Embed Size (px)
Citation preview
Quality control of sealed beta sources in brachytherapy
Recommendations on detectors, measurement procedures
and quality control of beta sources
NEDERLANDSE COMMISSIE VOOR STRALINGSDOSIMETRIE
Report 14 of the Netherlands Commission on Radiation Dosimetry
Authors:
R.P. Kollaard
W.J.F. Dries
H.J. van Kleffens
A.H.L. Aalbers
J. van der Marel
J.P.A. Marijnissen
M. Piessens
D.R. Schaart
H. de Vroome
Netherlands Commission on Radiation Dosimetry
Task Group Quality control of sealed beta sources in brachytherapy
August 2004


i
Preface
The Nederlandse Commissie voor Stralingsdosimetrie (NCS, Netherlands Commission on
Radiation Dosimetry) was officially established on 3 September 1982 with the aim of
promoting the appropriate use of dosimetry of ionizing radiation both for scientific research
and practical applications. The NCS is chaired by a board of scientists, installed upon the
suggestion of the supporting societies, including the Nederlandse Vereniging voor
Radiotherapie en Oncologie (Netherlands Society for Radiotherapy and Oncology), the
Nederlandse Vereniging voor Nucleaire Geneeskunde (Netherlands Society for Nuclear
Medicine), the Nederlandse Vereniging voor Klinische Fysica (Netherlands Society for
Clinical Physics), the Nederlandse Vereniging voor Radiobiologie (Netherlands Society for
Radiobiology), the Nederlandse Vereniging voor Stralingshygiëne (Netherlands Society for
Radiological Protection), the Nederlandse Vereniging voor Medische Beeldvorming en
Radiotherapie (Netherlands Society for Medical Imaging and Radiotherapy), the Nederlandse
Vereniging voor Radiologie (Netherlands Society for Radiology) and the Belgische
Vereniging voor Ziekenhuisfysici/Société Belge des Physiciens des Hôpitaux (Belgian
Hospital Physicists Association).
To pursue its aims, the NCS accomplishes the following tasks: participation in dosimetry
standardisation and promotion of dosimetry intercomparisons, drafting of dosimetry
protocols, collection and evaluation of physical data related to dosimetry. Furthermore the
commission shall maintain or establish links with national and international organisations
concerned with ionizing radiation and promulgate information on new developments in the
field of radiation dosimetry.
Current members of the board of the NCS:
S. Vynckier, chairman
B.J.M. Heijmen, vice-chairman
W. de Vries, secretary
J. Zoetelief, treasurer
A.J.J. Bos
A.A. Lammertsma
J.M. Schut
F.W. Wittkämper
D. Zweers
ii
Quality Control of Sealed Beta Sources in Brachytherapy
This report was prepared by a task group of the Netherlands Commission on Radiation
Dosimetry (NCS), consisting of Belgian and Dutch scientists. This work was financially
supported by The Netherlands Organisation for Health Research and Development (ZonMw).
Members of the task group:
W.J.F. Dries, chairman
A.H.L. Aalbers
H.J. van Kleffens
R.P. Kollaard
J. van der Marel
J.P.A. Marijnissen
M. Piessens
D.R. Schaart
H. de Vroome

iii
User guide
This report aims to provide information and guidelines for physicists who are responsible for
the quality control of beta sources in radiotherapy. Chapters 1-4 give an introduction to the
field of beta sources and dosimetry. The first three chapters give insight in the advantages
and disadvantages of applying beta sources in brachytherapy and in the different systems
that are available. Chapter 4 describes the current status of dosimetry of beta sources in the
Netherlands and Belgium.
Chapter 5 can be of help in the practical implementation of dosimetrical quality control on
beta sources. More details on practical measurement procedures are given in Appendix 10.
Chapter 6 and its summary in Chapter 7 can be used to implement a structural quality control
program for beta sources. These chapters contain an overview of relevant quality control
aspects, suitable equipment and recommendations on tolerances for deviations in source
strength, non-uniformity and asymmetry.

iv
ContentsPREFACE................................................................................................................................................. I
USER GUIDE.......................................................................................................................................... III
CONTENTS ............................................................................................................................................IV
SUMMARY .............................................................................................................................................. 1
ABBREVIATIONS ................................................................................................................................... 2
LIST OF SYMBOLS ................................................................................................................................ 3
1 INTRODUCTION .............................................................................................................................. 5
1.1 PURPOSE .................................................................................................................................... 6
1.2 SCOPE ........................................................................................................................................ 6
1.3 INTERPRETATION OF THE RECOMMENDATIONS............................................................................... 6
1.4 TREATMENT INDICATIONS ............................................................................................................. 7
1.5 IRRADIATION TECHNIQUES ............................................................................................................ 9
2 SEALED BETA SOURCES ...........................................................................................................10
2.1 INTRAVASCULAR BRACHYTHERAPY.............................................................................................. 10
2.2 OPHTHALMIC STRONTIUM APPLICATIONS ..................................................................................... 11
2.3 OPHTHALMIC RUTHENIUM APPLICATIONS ..................................................................................... 12
2.4 SOURCE STRENGTH SPECIFICATION BY MANUFACTURER .............................................................. 12
3 MEASUREMENT TECHNIQUES...................................................................................................13
3.1 SOURCE COORDINATE SYSTEMS AND REFERENCE POINTS............................................................ 13
3.2 NCS DEFINITIONS OF DOSIMETRIC PARAMETERS FOR SEALED BETA SOURCES .............................. 13
3.3 BETA DETECTORS...................................................................................................................... 19
3.4 MEASUREMENT CORRECTIONS ................................................................................................... 24
3.5 CONSIDERATIONS FOR DETECTOR SELECTION CRITERIA............................................................... 25
3.6 SELECTION OF DETECTORS ........................................................................................................ 26
4 CURRENT STATUS OF DOSIMETRY OF BETA SOURCES ......................................................28
4.1 QUESTIONNAIRE ........................................................................................................................ 28
4.2 USE OF BETA SOURCES IN THE NETHERLANDS AND BELGIUM ....................................................... 28
4.3 AVAILABLE DETECTORS.............................................................................................................. 29
4.4 FREQUENCY OF DOSIMETRIC CHECKS ......................................................................................... 29
5 RESULTS OF THE DOSIMETRY INTERCOMPARISON .............................................................31
5.1 MATERIALS................................................................................................................................ 31
5.2 MEASUREMENT METHODS .......................................................................................................... 34
5.3 ESTIMATION OF MEASUREMENT UNCERTAINTIES .......................................................................... 37
v
5.4 RESULTS OF INTER-INSTITUTE MEASUREMENTS ........................................................................... 41
5.5 EVALUATION OF TESTED DETECTORS .......................................................................................... 53
5.6 APPLICATION OF ACTION LEVELS ON INVESTIGATED SOURCES ...................................................... 55
6 NCS RECOMMENDATIONS FOR QUALITY CONTROL OF BETA SOURCES .........................56
6.1 SCOPE OF DOSIMETRY OF BETA SOURCES................................................................................... 56
6.2 RECOMMENDED REFERENCE POINTS AND SOURCE PARAMETERS.................................................. 56
6.3 NCS RECOMMENDATIONS FOR SUITABLE MEASUREMENT SYSTEMS .............................................. 58
6.4 NCS RECOMMENDED ACTION LEVELS ......................................................................................... 60
6.5 NCS RECOMMENDATIONS ON VERIFICATION OF PHYSICAL PARAMETERS....................................... 63
6.6 NCS RECOMMENDATIONS ON VERIFICATION OF SAFETY ASPECTS ................................................ 64
6.7 COMMUNICATION OF QC RESULTS TO CLINICIAN.......................................................................... 65
7 SUMMARY OF NCS RECOMMENDATIONS................................................................................66
APPENDIX 1. NUCLEAR DATA OF RELEVANT BETA EMITTERS ..................................................68
APPENDIX 2. SPECIFICATIONS OF BETA SOURCES .....................................................................69
APPENDIX 2.1 SPECIFICATIONS OF INTRAVASCULAR SOURCES................................................................ 69
APPENDIX 2.2 SPECIFICATIONS OF OPHTHALMIC RUTHENIUM SOURCES ................................................... 71
APPENDIX 2.3 DEPTH DOSE OF AMERSHAM STRONTIUM SOURCES .......................................................... 72
APPENDIX 3. SCALING FROM WATER EQUIVALENT PLASTIC TO WATER ................................73
APPENDIX 4. DETECTOR PROPERTIES ...........................................................................................74
APPENDIX 5. PLASTIC SCINTILLATOR PHANTOM FOR INTRAVASCULAR SOURCES .............75
APPENDIX 6. TECHNICAL DRAWING OF FILM PHANTOM FOR INTRAVASCULAR SOURCES .76
APPENDIX 7. TECHNICAL DRAWINGS OF PHANTOMS FOR OPHTHALMIC SOURCES.............77
APPENDIX 8. SETUP FOR MEASUREMENTS ON OPHTHALMIC SOURCES.................................78
APPENDIX 9. SETUP FOR IN-WATER DIODE MEASUREMENTS ON RUTHENIUM SOURCES ...79
APPENDIX 10. MEASUREMENT PROCEDURES...............................................................................80
APPENDIX 10.1 MEASUREMENT PROCEDURE GUIDANT 32P..................................................................... 80
APPENDIX 10.2 MEASUREMENT PROCEDURE NOVOSTE 90SR/90Y............................................................ 81
APPENDIX 10.3 MEASUREMENT PROCEDURE AMERSHAM 90SR/90Y ......................................................... 82
APPENDIX 10.4 MEASUREMENT PROCEDURE BEBIG 106RU/106RH .......................................................... 83
APPENDIX 11. CHOICE OF MARGIN SOURCE NON-UNIFORMITY UF ...........................................84
ORIGIN OF FIGURES ...........................................................................................................................85
REFERENCES ......................................................................................................................................86


1
Summary
At present, several types and subtypes of beta sources are in use in radiotherapy institutes in
the Netherlands and Belgium. There is large variation in quality control and more
specifically in dosimetry of these sources. In this report recommendations are presented on
detectors and measurement procedures for the dosimetry of beta sources. In addition,
recommendations are given on the quality control procedures for beta sources in general, as
well as action levels for deviations in source strength and uniformity.
The recommendations on suitable detectors and measurement procedures are based on on-
site measurements at 21 radiotherapy institutes in the Netherlands and Belgium. These
experiments were performed with well-type ionization chambers, a plastic scintillator, a
plane-parallel ionization chamber, radiochromic film and a diode. Based on this experience,
parameters are proposed for the evaluation of source strength, non-uniformity and in the
case of ophthalmic sources asymmetry.
Recommendations are presented for quality control of beta sources. On one hand,
recommendations are given on the dosimetric parameters that should be determined and on
the maximum deviations. On the other hand recommendations are given on, for example, the
accuracy of source positioning, frequency of dosimetry and radiation safety aspects, such as
measurements of leakage radiation.
With these recommendations it is expected that standardization of dosimetry and quality
control of beta sources in the Netherlands and Belgium will improve and that the chance of
treatment failure or emergency situations will reduce. With the availability of a primary
standard for beta dosimetry at the Netherlands Measurements institute (NMi), physicists will
be able to perform absolute measurements on beta sources using a calibrated detector.

2
Abbreviations
3D three-dimensionalA annuallyAAPM American Association of Physicists in MedicineASL active source length (in mm, defined on page 14)BT brachytherapyCABG coronary arterial bypass graftDGMP Deutsche Gesellschaft fur Medizinische Physik e.V.EPR electron paramagnetic resonanceESTRO European Society for Therapeutic Radiation OncologyEVA GEC EVA: endovascular, GEC: Groupe Européen de CuriethérapieHDR high dose rateIAEA International Atomic Energy AgencyICRU International Commission on Radiation Units and MeasurementsIVBT intravascular brachytherapyIVUS intravascular ultrasoundM monthly (3M: every 3 months, etc.)MRI magnetic resonance imagingNCS Netherlands Commission on Radiation DosimetryNIST National Institute of Standards and Technology, the US standards laboratoryNMi Netherlands Measurements Institute, the Dutch standards laboratoryNMR nuclear magnetic resonanceNSL nominal source length (in mm, defined on page 44)OD optical densityP (every) patient, every clinical application of the sourcePDD percentage depth dosePMMA poly(methyl methacrylate), a plastic also known as perspex or lucitePPIC plane-parallel ionization chamberPS plastic scintillatorPTCA percutaneous transluminal coronary angioplastyQA quality assuranceQC quality controlQCA quantitative coronary angiographyRIL reference isodose lengthSD standard deviationSE (each) source exchangeSS source strengthTG task group (of the AAPM)TLD thermoluminescent dosemeterWIC well-type ionization chamber

3
List of symbols
Symbol Description More information on pageASL active source length (mm) 14
avgD average absorbed dose rate (Gy/s) 16
Dm absorbed dose to material m (Gy)
maxD maximum absorbed dose rate (Gy/s) 16 (line), 17 (ophthalmic)
minD minimum absorbed dose rate (Gy/s) 16 (line), 17 (ophthalmic)
0rD absorbed dose rate on the z-axis (r = 0) (Gy/s) 17
Dw absorbed dose to water (Gy)
),( 00 zrD absorbed dose rate in reference point (r0, z0) 16
)( 0rD average absorbed dose rate along source axis at r = r0 15
M margin (mm) 15MP margin for phosphorus line sources (mm) 15MSr margin for strontium line sources (mm) 15OD optical density 35r distance along the radial axis (see figure) (mm) 13r0 reference position in r direction (mm) 13R50 average radius of ophthalmic sources (mm) 16Rc radius of curvature (mm) 12T1/2 half-lifeUAS source asymmetry (%) 19UF source non-uniformity (flatness) (%) 16, 17UICRU source non-uniformity (ICRU definition) (%) 15, 17z distance along the z-axis (see figure) (mm) 13z0 reference position in z direction (mm) 13

4
5
1 IntroductionIn many radiotherapy departments sealed beta sources are used for intravascularbrachytherapy or for irradiation of eye melanoma or pterygium [1]. As for all sources ofionizing radiation used in radiotherapy, quality control (QC) of the beta sources is theresponsibility of the clinical or medical physicist. An important aspect of this quality control is(independent) verification of the dosimetric properties of the source, such as strength anduniformity. In comparison with gamma sources, beta sources have a short range (typicallyabout 1 cm in water) and a steep dose gradient. This gradient is also present in the detectionvolume and small changes in source or detector positioning may give rise to large deviations(for example a 0.1 mm change in position may cause a 10% difference in absorbed dose).For the calibration of most beta sources no standardized techniques are available, and it isdifficult to find calibrated detectors for dosimetry of these sources. Until recently, only oneprimary standard for clinical beta sources was available wordwide (at NIST in the USA).
Source strength and depth dose measurements on beta sources have been described in theliterature and one of the manufacturers provides a calibrated detector for verification ofsource strength. Several organizations, such as the ICRU [2] and the IAEA [3], havepublished an overview of detectors that may be used. The dosimetric properties of interesthave been described by Task Group 60 of the AAPM [4] and the DGMP [5], as well as theICRU and the IAEA [2,3]. For the QC of brachytherapy sources in general, recommendationsare available in the report of Task Group 56 of the AAPM [6] and in NCS Report 13 [7]. Thislatter report gives recommendations on the QC of beta sources, but not on detectors for betadosimetry. Only the EVA GEC ESTRO working group [8] gives such a recommendation forbeta line sources. Guidelines were always written with gamma sources in mind and,therefore, no specific QC for beta sources has been described.
In this report tests and a selection of detectors for the dosimetry of beta sources arepresented. These detectors were evaluated employing several criteria, both physical (e.g.sensitivity, stability) and practical (e.g. ease of use, cost). Recommendations are given onsuitable detectors and on the parameters that should be determined. A compilation of themeasurement procedures used is given in Appendix 10. Based on our experience withsources used in clinical practice, tolerances are set for deviations in source strength, forsource non-uniformity and asymmetry. In addition to these dosimetric aspects, a set ofrecommendations for QC in general is presented, divided into radiation safety aspects andnon-dosimetric physical parameters.
Parallel to the recommendations presented in this report a primary standard for beta sourceshas become available at the Netherlands Measurements institute (NMi). At this facilitydetectors can be calibrated for independent measurements on beta sources. Radioactivesources with a long half-life such as strontium eye applicators can also be sent to the NMi forcalibration.

6
1.1 PurposeThis NCS report gives recommendations on quality control procedures for beta sources.Recommendations are also given on suitable detectors used for dosimetry of beta sources.Action levels are set for deviations in strength and for maximum source non-uniformity andasymmetry. In addition to these dosimetric aspects, recommendations are given on thefrequency of dosimetry and on other quality control procedures, such as the accuracy ofsource positioning and background radiation measurements.
1.2 ScopeIn the remainder of this chapter clinical indications for brachytherapy with beta sources aswell as irradiation techniques used are described. An overview of the radioactive betasources currently being used in the Netherlands and Belgium is given in Chapter 2.Measurement techniques are introduced in Chapter 3. This chapter describes the coordinatesystems for beta sources, detectors for dosimetry of beta sources and corrections that needto be taken into account in measurements. The current status of dosimetry of beta sources inthe Netherlands and Belgium is described in Chapter 4. To be able to give recommendationson detectors for dosimetry of beta sources, measurements were performed with a number ofdetectors. Materials and methods of these measurements are given in Chapter 5, togetherwith the results and an evaluation. Recommendations on detectors, measurement conceptsand reference points for dosimetry of beta sources in clinical practice are given in Chapter 6.The same chapter provides recommendations on quality control procedures for beta sources.The scope and frequency of measurements is described as well as action levels fordeviations in source strength and uniformity. Other physical parameters and safety aspectsthat should be taken into account are also described. Chapter 7 contains a summary of therecommendations.
1.3 Interpretation of the recommendationsThis report contains recommendations for quality control procedures, frequency ofmeasurements and tolerances in source strength and uniformity. Part is given as a minimumrequirement, part is optional. Each user, however, has his or her own responsibility inimplementing these recommendations. The recommendations on detectors only apply todetectors that were investigated and that were found to be suitable for source strength oruniformity measurements. New detectors or detectors that were not investigated may also besuitable, provided they fulfil the same criteria.
7
1.4 Treatment indications
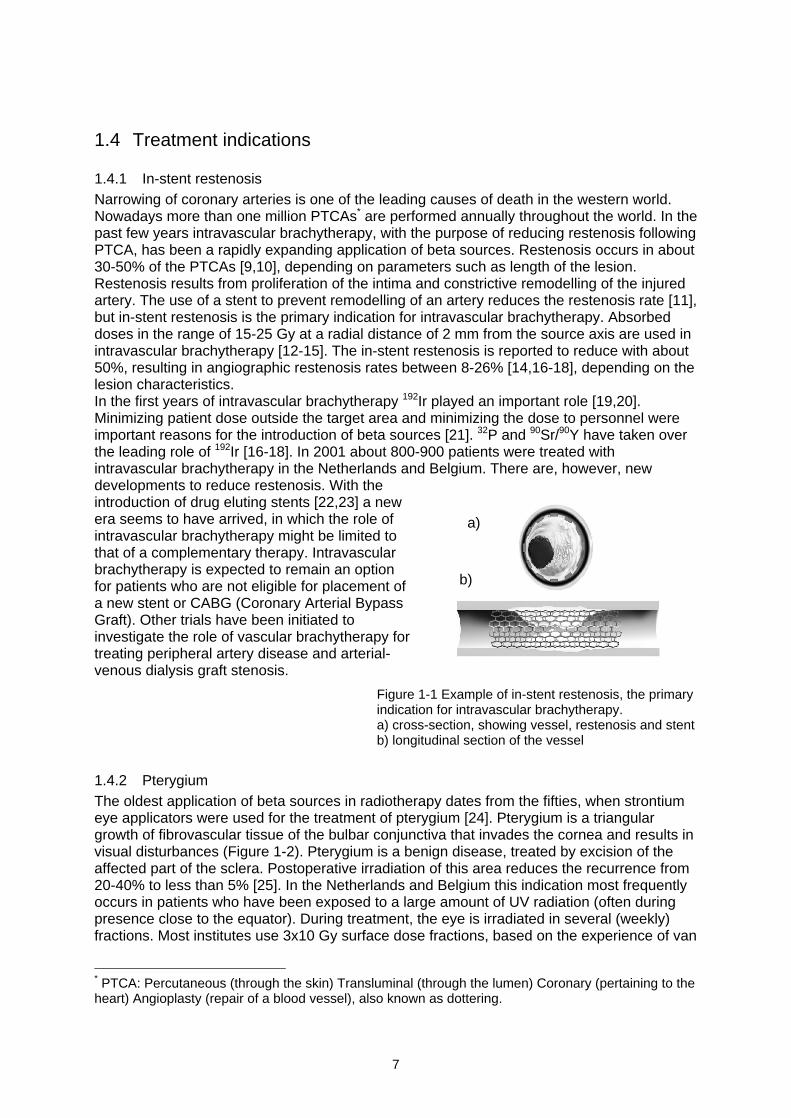
1.4.1 In-stent restenosisNarrowing of coronary arteries is one of the leading causes of death in the western world.Nowadays more than one million PTCAs* are performed annually throughout the world. In thepast few years intravascular brachytherapy, with the purpose of reducing restenosis followingPTCA, has been a rapidly expanding application of beta sources. Restenosis occurs in about30-50% of the PTCAs [9,10], depending on parameters such as length of the lesion.Restenosis results from proliferation of the intima and constrictive remodelling of the injuredartery. The use of a stent to prevent remodelling of an artery reduces the restenosis rate [11],but in-stent restenosis is the primary indication for intravascular brachytherapy. Absorbeddoses in the range of 15-25 Gy at a radial distance of 2 mm from the source axis are used inintravascular brachytherapy [12-15]. The in-stent restenosis is reported to reduce with about50%, resulting in angiographic restenosis rates between 8-26% [14,16-18], depending on thelesion characteristics.In the first years of intravascular brachytherapy 192Ir played an important role [19,20].Minimizing patient dose outside the target area and minimizing the dose to personnel wereimportant reasons for the introduction of beta sources [21]. 32P and 90Sr/90Y have taken overthe leading role of 192Ir [16-18]. In 2001 about 800-900 patients were treated withintravascular brachytherapy in the Netherlands and Belgium. There are, however, newdevelopments to reduce restenosis. With theintroduction of drug eluting stents [22,23] a newera seems to have arrived, in which the role ofintravascular brachytherapy might be limited tothat of a complementary therapy. Intravascularbrachytherapy is expected to remain an optionfor patients who are not eligible for placement ofa new stent or CABG (Coronary Arterial BypassGraft). Other trials have been initiated toinvestigate the role of vascular brachytherapy fortreating peripheral artery disease and arterial-venous dialysis graft stenosis.
Figure 1-1 Example of in-stent restenosis, the primaryindication for intravascular brachytherapy.a) cross-section, showing vessel, restenosis and stentb) longitudinal section of the vessel
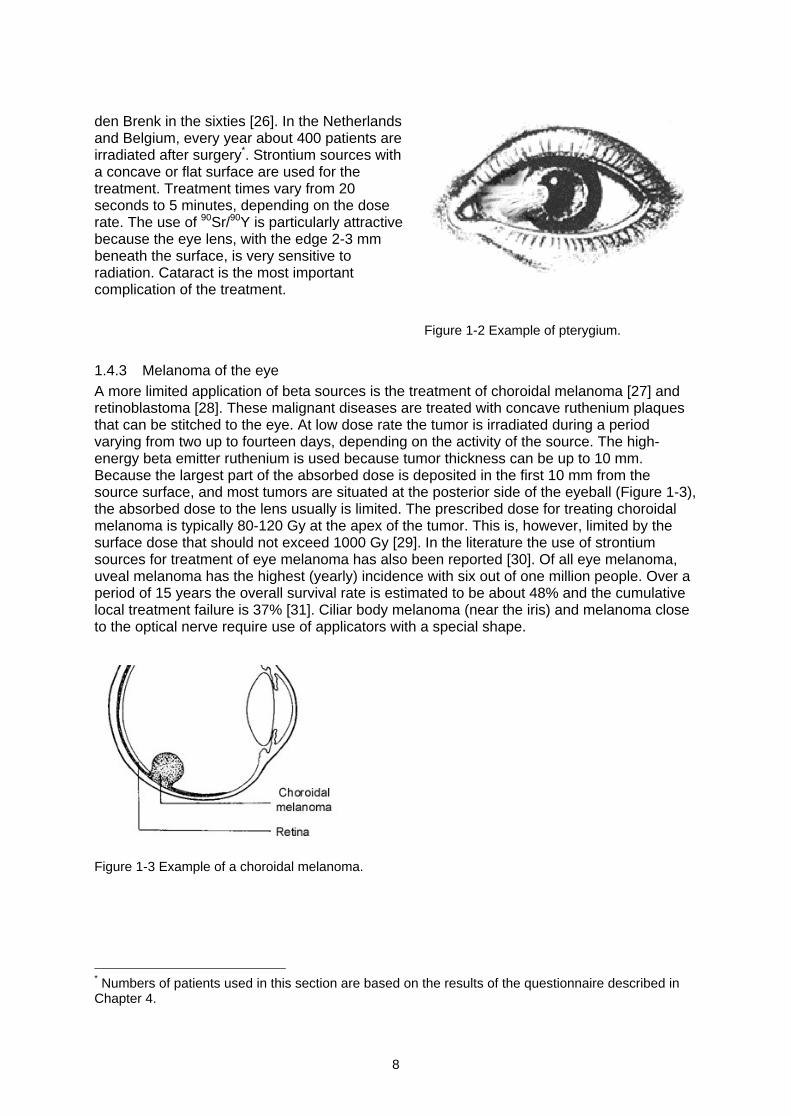
1.4.2 PterygiumThe oldest application of beta sources in radiotherapy dates from the fifties, when strontiumeye applicators were used for the treatment of pterygium [24]. Pterygium is a triangulargrowth of fibrovascular tissue of the bulbar conjunctiva that invades the cornea and results invisual disturbances (Figure 1-2). Pterygium is a benign disease, treated by excision of theaffected part of the sclera. Postoperative irradiation of this area reduces the recurrence from20-40% to less than 5% [25]. In the Netherlands and Belgium this indication most frequentlyoccurs in patients who have been exposed to a large amount of UV radiation (often duringpresence close to the equator). During treatment, the eye is irradiated in several (weekly)fractions. Most institutes use 3x10 Gy surface dose fractions, based on the experience of van
* PTCA: Percutaneous (through the skin) Transluminal (through the lumen) Coronary (pertaining to theheart) Angioplasty (repair of a blood vessel), also known as dottering.
a)
b)
8
den Brenk in the sixties [26]. In the Netherlandsand Belgium, every year about 400 patients areirradiated after surgery*. Strontium sources witha concave or flat surface are used for thetreatment. Treatment times vary from 20seconds to 5 minutes, depending on the doserate. The use of 90Sr/90Y is particularly attractivebecause the eye lens, with the edge 2-3 mmbeneath the surface, is very sensitive toradiation. Cataract is the most importantcomplication of the treatment.
Figure 1-2 Example of pterygium.
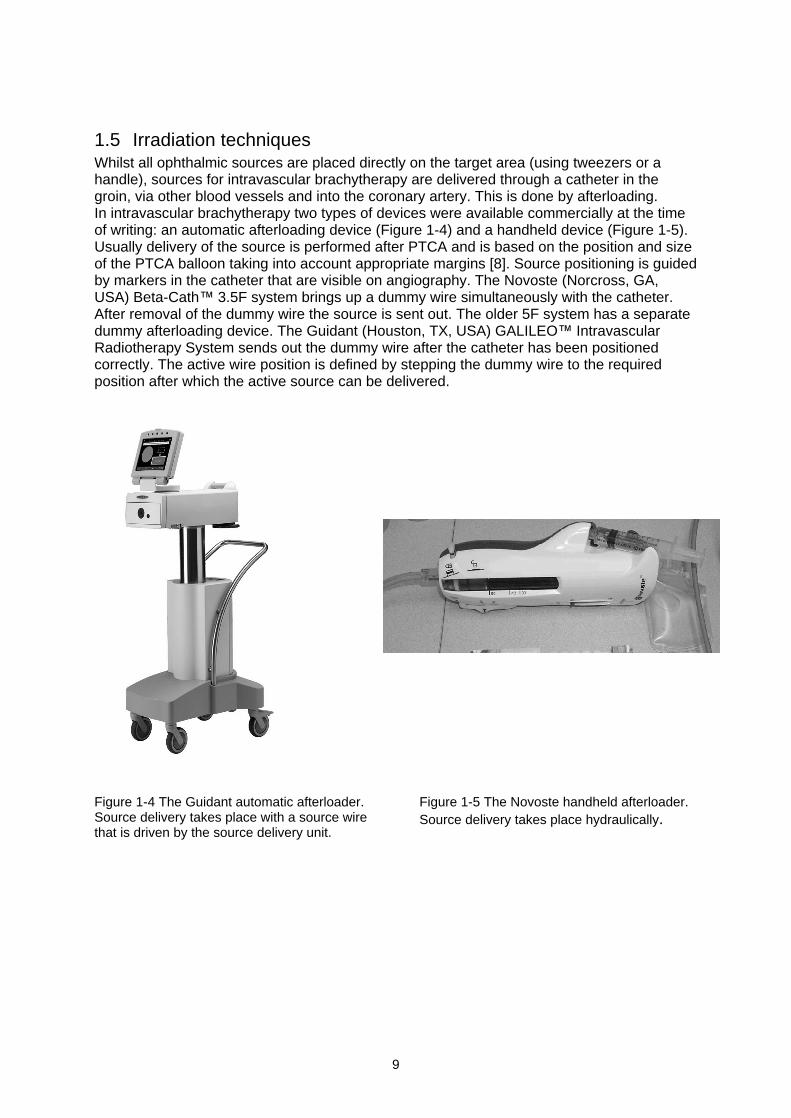
1.4.3 Melanoma of the eyeA more limited application of beta sources is the treatment of choroidal melanoma [27] andretinoblastoma [28]. These malignant diseases are treated with concave ruthenium plaquesthat can be stitched to the eye. At low dose rate the tumor is irradiated during a periodvarying from two up to fourteen days, depending on the activity of the source. The high-energy beta emitter ruthenium is used because tumor thickness can be up to 10 mm.Because the largest part of the absorbed dose is deposited in the first 10 mm from thesource surface, and most tumors are situated at the posterior side of the eyeball (Figure 1-3),the absorbed dose to the lens usually is limited. The prescribed dose for treating choroidalmelanoma is typically 80-120 Gy at the apex of the tumor. This is, however, limited by thesurface dose that should not exceed 1000 Gy [29]. In the literature the use of strontiumsources for treatment of eye melanoma has also been reported [30]. Of all eye melanoma,uveal melanoma has the highest (yearly) incidence with six out of one million people. Over aperiod of 15 years the overall survival rate is estimated to be about 48% and the cumulativelocal treatment failure is 37% [31]. Ciliar body melanoma (near the iris) and melanoma closeto the optical nerve require use of applicators with a special shape.
Figure 1-3 Example of a choroidal melanoma.
* Numbers of patients used in this section are based on the results of the questionnaire described inChapter 4.
9
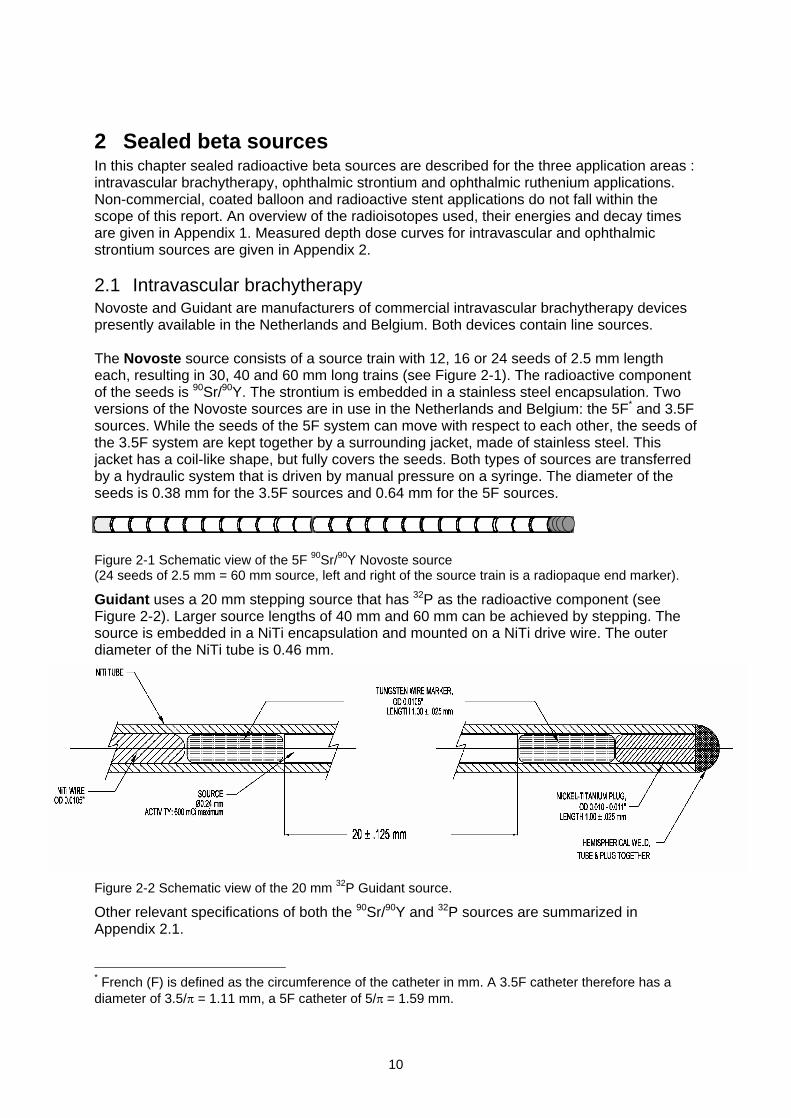
1.5 Irradiation techniquesWhilst all ophthalmic sources are placed directly on the target area (using tweezers or ahandle), sources for intravascular brachytherapy are delivered through a catheter in thegroin, via other blood vessels and into the coronary artery. This is done by afterloading.In intravascular brachytherapy two types of devices were available commercially at the timeof writing: an automatic afterloading device (Figure 1-4) and a handheld device (Figure 1-5).Usually delivery of the source is performed after PTCA and is based on the position and sizeof the PTCA balloon taking into account appropriate margins [8]. Source positioning is guidedby markers in the catheter that are visible on angiography. The Novoste (Norcross, GA,USA) Beta-Cath 3.5F system brings up a dummy wire simultaneously with the catheter.After removal of the dummy wire the source is sent out. The older 5F system has a separatedummy afterloading device. The Guidant (Houston, TX, USA) GALILEO IntravascularRadiotherapy System sends out the dummy wire after the catheter has been positionedcorrectly. The active wire position is defined by stepping the dummy wire to the requiredposition after which the active source can be delivered.
Figure 1-4 The Guidant automatic afterloader.Source delivery takes place with a source wirethat is driven by the source delivery unit.
Figure 1-5 The Novoste handheld afterloader.Source delivery takes place hydraulically.
10
2 Sealed beta sourcesIn this chapter sealed radioactive beta sources are described for the three application areas :intravascular brachytherapy, ophthalmic strontium and ophthalmic ruthenium applications.Non-commercial, coated balloon and radioactive stent applications do not fall within thescope of this report. An overview of the radioisotopes used, their energies and decay timesare given in Appendix 1. Measured depth dose curves for intravascular and ophthalmicstrontium sources are given in Appendix 2.
2.1 Intravascular brachytherapyNovoste and Guidant are manufacturers of commercial intravascular brachytherapy devicespresently available in the Netherlands and Belgium. Both devices contain line sources.
The Novoste source consists of a source train with 12, 16 or 24 seeds of 2.5 mm lengtheach, resulting in 30, 40 and 60 mm long trains (see Figure 2-1). The radioactive componentof the seeds is 90Sr/90Y. The strontium is embedded in a stainless steel encapsulation. Twoversions of the Novoste sources are in use in the Netherlands and Belgium: the 5F* and 3.5Fsources. While the seeds of the 5F system can move with respect to each other, the seeds ofthe 3.5F system are kept together by a surrounding jacket, made of stainless steel. Thisjacket has a coil-like shape, but fully covers the seeds. Both types of sources are transferredby a hydraulic system that is driven by manual pressure on a syringe. The diameter of theseeds is 0.38 mm for the 3.5F sources and 0.64 mm for the 5F sources.
Figure 2-1 Schematic view of the 5F 90Sr/90Y Novoste source(24 seeds of 2.5 mm = 60 mm source, left and right of the source train is a radiopaque end marker).
Guidant uses a 20 mm stepping source that has 32P as the radioactive component (seeFigure 2-2). Larger source lengths of 40 mm and 60 mm can be achieved by stepping. Thesource is embedded in a NiTi encapsulation and mounted on a NiTi drive wire. The outerdiameter of the NiTi tube is 0.46 mm.
Figure 2-2 Schematic view of the 20 mm 32P Guidant source.
Other relevant specifications of both the 90Sr/90Y and 32P sources are summarized inAppendix 2.1.
* French (F) is defined as the circumference of the catheter in mm. A 3.5F catheter therefore has adiameter of 3.5/ = 1.11 mm, a 5F catheter of 5/ = 1.59 mm.
11
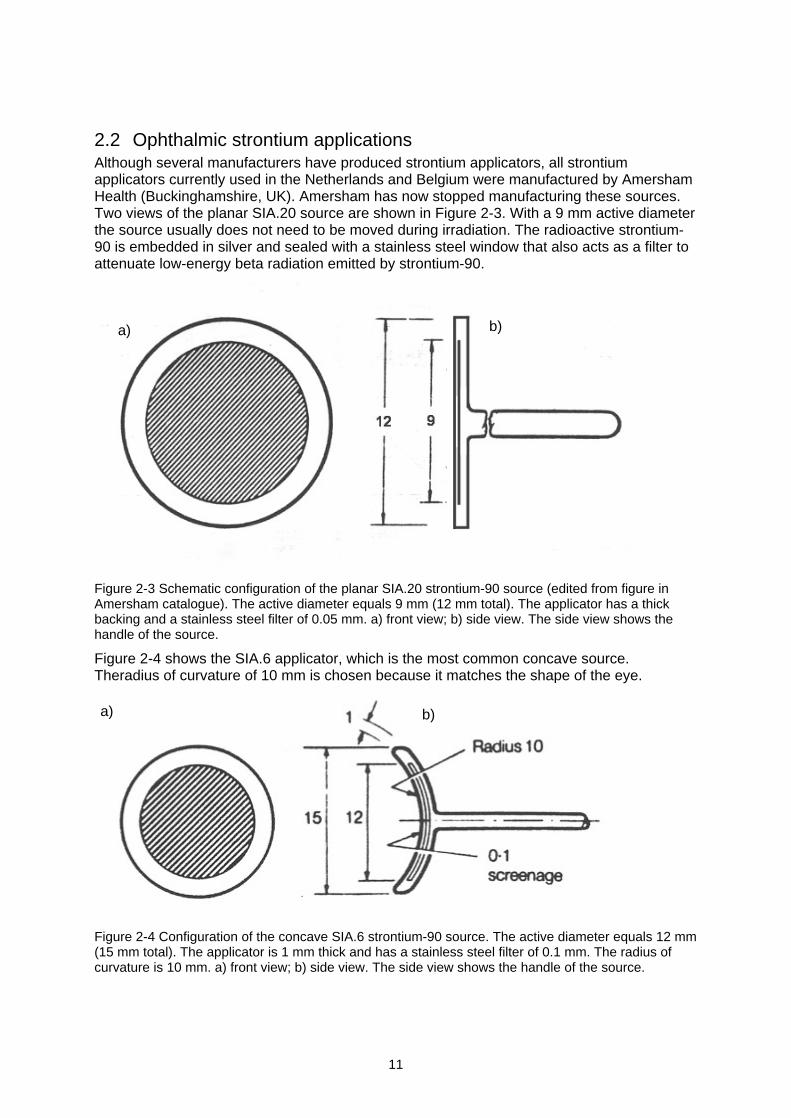
2.2 Ophthalmic strontium applicationsAlthough several manufacturers have produced strontium applicators, all strontiumapplicators currently used in the Netherlands and Belgium were manufactured by AmershamHealth (Buckinghamshire, UK). Amersham has now stopped manufacturing these sources.Two views of the planar SIA.20 source are shown in Figure 2-3. With a 9 mm active diameterthe source usually does not need to be moved during irradiation. The radioactive strontium-90 is embedded in silver and sealed with a stainless steel window that also acts as a filter toattenuate low-energy beta radiation emitted by strontium-90.
Figure 2-3 Schematic configuration of the planar SIA.20 strontium-90 source (edited from figure inAmersham catalogue). The active diameter equals 9 mm (12 mm total). The applicator has a thickbacking and a stainless steel filter of 0.05 mm. a) front view; b) side view. The side view shows thehandle of the source.
Figure 2-4 shows the SIA.6 applicator, which is the most common concave source.Theradius of curvature of 10 mm is chosen because it matches the shape of the eye.
Figure 2-4 Configuration of the concave SIA.6 strontium-90 source. The active diameter equals 12 mm(15 mm total). The applicator is 1 mm thick and has a stainless steel filter of 0.1 mm. The radius ofcurvature is 10 mm. a) front view; b) side view. The side view shows the handle of the source.
a) b)
a) b)
12
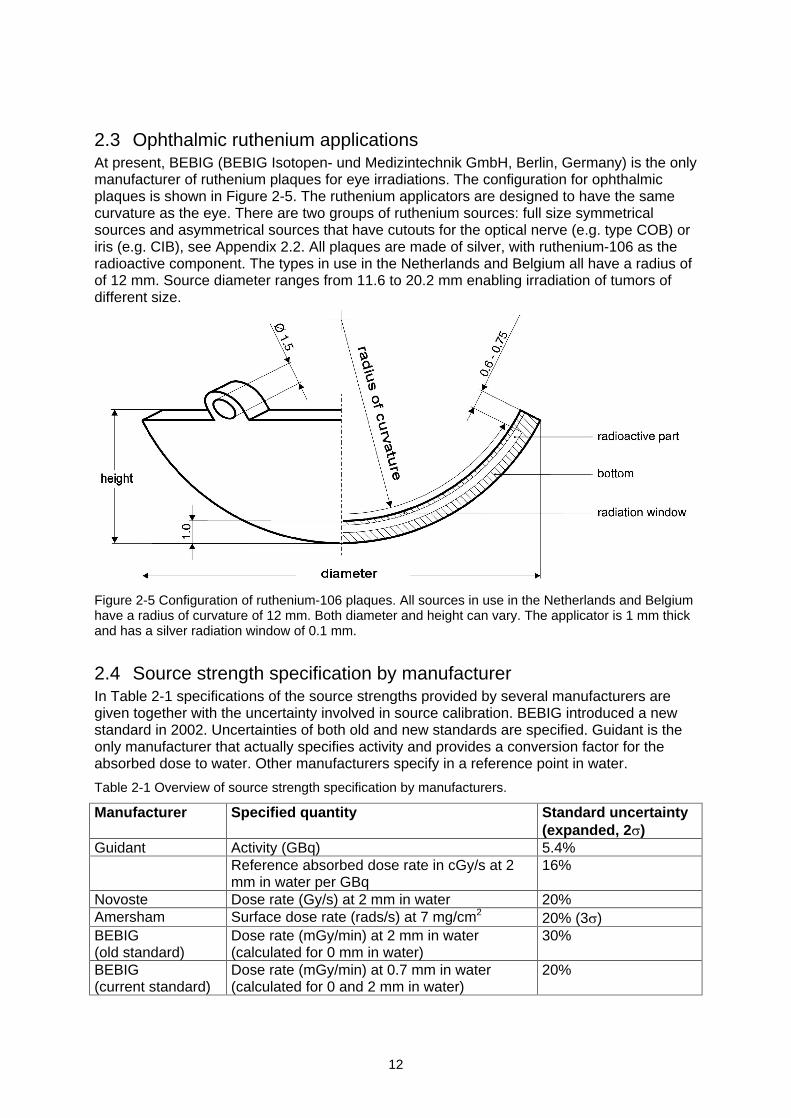
2.3 Ophthalmic ruthenium applicationsAt present, BEBIG (BEBIG Isotopen- und Medizintechnik GmbH, Berlin, Germany) is the onlymanufacturer of ruthenium plaques for eye irradiations. The configuration for ophthalmicplaques is shown in Figure 2-5. The ruthenium applicators are designed to have the samecurvature as the eye. There are two groups of ruthenium sources: full size symmetricalsources and asymmetrical sources that have cutouts for the optical nerve (e.g. type COB) oriris (e.g. CIB), see Appendix 2.2. All plaques are made of silver, with ruthenium-106 as theradioactive component. The types in use in the Netherlands and Belgium all have a radius ofof 12 mm. Source diameter ranges from 11.6 to 20.2 mm enabling irradiation of tumors ofdifferent size.
Figure 2-5 Configuration of ruthenium-106 plaques. All sources in use in the Netherlands and Belgiumhave a radius of curvature of 12 mm. Both diameter and height can vary. The applicator is 1 mm thickand has a silver radiation window of 0.1 mm.
2.4 Source strength specification by manufacturerIn Table 2-1 specifications of the source strengths provided by several manufacturers aregiven together with the uncertainty involved in source calibration. BEBIG introduced a newstandard in 2002. Uncertainties of both old and new standards are specified. Guidant is theonly manufacturer that actually specifies activity and provides a conversion factor for theabsorbed dose to water. Other manufacturers specify in a reference point in water.
Table 2-1 Overview of source strength specification by manufacturers.
Manufacturer Specified quantity Standard uncertainty(expanded, 2 )
Guidant Activity (GBq) 5.4%Reference absorbed dose rate in cGy/s at 2mm in water per GBq
16%
Novoste Dose rate (Gy/s) at 2 mm in water 20%Amersham Surface dose rate (rads/s) at 7 mg/cm2 20% (3 )BEBIG(old standard)
Dose rate (mGy/min) at 2 mm in water(calculated for 0 mm in water)
30%
BEBIG(current standard)
Dose rate (mGy/min) at 0.7 mm in water(calculated for 0 and 2 mm in water)
20%
13
3 Measurement techniquesThis chapter contains an overview of different techniques and methodologies required for thedosimetry of beta sources, such as coordinate systems and reference points (Section 3.1),dosimetric parameters (Section 3.2), possible detectors (Section 3.3), and measurementcorrections (Section 3.4). It should be noted that this chapter only provides backgroundinformation and that the recommendations of the NCS can be found in Chapter 6. Criteria forselection of detectors and a first selection based on these criteria are given at the end of thepresent chapter.
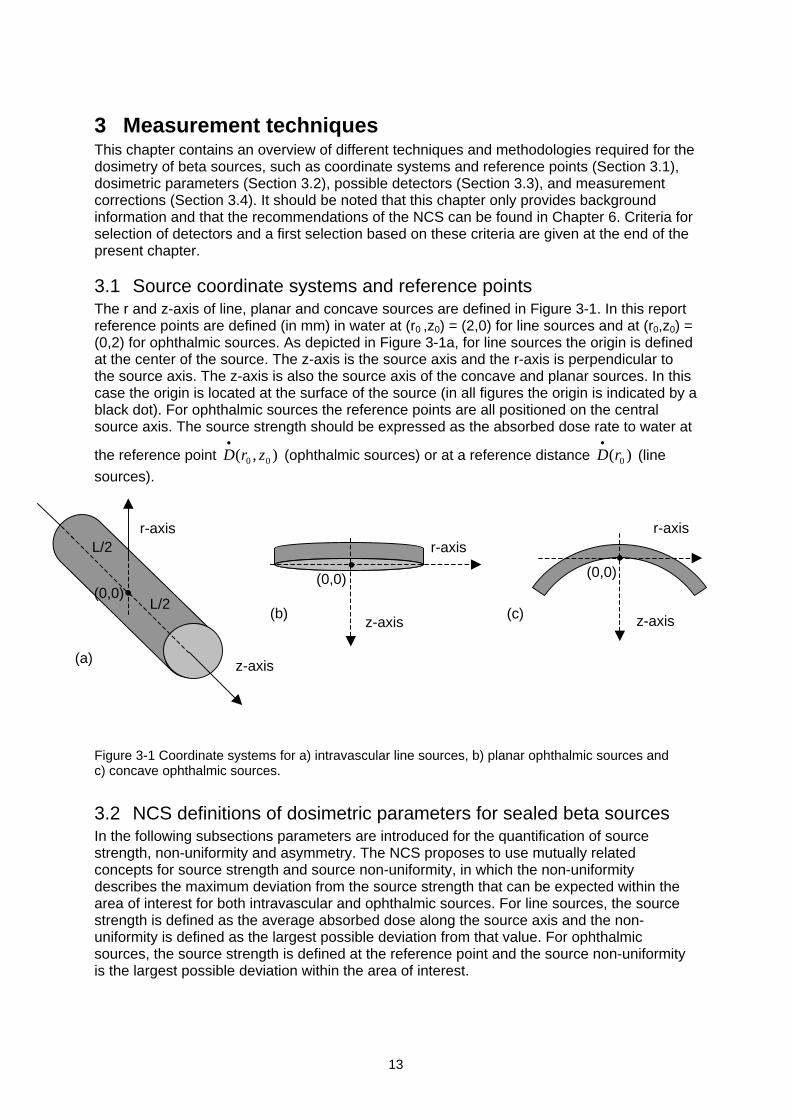
3.1 Source coordinate systems and reference pointsThe r and z-axis of line, planar and concave sources are defined in Figure 3-1. In this reportreference points are defined (in mm) in water at (r0 ,z0) = (2,0) for line sources and at (r0,z0) =(0,2) for ophthalmic sources. As depicted in Figure 3-1a, for line sources the origin is definedat the center of the source. The z-axis is the source axis and the r-axis is perpendicular tothe source axis. The z-axis is also the source axis of the concave and planar sources. In thiscase the origin is located at the surface of the source (in all figures the origin is indicated by ablack dot). For ophthalmic sources the reference points are all positioned on the centralsource axis. The source strength should be expressed as the absorbed dose rate to water at
the reference point ),( 00 zrD (ophthalmic sources) or at a reference distance )( 0rD (line
sources).
Figure 3-1 Coordinate systems for a) intravascular line sources, b) planar ophthalmic sources andc) concave ophthalmic sources.
3.2 NCS definitions of dosimetric parameters for sealed beta sourcesIn the following subsections parameters are introduced for the quantification of sourcestrength, non-uniformity and asymmetry. The NCS proposes to use mutually relatedconcepts for source strength and source non-uniformity, in which the non-uniformitydescribes the maximum deviation from the source strength that can be expected within thearea of interest for both intravascular and ophthalmic sources. For line sources, the sourcestrength is defined as the average absorbed dose along the source axis and the non-uniformity is defined as the largest possible deviation from that value. For ophthalmicsources, the source strength is defined at the reference point and the source non-uniformityis the largest possible deviation within the area of interest.
r-axis
z-axis(c)
(0,0)
r-axis
z-axis(b)
(0,0)
z-axis
r-axisL/2
L/2
(a)
(0,0)
14
3.2.1 Intravascular brachytherapy sources
Active Source Length (ASL)
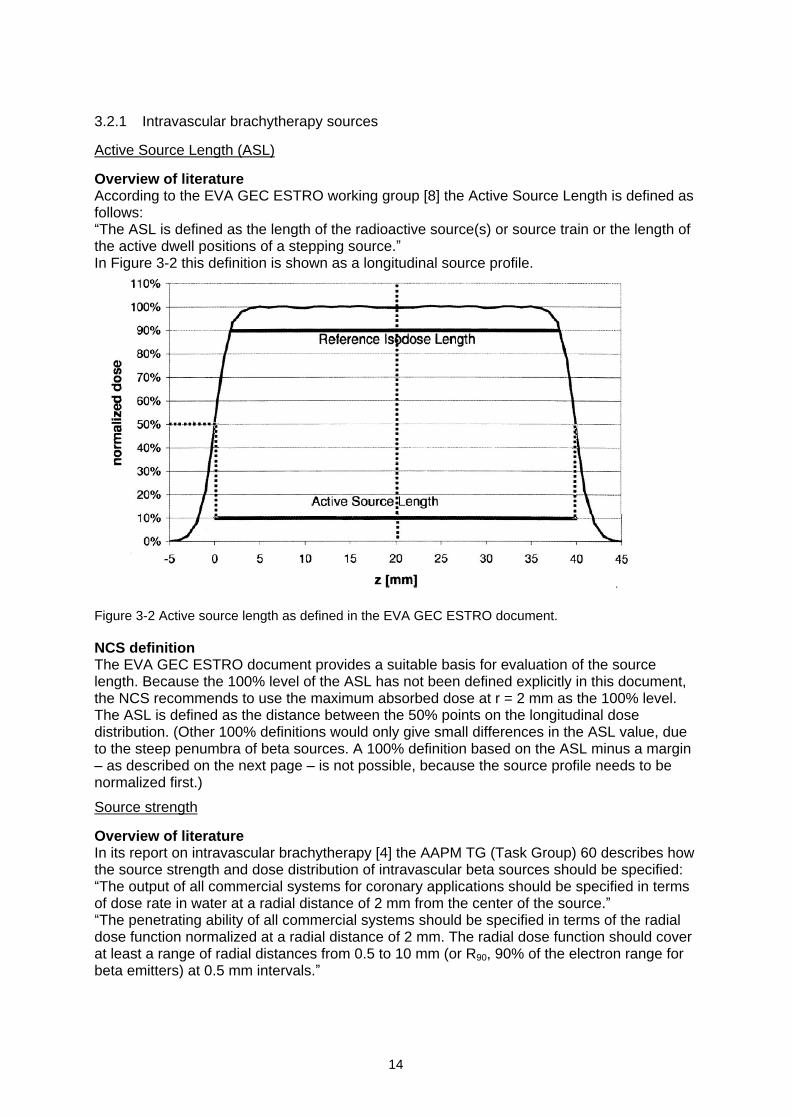
Overview of literatureAccording to the EVA GEC ESTRO working group [8] the Active Source Length is defined asfollows:The ASL is defined as the length of the radioactive source(s) or source train or the length of
the active dwell positions of a stepping source.In Figure 3-2 this definition is shown as a longitudinal source profile.
Figure 3-2 Active source length as defined in the EVA GEC ESTRO document.
NCS definitionThe EVA GEC ESTRO document provides a suitable basis for evaluation of the sourcelength. Because the 100% level of the ASL has not been defined explicitly in this document,the NCS recommends to use the maximum absorbed dose at r = 2 mm as the 100% level.The ASL is defined as the distance between the 50% points on the longitudinal dosedistribution. (Other 100% definitions would only give small differences in the ASL value, dueto the steep penumbra of beta sources. A 100% definition based on the ASL minus a margin
as described on the next page is not possible, because the source profile needs to benormalized first.)
Source strength
Overview of literatureIn its report on intravascular brachytherapy [4] the AAPM TG (Task Group) 60 describes howthe source strength and dose distribution of intravascular beta sources should be specified:The output of all commercial systems for coronary applications should be specified in terms
of dose rate in water at a radial distance of 2 mm from the center of the source.The penetrating ability of all commercial systems should be specified in terms of the radial
dose function normalized at a radial distance of 2 mm. The radial dose function should coverat least a range of radial distances from 0.5 to 10 mm (or R90, 90% of the electron range forbeta emitters) at 0.5 mm intervals.
15
These recommendations form the basis for all other recommendations on source strength ofbeta line sources [2,5,8]. In practice, the source strength in terms of dose rate is eitherdetermined directly (with a point detector) or indirectly (with a well-type ionization chamber).In the case of an indirect measurement, Monte Carlo simulations often are used forcalculation of the source strength at the reference point.
For intravascular applications in peripheral arteries the reference point is defined at r = 5 mmin water instead of 2 mm [5]. Currently, no commercial beta sources are in use for thisapplication.
NCS definitionFor three reasons, the NCS proposes an alternative to the AAPM concept of source strengthusing the average of the absorbed dose rate along the source axis. Firstly, the twomanufacturers of beta line sources (Guidant and Novoste) perform their calibrations withdetectors that evaluate the entire source length. Secondly, from a clinical point of view, theaverage absorbed dose rate along the source is more relevant than the absorbed dose ratein a single point. Thirdly, only a fraction of the source length contributes to the dose rate at(r0,z0) = (2,0) due to the limited range of betas. Therefore the NCS recommends to define the
source strength as the average absorbed dose rate )( 0rD at r0 = 2 mm along the active
source length minus a margin M at both ends of the source. MP = 2.5 mm for 32P sources andMSr = 3.0 mm for 90Sr/90Y sources. Simulated source profiles are given in Appendix 11. It isnoted that with these margins, the source strengths of the 32P and 90Sr/90Y line sources areaffected by less than 0.5% by the dose fall-off near the ends of the sources.
Source non-uniformity
Overview of literatureThe AAPM TG 60 [4] recommends to evaluate the uniformity of a source along the sourceaxis and in the azimuthal direction according to the following requirements :Uniformity of the dose delivered at points along the source-axis should be better than 10%
(range of values from minimum to maximum in the centered two-thirds of the treatmentlength of at least 3 cm) at a radial distance of 2 mm from the source axis.Uniformity of a dose at the points in a circle of 2 mm radius centered on the course axis
should also be within 10% in the centered two-thirds of a minimum treatment length of 3cm.
In its draft report the ICRU [2] advises to apply a different concept of source non-uniformity.In this concept the difference between minimum and maximum is evaluated, instead of thedeviation from a reference value. Although the ICRU uses U for non-uniformity, UICRU is usedthroughout this document for clarity. The following formula is used:
%100/)( minmax avgICRU DDDU (3-1)
in which: UICRU = source non-uniformity (%)
maxD = maximum absorbed dose rate
minD = minimum absorbed dose rate
avgD = average absorbed dose rateThis concept applies to the same 2/3 of the source length as described by the AAPM TG 60.The ICRU recommends a maximum non-uniformity of 20%. In contrast to the AAPM TG 60recommendation, this concept gives a clear normalization using the average absorbed dose.
16
NCS definitionThe NCS gives preference to a non-uniformity concept that evaluates the maximum deviationfrom the source strength. Therefore an approach similar to that of TG 60 is followed, exceptthat it is linked to the concept of source strength described in the previous section. TheAAPM recommendation to evaluate the source non-uniformity over 2/3 of the source lengthis not considered appropriate for beta sources, because this may result in unacceptably largemargins of 10 mm at both ends of a 60 mm source. The NCS recommends to evaluate thesource non-uniformity over the active source length minus a margin M at both ends of thesource. MP = 2.5 mm for 32P sources and MSr = 3.0 mm for 90Sr/90Y sources. The choice forthese margins is discussed in Appendix 11 and is based on data of clinical sources aspresented in Chapter 5. It is noted that the dose rates of the 32P and 90Sr/90Y line sources areat 96-97% of the maximum value at a distance M from the 50% point if the sources areassumed to be perfectly uniform [32]. The portion (ASL-2M) of the source length that isdetermined by these margins is used for the definition of the average absorbed dose of thesource. The NCS proposes to use the symbol UF (with F for flatness) for non-uniformitydefined as:
%100/,max maxmin avgavgavgF DDDDDU (3-2)
in which: UF = source non-uniformity (%)
maxD = maximum (relative) absorbed dose rate within ASL-2M
minD = minimum absorbed dose rate within ASL-2M
avgD = average absorbed dose rate within ASL-2M
3.2.2 Ophthalmic sources
Average radius (R50)The average radius (R50) is defined as the mean radius of the 50% isodose contour of a dosedistribution in which 100% is given by the maximum absorbed dose [2]. A precise descriptionof how this radius can be calculated is given in the section on source non-uniformity (seebelow).
Source strength
Overview of literatureIn the (draft) ICRU report [2] the source strength of all planar and concave sources is definedas the dose rate at (r, z) = (0,1) mm. The IAEA [3] recommends using the same point butrecognizes that performing measurements at these short distances is a difficult task.
NCS definitionThe NCS supports the IAEA opinion that measuring the absorbed dose at a distance of 1mm is a difficult task. Curvature of concave sources and minimum thickness of spacers limitthe possibilities of performing measurements at 1 mm, even if detector dimensions aresufficiently small. The NCS therefore recommends to determine the source strength at (r0, z0)= (0,2) mm. The reader is referred to Section 3.1 for the precise geometry. Becausedimensions of ophthalmic applicators are significantly smaller than those of line sources andbecause it is difficult to construct a phantom that allows averaging, the NCS recommends to
use a point dose rate for determination of the source strength ),( 00 zrD .
17
Source non-uniformity
Overview of literatureThe source non-uniformity for eye applicators, as introduced in the ICRU report, is given byEquation 3-1. The report recommends that the non-uniformity should be determined at aspecified depth over a specified area of the source. For planar sources the concept of fieldcenter can be used [33]. Although the principle can also be used for measurements with alarger detector such as a diode, this concept is especially suitable for scanned radiochromicfilms. The ICRU proposes to determine the non-uniformity at z = 1 mm depth, using 80% ofR50. The calculation of the source non-uniformity is performed as follows:
The maximum absorbed dose rate maxD is determined.
The pixels with 50% of maxD are determined (for films, absorbed dose values are used,instead of dose rate values).
The coordinate of the field center (xc,yc) is determined through:
m
j
jjc
n
i
iic
yy
my
xx
nx
11 2
50501,
2
50501(3-3)
In which n is the number of rows and m is the number of columns with a dose rate larger
than or equal to 50% of maxD . The sign indicates the position with respect to the sourcecenter.
The average radius R50 can be calculated through:
q
kkckc yyxx
qR
1
2250 5050
1(3-4)
in which q is the total number of 50% pixels.
Finally, analogous to the concept for line sources, Equation 3-1 is applied, in which minD ,
maxD and avgD are taken from the pixels with a distance smaller than 0.8R50 to (xc,yc).The ICRU recommends a maximum source non-uniformity UICRU of 20%.
For concave sources the concept of non-uniformity can be applied in different ways:1) in a concave surface parallel to the source surface,2) in a plane perpendicular to the source axis.Although uniformity measurements should preferably be performed parallel to the sourcesurface, film measurements are only possible in a plane. In the literature, film measurementson concave ophthalmic sources are described [34] and also in this report results of such filmmeasurements will be presented. However, these measurements combine effects of non-uniformity and the non-constant distance between the concave source surface and the film.Measurements with a small detector parallel to the source surface are also presented in thisreport.
NCS definitionThe concept of non-uniformity proposed by the ICRU has some disadvantages.1) The non-uniformity does not give the maximum possible deviation from the source
strength, but only the difference between minimum and maximum.2) The normalization is performed based on an average of the absorbed dose within the
area of interest and can therefore not be related directly to the source strength that isdefined in a point on the axis.
18
For these reasons, the NCS proposes to use a concept in which the non-uniformity gives apercentage value of the maximum deviation from the source strength. This source strength isdefined on the source axis as described earlier. The following equation is applied for thesource non-uniformity (flatness):
%100/,max 00max0min rrrF DDDDDU (3-5)
0rD is the (relative) absorbed dose rate as determined on the z-axis (r = 0) and may be
equal to the source strength ),( 00 zrD . The other variables are equal to those introduced by
the ICRU. Again, the area within 0.8R50 is used for evaluation of source non-uniformity. Adirect relation with source strength is obtained when non-uniformity is determined at thereference distance of 2 mm from the surface. Detector positioning at 2 mm is oftenaccompanied by additional uncertainties in the measurement setup. From a clinical point ofview, the measurement distance should preferably be less than 2 mm, because problemscaused by hot spots probably will occur close to the source surface. Because of thesereasons, the NCS recommends performing uniformity measurements at a distance as closeto the surface of the source as possible. The relatively small effect of distance on themagnitude of the non-uniformity is accounted for in the tolerances that will be given inChapter 6 for the non-uniformity. The non-uniformity is defined parallel to the source surface.
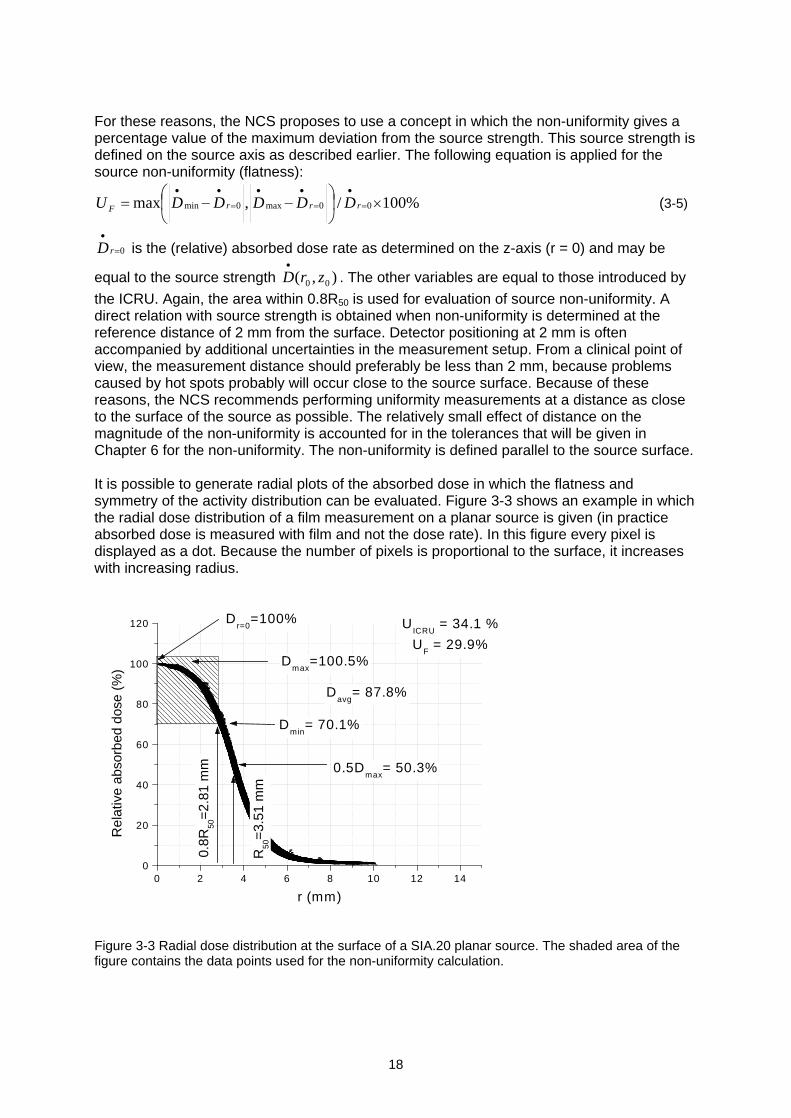
It is possible to generate radial plots of the absorbed dose in which the flatness andsymmetry of the activity distribution can be evaluated. Figure 3-3 shows an example in whichthe radial dose distribution of a film measurement on a planar source is given (in practiceabsorbed dose is measured with film and not the dose rate). In this figure every pixel isdisplayed as a dot. Because the number of pixels is proportional to the surface, it increaseswith increasing radius.
Figure 3-3 Radial dose distribution at the surface of a SIA.20 planar source. The shaded area of thefigure contains the data points used for the non-uniformity calculation.
0 2 4 6 8 10 12 140
20
40
60
80
100
120 Dr=0
=100%
0.5Dmax
= 50.3%
UICRU
= 34.1 %
UF
= 29.9%
R50
=3.
51 m
m
0.8R
50=
2.81
mm
Davg
= 87.8%
Dmin
= 70.1%
Dmax
=100.5%
Rel
ativ
e ab
sorb
ed d
ose
(%)
r (mm)
19
The results of the experiments described in Chapter 5 show that many of the clinical sourcesdo not satisfy the ICRU criterion of a maximum non-uniformity of 20%. 4 out of 5 planarstrontium sources and 5 out of 10 concave ruthenium sources display a non-uniformity that istoo high. It is therefore justified to state that the ICRU criterion is not in tune with clinicalpractice. Demands on uniformity should be in line with clinical practice, especially whentreatment results are considered to be acceptable. It may even be questioned whether theuse of sources with a flat activity distribution is desirable. For concave sources, used for theirradiation of eye melanoma, it may be beneficial to have a somewhat higher dose rate closeto the source edge in order to achieve better depth dose characteristics. Based on theseconsiderations, it was decided to use a wider margin for the non-uniformity and to introducean additional parameter for evaluating sources with respect to the asymmetry of the dosedistribution.
Source asymmetry a new NCS conceptTo quantify the asymmetry of the dose distribution of ophthalmic sources, the parameter forsource asymmetry UAS is introduced:
%100)(/)()(max minmax rDrDrDU avgAS (3-6)
In this expression the variation of the dose rate is calculated over a circle with a radius r. Themaximum of this variation, with r ranging from zero to 0.8R50, determines the value of theasymmetry UAS. The asymmetry is defined parallel to the source surface. For concavesources, a film measurement in a plane may be used as an approximation of UAS.
3.3 Beta detectors
3.3.1 IntroductionIn this section, detectors for absorbed dose measurements on beta sources are described.In general the measuring techniques can be divided into three categories:
Ionization chambers: extrapolation chamber, well-type ionization chamber, plane-parallelionization chamber
Radiochemical detectors: radiochromic film, polymer gels
Solid state detectors: thermoluminescent dosemeter (TLD), plastic scintillator, diamond,alanine, diode detector
3.3.2 Well-type ionization chamberThe well-type or re-entrant ionization chamber is an ionization chamber with a well-shape. Inradiotherapy it is the most frequently used method for calibrating line sources or seeds [35-37]. The detection volume surrounds the source, resulting in a high detection efficiencycompared with other ionization chambers. Well-type ionization chambers can be either open(vented) or pressurized. Pressurized chambers are filled with for example argon to increasethe chamber sensitivity to photons. In contrast to pressurized chambers a temperature andpressure correction needs to be applied to open chambers. Well-type ionization chambermeasurements do not provide spatial information. Usually, measurements are performed atthe sweet spot of the chamber, where the response is at a maximum. The length of thesweet spot is one of the important characteristics of a well-type ionization chamber. The
measurements are relatively simple and reliable (expanded standard uncertainty in theactivity of 5% (2 ) [36]). The well-type ionization chamber was originally designed formeasuring source activity. A conversion factor can be used to translate the activity to anabsorbed dose rate in water. The dose rate at the reference point is calculated from the
20
ionizations collected in the detection volume around the entire line source, under theassumption of a perfectly uniform activity distribution throughout the source.
The insert that is used to fix the source at the measurement position is part of the calibrationand for beta sources determines to a large extent the signal strength and whether mainlybeta radiation or bremsstrahlung is detected within the ionization volume. Different detectorinserts have been compared by Standard Imaging (Middleton, WI, USA) and the University ofWisconsin [38]. It was concluded that the use of a 2 mm acrylic insert was the optimumbetween signal strength and reproducibility. This insert blocks clinically irrelevant low-energybetas and shows high reproducibility during the measurements.
3.3.3 Plane-parallel ionization chamberThe use of parallel plate ionization chambers has been described for measurements onplanar strontium sources [34,39,40]. Because of the large electrode size (at least 5 mm),these chambers are not suitable for characterization of the activity distribution of a source. Inmost reported studies the chamber is used as a relative instrument for depth dosemeasurements.
3.3.4 Radiochromic filmRadiochromic film has turned into the most widely used method for verification of theuniformity of beta sources. GafChromicTM (ISP Technologies Inc., Wayne, NJ, USA) isavailable in single and double layer versions. A thin layer of almost colorless emulsion iscoated on a Polyethylene TerePhthalate (PTP) backing, forming a single or double sandwichof layers. The sensitive emulsion layer is between 7 and 40 m thick, depending on the typeof film. The total thickness can be between 0.1-0.3 mm (Table 3-1).
Table 3-1 Overview of currently available types of GafChromic film: MD55-2, HD810, HS, XR-R andXR-T.
MD55-2 HD810 HS XR-R XR-T
Dose range (Gy) 3-100 50-2500 0.5-40 0.2-30 0.2-15Film thickness ( m) 278 107 230 210 220Thickness ofsensitive layer ( m)
2x15 7 40 15 18
Specific features 2 sensitivelayers
Flexible, thin,sensitive layeron surface
Flexible,no adhesivelayer
Reflective,addition of lowZ material
Transparent,addition of lowZ material
The sensitive layer turns blue upon irradiation (MD55-2, HD810, HS) and does not requirepost-irradiation processing. The sensitivity of most films is low, so that an absorbed dose ofat least tens of Grays is needed. Films can be calibrated for absolute measurements [41].The energy dependence is low in the energy range relevant for clinical beta sources (100keV - 2 MeV, [42]). A major limitation of the radiochromic film is the variation in thickness ofthe sensitive layer resulting in a non-uniform response (up to 15% for MD55-2 [43]). It ispossible to compensate for these variations by using a double exposure technique [42]. Forabsolute measurements a delay of at least 24 h needs to be taken into account to minimizeeffects of incomplete film development. Uniformity information can be quantified by filmdensitometry [42]. In Table 3-2 an overview is given of frequently used densitometers. Theperformance of black and white densitometers can be enhanced some 50% by using a deeporange colored filter* when scanning the film [44]. Uniformity variations of more than ~ 10%can be detected (qualitatively) by the eye.
* Such a filter is available through Nuclear Associates (Hicksville, NY, USA).
21
In the literature radiochromic film measurements are described for both ophthalmic [45,46]and intravascular [41,47] sources. Film measurements can also be performed on concaveapplicators [46,48].
Table 3-2 Frequently used densitometers (as well as the Microtek flatbed scanner used in this report)
Company Model Light source type(wavelength)
Detector Signalresolution
Densityrange
Used by:
LKBPharmacia
UltroScan XL He-Ne laser(633 nm)
12 bit 0-4.0 OD NIST [33,49],Duggan [50],Kirisits [32]
Lumisys Lumiscan 75or 150
laser(633 nm)
LinearCCD
12 bit 0-3.5 OD Gluckman [51]
VidarSystems
Corporation
VXR-12 orVXR-16
Standard fluorescentlight (broadband)
LinearCCD
12 or 16bit
0-2.6 OD Gluckman [51],Piessens [41],
Häfeli [52], Odero[44]
NuclearAssociates
RadiochromicDensitometer
Red LED(10 nm bandwidth
centered at 671 nm)
Single spotsilicon
photodiode
3 digit ODoutput
0-4.0 Gluckman [51]
Microtek ScanMaker9600XL flatbed
White light LinearCCD
12 bit 0-3.2 OD (NCS report)
3.3.5 Polymer gelIn a few cases BANG® polymer gels (MGS Research, Guilford, CT, USA) have been usedfor 3D-dosimetry of line sources [52] or ophthalmic plaques [53]. The technique is based onthe radiation induced free-radical chain polymerization of acrylic monomers. The NMRrelaxation of water protons in the gel is strongly affected by this polymerization. The protonrelaxation rate (R2) of water protons in the polymerized gel increases linearly with absorbeddose, independent of dose rate or radiation quality. After irradiation, 3D dose maps can becreated based on R2 maps calculated from MRI spin-echo images [54,55]. In a singlemeasurement the full dose map of a source can be registered. For a ruthenium plaque anirradiation time of ~1h is needed [53].The technique is highly sensitive to environmental conditions such as temperature, light andoxygen concentration. The resolution of the MRI scanner is one of the bottlenecks of themeasurement. The introduction of a dedicated microscopic 3D optical density scanner forthis application would significantly improve resolution and reduce environmental dependence[55].
3.3.6 Thermoluminescent dosemeter (TLD)Although most hospitals make use of TLDs for dosimetry, dedicated TLDs are required formeasurements on beta sources [34,40,41,56]. The most important property of these TLDs istheir small size (as small as 0.1 mm thickness and 1 mm diameter for the active volume),which makes them suitable for determining the spatial distribution of the dose around asource. Due to their small size and water-equivalence these TLDs give only very smalldistortions of the radiation field. The TLDs are usually embedded in a solid phantom. Read-out is performed afterwards by heating the TLDs and measuring the amount of light with aphotomultiplier. Calibration is carried out in a clinical MeV electron beam or with a calibratedbeta source. TLDs can also be used for measurements on concave ophthalmic applicators[30,57,58]. The estimated standard uncertainty (1 ) is between 8-10% depending onknowledge of precise phantom dimensions and TLD characteristics [34].
22
3.3.7 Plastic scintillatorPlastic scintillators were first introduced for dosimetry of brachytherapy sources at theUniversity of Essen. The detector is based on light being generated in the plastic scintillatorvolume. The scintillation light is detected with a photomultiplier through an optical fiber. Thesignal from a blind fiber can be used to correct for Cherenkov light, created within the opticalfiber. Plastic scintillators are attractive because of their water equivalence and the smalldetection volume. The Essen plastic scintillator has a thickness of 0.4 mm and a diameter of1 mm. Measurements on ophthalmic applicators (125I and 106Ru/106Rh) showed a contributionof Cherenkov light of no more than 2%. This system has been used for measurements onboth ophthalmic plaques [59] and intravascular brachytherapy sources [60-62].The OptidosTM is a commercial version of this system developed by PTW (PTW FreiburgGmbH, Freiburg, Germany). The plastic scintillator has a detection volume of 0.8 mm3 (1 mmthickness and 1 mm diameter) and an outer diameter of 5.2 mm. The system has no blindfiber for Cherenkov compensation. Measurements need to be accompanied by check sourcemeasurements to correct for changes in the detector sensitivity. The estimated standarduncertainty (1 ) is 3% for relative dosimetry with the larger plastic scintillator withoutCherenkov compensation and 7% for the smaller scintillator with Cherenkov compensation[34].
3.3.8 Diamond detectorThe diamond detector is based on radiosensitive resistance of the detection material. One ofthe characteristics of the detector is its high sensitivity. The variation of the stopping powerratio to water in the range 0.02-5 MeV is less than 2%. Diamond detectors are producedindividually and their exact dimensions may vary. The detection volume is several mm3, butthe exact position of the detection volume is one of the larger contributors to the overallestimated standard uncertainty of 10% (1 ) [34]. Dose rates higher than 25 mGy s-1 areunderestimated, because of electron-hole recombination [34]. Pre-irradiation with 5-10 Gy isrequired to obtain a reliable signal. The detector can be used for measurements on concaveophthalmic applicators [63], despite the large outer diameter (~ 7 mm according to PTWspecifications) [64].
3.3.9 Diode detectorMost semiconductor detectors are based on p-type silicon, on one side doped with n-typematerial in order to create a p-n junction or a diode. During irradiation a current is present inthe depletion layer (effective thickness of about 60 m). There is significant variation instopping power ratio between silicon and water (up to 8% between 0.5 and 3.5 MeV) [65].Pre-irradiation with about 5 kGy by the manufacturer is needed for reliable response [66].The standard uncertainty is estimated to be 5% (1 or 2 k is not quoted) [29]. With an outerdiameter of 4-7 mm and a sensitive area of 1-2 mm (specifications Scanditronix Medical AB,Uppsala, Sweden) [29], the detector can be used for measurements on concave sources[67]. The sensitivity of the detector decreases with time, requiring regular recalibrations.Sensitivity decrease can be ~5% in a period of 5 years [29], but depends on the intensity ofuse. The detector is only used for relative measurements within the daily practice ofradiotherapy.
3.3.10 Alanine detectorDosimetry with alanine is based on the relative and non-destructive measurement of stablefree radicals produced by radiation [34,68]. These dosemeters are read out with an X-bandElectron Paramagnetic Resonance (EPR) spectrometer with a scan range of 0-2 mT.Advantages of the detector are the linear response and absence of energy dependence. Thedetector has a diameter of about 5 mm and a thickness of about 1 mm. These dimensionsalso determine the sensitive volume and therefore are a disadvantage of the method.
23
Another disadvantage is the low sensitivity, because the EPR signal is very weak. Anestimated standard uncertainty of 5-7% (1 ) can be expected in the region between 10-20Gy [34].
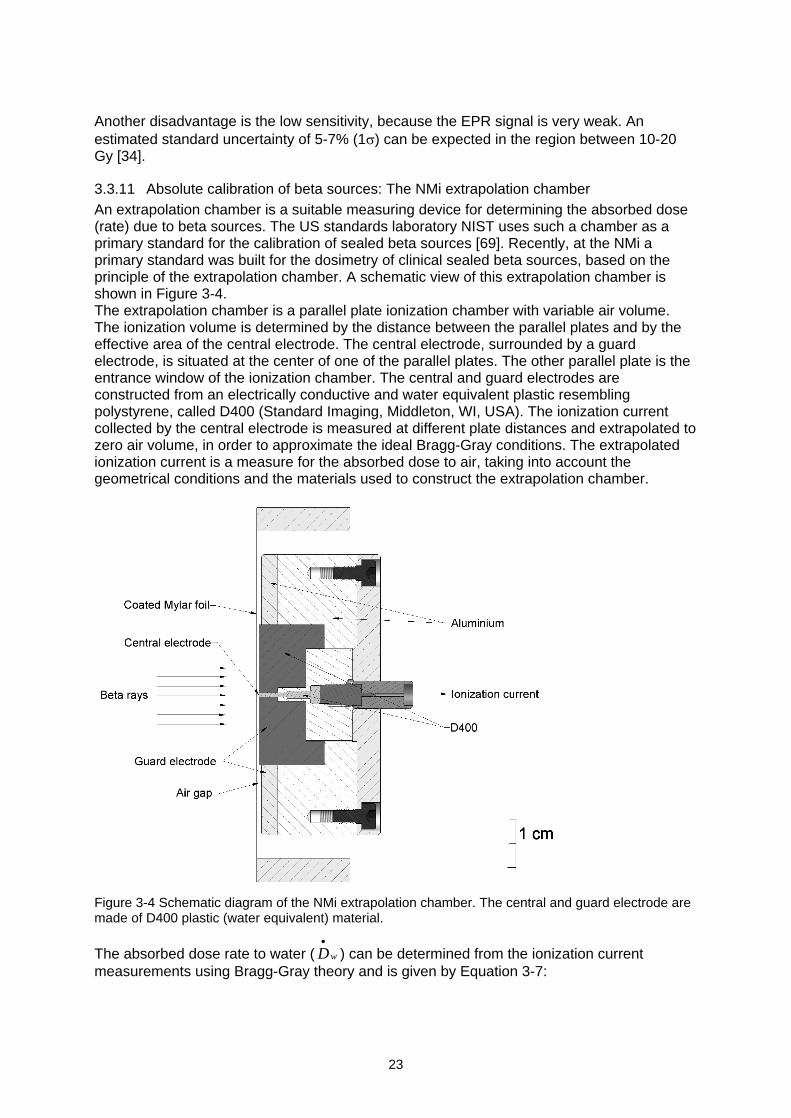
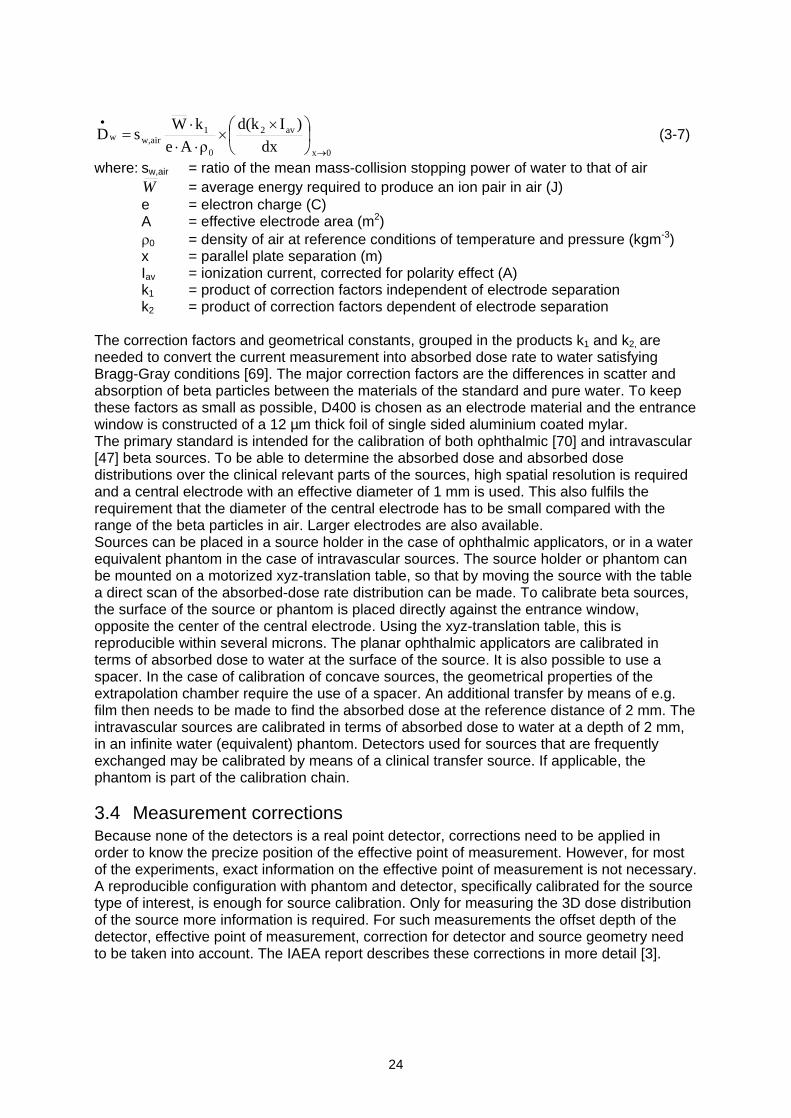
3.3.11 Absolute calibration of beta sources: The NMi extrapolation chamberAn extrapolation chamber is a suitable measuring device for determining the absorbed dose(rate) due to beta sources. The US standards laboratory NIST uses such a chamber as aprimary standard for the calibration of sealed beta sources [69]. Recently, at the NMi aprimary standard was built for the dosimetry of clinical sealed beta sources, based on theprinciple of the extrapolation chamber. A schematic view of this extrapolation chamber isshown in Figure 3-4.The extrapolation chamber is a parallel plate ionization chamber with variable air volume.The ionization volume is determined by the distance between the parallel plates and by theeffective area of the central electrode. The central electrode, surrounded by a guardelectrode, is situated at the center of one of the parallel plates. The other parallel plate is theentrance window of the ionization chamber. The central and guard electrodes areconstructed from an electrically conductive and water equivalent plastic resemblingpolystyrene, called D400 (Standard Imaging, Middleton, WI, USA). The ionization currentcollected by the central electrode is measured at different plate distances and extrapolated tozero air volume, in order to approximate the ideal Bragg-Gray conditions. The extrapolatedionization current is a measure for the absorbed dose to air, taking into account thegeometrical conditions and the materials used to construct the extrapolation chamber.
Figure 3-4 Schematic diagram of the NMi extrapolation chamber. The central and guard electrode aremade of D400 plastic (water equivalent) material.
The absorbed dose rate to water ( wD ) can be determined from the ionization currentmeasurements using Bragg-Gray theory and is given by Equation 3-7:
24
0x
av2
0
1airw,w
dx
)Id(k
Ae
kWsD (3-7)
where: sw,air = ratio of the mean mass-collision stopping power of water to that of airW = average energy required to produce an ion pair in air (J)e = electron charge (C)A = effective electrode area (m2)
0 = density of air at reference conditions of temperature and pressure (kgm-3)x = parallel plate separation (m)Iav = ionization current, corrected for polarity effect (A)k1 = product of correction factors independent of electrode separationk2 = product of correction factors dependent of electrode separation
The correction factors and geometrical constants, grouped in the products k1 and k2, areneeded to convert the current measurement into absorbed dose rate to water satisfyingBragg-Gray conditions [69]. The major correction factors are the differences in scatter andabsorption of beta particles between the materials of the standard and pure water. To keepthese factors as small as possible, D400 is chosen as an electrode material and the entrancewindow is constructed of a 12 µm thick foil of single sided aluminium coated mylar.The primary standard is intended for the calibration of both ophthalmic [70] and intravascular[47] beta sources. To be able to determine the absorbed dose and absorbed dosedistributions over the clinical relevant parts of the sources, high spatial resolution is requiredand a central electrode with an effective diameter of 1 mm is used. This also fulfils therequirement that the diameter of the central electrode has to be small compared with therange of the beta particles in air. Larger electrodes are also available.Sources can be placed in a source holder in the case of ophthalmic applicators, or in a waterequivalent phantom in the case of intravascular sources. The source holder or phantom canbe mounted on a motorized xyz-translation table, so that by moving the source with the tablea direct scan of the absorbed-dose rate distribution can be made. To calibrate beta sources,the surface of the source or phantom is placed directly against the entrance window,opposite the center of the central electrode. Using the xyz-translation table, this isreproducible within several microns. The planar ophthalmic applicators are calibrated interms of absorbed dose to water at the surface of the source. It is also possible to use aspacer. In the case of calibration of concave sources, the geometrical properties of theextrapolation chamber require the use of a spacer. An additional transfer by means of e.g.film then needs to be made to find the absorbed dose at the reference distance of 2 mm. Theintravascular sources are calibrated in terms of absorbed dose to water at a depth of 2 mm,in an infinite water (equivalent) phantom. Detectors used for sources that are frequentlyexchanged may be calibrated by means of a clinical transfer source. If applicable, thephantom is part of the calibration chain.
3.4 Measurement correctionsBecause none of the detectors is a real point detector, corrections need to be applied inorder to know the precize position of the effective point of measurement. However, for mostof the experiments, exact information on the effective point of measurement is not necessary.A reproducible configuration with phantom and detector, specifically calibrated for the sourcetype of interest, is enough for source calibration. Only for measuring the 3D dose distributionof the source more information is required. For such measurements the offset depth of thedetector, effective point of measurement, correction for detector and source geometry needto be taken into account. The IAEA report describes these corrections in more detail [3].
25
Many measurements are performed in a solid phantom instead of in water. The depth dosecurve in a solid phantom is in general different from that in water and therefore a correction isrequired. Monte Carlo calculations, in which the phantom medium is replaced by water, canbe used for such corrections. Another possibility is to correct through scaling. In the literaturedifferent reviews of scaling rules are given [2,3,65], mostly based on the work of Cross forpoint sources [71]. Schaart has adapted the method for line sources [72]. An overview of theinformation that is relevant for depth dose curves of beta sources is given in Appendix 3.
Estimates of other disturbances can often be found in the manual of the detector. Possiblefactors are energy dependence (stopping-power ratio in the area of interest), directionaldependence and dependence on temperature and/or pressure. For ionization chambers the
correction through pT
pT
0
0 is well known in radiotherapy.
3.5 Considerations for detector selection criteriaThe required degree of accuracy in beta dosimetry should be weighted against tolerancesand uncertainties in the clinical application. While a relatively high degree of accuracy isrequired in teletherapy and brachytherapy with gamma sources, several reasons may justifyless stringent demands on the accuracy in brachytherapy with beta sources.1) Positioning uncertainties within the patient are often in the order of 0.1-1 mm or even
more. Large uncertainties may for example exist if a non-centered catheter is used forintravascular brachytherapy. A change of 0.1 mm in radial source positioning causesdose differences in the order of 10%.
2) Relatively little is known about the minimum absorbed dose needed to achieve localcontrol in the three applications of beta sources: in-stent restenosis [16], pterygium [25]and eye melanoma. The clinical results, however, show relatively high local control rates.In addition, few complications related to overdose such as restenosis or cataract havebeen reported [73,74]. A surface dose of 1000 Gy is regarded as a limitation for theirradiation of eye melanoma [29].
3) Absolute source calibrations have always been accompanied by large uncertainties of upto 30% (2 ).
In the past, large uncertainties were present in the dosimetry of beta sources. This can beimproved by the introduction and standardization of more accurate measurement methods inclinical practice. The methods for source strength determination should be based on ortraceable to well established (primary) standards for absorbed dose. The measurementuncertainties should be reduced as much as possible, provided that the required investmentsremain reasonable. The NCS estimates that deviations in source strength below 10% willhave little clinical significance compared with other factors. Uncertainties in the dosimetry ofbeta sources should therefore be such that a deviation of 10% can be detected within allcombined measurement uncertainties that are present.
In the choice of detectors, aspects such as detector volume, reproducibility, stability,sensitivity, dependence of dose rate as well as angle of incidence and energy play a role.Other factors such as frequency of use, costs, ease of use, and availability of detectors andphantoms should also be taken into account before a measurement system is bought fordosimetry of beta sources. For calibration of sources with a long lifetime, services offered byspecialized institutes such as the NMi may be an efficient way of handling theresponsibility of independent strength and uniformity verifications.
26
3.6 Selection of detectorsBased on the criteria mentioned in the previous paragraph, a first selection was made ofdetectors to be tested during a dosimetry intercomparison study as described in Chapter 5.The considerations for this selection are given below. The availability of detectors at localdepartments was investigated separately and is provided in Section 4.3.
3.6.1 Detectors that were not selected for the intercomparison
Extrapolation chamberThe extrapolation chamber is the primary standard for beta dosimetry. It is not commerciallyavailable with electrodes smaller than 1 cm.
Polymer gelThe use of polymer gel is still very uncommon within the daily practice of radiotherapy.Disadvantages are the strong environmental dependence and the offline measurements. Theavailability of read-out devices may be a bottleneck for application of polymer gels, althoughdesktop optical readout devices are under development.
TLDAlthough sensitive and reliable measurements can be made with TLDs, the processing timeis an important disadvantage of this method. Furthermore, TLDs that have been used fordosimetry of beta sources are different in size from the regular TLDs in radiotherapy and arenot readily available. The TLDs only give information for one point; for measuring the spatialdistribution around the source more TLDs are required.
Diamond detectorThe required pre-irradiation and possible underestimation of the dose rate are disadvantagesof this detector. The detector is not part of the standard equipment, although it is (limited)commercially available. The diameter of the active volume of 2-4 mm is another limitation forthese measurements.
AlanineFew institutes have experience with this detector. The low sensitivity, offline measurementsand limited availability are disadvantages.
3.6.2 Detectors selected for the intercomparison
Well-type ionization chamberThe well-type ionization chamber is widely used for the calibration of line sources and isknown for its high reproducibility. All Guidant users are equipped with a well-type ionizationchamber. A disadvantage of the detector is that an additional measurement is required fordetermination of the source non-uniformity.
Plastic scintillatorThis versatile detector is suitable for measurements on high and low dose rate sources andfor strength, depth dose and uniformity measurements. It also has a high degree of waterequivalence and a relatively small detector volume. It is generally available and routinelyused by Novoste for source strength and uniformity verifications on their line sources.
Plane-parallel ionization chamberThe use of this detector for strength and depth dose measurements has been described asmentioned above. This detector is available in most radiotherapy departments. Size andsensitivity of the detector are factors that limit its use to high dose rates and relatively largesources such as the planar strontium applicators.
27
DiodeThis detector is used in many institutes for relative measurements of the dose distribution ofaccelerator beams. Its use is also mentioned in the literature and the detector has a relativelyhigh spatial resolution. In practice, the detector is rarely used for absolute measurements.
Radiochromic filmRadiochromic film is widely used for uniformity measurements on beta sources. Guidantusers are provided with film by the manufacturer. The film is easy to use, but quantitativeevaluation is more elaborate, as densitometry has to be applied.
28
4 Current status of dosimetry of beta sourcesThis chapter gives an overview of beta sources and related dosimetry in the Netherlands andBelgium. A questionnaire was sent to all radiotherapy departments to collect data on sourcesused and dosimetry procedures performed.
4.1 QuestionnaireA questionnaire was composed and sent to all known 47 radiotherapy departments in theNetherlands and Belgium (all 21 departments in the Netherlands, 26 in Belgium). Thequestionnaires were filled in between October 2001 and February 2002. The response was100%.The questionnaire consisted of 3 parts:
A list of sources (available y/n)
A list of detection methods (available y/n)
Type and frequency of current dosimetric checks
4.2 Use of beta sources in the Netherlands and BelgiumAbout half of the radiotherapy departments in the Netherlands and Belgium make use ofsealed beta sources: 10/21 in the Netherlands and 13/26 in Belgium. Only sources that arecommercially available and that are used clinically were included in the questionnaire.
The first part of the questionnaire concerned the source types. A general overview of all betasources in the Netherlands and Belgium is given in Figure 4-1. Sources used forintravascular brachytherapy are the Guidant 20 mm and Novoste 30, 40 and 60 mm sources.The ophthalmic sources are mostly planar and concave 90Sr/90Y applicators manufactured byAmersham. Only 3 institutes make use of concave 106Ru/106Rh BEBIG sources for thetreatment of malignant eye diseases.
Figure 4-1 Number of institutes with one or more Guidant, Novoste, Amersham or BEBIG sources inthe Netherlands and Belgium.
0
2
4
6
8
10
12
14
Guidant P-32 Novoste Sr-90 Amershamplanar Sr-90
Amershamconcave Sr-90
BEBIG concaveRu-106
num
ber
of in
stitu
tes
# of institutes with source (BE)
# of institutes with source (NL)
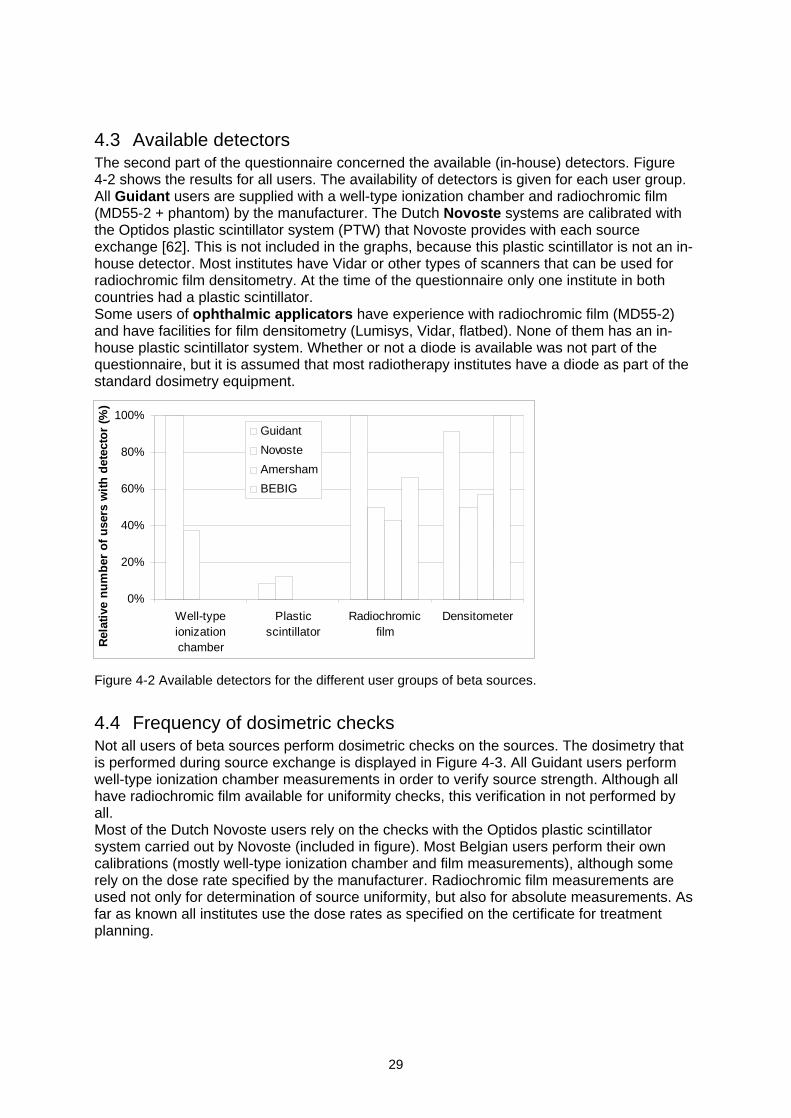
29
4.3 Available detectorsThe second part of the questionnaire concerned the available (in-house) detectors. Figure4-2 shows the results for all users. The availability of detectors is given for each user group.All Guidant users are supplied with a well-type ionization chamber and radiochromic film(MD55-2 + phantom) by the manufacturer. The Dutch Novoste systems are calibrated withthe Optidos plastic scintillator system (PTW) that Novoste provides with each sourceexchange [62]. This is not included in the graphs, because this plastic scintillator is not an in-house detector. Most institutes have Vidar or other types of scanners that can be used forradiochromic film densitometry. At the time of the questionnaire only one institute in bothcountries had a plastic scintillator.Some users of ophthalmic applicators have experience with radiochromic film (MD55-2)and have facilities for film densitometry (Lumisys, Vidar, flatbed). None of them has an in-house plastic scintillator system. Whether or not a diode is available was not part of thequestionnaire, but it is assumed that most radiotherapy institutes have a diode as part of thestandard dosimetry equipment.
Figure 4-2 Available detectors for the different user groups of beta sources.
4.4 Frequency of dosimetric checksNot all users of beta sources perform dosimetric checks on the sources. The dosimetry thatis performed during source exchange is displayed in Figure 4-3. All Guidant users performwell-type ionization chamber measurements in order to verify source strength. Although allhave radiochromic film available for uniformity checks, this verification in not performed byall.Most of the Dutch Novoste users rely on the checks with the Optidos plastic scintillatorsystem carried out by Novoste (included in figure). Most Belgian users perform their owncalibrations (mostly well-type ionization chamber and film measurements), although somerely on the dose rate specified by the manufacturer. Radiochromic film measurements areused not only for determination of source uniformity, but also for absolute measurements. Asfar as known all institutes use the dose rates as specified on the certificate for treatmentplanning.
0%
20%
40%
60%
80%
100%
Well-typeionizationchamber
Plasticscintillator
Radiochromicfilm
Densitometer
Rel
ativ
e n
um
ber
of
use
rs w
ith
det
ecto
r (%
)
Guidant
Novoste
Amersham
BEBIG
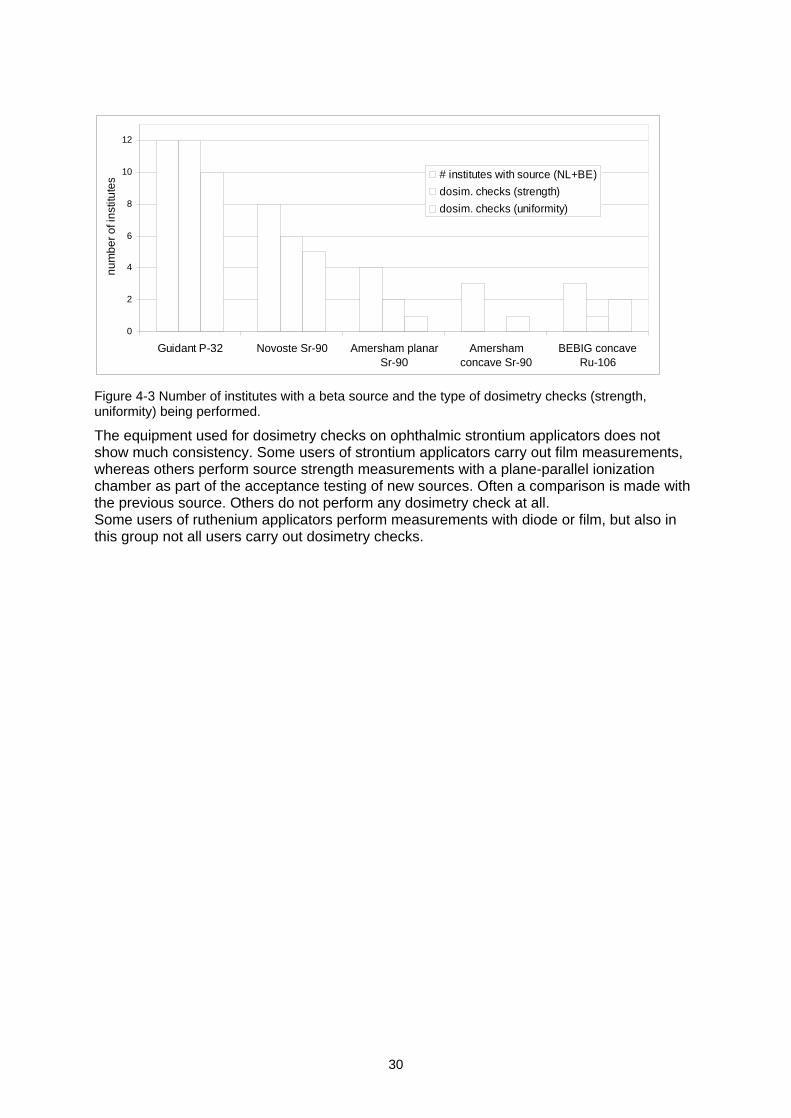
30
Figure 4-3 Number of institutes with a beta source and the type of dosimetry checks (strength,uniformity) being performed.
The equipment used for dosimetry checks on ophthalmic strontium applicators does notshow much consistency. Some users of strontium applicators carry out film measurements,whereas others perform source strength measurements with a plane-parallel ionizationchamber as part of the acceptance testing of new sources. Often a comparison is made withthe previous source. Others do not perform any dosimetry check at all.Some users of ruthenium applicators perform measurements with diode or film, but also inthis group not all users carry out dosimetry checks.
0
2
4
6
8
10
12
Guidant P-32 Novoste Sr-90 Amersham planarSr-90
Amershamconcave Sr-90
BEBIG concaveRu-106
num
ber o
f ins
titut
es
# institutes with source (NL+BE)
dosim. checks (strength)
dosim. checks (uniformity)
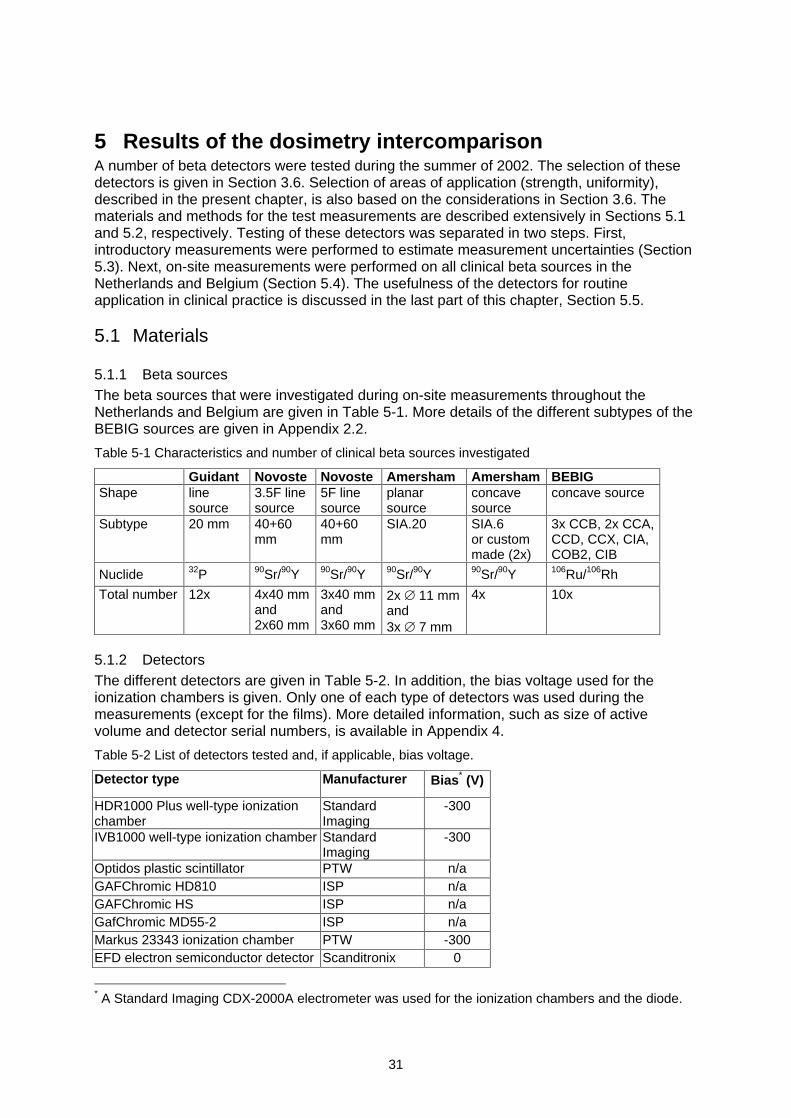
31
5 Results of the dosimetry intercomparisonA number of beta detectors were tested during the summer of 2002. The selection of thesedetectors is given in Section 3.6. Selection of areas of application (strength, uniformity),described in the present chapter, is also based on the considerations in Section 3.6. Thematerials and methods for the test measurements are described extensively in Sections 5.1and 5.2, respectively. Testing of these detectors was separated in two steps. First,introductory measurements were performed to estimate measurement uncertainties (Section5.3). Next, on-site measurements were performed on all clinical beta sources in theNetherlands and Belgium (Section 5.4). The usefulness of the detectors for routineapplication in clinical practice is discussed in the last part of this chapter, Section 5.5.
5.1 Materials
5.1.1 Beta sourcesThe beta sources that were investigated during on-site measurements throughout theNetherlands and Belgium are given in Table 5-1. More details of the different subtypes of theBEBIG sources are given in Appendix 2.2.
Table 5-1 Characteristics and number of clinical beta sources investigated
Guidant Novoste Novoste Amersham Amersham BEBIGShape line
source3.5F linesource
5F linesource
planarsource
concavesource
concave source
Subtype 20 mm 40+60mm
40+60mm
SIA.20 SIA.6or custommade (2x)
3x CCB, 2x CCA,CCD, CCX, CIA,COB2, CIB
Nuclide 32P 90Sr/90Y 90Sr/90Y 90Sr/90Y 90Sr/90Y 106Ru/106Rh
Total number 12x 4x40 mmand2x60 mm
3x40 mmand3x60 mm
2x 11 mmand3x 7 mm
4x 10x
5.1.2 DetectorsThe different detectors are given in Table 5-2. In addition, the bias voltage used for theionization chambers is given. Only one of each type of detectors was used during themeasurements (except for the films). More detailed information, such as size of activevolume and detector serial numbers, is available in Appendix 4.
Table 5-2 List of detectors tested and, if applicable, bias voltage.
Detector type Manufacturer Bias* (V)
HDR1000 Plus well-type ionizationchamber
StandardImaging
-300
IVB1000 well-type ionization chamber StandardImaging
-300
Optidos plastic scintillator PTW n/aGAFChromic HD810 ISP n/aGAFChromic HS ISP n/aGafChromic MD55-2 ISP n/aMarkus 23343 ionization chamber PTW -300EFD electron semiconductor detector Scanditronix 0
* A Standard Imaging CDX-2000A electrometer was used for the ionization chambers and the diode.
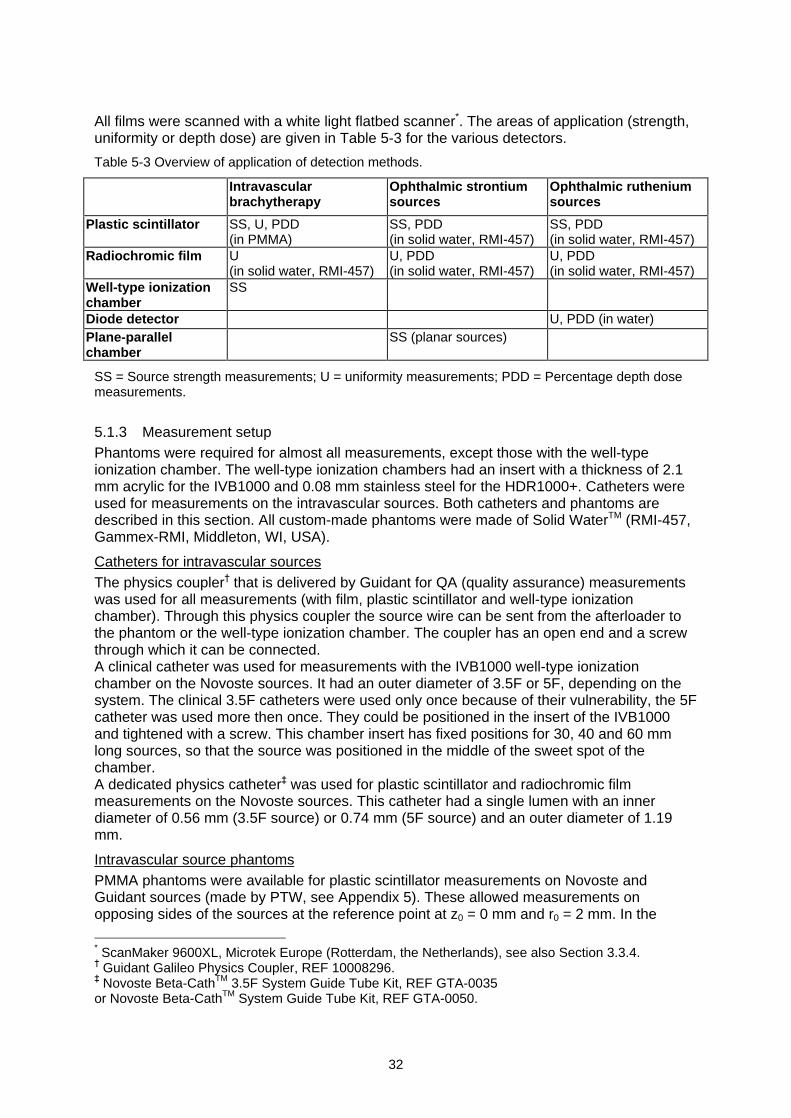
32
All films were scanned with a white light flatbed scanner*. The areas of application (strength,uniformity or depth dose) are given in Table 5-3 for the various detectors.
Table 5-3 Overview of application of detection methods.
Intravascularbrachytherapy
Ophthalmic strontiumsources
Ophthalmic rutheniumsources
Plastic scintillator SS, U, PDD(in PMMA)
SS, PDD(in solid water, RMI-457)
SS, PDD(in solid water, RMI-457)
Radiochromic film U(in solid water, RMI-457)
U, PDD(in solid water, RMI-457)
U, PDD(in solid water, RMI-457)
Well-type ionizationchamber
SS
Diode detector U, PDD (in water)Plane-parallelchamber
SS (planar sources)
SS = Source strength measurements; U = uniformity measurements; PDD = Percentage depth dosemeasurements.
5.1.3 Measurement setupPhantoms were required for almost all measurements, except those with the well-typeionization chamber. The well-type ionization chambers had an insert with a thickness of 2.1mm acrylic for the IVB1000 and 0.08 mm stainless steel for the HDR1000+. Catheters wereused for measurements on the intravascular sources. Both catheters and phantoms aredescribed in this section. All custom-made phantoms were made of Solid WaterTM (RMI-457,Gammex-RMI, Middleton, WI, USA).
Catheters for intravascular sourcesThe physics coupler that is delivered by Guidant for QA (quality assurance) measurementswas used for all measurements (with film, plastic scintillator and well-type ionizationchamber). Through this physics coupler the source wire can be sent from the afterloader tothe phantom or the well-type ionization chamber. The coupler has an open end and a screwthrough which it can be connected.A clinical catheter was used for measurements with the IVB1000 well-type ionizationchamber on the Novoste sources. It had an outer diameter of 3.5F or 5F, depending on thesystem. The clinical 3.5F catheters were used only once because of their vulnerability, the 5Fcatheter was used more then once. They could be positioned in the insert of the IVB1000and tightened with a screw. This chamber insert has fixed positions for 30, 40 and 60 mmlong sources, so that the source was positioned in the middle of the sweet spot of thechamber.A dedicated physics catheter was used for plastic scintillator and radiochromic filmmeasurements on the Novoste sources. This catheter had a single lumen with an innerdiameter of 0.56 mm (3.5F source) or 0.74 mm (5F source) and an outer diameter of 1.19mm.
Intravascular source phantomsPMMA phantoms were available for plastic scintillator measurements on Novoste andGuidant sources (made by PTW, see Appendix 5). These allowed measurements onopposing sides of the sources at the reference point at z0 = 0 mm and r0 = 2 mm. In the
* ScanMaker 9600XL, Microtek Europe (Rotterdam, the Netherlands), see also Section 3.3.4. Guidant Galileo Physics Coupler, REF 10008296. Novoste Beta-CathTM 3.5F System Guide Tube Kit, REF GTA-0035
or Novoste Beta-CathTM System Guide Tube Kit, REF GTA-0050.

33
phantom, depth dose measurements could be performed at z = 0 using spacers. The sourceprofile of the Guidant sources was obtained by stepping the source through the Optidosphantom. This phantom had a circular bore, in which the source runs, with a diameter of0.60 0.02 mm. The source profile of the Novoste sources was obtained at positions with z =0, ±10 and ±20 mm. This phantom had a circular bore in which both physics catheters fitted.A film phantom was designed in which the uniformity of intravascular sources could bedetermined at the reference distance r0 = 2 mm. The phantom was made in such a way thatit could be used for measurements on both the 90Sr/90Y Novoste and 32P Guidant sources.Details of the design are given in Appendix 6. The phantom had a different insert for thesetwo types of sources. The phantom for the Guidant sources had a square channel with a sideof 0.5 mm (source diameter is 0.46 mm), to which the physics coupler can be connected.The one for the Novoste sources had a square channel with a side of 1.2 mm in which thephysics catheter could be inserted.
Planar ophthalmic source phantomsPhantoms were designed for measurements on the planar ophthalmic sources using aplastic scintillator, plane-parallel ionization chamber and radiochromic film. All phantoms hadthe same principle for insertion of the source. A cross-section of the phantom for plasticscintillator measurements is given in Figure A11, Appendix 7. The source could be centeredwith respect to the detector. Spacers of different thickness could be inserted for depth dosemeasurements. A sketch of the setup used for measurements with the plastic scintillator andplane-parallel ionization chamber is given in Appendix 8. Similar setups were used formeasurements on all ophthalmic sources (both planar and concave), except for those onruthenium in water. Measurements with the plane-parallel ionization chamber wereperformed with the protective cover screwed onto the chamber. This cap has a thickness of0.87 mm acrylic (1 mm water equivalent).
Concave ophthalmic source phantomsSpherical phantoms were designed for measurements on the concave ophthalmic sources.They had a radius of curvature of 12 mm (ruthenium sources) and 10 mm (strontiumsources). The phantoms for depth dose measurements using either radiochromic film or aplastic scintillator are given in Figure A12 and A13 of Appendix 7. In the design of thephantom for the film depth dose measurements a space of 0.2 mm was left open tocompensate for film size. Spherical phantoms for uniformity measurements were designedwith a thickness of 3.4 mm (strontium sources) and 4.5 mm (ruthenium sources) under whicha film could be positioned. These distances are given by the nearest possible planesperpendicular to the source axis, outside the source geometry.
Setup diode measurements in waterDiode measurements on the ruthenium sources were performed in water. A sketch of thesetup is given in Appendix 9. The source-detector distance was determined with a depth dialindicator.
5.1.4 Check source measurementsCheck source measurements were performed to verify the stability of the plastic scintillator,plane-parallel ionization chamber and diode detector. A 33.3 MBq 90Sr/90Y check source wasavailable for this purpose (see Appendix 4 for more detail).For check source measurements on the plastic scintillator a dedicated phantom wasavailable from PTW. Check source measurements were performed every 40 minutes asadvised by the manufacturer. These measurements were used to correct for changes indetector sensitivity.Check source measurements on the Markus chamber were only used as a verification ofdetector stability. A special ring was available for placement of the check source.
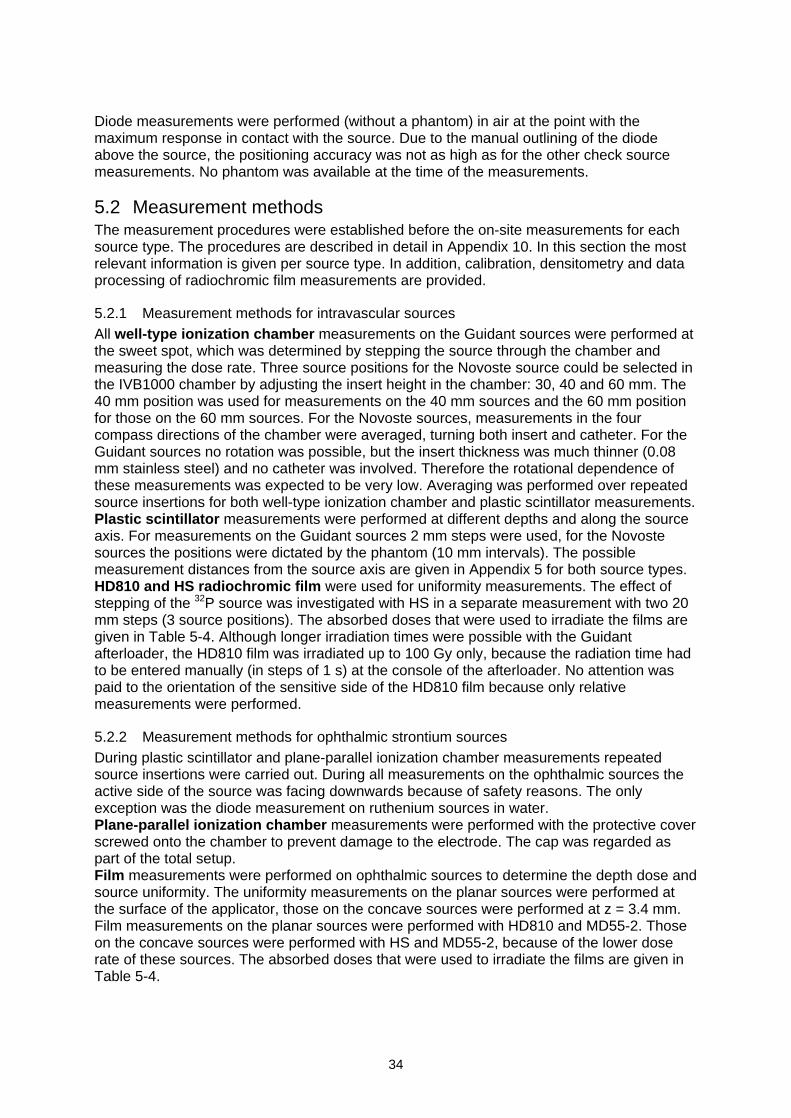
34
Diode measurements were performed (without a phantom) in air at the point with themaximum response in contact with the source. Due to the manual outlining of the diodeabove the source, the positioning accuracy was not as high as for the other check sourcemeasurements. No phantom was available at the time of the measurements.
5.2 Measurement methodsThe measurement procedures were established before the on-site measurements for eachsource type. The procedures are described in detail in Appendix 10. In this section the mostrelevant information is given per source type. In addition, calibration, densitometry and dataprocessing of radiochromic film measurements are provided.
5.2.1 Measurement methods for intravascular sourcesAll well-type ionization chamber measurements on the Guidant sources were performed atthe sweet spot, which was determined by stepping the source through the chamber andmeasuring the dose rate. Three source positions for the Novoste source could be selected inthe IVB1000 chamber by adjusting the insert height in the chamber: 30, 40 and 60 mm. The40 mm position was used for measurements on the 40 mm sources and the 60 mm positionfor those on the 60 mm sources. For the Novoste sources, measurements in the fourcompass directions of the chamber were averaged, turning both insert and catheter. For theGuidant sources no rotation was possible, but the insert thickness was much thinner (0.08mm stainless steel) and no catheter was involved. Therefore the rotational dependence ofthese measurements was expected to be very low. Averaging was performed over repeatedsource insertions for both well-type ionization chamber and plastic scintillator measurements.Plastic scintillator measurements were performed at different depths and along the sourceaxis. For measurements on the Guidant sources 2 mm steps were used, for the Novostesources the positions were dictated by the phantom (10 mm intervals). The possiblemeasurement distances from the source axis are given in Appendix 5 for both source types.HD810 and HS radiochromic film were used for uniformity measurements. The effect ofstepping of the 32P source was investigated with HS in a separate measurement with two 20mm steps (3 source positions). The absorbed doses that were used to irradiate the films aregiven in Table 5-4. Although longer irradiation times were possible with the Guidantafterloader, the HD810 film was irradiated up to 100 Gy only, because the radiation time hadto be entered manually (in steps of 1 s) at the console of the afterloader. No attention waspaid to the orientation of the sensitive side of the HD810 film because only relativemeasurements were performed.
5.2.2 Measurement methods for ophthalmic strontium sourcesDuring plastic scintillator and plane-parallel ionization chamber measurements repeatedsource insertions were carried out. During all measurements on the ophthalmic sources theactive side of the source was facing downwards because of safety reasons. The onlyexception was the diode measurement on ruthenium sources in water.Plane-parallel ionization chamber measurements were performed with the protective coverscrewed onto the chamber to prevent damage to the electrode. The cap was regarded aspart of the total setup.Film measurements were performed on ophthalmic sources to determine the depth dose andsource uniformity. The uniformity measurements on the planar sources were performed atthe surface of the applicator, those on the concave sources were performed at z = 3.4 mm.Film measurements on the planar sources were performed with HD810 and MD55-2. Thoseon the concave sources were performed with HS and MD55-2, because of the lower doserate of these sources. The absorbed doses that were used to irradiate the films are given inTable 5-4.
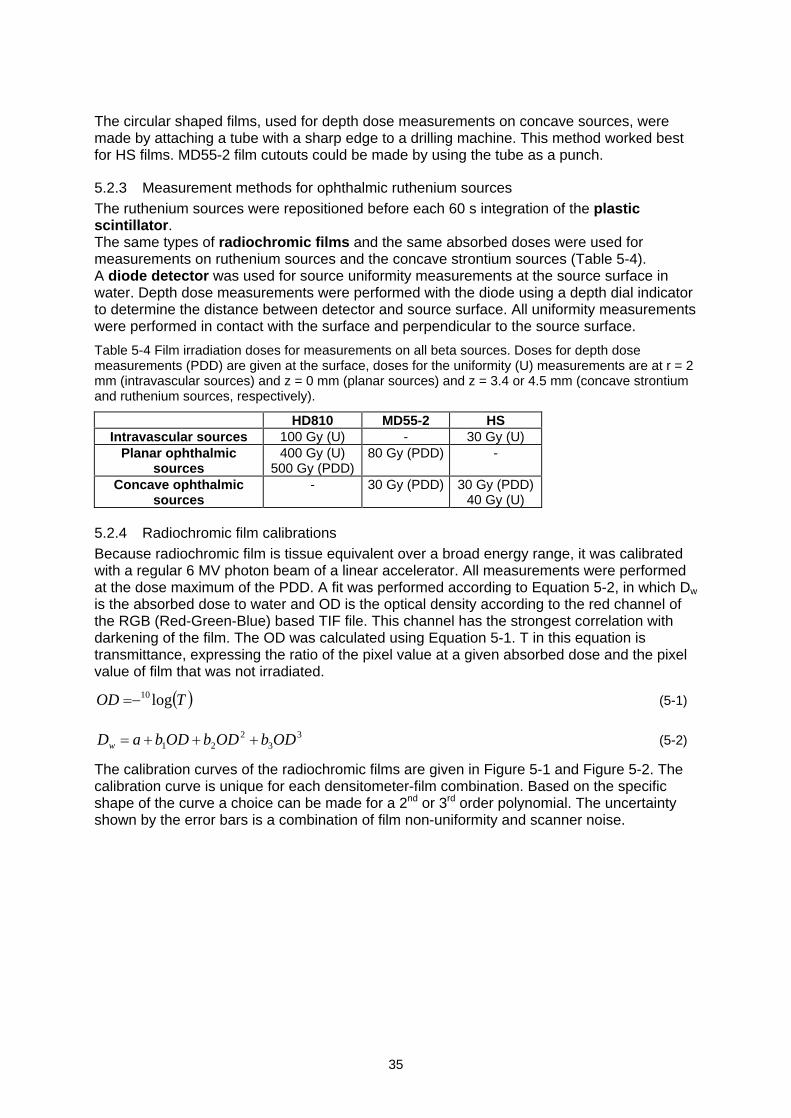
35
The circular shaped films, used for depth dose measurements on concave sources, weremade by attaching a tube with a sharp edge to a drilling machine. This method worked bestfor HS films. MD55-2 film cutouts could be made by using the tube as a punch.
5.2.3 Measurement methods for ophthalmic ruthenium sourcesThe ruthenium sources were repositioned before each 60 s integration of the plasticscintillator.The same types of radiochromic films and the same absorbed doses were used formeasurements on ruthenium sources and the concave strontium sources (Table 5-4).A diode detector was used for source uniformity measurements at the source surface inwater. Depth dose measurements were performed with the diode using a depth dial indicatorto determine the distance between detector and source surface. All uniformity measurementswere performed in contact with the surface and perpendicular to the source surface.
Table 5-4 Film irradiation doses for measurements on all beta sources. Doses for depth dosemeasurements (PDD) are given at the surface, doses for the uniformity (U) measurements are at r = 2mm (intravascular sources) and z = 0 mm (planar sources) and z = 3.4 or 4.5 mm (concave strontiumand ruthenium sources, respectively).
HD810 MD55-2 HSIntravascular sources 100 Gy (U) - 30 Gy (U)
Planar ophthalmicsources
400 Gy (U)500 Gy (PDD)
80 Gy (PDD) -
Concave ophthalmicsources
- 30 Gy (PDD) 30 Gy (PDD)40 Gy (U)
5.2.4 Radiochromic film calibrationsBecause radiochromic film is tissue equivalent over a broad energy range, it was calibratedwith a regular 6 MV photon beam of a linear accelerator. All measurements were performedat the dose maximum of the PDD. A fit was performed according to Equation 5-2, in which Dw
is the absorbed dose to water and OD is the optical density according to the red channel ofthe RGB (Red-Green-Blue) based TIF file. This channel has the strongest correlation withdarkening of the film. The OD was calculated using Equation 5-1. T in this equation istransmittance, expressing the ratio of the pixel value at a given absorbed dose and the pixelvalue of film that was not irradiated.
TOD log10 (5-1)
33
221 ODbODbODbaDw (5-2)
The calibration curves of the radiochromic films are given in Figure 5-1 and Figure 5-2. Thecalibration curve is unique for each densitometer-film combination. Based on the specificshape of the curve a choice can be made for a 2nd or 3rd order polynomial. The uncertaintyshown by the error bars is a combination of film non-uniformity and scanner noise.
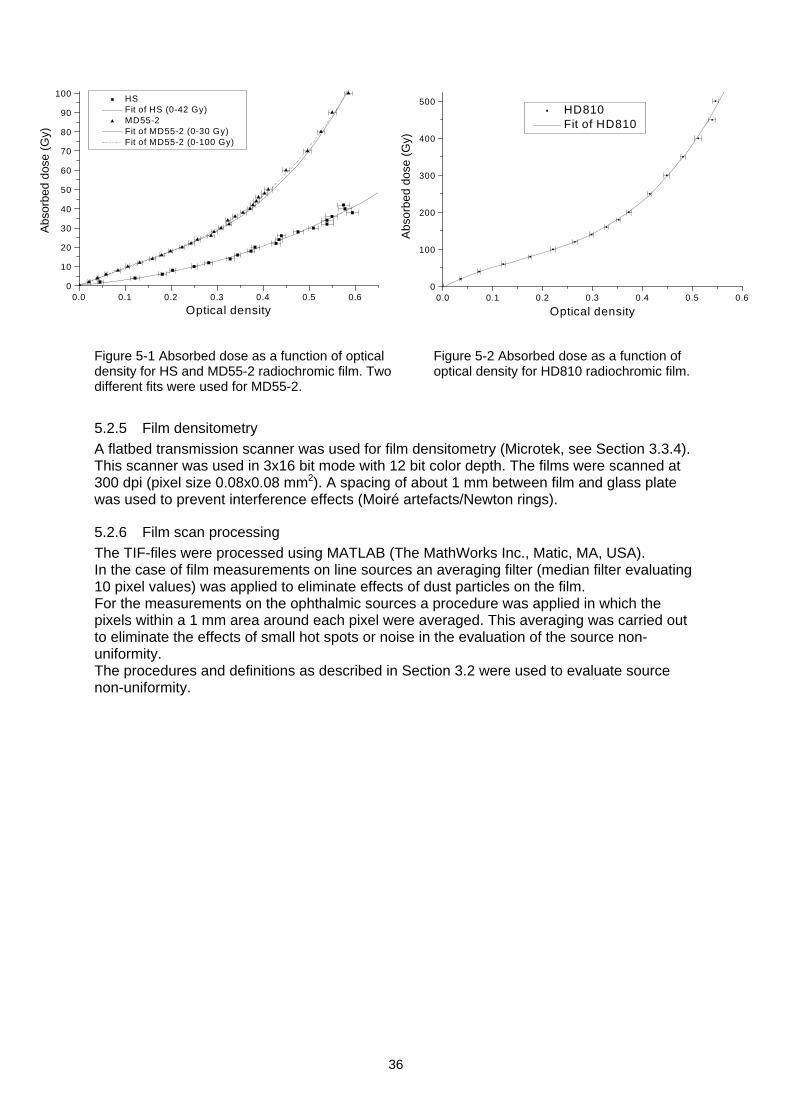
36
Figure 5-1 Absorbed dose as a function of opticaldensity for HS and MD55-2 radiochromic film. Twodifferent fits were used for MD55-2.
Figure 5-2 Absorbed dose as a function ofoptical density for HD810 radiochromic film.
5.2.5 Film densitometryA flatbed transmission scanner was used for film densitometry (Microtek, see Section 3.3.4).This scanner was used in 3x16 bit mode with 12 bit color depth. The films were scanned at300 dpi (pixel size 0.08x0.08 mm2). A spacing of about 1 mm between film and glass platewas used to prevent interference effects (Moiré artefacts/Newton rings).
5.2.6 Film scan processingThe TIF-files were processed using MATLAB (The MathWorks Inc., Matic, MA, USA).In the case of film measurements on line sources an averaging filter (median filter evaluating10 pixel values) was applied to eliminate effects of dust particles on the film.For the measurements on the ophthalmic sources a procedure was applied in which thepixels within a 1 mm area around each pixel were averaged. This averaging was carried outto eliminate the effects of small hot spots or noise in the evaluation of the source non-uniformity.The procedures and definitions as described in Section 3.2 were used to evaluate sourcenon-uniformity.
0.0 0.1 0.2 0.3 0.4 0.5 0.60
10
20
30
40
50
60
70
80
90
100
HS
Fit of HS (0-42 Gy)
MD55-2
Fit of MD55-2 (0-30 Gy)
Fit of MD55-2 (0-100 Gy)
Abs
orbe
d do
se (
Gy)
Optical density0.0 0.1 0.2 0.3 0.4 0.5 0.6
0
100
200
300
400
500
HD810
Fit of HD810
Abs
orbe
d do
se (
Gy)
Optical density
37
5.3 Estimation of measurement uncertaintiesDuring a number of introductory measurements measurement procedures were establishedas described in Appendix 10. Reproducibility of detector reading, influence of source anddetector positioning, environmental influences and detector stability as verified through checksource measurements were investigated. Results of these measurements are provided in thefollowing sections. Reproducibility of the measurements, as function of source positioning,was taken from the series of on-site measurements as described in Section 5.4. In addition,the check source measurements accompanying these on-site measurements were used forSection 5.3.3.
5.3.1 Positioning uncertaintiesThe steep dose gradient of beta sources strongly dictates the importance of accurate sourceand detector positioning. The effects of positioning are shown in columns 1-3 of Table 5-5.The numbers in column 2 are the averaged standard deviations taken from the on-sitemeasurements, described in Section 5.4. The measurements summarized in columns 2 to 4,correspond to n measurements (as given in column 1) on N different sources. For every 60 sintegration time, the source was reinserted in case of a measurement represented in column2, and the detector was repositioned for a measurement represented in column 3. Emptycells in column 3 indicate that it was not possible to change detector position withoutchanging source position.Phantom design and if applicable catheter geometry mainly determine positioninguncertainties. For plastic scintillator measurements on the 32P source with the PTW Optidosphantom, large variations in reading were found, which seemed to be correlated to thecurvature of the physics coupler. An experiment with a 360o loop in the Guidant physicscoupler gave differences in measured (60 s) values up to 9.3%. Differences up to 6% werefound with small changes in catheter shape even when the catheter was lined up straight.These differences probably were caused by the geometry of the phantom. The hole in whichthe source runs was wider than the source diameter. A (maximum) air gap of 0.14 mmbetween source and phantom was therefore possible. The potential difference in absorbeddose was estimated to be 7.5%, based on a 1/r fall-off. The low average standard deviation(SD) of 0.5% in column 2 can be explained by the fixed shape of the physics coupler during aseries of measurements.Measurements on the Novoste sources with the IVB1000 well-type ionization chamber wereperformed with 3 source insertions and averaging over the 4 compass directions (total of 12integrations). Effects of placement of the catheter in the chamber were investigatedseparately, but these were small compared with the effects of rotation of the chamber insert.The diameter of the hole in the phantom is an important factor in the uncertainty of the plasticscintillator and plane-parallel ionization chamber measurements on the SIA.20, because thediameter of this source type has changed during 20 or 25 years of production. The phantomwas large enough for the newer sources, but too small for two of the old sources. For thesesources an increased positioning uncertainty may be expected because centering the sourcehad to be done without the phantom.The plastic scintillator measurements on the ruthenium sources had a remarkable lowstandard deviation compared with those on the concave strontium sources. This differencewas probably due to the more shallow dose fall-off of ruthenium than that of the concavestrontium sources. Sources with a cutout had higher standard deviations (up to 3.5% for aCIA source). This higher standard deviation was due to the source positioning not being asstable as that for symmetrical sources, because the center of gravity was not on the centralaxis of the source. The high value for the positioning uncertainty of the diode measurementswas caused by the fact that all measurements were performed in water. The distance couldnot be determined very precisely due to the use of a depth dial indicator.
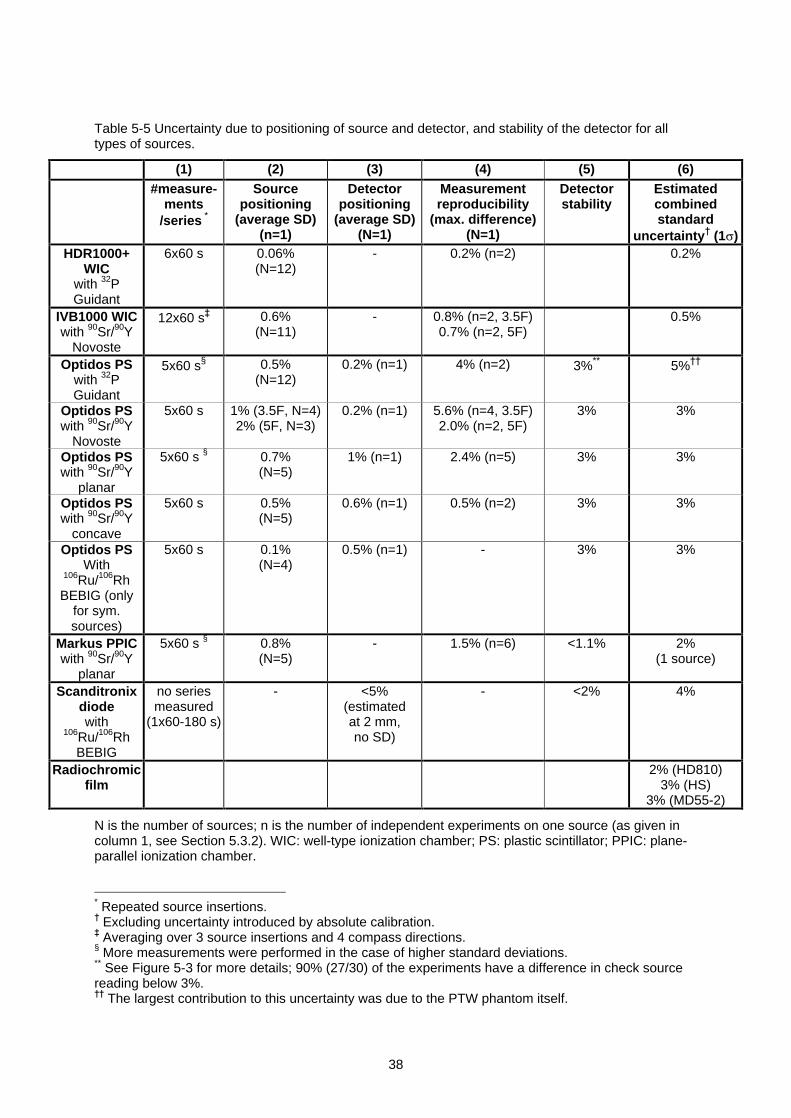
38
Table 5-5 Uncertainty due to positioning of source and detector, and stability of the detector for alltypes of sources.
(1) (2) (3) (4) (5) (6)#measure-
ments/series *
Sourcepositioning
(average SD)(n=1)
Detectorpositioning
(average SD)(N=1)
Measurementreproducibility
(max. difference)(N=1)
Detectorstability
Estimatedcombinedstandard
uncertainty (1 )HDR1000+
WICwith 32PGuidant
6x60 s 0.06%(N=12)
- 0.2% (n=2) 0.2%
IVB1000 WICwith 90Sr/90Y
Novoste
12x60 s 0.6%(N=11)
- 0.8% (n=2, 3.5F)0.7% (n=2, 5F)
0.5%
Optidos PSwith 32PGuidant
5x60 s§ 0.5%(N=12)
0.2% (n=1) 4% (n=2) 3%** 5%
Optidos PSwith 90Sr/90Y
Novoste
5x60 s 1% (3.5F, N=4)2% (5F, N=3)
0.2% (n=1) 5.6% (n=4, 3.5F)2.0% (n=2, 5F)
3% 3%
Optidos PSwith 90Sr/90Y
planar
5x60 s § 0.7%(N=5)
1% (n=1) 2.4% (n=5) 3% 3%
Optidos PSwith 90Sr/90Y
concave
5x60 s 0.5%(N=5)
0.6% (n=1) 0.5% (n=2) 3% 3%
Optidos PSWith
106Ru/106RhBEBIG (only
for sym.sources)
5x60 s 0.1%(N=4)
0.5% (n=1) - 3% 3%
Markus PPICwith 90Sr/90Y
planar
5x60 s § 0.8%(N=5)
- 1.5% (n=6) <1.1% 2%(1 source)
Scanditronixdiodewith
106Ru/106RhBEBIG
no seriesmeasured
(1x60-180 s)
- <5%(estimatedat 2 mm,no SD)
- <2% 4%
Radiochromicfilm
2% (HD810)3% (HS)
3% (MD55-2)
N is the number of sources; n is the number of independent experiments on one source (as given incolumn 1, see Section 5.3.2). WIC: well-type ionization chamber; PS: plastic scintillator; PPIC: plane-parallel ionization chamber.
* Repeated source insertions. Excluding uncertainty introduced by absolute calibration. Averaging over 3 source insertions and 4 compass directions.
§ More measurements were performed in the case of higher standard deviations.** See Figure 5-3 for more details; 90% (27/30) of the experiments have a difference in check sourcereading below 3%.
The largest contribution to this uncertainty was due to the PTW phantom itself.
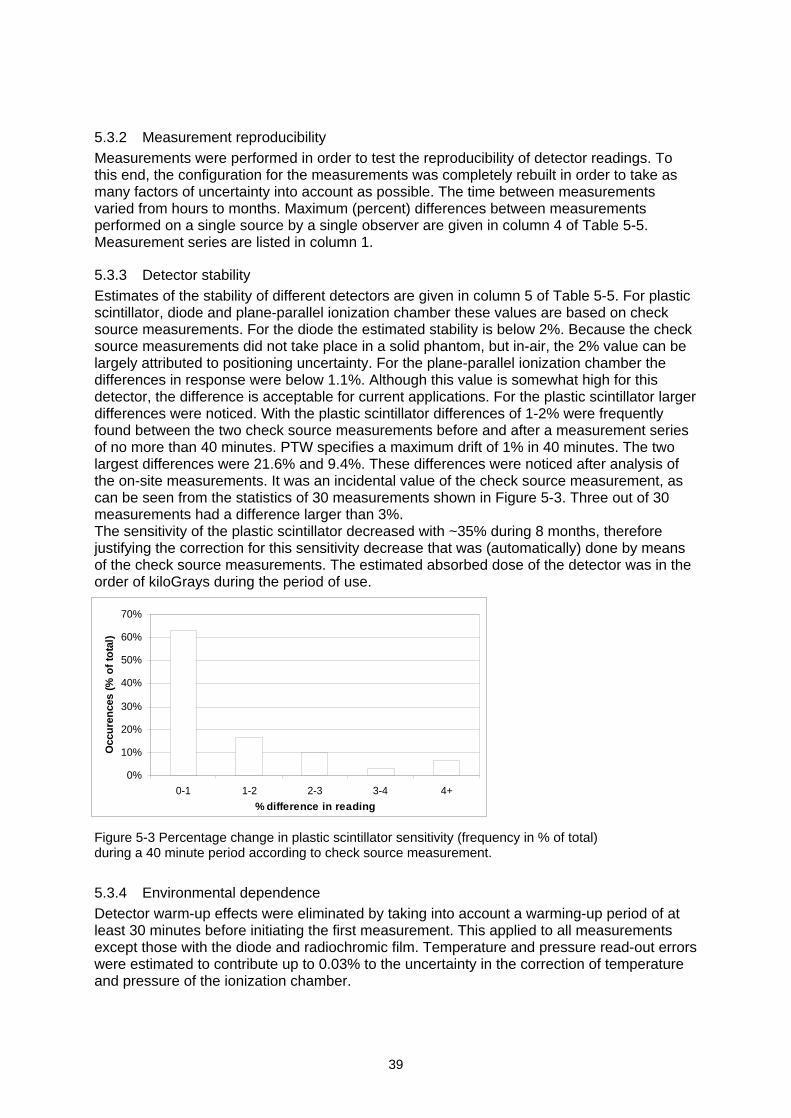
39
5.3.2 Measurement reproducibilityMeasurements were performed in order to test the reproducibility of detector readings. Tothis end, the configuration for the measurements was completely rebuilt in order to take asmany factors of uncertainty into account as possible. The time between measurementsvaried from hours to months. Maximum (percent) differences between measurementsperformed on a single source by a single observer are given in column 4 of Table 5-5.Measurement series are listed in column 1.
5.3.3 Detector stabilityEstimates of the stability of different detectors are given in column 5 of Table 5-5. For plasticscintillator, diode and plane-parallel ionization chamber these values are based on checksource measurements. For the diode the estimated stability is below 2%. Because the checksource measurements did not take place in a solid phantom, but in-air, the 2% value can belargely attributed to positioning uncertainty. For the plane-parallel ionization chamber thedifferences in response were below 1.1%. Although this value is somewhat high for thisdetector, the difference is acceptable for current applications. For the plastic scintillator largerdifferences were noticed. With the plastic scintillator differences of 1-2% were frequentlyfound between the two check source measurements before and after a measurement seriesof no more than 40 minutes. PTW specifies a maximum drift of 1% in 40 minutes. The twolargest differences were 21.6% and 9.4%. These differences were noticed after analysis ofthe on-site measurements. It was an incidental value of the check source measurement, ascan be seen from the statistics of 30 measurements shown in Figure 5-3. Three out of 30measurements had a difference larger than 3%.The sensitivity of the plastic scintillator decreased with ~35% during 8 months, thereforejustifying the correction for this sensitivity decrease that was (automatically) done by meansof the check source measurements. The estimated absorbed dose of the detector was in theorder of kiloGrays during the period of use.
Figure 5-3 Percentage change in plastic scintillator sensitivity (frequency in % of total)during a 40 minute period according to check source measurement.
5.3.4 Environmental dependenceDetector warm-up effects were eliminated by taking into account a warming-up period of atleast 30 minutes before initiating the first measurement. This applied to all measurementsexcept those with the diode and radiochromic film. Temperature and pressure read-out errorswere estimated to contribute up to 0.03% to the uncertainty in the correction of temperatureand pressure of the ionization chamber.
0%
10%
20%
30%
40%
50%
60%
70%
0-1 1-2 2-3 3-4 4+
% difference in reading
Occ
ure
nce
s (%
of
tota
l)
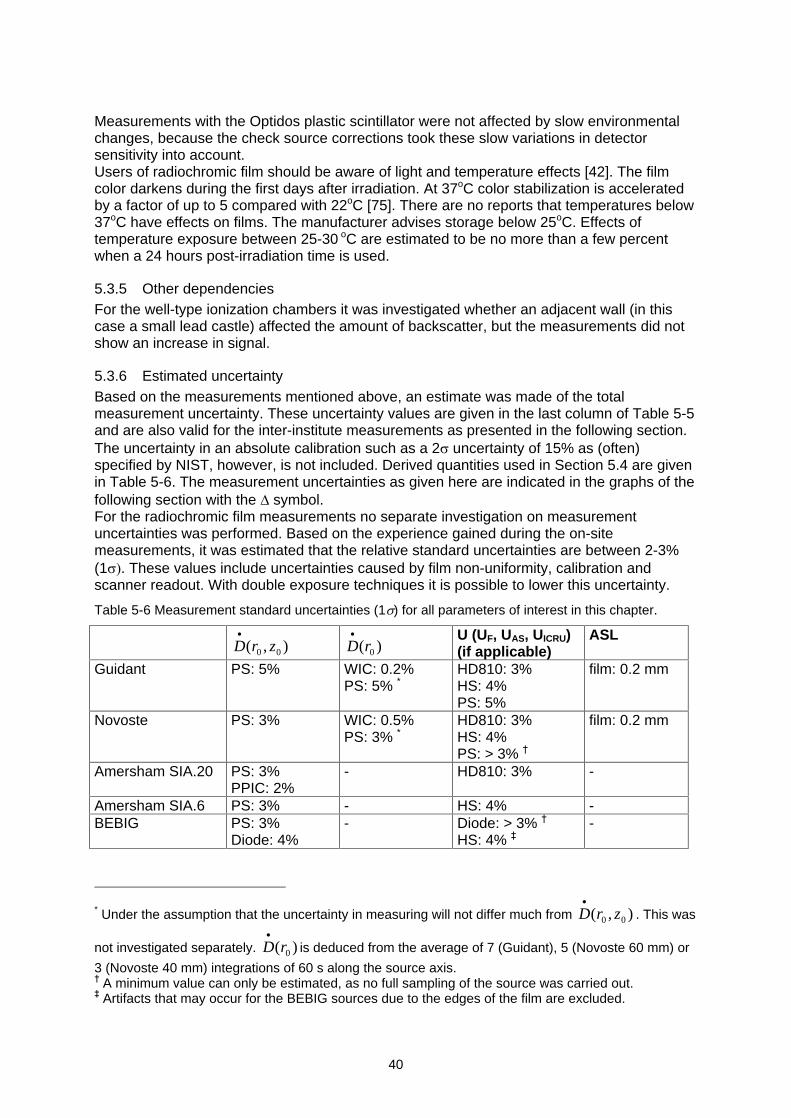
40
Measurements with the Optidos plastic scintillator were not affected by slow environmentalchanges, because the check source corrections took these slow variations in detectorsensitivity into account.Users of radiochromic film should be aware of light and temperature effects [42]. The filmcolor darkens during the first days after irradiation. At 37oC color stabilization is acceleratedby a factor of up to 5 compared with 22oC [75]. There are no reports that temperatures below37oC have effects on films. The manufacturer advises storage below 25oC. Effects oftemperature exposure between 25-30 oC are estimated to be no more than a few percentwhen a 24 hours post-irradiation time is used.
5.3.5 Other dependenciesFor the well-type ionization chambers it was investigated whether an adjacent wall (in thiscase a small lead castle) affected the amount of backscatter, but the measurements did notshow an increase in signal.
5.3.6 Estimated uncertaintyBased on the measurements mentioned above, an estimate was made of the totalmeasurement uncertainty. These uncertainty values are given in the last column of Table 5-5and are also valid for the inter-institute measurements as presented in the following section.The uncertainty in an absolute calibration such as a 2 uncertainty of 15% as (often)specified by NIST, however, is not included. Derived quantities used in Section 5.4 are givenin Table 5-6. The measurement uncertainties as given here are indicated in the graphs of thefollowing section with the symbol.For the radiochromic film measurements no separate investigation on measurementuncertainties was performed. Based on the experience gained during the on-sitemeasurements, it was estimated that the relative standard uncertainties are between 2-3%(1 . These values include uncertainties caused by film non-uniformity, calibration andscanner readout. With double exposure techniques it is possible to lower this uncertainty.
Table 5-6 Measurement standard uncertainties (1 ) for all parameters of interest in this chapter.
),( 00 zrD )( 0rDU (UF, UAS, UICRU)(if applicable)
ASL
Guidant PS: 5% WIC: 0.2%PS: 5% *
HD810: 3%HS: 4%PS: 5%
film: 0.2 mm
Novoste PS: 3% WIC: 0.5%PS: 3% *
HD810: 3%HS: 4%PS: > 3%
film: 0.2 mm
Amersham SIA.20 PS: 3%PPIC: 2%
- HD810: 3% -
Amersham SIA.6 PS: 3% - HS: 4% -BEBIG PS: 3%
Diode: 4%- Diode: > 3%
HS: 4% -
* Under the assumption that the uncertainty in measuring will not differ much from ),( 00 zrD . This was
not investigated separately. )( 0rD is deduced from the average of 7 (Guidant), 5 (Novoste 60 mm) or
3 (Novoste 40 mm) integrations of 60 s along the source axis. A minimum value can only be estimated, as no full sampling of the source was carried out. Artifacts that may occur for the BEBIG sources due to the edges of the film are excluded.
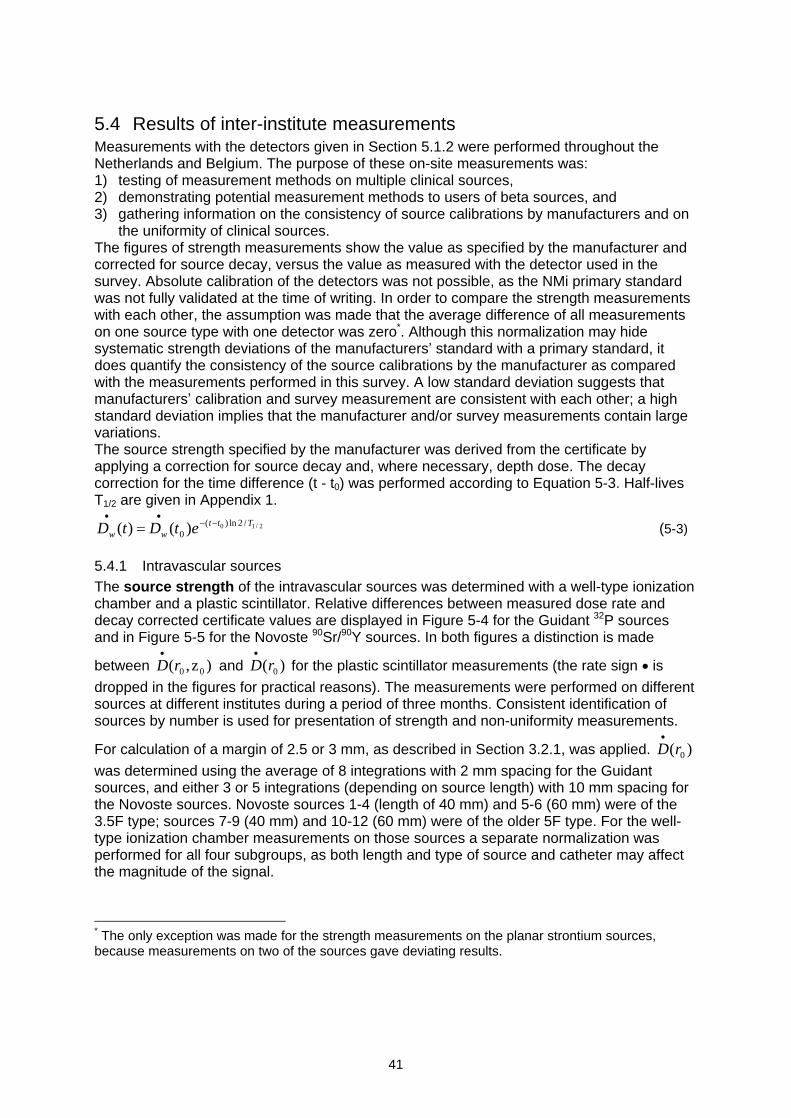
41
5.4 Results of inter-institute measurementsMeasurements with the detectors given in Section 5.1.2 were performed throughout theNetherlands and Belgium. The purpose of these on-site measurements was:1) testing of measurement methods on multiple clinical sources,2) demonstrating potential measurement methods to users of beta sources, and3) gathering information on the consistency of source calibrations by manufacturers and on
the uniformity of clinical sources.The figures of strength measurements show the value as specified by the manufacturer andcorrected for source decay, versus the value as measured with the detector used in thesurvey. Absolute calibration of the detectors was not possible, as the NMi primary standardwas not fully validated at the time of writing. In order to compare the strength measurementswith each other, the assumption was made that the average difference of all measurementson one source type with one detector was zero*. Although this normalization may hidesystematic strength deviations of the manufacturers standard with a primary standard, itdoes quantify the consistency of the source calibrations by the manufacturer as comparedwith the measurements performed in this survey. A low standard deviation suggests thatmanufacturers calibration and survey measurement are consistent with each other; a highstandard deviation implies that the manufacturer and/or survey measurements contain largevariations.The source strength specified by the manufacturer was derived from the certificate byapplying a correction for source decay and, where necessary, depth dose. The decaycorrection for the time difference (t - t0) was performed according to Equation 5-3. Half-livesT1/2 are given in Appendix 1.
2/10 /2ln)(0 )()( Ttt
ww etDtD (5-3)
5.4.1 Intravascular sourcesThe source strength of the intravascular sources was determined with a well-type ionizationchamber and a plastic scintillator. Relative differences between measured dose rate anddecay corrected certificate values are displayed in Figure 5-4 for the Guidant 32P sourcesand in Figure 5-5 for the Novoste 90Sr/90Y sources. In both figures a distinction is made
between )z,( 00rD and )( 0rD for the plastic scintillator measurements (the rate sign is
dropped in the figures for practical reasons). The measurements were performed on differentsources at different institutes during a period of three months. Consistent identification ofsources by number is used for presentation of strength and non-uniformity measurements.
For calculation of a margin of 2.5 or 3 mm, as described in Section 3.2.1, was applied. )( 0rDwas determined using the average of 8 integrations with 2 mm spacing for the Guidantsources, and either 3 or 5 integrations (depending on source length) with 10 mm spacing forthe Novoste sources. Novoste sources 1-4 (length of 40 mm) and 5-6 (60 mm) were of the3.5F type; sources 7-9 (40 mm) and 10-12 (60 mm) were of the older 5F type. For the well-type ionization chamber measurements on those sources a separate normalization wasperformed for all four subgroups, as both length and type of source and catheter may affectthe magnitude of the signal.
* The only exception was made for the strength measurements on the planar strontium sources,because measurements on two of the sources gave deviating results.
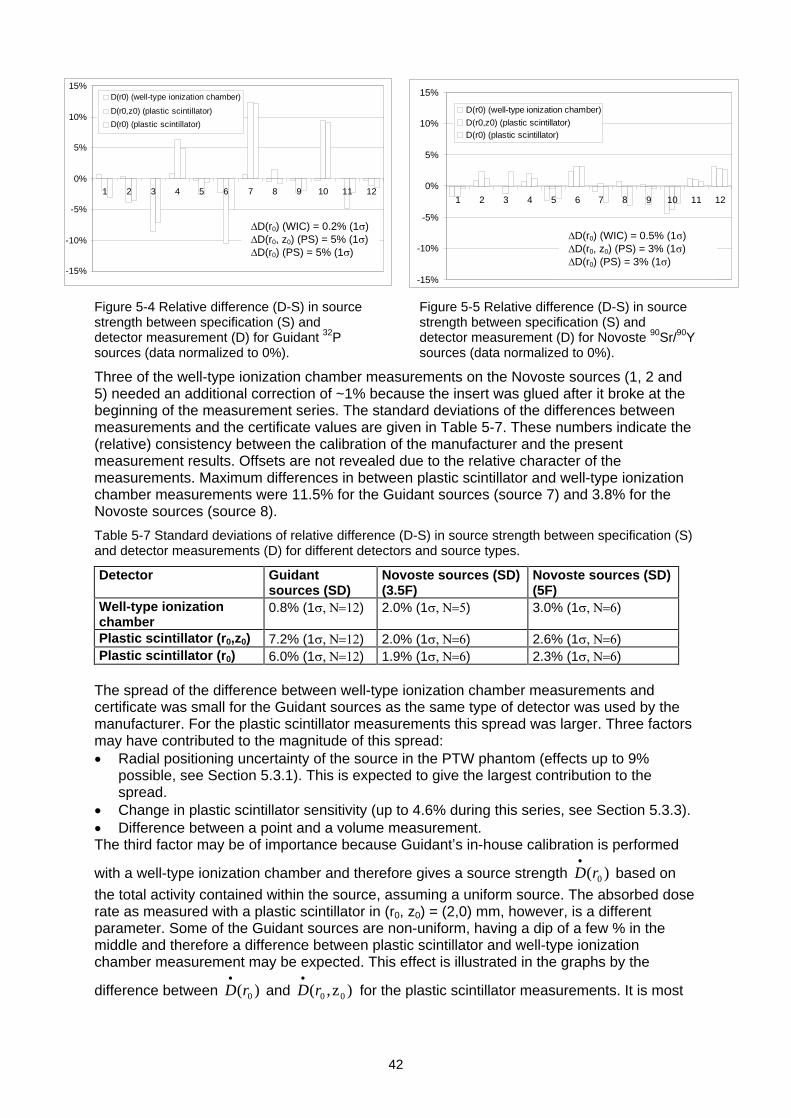
42
Figure 5-4 Relative difference (D-S) in sourcestrength between specification (S) anddetector measurement (D) for Guidant 32Psources (data normalized to 0%).
Figure 5-5 Relative difference (D-S) in sourcestrength between specification (S) anddetector measurement (D) for Novoste 90Sr/90Ysources (data normalized to 0%).
Three of the well-type ionization chamber measurements on the Novoste sources (1, 2 and5) needed an additional correction of ~1% because the insert was glued after it broke at thebeginning of the measurement series. The standard deviations of the differences betweenmeasurements and the certificate values are given in Table 5-7. These numbers indicate the(relative) consistency between the calibration of the manufacturer and the presentmeasurement results. Offsets are not revealed due to the relative character of themeasurements. Maximum differences in between plastic scintillator and well-type ionizationchamber measurements were 11.5% for the Guidant sources (source 7) and 3.8% for theNovoste sources (source 8).
Table 5-7 Standard deviations of relative difference (D-S) in source strength between specification (S)and detector measurements (D) for different detectors and source types.
Detector Guidantsources (SD)
Novoste sources (SD)(3.5F)
Novoste sources (SD)(5F)
Well-type ionizationchamber
0.8% (1 ) 2.0% (1 ) 3.0% (1 )
Plastic scintillator (r0,z0) 7.2% (1 ) 2.0% (1 ) 2.6% (1 )Plastic scintillator (r0) 6.0% (1 ) 1.9% (1 ) 2.3% (1 )
The spread of the difference between well-type ionization chamber measurements andcertificate was small for the Guidant sources as the same type of detector was used by themanufacturer. For the plastic scintillator measurements this spread was larger. Three factorsmay have contributed to the magnitude of this spread:
Radial positioning uncertainty of the source in the PTW phantom (effects up to 9%possible, see Section 5.3.1). This is expected to give the largest contribution to thespread.
Change in plastic scintillator sensitivity (up to 4.6% during this series, see Section 5.3.3).
Difference between a point and a volume measurement.The third factor may be of importance because Guidant s in-house calibration is performed
with a well-type ionization chamber and therefore gives a source strength )( 0rD based on
the total activity contained within the source, assuming a uniform source. The absorbed doserate as measured with a plastic scintillator in (r0, z0) = (2,0) mm, however, is a differentparameter. Some of the Guidant sources are non-uniform, having a dip of a few % in themiddle and therefore a difference between plastic scintillator and well-type ionizationchamber measurement may be expected. This effect is illustrated in the graphs by the
difference between )( 0rD and )z,( 00rD for the plastic scintillator measurements. It is most
-15%
-10%
-5%
0%
5%
10%
15%
1 2 3 4 5 6 7 8 9 10 11 12
D(r0) (well-type ionization chamber)
D(r0,z0) (plastic scintillator)
D(r0) (plastic scintillator)
D(r0) (WIC) = 0.2% (1 )D(r0, z0) (PS) = 5% (1 )D(r0) (PS) = 5% (1 )
-15%
-10%
-5%
0%
5%
10%
15%
1 2 3 4 5 6 7 8 9 10 11 12
D(r0) (well-type ionization chamber)
D(r0,z0) (plastic scintillator)D(r0) (plastic scintillator)
D(r0) (WIC) = 0.5% (1 )D(r0, z0) (PS) = 3% (1 )D(r0) (PS) = 3% (1 )
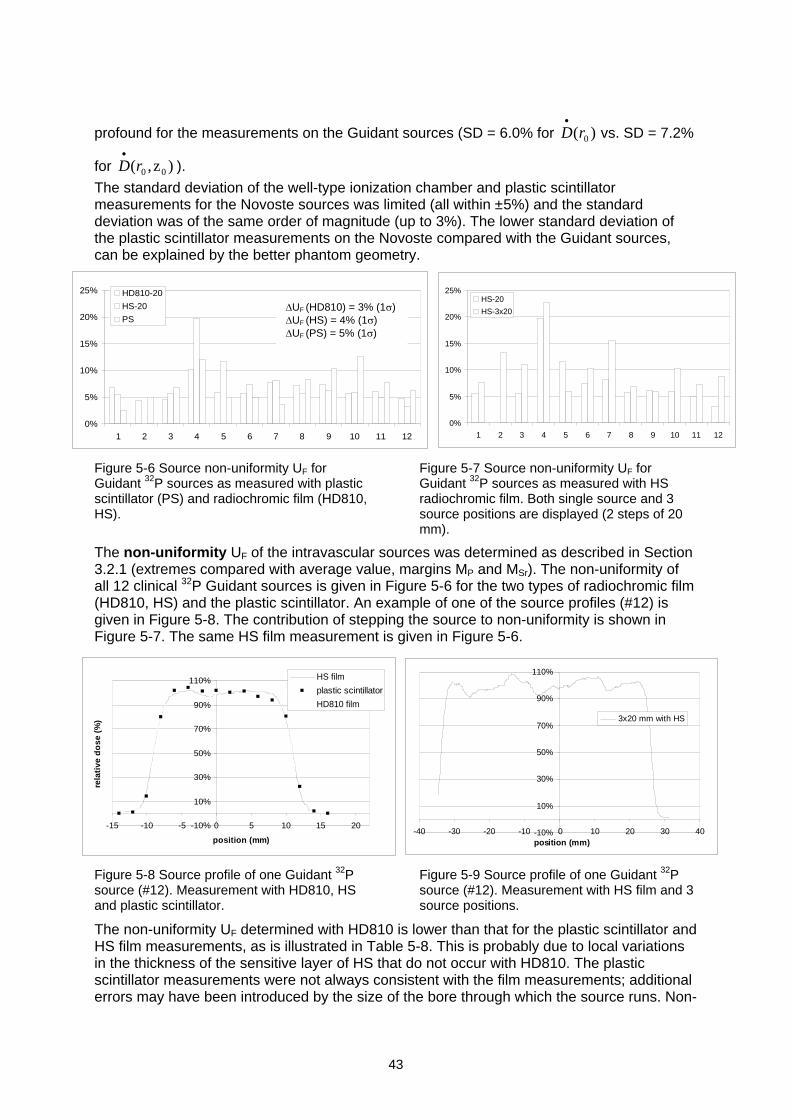
43
profound for the measurements on the Guidant sources (SD = 6.0% for )( 0rD
vs. SD = 7.2%
for )z,( 00rD ).
The standard deviation of the well-type ionization chamber and plastic scintillatormeasurements for the Novoste sources was limited (all within ±5%) and the standarddeviation was of the same order of magnitude (up to 3%). The lower standard deviation ofthe plastic scintillator measurements on the Novoste compared with the Guidant sources,can be explained by the better phantom geometry.
Figure 5-6 Source non-uniformity UF forGuidant 32P sources as measured with plasticscintillator (PS) and radiochromic film (HD810,HS).
Figure 5-7 Source non-uniformity UF forGuidant 32P sources as measured with HSradiochromic film. Both single source and 3source positions are displayed (2 steps of 20mm).
The non-uniformity UF of the intravascular sources was determined as described in Section3.2.1 (extremes compared with average value, margins MP and MSr). The non-uniformity ofall 12 clinical 32P Guidant sources is given in Figure 5-6 for the two types of radiochromic film(HD810, HS) and the plastic scintillator. An example of one of the source profiles (#12) isgiven in Figure 5-8. The contribution of stepping the source to non-uniformity is shown inFigure 5-7. The same HS film measurement is given in Figure 5-6.
Figure 5-8 Source profile of one Guidant 32Psource (#12). Measurement with HD810, HSand plastic scintillator.
Figure 5-9 Source profile of one Guidant 32Psource (#12). Measurement with HS film and 3source positions.
The non-uniformity UF determined with HD810 is lower than that for the plastic scintillator andHS film measurements, as is illustrated in Table 5-8. This is probably due to local variationsin the thickness of the sensitive layer of HS that do not occur with HD810. The plasticscintillator measurements were not always consistent with the film measurements; additionalerrors may have been introduced by the size of the bore through which the source runs. Non-
0%
5%
10%
15%
20%
25%
1 2 3 4 5 6 7 8 9 10 11 12
HD810-20
HS-20
PS
0%
5%
10%
15%
20%
25%
1 2 3 4 5 6 7 8 9 10 11 12
HS-20
HS-3x20UF (HD810) = 3% (1 )UF (HS) = 4% (1 )UF (PS) = 5% (1 )
-10%
10%
30%
50%
70%
90%
110%
-15 -10 -5 0 5 10 15 20
position (mm)
rela
tive
do
se (
%)
HS film
plastic scintillator
HD810 film
-10%
10%
30%
50%
70%
90%
110%
-40 -30 -20 -10 0 10 20 30 40position (mm)
3x20 mm with HS
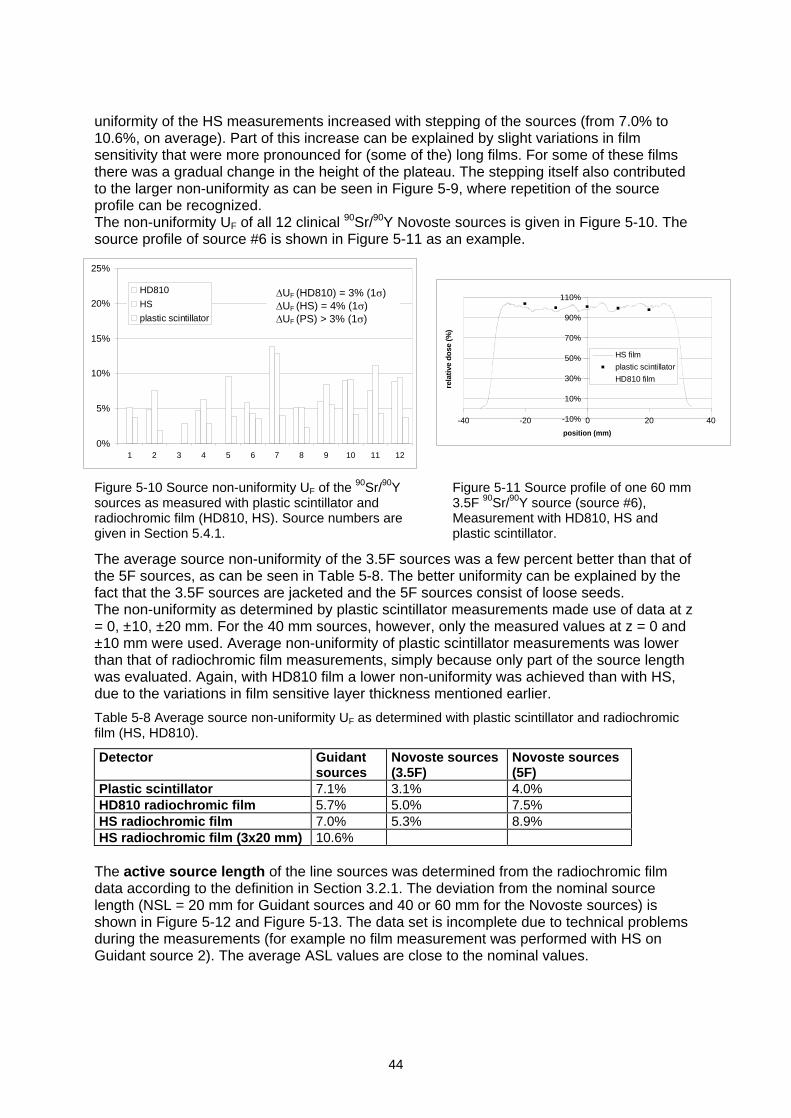
44
uniformity of the HS measurements increased with stepping of the sources (from 7.0% to10.6%, on average). Part of this increase can be explained by slight variations in filmsensitivity that were more pronounced for (some of the) long films. For some of these filmsthere was a gradual change in the height of the plateau. The stepping itself also contributedto the larger non-uniformity as can be seen in Figure 5-9, where repetition of the sourceprofile can be recognized.The non-uniformity UF of all 12 clinical 90Sr/90Y Novoste sources is given in Figure 5-10. Thesource profile of source #6 is shown in Figure 5-11 as an example.
Figure 5-10 Source non-uniformity UF of the 90Sr/90Ysources as measured with plastic scintillator andradiochromic film (HD810, HS). Source numbers aregiven in Section 5.4.1.
Figure 5-11 Source profile of one 60 mm3.5F 90Sr/90Y source (source #6),Measurement with HD810, HS andplastic scintillator.
The average source non-uniformity of the 3.5F sources was a few percent better than that ofthe 5F sources, as can be seen in Table 5-8. The better uniformity can be explained by thefact that the 3.5F sources are jacketed and the 5F sources consist of loose seeds.The non-uniformity as determined by plastic scintillator measurements made use of data at z= 0, ±10, ±20 mm. For the 40 mm sources, however, only the measured values at z = 0 and±10 mm were used. Average non-uniformity of plastic scintillator measurements was lowerthan that of radiochromic film measurements, simply because only part of the source lengthwas evaluated. Again, with HD810 film a lower non-uniformity was achieved than with HS,due to the variations in film sensitive layer thickness mentioned earlier.
Table 5-8 Average source non-uniformity UF as determined with plastic scintillator and radiochromicfilm (HS, HD810).
Detector Guidantsources
Novoste sources(3.5F)
Novoste sources(5F)
Plastic scintillator 7.1% 3.1% 4.0%HD810 radiochromic film 5.7% 5.0% 7.5%HS radiochromic film 7.0% 5.3% 8.9%HS radiochromic film (3x20 mm) 10.6%
The active source length of the line sources was determined from the radiochromic filmdata according to the definition in Section 3.2.1. The deviation from the nominal sourcelength (NSL = 20 mm for Guidant sources and 40 or 60 mm for the Novoste sources) isshown in Figure 5-12 and Figure 5-13. The data set is incomplete due to technical problemsduring the measurements (for example no film measurement was performed with HS onGuidant source 2). The average ASL values are close to the nominal values.
-10%
10%
30%
50%
70%
90%
110%
-40 -20 0 20 40
position (mm)
rela
tive
do
se (%
)
HS film
plastic scintillator
HD810 film
0%
5%
10%
15%
20%
25%
1 2 3 4 5 6 7 8 9 10 11 12
HD810
HS
plastic scintillator
UF (HD810) = 3% (1 )UF (HS) = 4% (1 )UF (PS) > 3% (1 )
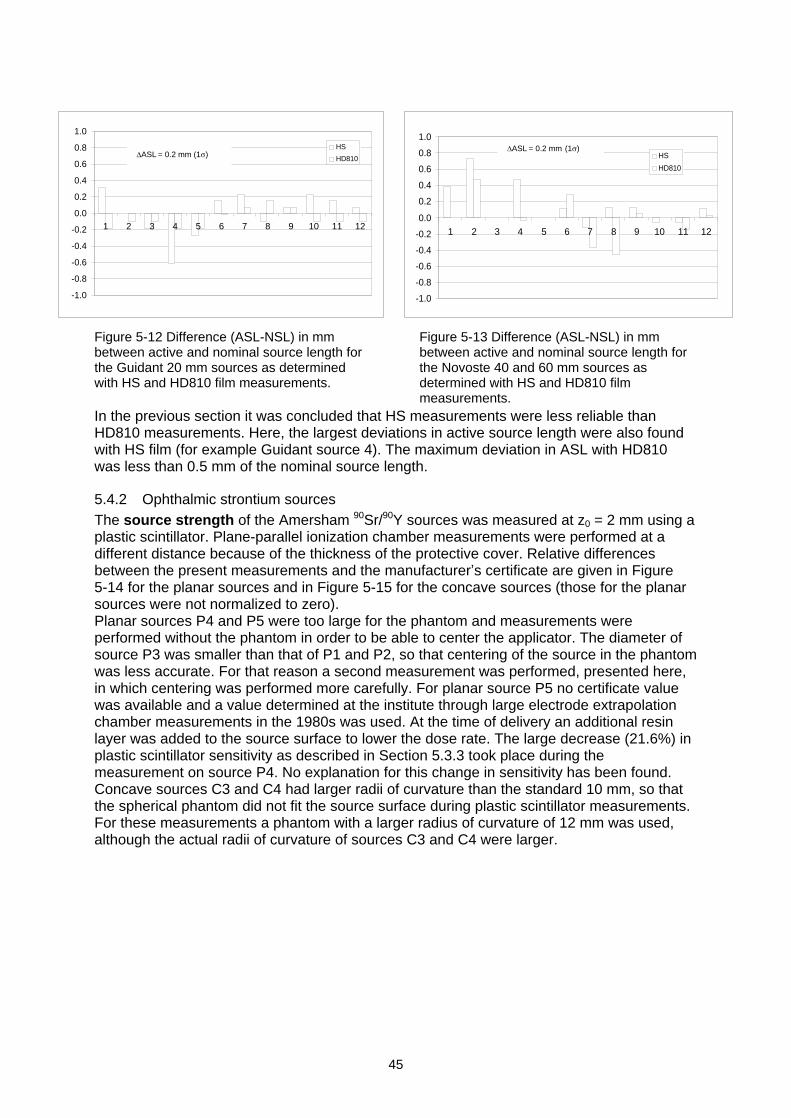
45
Figure 5-12 Difference (ASL-NSL) in mmbetween active and nominal source length forthe Guidant 20 mm sources as determinedwith HS and HD810 film measurements.
Figure 5-13 Difference (ASL-NSL) in mmbetween active and nominal source length forthe Novoste 40 and 60 mm sources asdetermined with HS and HD810 filmmeasurements.
In the previous section it was concluded that HS measurements were less reliable thanHD810 measurements. Here, the largest deviations in active source length were also foundwith HS film (for example Guidant source 4). The maximum deviation in ASL with HD810was less than 0.5 mm of the nominal source length.
5.4.2 Ophthalmic strontium sourcesThe source strength of the Amersham 90Sr/90Y sources was measured at z0 = 2 mm using aplastic scintillator. Plane-parallel ionization chamber measurements were performed at adifferent distance because of the thickness of the protective cover. Relative differencesbetween the present measurements and the manufacturer s certificate are given in Figure5-14 for the planar sources and in Figure 5-15 for the concave sources (those for the planarsources were not normalized to zero).Planar sources P4 and P5 were too large for the phantom and measurements wereperformed without the phantom in order to be able to center the applicator. The diameter ofsource P3 was smaller than that of P1 and P2, so that centering of the source in the phantomwas less accurate. For that reason a second measurement was performed, presented here,in which centering was performed more carefully. For planar source P5 no certificate valuewas available and a value determined at the institute through large electrode extrapolationchamber measurements in the 1980s was used. At the time of delivery an additional resinlayer was added to the source surface to lower the dose rate. The large decrease (21.6%) inplastic scintillator sensitivity as described in Section 5.3.3 took place during themeasurement on source P4. No explanation for this change in sensitivity has been found.Concave sources C3 and C4 had larger radii of curvature than the standard 10 mm, so thatthe spherical phantom did not fit the source surface during plastic scintillator measurements.For these measurements a phantom with a larger radius of curvature of 12 mm was used,although the actual radii of curvature of sources C3 and C4 were larger.
-1.0
-0.8
-0.6
-0.4
-0.2
0.0
0.2
0.4
0.6
0.8
1.0
1 2 3 4 5 6 7 8 9 10 11 12
HS
HD810
ASL = 0.2 mm
(1 )
-1.0
-0.8
-0.6
-0.4
-0.2
0.0
0.2
0.4
0.6
0.8
1.0
1 2 3 4 5 6 7 8 9 10 11 12
HS
HD810ASL = 0.2 mm (1 )
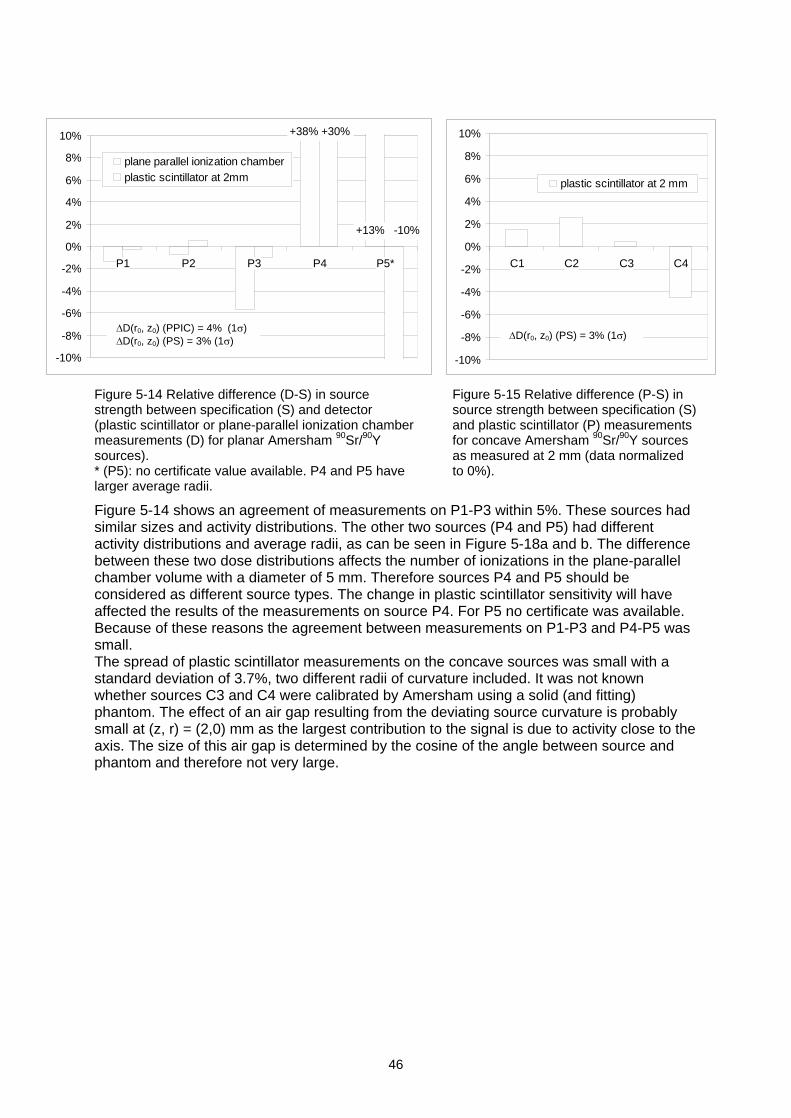
46
Figure 5-14 Relative difference (D-S) in sourcestrength between specification (S) and detector(plastic scintillator or plane-parallel ionization chambermeasurements (D) for planar Amersham 90Sr/90Ysources).* (P5): no certificate value available. P4 and P5 havelarger average radii.
Figure 5-15 Relative difference (P-S) insource strength between specification (S)and plastic scintillator (P) measurementsfor concave Amersham 90Sr/90Y sourcesas measured at 2 mm (data normalizedto 0%).
Figure 5-14 shows an agreement of measurements on P1-P3 within 5%. These sources hadsimilar sizes and activity distributions. The other two sources (P4 and P5) had differentactivity distributions and average radii, as can be seen in Figure 5-18a and b. The differencebetween these two dose distributions affects the number of ionizations in the plane-parallelchamber volume with a diameter of 5 mm. Therefore sources P4 and P5 should beconsidered as different source types. The change in plastic scintillator sensitivity will haveaffected the results of the measurements on source P4. For P5 no certificate was available.Because of these reasons the agreement between measurements on P1-P3 and P4-P5 wassmall.The spread of plastic scintillator measurements on the concave sources was small with astandard deviation of 3.7%, two different radii of curvature included. It was not knownwhether sources C3 and C4 were calibrated by Amersham using a solid (and fitting)phantom. The effect of an air gap resulting from the deviating source curvature is probablysmall at (z, r) = (2,0) mm as the largest contribution to the signal is due to activity close to theaxis. The size of this air gap is determined by the cosine of the angle between source andphantom and therefore not very large.
-10%
-8%
-6%
-4%
-2%
0%
2%
4%
6%
8%
10%
P1 P2 P3 P4 P5*
plane parallel ionization chamberplastic scintillator at 2mm
+38% +30%
+13% -10%
-10%
-8%
-6%
-4%
-2%
0%
2%
4%
6%
8%
10%
C1 C2 C3 C4
plastic scintillator at 2 mm
D(r0, z0) (PPIC) = 4%
(1 )D(r0, z0) (PS) = 3% (1 ) D(r0, z0) (PS) = 3% (1 )
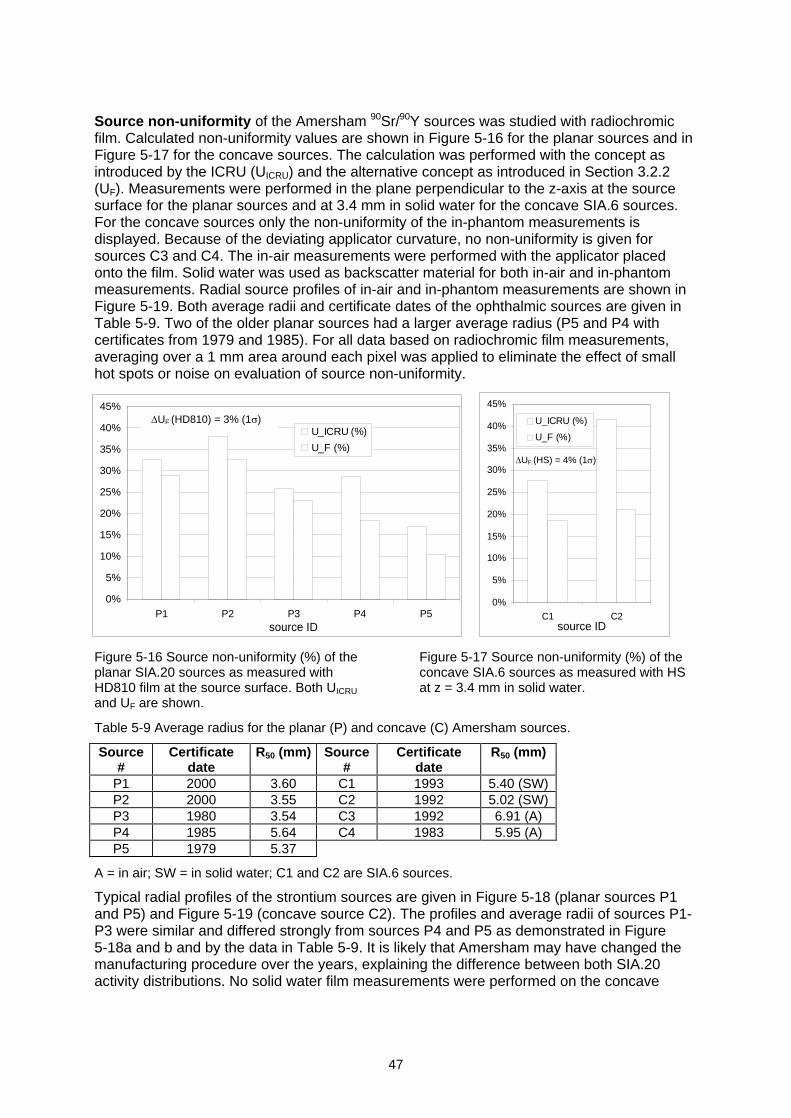
47
Source non-uniformity of the Amersham 90Sr/90Y sources was studied with radiochromicfilm. Calculated non-uniformity values are shown in Figure 5-16 for the planar sources and inFigure 5-17 for the concave sources. The calculation was performed with the concept asintroduced by the ICRU (UICRU) and the alternative concept as introduced in Section 3.2.2(UF). Measurements were performed in the plane perpendicular to the z-axis at the sourcesurface for the planar sources and at 3.4 mm in solid water for the concave SIA.6 sources.For the concave sources only the non-uniformity of the in-phantom measurements isdisplayed. Because of the deviating applicator curvature, no non-uniformity is given forsources C3 and C4. The in-air measurements were performed with the applicator placedonto the film. Solid water was used as backscatter material for both in-air and in-phantommeasurements. Radial source profiles of in-air and in-phantom measurements are shown inFigure 5-19. Both average radii and certificate dates of the ophthalmic sources are given inTable 5-9. Two of the older planar sources had a larger average radius (P5 and P4 withcertificates from 1979 and 1985). For all data based on radiochromic film measurements,averaging over a 1 mm area around each pixel was applied to eliminate the effect of smallhot spots or noise on evaluation of source non-uniformity.
Figure 5-16 Source non-uniformity (%) of theplanar SIA.20 sources as measured withHD810 film at the source surface. Both UICRU
and UF are shown.
Figure 5-17 Source non-uniformity (%) of theconcave SIA.6 sources as measured with HSat z = 3.4 mm in solid water.
Table 5-9 Average radius for the planar (P) and concave (C) Amersham sources.
Source#
Certificatedate
R50 (mm) Source#
Certificatedate
R50 (mm)
P1 2000 3.60 C1 1993 5.40 (SW)P2 2000 3.55 C2 1992 5.02 (SW)P3 1980 3.54 C3 1992 6.91 (A)P4 1985 5.64 C4 1983 5.95 (A)P5 1979 5.37
A = in air; SW = in solid water; C1 and C2 are SIA.6 sources.
Typical radial profiles of the strontium sources are given in Figure 5-18 (planar sources P1and P5) and Figure 5-19 (concave source C2). The profiles and average radii of sources P1-P3 were similar and differed strongly from sources P4 and P5 as demonstrated in Figure5-18a and b and by the data in Table 5-9. It is likely that Amersham may have changed themanufacturing procedure over the years, explaining the difference between both SIA.20activity distributions. No solid water film measurements were performed on the concave
0%
5%
10%
15%
20%
25%
30%
35%
40%
45%
P1 P2 P3 P4 P5source ID
U_ICRU (%)
U_F (%)
0%
5%
10%
15%
20%
25%
30%
35%
40%
45%
C1 C2source ID
U_ICRU (%)
U_F (%)
UF (HD810) = 3% (1 )
UF (HS) = 4% (1 )
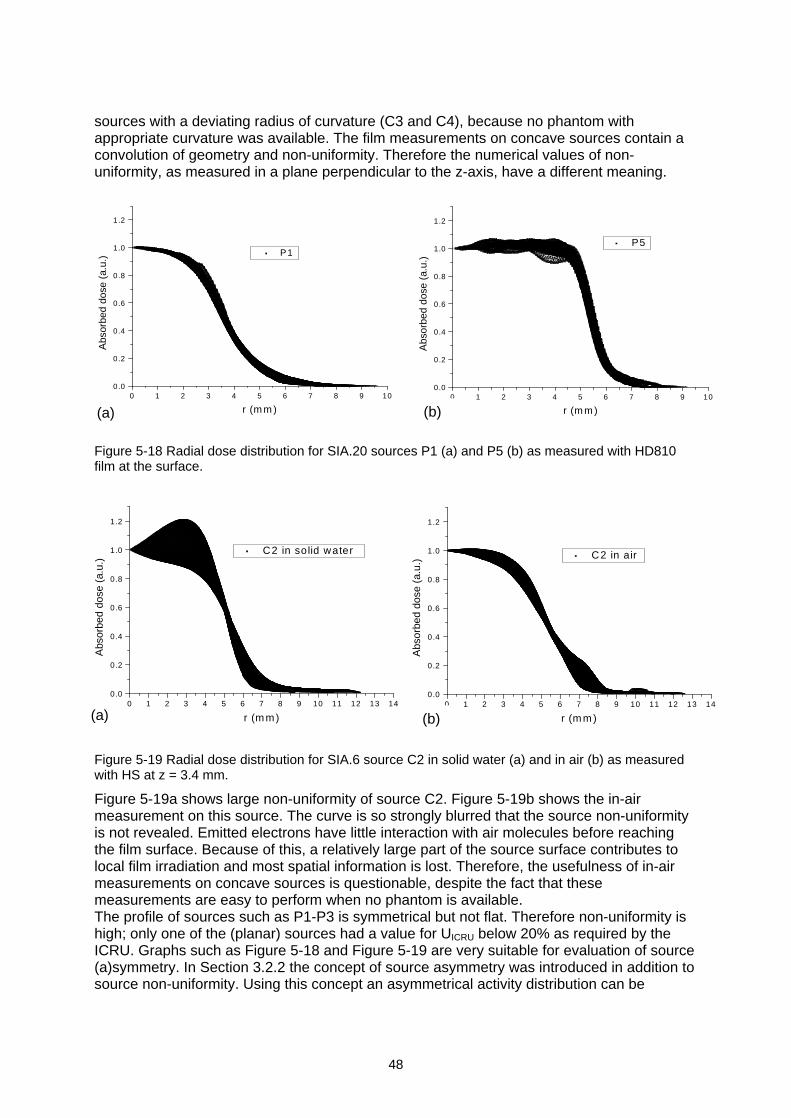
48
sources with a deviating radius of curvature (C3 and C4), because no phantom withappropriate curvature was available. The film measurements on concave sources contain aconvolution of geometry and non-uniformity. Therefore the numerical values of non-uniformity, as measured in a plane perpendicular to the z-axis, have a different meaning.
Figure 5-18 Radial dose distribution for SIA.20 sources P1 (a) and P5 (b) as measured with HD810film at the surface.
Figure 5-19 Radial dose distribution for SIA.6 source C2 in solid water (a) and in air (b) as measuredwith HS at z = 3.4 mm.
Figure 5-19a shows large non-uniformity of source C2. Figure 5-19b shows the in-airmeasurement on this source. The curve is so strongly blurred that the source non-uniformityis not revealed. Emitted electrons have little interaction with air molecules before reachingthe film surface. Because of this, a relatively large part of the source surface contributes tolocal film irradiation and most spatial information is lost. Therefore, the usefulness of in-airmeasurements on concave sources is questionable, despite the fact that thesemeasurements are easy to perform when no phantom is available.The profile of sources such as P1-P3 is symmetrical but not flat. Therefore non-uniformity ishigh; only one of the (planar) sources had a value for UICRU below 20% as required by theICRU. Graphs such as Figure 5-18 and Figure 5-19 are very suitable for evaluation of source(a)symmetry. In Section 3.2.2 the concept of source asymmetry was introduced in addition tosource non-uniformity. Using this concept an asymmetrical activity distribution can be
0 1 2 3 4 5 6 7 8 9 10 11 12 13 140.0
0.2
0.4
0.6
0.8
1.0
1.2
C2 in solid water
Abs
orbe
d do
se (
a.u.
)
r (m m)0 1 2 3 4 5 6 7 8 9 10 11 12 13 14
0.0
0.2
0.4
0.6
0.8
1.0
1.2
C2 in air
Abs
orbe
d do
se (
a.u.
)
r (m m )(a) (b)
0 1 2 3 4 5 6 7 8 9 100.0
0.2
0.4
0.6
0.8
1.0
1.2
P1
Abs
orbe
d do
se (
a.u.
)
r (m m )0 1 2 3 4 5 6 7 8 9 10
0.0
0.2
0.4
0.6
0.8
1.0
1.2
P5
Abs
orbe
d do
se (
a.u.
)r (m m )(a) (b)
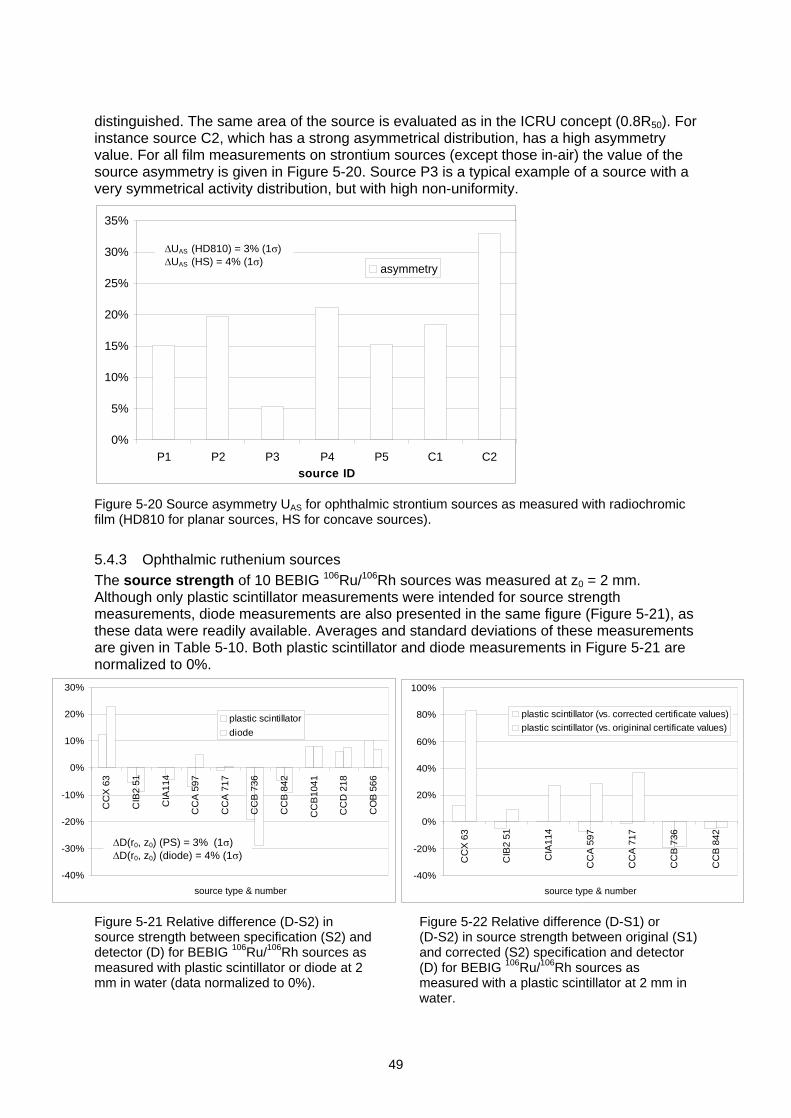
49
distinguished. The same area of the source is evaluated as in the ICRU concept (0.8R50). Forinstance source C2, which has a strong asymmetrical distribution, has a high asymmetryvalue. For all film measurements on strontium sources (except those in-air) the value of thesource asymmetry is given in Figure 5-20. Source P3 is a typical example of a source with avery symmetrical activity distribution, but with high non-uniformity.
Figure 5-20 Source asymmetry UAS for ophthalmic strontium sources as measured with radiochromicfilm (HD810 for planar sources, HS for concave sources).
5.4.3 Ophthalmic ruthenium sourcesThe source strength of 10 BEBIG 106Ru/106Rh sources was measured at z0 = 2 mm.Although only plastic scintillator measurements were intended for source strengthmeasurements, diode measurements are also presented in the same figure (Figure 5-21), asthese data were readily available. Averages and standard deviations of these measurementsare given in Table 5-10. Both plastic scintillator and diode measurements in Figure 5-21 arenormalized to 0%.
Figure 5-21 Relative difference (D-S2) insource strength between specification (S2) anddetector (D) for BEBIG 106Ru/106Rh sources asmeasured with plastic scintillator or diode at 2mm in water (data normalized to 0%).
Figure 5-22 Relative difference (D-S1) or(D-S2) in source strength between original (S1)and corrected (S2) specification and detector(D) for BEBIG 106Ru/106Rh sources asmeasured with a plastic scintillator at 2 mm inwater.
0%
5%
10%
15%
20%
25%
30%
35%
P1 P2 P3 P4 P5 C1 C2source ID
asymmetry
UAS (HD810) = 3% (1 )UAS (HS) = 4% (1 )
-40%
-30%
-20%
-10%
0%
10%
20%
30%
CC
X 6
3
CIB
2 51
CIA
114
CC
A 5
97
CC
A 7
17
CC
B 7
36
CC
B 8
42
CC
B10
41
CC
D 2
18
CO
B 5
66
source type & number
plastic scintillator
diode
-40%
-20%
0%
20%
40%
60%
80%
100%
CC
X 6
3
CIB
2 51
CIA
114
CC
A 5
97
CC
A 7
17
CC
B 7
36
CC
B 8
42
source type & number
plastic scintillator (vs. corrected certificate values)plastic scintillator (vs. origininal certificate values)
D(r0, z0) (PS) = 3%
(1 )D(r0, z0) (diode) = 4% (1 )
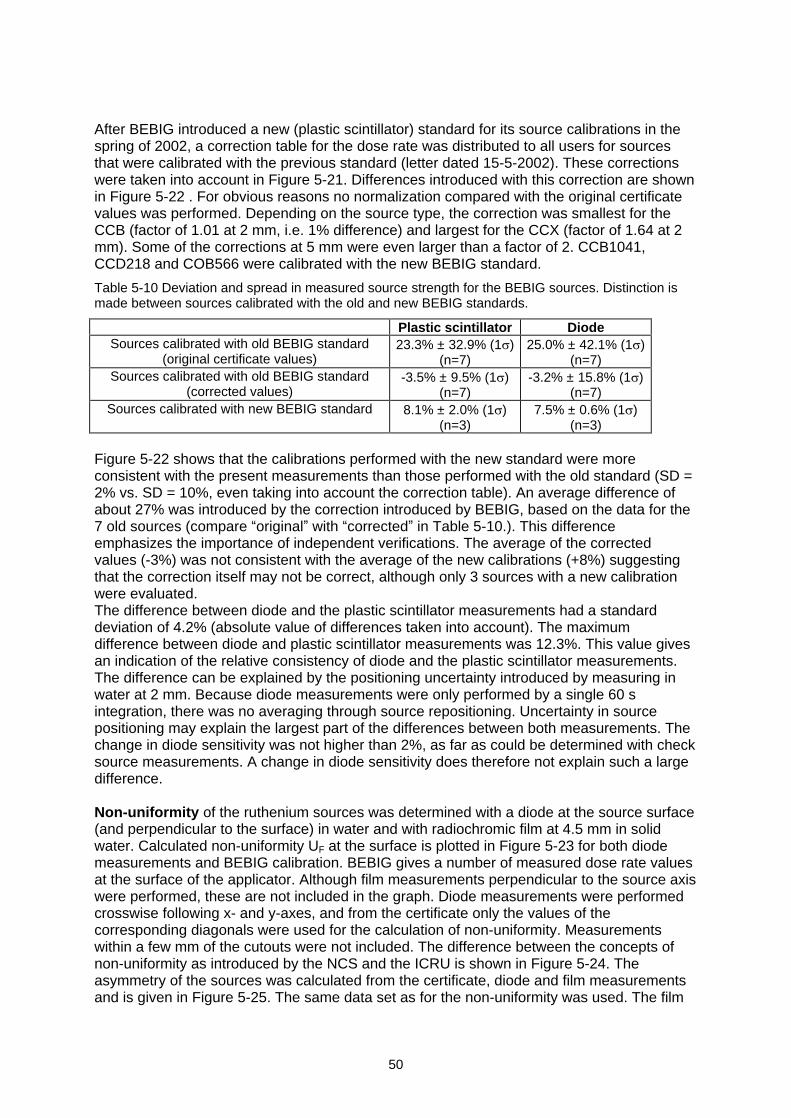
50
After BEBIG introduced a new (plastic scintillator) standard for its source calibrations in thespring of 2002, a correction table for the dose rate was distributed to all users for sourcesthat were calibrated with the previous standard (letter dated 15-5-2002). These correctionswere taken into account in Figure 5-21. Differences introduced with this correction are shownin Figure 5-22 . For obvious reasons no normalization compared with the original certificatevalues was performed. Depending on the source type, the correction was smallest for theCCB (factor of 1.01 at 2 mm, i.e. 1% difference) and largest for the CCX (factor of 1.64 at 2mm). Some of the corrections at 5 mm were even larger than a factor of 2. CCB1041,CCD218 and COB566 were calibrated with the new BEBIG standard.
Table 5-10 Deviation and spread in measured source strength for the BEBIG sources. Distinction ismade between sources calibrated with the old and new BEBIG standards.
Plastic scintillator DiodeSources calibrated with old BEBIG standard
(original certificate values)23.3% ± 32.9% (1 )
(n=7)25.0% ± 42.1% (1 )
(n=7)Sources calibrated with old BEBIG standard
(corrected values)-3.5% ± 9.5% (1 )
(n=7)-3.2% ± 15.8% (1 )
(n=7)Sources calibrated with new BEBIG standard 8.1% ± 2.0% (1 )
(n=3)7.5% ± 0.6% (1 )
(n=3)
Figure 5-22 shows that the calibrations performed with the new standard were moreconsistent with the present measurements than those performed with the old standard (SD =2% vs. SD = 10%, even taking into account the correction table). An average difference ofabout 27% was introduced by the correction introduced by BEBIG, based on the data for the7 old sources (compare original with corrected in Table 5-10.). This differenceemphasizes the importance of independent verifications. The average of the correctedvalues (-3%) was not consistent with the average of the new calibrations (+8%) suggestingthat the correction itself may not be correct, although only 3 sources with a new calibrationwere evaluated.The difference between diode and the plastic scintillator measurements had a standarddeviation of 4.2% (absolute value of differences taken into account). The maximumdifference between diode and plastic scintillator measurements was 12.3%. This value givesan indication of the relative consistency of diode and the plastic scintillator measurements.The difference can be explained by the positioning uncertainty introduced by measuring inwater at 2 mm. Because diode measurements were only performed by a single 60 sintegration, there was no averaging through source repositioning. Uncertainty in sourcepositioning may explain the largest part of the differences between both measurements. Thechange in diode sensitivity was not higher than 2%, as far as could be determined with checksource measurements. A change in diode sensitivity does therefore not explain such a largedifference.
Non-uniformity of the ruthenium sources was determined with a diode at the source surface(and perpendicular to the surface) in water and with radiochromic film at 4.5 mm in solidwater. Calculated non-uniformity UF at the surface is plotted in Figure 5-23 for both diodemeasurements and BEBIG calibration. BEBIG gives a number of measured dose rate valuesat the surface of the applicator. Although film measurements perpendicular to the source axiswere performed, these are not included in the graph. Diode measurements were performedcrosswise following x- and y-axes, and from the certificate only the values of thecorresponding diagonals were used for the calculation of non-uniformity. Measurementswithin a few mm of the cutouts were not included. The difference between the concepts ofnon-uniformity as introduced by the NCS and the ICRU is shown in Figure 5-24. Theasymmetry of the sources was calculated from the certificate, diode and film measurementsand is given in Figure 5-25. The same data set as for the non-uniformity was used. The film
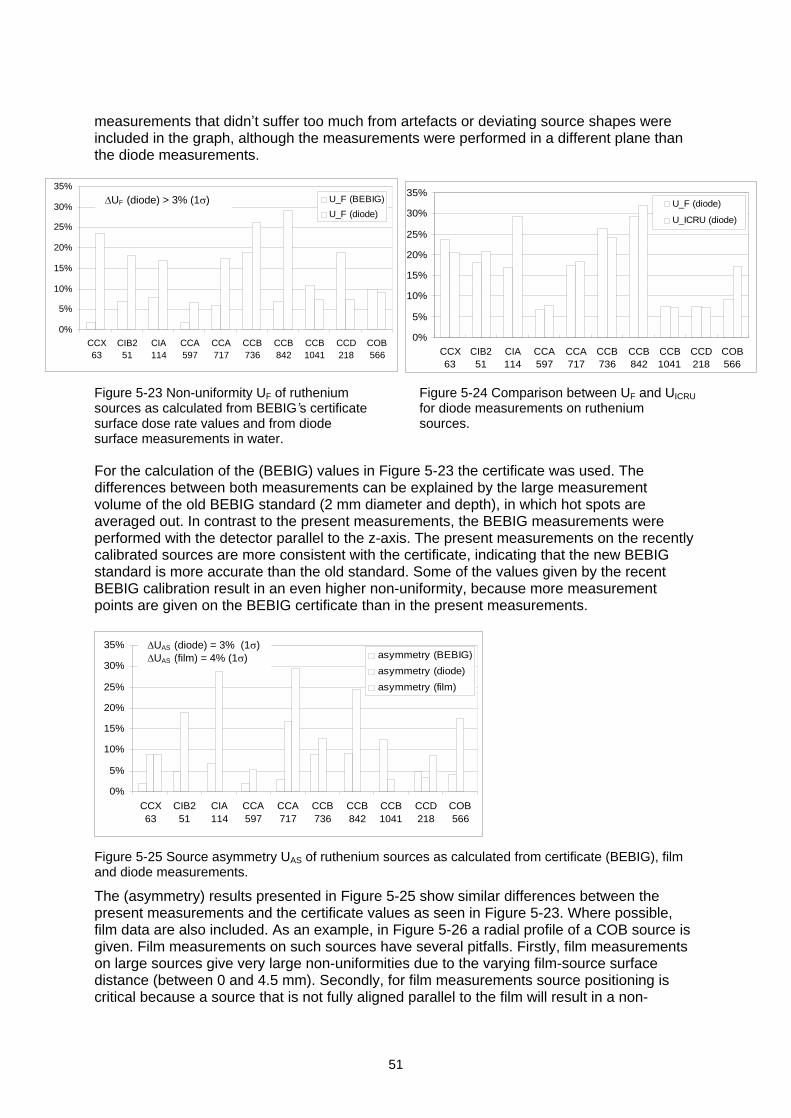
51
measurements that didn t suffer too much from artefacts or deviating source shapes wereincluded in the graph, although the measurements were performed in a different plane thanthe diode measurements.
Figure 5-23 Non-uniformity UF of rutheniumsources as calculated from BEBIG s certificatesurface dose rate values and from diodesurface measurements in water.
Figure 5-24 Comparison between UF and UICRU
for diode measurements on rutheniumsources.
For the calculation of the (BEBIG) values in Figure 5-23 the certificate was used. Thedifferences between both measurements can be explained by the large measurementvolume of the old BEBIG standard (2 mm diameter and depth), in which hot spots areaveraged out. In contrast to the present measurements, the BEBIG measurements wereperformed with the detector parallel to the z-axis. The present measurements on the recentlycalibrated sources are more consistent with the certificate, indicating that the new BEBIGstandard is more accurate than the old standard. Some of the values given by the recentBEBIG calibration result in an even higher non-uniformity, because more measurementpoints are given on the BEBIG certificate than in the present measurements.
Figure 5-25 Source asymmetry UAS of ruthenium sources as calculated from certificate (BEBIG), filmand diode measurements.
The (asymmetry) results presented in Figure 5-25 show similar differences between thepresent measurements and the certificate values as seen in Figure 5-23. Where possible,film data are also included. As an example, in Figure 5-26 a radial profile of a COB source isgiven. Film measurements on such sources have several pitfalls. Firstly, film measurementson large sources give very large non-uniformities due to the varying film-source surfacedistance (between 0 and 4.5 mm). Secondly, for film measurements source positioning iscritical because a source that is not fully aligned parallel to the film will result in a non-
0%
5%
10%
15%
20%
25%
30%
35%
CCX63
CIB251
CIA114
CCA597
CCA717
CCB736
CCB842
CCB1041
CCD218
COB566
U_F (BEBIG)
U_F (diode)
0%
5%
10%
15%
20%
25%
30%
35%
CCX63
CIB251
CIA114
CCA597
CCA717
CCB736
CCB842
CCB1041
CCD218
COB566
U_F (diode)
U_ICRU (diode)
UF (diode) > 3% (1 )
0%
5%
10%
15%
20%
25%
30%
35%
CCX63
CIB251
CIA114
CCA597
CCA717
CCB736
CCB842
CCB1041
CCD218
COB566
asymmetry (BEBIG)
asymmetry (diode)
asymmetry (film)
UAS (diode) = 3% (1 )UAS (film) = 4% (1 )
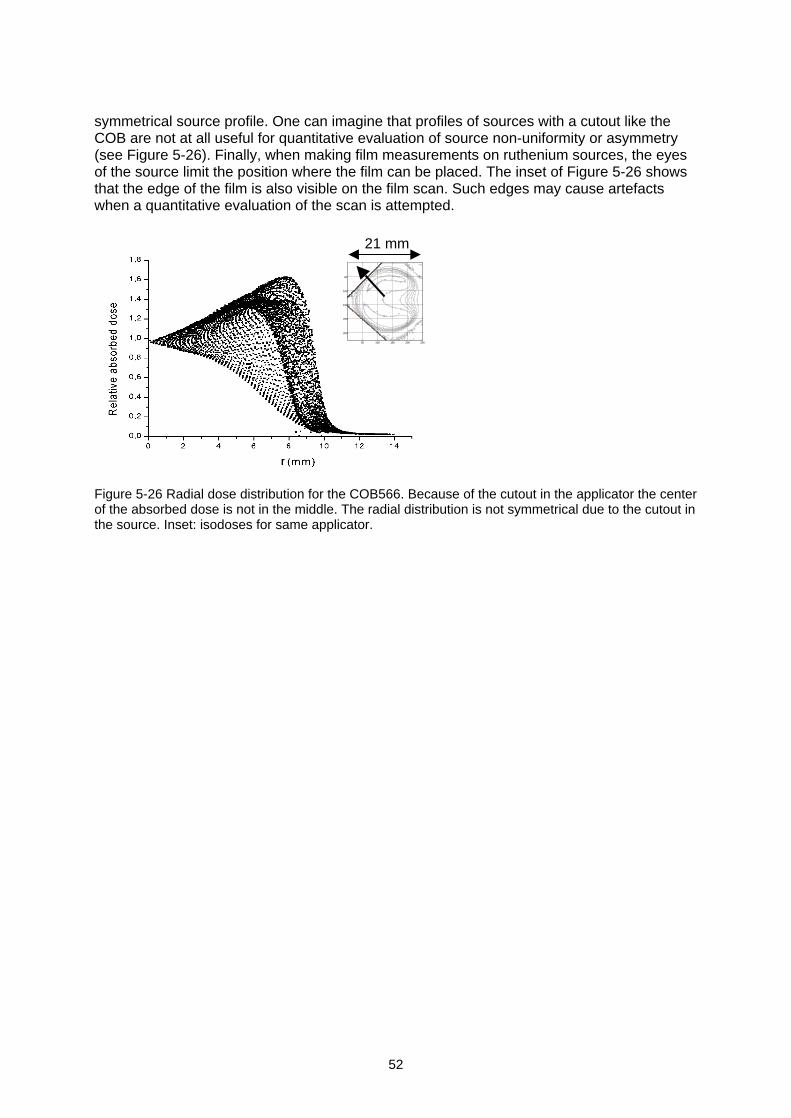
52
symmetrical source profile. One can imagine that profiles of sources with a cutout like theCOB are not at all useful for quantitative evaluation of source non-uniformity or asymmetry(see Figure 5-26). Finally, when making film measurements on ruthenium sources, the eyesof the source limit the position where the film can be placed. The inset of Figure 5-26 showsthat the edge of the film is also visible on the film scan. Such edges may cause artefactswhen a quantitative evaluation of the scan is attempted.
Figure 5-26 Radial dose distribution for the COB566. Because of the cutout in the applicator the centerof the absorbed dose is not in the middle. The radial distribution is not symmetrical due to the cutout inthe source. Inset: isodoses for same applicator.
50 100 150 200 250
50
100
150
200
250
21 mm
53
5.5 Evaluation of tested detectorsThis section provides an evaluation of the detectors that were tested during the on-sitemeasurements. Their suitability for strength or uniformity measurements is discussed. Therecommendations given in Section 6.3 are mainly based on this section.
Well-type ionization chamberBecause the well-type ionization chamber has the highest reproducibility of all detectors inbeta dosimetry, it is very suitable for strength verifications. Although a chamber insert isrequired, the fact that no phantom is needed for measurements is an advantage. Adisadvantage is that these measurements need to be performed in combination with forexample film measurements to determine source uniformity. Due to the required amount ofsignal the chamber insert must be kept thin for beta emitters. The insert of the IVB1000 is notpart of the chamber and is therefore more vulnerable. Currently, clinical catheters are usedfor measurements on the Novoste sources with the IVB1000 chamber. These catheters aremade for single use and therefore are vulnerable, especially the 3.5F catheter. A dedicatedrigid physics catheter would be more suitable for these measurements.One should be aware of the disadvantage of using a pressurized ionization chamber.Although these chambers sometimes are available in a nuclear medicine department, theirstability is not guaranteed due to possible gas leakage. The high response that is needed fornuclear medicine applications is not important, because brachytherapy sources have muchhigher source strength and vented ionization chambers give sufficient signal. For thesereasons the IAEA recommends using a vented chamber [3]. Application of a (T,p)-correctionis necessary.
Plastic scintillatorAdvantages of the plastic scintillator are that it can be used for high and low dose ratesources and for strength, depth dose and uniformity measurements. It also has a highdegree of water equivalence. It is expected that the detector can be used for uniformitymeasurements on ruthenium sources as well, although no experiments for this purpose wereperformed.Few institutes have a plastic scintillator, although it is readily available. Other disadvantagesare mainly related to the detector stability. Measurements showed that the use of a checksource (as PTW recommends) is essential for use of the detector. Two types of variations indetector sensitivity were found: short-term and long-term changes. The slow and long-termdecrease of detector sensitivity can be corrected for by check source measurements. Short-term changes also occur, possibly caused by environmental changes or changes in probeposition. Short-term changes up to 21.6% were observed, although most were below 3%within the 40 minutes time frame. A difference below 2 or 3% is recommended. For morecontrol of short-term changes in detector sensitivity it is also possible to reduce the timebetween two check source measurements.Analysis of the plastic scintillator measurements on the Guidant sources showed a largeuncertainty in the positioning of the phosphorus source in the PTW phantom. Even with smallchanges in the shape of the physics coupler, rather significant changes in detector readingwere apparent (up to 6%). This can be correlated to the diameter of the hole in the phantomas designed by PTW. At the time of writing PTW has acknowledged this problem and thediameter of the hole has been reduced from 0.60±0.02 mm to 0.53±0.02 mm.
Plane-parallel ionization chamberBecause the plane-parallel ionization chamber has low spatial resolution and limitedsensitivity, it is not very suitable for calibrating most beta sources. The detector can be usedfor relative source strength checks on high dose rate ophthalmic strontium sources, as longas the measurement set-up is reproducible. If different planar sources need to be compared,
54
differences in source geometry and activity distribution will strongly affect detector responsedue to the large electrode diameter. The detector is available in most radiotherapydepartments.
DiodeThe low degree of water equivalence can be regarded as a disadvantage of the diode. Thedetector is, however, part of the standard equipment of most radiotherapy departments andhas relatively high spatial resolution. No warm-up time is needed and the detector can alsobe used in water. Although the diode was not primarily selected for source strengthmeasurements, results for ruthenium sources were similar to those obtained with plasticscintillators. The accuracy of positioning the diode can be improved by introducing a solidphantom for measurements on both clinical and check sources. Averaging over multipleintegrating measurements will also contribute to a more accurate result. Under theseconditions use of a diode for measurements on ophthalmic strontium sources andintravascular sources may be considered, but further studies are required.
Radiochromic filmThe most attractive property of radiochromic film is its high spatial resolution. The need forfilm densitometry is a disadvantage that all users are aware of, although non-uniformitieslarger than 10% can be observed with the naked eye. Variations in thickness of the sensitivelayer have been reported for MD55-2. This effect was also noticed for HS film, where itcaused artificially high source non-uniformity. For HD810 this effect was not noticed, norfound in the literature. The effects of variations in thickness of the sensitive layer areminimized when the film is cut in the direction in which the coating is applied [42]. This effectcan be corrected for by the application of the double exposure technique [42]. If HS is used,detachment of the layers may be expected near the edge of the film (up to 1 mm), becauseof the cutting. This phenomenon can be explained from the composition of the film, in whichan adhesive layer, as used for MD55-2, is omitted. In spite of these disadvantages, HS isattractive as a detector for low dose rate sources because of its high sensitivity. Thedisadvantages mentioned and the differences in film sensitivity should determine the choicefor a specific type of film.For quantitative evaluation of the uniformity of intravascular and planar ophthalmic sourcesradiochromic film can be used. In the latter case the user should be aware that the non-uniformity UICRU may exceed the maximum 20% demanded by the ICRU and the IAEA [2,3].Radiochromic film should not be applied for quantitative evaluation of non-uniformity ofconcave sources. For estimating the asymmetry of ophthalmic sources radiochromic film is asuitable detector.Although some institutes have experience with routine source calibrations using HD810 film,within the scope of the present study, use of radiochromic film for absolute measurementswas not investigated. Therefore, presently, using film for this purpose cannot berecommended. Those who still like to use radiochromic film for absolute measurmentsshould be aware that additional film calibrations are necessary and that these measurementsare more time consuming than those with for example a well-type ionization chamber orplastic scintillator. A film phantom should be manufactured with small tolerances, because ofthe steep dose gradient of the sources. Using two parallel plates without a channel for linesource calibrations will not give appropriate results.
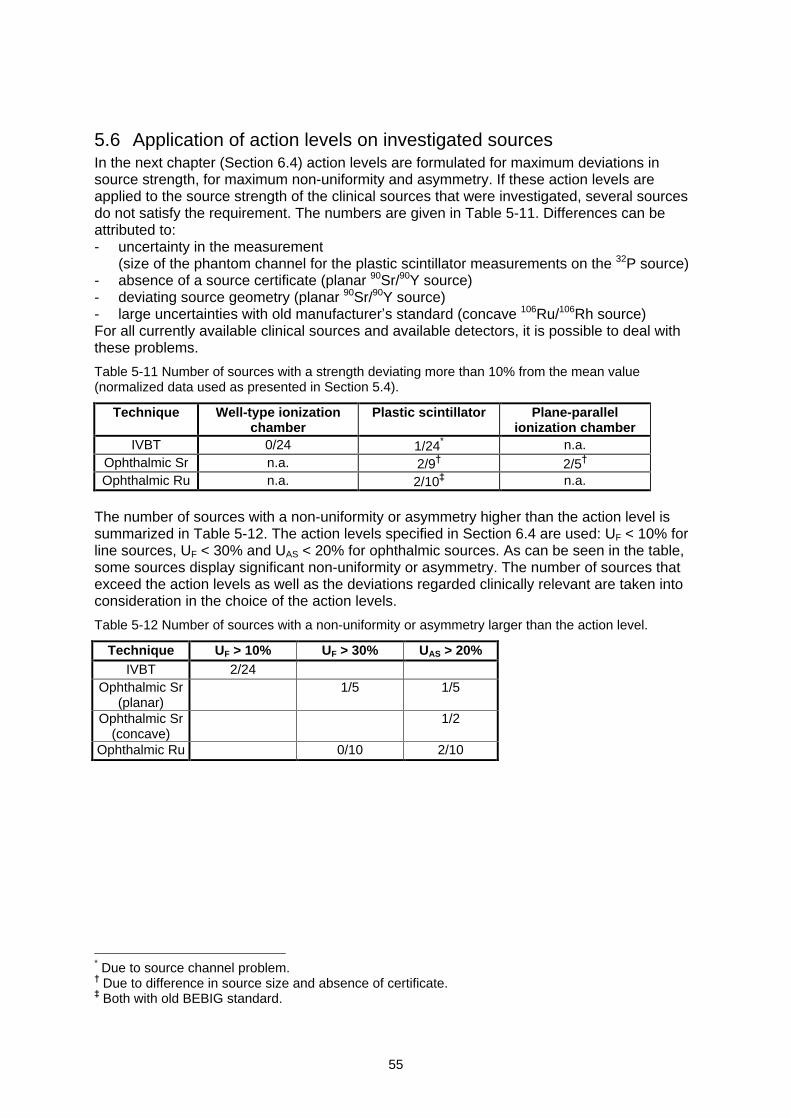
55
5.6 Application of action levels on investigated sourcesIn the next chapter (Section 6.4) action levels are formulated for maximum deviations insource strength, for maximum non-uniformity and asymmetry. If these action levels areapplied to the source strength of the clinical sources that were investigated, several sourcesdo not satisfy the requirement. The numbers are given in Table 5-11. Differences can beattributed to:- uncertainty in the measurement
(size of the phantom channel for the plastic scintillator measurements on the 32P source)- absence of a source certificate (planar 90Sr/90Y source)- deviating source geometry (planar 90Sr/90Y source)- large uncertainties with old manufacturer s standard (concave 106Ru/106Rh source)For all currently available clinical sources and available detectors, it is possible to deal withthese problems.
Table 5-11 Number of sources with a strength deviating more than 10% from the mean value(normalized data used as presented in Section 5.4).
Technique Well-type ionizationchamber
Plastic scintillator Plane-parallelionization chamber
IVBT 0/24 1/24* n.a.Ophthalmic Sr n.a. 2/9 2/5Ophthalmic Ru n.a. 2/10 n.a.
The number of sources with a non-uniformity or asymmetry higher than the action level issummarized in Table 5-12. The action levels specified in Section 6.4 are used: UF < 10% forline sources, UF < 30% and UAS < 20% for ophthalmic sources. As can be seen in the table,some sources display significant non-uniformity or asymmetry. The number of sources thatexceed the action levels as well as the deviations regarded clinically relevant are taken intoconsideration in the choice of the action levels.
Table 5-12 Number of sources with a non-uniformity or asymmetry larger than the action level.
Technique UF > 10% UF > 30% UAS > 20%IVBT 2/24
Ophthalmic Sr(planar)
1/5 1/5
Ophthalmic Sr(concave)
1/2
Ophthalmic Ru 0/10 2/10
* Due to source channel problem. Due to difference in source size and absence of certificate. Both with old BEBIG standard.
56
6 NCS recommendations for quality control of betasources
This chapter contains an overview of procedures for a quality control programme of betasources. In Section 6.1 the scope of dosimetry of beta sources is given. Measurementconcepts and corresponding reference points for source strength determinations areintroduced in Section 6.2, and recommendations on suitable detectors are provided inSection 6.3. In Section 6.4 dosimetric action levels are set. Sections 6.5 and 6.6 presentother physical properties and safety procedures that should be part of a quality controlprogramme, including recommendations on the frequency of such tests.
6.1 Scope of dosimetry of beta sourcesThe NCS recommends determining the following dosimetric parameters:Minimum requirements:- absolute source strength*
- active source length (line sources) or average radius (ophthalmic sources)- source non-uniformity- source asymmetry (ophthalmic sources)Suggested additional measurements:- depth dose in the case of a known change in source designThe parameters are specified in Section 6.2.
6.2 Recommended reference points and source parametersThe r and z axis and the reference points r0 and z0 in this section are defined in thecoordinate system as depicted in the figures of Section 3.1. A more extensive description ofthe parameters of interest is given in Section 3.2.
6.2.1 Intravascular sources
Active Source Length (ASL)The active source length is the distance between the 50% points of the longitudinal dosedistribution at r0 = 2 mm (see Figure 3-2). The 100% level is set by the maximum dose.
Source strength
The source strength )( 0rD of intravascular sources is defined as the average of the absorbed
dose rate to water at r0 = 2 mm along the source axis. The average should be determined inthe ASL, excluding a margin from the 50% points of MP = 2.5 mm for 32P sources and
MSr = 3.0 mm for 90Sr/90Y sources. )( 0rD can, in practice, be determined by:
a) a well-type ionization chamber measurement, orb) a series of measurements in a representative number of points along the source axis.
Source non-uniformityThe source non-uniformity of intravascular sources is expressed as
%100/,max maxmin avgavgavgF DDDDDU (6-1)
* Using a detector calibrated at the national standards institute. If no such absolute calibration can beobtained, the consistency of detector readings and certificates of two or more different sources shouldbe checked (see Chapter 5).
57
in which: UF = source non-uniformity (%)
maxD = maximum (relative) absorbed dose rate within ASL-2M
minD = minimum absorbed dose rate within ASL-2M
avgD = average absorbed dose rate within ASL-2MThe NCS recommends evaluating the source non-uniformity at r0 = 2 mm over the activesource length minus a margin MP = 2.5 mm for 32P sources, or MSr = 3.0 mm for 90Sr/90Y
sources. The average absorbed dose rate avgD is equal to the source strength )( 0rD if it is
determined with a calibrated detector.
6.2.2 Ophthalmic sources
Source strength
The source strength )z,( 00rD of all planar and concave sources should be expressed as an
absorbed dose rate in water at (r0, z0) = (0,2) mm.
Average radius (R50)The average radius (R50) is defined as the mean radius of the 50% isodose contour of a dosedistribution in which 100% is given by the maximum absorbed dose.
Source non-uniformityThe source non-uniformity (flatness) is expressed by:
%100/,max 00max0min rrrF DDDDDU (6-2)
In this formula 0rD is the absorbed dose rate as determined on the z-axis (r = 0). minD and
maxD are determined in an area with a maximum radius of 0.8R50.
Source asymmetryFor evaluation of the asymmetry of ophthalmic sources the quantity UAS is used:
%100)(/)()(max minmax rDrDrDU avgAS (6-3)
To assess UAS, the variation of the dose is determined for all circles with radii r, up tor = 0.8R50. The maximum observed variation determines the value of the asymmetry UAS.The source asymmetry and non-uniformity can usually be determined using the same dataset.
Choice of measurement positionThe average radius, source non-uniformity and asymmetry are defined at a constant distanceof the source surface. It is recommended that these parameters are determined as close tothe surface as possible. For concave sources such a measurement position may beproblematic because in water measurements are not always acceptable. Data from (film)measurements performed in a plane perpendicular to the source axis z can be used toestimate the source asymmetry and non-uniformity. In those measurements, the asymmetryof a source may be underestimated because blurring can occur due to the large distancebetween the source surface and film. Action levels formulated for the source asymmetry
58
according to the definition in this section are expected to hold also for measurements in aplane. On the other hand, the source non-uniformity may well be overestimated due to thevariable distance between source surface and film. A perfectly uniform concave source willgive a non-uniformity larger than zero in a plane. For this reason, no action levels areformulated for the source non-uniformity determined in a plane. Our experience shows thatthe non-uniformity calculated from the film measurements on two concave strontiumapplicators satisfied the action levels presented in Section 6.4. This experience is, however,too limited to support a recommendation.
6.3 NCS recommendations for suitable measurement systemsBased on the evaluation in Section 5.5, the NCS has selected a number of techniques thatcan be used for (1) absolute calibrations and/or (2) determination of the uniformity of betasources. A summary of the recommendations is given in Table 6-1. The terms suitabledetectors and other possible detectors are used to make a distinction between detectorsthat are regarded best for that application and other suitable, but less optimal detectors. Therecommended measurement procedures are given in Appendix 10. Details on possiblephantoms are provided in Section 5.1.3. Drawings of the phantoms are given in theappendices.
The recommendations in this section are meant to indicate those phantoms and detectorsthat are regarded to be suitable for source strength or uniformity measurements. Therecommendations are limited by the set of detectors that were available for the survey.Detectors that were not investigated may also be suitable as long as they satisfy the samecriteria.
6.3.1 Detectors suitable for intravascular brachytherapy sourcesThe NCS recommends performing source strength measurements on intravascularbrachytherapy sources with a plastic scintillator or a (vented) well-type ionization chamber.For uniformity measurements on intravascular sources the use of GafChromic film isrecommended. HD810 film is the best choice for evaluation of source uniformity. However,HD810 is not very practical for measurements on 32P sources because of the long irradiationtimes that need to be introduced manually into the afterloader program. MD55-2 and HSfilms can also be used, but may show variations in the thickness of the sensitive layer. Aplastic scintillator can be used for uniformity measurements, but the spatial resolution of thisdetector is limited. For measurements with the Optidos phantom on Novoste sources, onlymeasurements with a spacing of 10 mm are possible.
6.3.2 Detectors suitable for ophthalmic strontium sourcesOphthalmic strontium sources usually are replaced with an interval of 10 years or more.Therefore the NCS recommends sending these sources to the national standards institute forcalibration before clinical application. Institutes equipped with a calibrated plastic scintillatorcan do their own measurements. Every 3 years it should be verified that the source strengthdecreases in accordance with the natural decay. For this purpose a plane-parallel ionizationchamber or a plastic scintillator can be used.The NCS recommends checking the uniformity of strontium sources with radiochromic film.GafChromic HD810 is the most suitable film for planar strontium sources (for example a doserate of 0.1 Gy s-1 requires half an hour irradiation time for an absorbed dose of 200 Gy). Formeasurements on sources with a lower dose rate, such as the concave strontium sources,MD55-2 or HS can be used. Non-uniformity and asymmetry of the sources can bedetermined quantitatively by densitometry [33]. Diodes and plastic scintillators are notsuitable for uniformity measurements, because it is not desirable to perform thesemeasurements in water. In addition, the size of the active area is small compared with
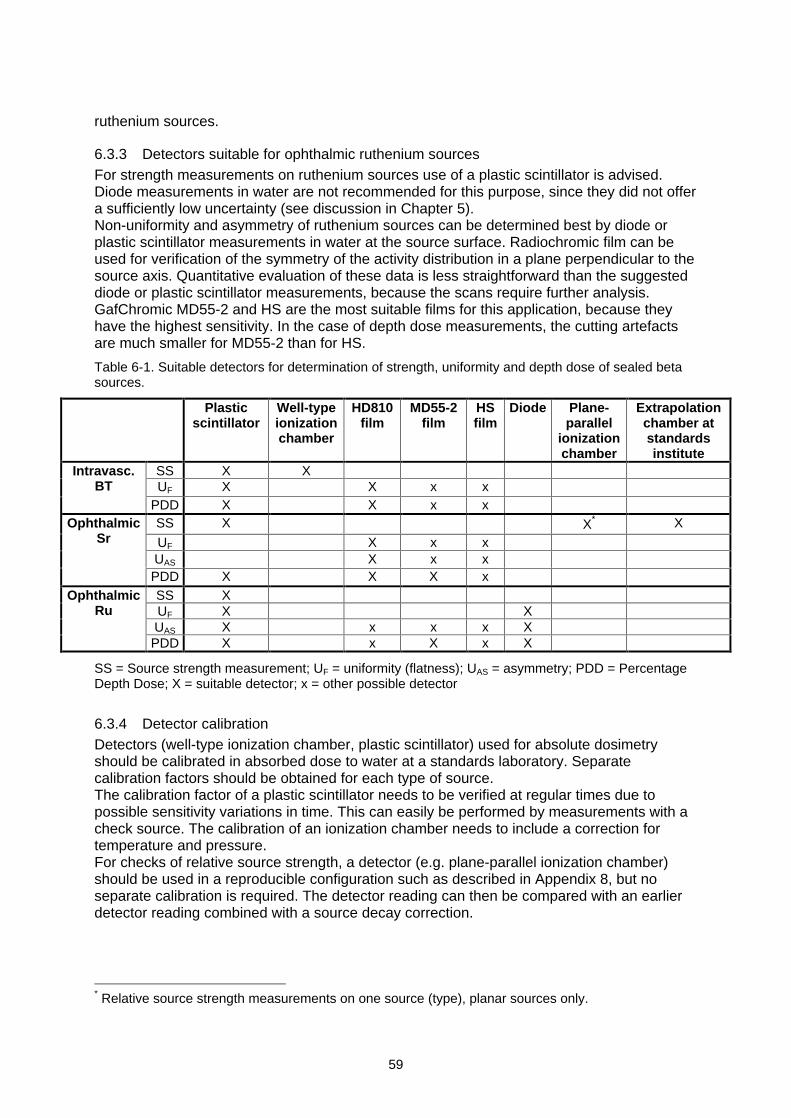
59
ruthenium sources.
6.3.3 Detectors suitable for ophthalmic ruthenium sourcesFor strength measurements on ruthenium sources use of a plastic scintillator is advised.Diode measurements in water are not recommended for this purpose, since they did not offera sufficiently low uncertainty (see discussion in Chapter 5).Non-uniformity and asymmetry of ruthenium sources can be determined best by diode orplastic scintillator measurements in water at the source surface. Radiochromic film can beused for verification of the symmetry of the activity distribution in a plane perpendicular to thesource axis. Quantitative evaluation of these data is less straightforward than the suggesteddiode or plastic scintillator measurements, because the scans require further analysis.GafChromic MD55-2 and HS are the most suitable films for this application, because theyhave the highest sensitivity. In the case of depth dose measurements, the cutting artefactsare much smaller for MD55-2 than for HS.
Table 6-1. Suitable detectors for determination of strength, uniformity and depth dose of sealed betasources.
Plasticscintillator
Well-typeionizationchamber
HD810film
MD55-2film
HSfilm
Diode Plane-parallel
ionizationchamber
Extrapolationchamber atstandardsinstitute
SS X XUF X X x x
Intravasc.BT
PDD X X x xSS X X* X
UF X x xUAS X x x
OphthalmicSr
PDD X X X xSS XUF X XUAS X x x x X
OphthalmicRu
PDD X x X x X
SS = Source strength measurement; UF = uniformity (flatness); UAS = asymmetry; PDD = PercentageDepth Dose; X = suitable detector; x = other possible detector
6.3.4 Detector calibrationDetectors (well-type ionization chamber, plastic scintillator) used for absolute dosimetryshould be calibrated in absorbed dose to water at a standards laboratory. Separatecalibration factors should be obtained for each type of source.The calibration factor of a plastic scintillator needs to be verified at regular times due topossible sensitivity variations in time. This can easily be performed by measurements with acheck source. The calibration of an ionization chamber needs to include a correction fortemperature and pressure.For checks of relative source strength, a detector (e.g. plane-parallel ionization chamber)should be used in a reproducible configuration such as described in Appendix 8, but noseparate calibration is required. The detector reading can then be compared with an earlierdetector reading combined with a source decay correction.
* Relative source strength measurements on one source (type), planar sources only.
60
6.3.5 Importance of phantom tolerancesPart of the total measurement system is the phantom that is used. Tolerances well below 0.1mm should be used in manufacturing these phantoms. The dimensions of a phantom shouldbe verified to gain insight in the measurement uncertainties that are introduced by this part ofthe total measurement system.
6.3.6 Recommendations for film densitometryWhen radiochromic film is used for relative measurements, each batch should be calibratedin-house to establish the relation between optical density (as determined through thedensitometer) and the absorbed dose. Each batch of film and every scanner should beconsidered independently. The use of a transmission scanner with a color depth of morethan 8 bits/color is recommended, because the 256 levels of an 3x8 bits RGB (Red-Green-Blue) color coded file give (discrete) steps in the order of 2% due to the logarithm that isused for the calculation of the absorbed dose.
6.3.7 Measurement uncertaintiesGiven the recommended detectors, setup and procedures we estimate that a combinedstandard uncertainty of 4% (1 ) can at least be achieved for the (relative) source strength,non-uniformity and asymmetry. The total measurement system should be tested in terms ofe.g. reproducibility and mechanical tolerances to assure that the total combined standarduncertainty of the system is below this value of 4%. Under these conditions action levels canbe set and maintained as described in the following section.
6.4 NCS recommended action levelsIn this section recommendations are given for the maximum deviations in source strength,maximum non-uniformity and maximum asymmetry.
6.4.1 Overview of literatureFew published recommendations are available regarding the maximum difference betweenspecified and measured source strength for beta sources. The ICRU report on beta raysand low-energy photons [2] is the only report in which a maximum deviation is mentionedexplicitly, though carefully worded. The action level is 15%. The EVA GEC ESTRO group[8] gives a suggested tolerance level in source strength reproducibility of 5% for beta linesources. The corresponding action is not specified.
The only recommendation regarding deviations in active source length is given by the EVAGEC ESTRO group. A maximum deviation in of 1 mm is recommended.
For verification of source uniformity more recommendations are available. Mostrecommendations originate from the AAPM TG 60 report [4] that covers line sources forintravascular brachytherapy. In this report a uniformity better than 10% is recommendedover two-thirds of the source length. The DGMP [5] subscribes this recommendation in itsreport 16. The EVA GEC ESTRO suggests to use a wider margin of 20% to includemeasurement uncertainties. The ICRU [2] and IAEA [3] have adapted the AAPMrecommendations for line sources. They use a somewhat different concept that expressesthe difference between maximum and minimum dose, as we described earlier in Section 3.2.For both line and ophthalmic sources the ICRU and IAEA recommend a maximum sourcenon-uniformity UICRU = 20%.
6.4.2 NCS recommendations for action levelsThis section provides recommendations on maximum deviations in source strength as well

61
as recommendations on maximum non-uniformity and asymmetry for both intravascular andophthalmic sources. A summary of the NCS recommendations, concerning action levels, isgiven in Table 6-2. The underlying concepts are summarized in Section 6.2.
Several factors were taken into account in the choice of action levels.1. the width of the therapeutic window (see Section 3.5)2. uncertainties in detectors and measurement procedures3. manufacturing tolerances that are considered to be achievable
If an action level is exceeded, the measurement should be repeated, in order to minimize thepossibility that either detector or setup are responsible for the deviation rather than thecalibration of the manufacturer. The NCS recommends that sources with a non-uniformity orasymmetry above the action level are not used for clinical application. The recommendedactions in the case of source strength deviations are specified in the following sections anddiffer per source type.
Action levels applied on source strengthThe action level for source strength presented in this chapter can be used twofold. Firstly, if adetector is calibrated at a primary standards institute, the action level can be directly applied.Both detector and source calibrations need to have the same traceability. The action leveldoes not take into account differences between primary standards and does also not takeinto account the uncertainty in absolute absorbed dose such as the 15% (2 ) specified byNIST.The second situation exists if no absolute detector calibration is available. Then a relativesource strength comparison needs to be done. The reference level used for comparison canbe the measured source strength of previous sources (averaged). A strength comparisonwith the source of another institute can be done if no previous sources are available. In thesurvey presented in Chapter 5 the largest differences were found for the source strength of
the Guidant sources and the BEBIG sources. For example, comparison of ),( 00 zrD for
Guidant source 4 (+6%) and source 3 (-9%) would lead to rejection of source 3, if source 4was the first source measured. If the 0% level would be the reference level, then source 3would be accepted. The spread in the relative source strength difference for the Guidant andBEBIG sources should be lower for the current sources, due to a better phantom (Guidant)and a new standard (BEBIG). A 10% tolerance should be able to cope with this spread.Therefore, the NCS recommends to apply the action level of 10% for source strength onboth absolute measurements with calibrated detectors and on relative strength comparisons.
Action levels for intravascular brachytherapy sources
The source strength )( 0rD of intravascular brachytherapy sources should be within 10%
of the value specified by the manufacturer, corrected for source decay. In the case of higherand reproducible deviations, the manufacturer should be contacted in order to resolve thecause of the discrepancy. It is advisable to ask the manufacturer for a review of the sourcecalibration. If deviations larger than 5% are found with a well-type ionization chamber, theuser should be alerted that something in the calibration chain or in his own measurementsmay have gone wrong.The non-uniformity UF should be less than 10%. A maximum deviation in active sourcelength of 1 mm is tolerated, also for the total active source length of stepping sources. Ifduring a visual check of deviations in step size are observed larger than 1 mm, the sourceshould also be sent back (this is in accordance with Guidant s QC guidelines).Regarding the percentage depth dose no demands are made. Under normal circumstancesno changes need to be expected in these properties. However, it is in the interest of the

62
customer to know and, if possible, to verify the depth dose characteristics of a source in thecase of changing circumstances. An example may be a change in the source design or themanufacturing process.
Action levels for ophthalmic strontium sourcesUsers of ophthalmic strontium applicators are recommended to have their sourceindependently calibrated at a standards laboratory. If a calibrated plastic scintillator is
available, it can be used as well. The measured source strength ),( 00 zrD should be within
10% of the value specified by the manufacturer, corrected for source decay. In the case oflarger and reproducible deviations, the institute s own calibration should be used and themanufacturer should be notified of the deviation. Note that, since the early nineties, there hasbeen a known inconsistency of about 21% between calibrations by Amersham and NIST[70].The non-uniformity UF of ophthalmic strontium sources should be below 30%. (UF
determined with film for a concave source gives an overestimation of the true non-uniformity,therefore no action levels are presented for this case, although our experience with twoconcave sources suggests that the same levels for UF can be used as for planar sources).The source asymmetry UAS should be below 20%.Regarding the percentage depth dose no demands are made. Under normal circumstancesno changes in these properties are expected. However, it is in the interest of the customer toknow and, if possible, verify the depth dose characteristics of a source in case of changingcircumstances. An example may be a change in the source design or the manufacturingprocess.
Action levels for ophthalmic ruthenium sources
The source strength ),( 00 zrD
of ruthenium sources should be within 10% of the value
specified by the manufacturer, corrected for source decay. In the case of higher andreproducible deviations, the manufacturer should be contacted in order to resolve the causeof the discrepancy. It is advisable to ask the manufacturer for a review of the sourcecalibration.The non-uniformity UF of the ruthenium sources should be below 30% and the sourceasymmetry UAS should be below 20%.There may be reasons to deviate from the recommended values of non-uniformity andasymmetry, for example for asymmetrical sources with a higher dose rate close to the cutout.One may also argue that a high dose rate close to the edge of the source is desirable toobtain better depth dose characteristics. It is, however, important to keep in mind that toolarge differences in surface dose rates may cause other side-effects.Regarding the percentage depth dose no demands are made. Under normal circumstancesno changes in these properties are expected. However, it is in the interest of the user toknow and, if possible, verify the depth dose characteristics of a source in case of for examplea change in source design or manufacturing process.
Table 6-2 NCS recommendations on maximum deviations in source strength, maximum source non-uniformity and asymmetry.
Technique Maximum deviationin source strength
Maximum sourcenon-uniformity UF
Maximum sourceasymmetry UAS
IVBT 10% 10% n.a.Ophthalmic 10% 30% 20%
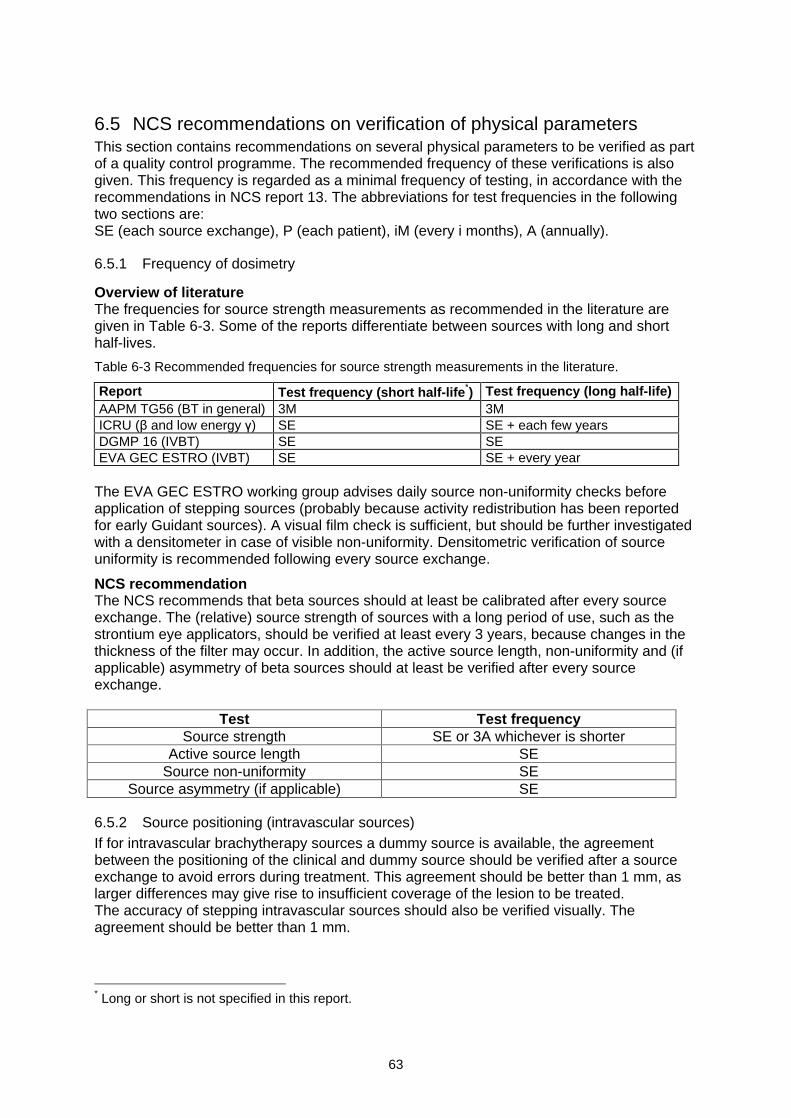
63
6.5 NCS recommendations on verification of physical parametersThis section contains recommendations on several physical parameters to be verified as partof a quality control programme. The recommended frequency of these verifications is alsogiven. This frequency is regarded as a minimal frequency of testing, in accordance with therecommendations in NCS report 13. The abbreviations for test frequencies in the followingtwo sections are:SE (each source exchange), P (each patient), iM (every i months), A (annually).
6.5.1 Frequency of dosimetry
Overview of literatureThe frequencies for source strength measurements as recommended in the literature aregiven in Table 6-3. Some of the reports differentiate between sources with long and shorthalf-lives.
Table 6-3 Recommended frequencies for source strength measurements in the literature.
Report Test frequency (short half-life*) Test frequency (long half-life)AAPM TG56 (BT in general) 3M 3MICRU ( and low energy ) SE SE + each few yearsDGMP 16 (IVBT) SE SEEVA GEC ESTRO (IVBT) SE SE + every year
The EVA GEC ESTRO working group advises daily source non-uniformity checks beforeapplication of stepping sources (probably because activity redistribution has been reportedfor early Guidant sources). A visual film check is sufficient, but should be further investigatedwith a densitometer in case of visible non-uniformity. Densitometric verification of sourceuniformity is recommended following every source exchange.
NCS recommendationThe NCS recommends that beta sources should at least be calibrated after every sourceexchange. The (relative) source strength of sources with a long period of use, such as thestrontium eye applicators, should be verified at least every 3 years, because changes in thethickness of the filter may occur. In addition, the active source length, non-uniformity and (ifapplicable) asymmetry of beta sources should at least be verified after every sourceexchange.
Test Test frequencySource strength SE or 3A whichever is shorter
Active source length SESource non-uniformity SE
Source asymmetry (if applicable) SE
6.5.2 Source positioning (intravascular sources)If for intravascular brachytherapy sources a dummy source is available, the agreementbetween the positioning of the clinical and dummy source should be verified after a sourceexchange to avoid errors during treatment. This agreement should be better than 1 mm, aslarger differences may give rise to insufficient coverage of the lesion to be treated.The accuracy of stepping intravascular sources should also be verified visually. Theagreement should be better than 1 mm.
* Long or short is not specified in this report.
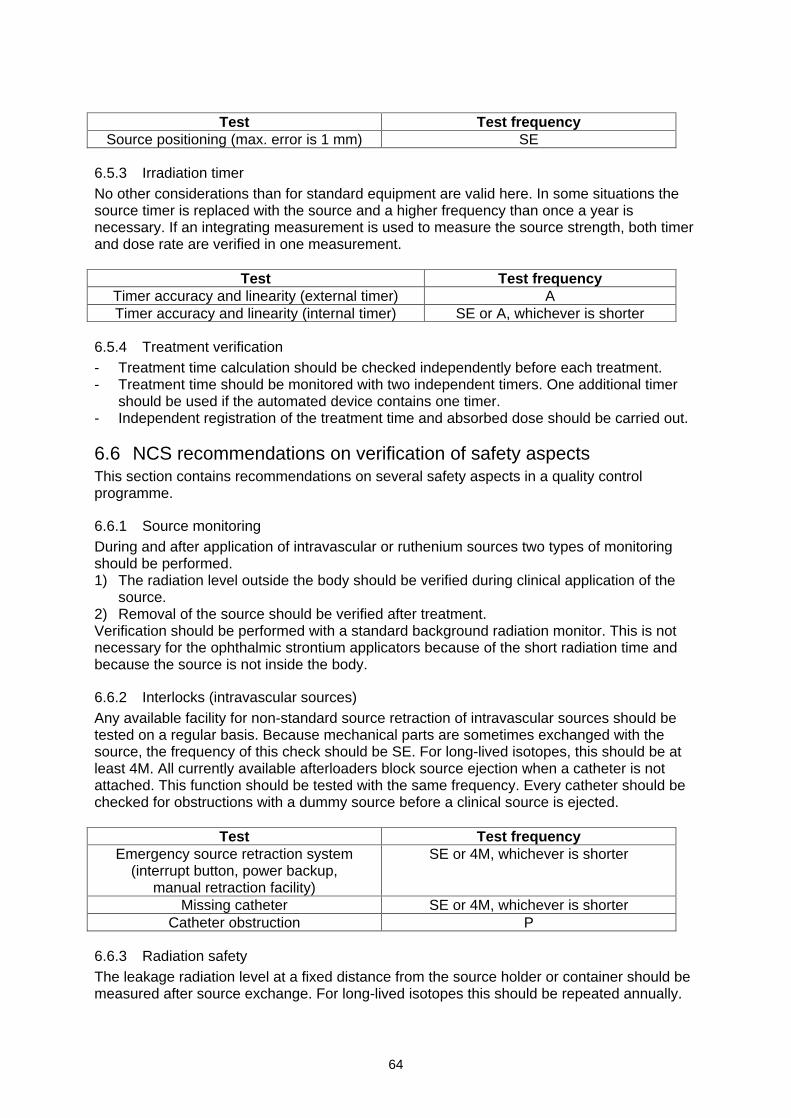
64
Test Test frequencySource positioning (max. error is 1 mm) SE
6.5.3 Irradiation timerNo other considerations than for standard equipment are valid here. In some situations thesource timer is replaced with the source and a higher frequency than once a year isnecessary. If an integrating measurement is used to measure the source strength, both timerand dose rate are verified in one measurement.
Test Test frequencyTimer accuracy and linearity (external timer) ATimer accuracy and linearity (internal timer) SE or A, whichever is shorter
6.5.4 Treatment verification- Treatment time calculation should be checked independently before each treatment.- Treatment time should be monitored with two independent timers. One additional timer
should be used if the automated device contains one timer.- Independent registration of the treatment time and absorbed dose should be carried out.
6.6 NCS recommendations on verification of safety aspectsThis section contains recommendations on several safety aspects in a quality controlprogramme.
6.6.1 Source monitoringDuring and after application of intravascular or ruthenium sources two types of monitoringshould be performed.1) The radiation level outside the body should be verified during clinical application of the
source.2) Removal of the source should be verified after treatment.Verification should be performed with a standard background radiation monitor. This is notnecessary for the ophthalmic strontium applicators because of the short radiation time andbecause the source is not inside the body.
6.6.2 Interlocks (intravascular sources)Any available facility for non-standard source retraction of intravascular sources should betested on a regular basis. Because mechanical parts are sometimes exchanged with thesource, the frequency of this check should be SE. For long-lived isotopes, this should be atleast 4M. All currently available afterloaders block source ejection when a catheter is notattached. This function should be tested with the same frequency. Every catheter should bechecked for obstructions with a dummy source before a clinical source is ejected.
Test Test frequencyEmergency source retraction system
(interrupt button, power backup,manual retraction facility)
SE or 4M, whichever is shorter
Missing catheter SE or 4M, whichever is shorterCatheter obstruction P
6.6.3 Radiation safetyThe leakage radiation level at a fixed distance from the source holder or container should bemeasured after source exchange. For long-lived isotopes this should be repeated annually.
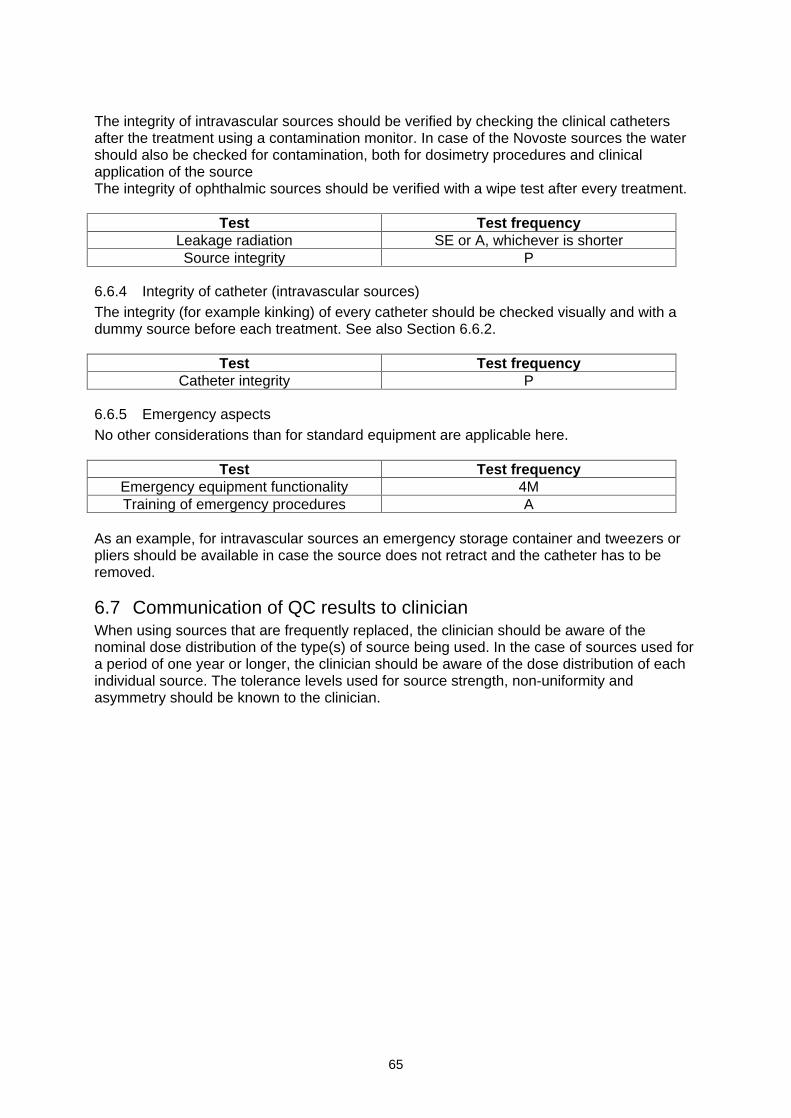
65
The integrity of intravascular sources should be verified by checking the clinical cathetersafter the treatment using a contamination monitor. In case of the Novoste sources the watershould also be checked for contamination, both for dosimetry procedures and clinicalapplication of the sourceThe integrity of ophthalmic sources should be verified with a wipe test after every treatment.
Test Test frequencyLeakage radiation SE or A, whichever is shorterSource integrity P
6.6.4 Integrity of catheter (intravascular sources)The integrity (for example kinking) of every catheter should be checked visually and with adummy source before each treatment. See also Section 6.6.2.
Test Test frequencyCatheter integrity P
6.6.5 Emergency aspectsNo other considerations than for standard equipment are applicable here.
Test Test frequencyEmergency equipment functionality 4MTraining of emergency procedures A
As an example, for intravascular sources an emergency storage container and tweezers orpliers should be available in case the source does not retract and the catheter has to beremoved.
6.7 Communication of QC results to clinicianWhen using sources that are frequently replaced, the clinician should be aware of thenominal dose distribution of the type(s) of source being used. In the case of sources used fora period of one year or longer, the clinician should be aware of the dose distribution of eachindividual source. The tolerance levels used for source strength, non-uniformity andasymmetry should be known to the clinician.
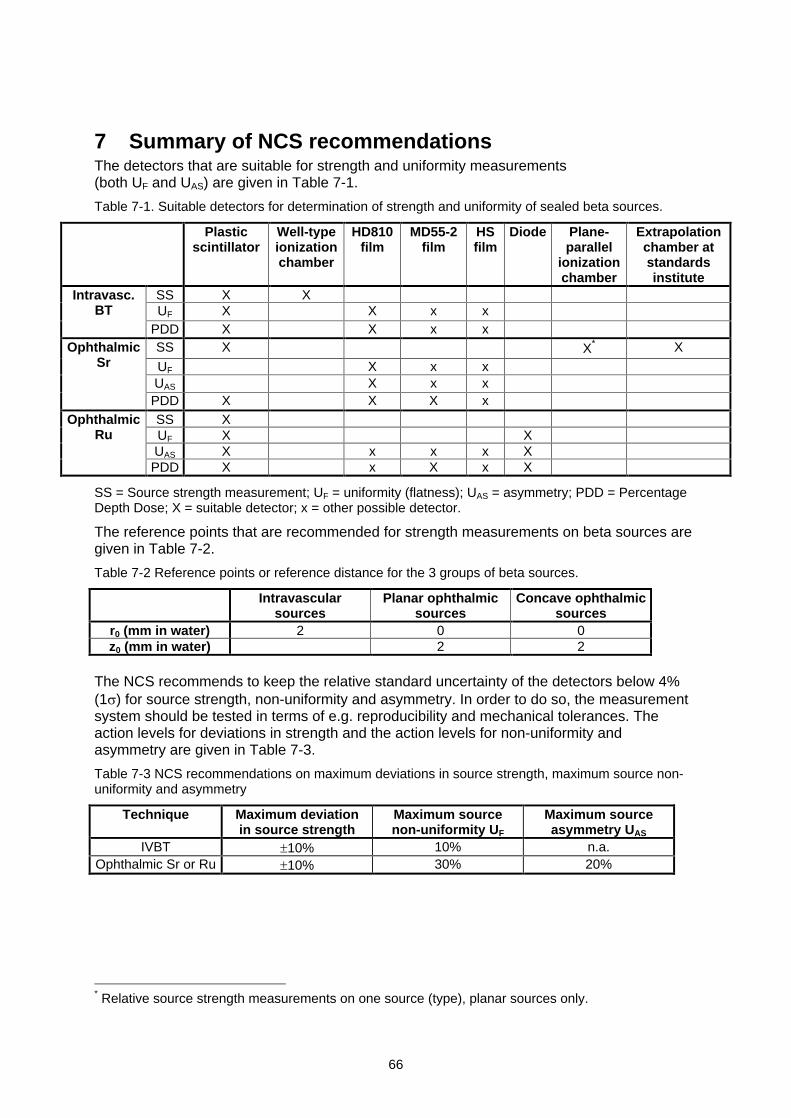
66
7 Summary of NCS recommendationsThe detectors that are suitable for strength and uniformity measurements(both UF and UAS) are given in Table 7-1.
Table 7-1. Suitable detectors for determination of strength and uniformity of sealed beta sources.
Plasticscintillator
Well-typeionizationchamber
HD810film
MD55-2film
HSfilm
Diode Plane-parallel
ionizationchamber
Extrapolationchamber atstandardsinstitute
SS X XUF X X x x
Intravasc.BT
PDD X X x xSS X X* X
UF X x xUAS X x x
OphthalmicSr
PDD X X X xSS XUF X XUAS X x x x X
OphthalmicRu
PDD X x X x X
SS = Source strength measurement; UF = uniformity (flatness); UAS = asymmetry; PDD = PercentageDepth Dose; X = suitable detector; x = other possible detector.
The reference points that are recommended for strength measurements on beta sources aregiven in Table 7-2.
Table 7-2 Reference points or reference distance for the 3 groups of beta sources.
Intravascularsources
Planar ophthalmicsources
Concave ophthalmicsources
r0 (mm in water) 2 0 0z0 (mm in water) 2 2
The NCS recommends to keep the relative standard uncertainty of the detectors below 4%(1 ) for source strength, non-uniformity and asymmetry. In order to do so, the measurementsystem should be tested in terms of e.g. reproducibility and mechanical tolerances. Theaction levels for deviations in strength and the action levels for non-uniformity andasymmetry are given in Table 7-3.
Table 7-3 NCS recommendations on maximum deviations in source strength, maximum source non-uniformity and asymmetry
Technique Maximum deviationin source strength
Maximum sourcenon-uniformity UF
Maximum sourceasymmetry UAS
IVBT 10% 10% n.a.Ophthalmic Sr or Ru 10% 30% 20%
* Relative source strength measurements on one source (type), planar sources only.
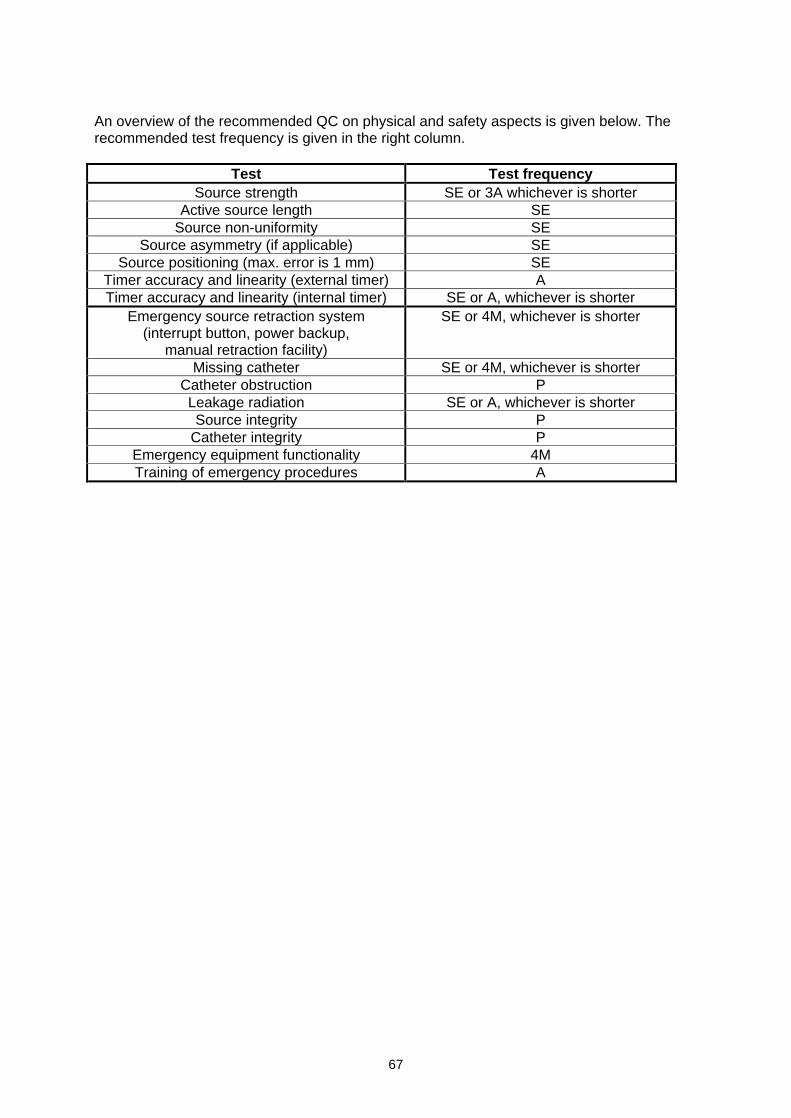
67
An overview of the recommended QC on physical and safety aspects is given below. Therecommended test frequency is given in the right column.
Test Test frequencySource strength SE or 3A whichever is shorter
Active source length SESource non-uniformity SE
Source asymmetry (if applicable) SESource positioning (max. error is 1 mm) SE
Timer accuracy and linearity (external timer) ATimer accuracy and linearity (internal timer) SE or A, whichever is shorter
Emergency source retraction system(interrupt button, power backup,
manual retraction facility)
SE or 4M, whichever is shorter
Missing catheter SE or 4M, whichever is shorterCatheter obstruction PLeakage radiation SE or A, whichever is shorterSource integrity P
Catheter integrity PEmergency equipment functionality 4MTraining of emergency procedures A
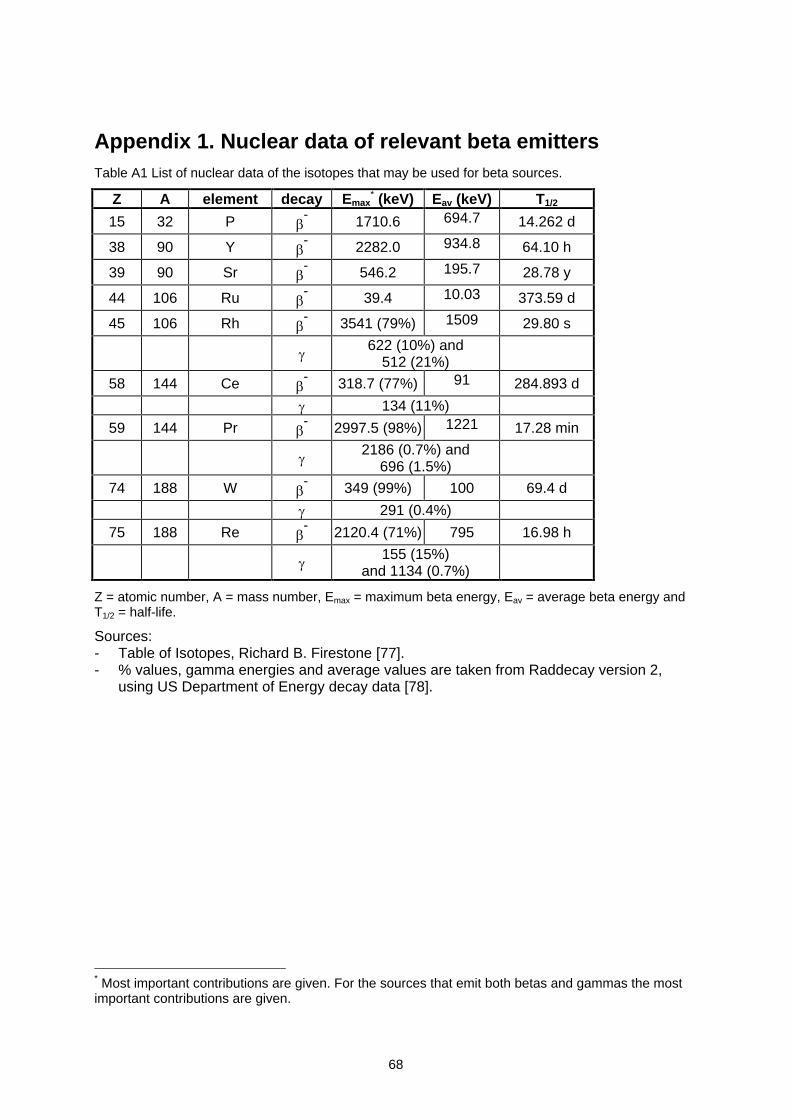
68
Appendix 1. Nuclear data of relevant beta emittersTable A1 List of nuclear data of the isotopes that may be used for beta sources.
Z A element decay Emax* (keV) Eav (keV) T1/2
15 32 P - 1710.6 694.7 14.262 d
38 90 Y - 2282.0 934.8 64.10 h
39 90 Sr - 546.2 195.7 28.78 y
44 106 Ru - 39.4 10.03 373.59 d
45 106 Rh - 3541 (79%) 1509 29.80 s
622 (10%) and512 (21%)
58 144 Ce - 318.7 (77%) 91 284.893 d
134 (11%)
59 144 Pr - 2997.5 (98%) 1221 17.28 min
2186 (0.7%) and696 (1.5%)
74 188 W - 349 (99%) 100 69.4 d
291 (0.4%)
75 188 Re - 2120.4 (71%) 795 16.98 h
155 (15%)and 1134 (0.7%)
Z = atomic number, A = mass number, Emax = maximum beta energy, Eav = average beta energy andT1/2 = half-life.
Sources:- Table of Isotopes, Richard B. Firestone [77].- % values, gamma energies and average values are taken from Raddecay version 2,
using US Department of Energy decay data [78].
* Most important contributions are given. For the sources that emit both betas and gammas the mostimportant contributions are given.
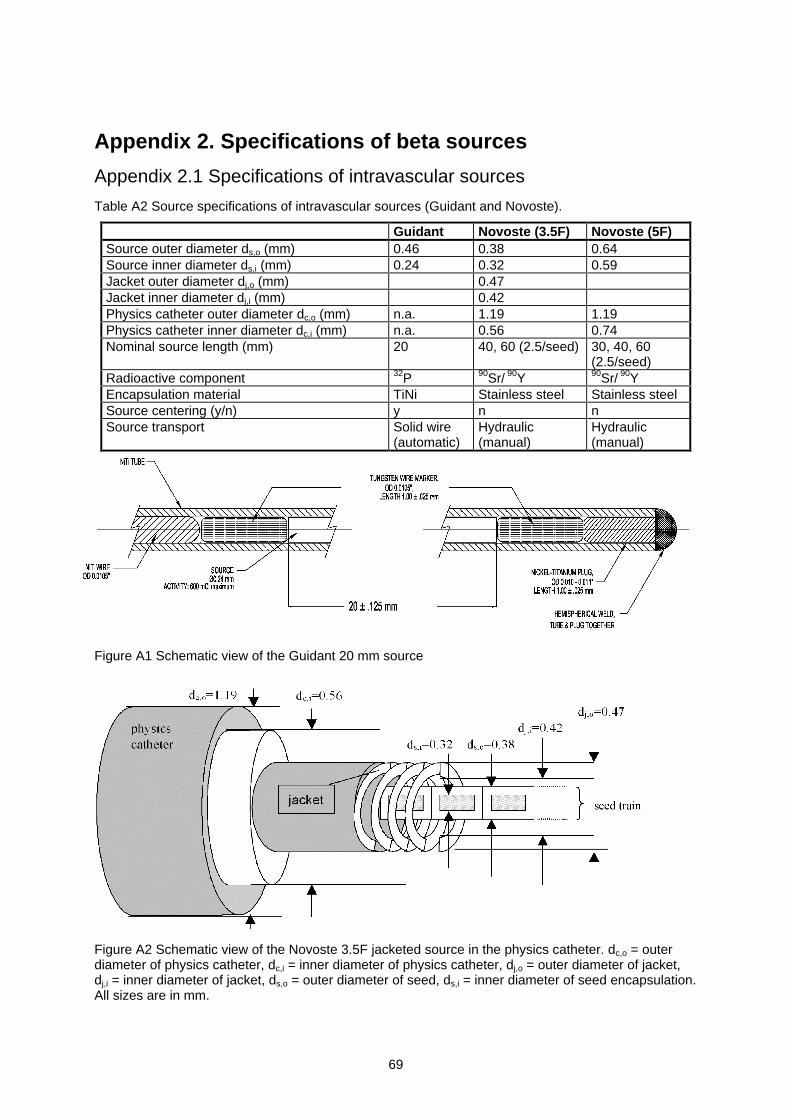
69
Appendix 2. Specifications of beta sources
Appendix 2.1 Specifications of intravascular sources
Table A2 Source specifications of intravascular sources (Guidant and Novoste).
Guidant Novoste (3.5F) Novoste (5F)Source outer diameter ds,o (mm) 0.46 0.38 0.64Source inner diameter ds,i (mm) 0.24 0.32 0.59Jacket outer diameter dj,o (mm) 0.47Jacket inner diameter dj,i (mm) 0.42Physics catheter outer diameter dc,o (mm) n.a. 1.19 1.19Physics catheter inner diameter dc,i (mm) n.a. 0.56 0.74Nominal source length (mm) 20 40, 60 (2.5/seed) 30, 40, 60
(2.5/seed)Radioactive component 32P 90Sr/ 90Y 90Sr/ 90YEncapsulation material TiNi Stainless steel Stainless steelSource centering (y/n) y n nSource transport Solid wire
(automatic)Hydraulic(manual)
Hydraulic(manual)
Figure A1 Schematic view of the Guidant 20 mm source
Figure A2 Schematic view of the Novoste 3.5F jacketed source in the physics catheter. dc,o = outerdiameter of physics catheter, dc,i = inner diameter of physics catheter, dj,o = outer diameter of jacket,dj,i = inner diameter of jacket, ds,o = outer diameter of seed, ds,i = inner diameter of seed encapsulation.All sizes are in mm.
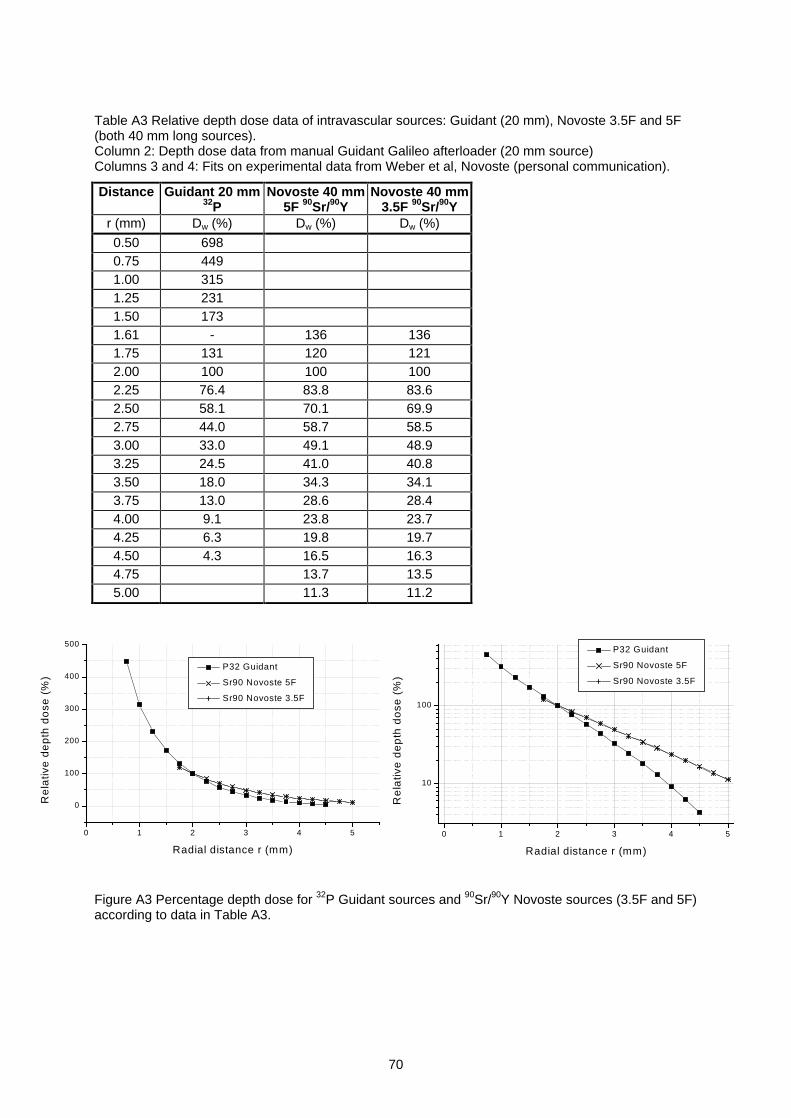
70
Table A3 Relative depth dose data of intravascular sources: Guidant (20 mm), Novoste 3.5F and 5F(both 40 mm long sources).Column 2: Depth dose data from manual Guidant Galileo afterloader (20 mm source)Columns 3 and 4: Fits on experimental data from Weber et al, Novoste (personal communication).
Distance Guidant 20 mm32P
Novoste 40 mm5F 90Sr/90Y
Novoste 40 mm3.5F 90Sr/90Y
r (mm) Dw (%) Dw (%) Dw (%)
0.50 6980.75 4491.00 3151.25 2311.50 1731.61 - 136 1361.75 131 120 1212.00 100 100 1002.25 76.4 83.8 83.62.50 58.1 70.1 69.92.75 44.0 58.7 58.53.00 33.0 49.1 48.93.25 24.5 41.0 40.83.50 18.0 34.3 34.13.75 13.0 28.6 28.44.00 9.1 23.8 23.74.25 6.3 19.8 19.74.50 4.3 16.5 16.34.75 13.7 13.55.00 11.3 11.2
Figure A3 Percentage depth dose for 32P Guidant sources and 90Sr/90Y Novoste sources (3.5F and 5F)according to data in Table A3.
0 1 2 3 4 5
10
100
P32 Guidant
Sr90 Novoste 5F
Sr90 Novoste 3.5F
Re
lativ
e d
ep
th d
ose
(%
)
Radial distance r (mm)
0 1 2 3 4 5
0
100
200
300
400
500
P32 Guidant
Sr90 Novoste 5F
Sr90 Novoste 3.5F
Re
lativ
e d
ep
th d
ose
(%
)
Radial distance r (mm)
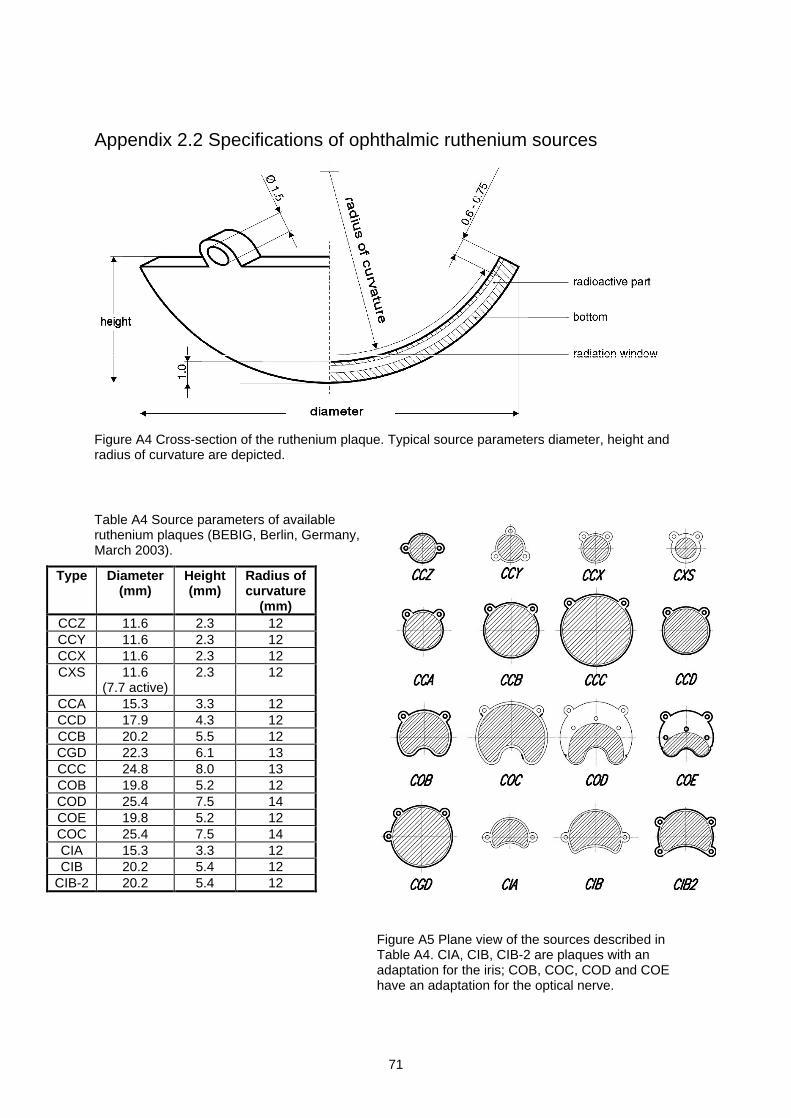
71
Appendix 2.2 Specifications of ophthalmic ruthenium sources
Figure A4 Cross-section of the ruthenium plaque. Typical source parameters diameter, height andradius of curvature are depicted.
Table A4 Source parameters of availableruthenium plaques (BEBIG, Berlin, Germany,March 2003).
Type Diameter(mm)
Height(mm)
Radius ofcurvature
(mm)CCZ 11.6 2.3 12CCY 11.6 2.3 12CCX 11.6 2.3 12CXS 11.6
(7.7 active)2.3 12
CCA 15.3 3.3 12CCD 17.9 4.3 12CCB 20.2 5.5 12CGD 22.3 6.1 13CCC 24.8 8.0 13COB 19.8 5.2 12COD 25.4 7.5 14COE 19.8 5.2 12COC 25.4 7.5 14CIA 15.3 3.3 12CIB 20.2 5.4 12
CIB-2 20.2 5.4 12
Figure A5 Plane view of the sources described inTable A4. CIA, CIB, CIB-2 are plaques with anadaptation for the iris; COB, COC, COD and COEhave an adaptation for the optical nerve.
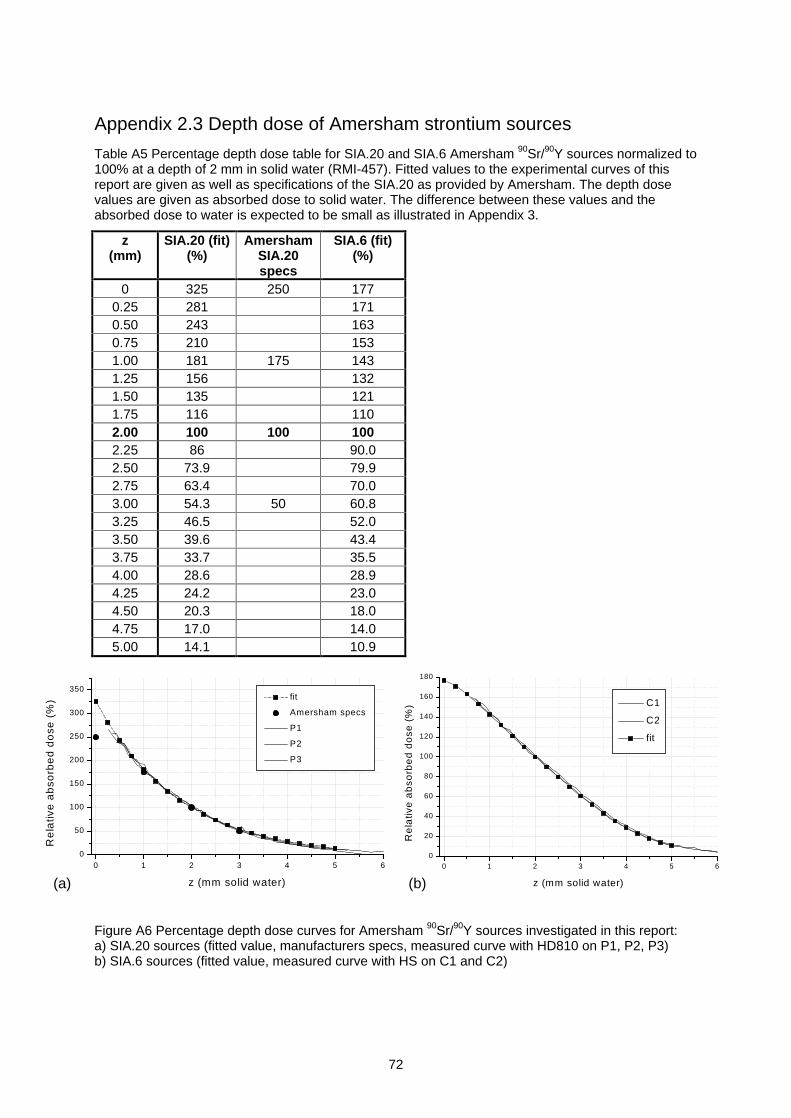
72
Appendix 2.3 Depth dose of Amersham strontium sources
Table A5 Percentage depth dose table for SIA.20 and SIA.6 Amersham 90Sr/90Y sources normalized to100% at a depth of 2 mm in solid water (RMI-457). Fitted values to the experimental curves of thisreport are given as well as specifications of the SIA.20 as provided by Amersham. The depth dosevalues are given as absorbed dose to solid water. The difference between these values and theabsorbed dose to water is expected to be small as illustrated in Appendix 3.
z(mm)
SIA.20 (fit)(%)
AmershamSIA.20specs
SIA.6 (fit)(%)
0 325 250 1770.25 281 1710.50 243 1630.75 210 1531.00 181 175 1431.25 156 1321.50 135 1211.75 116 1102.00 100 100 1002.25 86 90.02.50 73.9 79.92.75 63.4 70.03.00 54.3 50 60.83.25 46.5 52.03.50 39.6 43.43.75 33.7 35.54.00 28.6 28.94.25 24.2 23.04.50 20.3 18.04.75 17.0 14.05.00 14.1 10.9
Figure A6 Percentage depth dose curves for Amersham 90Sr/90Y sources investigated in this report:a) SIA.20 sources (fitted value, manufacturers specs, measured curve with HD810 on P1, P2, P3)b) SIA.6 sources (fitted value, measured curve with HS on C1 and C2)
0 1 2 3 4 5 60
20
40
60
80
100
120
140
160
180
C1
C2
fit
Re
lativ
e a
bso
rbe
d d
ose
(%
)
z (mm solid water)
0 1 2 3 4 5 60
50
100
150
200
250
300
350
fit
Amersham specs
P1
P2
P3
Re
lativ
e a
bso
rbe
d d
ose
(%
)
z (mm solid water)(a) (b)
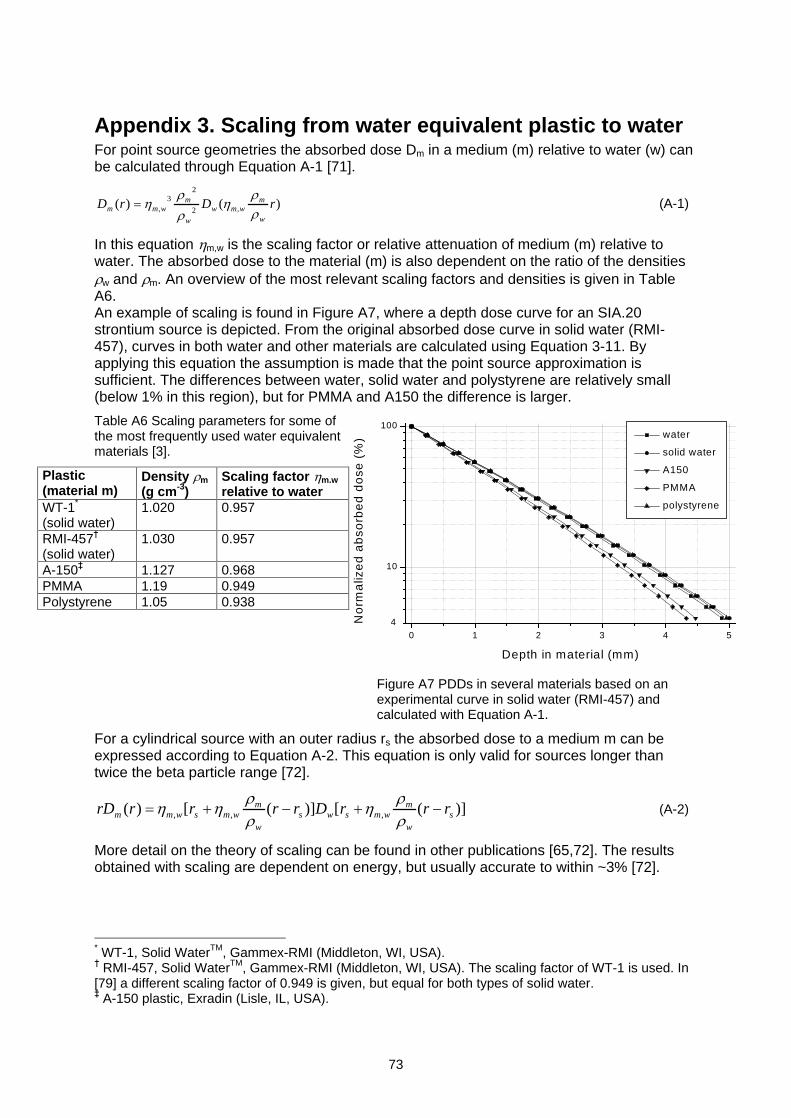
73
Appendix 3. Scaling from water equivalent plastic to waterFor point source geometries the absorbed dose Dm in a medium (m) relative to water (w) canbe calculated through Equation A-1 [71].
)()( ,2
23
, rDrDw
mwmw
w
mwmm (A-1)
In this equation m,w is the scaling factor or relative attenuation of medium (m) relative towater. The absorbed dose to the material (m) is also dependent on the ratio of the densities
w and m. An overview of the most relevant scaling factors and densities is given in TableA6.An example of scaling is found in Figure A7, where a depth dose curve for an SIA.20strontium source is depicted. From the original absorbed dose curve in solid water (RMI-457), curves in both water and other materials are calculated using Equation 3-11. Byapplying this equation the assumption is made that the point source approximation issufficient. The differences between water, solid water and polystyrene are relatively small(below 1% in this region), but for PMMA and A150 the difference is larger.
Table A6 Scaling parameters for some ofthe most frequently used water equivalentmaterials [3].
Plastic(material m)
Density m
(g cm-3)Scaling factor m,w
relative to waterWT-1*
(solid water)1.020 0.957
RMI-457(solid water)
1.030 0.957
A-150 1.127 0.968PMMA 1.19 0.949Polystyrene 1.05 0.938
Figure A7 PDDs in several materials based on anexperimental curve in solid water (RMI-457) andcalculated with Equation A-1.
For a cylindrical source with an outer radius rs the absorbed dose to a medium m can beexpressed according to Equation A-2. This equation is only valid for sources longer thantwice the beta particle range [72].
)]([)]([)( ,,, sw
mwmsws
w
mwmswmm rrrDrrrrrD (A-2)
More detail on the theory of scaling can be found in other publications [65,72]. The resultsobtained with scaling are dependent on energy, but usually accurate to within ~3% [72].
* WT-1, Solid WaterTM, Gammex-RMI (Middleton, WI, USA). RMI-457, Solid WaterTM, Gammex-RMI (Middleton, WI, USA). The scaling factor of WT-1 is used. In
[79] a different scaling factor of 0.949 is given, but equal for both types of solid water. A-150 plastic, Exradin (Lisle, IL, USA).
0 1 2 3 4 5
10
100
4
water
solid water
A150
PMMA
polystyrene
No
rma
lize
d a
bso
rbe
d d
ose
(%
)
Depth in material (mm)
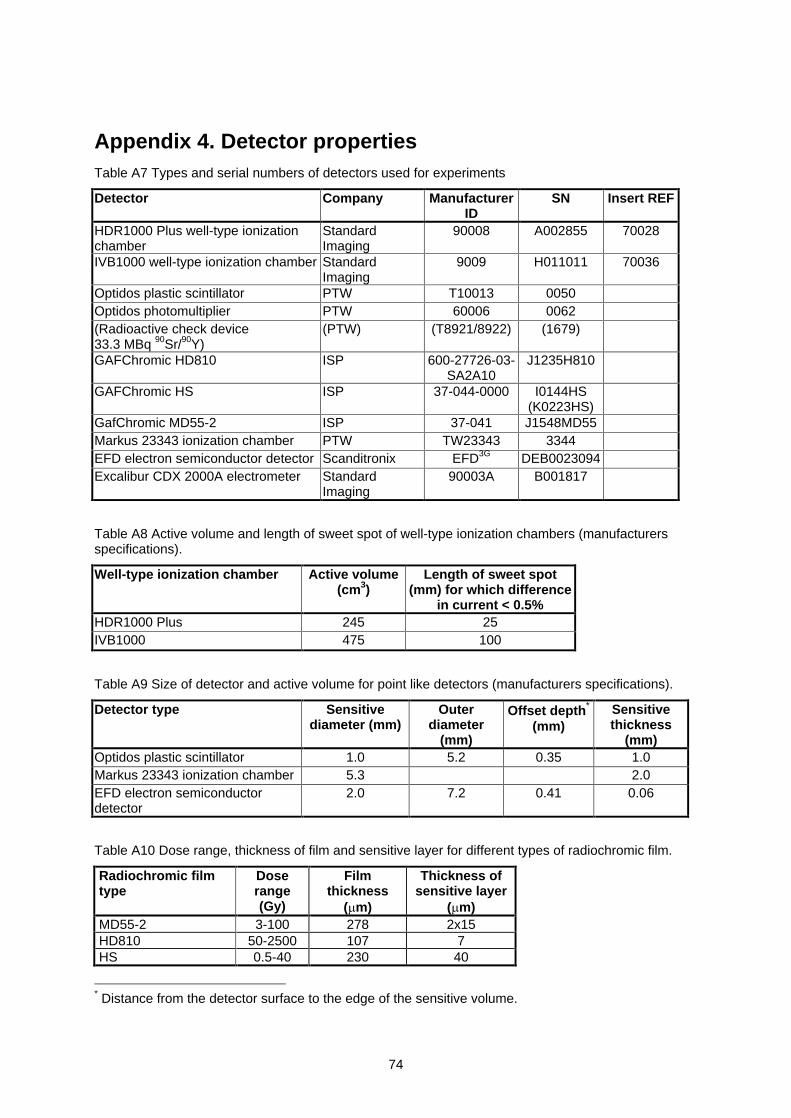
74
Appendix 4. Detector propertiesTable A7 Types and serial numbers of detectors used for experiments
Detector Company ManufacturerID
SN Insert REF
HDR1000 Plus well-type ionizationchamber
StandardImaging
90008 A002855 70028
IVB1000 well-type ionization chamber StandardImaging
9009 H011011 70036
Optidos plastic scintillator PTW T10013 0050Optidos photomultiplier PTW 60006 0062(Radioactive check device33.3 MBq 90Sr/90Y)
(PTW) (T8921/8922) (1679)
GAFChromic HD810 ISP 600-27726-03-SA2A10
J1235H810
GAFChromic HS ISP 37-044-0000 I0144HS(K0223HS)
GafChromic MD55-2 ISP 37-041 J1548MD55Markus 23343 ionization chamber PTW TW23343 3344EFD electron semiconductor detector Scanditronix EFD3G DEB0023094Excalibur CDX 2000A electrometer Standard
Imaging90003A B001817
Table A8 Active volume and length of sweet spot of well-type ionization chambers (manufacturersspecifications).
Well-type ionization chamber Active volume(cm3)
Length of sweet spot(mm) for which difference
in current < 0.5%HDR1000 Plus 245 25IVB1000 475 100
Table A9 Size of detector and active volume for point like detectors (manufacturers specifications).
Detector type Sensitivediameter (mm)
Outerdiameter
(mm)
Offset depth*
(mm)Sensitivethickness
(mm)Optidos plastic scintillator 1.0 5.2 0.35 1.0Markus 23343 ionization chamber 5.3 2.0EFD electron semiconductordetector
2.0 7.2 0.41 0.06
Table A10 Dose range, thickness of film and sensitive layer for different types of radiochromic film.
Radiochromic filmtype
Doserange(Gy)
Filmthickness
( m)
Thickness ofsensitive layer
( m)MD55-2 3-100 278 2x15HD810 50-2500 107 7HS 0.5-40 230 40
* Distance from the detector surface to the edge of the sensitive volume.
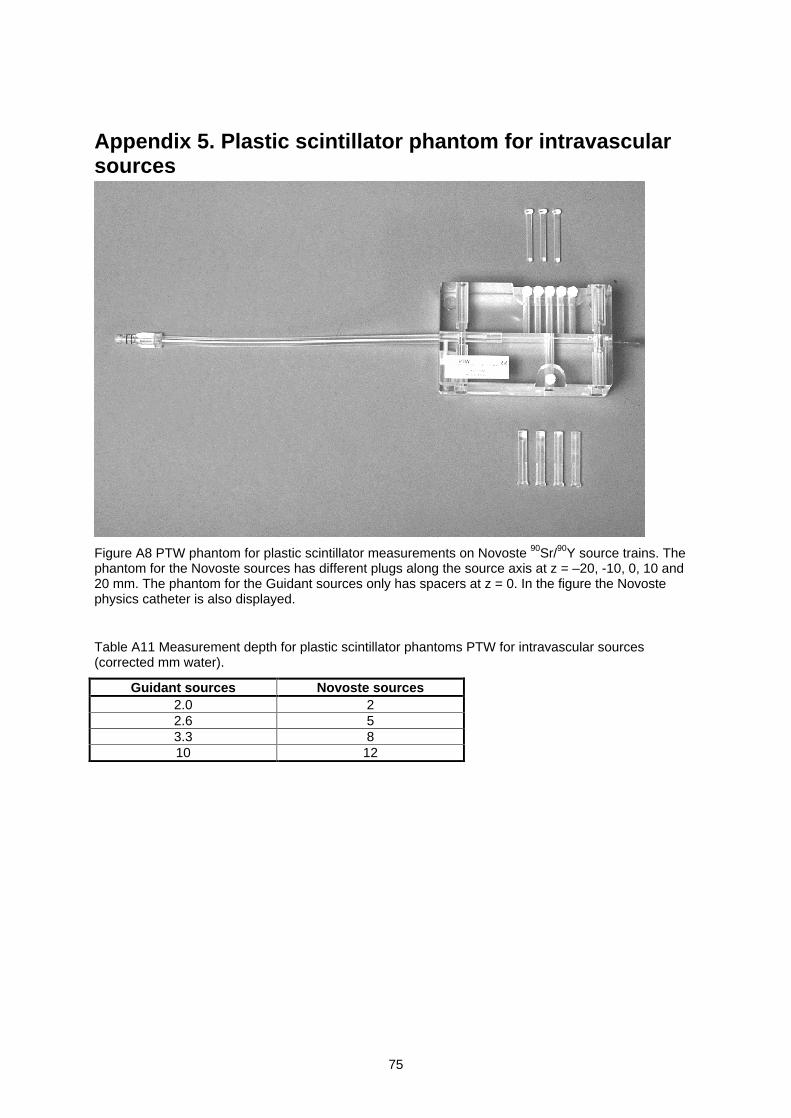
75
Appendix 5. Plastic scintillator phantom for intravascularsources
Figure A8 PTW phantom for plastic scintillator measurements on Novoste 90Sr/90Y source trains. Thephantom for the Novoste sources has different plugs along the source axis at z = 20, -10, 0, 10 and20 mm. The phantom for the Guidant sources only has spacers at z = 0. In the figure the Novostephysics catheter is also displayed.
Table A11 Measurement depth for plastic scintillator phantoms PTW for intravascular sources(corrected mm water).
Guidant sources Novoste sources2.0 22.6 53.3 810 12

76
Appendix 6. Technical drawing of film phantom forintravascular sources
Figure A9 Design of film phantom. Part 1: bottom of phantom; part 2: top of phantom; part 3: phantomadd-on for Guidant physics coupler connection; part 4: Novoste insert and part 5: Guidant insert (allsizes in mm).
Figure A10 3-dimensional view of the film phantom. Part 1 and part 5 correspond to the parts in FigureA9 and part 6 is the source (in case of the Guidant source) or the physics catheter (in case of theNovoste setup).
1
5
6
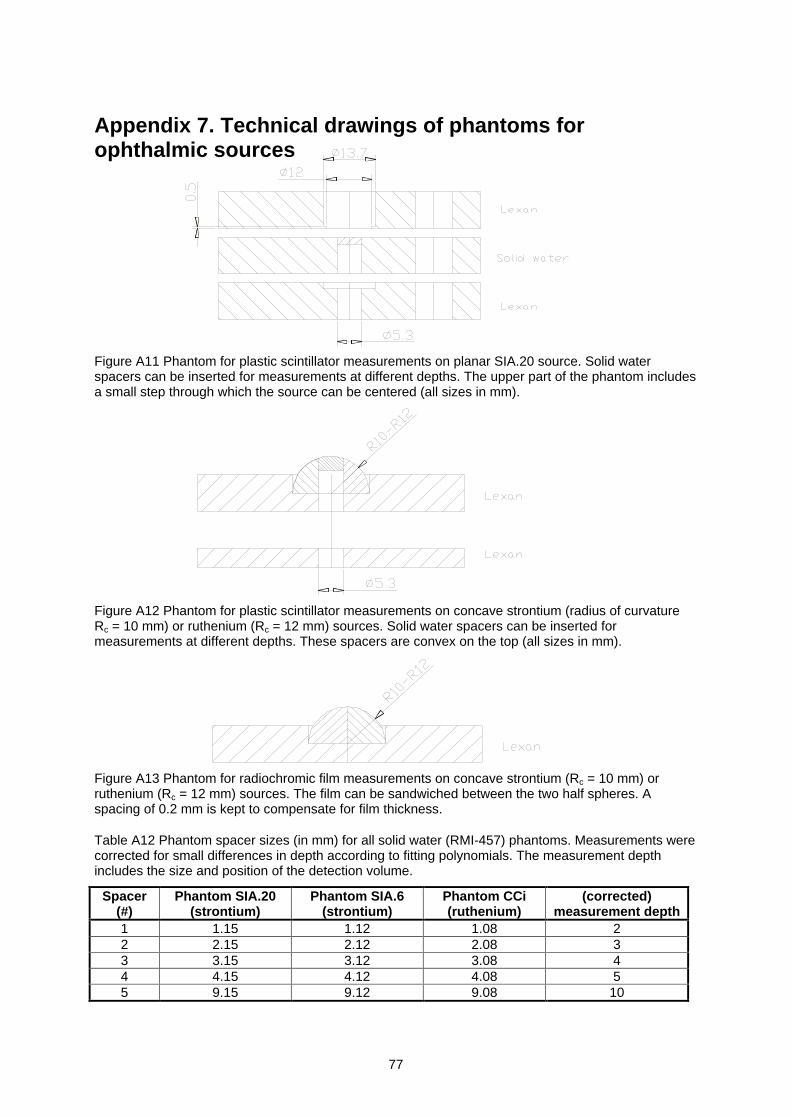
77
Appendix 7. Technical drawings of phantoms forophthalmic sources
Figure A11 Phantom for plastic scintillator measurements on planar SIA.20 source. Solid waterspacers can be inserted for measurements at different depths. The upper part of the phantom includesa small step through which the source can be centered (all sizes in mm).
Figure A12 Phantom for plastic scintillator measurements on concave strontium (radius of curvatureRc = 10 mm) or ruthenium (Rc = 12 mm) sources. Solid water spacers can be inserted formeasurements at different depths. These spacers are convex on the top (all sizes in mm).
Figure A13 Phantom for radiochromic film measurements on concave strontium (Rc = 10 mm) orruthenium (Rc = 12 mm) sources. The film can be sandwiched between the two half spheres. Aspacing of 0.2 mm is kept to compensate for film thickness.
Table A12 Phantom spacer sizes (in mm) for all solid water (RMI-457) phantoms. Measurements werecorrected for small differences in depth according to fitting polynomials. The measurement depthincludes the size and position of the detection volume.
Spacer(#)
Phantom SIA.20(strontium)
Phantom SIA.6(strontium)
Phantom CCi(ruthenium)
(corrected)measurement depth
1 1.15 1.12 1.08 22 2.15 2.12 2.08 33 3.15 3.12 3.08 44 4.15 4.12 4.08 55 9.15 9.12 9.08 10
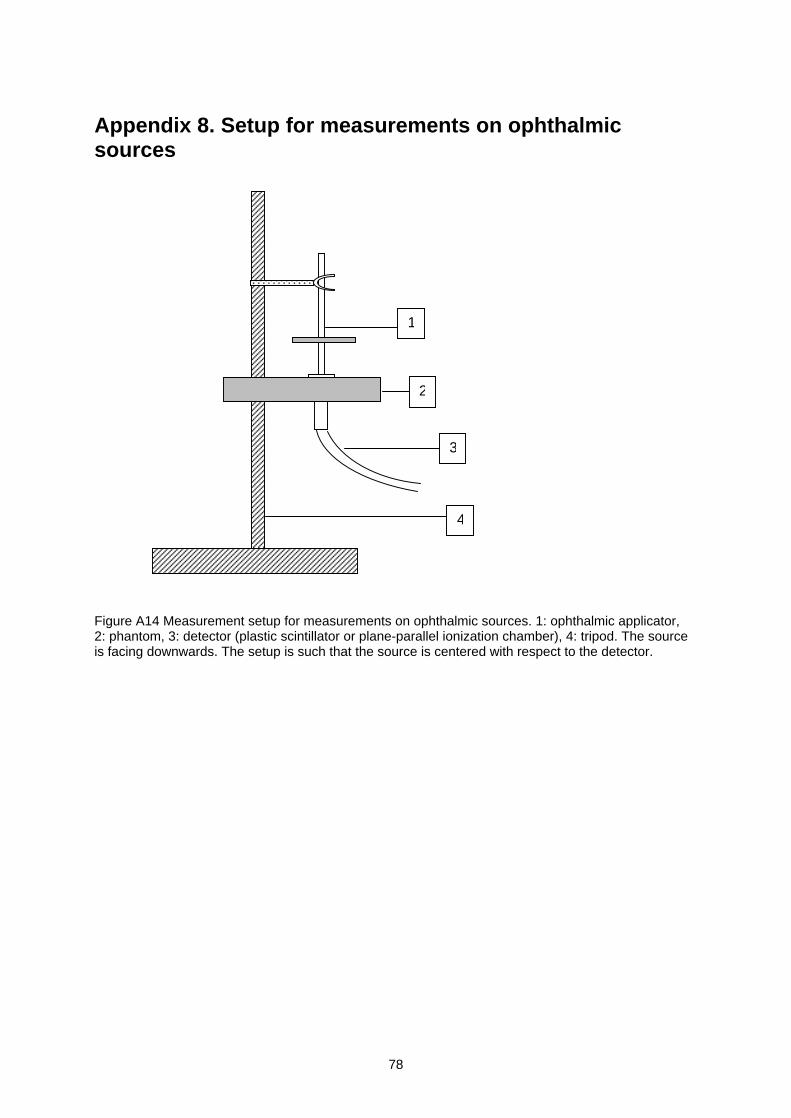
78
Appendix 8. Setup for measurements on ophthalmicsources
Figure A14 Measurement setup for measurements on ophthalmic sources. 1: ophthalmic applicator,2: phantom, 3: detector (plastic scintillator or plane-parallel ionization chamber), 4: tripod. The sourceis facing downwards. The setup is such that the source is centered with respect to the detector.
2
1
3
4
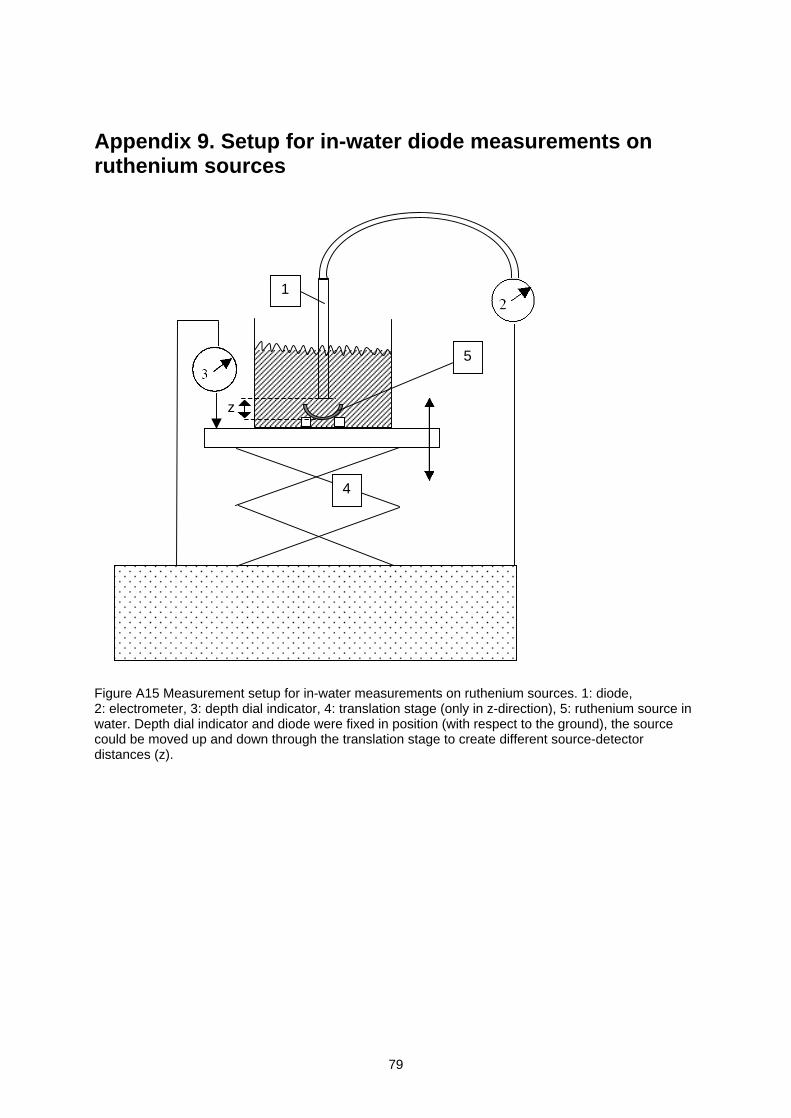
79
Appendix 9. Setup for in-water diode measurements onruthenium sources
Figure A15 Measurement setup for in-water measurements on ruthenium sources. 1: diode,2: electrometer, 3: depth dial indicator, 4: translation stage (only in z-direction), 5: ruthenium source inwater. Depth dial indicator and diode were fixed in position (with respect to the ground), the sourcecould be moved up and down through the translation stage to create different source-detectordistances (z).
4
1
5
z

80
Appendix 10. Measurement procedures
Appendix 10.1 Measurement procedure Guidant 32PWell-type ionization chamberPositioning of source- Measure at maximum of sweet spot (after determination of sweet spot by stepping the source)- Straight physics couplerPositioning of detector- Behind (perspex) protection screen- Influences of backscatter are negligible for measurements on beta sourcesNumber of measurements; achievable statistics- SD<0.1% can be achieved with N = 6 integrating measurements (60 s). Use repeated source insertions.Detector stability- Check correct voltage and polarity (according to calibration, for example 300 V)- Take 30 minutes warm-up time into account (with chamber connected)- Zero electrometer; correct for temperature and pressure
Plastic scintillatorPositioning of source- For the phantom used, the middle of the source should be at position 1982 as defined in the afterloader.Positioning of detector- Behind (perspex) protection screen- At 2 mm. No air gaps!- Keep probe in same shape during different measurements (signal depends on shape of probe).Number of measurements; achievable statistics- SD<1% should be achievable with N = 5 integrating measurements (60 s). Use repeated source insertions.
For determination of )( 0rD use integrations with the source at at least 3 positions taking into account a
margin of at least 2.5 mm from the 50% point.Detector stability- Take into account 30 minutes warm-up time (with scintillator probe connected)- Zero detector- Perform check source measurements every 40 minutes (range low). Changes higher than ~2% should not be
tolerated. The change can be concluded from the different calibration factors after a check sourcemeasurement.
Radiochromic filmPositioning of detector- Behind (perspex) protection screen- Measurements at 2 mm waterequivalent- Careful with air gaps in phantomFilm handling- Mark proximal and distal side of the source on the film- Cut film in direction of coating- Keep films out of light as much as possible and prevent high temperatures- Calibrate film and take same time between irradiation and densitometry into account- Preferably use HD810 film
Film scanning (some points specific for flatbed scanner)- In transmission mode- At for example 300 dpi or higher- At > 8 bits TIF format (if possible)- Do not allow scan (color) corrections- No direct contact between scanner plate and film (Newton rings will appear)- Scan direction parallel to the film (no angle)

81
Appendix 10.2 Measurement procedure Novoste 90Sr/90Y
Well-type ionization chamberPositioning of source- Measurement in sweet spot (IVB1000 is equipped with a 30, 40 and 60 mm source insert position)- Averaging over 4 compass directions to eliminate directional dependencePositioning of detector- Behind (perspex) protection screen- Influences of backscatter are negligible for measurements on beta sources- Clinical catheter should be fixed to chamber insertNumber of measurements; achievable statistics- SD<1% can be achieved with N = 3x4 integrating measurements (60 s). Use multiple positioning of source
and catheter (for example 3 repeated source insertions and 4 compass directions turning both insert andcatheter together).
Detector stability- Check correct voltage and polarity (according to calibration, for example 300 V)- Take 30 minutes warm-up time into account (with chamber connected)- Zero electrometer; correct for temperature and pressureWarning: our experience was that in measurements with the clinical 3.5F catheter (summer 2002) the sourcecould get stuck in the clinical catheter when the catheter was used more than once.
Plastic scintillatorPositioning of source- Stable source positioning should be monitored. Keeping pressure on water in the afterloader with a rubber
band, positioning the phantom in an angle are possibilities to keep the seed train in a stable positionPositioning of detector- Behind (perspex) protection screen- At 2 mm. No air gaps! Keep probe in same shape during different measurements (signal depends on shape
of probe).Number of measurements; achievable statistics- Sd<3% should be achievable with N = 5 integrating measurements (60 s). Use repeated source insertions.
For determination of )( 0rD use integrations with the source at at least 3 positions taking into account a
margin of at least 3.0 mm from the 50% point.Detector stability- Take into account 30 minutes warm-up time (with scintillator probe connected)- Zero detector- Perform check source measurements every 40 minutes (range low). Changes higher than ~2% should not be
tolerated. The change can be concluded from the different calibration factors after a check sourcemeasurement.
Radiochromic filmPositioning of source- Keep pressure on water in the afterloader, for example with a rubber band, position the phantom in an angle
to keep the seed train in a stable position.Positioning of detector- Behind (perspex) protection screen- Measurements at 2 mm waterequivalent- Careful with air gaps in phantomFilm handling- Mark proximal and distal side of the source on the film- Cut film in direction of coating- Keep films out of light as much as possible and prevent high temperatures- Calibrate film and take same time between irradiation and densitometry into account- Preferably use HD810 film
Film scanning (some points specific for flatbed scanner)- In transmission mode- At for example 300 dpi or higher- At > 8 bits TIF format (if possible)- Do not allow scan (color) corrections
- No direct contact between scanner plate andfilm (Newton rings will appear)
- Scan direction parallel to the film (no angle)

82
Appendix 10.3 Measurement procedure Amersham 90Sr/90Y
Plastic scintillatorPositioning of source- Place source horizontally- Source centered with respect to detector (axis coinciding with axis of detector)Positioning of detector- Behind (perspex) protection screen- Avoid air gaps! Keep probe in same shape during different measurements (signal depends on shape of
probe).Number of measurements; achievable statistics- SD<2% should be achievable with N = 5 measurements, SD<1% for concave sources. Use repeated source
placements.Detector stability- Take into account 30 minutes warm-up time (with scintillator probe connected)- Zero detector- Perform check source measurements every 40 minutes (range low). Changes higher than ~2% should not be
tolerated. The change can be concluded from the different calibration factors after a check sourcemeasurement.
Plane-parallel ionization chamberPositioning of source- Place source horizontally- Source centered with respect to detector (axis coinciding with axis of detector)Positioning of detector- Behind (perspex) protection screen- Avoid air gaps!- The position of the detector should be fixed, especially when it is positioned under the source- The detector should be properly centered with respect to the phantomNumber of measurements; achievable statistics- SD<1% should be achievable with N = 5 measurementsDetector stability- Check correct voltage and polarity (according to calibration, for example 300 V)- Take into account 30 minutes warm-up time (with chamber connected)- Zero electrometer; correct for temperature and pressure- As a verification of the stability of the chamber check source measurements can be performed. No
differences larger than 1% were observed
Radiochromic filmPositioning of source- Place source horizontally- Beware of source movementsPositioning of detector- Behind (perspex) protection screen- Careful with air gaps in phantom- Use waterequivalent backscatter materialFilm handling- Mark proximal and distal side of the source on the film- Keep films out of light as much as possible and prevent high temperatures- Calibrate film and take same time between irradiation and densitometry into account- Preferably use HD810 film if the dose rate allows it
Film scanning (some points specific for flatbed scanner)- In transmission mode- At for example 300 dpi or higher- At > 8 bits TIF format (if possible)- Do not allow scan (color) corrections- No direct contact between scanner plate and film (Newton rings will appear)- Scan direction parallel to the film (no angle)

83
Appendix 10.4 Measurement procedure BEBIG 106Ru/106Rh
Plastic scintillatorPositioning of source- Place source horizontally- Source centered with respect to detector (axis coinciding with axis plastic scintillator).Positioning of detector- Behind (perspex) protection screen- Avoid air gaps! Keep probe in same shape during different measurements (signal depends on shape of
probe).Number of measurements; achievable statistics- SD<1% should be achievable with N = 5 measurements (in phantom, sources without cutouts). Use repeated
source placementsDetector stability- Take into account 30 minutes warm-up time (with scintillator probe connected)- Zero detector- Perform check source measurements every 40 minutes (range low). Changes higher than ~2% should not be
tolerated. The change can be concluded from the different calibration factors after a check sourcemeasurement.
DiodePositioning of source- Source centered with respect to detector (axis coinciding with axis plastic scintillator)Positioning of detector- Behind (perspex) protection screen- In the case of in water measurements a depth dial indicator can be used for determination of the source-
detector distance.Detector stability- No warm-up time required- Check correct voltage (0 V)- Zero detector- Our experience is that a diode detector can be applied without check source measurements, but only when it
is not used for other measurements (no doses >100 Gy)
Radiochromic filmPositioning of source- Place source horizontally- Beware of source movementsPositioning of detector- Behind (perspex) protection screen- Careful with air gaps in phantom- Use waterequivalent backscatter materialFilm handling- Keep films out of light as much as possible and prevent high temperatures- Calibrate film and take same time between irradiation and densitometry into account- Use HS or MD55-2 film for uniformity measurements, MD55-2 film for depth dose measurements
Film scanning (some points specific for flatbed scanner)- In transmission mode- At for example 300 dpi or higher- At > 8 bits TIF format (if possible)- Do not allow scan (color) corrections- No direct contact between scanner plate and film (Newton rings will appear)- Scan direction parallel to the film (no angle)
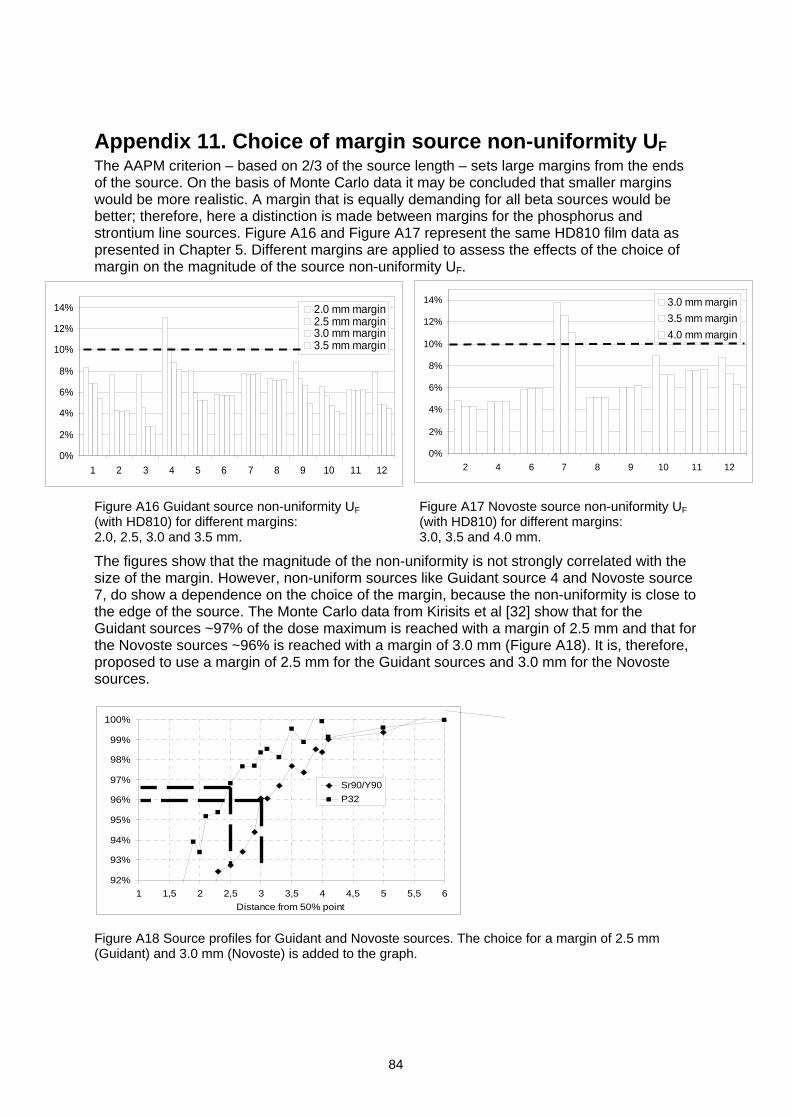
84
Appendix 11. Choice of margin source non-uniformity UFThe AAPM criterion based on 2/3 of the source length sets large margins from the endsof the source. On the basis of Monte Carlo data it may be concluded that smaller marginswould be more realistic. A margin that is equally demanding for all beta sources would bebetter; therefore, here a distinction is made between margins for the phosphorus andstrontium line sources. Figure A16 and Figure A17 represent the same HD810 film data aspresented in Chapter 5. Different margins are applied to assess the effects of the choice ofmargin on the magnitude of the source non-uniformity UF.
Figure A16 Guidant source non-uniformity UF
(with HD810) for different margins:2.0, 2.5, 3.0 and 3.5 mm.
Figure A17 Novoste source non-uniformity UF
(with HD810) for different margins:3.0, 3.5 and 4.0 mm.
The figures show that the magnitude of the non-uniformity is not strongly correlated with thesize of the margin. However, non-uniform sources like Guidant source 4 and Novoste source7, do show a dependence on the choice of the margin, because the non-uniformity is close tothe edge of the source. The Monte Carlo data from Kirisits et al [32] show that for theGuidant sources ~97% of the dose maximum is reached with a margin of 2.5 mm and that forthe Novoste sources ~96% is reached with a margin of 3.0 mm (Figure A18). It is, therefore,proposed to use a margin of 2.5 mm for the Guidant sources and 3.0 mm for the Novostesources.
Figure A18 Source profiles for Guidant and Novoste sources. The choice for a margin of 2.5 mm(Guidant) and 3.0 mm (Novoste) is added to the graph.
0%
2%
4%
6%
8%
10%
12%
14%
1 2 3 4 5 6 7 8 9 10 11 12
2.0 mm margin2.5 mm margin3.0 mm margin3.5 mm margin
0%
2%
4%
6%
8%
10%
12%
14%
2 4 6 7 8 9 10 11 12
3.0 mm margin
3.5 mm margin
4.0 mm margin
92%
93%
94%
95%
96%
97%
98%
99%
100%
1 1,5 2 2,5 3 3,5 4 4,5 5 5,5 6
Distance from 50% point
Sr90/Y90
P32
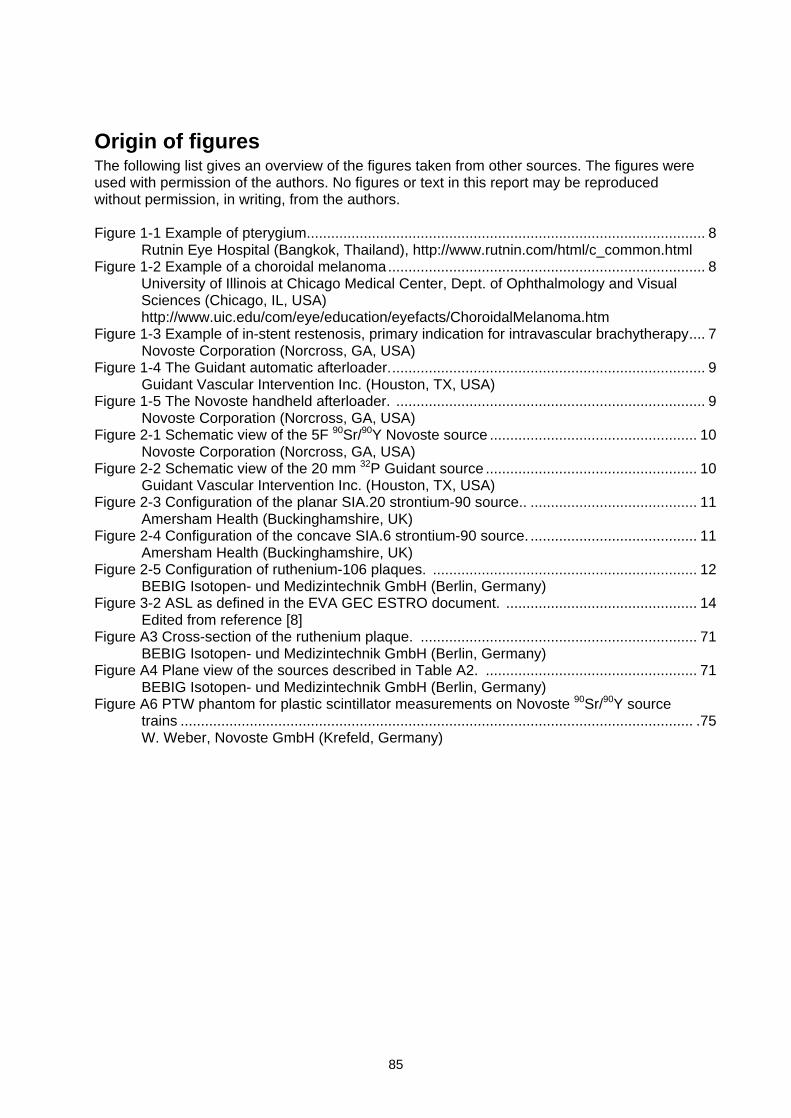
85
Origin of figuresThe following list gives an overview of the figures taken from other sources. The figures wereused with permission of the authors. No figures or text in this report may be reproducedwithout permission, in writing, from the authors.
Figure 1-1 Example of pterygium.................................................................................................. 8Rutnin Eye Hospital (Bangkok, Thailand), http://www.rutnin.com/html/c_common.html
Figure 1-2 Example of a choroidal melanoma.............................................................................. 8University of Illinois at Chicago Medical Center, Dept. of Ophthalmology and VisualSciences (Chicago, IL, USA)http://www.uic.edu/com/eye/education/eyefacts/ChoroidalMelanoma.htm
Figure 1-3 Example of in-stent restenosis, primary indication for intravascular brachytherapy.... 7Novoste Corporation (Norcross, GA, USA)
Figure 1-4 The Guidant automatic afterloader.............................................................................. 9Guidant Vascular Intervention Inc. (Houston, TX, USA)
Figure 1-5 The Novoste handheld afterloader. ............................................................................ 9Novoste Corporation (Norcross, GA, USA)
Figure 2-1 Schematic view of the 5F 90Sr/90Y Novoste source ................................................... 10Novoste Corporation (Norcross, GA, USA)
Figure 2-2 Schematic view of the 20 mm 32P Guidant source .................................................... 10Guidant Vascular Intervention Inc. (Houston, TX, USA)
Figure 2-3 Configuration of the planar SIA.20 strontium-90 source.. ......................................... 11Amersham Health (Buckinghamshire, UK)
Figure 2-4 Configuration of the concave SIA.6 strontium-90 source. ......................................... 11Amersham Health (Buckinghamshire, UK)
Figure 2-5 Configuration of ruthenium-106 plaques. ................................................................. 12BEBIG Isotopen- und Medizintechnik GmbH (Berlin, Germany)
Figure 3-2 ASL as defined in the EVA GEC ESTRO document. ............................................... 14Edited from reference [8]
Figure A3 Cross-section of the ruthenium plaque. .................................................................... 71BEBIG Isotopen- und Medizintechnik GmbH (Berlin, Germany)
Figure A4 Plane view of the sources described in Table A2. .................................................... 71BEBIG Isotopen- und Medizintechnik GmbH (Berlin, Germany)
Figure A6 PTW phantom for plastic scintillator measurements on Novoste 90Sr/90Y sourcetrains .............................................................................................................................. .75W. Weber, Novoste GmbH (Krefeld, Germany)
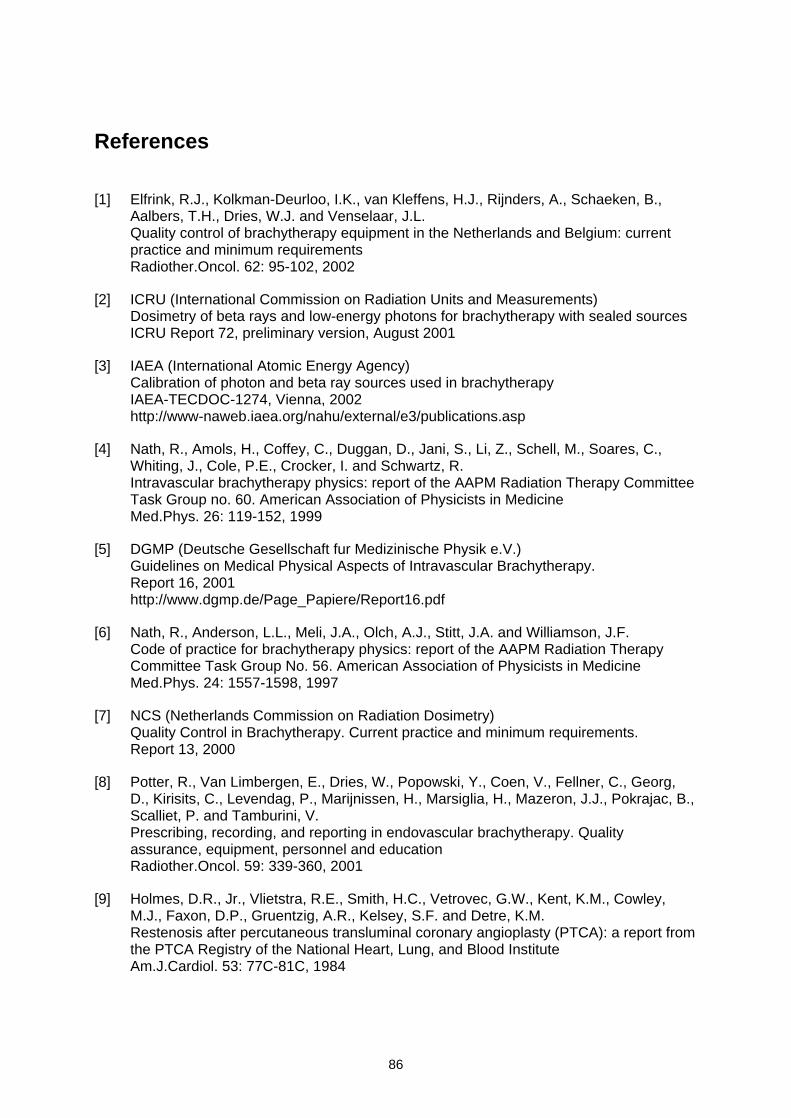
86
References
[1] Elfrink, R.J., Kolkman-Deurloo, I.K., van Kleffens, H.J., Rijnders, A., Schaeken, B.,Aalbers, T.H., Dries, W.J. and Venselaar, J.L.Quality control of brachytherapy equipment in the Netherlands and Belgium: currentpractice and minimum requirementsRadiother.Oncol. 62: 95-102, 2002
[2] ICRU (International Commission on Radiation Units and Measurements)Dosimetry of beta rays and low-energy photons for brachytherapy with sealed sourcesICRU Report 72, preliminary version, August 2001
[3] IAEA (International Atomic Energy Agency)Calibration of photon and beta ray sources used in brachytherapyIAEA-TECDOC-1274, Vienna, 2002http://www-naweb.iaea.org/nahu/external/e3/publications.asp
[4] Nath, R., Amols, H., Coffey, C., Duggan, D., Jani, S., Li, Z., Schell, M., Soares, C.,Whiting, J., Cole, P.E., Crocker, I. and Schwartz, R.Intravascular brachytherapy physics: report of the AAPM Radiation Therapy CommitteeTask Group no. 60. American Association of Physicists in MedicineMed.Phys. 26: 119-152, 1999
[5] DGMP (Deutsche Gesellschaft fur Medizinische Physik e.V.)Guidelines on Medical Physical Aspects of Intravascular Brachytherapy.Report 16, 2001http://www.dgmp.de/Page_Papiere/Report16.pdf
[6] Nath, R., Anderson, L.L., Meli, J.A., Olch, A.J., Stitt, J.A. and Williamson, J.F.Code of practice for brachytherapy physics: report of the AAPM Radiation TherapyCommittee Task Group No. 56. American Association of Physicists in MedicineMed.Phys. 24: 1557-1598, 1997
[7] NCS (Netherlands Commission on Radiation Dosimetry)Quality Control in Brachytherapy. Current practice and minimum requirements.Report 13, 2000
[8] Potter, R., Van Limbergen, E., Dries, W., Popowski, Y., Coen, V., Fellner, C., Georg,D., Kirisits, C., Levendag, P., Marijnissen, H., Marsiglia, H., Mazeron, J.J., Pokrajac, B.,Scalliet, P. and Tamburini, V.Prescribing, recording, and reporting in endovascular brachytherapy. Qualityassurance, equipment, personnel and educationRadiother.Oncol. 59: 339-360, 2001
[9] Holmes, D.R., Jr., Vlietstra, R.E., Smith, H.C., Vetrovec, G.W., Kent, K.M., Cowley,M.J., Faxon, D.P., Gruentzig, A.R., Kelsey, S.F. and Detre, K.M.Restenosis after percutaneous transluminal coronary angioplasty (PTCA): a report fromthe PTCA Registry of the National Heart, Lung, and Blood InstituteAm.J.Cardiol. 53: 77C-81C, 1984
87
[10] Califf, R.M., Fortin, D.F., Frid, D.J., Harlan, W.R., III, Ohman, E.M., Bengtson, J.R.,Nelson, C.L., Tcheng, J.E., Mark, D.B. and Stack, R.S.Restenosis after coronary angioplasty: an overviewJ.Am.Coll.Cardiol. 17: 2B-13B, 1991
[11] Serruys, P.W., de Jaegere, P., Kiemeneij, F., Macaya, C., Rutsch, W., Heyndrickx, G.,Emanuelsson, H., Marco, J., Legrand, V. and Materne, P.A comparison of balloon-expandable-stent implantation with balloon angioplasty inpatients with coronary artery disease. Benestent Study GroupN.Engl.J.Med. 331: 489-495, 1994
[12] Popowski, Y., Verin, V. and Urban, P.Endovascular beta-irradiation after percutaneous transluminal coronary balloonangioplastyInt.J.Radiat.Oncol.Biol.Phys. 36: 841-845, 1996
[13] Waksman, R., Cheneau, E., Ajani, A.E., White, R.L., Pinnow, E., Torguson, R., Deible,R., Satler, L.F., Pichard, A.D., Kent, K.M., Teirstein, P.S. and Lindsay, J.Intracoronary radiation therapy improves the clinical and angiographic outcomes ofdiffuse in-stent restenotic lesions: results of the Washington Radiation for In-StentRestenosis Trial for Long Lesions (Long WRIST) StudiesCirculation 107: 1744-1749, 2003
[14] Waksman, R., Raizner, A.E., Yeung, A.C., Lansky, A.J. and Vandertie, L.Use of localised intracoronary beta radiation in treatment of in-stent restenosis: theINHIBIT randomised controlled trialLancet 359: 551-557, 2002
[15] Urban, P., Serruys, P., Baumgart, D., Colombo, A., Silber, S., Eeckhout, E., Gershlick,A., Wegscheider, K., Verhees, L. and Bonan, R.A multicentre European registry of intraluminal coronary beta brachytherapyEur.Heart J. 24: 604-612, 2003
[16] Verin, V., Popowski, Y., de Bruyne, B., Baumgart, D., Sauerwein, W., Lins, M., Kovacs,G., Thomas, M., Calman, F., Disco, C., Serruys, P.W. and Wijns, W.Endoluminal beta-radiation therapy for the prevention of coronary restenosis afterballoon angioplasty. The Dose-Finding Study GroupN.Engl.J.Med. 344: 243-249, 2001
[17] Raizner, A.E., Oesterle, S.N., Waksman, R., Serruys, P.W., Colombo, A., Lim, Y.L.,Yeung, A.C., van der Giessen, W.J., Vandertie, L., Chiu, J.K., White, L.R., Fitzgerald,P.J., Kaluza, G.L. and Ali, N.M.Inhibition of restenosis with beta-emitting radiotherapy: Report of the ProliferationReduction with Vascular Energy Trial (PREVENT)Circulation 102: 951-958, 2000
[18] King, S.B., III, Williams, D.O., Chougule, P., Klein, J.L., Waksman, R., Hilstead, R.,Macdonald, J., Anderberg, K. and Crocker, I.R.Endovascular beta-radiation to reduce restenosis after coronary balloon angioplasty:results of the beta energy restenosis trial (BERT)Circulation 97: 2025-2030, 1998
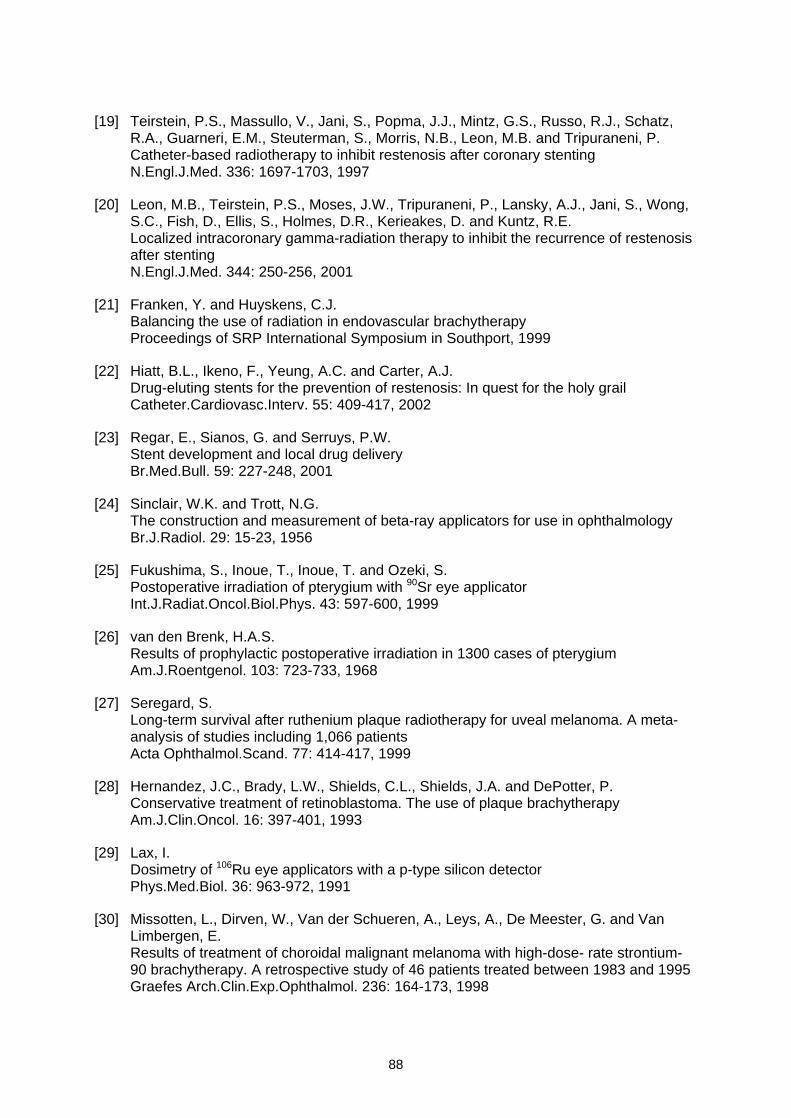
88
[19] Teirstein, P.S., Massullo, V., Jani, S., Popma, J.J., Mintz, G.S., Russo, R.J., Schatz,R.A., Guarneri, E.M., Steuterman, S., Morris, N.B., Leon, M.B. and Tripuraneni, P.Catheter-based radiotherapy to inhibit restenosis after coronary stentingN.Engl.J.Med. 336: 1697-1703, 1997
[20] Leon, M.B., Teirstein, P.S., Moses, J.W., Tripuraneni, P., Lansky, A.J., Jani, S., Wong,S.C., Fish, D., Ellis, S., Holmes, D.R., Kerieakes, D. and Kuntz, R.E.Localized intracoronary gamma-radiation therapy to inhibit the recurrence of restenosisafter stentingN.Engl.J.Med. 344: 250-256, 2001
[21] Franken, Y. and Huyskens, C.J.Balancing the use of radiation in endovascular brachytherapyProceedings of SRP International Symposium in Southport, 1999
[22] Hiatt, B.L., Ikeno, F., Yeung, A.C. and Carter, A.J.Drug-eluting stents for the prevention of restenosis: In quest for the holy grailCatheter.Cardiovasc.Interv. 55: 409-417, 2002
[23] Regar, E., Sianos, G. and Serruys, P.W.Stent development and local drug deliveryBr.Med.Bull. 59: 227-248, 2001
[24] Sinclair, W.K. and Trott, N.G.The construction and measurement of beta-ray applicators for use in ophthalmologyBr.J.Radiol. 29: 15-23, 1956
[25] Fukushima, S., Inoue, T., Inoue, T. and Ozeki, S.Postoperative irradiation of pterygium with 90Sr eye applicatorInt.J.Radiat.Oncol.Biol.Phys. 43: 597-600, 1999
[26] van den Brenk, H.A.S.Results of prophylactic postoperative irradiation in 1300 cases of pterygiumAm.J.Roentgenol. 103: 723-733, 1968
[27] Seregard, S.Long-term survival after ruthenium plaque radiotherapy for uveal melanoma. A meta-analysis of studies including 1,066 patientsActa Ophthalmol.Scand. 77: 414-417, 1999
[28] Hernandez, J.C., Brady, L.W., Shields, C.L., Shields, J.A. and DePotter, P.Conservative treatment of retinoblastoma. The use of plaque brachytherapyAm.J.Clin.Oncol. 16: 397-401, 1993
[29] Lax, I.Dosimetry of 106Ru eye applicators with a p-type silicon detectorPhys.Med.Biol. 36: 963-972, 1991
[30] Missotten, L., Dirven, W., Van der Schueren, A., Leys, A., De Meester, G. and VanLimbergen, E.Results of treatment of choroidal malignant melanoma with high-dose- rate strontium-90 brachytherapy. A retrospective study of 46 patients treated between 1983 and 1995Graefes Arch.Clin.Exp.Ophthalmol. 236: 164-173, 1998
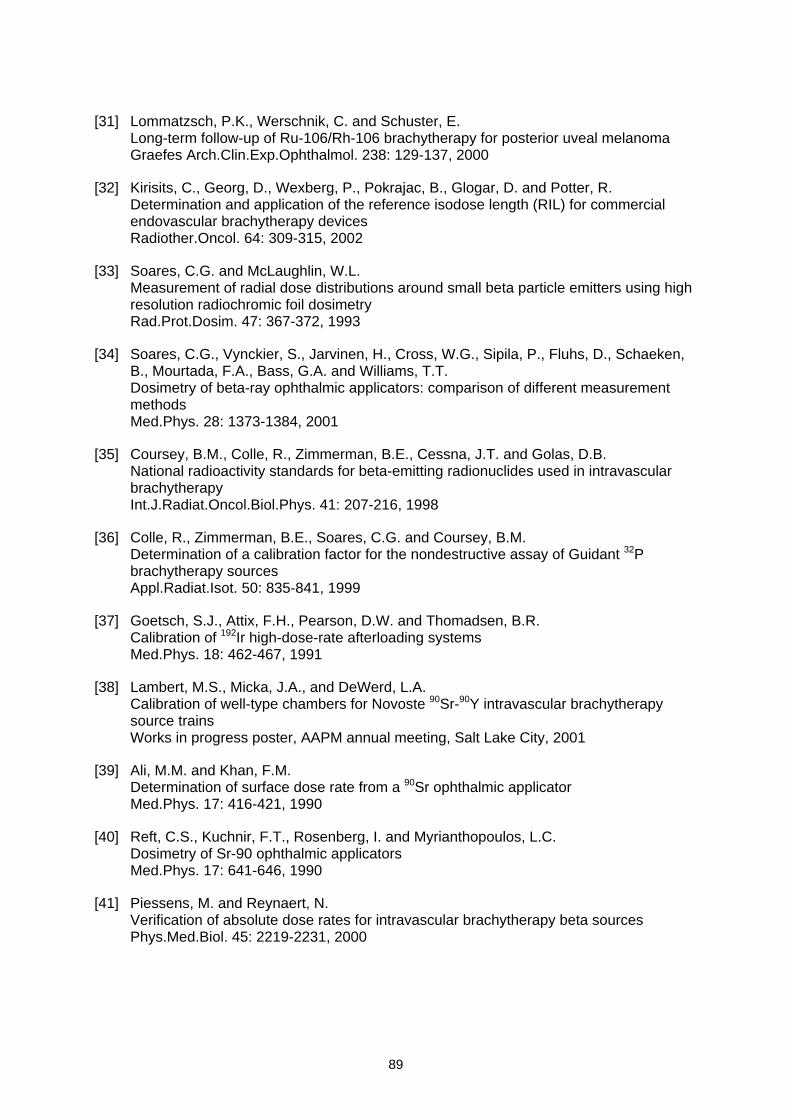
89
[31] Lommatzsch, P.K., Werschnik, C. and Schuster, E.Long-term follow-up of Ru-106/Rh-106 brachytherapy for posterior uveal melanomaGraefes Arch.Clin.Exp.Ophthalmol. 238: 129-137, 2000
[32] Kirisits, C., Georg, D., Wexberg, P., Pokrajac, B., Glogar, D. and Potter, R.Determination and application of the reference isodose length (RIL) for commercialendovascular brachytherapy devicesRadiother.Oncol. 64: 309-315, 2002
[33] Soares, C.G. and McLaughlin, W.L.Measurement of radial dose distributions around small beta particle emitters using highresolution radiochromic foil dosimetryRad.Prot.Dosim. 47: 367-372, 1993
[34] Soares, C.G., Vynckier, S., Jarvinen, H., Cross, W.G., Sipila, P., Fluhs, D., Schaeken,B., Mourtada, F.A., Bass, G.A. and Williams, T.T.Dosimetry of beta-ray ophthalmic applicators: comparison of different measurementmethodsMed.Phys. 28: 1373-1384, 2001
[35] Coursey, B.M., Colle, R., Zimmerman, B.E., Cessna, J.T. and Golas, D.B.National radioactivity standards for beta-emitting radionuclides used in intravascularbrachytherapyInt.J.Radiat.Oncol.Biol.Phys. 41: 207-216, 1998
[36] Colle, R., Zimmerman, B.E., Soares, C.G. and Coursey, B.M.Determination of a calibration factor for the nondestructive assay of Guidant 32Pbrachytherapy sourcesAppl.Radiat.Isot. 50: 835-841, 1999
[37] Goetsch, S.J., Attix, F.H., Pearson, D.W. and Thomadsen, B.R.Calibration of 192Ir high-dose-rate afterloading systemsMed.Phys. 18: 462-467, 1991
[38] Lambert, M.S., Micka, J.A., and DeWerd, L.A.Calibration of well-type chambers for Novoste 90Sr-90Y intravascular brachytherapysource trainsWorks in progress poster, AAPM annual meeting, Salt Lake City, 2001
[39] Ali, M.M. and Khan, F.M.Determination of surface dose rate from a 90Sr ophthalmic applicatorMed.Phys. 17: 416-421, 1990
[40] Reft, C.S., Kuchnir, F.T., Rosenberg, I. and Myrianthopoulos, L.C.Dosimetry of Sr-90 ophthalmic applicatorsMed.Phys. 17: 641-646, 1990
[41] Piessens, M. and Reynaert, N.Verification of absolute dose rates for intravascular brachytherapy beta sourcesPhys.Med.Biol. 45: 2219-2231, 2000
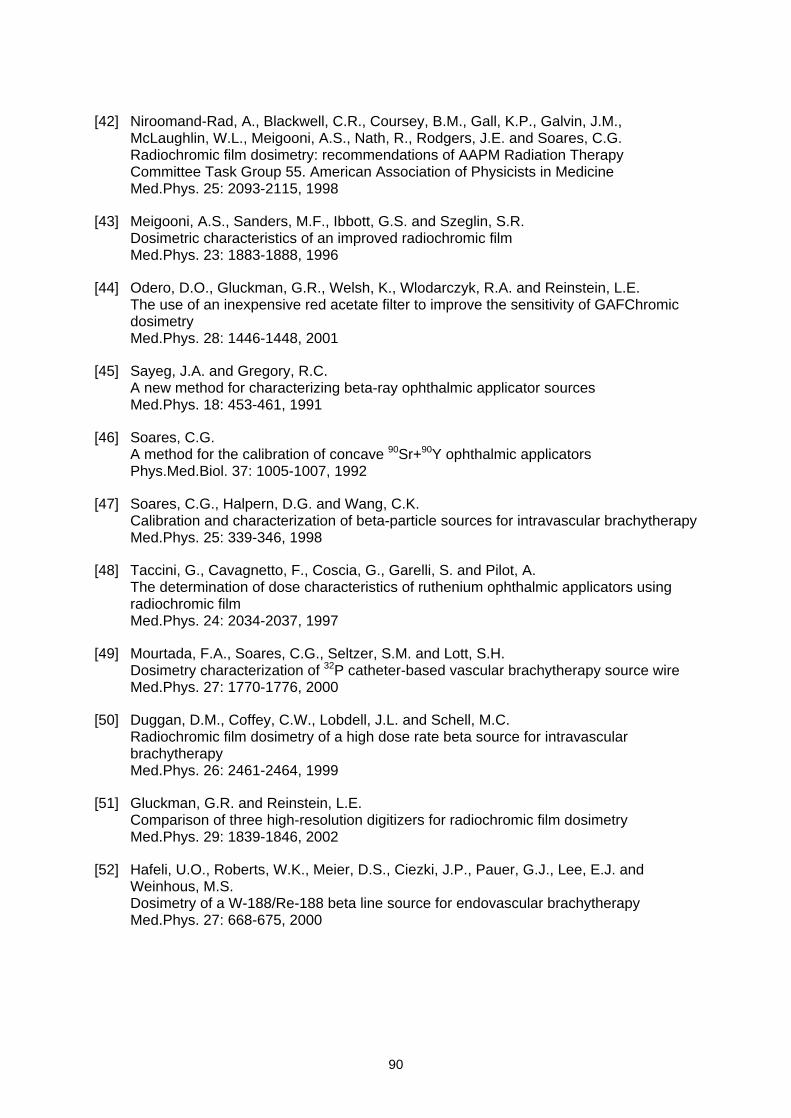
90
[42] Niroomand-Rad, A., Blackwell, C.R., Coursey, B.M., Gall, K.P., Galvin, J.M.,McLaughlin, W.L., Meigooni, A.S., Nath, R., Rodgers, J.E. and Soares, C.G.Radiochromic film dosimetry: recommendations of AAPM Radiation TherapyCommittee Task Group 55. American Association of Physicists in MedicineMed.Phys. 25: 2093-2115, 1998
[43] Meigooni, A.S., Sanders, M.F., Ibbott, G.S. and Szeglin, S.R.Dosimetric characteristics of an improved radiochromic filmMed.Phys. 23: 1883-1888, 1996
[44] Odero, D.O., Gluckman, G.R., Welsh, K., Wlodarczyk, R.A. and Reinstein, L.E.The use of an inexpensive red acetate filter to improve the sensitivity of GAFChromicdosimetryMed.Phys. 28: 1446-1448, 2001
[45] Sayeg, J.A. and Gregory, R.C.A new method for characterizing beta-ray ophthalmic applicator sourcesMed.Phys. 18: 453-461, 1991
[46] Soares, C.G.A method for the calibration of concave 90Sr+90Y ophthalmic applicatorsPhys.Med.Biol. 37: 1005-1007, 1992
[47] Soares, C.G., Halpern, D.G. and Wang, C.K.Calibration and characterization of beta-particle sources for intravascular brachytherapyMed.Phys. 25: 339-346, 1998
[48] Taccini, G., Cavagnetto, F., Coscia, G., Garelli, S. and Pilot, A.The determination of dose characteristics of ruthenium ophthalmic applicators usingradiochromic filmMed.Phys. 24: 2034-2037, 1997
[49] Mourtada, F.A., Soares, C.G., Seltzer, S.M. and Lott, S.H.Dosimetry characterization of 32P catheter-based vascular brachytherapy source wireMed.Phys. 27: 1770-1776, 2000
[50] Duggan, D.M., Coffey, C.W., Lobdell, J.L. and Schell, M.C.Radiochromic film dosimetry of a high dose rate beta source for intravascularbrachytherapyMed.Phys. 26: 2461-2464, 1999
[51] Gluckman, G.R. and Reinstein, L.E.Comparison of three high-resolution digitizers for radiochromic film dosimetryMed.Phys. 29: 1839-1846, 2002
[52] Hafeli, U.O., Roberts, W.K., Meier, D.S., Ciezki, J.P., Pauer, G.J., Lee, E.J. andWeinhous, M.S.Dosimetry of a W-188/Re-188 beta line source for endovascular brachytherapyMed.Phys. 27: 668-675, 2000
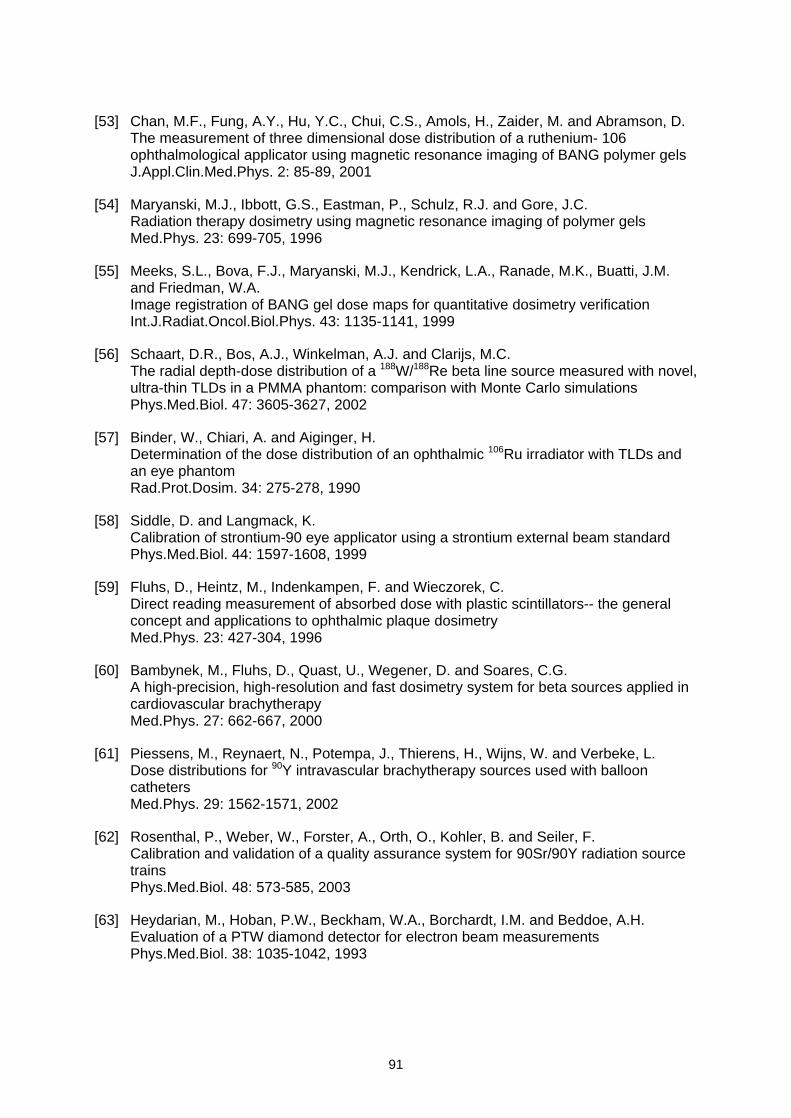
91
[53] Chan, M.F., Fung, A.Y., Hu, Y.C., Chui, C.S., Amols, H., Zaider, M. and Abramson, D.The measurement of three dimensional dose distribution of a ruthenium- 106ophthalmological applicator using magnetic resonance imaging of BANG polymer gelsJ.Appl.Clin.Med.Phys. 2: 85-89, 2001
[54] Maryanski, M.J., Ibbott, G.S., Eastman, P., Schulz, R.J. and Gore, J.C.Radiation therapy dosimetry using magnetic resonance imaging of polymer gelsMed.Phys. 23: 699-705, 1996
[55] Meeks, S.L., Bova, F.J., Maryanski, M.J., Kendrick, L.A., Ranade, M.K., Buatti, J.M.and Friedman, W.A.Image registration of BANG gel dose maps for quantitative dosimetry verificationInt.J.Radiat.Oncol.Biol.Phys. 43: 1135-1141, 1999
[56] Schaart, D.R., Bos, A.J., Winkelman, A.J. and Clarijs, M.C.The radial depth-dose distribution of a 188W/188Re beta line source measured with novel,ultra-thin TLDs in a PMMA phantom: comparison with Monte Carlo simulationsPhys.Med.Biol. 47: 3605-3627, 2002
[57] Binder, W., Chiari, A. and Aiginger, H.Determination of the dose distribution of an ophthalmic 106Ru irradiator with TLDs andan eye phantomRad.Prot.Dosim. 34: 275-278, 1990
[58] Siddle, D. and Langmack, K.Calibration of strontium-90 eye applicator using a strontium external beam standardPhys.Med.Biol. 44: 1597-1608, 1999
[59] Fluhs, D., Heintz, M., Indenkampen, F. and Wieczorek, C.Direct reading measurement of absorbed dose with plastic scintillators-- the generalconcept and applications to ophthalmic plaque dosimetryMed.Phys. 23: 427-304, 1996
[60] Bambynek, M., Fluhs, D., Quast, U., Wegener, D. and Soares, C.G.A high-precision, high-resolution and fast dosimetry system for beta sources applied incardiovascular brachytherapyMed.Phys. 27: 662-667, 2000
[61] Piessens, M., Reynaert, N., Potempa, J., Thierens, H., Wijns, W. and Verbeke, L.Dose distributions for 90Y intravascular brachytherapy sources used with ballooncathetersMed.Phys. 29: 1562-1571, 2002
[62] Rosenthal, P., Weber, W., Forster, A., Orth, O., Kohler, B. and Seiler, F.Calibration and validation of a quality assurance system for 90Sr/90Y radiation sourcetrainsPhys.Med.Biol. 48: 573-585, 2003
[63] Heydarian, M., Hoban, P.W., Beckham, W.A., Borchardt, I.M. and Beddoe, A.H.Evaluation of a PTW diamond detector for electron beam measurementsPhys.Med.Biol. 38: 1035-1042, 1993
92
[64] Vatnitsky, S. and Jarvinen, H.Application of a natural diamond detector for the measurement of relative dosedistributions in radiotherapyPhys.Med.Biol. 38: 173-184, 1993
[65] ICRU (International Commission on Radiation Units and Measurements)Dosimetry of External Beta Rays for Radiation ProtectionICRU Report 56, Bethesda, MD, USA, 1997
[66] Rikner, G. and Grusell, E.General specifications for silicon semiconductors for use in radiation dosimetryPhys.Med.Biol. 32: 1109-1117, 1987
[67] Davelaar, J., Schaling, D.F., Hennen, L.A. and Broerse, J.J.Dosimetry of ruthenium-106 eye applicatorsMed.Phys. 19: 691-694, 1992
[68] Schaeken, B. and Scalliet, P.One year of experience with alanine dosimetry in radiotherapyAppl.Radiat.Isot. 47: 1177-1182, 1996
[69] Pruit, J.S., Soares, C.G., and Ehrlich, M.Calibration of beta-particle radiation instrumentation and sources.NBS Special publication 250-21, 1988
[70] Soares, C.G.Calibration of ophthalmic applicators at NIST: a revised approachMed.Phys. 18: 787-793, 1991
[71] Cross, W.G.Variation of beta dose attenuation in different mediaPhys.Med.Biol. 13: 611-618, 1968
[72] Schaart, D.R.The scaling method applied to beta particle line sources with a finite diameterMed.Phys. 29: 2682-2686, 2002
[73] Hall, E.J., Miller, R.C. and Brenner, D.J.Radiobiological principles in intravascular irradiationCardiovascular Radiation Medicine 1: 42-47, 1999
[74] Beyer, D.C.Pterygia: single-fraction postoperative beta irradiationRadiology 178: 569-571, 1991
[75] Reinstein, L.E., Gluckman, G.R., Pai, S., and Meek, A.Post-irradiation dependence of radiochromic film optical density on temperature andtimeMed.Phys. 24: 1005, 1997
[76] Zhu, Y., Kirov, A.S., Mishra, V., Meigooni, A.S. and Williamson, J.F.Quantitative evaluation of radiochromic film response for two- dimensional dosimetryMed.Phys. 24: 223-231, 1997
93
[77] Firestone, R.B.Table of IsotopesEighth Edition, New York, 1996
[78] Kocher, D.C.Radioactive decay data tablesReport DOE/TIC-11026, U.S. Department of Energy, Washington, D.C., 1981
[79] IAEA (International Atomic Energy Agency)Absorbed dose determination in external beam radiotherapy - An international code ofpractice for dosimetry based on standards of absorbed dose to water -Technical Reports series no. 398, Vienna, 2000
94
Publications of the Netherlands Commission on Radiation Dosimetry
Radiation dosimetry activities in the Netherlands.Inventory compiled under the auspices of the Netherlands Commission for RadiationDosimetry.NCS Report 1, July 1986.
n.a.
Code of practice for the dosimetry of high-energy photon beams.NCS Report 2, December 1986.
n.a.
Proceedings of the Symposium on Thermoluminescence Dosimetry.NCS Report 3, October 1988.
n.a.
Aanbevelingen voor dosimetrie en kwaliteitscontrole van radioactieve bronnen bijbrachytherapieNCS Report 4, Februari 1989 (in Dutch).
n.a.
Recommendations for dosimetry and quality control of radioactive sources used inbrachytherapy.Synopsis (in English) of NCS Report 4, February 1991.
n.a.
Code of practice for the dosimetry of high-energy electron beams.NCS Report 5, December 1989.
n.a.
Dosimetric aspects of Mammography.NCS Report 6, March 1993.
n.a
Recommendations for the calibration of Iridium-192 high dose rate sources.NCS Report 7, December 1994.
12,50
Kwaliteitscontrole van Medische Lineaire Versnellers, methoden voor kwaliteitscontrole,wenselijke toleranties en frequenties.NCS Report 8, December 1995 (in Dutch).
12,50
Quality Control of Medical Linear Accelerators, current practice and minimum requirements.NCS Report 9, August 1996.
12,50
Dosimetry of low and medium energy x-rays, a code of practice for use in radiotherapy andradiobiology.NCS Report 10, July 1997.
12,50
Quality Control of Simulators and CT scanners and some basic QC methods for TreatmentPlanning Systems, current practice and minimum requirements.NCS Report 11, September 1997.
12,50
Determination and use of scatter correction factors of megavoltage photon beams,measurement and use of collimator and phantom scatter correction factors of arbitrarilyshaped fields with a symmetrical collimator setting.NCS Report 12, March 1998.
15,00
Quality Assurance in Brachytherapy.NCS Report 13, October 2000.
15,00

95
From outside The Netherlands, please complete the order form below.
ORDER FORM
Please send this completed order form to:
NCS secretary, P.O.Box 654, 2600 AR DELFT, The Netherlands
QTY REPORT TITLE COST
.......
.......
.......
.......
...............
...............
...............
...............
....................
....................
....................
....................
Subtotal ....................
Add postage and packing (Europe 10,-, outside Europe 15,-) ....................
Total ....................
Payment by: Cheque/postal order* made payable to Netherlands Commission on Radiation Dosimetry
(add 7,50,- for banking costs)
Please charge my Eurocard/Mastercard
Credit card No................................................................................................
Expiry date .....................................................................................................
Name: .......................................................................................................................................
Address: .......................................................................................................................................
.......................................................................................................................................
Date:
.......
Signature:
.......................................................................................................................................
* please delete as applicable
For more information, see: http://www.ncs-dos.org/
This document was created with Win2PDF available at http://www.daneprairie.com.The unregistered version of Win2PDF is for evaluation or non-commercial use only.