Embed Size (px)
Citation preview

Navy Personnel Research and Development CenterSan Diego, California 92152-7250 TN-96-17 February 1996
Quality of Life for Marines atCamp Lejeune
Herbert George BakerDavid W. Robertson
Leif Christiansen
19960301 087Approved for public release; distribution is unlimited.

NPRDC-TN-96-17 February 1996
Quality of Life for Marinesat Camp Lejeune
Herbert George BakerDavid W. Robertson
Leif Christiansen
Reviewed byJoyce Shettel Dutcher
Approved and released byKathleen Moreno
DirectorPersonnel and Organizational Assessment
Approved for public release;distribution is unlimited
Navy Personnel Research and Development CenterSan Diego, CA 92152-7250

REPORT DOCUMENTATION PAGE Oo. ,704v18
Public reporting burden for this collection of information Is estimated to average 1 hour per response, Including the time for reviewing instructions, searching existing datasources, gathering and maintaining the data needed, and completing and reviewing the collection of Information. Send comments regarding this burden estimate or any otheraspect of this collection of Information, including suggestions for reducing this burden, to Washington Headquarters Services, Directorate for Information Operations andReports, 1215 Jefferson Davis Highway, Suite 1204, Arlington, VA 22202-4302, and to the Office of Management and Budget, Paperwork Reduction Project (0704-0188),Washington, DC 20503.
1. AGENCY USE ONLY (Leave blank) 2. REPORT DATE 3. REPORT TYPE AND DATE COVEREDJanuary 1996 Final--1993
4. TITLE AND SUBTITLE 5. FUNDING NUMBERSQuality of Life for Marines at Camp Lejeune Program Element: 0602131M
Project: CP31P14
6. AUTHOR(S)Herbert George Baker, David W. Robertson, Leif Christiansen
7. PERFORMING ORGANIZATION NAME(S) AND ADDRESS(ES) 8. PERFORMING ORGANIZATIONNavy Personnel Research and Development Center REPORT NUMBER53335 Ryne Road NPRDC-TN-96-San Diego, CA 92152-7250
9. SPONSORING/MONITORING AGENCY NAME(S) AND ADDRESS(ES) 10. SPONSORING/MONITORINGAGENCY REPORT NUMBER
11. SUPPLEMENTARY NOTESFunctional Area: Organizational SystemsProduct Line: Organizational Systems EvaluationProduct Line: Quality of Life
12a. DISTRIBUTION/AVAILABILITY STATEMENT 12b. DISTRIBUTION CODE
Approved for public'release; distribution is unlimited. A
13. ABSTRACT (Maximum 200 words)
A comprehensive assessment of Quality of Life (QOL) in the Marine Corps, using a life domain framework, in which wereincluded the domains of residence, neighborhood, leisure and recreation, health, friends and friendships, marriage/intimaterelationship, relations with children, relations with other relatives, income/standard of living, job, and self, was conducted in1993. This report focuses on data for Camp Lejeune only. Global quality of life was shown to have significant effects onorganizational outcomes. Junior enlisted personnel were more negative on all measures of global QOL. Detailed discussions ofeach life domain are included.
14. SUBJECT TERMS 15. NUMBER OF PAGESQuality of life, surveys, military research 143
16. PRICE CODE
17. SECURITY CLASSIFICATION 18. SECURITY CLASSIFICATION 19. SECURITY CLASSIFICATION 20. LIMITATION OF ABSTRACTOF REPORT OF THIS PAGE OF ABSTRACT
UNCLASSIFIED UNCLASSIFIED UNCLASSIFIED UNLIMITED
NSN 7540-01-280-5500 Standard Form 298 (Rev. 2-89)Prescribed by ANSI Std. Z39-18298-102

Foreword
The research reported herein was funded by the Marine Corps Systems Command (Code AWT)under Program Element 0602131M, Project CP31P14, Task 1. The objective of the work was toconduct a baseline assessment of Quality of Life (QOL) in the Marine Corps. Results of the MarineCorps-wide assessment have been reported in NPRDC-TR-95-4 Quality of Life in the U. S. MarineCorps. This report, and its accompanying volume (NPRDC-TR-96-XX Statistical Tables for theMarine Corps Quality of Life Survey, Camp Lejeune), amplify that basic document, focusing onQOL assessments for Camp Lejeune. Questions regarding the material in this report should bedirected to Dr. Herbert Baker, Organizational Assessment and Development Division (619-553-7639; DSN 553-7639).
KATHLEEN MORENODirector, Personnel and Organizational Assessment
v

Executive Summary
The military services are increasingly concerned with the quality of life of their members. Thisconcern stems largely from a basic desire of military leaders to care for those in their charge, aconcern for the well being of those who may be called upon at any time to place their lives injeopardy in the defense of their country.
Such concern is exacerbated by substantive social and economic changes which have takenplace in recent years. The emergence of the all-volunteer force, coupled with a decline in thepopulation of eligible recruits, force the armed services into intense competition not only amongthemselves, but also with industry and academia. In addition, today's youth tend to be bettereducated as well as better informed of their vocational and career options. The rise of consumerismand the elevation of expectations regarding life's necessities and personal entitlements also focusattention on QOL. Finally, sophisticated, technologically advanced equipment and weaponrydemand highly skilled operators, even as the uncertainties and ambiguities of late-20th Centurydaily life demand motivated and dedicated organizational members.
The concern for Quality of Life, thus, is impelled both by the Marine tradition of "caring forour own," and the ever-present need for competent, highly motivated, personnel, always in a highstate of readiness. The result: immense investments of fiscal, personnel, and temporal resources insupport of enhanced QOL.
Quality of Life in the U. S. Marine Corps (Kerce, 1995) is the master report wherein the resultsof the Marine Corps-wide QOL assessment are reported. The present report amplifies results of theMarine Corps-wide QOL assessment, focusing on data from Camp Lejeune only.
Approach
The Marine Corps-wide QOL study produced data collected from a worldwide, representativesample of Marines (excluding only E-ls) who had been randomly selected to receive the QOLsurvey (refer to Kerce, 1995). Data for use in these site-specific analyses were extracted from thatdatabase. Analyses were performed using the Statistical Package for the Social Sciences (SPSS-X).
A total of 1,462 questionnaires were distributed to Marines stationed at Camp Lejeune. Onethousand one hundred twenty-seven (1,127) completed questionnaires were received by the cutoffdate and usable in the database, for an effective response rate of 77.1 percent. (For details, refer toKerce, 1995:29-30.)
Sample Characteristics
More than nine out of ten respondents (95.2%) were male, versus 4.8 percent female. Almostsix out of ten respondents (59.4%) were in the 21-25 (47.9%) and 26-30 (11.5%) age categories.The overwhelming majority (95.2%) of the sample were 35 years of age or less, and the averageage was 24.5 years. With respect to racial characteristics, 70.7 percent were White, 17.0 percentBlack, 9.9 percent were Asian or Pacific Islander, and 2.4 percent were Native American or Aleut(10.0 percent claimed Hispanic descent).
vii

Only three percent (3.2%) of the Marines in this sample had below a high school graduateeducation. One third (32.5%) had at least some college. Of the respondents in the sample, 46.5percent were married, 47.6 percent had never been married, and 5.9 percent were separated ordivorced. More than half (55.1%) of the Camp Lejeune Marines responding to the survey had nodependents, 3.8% were accompanied by some of their dependents, 32.7% by all of theirdependents. Four percent (4.3%) were temporarily unaccompanied, 3.4 percent were permanentlyunaccompanied by choice, 0.7 percent as a billet requirement. There were 202 respondents whowere married geographical bachelors, the most common reasons being personal preference andcost of living.
Fewer than one-third (27.9%) of those surveyed said they had dependent children living withthem; 9.4 percent had dependent children living elsewhere. Few (8.8%) of the responding Marineshad a military spouse. With respect to spousal employment other than by the military, 6.4 percentsaid their spouses were self-employed at home, 17.7 percent had spouses holding part-time civilianjobs, and spouses of 24.1 percent were full-time civilian workers. Twenty-two percent (22.3%) hadspouses who were unemployed by choice, 20.6 percent had spouses who were unemployed butlooking for work.
As would be expected, the largest grouping was in the E-2--E-3 category at 48.2 percent,followed by the E-4--E-5s, at 30.9 percent. Four percent (4.1%) of the total sample were O-1--O-3,1.6 percent 0-4 or higher. Length of time in current paygrade ranged from 0 to 144 months, withan average of 19.1 months. Average length of service was 5.0 years, with a range of from 0 to 28years. Approximately four out of ten (44.4%) had less than three years tenure in the Marine Corps.Zero to 92 months was the range for time at present assignment, with an average of 16.8 months.One-half of those responding (50.8%) had been on their present assignment 13 months or less.Eighteen persons (1.6%) said they were deployed at the time of the survey. A wide array of MarineCorps Military Occupational Specialties (MOS) was included in the sample, with clusters ofrespondents in particular MOSs relevant to ground combat.
Findings
In the Marine Corps Quality of Life Survey, information was elicited from respondents withrespect to 11 "domains": residence, neighborhood, leisure and recreation, health, friends andfriendships, marriage/intimate relationship, relationships with one's children, relationships withother relatives, income and standard of living, job, and self. Information varies by domain.However, affective assessments, cognitive assessments, objective descriptions, and salienceindications are included for each domain.
Also included in the report are analyses with respect to global quality of life, and therelationship between quality of life and organizational outcomes (readiness, retention, andperformance).
Summary of the Residence Domain
For the Marines at Camp Lejeune, type of housing was found to be a powerful determinant ofaffective evaluation of the residence and of satisfaction with residence overall. Those living inBOQ/BEQ have the least control over many aspects of their living quarters, and they tended to be
viii

much less satisfied with their residence than were those living in military housing; civilian housingresidents, whether they owned or rented, were most satisfied of all. Bachelor quarters residents alsotended to compare their current housing less favorably with childhood home, but about equallywith military housing residents on the kind of housing they might be enjoying if they were not inthe Marine Corps. Other than with cost, bachelor quarters residents were least satisfied on allfactors of residence. After all, their comparison, at best, is between their room (or shared suite) andan actual apartment or a house. Not unexpectedly, their lowest satisfaction was with privacy andspace, the highest, such as it was, with cost and location.
Marines living in military housing were more satisfied with their residences than were bachelorquarters residents. Members of this subgroup (military housing) were most satisfied with locationand cost, least with space and privacy.
Marines living in civilian housing were most satisfied with the space and privacy of theirresidences. Lowest satisfaction for this subgroup was with cost.
In general, there were no high levels of satisfaction with housing in the Camp Lejeune sample.On the seven-point scale of overall satisfaction (seven being high), the top indicator was found tobe 5.2; for a facet satisfaction (again with a seven-point scale) the top was 5.5 (satisfaction withthe location of the residence). Both highpoints of satisfaction were found among the residents ofcivilian housing.
Summary of the Neighborhood Domain
Overall satisfaction with neighborhood among Camp Lejeune Marines was not all that positive,with a mean (4.8) approaching the "somewhat satisfied" range. As would be expected, assessmentsof the neighborhood domain were influenced by type of housing. Again, BOQ/BEQ residents werethe least positive in their assessments in almost every case. As was true in the case of residence,satisfaction tends to increase with rank group, and married Marines tend to be more satisfied thanthose never having been married.
Satisfaction ratings were low (in tenth place) for sense of community among all three housingsubgroups; also ranking low in satisfaction for civilian community residents were transportationand commuting time to work. Marines living in BOQ/BEQ rated time to work and safety highestin facet satisfaction; for military housing residents, top satisfiers were time to work and racial mix.Top satisfiers for Marines living out in the civilian community were parking and public services.
Respondents comparing their current neighborhoods to those they might be living in were theynot in the Marine Corps were fairly positive. By subgroup, BOQ/BEQ residents were actuallyhighest on this measure. Substantial numbers of Marines in all three types of housing rated theircurrent neighborhoods as worse than those neighborhoods in which they grew up. Comparingcurrent neighborhood with those of their peers, civilian housing residents gave the most favorablerating, BOQ/BEQ residents the least favorable; however, with respect to all three housing types,the most common response choice was that their neighborhood and those of their peers were aboutequal.
ix

Results of a series of multiple regression procedures showed that, for BOQ/BEQ residents,appearance was the strongest predictor of overall satisfaction; for Marines living in civilianhousing, the top predictor was safety, and for military housing residents, it was condition of otherdwellings. In turn, regardless of housing type, overall satisfaction was the most powerful predictorof positive feelings about the neighborhood.
Summary of the Leisure and Recreation Domain
Responses to the questions in this section of the survey show that the Marines at Camp Lejeunetended to feel fairly positively about their leisure. Positive feelings increased with rank, and Whitesand Hispanics were more positive than were Blacks or Others. Overall satisfaction with leisure andrecreation was close to neutral, neither satisfied nor dissatisfied. With only a few exceptions (e.g.,dining out, movies) personal interest and preference account more for non-participation than anyother reason. Not surprisingly, single Marines frequent the bars and clubs more than their marriedcounterparts. For most of the women and men in the sample, current leisure compares veryfavorably with potential leisure as civilians, but not too with the leisure they might be enjoying ifstationed elsewhere in the Marine Corps.
Summary of the Health Domain
Few of the Marines at Camp Lejeune (11.3%) reported feeling negative about the state of theirhealth. In fact, three out of four (76.9%) said they were "pleased" to "delighted" about their health.There were no subgroup differences for gender or race. However, senior enlisted were morepositive about health than junior enlisted, junior officers were more positive than senior; and,married were most positive, never married least, and formerly married in the middle. As would beexpected, non-smokers and higher performers on the PFT tended to feel better about their state ofhealth.
Mean overall satisfaction with health was 5.30, with 75.3 percent expressing some degree ofsatisfaction with their health. As with the affective measure, non-smokers, high scorers on the PFT,and higher ranked individuals scored higher as well on the cognitive evaluation, i.e., overallsatisfaction with health. Endurance and energy level were most highly correlated with overallsatisfaction.
Mean satisfaction with both medical care (4.54) and dental care (4.58) was moderate. Therewas no relationship between driving time to nearest military medical facility and overallsatisfaction with health.
In this sample of Camp Lejeune Marines, almost four out of ten (38.5%) carried CHAMPUSsupplemental insurance. For dependent health care, military medical facilities were used mostoften, followed by CHAMPUS. Highest satisfaction for medical care went to private fee for serviceand military medical facilities, whereas for dependent dental care, it was private fee for service andgroup fee for service. No relationship was found between overall satisfaction and source oftreatment received by dependents. Respondents expressed somewhat less satisfaction with medicaland dental care for their dependents than for themselves.
x

The best predictor of overall satisfaction with health was satisfaction with endurance. Bestpredicting positive affective evaluation of personal health was overall satisfaction with personalhealth.
Summary of the Friends and Friendships Domain
Almost three out of four of these Camp Lejeune Marines (69.4%) felt positive about theirfriendships. An even higher percentage (72.7%) expressed overall satisfaction with this area oftheir lives. Support and encouragement received from friends most closely correlated with overallsatisfaction, and, of the four facet satisfactions, that one received the highest mean satisfactionscore.
Half (54.3%) of those in the sample had for their closest friends civilians in the local area and* fellow Marines at Camp Lejeune, and 77.4 percent of the respondents had friends in the local areawith whom they could discuss personal matters, usually at their own or their friend's residence.Most felt that making friends as a Marine and as a civilian had about equal difficulty or that it waseasier as a Marine. Half said they had about as many friends as did other Marines.
This domain showed moderate salience. The four facet satisfactions were the best predictors ofoverall satisfaction, and overall satisfaction was the best predictor of positive feelings about friendsand friendships.
Summary of the Marriage and Intimate Relationships Domain
Principal subgroups used for the analyses in this domain were married, involved in an intimaterelationship, and uninvolved. The uninvolved made up 31.7 percent of the sample. They weremostly young, junior enlisted and officer personnel, the majority of whom had never been married.
More than half the respondents felt positive about their relationship, whereas about one in fourfelt unhappy with their relationship situation. Younger Marines were lowest in affectiveassessment. Race and gender failed to account for any significant subgroup differences. MarriedMarines felt better about relationships than did those not having a relationship. Length of time inthe relationship seemed to make little difference in feelings about the relationship.
With respect to overall satisfaction in this domain, eight out of ten chose responses on thepositive end of the scale. The facet satisfaction most closely correlated with overall satisfactionwas satisfaction with the love and understanding received.
Summary of the Relationships with Children Domain
More than half the respondents (55.7%) indicated they were "pleased" or "mostly pleased"about their relationships with their children who were living with them. An even higher percentage(71.5%) indicated they were "pleased" with their relationships with the children who were notliving with them.
Approximately three out of four (75.7%) said they were somewhat to completely satisfied inthis domain. Of the several facet satisfactions, satisfaction with quality of time spent with childrenwas most closely linked to overall satisfaction. Least correlated with overall satisfaction was
xi

activities available for the children. Many of the respondents, both married (46.2%) and singleparents (74.6%) expressed some degree of dissatisfaction with the amount of time they spent withtheir children, and both single (85.2%) and married (78.7%) parents thought they would be able tospend more time with their children if they were civilians.
Overall satisfaction with the schools their children were attending was moderate. Thoseutilizing DoD schools showed the highest satisfaction, followed by those using public schools.
Married parents most often indicated that it was their spouse who cared for the children day today, and who would also be providing care during long-term absences such as deployments. Theresponses in both areas by single parents showed much more variation, and single parents were lessconfident of the care their children were and would be receiving.
Six out of ten respondents (66.1%) thought their relationships with their children would bebetter if they were civilians. Comparing their own situation with that of other Marines, 44.8 percentfelt the two were about equal.
Feelings about this domain (the D-T scale) cannot be predicted very well by the variablesprovided by this section of the survey. Somewhat better prediction is possible in the case of overallsatisfaction with this domain (the cognitive evaluation).
Summary of the Relationships with Other Relatives Domain
Most of these Camp Lejeune Marines provided positive assessments--both affective andcognitive--of this domain. Few subgroup differences were found with respect to either of theseoverall assessments.
Relatives' respect for the respondent's independence, and relatives' support for therespondent's military career were the facet satisfactions most highly correlated with overallsatisfaction.
Six out of ten felt that relationships with their relatives would be better if they were not in theMarine Corps. Younger Marines, junior enlisted and officer, and those whose relatives werefarthest away tended to feel this way more than their older, higher ranking contemporaries, or thosewith relatives in the nearby area.
Relatively high salience was found for this domain. However, salience, that is, thinking oftenof relatives, showed no significant correlation with feelings about this domain and only a veryweak inverse one with overall domain satisfaction.
Summary of the Income and Standard of Living Domain
Contentment with income and standard of living was rather low. Both affective and cognitiveevaluations had mean scores below the midpoint (4.0) of their respective scales, 3.82 and 3.66,respectively. As would be expected, feelings about income and standard of living vary with rankand age, and positive evaluation increased linearly with both age and rank. Women were morepositive than men on the affective evaluation. Cognitive evaluation differences by subgroup werevery similar.
xii

Only 5.1 percent of those sampled were holding second jobs, with another 15.1 percent activelysearching for one. Spouses contributed to the family's income in 28.0 percent of the cases.
Most closely correlated with overall domain satisfaction was satisfaction with money availablefor extras. Income and standard of living showed very high salience. Both the commissary and theexchange helped seven out of ten of the Marines, although neither received an exceptionally strongendorsement. Adverse financial events had occurred for 15.3 percent of the respondents.
In social comparisons, 54.8 percent thought they were better off financially than they would beas civilians, and 48.3 percent felt they were about as well off as their Marine peers.
Summary of the Marine Corps Job Domain
Neither affective nor cognitive evaluation of the work domain was very positive, with meanscores for both evaluations hovering about the midpoint of their respective scales. Marriedpersonnel were the most positive about their Marine Corps jobs, and both affective and cognitiveevaluations became more positive with increasing age of the respondents. Neither race nor genderaccounted for significant differences. Feelings about job and overall satisfaction correlatedpositively at .69.
Of the facet satisfaction items, highest mean satisfaction was shown for amount ofresponsibility on the job and feeling of accomplishment; lowest was for pay and benefits andopportunity for personal growth and development. Satisfaction with feeling of accomplishmentwas most closely correlated with overall satisfaction.
The Camp Lejeune Marines sampled reported working from 20 to 120 hours per week,although figures on both ends of the distribution must be questioned. Mean overall satisfaction washighest for those working 40-49 hours per week, lowest for those working 70-79 hours per week.
A measure of person-environment fit was used, and the results showed that, on average, theMarine Corps jobs were deficient in each of five job characteristics, when compared with therespondents' ideal jobs. In analyses using a summary P-E fit score, it was found that respondentsin jobs where the P-E fit was in the ideal range scored highest in overall satisfaction, ahead of thosein either the deficiency or excess categories.
Half (48.9%) felt they would be less likely to be in their ideal job if they were civilians, whereasabout one-fourth (23.8%) felt the opposite. Comparison favoring civilian job correlated negativelywith both affective and cognitive evaluations.
Variables used in the analyses were better able to predict overall satisfaction than affectiveevaluation. Satisfaction with feeling of accomplishment best predicted overall satisfaction,whereas affective evaluation was best predicted by overall satisfaction.
Summary of the Self Domain
A majority of the Marines in the Camp Lejeune sample reported having positive feelings aboutself. Positive evaluation of this domain was correlated somewhat with pride in being a Marine.Older Marines were more positive than younger, Blacks led the rest in positive feelings about self,
xiii

and being married or involved in an intimate relationship was associated with higher positiveness.Gender differences were not significant.
The mean score for overall satisfaction (the cognitive measure) was higher than the mean forfeelings about self (the affective measure). Subgroup differences for overall satisfaction paralleledsubgroup differences in feelings. Overall satisfaction was most positively correlated withsatisfaction with personal appearance and satisfaction with general competence. Highestsatisfaction was recorded for self-discipline, while the lowest mean satisfaction score was forprogress toward goals. This was generally true also for all subgroups.
More respondents thought their personal development was better as a Marine than it wouldhave been had they remained civilians. Also, when comparing their own accomplishments to thoseof other Marines of the same rank, most respondents rated their own accomplishments equal orhigher.
Personal development had relatively high salience. Those who scored highest on positivefeelings about self, and on overall satisfaction with self, tended to think less often about personaldevelopment.
Summary of Global Quality of Life Findings
Six measures of global QOL were included in the survey. Response totals for each measureexcept two were slightly weighted on the positive side, although the average scores hovered aboutthe midpoint. When a global QOL composite score was constructed, the distribution of scores waswide-ranging; however, the mean was somewhat above the midpoint. All in all, global QOL wasnot very high by any measure used. Married Marines tended to score higher on QOL, whichgenerally increased with rank and age. Women scored higher than men on global QOL.
QOL perceptions are affected by person-environment fit and by comparison with civilians.Somewhat higher global QOL is associated with better fit, and Marines who perceived theirsituations favorably compared with a civilian alternative tended to score higher on global QOL.
The strongest predictor of global QOL for the sample as a whole and for married respondentswas feelings about self; for singles, it was feelings about health. Six variables together accountedfor 77-84 percent of the variance when predicting global QOL from domain QOL.
In summary, it appears that construction of a single global composite using the domain QOLscores is defensible, and that the resulting composite score relates meaningfully to other variables(e.g., P-E fit). However, average global QOL composite scores, like most of the average domainQOL scores, do not distance themselves greatly from the scalar midpoints. Subgroup differencesappear, but, for practical purposes do not amount to very much.
Summary of QOL and Organizational Outcomes
Quality of life was significantly related to personal readiness. Marines perceiving higher QOLtended also to have a higher readiness composite score. Neither race nor marital status was relatedto personal readiness. Women showed less personal readiness than men, and readiness increased
xiv

with rank and age. On the whole, using the nine indices discussed above, readiness was onlymoderate.
Quality of life was found to be related to intention to stay in the Marine Corps. Most closelycorrelated with remaining on active duty were job and residence; this was true for both cognitiveand affective evaluations. In addition, perceptions of the effects of domain QOL for those Marinesintending to remain differed significantly from the perceptions of those Marines intending to leave.
A weak yet significant correlation was found between individual performance and global QOLfor E-5s and above, with higher performers also perceiving better QOL overall. This is, of course,a relationship, not a causal connection.
xv

Contents
Page
Section 1: Introduction ................................................................... . 1
Background ................................................................................................................... 3Problem ......................................................................................................................... 3Purpose............................................................................................ . . 3A pproach ....................................................................................................................... 3
Section Two: Sample Characteristics ............................................ 5
Response Rate ............................................................................................................... 7Gender ........................................................................................................................... 7A ge ................................................................................................................................ 7Race ............................................................................................................................... 7Education ...................................................................................................................... 8Marital Status .................................................... 8Accom panied Status ..................................................................................................... . 8Parental Status ................................................... ............................................................ 9Spousal Em ploym ent .................................................................................................... 9Paygrade ........................................................................................................................ 10Length of Service ......................................................................................................... 10M onths at Assignm ent ................................................................................................. 10Deploym ent Status ....................................................................................................... . 10Occupational Specialty ................................................................................................. 10
Section Three: Quality of Life Domains ......................................... 11
Introduction ................................................................................................................... 13Quality of Life D om ains ............................................................................................... 13M easurem ent Scales ...................................................................................................... 14Analysis Categories ..................................................................................................... 14D ata Presentation ......................................................................................................... . 15
T he R esidence D om ain ................................................................... 17
Type of Residence ......................................................................................................... 17Affective Evaluation of Residence ............................................................................... 17Cognitive Evaluation of Residence ............................................................................... 17Specific Residence Factors .......................................................................................... 18Social Com parisons ...................................................................................................... 20Salience ......................................................................................................................... 20V ariables Predicting Positive Assessm ent of Residence .............................................. 21
xvii
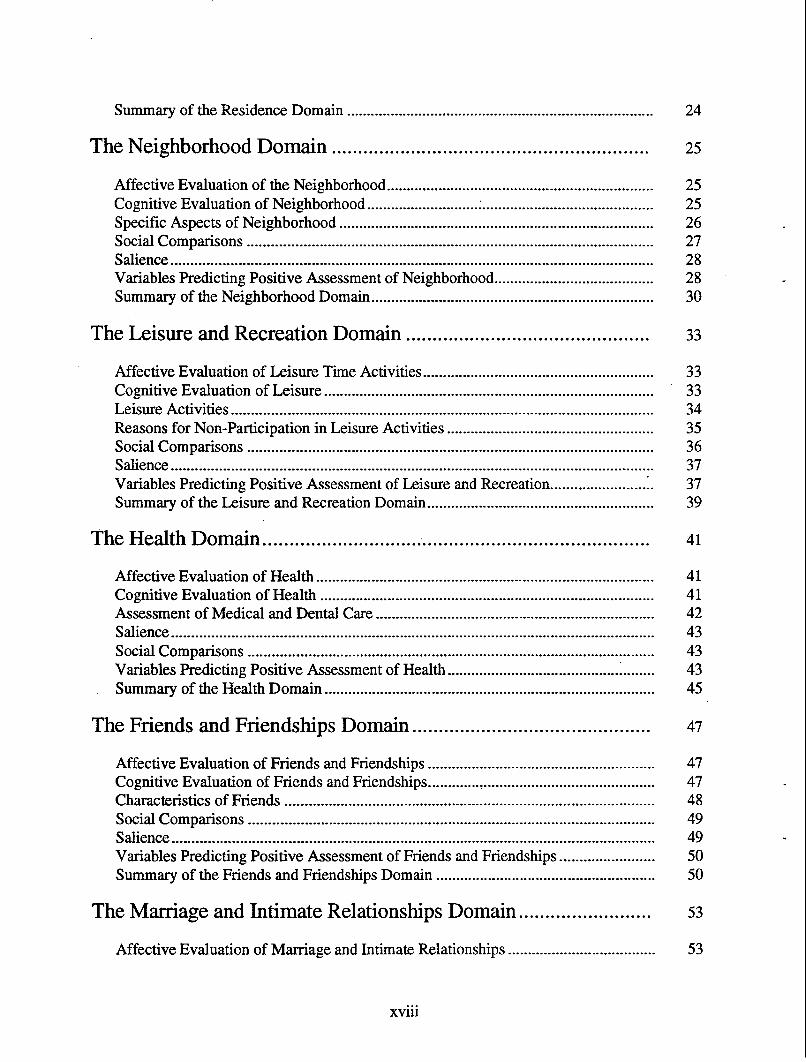
Summary of the Residence Domain ............................................................................. 24
The N eighborhood D om ain ............................................................ 25
Affective Evaluation of the Neighborhood .................................................................. 25Cognitive Evaluation of Neighborhood ................................... 25Specific Aspects of Neighborhood ............................................................................... 26Social Comparisons ..................................................................................................... 27Salience ......................................................................................................................... 28Variables Predicting Positive Assessment of Neighborhood ........................................ 28Summary of the Neighborhood Domain ...................................................................... 30
The Leisure and Recreation D om ain .............................................. 33
Affective Evaluation of Leisure Time Activities .......................................................... 33Cognitive Evaluation of Leisure ................................................................................... 33Leisure Activities .......................................................................................................... 34Reasons for Non-Participation in Leisure Activities .................................................... 35Social Comparisons ..................................................................................................... 36Salience ......................................................................................................................... 37Variables Predicting Positive Assessment of Leisure and Recreation .......................... 37Summary of the Leisure and Recreation Domain ......................................................... 39
The H ealth D om ain ......................................................................... 41
Affective Evaluation of Health .................................................................................... 41Cognitive Evaluation of Health ................................................................................... 41Assessment of Medical and Dental Care ...................................................................... 42Salience ......................................................................................................................... 43Social Comparisons ..................................................................................................... 43Variables Predicting Positive Assessment of Health .......................... 43Summary of the Health Domain ................................................................................... 45
The Friends and Friendships D om ain ............................................. 47
Affective Evaluation of Friends and Friendships ........................................................ 47Cognitive Evaluation of Friends and Friendships ........................................................ 47Characteristics of Friends ............................................................................................ 48Social Comparisons ..................................................................................................... 49Salience ......................................................................................................................... 49Variables Predicting Positive Assessment of Friends and Friendships ....................... 50Summary of the Friends and Friendships Domain ....................................................... 50
The Marriage and Intimate Relationships Domain ......................... 53
Affective Evaluation of M arriage and Intimate Relationships ..................................... 53
xviii

Cognitive Evaluation of Marriage and Intimate Relationships ..................................... 54Social C om parisons ...................................................................................................... 55Salience ......................................................................................................................... 56Variables Predicting Positive Assessment of Marriage and Intimate Relationships .... 56Summary of the Marriage and Intimate Relationships Domain ................................... 59
The Relationships with Children Domain .................. 61
Affective Evaluation of Relationships with Children .................................................. 61Cognitive Evaluation of Relationships with Children .................................................. 62Social C om parisons ....................................................................................................... 64Salience ......................................................................................................................... 65Variables Predicting Positive Assessment of Relationships with Children .................. 65Summary of the Relationships with Children Domain ................................................. 67
The Relationships with Other Relatives Domain ..... ......... 69
Affective Evaluation of Relationships with Other Relatives ........................................ 69Cognitive Evaluation of Relationships with Other Relatives Domain ......................... 69Social C om parisons ...................................................................................................... 70Salience ......................................................................................................................... 70Variables Predicting Positive Assessment of Relationships with Other Relatives ....... 71Summary of the Relationships with Other Relatives Domain ...................................... 72
The Income and Standard of Living Domain ................ 75
Affective Evaluation of the Income and Standard of Living Domain .......................... 75Cognitive Evaluation of Income and Standard of Living ....................... 76Social Com parisons ...................................................................................................... 77Salience ......................................................................................................................... 78Utilization of Base Exchange and Commissary ............................................................ 78Variables Predicting Evaluation of Income and Standard of Living ............................ 79Summary of the Income and Standard of Living Domain ........................................... 80
The W ork Domain .......................................................................... 83
Affective Evaluation of Job in the Marine Corps ......................................................... 83Cognitive Evaluation of Job in the Marine Corps ........................................................ 84Marines' Descriptions of Their Jobs ............................................................................. 85Person-Environment (P-E) Fit ...................................................................................... 86Social C om parison ........................................................................................................ 87Variables Predicting Positive Assessment of Marine Corps Job ................................. 88Summary of the Marine Corps Job Domain ................................................................. 89
xix
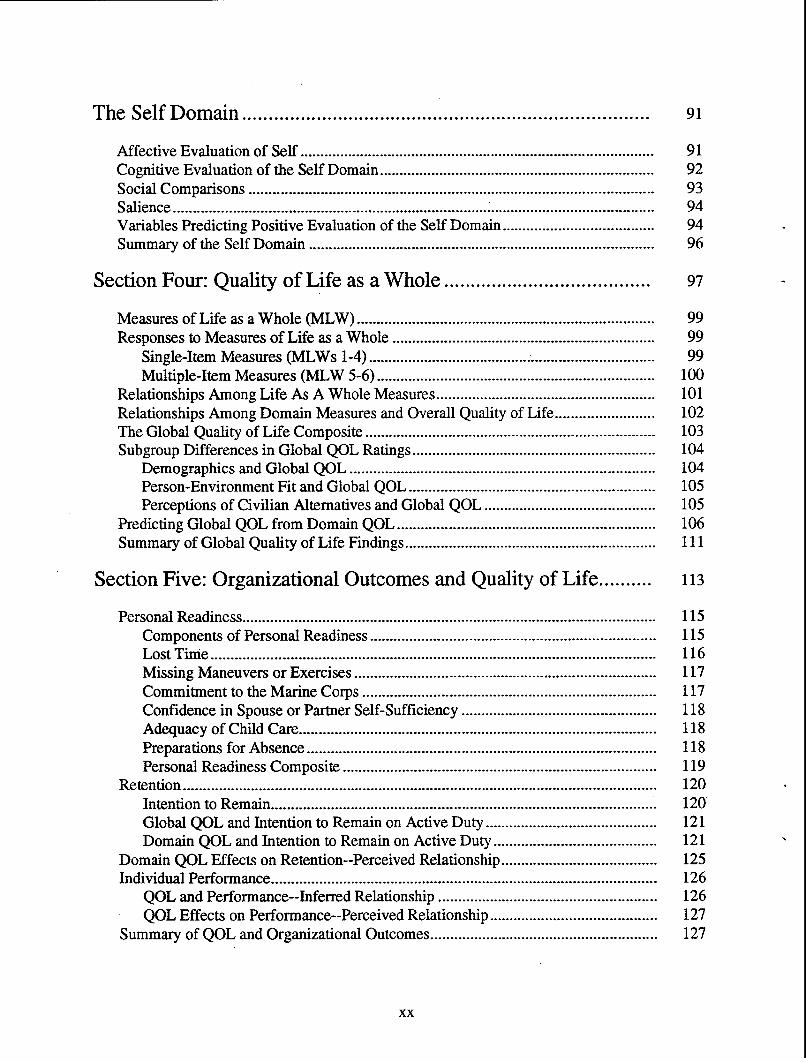
The Self D om ain ............................................................................. 91
Affective Evaluation of Self ........................................................................................ 91Cognitive Evaluation of the Self Domain .................................................................... 92Social Comparisons ...................................................................................................... 93Salience ......................................................................................................................... 94Variables Predicting Positive Evaluation of the Self Domain ...................................... 94Summary of the Self Domain ....................................................................................... 96
Section Four: Quality of Life as a Whole ....................................... 97
Measures of Life as a W hole (M LW ) ........................................................................... 99Responses to M easures of Life as a W hole ................................................................. 99
Single-Item M easures (MLW s 1-4) ........................................................................ 99Multiple-Item Measures (MLW 5-6) ...................................................................... 100
Relationships Among Life As A W hole Measures ....................................................... 101Relationships Among Domain M easures and Overall Quality of Life ......................... 102The Global Quality of Life Composite ......................................................................... 103Subgroup Differences in Global QOL Ratings ............................................................. 104
Demographics and Global QOL ............................................................................. 104Person-Environment Fit and Global QOL .............................................................. 105Perceptions of Civilian Alternatives and Global QOL ........................................... 105
Predicting Global QOL from Domain QOL ................................................................. 106Summary of Global Quality of Life Findings ............................................................... 111
Section Five: Organizational Outcomes and Quality of Life .......... 113
Personal Readiness ........................................................................................................ 115Components of Personal Readiness ........................................................................ 115Lost Time ................................................................................................................ 116Missing M aneuvers or Exercises ............................................................................ 117Commitment to the M arine Corps .......................................................................... 117Confidence in Spouse or Partner Self-Sufficiency ................................................. 118Adequacy of Child Care .......................................................................................... 118Preparations for Absence ........................................................................................ 118Personal Readiness Composite ............................................................................... 119
Retention ....................................................................................................................... 120Intention to Remain ................................................................................................. 120Global QOL and Intention to Remain on Active Duty ........................................... 121Domain QOL and Intention to Remain on Active Duty ......................................... 121
Domain QOL Effects on Retention--Perceived Relationship ....................................... 125Individual Performance ................................................................................................. 126
QOL and Performance--Inferred Relationship ....................................................... 126QOL Effects on Performance--Perceived Relationship .......................................... 127
Summary of QOL and Organizational Outcomes ......................................................... 127
xx
Section Six: Discussion .................................................................. 129
References ....................................................................................... 135
Appendix A--Marine Corps Quality of Life 1993M ember Questionnaire ................................................................. A-0
Distribution List
xxi

Section One
Introduction

Introduction
Background
The military services are increasingly concerned with the quality of life of their members. Thisconcern stems largely from a basic desire of military leaders to care for those in their charge, aconcern for the well being of those who may be called upon at any time to place their lives injeopardy in the defense of their country.
Such concern is exacerbated by substantive social and economic changes that have taken placein recent years. The emergence of the all-volunteer force, coupled with a decline in the populationof eligible recruits, force the armed services into intense competition not only among themselves,but also with industry and academia. In addition, today's youth tend to be better educated as wellas better informed of their vocational and career options. The rise of consumerism and the elevationof expectations regarding life's necessities and personal entitlements also focus attention onQuality of Life (QOL). Finally, sophisticated, technologically advanced equipment and weaponrydemand highly skilled operators, even as the uncertainties and ambiguities of late-20th Centurydaily life demand motivated and dedicated organizational members.
The concern for QOL, thus, is impelled both by the Marine tradition of "caring for our own,"and the ever-present need for competent, highly motivated, personnel, always in a high state ofreadiness. The result: immense investments of fiscal, personnel, and temporal resources in supportof enhanced QOL.
Problem
Quality of Life in the U. S. Marine Corps (Kerce, 1995) is the master report wherein the resultsof the Marine Corps-wide QOL assessment are reported. The research reported therein wasdesigned to assess the success of those enhancements of QOL, and to serve as baseline data againstwhich future QOL assessments can be arrayed. In addition, assessment results were made availableto HQMC program managers to guide ongoing Corps-wide QOL improvements.
What is needed to supplement the Marine Corps-wide information are site-specific analysesthat will be of use to commanders of major Marine Corps installations.
Purpose
The purpose of the research reported herein is to amplify results of the Marine Corps-wideQOL assessment, focusing on data from Camp Lejeune only.
Approach
The Marine Corps-wide QOL study produced data collected from a worldwide, representativesample of Marines (excluding only E-ls) who had been randomly selected to receive the QOLsurvey (refer to Kerce, 1995). Data for use in these site-specific analyses were extracted from thatdatabase. Analyses were performed using the Statistical Package for the Social Sciences (SPSS-X).
3

Section Two
Sample Characteristics

Sample Characteristics
Response Rate
A total of 1,462 questionnaires were distributed to Marines stationed at Camp Lejeune. Onethousand one hundred twenty-seven (1,127) completed questionnaires were received by the cutoffdate and usable in the database, for an effective response rate of 77.1 percent. (For details, refer toKerce, 1995:29-30.1)
Gender
More than nine out of ten respondents (95.2%) were male, versus 4.8 percent female.
Age
Age distribution for the sample is portrayed in Table 1. As shown, almost six out of tenrespondents (59.4%) were in the 21-25 (48.3%) and 26-30 (11.5%) age categories. Theoverwhelming majority (92.7%) of the sample were 35 years of age or less, and the average agewas 24.5 years.
Table 1
Age Distribution of Camp Lejeune Sample(n = 1,117)
Age Group Percent18-20 23.221-25 48.326-30 11.531-35 9.636+ 7.3
Race
Table 2 reflects the racial composition of the sample, in which 70.7 percent were White, 17.0percent Black, 9.9 percent were Asian or Pacific Islander, and 2.4 percent were Native Americanor Aleut. In response to a separate question, 10.0 percent claimed Hispanic descent.
'Note. The reader will find it useful to have at hand the Marine Corps-wide results of the survey, found in Kerce (1995).
7

Table 2
Racial Distributions of Camp Lejeune Sample(n = 1,105)
Race/Ethnic Group Number PercentWhite/Caucasian 781 70.7Black/African American 189 17.1Asian/Pacific Islander 109 9.9Native American/Aleut/Eskimo 26 2.4
Education
Only three percent (3.2%) of the Marines in this sample had below a high school graduateeducation. One third (32.5%) had at least some college. Table 3 shows the complete educationfigures.
Table 3
Educational Level for All Respondents(n = 1,118)
Situation PercentLess than high school 0.3High school equivalent 2.9High school graduate 64.4Less than two years college 18.9Two or more years college, no degree 4.7
Associate's degree 2.1Bachelor's degree 5.5Master's degree 1.1Doctoral or professional degree 0.2
Marital Status
Of the respondents in the sample, 46.5 percent were married, 47.6 percent had never beenmarried, and 5.9 percent were separated or divorced.
Accompanied Status
More than half (55.1%) of the Camp Lejeune Marines responding to the survey had nodependents, 3.8% were accompanied by some of their dependents, 32.7% by all of theirdependents. Four percent (4.3%) were temporarily unaccompanied, 3.4 percent were permanentlyunaccompanied by choice, 0.7 percent as a billet requirement. (Refer to Table 4.) There were 202
8

respondents who were married geographical bachelors, the most common reasons being personalpreference and cost of living.
Table 4
Accompanied Status by Marital Status Group
PercentMarried Single
Status (n = 498) (n = 64)Accompanied by some dependents 7.0 6.3Accompanied by all dependents 78.5 17.2Temporarily unaccompanied 8.6 29.7Temporarily unaccompanied 5.0 43.8Permanently unaccompanied by choice 0.8 3.1Permanently unaccompanied--billet requirement 0.0 0.0
Parental Status
Fewer than one-third (27.9%) of those surveyed said they had dependent children living withthem; 9.4 percent had dependent children living elsewhere.
Spousal Employment
Table 5 details the responses to the question about spouse's job. Few (8.8%) of the respondingMarines had a military spouse. With respect to spousal employment other than by the military, 6.4percent said their spouses were self-employed at home, 17.7 percent had spouses holding part-timecivilian jobs, 24.1 percent whose spouses were full-time civilian workers. Twenty-two percent(22.3%) had spouses who were unemployed by choice, 20.6 percent had spouses who wereunemployed but looking for work.
Table 5
Employment Situation for Spouses of Married Respondents(n = 543)
Situation PercentIn the military 8.8Self-employed at home 6.4Civilian job part time 17.7Civilian job full time 24.1Unemployed by choice 22.3Unemployed, actively seeking employment 20.6
9

Paygrade
The paygrade distribution for the sample is shown in Table 6. As would be expected, the largestgrouping was in the E-2--E-3 category at 48.2 percent, followed by the E-4--E-5s, at 30.9 percent.Four percent (4.1%) of the total sample were O-1--O-3s, 1.6 percent 0-4 or higher. Length of timein current paygrade ranged from 0 to 144 months, with an average of 19.1 months.
Table 6
Paygrade Distributions of Marine Corps and Sample(n = 1,121)
Paygrade Number PercentE-2--E-3 540 48.2E-4--E-5 346 30.9E-6--E-7 113 10.1E-8--E-9 27 2.4O-1--O-3 46 4.10-4--0-9 18 1.6W-O 12 1.1
Length of Service
Average length of service was 5.0 years, with a range of from 0 to 28 years. Approximatelyfour out of ten (44.4%) had less than 3 years tenure in the Marine Corps.
Months at Assignment
Zero to 92 months was the range for time at present assignment, with an average of 16.8months. One-half of those responding (50.8%) had been on their present assignment 13 months orless.
Deployment Status
Of the Marines in this sample, few were on deployment. Eighteen persons (1.6%) said theywere deployed at the time of the survey. However, in a separate question, four said they weredeployed aboard ship, one at a U.S. Embassy, and 18 at school (for a total of 23).
Occupational Specialty
A wide array of Marine Corps Military Occupational Specialties (MOS) was included in thesample, with clusters of respondents in particular MOSs relevant to ground combat.
10

Section Three
Quality of Life Domains

Quality of Life Domains
Introduction
The term "Quality of Life" refers to the overall well-being of the individual human being. It isimportant to remember that no external assessment of any person's quality of life is either valid orvery meaningful; quality of life (QOL) is as it is perceived by the individual. A QOL survey is anattempt to elicit information from an individual that will indicate, with some degree of fidelity, howthat person perceives his or her QOL. In the aggregate, questionnaire responses from ascientifically drawn sample of individuals will provide indications about the QOL for members ofan organization, and thus, in a way, provide a commentary on organizational health, and indicateareas where organizational resources might profitably be targeted.
It is probably true that personal assessments of QOL vary from time to time, dependent onmany things: personality factors, recent events in the life-space of the individual, or simply as aresult of the acquisition of new information by the individual. A survey can provide but a snapshotof the QOL perceptions of members of an organization. The information is highly relevant anduseful, but requires updating on a regular basis, or subsequent to major events in the physical orsocial environments.
Quality of Life Domains
Quality of Life is a global term. While such an overarching term is useful for referring tooverall well-being, that global perception has many contributors. Countless are the ways in whichQOL might meaningfully be divided. Each is a major category in which individuals would belikely to focus their attention, the results of which contribute in a great or small way to a globalassessment of well-being. The relative importance of each of these domains, of course, willconstantly shift, not always in a predictable manner.
Closest to the "heart" of QOL might be self-assessments, and perceptions about one's health.For most people, areas of life involving spouse or other intimate companion, children, and friendslie close to the self domain; not too distant are other relatives. Work remains closely associated withone's identity; and income, in addition to its own importance to QOL, affects many other areas ofQOL as well. Where one lives and the quality, size, and amenities of one's dwelling are of greatimportance to individuals. Leisure and recreation seem to be of increasing importance in today'ssociety, and thus become important to overall QOL.
In the Marine Corps Quality of Life Survey, information was elicited from respondents withrespect to 11 "domains." This section of the report details results for each of those domains of lifein the order presented in the survey itself:
ResidenceNeighborhoodLeisure and RecreationHealthFriends and FriendshipsMarriage/Intimate Relationship
13

Relationships with One's ChildrenRelationships with Other RelativesIncome and Standard of LivingJobSelf
Information varies by domain. However, affective assessments, cognitive assessments,objective descriptions, and salience indications are included for each domain.
Measurement Scales
Human beings have feelings about the various aspects of their lives. They also make rationalevaluations, which may or may not agree with how they feel. Within each domain, affectiveassessments (measuring feelings about something) used a seven-point scale, the bipolar anchorsbeing Delighted and Terrible (D-T). Cognitive assessment (measuring rational evaluations) againused a seven-point scale, which ran from Completely Satisfied to Completely Dissatisfied. A thirdseven-point scale was used to measure Salience ("on the mind"). Objective descriptions are statedin terms relevant to the qualities being measured, and each domain had some items unique to thatsection of the survey.
Analysis Categories
Extremely small numbers of respondents in some subgroups of the sample militate againstdefensible scientific analyses and may render survey information useless. Therefore, broadercategories have been developed. Even then, especially in crosstab analyses, there will be very fewrespondents in some categories. The reader is urged to review the actual distribution of responsesand to take any results where the number in a category is very, very low cum grano salis.
For analyses of differences according to demographic characteristics, the following categoriesare used in this report:
Age
Less than 25 years old25-35 years oldMore than 35 years old
Marital Status
MarriedFormerly married (divorced/widowed)Never married
14

Rank
E-2--E-4E-5--E-9W-1--W-5O-1--O-40-5--0-9Other (E-1)
Residence
BOQ/BEQMilitary housingCivilian housingOther
Race
WhiteBlackHispanicOther
In certain cases, categories will be used that are specific to the domain under consideration, andnot elsewhere in the report. In such cases, the reader will be alerted to the use of those specialanalysis categories.
Data Presentation
Presentation of survey results for Camp Lejeune closely parallels that for the Corps-widesurvey (Kerce, 1995). Tables and figures are used sparingly in this report, and only in cases wherevisual presentation of the data is particularly useful. In addition, for reporting purposes, responsesare sometimes "collapsed"; for example, "completely dissatisfied" and "dissatisfied" might becombined. The reader is urged to consult the survey itself (in the Appendix) for exact item wording.The tables are sequenced very close to the order of data presentation in this report.
15
The Residence Domain
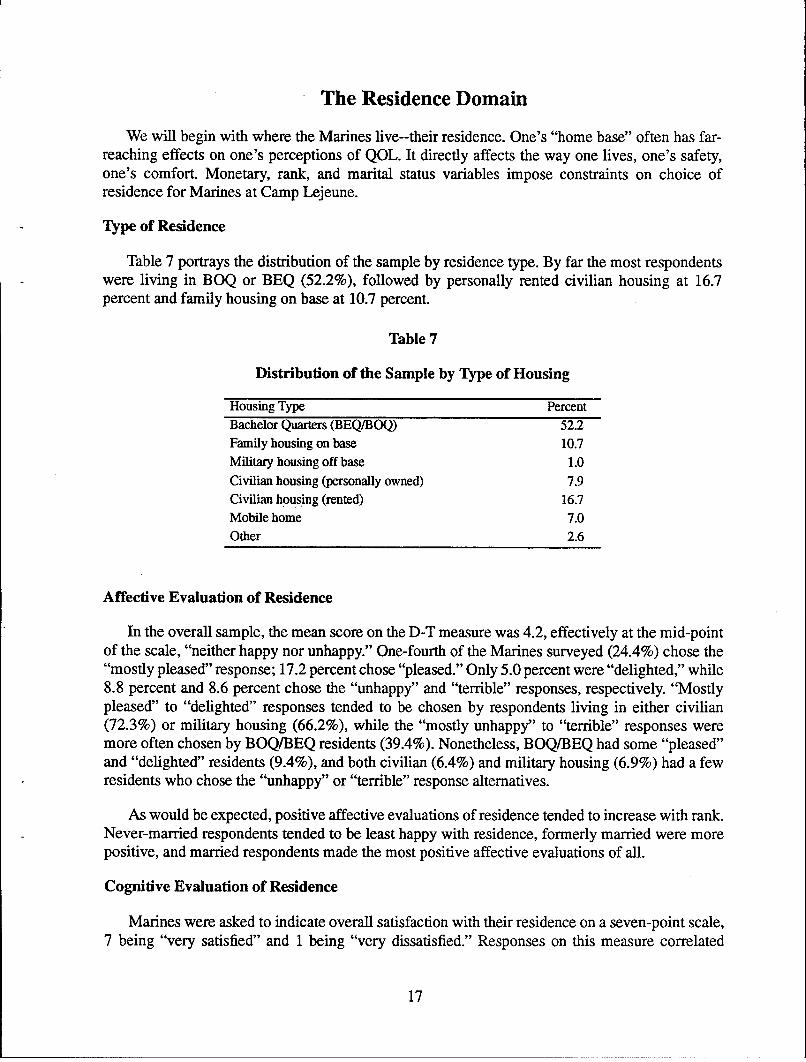
We will begin with where the Marines live--their residence. One's "home base" often has far-reaching effects on one's perceptions of QOL. It directly affects the way one lives, one's safety,one's comfort. Monetary, rank, and marital status variables impose constraints on choice ofresidence for Marines at Camp Lejeune.
Type of Residence
Table 7 portrays the distribution of the sample by residence type. By far the most respondentswere living in BOQ or BEQ (52.2%), followed by personally rented civilian housing at 16.7percent and family housing on base at 10.7 percent.
Table 7
Distribution of the Sample by Type of Housing
Housing Type PercentBachelor Quarters (BEQ/BOQ) 52.2Family housing on base 10.7Military housing off base 1.0Civilian housing (personally owned) 7.9Civilian housing (rented) 16.7Mobile home 7.0Other 2.6
Affective Evaluation of Residence
In the overall sample, the mean score on the D-T measure was 4.2, effectively at the mid-pointof the scale, "neither happy nor unhappy." One-fourth of the Marines surveyed (24.4%) chose the"mostly pleased" response; 17.2 percent chose "pleased." Only 5.0 percent were "delighted," while8.8 percent and 8.6 percent chose the "unhappy" and "terrible" responses, respectively. "Mostlypleased" to "delighted" responses tended to be chosen by respondents living in either civilian(72.3%) or military housing (66.2%), while the "mostly unhappy" to "terrible" responses weremore often chosen by BOQ/BEQ residents (39.4%). Nonetheless, BOQ/BEQ had some "pleased"and "delighted" residents (9.4%), and both civilian (6.4%) and military housing (6.9%) had a fewresidents who chose the "unhappy" or "terrible" response alternatives.
As would be expected, positive affective evaluations of residence tended to increase with rank.Never-married respondents tended to be least happy with residence, formerly married were morepositive, and married respondents made the most positive affective evaluations of all.
Cognitive Evaluation of Residence
Marines were asked to indicate overall satisfaction with their residence on a seven-point scale,7 being "very satisfied" and 1 being "very dissatisfied." Responses on this measure correlated
17

strongly with responses on the domain D-T scale (r =.75, p < .000). The sample mean for overallsatisfaction was 4.2, at just about the midpoint of the scale.
Subgroup comparisons indicated that married personnel were somewhat more satisfied withtheir residence than were those formerly married, who were much more satisfied than those neverhaving been married. Blacks were most satisfied, followed by "Other" and White in that order;least satisfied were Hispanic respondents. Women were more satisfied than men. Little differencein satisfaction was evident among the officer subgroups; however, senior enlisted were lesssatisfied than officers, and junior enlisted were least satisfied of all. Finally, Marines residing incivilian housing made the highest endorsement for satisfaction, followed by those living in militaryhousing. BOQ/BEQ residents were much lower in satisfaction, and "other" residence type waslowest.
Specific Residence Factors
In addition to the overall satisfaction measure, the survey also elicited information with respectto Marines' satisfaction with nine specific aspects of their residence. Table 8 shows correlationsamong the satisfaction ratings of specific factors in addition to the correlation between specificfactors and overall satisfaction. Generally, moderate to strong intercorrelations were found amongall of the specific factors except location, which was slightly lower, and cost, for whichintercorrelations were considerably lower. All specific factors correlated strongly with overallsatisfaction except cost.
Table 8
Intercorrelations of Specific and Overall Satisfactions with Residence
Intercorrelations Among Aspects CorrelationsWith Overall
Satisfaction Aspect S1 S2 S3 S4 S5 S6 S7 S8 S9 Satisfaction1. Attractiveness .74 .67 .67 .66 .56 .66 .63 .27 .792. Layout .69 .66 .69 .62 .62 .57 .29 .783. Amenities .66 .62 .55 .65 .55 .21 .734. Privacy .71 .58 .68 .54 .23 .755. Space .55 .65 .50 .26 .746. Location .57 .42 .26 .647. Comfort .62 .26 .778. Condition .35 .689. Cost .41Notes.1. All correlations are significant atp < .001.2. With pairwise treatment of missing values, Ns for these analyses ranged from 1,064 to 1,113.
Intercorrelations were examined separately for bachelor quarters, military family housing, andcivilian housing residents. Although there were minor inter-group differences, the correlationcoefficients for the three subgroups were generally similar to those shown in Table 8, again withcost showing the lowest correlation with overall satisfaction.
18

Analysis by type of residence produced results highly comparable with those for the totalsample. Except for cost, Marines residing in the BOQ and BEQ were consistently least satisfied onall factors. Residents of civilian housing tended to be most satisfied, except with respect to cost.For BOQ[BEQ residents, all but one of the mean scores fell into the dissatisfied portion of the scale;in contrast, all response means except two for military and all response means for the civilianhousing subgroups fell on the positive portion of the scale. Table 9 displays the satisfaction ratingsfor the three subgroups.
Table 9
Aspects of Residence Ranked by Mean Satisfaction Scoreby Where Respondents Were Living
Government FamilyBachelor Quarters Housing Civilian HousingAspect Mean Aspect Mean Aspect Mean
Cost 4.94 Location 5.30 Location 5.48Location 4.06 Cost 4.93 Privacy 5.40Condition 3.94 Comfort 4.90 Amenities 5.36Layout 3.74 Amenities 4.64 Comfort 5.32Attractive 3.50 Layout 4.61 Layout 5.26Comfort 3.26 Condition 4.48 Condition 5.23Amenities 2.98 Attractive 4.34 Attractive 5.23Space 2.87 Privacy 3.89 Space 4.89Privacy 2.77 Space 3.75 Cost 4.65
Space and privacy were lowest ranked for satisfaction by military, cost and space by civilianhousing residents; privacy, space, and amenities were lowest ranked by BOQ/BEQ residents.Those residing in civilian housing (N = 363) were paying from $50.00 to $1,250.00 per month fortheir housing (average of $408.78). Mortgage payments on personally owned civilian housingranged from $194.00 to $1,250.00, averaging $547.60. Monthly rent for non-owned civilianhousing ranged from $125.00 to $950.00 (average $410.34). Average cost for shared rentals was$271.29, the range being from $50.00 to $600.00. Seventy-eight respondents reported living in amobile home; their average monthly payment was $294.73.
For all respondents except those living in BOQ/BEQ (N = 791), the number of rooms in theresidence ranged from one (N = 9) to eight or more (N = 24). Two to six rooms were mostcommonly indicated, with the mode being five rooms. Number of adults living in the residenceranged from one to eight or more; children living in the residence ranged from one to six. Dividingthe number of rooms in the residence by the total number of persons living there (adults pluschildren) provided a figure denoting rooms per person. That figure ranged from a low of .50 to ahigh of 4.50. The mean for military housing was 1.3; for civilian housing it was 1.5.
19

Social Comparisons
Respondents were asked to compare their current residence to the residence they thought theymight have if they were not in the Marine Corps. Seventeen percent (17.2%) felt the two residenceswere about the same, 41.3 percent felt their current residence was worse, and 41.5 percent felt it tobe somewhat better. Marines living in military housing were rather positive in their responses, with18.6 percent stating their current residence and the one they might be living in were they not in theMarine Corps were about the same, but 46.5 feeling that their current residence was better. Civilianhousing residents were only slightly less positive, with 33.4 percent stating that the two were thesame, 36.4 percent feeling their current residence was worse. For BOQ/BEQ residents, there wasa relatively equal split between better (47.8%) and worse (45.3%).
Respondents were also asked to compare their current residence with homes in which they hadlived while growing up. By far the most stated that their current residence was worse (67.5%).More than half of the military housing residents (58.9%) felt their current residence was worse,18.6 percent felt their current residence and the one they had lived in while growing up were aboutequal. Civilian housing residents were very similar in their evaluations; 52.2 percent felt theircurrent residence was worse, 18.1 percent felt the two were about the same, while 29.7 percent felttheir current residence was better. BOQ/BEQ residents were highly negative in their responses:almost eight out of ten (79.0%) said "worse."
A third comparison was requested, this one between the Marine's current residence and theresidences of most other Marines of the same paygrade. More than half (59.3%) of thoseresponding felt the two were about the same, with responses for better (21.2%) and worse (19.5%)fairly evenly split. More than half (64.6%) the military housing residents saw their residence andthose of their contemporaries as about equal, with better and worse again about evenly split.Civilian housing residents were most positive in responding to this question, with half (48.9%)feeling the two were about equal, and 40.3 percent feeling their residence was better than that ofmost of their peers. Six out of ten (65.7%) BOQ/BEQ residents felt the two were about the same,24.6% felt their own residence was worse, 9.1% felt theirs was better.
Positive correlations were found between responses on two of the comparisons and overallsatisfaction with residence. Those who felt that their current residence compared favorably withwhere they lived as children, and even more those whose current residences compared favorablyto those of their peers, tended also to be satisfied with their current residence. The strongestrelationship was between overall satisfaction with residence and a positive comparison with peers(r = .45), followed by a positive comparison with childhood residence (r = .29).
Salience
Respondents were asked how frequently residence had been on their mind, using a seven-pointscale running from 1 (almost all the time) to 7 (not at all). Mean scores on the salience measurediffered very little by where respondents were living (military housing = 2.43, civilian housing =2.34, BOQ/BEQ = 2.21).
Saliency score was found to correlate positively with overall satisfaction with residence(r = .30, p = .000), and with feelings about one's residence on the D-T scale (r = .27, p = .000).
20

This indicates that the Marines in the sample had a tendency to think more often of their residenceif they were having problems with it.
Variables Predicting Positive Assessment of Residence
To identify the combination of factors that are predictive of overall satisfaction with residence,and with positive feelings toward it, a series of multiple regression procedures was conducted.Using a stepwise procedure, 14 variables were tested: nine specific satisfactions, overall domainsatisfaction, the D-T (feelings) score, and the three comparison variables. Because of differencesassociated with living in military housing, civilian housing, and bachelor quarters, analyses wereconducted separately for each subgroup. The results of the three analyses to predict residencedomain overall satisfaction are presented in Tables 10, 11, and 12. Only the strongest predictors,those adding at least one percentage point to the squared multiple correlation, are included in thetables.
Table 10
Multiple Regression Predicting Bachelor Quarters Residents'Overall Satisfaction with Residence
Variable Multiple R Rz BetaSatisfaction with space available .75 .57 .75Satisfaction with privacy .83 .68 .43Satisfaction with comfort .86 .73 .29Overall feeling about residence .87 .76 .23Satisfaction with layout .88 .78 .20Satisfaction with cost .89 .80 .12Satisfaction with space available .90 .80 .14Satisfaction with other Marines .90 .81 .07Satisfaction with amenities .90 .81 .07Satisfaction with condition .90 .81 .06
Table 11
Multiple Regression Predicting Government Family Residents'Overall Satisfaction with Residence
Variable Multiple R Rz BetaOverall feeling about residence .75 .56 .75Satisfaction with layout .83 .69 .46Satisfaction with privacy .86 .74 .27Satisfaction with condition .88 .77 .22Satisfaction with location .89 .79 .18Satisfaction with space available .90 .81 .18Satisfaction with attractiveness .90 .82 .13
21

Table 12
Multiple Regression Predicting Civilian Housing Residents'Overall Satisfaction with Residence
Variable Multiple R RI BetaSatisfaction with layout .73 .54 .73Satisfaction with cost .82 .68 .41Satisfaction with condition .86 .74 .32Satisfaction with comfort .87 .76 .22Overall feeling about residence .88 .78 .16Satisfaction with amenities .89 .79 .14Satisfaction with attractiveness .89 .79 .11Satisfaction with privacy .89 .80 .08
As can be seen in the tables, it is, generally, satisfaction with specific aspects of the residencethat most strongly predicts overall satisfaction with residence for Marines in all three subgroups.However, feelings about the residence was the top predictor for residents of military housing, fifthstrongest for civilian housing residents, and fourth strongest for those residing in BOQ/BEQ. Theimportance of predictors varied by subgroups.
Multiple regression procedures also were used to determine what most strongly influencedMarines' feelings about their residences. Overall satisfaction, the nine facet satisfactions, salience,and the three residence comparisons were the variables included. Results of the separate analysesfor BOQ/BEQ, military housing, and civilian housing are shown in Tables 13, 14, and 15.
Table 13
Multiple Regression Predicting Bachelor Quarters Residents'Feelings About Their Residence
Variable Multiple R RL BetaSatisfaction with residence overall .68 .47 .68Saliency .70 .49 .16Satisfaction with layout .71 .50 .16Satisfaction with privacy .71 .51 .13Satisfaction with attractiveness .71 .51 .07Comparison with housing while growing up .71 .51 .04Satisfaction with cost .71 .51 .03Satisfaction with location .72 .51 .02Comparison with other Marines .72 .51 .02Satisfaction with comfort .72 .51 -.01Satisfaction with condition .72 .51 .01Satisfaction with space available .72 .51 -.01Comparison with housing as a civilian .72 .51 -.005Satisfaction with mnenities .72 .51 .002
22

Table 14
Multiple Regression Predicting Military Family Residents'Feelings of About Their Residence
Variable Multiple R R1 BetaSatisfaction with residence overall .75 .56 .75Satisfaction with comfort .76 .58 .19Satisfaction with space available .77 .59 .14Satisfaction with cost .78 .60 .15Satisfaction with amenities .78 .61 -.11Satisfaction with location .78 .61 -.08Saliency .79 .62 .05Satisfaction with privacy .79 .62 -.06Comparison with layout .79 .62 .06Satisfaction with other Marines .79 .62 -.04Comparison with attractiveness .79 .62 -.04Satisfaction with condition .79 .62 .03Comparison with housing whereas growing up .79 .62 -.02Comparison with housing as a civilian .79 .62 -.02
Table 15Multiple Regression Predicting Civilian Housing Residents'
Feelings About Their Residence
Variable Multiple R R1 BetaSatisfaction with residence overall .68 .46 .68Satisfaction with privacy .71 .50 .24Satisfaction with attractiveness .72 .52 .23Comparison with other Marines .73 .54 .13Comparison with housing as a civilian .74 .54 .07Comparison with housing while growing up .74 .55 .10Satisfaction with amenities .74 .55 .06Saliency .74 .55 .04Satisfaction with cost .74 .55 .04Comparison with space available .74 .55 -.04Satisfaction with comfort .75 .56 .05Satisfaction with layout .75 .56 .05Satisfaction with location .75 .56 .03
Satisfaction with condition .75 .56 .03
Overall satisfaction with residence was the best predictor of positive feelings about theresidence. Salience was the second most potent predictor for residents of bachelor quarters,whereas comfort was second for military housing occupants, privacy for civilian housing residents.
23

The three comparisons added little to the correlations for any of the three housing types. Prediction,using the stated variables, was more successful in the case of Marines living in military housingthan for residents of the other two types of housing.
Summary of the Residence Domain
For the Marines at Camp Lejeune, type of housing was found to be a powerful determinant ofaffective evaluation of the residence and of satisfaction with residence overall. Those living inBOQ/BEQ have the least control over many aspects of their living quarters, and they tended to bemuch less satisfied with their residence than were those living in military housing; civilian housingresidents, whether they owned or rented, were most satisfied of all. Bachelor quarters residents alsotended to compare their current housing less favorably with childhood home, but about equallywith military housing residents on the kind of housing they might be enjoying if they were not inthe Marine Corps. Other than with cost, bachelor quarters residents were least satisfied on allfactors of residence. After all, their comparison, at best, is between their room (or shared suite) andan actual apartment or a house. Not unexpectedly, their lowest satisfaction was with privacy andspace, the highest, such as it was, with cost and location.
Marines living in military housing were more satisfied with their residences than were bachelorquarters residents. Members of this subgroup (military housing) were most satisfied with locationand cost, least with space and privacy.
Marines living in civilian housing were most satisfied with the space and privacy of theirresidences. Lowest satisfaction for this subgroup was with cost.
In general, there were no high levels of satisfaction with housing in the Camp Lejeune sample.On the seven-point scale of overall satisfaction (seven being high), the top indicator was found tobe 5.2; for a facet satisfaction (again with a seven-point scale) the top was 5.5 (satisfaction withthe location of the residence). Both high points of satisfaction were found among the residents ofcivilian housing.
24

The Neighborhood Domain
How Marines feel about where they live depends not only on their residence but also on theneighborhood in which it is situated. Many are the ways in which neighborhoods differ in theencircling environments they provide for any particular residence. Housing values, occupantsafety, and social relations are but a few of the things affected by neighborhood type and quality.Given the differences among housing types (BOQ/BEQ, military housing, civilian housing), onewould expect at least some neighborhood ratings to differ according to housing type. Variablesincluded in the assessment of neighborhood included the affective (D-T) scale, overall satisfaction,satisfaction with various aspects of the neighborhood, comparisons, salience, and perceived effectson behaviors and intentions.
Affective Evaluation of the Neighborhood
Relatively, Camp Lejeune Marines were about as positive about their neighborhood as abouttheir residences. With respect to feelings about their neighborhood, approximately one-third of thesample (32.9%) were on the mid-point of the seven-point scale, "neither happy nor unhappy."Responses of "unhappy" and "terrible" accounted for only 7.0 percent and 6.7 percent,respectively. One-fifth (19.5%) marked "mostly pleased," while another one-fifth (19.9%) chosethe "pleased" response. The mean for overall satisfaction was very close to the mid-point, and veryslightly higher than that for feelings about residence, at 4.3
Subgroup comparisons showed statistically significant differences by marital status, rankgroup, and type of housing. Feelings about neighborhood scored at a mean of 4.94 for married and4.57 for formerly married Marines,; however, the feeling score for those never having been marriedwas only 3.78. With respect to rank group, feelings about the neighborhood became more positivein a linear fashion with rank: E-2 to E-4, 4.05; E-5 to E-9, 5.01; 0-1 to 0-4, 5.46; and 0-5 to 0-9,5.83; warrant officers scored almost equal with senior enlisted at 5.00.
Feelings about neighborhood were least positive for BOQ/BEQ residents (3.83), more positivefor residents of military housing (4.86); those living in civilian housing were most positive of all(5.11). Much of the difference among subgroups can, of course, be accounted for by the fact thatsingle, unmarried Marines tend to live in the bachelor quarters. Those having higher incomes (i.e.,of higher rank) tend to select or to be assigned to better neighborhoods.
Length of time in the neighborhood was very weakly correlated with feelings about theneighborhood (r = .05, p = .041). A slightly stronger relationship was found between feelings aboutthe neighborhood and the amount of time it required to get to work (r = .27, p = .000).
Cognitive Evaluation of Neighborhood
Almost one-fifth (18.1%) of the Marines were somewhat to completely satisfied with theirneighborhoods; 61.2 percent were dissatisfied and 20.8 percent chose the neutral response. Overallsatisfaction with neighborhood was moderately correlated (r = .72) with responses on the D-T scale(feelings about neighborhood). Overall satisfaction with neighborhood differed significantly byrank group and type of housing, as well as by marital status.
25

Specific Aspects of Neighborhood
Correlations shown in Table 16 denote the relationships among satisfaction with specificaspects of the neighborhood, and between each of the specific aspects and overall satisfaction.Each of the 11 specific elements was significantly correlated with overall satisfaction. Although theexact correlations differed, the pattern of relationships was highly similar across type of residencesubgroups.
Table 16
Intercorrelations of Specific and Overall Satisfactions with Neighborhood
Intercorrelations Among Aspects CorrelationsWith
OverallAspect S2 S3 S4 S5 S6 S7 S8 S9 SO 811 Satisfaction1. Safety .59 .55 .52 .43 .28 .40 .45 .23 .17 .35 .562. Public Services .61 .56 .42 .36 .44 .47 .39 .19 .45 .613. Appearance .77 .52 .38 .47 .54 .39 .21 .45 .724. Other Dwellings .49 .38 .43 .51 .40 .24 .42 .695. Friendliness .35 .54 .65 .36 .23 .41 .656. Transportation .30 .45 .30 .17 .26 .467. Racial Mix .52 .37 .21 .41 .608. Sense of Community .38 .22 .36 .649. Retail Services .32 .37 .50
10. Commute Tune .29 .3211. Parking Availability .60Notes.1. All correlations are significant at p < .001.2. With pairwise treatment of missing values, Ns for these analyses ranged from 1,078 to 1,114.
Highest intercorrelation (r = .77) was between satisfaction with appearance of theneighborhood, and satisfaction with the condition of other dwellings; lowest intercorrelation(r =. 17) was between satisfaction with transportation services in the neighborhood and satisfactionwith the time it takes to get to work. The three aspects having the strongest relationship with overallsatisfaction were the appearance of the neighborhood, the condition of other dwellings, and thefriendliness of people living in the neighborhood. The aspect showing the least relationship withoverall satisfaction was commuting time.
Table 17 shows the mean satisfaction scores for the various specific elements of theneighborhood domain, broken out by type of housing. There were no surprises. Differences can beaccounted for by the trade-offs in characteristics of barracks life versus living in a home, and byon-base versus off-base housing. Time to work and safety rank high for BOQ/BEQ, time to workand racial mix for military housing; transportation ranks low for both. Among the Marines residingin civilian housing, transportation ranked lowest, with sense of community only slightly higher;their highest facet satisfactions were with parking and public services. Interestingly, Marines living
26

in military and civilian housing appear to be equally satisfied with the friendliness of theirneighbors.
Table 17
Aspects of Neighborhood Ranked by Mean Satisfaction Scoreby Where Respondents Were Living
Bachelor Quarters Military Family Housing Civilian HousingAspect Mean Aspect Mean Aspect MeanCommute Time 5.50 Commute Time 5.43 Parking 5.78Safety 4.72 Racial Mix 5.10 Public Services 5.37Parking 4.62 Parking 5.09 Racial Mix 5.29Retail Services 4.55 Retail Services 5.07 Safety 5.24Public Services 4.44 Safety 4.90 Appearance 5.23Other Dwellings 4.43 Friendliness 4.90 Friendliness 5.20Racial Mix 4.42 Appearance 4.83 Retail Services 5.12Friendliness 4.39 Public Services 4.75 Other dwellings 4.99Appearance 4.38 Other dwellings 4.63 Commute Time 4.70Community Sense 3.86 Community Sense 4.15 Community Sense 4.50Transportation 3.21 Transportation 3.58 Transportation 3.77
Although closely linked with type of housing, satisfaction with aspects of the neighborhoodtends to be lower among those never having been married and among the junior enlisted personnel.
Social Comparisons
Respondents were asked to compare their present neighborhood to the one they thought theymight be living in were they not in the Marine Corps. Responses were quite positive. More thanhalf (59.6%) thought their current neighborhood was better, while 20.3 percent of them felt the twowere about equal. Only 20.1 percent rated their current neighborhood as worse. However, whenasked to compare current neighborhood and the one in which they had grown up, respondents weremuch more negative. Six out of ten (63.2%) of the Marines felt their current neighborhood wasworse, and only 21.2 percent felt it was better. In a third comparison, 62.3 percent of those sampledfelt that their current neighborhood was about equal to that of their peers; 21.2 percent thoughttheirs was better, 16.4 percent thought theirs was worse.
There was no clear pattern by type of housing. Marines living in military housing were mostlikely to see their current neighborhood as superior to that of their peers. However, whencomparing current neighborhood with the one in which they grew up, little difference existedbetween the responses of military and civilian housing residents. And, although they were a littlemore negative on comparisons of current neighborhood with either the one in which they grew upor the neighborhoods of their peers, BOQ/BEQ residents were surprisingly more positive thaneither military or civilian housing residents when comparing their current neighborhood with theone they might be living in were they not in the Marine Corps.
27

Salience
Approximately half (51.6%) of these Camp Lejeune Marines stated that their neighborhoodwas on their mind "seldom," "hardly ever," or "not at all." One out of four (25.4%) marked "oncein a while," while 11.5 percent indicated "quite a lot." For a few, neighborhood was on their mind"a great deal" (5.8%) to "almost all the time" (5.7%). On the seven-point scale, the mean responsewas 4.6. Correlational analysis revealed that those who had their neighborhoods on their mind mostoften tended also to be the ones least satisfied with their neighborhoods.
Variables Predicting Positive Assessment of Neighborhood
The combination of factors that predict positive assessment of the neighborhood domain wereidentified through a series of multiple regression procedures. Because of the varying characteristicsof BOQ/BEQ, military housing, and civilian housing, which likely affect these assessments, theanalyses were conducted separately for each of the three housing type subgroups.
Fourteen variables were entered in a stepwise procedure: 11 facet satisfactions and threecomparisons. Tables 18, 19, and 20 show that, in each case, a few (4-6) facet satisfactions accountfor approximately 66-80 percent of the variance in overall satisfaction, with the comparison factorscontributing little to the correlations. (Only predictors adding a full percentage point or more to thesquared coefficient are included in the tables.)
Table 18
Multiple Regression Predicting Bachelor Quarters Residents'Overall Satisfaction with Neighborhood
Variable Multiple R R1 BetaSatisfaction with appearance .67 .45 .67Satisfaction with racial mix .74 .55 .33Satisfaction with availability of parking .78 .60 .26Satisfaction with sense of community .80 .64 .23Satisfaction with transportation .81 .65 .14Satisfaction with condition of other dwellings .82 .66 .16Comparison with neighborhood while growing up .82 .68 .11Satisfaction with friendliness .83 .68 .12Satisfaction with availability of retail services .83 .69 .07Satisfaction with safety .83 .69 .08Satisfaction with public services .83 .69 .03Satisfaction with length of time to get to work .83 .69 -.02Comparison with neighborhood as a civilian .83 .69 .01Comparison with other Marines .83 .69 .004
28
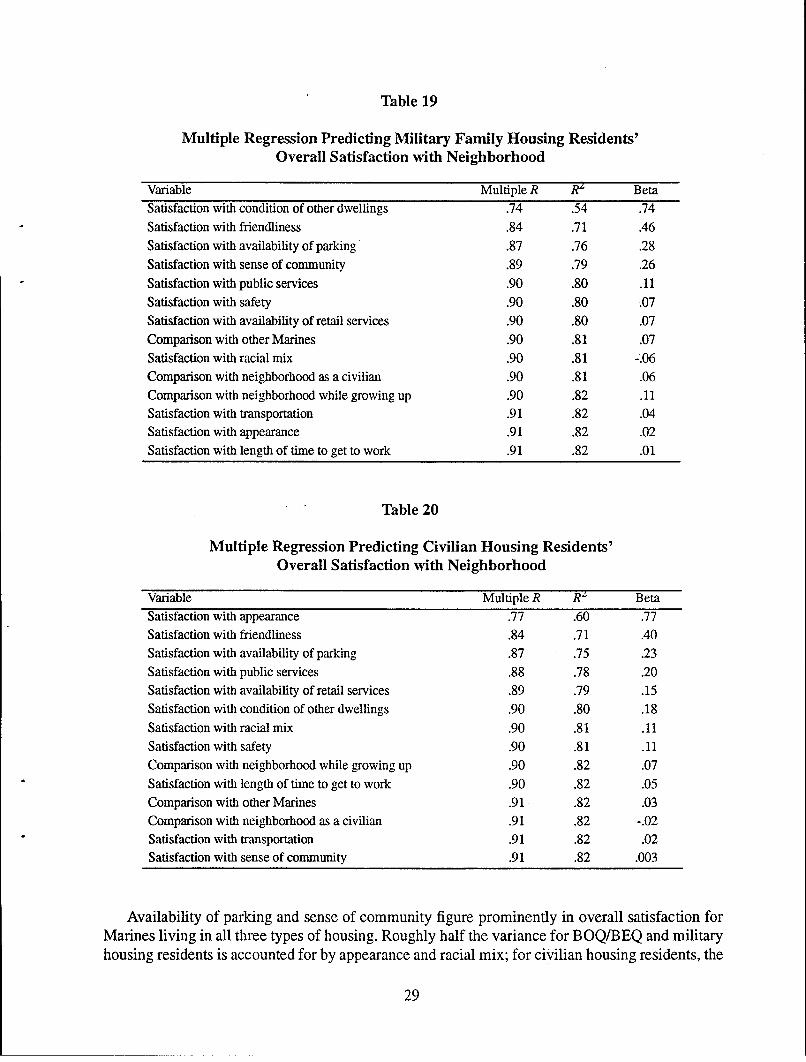
Table 19
Multiple Regression Predicting Military Family Housing Residents'Overall Satisfaction with Neighborhood
Variable Multiple R R1 BetaSatisfaction with condition of other dwellings .74 .54 .74Satisfaction with friendliness .84 .71 .46Satisfaction with availability of parking .87 .76 .28Satisfaction with sense of community .89 .79 .26Satisfaction with public services .90 .80 .11Satisfaction with safety .90 .80 .07Satisfaction with availability of retail services .90 .80 .07Comparison with other Marines .90 .81 .07Satisfaction with racial mix .90 .81 -.06Comparison with neighborhood as a civilian .90 .81 .06Comparison with neighborhood while growing up .90 .82 .11Satisfaction with transportation .91 .82 .04Satisfaction with appearance .91 .82 .02Satisfaction with length of time to get to work .91 .82 .01
Table 20
Multiple Regression Predicting Civilian Housing Residents'Overall Satisfaction with Neighborhood
Variable Multiple R Rz BetaSatisfaction with appearance .77 .60 .77Satisfaction with friendliness .84 .71 .40Satisfaction with availability of parking .87 .75 .23Satisfaction with public services .88 .78 .20Satisfaction with availability of retail services .89 .79 .15Satisfaction with condition of other dwellings .90 .80 .18Satisfaction with racial mix .90 .81 .11Satisfaction with safety .90 .81 .11Comparison with neighborhood while growing up .90 .82 .07Satisfaction with length of time to get to work .90 .82 .05Comparison with other Marines .91 .82 .03Comparison with neighborhood as a civilian .91 .82 -.02Satisfaction with transportation .91 .82 .02Satisfaction with sense of community .91 .82 .003
Availability of parking and sense of community figure prominently in overall satisfaction forMarines living in all three types of housing. Roughly half the variance for BOQ/BEQ and militaryhousing residents is accounted for by appearance and racial mix; for civilian housing residents, the
29

top predictor (again accounting for more than half the variance) is appearance. Top predictor formilitary housing residents is condition of other dwellings.
Five variables (overall satisfaction, the three comparisons, and domain salience) were testedfor their combined effects as predictors of how Marines felt about their neighborhoods, as indicatedby scores on the D-T scale. Overall satisfaction with neighborhood by far accounted for most ofthe variance (50%). Table 21 shows the variables and their order of entry into the equation. Inseparate analyses for each type of housing, overall satisfaction was the top predictor for all three.In second position as a predictor of feelings about the neighborhood was salience for BOQ/BEQand military housing residents, while for civilian housing residents it was the comparison betweentheir own neighborhood and the neighborhoods of peers. Compared to the other two residencecategories, much less of the variance was accounted for by any single factor in the case of bachelorquarters residents.
Table 21
Multiple Regression to Predict Feelings About theNeighborhood Domain--Total Sample
Variable Multiple R Rz BetaSatisfaction with neighborhood overall .71 .50 .71Comparison with neighborhoods while growing up .72 .52 .13Comparison with other Marines' neighborhoods .73 .53 .11Domain Saliency .73 .53 .09Comparison with neighborhood as a civilian .73 .53 -.05
Summary of the Neighborhood Domain
Overall satisfaction with neighborhood among Camp Lejeune Marines was not all that positive,with a mean (4.8) approaching the "somewhat satisfied" range. As would be expected, assessmentsof the neighborhood domain were influenced by type of housing. Again, BOQ/BEQ residents werethe least positive in their assessments in almost every case. As was true in the case of residence,satisfaction tends to increase with rank group, and married Marines tend to be more satisfied thanthose never having been married.
Satisfaction ratings were low (in tenth place) for sense of community among all three housingsubgroups; also ranking low in satisfaction for civilian community residents were transportationand commuting time to work. Marines living in BOQ/BEQ rated time to work and safety highestin facet satisfaction; for military housing residents, top satisfiers were time to work and racial mix.Top satisfiers for Marines living out in the civilian community were parking and public services.
Respondents comparing their current neighborhoods to those they might be living in were theynot in the Marine Corps were fairly positive. By subgroup, BOQ/BEQ residents were actuallyhighest on this measure. Substantial numbers of Marines in all three types of housing rated theircurrent neighborhoods as worse than those neighborhoods in which they grew up. Comparing
30

current neighborhood with those of their peers, civilian housing residents gave the most favorablerating, BOQ/BEQ residents the least favorable; however, with respect to all three housing types,the most common response choice was that their neighborhood and those of their peers were aboutequal.
Results of a series of multiple regression procedures showed that, for BOQ/BEQ residents,appearance was the strongest predictor of overall satisfaction; for Marines living in civilianhousing, the top predictor was safety; and for military housing residents, it was condition of otherdwellings. In turn, regardless of housing type, overall satisfaction was the most powerful predictorof positive feelings about the neighborhood.
31

The Leisure and Recreation Domain
We turn our attention now to the domain of leisure and recreation. Supporting a host ofindustries (resorts, equipment, media, clothing) leisure and recreation have become importantactivities in the life and life-style of modem men and women. It frequently becomes the focus ofcomparisons between one's own situation and the situations of other individuals, families, orpopulation subgroups. Thus, leisure and recreation is an activity domain with high potential forinfluencing a Marine's perceptions of her or his overall QOL.
In addition to eliciting information on the D-T (feelings) scale, satisfaction scales, andcomparison items, this section of the survey also asked respondents to indicate the recreationalactivities in which they participated, and how often they did so. Subsequently, those who wereinfrequent users of recreational activities were asked to indicate the reasons for their non-participation.
To make the elicited information more meaningful, analyses in this section sometimescategorize respondents by a combination of marital status (never married, married, divorced/separated/widowed), and age (under 25, 25-35, and 36 and older).
Affective Evaluation of Leisure Time Activities
Marines at Camp Lejeune seemed relatively content with their recreation. More than half(53.9%) were either "pleased" or "mostly pleased," and 11.1 percent chose the "delighted"response. Only a few (17.3%) felt negative about their leisure and recreation. The mean score of4.8 is at mid-scale, but approaches a "mostly pleased" response.
Analysis of variance found statistically significant differences by paygrade group (positivefeelings tended to increase with rank), race (Whites and Hispanics were more positive than Blacksor "Other,") and age (positive feelings increased with age). Gender accounted for only a smalldifference, women being more positive than men.
Cognitive Evaluation of Leisure
Measurement in this domain used an overall satisfaction item, plus four items addressingsatisfaction with specific aspects (facets) of leisure and recreation. Overall satisfaction had a meanscore of 4.06, very close to the neutral point on the scale. Almost four out of ten (37.5%) respondednegatively, another 19.0 percent were neutral, and less than half (43.5%) chose a positive response.Variance in overall satisfaction showed differences by age, rank, and marital status, but not bygender or race. Satisfaction increased linearly with age.
Specific facet satisfaction items focused on variety of leisure activities available, cost of leisureactivities, facilities provided, and the amount of time available for leisure activities. Table 22displays correlations among the facet satisfactions and between each facet satisfaction and overallsatisfaction with leisure and recreation. At least moderate correlations existed between each of thefactors, with the strongest relationship being between variety of activities available and facilitiesprovided. Facilities provided was the facet most strongly correlated with overall satisfaction.
33

Table 22
Intercorrelations of Specific and Overall SatisfactionWith Leisure Time
Satisfaction Intercorrelations Correlations with OverallAspect Sat2 Sat3 Sat4 Satisfaction
1. Variety .64 .75 .33 .65
2. Cost .68 .38 .603. Facilities .41 .694. Amount of leisure time .65Notes.1. All correlations are significant at p < .001.2. With pairwise treatment of missing values, Ns for these analyses ranged from 1,111 to 1,115.
Leisure Activities
Marines participating in the survey were asked to indicate how often they participated in eachof 28 leisure activities. For clarity of data presentation, responses have been collapsed into threecategories: never, seldom, and frequent. Table 23 summarizes the results separately for married andunmarried personnel; shown is the percent of the subgroup in each participation category.
Overall, the patterns for participation in the various activities were similar across subgroups.Going to bars and clubs was quite a bit more typical of the unmarried Marines. Gardening, churchactivities, fixing things, and visiting with people were more heavily participated in by married thanby unmarried. These results hold no surprises, especially when one considers the relationshipbetween marital status and type of living quarters.
34

Table 23
Participation in Leisure Activities by Married and Unmarried Marines
Married Not MarriedActivity Never Seldom Frequent Never Seldom FrequentActive sports 14.2 336.9 48.9 11.8 36.3 51.9Working out, running 2.0 11.5 86.5 4.0 14.5 81.5Swimming 27.7 59.1 13.2 32.7 47.6 19.7Watching sports events 15.4 33.3 51.4 15.1 31.5 53.4Golfing 66.8 25.7 7.5 69.0 23.1 8.0Tennis and racquet sports 59.2 32.0 8.8 63.6 30.1 6.3Sailing 92.3 6.4 1.4 87.8 9.9 2.3Outdoor activities (e.g., camping) 33.5 51.9 14.6 35.9 46.4 17.7Fishing, boating 32.3 48.9 18.8 39.1 47.0 13.9Dining out 1.6 39.3 59.1 4.6 30.4 65.0Picnics, pleasure drives 10.1 50.1 39.8 24.8 43.1 32.1Going to the movies 12.2 65.0 32.8 5.5 51.9 42.6Going to clubs, bars 31.2 52.2 16.6 7.2 30.6 62.1Tune with friends, relatives 4.0 33.9 62.2 3.5 24.1 72.4Club meetings, activities 59.1 29.6 11.3 65.7 23.2 11.1Church activities 40.1 37.6 22.2 49.9 37.6 12.5Playing cards, indoor games 20.1 45.7 34.2 21.3 40.9 37.8Classes or lectures 49.9 39.0 11.1 49.7 33.3 17.0Concerts, plays, etc. 59.9 38.0 2.1 38.1 56.5 5.4Museums, exhibits, etc. 47.6 49.6 2.8 56.5 40.2 3.3Gardening and yard work 22.7 23.9 53.4 74.3 16.8 8.9Making and fixing things 12.0 35.7 52.2 54.7 30.9 14.4Hobbies, musical instrument 22.9 40.7 36.4 35.8 35.8 28.3Volunteering 46.6 42.7 10.6 53.4 36.6 10.1Shopping (except groceries) 4.4 45.8 49.8 8.4 48.7 42.9Reading 6.3 35.6 58.1 10.3 30.9 58.8Watching TV, video games 1.2 14.8 84.0 3.0 18.4 78.7Listening to music 1.6 7.0 91.4 0.0 2.0 98.0Note. Many respondents skipped items in the leisure activity participation section. This resulted in blank re-sponses that ranged from 209 for listening to music to a high of 1,841 for sailing. This wide range in the numberof missing responses across items could be taken as evidence that people were not just skipping the whole sec-tion, but rather were selectively picking items to respond to. It is possible that these missing responses shouldhave been included in the "never" category but they have instead been excluded from computation of percent-ages.
Reasons for Non-Participation in Leisure Activities
Marines who had not recently participated in a particular leisure activity were asked to indicatewhy they had not. They could choose from several response alternatives: "not available,""inadequate facilities," "too expensive," "low priority," and "not interested." Table 24 shows thefrequencies for their responses.
35

Table 24
Reasons for Non-Participation in Leisure Activities
Not Inadequate Too Low NotActivity Available Facilities Expensive Priority InterestedActive sports 12.9 13.1 2.4 47.4 24.1Working out, running 6.1 15.5 2.3 58.2 17.8Swimming 12.7 14.7 0.6 41.7 30.3Watching sports events 13.0 11.4 2.9 33.2 39.5Golfing 5.8 2.4 2.4 18.1 68.4Tennis and racquet sports 3.9 9.4 1.2 22.5 63.0Sailing 7.9 3.4 12.8 17.1 58.8Camping, hiking, and outdoor activities 7.3 10.2 6.0 37.4 39.1Fishing, boating 8.2 6.5 14.1 37.4 33.9Dining out 3.0 7.0 67.4 17.1 5.4Picnics, pleasure drives 11.2 9.3 8.4 43.2 28.0Movies 3.0 6.7 53.3 29.4 7.6Clubs, bars 2.4 9.0 26.6 22.6 39.4Time with friends, relatives 30.8 7.7 18.3 33.1 10.1Club meetings, activities 8.2 2.6 1.4 20.2 67.6Church activities 4.8 5.2 1.0 32.1 56.9Playing cards, indoor games 5.6 2.8 1.9 41.4 48.3Classes, lectures 10.4 5.4 4.3 21.5 58.4Concerts, plays 19.2 10.0 19.9 16.5 34.3Museums, exhibits 25.5 12.4 6.3 19.4 36.5Gardening, working in yard 32.7 7.4 1.6 14.5 43.8Making and fixing things 33.6 7.4 4.0 19.5 35.6Hobbies, painting, musical instrument 15.4 7.4 8.3 30.6 38.3Volunteering 9.6 2.4 0.8 31.3 56.0Shopping 4.5 5.5 51.9 23.2 14.9Reading 4.7 3.1 2.6 53.9 35.6Television, video games 11.6 14.4 8.9 47.9 17.1Listening to music 9.3 17.4 12.8 53.5 7.0
Social Comparisons
When asked to compare their current leisure with what they thought their leisure would be likein civilian life, respondents were surprisingly positive. Nearly three-fourths (74.7%) said theircurrent leisure was a little to much more enjoyable than it would be if they were civilians. Only 6.5percent chose negative responses. Those never married tended to view this issue more positivelythan their married counterparts, while the married and formerly married both had a high percentagewho said the two were about the same. There was no significant correlation between comparisonof current leisure with potential leisure as a civilian, and overall domain satisfaction with leisure.
36

A second comparison was made, this one between current leisure and leisure at other placeswhere the individual had been stationed since joining the Marine Corps. Results were againpositive, though less so, with only 28.5% choosing positive responses, and 43.7% choosingnegative.
Salience
Salience of leisure and recreation was moderately high, with a mean score (2.8) just up into the"a great deal" range of the scale. A small but significant correlation (r = .13, p = .000) was foundbetween the amount of time spent thinking about leisure activities and feelings about leisure. Asignificant but weak correlation (r = .18, p = .000) between salience and cognitive assessmentindicated a slight tendency for those who thought least often about leisure activities to be mostsatisfied overall with their leisure and recreation.
Variables Predicting Positive Assessment of Leisure and Recreation
Stepwise multiple regression procedures revealed that satisfaction with the amount of leisuretime was the best predictor of overall satisfaction with leisure and recreation for married Marines,but that facilities was the best predictor for the unmarried. The same potential predictors weretested for each group, with facet satisfactions and feelings about leisure and recreation emergingas the combination of variables that best predicted domain satisfaction. Tables 25 and 26 providesummaries of the analyses (only measures contributing at least a one percent increase in theaccounting for variance are shown). As inferred, comparison measures served as poor predictorsof domain satisfaction.
Table 25
Multiple Regression Predicting Married Marines'Overall Satisfaction With Leisure Time
Variable Multiple R Rz BetaSatisfaction with amount of leisure time .71 .51 .71Satisfaction with variety of activities .84 .70 .47Satisfaction with facilities provided .85 .73 .26Overall feeling about leisure time .86 .74 .14Satisfaction with cost of activities .87 .75 .12Comparison with last duty station .87 .75 .07Comparison with civilians .87 .75 -.04
37

Table 26Multiple Regression Predicting Unmarried Marines'
Overall Satisfaction With Leisure Time
Variable Multiple R Rz BetaSatisfaction with facilities provided .70 .48 .69Satisfaction with amount of leisure time .77 .60 .37Overall feeling about leisure time .82 .68 .32Satisfaction with variety of activities .83 .70 .19Satisfaction with cost of activities .83 .70 .05Comparison with last duty station .83 .70 -.03Comparison with civilians .83 .70 .02
Overall satisfaction and the facet satisfactions were used in multiple regression procedureswith feelings about leisure as the dependent variable. For both married and unmarried Marines,only about 28 and 39 percent, respectively, of the variance could be accounted for. In each caseoverall domain satisfaction accounted for much of that percentage by itself. Refer to Tables 27 and28 for summaries of these regressions.
Table 27
Multiple Regression Predicting Married Marines'Feelings About Leisure Time
Variable Multiple R RI BetaOverall satisfaction with leisure time .50 .25 .50Satisfaction with amount of leisure time .52 .27 .19Comparison with last duty station .53 .28 .09Satisfaction with cost of activities .53 .28 .05Satisfaction with variety of activities .53 .28 -.03Satisfaction with facilities provided .53 .28 .01Comparison with civilians .53 .28 -.002
Table 28
Multiple Regression Predicting Unmarried Marines'Feelings About Leisure Time
Variable Multiple R Rz BetaOverall satisfaction with leisure time .58 .33 .58Satisfaction with variety of activities .60 .36 .22Satisfaction with amount of leisure time .62 .38 -.18Comparison with last duty station .62 .39 .09Satisfaction with facilities provided .62 .39 -.07Comparison with civilians .62 .39 -.02Satisfaction with cost of activities .62 .39 .02
38

Summary of the Leisure and Recreation Domain
Responses to the questions in this section of the survey show that the Marines at Camp Lejeunetended to feel fairly positively about their leisure. Positive feelings increased with rank, and Whitesand Hispanics were more positive than were Blacks or Others. Overall satisfaction with leisure andrecreation was close to neutral, neither satisfied nor dissatisfied. With only a few exceptions (e.g.,dining out, movies) personal interest and preference account more for non-participation than anyother reason. Not surprisingly, single Marines frequent the bars and clubs more than their marriedcounterparts. For most of the women and men in the sample, current leisure compares veryfavorably with potential leisure as civilians, but not too favorably with the leisure they might beenjoying if stationed elsewhere in the Marine Corps.
39

The Health Domain
Because it exerts profound effects on all other areas of a person's life, health is perhaps one ofthe central contributors to overall QOL. However, it may be that those who are young and thosewho are fit take their health for granted, whereas those who have lost their health or suffer fromimpairment are most keenly aware of the effects of health on QOL.
The United States has been called a health-conscious society--even if the prescriptions for ahealthy life-style are honored more in the breach than in practice. The fitness aspect of health, atleast, has always been a part of life in the Marine Corps. Because of the stringent entrancerequirements and the extant fitness programs that are characteristic of service as a Marine, healthissues were not expected to be a problem for survey respondents. That expectation was generallysupported by the data.
Affective Evaluation of Health
Three out of four Marines in the Camp Lejeune sample (76.9%) reported feeling "pleased" to"delighted" about their health. Another 11.3 percent felt "unhappy" to "terrible" about their health,while 11.7 percent chose a neutral response.
Subgroup comparisons revealed only two significant differences: senior enlisted were morepositive about health than junior enlisted, but junior officers were more positive than senior; and,married were most positive, never married least, and formerly married in the middle. No significantdifferences were found for race or gender.
Most of these Marines (82.0%) had attained a First Class score on their most recent physicalfitness test (PFT), and less than two percent (1.8%) had failed. The mean number of days missedfrom work in the past year due to illness or injury was 5.3.
Almost seven out of 10 respondents (69.0%) were non-smokers. Significant differences werefound between smokers and non-smokers in terms of feelings about this domain, with non-smokersfeeling better about their state of health. Significant differences also existed between feelings abouthealth and PFT scores, with feelings increasing in positive aspect linearly with PFT score, fromfailure to First Class.
Cognitive Evaluation of Health
Six facet satisfaction and one overall satisfaction items were used in the cognitive measurementof satisfaction with health. Overall satisfaction with health correlated positively with the affectivemeasure described previously (r = .72,p < .000). The mean response to the overall satisfaction itemwas 5.30, corresponding to "somewhat satisfied" on the seven-point scale. Analyses found thatonly 14.1 percent of the Marines sampled indicated dissatisfaction with their health, while 75.3percent expressed some degree of satisfaction.
One-way analyses of variance were conducted to isolate the effects of gender, race, rank,marital status, smoker status, and PFT score on overall satisfaction with health. Significantdifferences were found for rank, marital status, smoker status, and PFF score. As would be
41
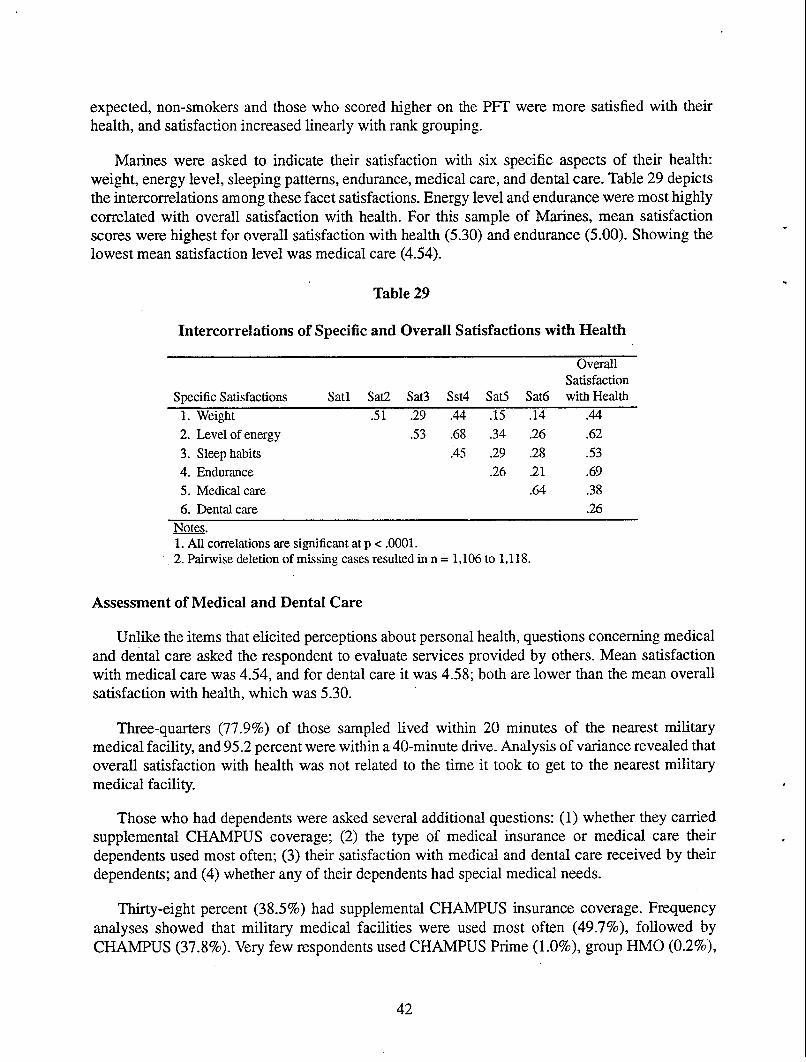
expected, non-smokers and those who scored higher on the PFT were more satisfied with theirhealth, and satisfaction increased linearly with rank grouping.
Marines were asked to indicate their satisfaction with six specific aspects of their health:weight, energy level, sleeping patterns, endurance, medical care, and dental care. Table 29 depictsthe intercorrelations among these facet satisfactions. Energy level and endurance were most highlycorrelated with overall satisfaction with health. For this sample of Marines, mean satisfactionscores were highest for overall satisfaction with health (5.30) and endurance (5.00). Showing thelowest mean satisfaction level was medical care (4.54).
Table 29
Intercorrelations of Specific and Overall Satisfactions with Health
OverallSatisfaction
Specific Satisfactions Satl Sat2 Sat3 Sst4 Sat5 Sat6 with Health1. Weight .51 .29 .44 .15 .14 .442. Level of energy .53 .68 .34 .26 .62
3. Sleep habits .45 .29 .28 .534. Endurance .26 .21 .695. Medical care .64 .386. Dental care .26
Notes.1. All correlations are significant at p < .0001.2. Pairwise deletion of missing cases resulted in n = 1,106 to 1,118.
Assessment of Medical and Dental Care
Unlike the items that elicited perceptions about personal health, questions concerning medicaland dental care asked the respondent to evaluate services provided by others. Mean satisfactionwith medical care was 4.54, and for dental care it was 4.58; both are lower than the mean overallsatisfaction with health, which was 5.30.
Three-quarters (77.9%) of those sampled lived within 20 minutes of the nearest militarymedical facility, and 95.2 percent were within a 40-minute drive. Analysis of variance revealed thatoverall satisfaction with health was not related to the time it took to get to the nearest militarymedical facility.
Those who had dependents were asked several additional questions: (1) whether they carriedsupplemental CHAMPUS coverage; (2) the type of medical insurance or medical care theirdependents used most often; (3) their satisfaction with medical and dental care received by theirdependents; and (4) whether any of their dependents had special medical needs.
Thirty-eight percent (38.5%) had supplemental CHAMPUS insurance coverage. Frequencyanalyses showed that military medical facilities were used most often (49.7%), followed byCHAMPUS (37.8%). Very few respondents used CHAMPUS Prime (1.0%), group HMO (0.2%),
42

group fee-for-service policies (0.5%), private HMO (1.4%), or private fee-for-service (2.1%).Analyses of variance revealed that no significant effects on satisfaction with either dependentmedical or dental care could be attributed to type of medical facilities or insurance coverage fordependents. Highest mean satisfaction levels for medical care went to private fee for service (4.67)and military medical facilities (4.18); highest satisfaction for dependent dental care was withprivate fee for service (4.67) and group fee for service (4.00).
Slightly less satisfaction was expressed by these Marines for dependent medical care than forthe medical care they themselves received. The same relationship held true in the case of dentalcare.
Respondents with dependents were asked whether any of those dependents had special medicalneeds. Of the 40.8 percent of respondents having dependents with special medical needs, 5.3percent indicated a spouse, 3.3 percent indicated a dependent child living with them, 1.2 percent adependent child not living with them, and 0.4 percent a parent or other dependent. Marines havingdependents with special medical care needs were significantly less satisfied than other Marineswith both the medical and dental care their dependents received.
Salience
Forty-three percent (43.1%) of the Marines surveyed reported that their health was on theirmind "quite a bit" to "all the time." Another 25.7 percent answered with the response "once in awhile," and 31.3 percent said "seldom" to "not at all."
On the face of it, these figures indicate a rather heavy concern with health issues, that is, highsalience for this domain, which most often would tend to be associated with health problems. Asis true for Americans in general, Marines without health problems tend to show little concern forhealth issues. However, it may be conjectured that what is driving these figures higher is notconcern for health at a global level, but a more specific concern for fitness, something very muchon the minds of all Marines, and critical to the organization itself.
Social Comparisons
Comparing their current health with what their health would be if they were a civilian, 42.7percent felt the two were about the same; 24.5 percent thought their current health was worse, 32.8percent thought it better. Comparing their own health to that of other Marines, 45.3 percent thoughtthemselves to be healthier, 13.5 percent thought they were less healthy than their contemporaries,and 40.8 percent felt about equal. Analyses of variance found no significant effects on comparisonwith civilians for either smoker status, but did for PFT score. However, both smoker status and PFTscore significantly affected comparison with other Marines, smokers and lower scoring individualstending to rate their own health lower by comparison.
Variables Predicting Positive Assessment of Health
A step-wise regression was used to identify the combination of factors best predicting overallsatisfaction with health. Included in the analysis were: the six facet satisfactions, rank, saliency,and social comparison measures. For these Marines, satisfaction with endurance was the top
43

predictor of overall satisfaction with health, accounting, by itself, for 48 percent of the variance.Other important predictors were sleep (an additional 5% of the variance), comparison with otherMarines (an additional 4%), and salience (an additional 3%).
Another stepwise regression was conducted to determine the best predictors of positiveaffective assessment of health. With respect to the D-T health domain measure, overall satisfactionwith health was the strongest predictor, accounting for nearly 51 percent of the variance;comparison with fellow Marines was second, accounting for an additional 2 percent of thevariance, and comparison with civilians was third, accounting for another two percent. Results ofthe regressions are found in Tables 30 an 31.
Table 30
Multiple Regression Predicting Overall Satisfaction With Health
Variable Multiple R RL Beta InSatisfaction with endurance .69 .48 .69Satisfaction with sleep .73 .53 .26Social comparison with other Marines .76 .57 .21Saliency .76 .60 .17Satisfaction with medical care .79 .62 .16Satisfaction with energy .80 .64 .14Social comparison with civilians .80 .65 .12Satisfaction with weight .81 .65 .09Satisfaction with dental .81 .65 -.04
Table 31
Multiple Regression Predicting Feelings About Health
Variable Multiple R Rz Beta InOverall satisfaction with health .72 .51 .72Social comparison to other Marines .73 .53 .16Social comparison to other civilians .74 .55 -.14Satisfaction with sleep .75 .56 .09Saliency .75 .56 .07Satisfaction with endurance .75 .56 -.07Satisfaction with dental .75 .56 .04Satisfaction with weight .75 .57 -.03Satisfaction with energy .75 .57 .04Medical care .75 .57 .01
44

Summary of the Health Domain
Few of the Marines at Camp Lejeune (11.3%) reported feeling negative about the state of theirhealth. In fact, three out of four (76.9%) said they were "pleased" to "delighted" about their health.There were no subgroup differences for gender or race. However, senior enlisted were morepositive about health than junior enlisted, junior officers were more positive than senior; and,married were most positive, never married least, and formerly married in the middle. As would beexpected, non-smokers and higher performers on the PFT tended to feel better about their state ofhealth.
Mean overall satisfaction with health was 5.30, with 75.3 percent expressing some degree ofsatisfaction with their health. As with the affective measure, non-smokers, high scorers on the PFT,and higher ranked individuals scored higher as well on the cognitive evaluation (i.e., overallsatisfaction with health). Endurance and energy level were most highly correlated with overallsatisfaction.
Mean satisfaction with both medical care (4.54) and dental care (4.58) was moderate. Therewas no relationship between driving time to nearest military medical facility and overallsatisfaction with health.
In this sample of Camp Lejeune Marines, almost four out of ten (38.5%) carried CHAMPUSsupplemental insurance. For dependent health care, military medical facilities were used mostoften, followed by CHAMPUS. Highest satisfaction for medical care went to private fee for serviceand military medical facilities, whereas for dependent dental care, it was private fee for service andgroup fee for service. No relationship was found between overall satisfaction and source oftreatment received by dependents. Respondents expressed somewhat less satisfaction with medicaland dental care for their dependents than for themselves.
The best predictor of overall satisfaction with health was satisfaction with endurance. Bestpredicting positive affective evaluation of personal health was overall satisfaction with personalhealth.
45
The Friends and Friendships Domain
For many, friendships and other interpersonal relationships contribute greatly to life's meaningand satisfaction, and form an important part of an individual's social support mechanism. Servicein the Marine Corps potentially has dual and somewhat contradictory effects in this domain. Thenature of the work impels close interactions and interdependencies, whereas periodic relocationexposes the individual Marine to many new acquaintances; that same mobility, however, mayprove inimical to long-term, deep, and lasting relationships.
Affective Evaluation of Friends and Friendships
The great majority (69.4%) of Marines in the Camp Lejeune sample expressed positive feelingsabout their friendships; 28.6 percent were "mostly pleased," 30.8 percent were "pleased," and 10.0percent said they were "delighted." Only 12.3 percent selected a negative response, and 18.4percent were "neither happy nor unhappy."
Neither tenure in the Marine Corps nor months at Camp Lejeune was significantly related toaffective evaluation of friendships. There were no subgroup differences by race, gender, maritalstatus, or age.
Cognitive Evaluation of Friends and Friendships
Four facet satisfaction items and one overall satisfaction item were used for the cognitiveassessment in this domain. Facet satisfactions included: amount of time spent socializing withfriends, number of Marine Corps friends, number of civilian friends, and support andencouragement received from friends. Mean overall satisfaction was 5.27, in the "somewhatsatisfied" range. A positive response was chosen by 72.7 percent of the respondents, with only 10.2percent choosing a negative.
With respect to facet satisfactions, Marines were most satisfied with support andencouragement received from friends, with a mean score of 5.24; number of Marine friendsfollowed with a mean score of 5.22. Support and encouragement received from friends was mostclosely correlated with overall domain satisfaction (r = .75, p = .000). Intercorrelations among thefacet satisfactions, and the correlation of each facet satisfaction with overall satisfaction are shownin Table 32.
47
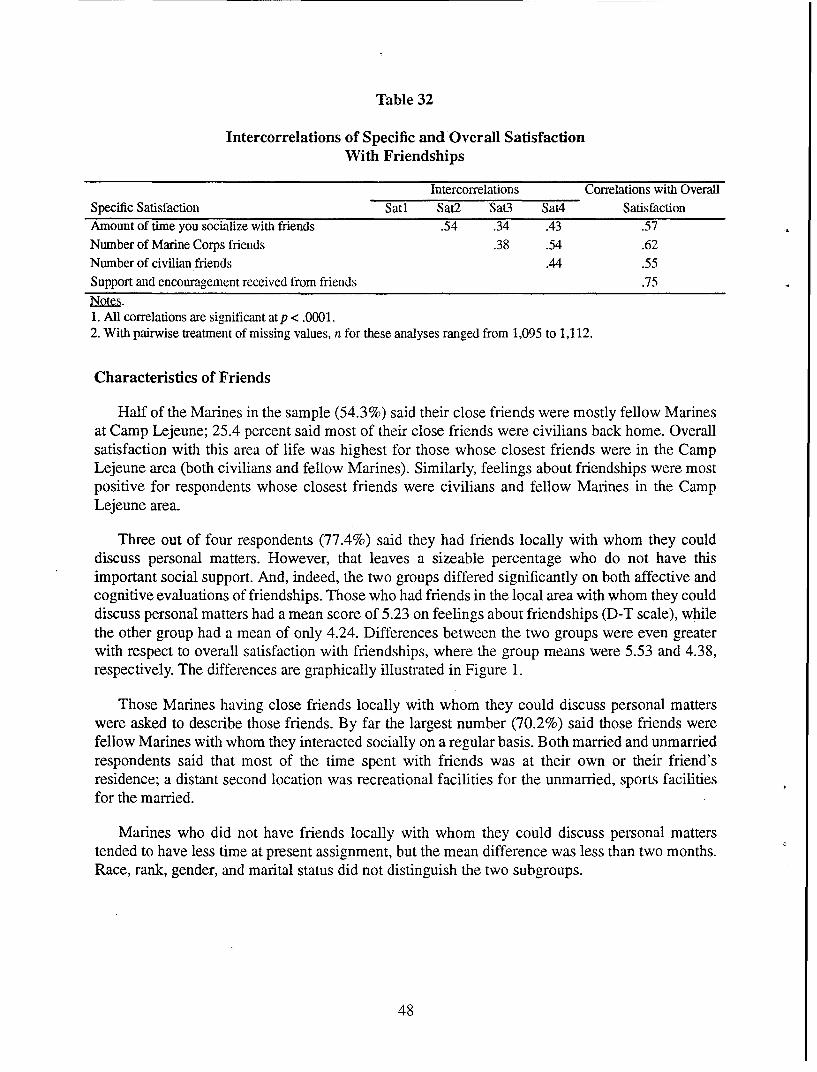
Table 32
Intercorrelations of Specific and Overall SatisfactionWith Friendships
Intercorrelations Correlations with OverallSpecific Satisfaction Sati Sat2 Sat3 Sat4 SatisfactionAmount of time you socialize with friends .54 .34 .43 .57Number of Marine Corps friends .38 .54 .62Number of civilian friends .44 .55Support and encouragement received from friends .75Notes.1. All correlations are significant at p < .0001.2. With pairwise treatment of missing values, n for these analyses ranged from 1,095 to 1,112.
Characteristics of Friends
Half of the Marines in the sample (54.3%) said their close friends were mostly fellow Marinesat Camp Lejeune; 25.4 percent said most of their close friends were civilians back home. Overallsatisfaction with this area of life was highest for those whose closest friends were in the CampLejeune area (both civilians and fellow Marines). Similarly, feelings about friendships were mostpositive for respondents whose closest friends were civilians and fellow Marines in the CampLejeune area.
Three out of four respondents (77.4%) said they had friends locally with whom they coulddiscuss personal matters. However, that leaves a sizeable percentage who do not have thisimportant social support. And, indeed, the two groups differed significantly on both affective andcognitive evaluations of friendships. Those who had friends in the local area with whom they coulddiscuss personal matters had a mean score of 5.23 on feelings about friendships (D-T scale), whilethe other group had a mean of only 4.24. Differences between the two groups were even greaterwith respect to overall satisfaction with friendships, where the group means were 5.53 and 4.38,respectively. The differences are graphically illustrated in Figure 1.
Those Marines having close friends locally with whom they could discuss personal matterswere asked to describe those friends. By far the largest number (70.2%) said those friends werefellow Marines with whom they interacted socially on a regular basis. Both married and unmarriedrespondents said that most of the time spent with friends was at their own or their friend'sresidence; a distant second location was recreational facilities for the unmarried, sports facilitiesfor the married.
Marines who did not have friends locally with whom they could discuss personal matterstended to have less time at present assignment, but the mean difference was less than two months.Race, rank, gender, and marital status did not distinguish the two subgroups.
48

6- 5.535.235 - 4.38
4.244-
3-
2
17
D-T Scale Overall Satisfaction
Do you have friends at this location with whomyou feel free to discuss personal matters?
EY E No
Figure 1. The effect of having a friend with whomto discuss personal matters on summaryevaluation of friendships.
Social Comparisons
When asked whether it was easier to make friends as a Marine or as a civilian, 39.1 percent saidit was about the same; 31.6 percent thought it was harder as a Marine, 29.3 percent easier. Maritalstatus, rank, and gender made no difference on this variable. Racial differences were significant.Whites reported finding it easier than Blacks; Hispanics found it even more difficult to makefriends, and individuals in the Other category found it easiest.
Respondents were also asked to make a comparison between themselves and other Marines onnumber of friends. Subgroup comparisons showed that Whites reported having the most friends,followed by Hispanics, Other, and Blacks in that order. Marital status, gender, and rank had nosignificant effect. Overall, half the respondents (50.1%) said they had about the same number offriends as their contemporaries, 30.0 percent said fewer and 19.8 percent said they had more.
Salience
With a mean of 3.98, salience was moderate, near the midpoint of the scale. One-third of theMarines in the sample (36.4%) said they had friends on their mind "quite a bit" to "almost all thetime." About the same number (32.6%) answered "once in a while," and 31.0 percent said"seldom" to "not at all." Salience, that is, having friends on one's mind, was not significantlycorrelated with cognitive evaluation (overall satisfaction with friends and friendships) and onlyvery weakly correlated with affective evaluation of this domain (feelings about friends andfriendships) (r = .09, p = .001).
49

Variables Predicting Positive Assessment of Friends and Friendships
Stepwise multiple regression procedures were used to identify the combination of factors thatwould best predict positive affective and cognitive assessments of this domain. Variables includedfacet satisfactions, comparisons, salience, and rank.
With respect to overall satisfaction, the four facet satisfactions clearly were the best predictors.Comparisons, rank, and salience accounted for little of the variance. In turn, overall satisfactionwith friends and friendships was the single best predictor of positive feelings about this domain,with the comparison factors adding to the strength of the prediction. Tables 33 and 34 summarizethe results of the regressions.
Table 33
Multiple Regression Predicting Overall SatisfactionWith Friends and Friendships
Variable Multiple R RL Beta InSatisfaction with support and encouragement received .75 .56 .75Satisfaction with amount of time socializing with friends .80 .64 .31Satisfaction with number of civilian friends .82 .68 .21Satisfaction with number of Marine Corps friends .83 .69 .18Comparison--civilian .84 .70 .07Comparison--other Marines .84 .70 -.05Rank .84 .70 -.02Salience .84 .70 .01
Table 34
Multiple Regression Predicting Feelings About Friends and Friendships
Variable Multiple R Rz Beta InOverall satisfaction with friend and friendships .65 .43 .65Comparison--other Marines .67 .44 .13Comparison--civilian .67 .45 -.07
Summary of the Friends and Friendships Domain
Almost three out of four of these Camp Lejeune Marines (69.4%) felt positive about theirfriendships. An even higher percentage (72.7%) expressed overall satisfaction with this area oftheir lives. Support and encouragement received from friends most closely correlated with overallsatisfaction, and, of the four facet satisfactions, that one received the highest mean satisfactionscore.
50

Half (54.3%) of those in the sample had for their closest friends civilians in the local area andfellow Marines at Camp Lejeune, and 77.4 percent of the respondents had friends in the local areawith whom they could discuss personal matters, usually at their own or their friend's residence.Most felt that making friends as a Marine and as a civilian had about equal difficulty or that it waseasier as a Marine. Half said they had about as many friends as did other Marines.
This domain showed moderate salience. The four facet satisfactions were the best predictors ofoverall satisfaction, and overall satisfaction was the best predictor of positive feelings about friendsand friendships.
51

The Marriage and Intimate Relationships Domain
Without question, intimate relationships, of which marriage is one, hold a central position inthe lives of most individuals. In addition to exerting powerful influences on perceptions of Qualityof Life in general, the quality of those relationships, and satisfaction or dissatisfaction with them,often have profound effects on other domains of life, quite often the workplace.
An additional variable was created to make the analyses more faithful to current social realities.Most analyses for this section of the questionnaire were conducted separately for married Marines,for those involved in an intimate relationship, and for those who were not involved. Marines notinvolved in an intimate relationship were not asked some of the questions, for obvious reasons.
Within the total sample, 48.0 percent were married. One-fourth (24.6%) were unmarried andinvolved in an intimate relationship, whereas 31.7 percent were unmarried and not involved. Anoverwhelming percentage (90.8%) of the uninvolved had never been married; separated, divorced,and widowed accounted for only 9.2 percent of them. In terms of the total sample, E-2 to E-4s hadthe highest percentage never married (62.4%) and the highest percentage uninvolved in any seriousrelationship (35.4%). Next came O-1--O-4s with 40.4 percent never married and 19.2 percent notseriously involved. Mean age for the uninvolved subgroup was 22.3, compared with a mean of 24.5for the entire sample.
Male Marines were less likely than female Marines to be married or involved in an intimaterelationship; females showed the lowest percentage of non married, not involved. Other had thehighest percentage of uninvolved (40.0%), followed by Whites at 29.9 percent, Hispanics at 26.1percent, and Blacks at 21.2 percent.
Affective Evaluation of Marriage and Intimate Relationships
Asked to indicate their feelings about their marriages or intimate relationships, more than halfof these Camp Lejeune Marines (57.3%) answered in positive terms (i.e., "mostly pleased" to"delighted"); those feeling "mostly unhappy" to "terrible" totaled 28.1 percent. The sample meanresponse was 4.64, about midway between neutral and "mostly pleased."
Significant subgroup differences were found. With respect to age, the youngest respondentshad the lowest mean score on the D-T scale. Positive affective evaluation increased linearly withage groups, but gender and race differences were not significant. Lower ranking enlisted and officerpersonnel scored lower on affective evaluation than their more senior contemporaries. As might beexpected, married individuals were most positive about their intimate relationships, those involvedsomewhat less so, the uninvolved least. The married were also more pleased with theirrelationships than were the formerly married, both groups being more pleased than those neverhaving been married.
Differences were also very apparent among the various involvement subgroups. Meanresponse for affective evaluation was 5.47 for married Marines, compared to 4.64 for single,involved; more than a full point below them were the single, uninvolved, with a mean of 3.21. Theuninvolved group had 57.4 percent feeling negative about their relationships; in contrast, three outof four of the married (77.7%), and 60.9 percent of the single involved expressed positive feelings
53

about their relationships. The formerly married who were involved in an intimate relationship had38.7 percent in the pleased response categories (with a mean of 4.08), compared with 60.0 percentof the formerly married but not involved who indicated being unhappy about their relationships.Those never having been married and not currently involved were also unhappy, with 57.2 percentgiving negative responses (mean of 3.20).
While it could be conjectured that length of time in a relationship might have an effect onfeelings about that relationship, neither for the married nor for the unmarried involved respondentswas there any significant relationship between length of the relationship and affective evaluationof the relationship using the D-T scale.
Cognitive Evaluation of Marriage and Intimate Relationships
Six facet satisfactions (love and understanding, communication, the way in which conflicts areresolved, partner's support for military career, compatibility of interests, and the sexual aspect ofthe relationship) and one measure of overall satisfaction were used in the cognitive evaluation.Eighty-six percent (85.9%) of the married Marines chose a positive response for the overallsatisfaction item; the unmarried involved Marines had even more in that category, 88.5 percent.Mean satisfaction scores were 5.95 for the married, and 6.05 for the single involved. Single, notinvolved had only 22.2 percent responding on the positive end of the scale, with a mean satisfactionscore of 3.22.
Intercorrelations among the various facet satisfactions varied from two highs of .79 (betweenlove and understanding and communication, and between communication and conflict resolution)and a low of .45 between partner's support for military career and the sexual aspect of therelationship. However, all intercorrelations were positive and significant (p = .000). Each of thefacet satisfactions correlated positively with overall satisfaction. Most highly correlated was loveand understanding received (r = .83), while partner's support for military career was lowest(r = .55). Table 35 shows the intercorrelations among the facet satisfactions, as well as thecorrelation between each facet and overall satisfaction.
Table 35
Intercorrelations of Specific and Overall SatisfactionWith Marriage/Intimate Relationship
Specific Satisfactions Overall DomainAspect Sati Sat2 Sat3 Sat4 Sat5 Sat6 Satisfaction1. Love and understanding .79 .74 .59 .66 .61 .832. Communication .79 .56 .64 .60 .753. Conflict resolution .59 .68 .56 .744. Support for military career .50 .45 .555. Compatibility of interests .62 .716. Sexual aspect .74N=. All correlations are significant at p < .0001.
54

Subgroup analyses revealed differences between the facet satisfaction responses of the marriedand the involved Marines. As can be seen in Table 36, the mean responses of these two subgroupsdiffer significantly on only two items: partner's support for military career and compatibility ofinterests. With respect to the first element, the single but involved are less satisfied than themarried, whereas on the second, the single are more satisfied. However, the mean responsesindicate that members of both groups are at least somewhat satisfied with all of the separateelements.
Table 36
Mean Ratings of Satisfactions With Marriage/IntimateRelationship by Involvement Status
Satisfaction Married Respondents Involved Respondentsn M SD n M SD t
Love and understanding 521 5.93 1.40 234 6.00 1.34 -.73Communication 521 5.63 1.55 234 5.48 1.60 1.07Conflict resolution 521 5.57 1.51 231 5.71 1.39 1.18Support for military career 518 5.83 1.47 232 5.51 1.28 2.65*Compatibility of interests 518 5.70 1.48 233 5.97 1.28 1.34*Sexual aspect 516 5.88 1.56 232 6.10 1.54 -1.82Overall domain satisfaction 519 5.95 1.47 234 6.05 1.30 -.94*p <. 0 1.
**p < .001.
Analysis by length of time in the relationship showed that, while 16.1 percent of the marriedMarines had been in a relationship of 12 months or less, 42.3 percent of the unmarried-involvedhad relationships of 12 months or less. Length of relationship was not significantly correlated witheither facet or overall satisfaction items.
Social Comparisons
All respondents, regardless of relationship category, were asked to compare their currentrelationship situation to the one they might be enjoying as a civilian. Very few (6.4%) comparedtheir current relationship situation favorably. "About the same" was the response of 26.6 percent,whereas 67.0 percent thought their relationship situation would be better if they were civilians.
There were several subgroup differences. Junior enlisted and senior officers had the highestmean scores, and, closely related, mean scores decreased with age. (The higher the mean score, themore the individual thinks things would be better in civilian life.) Women had a lower mean scorethan men. Racial differences were not significant. The comparison was most favorable to theMarine Corps on the part of the married, least favorable among the single, never married. SingleMarines, both involved and not involved in intimate relationships at the time of the survey, feltmore strongly than married Marines that their relationship situation would be better if they werecivilians.
55

In a second comparison, this time between their own relationship situation and those of theirMarine peers, 42.6 percent said the two were about the same; 16.7 percent thought theirs wasworse, 40.7 percent thought theirs was better. E-2 to E-4s compared themselves least favorablywith their peers in this regard, senior officers most positively. Comparisons of self andcontemporaries were increasingly positive with age. Those who were never married comparedtheir situation least favorably, while those formerly married were more positive, and thosecurrently married most positive. The married Marines were also more positive in comparing theircurrent situation with that of their peers than either the unmarried involved or unmarried notinvolved. Gender and race had no significant effects on this comparison.
Salience
Marines were asked how often marriage or intimate relationships had been on their mind lately.From one-fifth of those in the sample who were married (19.2%), the answer was "almost all thetime." Approximately equal percentages were recorded for "a great deal" (18.1%), "quite a bit"(18.3%), and "once in a while" (20.2%). For singles involved in an intimate relationship, saliencewas even higher: 82.8 percent answered in the "quite a bit" to "almost all the time" categories.Even for those not involved in an intimate relationship at the moment, salience was high, with 69.3percent choosing one of the top three responses. A weak positive correlation was found betweenthe affective evaluation of this domain and salience, but no significant correlation was foundbetween salience and cognitive evaluation.
Subgroup comparisons on this measure revealed no significant differences by race or gender.There were, however, differences by age, and by age-associated variables of rank, marital status,and relationship status. Salience decreased with age. Junior enlisted tended to have relationshipson their mind more than senior enlisted, junior officers more than either senior officers. Single,never married and formerly manied both scored higher on salience than the married. MarriedMarines had relationships on their mind less than those who were single but involved, and thosenot involved in an intimate relationship scored highest on salience.
Variables Predicting Positive Assessment of Marriage and Intimate Relationships
Stepwise regression was used to identify the combination of variables that best predictedpositive assessment of the marriage and intimate relationships domain. Variables included six facetsatisfactions, comparisons, time in the relationship, and salience. The analyses were conductedseparately for those married and those single but involved in an intimate relationship.
With respect to the married subgroups overall satisfaction with marriage and intimaterelationships, four facet satisfactions accounted for 87 percent of the variance. As can be seen inTable 37, compatibility of interests by itself accounted for 72 percent; love and understandingreceived added another 12 percent. Satisfaction with the sexual aspects of the relationship andcompatibility of interests together accounted for another three percent.
Somewhat less of the variance was explained by the candidate variables in the case of singleMarines involved in an intimate relationship. In this case, four factors, again all facet satisfactions,together accounted for approximately 66 percent of the variance, with the most powerful predictorsbeing love and understanding received, compatibility of interests, the sexual aspect of the
56

relationship, and communication. As shown in Table 38, the best predictors for the involvedoverlapped greatly with those for married Marines.
Table 37
Multiple Regression Predicting Overall SatisfactionWith Marriage
Variable Multiple R Rz Beta InCompatibility of interests .85 .72 .85Love and understanding .92 .84 .47Sexual aspect .92 .85 .21Communications .93 .87 -.36Saliency .94 .88 -.05Compared to other Marines .94 .88 .02Support for military career .94 .88 .02Conflict resolution .94 .88 -.02How long in relationship .94 .88 -.007Compared to civilians .94 .88 -.007
Table 38
Multiple Regression Predicting Overall SatisfactionWith Intimate Relationship
Variable Multiple R Rz Beta InLove and understanding .73 .54 .73Interests .78 .61 .30Sexual aspect .80 .64 .21Communication .82 .66 .19Conflict resolution .82 .67 .14Saliency .82 .68 .08How long in relationship .83 .68 -.08Compared to civilians .83 .68 -.02Compared to Marines .83 .68 .02Support for military career .83 .68 .01
In predicting positive affective assessment in this domain, five factors accounted for 53 percentof the variance for the married personnel. The strongest predictor was satisfaction with love andunderstanding received (accounting by itself for approximately 36 percent of the variance),followed by comparison with fellow Marines, salience, and compatibility of interests.
Nearly the same amount of variance was accounted for by the candidate variables in the caseof the single, involved Marines. The best predictor (comparison with fellow Marines) accounted
57

for only 17 percent of the variance. Adding in support for military career, comparison withcivilians, overall satisfaction, and compatibility of interests accounted for another 16 percent.Evidently, positive assessment in this domain by the single involved respondents depended onfactors not considered in the regressions. Tables 39 and 40 summarize the regressions for affectiveassessment.
Table 39
Multiple Regression Predicting Feelings About Marriage
Variable Multiple R R' Beta InLove and understanding .60 .36 .60Compared to other Marines .67 .45 .31Saliency .70 .49 .20Interests .72 .52 .25Conflict resolution .73 .53 -.17Overall satisfaction with marriage .73 .53 .13Sexual aspect .73 .53 -.07Length of time in marriage .73 .53 -.02Communications .74 .53 .13Compared to civilians .74 .53 .02Support for military career .74 .53 .002
Table 40
Multiple Regression Predicting Feelings AboutIntimate Relationship
Variable Multiple R R' Beta InCompared to other Marines .42 .17 .42Support for military career .48 .23 .25Compared to civilians .52 .27 -.19Overall satisfaction with intimate relationship .54 .29 .16Interests .58 .34 -.27Communication .58 .34 .10Saliency .59 .35 .07Love and understanding .59 .35 .06Sexual aspect .59 .35 .04Length of time in relationship .59 .35 .03Conflict resolution .59 .35 .03
58
Summary of the Marriage and Intimate Relationships Domain
Principal subgroups used for the analyses in this domain were married, involved in an intimaterelationship, and uninvolved. The uninvolved made up 31.7 percent of the sample. They weremostly young, junior enlisted and officer personnel, the majority of whom had never been married.
More than half the respondents felt positive about their relationship, while about one in fourfelt unhappy with their relationship situation. Younger Marines were lowest in affectiveassessment. Race and gender failed to account for any significant subgroup differences. MarriedMarines felt better about relationships than did those not having a relationship. Length of time inthe relationship seemed to make little difference in feelings about the relationship.
With respect to overall satisfaction in this domain, eight out of ten chose responses on the
positive end of the scale. The facet satisfaction most closely correlated with overall satisfactionwas satisfaction with the love and understanding received.
59
The Relationships with Children Domain
A Marine's performance at work and overall quality of life in general both can be severelyaffected by that individual's relationships with her or his children. Although this has always beentrue, the breakdown of the typical American family pattern, the dramatic increase in the number ofsingle-parent families, and the often turbulent relations between children and parents during timesof rapid social change, all conduce to a heightened interest in this domain.
Because of the many concerns and issues that confront single parents, the analyses for thisdomain were conducted separately in several areas for single parents and parents with partners.Single parents constituted only 5.8 percent of the sample from Camp Lejeune. However, theirunique concerns, and the fact that many individuals endure single parenthood for some time duringtheir lives, make the information contained in this section of increased relevance.
In this sample, the highest percentages of single parents were found among senior enlisted(11.1%) and warrant officers (8.3%)--although there were few in the latter category in actualnumbers. Single parenthood was most likely among Blacks (12.3%), Others (5.6%), and Hispanics(5.1%), less so among Whites (4.4%). Average age of the single parents was 27.3, compared withan average of 24.6 for the sample as a whole. Of those with children from previous marriages (8.8percent of the sample), 26.8 percent had full custody of all the children, 2.1 percent had full custodyof some of the children, 33.0 percent had shared custody, and 38.1 percent had no custody. Singleparenthood characterized 14.8 percent of the females in the sample, 5.3 percent of the males.
Affective Evaluation of Relationships with Children
Because of varying custody arrangements, respondents were asked to indicate how they feltabout the children living with them, and also how they felt about those who were not.Approximately two-thirds (62.70%) of the Marines in this sample from Camp Lejeune had nochildren living either in or away from the home.
Of those having children living with them, 55.7 percent were "pleased" or "mostly pleased"about their relationships with those children; 21.3 percent marked "neither happy nor unhappy,"15.9 percent were "mostly unhappy," and 6.2 percent felt "unhappy" or "terrible" about therelationships in question. With respect to those not having children living with them, 71.5 percentchose the "pleased" response, with each of the other responses showing relatively equalfrequencies at 1-2 percent.
Further analyses showed that neither race nor gender was significantly related to respondents'feelings about relationships with children who were living with them. Feeling worst about theserelationships were senior officers, whereas junior enlisted and junior officers felt best about them.Younger Marines tended to feel slightly better about relationships with children who were livingwith them. Average scores on the D-T scale were more positive for those persons who were notinvolved in an intimate relationship than for those who were, and married persons were leastpositive. Married respondents were also less happy about these relationships with children in thehome than were divorced, separated, or widowed, and those who had never been married were inthe middle. Single parents felt better about relationships with children who were living at homethan did married parents.
61

For the subgroup having children who were not living with them, rank, race, and genderaccounted for no significant differences in feelings (affective assessment). Age groups againdiffered, with those youngest being most positive. In this case, the married were most positive,widowed, separated, and divorced next, with those who had never been married least. Byrelationship status, married were most pleased, those not involved in an intimate relationship in themiddle, and those single involved a distinct last. Married parents felt significantly better about theirrelationships with children living away from home than did single parents.
Cognitive Evaluation of Relationships with Children
Cognitive measurement was accomplished using one overall satisfaction and five facetsatisfaction items. Three out of four (75.7%) of the Marines responding said they were "somewhatsatisfied" to "completely satisfied" overall. Neutral responses were made by 7.8 percent, and thosechoosing "somewhat dissatisfied" to "completely dissatisfied" comprised only 16.4 percent of thesample. Those who were married were more satisfied than those involved but not married, who, inturn, were much more satisfied than the single, uninvolved; similarly, the married were moresatisfied than those never married, while the formerly married were lowest in satisfaction. Parentalstatus also accounted for significant differences, with married parents showing more overallsatisfaction with relationships with children to a statistically significant degree than single parents.Rank, race, gender, and age accounted for no subgroup differences.
Table 41 shows the intercorrelations among the facet satisfaction items, plus the correlation ofeach facet satisfaction with overall satisfaction. The strongest intercorrelation was between qualitytime spent with children and amount of time (r = .58); lowest correlation was between activitiesavailable and overall relationship with the children (r = .30). Most strongly correlated with overallsatisfaction was quality of time spent with the children (r = .67). Least correlated with overallsatisfaction was activities available for the children (r = .30).
Table 41
Intercorrelations of Specific and Overall SatisfactionsWith Relations With Children
Overall DomainSpecific Satisfactions Sati Sat2 Sat3 Sat4 Sat5 Satisfaction1. Quantity of time spent .59 .50 .39 .38 .532. Quality of time spent .43 .31 .39 .673. Military environment .58 .48 .404. Availability of activities .38 .305. Education .43N=. All correlations are significant at p < .0001.
Married respondents had significantly higher levels of satisfaction for three of the five facetsatisfaction items (amount of time spent with their children, quality of time spent with theirchildren, and military environment), and for overall satisfaction. Half the married (46.2%) weredissatisfied with the amount of time spent with their children; 74.6 percent of the singles were
62

dissatisfied. With respect to quality of time spent together, 24.5 percent of the married weredissatisfied, 52.5 percent of the single. Dissatisfaction with the military environment was 29.5percent for marrieds, 40.4 percent for the singles. Dissatisfaction with activities available wasvoiced by almost equal numbers (29.5% for married, 30.4% for single). Fourteen percent (13.7%)of the married expressed dissatisfaction with the education their children received, versus 9.1percent of the singles.
Most married (78.7%) and single (85.2%) parents thought they would be able to spend moretime with their children if they were civilians. Six out of ten (64.8%) married parents and 81.7percent of single parents thought their relationships with their children would be better if they werecivilians. Asked how their relationship with their children compared with the relationships had byother Marines, only 7.3 percent of the married said theirs was worse, versus 40.7 percent of thesingles; both groups endorsed the neutral response most frequently, 45.2 and 40.7 percent,respectively.
Overall, satisfaction with education their children were receiving was moderate--approximately half of both married and single parents were satisfied. By far, most sent theirchildren to public schools (62.3%). In second place were Department of Defense schools at 26.2percent, followed distantly by church school (1.7%), private day school (1.2%) and other (7.6%).Subgroup comparisons showed that the DoD Schools beat public schools in mean satisfaction (5.8against 5.1) with education received by the children (church and private day schools had too fewto consider).
Three additional items addressed satisfaction with child care issues: cost of care, qualificationsof the care provider, and safety of the child. Three out of four (76.4%) were satisfied to some degreewith the qualifications of their care provider, and only 6.0 percent expressed any dissatisfaction.Similar response patterns existed for safety of the child, with 73.1 percent expressing satisfaction,7.9 percent dissatisfaction. Cost was another matter, with 28.2 percent being dissatisfied, andanother 21.1 percent neutral. T-tests revealed that differences between single and married parentson these three items were not significant. Mean ratings of satisfaction on these three items areshown in Table 42.
Table 42
Mean Ratings of Satisfactions With Child Care Issues
Issue n M SDSatisfaction with qualifications of provider 218 5.63 1.42Satisfaction with cost of child care 213 4.39 1.88Satisfaction with safety of child while in child care 216 5.46 1.50
Almost all parents (92.8% of the married, 87.3% of the single) indicated they had child careneeds for their youngest child. By far the greatest percentage of those married with children(68.4%) indicated that it was their spouse who cared for their youngest child, with small
63

percentages distributed throughout the other response alternatives. Although the category wassingle parents, one out of four (25.5%) chose "spouse" as their response. It can only be conjecturedthat they meant either ex-spouse or their partner in a marital-like relationship. "Other" came in at25.5 percent also. Relative or older sibling, and civilian home care accounted for 10.9 percent each.
Asked what their most critical child care requirement was, married parents most often chose"occasional baby-sitter" (17.1%), followed by "access to care at any time" (15.9%), and "all-daycare for pre-schoolers" (12.8%). Most critical need sighted by single parents was "other" (19.6%),tied with "all-day care for pre-schoolers" (19.6%). and "access to care at any time" followed at 12.5percent.
Because military parents are subject to being away from home for extended periods of time,respondents were asked two additional questions: (1) If they had to be away from their children forsix months or more, who would care for their children; and (2) How certain they were that personwould adequately care for their children). The two subgroups differed significantly on the firstquestion (p = .000). For the married parents, "spouse" was the most common answer by far(96.3%). For single parents, the responses were more evenly distributed, with "spouse" (again,probably ex-spouse or partner) checked at 41.1 percent, "immediate family member" receiving32.1 percent of the responses, "other family member" 1.8 percent, and "friend or neighbor" 1.8percent; "other" was chosen as a response by 23.2 percent.
Social Comparisons
Respondents were asked whether their relationship with their children would be better or worseif they were civilians. Thirty percent (30.0%) thought the two were about equal, while 66.1 percentthought those relationships would be better if they were civilians. Junior and senior enlistedcompared their current relationships more negatively (i.e., better as a civilian) than did eitherofficers or warrant officers. Negative comparisons of current relationship decreased with age.Those not involved in any relationship responded most negatively, followed by the single,involved, with married most positive. With respect to marital status, those who were formerlymarried were much more likely to respond negatively about current relationships with theirchildren than those never having been married; married respondents were least negative aboutcurrent relationships with their children. Single parents were more negative than married parents.Race and gender accounted for no statistically significant subgroup differences.
Comparing their own situations to those of other Marines, 44.8 percent felt that the two wereabout the same, 42.8 percent felt their own were better. Positive comparisons increased with rank.Gender and age accounted for no significant differences on this item. Marines in the Hispanic racialcategory compared themselves most favorably, followed by Other, Blacks, and Whites, in thatorder. Married respondents compared themselves most favorably, those who were single but notinvolved came in second, and those single but involved were least likely to make a favorablecomparison. Similarly, married were more positive than those never married, who were morepositive than those formerly married. Finally, married parents compared their own situation morefavorably than did single parents.
64
Salience
Parents were asked how often their relationships with their children had been on their mindlately. For married parents, the most frequent responses were "almost all the time" (28.7%), "quitea bit" (25.6%), "a great deal" (24.7%), and "once in a while" (17.1%). Single parents responded ina similar pattern, but with higher percentages in the almost all the time (39.3%) and a great deal(32.8%) response categories.
Subgroup comparisons showed that higher salience characterized the junior enlisted and juniorofficer respondents, senior enlisted scoring lowest. Salience decreased with age. Race and genderaccounted for no significant differences. Uninvolved scored higher on salience than either thosemarried or those single but involved. Higher salience was shown by formerly married than single,never married, with lowest salience recorded by the married respondents. Single parents scoredhigher on salience than married parents.
Variables Predicting Positive Assessment of Relationships with Children
The relative strength of a number of potential predictors of affective and cognitive evaluationof this domain was determined through a multiple regression procedure. Variables included thefacet satisfactions, satisfaction with care givers, salience, and the two comparisons.
Together, five factors accounted for 52 percent of the variance in overall satisfaction. The mostpotent predictor was satisfaction with quality of time spent with children, followed by militaryenvironment. Other variables accounting for an additional one percent or more of the variancewere: confidence in the caretaker's ability to care for the child during extended absences of theparent, comparison with other Marines, and comparison with civilians. The results of theregression are shown in Table 43.
Prediction of the affective assessment of this domain using the variables provided by the surveywas very weak. With respect to feelings about children living with the respondent, even 16variables together accounted for only 29 percent of the variance. Top predictors, although veryweak, were qualifications of the caregiver, overall domain satisfaction, and comparison withcivilians.
More of the variance could be accounted for in predicting feelings toward children not livingwith the respondent. Five variables together could account for 49 percent of the variance. Toppredictors were children from previous marriage and quality of time spent with the children. Tables44 and 45 summarize the results of the regression for affective assessment, for children living withthe respondent and for children not living with the respondent, respectively.
65

Table 43
Multiple Regression Predicting Overall Satisfactionin the Children Domain
Variable Multiple R R' BetaSatisfaction with quality of time .69 .48 .69Military environment .71 .50 .16Ability of person .72 .52 -.12Compared to other Marines .72 .52 .08Compared to civilians .72 .53 -.07Saliency .73 .53 -.08Relations with children living with me .73 .54 .07Relations with children not living with me .73 .54 .06Safety .74 .54 .06Qualifications of person caring for children .74 .55 -.18Satisfaction with education .74 .55 .05Satisfaction with ,amount of time .74 .55 .05Satisfaction with activities available .74 .55 -.02
Table 44
Multiple Regression Predicting Feelings About RelationsWith Children Living With the Respondent
MultipleVariable R R2 BetaQualifications of person caring for children .33 .11 .33Satisfaction with relationship overall .41 .17 .25Relationship with children compared to civilians .44 .19 .16Military environment .46 .22 -.15Satisfaction with the cost of children .48 .23 .17Satisfaction with quality of time .49 .24 -.11Saliency .50 .25 -.12Time with children compared to civilians .51 .26 .09Satisfaction with education .52 .27 -.08Number of children .53 .28 .09Ability of person .53 .28 -.08Compared to other Marines .54 .29 .08Satisfaction with activities available .54 .29 .05Satisfaction with amnount of time .54 .29 .06Safety .54 .29 .06Relations with children from a previous marriage .54 .29 -.03
66

Table 45
Multiple Regression Predicting Feelings About RelationsWith Children Not Living With the Respondent
Variable Multiple R Rz BetaRelations with children from a previous marriage .64 .40 -.64Satisfaction with quality of time .68 .46 .24Time with children compared to civilians .68 .47 .08Relationship with children compared to civilians .70 .49 -.17Satisfaction with education .70 .49 -.07Compared to other Marines .70 .49 -.06Satisfaction with activities available .70 .50 .06Military environment .71 .50 -.10Number of children .71 .51 -.07Qualifications of person caring for children .72 .51 .05Safety .72 .51 -.10Saliency .72 .51 .05Ability of person .72 .52 -.06Satisfaction with relationship to overall .72 .52 .05Satisfaction with the cost of childcare .72 .52 .05Satisfaction with amount of time .72 .52 -.008
Summary of the Relationships with Children Domain
More than half the respondents (55.7%) indicated they were "pleased" or "mostly pleased"about their relationships with their children who were living with them. An even higher percentage(71.5%) indicated they were "pleased" with their relationships with the children who were notliving with them.
Approximately three out of four (75.7%) said they were somewhat to completely satisfied inthis domain. Of the several facet satisfactions, satisfaction with quality of time spent with childrenwas most closely linked to overall satisfaction. Least correlated with overall satisfaction wasactivities available for the children. Many of the respondents, both married (46.2%) and singleparents (74.6%) expressed some degree of dissatisfaction with the amount of time they spent withtheir children, and both single (85.2%) and married (78.7%) parents thought they would be able tospend more time with their children if they were civilians.
Overall satisfaction with the schools their children were attending was moderate. Thoseutilizing DoD schools showed the highest satisfaction, followed by those using public schools.
Married parents most often indicated that it was their spouse who cared for the children day today, and who would also be providing care during long-term absences such as deployments. Theresponses in both areas by single parents showed much more variation, and single parents were lessconfident of the care their children were and would be receiving.
67

Six out of ten respondents (66.1%) thought their relationships with their children would bebetter if they were civilians. Comparing their own situation with that of other Marines, 44.8 percentfelt the two were about equal.
Feelings about this domain (the D-T scale) cannot be predicted very well by the variablesprovided by this section of the survey. Somewhat better prediction is possible in the case of overallsatisfaction with this domain (the cognitive evaluation).
68

The Relationships with Other Relatives Domain
Relationships with family members other than spouse and children at times can be verysupportive and rewarding for an individual, at other times, sources of additional stress andirritation. One might hazard a guess that the absence of supportive relationships with those otherfamily members, or the presence, perhaps of stressful relationships with them, may prove to haveeven more pronounced effects on single Marines, those who have no spouse (or significant other)or children.
For purposes of this survey, "relatives" included brothers and sisters, parents, grandparents, in-laws, and other close relatives. Asked about the distance of their nearest relatives from their dutystation, 3.1 percent of the Marines in the sample said they had relatives in the local (Camp Lejeune)area, 2.2 percent had relatives within 100 miles, while for 26.4 percent of those responding, theirnearest relative was more than 1,000 miles distant.
Affective Evaluation of Relationships with Other Relatives
Only 15.2 percent of these Camp Lejeune Marines indicated they felt "mostly unhappy" to"terrible" about relationships with their other relatives. Another 14.6 percent chose a neutralresponse. However, the majority of respondents felt positive about this domain, as evidenced bythe percentages of responses in the "mostly pleased" (22.4%), "pleased" (31.6%) and even the"delighted" (15.8%) categories. Mean response on this item was 5.09, just within the "mostlypleased" range.
Additional analyses revealed no subgroup differences by rank, age, race, or gender. Significantdifferences were found for relationship status, with those not involved being less positive thanthose who were married, with the single but involved in between. Married were also more pleasedthan those formerly and those never married, who were about equal. The general pattern was forfeelings about this domain (affective evaluation) to become less positive as the distance increasedbetween respondents and their other relatives. No significant differences on this variable could beattributed to whether or not the respondent grew up in a military family.
Cognitive Evaluation of Relationships with Other Relatives Domain
Measures of overall satisfaction and satisfaction with four specific aspects of the domain wereused in the cognitive evaluation. Mean response to the overall satisfaction item was 5.46.Frequency analyses showed that eight out of ten Marines in the Camp Lejeune sample (76.8%)indicated some degree of satisfaction in this domain, with only 10.9 percent of the respondentschoosing a negative response. Not surprisingly, overall satisfaction correlated positively with theaffective evaluation discussed above (r = .57, p = .000).
Subgroup comparisons revealed that only age accounted for significant differences in meanresponse, with the middle age grouping scoring higher on satisfaction (5.65) than either theiryounger (5.41) or older (5.34) counterparts.
Facet satisfactions included amount of contact, how well relatives get along with each other,support by relatives for respondent's military career, and relatives' respect for the respondent's
69

independence. Intercorrelations among the items are shown in Table 44. The strongestintercorrelation was between support for military career and relatives' respect for respondent'sindependence; weakest was between relatives' support for respondent's independence and amountof contact with relatives. As shown in Table 46, each of the four facet satisfactions correlatedpositively with overall satisfaction, the strongest being relatives' support for the respondent'smilitary career; amount of contact with relatives showed the weakest linkage with overallsatisfaction.
Table 46
Intercorrelations of Specific and Overall SatisfactionsWith Relations With Relatives
Overall Satisfactionwith Relations with
Specific Satisfactions Sati Sat2 Sat3 Sat4 Relatives1. Amount of contact .18 .22 .12 .312. Ability to get along .49 .45 .573. Support for military career .66 .614. Respect for independence .58
1. All correlations are significant atp < .0001.2. Pairwise deletion of missing-cases resulted in n = 1,109 to 1,111.
Relatives' respect for respondent's independence showed the highest mean score forsatisfaction (5.80), followed by relatives' support for respondent's military career (5.61), how wellrelatives get along with each other (5.14), and amount of contact with relatives (3.64).
Social Comparisons
Well more than half the Marines sampled (59.3%) felt their relationships with other relativeswould be better if they were civilians. Thirty-one percent (31.0%) thought they would be about thesame. Only one in ten (9.7%) thought those relationships would not be better if they were civilians.Junior enlisted were most negative, and the comparison bias toward better relationships with otherrelatives as a civilian decreased with age. Gender, relationship status, and race made no difference.Married and never having been married were about equal, and more positive than those formerlymarried. Those whose nearest relative was more than 1000 miles distant were more likely thanthose with relatives in the Camp Lejeune area or within 100 miles to feel that their relationshipswould be better if they were civilians; however, the relationship was not uniformly linear. Havinghad a parent in the military increased the propensity for a negative response in this area.
Salience
Respondents were asked how often their relationships with other relatives had been on theirmind lately. Relatively high salience was found for this domain, with many respondents choosingresponses of "quite a bit" (19.5%), "a great deal" (12.8%) and "almost all the time" (9.7%).Approximately one-third of the sample (36.0%) marked "once in a while."
70
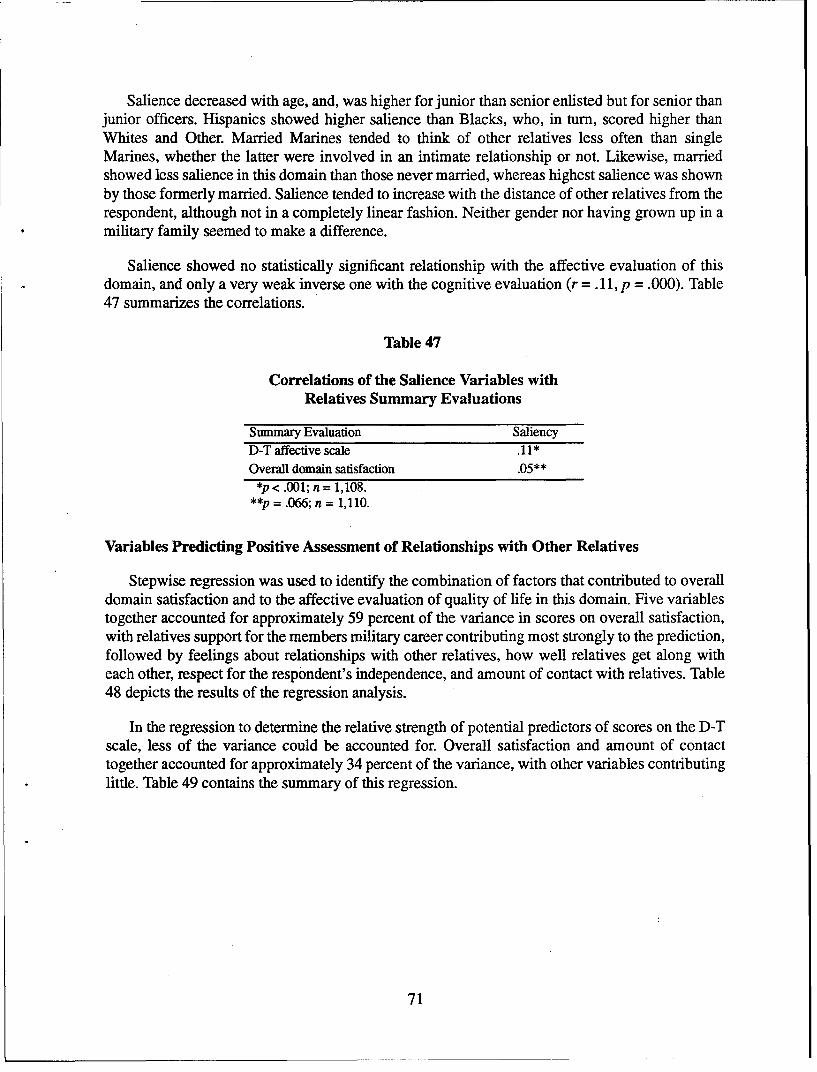
Salience decreased with age, and, was higher for junior than senior enlisted but for senior thanjunior officers. Hispanics showed higher salience than Blacks, who, in turn, scored higher thanWhites and Other. Married Marines tended to think of other relatives less often than singleMarines, whether the latter were involved in an intimate relationship or not. Likewise, marriedshowed less salience in this domain than those never married, whereas highest salience was shownby those formerly married. Salience tended to increase with the distance of other relatives from therespondent, although not in a completely linear fashion. Neither gender nor having grown up in amilitary family seemed to make a difference.
Salience showed no statistically significant relationship with the affective evaluation of thisdomain, and only a very weak inverse one with the cognitive evaluation (r =.11, p = .000). Table47 summarizes the correlations.
Table 47
Correlations of the Salience Variables withRelatives Summary Evaluations
Summary Evaluation SaliencyD-T affective scale .11*Overall domain satisfaction .05*
*p <.001; n 1,108.**p = .066; n = 1,110.
Variables Predicting Positive Assessment of Relationships with Other Relatives
Stepwise regression was used to identify the combination of factors that contributed to overalldomain satisfaction and to the affective evaluation of quality of life in this domain. Five variablestogether accounted for approximately 59 percent of the variance in scores on overall satisfaction,with relatives support for the members military career contributing most strongly to the prediction,followed by feelings about relationships with other relatives, how well relatives get along witheach other, respect for the respondent's independence, and amount of contact with relatives. Table48 depicts the results of the regression analysis.
In the regression to determine the relative strength of potential predictors of scores on the D-Tscale, less of the variance could be accounted for. Overall satisfaction and amount of contacttogether accounted for approximately 34 percent of the variance, with other variables contributinglittle. Table 49 contains the summary of this regression.
71

Table 48
Multiple Regression Predicting Overall Satisfaction With Relatives
Variable Multiple R RI Beta InSupport for military career .61 .38 .61Overall feelings about relationships with relatives .71 .50 .38How well relatives get along .74 .55 .27Respect for independence .76 .58 .23Amount of contact .77 .59 .11Parent who was a career military member .77 .59 -.04Social comparison with civilians .77 .59 -.03Distance to nearest relative .77 .59 -.02Saliency .77 .59 .003
Table 49
Multiple Regression Predicting Feelings AboutRelationship with Relatives
Variable Multiple R RI Beta InOverall satisfaction with relationships with relatives .57 .32 .57Amount of contact .59 .34 .15How well relatives get along .59 .35 .11Saliency .60 .35 .06Distance to nearest relative .60 .36 -.05Support for military career .60 .36 .07Respect for independence .60 .36 -.07Social comparison with civilians .60 .36 .02Parent who was a career military member .60 .36 -.002
Summary of the Relationships with Other Relatives Domain
Most of these Camp Lejeune Marines provided positive assessments--both affective andcognitive--of this domain. Few subgroup differences were found with respect to either of theseoverall assessments.
Relatives' respect for the respondent's independence, and relatives' support for therespondent's military career were the facet satisfactions most highly correlated with overallsatisfaction.
Six out of ten felt that relationships with their relatives would be better if they were not in theMarine Corps. Younger Marines, junior enlisted and officer, and those whose relatives werefarthest away tended to feel this way more than their older, higher ranking contemporaries, or thosewith relatives in the nearby area.
72
Relatively high salience was found for this domain. However, salience, that is, thinking oftenof relatives, showed no significant correlation with feelings about this domain and only a veryweak inverse one with overall domain satisfaction.
73

The Income and Standard of Living Domain
To most people, probably the first thing that comes to mind when quality of life is mentionedin one's financial resources. In fact, income and standard of living are often confused, at timesbeing treated as alternative terms for the same thing, and sometimes being used to indicate qualityof life itself. In a sense, of course, income is one of the easiest components of overall quality of lifeto express quantitatively, a fact which may lead to its pseudo synonymity with QOL. In themilitary, actual compensation and allied benefits vary according to a number of factors: rank,tenure, marital status, and, to some degree, location and work assignment.
Affective Evaluation of the Income and Standard of Living Domain
For the sample as a whole, the mean response to this item was rather negative. At 3.82, it nearedthe upper limit of the "mostly unhappy" segment of the D-T scale, slightly below the midpoint.Four out of ten in the sample (40.0%) chose the negative response alternatives of "terrible" (8.8%),"unhappy" (11.6%), or "mostly unhappy" (19.6%). Another 24.5 percent chose the neutralresponse. Only 35.5 percent of the Marines in this sample from Camp Lejeune felt positive abouttheir standard of living.
There were a number of significant subgroup differences. Women were more positive in theirfeelings about this domain than were men. And married Marines effectively evaluated this domainmore positively than did those who had formerly been married who were about equal with thosewho had never been married. On the relationship variable, married respondents were more positivethan their unmarried counterparts, either those involved in an intimate relationship or thoseuninvolved. No clear relationship existed between race and feelings about this domain. Positivefeelings actually increased with number of children.
Positive feelings toward this domain of QOL increased in linear fashion with both age andrank. Obviously, one would suspect that the actual income of the respondent would be closelyrelated to feelings about QOL; actual income as a Marine, of course, is directly related to rank (andsomewhat to tenure), and rank is positively correlated with age (r = .47). To follow up on this,Pearson correlations were run between feelings about the income and standard of living domainand three variables. Affective evaluation correlated positively with rank (r = .20), age (r = .23), andtime in service (r = .24). When controlling for age, rank correlates with feelings about this domainat r =. 11; controlling for rank, age correlates with feelings about this domain at r = .13.
Rank groups differed significantly on feelings about this domain of QOL. The E-2 to E-4s hada mean score of 3.57 on the D-T scale, slightly below the midpoint. Affective evaluation increasedin a positive direction linearly with rank, with means being 4.18 for senior enlisted, 5.00 forwarrant officers, 5.32 for junior officers, and 5.58 for senior officers.
Of the Marines sampled, most (79.8%) had no second job, and were not looking for one.Another 15.1 percent did not have a second job but were trying to find one. Only 5.1 percent wereaugmenting their income through a second job, working from less than 10 to more than 30 hoursper week. Those having second jobs most often cited needing money (59.6%) as the reason,followed by enjoyment of work (15.4%) and the gaining of experience (13.5%). Marines working10-20 hours per week at a second job, and those working more than 30 hours, felt less positively
75
about their income and standard of living than did those working less than 10 hours or 31-40 hoursper week or those having no second job; those looking for a second job scored lowest of all.
Spouses contributed to the family income in 28.0 percent of the cases, most commonly 20-40percent of the income; next most common spousal contribution was less than 20 percent. Marineswith military spouses had the most positive feelings about this domain; those with unemployedspouses who were actively seeking a job were the least positive.
Evaluations by single parents and married Marines on unaccompanied tours (temporarily orpermanently, by choice or because of billet requirement) were lower than the married parents whowere accompanied by their dependents. There were only 117 geographical bachelors in the sample,too few to justify subgroup analyses on that variable.
Cognitive Evaluation of Income and Standard of Living
Cognitive measurement of this domain used one overall satisfaction item and six facetsatisfaction items: money available for essentials, for extras, and for savings, and satisfaction withcar, household furnishings, and what can be provided for the children. Cognitive evaluation(overall satisfaction) correlated positively with affective evaluation (feelings, the D-T scale)(r = .66). Mean overall satisfaction was 3.66, below the midpoint of the scale. Those dissatisfied(49.5%) outnumbered those who were satisfied (35.9%).
A number of significant subgroup differences were found, with most means below the midpointof the scale for overall satisfaction. Mean cognitive evaluations (overall satisfaction) increasedlinearly with rank, from a low of 3.46 to a high of 5.50. Mean satisfaction was also higher forfemales (4.44) than for males (3.62). Similarly as with rank, satisfaction increased linearly withage, from a low of 3.52 to a high of 4.50. With respect to relationship status, married Marines weremost satisfied (3.88), those single but involved least (3.26), and the uninvolved singles were in themiddle (3.51). Currently married (3.87) were more satisfied in this domain than either formerlymarried (3.50) or never married (3.48). Permanently unaccompanied scored highest on satisfaction(4.17), those accompanied by all dependents next (3.91). Race and number of children accountedfor no significant differences.
Table 50 shows the intercorrelations among the facet satisfactions and also the correlationbetween each facet satisfaction and overall satisfaction. Highest intercorrelation (r = .77) wasbetween satisfaction with money available for extras and satisfaction with money available forsavings; lowest (r = .25) was between satisfaction with money available for savings andsatisfaction with car. Correlating most strongly with overall satisfaction was satisfaction withmoney available for extras (r = .79). Considering only those Marines with children, overallsatisfaction was strongly and positively correlated with satisfaction with what could be providedfor the children.
In the area of facet satisfactions, satisfaction with car had the highest mean score (4.85), whilesatisfaction with money available for savings had the lowest (3.10).
76

Table 50
Intercorrelations of Specific and Overall Income/Standardof Living Satisfactions
Overall DomainSpecific Satisfactions Sati Sat2 Sat3 Sat4 Sat5 Sat6 Satisfaction1. Money for essentials .69 .56 .30 .40 .54 .682. Money for extras .77 .31 .44 .57 .793. Money for savings .25 .36 .51 .734. Car .44 .43 .435. Household furnishings .60 .556. Provide for children .64Notes.1. All correlations are significant at p < .0001.2. Pairwise deletion of missing cases resulted in n = 840 to 1,522.
Respondents were asked to report on five indicators of financial hardship with respect to theircurrent command: letter of indebtedness; repossession, bankruptcy, crisis loan from a militaryrelief organization, and trouble over child support. Fifteen percent (15.3%) of the respondents hadsuffered one or more of those hardship events. Frequency analyses revealed that 4.4 percent of therespondents had received a letter of indebtedness, 2.0 percent had suffered a repossession, 0.9percent had filed bankruptcy, 7.8 percent had received a crisis loan, and 2.8 percent hadexperienced trouble over child support payments. Eight out of ten (84.7%) reported havingexperienced none of those events at their present command. As expected, young Marines in lowerpaygrades (E-3--E-5) were overrepresented in the group having had financial problems.
Social Comparisons
Marines at Camp Lejeune were asked to compare their present financial situation to the onethey would probably be experiencing if they were civilians, and also to compare their presentfinancial situation with that of other Marines of the same paygrade. Approximately one-fourth ofthe sample (25.0%) thought they were worse off financially than they would be as civilians;however, 54.8 percent thought they were better off, and 20.2 percent felt the two situations wereapproximately equal.
Subgroup differences were found for rank, with junior enlisted comparing their currentsituation most favorably, warrant officers least favorably; however, there was not a linearrelationship between rank and comparison score. As to race, Whites made the most favorablecomparison, Hispanics the least. Men felt they were better off than civilians with respect tofinancial situation more than did women. The comparisons grew less favorable with increasing age.The single (involved and uninvolved) Marines compared their current financial situation morefavorably than did their married counterparts. Formerly married Marines made more favorablecomparisons than those who had never been married, and currently married made the leastfavorable comparisons.
77

Responses on the second comparison clustered near the scale's midpoint; 48.3 percent sayingthey and other Marines of the same paygrade were about equal financially, 11.9 percent stating theywere a little worse off, 20.1 percent stating they were a little better off. Warrant officers and juniorofficers made the least favorable comparisons. Whites made more favorable comparisons thanBlacks or Other; Hispanics were least favorable in comparing their situation to that of fellowMarines. Men were more positive than women. Youngest Marines made the most favorablecomparisons. Relationship status made a difference, with the uninvolved more positive than thesingle involved, who, in turn, were more positive than the married. Married also compared theircurrent financial situation to that of other Marines of the same paygrade less favorably thanformerly married; never married were in between.
Salience
Salience for the income and standard of living domain was very high. Of the total sample, 25.8percent reported that their financial situation was on their mind "almost all the time"; 24.7 percentsaid "a great deal of the time," and 23.9 percent said "quite a bit." The response alternatives of"seldom" (5.0%), "hardly ever" (1.5%), and "not at all" (2.0%) showed negligible frequencies.
Salience did show variation by subgroup. Junior and senior enlisted had income and standardof living on their minds more than junior and senior officers, with warrant officers showing lowestsalience. Salience was lower for "Other," Whites and Hispanics, all of whom scored lower thanBlacks. Gender differences were not significant. Salience decreased linearly with age. Those nevermarried scored lowest in salience; in close second were the married, and formerly married werehighest. Marital status accounted for no significant differences on this variable.
As shown in Table 51, salience correlated positively with both the score on the D-T scale, andwith the score on overall domain satisfaction. As positive feelings about income and standard ofliving, and overall satisfaction with them increase, less time is spent thinking about them.
Table 51
Correlations of the Salience Variables withIncome/Standard of Living Summary Evaluations
Summary Evaluation SaliencyD-T affective scale .40Overall domain satisfaction .38p <.00 0 1.n = 666 to 1,096.
Utilization of Base Exchange and Commissary
Respondents were asked how much the base exchanges and the commissary helped them tosave money and to make ends meet financially. Seven out of ten of the Marines (70.8% for theexchange, 71.1% for the commissary) indicated "a little" to "a great deal" of help. With respect tothe exchange, "not at all" received 29.2 percent of the responses, "a little" received 31.3 percent,
78

and "some" 26.5 percent; "quite a bit" (9.9%) and "a great deal" (3.2%) had low frequencies. Thecommissary had similar endorsements: "not at all," 28.9 percent; "a little," 25.9 percent; "some,"25.9 percent; "quite a bit," 13.7 percent; and "a great deal," 5.5 percent.
Asked where they shopped for food, 8.1 percent said "only at the commissary," 17.4 percentsaid "mostly at the commissary," 27.6 percent said "mostly at civilian stores," and 18.3 percent said"only at civilian stores;" another 28.6 percent marked the "50-50" response. Three out of fourshopped mostly (45.2%) or only (23.1%) at civilian stores for clothing and personal and householditems, while a scant 1.5 percent shopped only at the exchange, 5.9 percent mostly at the exchange,and 24.2 percent 50-50 at the exchange and civilian stores.
Variables Predicting Evaluation of Income and Standard of Living
Stepwise regression was used to measure the relative importance of factors that conduce tooverall satisfaction in this domain. Regressions were run separately for Marines without and withchildren. For those without children, five of the six facet satisfactions, plus saliency and rankconstituted the candidate variables. Five variables together accounted for 75 percent of thevariance: satisfaction with money available for extras, satisfaction with household furnishings,satisfaction with car, satisfaction with money available for savings, and salience.
In the regression for those who were married and had children, an additional variable wasadded: satisfaction with what can be provided for the children. It emerged as the second mostpotent predictor variable, behind satisfaction with money available for extras, and ahead ofsatisfaction with money available for household furnishings. Together, these three variablesaccounted for 72 percent of the variance.
A third regression was run to measure the strength of variables contributing to the predictionof positive feelings about this domain. Overall satisfaction was the most potent predictor of scoreson the D-T scale. Two other variables combined with overall satisfaction to account for 53 percentof the variance: comparison with civilians (a negative correlation), and satisfaction with whatcould be provided for the children. Tables 52, 53, and 54 summarize the results of the regressions.
Table 52
Multiple Regression Predicting Overall Satisfaction WithIncome for Marines Without Children
Variable Multiple R Rz Beta InMoney available for extras .80 .64 .80Money available for household furnishings .83 .70 -.26Car .87 .71 -.17Money available for savings .85 .72 -.24Money available for essentials .86 .74 -.13Rank .87 .71 .14Saliency .87 .75 -.04
79

Table 53
Multiple Regression Predicting Overall Satisfaction WithIncome for Marines With Children
Variable Multiple R RL Beta InMoney available for extras .79 .63 .79Money available for children .84 .70 .35Money available for household furnishings .85 .72 .16Money available for savings .86 .74 .22Money available for essentials .87 .75 .19Saliency .57 .76 .09Car .88 .77 .09Rank .88 .77 .08
Table 54
Multiple Regression Predicting Feelings About Income
Variable Multiple R Rz Beta InOverall satisfaction with income .70 .49 .70Income comparison to civilians .72 .51 -.18Money available for children .73 .53 .19Rank .73 .54 .10Saliency .74 .54 .07Money available for extras .74 .54 .06Money available for household furnishings .74 .55 .04Money available for essentials .74 .55 .03Number of children .74 .55 .02Income comparison to other Marines .74 .55 .01Car .74 .55 -.01Money available for savings .74 .55 .01
Summary of the Income and Standard of Living Domain
Contentment with income and standard of living was rather low. Both affective and cognitiveevaluations had mean scores below the midpoint (4.0) of their respective scales, 3.82 and 3.66,respectively. As would be expected, feelings about income and standard of living vary with rankand age, and positive evaluation increased linearly with both age and rank. Women were morepositive than men on the affective evaluation. Cognitive evaluation differences by subgroup werevery similar.
Only 5.1 percent of those sampled were holding second jobs, with another 15.1 percent activelysearching for one. Spouses contributed to the family's income in 28.0 percent of the cases.
80

Most closely correlated with overall domain satisfaction was satisfaction with money availablefor extras. Income and standard of living showed very high salience. Both the commissary and theexchange helped seven out of ten of the Marines, although neither received an exceptionally strongendorsement. Adverse financial events had occurred for 15.3 percent of the respondents.
In social comparisons, 54.8 percent thought they were better off financially than they would beas civilians, and 48.3 percent felt they were about as well off as their Marine peers.
81

The Work Domain
Work remains, for many (some would say most) people, the domain most central to theiridentity, self-regard, and the meaning they find in life. Even in an age when the work ethic hassupposedly declined in importance, it remains true that nine out of 10 individuals, when asked whothey are, will also say what they do! Work is second only to family--and sometimes not second--when it comes to influencing an individual's perceived quality of life. And, in fact, work directlyor indirectly influences almost all of life's other domains, whether because of compensation, timedemands, occupational status, or whatever. Certainly, with respect to members of the U. S. MarineCorps, work spreads its effects throughout the life space.
Affective Evaluation of Job in the Marine Corps
Of the Camp Lejeune Marines sampled, 34.0 percent felt unhappy to some degree about theirjobs; a somewhat larger percentage (41.0%) felt pleased to some degree, and another 25.0 percentsaid they were "neither happy nor unhappy." At 4.01, the mean response was right at the scale'smidpoint, and the response most often chosen was the neutral one. Nine percent (9.5%) felt"terrible" about their Marine Corps job, but 3.9 percent said they were "delighted" with theirs.
Subgroup analyses showed that positive feelings about job increased in linear fashion with bothage and rank; with respect to rank, senior enlisted were more positive than junior enlisted, juniorofficers more than their senior counterparts, but warrant officers were most positive of all. Therewere no differences by race or gender. The job was more positively evaluated by Marines who weremarried and those who were involved than by those uninvolved. Married were most positive, thosenever married the least, and those formerly married in between.
This domain's affective evaluation used a second measure, an organizational commitmentscale. The scale included 11 items, and response alternatives were anchored with 1 (stronglydisagree) to 7 (strongly agree). Mean response was 3.70, and the modal response was 4.0; both areat or near the scale's midpoint, and the distribution of scores was quite normal. Commitment washighest for Other, followed in order by Hispanics, Whites, and Blacks. Gender made no significantdifference. Commitment scores grew more positive linearly with age and rank. With respect torelationship status, married and involved singles were more positive than singles not in an intimaterelationship. By marital status, formerly married scored lower on organizational commitment thandid married, while those never having been married were in between. Commitment and feelingsabout this domain (using the D-T scale) correlated positively (r = .58).
Respondents were asked what, in their opinion, was the single best thing about being a Marine.The most popular response was "chance to serve country" (25.3%), followed by "being one of thefew and the proud" (19.1%), and "training and personal development" (15.3%). "Job security" waschosen by few respondents (9.9%), as was "pay and benefits" (5.7%), and "retirement options"(2.7%). Table 55 shows the percentages of respondents choosing each of the response alternativesto the "one best thing" item. Further analysis revealed that higher organizational commitment wasreported by those Marines who had chosen "training and personal development" (highest meanscore, 4.16), followed by those choosing "being one of the few and the proud" (4.09), andadventure and excitement (3.87).
83

Table 55
Respondents' Perceptions of "The Best ThingAbout Being a Marine"
Response Option Percent of RespondentsA chance to serve your country 25.3Being one of "the few and the proud" 19.1Training and personal development 15.3Job security 9.9Adventure and excitement 7.0Pay and benefits 5.7Retirement options 2.7Other 14.8
Cognitive Evaluation of Job in the Marine Corps
One overall satisfaction item and 11 facet satisfaction items were used in the cognitiveevaluation of this domain. The mean response on overall satisfaction was 4.45, a little above thescale's midpoint, and somewhat higher than the mean response on the D-T scale (affectiveevaluation). Some degree of satisfaction with their job was indicated by 54.7 percent of therespondents. With 17.9 percent choosing a neutral response, that left 27.4 percent voicing somedegree of dissatisfaction.
With respect to the facet satisfaction items, highest mean satisfaction was recorded for amountof responsibility had on the job (4.83), followed by feeling of accomplishment (4.64); lowestsatisfaction was with pay and benefits (3.60) and opportunity for personal growth and development(3.99).
Intercorrelations among the facet satisfaction items were all positive, and ranged from a highof .73 (between support and guidance received from supervisor, and leadership provided bysupervisor), to a low of .27 (between pay and benefits and amount of responsibility). The facetsatisfaction most closely correlating with overall satisfaction was feeling of accomplishment(r= .73). Least related to overall satisfaction was amount of job security (.40). Table 56summarizes the intercorrelations among the facet satisfactions and shows the correlation betweeneach facet satisfaction and overall satisfaction.
84

Table 56
Correlation Matrix for Job Satisfaction Measures
Intercorrelations Among Specific Satisfactions CorrelationsWith Overall
Job Related Satisfaction Measures S1 S2 S3 S4 S5 S6 S7 S8 S9 S10 S11 Satisfaction1. Peers and co-workers .36 .52 .29 .43 .49 .41 .41 .51 .54 .40 .54
2. Pay and benefits .39 .34 .39 .34 .33 .34 .37 .36 .28 .41
3. Support, guidance from supervisor .38 .54 .66 .49 .50 .74 .60 .49 .65
4. Amount of job security .46 .32 .35 .33 .33 .34 .28 .40
5. Personal growth on job .54 .58 .59 .52 .53 .48 .66
6. Respect and fair treatment .49 .50 .70 .61 .51 .67
7. Amount of challenge .72 .50 .53 .59 .68
8. Feelings of accomplishment .53 .56 .56 .73
9. Leadership .63 .49 .68
10. Feedback .54 .66
11. Amount of responsibility .64
Notes.1. All correlations are significant at p < .0001.2. With pairwise treatment of missing values, n for these analyses ranged from 1,096 to 1,115.
Overall satisfaction was strongly and positively correlated with affective evaluation (r - .69).Therefore, subgroup differences on overall satisfaction were expected to be similar to those foundon affective evaluation. Mean overall satisfaction scores increased with rank among the enlisted,but decreased with rank among officers. Satisfaction increased linearly with age. Race and genderaccounted for no significant differences. In terms of relationship status, overall satisfaction withjob was higher for the married, lowest for those not involved in a relationship; married were alsomore satisfied than formerly married or those never married.
Marines' Descriptions of Their Jobs
Respondents were asked to indicate how long they had been on their present assignment. Themean time on assignment was 16.3 months, and the range was from zero to 92 months. There wasno significant relationship between time at present assignment and either feelings about the job oroverall satisfaction with job.
Number of hours worked each week was slightly negatively correlated with both affective andcognitive evaluation. That is, the more hours the respondents worked, the less happy they tendedto be with this domain of QOL, and the less overall satisfaction they tended to have with the workdomain. Marines in the sample reported working hours per week ranging from 20 to 120. Although2.3 percent said they worked in excess of 80 hours per week, such is not likely, nor is it likely that2.9 percent worked less than 40 hours. The fault may lie with the survey item itself, and the unclearmeaning of "work."
Adjusting for unreasonable responses, it appears that (for those remaining in the sample) 33.8percent work 40-49 hours per week, 34.9 percent work 50-59 hours, 23.7 percent work 60-69hours, and 7.7 percent work 70-79 hours. Using these data, mean overall satisfaction (4.60) was
85

highest for those working 40-49 hours per week, and declined in linear fashion as work hoursincreased, to 4.23 for those working 70-79 hours (however, statistically, these differences were notsignificant).
Asked if their training had prepared them for their current job assignment, 41.3 percentresponded "pretty well," while another 8.7 percent said "completely." Other responses were"somewhat" (26.0%), "barely" (14.2%), and "not at all" (9.7%). A second question asked how wellmembers of the respondent's work group had been trained to do their jobs. Responses were "not atall" (2.6%), "barely" (12.0%), "somewhat" 33.2%), "pretty well" (46.7%), and "completely"(5.5%). The difference between how well individuals perceived their own and their workcompanions' training adequacy was statistically significant, but a comparison of the percentagesin each response category reveals little practical difference in the two distributions.
Person-Environment (P-E) Fit
Congruence between job characteristics important to an individual, and the actualcharacteristics of the jobs they hold (aka person-environment fit) has been shown to be related tosuch things as satisfaction with work, stress on the job, and individual health. The idea is that aclose fit indicates that the person's needs and the opportunities to fulfill those needs on the job havehigh congruence.
In the survey, Marines were asked to indicate how much their present job offered in the way ofvariety, autonomy, task feedback, importance, and task completion. They were also asked toindicate the levels of each of these five elements in "their ideal job." Using mean responses, Figure2 shows the characteristics of present and ideal job for members of the Camp Lejeune sample.
5
4
------------ --------------
3
2 - Current- Ideal
1 I I I I
Variety Autonomy Task Importance TaskFeedback Completion
Figure 2. Profiles of respondents' current and ideal jobs.
86

When the scale value for ideal job is subtracted from the scale value for presentjob (i.e., presentminus ideal), the result is an indicator of deficiency or excess of that particular quality in the presentjob. Zero difference indicates a good P-E fit. Table 57 shows the percentage of respondents inexcess, even, and deficiency categories for each job element. "Current excess" means those jobincumbents want less of that job element or characteristic, while "current deficiency" means theywant more of it.
Table 57
Comparison of Current and Ideal Jobs
Current Excess P-E Fit Current DeficiencyJob Dimension (%) (%) (%)Variety (n = 996) 8.3 34.8 56.9Autonomy (n = 994) 4.6 27.2 68.2Task feedback (n = 987) 4.0 41.1 54.9Work importance (n = 990) 6.9 41.4 51.7Task completion (n = 986) 4.5 32.1 63.4
A single additive index of P-E fit was developed from the responses on all five job elements.In terms of this index, only 8.0 percent of the Marines sampled are working at jobs for which theyhave an ideal P-E fit; that is, jobs in which they have just the amounts they want of each of the fivejob elements. More than eight out of 10 (85.6%) rated their present job deficient in comparison withtheir ideal job. A very small percentage (6.3%) rated their job as excess in the five job elements.
To investigate the effect of P-E fit on overall satisfaction, one-way analysis of varianceprocedures were conducted. Results revealed that there were significant differences among thethree "fit" groups, with those in the deficiency category showing lower mean overall satisfaction(4.27) than those in either the ideal (5.69) or excess (5.10) categories. Additional analyses revealedthat feelings toward this domain differed in the same way (i.e., by "fit" category). Mean feelingsscores were: deficiency--3.86, ideal--5.09, and excess--4.71.
Social Comparison
Marines were asked to make only one comparison in this domain: "Would you be more or lesslikely to have your ideal job now if you were a civilian?" About half (48.9%) said it was less likelythey would be performing their ideal job if they were civilians. Another 27.3 percent thought thechances were about 50-50, while 23.8 percent thought it was more likely they'd have their idealjob now if they were civilians.
Several subgroup differences were found. Senior officers and warrant officers were most likelyto feel they would be less likely to have their ideal job if they were civilians; among the enlisted,it was the junior members who felt they would be less likely to have their ideal job as civilians. Thefeeling that they would be more likely to have their ideal job as civilians increased uniformly with
87

age. Relationship status and marital status, however, accounted for no statistically significantdifferences, nor did race or gender.
Comparison favoring civilian job correlated negatively with scores on both the D-T scale(r = .26, p = .000) and the measure of overall satisfaction in the job domain (r = -.26, p = .000).That is, those who felt they were more likely to have their ideal job if they were civilians tended tofeel worse about their Marine Corps job, and to be less satisfied with it.
Variables Predicting Positive Assessment of Marine Corps Job
Stepwise multiple regression was used to identify the combination of factors which bestpredicts overall satisfaction in this domain. The 11 facet satisfactions, organizational commitment,P-E fit, the comparison, work hours, and rank were the candidate variables. Six variables togetheraccounted for 73 percent of the variance. Satisfaction with feelings of accomplishment andsatisfaction with respect and fair treatment were the two most potent predictors. Table 58summarizes the results of the regression analysis for overall satisfaction.
Table 58
Multiple Regression Predicting Overall Job Satisfaction
Variable Multiple R Rz Beta InSatisfaction with feelings of accomplishment on the job .71 .50 .71Satisfaction with respect and fair treatment from supervisors .79 .63 .40Satisfaction with amount of responsibility on the job .82 .67 .25Satisfaction with leadership by superiors .83 .69 .23Commitment to the Marine Corps .84 .71 .18Satisfaction with opportunities for personal growth on the job .85 .73 .16Support and guidance .86 .73 .12Amount of challenge .86 .74 .11Feedback from others .86 .74 .09Peers and co-workers .86 .75 .06Rank .86 .75 -.05Present j ob/ideal job difference .87 .75 .05Hours worked per week .87 .75 -.03Ideal job as a civilian .87 .75 -.03Pay and benefits .87 .75 .01Job security .87 .75 .005
A similar multiple regression was run to determine the best predictors of positive affectiveevaluation. Overall satisfaction was added as a candidate variable, and it proved to be the bestpredictor, accounting for 47 percent of the variance. However, prediction of affective evaluationwas less successful than prediction of overall satisfaction: together (as shown in Table 59), all 17variables could account for only 55 percent of the variance.
88

Table 59
Multiple Regression Predicting Feelings About One's Job
Variable Multiple R Rz BetaOverall job satisfaction .68 .47 .68Commitment to the Marine Corps .72 .52 .29Present job/ideal job difference .73 .54 .15Hours worked per week .74 .54 -.09Amount of challenge .74 .55 .08Feedback from others .74 .55 .06Amount of job security .74 .55 -.03Personal growth .74 .55 .05Civilian comparison .74 .55 -.03Amount of responsibility .74 .55 -.05Pay and benefits .74 .55 -.04Peers and co-workers .74 .55 .03Leadership .74 .55 .02Rank .74 .55 -.04Feelings of accomplishment .74 .55 .03Support and guidance .75 .56 .03Respect and fair treatment .75 .56 -.02
Summary of the Marine Corps Job Domain
Neither affective nor cognitive evaluation of the work domain was very positive, with meanscores for both evaluations hovering about the midpoint of their respective scales. Marriedpersonnel were the most positive about their Marine Corps jobs, and both affective and cognitiveevaluations became more positive with increasing age of the respondents. Neither race nor genderaccounted for significant differences. Feelings about job and overall satisfaction correlatedpositively at .69.
Of the facet satisfaction items, highest mean satisfaction was shown for amount ofresponsibility on the job and feeling of accomplishment; lowest was for pay and benefits andopportunity for personal growth and development. Satisfaction with feeling of accomplishmentwas most closely correlated with overall satisfaction.
The Camp Lejeune Marines sampled reported working from 20 to 120 hours per week,although figures on both ends of the distribution must be questioned. Mean overall satisfaction washighest for those working 40-49 hours per week, lowest for those working 70-79 hours per week.
A measure of person-environment fit was used, and the results showed that, on average, theMarine Corps jobs were deficient in each of five job characteristics, when compared with therespondents' ideal jobs. In analyses using a summary P-E fit score, it was found that respondentsin jobs where the P-E fit was in the ideal range scored highest in overall satisfaction, ahead of thosein either the deficiency or excess categories.
89

Half (48.9%) felt they would be less likely to be in their ideal job if they were civilians, whileabout one-fourth (23.8%) felt the opposite. Comparison favoring civilian job correlated negativelywith both affective and cognitive evaluations.
Variables used in the analyses were better able to predict overall satisfaction than affectiveevaluation. Satisfaction with feeling of accomplishment best predicted overall satisfaction, whileaffective evaluation was best predicted by overall satisfaction.
90

The Self Domain
Having explored a number of elements in the individual's life space (i.e., the several domainsof quality of life), we turn now to the heart of the matter, the domain of self. Here is the domainmost central to the individual's life space; but is it the domain having the greatest impact onperceptions about quality of life? Evaluations of quality of life may, in the end, depend more onthis domain than any other; one's evaluations of the world outside and of one's place in it may bereflective of one's evaluations of self. Or, they may not.
Before addressing that issue, we will examine the self-perceptions of the Marines from CampLejeune who responded to the survey. As used herein, assessments about self have to do with self-esteem, influence over one's destiny, competence, and self-improvement.
Affective Evaluation of Self
Six out of 10 (63.1%) Marines in the sample reported positive feelings in this domain. Anotherone in five (18.3%) were neither happy nor unhappy about self. Only 18.6 percent chose a negativeresponse to this item. At the extremes, 3.1 percent felt "terrible," and 8.2 percent felt "delighted."The average score was 4.80, somewhat above the midpoint of the seven-point D-T scale.
Because affective evaluation of self might be influenced by internalization of values associatedwith being a Marine, a two-item composite was used as an indicator of pride in being a Marine.The two items were: "Being a Marine is worth personal sacrifice," and "The Marine Corps is thebest of all places for me to work." This summative "pride" score correlated positively with feelingsabout self (r = .34), indicating a significant but modest relationship. Additional analyses wereconducted to examine the relationship between feelings about self and pride in being a Marine,using the "one best thing about being a Marine" item from the work domain. The results showedthat those who selected the response "training and personal development" had the second highestaffective evaluation of self; highest were those who chose the "retirement options" alternative.
Affective evaluations of self tended to become more positive with increasing rank, althoughsenior officers were less positive than junior officers or warrant officers. Positive affectiveevaluation increased in linear fashion with age. Age and rank are positively correlated (r = .61),and feelings about self correlated with age and rank about equally (.19 and .17, respectively).Controlling for paygrade, the partial correlation of age and feelings about self was .12 (p = .000).Controlling for age, the partial correlation between feelings about self and paygrade was .08. Thus,both age and paygrade are contributing some unique amount to feelings about self.
Blacks felt best about the self domain (mean score of 5.05), followed by Hispanics (5.00),Whites (4.73), and "Other" (4.58). Relationship status made a difference in feelings about self,with married respondents being most positive, involved singles less so, and uninvolved singlesleast. Similarly, married Marines were more positive than formerly married, while those who hadnever been married were lowest in affective evaluation of the self domain. Gender differences onthis item were not significant.
91
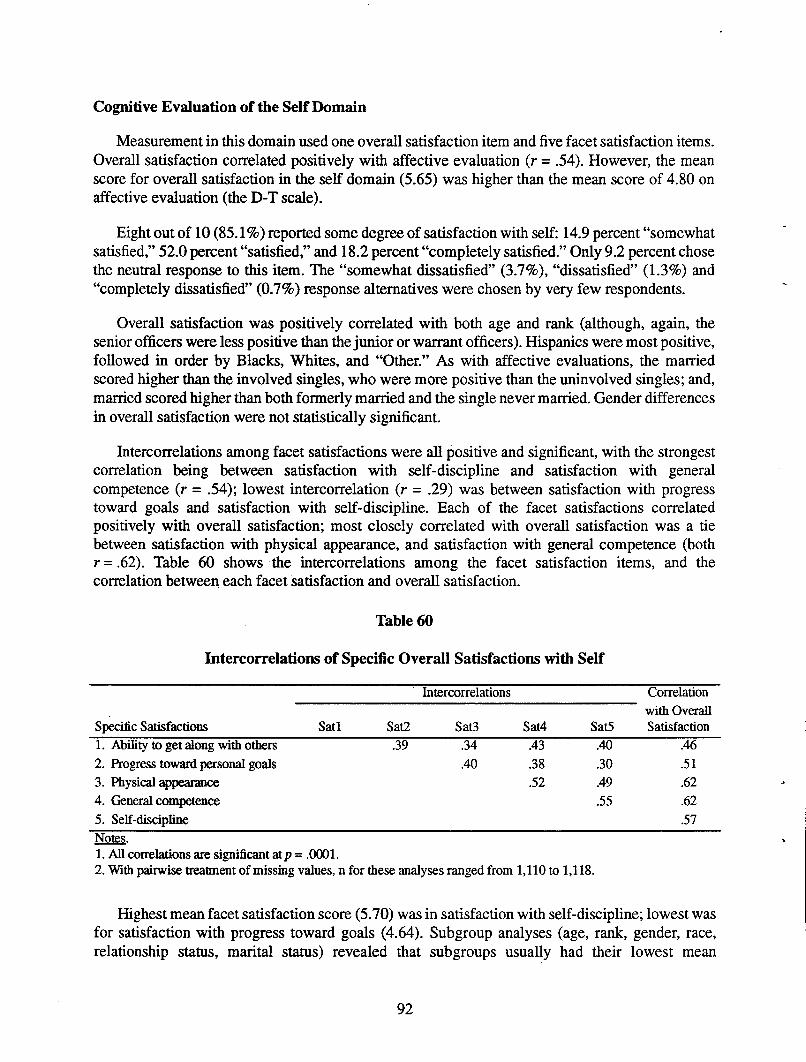
Cognitive Evaluation of the Self Domain
Measurement in this domain used one overall satisfaction item and five facet satisfaction items.Overall satisfaction correlated positively with affective evaluation (r = .54). However, the meanscore for overall satisfaction in the self domain (5.65) was higher than the mean score of 4.80 onaffective evaluation (the D-T scale).
Eight out of 10 (85.1%) reported some degree of satisfaction with self: 14.9 percent "somewhatsatisfied," 52.0 percent "satisfied," and 18.2 percent "completely satisfied." Only 9.2 percent chosethe neutral response to this item. The "somewhat dissatisfied" (3.7%), "dissatisfied" (1.3%) and"completely dissatisfied" (0.7%) response alternatives were chosen by very few respondents.
Overall satisfaction was positively correlated with both age and rank (although, again, thesenior officers were less positive than the junior or warrant officers). Hispanics were most positive,followed in order by Blacks, Whites, and "Other." As with affective evaluations, the marriedscored higher than the involved singles, who were more positive than the uninvolved singles; and,married scored higher than both formerly married and the single never married. Gender differencesin overall satisfaction were not statistically significant.
Intercorrelations among facet satisfactions were all positive and significant, with the strongestcorrelation being between satisfaction with self-discipline and satisfaction with generalcompetence (r = .54); lowest intercorrelation (r = .29) was between satisfaction with progresstoward goals and satisfaction with self-discipline. Each of the facet satisfactions correlatedpositively with overall satisfaction; most closely correlated with overall satisfaction was a tiebetween satisfaction with physical appearance, and satisfaction with general competence (bothr = .62). Table 60 shows the intercorrelations among the facet satisfaction items, and thecorrelation between each facet satisfaction and overall satisfaction.
Table 60
Intercorrelations of Specific Overall Satisfactions with Self
Intercorrelations Correlationwith Overall
Specific Satisfactions Sati Sat2 Sat3 Sat4 Sat5 Satisfaction1. Ability to get along with others .39 .34 .43 .40 .462. Progress toward personal goals .40 .38 .30 .513. Physical appearance .52 .49 .624. General competence .55 .625. Self-discipline .57Nots.1. All correlations are significant at p = .0001.2. With pairwise treatment of missing values, n for these analyses ranged from 1,110 to 1,118.
Highest mean facet satisfaction score (5.70) was in satisfaction with self-discipline; lowest wasfor satisfaction with progress toward goals (4.64). Subgroup analyses (age, rank, gender, race,relationship status, marital status) revealed that subgroups usually had their lowest mean
92

satisfaction score on progress toward goals; highest mean scores were for either self-discipline orgeneral competence, both very close in each case.
Respondents were asked to what extent they felt in control of their lives. Responses weregenerally positive, with 24.1% saying they were handling all areas of their lives well, and 45.1%saying they were handling most areas well. Negative responses were fewer: "some areas out ofcontrol" (22.6%), "many areas out of control" (5.9%), and "totally out of control" a very scant 2.2percent.
Weak to moderate correlations were found between the control item and each of the facetsatisfaction items. The strongest linkage was between control and progress toward goals (r = .39).
Given the composition of the sample (high percentages of young, lower ranking males), it wasnot surprising that, of those making the two most negative responses, nearly all were enlisted(87.2% junior enlisted; 11.6% senior enlisted). Similarly, negativity was highest for the youngestsubgroup (81.0%).
Social Comparisons
Responding to the question "Would your personal development have been better or worse ifyou had remained a civilian?, 43.3 percent felt it would have been a little to a lot worse (thus, betteras a Marine), 32.3 percent felt it would have been better, and 24.4 percent felt it was about equalto what it would have been. Subgroup differences were found. The lower the enlisted rank, themore this comparison favored the hypothetical civilian accomplishments; the reverse was true forofficers. The lower the age, the more the civilian situation was endorsed. Race gender, relationshipstatus, and marital status made no significant difference in this comparison.
When comparing their own accomplishments with those of most Marines in their ownpaygrade, most (43.0%) felt the two were about the same, 25.4 percent felt they had accomplisheda little more, 14.5 percent considerably more, and 5.0 percent a lot more. Only 12.1 percent felttheir accomplishments were less than those of their peers. Subgroup analyses showed that personalaccomplishments were more favorably endorsed by junior than senior enlisted; with officers,however, it was senior officers who felt their accomplishments outweighed those of their peers,while warrant officers were equal with senior officers. Younger Marines were more positive abouttheir own accomplishments than those in the middle and oldest categories. Gender, race,relationship status, and marital status accounted for no significant differences with respect to thiscomparison.
Those who felt their personal development was better in the Marines (thus, worse had theyremained civilians), were more likely to feel positive about self (the D-T scale), and to have highoverall satisfaction in the self domain (the cognitive evaluation). Comparison with civilianscorrelated with both affective evaluation (r = -.21, p = .000), and overall domain satisfaction(r = .13, p = .000). The same trend was apparent in the case of the second comparison. ThoseMarines who felt their own accomplishments were greater than those of their same paygradecontemporaries were more likely to feel better about self, and to indicate greater overallsatisfaction in the self domain. Correlations were .26, (p = .000), and .24, (p = .000), respectively.
93

Salience
The question addressing salience was "How often has your personal development been on yourmind lately?" More than half (55.1%) indicated high salience: "quite a bit" (24.0%), "a great deal"(18.8%), and "almost all the time" (12.3%). Approximately one out of four (23.9%) said "once ina while." "Seldom" was the response alternative chosen by 10.3 percent, "hardly ever" by 6.1percent, and "not at all" by 4.7 percent.
Salience in this domain correlated positively with both affective evaluation (feelings aboutself) (r = .18) and cognitive evaluation (overall satisfaction) (r = .11). (The salience scale isreverse-coded. Thus, those who felt better about themselves, and those indicating highest domainsatisfaction were those who less often had personal development on their minds.) Table 61summarizes these correlations.
Table 61
Correlations of the Saliency VariableWith Summary Self Evaluations
Self Evaluations SaliencyD-T affective scale .18Overall satisfaction with self .11
Variables Predicting Positive Evaluation of the Self Domain
Stepwise multiple regression procedures were used to measure the relative contribution of thefive facet satisfactions, salience, comparisons, control, and rank in predicting overall satisfactionwith self. Six variables together accounted for 59% of the variance, the most potent predictorsbeing satisfaction with physical appearance, and satisfaction with general competence. Table 62summarizes the results of this regression.
A similar stepwise multiple regression was conducted to determine the best predictors ofpositive affective evaluation in this domain. To the list of candidate predictors was added overallsatisfaction. As can be seen in Table 63, the prediction was a little less successful, with threevariables together accounting for only 49% of the variance. Most potent was extent to which theindividual was in control, followed by satisfaction with progress toward goals.
94

Table 62
Multiple Regression Predicting Overall Satisfaction With Self
Variable Multiple R Rz Beta InPhysical appearance .61 .37 .61General competence .69 .49 .34Progress towards goals .73 .54 .25Self-discipline .75 .57 .22Control over life .76 .58 .10Ability to get along with others .77 .59 .05Saliency .77 .59 -.02Begun a degree program .77 .59 -.02Job skills .77 .59 -.02Personal development as a Marine .77 .59 .01Obtained college degree .77 .59 .01Personal enrichment classes .77 .59 .01High school equivalency .77 .59 .01Personal accomplishments as a Marine .77 .59 -.01Rank .77 .59 -.002Taken college classes .77 .59 -.001
Table 63
Multiple Regression Predicting Overall Feelings About Self
Variable Multiple R Rz Beta InControl over life .59 .35 .61Progress towards goals .67 .45 .40Feelings about self overall .70 .49 .25Personal development as a Marine .70 .54 .22Ability to get along with others .70 .57 .14Self-discipline .71 .58 .10Saliency .71 .59 .05Personal development compared to civilians .71 .59 -.02Physical appearance .71 .59 -.02Taken college classes .71 .59 .02High School equivalency .71 .59 .01Job skills .71 .59 .01General competence .71 .59 .01Personal enrichment classes .71 .59 -.01Rank .71 .59 -.002Begun a degree program .71 .59 -.001
95

Summary of the Self Domain
A majority of the Marines in the Camp Lejeune sample reported having positive feelings aboutself. Positive evaluation of this domain was correlated somewhat with pride in being a Marine.Older Marines were more positive than younger, Blacks led the rest in positive feelings about self,and being married or involved in an intimate relationship wasassociated with higher positiveness.Gender differences were not significant.
The mean score for overall satisfaction (the cognitive measure) was higher than the mean forfeelings about self (the affective measure). Subgroup differences for overall satisfaction paralleledsubgroup differences in feelings. Overall satisfaction was most positively correlated withsatisfaction with personal appearance and satisfaction with general competence. Highestsatisfaction was recorded for self-discipline, while the lowest mean satisfaction score was forprogress toward goals. This was generally true also for all subgroups.
More respondents thought their personal development was better as a Marine than it wouldhave been had they remained civilians. Also, when comparing their own accomplishments to thoseof other Marines of the same rank, most respondents rated their own accomplishments equal orhigher.
Personal development had relatively high salience. Those who scored highest on positivefeelings about self, and on overall satisfaction with self, tended to think less often about personaldevelopment.
96

Section Four
Quality of Life as a Whole

Quality of Life as a Whole
Whereas any particular domain of life may occupy the attention of an individual at a particularpoint in time, that same individual is able to somehow summarize his or her affective and cognitiveassessments in the various domains and arrive at some overall assessment of quality of life ingeneral. Perhaps the various life domains contribute differentially to this overall assessment;perhaps the salience of each domain fluctuates. There are, no doubt, QOL domains which were notaddressed by the survey, a supposition supported by the fact that, in no case, was either the affectiveor the cognitive assessment in any domain fully predictable using only the variables provided bythe survey itself. However, the complexities of human assessments aside, an individual is able toarrive, by whatever means, at a conclusion with respect to overall quality of life.
In the survey, Marines were asked to respond to several items having to do with "life as awhole." These were attempts to provide multiple measures of global quality of life. Subsequently,those responses were cumulated into a single measure of quality of life as a whole.
Measures of Life as a Whole (MLW)
The Marine Corps Quality of Life Survey incorporated six measures (affective and cognitive)of life as a whole, two single-item measures, and four multiple-item indices:
MLW 1 measured feelings about life as a whole, using the D-T scale (i.e., "delighted" to"terrible");
MLW 2 offered descriptors of one's life, ranging from "ideal" to "miserable";
MLW 3 measured satisfaction with life overall, with scale anchors ranging from "very sat-isfied" to "very dissatisfied";
MLW 4 was a comparison of the respondent's life as a whole, with that of a particularfriend of the same age;
MLW 5 was an adapted version of the Life Characteristics Scale (LCS) (Campbell, Con-verse, & Rodgers, 1976), a sematic differential-based rating of seven dimensions of the respon-dent's life; and
MLW 6 was the Satisfaction with Life (SWL) Scale (Diener, Emmons, Larsen, & Griffin,1985), with which respondents indicated agreement or disagreement with five items which weresubsequently combined to yield an index of affect (feelings).
Responses to Measures of Life as a Whole
The following is a synopsis of the responses to the various measures of Life as a Whole.
Single-Item Measures (MLWs 1-4)
Each of the single-item measures used a seven-point scale, coded so that the highest number(7) would, in all cases, represent the most positive response. On each of the single-item measures,
99

the mean score for the sample as a whole was slightly above the midpoint of the scale, i.e., just intothe positive zone, except for MLW 2, which was below the midpoint.
MLW 1 Six out of 10 (59.0%) gave a positive response to this item which used the familiarD-T scale. Another 24.5 percent chose a neutral response. Only 16.5 percent chose the negativeresponses of "mostly unhappy" (9.5%), "unhappy" (4.8%), or "terrible" (2.2%).
MLW 2 On this measure, the respondent was asked to choose a response that most accu-rately described her or his life. The range was from "miserable" to "ideal life." The three middlerange responses were most popular. "A good enough life for now," the neutral response, was en-dorsed by 26.2 percent of the Marines responding to the sample; "the best kind of life I am able tohave now" (a positive response) was given by 25.6 percent; and "a tolerable life for now" (a neg-ative response) was chosen by 25.4 percent. Far fewer respondents chose either of the two mostnegative (14.1%) or two most positive (8.7%) responses.
MLW 3 This was the same cognitive measure used in the domain satisfaction assessments.More than half of the Marines sampled (58.5%) reported some measure of satisfaction with theirlife as a whole: "mostly satisfied" (28.3%), "satisfied" (24.4%), "completely satisfied" (5.7%).Those endorsing "neither satisfied nor dissatisfied" totalled 14.4 percent. On the negative side,17.2 percent were "somewhat dissatisfied," 6.7 percent were "dissatisfied," and 3.2 percent were"completely dissatisfied."
MLW 4 After selecting a particular friend of about the same age, the Marine responding tothe survey compared his or her own life as a whole with that person's life as a whole. One-third ofthose responding (33.4%) said the two were about the same. A majority (39.2%) thought their ownlife was better, while 27.4 percent thought their own was worse. Response tallies for the two polarextremes were almost equal: "a lot worse" at 4.0 percent, and "a lot better" at 4.8 percent.
Multiple-Item Measures (MLW 5-6)
The two multiple-item measures of life as a whole used their own scales. The mean score forone measure was above the midpoint of its scale, that for the other measure below its scale'smidpoint.
MLW 5 The Life Characteristics Scale, a composite measure, asked the respondent to con-sider seven adjective pairs presented in a semantic differential format, with polar terms were placedat the extremes of a seven-point rating scale. Some pairs were reverse coded to ensure that the mostpositive adjective always had the highest score across all seven dimensions. Average scores on theseven dimensions ranged from a low of 4.69 (the disappointing-rewarding dimension) to a high of5.27 (the useless-worthwhile dimension). The mean rating for each dimension is shown inFigure 3.
100

Boring 4.91 Interesting
Miserable 5.34 Enjoyable
Useless Worthwhile
Lonely Friendly4.93
Empty Full5.03
Discouraging Hopeful
Disappointing 4 Rewarding
1 3 4 5 7
Figure 3. Mean scores--LCS components.
Responses across dimensions were averaged to yield a single LCS score on the seven-pointscale. Results of a factor analysis indicated that all seven items had significant loadings on a singlefactor, which accounted for 70 percent of the variance. Reliability analysis yielded an internalconsistency alpha of .89. Inter-item correlations ranged from a high of .79 between discouraging-hopeful and disappointing-rewarding, to a low of .47 between friendly-lonely and useless-worthwhile.
A high score on the LCS indicates that the respondent tends to view her or his life in positiveterms. Just over one-half (56.6%) of these Camp Lejeune Marines had scores on this measure offive or higher. At the polar extremes. 7.5 percent of those responding to the survey described theirlives as completely interesting, rewarding, worthwhile, etcetera, while a scant 1.5 percent said theirlives were totally boring, useless, discouraging, and so forth. A little more than one in five (23.4%)had scores below the midpoint of the scale, that is, in the negative zone. The mean was 4.94.
MLW 6 The Satisfaction with Life Scale contained five positive statements about life as awhole. Survey participants indicated how much they agreed with each statement, using a seven-point scale whose polar anchors were "strong disagreement" and "strong agreement."
The five component items of the SWL Scale loaded on one common factor which accountedfor 70 percent of the variance. Reliability analysis yielded an internal consistency alpha of .89,indicating that it was appropriate to combine the components additively. SWL Scale scoresrepresent the average level of agreement across the five components of the scale.
The mean score on this measure was 3.78, a little below the midpoint of 4.0. Of the componentitems, the Marines in the sample were most likely to disagree with the statement "If I could livemy life over, I would change almost nothing." They were most likely to agree with the statement"I am satisfied with my life."
Relationships Among Life As A Whole Measures
Intercorrelations among the six measures of life as a whole are presented in Table 64. Theseintercorrelations ranged from a low of .40 (between MLW-1, the D-T Scale and MLW-4, socialcomparison) to a high of .75 (between MLW-3, the cognitive satisfaction scale and MLW-5, the
101

Life Characteristics Scale). The moderate correlation coefficients obtained suggest that the variousscales are measuring slightly different aspects of overall quality of life. However, only onecommon factor was extracted.
Table 64
Intercorrelations Among Global QOL Measures
LAW I LAW 2 LAW 3 LAW 4 LCS SWL
LAW 1 .68 .60 .40 .74 .62
LAW 2 (Life description) .60 .41 .71 .67
LAW 3 (Life satisfaction) .48 .62 .75LAW 4 (Social comparison .41 .48
LCS Scale .65SWL ScaleNo.. All coefficients are significant atp < .001.
Relationships Among Domain Measures and Overall Quality of Life
Correlations were computed between each of the domain affective and cognitive scores andeach of the global scores. These correlations are presented in Table 65. Showing the strongestcorrelation with the global measures, very generally, were income, job, and self. Weakestcorrelations were generally found between global measures and relationships with children andrelationships with relatives. To a very slight degree, correlations between domain affectiveassessments and global measures tended to be stronger than correlations between domain cognitiveassessments and global measures.
102

Table 65
Correlations of Domain Measures With Global QOL
Global QOL MeasuresDomain Measures LAW 1 LAW 2 LAW 3 LAW 4 LCS SWLResidence
D-T .48 .46 .41 .32 .50 .49Satisfaction .42 .43 .40 .29 .45 .47
Neighborhood.D-T .36 .39 .35 .25 .43 .42Satisfaction .34 .37 .36 .27 .41 .43
Leisure and RecreationD-T .39 .37 .37 .19 .43 .39Satisfaction .38 .38 .34 .26 .40 .43
HealthD-T .46 .43 .44 .29 .47 .43Satisfaction .39 .38 .44 .26 .44 .42
FriendshipsD-T .38 .35 .39 .21 .43 .34Satisfaction .33 .28 .35 .19 .38 .34
Marriage/RelationshipD-T1 .41 .41 .44 .29 .49 .45Satisfaction .23 .19 .28 .15 .25 .27
ChildrenD-T .03 -.05 .10 .02 .04 .01Satisfaction .35 .33 .39 .35 .34 .41
Other RelativesD-T .29 .27 .35 .20 .32 .29Satisfaction .25 .21 .29 .22 .28 .27
Income/Standard of LivingD-T .51 .53 .53 .38 .52 .60Satisfaction .43 .44 .46 .33 .43 .55
JobD-T .51 .54 .45 .35 .56 .53Satisfaction .44 .46 .45 .35 .53 .52
SelfD-T .66 .59 .65 .41 .68 .64Satisfaction .41 .34 .49 .30 .48 .43
Notes.1. All coefficients are significant at p < .001.2. Ns varied from 678 to 1,119 for the Relations with Children domain.aA Separate D-T scale was used for members not seriously involved in a relationship.
The Global Quality of Life Composite
While multiple measures of a single concept serve to enhance measurement reliability andvalidity, the resulting increase in complexity militates against easy interpretation of analysisresults. Recognizing the value of multiple measures, it nevertheless seemed advisable to either
103
reduce the number of measures, or cumulate them into some meaningful composite, in order tofacilitate the use of the findings of this study in operational programs.
To ascertain the appropriateness of a single composite measure, the six life as a whole variableswere subjected to a principal components factor analysis. The result was the extraction of a singlefactor which accounted for 66 percent of the variance. Loading most highly on this factor was theSWL Scale, the satisfaction with life scale, followed in order by MLW 5, the modified LCS, MLW1, the D-T scale, MLW 2, the single item life description, MLW 3, the satisfaction item, and MLW4, the social comparison item. Factor loadings ranged from .38 to .74. Therefore, the factor analysissupported an underlying single-factor structure, each of the measures accounting for a significantincrease in variance accounted for.
The resulting composite was subjected to reliability analysis to determine internal consistency.The obtained coefficient alpha of the QOL composite was .90. This excellent reliability furthersupported the appropriateness of a global composite.
The resulting distribution of scores on the global QOL composite ranged from a low of six toa high of 41 (the latter being one point below the highest positive score possible across the sixmeasures). The mean of the distribution was 25.5, very slightly below the midpoint of the scale,which was 26.3.
Subgroup Differences in Global QOL Ratings
Analysis of variance procedures were used to investigate subgroup differences in assessmentsof global quality of life. These differences are discussed below.
Demographics and Global QOL
Analysis of variance showed that marital status and rank group both accounted for significantdifferences; interactions between the two, however, did not. Married scored higher on global QOLthan either the formerly married or those who had never been married. Senior enlisted scoredhigher than junior enlisted, but senior officers scored lower than their junior counterparts; warrantofficers scored highest of all. Women averaged higher Global QOL than men. Scores increaseduniformly with age group. With respect to relationship status, married respondents scored higherthan the singles who were involved in an intimate relationship; singles who were not involved in arelationship scored lowest. No significant differences could be attributed to race. Table 66 presentsa cross-tabulation between marital status and rank group.
104

Table 66
QOL Global Composite Means by Marital Status and Rank Group
Rank GroupMarital Status E-2--E-5 E-6--E-9 W-O O-1--O-4 O-4--O-9Married 25.57 28.54 31.31 31.74 29.73Single, Never Married 21.59 27.15 33.20 N/A N/ASingle, Previously Married 23.52 25.33 36.80 30.68 N/A
Person-Environment Fit and Global QOL
Two variables were computed to measure the concept of P-E fit. The first reflected the matchbetween the characteristics of the respondent's current job in the Marine Corps and that person'sideal job. For the five job characteristics, ideal job ratings were subtracted from current job ratings;a score of zero indicated a match, while discrepancy scores could reach from minus four to plusfour (-4 to +4), with zero at the center. Thus, the closer the score to zero, the better the fit betweenperson and job.
The second variable was computed from responses to three items that reflect the fit between theindividual and Marine Corps life. The items were:
"I talk up the Marine Corps to my friends as a great outfit to be associated with."
"I find that my values and the Marine Corps' values are very similar."
"The Marine Corps is the best of all places for me to work."
Survey participants indicated their agreement with each statement, using a seven-point scalewhose polar anchors were 1--strongly disagree and 7--strongly agree. Ratings were then summed.Thus scores for this variable could range from three to 21.
The two P-E fit variables were moderately correlated (r = -.44, p = .000). Correlations betweeneach variable and the global QOL composite were .43 for job P-E fit, .55 for the Marine Corps fit.
Perceptions of Civilian Alternatives and Global QOL
For each of the QOL domains, respondents compared their current situation with what theyimagined their situation would be if they were civilians. Cumulating these scores resulted in anoverall civilian comparison score.
Marines who perceived that their situations would be better if they were civilians wouldprobably perceive their global QOL less favorably. Indeed, such was the case. A moderate butsignificant negative correlation (r = -.31, p = .000) was found between the global QOL and overallcivilian comparison scores.
105

Predicting Global QOL from Domain QOL
A series of multiple regressions were performed to measure the contribution of the variousdomains to global QOL. Variables included the D-T score and the overall satisfaction score foreach domain (two satisfaction scores for the Relationships with Children domain--those who hadchildren living with them and those whose children resided elsewhere). Organizationalcommitment was also included as a candidate variable because of its presumed effect of QOLperceptions. Table 67 shows the result of the stepwise regression for the total sample, and Tables68 and 69 show the results for married and unmarried respondents, respectively.
Table 67
Multiple Regression Predicting Global QOL--Total Sample
Variable Multiple R RL Beta InFeelings about self overall .62 .38 .62Income and standard of living .70 .49 .36Commitment .74 .54 .24Marriage/Intimate relationship .75 .57 .17Satisfaction with income .76 .58 .18Feelings with child not living with you .77 .59 .10Feelings aboutjob .78 .60 .13Satisfaction with residence .78 .61 .10Friends and Friendship .78 .62 .09Satisfaction with neighborhood .79 .62 -.09Leisure and recreation .79 .62 .06Self and self development .79 63 .05Satisfaction with marriage .79 63 .03Satisfaction with recreation .79 63 -.03Satisfaction with relatives .79 63 .03Feelings with child living with you .79 63 -.02Feelings about neighborhood .79 63 .03Feeling about residence .79 63 -.02Satisfaction relationship with children .79 63 -.01Satisfaction with friends .79 63 .01Feelings about health .79 63 .01Satisfaction with health .79 63 -.01Feelings about relations with relatives .79 63 -.01Satisfaction with job .79 63 -.004
106

Table 68
Multiple Regression Predicting Global QOL--Married Sample
Variable Multiple R Rz Beta InSelf and self development .62 .39 .62Satisfaction with income .70 .49 .34Commitment .73 .54 .23Marriage/Intimate Relationship .75 .57 .20Feelings with child not living with you .76 .58 .13Income and standard of living .77 .60 .17Feelings aboutjob .78 .61 .12Friends and friendship .78 .61 .11Satisfaction with residence .79 .62 .09Satisfaction with neighborhood .79 .62 -.09Leisure and recreation .79 .63 .04Satisfaction with recreation .79 .63 -.04Satisfaction with relatives .79 .63 .03Residence .79 .63 .04Satisfaction with marriage overall .79 .63 .03Satisfaction with friends .79 .63 .02Feelings with child living with you .79 .63 -.02Self and self development .79 .63 .02Feelings about neighborhood .79 .63 .01Satisfaction with job .79 .63 .01Feelings about health .79 .63 .004Satisfaction relationship with children .79 .63 -.003Satisfaction with health .79 .63 -.002
107

Table 69
Multiple Regression Predicting Global QOL--Unmarried
Variable .Multiple R R2 Beta InFeelings about health .54 .30 .54
Satisfaction with recreation .67 .44 .38
Feelings about self .73 .53 .36
Satisfaction with income .77 .60 .29
Feelings about job .80 .64 .29
Feelings about neighborhood .84 .71 -.34
Satisfaction with marital relations .85 .73 .19
Marriage/Intimate Relationship .88 .77 -.33
Satisfaction with neighborhood .89 .79 .34
Income and standard of living .91 .82 .31Satisfaction with residence .92 .84 .31
Feelings with child living with you .93 .87 -.21
Satisfaction relationship with children .94 .89 -.19
Self and self development .95 .90 .19
Commitment .96 .92 .17Satisfaction with health .96 .93 -.29
Feelings with child not living with you .96 .93 .13
Satisfaction with job .97 .94 -.58Feelings about relations with relatives .98 .95 .17
Satisfaction with relatives .99 .98 -.68
Satisfaction with friends 1.0 1.0 .53
Residence 1.0 1.0 -.38
Leisure and recreation 1.0 1.0 .12
Feelings about self emerged as the most potent predictor in two cases, total sample and marriedpersonnel; for single Marines, the top predictor was feelings about health. Second for the sampleas a whole was feelings about standard of living, whereas second for both married and single wasoverall satisfaction. In each case, most of the variance was accounted for by six variables--77percent for the total and married samples, and 84 percent for the unmarried sample.
It has been suggested that the weight of the domains might influence global QOL. To test this,each domain's D-T and overall satisfaction score were weighted by multiplying that score by thesalience score for the same domain (except for the job domain, wherein no salience score wasobtained). The regressions were then re-run. The results were indeed different. Feelings about jobemerged as the strongest predictor for all three groups. Tables 70, 71, and 72 summarize the resultsof these regressions.
108

Table 70
Multiple Regression Predicting Global QOL--Total Samplea
Variable Step Multiple R RZJob 1 .52 .27Income and standard of living 2 .61 .38Satisfaction with job 3 .63 .40Friends and friendship 4 .65 .42Commitment 5 .65 .43Self and self development 6 .67 .44Satisfaction with self 7 .69 .48Satisfaction with residence 8 .70 .48Marniage/Intimate relationship 9 .70 .49Satisfaction with income 10 .70 .49Satisfaction with relatives 11 .70 .49Feelings with child living with you 12 .70 .49Satisfaction relationship with children 13 .71 .50Satisfaction with friends 14 .71 .50Neighborhood 15 .71 .50Residence 16 .71 .50Satisfaction with marriage 17 .71 .50Satisfaction with recreation 18 .71 .50Feelings about relations with relatives 19 .71 .50Health 20 .71 .50Satisfaction with health 21 .71 .50Satisfaction with neighborhood 22 .71 .50Feelings with child not living with you 25 .71 .50aWeighted D-T and Satisfaction values.
109

Table 71
Multiple Regression Predicting Global QOL--Married*
Variable Step Multiple R RzJob 1 .51 .26Income and standard of living 2 .61 .37Satisfaction with job 3 .62 .39Self and self development 4 .64 .41Satisfaction with self 5 .66 .44Commitment 6 .68 .47Satisfaction with friends 7 .69 .48Satisfaction with residence 8 .70 .48Satisfaction with relatives 9 .70 .49Marriage/Intimate relationship 10 .70 .49Satisfaction with income 11 .70 .49Feelings with child living with you 12 .70 .49Satisfaction relationship with children 13 .71 .50Satisfaction with marriage 14 .71 .50Satisfaction with neighborhood 15 .71 .50Residence 16 .71 .50Health 17 .71 .50Satisfaction with recreation 18 .71 .50Feelings with child not living with you 19 .71 .50Neighborhood 20 .71 .50Feelings about relations with relatives 21 .71 .50Satisfaction with health 22 .71 .50Friends and friendship 23 .71 .50Leisure and recreation 24 .71 .50aWeighted D-T and Satisfaction values.
110

Table 72
Multiple Regression Predicting Global QOL--Unmarried*
Variable Step Multiple R RzJob 1 .57 .33Satisfaction with income 2 .69 .48Satisfaction with job 3 .74 .54Friends and friendship 4 .79 .62Feelings about relations with relatives 5 .83 .69Marriage/Intimate relationship 6 .91 .82Commitment 7 .91 .84Satisfaction with friends 8 .92 .85Leisure and recreation 9 .93 .86Income and standard of living 10 .94 .89Feelings with child not living with you 11 .95 .90Satisfaction with recreation 12 .95 .91Satisfaction with neighborhood 13 .96 .92Satisfaction with residence 14 .97 .93Satisfaction with self 15 .97 .95Residence 16 .98 .95Feelings with child living with you 17 .98 .96Satisfaction relationship with children 18 .98 .96Neighborhood 19 .99 .99'Weighted D-T and Satisfaction values.
Summary of Global Quality of Life Findings
Six measures of global QOL were included in the survey. Response totals for each measureexcept two were slightly weighted on the positive side, although the average scores hovered aboutthe midpoint. When a global QOL composite score was constructed, the distribution of scores waswide-ranging; however, the mean was somewhat above the midpoint. All in all, global QOL wasnot very high by any measure used. Married Marines tended to score higher on QOL, whichgenerally increased with rank and age. Women scored higher than men on global QOL.
QOL perceptions are affected by person-environment fit and by comparison with civilians.Somewhat higher global QOL is associated with better fit, and Marines who perceived theirsituations favorably compared with a civilian alternative tended to score higher on global QOL.
The strongest predictor of global QOL for the sample as a whole and for married respondentswas feelings about self; for singles, it was feelings about health. Six variables together accountedfor 77-84 percent of the variance when predicting global QOL from domain QOL.
In summary, it appears that construction of a single global composite using the domain QOLscores is defensible, and that the resulting composite score relates meaningfully to other variables(e.g., P-E fit). However, average global QOL composite scores, like most of the average domainQOL scores, do not distance themselves greatly from the scalar midpoints. Subgroup differencesappear, but, for practical purposes do not amount to very much.
111

Section Five
Organizational Outcomes and Quality of Life

Organizational Outcomes and Quality of Life
Enhancement of the quality of life of its members is a laudable organizational goal in and ofitself. Nevertheless, if quality of life indeed has effects on organizational and individualproductivity and performance, such effects must be identified and measured. It has been thoughtthat quality of life exerts its influence on such things as operational readiness, work quality,performance, and retention. Indirectly, quality of life could influence recruitment throughperceptions of QOL in the Marine Corps by potential applicants, perceptions derived from mediacoverage or from conversations with Marines themselves who discuss quality of life in the Corps.
Outcome variables measured in the Marine Corps Quality of Life Survey include personalreadiness, intention to remain on active duty, and individual performance. Each variable wasmeasured using a combination of indicators drawn from a variety of survey items. Thus, unlike theresults discussed previously (for the various domains of QOL), results in this section are based onany number of items which were embedded in the several sections of the survey. Discussed beloware the descriptive statistics for each of the three variables, and their relationship to global qualityof life.
Personal Readiness
Personal readiness focuses on individual, job, and family conditions which might affect anindividual's ability to move out quickly and, in the end, to perform effectively in the field. Thus,the present study used a multidimensional construct to represent this variable.
Components of Personal Readiness
Nine component items were combined to yield a composite measure of personal readiness.Descriptive statistics for each of the nine elements are presented in the pages that follow.
Perceived Adequacy of Training. Respondents indicated how well they perceived theirtraining to have prepared them for their present job, using a five-point scale anchored from "not atall" to "completely." The modal response was "pretty well" at 41.3 percent; "somewhat" wassecond at 26.0 percent, followed by "barely" at 14.2 percent. The polar opposite responses of"completely" and "not at all" were endorsed relatively equally at 8.7 percent and 9.7 percent,respectively. Perceived adequacy of training was greatest for warrant officers, least for juniorenlisted. Age was positively correlated with perceived adequacy of training, but there were nosignificant differences by gender or race.
Job-Related Problems. Seven items described specific job-related problems (e.g., "mind noton job" or "problems with a superior"), and survey participants were asked to indicate howfrequently they had experienced these difficulties. Table 73 summarizes their responses.
115
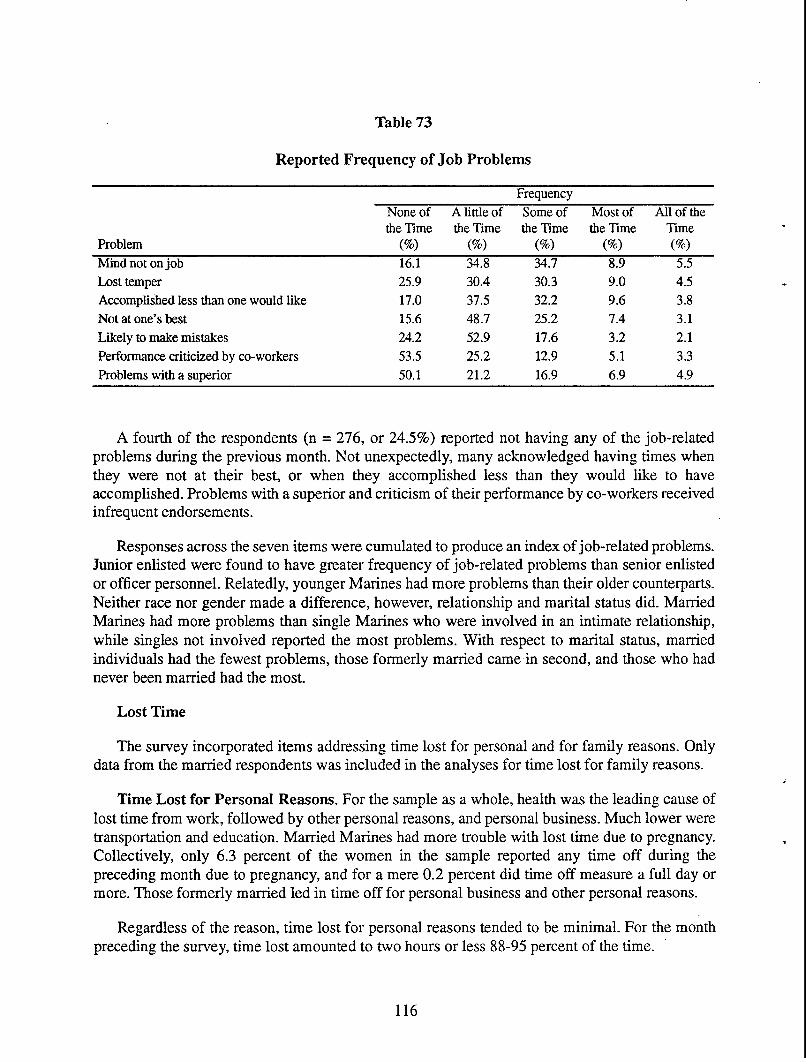
Table 73
Reported Frequency of Job Problems
FrequencyNone of A little of Some of Most of All of thethe Time the Time the Tune the Tune Time
Problem (%) (%) (%) (%) (%)Mind not on job 16.1 34.8 34.7 8.9 5.5Lost temper 25.9 30.4 30.3 9.0 4.5Accomplished less than one would like 17.0 37.5 32.2 9.6 3.8Not at one's best 15.6 48.7 25.2 7.4 3.1Likely to make mistakes 24.2 52.9 17.6 3.2 2.1Performance criticized by co-workers 53.5 25.2 12.9 5.1 3.3Problems with a superior 50.1 21.2 16.9 6.9 4.9
A fourth of the respondents (n = 276, or 24.5%) reported not having any of the job-relatedproblems during the previous month. Not unexpectedly, many acknowledged having times whenthey were not at their best, or when they accomplished less than they would like to haveaccomplished. Problems with a superior and criticism of their performance by co-workers receivedinfrequent endorsements.
Responses across the seven items were cumulated to produce an index of job-related problems.Junior enlisted were found to have greater frequency of job-related problems than senior enlistedor officer personnel. Relatedly, younger Marines had more problems than their older counterparts.Neither race nor gender made a difference, however, relationship and marital status did. MarriedMarines had more problems than single Marines who were involved in an intimate relationship,while singles not involved reported the most problems. With respect to marital status, marriedindividuals had the fewest problems, those formerly married came in second, and those who hadnever been married had the most.
Lost Time
The survey incorporated items addressing time lost for personal and for family reasons. Onlydata from the married respondents was included in the analyses for time lost for family reasons.
Time Lost for Personal Reasons. For the sample as a whole, health was the leading cause oflost time from work, followed by other personal reasons, and personal business. Much lower weretransportation and education. Married Marines had more trouble with lost time due to pregnancy.Collectively, only 6.3 percent of the women in the sample reported any time off during thepreceding month due to pregnancy, and for a mere 0.2 percent did time off measure a full day ormore. Those formerly married led in time off for personal business and other personal reasons.
Regardless of the reason, time lost for personal reasons tended to be minimal. For the monthpreceding the survey, time lost amounted to two hours or less 88-95 percent of the time.
116

Time Lost for Family Reasons. Five subcategories of time lost due to family situations wereused: children, spouse, transportation, family business, and other reasons. Family business andcaring for children were most frequently cited as reasons for time lost. Other family matters andfamily business came next, with transportation receiving the lowest percentage of endorsements.Reporting no time lost for any of these reasons during the preceding month were 71-82 percent ofthe respondents (all married Marines). For any reason, time off reached one day or more for at most3.7 percent of the respondents. Absences of more than five days never exceeded 1.8 percent.
Missing Maneuvers or Exercises
Marines taking the survey were asked if they had missed, arrived late to, or departed early from,maneuvers, exercises, or no-notice alerts, and, if so, the reason(s) therefor. Nearly half the sample(46.3%) indicated that such events did not occur for them. Of those for whom the maneuvers andalerts had occurred (53.7%), time losses were minimal: 94.1 percent had missed no maneuver, norbeen late or left early. Absent were 1.9 percent, while 2.0 percent arrived late and 2.0 percent leftearly.
In sum, only 5.6 percent of the total sample missed any time from these events. The reasons forthe few cases of absence from maneuvers, exercises, or no-notice alerts are shown in Table 74.
Table 74
Reasons Given for Time Lost From Maneuvers, Exercises, or Alerts(n = 96)
Frequency (%)Reason Arrived late/left early Missed entirelyPersonal illness 50.0 50.0Family illness 88.9 11.1Personal or family business 66.7 33.3Legal matters 66.7 33.3Command failed to reach 100.0 0.0Other 57.7 42.3
Commitment to the Marine Corps
Eleven items were used to measure commitment. The items were statements to whichrespondents indicated agreement or disagreement on a 7-point scale, 1 being strong disagreement,and seven representing strong agreement. Each respondent achieved a mean commitment score,and these scores ranged from 1.00 to 6.91, with an average of 3.70, somewhat below the scale'smidpoint of 4.00.
Commitment correlated positively with rank (r = .23) and tenure in the Marine Corps (r = .31).Mean commitment score was highest for warrant officers (4.87), followed in order by senior officer(4.55), junior officers (4.51), senior enlisted (4.31), and junior enlisted (3.42). Commitment waslinearly related to age. By relationship status, married respondents showed higher commitmentthan unmarried, whether the latter were in an intimate relationship or not. Differences were also
117

found by marital status, with formerly married being least committed, married being mostcommitted, and never married Marines in the middle. Other were most committed, followed byHispanics, Whites, and Blacks in that order. Gender accounted for no significant differences incommitment.
There were indications that commitment bore a relationship to time lost from duty. Those whohad lower commitment scores tended to be the ones who also had lost time. Time lost for personalreasons correlated slightly negatively with commitment (r = -.08,p = .003), but time lost for familyreasons showed no significant relationship.
Confidence in Spouse or Partner Self-Sufficiency
This measure was included in the personal readiness composite on the belief that the Marinewould be more able to attend to her or his duties if the spouse or intimate partner was believed tobe self-sufficient and able to take care of situations at home.
The Marines were asked, if they were to be away for a period of six months, how capable thespouse or partner would be to take full responsibility for each of eight concerns. Responses weremade on a five-point scale, anchored with 1, "extremely capable," to 5, "not at all capable." A meanscore across all eight concerns was then computed.
For finances, spouses were rated quite favorably: "capable" (22.6%), "very capable" (18.3%),and "extremely capable" (50.7%). In contrast, "not so capable" (5.9%) and "not at all capable"(2.6%) were response alternatives chosen by very few. Spouses received the lowest capabilityrating for managing residential maintenance and for managing investments, with scores just belowthe scale midpoint. Emotional and parenting matters was the other element with a score on thenegative end of the scale. Ratings for family's health, finances, and safety of family had meanscores below the scale's midpoint.
Adequacy of Child Care
If their Marine duties were to take them away for a period of six months or more, 84.5 percentof those with children felt "completely sure" of the ability of the person with whom their child(ren)were left to fully care for them; another 10.6 percent were "very sure." Only 3.2 percent were atall unsure about the care of their children. More than eight out of 10 (86.0%) said the children'scaretaker would be the spouse, and another 6.2 percent cited an immediate family member. Thosepersons being most confident of their childrens' care were much more likely to cite the spouse asthe caregiver; those most unsure had a high percentage of "other" (23.1%).
Preparations for Absence
Ten items assessed the Marine's preparations for deployments, particularly move outs thatmight occur with little or no warning. Generally, the items had to do with things that make it easierto cope with family separation and the management of personal affairs. Some items (e.g., jointchecking account) applied primarily to married personnel, while making a will or arranging for billpayments applied to almost all respondents. The figures below exclude those who checked "n/a"
118
(often most of the respondents), so the actual numbers of persons indicating having madepreparations for any one thing might be only a few hundred in some cases.
Fourteen percent (14.3%) of these Camp Lejeune Marines felt that none of the items applied tothem. Claimed applicability of the particular items ranged from a low of 2.20 percent of therespondents, to a high of 15.5 percent.
Less than half (45.5%) had drawn up a will, close to the 35.0 percent who had established ajoint checking account. Just half (49.6%) had given power of attorney. Where elder care was aconsideration, 76.4% had made advance preparations. Considering the exigencies of service in theMarine Corps, fairly low numbers had prepared for storage of possessions (53.6%), care of pets(37.4%), and official records (51.0%). Even lower percentages of these Marines had prepared forpayment of bills (26.4%), lease obligations (35.7%), and management of investments (31.4%).
An overall deployment preparation index was computed by dividing the number of actions inthe list not marked "n/a" by the number of those items on which action had been taken. Thisprocedure yielded percentage scores ranging from zero to 100, with an average of 54, not as highan average score as might be desired.
Subgroup analyses revealed that preparation increased with rank and age, in a generally linearfashion. Race and gender accounted for no significant differences in advance preparation forextended absence from home. With respect to relationship status, married Marines were muchmore prepared than single Marines, involved or not. And, by marital status, those married weremost prepared, followed in order by those formerly married and those never having been married.
Personal Readiness Composite
The composite measure of personal readiness was derived from the responses on the ninecomponent variables just discussed. All contributing items were coded so that undesirable optionswere assigned negative values and desirable options positive. The positive and negative data pointswere balanced around a neutral response coded as zero. Because the components used a variety ofresponse scales, all raw scores were transformed into standardized z scores in order to have acommon metric before the scores were combined. Procedures for computing composite scoreswere adjusted so that the scores of single Marines would not be adversely affected by the "notapplicable" (n/a) responses on the two component measures which addressed spouse and children.
The resulting composite yielded a range of scores from -19 to +9, with a mean of -.36. Higherscores indicate a higher level of personal readiness. In the distribution of scores, 50.9 percent ofthe respondents had negative scores, and 49.1 percent scored in the positive range. Readinessincreased generally but not really linearly with rank; the middle age group showed highestreadiness. Hispanics were most ready, followed in order by Other, White, and Black. Gender,marital status, and relationship status accounted for no significant differences.
The global QOL composite correlated at .38 (p = .000) with the personal readiness composite.This indicates only a very moderate relationship, a shared variance of some 14 percent between thetwo measures. The relationship between the two was tested further by contrasting the QOL levelsachieved by those individuals at the extremes of the distribution, that is, those persons (n = 221)
119

with the highest 20 percent of the personal readiness scores, and those (n = 227) with the lowest20 percent. Global QOL averaged 29.64 for the group with the highest scores, versus an averageof 22.23 for persons in the lowest scoring group, a statistically significant difference.
Retention -
The organizational outcome variable of retention was measured using a single indicator,intention to remain on active duty.
Intention to Remain
Marines responding to the survey could chose, from a list of six options, the statement that bestdescribed their intentions at that time. Statements ranged from intending to stay in the MarineCorps until retirement, to intending to get out as soon as possible. A provision was also made forthose individuals who had planned a career in the Marine Corps but were being released becauseof the drawdown. Table 75 shows the percentage of responses in each category. Thirty-five percent(35.5%) intended to leave as soon as possible, and 23.0 percent were unsure of what to do.Approximately one out of four (29.9%) intended to stay until or beyond retirement eligibility.
Table 75
Intentions to Stay
Reenlistment Intentions PercentRemain on active duty until eligible for retirement or beyond 29.9Remaining on active duty, but planning to leave prior to retirement 8.8Not sure about career intentions 23.0Intending to leave Marine Corps as soon as possible 35.5Intended to remain on active duty, but being released due to drawdown 2.8
Significant differences were found on all subgroup variables. Intention to remain was higherfor senior enlisted and officers than for their more junior contemporaries, and warrant officersshowed the greatest intention to remain. Of 761 E-2 to E-4s, 45.5 percent were leaving the MarineCorps as soon as they could, while another 27.9 percent were unsure of what to do; only 23.7percent were staying. Stayers exceeded leavers in all other rank groups; senior enlisted (74.3% vs.12.5%), warrant officers (100.0% vs. 0.0%), junior officers (63.5% vs. 11.5%), and senior officers(100.0% vs. 0.0%). Somewhat related to these findings with respect to rank, intention to remain onactive duty increased linearly with age.
The "Other" group had the highest intention to remain (54.3%), followed in order by Blacks(44.6%), Hispanics (40.8%), and Whites (36.7%). There were no significant gender differences. Byrelationship status, highest intention to remain was shown by the married Marines, lowest by thesingle Marines who were not involved in an intimate relationship. With respect to marital status,the formerly married Marines had the lowest intention to remain, while those who were marriedscored the highest on staying.
120

Global QOL and Intention to Remain on Active Duty
Analysis of variance revealed that those who intended to leave the Marine Corps as soon aspossible also scored lowest on QOL, while those choosing to remain on active duty scored highest.Marines who were unsure of their intentions had lower QOL than those intending to remain, butscored higher on QOL than those intending to leave as soon as possible.
These result demonstrate a relationship between QOL and a desired organizational outcome(retention). They do not, of course, indicate a causal direction.
Domain QOL and Intention to Remain on Active Duty
Three domain level variables were used to measure relationships between domain level QOLand intention to remain on active duty: the domain D-T summary score, the domain levelsatisfaction summary score, and the respondent's own estimation of the effects of various lifeaspects on their intentions to remain. Thus, the first two variables are derived from the data, whilethe third results from a direct question about (perceived) effects on intention.
Domain QOL and Retention--Inferred Relationship. The intention to remain categoricalvariable was recoded as a continuous variable, to facilitate measurement of relationships betweendomain QOL and intentions to remain on active duty. In this recoding, the response dealing withinvoluntary separation because of downsizing was dropped; intention to remain until retirement,and eligible to retire but staying in, were combined. Correlations were then computed betweendomain QOL levels and intention to remain.
With respect to affective evaluations (the D-T scale) for the various domains, 10 of the 12showed a slight but statistically significant relationship with intention to remain on active duty.Thus, those Marines intending to stay were more likely to have higher scores on the Domain D-Tscales. Feelings about residence had the strongest relationship (r = .24), followed by neighborhood(r = .22). Cognitive evaluations (satisfaction) for the various domains showed similar relationshipswith intention to remain in the Corps. Nine of 11 were significantly correlated with intention toremain on active duty, with the Marines having higher satisfaction scores being those most likelyto stay. The strongest relationship was between staying and satisfaction with job (r = .28), followedby satisfaction with residence (r = .25).
QOL, Career Intent, and Commitment in the Lower Paygrades. As stated above, overall,perceptions of quality of life become more positive with increasing age and rank, and with strongercareer intent. To compare mean levels of satisfaction by career intent within seniority groups, threecareer subgroups were identified using the career intent item in the survey: a "stay" group (fromthe first two alternative responses); an "unsure" group (from the third and fourth alternatives); anda "leave" group (from the fifth alternative). Those being released due to reduction in force wereexcluded.
Enlisted and officer groups were analyzed separately, with three seniority groups in each--enlisted paygrades E-2 to E-3 (junior), E-4 to E-5 (middle), and E-6 to E-7 (senior); and officerpaygrades 0-1 to 0-2 (junior), 0-3 (middle), and 0-4 to 0-5 (senior). Other paygrades wereexcluded because of very small sample size.
121
For enlisted junior, middle, and senior groups, the ages averaged 20.9, 24.5, and 39.9,respectively; for officers, the respective mean ages were 25.6, 34.1, and 40.9. However, because ofsmall sample sizes, the career unsure and leave groups were combined for enlisted senior and allthree officer seniority groups. Responses were compared on three domain satisfaction items(Income, Job, and Self Development), and on one (within Job domain) organizational commitmentitem ("the Marine Corps is the best place to work..
The results are shown in Figures 4, 5, 6, and 7. The enlisted stay groups show few or infrequentdifferences across seniority levels, but clear differences within seniority groups (stay is highest,leave is lowest). Thus, the junior stay group is almost always more positive than the middle andsenior leave and unsure groups. Domain satisfaction levels for officers tend to vary across careerand seniority groups. However, the commitment item shows large differences for all enlisted andofficer stay groups--higher than all unsure and leave groups.
This result suggests that this commitment item may be as good as, or better than, the careerintent item for estimating or predicting an individual's subsequent career decision. Furthermore,using the three career intent groups as a continuous variable (stay = 3, unsure = 2, leave = 1),correlation with "Marine Corps is the best place" is relatively high for enlisted (.52), moderate forofficer (.37).
Because members of the junior paygrades must all make a career decision, similar comparisonswere conducted on only junior enlisted (E-2, 3, 4) and officer (0-1, 2, 3) groups, using threecommitment items ("the Marine Corps is the best place," "involved personally in my work," and"being a Marine is worth personal sacrifice"). Results are portrayed in Figure 8. Again, there arelarge differences among the enlisted stay, unsure, and leave groups, and smaller differencesbetween the officer stay and combined unsure/leave groups.
122

Stayr-'Unsure
Leave• Unsure/Leave
6
5
4
3
2
1
0Jr Mid Sr Jr Mid Sr
Enlisted OfficerSeniority
Income Satisfaction
Figure 4. Comparison of income satisfaction for three career intentgroups within seniority levels.
Stay=Unsure
SLeaveSUnsure/Leave
6
5
4
3
21 i
0Jr Mid Sr Jr Mid Sr
Enlisted OfficerSeniority
Job Satisfaction
Figure 5. Comparison of job satisfaction for three career intentgroups within seniority levels.
123

M Stay
r- Unsure
EDLeave
R Unsure/Leave6
5
4
3
2
1
0Jr Mid Sr Jr Mid Sr
Enlisted OfficerSeniority
Satisfaction with Self/Personal development
Figure 6. Comparison of satisfaction with self-development forthree career intent groups within seniority levels.
=Stay=Unsure
SLeaveB=Unsure/Leave
6
5
4
3
2
1
0Jr Mid Sr Jr Mid Sr
Enlisted OfficerSeniority
Organizational Commitment
Figure 7. Comparison of organizational commitment for threecareer intent groups within seniority levels.
124

lEnl. Stay
r-Enl. Unsure
E"Enl. Leave
M Off. Stay
6 EZ Off. Unsure/Leave
5
4
3
2
Best Place Worth Sacrifice Involved in My Work
Organizational Commitment
Figure 8. Comparison of organizational commidtment of JuniorEnlisted and Junior Officers by career intent.
Domain QOL Effects on Retention--Perceived Relationship
An item in each of the domain sections of the survey asked a question: "To what extent does(domain title) affect your plans to remain on active duty?" The response scale for these itemsranged from "not at all" (1) to "a great deal" (7), with a neutral center point of "somewhat" (4).Table 76 presents the means for the sample as a whole on each of the items. Also shown are themeans for the "planning to leave" and "intending to remain" subgroups.
125

Table 76
The Extent to Which Various Aspects of Life Affect Career Plans
Perceived Effect of Domain on Reenlistment DecisionsOverall Leaving Group Staying Group
Domain Mean Mean. MeanResidence 3.22 3.68 2.61Neighborhood 2.77 3.30 2.19Leisure and recreation 3.36 4.04 2.47Health 3.26 3.27 3.18Friends and friendships 2.48 2.76 1.88Marriage or intimate relationship 3.98 4.53 3.03
Children 3.96 4.64 3.45Relatives 3.06 3.73 1.93Income and standard of living 4.60 5.23 3.62Job 4.40 4.83 3.86Self 3.84 4.11 3.50
A comparison of the subgroup means reveals that the mean scores (for effect on intention) ofthe "planning to leave" subgroup are consistently higher than the other group's mean scores, acrossall domains, and the higher the mean score, the more effect that domain is having on intention toremain on active duty. The indications are that when respondents said that a domain had an effecton their intentions to remain on active duty, it was a negative effect which they were indicating.Friends and friendships had the least effect on career intentions, income the greatest effect.
Individual Performance
There are serious problems facing any attempt to relate performance to either personal ororganizational variables. Such problems arise primarily because of the performance question, (i.e.,just what is performance?), and from the extreme difficulties encountered in trying to measureperformance. There is no completely satisfactory operational definition of performance, and thiscriterion problem is not nearing solution. To this already troublesome state of affairs must be addedthe issue of inflated ratings, a concern shared by military and civilian organizations; performancescores of job incumbents tend to be clustered near the top of the scales, making differentiationamong individuals difficult. A third problem inserts itself into the present effort, that being the factthat there is neither a common metric nor a common performance data set between E-4 and belowpersonnel and E-5s and above.
QOL and Performance--Inferred Relationship
In spite of great deficiencies with respect to performance measurement, it was decided to usethe direct measures used by the Marine Corps itself. Thus, unsatisfactory as they are, a performancerating average across seven performance dimensions was drawn from the last two fitness reportsfor E-5s and above. For E-2 to E-4s, the performance variable was a composite used for promotionconsiderations (this was available for only those Marines in this rank group who were eligible for
126
promotion based on time in grade, and it was contaminated by non-performance elements). Toavoid to some extent the problem with distribution of scores, only the top 20 percent and the bottom20 percent of scores for each of the two rank groups were used in the calculations.
Using these scores for performance, there was no significant correlation with global QOL foreither the E-4s and below or the E5s and above. Analyses of variance procedures, however,confirmed that some significant differences could indeed be attributed to performance category forthe E-4s and below (= .05). For the E-4s and below, the mean performance scores were 23.40 forthe low performers, versus 24.78 for the high performers. A t-test for differences between twomeans found significance at the .05 level. For the E-5s and above, the differences between meanswas not significant.
QOL Effects on Performance--Perceived Relationship
Except for the section on Marine Corps job, each section of the survey included a questionasking respondents how much that particular area of life affected their job performance. For thisanalysis, the respondents were categorized as E-2 to E-4s or E-5 and above. Response optionsagain were arrayed on a seven-point scale from "not at all" (1) to "a great deal" (7), with"somewhat" (4) being the neutral midpoint.
For the lower ranking individuals having dependents (less than half of the E-2 to E-4s),dependent health concerns were perceived to have the greatest effect on performance, followed bypersonal development. Showing the least effect on performance for members of this subgroup wasneighborhood. In the E-5 and above subgroup, personal development showed the greatest effect onperformance, with dependent health coming in at a close second. Relationships with relatives hadleast effects on performance.
It should be noted that, in no case, for either subgroup, did the average perceived effects onperformance reach even the midpoint of the scale. Also, in all but one case, perceived effects onperformance were rated higher by the lower ranking group than by the higher. The range of meanscores provide evidence that respondents can distinguish the varying intensities of domain QOLeffects. Nonetheless, it can be conjectured, on the basis of these findings, that the Marines in theCamp Lejeune sample perceive their performance on the job to be little affected by quality of lifeconditions in the other areas of their lives.
Summary of QOL and Organizational Outcomes
Quality of life was significantly related to personal readiness. Marines perceiving higher QOLtended also to have a higher readiness composite score. Neither race nor marital status was relatedto personal readiness. Women showed less personal readiness than men, and readiness increasedwith rank and age. On the whole, using the nine indices discussed above, readiness was onlymoderate.
Quality of life was found to be related to intention to stay in the Marine Corps. Most closelycorrelated with remaining on active duty were job and residence; this was true for both cognitiveand affective evaluations. In addition, perceptions of the effects of domain QOL for those Marinesintending to remain differed significantly from the perceptions of those Marines intending to leave.
127

A weak yet significant correlation was found between individual performance and global QOLfor E-5s and above, with higher performers also perceiving better QOL overall. This is, of course,a relationship, not a causal connection.
128

Section Six
Discussion

Discussion
The Marine Corps Quality of Life Survey has delivered a wealth of information bearing on thequality of life of Camp Lejeune Marines, both in a global sense and with respect to a number ofspecific domains. The analyses reported herein reflect an attempt to "slice the data" in multipleways so as to derive meaning from the responses which these Marines have provided through theirparticipation in the survey. That the result is a rich lode of information is undeniable.
The image which emerges from the data is one of the women and men of an organization doingthe work they are assigned, and endeavoring to do it well. Their quality of life may vary from thatof others, and from the level they would like it to be at; however, in their perceptions, by and large,QOL does not affect their performance to any great extent--or, they do not allow it to. As in anyorganization, and as in life in general in our society, quality of life, at least in its material andpsychological aspects, increases with one's status, income, and organizational tenure.
Young people do not perceive their quality of life as positively as do their more mature fellows,in part because of these material and psychological conditions, but also, one would suspect, simplybecause of youth itself and its demands for adjustment to adult life in general and in particular tothe world of work. The presence among the Marines of Camp Lejeune of many very young andfew very old cannot but induce age differences in perceived quality of life which favor the moremature person. Rank differences stem in part from the younger-older contrast, in part fromprivileges and benefits attendant upon seniority, and also from the officer-enlisted dichotomy.
As to the perceptions of young people, however, a striking finding of this study is that the QOLperceptions of career-intending Marines of all ages are frequently more positive than those ofMarines unsure of their career plans or planning to leave. This finding was most noticeable withrespect to a few organizational commitment items, particularly "The Marine Corps in the best placefor me to work." Thus, the job-oriented perceptions of the committed Marines appear topredominate over (but certainly not exclude) their concerns with the "creature comfort" and"social" type domains of QOL.
Although quality of life is an important concern for Marines of all paygrades, there is goodreason to be especially sensitive to the experiences and perceptions of the lower enlisted and officerpersonnel--the source of the future leaders of the Marine Corps. The Corps wants to attract to acareer the most competent and committed from these sources. Virtually all individuals in the seniorranks have long ago committed themselves to a career, and thus, long ago decided that the variousaspects of QOL were sufficiently acceptable to them and their families (even if not fullysatisfactory) for a career in the Marine Corps.
To what extent will improvements in any aspect of QOL attract more of the junior officer andenlisted personnel to a Marine Corps career? For some--those who joined just for the challenge oradventure, or short-term service to their country (the intending "leavers")--perhaps no amount ofQOL enhancement (except, perhaps, increased job challenge) would be enough to shift theirintention toward a career. The other two junior groups, the stayers and the unsure, are probably thegroups most critical to monitor (by periodic surveys) for shifts in perceptions, regarding actions toimprove specific domains of QOL.
131

Marriage, children, and intimate relationships each introduce additional concerns to membersof an organization, affecting quality of life by those concerns, sometimes markedly. On the otherhand, such relationships also offer many positive contributions to quality of life. In all likelihood,racial and gender differences in perceived QOL primarily reflect individual comparisons betweenperceived opportunities within and outside of the Marine Corps. Age, rank, gender, race, andrelationship or marital status notwithstanding, the great majority of survey respondents from CampLejeune are proud to serve, proud to be Marines.
On a total sample basis, quality of life is about average, i.e., mean QOL ratings cluster aroundthe midpoints of the scales by which it is being measured. Many of the Marines in the CampLejeune sample are reasonably content, many are not. At the extremes, a few see life as "a bowl ofcherries"; others perceive just the pits. However, most differences meld together, and things comeout in the middle for the sample as a whole--for that is what averaging does, especially with largesamples. In the end, the picture presented by the survey results is neither good nor bad; it is just apicture. There are aspects of QOL warranting accolades, and other aspects calling for commandattention and ameliorative efforts.
In a sense, of course, the results of the survey hold few surprises. There is little revealed by thesurvey which is not known to the enlisted and officer leaders of the Marines stationed at CampLejeune. After all, "know your people and look out for their welfare" is more than a cliche to theMarines--it is an operative fact, and an ever-present requirement. Therefore, much, if not most, ofthe information contained in this report has little novelty.
No Marine leader needs a survey to tell him or her that life in a house located in a goodneighborhood is in many ways preferable to life in the barracks, or that, if Marines must live inbachelor quarters, they desire those quarters to be attractive. Likewise, it is no secret that physicalappearance is highly important to a Marine of whatever rank or job assignment. The Marine leaderis fully cognizant that married Marines, and those with children, have added concerns that affectquality of life. The Marine leader is alert to performance discrepancies that frequently arisebecause of interpersonal relationships and family problems, and knows the value of recreationalfacilities and services provided to the Marines at Camp Lejeune.
Finally, the concordance of the findings with known conditions serves, in a non-scientific way,of course, to lend credibility to the survey results, and to highlight even more those areas whereresults depart from what might be expected.
However, the survey results do more than confirm what the leader knows. Most importantly,they provide quantification. "A lot of," "not too many," "only some of," "the average Marine," andother ill-defined terms commonly used in estimating situations and requirements have beenreplaced with numbers, with accurate numbers derived from scientifically defensible surveymethods and data analyses. This enhances communications capability.
While the "not too many" of several leaders may differ widely, sample means and responsepercentages are fixed with numbers fully comprehensible to all. This does not relieve the leader ofoperationally defining success and failure--of deciding which percentages etcetera are satisfactoryand which are unacceptable and therefore shall become the targets for amelioration. But it does addthe quantification needed for accurate targeting.
132

What might profitably follow this effort are attempts to lend additional meaning to what hasbeen quantified. It is suggested that the commander and staff select those results areas which areproblematic with respect to organizational goals, those elements of the survey results which callfor further exploration or simply pique the curiosity of those cognizant over functions and activitieswhich bear directly on quality of life. These results areas, then, should become the focal points fordeeper, site-specific research by the command, using such techniques, perhaps, as focus groups,follow-on mini-surveys, and interviews.
On the other hand, quality of life is as it is perceived. The results are clear: QOL perceptionsare heavily influenced by feelings about self-esteem and satisfaction with personal development.The commander and staff can influence QOL in a positive way through efforts aimed at enhancingindividual self-esteem and organizational pride in a job well done.
Perceptions about the job domain very strongly influence quality of life perceptions. This isvery apparent in the survey results. The work of Marines has many aspects that can become thesubject of information campaigns designed to inform Marines, particularly the younger ones, ofthe many benefits of service in the Marine Corps, whether or not a career is envisioned.
In sum, quality of life in the Marine Corps could benefit greatly by serious and sophisticatedefforts to highlight the many benefits of service, as well as by efforts to make Marines feel goodabout themselves. In addition, simple, periodic instruction in how to take care of life's situationswould improve personal readiness even as it made individual Marines feel more in charge of theirown affairs. Perceptions can be altered, and Marines can be taught how to organize their life spacein order to improve their own quality of life.
Another important survey result also has to do with numbers. This is in the realm of baselinestatistics. Whether one is setting goals for a program, or furnishing data to the "bean counters" athigher echelon in order to justify funding requests, one must be able to answer the question:"Compared to what?" These survey results give the leaders of the Marines at Camp Lejeune theadvantage of being able to answer that question.
Furthermore, baseline statistics assist in developing objectives, as well as in calculatingprogress in reaching them. To use an analogy, a line of march requires two points: current position,and goal position. These baseline statistics provide current position with respect to the QOLelements that were measured. When the goals are added to them, the line of march is clearlyindicated. Then, in the future, subsequent to organizational events, QOL enhancement efforts,social changes, or whatever, QOL at that future time can be measured against these baselinestatistics, providing quantified measures of progress, or, indicating where command attentionmight profitably be focused.
There is a long history of failure in trying to definitively tie performance to other variables suchas job satisfaction, organizational commitment, and quality of life. The fact that the results of thissurvey show a connection between QOL and performance must be viewed as a landmark--andshould impel further research in this area, in terms of causal connections and interventionimplications.
133

Because performance is impossible absent the Marine, results documenting a connectionbetween QOL and intention to remain on active duty are important data points for Marine Corpsplanning and policy making. And, because personal readiness is itself an important organizationalvariable--particularly for a combat organization--the relationship between the personal readinessof Camp Lejeune Marines and their QOL perceptions takes on great importance, Many Marinesseem to "get 'erm both right": they perceive good QOL and they see to their own readiness. Noclaim is made for a causal connection in either direction; however, the relationship is important inits own right, and may have to do with that underlying factor known as attitude, which is, of course,modifiable.
Those persons familiar with the discipline of organizational development will recognize thatthe collection of data and the reporting of those data in themselves constitute an organizationalintervention. To the point, the Marine Corps, and its subordinate units, have been changed towhatever small degree just by virtue of having commissioned and conducted the Marine QOLsurvey.
For many Marines stationed at Camp Lejeune, the survey has no doubt raised the salience ofboth global QOL and QOL in the various life domains; these persons will be more alert to QOL,and may begin to more critically evaluate their QOL circumstances and options. For whatevernumber of survey participants, it has inescapably raised expectations that there will be QOLenhancement efforts "coming down the pike," and they will await evidence of such efforts. Theleaders at Camp Lejeune should be alert to such effects and expectations, and capitalize on them.
It has previously been suggested that the Marine Corps Quality of Life Survey be repeated atregular intervals. That recommendation is sound. Such data collection is considered essential totracking progress in QOL improvement. However, the leadership of Camp Lejeune is not limitedto data from the triennial QOL surveys; it can make use of the survey at will. In addition, the surveyis essentially modular; one or more relevant sections of it could be used for specific data collectionefforts at local sites. This makes the survey an even more effective and available "weapon ofopportunity" for the leaders of the Marines at Camp Lejeune.
Comprehensive quality of life assessment has brought into clearer focus the perceptions of theMarines themselves--as a whole and as demographic subgroups--about their quality of life. Thus,the data reported herein speak for these Marines. The individual responses of each Marine havebeen tallied and added to those of her or his fellows; together, their responses cumulate into apowerful information matrix for the commander and other cognizant officers. In addition to the"snapshot" of what conditions are for Camp Lejeune Marines in terms of QOL, the assessmentindicates avenues of approach toward QOL enhancement.
134
References
Campbell, A., Converse, P. E., & Rodgers, W. (1976). The quality of American life: Perceptions,evaluations, and satisfactions. New York: Russell Sage Foundation.
Diener, E., Emmons, R. A., Larsen, R. J., & Griffin, S. (1985). The Satisfaction with Life Scale.Journal of Personality Assessment, 49, 71-75.
Kerce, E. W. (1995). Quality of Life in the U.S. Marine Corps (NPRDC TR-95-4). San Diego:Navy Personnel Research and Development Center.
135

Appendix A
Marine Corps Quality of Life 1993Member Questionnaire
A-0

THE MARINE CORPS andQUALITY OF LIFE
1993 Member Questionnaire
Navy Personnel Research and Development CenterSan Diego, California 92152-7250
A-1

This survey concerns how you feel about your life. The questionsask about various aspects of life and life as a whole. There aremany aspects to our lives and the questionnaire attempts to coverthe major ones for most people. This accounts for its length. Wethink you will find most of the questions interesting and easybecause it's YOUR life. All people don't feel the same way aboutwhat happens to them in everyday life, so there are no right orwrong answers. We hope you will answer each question ascarefully and frankly as possible. You were randomly selected bycomputer to take part in this survey. Your responses will help usobtain a representative picture of life as it is experienced by MarineCorps members.
"* USE NO. 2 PENCIL ONLY EXAMPLE•"* Do not use ink, ballpoint, or felt tip pens."* Erase cleanly and completely any changes you make. 2. What is your favorite color?"* Make black marks that fill the circle."* Do not make stray marks on the form. O Re"* Write the numbers in the boxes at the top of the block. 0 Green"* Fill in the corresponding circles below. 0 Purple
J3=O2~N
rplO. Ly
CORRECT MARK: 0INCORRECT MARK: 0 0' ® G
For questions that look like the following example, print PRIVACY ACT STATEMENTthe required information in the row of boxes provided.Put a 0 in the first column if your answer is nine or less. Public Law 93-579, called the Privacy Act of 1974, requiresThen blacken the corresponding circle under the that you be informed of the purposes and uses to be made ofnumber you printed, the information collected. The Navy Personnel Research
and Development Center may collect the information
EXAMPLE requested in The Marine Corps and Quality of Life 1993Survey under the authority of 5 United States Code 301.
1. How long have you been on active duty?
The information collected with this questionnaire will beY ears used to evaluate existing and proposed policies, procedures,
0 5 and programs in the Marine Corps.
(0:Providing information in this form is completely voluntary.2The information you choose to provide will not become partof your permanent record and will not affect your career inany way. Failure to respond to any questions will not resultin any penalties except possible lack of representation in
66survey results.
@r(r
2 rjr
A- 2
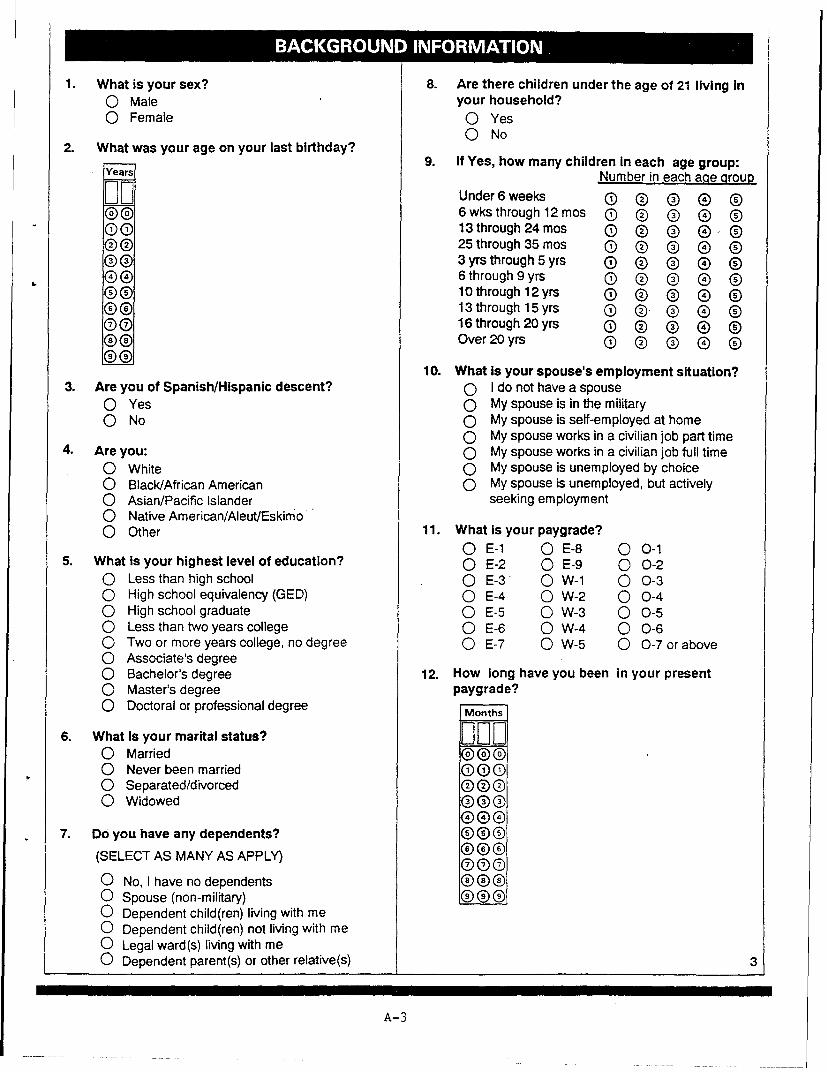
BAKRON INFRATIN
I.What is your sex? 8. Are there children under the age of 21 living Ino Male your household?o Female 0 Yes
O No2. What was your age on your last birthday?. W9. If Yes, how many children in each age group:Years Number in each age qroup
Under 6 weeks 0 0 0 0 ®@ @ 66wksthrough12mos 0 @ (a) (D)"00 13 through 24 mos 0 0 - Q@(D 25 through 35mos 0 0 0 0 ®G•) @ 3yrsthrough5yrs 0D Q) 0 0
1 G(•) 0 6through9yrs 00 0 0 0@( @ 10 through12 yrs 0 0 0 (D
@0@ 13 through15 yrs 0 0 Q 0 @0o 16 through 20 yrs 0 0 0 0 ®
Over20yrs 0 0 0 0
10. What is your spouse's employment situation?3. Are you of Spanish/Hispanic descent? Q I do not have a spouse
o Yes Q My spouse is in the militaryO No 0 My spouse is self-employed at home
o My spouse works in a civilian job part time4. Are you: Q My spouse works in a civilian job full time
o White Q My spouse is unemployed by choice"o Black/African American O My spouse is unemployed, but actively"o Asian/Pacific Islander seeking employmento Native American/Aleut/Eskimoo Other 11. What is your paygrade?
Q E-1 0 E-8 0 0-15. What Is your highest level of education? 0 E-2 0 E-9 0 0-2
0 Less than high school 0 E-3 0 W-1 0 0-30 High school equivalency (GED) 0 E-4 0 W-2 0 0-40 High school graduate 0 E-5 0 W-3 0 0-50 Less than two years college 0 E-6 0 W-4 0 0-60 Two or more years college, no degree 0 E-7 0 W-5 0 0-7 or above0 Associate's degree0 Bachelor's degree 12. How long have you been in your present0 Master's degree paygrade?0 Doctoral or professional degree Months
6. What Is your marital status?0 Married0 Never been married 000)0 Separated/divorced 0000 Widowed ) 0 (
0007. Do you have any dependents? @(DO
(SELECT AS MANY AS APPLY) Go®0 No, I have no dependents D 0 0@0 Spouse (non-military) 0000 Dependent child(ren) living with me0 Dependent child(ren) not living with me0 Legal ward(s) living with me0 Dependent parent(s) or other relative(s) 3
A-3

13. How long have you been on active duty In the 18. If you are a "geographic bachelor by choice" IsMarine Corps? this because of:
Years 0---; 0 Does not applyO Spouse's jobO Children's schools
@( @0 Cost of living at this location1 11 G) 0 Moving costs for family
20 (2 2 0 Personal preference of self or spouse
0 ( (D) 0 Some other reason
5 5 5 5 •19. Where are you permanently stationed?6( 66 0 Albany
@ 7 (D 0 Barstow�® 0 Beaufort
0 Camp ButlerO Camp Elmore
14. Which of the following statements BEST Q Camp Lejeunedescribes your career intentions at this time? 0 Camp Pendleton
O I intend to remain on active duty in the 0 Cherry Point
Marine Corps until eligible for retirement 0 El ToroO I am eligible for retirement, but intend 0 Iwakuni
to stay in 0 Kaneohe Bay/Camp SmithO I intend to stay in, but not until retirement 0 New RiverO I'm not sure what I intend to do 0 PanamaO I intend to leave the Marine Corps as 0 Parris Island
soon as I can 0 QuanticoO I intended to remain on active duty, but I 0 San Diego
am being released due to reduction Q Twentynine Palmsin force 0 Tustin
O Washington DC-Headquarters Marine Corps
15. What are your primary 16. How long have 0 Washington DC-Henderson Halland duty MOS? you been In your 0 Washington DC-Pentagon
present 0 Washington DC-8th & Iassignment? 0 Yuma
Primary Duty Q Ship's Company/Aboard Ship0 MSG,CONUSDD0 o MSG,OCONUS
Q@@@ ® ®@@@@ 0 Other, CONUS00(D)( 0) 0(1)(1 0 Other, OCONUS
2@00 2()0
Q®O® @000 @4(® 0® 0 4 ® ®(4) 20. Are you presently deployed?
00)@@ (D @ 0 Yes6000 6006@ (D @ 0 No
a ® ®• @ ( @ @@ 8 a) 21. IfYes, are you deployed:
@ @ ) (D (D (D Q Q 0 Aboard ship0 At a U.S. Embassy
17. Are you accompanied by your dependents on 0 At schoolyour present assignment?
O Does not apply--no dependentsO Accompanied by some dependents0 Accompanied by all dependents0 Temporarily unaccompanied0 Permanently unaccompanied by choice0 Permanently unaccompanied because
required by billet
A-4
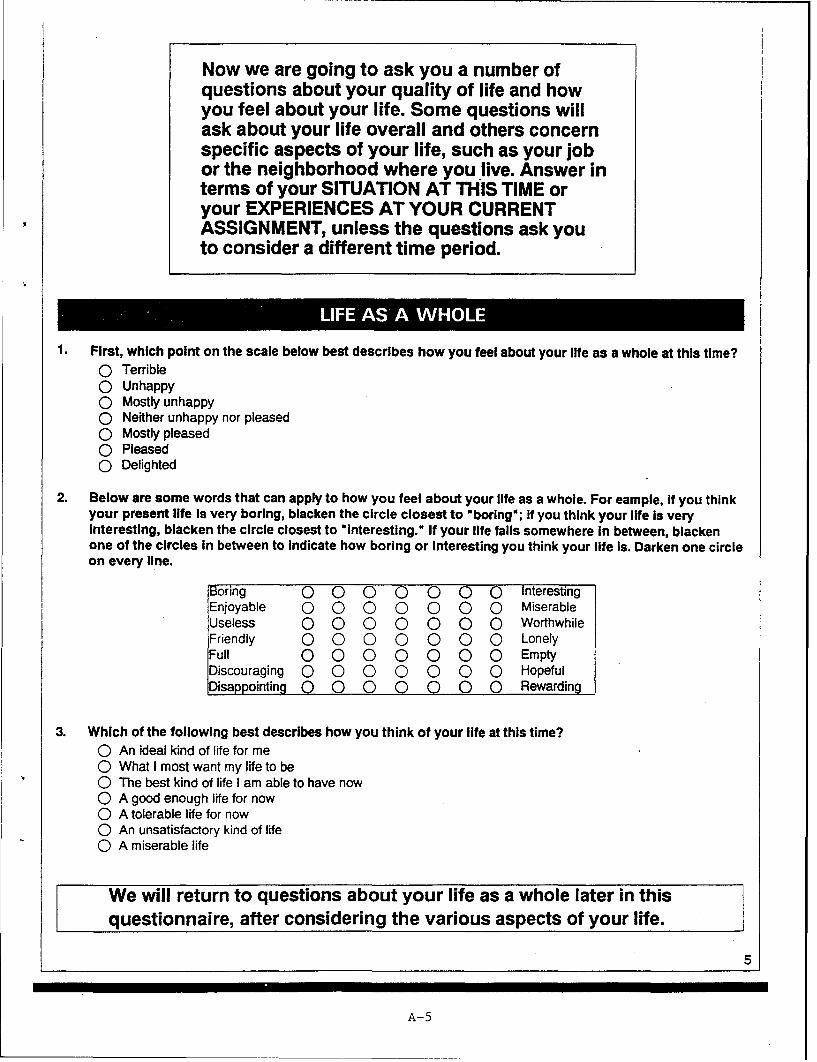
Now we are going to ask you a number ofquestions about your quality of life and howyou feel about your life. Some questions willask about your life overall and others concernspecific aspects of your life, such as your jobor the neighborhood where you live. Answer interms of your SITUATION AT THIS TIME oryour EXPERIENCES AT YOUR CURRENTASSIGNMENT, unless the questions ask youto consider a different time period.
LIEAS AWH L
1. First, which point on the scale below best describes how you feel about your life as a whole at this time?o TerribleO Unhappyo Mostly unhappyO Neither unhappy nor pleasedO Mostly pleasedO Pleasedo Delighted
2. Below are some words that can apply to how you feel about your life as a whole. For eample, If you thinkyour present life Is very boring, blacken the circle closest to "boring"; if you think your life Is veryinteresting, blacken the circle closest to "interesting." If your life falls somewhere In between, blackenone of the circles in between to indicate how boring or interesting you think your life is. Darken one circleon every line.
Boring o o o o o o InterestingEnjoyable 0 0 0 0 0 0 0 MiserableUseless 0 0 0 0 0 0 0 WorthwhileFriendly 0 0 0 0 O Q 0 LonelyFull 0 0 0 0 0 0 0 EmptyDiscouraging 0 0 0 0 0 0 0 HopefulDisappointing 0 0 0 0 0 0 0 Rewarding
3. Which of the following best describes how you think of your life at this time?0 An ideal kind of life for me0 What I most want my life to be0 The best kind of life I am able to have now0 A good enough life for now0 A tolerable life for now0 An unsatisfactory kind of life0 A miserable life
We will return to questions about your life as a whole later in thisquestionnaire, after considering the various aspects of your life.
5
A-5
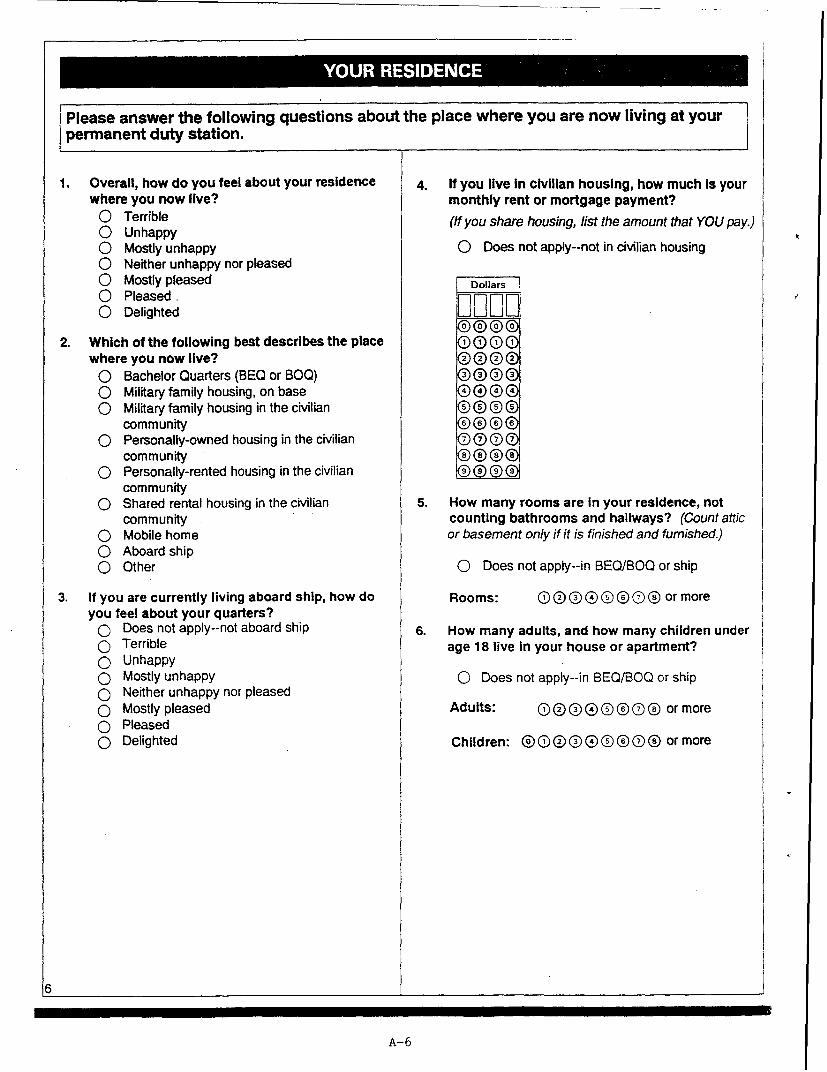
Please answer the following questions about the place where you are now living at yourpermanent duty station.
1. Overall, how do you feel about your residence 4. If you live In civilian housing, how much Is yourwhere you now live? monthly rent or mortgage payment?
O Terrible (If you share housing, list the amount that YOU pay.)O UnhappyO Mostly unhappy 0 Does not apply--not in civilian housingO Neither unhappy nor pleased0 Mostly pleased Dollars0 Pleased ]w0 Delighted
2. Which of the following best describes the place 1 000where you now live?
o Bachelor Quarters (BEQ or BOO) 3 ® ®0 Military family housing, on base @ @ (D0 Military family housing in the civilian (D( @G
community G D @ @0 Personally-owned housing in the civilian :0 (D (D 0
community I @ @0 Personally-rented housing in the civilian U 0 1
communityO Shared rental housing in the civilian 5. How many rooms are In your residence, not
community counting bathrooms and hallways? (Count atticO Mobile home or basement only if it is finished and furnished.)o Aboard shipO Other 0 Does not apply--in BEQ/BOQ or ship
3. If you are currently living aboard ship, how do Rooms: 00000@0• or moreyou feel about your quarters?
O Does not apply--not aboard ship 6. How many adults, and how many children underO Terrible age 18 live in your house or apartment?O UnhappyO Mostly unhappy 0 Does not apply--in BEQ/BOQ or shipO Neither unhappy nor pleased0 Mostly pleased Adults: 000000@0 or moreO Pleased0 Delighted Children: @QOOGOOQO ormore
A-6
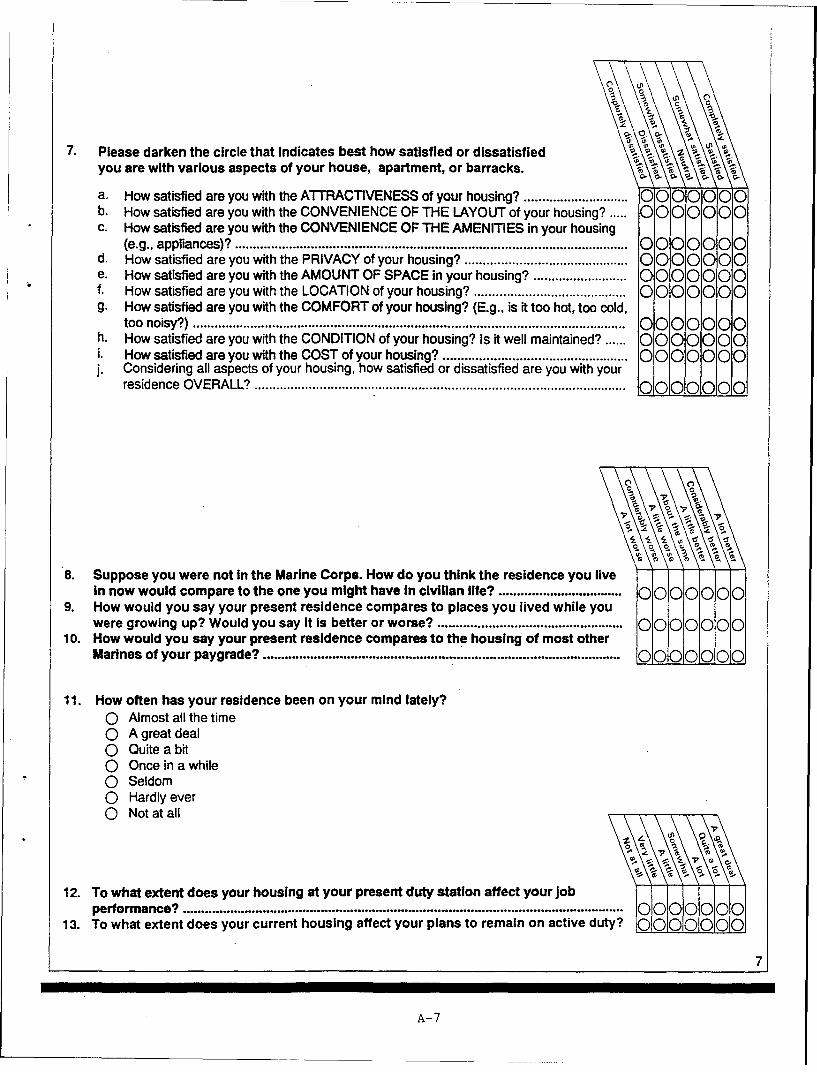
7. Please darken the circle that Indicates best how satisfied or dissatisfiedIl.10you are with various aspects of your house, apartment, or barracks.
a. How satisfied are you with the ATTRACTIVENESS of your housing? ............................. 0 0 0 0b. How satisfied are you with the CONVENIENCE OF THE LAYOUT of your housing? ..... 0 0 0 0c. How satisfied are you with the CONVENIENCE OF THE AMENITIES in your housing
(e.g., appliances)? ............................................................................................................ 0 0 0 0d. How satisfied are you with the PRIVACY of your housing? ............................................. 0 0 0 0e. How satisfied are you with the AMOUNT OF SPACE in your housing? .......................... 0 0 0 0f. How satisfied are you with the LOCATION of your housing? .......................................... 00 0g. How satisfied are you with the COMFORT of your housing? (E.g., is it too hot, too cold,
too noisy?) ....................................................................................................................... 00 0h. How satisfied are you with the CONDITION of your housing? Is it well maintained? ...... 0 0 0i. How satisfied are you with the COST of your housing? ................................................... 0 0 0 0j. Considering all aspects of your housing, how satisfied or dissatisfied are you with your
residence O V ERA LL? ...................................................................................................... 0 0 0 0
8. Suppose you were not In the Marine Corps. How do you think the residence you live •||
in now would compare to the one you might have in civilian life? .................................. OIO00OIOo0O9. How would you say your present residence compares to places you lived while you
were growing up? Would you say It Is better or worse? ................................................... 0 0 0I 0 0I 0 0IO10. How would you say your present residence compares to the housing of most other !
Marines of your paygrade? ................................................... ............................................... 0101o010o0o0o0
11. How often has your residence been on your mind lately?O Almost all the timeO A great dealO Quite a bit
O Once in a while0 Seldom0 Hardly everO Not at all
performance? .................................................................................................................... 0" 0 0l 0 0lO t 0~13. To what extent does your current housing abest your plans to remain on active uty. 0000000
7
A-7

Next, we would like you to consider the neighborhood where your present house,apartment, or barracks is located.
1 Overall, how do you feel about your 3. On an average, how many minutes does it takeneighborhood? you to get to work?0 Terrible Minutes
0 Unhappy0 Mostly unhappy0 Neither unhappy nor pleased o ® ®0 Mostly pleased '000 Pleased. Q@()0 Delighted @®0
2. How long have you lived in this neighborhood? ® ® 5
Months 6®(
~00
@00
S5®®00G®®
g@@@@ @ (
4. Please darken the circle that shows best how Satisfied or dissatisfied you are \with various aspects of your neighborhood. T
a. How satisfied are you with the SAFETY of your neighborhood? ...................................... 0 0 0b. How satisfied are you with the PUBLIC SERVICES in your neighborhood such as trash
collection, mail delivery, police protection, etc.? ............................................................... 0 0 0c. How satisfied are you with the APPEARANCE of your neighborhood? .......................... 0 0 0 0d. How satisfied are you with the CONDITION OF OTHER DWELLINGS in the
neighborhood? .................................................................................................................. 00 0e. How satisfied are you with the FRIENDLINESS OF PEOPLE living in your
neighborhood? ................................................................................................................... 0 0 0 0f. How satisfied are you with the TRANSPORTATION SERVICES in your neighborhood?0 0 0 0g. How satisfied are you with the RACIAL MIX of people in your neighborhood? ................. 0 0 0 0h. How satisfied are you with the SENSE OF COMMUNITY in your neighborhood? ............ 0 0 0 0i. How satisfied are you with the AVAILABILITY OF RETAIL SERVICES in your
nieghborhood? (E.g., groceries, dry-cleaning, etc.) ........................................................... 0 0 0 0j. How satisfied are you with the LENGTH OF TIME it takes you to get to work? ................ 00 0 0k. How satisfied are you with the AVAILABILITY OF PARKING in your neighborhood? ...... 00 0 01. Considering all the different aspects of your neighborhood, how satisfied are you with
this neighborhood OVERALL? .......................................................................................... 0 0 0 0
A-8
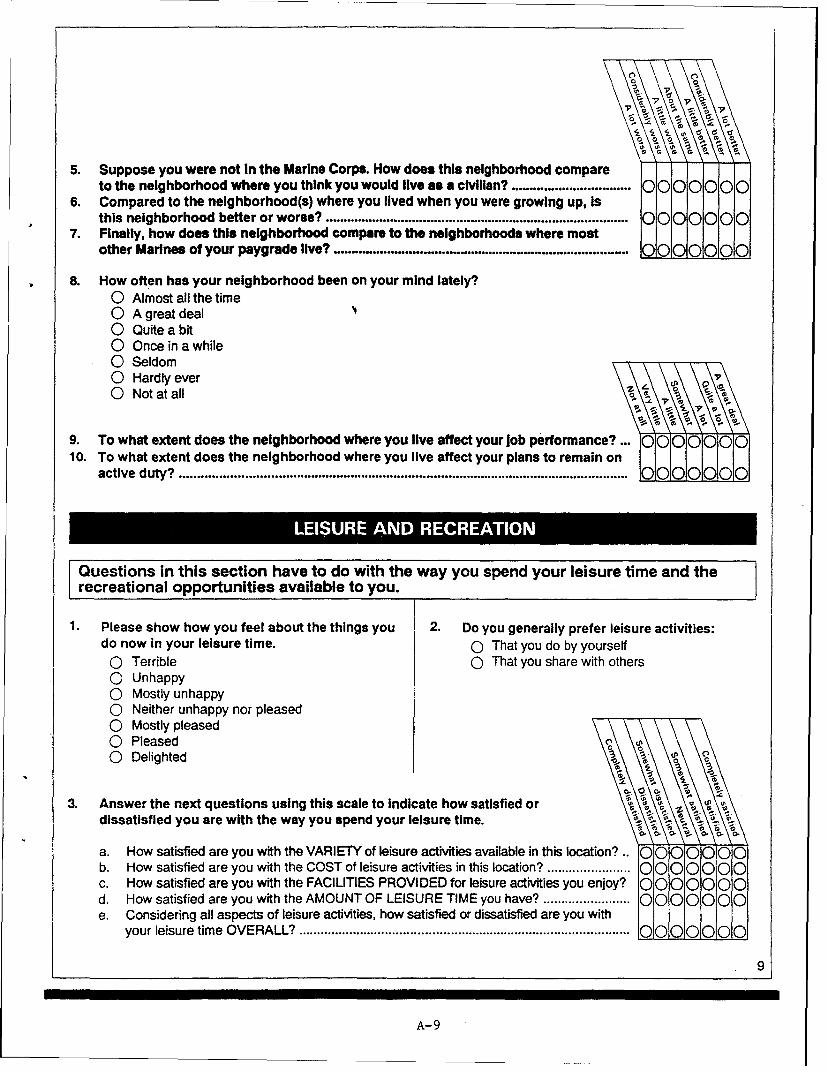
0 0 C
5. Suppose you were not In the Marine Corps. How does this neighborhood compare \• 1 \\ \\"\
to the neighborhood where you think you would live as a civilian? ................................. 0'000000O6. Compared to the neighborhood(s) where you lived when you were growing up, Is
this neighborhood better or worse? .................................................................................... 0 0 0 0 0 0 07. Finally, how does this neighborhood compare to the neighborhoods where most
other Marines of your paygrade live? .................................................................................. 0[010 0 0 0
8. How often has your neighborhood been on your mind lately?0 Almost all the time0 A great deal0 Quite a bit0 Once in a while0 Seldom
0Hardly ever 7 \o\
0 Not at all•--- •- :.,\•.
10. To what extent does the neighborhood where you live affect your plans to remain onactive duty? ............................................................................................................................ O IO0 !O IO O IO
Questions in this section have to do with the way you spend your leisure time and therecreational opportunities available to you.
1.Please show how you feel about the things you 2. Do you generally prefer leisure activities:do now in your leisure time. O That you do by yourself
0 Terrible 0 That you share with others0 Unhappy0 Mostly unhappy0 Neither unhappy nor pleased0 Mostly pleased0 Pleased0 Delighted
3. Answer the next questions using this scale to Indicate how satisfied or
%
dissatisfied you are with the way you spend your leisure time.
a. How satisfied are you with the VARIETY of leisure activities available in this location? "" )-00000
b. How satisfied are you with the COST of leisure activities in this location? ....................... 0 0 0c. How satisfied are you with the FACILITIES PROVIDED for leisure activities you enjoy? 0 0 0d. How satisfied are you with the AMOUNT OF LEISURE TIME you have? ........................ 0 0 0e. Considering all aspects of leisure activities, how satisfied or dissatisfied are you with
your leisure tim e OVERALL? ............................................................................................ 0 1 1 1 1 1
9
A-9

4. Here is a list of some activities that people might do In their spare time. Please show how often you havebeen doing these things. If you haven't recently participated in an activity, please show the ONE mainreason why-because the activity is not available locally; the local facilities are inadequate; it is tooexpensive for your budget; It Is of low priority with you, and you don't have enough time for it now; orsimply because you are not interested in that activity,
~00
o0 0 Participating in active sports 0000000 000 Working out,.running 000000000 0 Swimming 000000000 0 Watching sports events 000000000 0 Golfing 00000000 0 Tennis and racquet sports 0000000 0 0 Sailing 00000000:00 Outdoor activities (e.g., camping, hiking) 00000000i 0 Fishing, boating 0000000000 Dining out 0000000 000 Picnics, pleasure drives 00000000o00 Going to the movies 00000000000 Going to clubs, bars, etc. 00000000000 Spending time with friends, relatives, neighbors 0000000000 Going to club meetings, activities 00000
000 0 00 Participating in church activities 000000000l 0 Playing cards, indoor games 00000
00000 Going to classes or lectures 0000000000 Going to concerts, plays, etc. 000000000 0 Going to museums, exhibits, etc. 0100000000! 0 Gardening and working around the yard 010000000 Making and fixing things around the house 0100000000t 0 Working on hobbies, painting, musical instrument 010000000000 Volunteering 01000000o 0000 Shopping (except for groceries) 000000000l 0 Reading 01000000 0000 Watching IV, playing video games 00000000000 Listening to music
o0
too c,,-
5. Do you think that your leisure time would be more enjoyable or less enjoyable if youwere a civilian instead of a Marine? ...................................................................................... 0 0 0 :
6. Compared to other places where you have been stationed since joining the MarineCorps, do you find your leisure time at this station more enjoyable or less enjoyable? )bOIOOOIO!O
100
A-10

7. How often have leisure and leisure activities been on your mind lately?0 Almost all the time0 A great deal0 Quite a bit0 Once in a while0 Seldom0 Hardly ever ( .0 Not at all
o .0o
8. To what extent do leisure activities affect your job performance? ................................ 00008 01009. To what extent do leisure activities affect your plans to remain on active duty? ............ 0000000)
The items in the floigsection are all related to yorhealth and to health benefits.
1. Please Indicate how you feel about the state of 4. How many duty days did you miss because ofyour health. illness or injury in the past year?
0 Terrible Days
0 Unhappy0 Mostly unhappy0 Neither unhappy nor pleased o ® ®0 Mostly pleased 000) (D)0 Pleased (D Q (20 Delighted O()(
2. What was your most recent PFT score? 5 0 0
0 First class @ (D @0 Second class 00@0 Third class ) (D0 Failed0 Not required to take
5. Are you a smoker?
3. How long would it take you to get to a military 0 Yesmedical facility from your residence? 0 No
0 About 5 minutes0 6 to 20 minutes0 21 to 40 minutes0 41 minutes to an hour0 More than 1 hour
S- S .
6. Please use this scale to indicate how satisfied or dissatisfied you arewith various aspects of your state of health.
a. How satisfied are you with your current WEIGHT? ........................................................ 000000b. How satisfied are you with your LEVEL OF ENERGY? ................................................ 0000000c. How satisfied are you with HOW WELL YOU SLEEP? ................................................ 0000000d. How satisfied are you with your ENDURANCE? 0000000..............e. How satisfied are you with YOUR HEALTH OVERALL? .............................................. 0000000f. How satisfied are you with the MEDICAL CARE you receive? ................... . . .. . .. . .. . .. . .. . . . 0000000g. How satisfied are you with the DENTAL CARE you receive? ....................................... 0000000
11
A-Il

7. If you were not In the Marine Corps, do you think 9. How often has your health been on your mindyour state of health would be better or worse? lately?
O A lot worse 0 Almost all the timeO Considerably worse 0 A great dealO A little worse 0 Quite a bitO About the same 0 Once in a whileO A little better 0 SeldomO Considerably better 0 Hardly everO A lot better 0 Not at all
8. Compared to most Marines, would you say youare healthier or not as healthy?O Not nearly as healthyO Considerably less healthyO A little less healthyO About the sameo A little healthier
0 Considerably healthier0 AI lot healthiear \•\\ • •
10. To what extent does your state of health affect your job performance? ...................... 000000011. To what extent does your state of health affect your plans to remain on active duty?.. 0000 00
Answer the next questions ONLY If you have dependents. If you do not have dependents,go to the next section headed "Friends and Friendships.'
12. Which type of medical Insurance/medical care 14. Which, if any, of your dependents has specialdo your dependents use most often? medical needs (e.g., disabilities and/or medical
0 Military medical facilities conditions requiring specialized care)?0 CHAMPUS 0 None of my dependents has special0 CHAMPUS Prime medical needs0 Group HMO 0 My spouse0 Group fee-for-service policy 0 Dependent child(ren) living with me0 Private HMO 0 Dependent child(ren) not living with me0 Private fee-for-service policy 0 Legal ward(s) living with me0 Other 0 Dependent parent(s) or other relative(s)
13. Do you have CHAMPUS supplementalinsurance coverage?0 YesOo0 No
Il
15. How satisfied are you with the MEDICAL CARE received by your dependents? ............ 00000016. How satisfied are you with the DENTAL CARE received by your dependents? ....... 0000000
7
17. To what extent does your dependents' state of health affect your job performance? ... 0000000
18. To what extent does your dependents' state of health affect your plans to remain onactive duty? ........................................................................................................................... 0 0 0 0
12
A-12

The questions In this section concern your friendships and how those friendships affectyour quality of life. Think about the friends you have and your relationships with them.
1. In general, how are you feeling about your 4. If Yes, which statement BEST describes thosefriendships these days? friends?O Terrible 0 Not applicable -- none hereO Unhappy 0 Marines I see only at workO Mostly unhappy 0 Marines I socialize with once in a whileO Neither unhappy nor pleased 0 Marines I socialize with regularlyO Mostly pleased 0 Members of other military serviceso Pleased 0 CiviliansO Delighted 0 Other
2. Are your close friends MOSTLY: 5. Where do you spend the MOST time with yourO Fellow Marines at this location local friends?O Marines who are stationed at other locations 0 Your residence or theirsO Civilians in this area 0 Clubs, on baseo Civilians "back home* 0 Sports facilitiesO Members of other military services 0 Recreational facilities off the baseo Other 0 Restaurants/dining out
0 Other3. Do you have friends at this location with whom
you feel free to discuss personal matters?Q Yes0 No
~s0%
6. Please use this scale to show how satisfied or dissatisfied you are with yourfriendships at this time.
a. How satisfied are you with the AMOUNT OF TIME YOU SOCIALIZE with your friends? 0000000b. How satisfied are you with the NUMBER OF MARINE CORPS FRIENDS you have? .... 0000000c. How satisfied are you with the NUMBER OF CIVIUAN FRIENDS you have? ............ 0000000d. How satisfied are you with the SUPPORT AND ENCOURAGEMENT you receive from
your friends? ........................... 0.............................................................o......................0.....0e. How satisfied are you OVERALL with your friendships at this time? ............................ 0000000
7. Compared to civilian life, do you think It has 8. Do you think you have fewer, more, or about thebeen harder or easier for you to make friends? same number of good friends as most Marines?
0 A lot harder 0 A lot fewer0 Considerably harder 0 Considerably fewer0 A little harder 0 Somewhat fewer0 About the same 0 About the same0 A little easier 0 A little more0 Considerably easier 0 Considerably more0 A lot easier 0 A lot more
13
A- 13
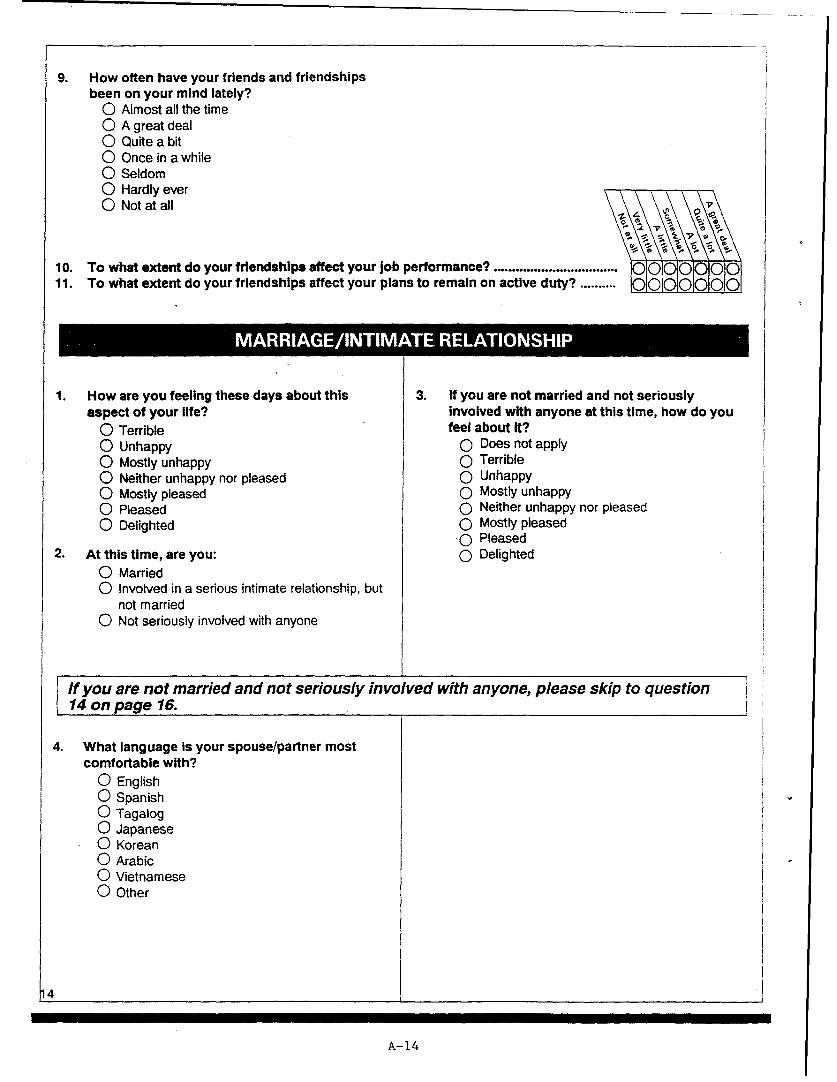
9. How often have your friends and friendshipsbeen on your mind lately?
O Almost all the time0 A great deal0 Quite a bit0 Once in a while0 Seldom0 Hardly ever0 Not at all7
10. To what extent do your friendships affect your job performance? ............................... • 000 )00011. To what extent do your friendships affect your plans to remain on active duty? .......... 0000 100
1. How are you feeling these days about this 3. If you are not married and not seriouslyaspect of your life? involved with anyone at this time, how do you
0 Terrible feel about it?0 Unhappy 0 Does not apply0 Mostly unhappy 0 Terrible
0 Neither unhappy nor pleased 0 Unhappy0 Mostly pleased 0 Mostly unhappy0 Pleased 0 Neither unhappy nor pleased0 Delighted 0 Mostly pleased
0 Pleased2. At this time, are you: 0 Delighted
0 Married0 Involved in a serious intimate relationship, but
not married0 Not seriously involved with anyone
If you are not married and not seriously involved with anyone, please skip to question14 on page 16..,
4. What language is your spouse/partner mostcomfortable with?
0 English0 Spanish0 Tagalog0 Japanese0 Korean0 Arabic0 Vietnamese0 Other
h4
A-14

Answer questions 5- 7 ONLY if you are Answer questions 8- 11 ONLY if you AREmarriedbuinvolved in a serious intimate relationship,
but NOT married.5. How long have you been married?
0 Less than 6 months 8. How long have you been Involved in this0 6 to 12 months relationship?0 13 to 23 months 0 Less than a month0 2or3years 0 ito 3 months0 4 or 5 years 0 4 to 6 months0 6 to 10 years 0 7 to 12 months0 11 to 20 years 0 13 to 23 months0 More than 20 years 0 2 to 5 years
0 More than 5 years6. Have either you or your spouse been married
before? 9. Is your Intimate partner:O 1 have been married before but my spouse 0 Also a Marine
has not 0 A member of another military serviceO My spouse has been married before but I 0 A civilian
have notO Both my spouse and I have been married 10. Does your Intimate partner live:
before 0 "Back home"O Neither my spouse nor I have been married 0 At or near your station
before 0 Other
7. If you are not accompanied at this station, how 11. If your Intimate partner does not live In the area,frequently do you see your spouse? how frequently are you able to see each other?O Not applicable 0 Not applicableO Several times a week 0 Every dayO Once a week 0 Several times a weekO Once a month 0 Once a week0 9 to 11 times a year 0 Once a month0 7 or 8 times a year 0 9 to 11 times a year0 5 or 6 times a year 0 7 or 8 times a year0 3 or 4 times a year 0 5 or 6 times a year0 1 or 2 times a year 0 3 or 4 times a year
0 1 or 2 times a year
12. If you are married or have an intimate relationship, please use this scale s-\• 0. \ ?rto show how satisfied or dissatisfied you are with various aspects of this • "•relationship. din
a. How satisfied are you with the LOVE AND UNDERSTANDING you receive in therelationship? ..................................................................................................................... 00 0
b. How satisfied are you with the COMMUNICATION within the relationship? .................... 0 0 0c. How satisfied are you with the way CONFLICTS ARE RESOLVED with your partner? .. 0 0 0d. How satisfied are you with your partner's SUPPORT FOR YOUR MILITARY CAREER? 0 0 0e. How satisfied are you with the COMPATABILITY OF INTERESTS between you and
your partner? .................................................................................................................... 00 0f. How satisfied are you with the SEXUAL ASPECT of your relationship? ......................... 0 0 0 0g. How satisfied are you with your intimate relationship OVERALL? ................................... 0 0 0 0
15
A-15

13. If your military duties took you away for 6 months or more, how capable do youthink your spouse or partner would be to take full responsibility for the following? '
a. Child care .............................................................................................................. 0 0....... 00 0 0 0b. Family mem bers' health ......................................................................................... ....... 0 0 0 0 0 0c. Family finances ................................................................................................................. 0 0 0 0 0 0d. Managing the maintenance of your residence .................................................................. 000000e. Emotional or parenting matters ........................................................................................ 0 0 0 0 0 0f. Safety of fam ily members ................................................................................................. 0 0 0 0 0 0g. Transportation .................................................................................................................. 0 0 0 0 0h. Investm ents ...................................................................................................................... 0 0 0 0 0 0
14. How satisfying do you think this aspect of your life would be if you were not In theMarine Corps? Do you think it would be better, worse, or just about the same? ........... 0 00 0
15. How would you compare this aspect of your life with that of most Marines?. ................. 0 0 0
16. How often has this aspect of your life been on your mind lately?0 Almost all the time0 A great deal0 Quite a bit0 Once in a while0 Seldom\0 .0
0~~ Hadl eve 7
0 Not at all \,' \',\ ',
17. To what extent does this aspect of your life affect your job performance? ......n..t . .... 0 t0000
18. To what extent does this aspect of your life affect your plans to remain on active
duty? ................................................................................ ;....................................................... 100 10 0 0
The next group of questions have to do with your relations with your children. If you donot have children under age 18, skip to the following section on Relations with OtherRelatives (page 19.)
1. If you have children from a previous marriage, which of the following best describes the legal custodystatus of those child(ren)?
0 Does not apply0 Full custody of your child(oen)
0 Full custody of some of your children0 Shared custody0 No custody
16
A-16

2. How are you feeling these days about your relations with your children who livewith you in your household, if any? .............................. 00000000
3. How are you feeling these days about your relations with your children who do notlive with you, If any? ..................................................... .. .. ..... . . .. . . . .. . . . .. . .. . . . .. . . .. . . .. . . . . .. . .. 0 0 00 0 0
4. Who is usually the primary care provider for 6. If you have school-age children who live withyour youngest child while you are on duty? you, do they attend:
0 No care provider required (MARK ALL THAT APPLY)0 Private licensed facility0 Civilian-operated family home care 0 No school-age children0 At-home employee (nanny, au pair, etc.) 0 Public school in the community0 Relative or older siblings 0 DoD school for dependents0 Friend 0 A church school0 Your spouse 0 A private day school0 Military Child Development Center 0 A private boarding school0 Base-operated family home care program 0 Other0 Other
5. What is your ONE most critical child carerequirement?
0 No requirement0 Occasional babysitting0 All day care for pre-school child0 Before and/or after schoolO Overnight care0 Extended care for several dayso Access to care at any timeO Sick child care0 Other 0
7. Now we would like you to tell us how satisfied or dissatisfied you are withdo S11P 0P
various aspects of your relations with your children.... ...
a. How satisfied are you with the AMOUNT OF TIME you have with your children? ......... 0 0 0 0b. How satisfied are you with the QUALITY OF THE TIME you spend with your children? 0 0 0c. How satisfied are you with the MILITARY ENVIRONMENT for raising children? .......... 0 0 0 0d. How satisfied are you with the ACTIVITIES AVAILABLE for children at your base
location? ......................................................................................................................... 0 0 0 0e. How satisfied are you with your OVERALL relationship with your children? .................. 0f. If you have school-age children, how satisfied are you with the EDUCATION your
children are receiving? ................................................................................................... 1 1
17,
A- 17
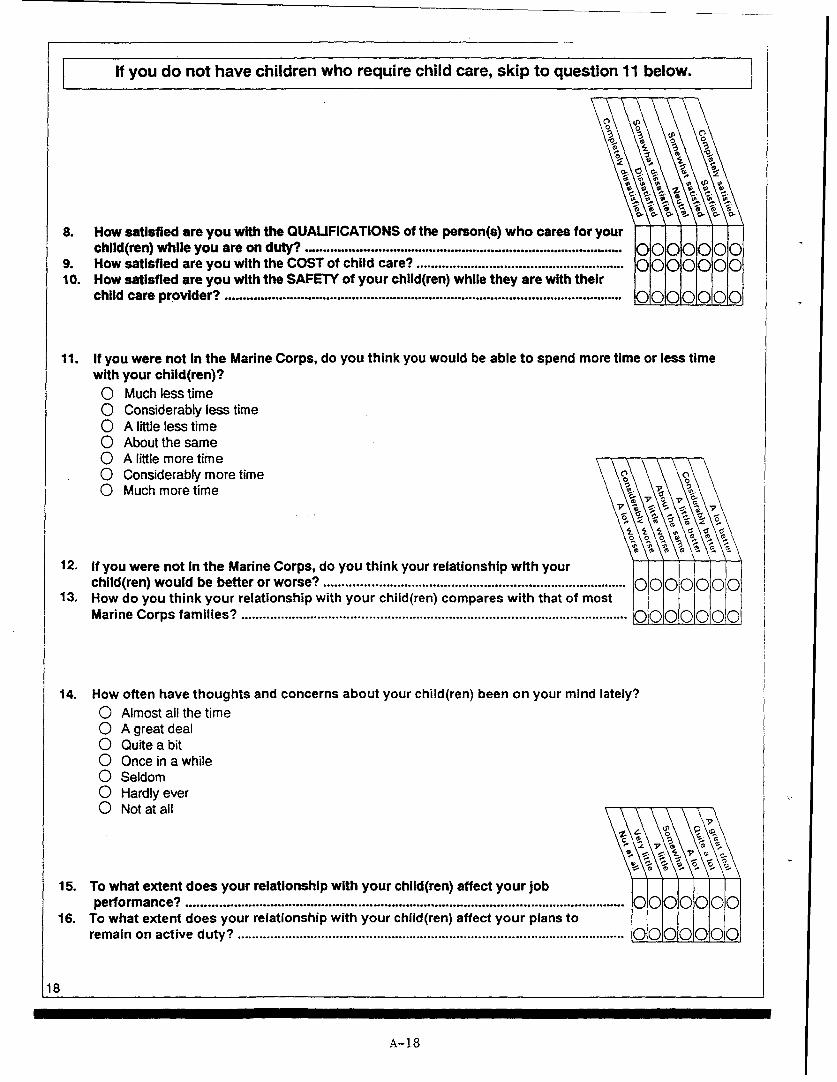
If you do not have children who require child care, skip to question 11 below.
o P o 1
8. How satisfied are you with the QUALIFICATIONS of the• person(s) who cares for yourchild(ren) while you are on duty". ....................................................................................... 0 0 0 0
9. How satisfied are you with the COST of child care? ......................................................... 0 0 0 010. How satisfied are you with the SAFETY of your child(ren) while they are with their
child care provider? ............................................................................................................. 0 0 0 0
11. If you were not In the Marine Corps, do you think you would be able to spend more time or less timewith your child(ren)?
0 Much less time0 Considerably less time0 A little less time0 About the same0 A little more time
SConsiderably more time
0 Much more time
to 01
12. If you were not In the Marine Corps, do you think your relationship with yourchild(ren) would be better or worse? ................................................................................ 000000
13. How do you think your relationship with your child(ren) compares with that of mostMarine Corps fam ilies? .......................................................................................................... 0 0 0 0 0 0 0
14. How often have thoughts and concerns about your child(ren) been on your mind lately?0 Almost all the time
0 A great deal0 Quite a bit0 Once in a while0 Seldom
0 Hardly ever0 Not at all
15. To what extent does your relationship with your child(ren)affect your job
foore wnco e? ........................................................................................................................ 0 0 0 0 0 0 016. To what extent does your relationship with your child(ren) affect your plans to
remain on active duty? .......................................................................................................... 0 0 0 0 0 0 0
18
A-18

17. If you had to be separated from your child(ren) 18. How sure are you that the person named Infor 6 months or more because of your military question 17 would adequately take care of yourduties, who would care for them? child(ren) In your absence?
O No child(ren) under 18 0 Completely sureO Spouse 0 Very sureO Immediate family member (for example, 0 Somewhat sure
grandparents) 0 Somewhat unsureO Other family member 0 Very unsureO Friend or neighbor 0 Completely unsure0 Public agency0 Other
Questions in this section ask about your relations with other relatives, such as yourparents, grandparents, brothers and sisters, and/or your in-laws if you are married.
1. How do you feel about your relations with your 3. Is the amount of time you spend with therelatives at this time? relatives listed below less than you would like,
O Terrible more than you would like, or about the rightO Unhappy amount of time? (IF YOU DO NOT HAVEO Mostly unhappy RELATIVES IN ONE OF THESE CATEGORIES,O Neither unhappy nor pleased PLEASE BLACKEN THE N/A CIRCLE.)O Mostly pleasedo Pleasedo Delighted
2. How far are your nearest relatives from your % %present duty station?
O N/A--no relatives0 Local area a. Parent(s) .................. 00000 Within 100 miles b. Grandparent(s) ........................... 0 0000 Between 101 and 200 miles c. Brothers-and sisters .................. 0000 I0 Between 201 and 500 miles d. In-laws ....................................... 0 0 0 00 Between 501 and 1,000 miles e. Other close relatives .................. 0000O0 More than 1,000 miles
4. While you were growing up, did you live with aparent who was a career military member?
O No0 Yes, parent was in the Marine Corps0 Yes, parent was in another service branch
5. Show how satisfied or dissatisfied you are with various aspects of your d.• ¢\ •\.
c • ,j ••&
relationships with your relatives. •••• :.Hwstsidaeyuwt h a orrltvsGTAOGWT AHOHR .l iiii
a. How satisfied are you with the AMOUNT OF CONTACT you have with your relatives?.. 0(000000O(•)
c. How satisfied are you with their SUPPORT FOR YOUR MILITARY CAREER? ............... 0 0 0d. How satisfied are you with your relatives' RESPECT FOR YOUR INDEPENDENCE? .... 00 0 0e. How satisfied are you with relations with your relatives OVERALL? ................................ 00 0 0
19
A-19

6. If you were not in the Marine Corps, do you 7. How often have relations with your relatives
think your relations with your relatives would been on your mind lately?
be better or worse? 0 Almost all the time
O A lot worse 0 A great deal
O Considerably worse 0 Quite a bit
o A little worse 0 Once in a while
o About the same 0 Seldom
o A little better 0 Hardly ever
0 Considerably better 0 Not at all
o A lot better
o0 , 1&
8. To what extent do relations with your relatives affect your job performance? ....... 0000000
9. To what extent do relations with your relatives affect your plans to remain on active
duty? .......................................................................................................................................
1. Overall, how do you feel about your current 4. Do you have a second job?
standard of living? 0 No, and I have not looked for one
0 Terrible 0 No, but I'm trying to find one
0 Unhappy 0 Yes, working less than 10 hours per week
0 Mostly unhappy 0 Yes, working between 10 and 20 hours per
0 Neither unhappy nor pleased week
0 Mostly pleased 0 Yes, working between 21 and 30 hours per
0 Pleased week
0 Delighted 0 Yes, working more than 30 hours per week
2. Have any of the following things occurred since 5. If you answered Yes, what's the main reason
you have been at your present location? you have a second job?0 N/A--no second job
(MARK ALL THAT APPLY) 0 I/we seed job0 I/we need the money
0 Indebtedness letter to your command 0 To get experience
0 Repossession of something purchased on 0 I enjoy the work
time 0 Other
0 Bankruptcy0 Crisis loan from military relief organization 6. How much of your family's total income comes
0 Trouble over child support payments from your spouse?
0 None of the above 0 N/A--no spouse0 None
3. Which of the following best describes your own 0 Less than 20%
or your family's financial situation at this time? 0 20% to 40%
0 I/we can afford most of the things I/we want 0 41% to 60%
0 I/we can easily afford the things Itwe need, 0 61% to 80%
plus some extras 0 More than 80%
0 I/we can easily afford the things I/we need,
but not extras0 I/we can barely afford the things I/we need
0 I/we often cannot afford things that I/we need
7. To what extent does the base exchange help you save money and make ends meet?.. 00000
8. To what extent does the commissary help you save money and make ends meet? ....... 0000
20
A-20

9. Where does your family shop for food? 10. Where does your family shop for clothing,0 Exclusively at the commissary personal Items, and household Items?o Mostly at the commissary 0 Exclusively at the exchangeo About 50-50 at the commissary and civilian 0 Mostly at the exchange
stores 0 About 50-50 at the exchange and cMliano Mostly at civilian stores storeso Exclusively at civilian stores 0 Mostly at civilian stores
0 Exclusively at civilian stores
0. 0 0
11. Please use this scale to indicate how satisfied or dissatisfied you are 0 0 0 'with various aspects of your current financial situation.
a. How satisfied are you with the money you have available for ESSENTIALS? ................ .0 00b. How satisfied are you with the money you have available for EXTRAS? ......................... 00000c. How satisfied are you with the money you have available for SAVINGS? ..................... 00 0 00d. If you own a car, how satisfied are you with the CAR you drive? .................. . . . .. . . . . .. . . . . . 0000 00e. If you have a house or apartment, how satisfied are you with your HOUSEHOLD
FURNISHINGS? ............................................................................................................... 0 0 0 0 0 0 0f. If you have children, how satisfied are you with WHAT YOU CAN PROVIDE FOR
YOUR CHILDREN .......................................................................................................... 0 0 0i0 0g. How satisfied or dissatisfied are you with your current financial situation OVERALL?....000 00
7o %
12. Do you feel that you are financially worse off or better off In the Marine Corps thanyou would be In civilian life? ................................................................................................ 0 0 0 0 0 0 0
13. Compared to most Marine Corps members of the same paygrade, do you think youare doing worse financially, or better? ........................................................................... 0 0 0 0 0 0 0
14. How often has your financial situation been on your mind lately?0 Almost all the time0 A great deal0 Quite a bit0 Once in a whileo Seldom0 Hardly ever0 Not at all
0 S
15. To what extent does your financial situation affect your Job performance? ................... 0000016. To what extent does your financial situation affect your plans to remain on active
duty? ....................................................................................................................................... 0 0 0 0 0 0 0
21
A-21

YOU JOB
1. Overall, how are you feeling these days about 5. In your opinion, how well are most otheryour job? members of your work group trained to do
O Terrible their jobs?o Unhappy 0 Not at allO Mostly unhappy 0 BarelyO Neither unhappy nor pleased 0 SomewhatO Mostly pleased 0 Pretty wello Pleased 0 CompletelyO Delighted
6. During the past year, did you entirely miss,2. How many hours do you usually work each arrive late, or have to leave early from a
week? no-notice alert, maneuver, or exercise?
Hou 0 Does not apply (no such events)o No, I was there when directed
E o Yes, I was late0 Yes, I left early
000 0 Yes, I missed it entirely
3 ) (@ 7. If you answered Yes on question 6, what wasD G( G, the main reason?DO (D 0 Not applicable S(•) (•10 I was sick
7,•.• 0 Someone in my family was sick)0 Personal or family business
@ 0 Legal matters
o I couldn't be reached3. How many days do you usually work each 0 Other
week?
Days: G•(•(D)(0 0
4. How well do you think your USMC trainingprepared you for your present job?
O Not at allO Barelyo SomewhatO Pretty wellO Completely
8. In the past month, how much time did you take off from duty for each ofthe following PERSONAL reasons? (INCLUDE TIME WHEN YOU ARRIVEDLATE OR LEFT EARLY, BUT NOT SCHEDULED LEAVE TIME.) •
a. Your education (if not part of your military duties) ...................................................... 0 00 0 0 0 0 0b. Your transportation (for example, car wouldn't start) ................................................... ol00 0 0 0 0tc. Pregnancy (for example, prenatal care or doctor visit) .............................................. 0 0000000d. Your health (sick, or doctor/dentist appointment) ....................................................... 0 0 0 0 000e. Personal business (for example, financial matters) ............................................... ..... 0 0 00000f. Other personal reasons .................................................................................................. 0 t0 O010 10101000
22
A-2 2

9. In the past month, how much time did you take off from duty for eachof the following FAMILY reasons? (INCLUDE TIME WHEN YOU ARRIVEDLATE OR LEFT EARLY, BUT NOT SCHEDULED LEAVE TIME.) 0 0 v
a. Caring for children (e.g., a sick child, school visits, no sitter, discipline) ................... 0 0 0 0 0 0 00b. Helping spouse (e.g., illness or emotional problems) ................................................... 0 0 0 0 0 0c. Family business (e.g., financial or housing matters) .................................................... 0 0 0 00d. Family transportation .................................................................................................... 0 0 00 0 0e. Other family matters ..................................................................................................... 0 0 0 0 0 0
10. If you had to deploy at short notice, have you made provisions for thefollowing?
(MARK THE N/A CIRCLE FOR THOSE THAT DO NOT APPLY TO YOU.)
a. Awwill ............................................................................................................................. 0 0 0b. A joint checking account ........................................................................................... 0c. A power of attorney ...................................................................................................... 00 0d. Storage of possessions ................................................................................................ 00 0e. Payment of bills ........................................................................................................... 00 0f. Elder care ..................................................................................................................... 0g. Care for pets ................................................................................................................ 00 0h. Lease obligations ....................................................................................................... 0 00i. Management of investments ........................................................................................ 0 00j. Modifying official records if necessary ...................................................................... 0 0 0
11. Show how much you agree or disagree with each of the following .
statements.
a. I talk up the Marine Corps to my friends as a great outfit to be associated with ..... 00 0 O 0 -
b. I find that my values and the Marine Corps' values are very similar ............................ 0 000 00c. There is not much to be gained by my sticking with the Marine Corps indefinitely ...... 0 000d. The Marine Corps is the best of all places for me to work ........................................... 0 000 0e. The major satisfaction in my life comes from my job ................................................. 0 0 0 0f. The most important things that happen to me involve my work ................................. 0 0 0 00g. I'm really a perfectionist about my work ....................................................................... 0 0 0 00 00h. I live, eat, and breathe my job ..................................................................................... 0 000 00i. Most things in life are more important than work ....................................................... 0 0 00 0j. I am very much involved personally in my work .......................................................... 0 0 0 0 0 00k. Being a Marine is worth personal sacrifice ................................................................. 00 0 00 0
23
A-23
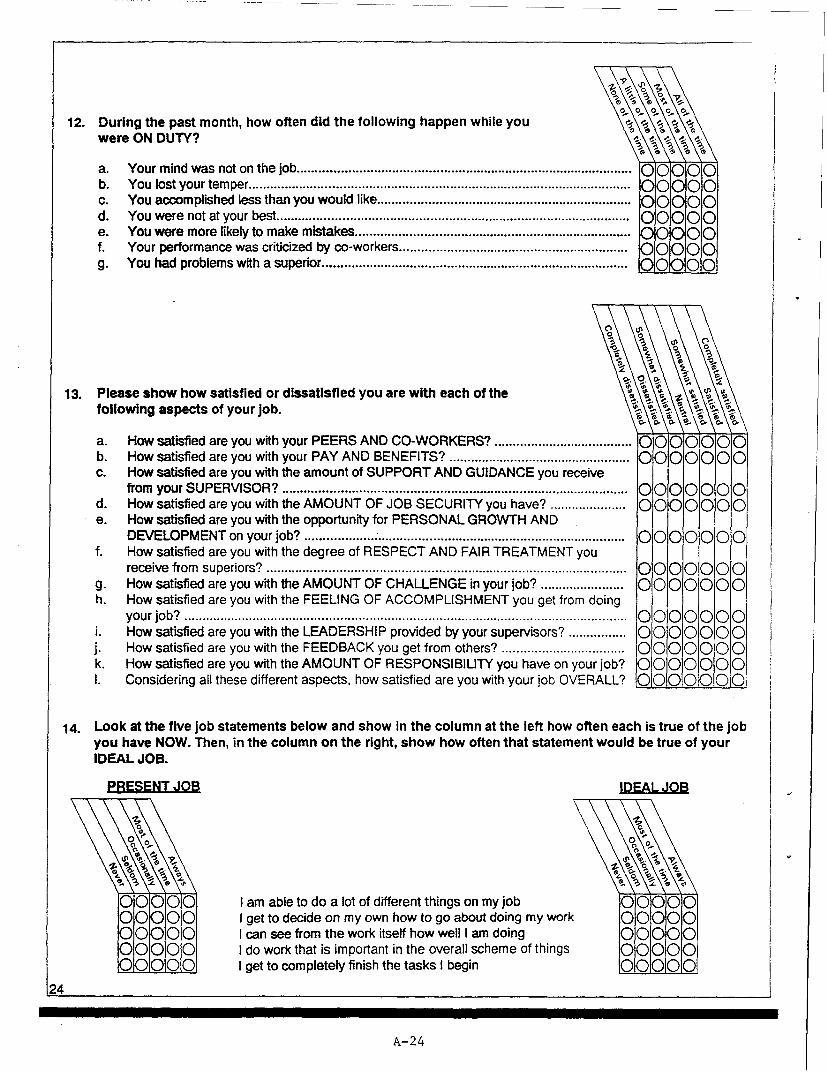
12. During the past month, how often did the following happen while you 01 - 0
were ON DUTY?
a. Your mind was not on the job .......................................................................................... 0 0 0 0 0b. You lost your temper ....................................................................................................... 0 0 0 0 0c. You accomplished less than you would like ...................................................................... 0 0 0 0d. You were not at your best ................................................................................................ 0 0 0 0e. You were more likely to make mistakes ............................................................................f. Your performance was criticized by co-workers ...............................................................g. You had problems with a superior ....................................................................................
o0
0
13. Please show how satisfied or dissatisfied you are with each of thefollowing aspects of your job.
a. How satisfied are you with your PEERS AND CO-WORKERS? ................................... 00 0000b. How satisfied are you with your PAY AND BENEFITS? ............................................... 0000000c. How satisfied are you with the amount of SUPPORT AND GUIDANCE you receive
from your SUPERVISOR? ........................................................................................... 0 0 0 0 0 0 0d. How satisfied are you with the AMOUNT OF JOB SECURITY you have? ................... 0000000e. How satisfied are you with the opportunity for PERSONAL GROWTH AND
DEVELOPMENT on your job?.....................................0000000f. How satisfied are you with the degree of RESPECT AND FAIR TREATMENT you
receive from superiors? ................................................................................................... 0 0 0 0 0 0 0g. How satisfied are you with the AMOUNT OF CHALLENGE in your job? ....................... 000000h. How satisfied are you with the FEELING OF ACCOMPLISHMENT you get from doing
your job? .......................................................................................................................... 0 0 0 0 0 0 0i. How satisfied are you with the LEADERSHIP provided by your supervisors? .............. 0000000j. How satisfied are you with the FEEDBACK you get from others? ................................. 0000000k. How satisfied are you with the AMOUNT OF RESPONSIBIULTY you have on your job? 000000I. Considering all these different aspects, how satisfied are you with your job OVERALL? 0000000
14. Look at the five job statements below and show in the column at the left how often each is true of the jobyou have NOW. Then, in the column on the right, show how often that statement would be true of yourIDEAL JOB.
O IDEALJOB
00000)tolO 1 am able to do a lot of different things on my job 00( O000 0 get to decide on my own how to go about doing my work 0O0000,•,•,00 00 1 can see from the work itself how well I am doing 00000
00000 1 do work that is important in the overall scheme of things o00000100 00O 1 get to completely finish the tasks I begin ~(>0t0000
24
A-24

15. Would you be more likely or less likely to have 17. In your opinion, what is the ONE best thingyour Ideal job NOW if you were a civilian? about being a Marine?"o Much more likely 0 A chance to serve your country"o More likely 0 Job security"o About equally likely 0 Pay and benefitsO Less likely Q Adventure and excitementO Much less likely O Being one of "the few and the proud"
0 Training and personal development16. To what extent does your Job affect your plans O Retirement options
to remain on active duty? 0 OtherO Not at allO Very littleO A littleO Somewhat0 AlotO Quite a lotO A great deal
1. All in all, how are you feeling about yourself 3. How about your work skills? Do you think yourthese days? skills are:"O Terrible 0 Readily marketable"O Unhappy 0 Ukely to be marketable"O Mostly unhappy 0 May or may not be marketable"O Neither unhappy nor pleased 0 Not likely to be marketable"O Mostly pleased 0 Not marketableO PleasedO Delighted 4. Since joining the Marine Corps, have you:
2. Do you feel that you are pretty much In control (MARK ALL THAT APPLY TO YOU)
of your life and handling things well, or do you 0 Completed your high school equivalencymore often feel as if you have lost control? 0 Taken college classes
O I am handling all areas of my life well 0 Begun a college degree program0 I am handling most areas of my life well 0 Obtained a college degree0 Some areas of my life seem out of control 0 Taken personal enrichment class(es)0 Many areas of my life seem out of control0 My life seems totally out of control
0 0
5. In the next few questions, please tell us how satisfied or dissatisfied youC
are with various aspects of your personal development, using this scale.I
a. How satisfied are you with your ABILITY TO GET ALONG WITH OTHERS? ................. 0 0 0 0
b. How satisfied are you with your PROGRESS TOWARD YOUR PERSONAL GOALS? .. 000000c. How satisfied are you with your PHYSICAL APPEARANCE? ......................................... 0 0 0
d. How satisfied are you with your GENERAL COMPETENCE? ......................................... 0 0 0
e. How satisfied are you with your SELF-DISCIPLINE? ...................................................... 0 0 0 0f. How satisfied are you w ith YO URSELF OVERALL? ....................................................... 0 0 0 0 0 Q O 25
A-25

(P 0o •.
6. How well do you think the following statements describe you? Please \\\ •\Indicate how much you agree or disagree with each statement. too ,,
a. In uncertain times, I usually expect the best ...................................................................... 0 0 0 0b. It's easy for me to relax ................................................................................................. 0 •0 • 0 0 0 0C. If something can go wrong for me, it will ............................................................................ 0 , 0 0 00 ()d. I always look on the bright side of things ........................................................................... 00 0 0 0 00e. I'm always optimistic about my future ................................................................................ 0 0 0 0 0 00f. I enjoy my friends a lot ............................................................................................... .0 0 1 0 0 1 0 0 )g- It's important for me to keep busy ...................................................................................... 00 00 0 0h. (hardly ever expect things to go my way ......................................................................... 0 0 0 0 0 0i. Things never work out the way I want them to .................................. 0I. I don't get upset too easily .................................................................................................. 0/k. I'm a believer in the idea that 'every cloud has a silver lining .................... 000..... . 00
I. I rarely count on good things happening tomne............................................... 00 0000
7. Consider your personal development since 9. How often has your personal development beenjoining the Marine Corps. Do you think your on your mind lately?personal development would have been better 0 Almost all the timeor worse If you had remained a civilian? 0 A great deal
0 A lot worse 0 Quite a bitO Considerably worse 0 Once in a while0 A little worse 0 Seldom0 About the same 0 Hardly ever0 A little better 0 Not at all0 Considerably better0 A lot better
8. How do you think your personal accomplish-ments compare with those of most MarineCorps members at the same paygrade?
0 A lot less0 Considerably less0 A little less0 About the same0 A little more0 Considerably more0 A lot more
.7
10. To what extent does your personal development affect your job performance .......... 0000 0011. To what extent does your personal development affect your plans to remain on active
duty? ...................................................................................................................................... 001 00
26
A-26
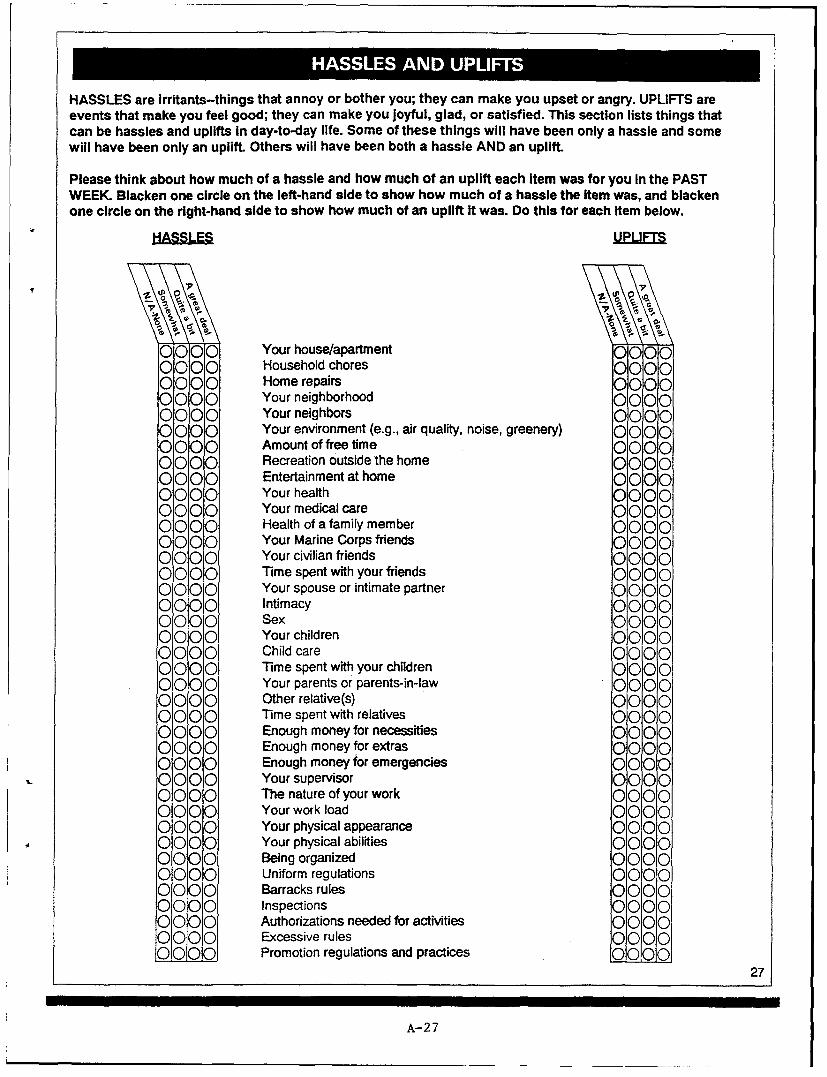
HASSE ANUPIT
HASSLES are irritants-things that annoy or bother you; they can make you upset or angry. UPLIFTS areevents that make you feel good; they can make you joyful, glad, or satisfied. This section lists things thatcan be hassles and uplifts In day-to-day life. Some of these things will have been only a hassle and somewill have been only an uplift. Others will have been both a hassle AND an uplift.
Please think about how much of a hassle and how much of an uplift each item was for you In the PASTWEEK. Blacken one circle on the left-hand side to show how much of a hassle the item was, and blackenone circle on the right-hand side to show how much of an uplift it was. Do this for each Item below.
HASSLES UPLIFTS
0000 Your house/apartment 0000000 Household chores oooo0000 Home repairs 0000000 Your neighborhood 00000000 Your neighbors 00000000 Your environment (e.g., air quality, noise, greenery) 00000000 Amount of free time 00000000 Recreation outside the home 00000000 Entertainment at home 00000000 Your health 00000000 Your medical care 00000000 Health of a family member 00oo0000 Your Marine Corps friends 00000000 Your civilian friends 00oo0000 Time spent with your friends 00000000 Your spouse or intimate partner 00000000 Intimacy 00000000 Sex 00000000 Your children 00000000 Child care 00000000 Time spent with your children 00000000 Your parents or parents-in-law 00000000 Other relative(s) 00000000 Time spent with relatives 00000000 Enough money for necessities 00000000 Enough money for extras 00000000 Enough money for emergencies 0000000 Your supervisor 00000000 The nature of your work 00000000 Your work load 00000000 Your physical appearance 0000000 Your physical abilities 000000O00 Being organized 000
0000 Uniform regulations 00000000 Barracks rules 00000000 Inspections 00000000 Authorizations needed for activities 0000
0 000 Excessive rules
01000 Promotion regulations and practices 000027
A-27

LIEAS AWH L
Now, think once again about your life as a whole, considering all the different aspects oflife that have been covered in this survey.
1~.
00
1. Please indicate how much you agree or disagree with each statement.
a. In most ways my life is close to ideal ............................................................................ 000.0 00b. The conditions of my life are excellent ............................................................................ 0 0 0 0 0c. I am satisfied with my life .................................................................................................. 0 0 0 0 0 0d. So far I have gotten the important things I want in life ...................................................... 0 0 0 0 0 0e. If I could live my life over, I would change almost nothing ............................................... 000000
2. How satisfied are you with your life overall? 3. Think of a friend that you know well and who is0 Completely dissatisfied about your age. How does your life as a whole0 Dissatisfied compare to your friend's life?0 Somewhat dissatisfied 0 A lot worse0 Neither satisfied nor dissatisfied 0 Considerably worse0 Mostly satisfied 0 A little worse0 Satisfied 0 About the same0 Completely satisfied 0 A little better
0 Considerably better0 A lot better
Social security numbers will be used by researchers at the Navy Personnel Research and DevelopmentCenter to match information on this questionnaire with other Marine Corps files. NO INFORMATION FROMTHIS QUESTIONNAIRE ABOUT ANY INDIVIDUAL MARINE WILL EVER BE GIVEN TO ANYONE ELSE IN OROUTSIDE OF THE MARINE CORPS.
Please write in your social security numberand darken the circles to match.
®(( " ® ) ® - (®)®)(®If you have any questions, please call Dr. Elyse000 - (D0 - 0000 Kerce, DSN 553-7606 or (619) 553-7606 or Paul000 - 0D 0( 0 00 (D@ Magnusson, DSN 553-7648 or (619) 553-7648 at(D (0) - (0 (2) - (2) @ (D) the Navy Personnel Research and Development
( -G) -) -(0) Center In San Diego, California.G0® - D D- 0®®®@(( - @® - (®DG) Thank you for your time and effort!(D(D(D- 00 - 0000( (00@ - (0 - 00M0
28
A-28

Distribution List
Commanding General, Camp LejeuneCommandant of the Marine Corps (MH)Headquarters, U.S. Marine Corps (MA), (MWM)Defense Technical Information Center (4)