Embed Size (px)
Citation preview
Quality of Life Measurement and Its Application in Indonesia
Quality of Life Measurement and Its Application in Indonesia
Fredrick Dermawan Purba
Fredrick Derm
awan Purba
Quality of Life M
easurement and Its A
pplication in Indonesia
INVITATION
for the public defense of my thesis
Quality of life measurement and its application
in Indonesia
on 26 September 201811:30 AM
Erasmus MC, Prof. Andries Queridozaal (Eg-370)‘s-Gravendijkwal 230
Rotterdam 3015 CE
after the ceremony you are welcome to join us for a reception
at the foyer of the defense ceremony room
Fredrick Dermawan PurbaDepartment of Psychiatry,
Section [email protected]
Paranymphs
Hetty [email protected]
Norma Sofisa [email protected]

Quality of Life Measurement and Its Application in Indonesia
Fredrick Dermawan Purba
Colofon
Quality of Life Measurement and Its Application in Indonesia, Fredrick Dermawan Purba
ISBN: 978-94-6375-071-4
© 2018, Fredrick Dermawan Purba, the Netherlands, [email protected]
All rights reserved. No part of this thesis may be reproduced or transmitted in any form or by any
means, electronic or mechanical, including photocopy, recording, or any information storage or
retrieval system, without prior permission from the author of this thesis or, when appropriate, from the
publishers of the manuscripts in this thesis.
LAYOUT AND DESIGN: Joppe Klein, persoonlijkproefschrift.nl.
PRINTING: Ridderprint BV | www.ridderprint.nl
Quality of Life Measurement and Its Application in Indonesia
Kwaliteit van leven meting en de toepassing in Indonesië
Thesis
to obtain the degree of Doctor from the
Erasmus University Rotterdam
by command of the
Prof. dr. Rutger C.M.E. Engels
and in accordance with the decision of the Doctorate Board.
The public defense shall be held on
Wednesday 26 September 2018 at 11.30 hours
by
Fredrick Dermawan Purba
born in Medan, North Sumatera, Indonesia
Doctoral committee
Promoters
Prof. dr. J.J. van Busschbach
Prof. dr. S.S. Sadarjoen
Prof. dr. J. Passchier
Other members
Prof. dr. C.A. Uyl - de Groot
Prof. dr. J. de Vries
Associate professor N. Luo
Copromotores
Dr. J.A.M. Hunfeld
Dr. A. Iskandarsyah
Table of Contents
Chapter 1 General introduction 6
Chapter 2 Employing quality control and feedback to the EQ-5D-5L valuation protocol to improve the quality of data collection
Published in Quality of Life Research, 2017, 26(5), 1197-1208
16
Chapter 3 Test-retest reliability of EQ-5D-5L valuation techniques: the composite time trade-off and discrete choice experiments
Accepted in Value in Health, 2018, in press
40
Chapter 4 The Indonesian EQ-5D-5L value set
Published in Pharmacoeconomics, 2017, 35(11), 1153-1165
68
Chapter 5 Quality of life of the Indonesian general population: test-retest reliability and population norms of the EQ-5D-5L and WHOQOL-BREF
Published in PLOS One, 2018;13(5):e0197098.
96
Chapter 6 the health status and quality of life of people living on an unhealthy riverbank
Published in BMC Public Health. 2018;18(1):782.
132
Chapter 7 General discussion 156
Appendix Summary 170
Samenvatting 176
About the Author 180
181
PhD Portfolio 182
Acknowledgements 185

General introduction
In Indonesia, health-related quality of life (HRQOL) measurement has become important, as
care budget. This requires objective estimates of HRQOL. Indeed, several internationally-
accepted HRQOL measures, such as WHOQOL-BREF and EQ-5D-5L have been translated into
Bahasa Indonesia and are used in investigations in Indonesia. To ensure valid use of these
questionnaires, it is necessary to establish their psychometric properties in Indonesia, their
population norms, and ‘health economic value sets’. This thesis sets out to investigate these
aspects of WHOQOL-BREF and EQ-5D-5L in Indonesia in a large, representative sample of
the general population. Moreover, the investigations presented in this thesis explore the
introduction of quality control in sampling and administration of the questionnaires, thus
ensuring state-of-the-art sampling and administration. The use of the questionnaires and
their norm scores is illustrated by investigating the quality of life of people living on the banks
of the polluted Ciliwung river in Jakarta.
Indonesia and quality of life
Indonesia consists of 13.466 islands and 255.5 million inhabitants in 2015 [1]. The current
president, Joko Widodo, launched a national development agenda entitled Nawa Cita,
consisting of nine development priorities [2]. One of the nine priorities was to improve the
as: “individuals’ perceptions of their position in life in the context of the culture and value
systems in which they live and in relation to their goals, expectations, standards and concerns’
[3]. This thesis focuses on HRQOL, i.e. the health aspects of quality of life [4,5]. Health itself is
a state of complete physical, social and mental well-being and not merely
’ [6]. Different national programs have been implemented to
improve the quality of life of the Indonesian people, including by the Ministry of Health (MoH),
one of whose major programs has been basic national health insurance provided for everyone
in Indonesia, regardless of socio-economic status. This ‘Jaminan Kesehatan Nasional’ was
by the MoH that the implementation of the insurance scheme had the potential to increase the
need for medication and medical devices. Even though the economy of the country has grown
steadily, the health budget is limited: to about 2.5% of the total national budget [8]. The limited
of medication and medical devices for the population. Health economic studies provide such a
strategy. In addition to medical interventions, there are programs run by other ministries that
Chapter 1
8
the effects of these efforts to improve the quality of life of the Indonesian population, objective
estimates of HRQOL are also required.
HRQOL measurement
epidemiological surveys, ii) to assess the subjective health and well-being of the general
studies, and iv) to compare cost-effectiveness between different health interventions in
respondents, from healthy populations to patient groups: e.g. the EuroQol EQ-5D, the World
Asthma Quality of Life Questionnaire (AQLQ) [9]. Further, the generic HRQOL instruments can
and ii) those producing ‘utilities’ used for economic evaluation (unidimensional) [10].
generic HRQOL instrument. It measures four domains of quality of life: physical, psychological,
social and environmental. It was designed based on a cross-cultural methodology to be
used in epidemiological studies and transcultural investigations [3,11] and has been proven
valid across many health conditions in various countries [11-18]. WHOQOL-BREF presents a
differentiated picture of health-related quality of life, addressing the domains listed above [19].
EQ-5D-5L is an example of the second type of generic HRQOL instrument. It is provided by
system): mobility, self-care, usual activities, pain/discomfort, and anxiety/depression, with
visual analogue scale (EQ-VAS) ranging from 0 (“worst imaginable health state") to 100 (“best
imaginable health state") [20]. EQ-5D-5L has been shown to be valid in many settings and
be converted into an ‘index score’ using a value set representing societal preferences: a
national value set [28,29]. The index score is often referred to as a ‘utility’. Several national
1
9
General introduction
recommended EQ-5D as the preferred method for deriving utilities to be used in economic
evaluation in their respective countries [30,31].
While the two questionnaires are increasingly being used in different types of
investigations in Indonesia [32-38], the literature on the psychometric properties of both
instruments in the Indonesian general population and in different sub-populations, e.g.,
is limited. Moreover, neither population norms nor a national value set are available for the
two questionnaires. Hence this thesis reports on the investigations implemented to arrive at
such norm data and value sets.
Psychometric properties and valuation of HRQOL instruments for the Indonesian
population
There are several studies investigating the validity and reliability of EQ-5D-5L and
WHOQOL-BREF in Indonesian samples. These showed that EQ-5D-5L is valid and reliable
in human papilloma virus (HPV)-related cancer patients [39], and WHOQOL-BREF in the
Indonesian elderly [40]. Yet, no previous investigation reported test-retest results for the two
questionnaires. Such reliability tests would support the use of both questionnaires in HRQOL
measurement in Indonesia if they were indeed proven to be reliable over time.
Furthermore, no previous study reported Indonesian national representative norm scores
for the two questionnaires. These norm scores are needed as reference values for various
patient groups or for any particular group of individuals. Different stakeholders, such as
clinicians, researchers, public health experts, epidemiologists, and health care workers could
Indonesia has no national EQ-5D-5L value set. Previous investigations used the values
preferences among the countries are different [41-44], and because values might not compatible
with the different languages of the UK and Malaysia, it is best for research be conducted
Indonesian people.
the EuroQol Valuation Technology (EQ-VT). EQ-VT implements two value elicitation techniques:
the composite Time Trade-Off (C-TTO), and Discrete Choice Experiments (DCE) [45,46]. This
same stimuli and all answers are recorded in the same manner, in order to ensure as much
as possible that differences in answers cannot be attributed to the interview process, but to
10
Chapter 1
valuation studies, a quality control (QC) report tool was implemented [47]. This thesis sets out
The EQ-VT protocol has been implemented in different countries to obtain national
value sets [48-54]. However, no evidence has been reported on the test-retest reliability of the
valuation methods used: C-TTO and DCE. Such psychometric evidence would support the use
of EQ-VT, and even the C-TTO and DCE, not only in Indonesia but also at an international level.
In this thesis, the two questionnaires were used: (i) to measure HRQOL of an underprivileged
group - people living on a polluted riverbank - and to compare their scores with those of the
general population. (ii) to report on the relationships between socio-demographic factors such
as age, gender, income, and living on a polluted riverbank, and HRQOL.
Outline and aims of this thesis
The thesis presents EQ-5D-5L health state values provided by the general population
(the 'value set’) and EQ-5D-5L and WHOQOL-BREF norm scores. The process of ensuring a
is also presented. The application of the two questionnaires to the measurement of HRQOL
in a community that lived on the Ciliwung riverbank in Jakarta, and comparison with the
normative scores, is presented subsequently.
The research objectives in this thesis are as follows:
1. To obtain the values of different EQ-5D-5L health states according to the Indonesian
2. To establish the test-retest reliability of the methods used to obtain the value set: C-TTO
3. To establish the test-retest reliability of two frequently-used HRQOL measures: EQ-5D-5L
and WHOQOL-BREF.
4. To obtain population norm scores for EQ-5D-5L and WHOQOL-BREF.
5.
Chapter 2
respondents during data collection, and (ii) the improvement of the interviewers’ performances
1
11
General introduction
presents the solutions found.
Chapter 3 presents the test-retest reliability of the two techniques used in the EQ-VT
interviews to elicit values of health states: C-TTO and DCE. The stability over time of these
two techniques is checked from two perspectives, the respondent perspective and the health
states perspective.
In Chapter 4, the EQ-5D-5L value set obtained from the Indonesian general population is
presented, including the procedure for obtaining the value set and the different modelling
approaches.
The investigation on the test-retest reliability of EQ-5D-5L and WHOQOL-BREF and the
normative scores of the two questionnaires from the Indonesian general population are
presented in Chapter 5, including the subgroups analysis in respect of residence, gender,
level of education, age, religion and ethnicity groups.
In Chapter 6,
people living on the banks of Ciliwung river in Jakarta, are reported, along with happiness,
life satisfaction, and perceived economic circumstances. This is undertaken in comparison
with a matching control group. In addition, the people living on the banks of Ciliwung river are
compared to the inhabitants of Jakarta in general, and with the Indonesian general population.
Chapter 7
thesis, including recommendations for relevant stakeholders and future research.
12
Chapter 1
References
1. Badan Pusat Statistik (2015). Statistik 70 Tahun Indonesia Merdeka. http://bps.go.id/index.php/publikasi/1053. Accessed November 3, 2015.
2. United Nations Development Programme (UNDP) Indonesia (2015). Converging Development Agendas: ‘Nawa Cita’, ‘RPJMN’, and SDGs. Jakarta.
3. The WHOQOL Group (1998). Development of the
quality of life assessment. . Psychological Medicine, 28(3), 551-558.
4. Torrance, G. W. (1987). Utility approach to measuring health-related quality of life. Journal of Chronic Diseases, 40(6), 593-600, doi:https://doi.org/10.1016/0021-9681(87)90019-1.
5. Mayo, N. E. (2015). Isoqol Dictionary of Quality of Life and Health Outcomes Measurement: ISOQOL.
6. World Health, O. (1995). Constitution of the
7. bpjs-kesehatan.go.id (2010). Vision and Mission. http://bpjs-kesehatan.go.id/bpjs/index.php/pages/detail/2010/2. Accessed November 4th, 2015.
8. Kementerian Kesehatan Republik Indonesia (2015). Rencana Strategis Kementerian Kesehatan 2015-2019. Jakarta.
9. Patrick, D. L., & Deyo, R. A. (1989). Generic
health status and quality of life. Medical Care, 27(3 Suppl), S217-232.
10. Drummond, M., Sculpher, M. J., Claxton, K., Stoddart, G. L., & Torrance, G. W. (2015). Methods for the Economic Evaluation of Health Care Programmes (Fourth edition). Oxford: Oxford University Press.
11. Skevington, S. M., Lotfy, M., & O'Connell, K.
WHOQOL-BREF quality of life assessment: psychometric properties and results of the
WHOQOL group. Quality of Life Research, 13(2), 299-310.
12. Hanestad, B. R., Rustoen, T., Knudsen, O., Jr., Lerdal, A., & Wahl, A. K. (2004). Psychometric properties of the WHOQOL-BREF questionnaire for the Norwegian general population. Journal of Nursing Measurement, 12(2), 147-159.
13. Chachamovich, E., Trentini, C., & Fleck, M. P. (2007). Assessment of the psychometric performance of the WHOQOL-BREF
adults. International Psychogeriatrics, 19(4), 635-646.
14. N., Mallik, S., Baghaei, A. M., & Rabiei, K. (2010). Psychometric properties of the WHOQOL-BREF in an Iranian adult sample. Community Mental Health Journal, 46(2), 139-147.
15. Ohaeri, J. U., Awadalla, A. W., El-Abassi,
factor analytical study of the WHOQOL-Bref: experience with Sudanese general population and psychiatric samples. BMC Medical Research Methodology, 7, 37.
16. Ohaeri, J. U., & Awadalla, A. W. (2009). The reliability and validity of the short version of the WHO Quality of Life Instrument in an Arab general population. Annals of Saudi Medicine, 29(2), 98-104.
17. Ohaeri, J. U., Awadalla, A. W., & Gado, O. M. (2009). Subjective quality of life in a nationwide sample of Kuwaiti subjects using the short version of the WHO quality of life instrument. Social Psychiatry and Psychiatric Epidemiology, 44(8), 693-701.
18. subjective quality of life and its correlates in a nation-wide sample of high school students in an Arab setting using the WHOQOL-Bref. BMC Psychiatry, 11, 71.
19. de Willige, G. v., Wiersma, D., Nienhuis, F. J., & Jenner, J. A. (2005). Changes in quality of life in chronic psychiatric patients: A comparison between EuroQol (EQ-5D) and WHOQoL. [journal article]. Quality of Life Research, 14(2), 441-451, doi:10.1007/s11136-004-0689-y.
20. Herdman, M., Gudex, C., Lloyd, A., Janssen, M., Kind, P., Parkin, D., et al. (2011). Development
version of EQ-5D (EQ-5D-5L). Quality of Life Research, 20(10), 1727-1736, doi:10.1007/s11136-011-9903-x.
21. Tran, B. X., Ohinmaa, A., & Nguyen, L. T. (2012).
properties of the EQ-5D-5L in HIV/AIDS patients. Health Qual Life Outcomes, 10, 132.
22. Nguyen, L. H., Tran, B. X., Hoang Le, Q. N., Tran, T. T., & Latkin, C. A. (2017). Quality of
using EQ-5D-5L. [journal article]. Health and Quality of Life Outcomes, 15(1), 199, doi:10.1186/s12955-017-0771-0.
1
13
General introduction
23. Kim, T. H., Jo, M. W., Lee, S. I., Kim, S. H., & Chung, S. M. (2013). Psychometric properties of the EQ-5D-5L in the general population of South Korea. Quality of Life Research, 22(8), 2245-2253.
24. Janssen, M. F., Pickard, A. S., Golicki, D., Gudex, C., Niewada, M., Scalone, L., et al. (2013). Measurement properties of the EQ-5D-5L compared to the EQ-5D-3L across eight patient groups: a multi-country study. Quality of Life Research, 22(7), 1717-1727.
25. Zenger, M., & Brahler, E. (2014). The quality of life questionnaire EQ-5D-5L: psychometric properties and normative values for the general German population. Quality of Life Research, 23(2), 443-447, doi:10.1007/s11136-013-0498-2.
26. Nolan, C. M., Longworth, L., Lord, J., Canavan, J. L., Jones, S. E., Kon, S. S. C., et al. (2016). The EQ-5D-5L health status questionnaire in COPD: validity, responsiveness and minimum important difference. [10.1136/thoraxjnl-2015-207782]. Thorax.
27. Chen, P., Lin, K.-C., Liing, R.-J., Wu, C.-Y., Chen, C.-L., & Chang, K.-C. (2016). Validity, responsiveness, and minimal clinically important difference of EQ-5D-5L in stroke patients undergoing rehabilitation. Quality of Life Research, 25(6), 1585-1596, doi:10.1007/
28. Torrance, G. W. (1986). Measurement of health state utilities for economic appraisal. Journal of Health Economics, 5(1), 1-30.
29. Dolan, P. (1997). Modeling valuations for EuroQol health states. Medical Care, 35(11), 1095-1108.
30. Rawlins, M. D., & Culyer, A. J. (2004). National Institute for Clinical Excellence and its value judgments. BMJ, 329(7459), 224-227.
31. Sakthong, P. (2008). Measurement of clinical-effect: utility. Journal of the Medical Association of Thailand, 91 Suppl 2, S43-52.
32. Sitaresmi, M. N., Mostert, S., Gundy, C. M., Sutaryo, & Veerman, A. J. (2008). Health-related quality of life assessment in Indonesian childhood acute lymphoblastic leukemia. Health Qual Life Outcomes, 6, 96.
33. Handajani, Y. S., Djoerban, Z., & Irawan, H. (2012). Quality of life people living with HIV/AIDS: outpatient in Kramat 128 Hospital Jakarta. Acta Medica Indonesiana, 44(4), 310-316.
34. Iskandar, S., van Crevel, R., Hidayat, T., Siregar, I. M., Achmad, T. H., van der Ven, A. J., et al. (2013). Severity of psychiatric and physical problems is associated with lower quality of life in methadone patients in Indonesia. American Journal on Addictions, 22(5), 425-431.
35. Endarti, D., Riewpaiboon, A., Thavorncharoensap, M., Praditsitthikorn, N., Hutubessy, R., & Kristina, S. A. (2015). Evaluation of Health-Related Quality of Life among Patients with Cervical Cancer in Indonesia. Prevention, 16(8), 3345-3350.
36. E., & Home, P. (2014). An analysis of the short- and long-term cost-effectiveness of starting biphasic insulin aspart 30 in insulin-naive people with poorly controlled type 2 diabetes. Diabetes Research and Clinical Practice, 106(2), 319-327.
37. Nikolajsen, A. (2015). An analysis of the cost-effectiveness of starting insulin detemir in insulin-naive people with type 2 diabetes. Journal of Medical Economics, 18(3), 230-240.
38. Gupta, V., Baabbad, R., Hammerby, E.,
analysis of the cost-effectiveness of switching from biphasic human insulin 30, insulin glargine, or neutral protamine Hagedorn to biphasic insulin aspart 30 in people with type 2 diabetes. Journal of Medical Economics, 18(4), 263-272.
39. Asselt, A. D. I., & Postma, M. J. (2018). Health-Related Quality of Life of Patients with HPV-Related Cancers in Indonesia. [doi: 10.1016/j.vhri.2017.07.010]. Value in Health Regional Issues, 15, 63-69, doi:10.1016/j.vhri.2017.07.010.
40. Salim, O. C., Sudharma, N. I., Rina, K., Kusumaratna, R. K., & Hidayat, A. (2007). Validity and reliability of World Health
the quality of life in the elderly (in Bahasa Indonesia). Univ Med, 26, 27-38.
41. Badia, X., Roset, M., Herdman, M., & Kind, P. (2001). A comparison of United Kingdom and Spanish general population time trade-off values for EQ-5D health states. Medical Decision Making, 21(1), 7-16.
14
Chapter 1
42. M., Oppe, S., Badia, X., Dolan, P., et al. (2003). A comparison of EQ-5D time trade-off values obtained in Germany, The United Kingdom and Spain. In R. Brooks, R. Rabin, & F. de Charro (Eds.), The Measurement and Valuation of Health Status Using EQ-5D: A European Perspective: Evidence from the EuroQol BIOMED Research Programme (pp. 143-165). Dordrecht: Springer Netherlands.
43. Johnson, J. A., Luo, N., Shaw, J. W., Kind, P., & Coons, S. J. (2005). Valuations of EQ-5D health states: are the United States and United Kingdom different? Medical Care, 43(3), 221-228.
44. Heijink, R., van Baal, P., Oppe, M., Koolman, X., & Westert, G. (2011). Decomposing cross-country differences in quality adjusted life expectancy: the impact of value sets. [journal article]. Population Health Metrics, 9(1), 17, doi:10.1186/1478-7954-9-17.
45. Oppe, M., Devlin, N. J., van Hout, B., Krabbe, P. F., & de Charro, F. (2014). A program of methodological research to arrive at the new international EQ-5D-5L valuation protocol. Value in Health, 17(4), 445-453, doi:10.1016/j.jval.2014.04.002.
46. Oppe, M., Rand-Hendriksen, K., Shah, K., Ramos-Goni, J. M., & Luo, N. (2016). EuroQol Protocols for Time Trade-Off Valuation of Health Outcomes. Pharmacoeconomics, 34(10), 993-1004.
47. Ramos-Goñi, J. M., Oppe, M., Slaap, B., Busschbach, J. J. V., & Stolk, E. (2016). Quality Control Process for EQ-5D-5L Valuation Studies. [doi: 10.1016/j.jval.2016.10.012]. Value in Health, doi:10.1016/j.jval.2016.10.012.
48.
An EQ-5D-5L value set based on Uruguayan population preferences. Quality of Life Research, 25(2), 323-333.
49. Xie, F., Pullenayegum, E., Gaebel, K., Bansback, N., Bryan, S., Ohinmaa, A., et al. (2016). A Time Trade-off-derived Value Set of the EQ-5D-5L for Canada. Medical Care, 54(1), 98-105.
50. Versteegh, M. M., Vermeulen, K. M., Evers, S. M. A. A., de Wit, G. A., Prenger, R., & Stolk, E. A. (2016). Dutch Tariff for the Five-Level Version of EQ-5D. Value in Health, 19(4), 343-352, doi:10.1016/j.jval.2016.01.003.
51. Luo, N., Liu, G., Li, M., Guan, H., Jin, X., & Rand-Hendriksen, K. (2017). Estimating an EQ-5D-5L Value Set for China. Value in Health, 20(4), 662-669, doi:https://doi.org/10.1016/j.jval.2016.11.016.
52. Ramos-Goñi, J. M., Craig, B. M., Oppe, M., Ramallo-Fariña, Y., Pinto-Prades, J. L., Luo, N., et al. Handling Data Quality Issues to Estimate the Spanish EQ-5D-5L Value Set Using a Hybrid Interval Regression Approach. Value in Health, doi:https://doi.org/10.1016/j.jval.2017.10.023.
53. Shiroiwa, T., Ikeda, S., Noto, S., Igarashi, A., Fukuda, T., Saito, S., et al. (2016). Comparison of Value Set Based on DCE and/or TTO Data: Scoring for EQ-5D-5L Health States in Japan. Value in Health, 19(5), 648-654.
54. Kim, S. H., Ahn, J., Ock, M., Shin, S., Park, J., Luo, N., et al. (2016). The EQ-5D-5L valuation study in Korea. Quality of Life Research, 25(7), 1845-1852, doi:10.1007/s11136-015-1205-2.
1
15
General introduction

Employing quality control and feedback to the EQ-5D-5L valuation protocol
to improve the quality of data collection
Published as: Purba, F. D., Hunfeld, J. A. M., Iskandarsyah, A., Fitriana, T. S., Sadarjoen, S. S.,
Passchier, J., Busschbach, J. J. V. (2017). Employing quality control and feedback to the EQ-
5D-5L valuation protocol to improve the quality of data collection. Quality of Life Research,
26(5), 1197-1208, doi:10.1007/s11136-016-1445-9.
18
Chapter 2
Abstract
OBJECTIVES: In valuing health states using generic questionnaires such as EQ-5D, there
are unrevealed issues with the quality of the data collection. The aims were to describe the
problems encountered during valuation and to evaluate a quality control report and subsequent
retraining of interviewers in improving this valuation.
METHODS:
Interviewers were trained and answered questions regarding problems during these initial
interviews. Thematic analysis was used and individual feedback was provided. After
followed by a one-day retraining program. Subsequently individual feedback was also given on
the basis of follow-up QCs. The Wilcoxon Signed-Rank Test was used to assess improvements
further 168 interviews.
RESULTS: Interviewers encountered problems in recruiting respondents. Solutions provided
scripts to explain the project’s goals to respondents. Solutions applied to help respondents
during interview were: developing the technical and personal skills of the interviewers and
stimulating the respondents’ thought processes. There were also technical problems related
to hardware, software and internet connections. There was an improvement in all 7 indicators
of quality after the second QC.
CONCLUSION: Training before and during a study, and individual feedback on the basis of a
quantitative QC, can increase the validity of values obtained from generic questionnaires.
19
Employing quality control and feedback to the EQ-5D-5L valuation protocol
Introduction
The EQ-5D instrument is a generic health questionnaire developed by the EuroQol Group and
widely used to measure health outcomes. The EuroQol Group released the newer version of
studies of this new questionnaire were conducted internationally with the aim of developing
includes a computer supported time trade-off (TTO) exercise, a visual analog scale (VAS), and a
discrete choice experiment (DCE) [8]. In earlier TTO, VAS, and DCE administrations researchers
noticed problems with the quality of the responses such as ‘non-traders’ (those not willing to
trade life-years for health), and illogical answers, both of which could affect the quality of the
data [9]. Another problem has been in obtaining values below the value of dead [10]. One of the
reasons the EQ-VT was developed was to overcome such problems [11].
In addition to these efforts, several investigations were conducted in the area of
methodology [8,12], approaches and techniques [13-15], and data analysis [16,17], in order to
increase the quality of the data collection and data reporting, but none of these investigations
focused on the interviewers. Such a focus is warranted, since training for interviewers, before
and during data collection, has been shown to relate to data quality [9]. However, it is not yet
clear how this training is undertaken in a valuation procedure, such as the EQ-VT protocol,
data collection as a relevant topic and has developed a continuous quality monitor for data
collection: the quality control (QC) report tool. How interviewers and supervisors improve in
response to this QC report is as yet unknown.
The main purposes of this study were (i) to describe the problems of the interviewers.
problems interviewers encountered during their interviews, and the problems they perceived
in their respondents as these respondents endeavored to undertake the TTO, DCE and VAS
exercises; (ii) to evaluate quantitatively the improvement in interviewers’ skills displayed
feedback, and the advice from the daily supervisor.
2
20
Chapter 2
Methods
Respondents and interviewers
This study is part of a larger valuation study using a health-related quality of life measurement
tool, EQ-5D-5L, for the general Indonesian population. Thirteen interviewers were hired to
interview 1000 respondents in three different cities (Jakarta, Bandung and Jogjakarta) and
their surrounding areas. Quota sampling was used to make the sample representative of the
Indonesian population with regard to six demographic characteristics: location (urban-rural),
gender, age, level of education, religion, and ethnicity [18]. The majority of the interviewers
had Bachelors’ degrees in various disciplines, especially quality of life-related majors (e.g.
Psychology, Management, Development Communication, Economics). One interviewer had
obtained a Master’s degree in Psychology. Each interviewer was included as a participant if
retraining program, and completion of at least 15 interviews after retraining.
Instruments
EQ-5D-5L Valuation Technology (EQ-VT)
studies, the EuroQol Group developed a valuation protocol [8] and the EQ-VT computer program.
descriptive system, the VAS, and the socio-demographic background questions, (iii) composite
time trade-off (cTTO) tasks [19]; (iv) DCE tasks, and (v) round up. All steps were accomplished
using computer-assisted face-to-face interviews employing the EQ-VT software provided by
the EuroQol Group.
Open-ended Questionnaire
An open-ended questionnaire comprising three questions was given to the interviewers.
(i) ‘What were the problems that you as an interviewer faced whilst conducting EQ-5D-5L
valuation study interviews?’ (ii) ‘What were the problems that you think your respondents
faced in completing EQ-5D-5L valuation study interviews?’ (iii) ‘What were the solutions
that you applied to overcome your problems as an interviewer and the problems of your
respondents?’
Quality Control (QC) Report
related to the quality of the data collected so far, differentiated per interviewer. It measured
21
Employing quality control and feedback to the EQ-5D-5L valuation protocol
interviewers’ compliance with the valuation study protocol. Seven protocol compliance
indicators were used:
i.
ii. The mean number of iterative TTO steps used in the wheelchair example by the
interviewer, over all his or her interviews. More steps used means the interviewer
explained the wheelchair example more thoroughly than less amount of steps.
iii. The number of times when a respondent had an inconsistency where the TTO rating of
state 55555 was not rated as the state with the lowest value and at least 0.5 higher than
the state with the lowest value. If such an inconsistent response was found, the whole
iv. The number of times when the duration of time an interviewer used to explain the
‘wheelchair example’ preceding the actual valuation task was less than 180 seconds.
v. Interview duration: the minutes taken to complete the TTO valuation task. If the TTO task
vi.
vii.
It was considered that this should be below 40%. The daily supervisor used this indicator
as the starting point for the conversation with the interviewer during feedback sessions.
The primary training of the interviewers comprised of three sessions: (i) introduction of
related concepts, such as health-related quality of life and EQ-5D-5L as a generic questionnaire
used to value health states, (ii) explanation of the EQ-VT protocol and interviewer instructions,
and (iii) practice in groups.
was 53%. This was deemed to be quite disappointing by the team since this should be below
until the interviewers were retrained, using the feedback from the quality report.
All interviewers were invited to the retraining program. The retraining program led by
the daily supervisor (FDP) was held in each center and was attended by interviewers from
that center only. First, FDP presented the QC report to show overall quality of each center’s
interviews based on seven objective indicators of compliance with the protocol. FDP then
2
22
Chapter 2
to meet each indicator and provide suitable solutions to overcome these problems. A list of
these problems and solutions was made in each center and shared to other centers.
To ensure interviewers adhere to every indicator of protocol compliance after the retraining
program, FDP created QC reports once in two days. He made notes at a group level and on an
individual level and sent this feedback to the interviewers so that they were able to learn from
their own and other interviewers’ performance.
Procedure
The valuation study was approved by the Health Research Ethics Committee, Faculty of
Medicine, Padjadjaran University, Indonesia. The daily supervisor (FDP) created two QC reports
report generated on March 16th, 2015 consists of ninety-eight interviews conducted by the
interviewers. This report was used as a basis for a retraining program held March 21st – 24th,
2015. The second report generated on May 18th, 2015 consists of 168 interviews conducted
after the retraining program. On May 18th, 2015 the FDP sent an open-ended questionnaire by
e-mail to each interviewer, asking them to return the questionnaire within one week. Three
days later, all interviewers had sent their answers.
Data Collection and Analysis
The data regarding problems encountered by interviewers and respondents, and solutions
a thematic analysis approach in order to provide relevant themes. The guidelines of Braun
(FDP) read all the answer documents from the interviewers and built an initial coding
directory. Using this initial directory, FDP and two groups consisting of two coders (from the
interviewers) each coded the transcripts separately. FDP and one group of coders coded that
part of the interviewers’ answers regarding problems encountered by interviewers and the
solutions applied. FDP and the second group of coders discussed the other part of the data,
the problems perceived by the interviewers as encountered by respondents and the solutions
applied. During the coding process, coders frequently contacted the corresponding interviewer
to clarify any unclear answer. A discussion was held to achieve agreement on differences
that occurred in the initial coding. Codes were collated into potential themes, reviewed by
FDP and the other coders, to generate a thematic map of the analysis. Finally, a discussion
23
Employing quality control and feedback to the EQ-5D-5L valuation protocol
with all interviewers for additional comments. Frequencies for each theme and sub-theme
were calculated and typical citations were noted.
Data from two QC reports regarding interviewers’ performance was treated as quantitative
performance of the interviewers before and after the retraining program, software program
the improvement in interviewers’ performance, based on 266 respondents’ data (98 respondents
before and 168 respondents after the retraining) on the seven previously-mentioned indicators.
Results
Interviewer characteristics
In total, 11 out of 13 interviewers were eligible to participate and returned their answers. One
interviewer conducted a limited number of interviews in the second wave (below 15) and thus
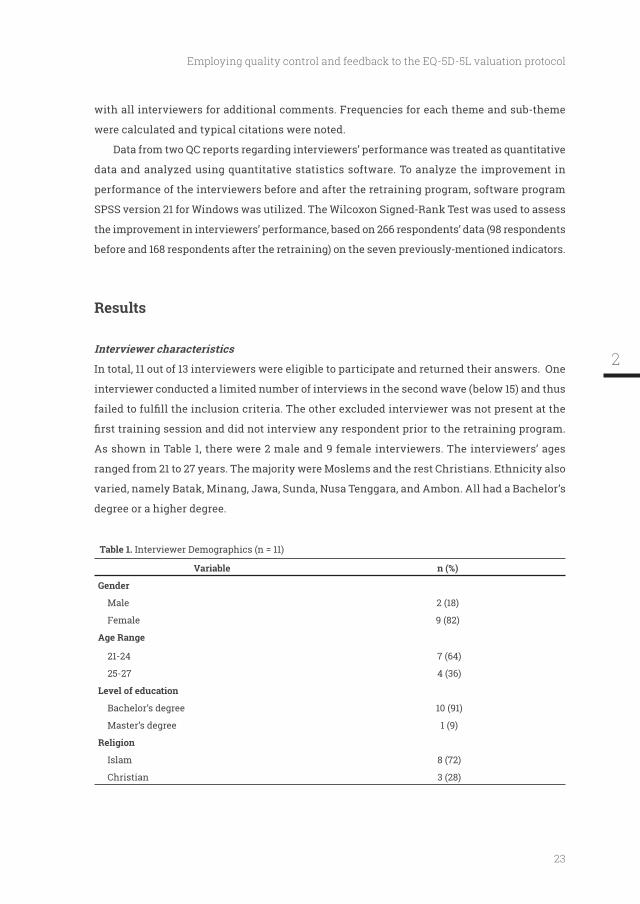
As shown in Table 1, there were 2 male and 9 female interviewers. The interviewers’ ages
ranged from 21 to 27 years. The majority were Moslems and the rest Christians. Ethnicity also
varied, namely Batak, Minang, Jawa, Sunda, Nusa Tenggara, and Ambon. All had a Bachelor’s
degree or a higher degree.
Table 1. Interviewer Demographics (n = 11)
Variable n (%)
Gender
Male 2 (18)
Female 9 (82)
21-24 7 (64)
25-27 4 (36)
Level of education
Bachelor’s degree 10 (91)
Master’s degree 1 (9)
Islam 8 (72)
Christian 3 (28)
2
24
Chapter 2
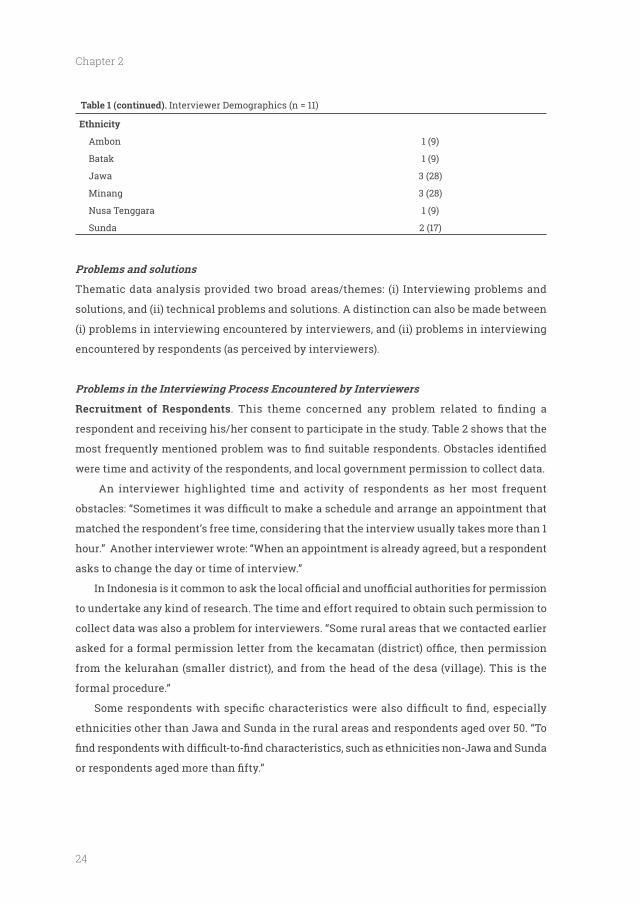
Table 1 (continued). Interviewer Demographics (n = 11)
Ethnicity
Ambon 1 (9)
Batak 1 (9)
Jawa 3 (28)
Minang 3 (28)
Nusa Tenggara 1 (9)
Sunda 2 (17)
Problems and solutions
Thematic data analysis provided two broad areas/themes: (i) Interviewing problems and
solutions, and (ii) technical problems and solutions. A distinction can also be made between
(i) problems in interviewing encountered by interviewers, and (ii) problems in interviewing
encountered by respondents (as perceived by interviewers).
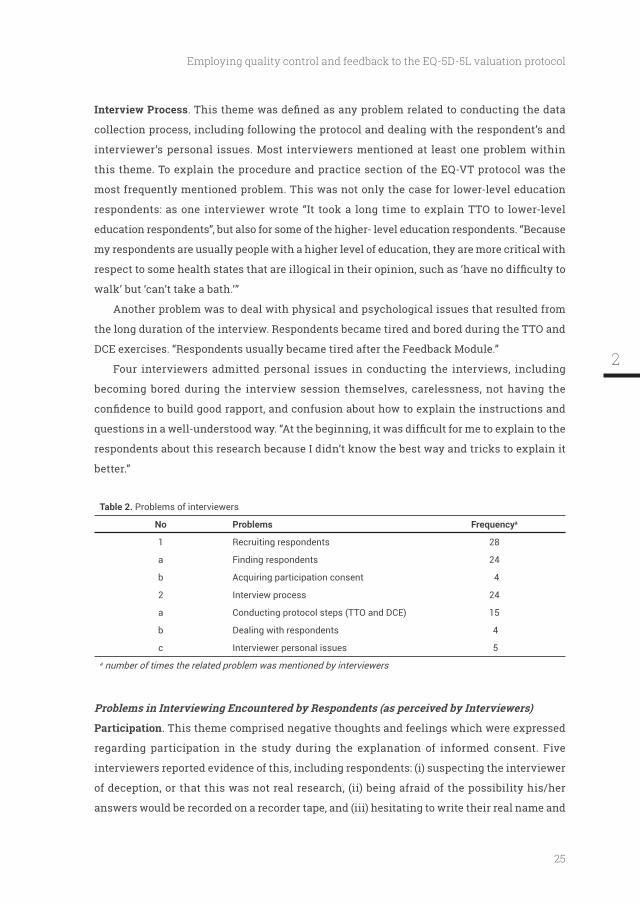
Recruitment of Respondents
respondent and receiving his/her consent to participate in the study. Table 2 shows that the
were time and activity of the respondents, and local government permission to collect data.
An interviewer highlighted time and activity of respondents as her most frequent
matched the respondent’s free time, considering that the interview usually takes more than 1
hour.” Another interviewer wrote: “When an appointment is already agreed, but a respondent
asks to change the day or time of interview.”
to undertake any kind of research. The time and effort required to obtain such permission to
collect data was also a problem for interviewers. “Some rural areas that we contacted earlier
from the kelurahan (smaller district), and from the head of the desa (village). This is the
formal procedure.”
ethnicities other than Jawa and Sunda in the rural areas and respondents aged over 50. “To
25
Employing quality control and feedback to the EQ-5D-5L valuation protocol
Interview Process
collection process, including following the protocol and dealing with the respondent’s and
interviewer’s personal issues. Most interviewers mentioned at least one problem within
this theme. To explain the procedure and practice section of the EQ-VT protocol was the
most frequently mentioned problem. This was not only the case for lower-level education
respondents: as one interviewer wrote “It took a long time to explain TTO to lower-level
education respondents”, but also for some of the higher- level education respondents. “Because
my respondents are usually people with a higher level of education, they are more critical with
walk’ but ‘can’t take a bath.’”
Another problem was to deal with physical and psychological issues that resulted from
the long duration of the interview. Respondents became tired and bored during the TTO and
DCE exercises. “Respondents usually became tired after the Feedback Module.”
Four interviewers admitted personal issues in conducting the interviews, including
becoming bored during the interview session themselves, carelessness, not having the
respondents about this research because I didn’t know the best way and tricks to explain it
better.”
Table 2. Problems of interviewers
No Problems Frequencya
1 Recruiting respondents 28
a Finding respondents 24
b Acquiring participation consent 4
2 Interview process 24
a Conducting protocol steps (TTO and DCE) 15
b Dealing with respondents 4
c Interviewer personal issues 5a number of times the related problem was mentioned by interviewers
Participation. This theme comprised negative thoughts and feelings which were expressed
regarding participation in the study during the explanation of informed consent. Five
interviewers reported evidence of this, including respondents: (i) suspecting the interviewer
of deception, or that this was not real research, (ii) being afraid of the possibility his/her
answers would be recorded on a recorder tape, and (iii) hesitating to write their real name and
2
26
Chapter 2
address. “Some respondents were hesitant because they were afraid that this research was a
fraud or had a hidden agenda.”
Interview Process
was the most frequently mentioned issue, with 8 interviewers mentioning respondent
different the dimensions and levels of EQ-5D-5L and the different questions in TTO and DCE.
of health states (no problem until severe)”.
The second problem most frequently mentioned by the interviewers was strong religious
beliefs and respect for life that interfered with how the respondent should follow the data
collection process. The majority of interviewers encountered this problem. Some respondents
death in a TTO question. One interviewer wrote “For respondents who have strong religious
beliefs, they believed that every word they said was like a prayer. Some refused to continue
their participation because of the option of Instant Death in TTO. Others preferred not to
choose Instant Death even though the health state in the question was really bad. They
believed that there would be someone else who would help them and because they believed
that life and death were in God’s hands”. Other respondents had a strong preference for life
any TTO question. “Some respondents had a strong belief that no matter how bad the health
could still do something useful.”
For some respondents, their physical condition interfered with their efforts at completing
them to read a screen full of small letters.” Boredom and fatigue were also experienced by some
respondents when completing the TTO and DCE tasks. The problems came not only from the
respondents themselves but also from the presence of others, whether or not they knew these
people. Their presence was distracting the respondents from the task or interfered with how
they answered or wished to answer the questions. “One of my respondents was interviewed
in her house in the presence of her little daughter in the room. When she selected the instant
death choice in one of the TTO questions, her daughter displayed a shocked reaction that
resulted in the respondent changing her answer.”
27
Employing quality control and feedback to the EQ-5D-5L valuation protocol
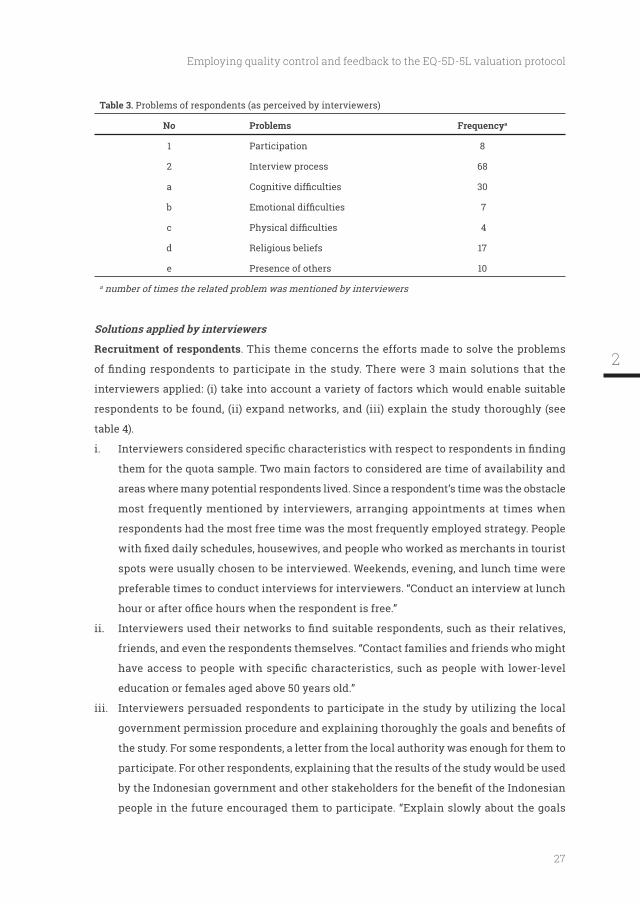
Table 3. Problems of respondents (as perceived by interviewers)
No Problems Frequencya
1 Participation 8
2 Interview process 68
a 30
b 7
c 4
d Religious beliefs 17
e Presence of others 10
a number of times the related problem was mentioned by interviewers
Solutions applied by interviewers
Recruitment of respondents. This theme concerns the efforts made to solve the problems
interviewers applied: (i) take into account a variety of factors which would enable suitable
respondents to be found, (ii) expand networks, and (iii) explain the study thoroughly (see
table 4).
i.
them for the quota sample. Two main factors to considered are time of availability and
areas where many potential respondents lived. Since a respondent’s time was the obstacle
most frequently mentioned by interviewers, arranging appointments at times when
respondents had the most free time was the most frequently employed strategy. People
spots were usually chosen to be interviewed. Weekends, evening, and lunch time were
preferable times to conduct interviews for interviewers. “Conduct an interview at lunch
ii.
friends, and even the respondents themselves. “Contact families and friends who might
education or females aged above 50 years old.”
iii.
the study. For some respondents, a letter from the local authority was enough for them to
participate. For other respondents, explaining that the results of the study would be used
people in the future encouraged them to participate. “Explain slowly about the goals
2
28
Chapter 2
of this research in more concrete words, such as this survey is about health and will
measure the perceptions of Indonesian people about health and health problems. The
results will be used by the Indonesian government to create useful health policies. So
your participation is really valuable for the improvement of the healthcare system in
Indonesia.”
Interview process
data collection by stimulating them using various means, and by developing interviewer’s
personal skills. The majority of interviewers helped their respondents to complete interviews
by putting extra effort into the process of interviewing. This could involve: (i) giving additional
explanation or rephrasing the explanation in words that were easier to understand, (ii) asking
the respondent to imagine concrete examples of the question, (iii) guiding the respondent to
look in detail at each health state, (iv) reassuring the respondent about the implications of his/
in the DCE exercise, an interviewer did the following: “I helped my respondents to choose by
asking them to compare each dimension in life A and life B, not just to read it quickly and give
an answer.” With respect to the problem of religious beliefs, further explanation concerning
the nature of the TTO exercise, i.e. that this should be considered as a cognitive task, was quite
effective in reassuring some respondents. “I explained that this was research concerning his
opinions on a number of health states, not his prayer to God. My respondent then understood
and provided appropriate answers based on his opinions.”
Some interviewers chose to focus on their relationship with the respondent by talking
about other things (for instance family or work), encouraging him/her to continue, and praising
into an interview, usually about the respondent’s daily life.” In addition to working/training
with their respondents during interviews, some interviewers also developed their own skills
in order to improve the quality of their interviews, by additional reading and practice in order
to get used to the protocol and the software as quickly as possible. “After I get used to this
EQ-VT protocol and guideline, I can explain it better to the respondents.”
29
Employing quality control and feedback to the EQ-5D-5L valuation protocol
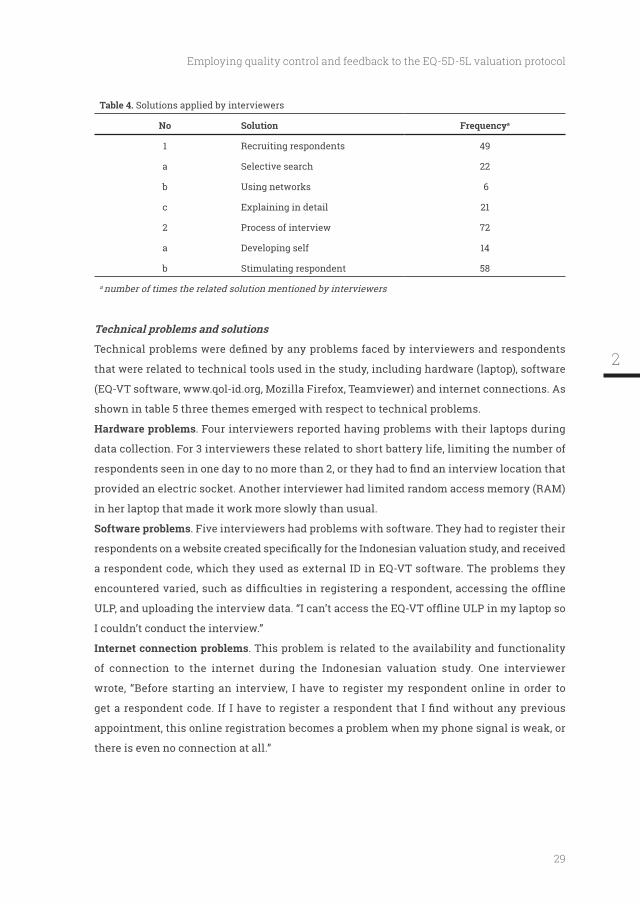
Table 4. Solutions applied by interviewers
No Solution Frequencya
1 Recruiting respondents 49
a Selective search 22
b Using networks 6
c Explaining in detail 21
2 Process of interview 72
a Developing self 14
b Stimulating respondent 58
a number of times the related solution mentioned by interviewers
Technical problems and solutions
that were related to technical tools used in the study, including hardware (laptop), software
shown in table 5 three themes emerged with respect to technical problems.
Hardware problems. Four interviewers reported having problems with their laptops during
data collection. For 3 interviewers these related to short battery life, limiting the number of
provided an electric socket. Another interviewer had limited random access memory (RAM)
in her laptop that made it work more slowly than usual.
Software problems. Five interviewers had problems with software. They had to register their
a respondent code, which they used as external ID in EQ-VT software. The problems they
I couldn’t conduct the interview.”
Internet connection problems. This problem is related to the availability and functionality
of connection to the internet during the Indonesian valuation study. One interviewer
wrote, “Before starting an interview, I have to register my respondent online in order to
appointment, this online registration becomes a problem when my phone signal is weak, or
there is even no connection at all.”
2
30
Chapter 2
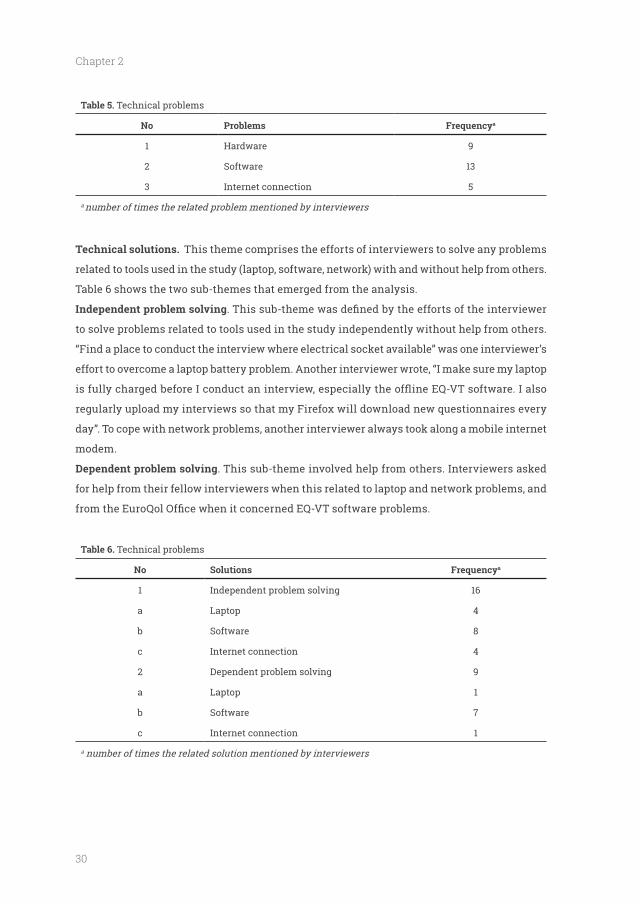
Table 5. Technical problems
No Problems Frequencya
1 Hardware 9
2 Software 13
3 Internet connection 5
a number of times the related problem mentioned by interviewers
Technical solutions. This theme comprises the efforts of interviewers to solve any problems
related to tools used in the study (laptop, software, network) with and without help from others.
Table 6 shows the two sub-themes that emerged from the analysis.
to solve problems related to tools used in the study independently without help from others.
“Find a place to conduct the interview where electrical socket available” was one interviewer’s
effort to overcome a laptop battery problem. Another interviewer wrote, “I make sure my laptop
regularly upload my interviews so that my Firefox will download new questionnaires every
day”. To cope with network problems, another interviewer always took along a mobile internet
modem.
. This sub-theme involved help from others. Interviewers asked
for help from their fellow interviewers when this related to laptop and network problems, and
Table 6. Technical problems
No Solutions Frequencya
1 Independent problem solving 16
a Laptop 4
b Software 8
c Internet connection 4
2 Dependent problem solving 9
a Laptop 1
b Software 7
c Internet connection 1
a number of times the related solution mentioned by interviewers
31
Employing quality control and feedback to the EQ-5D-5L valuation protocol
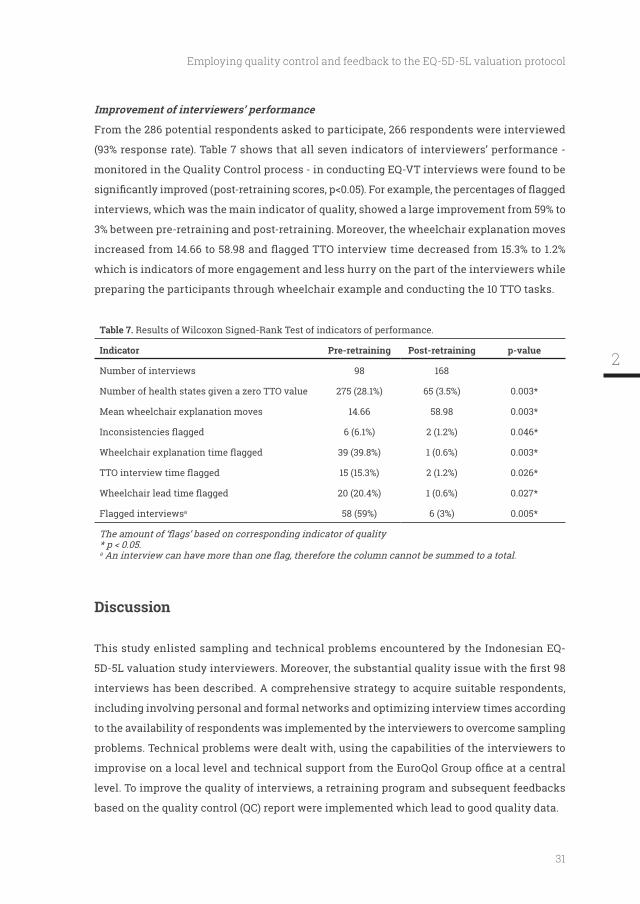
Improvement of interviewers’ performance
From the 286 potential respondents asked to participate, 266 respondents were interviewed
(93% response rate). Table 7 shows that all seven indicators of interviewers’ performance -
monitored in the Quality Control process - in conducting EQ-VT interviews were found to be
interviews, which was the main indicator of quality, showed a large improvement from 59% to
3% between pre-retraining and post-retraining. Moreover, the wheelchair explanation moves
which is indicators of more engagement and less hurry on the part of the interviewers while
preparing the participants through wheelchair example and conducting the 10 TTO tasks.
Table 7. Results of Wilcoxon Signed-Rank Test of indicators of performance.
Indicator p-value
Number of interviews 98 168
275 (28.1%) 65 (3.5%) 0.003*
Mean wheelchair explanation moves 14.66 58.98 0.003*
6 (6.1%) 2 (1.2%) 0.046*
39 (39.8%) 1 (0.6%) 0.003*
15 (15.3%) 2 (1.2%) 0.026*
20 (20.4%) 1 (0.6%) 0.027*
Flagged interviewsa 58 (59%) 6 (3%) 0.005*
a
Discussion
This study enlisted sampling and technical problems encountered by the Indonesian EQ-
interviews has been described. A comprehensive strategy to acquire suitable respondents,
to the availability of respondents was implemented by the interviewers to overcome sampling
problems. Technical problems were dealt with, using the capabilities of the interviewers to
level. To improve the quality of interviews, a retraining program and subsequent feedbacks
based on the quality control (QC) report were implemented which lead to good quality data.
2
32
Chapter 2
willing to participate in the study. Some participation problems have been mentioned in
the literature [21,22], although not with particular reference to TTO and DCE exercises. For
example, some respondents were anxious about their participation in our research. This
questions [23] or had minimal knowledge of what would happen [24]. Being well-prepared
and having a good ability to establish rapport as an interviewer are known to be essential
to reduce respondents’ levels of anxiety [24]. Respondents also prefer interviewers that they
know [25], have similar characteristics to them [26], and use their preferred language [27].
Solutions applied by the interviewers in this study, such as involving personal networks and
explaining informed consent in simple, easy-to-understand words, were effective in coping
availability with the interviewer’s schedule in terms of time and place. Choosing a time most
suitable for the respondent to be focused on the interview and a comfortable location that is
convenient, are vital in ensuring an optimal interview process [24]. It turned out that some
until the category was full at the aggregate sample level. Evidently, given possible interviewer
category of subjects. In our study, this exclusive interviewing was not the case.
The second problem was to conduct an interview that followed the essential parts of the
protocol but was adaptive enough to help respondents complete the interview. Respondents
problem, interviewers’ interviewing and communication skills play important roles [24]. This
study’s interviewers had some training in interviewing skills during their Bachelor’s degrees
the start of the valuation study. Attentive listening and ability to direct interviews using
various means are essential to keep respondents focused on their tasks [28]. Asking questions
to stimulate the thought process, especially in the TTO section of the interview, and giving
examples that closely relate to a respondent’s experiences are effective interview tools [26].
This study found that the interviewers struggled to implement the standard valuation
was also reported by Papadimitropoulos et al. [10] in the United Arab Emirates, in which
their interviewers were from a market research agency. Their recommendation was to
33
Employing quality control and feedback to the EQ-5D-5L valuation protocol
train academic researchers in health state valuation and state preference methods in order
to increase the availability of skillful interviewers. Tasks such as TTO and DCE have high
cognitive burdens. The presence of experienced interviewers is essential in ensuring the
validity of such tasks. This means that the training of interviewers plays an important role
in assuring data quality [19]. To meet these criteria, we hired interviewers with academic
backgrounds related to the topic of quality of life such as Psychology, Management,
Development Communication, and Economics. To equip interviewers with the relevant
knowledge of health state valuation and stated preference methods, we conducted one-day
training sessions before commencing the study where interviewers learned about the basic
concept of quality of life and its measurement. They also learned about how to value quality of
life, in this case by using the TTO and DCE approaches. Time and tools for interviewers were
provided to practice using EQ-5D-5L valuation software and protocols. Nevertheless, we still
encountered the same problem as in UAE regarding protocol compliance. When the initial
was conducted. This program and a series of QC reports and feedback led to higher compliance
and wheelchair moves. We can expect that this protocol compliance problem will emerge in
any valuation study regardless of the interviewers’ background characteristics; hence the
training and consistent feedback.
Indonesia is a country where religious belief plays a big role in its residents’ lives [29].
the TTO questions, especially with respect to ‘instant death’ and ‘worse-than-dead.’ [10,30]. It
was believed that ‘words are prayer’ which resulted in hesitation or even rejection in choosing
the instant death and worse-than-dead answers. Some respondents even withdrew from
the interview during the worse-than-dead explanation in the wheelchair example due to
this belief. Similar problem was reported by researchers from United Arab Emirates (UAE),
Malaysia and Singapore [10,30,31]. This issue is less problematic during valuation studies
in more secular countries in the western hemisphere such as the United Kingdom and The
Netherlands [2,5]. Interviewers have to ensure the cultural safety of research participants, i.e.
by taking their religious beliefs into account [32]. Therefore, we expect similar will happened
during valuation study in the countries where Islam is the majority religion or in the Islamic
subset of a population. A solid rapport and various strategies, such as further explanation,
rephrasing the explanation in words that were easier to understand, and stressing the goals
2
34
Chapter 2
of emotional responses, proved effective enough to handle this situation.
and the quality of the data collected in a valuation of EQ-5D-5L. Furthermore, this study
comprehensively describes the problems and solutions of interviewers and respondents in
performing TTO and DCE tasks, as well as technical and methodological issues. Finally, several
possible solutions and their impact on the quality of the interviews also provided. The lessons
learned from this study could serve as examples discussed in the initial training of EQ-5D-5L
valuation study.
Several limitations of this study should be considered. First, the study shows that a QC
data collected. However, this was a formal process and focused on several objective indicators,
such as consistency, duration, etc., which did not take into account what was actually said, let
alone the non-verbal interaction between interviewer and respondent. Nevertheless, it was
Second, respondent recruitment might raise questions about the objectivity/
representativeness of the study sample since one of the solutions employed was to use
personal networks related to the respondents. This might have entailed some bias in terms
categories in the quota sampling. This was because the quotas were determined on those
respect, we have constructed a representative sample. Nevertheless, a limitation could be that
the sample might be in part the networks of the interviewers. It remains to be seen whether
this is a problem.
Third, it is not known what kind of problems were associated with those who did not want
to participate, i.e. 20 people out of 286 asked to participate.
municipal administrations (kabupaten) as rural in no way represented the characteristics
of a rural area. They were Jatinangor where Universitas Padjadjaran is located and Depok
Sleman where Universitas Gadjah Mada is located. Respondents from these two areas were,
35
Employing quality control and feedback to the EQ-5D-5L valuation protocol
Fifth, the interviewers’ improvement analysis was based upon data from 266 respondents,
25% of the targeted number of respondents. It may thus be wondered how representative the
problems discovered were for the complete sample, as this 25% were in particular young,
relatively well-educated and urban respondents. Of the 266 respondents, only 39 elderly
respondents (14.6%), 5 low-educated respondents (1.8%), and 53 rural respondents (19.9%) were
interviewed. Hence it could be stated that the interviewers started with an easy, smart and
‘well behaved’ sample. One can question whether this a problem, or an advantage. It can be
trained. Indeed, we would recommend commencing with the easy interviews and moving on
Sixth, all interviews were conducted in 3 cities on Java island, even though some
ethnicities interviewed were not originally from Java (e.g. Sumatera, Bali, Madura, and
Sulawesi). We do not know whether different problems, such as language barrier, would
emerge if the interviews were to be conducted in the home towns of these ethnicities.
Seventh, the interviewers were asked about their problems and solutions during the
interview by the researchers, who was also the person who hired them and evaluate their
discussion during feedback sessions as positive, open, and equal, we think that we have
been as careful as possible in that respect. The interviewers’ feedback to the researchers at
the end of valuation study data collection showed the same conclusion.
Lastly, the retrospective character of the study, in which the interviewers received the
questionnaire at a later date, might have been liable to recall bias and led to the omission of
some information.
Recommendations
Given the limitations of this study, there are some suggestions for future research. Regarding
the method of controlling the quality of interviewers’ performances, it would be better to put the
interviews from a small representative sample of interviewers before and after the retraining
program on video to establish which elements of the retraining yielded improvement.
Interviewers should be asked to note the problems occurring whilst interviewing immediately
instead of at a later date. Recruiting more elderly, more lower-educated, and more rural
categories of respondents. In order to avoid disappointment and frustration in the research
2
36
Chapter 2
feedback and to ensure good quality subsequently. Evidently such a pilot phase for each
interviewer would increase costs, but it would reduce the costs associated with modelling
low-quality data. This leads to a recommendation to limit the number of interviewers, in order
the problems and solutions encountered during valuation studies should also incorporated
in future interviewer training manuals.
Conclusion
standard EQ-5D-5L valuation protocol. Moreover, substantial quality issues in the interviews
process have been described. Sampling problems could be overcome by a comprehensive
respondents. Quality issues in the interview could be dealt with using feedback from the
QC report, a comprehensive training program, and increased supervision at the start of, and
during the study. If the interviewers were to become more engaged in the research, the quality
of the interviews should improve. We recommend limiting the number of interviewers and
relying on academically-skilled interviewers who could be expected to fully understand the
of data collection.
This study was funded by EuroQol Research Foundation (grant no 2013240)
Ethical approval: All procedures performed in studies involving human participants were in accordance
with the ethical standards of the institutional and/or national research committee and with the 1964
Helsinki declaration and its later amendments or comparable ethical standards
Informed consent: Informed consent was obtained from all individual participants included in the study.
37
Employing quality control and feedback to the EQ-5D-5L valuation protocol
References
1. Herdman, M., Gudex, C., Lloyd, A., Janssen, M., Kind, P., Parkin, D., et al. (2011). Development
version of EQ-5D (EQ-5D-5L). Quality of Life Research, 20(10), 1727-1736, doi:10.1007/s11136-011-9903-x.
2. Devlin, N., Shah, K., Feng, Y., Mulhern, B., & van Hout, B. (2015). Valuing health-related quality of life: an EQ-5D-5L value set for England. OHE Research Paper.
3. Xie, F., Pullenayegum, E., Gaebel, K., Bansback, N., Bryan, S., Ohinmaa, A., et al. (2015). A Time Trade-off-derived Value Set of the EQ-5D-5L for Canada. Medical Care.
4.
An EQ-5D-5L value set based on Uruguayan population preferences. Quality of Life Research.
5. Versteegh, M. M., Vermeulen, K. M., Evers, S. M. A. A., de Wit, G. A., Prenger, R., & Stolk, E. A. (2016). Dutch Tariff for the Five-Level Version of EQ-5D. Value in Health, 19(4), 343-352, doi:10.1016/j.jval.2016.01.003.
6. Kim, S. H., Ahn, J., Ock, M., Shin, S., Park, J., Luo, N., et al. (2016). The EQ-5D-5L valuation study in Korea. Quality of Life Research, 25(7), 1845-1852, doi:10.1007/s11136-015-1205-2.
7. Ikeda, S., Shiroiwa, T., Igarashi, A., Noto, S., Fukuda, T., Saito, S., et al. (2015). Developing a Japanese version of the EQ-5D-5L value set (inJapanese). . J Natl Inst Public Health, 64, 47-55.
8. Oppe, M., Devlin, N. J., van Hout, B., Krabbe, P. F., & de Charro, F. (2014). A program of methodological research to arrive at the new international EQ-5D-5L valuation protocol. Value in Health, 17(4), 445-453, doi:10.1016/j.jval.2014.04.002.
9. Edelaar-Peeters, Y., Stiggelbout, A. M., & Van Den Hout, W. B. (2014). Qualitative and Quantitative Analysis of Interviewer Help Answering the Time Tradeoff. Medical Decision Making, 34(5), 655-665, doi:10.1177/0272989x14524989.
10. I., Katsaiti, M.S., Shah, K.K., Devlin, N.J. (2015). An Investigation of the Feasibility and Cultural Appropriateness of Stated Preference Methods to Generate EQ-5D-5L Values in the United Arab Emirates In O. o. H. E. (OHE) (Ed.).
11. Shah, K. K., Lloyd, A., Oppe, M., & Devlin, N. J. (2013). One-to-one versus group setting for conducting computer-assisted TTO studies:
the Netherlands. Eur J Health Econ, 14 Suppl 1, S65-73, doi:10.1007/s10198-013-0509-9.
12. Xie, F., Gaebel, K., Perampaladas, K., Doble, B., & Pullenayegum, E. (2014). Comparing EQ-5D valuation studies: a systematic review and methodological reporting checklist. Medical Decision Making, 34(1), 8-20, doi:10.1177/0272989x13480852.
13. Bansback, N., Hole, A. R., Mulhern, B., & Tsuchiya, A. (2014). Testing a discrete choice experiment including duration to value health states for large descriptive systems: addressing design and sampling issues. Social Science and Medicine, 114, 38-48, doi:10.1016/j.socscimed.2014.05.026.
14. M., & Devlin, N. J. (2013). Lead versus lag-time trade-off variants: does it make any difference? Eur J Health Econ, 14 Suppl 1, S25-31, doi:10.1007/s10198-013-0505-0.
15. Luo, N., Cheung, Y. B., Ng, R., & Lee, C. F. (2015). Mapping and direct valuation: Do they give equivalent EQ-5D-5L index scores? Health Qual Life Outcomes, 13(1).
16. van Hout, B., Janssen, M. F., Feng, Y. S., Kohlmann, T., Busschbach, J., Golicki, D., et al. (2012). Interim scoring for the EQ-5D-5L: mapping the EQ-5D-5L to EQ-5D-3L value sets. Value in Health, 15(5), 708-715, doi:10.1016/j.jval.2012.02.008.
17. Ramos-Goni, J. M., Pinto-Prades, J. L., Oppe, M., Cabases, J. M., Serrano-Aguilar, P., & Rivero-Arias, O. (2014). Valuation and Modeling of EQ-5D-5L Health States Using a Hybrid Approach. Medical Care, doi:10.1097/mlr.0000000000000283.
18. Morgan, D. L. (2006). Quota Sampling. The Sage Encyclopedia of Qualitative Research Methods. SAGE Publications, Inc. Thousand Oaks, CA: SAGE Publications, Inc.
19. Janssen, B. M., Oppe, M., Versteegh, M. M., & Stolk, E. A. (2013). Introducing the composite time trade-off: a test of feasibility and face validity. Eur J Health Econ, 14 Suppl 1, S5-13.
20. Braun, V., & Clarke, V. (2006). Using thematic analysis in psychology. Qualitative Research in Psychology, 3, 77–101, doi:10.1191/ 1478088706qp063oa.
21. Galea, S., & Tracy, M. (2007). Participation rates in epidemiologic studies. Annals of Epidemiology, 17(9), 643-653.
2
38
Chapter 2
22. Slegers, C., Zion, D., Glass, D., Kelsall, H., Fritschi, L., Brown, N., et al. (2015). Why do people participate in epidemiological research? J Bioeth Inq, 12(2), 227-237.
23.
Response Technique. In M. J. Houston (Ed.), NA - Advances in Consumer Research 1988 (Vol. 15, pp. 595-599): Association for Consumer Research
24. Birks, M. J., Chapman, Y., & Francis, K. (2007). Breaching the wall: interviewing people from other cultures. Journal of Transcultural Nursing, 18(2), 150-156, doi:10.1177/1043659606298617.
25. Kaiser, W., Burow, S., Dahms, M., Lund, H., Nast, J., & Zindel, K. (1998). [Interviewer effects in assessing subjective quality of life and satisfaction with care in sheltered housing]. Psychiatrische Praxis, 25(3), 142-148.
26. Kroeger, A. (1983). Health interview surveys in developing countries: a review of the methods and results. International Journal of Epidemiology, 12(4), 465-481.
27. Fryer, C., Mackintosh, S., Stanley, M., & Crichton, J. (2012). Qualitative studies using in-depth interviews with older people from multiple language groups: methodological systematic review. Journal of Advanced Nursing, 68(1), 22-35, doi:10.1111/j.1365-2648.2011.05719.x.
28. Patton, M. Q. (2002). Qualitative research & evaluation methods (3rd ed). Thousand Oaks, CA: SAGE Publications, Inc.
29. Sallquist, J., Eisenberg, N., French, D. C., Purwono, U., & Suryanti, T. A. (2010). Indonesian adolescents' spiritual and religious experiences and their longitudinal relations with socioemotional functioning. Developmental Psychology, 46(3), 699-716, doi:10.1037/a0018879.
30. Wee, H. L., Li, S. C., Xie, F., Zhang, X. H., Luo, N., Feeny, D., et al. (2008). Validity, feasibility and acceptability of time trade-off and standard gamble assessments in health valuation studies: a study in a multiethnic Asian population in Singapore. Value in Health, 11 Suppl 1, S3-10.
31. Estimating an EQ-5D value set for Malaysia using time trade-off and visual analogue scale methods. Value in Health, 15(1 Suppl), S85-90.
32. C. (2008). Challenges and approaches to newcomer health research. Journal of Transcultural Nursing, 19(1), 64-73, doi:10.1177/1043659607309142.
39
Employing quality control and feedback to the EQ-5D-5L valuation protocol
2

Test-retest reliability of EQ-5D-5L valuation techniques: the composite time trade-off and discrete choice experiments
Published as: Purba, F. D., Hunfeld, J. A. M., Timman, R., Iskandarsyah, A., Fitriana, T. S.,
Sadarjoen, S. S., Passchier, J., Busschbach, J. J. V.. Test-Retest Reliability of EQ-5D-5L
Valuation Techniques: The Composite Time Trade-Off and Discrete Choice Experiments.
Value in Health, doi:10.1016/j.jval.2018.02.003 (in press)
42
Chapter 3
Abstract
OBJECTIVES: To explore the test–retest reliability of the Composite time trade-off (C-TTO) and
questionnaire (EQ-5D-5L) valuation study.
METHODS: A representative sample aged 17 and over was recruited from the Indonesian
Trained interviewers administered computer-assisted face-to-face interviews with the EQ
valuation technology (EQ-VT). Each respondent valued 10 health states using C-TTO and 7
pairs of health states in a DCE exercise. The retest interview was conducted after a 2-week by
the same interviewer. The Wilcoxon matched-pairs signed-rank test, intraclass correlation
data. For DCE, the analysis of proportions was used.
RESULTS: 226 respondents with characteristics similar to the Indonesian population
mean value differences between test and retest. The mean value of the second test was
identical. DCE retest showed a different pattern concerning the relative importance of the
dimensions, while the C-TTO remained the same.
CONCLUSIONS: C-TTO is stable over time, while in DCE the relative values of the dimensions
shift. The results support the use of the C-TTO, in particular the Indonesian EQ-5D-5L value
set and suggest a critical examination of the reliability of DCE results over time.
•
EQ-5D.
• Composite time trade-off (C-TTO) and discrete choice experiments (DCE) are the standard
elicitation techniques in the EQ-5D-5L valuation protocol
• We found little difference between the test-retest results of the C-TTO, which suggests
good reliability with respect to the EQ-5D-5L valuation exercise
• The DCE seems to show a shift in the relative values of the dimensions between the
interventions.
43
Test-retest reliability of EQ-5D-5L valuation techniques
Introduction
The EQ-5D-5L is a generic measure of health outcomes and comprises two parts: a descriptive
dimensions: mobility, self-care, usual activities, pain/discomfort, and anxiety/depression.
The - EQ-5D-5L version has 5 levels for each dimension: no problems, slight problems, moderate
problems, severe problems, and unable/extreme problems [1].
converted into an index score using a value set representing societal preferences [2,3]. This
value set is usually obtained using techniques such as the standard gamble (SG), time trade-off
(TTO) and discrete choice experiments (DCE). In 2014 the EuroQol Group developed a valuation
protocol for EQ-5D-5L, together with the EuroQol valuation Technology (EQ-VT) computer
this protocol, the ‘composite TTO’ (C-TTO) and DCE were the chosen elicitation techniques [4].
Several studies concluded that the clinical administration of the descriptive part of the
EQ-5D-5L was valid and reliable [5-11]. Three studies [12-14] evaluated the reliability of the
valuation techniques used to obtain value sets. This reliability could not be tested using
Cronbach's alpha, or any other ‘internal test’, as no questionnaire items related to the traits
of the respondent, instead the respondent valued health states. Hence reliability could only
be tested with to ‘test-retest reliability’. The reliability of the values elicitation technique is
care for budgeting decisions if the values provided by the respondent were to change over
time. Van Agt et al. [12] investigated test-retest reliability of value sets based on the EQ-VAS.
Badia et al. [13] used EQ-VAS and TTO, while Robinson [14] used TTO and PTO (Person Trade-
Off). All used the old 3-level version of EQ-5D, and in those days the valuation protocol was
found that the variability of the values was mostly due to differences between individuals and
differences between health states, while the variability attributable to the timing of the tests
variance between the states on the scale, and the variance between individual respondents,
which would diminish the variance between the test and the retest exercises. Multi-level
analysis would be more appropriate, as this could account for dependencies between health
state values provided by one respondent and the dependencies of the values of the test and
the retest exercises since they were also given by the same respondent. Moreover, we could
include an interviewer level, as interviewers have an effect on values [15]. Robinson’s study
3
44
Chapter 3
would overcome some of the problems just mentioned, but not all. Robinson also concluded
that the use of TTO for the valuation of EQ-5D-3L was highly reliable.
There is no published test-retest study for the new EQ-VT with respect to the new EQ-
5D-5L using C-TTO and DCE. Such a study would be timely, as the new EQ-VT protocol has
already been implemented in numerous valuation studies across the globe [16-23]. Therefore,
the objective of our study was to measure the test-retest reliability of C-TTO and DCE used in
the Indonesian EQ-5D-5L valuation study.
Methods
This study was part of a larger study that focused upon the Indonesian national valuation of
EQ-5D-5L, using a face-to-face setting. See the study report of this valuation study also for
details of the current test-retest study [23]. The study was approved by the Health Research
Ethics Committee, Faculty of Medicine, Padjadjaran University, Indonesia
Indonesian Bureau of Statistics [24]. Fourteen interviewers conducted interviews in 6 cities
and their surroundings, located in different parts of the country: Jakarta, Bandung, Jogjakarta,
Surabaya, Medan, and Makassar.
interview, based on completion time (e.g. more than two hours), verbally expressed comment(s)
indicating frustration, or frequent interruptions indicating tiredness. When these signs were
absent, the interviewer asked the respondent’s consent to be interviewed again (retest). The
interview was held by the same interviewer.
Valuation Interview Protocol
The valuation protocol (EQ-VT) consists of six components [4,25]
i. A general welcome and informed consent.
ii. Completion of the descriptive system page, the EQ-VAS, and background questions.
iii.
regarding the C-TTO tasks’
45
Test-retest reliability of EQ-5D-5L valuation techniques
iv.
regarding this task.
v. A round-up.
vi. Country-specific questionnaire: paper-and-pencil version of the World Health
Resilience Assessment Scale (FRAS)
assisted face-to-face interviews using the EQ-VT platform.
Composite Time Trade-Off (C-TTO)
The C-TTO exercise applied conventional TTO to obtain better-than-dead (BTD) values, and
lead-time TTO to obtain worse-than-dead (WTD) values (Appendix Figure A1). Details of the
C-TTO approach can be found in Oppe et al. [25] and Purba at al. [23].
The EuroQol valuation protocol included 86 EQ-5D-5L health states to be valued using
C-TTO. The 86 health states were distributed into 10 blocks with a similar level of severity. Each
block contained 8 unique EQ-5D-5L health states, plus 1 very mild state (i.e. only 1 dimension
at level 2 and all others at level 1, e.g.: ‘11112’) plus the most severe/’pits’ state (‘55555’) [4].
Respondents were randomly assigned to one of the 10 C-TTO blocks. Each state in the block
was presented in random order to respondents.
Discrete Choice Experiments (DCE)
DCE tasks were conducted by presenting 2 health states and asking the respondent to select
the preferred state (Appendix Figure A2). The DCE design consisted of 196 pairs of EQ-5D-5L
health states distributed over 28 blocks, each consisting of 7 pairs with similar severity. The
was given one block of DCE tasks to complete.
Statistical analysis
general population using percentages for discrete variables and data from the Indonesian
Bureau of Statistics [24].
respondent perspective and the health states perspective, and also at an aggregate level,
employing pooled data.
3
46
Chapter 3
in the mean of 10 health states values given by each respondent at test and retest applying
Wilcoxon matched-pairs signed-rank tests. For the health state perspective analysis, three
86 health states valued by applying the Wilcoxon matched-pairs signed-rank test. Second,
agreement) of each health state. We applied the following reliability guideline for the strength
investigated the proportions of respondents per health state who were consistent in choosing
a better-than-dead (positive) value or worse-than-dead (negative) value between the two tests.
multilevel regression analysis to deal with the dependency in the data. On the one hand, the
two test times (test and retest) were nested within respondents and respondents were nested
within interviewers, on the other hand, the two test times were nested within health states.
However, the health states were not nested within interviewers or within respondents or the
other way around. Hence, we could not perform one analysis that included all four: i.e. two
test times, respondents, interviewers, and health states. Instead, we performed a three-level
model analysis and a two-level model analysis. The three-level model included the two tests
as the lower level, the respondents as the middle level and the interviewers as the upper level,
whereas the two-level model included the two tests as the lower level and the health states as
the upper level. The necessity to include the levels was determined by the deviance statistic,
using restricted maximum likelihood [27]. The dependent variable was the C-TTO value given
displayed by a respondent. For the pair of health states perspective, we calculated the
proportion of consistent choices of the 196 DCE pairs completed twice by the respondents.
in a pair was also investigated. The severity level difference was calculated using the severity
level of the health state A minus the severity level of health state B in a pair, for example, the
severity level difference of pair 153 (‘22123’ vs ‘11155’) was -3 (10-13).
Tobit model, the DCE data with conditional logit, and a combination of the two datasets with a
47
Test-retest reliability of EQ-5D-5L valuation techniques
Hybrid model. This last model was used in the national Indonesian valuation study and details
of this approach can be found in work by Purba et al. [23]. The three models used 20 dummy
variables representing levels 2, 3, 4 and 5 for each dimension: mobility (MO), self-care (SC),
usual activities (UA), pain/discomfort (PD) and anxiety/depression (AD), was implemented.
The level 1 (no problems) served as the reference level. Thus, MO4 meant the utility decrement
the relative importance attributed to the EQ-5D dimensions. A similar approach was applied
by Rand-Hendriksen et al. [28]. The relative utility decrements between each of the 5 levels
dimensions, e.g. the sum of the level 2s of all dimensions. Second, we divided the sum of each
Whether the change in respondents’ own health affected their valuation scores (C-TTO)
was checked by taking the following steps: (i) transforming respondents’ self-reported health
states into index scores using the Indonesian value set[23] at the two measurements points,
then calculating the differences, (ii) calculating the change in the mean of the 10 health state
values given by each respondent in the C-TTO test and retest, (iii) checking their associations
with Spearman’s rho test.
Results
From 227 respondents who completed the test-retest exercises, 1 respondent was excluded
because of technical error: he received different C-TTO and DCE block of health states. Thus,
second interviews was 19.90 days (SD= 9.32; range: 10-59). The characteristics of the test-retest
respondents were similar to those of the Indonesian general population in terms of residence,
gender and age (Table 1). The respondents reported small problems in understanding the tasks
3
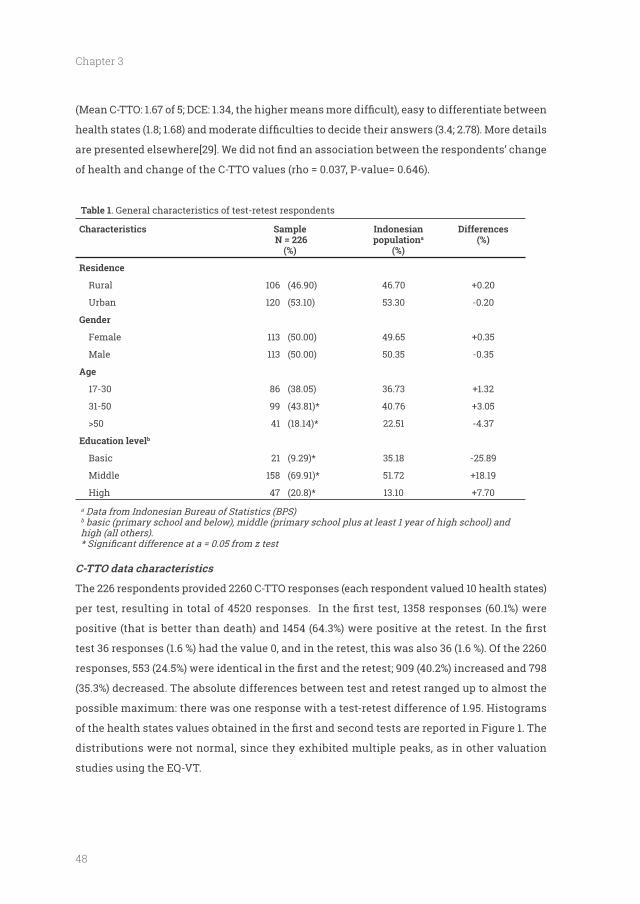
48
Chapter 3
of health and change of the C-TTO values (rho = 0.037, P-value= 0.646).
Table 1. General characteristics of test-retest respondents
Characteristics Sample N = 226
(%)
Indonesian populationa
(%)
Differences (%)
Residence
Rural 106 (46.90) 46.70
Urban 120 (53.10) 53.30 -0.20
Gender
Female 113 (50.00) 49.65
Male 113 (50.00) 50.35 -0.35
17-30 86 (38.05) 36.73
31-50 99 (43.81)* 40.76
41 (18.14)* 22.51 -4.37
Education levelb
Basic 21 (9.29)* 35.18 -25.89
Middle 158 (69.91)* 51.72
High 47 (20.8)* 13.10
a Data from Indonesian Bureau of Statistics (BPS)b basic (primary school and below), middle (primary school plus at least 1 year of high school) and high (all others).
C-TTO data characteristics
The 226 respondents provided 2260 C-TTO responses (each respondent valued 10 health states)
test 36 responses (1.6 %) had the value 0, and in the retest, this was also 36 (1.6 %). Of the 2260
(35.3%) decreased. The absolute differences between test and retest ranged up to almost the
possible maximum: there was one response with a test-retest difference of 1.95. Histograms
distributions were not normal, since they exhibited multiple peaks, as in other valuation
studies using the EQ-VT.
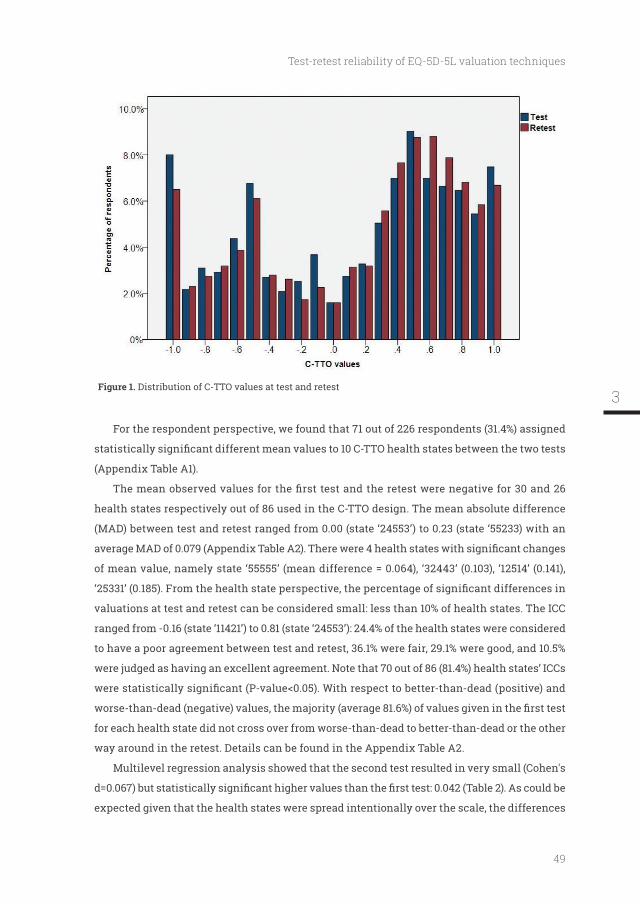
49
Test-retest reliability of EQ-5D-5L valuation techniques
Distribution of C-TTO values at test and retest
For the respondent perspective, we found that 71 out of 226 respondents (31.4%) assigned
(Appendix Table A1).
health states respectively out of 86 used in the C-TTO design. The mean absolute difference
(MAD) between test and retest ranged from 0.00 (state ‘24553’) to 0.23 (state ‘55233) with an
of mean value, namely state ‘55555’ (mean difference = 0.064), ‘32443’ (0.103), ‘12514’ (0.141),
valuations at test and retest can be considered small: less than 10% of health states. The ICC
ranged from -0.16 (state ‘11421’) to 0.81 (state ‘24553’): 24.4% of the health states were considered
to have a poor agreement between test and retest, 36.1% were fair, 29.1% were good, and 10.5%
were judged as having an excellent agreement. Note that 70 out of 86 (81.4%) health states’ ICCs
for each health state did not cross over from worse-than-dead to better-than-dead or the other
way around in the retest. Details can be found in the Appendix Table A2.
Multilevel regression analysis showed that the second test resulted in very small (Cohen's
expected given that the health states were spread intentionally over the scale, the differences
3
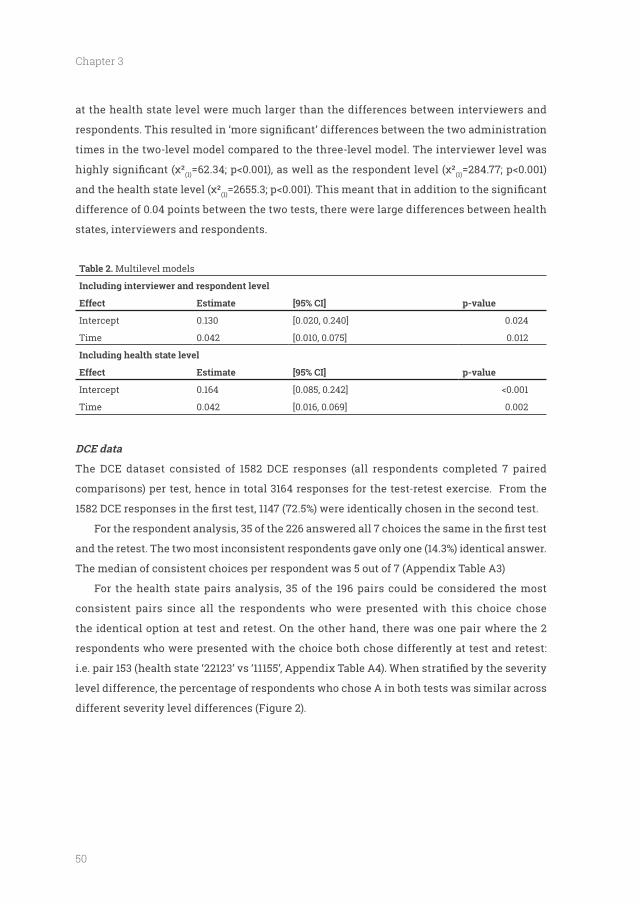
50
Chapter 3
at the health state level were much larger than the differences between interviewers and
times in the two-level model compared to the three-level model. The interviewer level was
(1) (1)
(1)
difference of 0.04 points between the two tests, there were large differences between health
states, interviewers and respondents.
Table 2. Multilevel models
Effect Estimate [95% CI] p-value
Intercept 0.130 [0.020, 0.240] 0.024
Time 0.042 [0.010, 0.075] 0.012
Effect Estimate [95% CI] p-value
Intercept 0.164 [0.085, 0.242]
Time 0.042 [0.016, 0.069] 0.002
DCE data
The DCE dataset consisted of 1582 DCE responses (all respondents completed 7 paired
comparisons) per test, hence in total 3164 responses for the test-retest exercise. From the
and the retest. The two most inconsistent respondents gave only one (14.3%) identical answer.
The median of consistent choices per respondent was 5 out of 7 (Appendix Table A3)
For the health state pairs analysis, 35 of the 196 pairs could be considered the most
consistent pairs since all the respondents who were presented with this choice chose
the identical option at test and retest. On the other hand, there was one pair where the 2
respondents who were presented with the choice both chose differently at test and retest:
level difference, the percentage of respondents who chose A in both tests was similar across
different severity level differences (Figure 2).
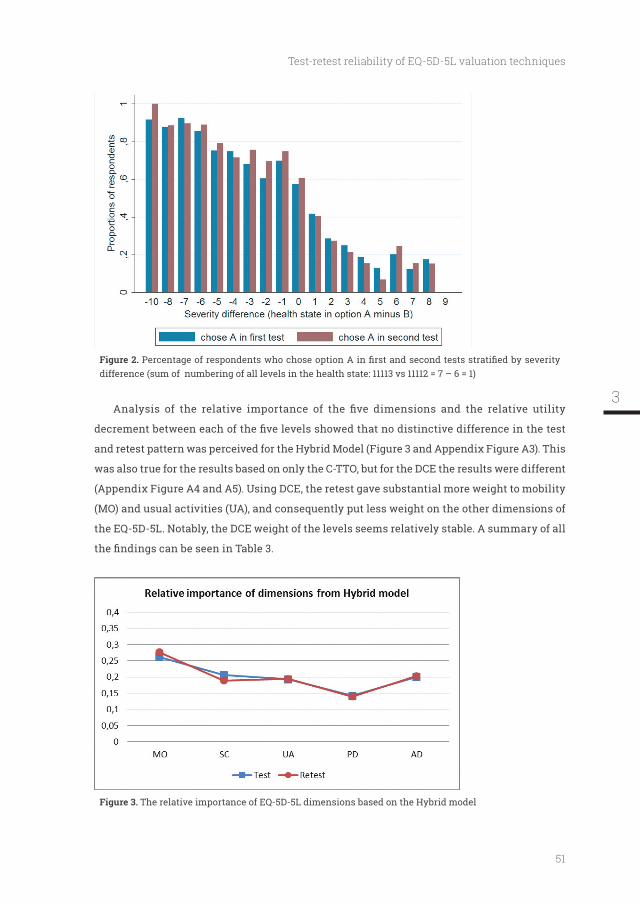
51
Test-retest reliability of EQ-5D-5L valuation techniques
difference (sum of numbering of all levels in the health state: 11113 vs 11112 = 7 – 6 = 1)
and retest pattern was perceived for the Hybrid Model (Figure 3 and Appendix Figure A3). This
was also true for the results based on only the C-TTO, but for the DCE the results were different
(Appendix Figure A4 and A5). Using DCE, the retest gave substantial more weight to mobility
(MO) and usual activities (UA), and consequently put less weight on the other dimensions of
the EQ-5D-5L. Notably, the DCE weight of the levels seems relatively stable. A summary of all
The relative importance of EQ-5D-5L dimensions based on the Hybrid model
3
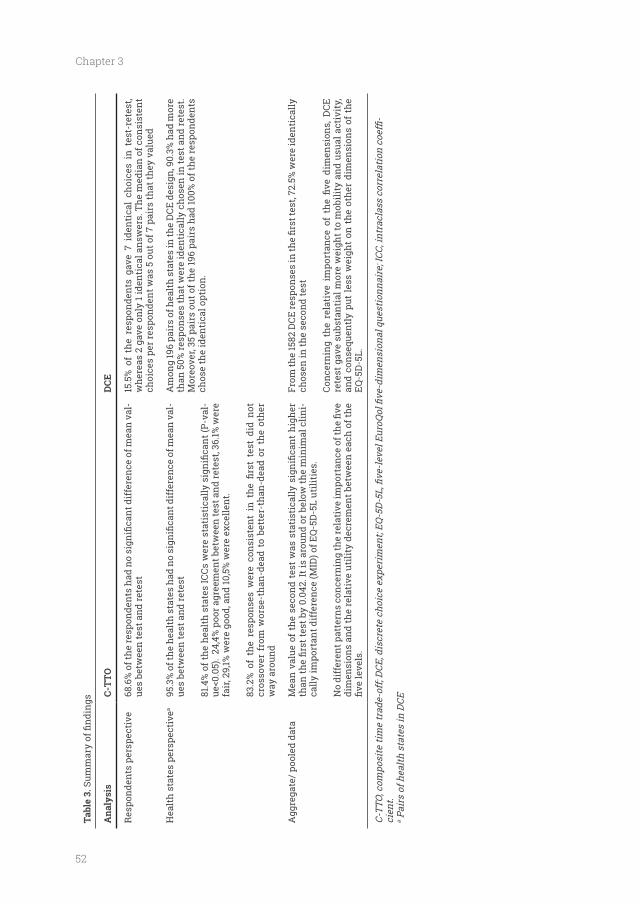
52
Chapter 3
Tabl
e 3.
Ana
lysi
sC-
TTO
DCE
Res
pond
ents
per
spec
tive
-ue
s be
twee
n te
st a
nd re
test
15.5
% o
f th
e re
spon
dent
s ga
ve 7
ide
ntic
al c
hoic
es i
n te
st-r
etes
t, w
here
as 2
gav
e on
ly 1
iden
tica
l ans
wer
s. T
he m
edia
n of
con
sist
ent
choi
ces
per r
espo
nden
t was
5 o
ut o
f 7 p
airs
that
they
val
ued
Hea
lth
stat
es p
ersp
ecti
vea
-ue
s be
twee
n te
st a
nd re
test
-
fair
, 29,
1% w
ere
good
, and
10,5
% w
ere
exce
llent
.
cros
sove
r fr
om w
orse
-tha
n-de
ad t
o be
tter
-tha
n-de
ad o
r th
e ot
her
way
aro
und
Am
ong
196
pair
s of
hea
lth
stat
es in
the
DCE
des
ign,
90.
3% h
ad m
ore
than
50%
resp
onse
s th
at w
ere
iden
tica
lly c
hose
n in
test
and
rete
st.
Mor
eove
r, 35
pai
rs o
ut o
f the
196
pair
s ha
d 10
0% o
f the
resp
onde
nts
chos
e th
e id
enti
cal o
ptio
n.
Agg
rega
te/ p
oole
d da
ta
-ca
lly im
port
ant d
iffe
renc
e (M
ID) o
f EQ
-5D
-5L
utili
ties
.
dim
ensi
ons
and
the
rela
tive
uti
lity
decr
emen
t bet
wee
n ea
ch o
f the
chos
en in
the
seco
nd te
st
rete
st g
ave
subs
tant
ial m
ore
wei
ght t
o m
obili
ty a
nd u
sual
act
ivit
y,
and
cons
eque
ntly
put
less
wei
ght
on t
he o
ther
dim
ensi
ons
of t
he
EQ-5
D-5
L.
-ci
ent.
a Pai
rs o
f hea
lth s
tate
s in
DCE
53
Test-retest reliability of EQ-5D-5L valuation techniques
Discussion
We studied the test-retest of the EQ-VT in 226 respondents representative for the Indonesian
population. For C-TTO, it was shown that 68.6% of the respondents and 95.3% of the health
states displayed no different values between the two tests, although the overall mean was
0.042 higher in the retest. For DCE, 72.5% of the responses were identical. No different pattern
was found for the C-TTO and Hybrid Model between test-retest. DCE results showed that
mobility and usual activity were given more weight in the retest. The DCE weight of the levels
seems relatively stable.
Several limitations of this study should be considered. First, we only did a retest in
population. Indeed, as the retest population is of a higher educational level, one can expect that
our results have a bias to favourable test-retest variation compared with “real-life” valuations.
second measurement. As values of hypothetical health states related to own health states,
Third, 143 (6.33%) out of 2260 responses were considered highly inconsistent, that is, they
had absolute value differences between both tests in the range 1.00-1.95: 10 years to 19.5 years
in the 20 years C-TTO time-frame. It could be argued that this was the result of interactions
respondents (different socio-demographic backgrounds). With respect to the health states,
Descriptive analysis of the 143 inconsistent values showed that two-thirds were recorded
spread across socio-demographic characteristics: residence, gender, and age groups, which
made the interviewer an important additional source of variance. The possible interaction
between health state valuations, interviewers and respondents might not be completely
avoidable. However, extensive use of the quality control report component of EQ-VT, training
and retraining programs, and continuous individual feedback could be effective in reducing
resulting in high quality data [29].
reliability of the current 5 level version of the EQ-5D and the new standard EQ-VT valuation
study design. We found that C-TTO was consistent over time which is in line with previous
3
54
Chapter 3
studies of the 3-level version [13,14]. Moreover, the average value of the retest data was 0.042
also shown by other studies using TTO [14]. The fact that this small difference was statistically
observations. The value 0.042 was around or below the minimal clinically important difference
(MID) of EQ-5D-5L utilities. For instance, McClure et al., found MID was between 0.037 and 0.069
for valuation studies, depending on the country [30]. The patient-based MCIDs were 0.05 (COPD
patients) and 0.10 (stroke patients) [31,32]. Whether the MID is a valid yardstick to compare
test-rest against remains unclear. Indeed, MID has limited relevance in cost-effectiveness
to the judgment of the individual patient. In any case, a 4% upwards shift of the values in the
retest seems something to be acknowledged. One explanation for the higher C-TTO value in
the second test could be an adaptation to the stimulus of the health state. Another might be
that respondents adapted to the process. Perhaps the respondents were gaining experience
life-years’. This would be similar to patients who have already adapted to their ‘illness’ and
thus placed higher values on impaired health states [33]. Another explanation could be that
point of equivalence, i.e. clicked the button ‘life A and life B are about the same’ faster. Hence,
they did not explore more iteration steps and the values obtained were higher. We indeed
Second, we found that the DCE showed a different pattern concerning the relative
importance of the dimensions resulting in quite different values for the health states in test-
retest. The different pattern was not observed in C-TTO and Hybrid model. It appears that
DCE is a less reliable method compared to C-TTO (using the quality control as employed in
this investigation) in terms of test-retest reliability when it is implemented in health state
presented a head-to-head comparison between the test-retest of DCE and TTO. The low test-
retest validity of DCE found in this investigation has implications for the implementation of
DCE. Given this evidence that DCE values change over time (while the C-TTO remains stable), it
questions whether we can rely on DCE in health state valuations. Indeed, in TTO large progress
in quality control is made, while in DCE such quality control is not yet implementing, at least
not on the scale as done in this study. We might have been misguided by the relatively simple
55
Test-retest reliability of EQ-5D-5L valuation techniques
dimensions with a remaining life time in full health. Full health will always be the same,
which assures that the respondent ‘only’ has to deal with the changing 5 dimensions and
life time. In DCE the respondent compares two health states, each with 5 dimensions, and all
these 10 dimensions can be different in every comparison. This cognitive task might be more
complex than TTO, resulting in less reliable results. Note that from the number of consistent
choices: i.e. 72.5% of 1582 responses were identically chosen between the two interviews, one
could conclude that DCE is reliable. But when looking at the consequences of the weight of
the dimensions, the results are less favorable. Our conclusion is that the enthusiasm with
which DCE is employed in health state valuations should be critically examined, given that
the results of DCE differ over time.
Conclusion
found an upwards shift of about 4% in C-TTO data. Moreover, in DCE there also seems to
be a shift in the relative values of the dimensions between the two time of administration.
Especially the last is concerning, as this will change the ranking of health states, and thus
the C-TTO and DCE together (the Hybrid Model) the results are much more stable, and little
difference can be seen in the relative dimensions and levels. This supports the use of the C-TTO
values and the combination of C-TTO and DCE in values sets, in particular, the Indonesian
EQ-5D-5L value set. Our investigation suggests a critical examination of DCE, as test-retest
seems to change the ranking of health states.
3
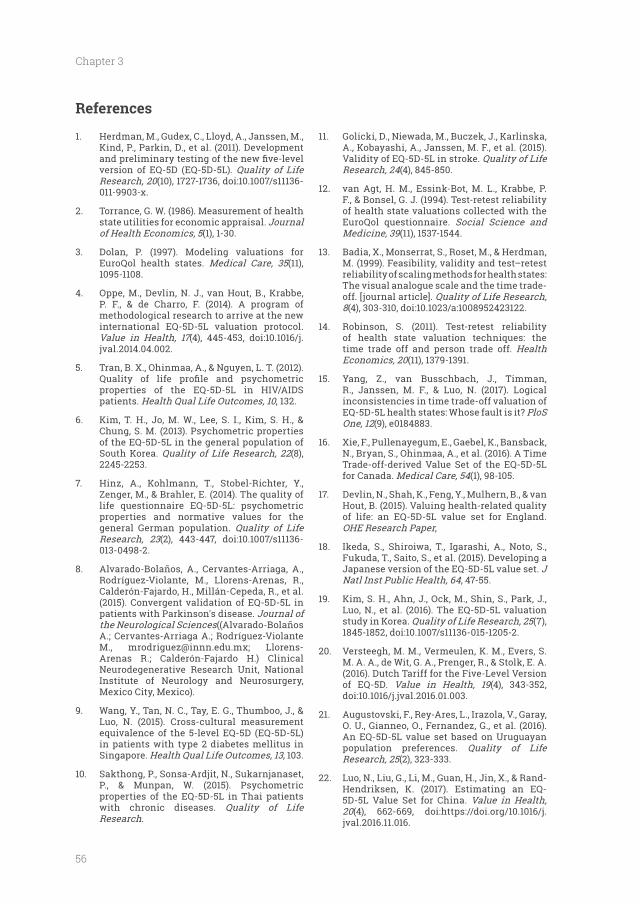
56
Chapter 3
References
1. Herdman, M., Gudex, C., Lloyd, A., Janssen, M., Kind, P., Parkin, D., et al. (2011). Development
version of EQ-5D (EQ-5D-5L). Quality of Life Research, 20(10), 1727-1736, doi:10.1007/s11136-011-9903-x.
2. Torrance, G. W. (1986). Measurement of health state utilities for economic appraisal. Journal of Health Economics, 5(1), 1-30.
3. Dolan, P. (1997). Modeling valuations for EuroQol health states. Medical Care, 35(11), 1095-1108.
4. Oppe, M., Devlin, N. J., van Hout, B., Krabbe, P. F., & de Charro, F. (2014). A program of methodological research to arrive at the new international EQ-5D-5L valuation protocol. Value in Health, 17(4), 445-453, doi:10.1016/j.jval.2014.04.002.
5. Tran, B. X., Ohinmaa, A., & Nguyen, L. T. (2012).
properties of the EQ-5D-5L in HIV/AIDS patients. Health Qual Life Outcomes, 10, 132.
6. Kim, T. H., Jo, M. W., Lee, S. I., Kim, S. H., & Chung, S. M. (2013). Psychometric properties of the EQ-5D-5L in the general population of South Korea. Quality of Life Research, 22(8), 2245-2253.
7. Zenger, M., & Brahler, E. (2014). The quality of life questionnaire EQ-5D-5L: psychometric properties and normative values for the general German population. Quality of Life Research, 23(2), 443-447, doi:10.1007/s11136-013-0498-2.
8. Alvarado-Bolaños, A., Cervantes-Arriaga, A.,
Calderón-Fajardo, H., Millán-Cepeda, R., et al. (2015). Convergent validation of EQ-5D-5L in patients with Parkinson's disease. Journal of the Neurological Sciences((Alvarado-Bolaños
Arenas R.; Calderón-Fajardo H.) Clinical Neurodegenerative Research Unit, National Institute of Neurology and Neurosurgery, Mexico City, Mexico).
9. Wang, Y., Tan, N. C., Tay, E. G., Thumboo, J., & Luo, N. (2015). Cross-cultural measurement equivalence of the 5-level EQ-5D (EQ-5D-5L) in patients with type 2 diabetes mellitus in Singapore. Health Qual Life Outcomes, 13, 103.
10. Sakthong, P., Sonsa-Ardjit, N., Sukarnjanaset, P., & Munpan, W. (2015). Psychometric properties of the EQ-5D-5L in Thai patients with chronic diseases. Quality of Life Research.
11. A., Kobayashi, A., Janssen, M. F., et al. (2015). Validity of EQ-5D-5L in stroke. Quality of Life Research, 24(4), 845-850.
12. van Agt, H. M., Essink-Bot, M. L., Krabbe, P. F., & Bonsel, G. J. (1994). Test-retest reliability of health state valuations collected with the EuroQol questionnaire. Social Science and Medicine, 39(11), 1537-1544.
13. Badia, X., Monserrat, S., Roset, M., & Herdman, M. (1999). Feasibility, validity and test–retest reliability of scaling methods for health states: The visual analogue scale and the time trade-off. [journal article]. Quality of Life Research, 8(4), 303-310, doi:10.1023/a:1008952423122.
14. Robinson, S. (2011). Test-retest reliability of health state valuation techniques: the time trade off and person trade off. Health Economics, 20(11), 1379-1391.
15. Yang, Z., van Busschbach, J., Timman, R., Janssen, M. F., & Luo, N. (2017). Logical inconsistencies in time trade-off valuation of EQ-5D-5L health states: Whose fault is it? PloS One, 12(9), e0184883.
16. Xie, F., Pullenayegum, E., Gaebel, K., Bansback, N., Bryan, S., Ohinmaa, A., et al. (2016). A Time Trade-off-derived Value Set of the EQ-5D-5L for Canada. Medical Care, 54(1), 98-105.
17. Devlin, N., Shah, K., Feng, Y., Mulhern, B., & van Hout, B. (2015). Valuing health-related quality of life: an EQ-5D-5L value set for England. OHE Research Paper,
18. Ikeda, S., Shiroiwa, T., Igarashi, A., Noto, S., Fukuda, T., Saito, S., et al. (2015). Developing a Japanese version of the EQ-5D-5L value set. J Natl Inst Public Health, 64, 47-55.
19. Kim, S. H., Ahn, J., Ock, M., Shin, S., Park, J., Luo, N., et al. (2016). The EQ-5D-5L valuation study in Korea. Quality of Life Research, 25(7), 1845-1852, doi:10.1007/s11136-015-1205-2.
20. Versteegh, M. M., Vermeulen, K. M., Evers, S. M. A. A., de Wit, G. A., Prenger, R., & Stolk, E. A. (2016). Dutch Tariff for the Five-Level Version of EQ-5D. Value in Health, 19(4), 343-352, doi:10.1016/j.jval.2016.01.003.
21.
An EQ-5D-5L value set based on Uruguayan population preferences. Quality of Life Research, 25(2), 323-333.
22. Luo, N., Liu, G., Li, M., Guan, H., Jin, X., & Rand-Hendriksen, K. (2017). Estimating an EQ-5D-5L Value Set for China. Value in Health, 20(4), 662-669, doi:https://doi.org/10.1016/j.jval.2016.11.016.
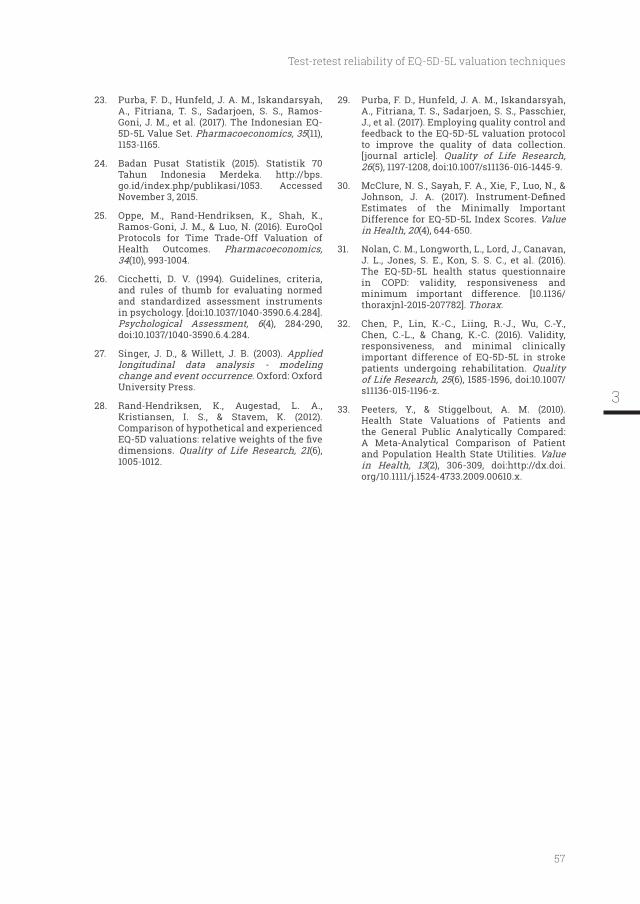
57
Test-retest reliability of EQ-5D-5L valuation techniques
23. Purba, F. D., Hunfeld, J. A. M., Iskandarsyah, A., Fitriana, T. S., Sadarjoen, S. S., Ramos-Goni, J. M., et al. (2017). The Indonesian EQ-5D-5L Value Set. Pharmacoeconomics, 35(11), 1153-1165.
24. Badan Pusat Statistik (2015). Statistik 70 Tahun Indonesia Merdeka. http://bps.go.id/index.php/publikasi/1053. Accessed November 3, 2015.
25. Oppe, M., Rand-Hendriksen, K., Shah, K., Ramos-Goni, J. M., & Luo, N. (2016). EuroQol Protocols for Time Trade-Off Valuation of Health Outcomes. Pharmacoeconomics, 34(10), 993-1004.
26. Cicchetti, D. V. (1994). Guidelines, criteria, and rules of thumb for evaluating normed
in psychology. [doi:10.1037/1040-3590.6.4.284]. Psychological Assessment, 6(4), 284-290, doi:10.1037/1040-3590.6.4.284.
27. Singer, J. D., & Willett, J. B. (2003). Applied longitudinal data analysis - modeling change and event occurrence. Oxford: Oxford University Press.
28. Rand-Hendriksen, K., Augestad, L. A., Kristiansen, I. S., & Stavem, K. (2012). Comparison of hypothetical and experienced
dimensions. Quality of Life Research, 21(6), 1005-1012.
29. Purba, F. D., Hunfeld, J. A. M., Iskandarsyah, A., Fitriana, T. S., Sadarjoen, S. S., Passchier, J., et al. (2017). Employing quality control and feedback to the EQ-5D-5L valuation protocol to improve the quality of data collection. [journal article]. Quality of Life Research, 26(5), 1197-1208, doi:10.1007/s11136-016-1445-9.
30. McClure, N. S., Sayah, F. A., Xie, F., Luo, N., &
Estimates of the Minimally Important Difference for EQ-5D-5L Index Scores. Value in Health, 20(4), 644-650.
31. Nolan, C. M., Longworth, L., Lord, J., Canavan, J. L., Jones, S. E., Kon, S. S. C., et al. (2016). The EQ-5D-5L health status questionnaire in COPD: validity, responsiveness and minimum important difference. [10.1136/thoraxjnl-2015-207782]. Thorax.
32. Chen, P., Lin, K.-C., Liing, R.-J., Wu, C.-Y., Chen, C.-L., & Chang, K.-C. (2016). Validity, responsiveness, and minimal clinically important difference of EQ-5D-5L in stroke patients undergoing rehabilitation. Quality of Life Research, 25(6), 1585-1596, doi:10.1007/
33. Peeters, Y., & Stiggelbout, A. M. (2010). Health State Valuations of Patients and the General Public Analytically Compared: A Meta-Analytical Comparison of Patient and Population Health State Utilities. Value in Health, 13(2), 306-309, doi:http://dx.doi.org/10.1111/j.1524-4733.2009.00610.x.
3
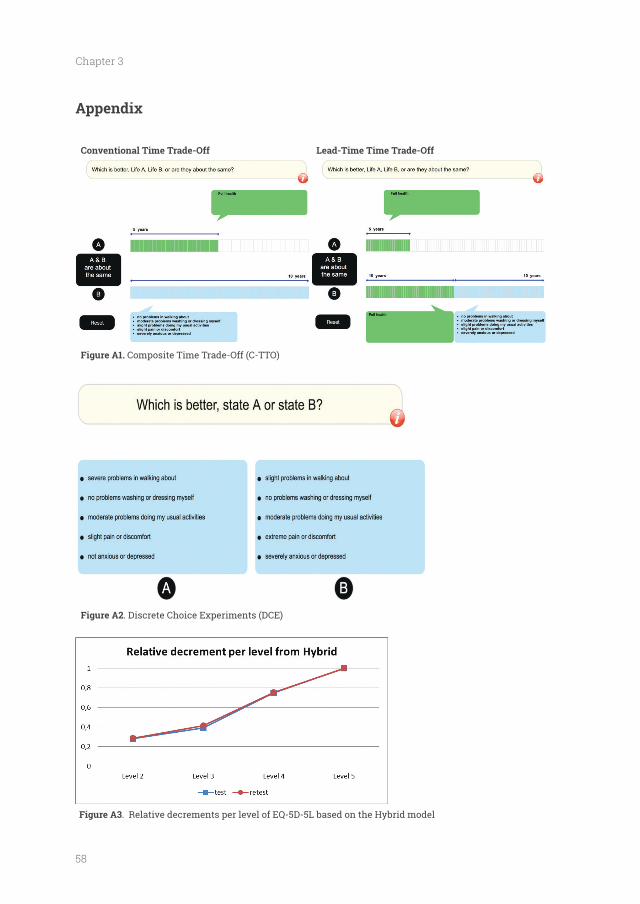
58
Chapter 3
Appendix
Conventional Time Trade-Off Lead-Time Time Trade-Off
Composite Time Trade-Off (C-TTO)
. Discrete Choice Experiments (DCE)
. Relative decrements per level of EQ-5D-5L based on the Hybrid model
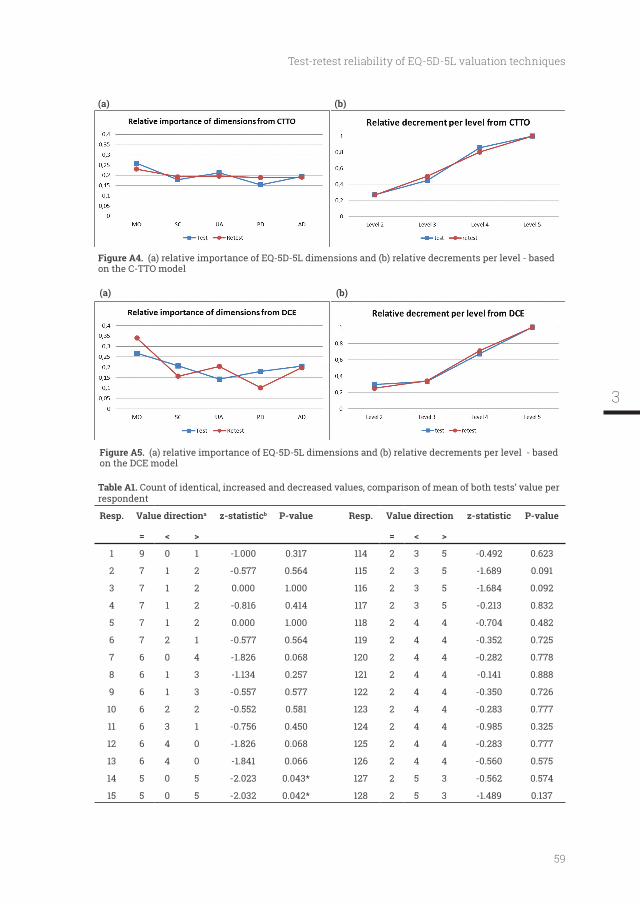
59
Test-retest reliability of EQ-5D-5L valuation techniques
(a) (b)
(a) relative importance of EQ-5D-5L dimensions and (b) relative decrements per level - based on the C-TTO model
(a) (b)
(a) relative importance of EQ-5D-5L dimensions and (b) relative decrements per level - based on the DCE model
Table A1. Count of identical, increased and decreased values, comparison of mean of both tests’ value per respondent
Resp. Value directiona z-statisticb P-value Resp. Value direction z-statistic P-value
= < > = < >
1 9 0 1 -1.000 0.317 114 2 3 5 -0.492 0.623
2 7 1 2 -0.577 0.564 115 2 3 5 -1.689 0.091
3 7 1 2 0.000 1.000 116 2 3 5 -1.684 0.092
4 7 1 2 -0.816 0.414 117 2 3 5 -0.213 0.832
5 7 1 2 0.000 1.000 118 2 4 4 -0.704 0.482
6 7 2 1 -0.577 0.564 119 2 4 4 -0.352 0.725
7 6 0 4 -1.826 0.068 120 2 4 4 -0.282 0.778
8 6 1 3 -1.134 0.257 121 2 4 4 -0.141 0.888
9 6 1 3 -0.557 0.577 122 2 4 4 -0.350 0.726
10 6 2 2 -0.552 0.581 123 2 4 4 -0.283 0.777
11 6 3 1 -0.756 0.450 124 2 4 4 -0.985 0.325
12 6 4 0 -1.826 0.068 125 2 4 4 -0.283 0.777
13 6 4 0 -1.841 0.066 126 2 4 4 -0.560 0.575
14 5 0 5 -2.023 0.043* 127 2 5 3 -0.562 0.574
15 5 0 5 -2.032 0.042* 128 2 5 3 -1.489 0.137
3
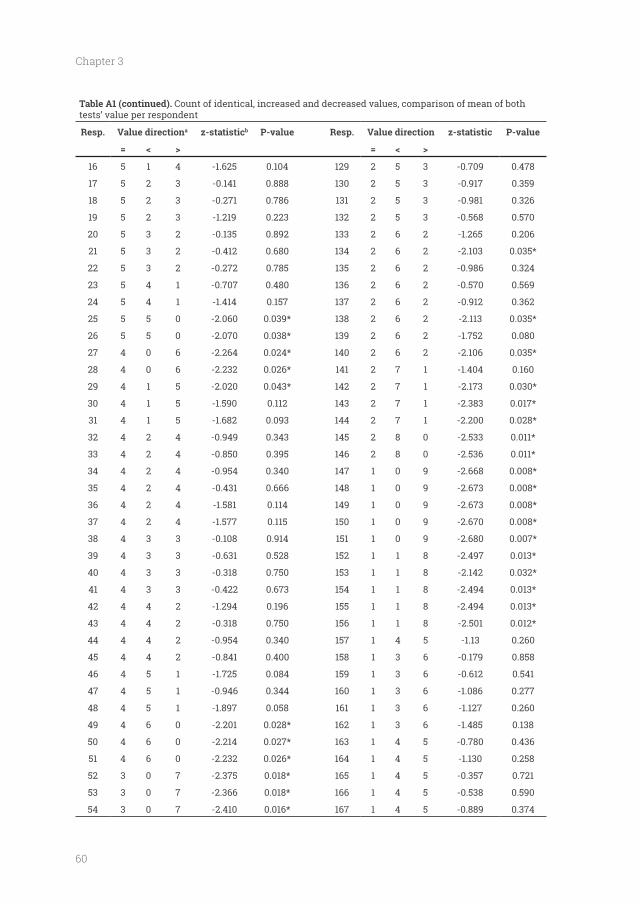
60
Chapter 3
Table A1 (continued). Count of identical, increased and decreased values, comparison of mean of both tests’ value per respondent
Resp. Value directiona z-statisticb P-value Resp. Value direction z-statistic P-value
= < > = < >
16 5 1 4 -1.625 0.104 129 2 5 3 -0.709 0.478
17 5 2 3 -0.141 0.888 130 2 5 3 -0.917 0.359
18 5 2 3 -0.271 0.786 131 2 5 3 -0.981 0.326
19 5 2 3 -1.219 0.223 132 2 5 3 -0.568 0.570
20 5 3 2 -0.135 0.892 133 2 6 2 -1.265 0.206
21 5 3 2 -0.412 0.680 134 2 6 2 -2.103 0.035*
22 5 3 2 -0.272 0.785 135 2 6 2 -0.986 0.324
23 5 4 1 -0.707 0.480 136 2 6 2 -0.570 0.569
24 5 4 1 -1.414 0.157 137 2 6 2 -0.912 0.362
25 5 5 0 -2.060 0.039* 138 2 6 2 -2.113 0.035*
26 5 5 0 -2.070 0.038* 139 2 6 2 -1.752 0.080
27 4 0 6 -2.264 0.024* 140 2 6 2 -2.106 0.035*
28 4 0 6 -2.232 0.026* 141 2 7 1 -1.404 0.160
29 4 1 5 -2.020 0.043* 142 2 7 1 -2.173 0.030*
30 4 1 5 -1.590 0.112 143 2 7 1 -2.383 0.017*
31 4 1 5 -1.682 0.093 144 2 7 1 -2.200 0.028*
32 4 2 4 -0.949 0.343 145 2 8 0 -2.533 0.011*
33 4 2 4 -0.850 0.395 146 2 8 0 -2.536 0.011*
34 4 2 4 -0.954 0.340 147 1 0 9 -2.668 0.008*
35 4 2 4 -0.431 0.666 148 1 0 9 -2.673 0.008*
36 4 2 4 -1.581 0.114 149 1 0 9 -2.673 0.008*
37 4 2 4 -1.577 0.115 150 1 0 9 -2.670 0.008*
38 4 3 3 -0.108 0.914 151 1 0 9 -2.680 0.007*
39 4 3 3 -0.631 0.528 152 1 1 8 -2.497 0.013*
40 4 3 3 -0.318 0.750 153 1 1 8 -2.142 0.032*
41 4 3 3 -0.422 0.673 154 1 1 8 -2.494 0.013*
42 4 4 2 -1.294 0.196 155 1 1 8 -2.494 0.013*
43 4 4 2 -0.318 0.750 156 1 1 8 -2.501 0.012*
44 4 4 2 -0.954 0.340 157 1 4 5 -1.13 0.260
45 4 4 2 -0.841 0.400 158 1 3 6 -0.179 0.858
46 4 5 1 -1.725 0.084 159 1 3 6 -0.612 0.541
47 4 5 1 -0.946 0.344 160 1 3 6 -1.086 0.277
48 4 5 1 -1.897 0.058 161 1 3 6 -1.127 0.260
49 4 6 0 -2.201 0.028* 162 1 3 6 -1.485 0.138
50 4 6 0 -2.214 0.027* 163 1 4 5 -0.780 0.436
51 4 6 0 -2.232 0.026* 164 1 4 5 -1.130 0.258
52 3 0 7 -2.375 0.018* 165 1 4 5 -0.357 0.721
53 3 0 7 -2.366 0.018* 166 1 4 5 -0.538 0.590
54 3 0 7 -2.410 0.016* 167 1 4 5 -0.889 0.374
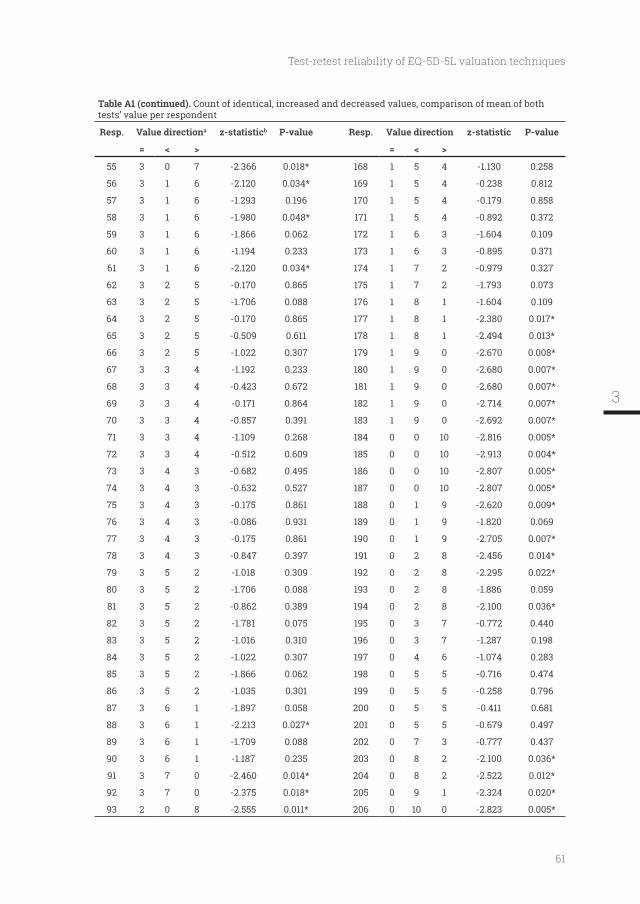
61
Test-retest reliability of EQ-5D-5L valuation techniques
Table A1 (continued). Count of identical, increased and decreased values, comparison of mean of both tests’ value per respondent
Resp. Value directiona z-statisticb P-value Resp. Value direction z-statistic P-value
= < > = < >
55 3 0 7 -2.366 0.018* 168 1 5 4 -1.130 0.258
56 3 1 6 -2.120 0.034* 169 1 5 4 -0.238 0.812
57 3 1 6 -1.293 0.196 170 1 5 4 -0.179 0.858
58 3 1 6 -1.980 0.048* 171 1 5 4 -0.892 0.372
59 3 1 6 -1.866 0.062 172 1 6 3 -1.604 0.109
60 3 1 6 -1.194 0.233 173 1 6 3 -0.895 0.371
61 3 1 6 -2.120 0.034* 174 1 7 2 -0.979 0.327
62 3 2 5 -0.170 0.865 175 1 7 2 -1.793 0.073
63 3 2 5 -1.706 0.088 176 1 8 1 -1.604 0.109
64 3 2 5 -0.170 0.865 177 1 8 1 -2.380 0.017*
65 3 2 5 -0.509 0.611 178 1 8 1 -2.494 0.013*
66 3 2 5 -1.022 0.307 179 1 9 0 -2.670 0.008*
67 3 3 4 -1.192 0.233 180 1 9 0 -2.680 0.007*
68 3 3 4 -0.423 0.672 181 1 9 0 -2.680 0.007*
69 3 3 4 -0.171 0.864 182 1 9 0 -2.714 0.007*
70 3 3 4 -0.857 0.391 183 1 9 0 -2.692 0.007*
71 3 3 4 -1.109 0.268 184 0 0 10 -2.816 0.005*
72 3 3 4 -0.512 0.609 185 0 0 10 -2.913 0.004*
73 3 4 3 -0.682 0.495 186 0 0 10 -2.807 0.005*
74 3 4 3 -0.632 0.527 187 0 0 10 -2.807 0.005*
75 3 4 3 -0.175 0.861 188 0 1 9 -2.620 0.009*
76 3 4 3 -0.086 0.931 189 0 1 9 -1.820 0.069
77 3 4 3 -0.175 0.861 190 0 1 9 -2.705 0.007*
78 3 4 3 -0.847 0.397 191 0 2 8 -2.456 0.014*
79 3 5 2 -1.018 0.309 192 0 2 8 -2.295 0.022*
80 3 5 2 -1.706 0.088 193 0 2 8 -1.886 0.059
81 3 5 2 -0.862 0.389 194 0 2 8 -2.100 0.036*
82 3 5 2 -1.781 0.075 195 0 3 7 -0.772 0.440
83 3 5 2 -1.016 0.310 196 0 3 7 -1.287 0.198
84 3 5 2 -1.022 0.307 197 0 4 6 -1.074 0.283
85 3 5 2 -1.866 0.062 198 0 5 5 -0.716 0.474
86 3 5 2 -1.035 0.301 199 0 5 5 -0.258 0.796
87 3 6 1 -1.897 0.058 200 0 5 5 -0.411 0.681
88 3 6 1 -2.213 0.027* 201 0 5 5 -0.679 0.497
89 3 6 1 -1.709 0.088 202 0 7 3 -0.777 0.437
90 3 6 1 -1.187 0.235 203 0 8 2 -2.100 0.036*
91 3 7 0 -2.460 0.014* 204 0 8 2 -2.522 0.012*
92 3 7 0 -2.375 0.018* 205 0 9 1 -2.324 0.020*
93 2 0 8 -2.555 0.011* 206 0 10 0 -2.823 0.005*
3
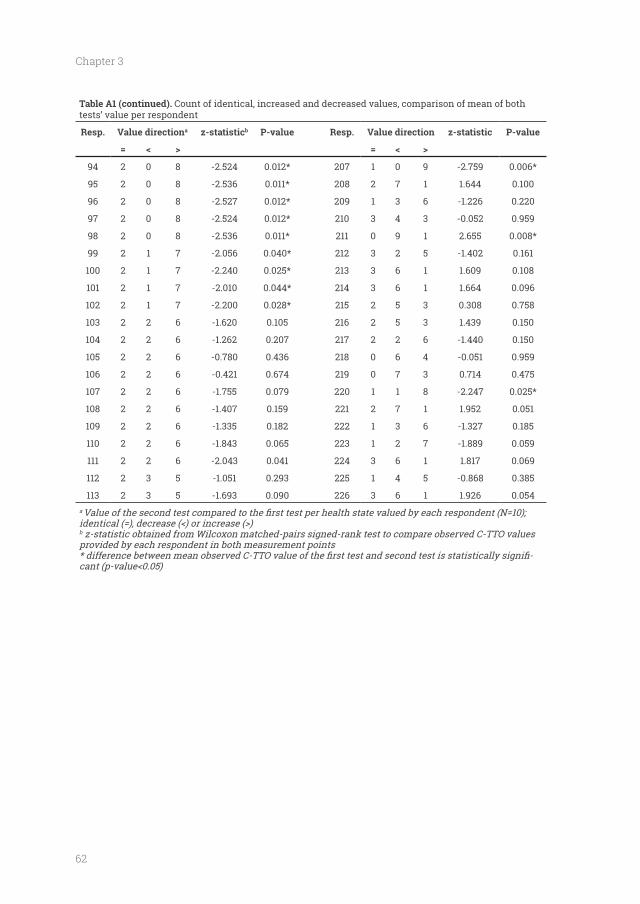
62
Chapter 3
Table A1 (continued). Count of identical, increased and decreased values, comparison of mean of both tests’ value per respondent
Resp. Value directiona z-statisticb P-value Resp. Value direction z-statistic P-value
= < > = < >
94 2 0 8 -2.524 0.012* 207 1 0 9 -2.759 0.006*
95 2 0 8 -2.536 0.011* 208 2 7 1 1.644 0.100
96 2 0 8 -2.527 0.012* 209 1 3 6 -1.226 0.220
97 2 0 8 -2.524 0.012* 210 3 4 3 -0.052 0.959
98 2 0 8 -2.536 0.011* 211 0 9 1 2.655 0.008*
99 2 1 7 -2.056 0.040* 212 3 2 5 -1.402 0.161
100 2 1 7 -2.240 0.025* 213 3 6 1 1.609 0.108
101 2 1 7 -2.010 0.044* 214 3 6 1 1.664 0.096
102 2 1 7 -2.200 0.028* 215 2 5 3 0.308 0.758
103 2 2 6 -1.620 0.105 216 2 5 3 1.439 0.150
104 2 2 6 -1.262 0.207 217 2 2 6 -1.440 0.150
105 2 2 6 -0.780 0.436 218 0 6 4 -0.051 0.959
106 2 2 6 -0.421 0.674 219 0 7 3 0.714 0.475
107 2 2 6 -1.755 0.079 220 1 1 8 -2.247 0.025*
108 2 2 6 -1.407 0.159 221 2 7 1 1.952 0.051
109 2 2 6 -1.335 0.182 222 1 3 6 -1.327 0.185
110 2 2 6 -1.843 0.065 223 1 2 7 -1.889 0.059
111 2 2 6 -2.043 0.041 224 3 6 1 1.817 0.069
112 2 3 5 -1.051 0.293 225 1 4 5 -0.868 0.385
113 2 3 5 -1.693 0.090 226 3 6 1 1.926 0.054a
b
provided by each respondent in both measurement points-
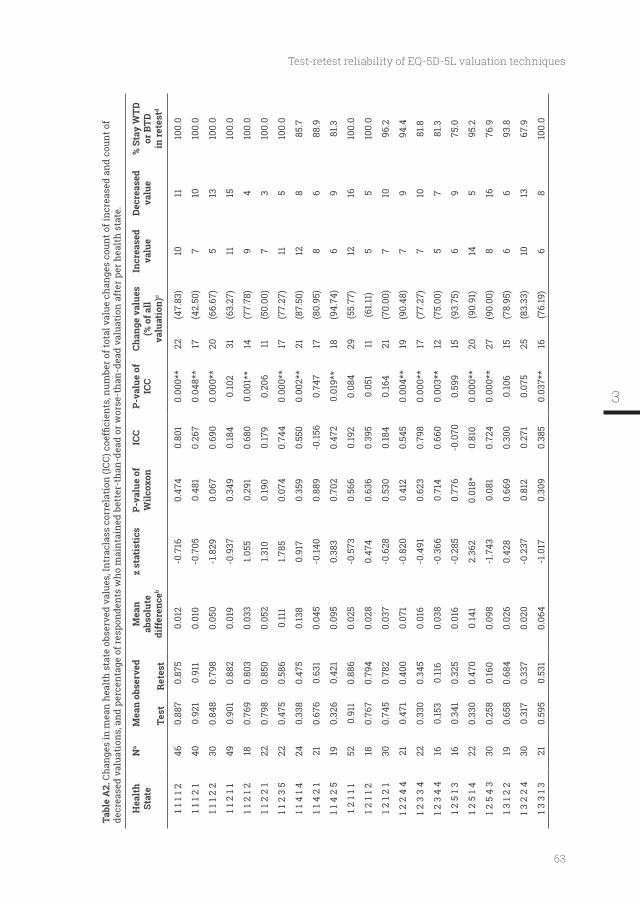
63
Test-retest reliability of EQ-5D-5L valuation techniques
Tabl
e A
2.de
crea
sed
valu
atio
ns, a
nd p
erce
ntag
e of
resp
onde
nts
who
mai
ntai
ned
bett
er-t
han-
dead
or w
orse
-tha
n-de
ad v
alua
tion
aft
er p
er h
ealt
h st
ate.
Hea
lth
Stat
eN
aM
ean
obse
rved
Tes
t
Ret
est
Mea
n ab
solu
te
diff
eren
ceb
z st
atis
tics
P-va
lue
of
Wilc
oxon
ICC
P-va
lue
of
ICC
(% o
f all
va
luat
ion)
c
Incr
ease
d va
lue
Dec
reas
ed
valu
e%
Sta
y W
TD
or B
TD
in re
test
d
1 1 1
1 246
0.88
70.
875
0.01
2-0
.716
0.47
40.
801
0.00
0**
22(4
7.83
)10
1110
0.0
1 1 1
2 1
400.
921
0.91
10.
010
-0.7
050.
481
0.26
70.
048*
*17
(42.
50)
710
100.
0
1 1 1
2 2
300.
848
0.79
80.
050
-1.8
290.
067
0.69
00.
000*
*20
(66.
67)
513
100.
0
1 1 2
1 1
490.
901
0.88
20.
019
-0.9
370.
349
0.18
40.
102
31(6
3.27
)11
1510
0.0
1 1 2
1 2
180.
769
0.80
30.
033
1.055
0.29
10.
680
0.00
1**
14(7
7.78
)9
410
0.0
1 1 2
2 1
220.
798
0.85
00.
052
1.310
0.19
00.
179
0.20
611
(50.
00)
73
100.
0
1 1 2
3 5
220.
475
0.58
60.
111
1.785
0.07
40.
744
0.00
0**
17(7
7.27
)11
510
0.0
1 1 4
1 4
240.
338
0.47
50.
138
0.91
70.
359
0.55
00.
002*
*21
(87.
50)
128
85.7
1 1 4
2 1
210.
676
0.63
10.
045
-0.14
00.
889
-0.15
60.
747
17(8
0.95
)8
688
.9
1 1 4
2 5
190.
326
0.42
10.
095
0.38
30.
702
0.47
20.
019*
*18
(94.
74)
69
81.3
1 2 1
1 152
0.91
10.
886
0.02
5-0
.573
0.56
60.
192
0.08
429
(55.
77)
1216
100.
0
1 2 1
1 218
0.76
70.
794
0.02
80.
474
0.63
60.
395
0.05
111
(61.1
1)5
510
0.0
1 2 1
2 1
300.
745
0.78
20.
037
-0.6
280.
530
0.18
40.
164
21(7
0.00
)7
1096
.2
1 2 2
4 4
210.
471
0.40
00.
071
-0.8
200.
412
0.54
50.
004*
*19
(90.
48)
79
94.4
1 2 3
3 4
220.
330
0.34
50.
016
-0.4
910.
623
0.79
80.
000*
*17
(77.
27)
710
81.8
1 2 3
4 4
160.
153
0.11
60.
038
-0.3
660.
714
0.66
00.
003*
*12
(75.
00)
57
81.3
1 2 5
1 3
160.
341
0.32
50.
016
-0.2
850.
776
-0.0
700.
599
15(9
3.75
)6
975
.0
1 2 5
1 4
220.
330
0.47
00.
141
2.36
20.
018*
0.81
00.
000*
*20
(90.
91)
145
95.2
1 2 5
4 3
300.
258
0.16
00.
098
-1.7
430.
081
0.72
40.
000*
*27
(90.
00)
816
76.9
1 3 1
2 2
190.
658
0.68
40.
026
0.42
80.
669
0.30
00.
106
15(7
8.95
)6
693
.8
1 3 2
2 4
300.
317
0.33
70.
020
-0.2
370.
812
0.27
10.
075
25(8
3.33
)10
1367
.9
1 3 3
1 3
210.
595
0.53
10.
064
-1.0
170.
309
0.38
50.
037*
*16
(76.
19)
68
100.
0
3
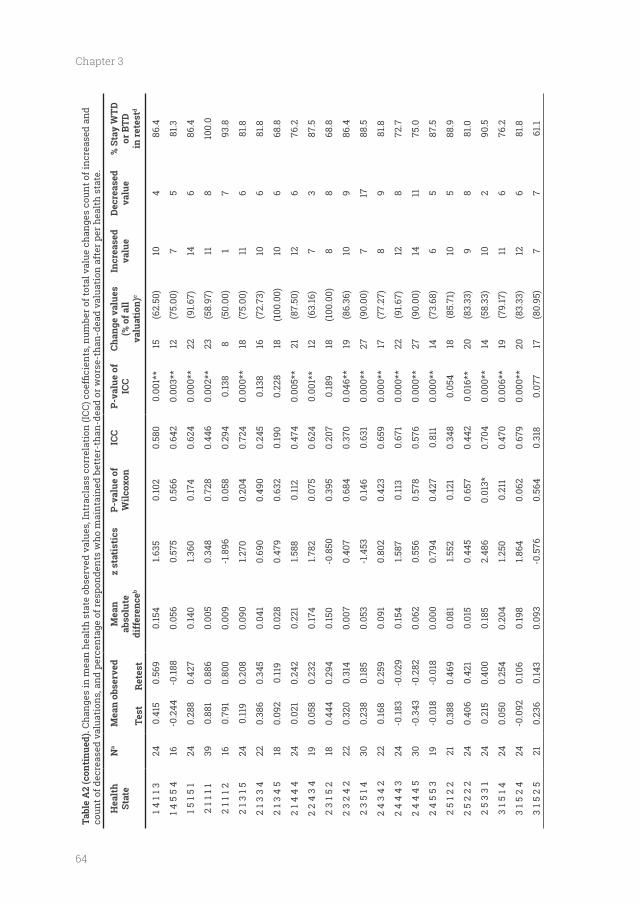
64
Chapter 3
Tabl
e A
2 (c
onti
nued
).co
unt o
f dec
reas
ed v
alua
tion
s, a
nd p
erce
ntag
e of
resp
onde
nts
who
mai
ntai
ned
bett
er-t
han-
dead
or w
orse
-tha
n-de
ad v
alua
tion
aft
er p
er h
ealt
h st
ate.
Hea
lth
Stat
eN
aM
ean
obse
rved
Tes
t
Ret
est
Mea
n ab
solu
te
diff
eren
ceb
z st
atis
tics
P-va
lue
of
Wilc
oxon
ICC
P-va
lue
of
ICC
(% o
f all
va
luat
ion)
c
Incr
ease
d va
lue
Dec
reas
ed
valu
e%
Sta
y W
TD
or B
TD
in re
test
d
1 4 1
1 324
0.41
50.
569
0.15
41.6
350.
102
0.58
00.
001*
*15
(62.
50)
104
86.4
1 4 5
5 4
16-0
.244
-0.18
80.
056
0.57
50.
566
0.64
20.
003*
*12
(75.
00)
75
81.3
1 5 1
5 1
240.
288
0.42
70.
140
1.360
0.17
40.
624
0.00
0**
22(9
1.67)
146
86.4
2 1 1
1 1
390.
881
0.88
60.
005
0.34
80.
728
0.44
60.
002*
*23
(58.
97)
118
100.
0
2 1 1
1 2
160.
791
0.80
00.
009
-1.8
960.
058
0.29
40.
138
8(5
0.00
)1
793
.8
2 1 3
1 5
240.
119
0.20
80.
090
1.270
0.20
40.
724
0.00
0**
18(7
5.00
)11
681
.8
2 1 3
3 4
220.
386
0.34
50.
041
0.69
00.
490
0.24
50.
138
16(7
2.73
)10
681
.8
2 1 3
4 5
180.
092
0.11
90.
028
0.47
90.
632
0.19
00.
228
18(1
00.0
0)10
668
.8
2 1 4
4 4
240.
021
0.24
20.
221
1.588
0.11
20.
474
0.00
5**
21(8
7.50
)12
676
.2
2 2
4 3
419
0.05
80.
232
0.17
41.7
820.
075
0.62
40.
001*
*12
(63.
16)
73
87.5
2 3
1 5 2
180.
444
0.29
40.
150
-0.8
500.
395
0.20
70.
189
18(1
00.0
0)8
868
.8
2 3
2 4
222
0.32
00.
314
0.00
70.
407
0.68
40.
370
0.04
6**
19(8
6.36
)10
986
.4
2 3
5 1 4
300.
238
0.18
50.
053
-1.4
530.
146
0.63
10.
000*
*27
(90.
00)
717
88.5
2 4
3 4
222
0.16
80.
259
0.09
10.
802
0.42
30.
659
0.00
0**
17(7
7.27
)8
981
.8
2 4
4 4
324
-0.18
3-0
.029
0.15
41.5
870.
113
0.67
10.
000*
*22
(91.6
7)12
872
.7
2 4
4 4
530
-0.3
43-0
.282
0.06
20.
556
0.57
80.
576
0.00
0**
27(9
0.00
)14
1175
.0
2 4
5 5
319
-0.0
18-0
.018
0.00
00.
794
0.42
70.
811
0.00
0**
14(7
3.68
)6
587
.5
2 5
1 2 2
210.
388
0.46
90.
081
1.552
0.12
10.
348
0.05
418
(85.
71)
105
88.9
2 5
2 2
224
0.40
60.
421
0.01
50.
445
0.65
70.
442
0.01
6**
20(8
3.33
)9
881
.0
2 5
3 3
124
0.21
50.
400
0.18
52.
486
0.01
3*0.
704
0.00
0**
14(5
8.33
)10
290
.5
3 1 5
1 4
240.
050
0.25
40.
204
1.250
0.21
10.
470
0.00
6**
19(7
9.17
)11
676
.2
3 1 5
2 4
24-0
.092
0.10
60.
198
1.864
0.06
20.
679
0.00
0**
20(8
3.33
)12
681
.8
3 1 5
2 5
210.
236
0.14
30.
093
-0.5
760.
564
0.31
80.
077
17(8
0.95
)7
761
.1
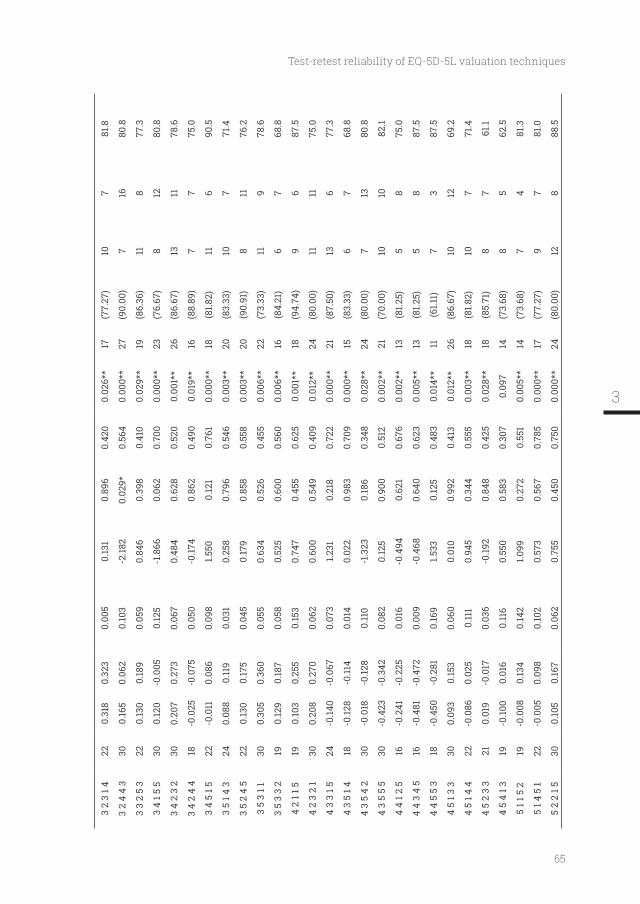
65
Test-retest reliability of EQ-5D-5L valuation techniques
3 2
3 1 4
220.
318
0.32
30.
005
0.13
10.
896
0.42
00.
026*
*17
(77.
27)
107
81.8
3 2
4 4
330
0.16
50.
062
0.10
3-2
.182
0.02
9*0.
564
0.00
0**
27(9
0.00
)7
1680
.8
3 3
2 5
322
0.13
00.
189
0.05
90.
846
0.39
80.
410
0.02
9**
19(8
6.36
)11
877
.3
3 4
1 5 5
300.
120
-0.0
050.
125
-1.8
660.
062
0.70
00.
000*
*23
(76.
67)
812
80.8
3 4
2 3
230
0.20
70.
273
0.06
70.
484
0.62
80.
520
0.00
1**
26(8
6.67
)13
1178
.6
3 4
2 4
418
-0.0
25-0
.075
0.05
0-0
.174
0.86
20.
490
0.01
9**
16(8
8.89
)7
775
.0
3 4
5 1 5
22-0
.011
0.08
60.
098
1.550
0.12
10.
761
0.00
0**
18(8
1.82)
116
90.5
3 5
1 4 3
240.
088
0.11
90.
031
0.25
80.
796
0.54
60.
003*
*20
(83.
33)
107
71.4
3 5
2 4
522
0.13
00.
175
0.04
50.
179
0.85
80.
558
0.00
3**
20(9
0.91
)8
1176
.2
3 5
3 1 1
300.
305
0.36
00.
055
0.63
40.
526
0.45
50.
006*
*22
(73.
33)
119
78.6
3 5
3 3
219
0.12
90.
187
0.05
80.
525
0.60
00.
560
0.00
6**
16(8
4.21
)6
768
.8
4 2
1 1 5
190.
103
0.25
50.
153
0.74
70.
455
0.62
50.
001*
*18
(94.
74)
96
87.5
4 2
3 2
130
0.20
80.
270
0.06
20.
600
0.54
90.
409
0.01
2**
24(8
0.00
)11
1175
.0
4 3
3 1 5
24-0
.140
-0.0
670.
073
1.231
0.21
80.
722
0.00
0**
21(8
7.50
)13
677
.3
4 3
5 1 4
18-0
.128
-0.11
40.
014
0.02
20.
983
0.70
90.
000*
*15
(83.
33)
67
68.8
4 3
5 4
230
-0.0
18-0
.128
0.11
0-1
.323
0.18
60.
348
0.02
8**
24(8
0.00
)7
1380
.8
4 3
5 5
530
-0.4
23-0
.342
0.08
20.
125
0.90
00.
512
0.00
2**
21(7
0.00
)10
1082
.1
4 4
1 2 5
16-0
.241
-0.2
250.
016
-0.4
940.
621
0.67
60.
002*
*13
(81.2
5)5
875
.0
4 4
3 4
516
-0.4
81-0
.472
0.00
9-0
.468
0.64
00.
623
0.00
5**
13(8
1.25)
58
87.5
4 4
5 5
318
-0.4
50-0
.281
0.16
91.5
330.
125
0.48
30.
014*
*11
(61.1
1)7
387
.5
4 5
1 3 3
300.
093
0.15
30.
060
0.01
00.
992
0.41
30.
012*
*26
(86.
67)
1012
69.2
4 5
1 4 4
22-0
.086
0.02
50.
111
0.94
50.
344
0.55
50.
003*
*18
(81.8
2)10
771
.4
4 5
2 3
321
0.01
9-0
.017
0.03
6-0
.192
0.84
80.
425
0.02
8**
18(8
5.71
)8
761
.1
4 5
4 1 3
19-0
.100
0.01
60.
116
0.55
00.
583
0.30
70.
097
14(7
3.68
)8
562
.5
5 1 1
5 2
19-0
.008
0.13
40.
142
1.099
0.27
20.
551
0.00
5**
14(7
3.68
)7
481
.3
5 1 4
5 1
22-0
.005
0.09
80.
102
0.57
30.
567
0.78
50.
000*
*17
(77.
27)
97
81.0
5 2
2 1 5
300.
105
0.16
70.
062
0.75
50.
450
0.75
00.
000*
*24
(80.
00)
128
88.5
3
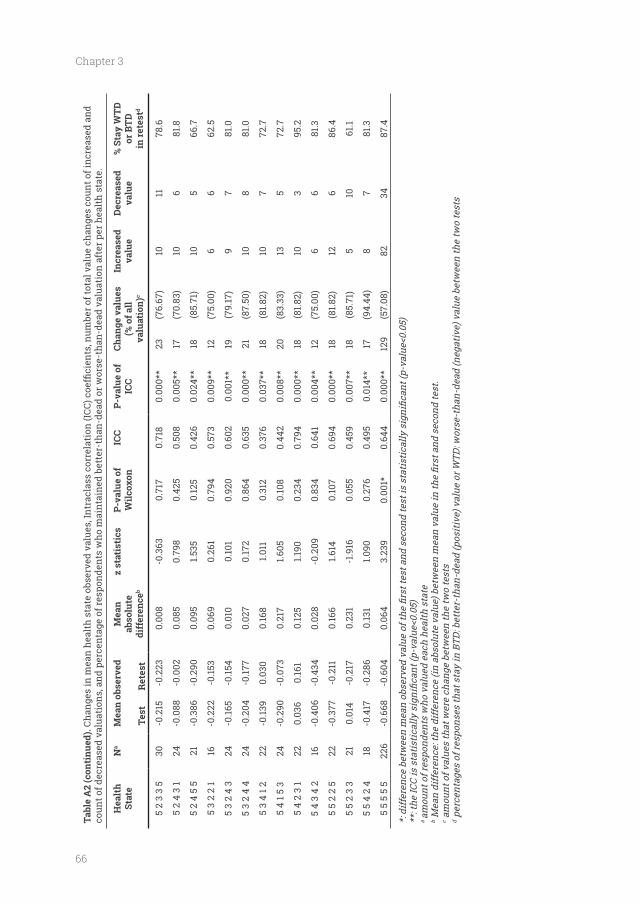
66
Chapter 3
Tabl
e A
2 (c
onti
nued
).co
unt o
f dec
reas
ed v
alua
tion
s, a
nd p
erce
ntag
e of
resp
onde
nts
who
mai
ntai
ned
bett
er-t
han-
dead
or w
orse
-tha
n-de
ad v
alua
tion
aft
er p
er h
ealt
h st
ate.
Hea
lth
Stat
eN
aM
ean
obse
rved
Tes
t
Ret
est
Mea
n ab
solu
te
diff
eren
ceb
z st
atis
tics
P-va
lue
of
Wilc
oxon
ICC
P-va
lue
of
ICC
(% o
f all
va
luat
ion)
c
Incr
ease
d va
lue
Dec
reas
ed
valu
e%
Sta
y W
TD
or B
TD
in re
test
d
5 2
3 3
530
-0.2
15-0
.223
0.00
8-0
.363
0.71
70.
718
0.00
0**
23(7
6.67
)10
1178
.6
5 2
4 3
124
-0.0
88-0
.002
0.08
50.
798
0.42
50.
508
0.00
5**
17(7
0.83
)10
681
.8
5 2
4 5
521
-0.3
86-0
.290
0.09
51.5
350.
125
0.42
60.
024*
*18
(85.
71)
105
66.7
5 3
2 2
116
-0.2
22-0
.153
0.06
90.
261
0.79
40.
573
0.00
9**
12(7
5.00
)6
662
.5
5 3
2 4
324
-0.16
5-0
.154
0.01
00.
101
0.92
00.
602
0.00
1**
19(7
9.17
)9
781
.0
5 3
2 4
424
-0.2
04-0
.177
0.02
70.
172
0.86
40.
635
0.00
0**
21(8
7.50
)10
881
.0
5 3
4 1 2
22-0
.139
0.03
00.
168
1.011
0.31
20.
376
0.03
7**
18(8
1.82)
107
72.7
5 4
1 5 3
24-0
.290
-0.0
730.
217
1.605
0.10
80.
442
0.00
8**
20(8
3.33
)13
572
.7
5 4
2 3
122
0.03
60.
161
0.12
51.1
900.
234
0.79
40.
000*
*18
(81.8
2)10
395
.2
5 4
3 4
216
-0.4
06-0
.434
0.02
8-0
.209
0.83
40.
641
0.00
4**
12(7
5.00
)6
681
.3
5 5
2 2
522
-0.3
77-0
.211
0.16
61.6
140.
107
0.69
40.
000*
*18
(81.8
2)12
686
.4
5 5
2 3
321
0.01
4-0
.217
0.23
1-1
.916
0.05
50.
459
0.00
7**
18(8
5.71
)5
1061
.1
5 5
4 2
418
-0.4
17-0
.286
0.13
11.0
900.
276
0.49
50.
014*
*17
(94.
44)
87
81.3
5 5
5 5
522
6-0
.668
-0.6
040.
064
3.23
90.
001*
0.64
40.
000*
*12
9(5
7.08
)82
3487
.4
a am
ount
of r
espo
nden
ts w
ho v
alue
d ea
ch h
ealth
sta
teb c a
mou
nt o
f val
ues
that
wer
e ch
ange
bet
wee
n th
e tw
o te
sts
d per
cent
ages
of r
espo
nses
that
sta
y in
BTD
: bet
ter-
than
-dea
d (p
ositi
ve) v
alue
or W
TD: w
orse
-tha
n-de
ad (n
egat
ive)
val
ue b
etw
een
the
two
test
s
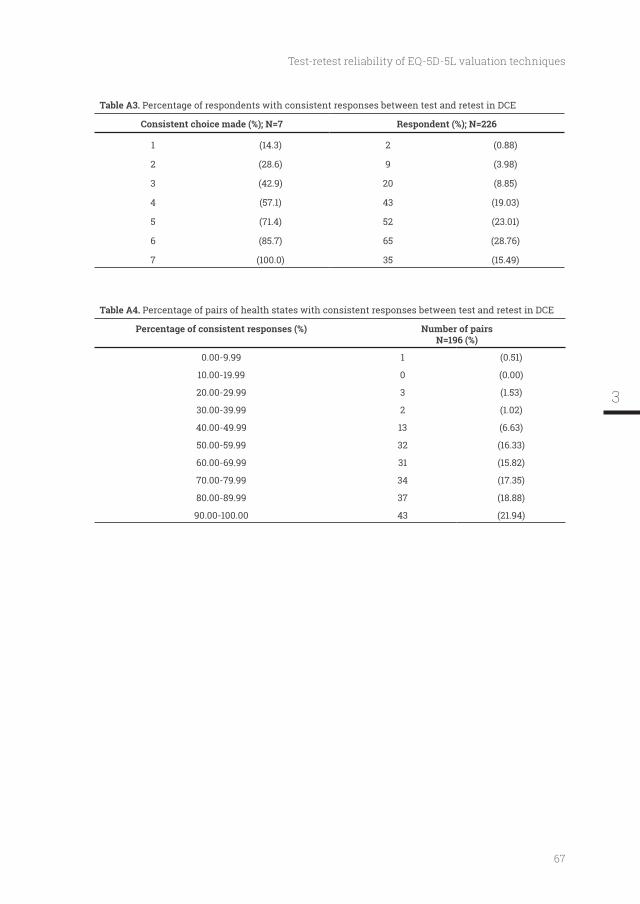
67
Test-retest reliability of EQ-5D-5L valuation techniques
Table A3. Percentage of respondents with consistent responses between test and retest in DCE
Consistent choice made (%); N=7 Respondent (%); N=226
1 (14.3) 2 (0.88)
2 (28.6) 9 (3.98)
3 (42.9) 20 (8.85)
4 (57.1) 43 (19.03)
5 (71.4) 52 (23.01)
6 (85.7) 65 (28.76)
7 (100.0) 35 (15.49)
Table A4. Percentage of pairs of health states with consistent responses between test and retest in DCE
Number of pairs N=196 (%)
0.00-9.99 1 (0.51)
10.00-19.99 0 (0.00)
20.00-29.99 3 (1.53)
30.00-39.99 2 (1.02)
40.00-49.99 13 (6.63)
50.00-59.99 32 (16.33)
60.00-69.99 31 (15.82)
70.00-79.99 34 (17.35)
80.00-89.99 37 (18.88)
90.00-100.00 43 (21.94)
3
The Indonesian EQ-5D-5L value set
Published as: Purba, F. D., Hunfeld, J. A. M., Iskandarsyah, A., Fitriana, T. S., Sadarjoen, S. S.,
Ramos-Goni, J. M., Passchier, J., Busschbach, J. J. V. (2017). The Indonesian EQ-5D-5L Value
Set. Pharmacoeconomics, 35(11), 1153-1165.
70
Chapter 4
Abstract
BACKGROUND: The EQ-5D is one of the most used generic health-related quality of life (HRQOL)
instrument worldwide. To make the EQ-5D suitable for use in economic evaluations, a societal-
based value set is needed. Indonesia does not have such value set.
OBJECTIVE: To derive an EQ-5D-5L value set from the Indonesian general population.
METHODS: A representative sample aged 17 years and over was recruited from the Indonesian
the composite time trade-off (C-TTO) and discrete choice experiments (DCE) were applied.
Interviews were undertaken by trained interviewers using computer-assisted face-to-face
interviews with the EuroQol Valuation Technology (EQ-VT) platform. To estimate the value
set, a hybrid regression model combining C-TTO and DCE data was used.
RESULTS: 1054 respondents who completed the interview formed the sample for the analysis.
Their characteristics were similar to those of the Indonesian population. Most self-reported
health problems were observed in the pain/discomfort dimension (39.66%) and least in the
self-care dimension (1.9%). In the value set, the maximum value was 1.000 for full health
(health state ‘11111’) followed by the health state ‘11112’ with value 0.921. The minimum value
was -0.865 for the worst state (‘55555’). Preference values were most affected by mobility and
least by pain/discomfort.
CONCLUSIONS: We now have a representative EQ-5D-5L value set for Indonesia. We expect
our results will promote and facilitate health economic evaluations and HRQOL research in
Indonesia.
Key Points for Decision Makers
• Indonesia does not have an EQ-5D value set.
• An EQ-5D-5L value set was derived from a highly representative sample of the Indonesian
general population.
• Data were collected using a rigorous quality control procedure which led to logical and
• This Indonesian EQ-5D-5L value set is now becoming available and will be used by all
health economic evaluations and health-related quality of life studies in Indonesia that
use EQ-5D.
71
The Indonesian EQ-5D-5L value set
Introduction
The Indonesian government wishes to improve equal access to health care by introducing
universal health insurance. To ensure health technology assessment (HTA) can be undertaken
for such an insurance scheme, Indonesia intends to employ cost-effectiveness analysis for
new and existing medical interventions. To value the outcomes of a medical intervention
in quality-adjusted life years (QALYs) requires a quality of life instrument that can value
the health states of patients using societal preferences, such as the EQ-5D instrument. At
present no Indonesian EQ-5D value set is available for the calculation of QALYs. There exists
with over 1000 respondents’ representative of the Indonesian population. Below we describe
EQ-5D-5L, its valuation protocol and the place of the EQ-5D in HTA; and (iii) we describe why
we cannot rely on values set from European countries and/or neighbouring countries.
Indonesia is located in South East Asia with 255.5 million inhabitants in 2015 [1].
Commencing in January 2014, Indonesia has implemented universal health care coverage
The Healthcare and Social Security Agency. The aim of the BPJS Kesehatan is to include
The decision-making process related to the implementation of this national health coverage
application of HTA, a decision-making process involving economic evaluation and other
use of health technologies for the population. In 2015, the Ministry of Health of Indonesia
formed a national HTA committee (Komite Penilaian Teknologi Kesehatan). The committee’s
expected output is a policy recommendation to the Minister on the feasibility of the health
Economic evaluation uses clinical evidence to provide systematic consideration of the
effects of all available alternatives regarding health, health care costs, and other effects
regarded as valuable [5]. Cost-utility analysis (CUA) is used to evaluate health-related quality
of life (HRQOL) outcomes and to compare costs and outcomes between different health care
programmes in terms of cost per QALY [5, 6]. A QALY is obtained by integrating a health state
utility function, measured by multi-attribute utility instruments (MAUIs), differentiated over
a lifetime. The 3 most widely used MAUIs are the EQ-5D, the Health Utility Index (HUI),
4
72
Chapter 4
the United Kingdom and Thailand, have recommended EQ-5D as the preferred method for
activities, pain/discomfort, anxiety/depression); followed by a self-rating of overall health
status on a visual analogue scale (EQ VAS) ranging from 0 (“worst imaginable health state")
to 100 (“best imaginable health state") [11, 12]. In 2011, the EuroQol Group expanded the levels
of severity of the classic version of EQ-5D, renamed EQ-5D-3L, from 3 to 5 levels. This new
instrument is designated ‘EQ-5D-5L’ [12]. Recent studies have shown that EQ-5D-5L produces
a richer description of health states, a higher discriminatory power, and a lower ceiling effect
compared to EQ-5D-3L [13-18]. The EuroQol Group has also developed a valuation protocol for
EQ-5D-5L [19], and the EuroQol Group Valuation Technology (EQ-VT) template computerised
protocol provides a value set for the calculation of QALYs using a societal perspective, the
preferred perspective in health economics [5].
Indonesia does not have an EQ-5D value set, either for the 3-level or for the new 5-level
version. Previous EQ-5D studies conducted in Indonesia measured health preferences using
for a value set to be valid for Indonesia, it should represent the culture and living standards of
Indonesia [22]. Moreover, the values should match the particular wording of the Indonesian
instrument: for instance, if “cukup” (that is “moderate”) is less worse in Bahasa Indonesia than
in the Malaysian language (“sederhana”) or in English, then the values should match that
difference. For these reasons the aim of our study was to obtain preferences from the general
population in order to derive a national EQ-5D-5L value set for the calculation of QALYs from
a societal, Indonesian perspective.
Methods
Respondents
A representative sample was recruited from the Indonesian general population, with a
minimum of 1000 respondents aged 17 and over, based on the work of Ramos-Goñi et al.: to
obtain a 0.01 standard error (SE) of the observed mean C-TTO, 9735 C-TTO responses were
needed. Therefore 1000 respondents interviewed will provide 10000 C-TTO and 7000 DC
because in Indonesia, the legal age to obtain an ID card, a driving license, and the access to
73
The Indonesian EQ-5D-5L value set
above 50); and level of education, basic (primary school and below), middle (primary school plus
groups. Two other categories: religion (Islam/Christian/Others) and ethnicity (own-declared
ethnicity: Jawa/Sunda/Sumatera/Sulawesi/Madura-Bali/Others) were considered important
as well. However, including them in the same way as residence, gender, age, and education
would result in 36 x 3 x 6 = 3888 quota groups. We therefore used religion and ethnicity quota
independently from the other factors. So, religion and ethnicity are representative over the
whole sample, but within the individual 36 quota groups, this might not be it the case. To take
We designed and used an online tool to ensure that the recruitment of respondents was
of the country. Interviews were conducted in the following 6 cities and their surroundings,
located in different parts of Indonesia: Jakarta, Bandung, Jogjakarta, Surabaya, Medan, and
Makassar. Respondents were recruited through a mixed strategy, i.e. through personal contact,
local leader assistance, and from public places such as mosques and shopping streets. We also
asked respondents to introduce us to other potential respondents. Interviews were conducted
at the respondents’ or interviewers’ homes. For their participation, all respondents received a
from all respondents included in the study. The study was approved by the Health Research
Ethics Committee, Faculty of Medicine, Padjadjaran University, Indonesia.
Instruments
EQ-5D-5L
slight problems, moderate problems, severe problems, and extreme problems [12]. The EQ-5D-
5L instrument describes 3125 (55) unique health states. A 1-digit number expresses the level
4
74
Chapter 4
washing or dressing, moderate problems doing usual activities, slight pain or discomfort, and
no anxiety or depression’ [12]. Each health state has a so called ‘sum score of the level digits’
means the sum of the levels across domains, e.g. ‘11111’ sum score of the level digits is 5 and
‘54321’ is 15. This EQ-5D descriptive system is followed by self-rating of overall health status
on a visual analogue scale (EQ VAS) ranging from 0 (“worst health you can imagine") to 100
(“best health you can imagine").
Valuation Protocol
i. A general welcome, where the interviewer explains the objectives of the research,
ii. Introduction to and completion of the descriptive system, visual analogue scale (VAS), and
background questions (age, sex, experience of illness, religion, ethnicity, and education).
iii. Composite Time Trade-Off (C-TTO; see section 2.2.3. below) tasks followed by a ‘Feedback
Module’ task. Each respondent has to complete one example (health state: being in a
to imagine: ‘15411’) and 10 ‘real’ C-TTO tasks valuing hypothetical EQ-5D-5L health states.
In the Feedback Module task, the respondents check whether they agree with the order
of the health states they valued before. The EQ-VT screen shows 10 C-TTO tasks’ health
states arranged based on their value given by the respondents: from the lowest value at
with which they do not agree with the previously given relative position to other health
iv.
questions regarding the DCE. Each respondent has to complete 7 forced pair comparisons.
v. A round-up, where respondents can comment on the valuation tasks
vi.
All sections were administered utilising computer-assisted face-to-face interviews employing
the EQ-VT platform version 2.0.
Preference elicitation methods
Time trade-off (TTO) has been widely used as a standard method to elicit preferences [25,
26]. C-TTO uses conventional TTO to elicit better-than-dead (BTD) values, and lead-time TTO
75
The Indonesian EQ-5D-5L value set
to elicit worse-than-dead (WTD) values. Details regarding C-TTO can be found in the study
by Oppe et al.
they had to choose between 10 years in an impaired health state (Life B) and 10 years of
full health (Life A). After a series of choice-based iterations, respondents achieved a point of
equivalence between the length of time in full health (Life A): ‘x’ and a period of time 10 years
example, if a respondent could not differentiate between 3 years of full health in Life A and 10
years living in Life B, then that health state value would be 0.3 (3/10). For a really poor health
is lower than 0 (death value = 0). In this case, the lead-time TTO approach was introduced to
allow respondents to express a value below the value of death, that is below 0. The 2 lives in
the lead-time TTO are 10 years of full health (Life A) and 10 years of full health followed by
10 years in the impaired health state (Life B). When respondents reach an indifference point
Hence, -1 is the lowest possible value of a given health state, generated from trading the full
10 years of Life A in a lead-time TTO.
The EQ-5D-5L valuation protocol included 86 EQ-5D-5L health states to be valued using
C-TTO. The 86 health states were distributed into 10 blocks with a similar level of severity. 80
unique heath states were selected using Monte Carlo simulation (8 unique included in each
block), 5 very mild states (only one dimension at level 2 and all others at level 1, e.g: ‘11112’)
(each included in 2 blocks) and the most severe/’pits’ state (‘55555’) (included in all blocks) [19].
Respondents were randomly assigned to one of the 10 C-TTO blocks. Each state of the block
was presented in random order to respondents using the EQ-VT platform.
valuation techniques to be used in conjunction with TTO to make the valuation studies more
robust and valid. Previous experiments with DCE, like the study by Stolk et al. using EQ-5D-
3L [28] or Ramos-Goñi et al. using EQ-5D-5L [29], showed that Discrete Choice Experiments
(DCE) is a valid valuation technique to get health preference from respondents. Since both
TTO and DCE try to measure the same concept, it was anticipated that DCE, could be used in
combination with TTO [30]. In the light of this reasoning, DCE was included in the EuroQol
VT protocol.
Each DCE task was conducted by presenting 2 health states and asking the respondent
to select the preferred state for him/her. The DCE design consisted of 196 pairs of EQ-5D-5L
health states distributed over 28 blocks, each consisting of 7 pairs with a similar severity
[19]. The 7 paired comparisons were presented in random order by the EQ-VT, in addition, the
4
76
Chapter 4
Data Collection
At the outset 13 interviewers were recruited and trained intensively in a one-day workshop
at 2 locations: (i) Jakarta for interviewers who worked in Jakarta, Bandung, and Makassar;
and (ii) Jogjakarta for interviewers who worked in Jogjakarta, Surabaya and Medan. Each
interviewer performed at least 5 pilot interviews in the week after training. Their experiences
were discussed, and feedback was given by the daily supervisor. Only after this was they
permitted to conduct real data interviews. Three additional interviewers were hired during
the data collection, and they received similar training and met similar requirements to the
interviews we evaluated the quality of the interviews (see section 2.5. below), and we concluded
102 interviews collected thus far as pilot interviews, so excluding the 102 interviews in the
data analysis. A detailed description of this decision-making process and the retraining of
the interviewers is provided elsewhere [30].
Exclusion Criteria
There were two main criteria for data exclusion: lack of completion of an interview and
characteristics of respondents’ answers that related to poor understanding of the task or
excludes respondent answers/responses.
not want to continue the interview process, (ii) interviewers concluded that the respondent
was unable to differentiate between the different dimensions and levels of EQ-5D-5L, (iii)
interviewers concluded that the respondent was not able to comprehend the C-TTO task during
the practice session. When an interview had to be stopped during the C-TTO task, it was
excluded from the study.
With respect to the second criterion, completed interview responses were excluded on
account of any of the following characteristics: (i)a respondent had a positive slope on the
regression between his/her values on C-TTO and the 'sum score of the level digits’, as this
would indicate that the respondent provided higher utility values for poorer health states
on average. The slope of the regression between C-TTO and the 'sum score of the level digits’
was generated as part of the standard quality control report; (ii) when a response in the C-TTO
tasks was judged to be irrational: for instance preferring life B (10 years in the corresponding
health state) to life A (10 years in full health) and not shifting after his/her initial response was
77
The Indonesian EQ-5D-5L value set
Feedback Module task, which was a sign that the respondents disagreed with the valuation
of those responses.
Quality control
To ensure data quality, we followed the quality control (QC) process described by Ramos-Goñi
et al. [32], which consisted of minimum quality criteria and cyclical feedback to improve
interviewers’ skills. The EuroQol Group facilitates use of the EQ-VT QC tool, which is a software
programme that automates the production of QC reports based on data from EQ-VT studies.
EQ-VT support team. The aim of these meetings was to evaluate and improve the interviewers’
performance and to check for possible non-compliance with the interview protocol.
Minimum quality criteria
The QC reports provided a number of statistics related to the quality of the data collected thus
far, differentiated by interviewer.
i. Wheelchair time: when the duration of time an interviewer used to explain the ‘wheelchair
example’ preceding the actual C-TTO tasks was less than three minutes.
ii. Wheelchair lead-time: when the interviewer did not explain the WTD element of the
wheelchair example.
iii.
iv. Inconsistency: the value for state ‘55555’ was not the lowest and it was at least 0.5 higher
than that of the state with the lowest value.
interviewer is conducted. After a further 10 interviews, the performance and compliance are
be removed, and the interviewer is removed from the data collection process. Quality control
The DCE part of the valuation study was also monitored to detect suspicious response
patterns. Assuming that A is the health state at the left of the screen and B is the health state
at the right of the screen, then a consistent preference for the left (A) would be suspicious
(AAAAAAA). The same would apply to the response pattern BBBBBBB, ABABABA, BABABAB.
This was also reported in the QC report.
4
78
Chapter 4
Cyclical feedback
The retraining programme conducted by the daily supervisor was held in 2 locations: (i)
Jakarta for interviewers who worked in Jakarta, Bandung and Makassar; and (ii) Jogjakarta
for interviewers who worked in Jogjakarta, Surabaya, and Medan. The QC reports for their
interviews were presented, discussions were held to address non-compliance problems, and
suitable solutions were agreed upon among the interviewers. After the retraining programme,
the daily supervisor continuously created QC reports, made notes at the group and individual
levels, and sent feedback to the interviewers, so that they were able to learn from their own
and other interviewers’ performance.
Data Analysis
We describe the sample characteristics including self-reported health on the EQ-5D-5L
descriptive system and the EQ-VAS using percentages for discrete variables and means and
standard deviations for continuous variables in comparison with the Indonesian population.
to, or different from, the general population.
as loss of aversion [33] but also has advantages as the TTO based value sets are anchored on
a scale of (0) death (1) full health. DCE is not except of limitations, as lexicographic behavior
from respondent has been widely reported in the literature [34]. It is also noticeable that DCE,
in its present form, where time is not incorporated in health state presentations, it does not
anchor value sets on a (0) death (1) full scale. Therefore, DCE produces value sets on an arbitrary
scale based on the relative distances between health states.
However, both techniques attempt to measure health states preference, but using different
underlying assumptions and seem to do not share same limitations. Therefore, the data
obtained from these two elicitation methods could be seen as complementary, not necessary
competing with each other. Hence, we chose the solution presented by Oppe et al. [35], who
combined DCE with C-TTO in a ‘hybrid model’, imposing the (0) death (1) full health scale as
determined by C-TTO.
To illustrate how the hybrid model combined C-TTO and DCE responses in this study, we
also present the results from the models estimated from each C-TTO and DCE separately, with
the same assumptions as those used for the hybrid model. We used the 20-parameter main
effects model which estimates 4 parameters for the 5 levels of each of the 5 dimensions: i.e.
represents the additional utility decrement of moving from one level to another. Hence the
overall decrement of moving from “no problems” to “unable/extreme problems” is calculated
79
The Indonesian EQ-5D-5L value set
problems”, “moderate problems to severe problems”, and “severe problems to unable”.
Presenting the TTO, the DCE, and the hybrid model, also allows us to compare the value
distribution in the form of the correlations between the predicted values of the models, and we
can compare the weights of the individual dimensions. This gives information about construct
validity in the form of ‘convergent validity’, or ‘concordance’.
Modelling was undertaken using the STATA statistical package. C-TTO data were modelled
using the response values as dependent variables and the health states as explanatory
variables. This was achieved by the implementation of a Tobit model (hyreg with ll() option),
which assumes a latent variable Y*it underlying the observed Yit of C-TTO values when there is
either left- or right-censoring in the dependent variable. The C-TTO data, in particular the lead-
time C-TTO for WTD health states, is by nature censored at -1 (ll(-1) option on hyreg command).
This means that observed preference values were valued by the C-TTO method at -1, despite
the latent preferences of respondents possibly including values lower than -1 [36]. The Tobit
model accounts for this censoring by estimating the latent variable Y*it, which can take on
predicted preference values extrapolated beyond the range of the observed values. Variance
of C-TTO data is not homogeneous among health states; this led us to model C-TTO data as
heteroskedastic data. We used the hetcont() option of the hyreg command as suggested by
Ramos-Goñi et al. [37]. The dummy variables included in the hetcont() option were the same as
DCE (forced pair comparisons in our case) responses were modelled as a conditional
logistic regression model including the same 20 dummy parameters as those used for the
model because they were expressed on a latent arbitrary utility scale. We rescaled the DCE
more details on the modelling see Ramos-Goñi et al. [37, 23].
Pearson product-moment correlation analysis was applied to measure the strength and
direction of association that exists between C-TTO, DCE rescaled, and hybrid predicted values
for 3125 health states.
4
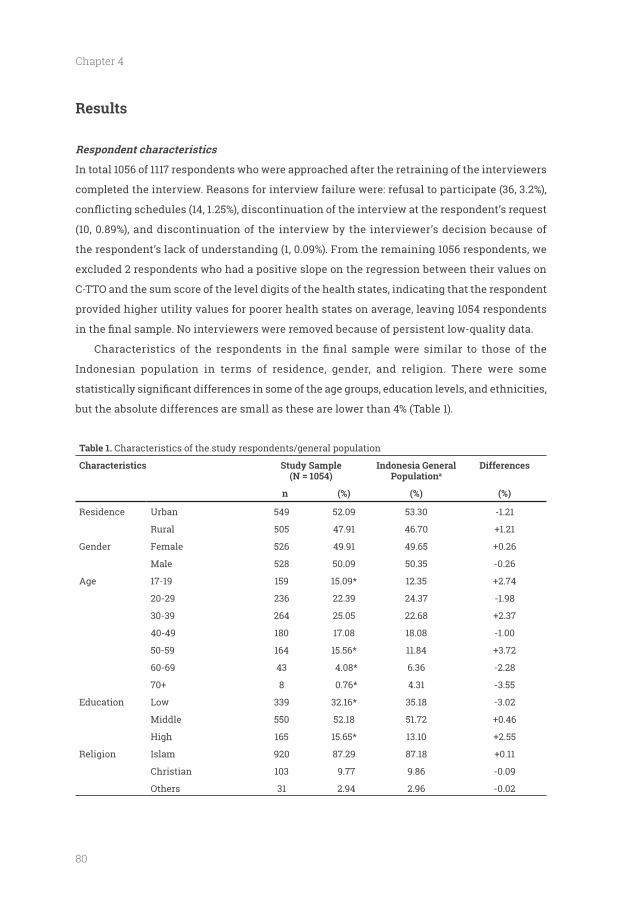
80
Chapter 4
Results
Respondent characteristics
In total 1056 of 1117 respondents who were approached after the retraining of the interviewers
completed the interview. Reasons for interview failure were: refusal to participate (36, 3.2%),
(10, 0.89%), and discontinuation of the interview by the interviewer’s decision because of
the respondent’s lack of understanding (1, 0.09%). From the remaining 1056 respondents, we
excluded 2 respondents who had a positive slope on the regression between their values on
C-TTO and the sum score of the level digits of the health states, indicating that the respondent
provided higher utility values for poorer health states on average, leaving 1054 respondents
Indonesian population in terms of residence, gender, and religion. There were some
but the absolute differences are small as these are lower than 4% (Table 1).
Table 1. Characteristics of the study respondents/general population
Characteristics Study Sample (N = 1054)
Indonesia General Populationa
Differences
n (%) (%) (%)
Residence Urban 549 52.09 53.30 -1.21
Rural 505 47.91 46.70
Gender Female 526 49.91 49.65
Male 528 50.09 50.35 -0.26
Age 17-19 159 15.09* 12.35
20-29 236 22.39 24.37 -1.98
30-39 264 25.05 22.68
40-49 180 17.08 18.08 -1.00
50-59 164 15.56* 11.84
60-69 43 4.08* 6.36 -2.28
8 0.76* 4.31 -3.55
Education Low 339 32.16* 35.18 -3.02
Middle 550 52.18 51.72
High 165 15.65* 13.10
Religion Islam 920 87.29 87.18
Christian 103 9.77 9.86 -0.09
Others 31 2.94 2.96 -0.02
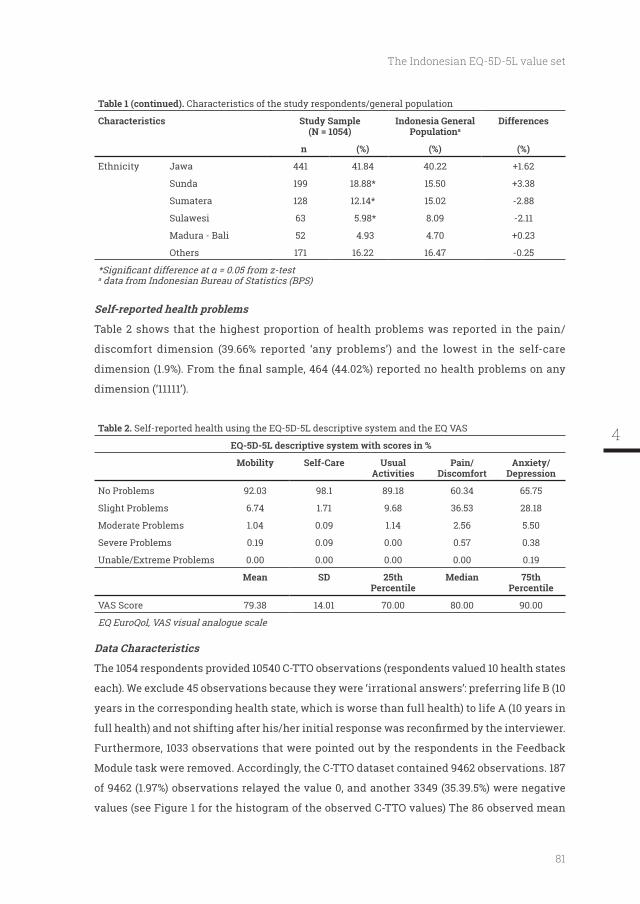
81
The Indonesian EQ-5D-5L value set
Table 1 (continued). Characteristics of the study respondents/general population
Characteristics Study Sample (N = 1054)
Indonesia General Populationa
Differences
n (%) (%) (%)
Ethnicity Jawa 441 41.84 40.22
Sunda 199 18.88* 15.50
Sumatera 128 12.14* 15.02 -2.88
Sulawesi 63 5.98* 8.09 -2.11
Madura - Bali 52 4.93 4.70
Others 171 16.22 16.47 -0.25
a data from Indonesian Bureau of Statistics (BPS)
Self-reported health problems
Table 2 shows that the highest proportion of health problems was reported in the pain/
discomfort dimension (39.66% reported ‘any problems’) and the lowest in the self-care
dimension (‘11111’).
Table 2. Self-reported health using the EQ-5D-5L descriptive system and the EQ VAS
EQ-5D-5L descriptive system with scores in %
Mobility Self-Care Usual Activities
Pain/ Discomfort
Anxiety/ Depression
No Problems 92.03 98.1 89.18 60.34 65.75
Slight Problems 6.74 1.71 9.68 36.53 28.18
Moderate Problems 1.04 0.09 1.14 2.56 5.50
Severe Problems 0.19 0.09 0.00 0.57 0.38
Unable/Extreme Problems 0.00 0.00 0.00 0.00 0.19
Mean SD 25th Percentile
Median 75th Percentile
VAS Score 79.38 14.01 70.00 80.00 90.00
EQ EuroQol, VAS visual analogue scale
Data Characteristics
The 1054 respondents provided 10540 C-TTO observations (respondents valued 10 health states
each). We exclude 45 observations because they were ‘irrational answers’: preferring life B (10
years in the corresponding health state, which is worse than full health) to life A (10 years in
Furthermore, 1033 observations that were pointed out by the respondents in the Feedback
Module task were removed. Accordingly, the C-TTO dataset contained 9462 observations. 187
of 9462 (1.97%) observations relayed the value 0, and another 3349 (35.39.5%) were negative
values (see Figure 1 for the histogram of the observed C-TTO values) The 86 observed mean
4
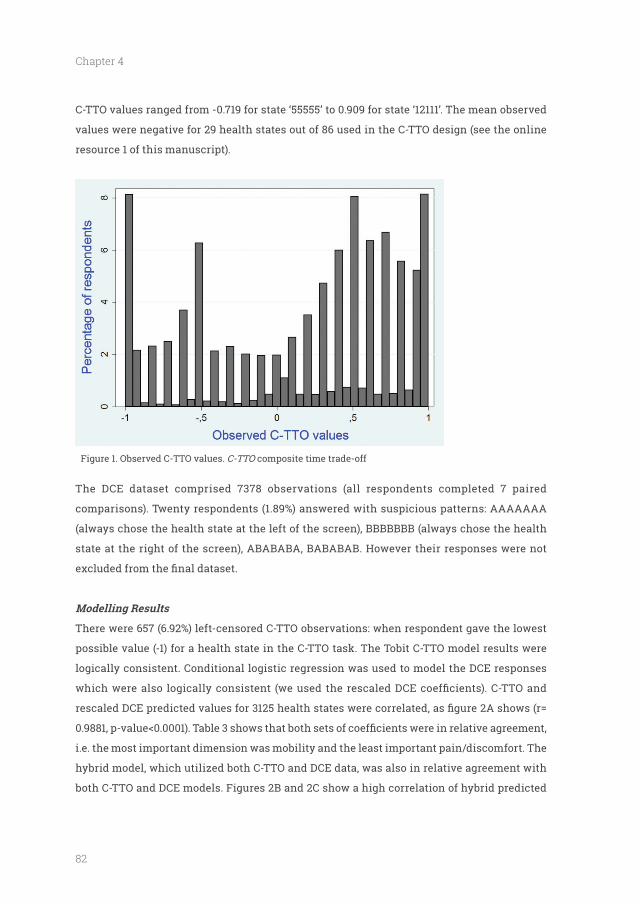
82
Chapter 4
C-TTO values ranged from -0.719 for state ‘55555’ to 0.909 for state ‘12111’. The mean observed
values were negative for 29 health states out of 86 used in the C-TTO design (see the online
resource 1 of this manuscript).
Figure 1. Observed C-TTO values. C-TTO composite time trade-off
The DCE dataset comprised 7378 observations (all respondents completed 7 paired
comparisons). Twenty respondents (1.89%) answered with suspicious patterns: AAAAAAA
(always chose the health state at the left of the screen), BBBBBBB (always chose the health
state at the right of the screen), ABABABA, BABABAB. However their responses were not
There were 657 (6.92%) left-censored C-TTO observations: when respondent gave the lowest
possible value (-1) for a health state in the C-TTO task. The Tobit C-TTO model results were
logically consistent. Conditional logistic regression was used to model the DCE responses
i.e. the most important dimension was mobility and the least important pain/discomfort. The
both C-TTO and DCE models. Figures 2B and 2C show a high correlation of hybrid predicted
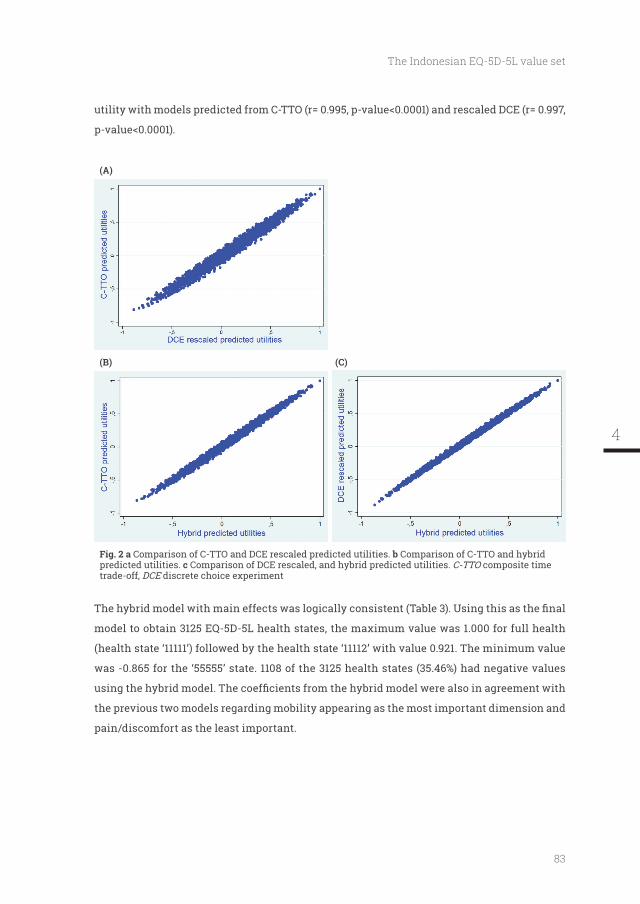
83
The Indonesian EQ-5D-5L value set
(A)
(B) (C)
Comparison of C-TTO and DCE rescaled predicted utilities. b Comparison of C-TTO and hybrid predicted utilities. c Comparison of DCE rescaled, and hybrid predicted utilities. C-TTO composite time trade-off, DCE discrete choice experiment
model to obtain 3125 EQ-5D-5L health states, the maximum value was 1.000 for full health
(health state ‘11111’) followed by the health state ‘11112’ with value 0.921. The minimum value
was -0.865 for the ‘55555’ state. 1108 of the 3125 health states (35.46%) had negative values
the previous two models regarding mobility appearing as the most important dimension and
pain/discomfort as the least important.
4
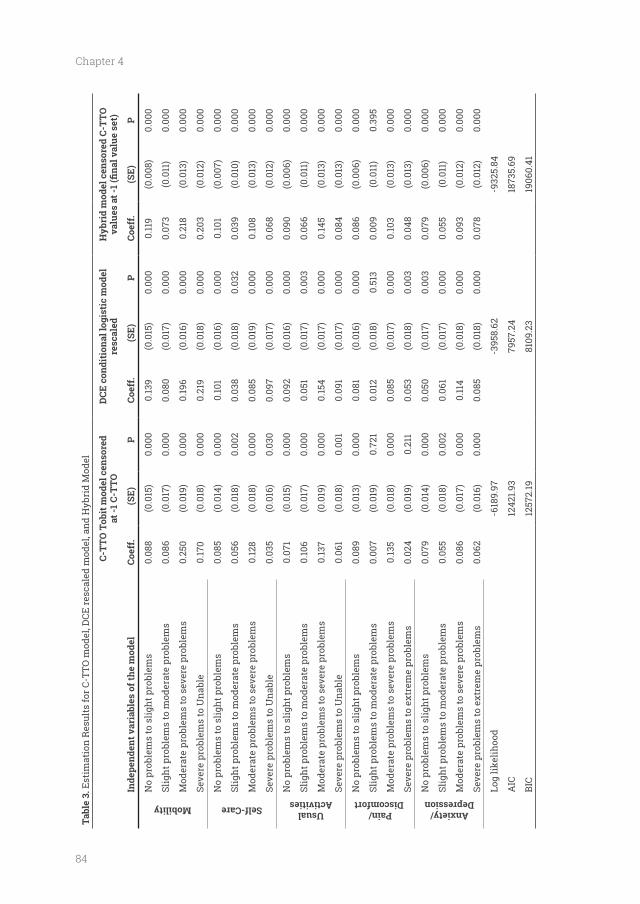
84
Chapter 4
Tabl
e 3.
Est
imat
ion
Res
ults
for C
-TTO
mod
el, D
CE re
scal
ed m
odel
, and
Hyb
rid
Mod
el
C-T
TO T
obit
mod
el c
enso
red
at
-1 C
-TTO
resc
aled
Hyb
rid
mod
el c
enso
red
C-T
TO
Inde
pend
ent v
aria
bles
of t
he m
odel
Coef
f. (
SE)
P
Coef
f.
(SE)
P
Coef
f.(S
E)P
Mobility
No
prob
lem
s to
slig
ht p
robl
ems
0.08
8(0
.015
)0.
000
0.13
9(0
.015
)0.
000
0.11
9(0
.008
)0.
000
Slig
ht p
robl
ems
to m
oder
ate
prob
lem
s0.
086
(0.0
17)
0.00
00.
080
(0.0
17)
0.00
00.
073
(0.0
11)
0.00
0
Mod
erat
e pr
oble
ms
to s
ever
e pr
oble
ms
0.25
0(0
.019
)0.
000
0.19
6(0
.016
)0.
000
0.21
8(0
.013
)0.
000
Seve
re p
robl
ems
to U
nabl
e0.
170
(0.0
18)
0.00
00.
219
(0.0
18)
0.00
00.
203
(0.0
12)
0.00
0
Self-Care
No
prob
lem
s to
slig
ht p
robl
ems
0.08
5(0
.014
)0.
000
0.10
1(0
.016
)0.
000
0.10
1(0
.007
)0.
000
Slig
ht p
robl
ems
to m
oder
ate
prob
lem
s0.
056
(0.0
18)
0.00
20.
038
(0.0
18)
0.03
20.
039
(0.0
10)
0.00
0
Mod
erat
e pr
oble
ms
to s
ever
e pr
oble
ms
0.12
8(0
.018
)0.
000
0.08
5(0
.019
)0.
000
0.10
8(0
.013
)0.
000
Seve
re p
robl
ems
to U
nabl
e0.
035
(0.0
16)
0.03
00.
097
(0.0
17)
0.00
00.
068
(0.0
12)
0.00
0
Usual Activities
No
prob
lem
s to
slig
ht p
robl
ems
0.07
1(0
.015
)0.
000
0.09
2(0
.016
)0.
000
0.09
0(0
.006
)0.
000
Slig
ht p
robl
ems
to m
oder
ate
prob
lem
s0.
106
(0.0
17)
0.00
00.
051
(0.0
17)
0.00
30.
066
(0.0
11)
0.00
0
Mod
erat
e pr
oble
ms
to s
ever
e pr
oble
ms
0.13
7(0
.019
)0.
000
0.15
4(0
.017
)0.
000
0.14
5(0
.013
)0.
000
Seve
re p
robl
ems
to U
nabl
e0.
061
(0.0
18)
0.00
10.
091
(0.0
17)
0.00
00.
084
(0.0
13)
0.00
0
Pain/ Discomfort
No
prob
lem
s to
slig
ht p
robl
ems
0.08
9(0
.013
)0.
000
0.08
1(0
.016
)0.
000
0.08
6(0
.006
)0.
000
Slig
ht p
robl
ems
to m
oder
ate
prob
lem
s0.
007
(0.0
19)
0.72
10.
012
(0.0
18)
0.51
30.
009
(0.0
11)
0.39
5
Mod
erat
e pr
oble
ms
to s
ever
e pr
oble
ms
0.13
5(0
.018
)0.
000
0.08
5(0
.017
)0.
000
0.10
3(0
.013
)0.
000
Seve
re p
robl
ems
to e
xtre
me
prob
lem
s0.
024
(0.0
19)
0.21
10.
053
(0.0
18)
0.00
30.
048
(0.0
13)
0.00
0
Anxiety/ Depression
No
prob
lem
s to
slig
ht p
robl
ems
0.07
9(0
.014
)0.
000
0.05
0(0
.017
)0.
003
0.07
9(0
.006
)0.
000
Slig
ht p
robl
ems
to m
oder
ate
prob
lem
s0.
055
(0.0
18)
0.00
20.
061
(0.0
17)
0.00
00.
055
(0.0
11)
0.00
0
Mod
erat
e pr
oble
ms
to s
ever
e pr
oble
ms
0.08
6(0
.017
)0.
000
0.11
4(0
.018
)0.
000
0.09
3(0
.012
)0.
000
Seve
re p
robl
ems
to e
xtre
me
prob
lem
s0.
062
(0.0
16)
0.00
00.
085
(0.0
18)
0.00
00.
078
(0.0
12)
0.00
0
Log
likel
ihoo
d-6
189.
97
-395
8.62
-932
5.84
AIC
1242
1.93
7957
.24
1873
5.69
BIC
1257
2.19
8109
.23
1906
0.41
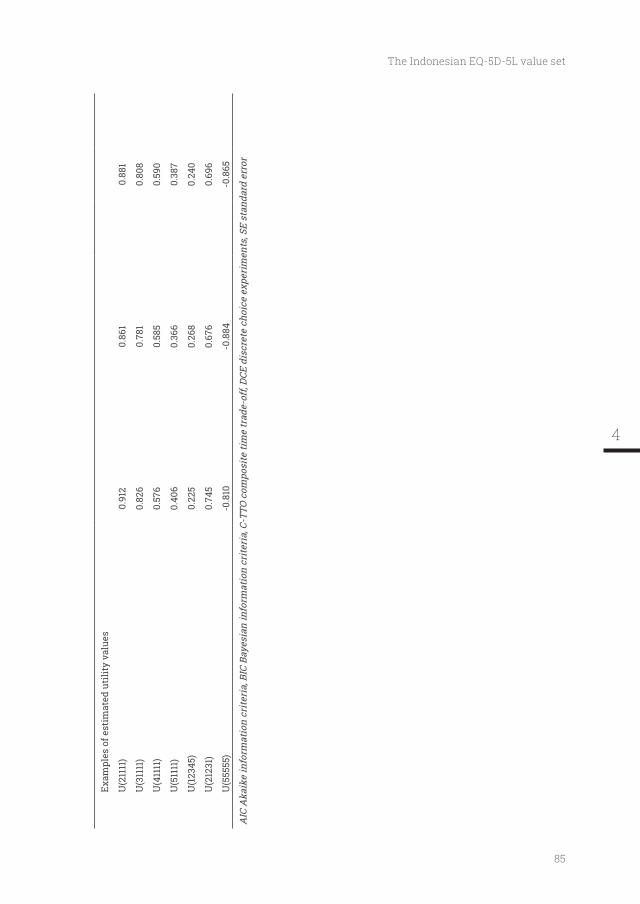
85
The Indonesian EQ-5D-5L value set
Exam
ples
of e
stim
ated
uti
lity
valu
es
U(2
1111
)0.
912
0.86
10.
881
U(3
1111
)0.
826
0.78
10.
808
U(4
1111
)0.
576
0.58
50.
590
U(5
1111
)0.
406
0.36
60.
387
U(1
2345
)0.
225
0.26
80.
240
U(2
1231
)0.
745
0.67
60.
696
U(5
5555
)-0
.810
-0.8
84-0
.865
AIC
Aka
ike
info
rmat
ion
crite
ria,
BIC
Bay
esia
n in
form
atio
n cr
iteri
a, C
-TTO
com
posi
te ti
me
trad
e-of
f, DC
E di
scre
te c
hoic
e ex
peri
men
ts, S
E st
anda
rd e
rror
4
86
Chapter 4
To obtain utility for an EQ-5D-5L health state, for instance ‘12345’, the following calculation
Utility weight (‘12345’) = 1 – no problems in MO (0) – no problems to slight problems in SC
(0. 101) – no problems to slight problems in UA (0.090) – slight problems to moderate problems
in UA (0.066) – no problems to slight problems in PD (0.086) – slight problems to moderate
problems in PD (0.009) – moderate problems to severe problems in PD (0.103) – no problems to
slight problems in AD (0.079) – slight problems to moderate problems in AD (0.055) – moderate
problems to severe problems in AD (0.093) – severe problems to extreme problems in AD5
(0.078) = 0.240.
level to another.
Discussion
The aim of this study was to obtain social preferences and thus derive an EQ-5D-5L value set
from the Indonesian general population. To obtain values for 3125 EQ-5D-5L health states,
1054 respondents were interviewed using the computer-assisted EuroQol Group valuation
protocol. C-TTO and DCE were part of the protocol employed in 6 cities and their surrounding
areas. We used an iterative quality control approach in order to obtain high quality data. The
socio-demographic characteristics of the respondents were similar to those of the Indonesian
population with respect to residence, gender, age, level of education, ethnicity, and religion.
health insurance scheme. Furthermore, non-HTA studies in Indonesia such as those using
patient-reported outcome measures (PROMs), clinical trials, or improvements in hospital care,
could use EQ-5D-5L as an instrument to measure HRQOL, with the notion that the values
attached to the health states are societal values.
Several limitations of this study should be considered. It could be argued that there are
sample compared with the data provided by the National Bureau of Statistics. There are
education levels, and some ethnicity groups. As a check to see if such small differences were
of importance, we compared observed C-TTO values for each health state between respondents
with different levels of age, education, and ethnicity. There was no clear pattern of differences
in the health state values. Moreover, as can be seen in Table 1, the percentage deviations were
87
The Indonesian EQ-5D-5L value set
than 1000 respondents. Given these observations, and given that weighting for background
variables would add additional complexity, we chose not to introduce weighting for these
small deviations from full representativeness.
the respondents could raise questions about the objectivity/ representativeness of the study
constructed a representative sample based on pre-determined variables: rural/urban, gender,
age, level of education, religion, and ethnicity. A further investigation could be conducted
respondents is not preferable or acceptable.
Indonesia has 5 major islands which are inhabited by 93.5% of the population [1]. However,
92.9% of respondents interviewed in this study were living on Java Island. This might raise
questions about the representativeness of the study sample. However, we focused the data
collection on Java island because it is the most populous island (57% of the population) and
the main target of migration from all over Indonesia. The diversity of its residents in terms
do not know whether the values obtained in Java from these migrants would have differed
from the values should the interviews have been conducted on their original islands. One
way to investigate whether location is indeed an issue in valuing health in Indonesia would
be to sample values for health states at different places/islands in the republic. For instance,
the same health states could be valued in Aceh (west), Java (middle) and Papua (east). Such
a study could then be used to provide the motivation for additional studies that sample the
values for people living in other parts of the archipelago. For the time being, we conclude
that the present value set is the best representative values set for the EQ-5D-5L now available
of the Indonesian.
which was assured by i) the extensive use of the QC report provided by the EuroQol Group,
further analysis using the hybrid model demonstrated that the results of these interviews
4
88
Chapter 4
showed logical inconsistencies in self-care and pain/discomfort dimensions, together with a
Second, the Indonesian results present more negative values than any other EQ-5D-5L
valuation studies undertaken so far, i.e. in the UK, the Netherlands, Canada, Uruguay, Japan,
and Korea [38-43]. It could be argued that the high number of negative values is the result
of interaction between process-related factor: quality control process and cultural-related
factor: interdependence among the members of a society (collectivism vs individualism). This
study implemented quality control process rigorously. It is possible that this quality control
process provides the interviewer with better feedback and therefore better skills to administer
the complex worse-than-dead trade-offs. So, the more valid administration of the C-TTO,
means that more interviewers follow the protocol, which could have led to higher proportion
of negative values. The cultural factor, namely collectivism, might play a role. People from
collectivistic cultures, such as Indonesia, are more concerned with how their illness might
affect their closest circles such as family and friends [44]. Moreover, they are more reluctant
to explicitly asked for help [45]. Some comments from our respondents support this: having
severe or extreme/unable problems in EQ-5D dimensions was very bad for themselves but will
also be a burden for their closest circles (family and friends). For other respondents, they prefer
to die than to bother their families and friends when they have a severe illness. The EQ-5D-3L
value set of Singapore, the neighbouring country of Indonesian and a collectivistic country as
well, showed the all-worst state ‘33333’ was -0.769 [46]. When more national valuation studies
are published, it will be possible for a further investigation to disentangled the effect of these
factors on proportion of worse-than-dead values in EQ-5D-5L valuation study.
Third, we had a low level of non-response: only 61 of the 1117 respondents. Our recruitment
strategy, which involved local leaders and asking respondents to recommend our study to
other people, contributed to this low number.
Fourth, this study was performed according to the EuroQol Group’s EQ-5D-5L valuation
most, similar to EQ-5D-5L valuation study results from Uruguay and South Korea [41, 43]. The
of the EQ-5D-5L value sets of England and the Netherlands where this dimension was in
due to better infrastructure provision and less emphasis on manual labour. It could also be
argued that Indonesian people have adapted to mild levels of pain or discomfort, or perhaps
89
The Indonesian EQ-5D-5L value set
they considered a mild level of pain or discomfort something they have to live with. The same
line of reasoning applies to anxiety/depression: Indonesian people report more problems in
anxiety/depression and have adapted to these mild levels of anxiety/ depression, or they
consider this as part of normal life. It could also be a result of small differences in translation.
If the translated Indonesian words for depression and anxiety refer to a lighter problem, then
it makes sense that the prevalence was higher and the disutility lower. Indeed, there are some
indications that this was the case. In the Indonesian EQ-5D translation the word ‘sedih’, which
might also be translated as ‘sadness’, is added to the description of the anxiety/ depression
dimension. These kinds of interactions between the description of the dimensions and the
values attached justify attempts to utilise local and linguistically matched value sets for
utility questionnaires such as EQ-5D. If not, value sets based on other languages might apply
the wrong (higher) utilities to the descriptors. For instance, it is now clear that one cannot
use the UK value for anxiety/depression for the Indonesian descriptor with an additional
word ‘sadness’.
mobility dimension most affects utility could be implemented in Indonesian government
policies, such as allocating more funds to the prevention of diabetic foot ulcers or other
interventions that improve mobility like better wheelchairs. Moreover, the anxiety and
depression problems reported should be addressed. If so, the discussion concerning the
translation of the anxiety and depression dimension mentioned in the paragraph above
Indonesia, mental health treatment by professionals such as psychologists and psychiatrists
within the national health insurance scheme should be considered.
Indonesia is endeavouring to implement HTA comprehensively. The present research
shows that in measuring and valuing quality of life, Indonesia bears comparison with the
leading countries employing HTA. Evidently Indonesia still has ground to conquer when
dealing with models, cost data, and decision-making. Nevertheless, this research shows that
it is possible to arrive at an established level of HTA methodology in a short time-span when
cooperating at an international level.
Conclusion
preferences. We expect our results to promote and facilitate health economic evaluations in
Indonesia which can help to inform decision makers concerning resource allocation decisions.
4
90
Chapter 4
Data Availability Statement
The datasets generated during and/or analysed during the current study are available from
the corresponding author on reasonable request
(VDMS)’ and ‘Indonesia Bhadra Utama (IBU) Foundation’ helped us with the data collection.
Any errors or omissions are the responsibility of the authors only
Author Contribution
JB, JP, and JH designed the study and acquired the funding. SS and AI provided detail
information regarding data collection process in Indonesia during study design phase. FDP
coordinated the data acquisition, assisted by TSF and AI. FDP and JMR conceived the analysis.
submitted manuscript to ensure accuracy and fair balance.
Compliance with Ethical Standards
All procedures performed in studies involving human participants were in accordance with
the ethical standards of the institutional research committee [Padjadjaran University Health
Research Ethics Committee (no: 065/UN6.C1.3.2/KEPK/PN/2015)]
of Indonesia (http://www.dikti.go.id). Both grants were unrestricted.
The following authors are members of the EuroQol Research Foundation (the copyright holders
91
The Indonesian EQ-5D-5L value set
References
1. Badan Pusat Statistik. Statistik 70 Tahun Indonesia Merdeka. Badan Pusat Statistik, Jakarta 2015. http://bps.go.id/index.php/publikasi/1053. Accessed November 3, 2015.
2. bpjs-kesehatan.go.id. Vision and Mission. BPJS Kesehatan. 2010. http://bpjs-kesehatan.go.id/bpjs/index.php/pages/detail/2010/2. Accessed November 4th, 2015.
3. President of Republik Indonesia. Peraturan Presiden Republik Indonesia Nomor 12 Tahun 2013 Tentang Jaminan Kesehatan Jakarta. 2013. http://bpjs-kesehatan.go.id/bpjs/index.php/unduh/index/3. Accessed November 14, 2015.
4. with National agency/unit/committee that produces HTA reports for the Ministry of
http://www.who.int/health-technology-assessment / Nat iona l AgencieH TA .p d f . Accessed November 5th, 2015.
5. Drummond M, Sculpher MJ, Claxton K, Stoddart GL, Torrance GW. Methods for the Economic Evaluation of Health Care Programmes (Fourth edition). Oxford: Oxford University Press; 2015.
6. multi-attribute utility instruments produce different utilities: the relative importance of the descriptive systems, scale and 'micro-utility' effects. Qual Life Res. 2015;24(8):2045-53.
7. Comparing and explaining differences in the magnitude, content, and sensitivity of utilities predicted by the EQ-5D, SF-6D, HUI 3, 15D, QWB, and AQoL-8D multiattribute utility instruments. Med Decis Making. 2015;35(3):276-91.
8. J, Richardson J. Mapping between 6 Multiattribute Utility Instruments. Med Decis Making. 2016;36(2):160-75.
9. Rawlins MD, Culyer AJ. National Institute for Clinical Excellence and its value judgments. BMJ. 2004;329(7459):224-7.
10. Sakthong P. Measurement of clinical-effect: utility. J Med Assoc Thai. 2008;91 Suppl 2:S43-52.
11. Brooks R. EuroQol: the current state of play. Health Policy. 1996;37(1):53-72.
12. Herdman M, Gudex C, Lloyd A, Janssen M, Kind P, Parkin D et al. Development and
version of EQ-5D (EQ-5D-5L). Qual Life Res. 2011;20(10):1727-36. doi:10.1007/s11136-011-9903-x.
13. Feng Y, Devlin N, Herdman M. Assessing the health of the general population in England:
EQ-5D compare? Health Qual Life Outcomes. 2015;13(1):171.
14. Pattanaphesaj J, Thavorncharoensap M. Measurement properties of the EQ-5D-5L compared to EQ-5D-3L in the Thai diabetes patients. Health Qual Life Outcomes. 2015;13:14.
15. Conner-Spady BL, Marshall DA, Bohm E, Dunbar MJ, Loucks L, Khudairy AA et al. Reliability and validity of the EQ-5D-5L compared to the EQ-5D-3L in patients with osteoarthritis referred for hip and knee replacement. Qual Life Res. 2015;24(7):1775-84.
16. Kobayashi A, Janssen MF et al. Comparing responsiveness of the EQ-5D-5L, EQ-5D-3L and EQ VAS in stroke patients. Qual Life Res. 2015;24(6):1555-63.
17. Greene ME, Rader KA, Garellick G, Malchau H, Freiberg AA, Rolfson O. The EQ-5D-5L Improves on the EQ-5D-3L for Health-related Quality-of-life Assessment in Patients Undergoing Total Hip Arthroplasty. Clin Orthop Relat Res. 2015;473(11):3383-90.
18. Agborsangaya CB, Lahtinen M, Cooke T, Johnson JA. Comparing the EQ-5D 3L and 5L: measurement properties and association with chronic conditions and multimorbidity in the general population. Health Qual Life Outcomes. 2014;12:74.
19. Oppe M, Devlin NJ, van Hout B, Krabbe PF, de Charro F. A program of methodological research to arrive at the new international EQ-5D-5L valuation protocol. Value Health. 2014;17(4):445-53. doi:10.1016/j.jval.2014.04.002.
20. Endarti D, Riewpaiboon A, Thavorncharoensap M, Praditsitthikorn N, Hutubessy R, Kristina SA. Evaluation of Health-Related Quality of Life among Patients with Cervical Cancer in Indonesia. Asian Pac J Cancer Prev. 2015;16(8):3345-50.
4
92
Chapter 4
21. Iskandar S, van Crevel R, Hidayat T, Siregar IM, Achmad TH, van der Ven AJ et al. Severity of psychiatric and physical problems is associated with lower quality of life in methadone patients in Indonesia. Am J Addict. 2013;22(5):425-31.
22. Rashidian A, Mohammad K. Population-Based Preference Weights for the EQ-5D Health States Using the Visual Analogue Scale (VAS) in Iran. Iran Red Crescent Med J. 2016;18(2):e21584.
23. Ramos-Goñi JM, Pinto-Prades JL, Oppe M, Cabasés JM, Serrano-Aguilar P, Rivero-Arias O. Valuation and Modeling of EQ-5D-5L Health States Using a Hybrid Approach. Med Care. 2017;55(7):e51-e8.
24. Rabin R, Gudex C, Selai C, Herdman M. From translation to version management: a history and review of methods for the cultural
questionnaire. Value Health. 2014;17(1):70-6.
25. Dolan P. Modeling valuations for EuroQol health states. Med Care. 1997;35(11):1095-108.
26. Shaw JW, Johnson JA, Coons SJ. US valuation of the EQ-5D health states: development and testing of the D1 valuation model. Med Care. 2005;43(3):203-20.
27. Oppe M, Rand-Hendriksen K, Shah K, Ramos-Goni JM, Luo N. EuroQol Protocols for Time Trade-Off Valuation of Health Outcomes. Pharmacoeconomics. 2016;34(10):993-1004.
28. Stolk EA, Oppe M, Scalone L, Krabbe PF. Discrete choice modeling for the
EQ-5D. Value Health. 2010;13(8):1005-13.
29. Ramos-Goni JM, Rivero-Arias O, Errea M, Stolk EA, Herdman M, Cabases JM. Dealing with the health state 'dead' when using discrete choice experiments to obtain values for EQ-5D-5L heath states. Eur J Health Econ. 2013;14 Suppl 1:S33-42. doi:10.1007/s10198-013-0511-2.
30. Purba FD, Hunfeld JAM, Iskandarsyah A, Fitriana TS, Sadarjoen SS, Passchier J et al. Employing quality control and feedback to the EQ-5D-5L valuation protocol to improve the quality of data collection. Qual Life Res. 2017;26(5):1197-208. doi:10.1007/s11136-016-1445-9.
31. Busschbach JJ, McDonnell J, Essink-Bot ML, van Hout BA. Estimating parametric relationships between health description and health valuation with an application to the EuroQol EQ-5D. J Health Econ. 1999;18(5):551-71.
32. Ramos-Goñi JM, Oppe M, Slaap B, Busschbach JJV, Stolk E. Quality Control Process for EQ-5D-5L Valuation Studies. Value Health. 2016. doi:10.1016/j.jval.2016.10.012.
33. Bleichrodt H, Pinto JL. Loss Aversion and Scale Compatibility in Two-Attribute Trade-Offs. J Math Psychol. 2002;46(3):315-37. doi:http://doi.org/10.1006/jmps.2001.1390.
34. Hawkins SA. Information Processing Strategies in Riskless Preference Reversals: The Prominence Effect. Organ Behav Hum Decis Process. 1994;59(1):1-26. doi:http://dx.doi.org/10.1006/obhd.1994.1048.
35. Oppe M, van Hout B. The optimal hybrid: Experimental design and modeling of a
Plenary Meeting of the EuroQol Group-Proceedings; Athens, Greece: EuroQol Group
36. Attema AE, Versteegh MM, Oppe M, Brouwer WB, Stolk EA. Lead time TTO: leading to better health state valuations? Health Econ. 2013;22(4):376-92.
37. Ramos-Goñi JM, Craig BM, Oppe M, van Hout B. Combining continuous and dichotomous responses in a hybrid model. EuroQol Research Foundation. 2016. http://www.euroqol.org/eq-5d-publications/working-paper-series/file/EuroQol_Working_Paper_Series_Manuscript_16002_-_Juan_Ramos-Goni_01.pdf.html Accessed 2 January 2017.
38. Devlin N, Shah K, Feng Y, Mulhern B, van Hout B. Valuing health-related quality of life: an EQ-5D-5L value set for England. OHE Research Paper. 2015. https://www.ohe.org/publications/valuing-health-related-quality-life-eq-5d-5l-value-set-england. Accessed 4 Nov 2015
39. Versteegh MM, Vermeulen KM, Evers SMAA, de Wit GA, Prenger R, Stolk EA. Dutch Tariff for the Five-Level Version of EQ-5D. Value Health. 2016;19(4):343-52. doi:10.1016/j.jval.2016.01.003.
40. Xie F, Pullenayegum E, Gaebel K, Bansback N, Bryan S, Ohinmaa A et al. A Time Trade-off-derived Value Set of the EQ-5D-5L for Canada. Med Care. 2016;54(1):98-105.
41.
5L value set based on Uruguayan population preferences. Qual Life Res. 2016;25(2):323-33.
42. Ikeda S, Shiroiwa T, Igarashi A, Noto S, Fukuda T, Saito S et al. Developing a Japanese version of the EQ-5D-5L value set. J Natl Inst Public Health. 2015;64:47-55.
93
The Indonesian EQ-5D-5L value set
43. Kim SH, Ahn J, Ock M, Shin S, Park J, Luo N et al. The EQ-5D-5L valuation study in Korea. Qual Life Res. 2016;25(7):1845-52. doi:10.1007/s11136-015-1205-2.
44. U skul AyK, H ynie Mi. Self-Construal and Concerns Elicited by Imagined and Real Health Problems. J Appl Soc Psychol. 2007;37(9):2156-89.
45. Kim HS, Sherman DK, Taylor SE. Culture and social support. Am Psychol. 2008;63(6):518-26.
46. Luo N, Wang P, Thumboo J, Lim YW, Vrijhoef HJ. Valuation of EQ-5D-3L health states in Singapore: modeling of time trade-off values for 80 empirically observed health states. Pharmacoeconomics. 2014;32(5):495-507. doi:10.1007/s40273-014-0142-1.
4
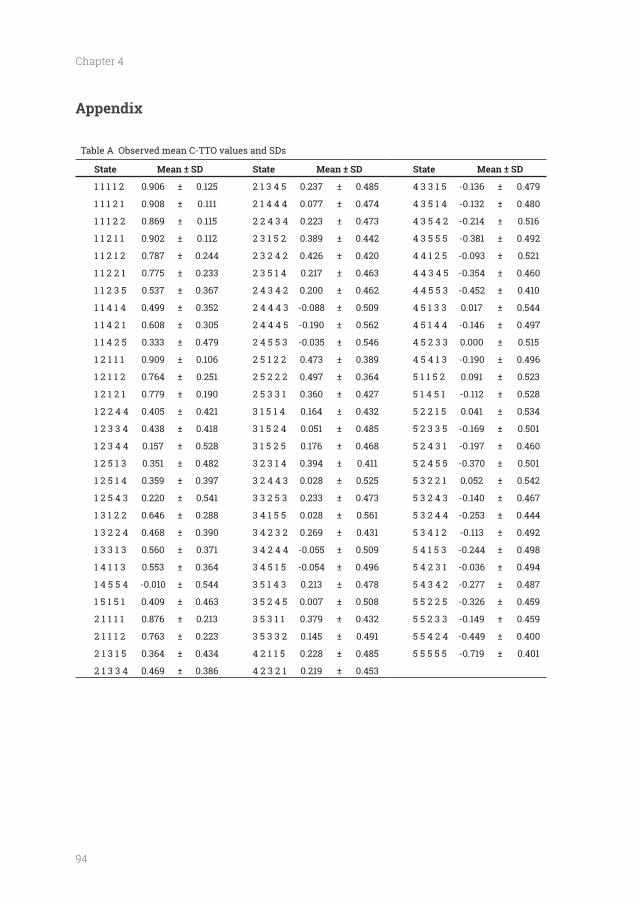
94
Chapter 4
Appendix
Table A Observed mean C-TTO values and SDs
State Mean ± SD State Mean ± SD State Mean ± SD
1 1 1 1 2 0.906 0.125 2 1 3 4 5 0.237 0.485 4 3 3 1 5 -0.136 0.479
1 1 1 2 1 0.908 0.111 2 1 4 4 4 0.077 0.474 4 3 5 1 4 -0.132 0.480
1 1 1 2 2 0.869 0.115 2 2 4 3 4 0.223 0.473 4 3 5 4 2 -0.214 0.516
1 1 2 1 1 0.902 0.112 2 3 1 5 2 0.389 0.442 4 3 5 5 5 -0.381 0.492
1 1 2 1 2 0.787 0.244 2 3 2 4 2 0.426 0.420 4 4 1 2 5 -0.093 0.521
1 1 2 2 1 0.775 0.233 2 3 5 1 4 0.217 0.463 4 4 3 4 5 -0.354 0.460
1 1 2 3 5 0.537 0.367 2 4 3 4 2 0.200 0.462 4 4 5 5 3 -0.452 0.410
1 1 4 1 4 0.499 0.352 2 4 4 4 3 -0.088 0.509 4 5 1 3 3 0.017 0.544
1 1 4 2 1 0.608 0.305 2 4 4 4 5 -0.190 0.562 4 5 1 4 4 -0.146 0.497
1 1 4 2 5 0.333 0.479 2 4 5 5 3 -0.035 0.546 4 5 2 3 3 0.000 0.515
1 2 1 1 1 0.909 0.106 2 5 1 2 2 0.473 0.389 4 5 4 1 3 -0.190 0.496
1 2 1 1 2 0.764 0.251 2 5 2 2 2 0.497 0.364 5 1 1 5 2 0.091 0.523
1 2 1 2 1 0.779 0.190 2 5 3 3 1 0.360 0.427 5 1 4 5 1 -0.112 0.528
1 2 2 4 4 0.405 0.421 3 1 5 1 4 0.164 0.432 5 2 2 1 5 0.041 0.534
1 2 3 3 4 0.438 0.418 3 1 5 2 4 0.051 0.485 5 2 3 3 5 -0.169 0.501
1 2 3 4 4 0.157 0.528 3 1 5 2 5 0.176 0.468 5 2 4 3 1 -0.197 0.460
1 2 5 1 3 0.351 0.482 3 2 3 1 4 0.394 0.411 5 2 4 5 5 -0.370 0.501
1 2 5 1 4 0.359 0.397 3 2 4 4 3 0.028 0.525 5 3 2 2 1 0.052 0.542
1 2 5 4 3 0.220 0.541 3 3 2 5 3 0.233 0.473 5 3 2 4 3 -0.140 0.467
1 3 1 2 2 0.646 0.288 3 4 1 5 5 0.028 0.561 5 3 2 4 4 -0.253 0.444
1 3 2 2 4 0.468 0.390 3 4 2 3 2 0.269 0.431 5 3 4 1 2 -0.113 0.492
1 3 3 1 3 0.560 0.371 3 4 2 4 4 -0.055 0.509 5 4 1 5 3 -0.244 0.498
1 4 1 1 3 0.553 0.364 3 4 5 1 5 -0.054 0.496 5 4 2 3 1 -0.036 0.494
1 4 5 5 4 -0.010 0.544 3 5 1 4 3 0.213 0.478 5 4 3 4 2 -0.277 0.487
1 5 1 5 1 0.409 0.463 3 5 2 4 5 0.007 0.508 5 5 2 2 5 -0.326 0.459
2 1 1 1 1 0.876 0.213 3 5 3 1 1 0.379 0.432 5 5 2 3 3 -0.149 0.459
2 1 1 1 2 0.763 0.223 3 5 3 3 2 0.145 0.491 5 5 4 2 4 -0.449 0.400
2 1 3 1 5 0.364 0.434 4 2 1 1 5 0.228 0.485 5 5 5 5 5 -0.719 0.401
2 1 3 3 4 0.469 0.386 4 2 3 2 1 0.219 0.453

95
The Indonesian EQ-5D-5L value set
4

Quality of life of the Indonesian general population: test-retest reliability and population norms
of the EQ-5D-5L and WHOQOL-BREF
Published as: Purba FD, Hunfeld JA, Iskandarsyah A, Fitriana TS, Sadarjoen SS, Passchier
J, et al. Quality of life of the Indonesian general population: Test-retest reliability and
population norms of the EQ-5D-5L and WHOQOL-BREF. PLoS One. 2018;13(5):e0197098.
98
Chapter 5
Abstract
OBJECTIVES: The objective of this study is to obtain population norms and to assess test-retest
reliability of EQ-5D-5L and WHOQOL-BREF for the Indonesian population.
METHODS: A representative sample of 1056 people aged 17-75 years was recruited from the
with respect to residence, gender, age, education level, religion, and ethnicity. Respondents
completed EQ-5D-5L and WHOQOL-BREF with help from an interviewer. Norms data for both
instruments were reported. For the test-retest evaluations, a sub-sample of 206 respondents
completed both instruments twice.
RESULTS: The total sample and test-retest sub-sample were representative of the Indonesian
general population. The EQ-5D-5L shows almost perfect agreement between the two tests
However, the agreement of EQ-VAS and index scores can be considered as poor (ICC: 0.45 and
0.37 respectively). For the WHOQOL-BREF, ICCs of the four domains were between 0.70 and
0.79, which indicates moderate to good agreement. For EQ-5D-5L, it was shown that female
and older respondents had lower EQ-index scores, whilst rural, younger and higher-educated
respondents had higher EQ-VAS scores. For WHOQOL-BREF: male, younger, higher-educated,
high-income respondents had the highest scores in most of the domains, overall quality of
life, and health satisfaction.
CONCLUSIONS: This study provides representative estimates of self-reported health status
and quality of life for the general Indonesian population as assessed by the EQ-5D-5L and
WHOQOL-BREF instruments. The descriptive system of the EQ-5D-5L and the WHOQOL-BREF
have high test-retest reliability while the EQ-VAS and the index score of EQ-5D-5L show poor
agreement between the two tests. Our results can be useful to researchers and clinicians
general population.
99
Quality of life of the Indonesian general population
Introduction
perceived health status in epidemiological surveys, (ii) to assess the subjective health and
well-being of populations and patients, (iii) to measure outcomes in effectiveness studies, and
The latter is designed to narrow the scope of assessment to the health-related problems in
There are several generic measures of HRQOL that are widely used in the world, including
depression (3). The descriptive system constructed from these dimensions can be converted
into an index score by applying health preference weights elicited from a general population.
This index score can also be used in economic evaluations to assess the cost-effectiveness
of health interventions and is as such one of the most widely used HRQOL questionnaires in
the world (4).
measures four domains of quality of life: physical, psychological, social and environmental with
its 26 items. It was devised from a cross-cultural methodology to be used in epidemiological
studies and in transcultural investigations (5, 6). The WHOQOL-BREF presents a differentiated
picture of quality of life, addressing social, psychological, physical, and environmental
functioning (7).
These two instruments have been proved valid in many contexts, and across many
health conditions in many countries (6, 8-16), including Indonesia (17, 18). In Indonesia,
both questionnaires are increasingly being used in different types of investigations, for
example in the measurement of quality of life in different patient groups (19-22) and cost-
effectiveness studies (23-25). Thus far, no investigation has measured the stability over time
of both questionnaires when measuring the HRQOL of the Indonesian general population:
if the results change over time due to its unreliability. Moreover, increasing use of both
questionnaires in Indonesia demands the need for normative scores to be used as reference
values for various patient groups or any particular group of individuals comparison. This
need is particularly felt as in the coming years a new national health insurance system is
implemented in the whole of Indonesia, requiring a monitoring system for evaluation of its
5
100
Chapter 5
effect. These general population norms, provide a useful guide to interpret the results of
different studies of quality of life. Such population norms are not available in Indonesia.
Therefore, the aims of this study were to measure the test-retest reliability of EQ-5D-5L and
WHOQOL-BREF and to derive Indonesian adult general population norms for both instruments
according to different socio-demographic characteristics, i.e. residence, gender, age, education
level, income, religion, and ethnicity.
Methods
This study was part of a larger study focused upon the adult general population, in which
interviewers or the homes of the subjects. The present manuscript is focused on presenting
the frequency distribution of the responses on the descriptive part of EQ-5D-5L and WHOQOL-
BREF (see below) as obtained in the Indonesian general population. This study must be
distinguished from the study in which we ‘valued’ the health states of the EQ-5D with Time
Trade-Off (TTO) and Discrete Choice Experiments (DCE) (26) using the same population.
The outcome of that study is of interest for the use of the EQ-5D-5L in health economics
and Health Technology Assessment. The present study reports on the more classical way of
presenting norm score, that is the frequency of the score in the general population. The study
was approved by the Health Research Ethics Committee, Faculty of Medicine, Padjadjaran
University, Indonesia.
The details of sampling and interviewers could be found elsewhere (26). In short, a multistage
female), age (17-30/31-50/above 50), level of education (basic: primary school and below/middle:
high school/high: all others), religion (Islam/Christian/Others) and ethnicity (self-declared:
on data from the Indonesian Bureau of Statistics (27). Each respondent received a mug or a
Sixteen interviewers were hired to collect the data. Data collection was conducted in
six cities and their surroundings located in different parts of Indonesia: Jakarta, Bandung,
Jogjakarta, Surabaya, Medan, and Makassar. Signed informed consent was obtained from all
the respondents.
101
Quality of life of the Indonesian general population
The retest interview was held by the same interviewer. The characteristics of the test-retest
sub-sample were matched with the Indonesian general population for three factors: residence,
gender, and age. The other three characteristics: level of education, religion, and ethnicity,
willing to participate in the second interview.
Instruments
(MO), self-care (SC), usual activities (UA), pain/discomfort (PD), and anxiety/depression
(AD). Responses are recorded on a 5-point scale indicating levels of severity: no problems,
slight problems, moderate problems, severe problems, and unable/extreme problems. This
‘descriptive system’ is followed by a self-rating of overall health status on a visual analogue
scale (EQ-VAS) ranging from 0 (“The worst health you can imagine") to 100 (“The best health
protocol (28) and has been proven as a valid and reliable questionnaire to be used in Indonesia
(17). Completion of EQ-5D-5L was undertaken using an online version of the questionnaire, as
part of the EuroQol EQ-Valuation Technology (EQ-VT) platform version 2.0.
The WHOQOL-BREF was developed by the WHOQOL Group as a short version of the
WHOQOL-100. This instrument comprises 26 questions, two of which measure the overall
quality of life and general health. The other 24 questions are divided into four domains:
physical, psychological, social relationships, and environmental. Each item is scored on a
scale from 1 to 5. The scores are then transformed into a linear scale between 0 and 100,
with 0 being the least favourable quality of life and 100 being the most favourable (5). The
Indonesian version of the WHOQOL-BREF is available and has been proven as a valid and
reliable questionnaire to be used in Indonesia (18). In line with the manual of the English
version of the WHOQOL-BREF (29), we chose to apply a time-frame for the WHOQOL-BREF
Indonesia version. We used the self-administered paper-based WHOQOL-BREF for this study.
Demographic data was collected using a questionnaire, which included: name, place, and
date of birth, ethnicity, religion, education level, work status, monthly income, and marital
status.
5
102
Chapter 5
Statistical analysis
(SD) were calculated for continuous data. We calculated the test-retest reliability of both
chosen to tackle the ‘Kappa paradoxes’: i.e. high percentage agreement but low kappa which
usually occurs in the sample with a low prevalence of cases or problems, such as in general
population. Details can be found in the work of Gwet (30) and Wongpakaran (31). This Gwet’s AC
was also used to calculate the test-retest reliability of overall quality of life and general health
from WHOQOL-BREF. Percentage of agreement among test and retest were also calculated.
Test–retest reliability of the EQ-VAS, the EQ-5D-5L index scores, and the four domains scores of
effects, absolute agreement). When the data is non-normally distributed, we transformed
the data: i.e. log, square and cubic transformation, and reapplied the ICC. We applied the
data. In addition, we used the Bland-Altman plots for the EQ-VAS, index scores, and the four
domains of WHOQOL-BREF to examine visually the agreement between test and retest scores.
To obtain EQ-5D-5L ‘utility’ index scores, the new Indonesian value set was used (26). For
respondents who responded to each level of each dimension and calculated those percentages
across different socio-demographic characteristics, i.e.: residence, gender, age, education
level, religion, ethnicity, and income. We compared the proportions of self-reported health for
the different socio-demographic characteristics with the Chi-square test. For the population
norms, the EQ-5D-5L mean scores (i.e. EQ-VAS scores and index scores) and WHOQOL-BREF
mean scores (domain scores, overall quality of life, and general health) were calculated across
different socio-demographic characteristics. For comparison of scores between two groups
(residence and gender), Welch's unequal variances t-test was used, given the skewed data and
different variances. ANOVA was used to compare more than two groups: age, education level,
religion, ethnicity, and income.
All statistical analyses were carried out using the STATA version 13 software.
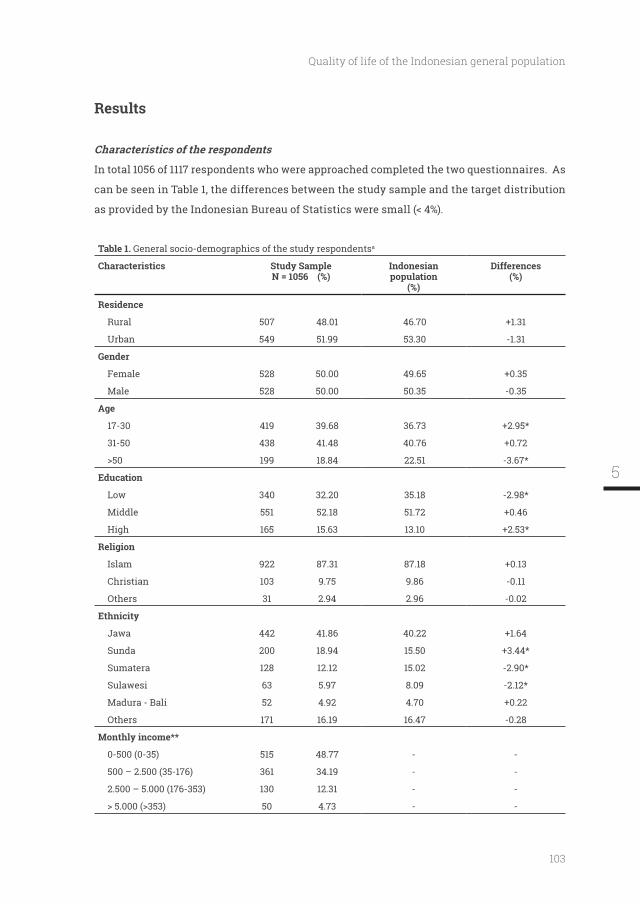
103
Quality of life of the Indonesian general population
Results
Characteristics of the respondents
In total 1056 of 1117 respondents who were approached completed the two questionnaires. As
can be seen in Table 1, the differences between the study sample and the target distribution
Table 1. General socio-demographics of the study respondentsa
Characteristics Study SampleN = 1056 (%)
Indonesian population
(%)
Differences(%)
Residence
Rural 507 48.01 46.70
Urban 549 51.99 53.30 -1.31
Gender
Female 528 50.00 49.65
Male 528 50.00 50.35 -0.35
17-30 419 39.68 36.73
31-50 438 41.48 40.76
199 18.84 22.51 -3.67*
Low 340 32.20 35.18 -2.98*
Middle 551 52.18 51.72
High 165 15.63 13.10
Islam 922 87.31 87.18
Christian 103 9.75 9.86 -0.11
Others 31 2.94 2.96 -0.02
Jawa 442 41.86 40.22
Sunda 200 18.94 15.50
Sumatera 128 12.12 15.02 -2.90*
Sulawesi 63 5.97 8.09 -2.12*
Madura - Bali 52 4.92 4.70
Others 171 16.19 16.47 -0.28
Monthly income**
0-500 (0-35) 515 48.77 - -
500 – 2.500 (35-176) 361 34.19 - -
2.500 – 5.000 (176-353) 130 12.31 - -
50 4.73 - -
5

104
Chapter 5
Table 1 (continued). General socio-demographics of the study respondentsa
General characteristics of test-retest respondents
Characteristics Test-retest Sample N = 206 (%)
Indonesian popu-lation
(%)
Differences(%)
Residence
Rural 103 50.00 46.70
Urban 103 50.00 53.30 -3.30
Gender
Female 103 50.00 49.65
Male 103 50.00 50.35 -0.35
17-30 79 38.35 36.73
31-50 86 41.75 40.76
41 19.90 22.51 -2.61
**: Monthly income in thousands of Rupiah and Euro in bracketsaThis data is also presented, with some slight differences, in Purba et al (26)
Test-retest reliability
From 227 participants who completed the two questionnaires twice, 21 participants were
excluded because the time interval between both interviews (i.e. test-retest) was more than
a month, which was considered as too long for a retest interview. Thus, the sample tested
17.45 days (SD=4.71). The characteristics of the remaining test-retest respondents were similar
to those of the Indonesian general population and the total sample in terms of residence,
gender and age (see Table 1).
The EQ-5D-5L shows almost perfect agreement between the two tests (Gwet’s AC: 0.85-0.99
of EQ-VAS and index scores can be considered to be poor with ICC scores of 0.45 and 0.37
respectively. Transforming the data resulted in small increases only to the ICCs. Similar scores
were shown by the concordance correlation analysis. These results can be seen in Table 2.
Inspection of the Bland –Altman plot of the EQ-VAS shows that there were 5.3% of data points
majority of these data points were from the lower part of the scale: mean score of 70 and less.
For the index score, majority of the 7.3% of the poor agreements data points were between the
0.8 and 0.9 mean index score. For the two measures: EQ-VAS and index score, higher agreement
between the two tests were shown by respondents with better health: i.e. all the data points of
EQ-VAS mean score of 85 and above and between mean index scores of 0.9 and 1.0 were within
the limits of agreement (see Fig 1).
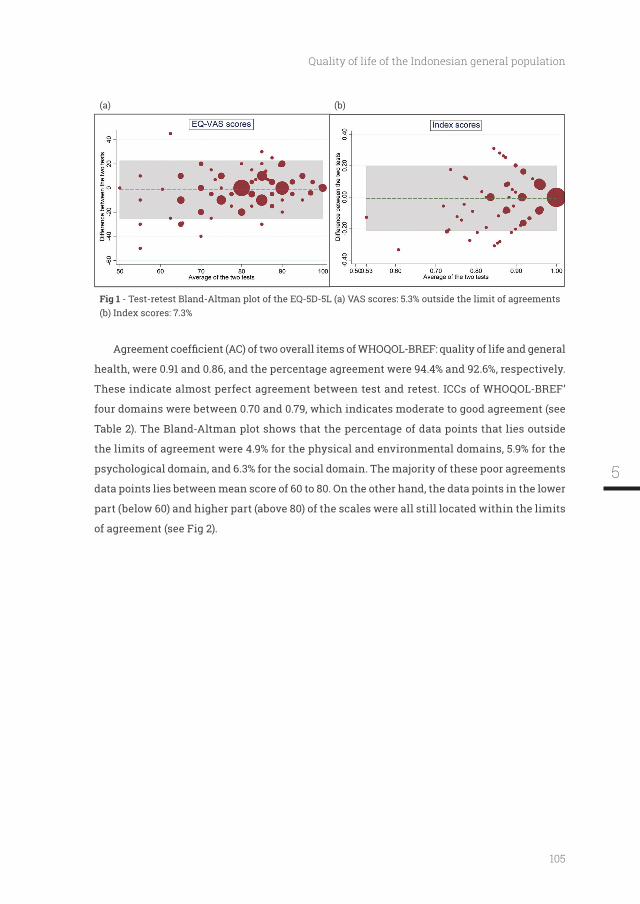
105
Quality of life of the Indonesian general population
(a) (b)
- Test-retest Bland-Altman plot of the EQ-5D-5L (a) VAS scores: 5.3% outside the limit of agreements (b) Index scores: 7.3%
health, were 0.91 and 0.86, and the percentage agreement were 94.4% and 92.6%, respectively.
These indicate almost perfect agreement between test and retest. ICCs of WHOQOL-BREF’
four domains were between 0.70 and 0.79, which indicates moderate to good agreement (see
Table 2). The Bland-Altman plot shows that the percentage of data points that lies outside
the limits of agreement were 4.9% for the physical and environmental domains, 5.9% for the
psychological domain, and 6.3% for the social domain. The majority of these poor agreements
data points lies between mean score of 60 to 80. On the other hand, the data points in the lower
part (below 60) and higher part (above 80) of the scales were all still located within the limits
of agreement (see Fig 2).
5
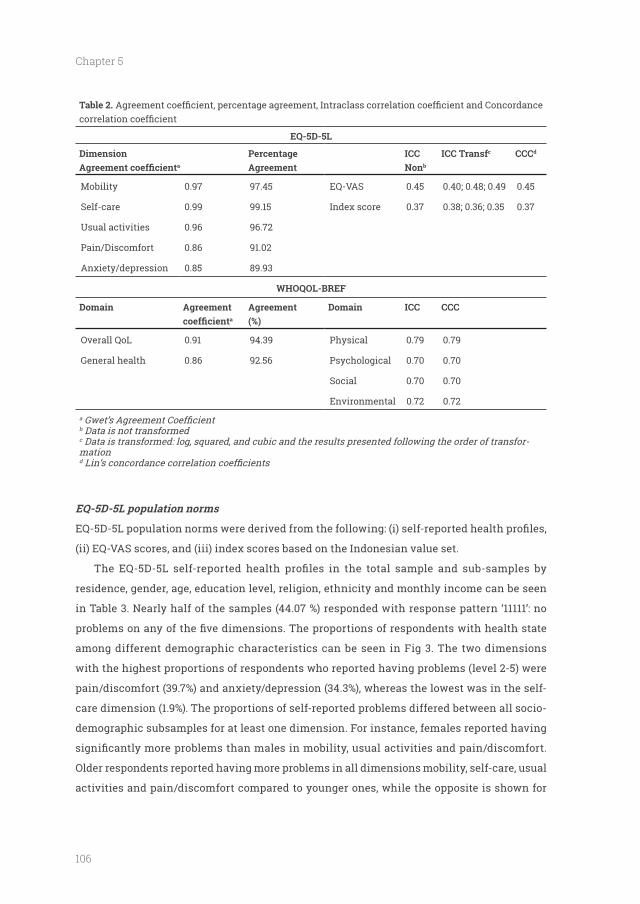
106
Chapter 5
Table 2.
EQ-5D-5L
Dimensiona
ICC Nonb
ICC Transfc CCCd
Mobility 0.97 97.45 EQ-VAS 0.45 0.40; 0.48; 0.49 0.45
Self-care 0.99 99.15 Index score 0.37 0.38; 0.36; 0.35 0.37
Usual activities 0.96 96.72
Pain/Discomfort 0.86 91.02
Anxiety/depression 0.85 89.93
WHOQOL-BREF
Domaina (%)
Domain ICC CCC
Overall QoL 0.91 94.39 Physical 0.79 0.79
General health 0.86 92.56 Psychological 0.70 0.70
Social 0.70 0.70
Environmental 0.72 0.72
a
b Data is not transformedc Data is transformed: log, squared, and cubic and the results presented following the order of transfor-mationd
EQ-5D-5L population norms
(ii) EQ-VAS scores, and (iii) index scores based on the Indonesian value set.
residence, gender, age, education level, religion, ethnicity and monthly income can be seen
in Table 3. Nearly half of the samples (44.07 %) responded with response pattern ‘11111’: no
among different demographic characteristics can be seen in Fig 3. The two dimensions
with the highest proportions of respondents who reported having problems (level 2-5) were
pain/discomfort (39.7%) and anxiety/depression (34.3%), whereas the lowest was in the self-
care dimension (1.9%). The proportions of self-reported problems differed between all socio-
demographic subsamples for at least one dimension. For instance, females reported having
Older respondents reported having more problems in all dimensions mobility, self-care, usual
activities and pain/discomfort compared to younger ones, while the opposite is shown for
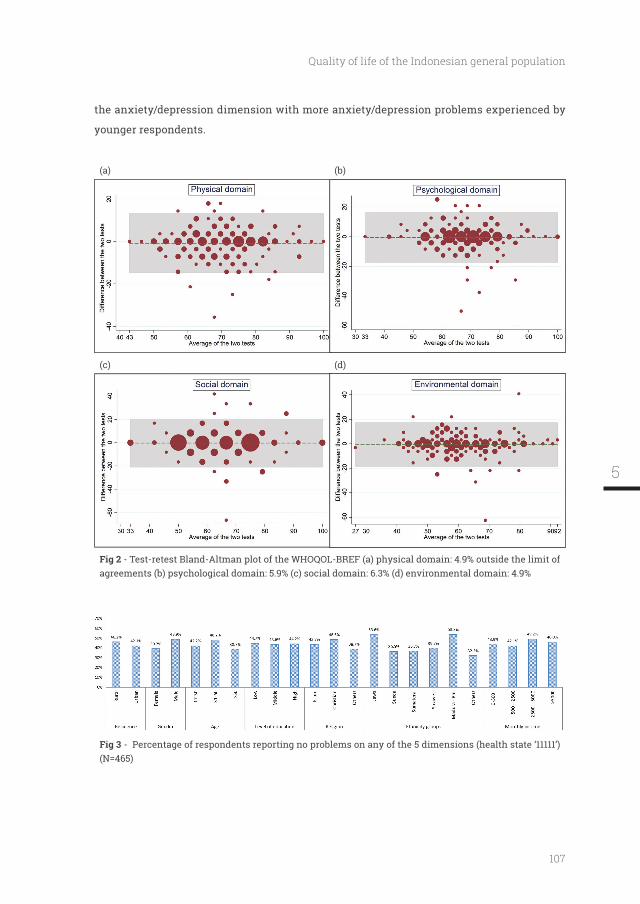
107
Quality of life of the Indonesian general population
the anxiety/depression dimension with more anxiety/depression problems experienced by
younger respondents.
(a) (b)
(c) (d)
- Test-retest Bland-Altman plot of the WHOQOL-BREF (a) physical domain: 4.9% outside the limit of agreements (b) psychological domain: 5.9% (c) social domain: 6.3% (d) environmental domain: 4.9%
- Percentage of respondents reporting no problems on any of the 5 dimensions (health state ‘11111’) (N=465)
5
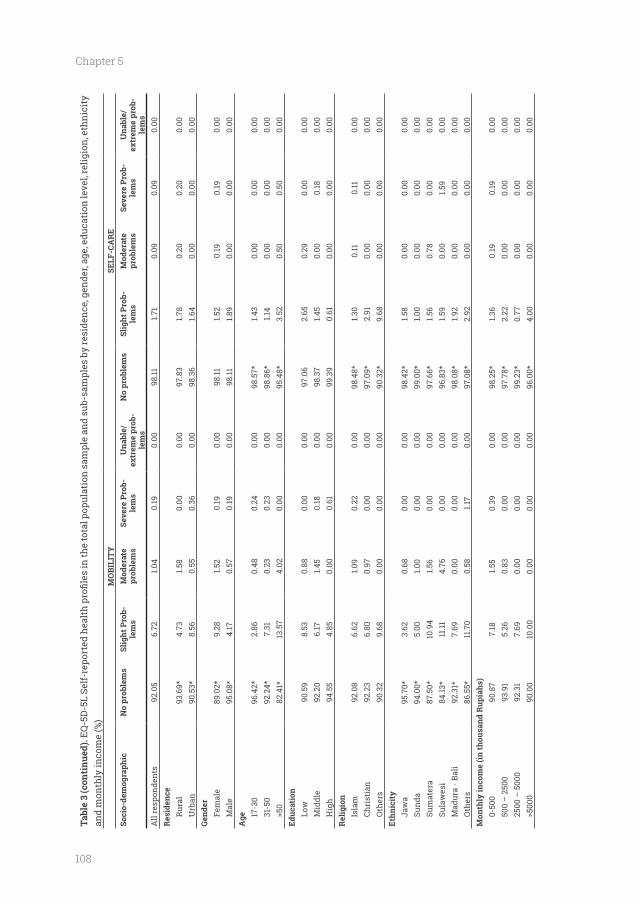
108
Chapter 5
Tabl
e 3
(con
tinu
ed).
and
mon
thly
inco
me
(%)
MO
BILI
TY
SELF
-CA
RE
No
prob
lem
s-
lem
sM
oder
ate
prob
lem
sSe
vere
Pro
b-le
ms
Una
ble/
ex
trem
e pr
ob-
lem
s
No
prob
lem
s-
lem
sM
oder
ate
prob
lem
sSe
vere
Pro
b-le
ms
Una
ble/
ex
trem
e pr
ob-
lem
sA
ll re
spon
dent
s92
.05
6.72
1.04
0.19
0.00
98.11
1.71
0.09
0.09
0.00
Rur
al93
.69*
4.73
1.58
0.00
0.00
97.8
31.7
80.
200.
200.
00U
rban
90.5
3*8.
560.
550.
360.
0098
.36
1.64
0.00
0.00
0.00
Gend
erFe
mal
e89
.02*
9.28
1.52
0.19
0.00
98.11
1.52
0.19
0.19
0.00
Mal
e95
.08*
4.17
0.57
0.19
0.00
98.11
1.89
0.00
0.00
0.00
17-3
096
.42*
2.86
0.48
0.24
0.00
98.5
7*1.4
30.
000.
000.
0031
-50
92.2
4*7.
310.
230.
230.
0098
.86*
1.14
0.00
0.00
0.00
82.4
1*13
.57
4.02
0.00
0.00
95.4
8*3.
520.
500.
500.
00
Low
90.5
98.
530.
880.
000.
0097
.06
2.65
0.29
0.00
0.00
Mid
dle
92.2
06.
171.4
50.
180.
0098
.37
1.45
0.00
0.18
0.00
Hig
h94
.55
4.85
0.00
0.61
0.00
99.3
90.
610.
000.
000.
00
Isla
m92
.08
6.62
1.09
0.22
0.00
98.4
8*1.3
00.
110.
110.
00Ch
rist
ian
92.2
36.
800.
970.
000.
0097
.09*
2.91
0.00
0.00
0.00
Oth
ers
90.3
29.
680.
000.
000.
0090
.32*
9.68
0.00
0.00
0.00
Jaw
a95
.70*
3.62
0.68
0.00
0.00
98.4
2*1.5
80.
000.
000.
00Su
nda
94.0
0*5.
001.0
00.
000.
0099
.00*
1.00
0.00
0.00
0.00
Sum
ater
a 87
.50*
10.9
41.5
60.
000.
0097
.66*
1.56
0.78
0.00
0.00
Sula
wes
i84
.13*
11.11
4.76
0.00
0.00
96.8
3*1.5
90.
001.5
90.
00M
adur
a - B
ali
92.3
1*7.
690.
000.
000.
0098
.08*
1.92
0.00
0.00
0.00
Oth
ers
86.5
5*11
.70
0.58
1.17
0.00
97.0
8*2.
920.
000.
000.
00M
onth
ly in
com
e (in
thou
sand
Rup
iahs
)0-
500
90.8
77.
181.5
50.
390.
0098
.25*
1.36
0.19
0.19
0.00
500
– 2
500
93.9
15.
260.
830.
000.
0097
.78*
2.22
0.00
0.00
0.00
2500
– 5
000
92.3
17.
690.
000.
000.
0099
.23*
0.77
0.00
0.00
0.00
90.0
010
.00
0.00
0.00
0.00
96.0
0*4.
000.
000.
000.
00
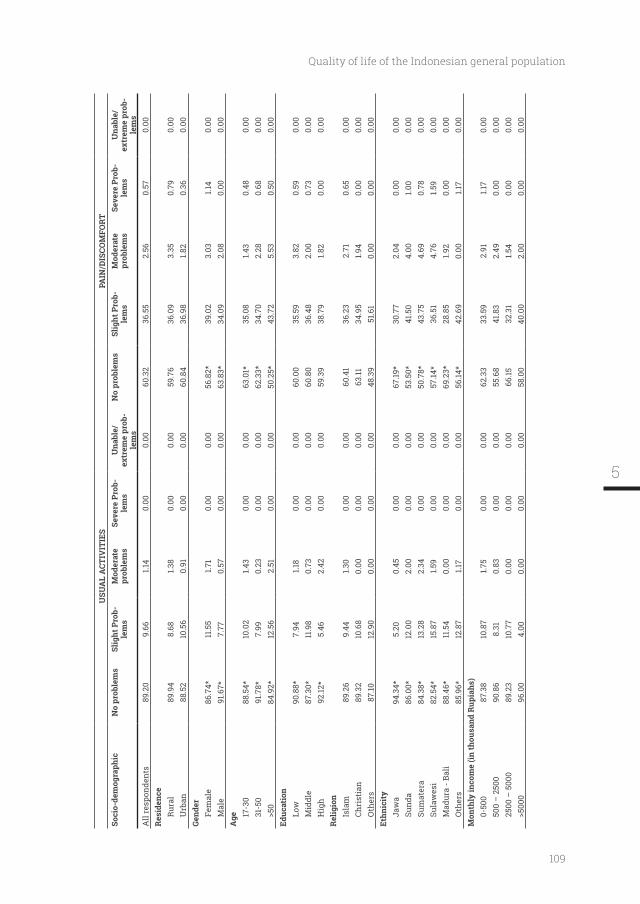
109
Quality of life of the Indonesian general population
USU
AL
ACT
IVIT
IES
PAIN
/DIS
COM
FORT
No
prob
lem
s-
lem
sM
oder
ate
prob
lem
sSe
vere
Pro
b-le
ms
Una
ble/
ex
trem
e pr
ob-
lem
s
No
prob
lem
s-
lem
sM
oder
ate
prob
lem
sSe
vere
Pro
b-le
ms
Una
ble/
ex
trem
e pr
ob-
lem
sA
ll re
spon
dent
s89
.20
9.66
1.14
0.00
0.00
60.3
236
.55
2.56
0.57
0.00
Res
iden
ceR
ural
89.9
48.
681.3
80.
000.
0059
.76
36.0
93.
350.
790.
00U
rban
88.5
210
.56
0.91
0.00
0.00
60.8
436
.98
1.82
0.36
0.00
Gend
erFe
mal
e86
.74*
11.5
51.7
10.
000.
0056
.82*
39.0
23.
031.1
40.
00M
ale
91.6
7*7.
770.
570.
000.
0063
.83*
34.0
92.
080.
000.
00
17-3
088
.54*
10.0
21.4
30.
000.
0063
.01*
35.0
81.4
30.
480.
0031
-50
91.7
8*7.
990.
230.
000.
0062
.33*
34.7
02.
280.
680.
0084
.92*
12.5
62.
510.
000.
0050
.25*
43.7
25.
530.
500.
00
Low
90.8
8*7.
941.1
80.
000.
0060
.00
35.5
93.
820.
590.
00M
iddl
e87
.30*
11.9
80.
730.
000.
0060
.80
36.4
82.
000.
730.
00H
igh
92.12
*5.
462.
420.
000.
0059
.39
38.7
91.8
20.
000.
00
Isla
m89
.26
9.44
1.30
0.00
0.00
60.4
136
.23
2.71
0.65
0.00
Chri
stia
n89
.32
10.6
80.
000.
000.
0063
.1134
.95
1.94
0.00
0.00
Oth
ers
87.10
12.9
00.
000.
000.
0048
.39
51.6
10.
000.
000.
00
Jaw
a94
.34*
5.20
0.45
0.00
0.00
67.19
*30
.77
2.04
0.00
0.00
Sund
a86
.00*
12.0
02.
000.
000.
0053
.50*
41.5
04.
001.0
00.
00Su
mat
era
84.3
8*13
.28
2.34
0.00
0.00
50.7
8*43
.75
4.69
0.78
0.00
Sula
wes
i82
.54*
15.8
71.5
90.
000.
0057
.14*
36.5
14.
761.5
90.
00M
adur
a - B
ali
88.4
6*11
.54
0.00
0.00
0.00
69.2
3*28
.85
1.92
0.00
0.00
Oth
ers
85.9
6*12
.87
1.17
0.00
0.00
56.14
*42
.69
0.00
1.17
0.00
Mon
thly
inco
me
(in th
ousa
nd R
upia
hs)
0-50
0 87
.38
10.8
71.7
50.
000.
0062
.33
33.5
92.
911.1
70.
0050
0 –
250
090
.86
8.31
0.83
0.00
0.00
55.6
841
.83
2.49
0.00
0.00
2500
– 5
000
89.2
310
.77
0.00
0.00
0.00
66.15
32.3
11.5
40.
000.
0096
.00
4.00
0.00
0.00
0.00
58.0
040
.00
2.00
0.00
0.00
5
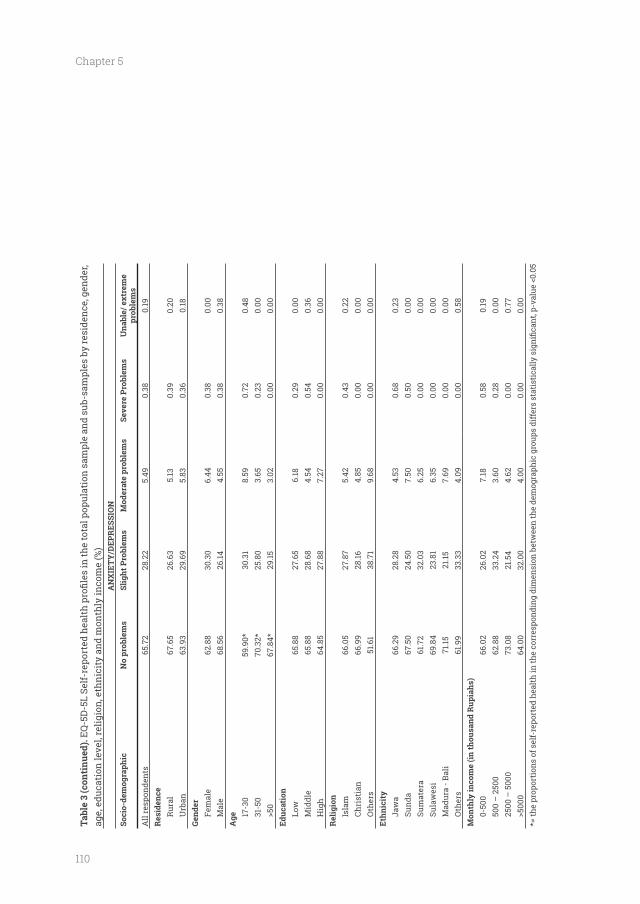
110
Chapter 5
Tabl
e 3
(con
tinu
ed).
age,
edu
cati
on le
vel,
relig
ion,
eth
nici
ty a
nd m
onth
ly in
com
e (%
)A
NX
IET
Y/D
EPR
ESSI
ON
No
prob
lem
sM
oder
ate
prob
lem
sSe
vere
Pro
blem
sU
nabl
e/ e
xtre
me
prob
lem
sA
ll re
spon
dent
s65
.72
28.2
25.
490.
380.
19R
esid
ence
Rur
al67
.65
26.6
35.
130.
390.
20U
rban
63.9
329
.69
5.83
0.36
0.18
Gend
erFe
mal
e62
.88
30.3
06.
440.
380.
00M
ale
68.5
626
.144.
550.
380.
38
17-3
059
.90*
30.3
18.
590.
720.
4831
-50
70.3
2*25
.80
3.65
0.23
0.00
67.8
4*29
.153.
020.
000.
00
Low
65.8
827
.65
6.18
0.29
0.00
Mid
dle
65.8
828
.68
4.54
0.54
0.36
Hig
h64
.85
27.8
87.
270.
000.
00
Isla
m66
.05
27.8
75.
420.
430.
22Ch
rist
ian
66.9
928
.164.
850.
000.
00O
ther
s51
.61
38.7
19.
680.
000.
00
Jaw
a66
.29
28.2
84.
530.
680.
23Su
nda
67.5
024
.50
7.50
0.50
0.00
Sum
ater
a 61
.72
32.0
36.
250.
000.
00Su
law
esi
69.8
423
.81
6.35
0.00
0.00
Mad
ura
- Bal
i71
.1521
.157.
690.
000.
00O
ther
s61
.99
33.3
34.
090.
000.
58
0-50
0 66
.02
26.0
27.
180.
580.
1950
0 –
250
062
.88
33.2
43.
600.
280.
0025
00 –
500
073
.08
21.5
44.
620.
000.
7764
.00
32.0
04.
000.
000.
00
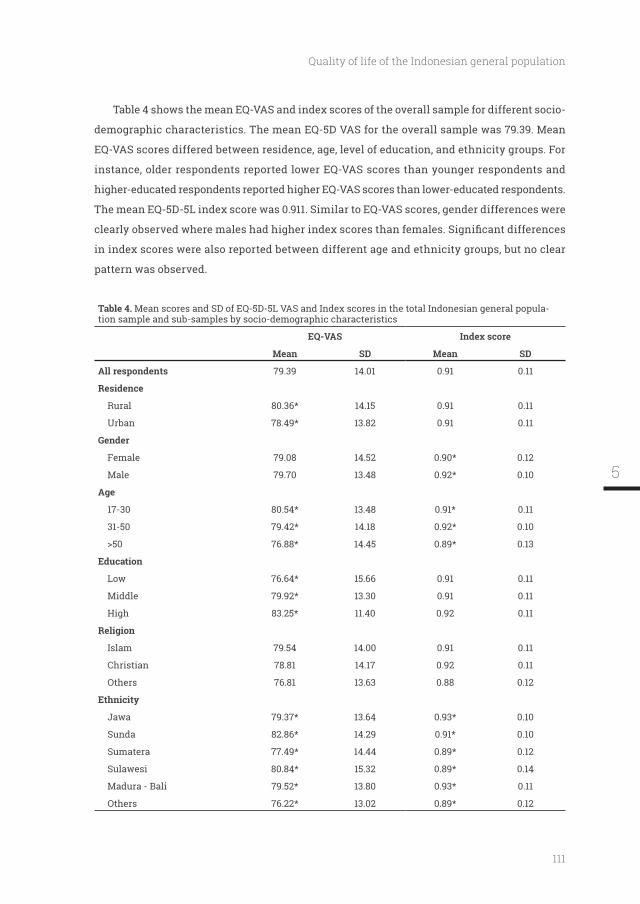
111
Quality of life of the Indonesian general population
Table 4 shows the mean EQ-VAS and index scores of the overall sample for different socio-
demographic characteristics. The mean EQ-5D VAS for the overall sample was 79.39. Mean
EQ-VAS scores differed between residence, age, level of education, and ethnicity groups. For
instance, older respondents reported lower EQ-VAS scores than younger respondents and
higher-educated respondents reported higher EQ-VAS scores than lower-educated respondents.
The mean EQ-5D-5L index score was 0.911. Similar to EQ-VAS scores, gender differences were
in index scores were also reported between different age and ethnicity groups, but no clear
pattern was observed.
Table 4. Mean scores and SD of EQ-5D-5L VAS and Index scores in the total Indonesian general popula-tion sample and sub-samples by socio-demographic characteristics
EQ-VAS Index score
Mean SD Mean SD
All respondents 79.39 14.01 0.91 0.11
Residence
Rural 80.36* 14.15 0.91 0.11
Urban 78.49* 13.82 0.91 0.11
Gender
Female 79.08 14.52 0.90* 0.12
Male 79.70 13.48 0.92* 0.10
17-30 80.54* 13.48 0.91* 0.11
31-50 79.42* 14.18 0.92* 0.10
76.88* 14.45 0.89* 0.13
Low 76.64* 15.66 0.91 0.11
Middle 79.92* 13.30 0.91 0.11
High 83.25* 11.40 0.92 0.11
Islam 79.54 14.00 0.91 0.11
Christian 78.81 14.17 0.92 0.11
Others 76.81 13.63 0.88 0.12
Jawa 79.37* 13.64 0.93* 0.10
Sunda 82.86* 14.29 0.91* 0.10
Sumatera 77.49* 14.44 0.89* 0.12
Sulawesi 80.84* 15.32 0.89* 0.14
Madura - Bali 79.52* 13.80 0.93* 0.11
Others 76.22* 13.02 0.89* 0.12
5
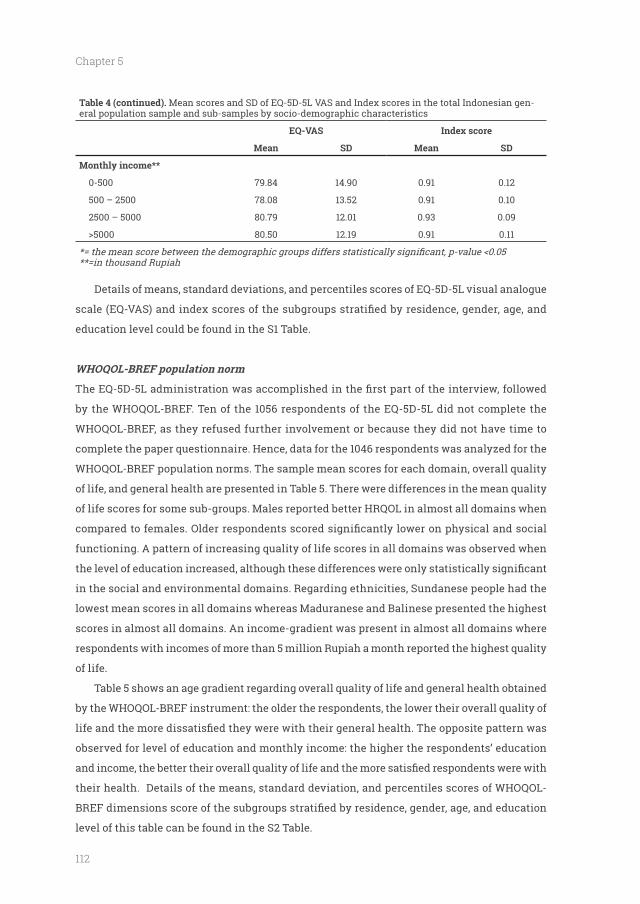
112
Chapter 5
Table 4 (continued). Mean scores and SD of EQ-5D-5L VAS and Index scores in the total Indonesian gen-eral population sample and sub-samples by socio-demographic characteristics
EQ-VAS Index score
Mean SD Mean SD
Monthly income**
0-500 79.84 14.90 0.91 0.12
500 – 2500 78.08 13.52 0.91 0.10
2500 – 5000 80.79 12.01 0.93 0.09
80.50 12.19 0.91 0.11
**=in thousand Rupiah
Details of means, standard deviations, and percentiles scores of EQ-5D-5L visual analogue
education level could be found in the S1 Table.
WHOQOL-BREF population norm
by the WHOQOL-BREF. Ten of the 1056 respondents of the EQ-5D-5L did not complete the
WHOQOL-BREF, as they refused further involvement or because they did not have time to
WHOQOL-BREF population norms. The sample mean scores for each domain, overall quality
of life, and general health are presented in Table 5. There were differences in the mean quality
of life scores for some sub-groups. Males reported better HRQOL in almost all domains when
functioning. A pattern of increasing quality of life scores in all domains was observed when
in the social and environmental domains. Regarding ethnicities, Sundanese people had the
lowest mean scores in all domains whereas Maduranese and Balinese presented the highest
scores in almost all domains. An income-gradient was present in almost all domains where
respondents with incomes of more than 5 million Rupiah a month reported the highest quality
of life.
Table 5 shows an age gradient regarding overall quality of life and general health obtained
by the WHOQOL-BREF instrument: the older the respondents, the lower their overall quality of
observed for level of education and monthly income: the higher the respondents’ education
their health. Details of the means, standard deviation, and percentiles scores of WHOQOL-
level of this table can be found in the S2 Table.
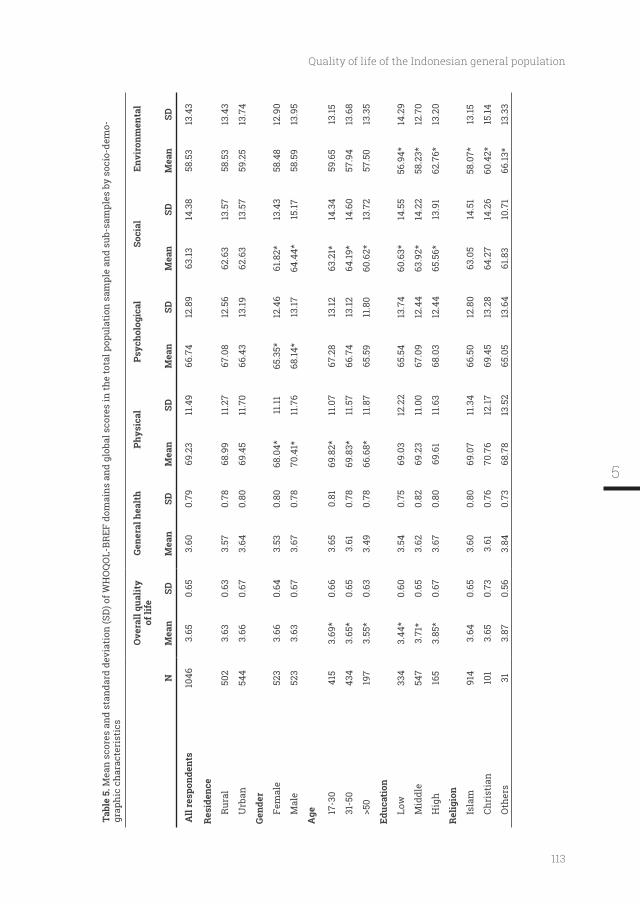
113
Quality of life of the Indonesian general population
Tabl
e 5.
Mea
n sc
ores
and
sta
ndar
d de
viat
ion
(SD
) of W
HO
QO
L-BR
EF d
omai
ns a
nd g
loba
l sco
res
in th
e to
tal p
opul
atio
n sa
mpl
e an
d su
b-sa
mpl
es b
y so
cio-
dem
o-gr
aphi
c ch
arac
teri
stic
s
Ove
rall
qual
ity
of li
feGe
nera
l hea
lth
Phys
ical
Soci
alEn
viro
nmen
tal
NM
ean
SDM
ean
SDM
ean
SDM
ean
SDM
ean
SDM
ean
SD
All
resp
onde
nts
1046
3.65
0.65
3.60
0.79
69.2
3
11.4
966
.74
12
.89
63.13
14
.38
58.5
3
13.4
3
Res
iden
ce
Rur
al50
23.
630.
633.
570.
7868
.99
11
.27
67.0
8
12.5
662
.63
13
.57
58.5
3
13.4
3
Urb
an54
43.
660.
673.
640.
8069
.45
11
.70
66.4
3
13.19
62.6
3
13.5
759
.25
13
.74
Gend
er
Fem
ale
523
3.66
0.64
3.53
0.80
68.0
4*
11.11
65.3
5*
12.4
661
.82*
13
.43
58.4
8
12.9
0
Mal
e52
33.
630.
673.
670.
7870
.41*
11
.76
68.14
*
13.17
64.4
4*
15.17
58.5
9
13.9
5
17-3
041
53.
69*
0.66
3.65
0.81
69.8
2*
11.0
767
.28
13
.1263
.21*
14
.34
59.6
513
.15
31-5
043
43.
65*
0.65
3.61
0.78
69.8
3*
11.5
766
.74
13.12
64.19
*14
.60
57.9
413
.68
197
3.55
*0.
633.
490.
7866
.68*
11
.87
65.5
911
.80
60.6
2*13
.72
57.5
013
.35
Low
334
3.44
*0.
603.
540.
7569
.03
12
.22
65.5
4
13.7
460
.63*
14
.55
56.9
4*
14.2
9
Mid
dle
547
3.71
*0.
653.
620.
8269
.23
11
.00
67.0
9
12.4
463
.92*
14
.22
58.2
3*
12.7
0
Hig
h16
53.
85*
0.67
3.67
0.80
69.6
1
11.6
368
.03
12
.44
65.5
6*
13.9
162
.76*
13
.20
Isla
m91
43.
640.
653.
600.
8069
.07
11
.34
66.5
0
12.8
063
.05
14
.51
58.0
7*
13.15
Chri
stia
n10
13.
650.
733.
610.
7670
.76
12
.1769
.45
13
.28
64.2
7
14.2
660
.42*
15
.14
Oth
ers
313.
870.
563.
840.
7368
.78
13
.52
65.0
5
13.6
461
.83
10
.71
66.13
*
13.3
3
5
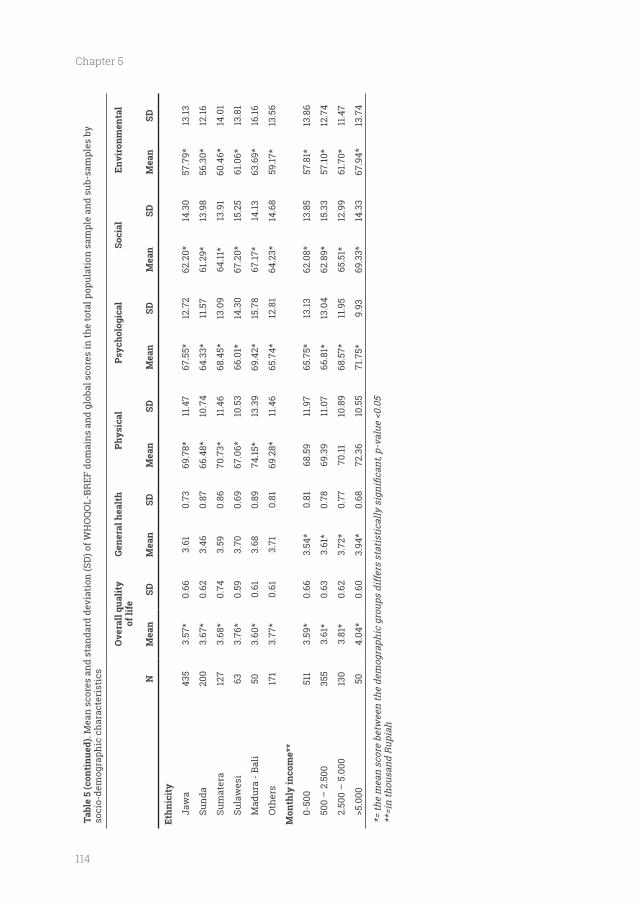
114
Chapter 5
Tabl
e 5
(con
tinu
ed).
Mea
n sc
ores
and
sta
ndar
d de
viat
ion
(SD
) of W
HO
QO
L-BR
EF d
omai
ns a
nd g
loba
l sco
res
in th
e to
tal p
opul
atio
n sa
mpl
e an
d su
b-sa
mpl
es b
y so
cio-
dem
ogra
phic
cha
ract
eris
tics
Ove
rall
qual
ity
of li
feGe
nera
l hea
lth
Phys
ical
Soci
alEn
viro
nmen
tal
NM
ean
SDM
ean
SDM
ean
SDM
ean
SDM
ean
SDM
ean
SD
Jaw
a43
53.
57*
0.66
3.61
0.73
69.7
8*
11.4
767
.55*
12
.72
62.2
0*
14.3
057
.79*
13
.13
Sund
a20
03.
67*
0.62
3.46
0.87
66.4
8*
10.7
464
.33*
11
.57
61.2
9*
13.9
8
56.3
0*
12.16
Sum
ater
a 12
73.
68*
0.74
3.59
0.86
70.7
3*
11.4
668
.45*
13
.09
64.11
*
13.9
160
.46*
14
.01
Sula
wes
i63
3.76
*0.
593.
700.
6967
.06*
10
.53
66.0
1*
14.3
067
.20*
15
.25
61.0
6*
13.8
1
Mad
ura
- Bal
i50
3.60
*0.
613.
680.
8974
.15*
13
.39
69.4
2*
15.7
867
.17*
14
.1363
.69*
16
.16
Oth
ers
171
3.77
*0.
613.
710.
8169
.28*
11
.46
65.7
4*
12.8
164
.23*
14
.68
59.17
*
13.5
6
Mon
thly
inco
me*
*
0-50
0
511
3.59
*0.
663.
54*
0.81
68.5
9
11.9
765
.75*
13
.1362
.08*
13
.85
57.8
1*
13.8
6
500
– 2
.500
355
3.61
*0.
633.
61*
0.78
69.3
9
11.0
766
.81*
13
.04
62.8
9*
15.3
357
.10*
12
.74
2.50
0 –
5.0
0013
03.
81*
0.62
3.72
*0.
7770
.11
10.8
968
.57*
11
.95
65.5
1*
12.9
961
.70*
11
.47
504.
04*
0.60
3.94
*0.
6872
.36
10
.55
71.7
5*
9.93
69.3
3*
14.3
367
.94*
13
.74
**=i
n th
ousa
nd R
upia
h
115
Quality of life of the Indonesian general population
Discussion
Indonesian general adult population, which is the fourth most populous country in the world.
We sub-divided the norm scores of the 1056 respondents according to socio-demographic
characteristics, i.e. residence, gender, age, education level, income, religion, and ethnicity. We
also investigated the test-retest reliability of these two instruments in 206 respondents from
the original Indonesian general population sample. The EQ-5D-5L dimensions show almost
perfect agreement between the two tests but poor agreement of the EQ-VAS and index scores.
The WHOQOL-BREF instrument showed almost perfect agreements of the two general items
below.
Several limitations of this study should be considered. The respondents in our total sample
mainly lived on Java island. One could therefore question the representativeness of the sample
with respect to the population living over the whole archipelago. It has to be mentioned that
Java is the island with the largest population of Indonesia: 57% of the population live in the
island and that we also included other ethnic groups than Javanese. One way to solve this
would be to interview respondents from different locations other than Java, for instance
differences. Such a study could then motivate additional studies about the quality of life of
people living in other parts of the archipelago.
Another limitation is that the interval time of the second test is intersect with the
WHOQOL-BREF’s reference period of four weeks. This might potentially bias the test-retest
result. However, this might also be considered as an advantage, since it implies that the
respondent was looking partly back to a same health condition. Therefore, concerning the
overlap, variation between test-retest cannot be explained by a change in the respondent’s
health.
score. The high percentage of “no problems” in the EQ-5D dimensions scores in a general
and Poland (35). The general population is usually healthy or at least has no health problem
affects their health happens in the interval time of test-retest, it is encouraging that they
reported similar health state in the EQ-5D-5L. On the other hand, our data has high number of
respondents who reported no problems in all dimensions (health state’11111’): 44.07 %. Only 33
5
116
Chapter 5
out of 3125 (1.06%) possible health states were reported. About 80% of the test-retest respondents
reported no more than one-point difference of the so-called ‘Misery index’ (i.e. sum score of the
level digits) between the two tests. It can be concluded that the EQ-5D-5L data in the general
population is highly skewed and shows low variance. Since ICC relies on variance, it can be
expected that the ICC score is low in this population (16). In patient data the ceiling effect is
less and there is more variation in health states, hence the ICC is more favourable (17, 36-39).
The Indonesian version of WHOQOL-BREF shows good agreement of the four domains,
which is consistent with previous studies in Bangladesh and Malaysia (41, 42). The two global
items of the WHOQOL-BREF: overall quality of life, and general health were in almost perfect
agreement. Moreover, the data points which are considered as poor agreement were less than
10% for all the domains. It can be concluded that the WHOQOL-BREF is a consistent and stable
instrument to measure the quality of life of Indonesian general population.
The most self-reported health problems were observed in the pain/discomfort dimension
EQ-5D-5L population norm reports from other countries (15, 33-35, 40, 41). It could be argued
that self-care is a rather ‘easy’ task which is not accompanied by problems in healthy people,
whilst pain/discomfort is a quite a common sign of various types of problems for which there
is not one and only answer, hence respondents possibly reported problems related to pain/
discomfort more often.
The mean index score of the Indonesian population was 0.91 while the mean EQ-VAS
score was 79.4. The difference between index score and EQ-VAS as shown in our study is
also reported by studies in South Korean (index: 0.96; EQ-VAS: 80.4) and South Australian
general population (0.91; 78.6) (15, 33). The score of WHOQOL-BREF’s domains were between
58.3 to 69.3, which is closer to the EQ-VAS score than the index score of the EQ-5D-5L. The
explanation is that the top anchor of the EQ-VAS is ‘best imaginable health state’, while the
best EQ-5D levels are labeled ‘no problems’. Many respondents in the general populations
have a rational view on their health: although they might not experience any health problem,
they are not in the best imaginable health state. For instance, a person may think that he/
she is overweight, should exercise more, stop smoking, or feel a bit tired, low on energy, or
have a little cold but nevertheless does not consider that a real health problem. Note that the
WHOQOL-BREF also allows to estimate a value of health beyond ‘no problems’. For instance, a
has completely enough money to meet his/her needs’. Therefore, the EQ-VAS and WHOQOL-
BREF might capture aspects in the high region of quality of life that was not captured by the
in the general population, one might consider using the WHOQOL-BREF and EQ-VAS rather
117
Quality of life of the Indonesian general population
than the EQ-5D-5L, as the former two might pick up variance which is not captured by the ‘no
problem level’ of the EQ-5D. Note that beyond ‘no problem’, it might be in the area of ‘pleasure
seeking’, instead of ‘pain avoiding’ (42), and thus should be left to private responsibility instead
of collective responsibility through national health policy. However, if one would intend to use
the EQ-VAS and/or index score for a sample from the general population, despite its low test-
the (random) error.
Similar to EQ-5D-5L results, health-related quality of life in different domains measured
by WHOQOL-BREF depended on gender and age. Men had higher values in almost all domains
than women. An age-gradient was present in almost all domains, especially when comparing
respondents above 50 years old to those below 30. Moreover, for WHOQOL-BREF education
health. The higher the respondents’ education levels and incomes, the better their quality of
life and the more satisfaction with their general health. These gender, income, and education
the age-related pattern (43-45).
Estimation of EQ-5D-5L and WHOQOL-BREF norms can contribute to the improvement of
the overall health status of the Indonesian population. The population norms are important
for different parties: (i) for clinicians as reference data, comparing patient data with the same
demographic characteristics as in the general population, (ii) for researchers to form control
groups in case series or other types of uncontrolled studies, (iii) for public health experts to
assess health-related problems and to identify vulnerable groups, and (iv) for epidemiologists
to determine the burden of diseases; and (v) for health care workers to determine the impact
of their interventions.
Conclusion
This study provides representative estimates of self-reported health status and quality of
life for the general Indonesian population as assessed by the EQ-5D-5L and WHOQOL-BREF
instruments. The descriptive system of the EQ-5D-5L and the WHOQOL-BREF have high test-
retest reliability while the EQ-VAS and the index score of EQ-5D-5L show poor agreement
between the tests in the general population. Our results can be useful to researchers and
Indonesian general population.
5
118
Chapter 5
the ‘Indonesia Bhadra Utama (IBU) Foundation’ respectively, helped us with the data collection.
Any errors or omissions are the responsibility of the authors only.
119
Quality of life of the Indonesian general population
References
1. Drummond M, Sculpher MJ, Claxton K, Stoddart GL, Torrance GW. Methods for the Economic Evaluation of Health Care Programmes (Fourth edition). Oxford: Oxford University Press; 2015.
2. Patrick DL, Deyo RA. Generic and disease-
status and quality of life. Med Care. 1989;27(3 Suppl):S217-32.
3. Herdman M, Gudex C, Lloyd A, Janssen M, Kind P, Parkin D, et al. Development and
version of EQ-5D (EQ-5D-5L). Qual Life Res. 2011;20(10):1727-36.
4. Brooks R. EuroQol: the current state of play. Health Policy. 1996;37(1):53-72.
5. The WHOQOL Group. Development of the
quality of life assessment. . Psychol Med. 1998;28(3):551-8.
6. Skevington SM, Lotfy M, O'Connell KA. The
quality of life assessment: psychometric properties and results of the international
Qual Life Res. 2004;13(2):299-310.
7. de Willige Gv, Wiersma D, Nienhuis FJ, Jenner JA. Changes in quality of life in chronic psychiatric patients: A comparison between EuroQol (EQ-5D) and WHOQoL. Qual Life Res. 2005;14(2):441-51.
8. Hanestad BR, Rustoen T, Knudsen O, Jr., Lerdal A, Wahl AK. Psychometric properties of the WHOQOL-BREF questionnaire for the Norwegian general population. J Nurs Meas. 2004;12(2):147-59.
9. Chachamovich E, Trentini C, Fleck MP. Assessment of the psychometric performance of the WHOQOL-BREF instrument in a sample
2007;19(4):635-46.
10. Mallik S, Baghaei AM, Rabiei K. Psychometric properties of the WHOQOL-BREF in an Iranian adult sample. Community Ment Health J. 2010;46(2):139-47.
11. Ohaeri JU, Awadalla AW. The reliability and validity of the short version of the WHO Quality of Life Instrument in an Arab general population. Ann Saudi Med. 2009;29(2):98-104.
12. 5D in a study of people with mild to moderate dementia. Qual Life Res. 2010;19(3):425-34.
13. Tran BX, Ohinmaa A, Nguyen LT. Quality of
the EQ-5D-5L in HIV/AIDS patients. Health Qual Life Outcomes. 2012;10:132.
14. Hunger M, Sabariego C, Stollenwerk B,
responsiveness of the EQ-5D in German stroke patients undergoing rehabilitation. Qual Life Res. 2012;21(7):1205-16.
15. Kim TH, Jo MW, Lee SI, Kim SH, Chung SM. Psychometric properties of the EQ-5D-5L in the general population of South Korea. Qual Life Res. 2013;22(8):2245-53.
16. Janssen MF, Pickard AS, Golicki D, Gudex C, Niewada M, Scalone L, et al. Measurement properties of the EQ-5D-5L compared to the EQ-5D-3L across eight patient groups: a multi-country study. Qual Life Res. 2013;22(7):1717-27.
17. Asselt ADI, Postma MJ. Health-Related Quality of Life of Patients with HPV-Related Cancers in Indonesia. Value in Health Regional Issues. 2018;15:63-9.
18. Salim OC, Sudharma NI, Rina K, Kusumaratna RK, Hidayat A. Validity and reliability of World
assess the quality of life in the elderly (in Bahasa Indonesia). Univ Med. 2007;26:27-38.
19. Sitaresmi MN, Mostert S, Gundy CM, Sutaryo, Veerman AJ. Health-related quality of life assessment in Indonesian childhood acute lymphoblastic leukemia. Health Qual Life Outcomes. 2008;6:96.
20. Handajani YS, Djoerban Z, Irawan H. Quality of life people living with HIV/AIDS: outpatient in Kramat 128 Hospital Jakarta. Acta Med Indones. 2012;44(4):310-6.
21. Iskandar S, van Crevel R, Hidayat T, Siregar IM, Achmad TH, van der Ven AJ, et al. Severity of psychiatric and physical problems is associated with lower quality of life in methadone patients in Indonesia. Am J Addict. 2013;22(5):425-31.
22. Endarti D, Riewpaiboon A, Thavorncharoensap M, Praditsitthikorn N, Hutubessy R, Kristina SA. Evaluation of Health-Related Quality of Life among Patients with Cervical Cancer in Indonesia. Asian Pac J Cancer Prev. 2015;16(8):3345-50.
5
120
Chapter 5
23. Home P. An analysis of the short- and long-term cost-effectiveness of starting biphasic insulin aspart 30 in insulin-naive people with poorly controlled type 2 diabetes. Diabetes Res Clin Pract. 2014;106(2):319-27.
24. Nikolajsen A. An analysis of the cost-effectiveness of starting insulin detemir in insulin-naive people with type 2 diabetes. J Med Econ. 2015;18(3):230-40.
25. Gupta V, Baabbad R, Hammerby E, Nikolajsen
effectiveness of switching from biphasic human insulin 30, insulin glargine, or neutral protamine Hagedorn to biphasic insulin aspart 30 in people with type 2 diabetes. J Med Econ. 2015;18(4):263-72.
26. Purba FD, Hunfeld JAM, Iskandarsyah A, Fitriana TS, Sadarjoen SS, Ramos-Goni JM, et al. The Indonesian EQ-5D-5L Value Set. Pharmacoeconomics. 2017;35(11):1153-65.
27. Badan Pusat Statistik. Statistik 70 Tahun Indonesia Merdeka Jakarta Badan Pusat Statistik; 2015 [Available from: http://bps.go.id/index.php/publikasi/1053.
28. Rabin R, Gudex C, Selai C, Herdman M. From translation to version management: a history and review of methods for the cultural
questionnaire. Value Health. 2014;17(1):70-6.
29. The WHOQOL Group. WHOQOL-BREF Introduction, Administration, Scoring And Generic Version of The Assessment1996 May 9, 2014. Available from: http://www.who.int/mental_health/media/en/76.pdf.
30. Gwet KL. Computing inter-rater reliability and its variance in the presence of high agreement. Br J Math Stat Psychol. 2008;61(Pt 1):29-48.
31. Wongpakaran N, Wongpakaran T, Wedding D, Gwet KL. A comparison of Cohen’s Kappa and Gwet’s AC1 when calculating inter-rater
with personality disorder samples. BMC Med Res Methodol. 2013;13(1):61.
32. Koo TK, Li MY. A Guideline of Selecting and
for Reliability Research. J Chiropr Med. 2016;15(2):155-63.
33. McCaffrey N, Kaambwa B, Currow DC, Ratcliffe J. Health-related quality of life measured using the EQ-5D-5L: South Australian population norms. Health Qual Life Outcomes. 2016;14(1):133.
34. Shiroiwa T, Fukuda T, Ikeda S, Igarashi A, Noto S, Saito S, et al. Japanese population norms for preference-based measures: EQ-5D-3L, EQ-5D-5L, and SF-6D. Qual Life Res. 2016;25(3):707-19.
35. Golicki D, Niewada M. EQ-5D-5L Polish population norms. Arch Med Sci. 2015;13(1):191-200.
36. Koh D, Abdullah AM, Wang P, Lin N, Luo N. Validation of Brunei's Malay EQ-5D Questionnaire in Patients with Type 2 Diabetes. PLoS One. 2016;11(11):e0165555.
37. Pattanaphesaj J, Thavorncharoensap M. Measurement properties of the EQ-5D-5L compared to EQ-5D-3L in the Thai diabetes patients. Health Qual Life Outcomes. 2015;13:14.
38. Sakthong P, Sonsa-Ardjit N, Sukarnjanaset P, Munpan W. Psychometric properties of the EQ-5D-5L in Thai patients with chronic diseases. Qual Life Res. 2015.
39. Jia YX, Cui FQ, Li L, Zhang DL, Zhang GM, Wang FZ, et al. Comparison between the EQ-5D-5L and the EQ-5D-3L in patients with hepatitis B. Qual Life Res. 2014;23(8):2355-63.
40. Garcia-Gordillo MA, Adsuar JC, Olivares PR. Normative values of EQ-5D-5L: in a Spanish representative population sample from Spanish Health Survey, 2011. Qual Life Res. 2016;25(5):1313-21.
41. M, Brahler E. The quality of life questionnaire EQ-5D-5L: psychometric properties and normative values for the general German population. Qual Life Res. 2014;23(2):443-7.
42. Scitovsky T. The joyless economy: An inquiry into human satisfaction and consumer dissatisfaction. 1976.
43. Noerholm V, Groenvold M, Watt T, Bjorner JB, Rasmussen NA, Bech P. Quality of life in the Danish general population--normative data and validity of WHOQOL-BREF using Rasch and item response theory models. Qual Life Res. 2004;13(2):531-40.
44.
normative values for the WHOQOL-bref in a southern general population sample. Qual Life Res. 2011;20(7):1123-9.
45. Hawthorne G, Herrman H, Murphy B. Interpreting the WHOQOL-Brèf: Preliminary
Indicators Research. 2006;77(1):37-59.
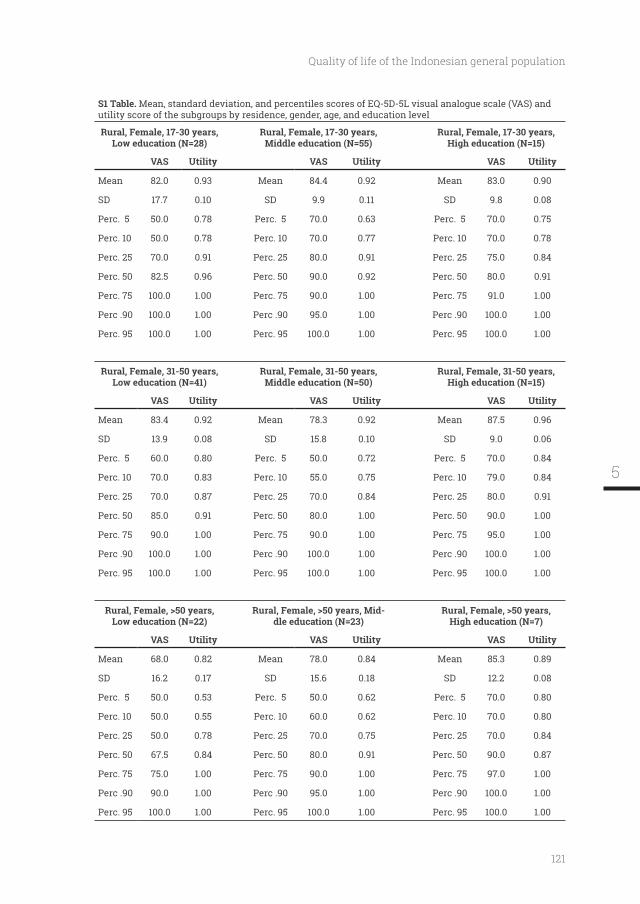
121
Quality of life of the Indonesian general population
S1 Table. Mean, standard deviation, and percentiles scores of EQ-5D-5L visual analogue scale (VAS) and utility score of the subgroups by residence, gender, age, and education level
Rural, Female, 17-30 years, Low education (N=28)
Rural, Female, 17-30 years, Middle education (N=55)
Rural, Female, 17-30 years,
VAS Utility VAS Utility VAS Utility
Mean 82.0 0.93 Mean 84.4 0.92 Mean 83.0 0.90
SD 17.7 0.10 SD 9.9 0.11 SD 9.8 0.08
Perc. 5 50.0 0.78 Perc. 5 70.0 0.63 Perc. 5 70.0 0.75
Perc. 10 50.0 0.78 Perc. 10 70.0 0.77 Perc. 10 70.0 0.78
Perc. 25 70.0 0.91 Perc. 25 80.0 0.91 Perc. 25 75.0 0.84
Perc. 50 82.5 0.96 Perc. 50 90.0 0.92 Perc. 50 80.0 0.91
Perc. 75 100.0 1.00 Perc. 75 90.0 1.00 Perc. 75 91.0 1.00
Perc .90 100.0 1.00 Perc .90 95.0 1.00 Perc .90 100.0 1.00
Perc. 95 100.0 1.00 Perc. 95 100.0 1.00 Perc. 95 100.0 1.00
Rural, Female, 31-50 years, Low education (N=41)
Rural, Female, 31-50 years, Middle education (N=50)
Rural, Female, 31-50 years,
VAS Utility VAS Utility VAS Utility
Mean 83.4 0.92 Mean 78.3 0.92 Mean 87.5 0.96
SD 13.9 0.08 SD 15.8 0.10 SD 9.0 0.06
Perc. 5 60.0 0.80 Perc. 5 50.0 0.72 Perc. 5 70.0 0.84
Perc. 10 70.0 0.83 Perc. 10 55.0 0.75 Perc. 10 79.0 0.84
Perc. 25 70.0 0.87 Perc. 25 70.0 0.84 Perc. 25 80.0 0.91
Perc. 50 85.0 0.91 Perc. 50 80.0 1.00 Perc. 50 90.0 1.00
Perc. 75 90.0 1.00 Perc. 75 90.0 1.00 Perc. 75 95.0 1.00
Perc .90 100.0 1.00 Perc .90 100.0 1.00 Perc .90 100.0 1.00
Perc. 95 100.0 1.00 Perc. 95 100.0 1.00 Perc. 95 100.0 1.00
Rural, Female, >50 years, Low education (N=22)
Rural, Female, >50 years, Mid-dle education (N=23)
Rural, Female, >50 years,
VAS Utility VAS Utility VAS Utility
Mean 68.0 0.82 Mean 78.0 0.84 Mean 85.3 0.89
SD 16.2 0.17 SD 15.6 0.18 SD 12.2 0.08
Perc. 5 50.0 0.53 Perc. 5 50.0 0.62 Perc. 5 70.0 0.80
Perc. 10 50.0 0.55 Perc. 10 60.0 0.62 Perc. 10 70.0 0.80
Perc. 25 50.0 0.78 Perc. 25 70.0 0.75 Perc. 25 70.0 0.84
Perc. 50 67.5 0.84 Perc. 50 80.0 0.91 Perc. 50 90.0 0.87
Perc. 75 75.0 1.00 Perc. 75 90.0 1.00 Perc. 75 97.0 1.00
Perc .90 90.0 1.00 Perc .90 95.0 1.00 Perc .90 100.0 1.00
Perc. 95 100.0 1.00 Perc. 95 100.0 1.00 Perc. 95 100.0 1.00
5
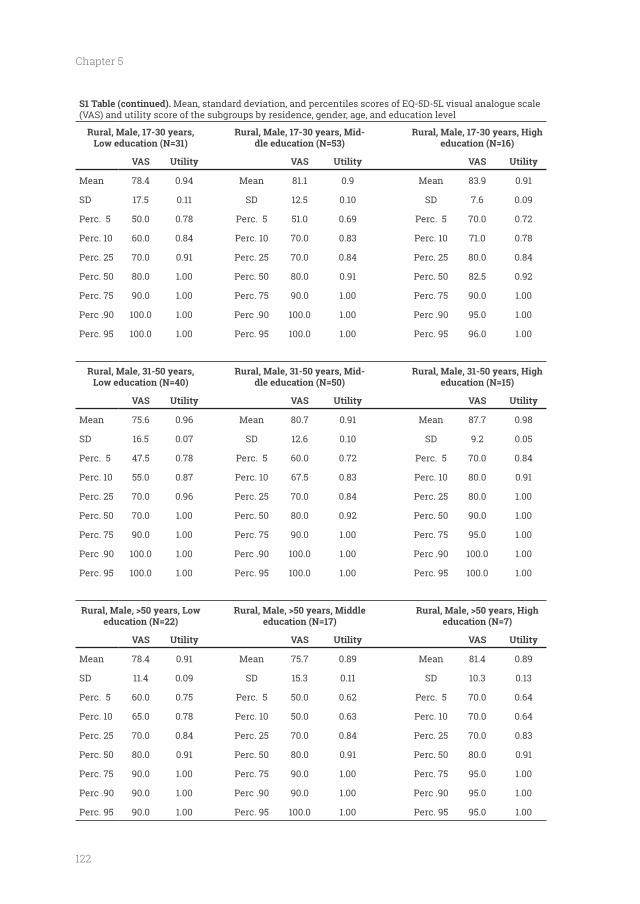
122
Chapter 5
S1 Table (continued). Mean, standard deviation, and percentiles scores of EQ-5D-5L visual analogue scale (VAS) and utility score of the subgroups by residence, gender, age, and education level
Rural, Male, 17-30 years, Low education (N=31)
Rural, Male, 17-30 years, Mid-dle education (N=53) education (N=16)
VAS Utility VAS Utility VAS Utility
Mean 78.4 0.94 Mean 81.1 0.9 Mean 83.9 0.91
SD 17.5 0.11 SD 12.5 0.10 SD 7.6 0.09
Perc. 5 50.0 0.78 Perc. 5 51.0 0.69 Perc. 5 70.0 0.72
Perc. 10 60.0 0.84 Perc. 10 70.0 0.83 Perc. 10 71.0 0.78
Perc. 25 70.0 0.91 Perc. 25 70.0 0.84 Perc. 25 80.0 0.84
Perc. 50 80.0 1.00 Perc. 50 80.0 0.91 Perc. 50 82.5 0.92
Perc. 75 90.0 1.00 Perc. 75 90.0 1.00 Perc. 75 90.0 1.00
Perc .90 100.0 1.00 Perc .90 100.0 1.00 Perc .90 95.0 1.00
Perc. 95 100.0 1.00 Perc. 95 100.0 1.00 Perc. 95 96.0 1.00
Rural, Male, 31-50 years, Low education (N=40)
Rural, Male, 31-50 years, Mid-dle education (N=50) education (N=15)
VAS Utility VAS Utility VAS Utility
Mean 75.6 0.96 Mean 80.7 0.91 Mean 87.7 0.98
SD 16.5 0.07 SD 12.6 0.10 SD 9.2 0.05
Perc. 5 47.5 0.78 Perc. 5 60.0 0.72 Perc. 5 70.0 0.84
Perc. 10 55.0 0.87 Perc. 10 67.5 0.83 Perc. 10 80.0 0.91
Perc. 25 70.0 0.96 Perc. 25 70.0 0.84 Perc. 25 80.0 1.00
Perc. 50 70.0 1.00 Perc. 50 80.0 0.92 Perc. 50 90.0 1.00
Perc. 75 90.0 1.00 Perc. 75 90.0 1.00 Perc. 75 95.0 1.00
Perc .90 100.0 1.00 Perc .90 100.0 1.00 Perc .90 100.0 1.00
Perc. 95 100.0 1.00 Perc. 95 100.0 1.00 Perc. 95 100.0 1.00
Rural, Male, >50 years, Low education (N=22)
Rural, Male, >50 years, Middle education (N=17) education (N=7)
VAS Utility VAS Utility VAS Utility
Mean 78.4 0.91 Mean 75.7 0.89 Mean 81.4 0.89
SD 11.4 0.09 SD 15.3 0.11 SD 10.3 0.13
Perc. 5 60.0 0.75 Perc. 5 50.0 0.62 Perc. 5 70.0 0.64
Perc. 10 65.0 0.78 Perc. 10 50.0 0.63 Perc. 10 70.0 0.64
Perc. 25 70.0 0.84 Perc. 25 70.0 0.84 Perc. 25 70.0 0.83
Perc. 50 80.0 0.91 Perc. 50 80.0 0.91 Perc. 50 80.0 0.91
Perc. 75 90.0 1.00 Perc. 75 90.0 1.00 Perc. 75 95.0 1.00
Perc .90 90.0 1.00 Perc .90 90.0 1.00 Perc .90 95.0 1.00
Perc. 95 90.0 1.00 Perc. 95 100.0 1.00 Perc. 95 95.0 1.00
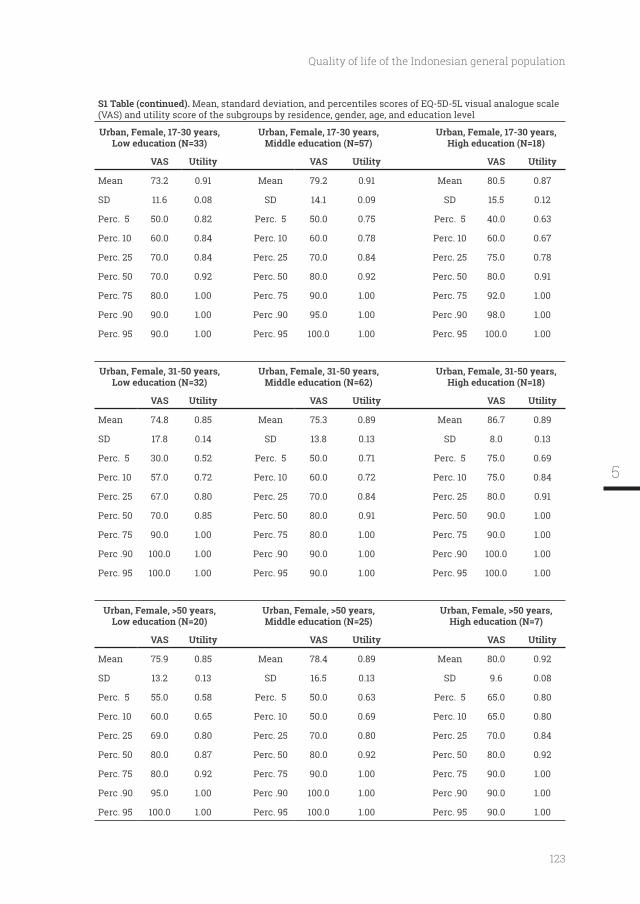
123
Quality of life of the Indonesian general population
S1 Table (continued). Mean, standard deviation, and percentiles scores of EQ-5D-5L visual analogue scale (VAS) and utility score of the subgroups by residence, gender, age, and education level
Urban, Female, 17-30 years, Low education (N=33)
Urban, Female, 17-30 years, Middle education (N=57)
Urban, Female, 17-30 years,
VAS Utility VAS Utility VAS Utility
Mean 73.2 0.91 Mean 79.2 0.91 Mean 80.5 0.87
SD 11.6 0.08 SD 14.1 0.09 SD 15.5 0.12
Perc. 5 50.0 0.82 Perc. 5 50.0 0.75 Perc. 5 40.0 0.63
Perc. 10 60.0 0.84 Perc. 10 60.0 0.78 Perc. 10 60.0 0.67
Perc. 25 70.0 0.84 Perc. 25 70.0 0.84 Perc. 25 75.0 0.78
Perc. 50 70.0 0.92 Perc. 50 80.0 0.92 Perc. 50 80.0 0.91
Perc. 75 80.0 1.00 Perc. 75 90.0 1.00 Perc. 75 92.0 1.00
Perc .90 90.0 1.00 Perc .90 95.0 1.00 Perc .90 98.0 1.00
Perc. 95 90.0 1.00 Perc. 95 100.0 1.00 Perc. 95 100.0 1.00
Urban, Female, 31-50 years, Low education (N=32)
Urban, Female, 31-50 years, Middle education (N=62)
Urban, Female, 31-50 years,
VAS Utility VAS Utility VAS Utility
Mean 74.8 0.85 Mean 75.3 0.89 Mean 86.7 0.89
SD 17.8 0.14 SD 13.8 0.13 SD 8.0 0.13
Perc. 5 30.0 0.52 Perc. 5 50.0 0.71 Perc. 5 75.0 0.69
Perc. 10 57.0 0.72 Perc. 10 60.0 0.72 Perc. 10 75.0 0.84
Perc. 25 67.0 0.80 Perc. 25 70.0 0.84 Perc. 25 80.0 0.91
Perc. 50 70.0 0.85 Perc. 50 80.0 0.91 Perc. 50 90.0 1.00
Perc. 75 90.0 1.00 Perc. 75 80.0 1.00 Perc. 75 90.0 1.00
Perc .90 100.0 1.00 Perc .90 90.0 1.00 Perc .90 100.0 1.00
Perc. 95 100.0 1.00 Perc. 95 90.0 1.00 Perc. 95 100.0 1.00
Urban, Female, >50 years, Low education (N=20)
Urban, Female, >50 years, Middle education (N=25)
Urban, Female, >50 years,
VAS Utility VAS Utility VAS Utility
Mean 75.9 0.85 Mean 78.4 0.89 Mean 80.0 0.92
SD 13.2 0.13 SD 16.5 0.13 SD 9.6 0.08
Perc. 5 55.0 0.58 Perc. 5 50.0 0.63 Perc. 5 65.0 0.80
Perc. 10 60.0 0.65 Perc. 10 50.0 0.69 Perc. 10 65.0 0.80
Perc. 25 69.0 0.80 Perc. 25 70.0 0.80 Perc. 25 70.0 0.84
Perc. 50 80.0 0.87 Perc. 50 80.0 0.92 Perc. 50 80.0 0.92
Perc. 75 80.0 0.92 Perc. 75 90.0 1.00 Perc. 75 90.0 1.00
Perc .90 95.0 1.00 Perc .90 100.0 1.00 Perc .90 90.0 1.00
Perc. 95 100.0 1.00 Perc. 95 100.0 1.00 Perc. 95 90.0 1.00
5
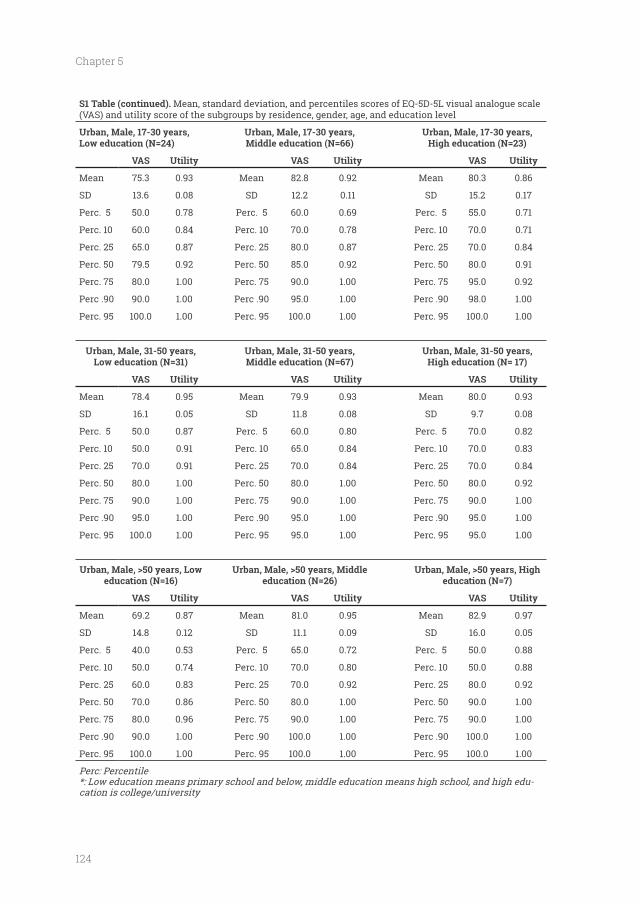
124
Chapter 5
S1 Table (continued). Mean, standard deviation, and percentiles scores of EQ-5D-5L visual analogue scale (VAS) and utility score of the subgroups by residence, gender, age, and education level
Urban, Male, 17-30 years, Low education (N=24)
Urban, Male, 17-30 years, Middle education (N=66)
Urban, Male, 17-30 years,
VAS Utility VAS Utility VAS Utility
Mean 75.3 0.93 Mean 82.8 0.92 Mean 80.3 0.86
SD 13.6 0.08 SD 12.2 0.11 SD 15.2 0.17
Perc. 5 50.0 0.78 Perc. 5 60.0 0.69 Perc. 5 55.0 0.71
Perc. 10 60.0 0.84 Perc. 10 70.0 0.78 Perc. 10 70.0 0.71
Perc. 25 65.0 0.87 Perc. 25 80.0 0.87 Perc. 25 70.0 0.84
Perc. 50 79.5 0.92 Perc. 50 85.0 0.92 Perc. 50 80.0 0.91
Perc. 75 80.0 1.00 Perc. 75 90.0 1.00 Perc. 75 95.0 0.92
Perc .90 90.0 1.00 Perc .90 95.0 1.00 Perc .90 98.0 1.00
Perc. 95 100.0 1.00 Perc. 95 100.0 1.00 Perc. 95 100.0 1.00
Urban, Male, 31-50 years, Low education (N=31)
Urban, Male, 31-50 years, Middle education (N=67)
Urban, Male, 31-50 years,
VAS Utility VAS Utility VAS Utility
Mean 78.4 0.95 Mean 79.9 0.93 Mean 80.0 0.93
SD 16.1 0.05 SD 11.8 0.08 SD 9.7 0.08
Perc. 5 50.0 0.87 Perc. 5 60.0 0.80 Perc. 5 70.0 0.82
Perc. 10 50.0 0.91 Perc. 10 65.0 0.84 Perc. 10 70.0 0.83
Perc. 25 70.0 0.91 Perc. 25 70.0 0.84 Perc. 25 70.0 0.84
Perc. 50 80.0 1.00 Perc. 50 80.0 1.00 Perc. 50 80.0 0.92
Perc. 75 90.0 1.00 Perc. 75 90.0 1.00 Perc. 75 90.0 1.00
Perc .90 95.0 1.00 Perc .90 95.0 1.00 Perc .90 95.0 1.00
Perc. 95 100.0 1.00 Perc. 95 95.0 1.00 Perc. 95 95.0 1.00
Urban, Male, >50 years, Low education (N=16)
Urban, Male, >50 years, Middle education (N=26) education (N=7)
VAS Utility VAS Utility VAS Utility
Mean 69.2 0.87 Mean 81.0 0.95 Mean 82.9 0.97
SD 14.8 0.12 SD 11.1 0.09 SD 16.0 0.05
Perc. 5 40.0 0.53 Perc. 5 65.0 0.72 Perc. 5 50.0 0.88
Perc. 10 50.0 0.74 Perc. 10 70.0 0.80 Perc. 10 50.0 0.88
Perc. 25 60.0 0.83 Perc. 25 70.0 0.92 Perc. 25 80.0 0.92
Perc. 50 70.0 0.86 Perc. 50 80.0 1.00 Perc. 50 90.0 1.00
Perc. 75 80.0 0.96 Perc. 75 90.0 1.00 Perc. 75 90.0 1.00
Perc .90 90.0 1.00 Perc .90 100.0 1.00 Perc .90 100.0 1.00
Perc. 95 100.0 1.00 Perc. 95 100.0 1.00 Perc. 95 100.0 1.00
Perc: Percentile*: Low education means primary school and below, middle education means high school, and high edu-cation is college/university
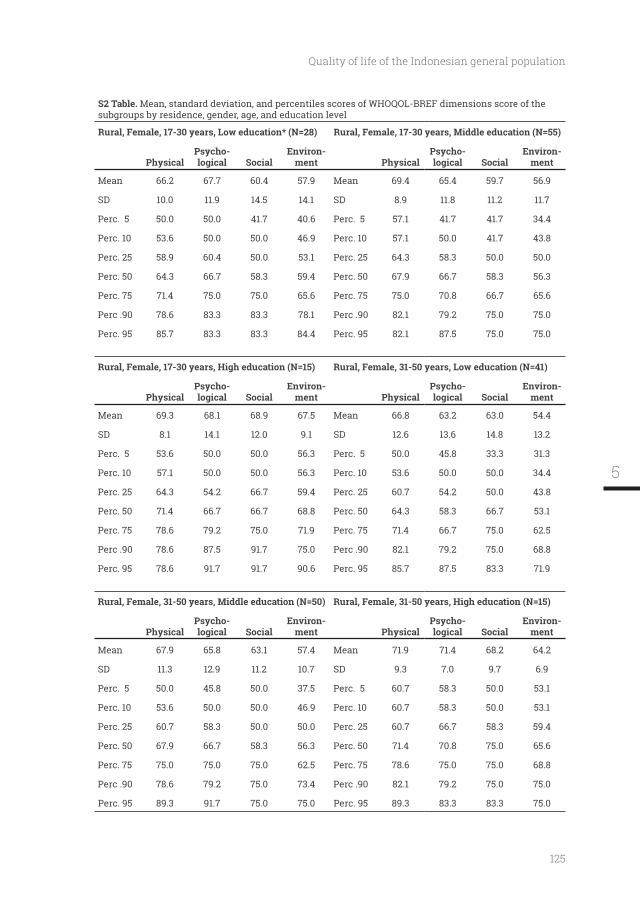
125
Quality of life of the Indonesian general population
S2 Table. Mean, standard deviation, and percentiles scores of WHOQOL-BREF dimensions score of the subgroups by residence, gender, age, and education level
Rural, Female, 17-30 years, Low education* (N=28) Rural, Female, 17-30 years, Middle education (N=55)
PhysicalPsycho-
SocialEnviron-
ment PhysicalPsycho-
SocialEnviron-
ment
Mean 66.2 67.7 60.4 57.9 Mean 69.4 65.4 59.7 56.9
SD 10.0 11.9 14.5 14.1 SD 8.9 11.8 11.2 11.7
Perc. 5 50.0 50.0 41.7 40.6 Perc. 5 57.1 41.7 41.7 34.4
Perc. 10 53.6 50.0 50.0 46.9 Perc. 10 57.1 50.0 41.7 43.8
Perc. 25 58.9 60.4 50.0 53.1 Perc. 25 64.3 58.3 50.0 50.0
Perc. 50 64.3 66.7 58.3 59.4 Perc. 50 67.9 66.7 58.3 56.3
Perc. 75 71.4 75.0 75.0 65.6 Perc. 75 75.0 70.8 66.7 65.6
Perc .90 78.6 83.3 83.3 78.1 Perc .90 82.1 79.2 75.0 75.0
Perc. 95 85.7 83.3 83.3 84.4 Perc. 95 82.1 87.5 75.0 75.0
Rural, Female, 31-50 years, Low education (N=41)
PhysicalPsycho-
SocialEnviron-
ment PhysicalPsycho-
SocialEnviron-
ment
Mean 69.3 68.1 68.9 67.5 Mean 66.8 63.2 63.0 54.4
SD 8.1 14.1 12.0 9.1 SD 12.6 13.6 14.8 13.2
Perc. 5 53.6 50.0 50.0 56.3 Perc. 5 50.0 45.8 33.3 31.3
Perc. 10 57.1 50.0 50.0 56.3 Perc. 10 53.6 50.0 50.0 34.4
Perc. 25 64.3 54.2 66.7 59.4 Perc. 25 60.7 54.2 50.0 43.8
Perc. 50 71.4 66.7 66.7 68.8 Perc. 50 64.3 58.3 66.7 53.1
Perc. 75 78.6 79.2 75.0 71.9 Perc. 75 71.4 66.7 75.0 62.5
Perc .90 78.6 87.5 91.7 75.0 Perc .90 82.1 79.2 75.0 68.8
Perc. 95 78.6 91.7 91.7 90.6 Perc. 95 85.7 87.5 83.3 71.9
Rural, Female, 31-50 years, Middle education (N=50)
PhysicalPsycho-
SocialEnviron-
ment PhysicalPsycho-
SocialEnviron-
ment
Mean 67.9 65.8 63.1 57.4 Mean 71.9 71.4 68.2 64.2
SD 11.3 12.9 11.2 10.7 SD 9.3 7.0 9.7 6.9
Perc. 5 50.0 45.8 50.0 37.5 Perc. 5 60.7 58.3 50.0 53.1
Perc. 10 53.6 50.0 50.0 46.9 Perc. 10 60.7 58.3 50.0 53.1
Perc. 25 60.7 58.3 50.0 50.0 Perc. 25 60.7 66.7 58.3 59.4
Perc. 50 67.9 66.7 58.3 56.3 Perc. 50 71.4 70.8 75.0 65.6
Perc. 75 75.0 75.0 75.0 62.5 Perc. 75 78.6 75.0 75.0 68.8
Perc .90 78.6 79.2 75.0 73.4 Perc .90 82.1 79.2 75.0 75.0
Perc. 95 89.3 91.7 75.0 75.0 Perc. 95 89.3 83.3 83.3 75.0
5
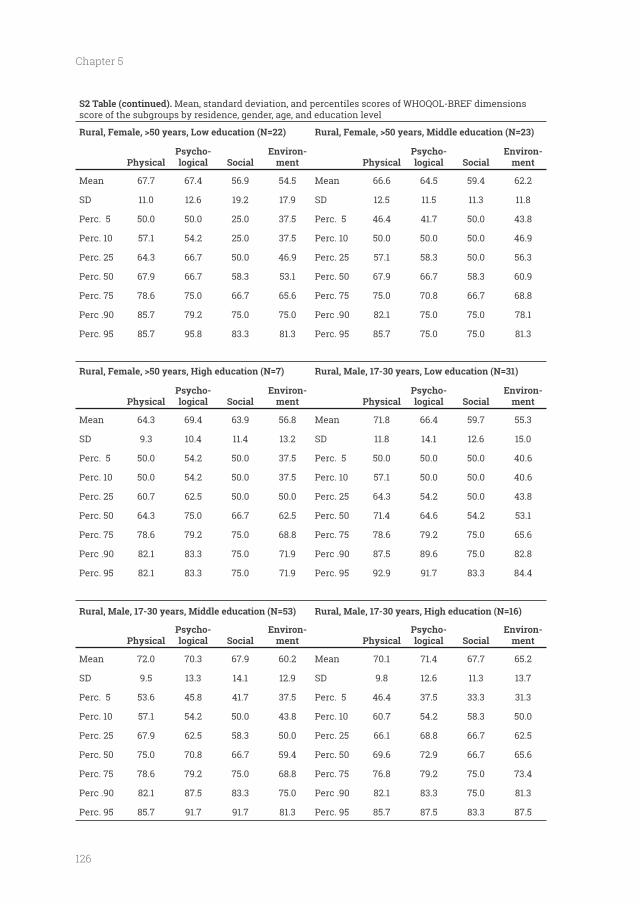
126
Chapter 5
S2 Table (continued). Mean, standard deviation, and percentiles scores of WHOQOL-BREF dimensions score of the subgroups by residence, gender, age, and education level
Rural, Female, >50 years, Low education (N=22) Rural, Female, >50 years, Middle education (N=23)
PhysicalPsycho-
SocialEnviron-
ment PhysicalPsycho-
SocialEnviron-
ment
Mean 67.7 67.4 56.9 54.5 Mean 66.6 64.5 59.4 62.2
SD 11.0 12.6 19.2 17.9 SD 12.5 11.5 11.3 11.8
Perc. 5 50.0 50.0 25.0 37.5 Perc. 5 46.4 41.7 50.0 43.8
Perc. 10 57.1 54.2 25.0 37.5 Perc. 10 50.0 50.0 50.0 46.9
Perc. 25 64.3 66.7 50.0 46.9 Perc. 25 57.1 58.3 50.0 56.3
Perc. 50 67.9 66.7 58.3 53.1 Perc. 50 67.9 66.7 58.3 60.9
Perc. 75 78.6 75.0 66.7 65.6 Perc. 75 75.0 70.8 66.7 68.8
Perc .90 85.7 79.2 75.0 75.0 Perc .90 82.1 75.0 75.0 78.1
Perc. 95 85.7 95.8 83.3 81.3 Perc. 95 85.7 75.0 75.0 81.3
Rural, Male, 17-30 years, Low education (N=31)
PhysicalPsycho-
SocialEnviron-
ment PhysicalPsycho-
SocialEnviron-
ment
Mean 64.3 69.4 63.9 56.8 Mean 71.8 66.4 59.7 55.3
SD 9.3 10.4 11.4 13.2 SD 11.8 14.1 12.6 15.0
Perc. 5 50.0 54.2 50.0 37.5 Perc. 5 50.0 50.0 50.0 40.6
Perc. 10 50.0 54.2 50.0 37.5 Perc. 10 57.1 50.0 50.0 40.6
Perc. 25 60.7 62.5 50.0 50.0 Perc. 25 64.3 54.2 50.0 43.8
Perc. 50 64.3 75.0 66.7 62.5 Perc. 50 71.4 64.6 54.2 53.1
Perc. 75 78.6 79.2 75.0 68.8 Perc. 75 78.6 79.2 75.0 65.6
Perc .90 82.1 83.3 75.0 71.9 Perc .90 87.5 89.6 75.0 82.8
Perc. 95 82.1 83.3 75.0 71.9 Perc. 95 92.9 91.7 83.3 84.4
Rural, Male, 17-30 years, Middle education (N=53)
PhysicalPsycho-
SocialEnviron-
ment PhysicalPsycho-
SocialEnviron-
ment
Mean 72.0 70.3 67.9 60.2 Mean 70.1 71.4 67.7 65.2
SD 9.5 13.3 14.1 12.9 SD 9.8 12.6 11.3 13.7
Perc. 5 53.6 45.8 41.7 37.5 Perc. 5 46.4 37.5 33.3 31.3
Perc. 10 57.1 54.2 50.0 43.8 Perc. 10 60.7 54.2 58.3 50.0
Perc. 25 67.9 62.5 58.3 50.0 Perc. 25 66.1 68.8 66.7 62.5
Perc. 50 75.0 70.8 66.7 59.4 Perc. 50 69.6 72.9 66.7 65.6
Perc. 75 78.6 79.2 75.0 68.8 Perc. 75 76.8 79.2 75.0 73.4
Perc .90 82.1 87.5 83.3 75.0 Perc .90 82.1 83.3 75.0 81.3
Perc. 95 85.7 91.7 91.7 81.3 Perc. 95 85.7 87.5 83.3 87.5
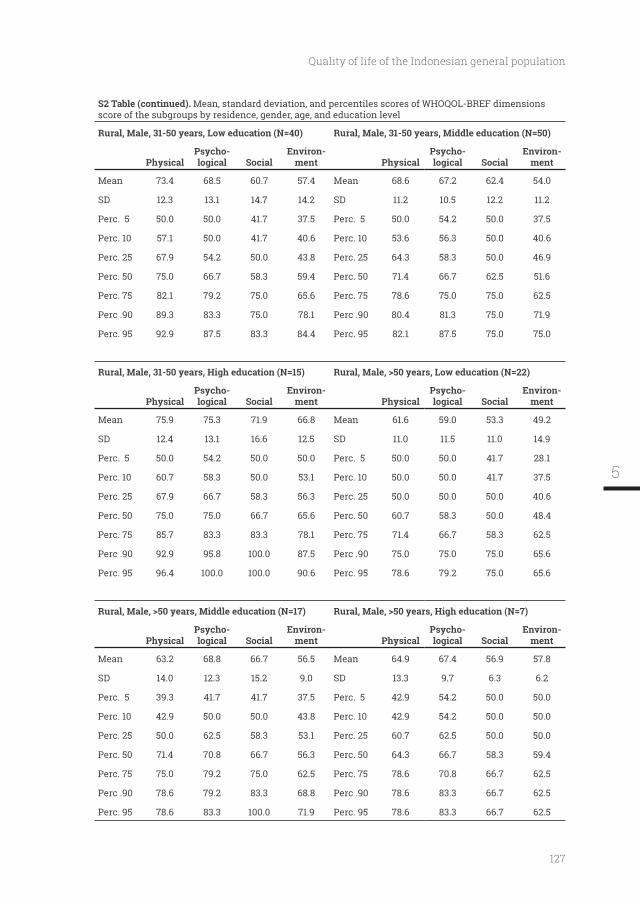
127
Quality of life of the Indonesian general population
S2 Table (continued). Mean, standard deviation, and percentiles scores of WHOQOL-BREF dimensions score of the subgroups by residence, gender, age, and education level
Rural, Male, 31-50 years, Low education (N=40) Rural, Male, 31-50 years, Middle education (N=50)
PhysicalPsycho-
SocialEnviron-
ment PhysicalPsycho-
SocialEnviron-
ment
Mean 73.4 68.5 60.7 57.4 Mean 68.6 67.2 62.4 54.0
SD 12.3 13.1 14.7 14.2 SD 11.2 10.5 12.2 11.2
Perc. 5 50.0 50.0 41.7 37.5 Perc. 5 50.0 54.2 50.0 37.5
Perc. 10 57.1 50.0 41.7 40.6 Perc. 10 53.6 56.3 50.0 40.6
Perc. 25 67.9 54.2 50.0 43.8 Perc. 25 64.3 58.3 50.0 46.9
Perc. 50 75.0 66.7 58.3 59.4 Perc. 50 71.4 66.7 62.5 51.6
Perc. 75 82.1 79.2 75.0 65.6 Perc. 75 78.6 75.0 75.0 62.5
Perc .90 89.3 83.3 75.0 78.1 Perc .90 80.4 81.3 75.0 71.9
Perc. 95 92.9 87.5 83.3 84.4 Perc. 95 82.1 87.5 75.0 75.0
Rural, Male, >50 years, Low education (N=22)
PhysicalPsycho-
SocialEnviron-
ment PhysicalPsycho-
SocialEnviron-
ment
Mean 75.9 75.3 71.9 66.8 Mean 61.6 59.0 53.3 49.2
SD 12.4 13.1 16.6 12.5 SD 11.0 11.5 11.0 14.9
Perc. 5 50.0 54.2 50.0 50.0 Perc. 5 50.0 50.0 41.7 28.1
Perc. 10 60.7 58.3 50.0 53.1 Perc. 10 50.0 50.0 41.7 37.5
Perc. 25 67.9 66.7 58.3 56.3 Perc. 25 50.0 50.0 50.0 40.6
Perc. 50 75.0 75.0 66.7 65.6 Perc. 50 60.7 58.3 50.0 48.4
Perc. 75 85.7 83.3 83.3 78.1 Perc. 75 71.4 66.7 58.3 62.5
Perc .90 92.9 95.8 100.0 87.5 Perc .90 75.0 75.0 75.0 65.6
Perc. 95 96.4 100.0 100.0 90.6 Perc. 95 78.6 79.2 75.0 65.6
Rural, Male, >50 years, Middle education (N=17)
PhysicalPsycho-
SocialEnviron-
ment PhysicalPsycho-
SocialEnviron-
ment
Mean 63.2 68.8 66.7 56.5 Mean 64.9 67.4 56.9 57.8
SD 14.0 12.3 15.2 9.0 SD 13.3 9.7 6.3 6.2
Perc. 5 39.3 41.7 41.7 37.5 Perc. 5 42.9 54.2 50.0 50.0
Perc. 10 42.9 50.0 50.0 43.8 Perc. 10 42.9 54.2 50.0 50.0
Perc. 25 50.0 62.5 58.3 53.1 Perc. 25 60.7 62.5 50.0 50.0
Perc. 50 71.4 70.8 66.7 56.3 Perc. 50 64.3 66.7 58.3 59.4
Perc. 75 75.0 79.2 75.0 62.5 Perc. 75 78.6 70.8 66.7 62.5
Perc .90 78.6 79.2 83.3 68.8 Perc .90 78.6 83.3 66.7 62.5
Perc. 95 78.6 83.3 100.0 71.9 Perc. 95 78.6 83.3 66.7 62.5
5
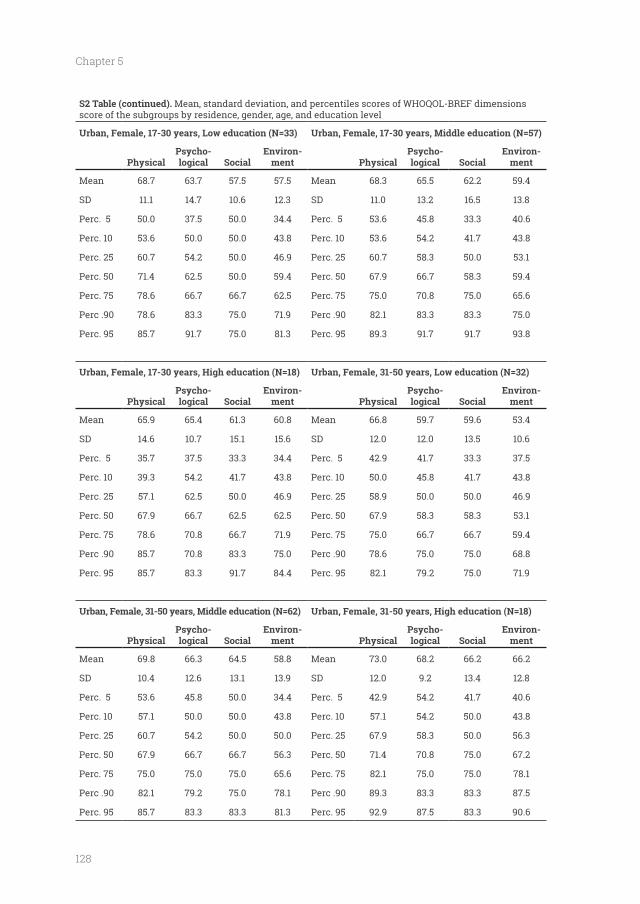
128
Chapter 5
S2 Table (continued). Mean, standard deviation, and percentiles scores of WHOQOL-BREF dimensions score of the subgroups by residence, gender, age, and education level
Urban, Female, 17-30 years, Low education (N=33) Urban, Female, 17-30 years, Middle education (N=57)
PhysicalPsycho-
SocialEnviron-
ment PhysicalPsycho-
SocialEnviron-
ment
Mean 68.7 63.7 57.5 57.5 Mean 68.3 65.5 62.2 59.4
SD 11.1 14.7 10.6 12.3 SD 11.0 13.2 16.5 13.8
Perc. 5 50.0 37.5 50.0 34.4 Perc. 5 53.6 45.8 33.3 40.6
Perc. 10 53.6 50.0 50.0 43.8 Perc. 10 53.6 54.2 41.7 43.8
Perc. 25 60.7 54.2 50.0 46.9 Perc. 25 60.7 58.3 50.0 53.1
Perc. 50 71.4 62.5 50.0 59.4 Perc. 50 67.9 66.7 58.3 59.4
Perc. 75 78.6 66.7 66.7 62.5 Perc. 75 75.0 70.8 75.0 65.6
Perc .90 78.6 83.3 75.0 71.9 Perc .90 82.1 83.3 83.3 75.0
Perc. 95 85.7 91.7 75.0 81.3 Perc. 95 89.3 91.7 91.7 93.8
Urban, Female, 31-50 years, Low education (N=32)
PhysicalPsycho-
SocialEnviron-
ment PhysicalPsycho-
SocialEnviron-
ment
Mean 65.9 65.4 61.3 60.8 Mean 66.8 59.7 59.6 53.4
SD 14.6 10.7 15.1 15.6 SD 12.0 12.0 13.5 10.6
Perc. 5 35.7 37.5 33.3 34.4 Perc. 5 42.9 41.7 33.3 37.5
Perc. 10 39.3 54.2 41.7 43.8 Perc. 10 50.0 45.8 41.7 43.8
Perc. 25 57.1 62.5 50.0 46.9 Perc. 25 58.9 50.0 50.0 46.9
Perc. 50 67.9 66.7 62.5 62.5 Perc. 50 67.9 58.3 58.3 53.1
Perc. 75 78.6 70.8 66.7 71.9 Perc. 75 75.0 66.7 66.7 59.4
Perc .90 85.7 70.8 83.3 75.0 Perc .90 78.6 75.0 75.0 68.8
Perc. 95 85.7 83.3 91.7 84.4 Perc. 95 82.1 79.2 75.0 71.9
Urban, Female, 31-50 years, Middle education (N=62)
PhysicalPsycho-
SocialEnviron-
ment PhysicalPsycho-
SocialEnviron-
ment
Mean 69.8 66.3 64.5 58.8 Mean 73.0 68.2 66.2 66.2
SD 10.4 12.6 13.1 13.9 SD 12.0 9.2 13.4 12.8
Perc. 5 53.6 45.8 50.0 34.4 Perc. 5 42.9 54.2 41.7 40.6
Perc. 10 57.1 50.0 50.0 43.8 Perc. 10 57.1 54.2 50.0 43.8
Perc. 25 60.7 54.2 50.0 50.0 Perc. 25 67.9 58.3 50.0 56.3
Perc. 50 67.9 66.7 66.7 56.3 Perc. 50 71.4 70.8 75.0 67.2
Perc. 75 75.0 75.0 75.0 65.6 Perc. 75 82.1 75.0 75.0 78.1
Perc .90 82.1 79.2 75.0 78.1 Perc .90 89.3 83.3 83.3 87.5
Perc. 95 85.7 83.3 83.3 81.3 Perc. 95 92.9 87.5 83.3 90.6
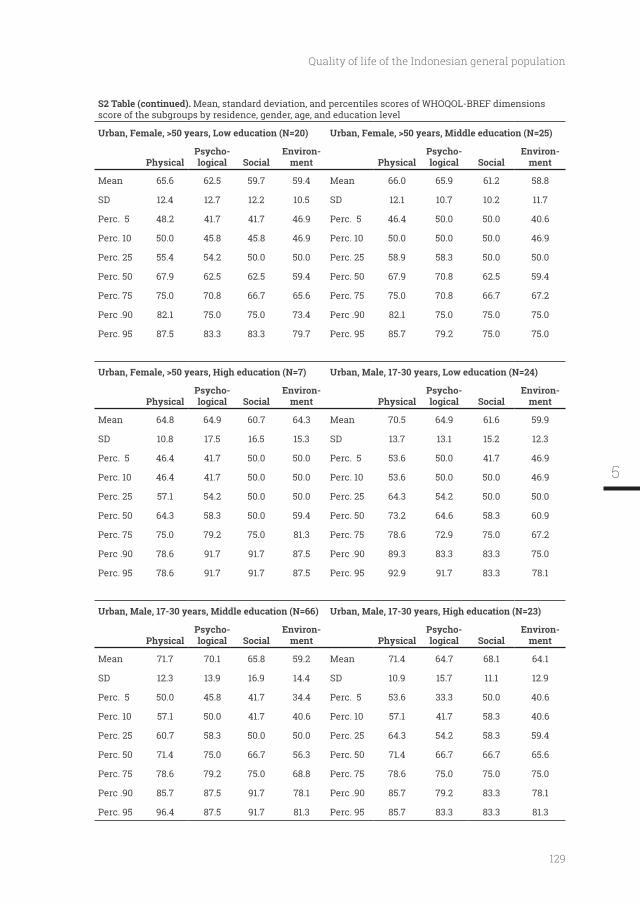
129
Quality of life of the Indonesian general population
S2 Table (continued). Mean, standard deviation, and percentiles scores of WHOQOL-BREF dimensions score of the subgroups by residence, gender, age, and education level
Urban, Female, >50 years, Low education (N=20) Urban, Female, >50 years, Middle education (N=25)
PhysicalPsycho-
SocialEnviron-
ment PhysicalPsycho-
SocialEnviron-
ment
Mean 65.6 62.5 59.7 59.4 Mean 66.0 65.9 61.2 58.8
SD 12.4 12.7 12.2 10.5 SD 12.1 10.7 10.2 11.7
Perc. 5 48.2 41.7 41.7 46.9 Perc. 5 46.4 50.0 50.0 40.6
Perc. 10 50.0 45.8 45.8 46.9 Perc. 10 50.0 50.0 50.0 46.9
Perc. 25 55.4 54.2 50.0 50.0 Perc. 25 58.9 58.3 50.0 50.0
Perc. 50 67.9 62.5 62.5 59.4 Perc. 50 67.9 70.8 62.5 59.4
Perc. 75 75.0 70.8 66.7 65.6 Perc. 75 75.0 70.8 66.7 67.2
Perc .90 82.1 75.0 75.0 73.4 Perc .90 82.1 75.0 75.0 75.0
Perc. 95 87.5 83.3 83.3 79.7 Perc. 95 85.7 79.2 75.0 75.0
Urban, Male, 17-30 years, Low education (N=24)
PhysicalPsycho-
SocialEnviron-
ment PhysicalPsycho-
SocialEnviron-
ment
Mean 64.8 64.9 60.7 64.3 Mean 70.5 64.9 61.6 59.9
SD 10.8 17.5 16.5 15.3 SD 13.7 13.1 15.2 12.3
Perc. 5 46.4 41.7 50.0 50.0 Perc. 5 53.6 50.0 41.7 46.9
Perc. 10 46.4 41.7 50.0 50.0 Perc. 10 53.6 50.0 50.0 46.9
Perc. 25 57.1 54.2 50.0 50.0 Perc. 25 64.3 54.2 50.0 50.0
Perc. 50 64.3 58.3 50.0 59.4 Perc. 50 73.2 64.6 58.3 60.9
Perc. 75 75.0 79.2 75.0 81.3 Perc. 75 78.6 72.9 75.0 67.2
Perc .90 78.6 91.7 91.7 87.5 Perc .90 89.3 83.3 83.3 75.0
Perc. 95 78.6 91.7 91.7 87.5 Perc. 95 92.9 91.7 83.3 78.1
Urban, Male, 17-30 years, Middle education (N=66)
PhysicalPsycho-
SocialEnviron-
ment PhysicalPsycho-
SocialEnviron-
ment
Mean 71.7 70.1 65.8 59.2 Mean 71.4 64.7 68.1 64.1
SD 12.3 13.9 16.9 14.4 SD 10.9 15.7 11.1 12.9
Perc. 5 50.0 45.8 41.7 34.4 Perc. 5 53.6 33.3 50.0 40.6
Perc. 10 57.1 50.0 41.7 40.6 Perc. 10 57.1 41.7 58.3 40.6
Perc. 25 60.7 58.3 50.0 50.0 Perc. 25 64.3 54.2 58.3 59.4
Perc. 50 71.4 75.0 66.7 56.3 Perc. 50 71.4 66.7 66.7 65.6
Perc. 75 78.6 79.2 75.0 68.8 Perc. 75 78.6 75.0 75.0 75.0
Perc .90 85.7 87.5 91.7 78.1 Perc .90 85.7 79.2 83.3 78.1
Perc. 95 96.4 87.5 91.7 81.3 Perc. 95 85.7 83.3 83.3 81.3
5
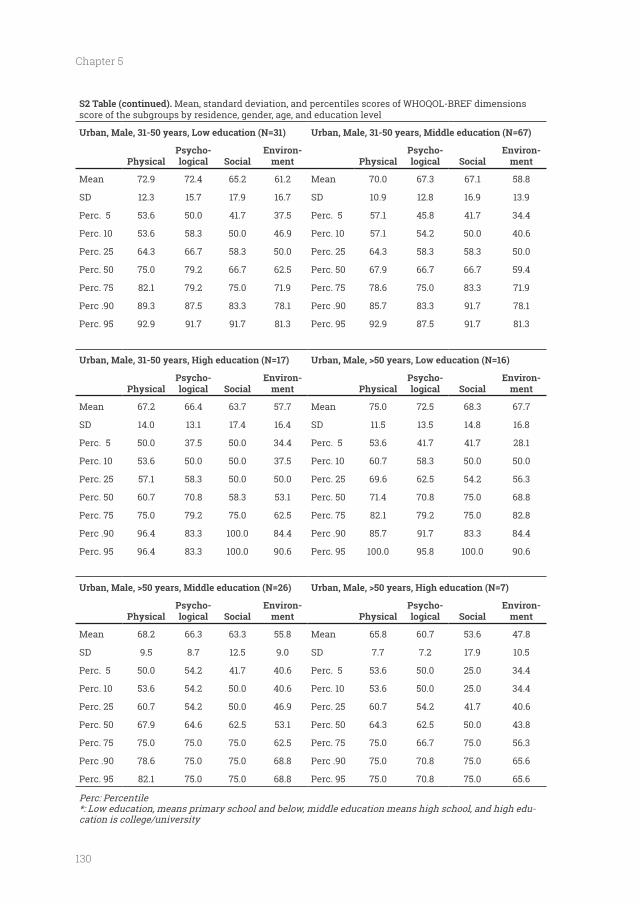
130
Chapter 5
S2 Table (continued). Mean, standard deviation, and percentiles scores of WHOQOL-BREF dimensions score of the subgroups by residence, gender, age, and education level
Urban, Male, 31-50 years, Low education (N=31) Urban, Male, 31-50 years, Middle education (N=67)
PhysicalPsycho-
SocialEnviron-
ment PhysicalPsycho-
SocialEnviron-
ment
Mean 72.9 72.4 65.2 61.2 Mean 70.0 67.3 67.1 58.8
SD 12.3 15.7 17.9 16.7 SD 10.9 12.8 16.9 13.9
Perc. 5 53.6 50.0 41.7 37.5 Perc. 5 57.1 45.8 41.7 34.4
Perc. 10 53.6 58.3 50.0 46.9 Perc. 10 57.1 54.2 50.0 40.6
Perc. 25 64.3 66.7 58.3 50.0 Perc. 25 64.3 58.3 58.3 50.0
Perc. 50 75.0 79.2 66.7 62.5 Perc. 50 67.9 66.7 66.7 59.4
Perc. 75 82.1 79.2 75.0 71.9 Perc. 75 78.6 75.0 83.3 71.9
Perc .90 89.3 87.5 83.3 78.1 Perc .90 85.7 83.3 91.7 78.1
Perc. 95 92.9 91.7 91.7 81.3 Perc. 95 92.9 87.5 91.7 81.3
Urban, Male, >50 years, Low education (N=16)
PhysicalPsycho-
SocialEnviron-
ment PhysicalPsycho-
SocialEnviron-
ment
Mean 67.2 66.4 63.7 57.7 Mean 75.0 72.5 68.3 67.7
SD 14.0 13.1 17.4 16.4 SD 11.5 13.5 14.8 16.8
Perc. 5 50.0 37.5 50.0 34.4 Perc. 5 53.6 41.7 41.7 28.1
Perc. 10 53.6 50.0 50.0 37.5 Perc. 10 60.7 58.3 50.0 50.0
Perc. 25 57.1 58.3 50.0 50.0 Perc. 25 69.6 62.5 54.2 56.3
Perc. 50 60.7 70.8 58.3 53.1 Perc. 50 71.4 70.8 75.0 68.8
Perc. 75 75.0 79.2 75.0 62.5 Perc. 75 82.1 79.2 75.0 82.8
Perc .90 96.4 83.3 100.0 84.4 Perc .90 85.7 91.7 83.3 84.4
Perc. 95 96.4 83.3 100.0 90.6 Perc. 95 100.0 95.8 100.0 90.6
Urban, Male, >50 years, Middle education (N=26)
PhysicalPsycho-
SocialEnviron-
ment PhysicalPsycho-
SocialEnviron-
ment
Mean 68.2 66.3 63.3 55.8 Mean 65.8 60.7 53.6 47.8
SD 9.5 8.7 12.5 9.0 SD 7.7 7.2 17.9 10.5
Perc. 5 50.0 54.2 41.7 40.6 Perc. 5 53.6 50.0 25.0 34.4
Perc. 10 53.6 54.2 50.0 40.6 Perc. 10 53.6 50.0 25.0 34.4
Perc. 25 60.7 54.2 50.0 46.9 Perc. 25 60.7 54.2 41.7 40.6
Perc. 50 67.9 64.6 62.5 53.1 Perc. 50 64.3 62.5 50.0 43.8
Perc. 75 75.0 75.0 75.0 62.5 Perc. 75 75.0 66.7 75.0 56.3
Perc .90 78.6 75.0 75.0 68.8 Perc .90 75.0 70.8 75.0 65.6
Perc. 95 82.1 75.0 75.0 68.8 Perc. 95 75.0 70.8 75.0 65.6
Perc: Percentile*: Low education, means primary school and below, middle education means high school, and high edu-cation is college/university
131
Quality of life of the Indonesian general population
5

the health status and quality of life of people living on an unhealthy riverbank
Published as: Purba FD, Hunfeld JAM, Fitriana TS, Iskandarsyah A, Sadarjoen SS,
the health status and quality of life of people living on an unhealthy riverbank.
BMC Public Health. 2018;18(1):782.
134
Chapter 6
Abstract
BACKGROUND -
poverished and physically unhealthy circumstances. However, they were reluctant to move or
be relocated to other locations where better living conditions were available. This study aimed
to investigate the health status, quality of life (QoL), happiness, and life satisfaction of the peo-
ple who were living on the banks of one of the main rivers in Jakarta, Indonesia, the Ciliwung.
METHODS: Respondents were 17 years and older and recruited from the Bukit Duri community
(n=204). Three comparison samples comprised: i) a socio-demographically matched control
group, not living on the river bank (n=204); ii) inhabitants of Jakarta (n=305), and iii) the Indo-
WHOQOL-BREF, the Happiness Scale, and the Life Satisfaction Index. A visual analogue scale
and the three comparison groups.
RESULTS: The Ciliwung respondents reported lower physical QoL on WHOQOL-BREF and less
personal happiness than the matched controls but rated their health (EQ-5D-5L) and life sat-
isfaction better than the matched controls. Similar results were obtained by comparison with
the Jakarta inhabitants and the general population. Bukit Duri inhabitants also perceived
though their incomes were lower.
CONCLUSIONS: The recent relocation to a better environment with better housing might im-
prove the former Ciliwung inhabitants’ quality of life and happiness, but not necessarily their
KEYWORDS: quality of life; health status; happiness; life satisfaction; water pollution; Indone-
sia
135
living circumstances. This is the case in the downstream areas of many rivers in Southeast
Asia, where waste from the factories and people of the upper and lower parts of the river is
Deltas in Cambodia and Vietnam, Manila bay, and the Mae Klong river in Thailand [1-6]. The
Ciliwung river in Jakarta on the island of Java in Indonesia is an example of such a situation.
length, with a catchment area of 390 square km. The Ciliwung river is heavily polluted with
Notwithstanding these circumstances, at the time of this study, many people still lived
next to the Ciliwung. Living in such a place with high health risks, inadequate infrastructure,
inhabitants as an acceptably safe and normal part of everyday life [12, 13]. People used the
river water for washing and defecating. The children played and swum with their playmates.
The houses had bad sanitation and were overcrowded; cats and mice could be found frequently
[14, 15]. Evidently, such living conditions were accompanied by increased risks of different
diseases, such as fecal-oral contagion, infectious diseases, skin complaints, and diarrhea.
Despite the conditions, the inhabitants were reluctant to move or to be relocated by the
government to other parts of Jakarta where better living conditions were available. This
apparent contradiction raises questions concerning their subjective health and quality of
life, including life satisfaction and happiness.
As elsewhere, government plans have been implemented in Jakarta to improve the state of
these plans upon the lives of the people involved, knowledge of their health status and quality
of life is required. Hence the aims of the present investigation were: 1) to obtain data on the
health status and quality of life of people living on the Ciliwung riverbank, and 2) to compare
these features with those of: i) a matched control group consisting of people with similar
demographic characteristics, ii) inhabitants of Jakarta in general, and iii) the norm scores
for the general population of Indonesia. The comparison groups were chosen to identify: i) the
6
136
Chapter 6
and quality of life; ii) how the group’s results on these features compared to those of (a) the
overall inhabitants of their metropolitan city Jakarta, and b) the Indonesian people in general.
Methods
Respondents
We conducted the survey in Bukit Duri, an administrative urban village of South Jakarta city
directly adjacent to the Ciliwung river. The population of Bukit Duri in 2015 consisted of 9233
families encompassing 32679 subjects [16]. Of these families, approximately 400 lived by the
Ciliwung. The inclusion criteria for this group, which will be referred to as ‘Ciliwung’ in this
manuscript, were the following: i) living by the Ciliwung river, ii) aged 17 years or more, iii)
an adequate command of the Indonesian language Bahasa Indonesia. The interviewers were
the area. As no formal street plan existed, nor any detailed information about the number of
inhabitants per house, respondents were invited after knocking on each door. Because of this
have been living in a household. We were able to interview 204 respondents.
The data for the three comparison groups: the Indonesian general population (which will
be referred to as ‘general population’), Jakarta sample (‘Jakarta’), and a comparable matched
control group (‘matched control’) were selected from our larger study which focused upon
the Indonesian general population, in which several questionnaires were tested in a face-to-
representativeness of the Indonesian general population, resulting in 1041 respondents being
respect to location (urban/rural), gender, age, level of education, religion, and ethnicity [17]. For
Jakarta as a comparison group, all respondents from the larger study who lived in Jakarta were
included (n=305). For the control group, we matched every respondent from the Ciliwung group
with a respondent from the general population group with respect to their gender, age group,
level of education, and monthly income. When there was more than one match for a respondent
from of the Ciliwung population, a subject was randomly chosen from the possible matches.
137
Procedure
The study was approved by the Health Research Ethics Committee, YARSI University,
of Psychology as interviewers. All interviewers were trained by two of the authors at a half-day
workshop concerned with the research project itself, the questionnaires, and the interview
technique. The interviews were held at the homes of the respondents. Before they participated
in the study, the interviewers asked the respondents to read and sign informed consent forms.
Respondents were encouraged to read the questionnaire by themselves, but if they had
the interviewers would help them by reading aloud an item and asking them to indicate the
study as a token of appreciation.
Measures
questionnaire including questions about the respondent’s gender, age, ethnicity, education,
religion, income, and marital status.
Indonesia version provided by the EuroQol Group. This translation of EQ-5D-5L was produced
countries [19-22] including in Indonesian population samples [23, 24]. The EQ-5D-5L is a generic
(no problems, slight problems, moderate problems, severe problems, and unable/extreme
problems), and ii) the EQ Visual Analogue Scale (EQ-VAS), which records the respondent’s
self-rated health on a 20 cm vertical visual analogue scale with endpoints labelled “the best
health you can imagine’’ and “the worst health you can imagine” [25].
Quality of life was measured by the Indonesian version of WHOQOL-BREF, which is an
abbreviated 26-item version of WHOQOL-100 that assesses four major domains: physical,
psychological, social relationships, and environment. Each item is rated using a 5-point
Likert scale with varied wording on each scale depending on the item (for example 1 = very
0 and 100, with 0 being the least favorable quality of life and 100 being the most favorable [26,
27]. The WHOQOL-BREF has been proved valid in a variety of contexts, and across many health
conditions in many countries [28-32], including in Indonesia [33]. In line with the manual of the
English version of WHOQOL-BREF [27], we chose to apply a time-frame of four weeks, and our
6
138
Chapter 6
used the self-administered paper-based WHOQOL-BREF for this study. The Indonesian version
of WHOQOL-BREF is available and has been proven as a valid and reliable questionnaire to
be used in Indonesia [33].
In addition, we measured the respondents’ personal happiness and life satisfaction.
Personal happiness was assessed with the Happiness Thermometer, an 11-point scale for
the assessment of happiness: during today, over the past month, and for life as a whole.
0, represented by a ‘sad smiley’, to 5, represented by a neutral smiley, to 10, represented by a
this study’s sample, the internal consistency of the Happiness Thermometer scale was 0.78.
Life satisfaction was assessed with Cantril’s Self-Anchoring Striving Scale [37].
Participants were presented an 11-step vertical ladder, where the bottom step was marked
with 0, the worst life possible, and the last step with 10, the best possible life. Participants
[38]. The internal consistency of the Cantril’s Self-Anchoring Striving Scale in the present
sample was 0.74.
Finally, we were interested in how the people of Ciliwung, who lived in a poor area of
imagine’) to 10 (‘the richest you can imagine’) was presented for the respondents to choose.
The cultural adaptation of the questionnaires was conducted following guidelines from
Guillemin [39] which consist of forward translation, backward translation, committee review,
and pre-testing. The EQ-5D-5L and WHOQOL-BREF were available in Bahasa Indonesia
Happiness Thermometer and Cantril’s Self-Anchoring Striving Scale were translated into
Bahasa Indonesia by two native Indonesian speakers, backward translated into English by
a native English speaker, and the study team held a meeting to check on the equivalence of
the two translations. A pilot study of 46 inhabitants of Ciliwung was conducted to test the
feasibility of the questionnaires and revision was subsequently undertaken based on the
pilot study.
139
Analysis
The demographic characteristics were described as percentages within the subgroups in
each sample: i.e. gender, age group, education level, ethnicity, religion, monthly income and
percentages of respondents for each level of each dimension. We then combined level 2 (slight
problems) through to level 5 (unable/extreme problems) into ‘any problems’ and presented this
along with level 1 (no problems). The proportions of the Ciliwung and the three comparison
groups’ respondents who reported any problems were compared using the Chi-square test.
The EQ-5D-5L health states were converted into a single index score using the Indonesian
value set [17], and EQ-VAS was scored by transforming the 20 cm VAS into a 0-100 scale [40].
Mean and standard deviation were calculated for each different domain of WHOQOL-BREF, and
For the comparison between the Ciliwung sample and the three other groups of the
domains of each variable: health status (EQ-VAS and index score), quality of life (physical,
psychological, social relationships and environment domains from WHOQOL-BREF), personal
distributed or the Wilcoxon rank-sum test if not normally distributed. Normality was tested
using the Shapiro-Wilk test. We also applied one-way MANOVA to test the difference between
groups across each outcome variable’s domains simultaneously: health status, quality of life,
happiness, and life satisfaction. The groups - Ciliwung, matched control, Jakarta, general
population - served as the predictors. Further multiple linear regression analysis was carried
out to evaluate the group differences when controlling for socio-demographic variables:
gender, age, education, monthly income, ethnicity, religion, and marital status. Additional
multiple linear regression analyses were conducted to evaluate the group differences in the
average scores of the three time-points on the Happiness Thermometer and on Cantril’s Self-
6
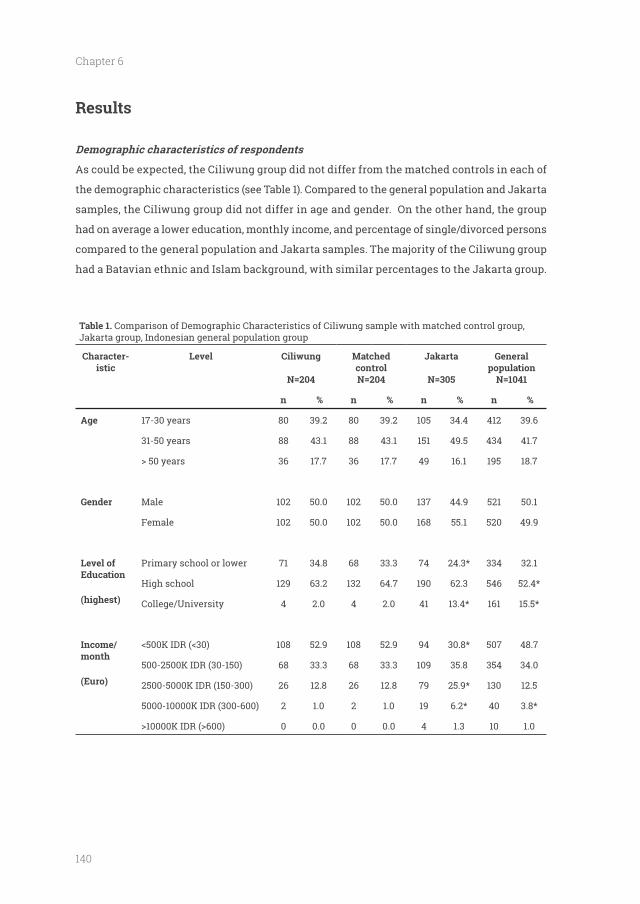
140
Chapter 6
Results
As could be expected, the Ciliwung group did not differ from the matched controls in each of
the demographic characteristics (see Table 1). Compared to the general population and Jakarta
samples, the Ciliwung group did not differ in age and gender. On the other hand, the group
had on average a lower education, monthly income, and percentage of single/divorced persons
compared to the general population and Jakarta samples. The majority of the Ciliwung group
had a Batavian ethnic and Islam background, with similar percentages to the Jakarta group.
Table 1. Comparison of Demographic Characteristics of Ciliwung sample with matched control group, Jakarta group, Indonesian general population group
Character-istic
Level
N=204
Matched control N=204
Jakarta
N=305
General population
N=1041
n n n n
17-30 years 80 39.2 80 39.2 105 34.4 412 39.6
31-50 years 88 43.1 88 43.1 151 49.5 434 41.7
36 17.7 36 17.7 49 16.1 195 18.7
Gender Male 102 50.0 102 50.0 137 44.9 521 50.1
Female 102 50.0 102 50.0 168 55.1 520 49.9
Level of Education
Primary school or lower 71 34.8 68 33.3 74 24.3* 334 32.1
High school 129 63.2 132 64.7 190 62.3 546 52.4*
College/University 4 2.0 4 2.0 41 13.4* 161 15.5*
Income/month
(Euro)
108 52.9 108 52.9 94 30.8* 507 48.7
500-2500K IDR (30-150) 68 33.3 68 33.3 109 35.8 354 34.0
2500-5000K IDR (150-300) 26 12.8 26 12.8 79 25.9* 130 12.5
5000-10000K IDR (300-600) 2 1.0 2 1.0 19 6.2* 40 3.8*
0 0.0 0 0.0 4 1.3 10 1.0
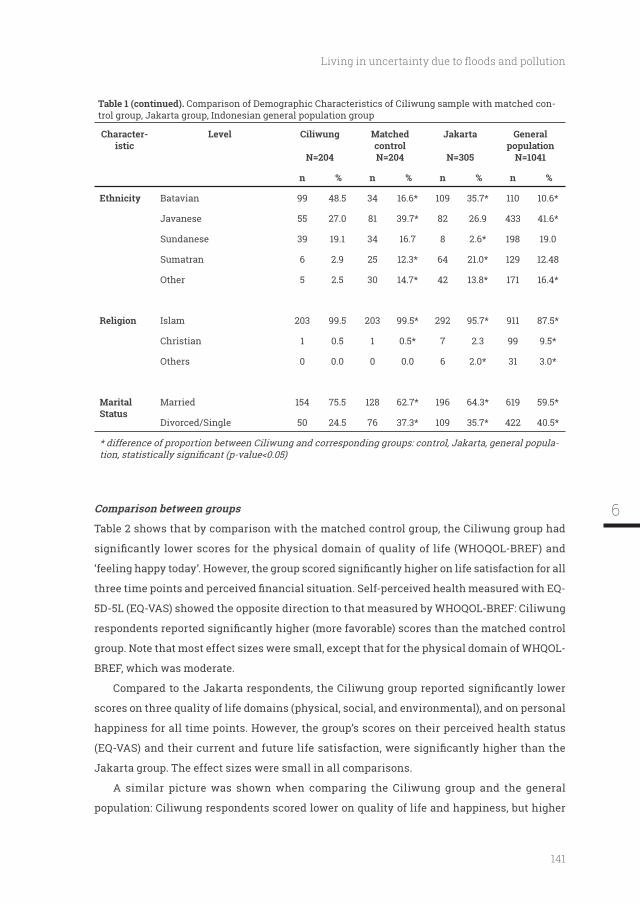
141
Table 1 (continued). Comparison of Demographic Characteristics of Ciliwung sample with matched con-trol group, Jakarta group, Indonesian general population group
Character-istic
Level
N=204
Matched control N=204
Jakarta
N=305
General population
N=1041
n n n n
Ethnicity Batavian 99 48.5 34 16.6* 109 35.7* 110 10.6*
Javanese 55 27.0 81 39.7* 82 26.9 433 41.6*
Sundanese 39 19.1 34 16.7 8 2.6* 198 19.0
Sumatran 6 2.9 25 12.3* 64 21.0* 129 12.48
Other 5 2.5 30 14.7* 42 13.8* 171 16.4*
Islam 203 99.5 203 99.5* 292 95.7* 911 87.5*
Christian 1 0.5 1 0.5* 7 2.3 99 9.5*
Others 0 0.0 0 0.0 6 2.0* 31 3.0*
Marital Status
Married 154 75.5 128 62.7* 196 64.3* 619 59.5*
Divorced/Single 50 24.5 76 37.3* 109 35.7* 422 40.5*
* difference of proportion between Ciliwung and corresponding groups: control, Jakarta, general popula-
Table 2 shows that by comparison with the matched control group, the Ciliwung group had
5D-5L (EQ-VAS) showed the opposite direction to that measured by WHOQOL-BREF: Ciliwung
BREF, which was moderate.
scores on three quality of life domains (physical, social, and environmental), and on personal
happiness for all time points. However, the group’s scores on their perceived health status
A similar picture was shown when comparing the Ciliwung group and the general
population: Ciliwung respondents scored lower on quality of life and happiness, but higher
6
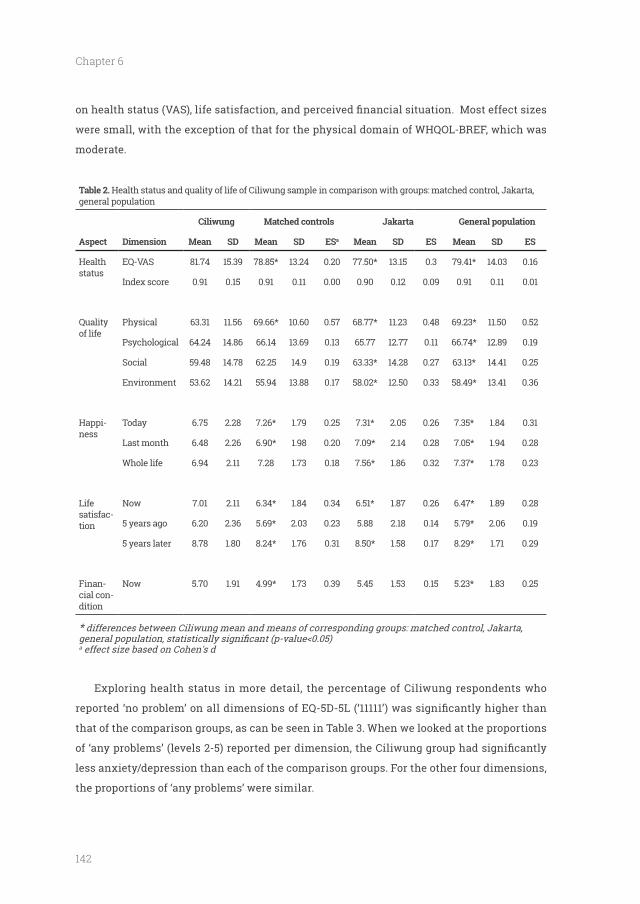
142
Chapter 6
were small, with the exception of that for the physical domain of WHQOL-BREF, which was
moderate.
Table 2. Health status and quality of life of Ciliwung sample in comparison with groups: matched control, Jakarta, general population
Matched controls Jakarta General population
Aspect Dimension Mean SD Mean SD ESa Mean SD ES Mean SD ES
Health status
EQ-VAS 81.74 15.39 78.85* 13.24 0.20 77.50* 13.15 0.3 79.41* 14.03 0.16
Index score 0.91 0.15 0.91 0.11 0.00 0.90 0.12 0.09 0.91 0.11 0.01
Quality of life
Physical 63.31 11.56 69.66* 10.60 0.57 68.77* 11.23 0.48 69.23* 11.50 0.52
Psychological 64.24 14.86 66.14 13.69 0.13 65.77 12.77 0.11 66.74* 12.89 0.19
Social 59.48 14.78 62.25 14.9 0.19 63.33* 14.28 0.27 63.13* 14.41 0.25
Environment 53.62 14.21 55.94 13.88 0.17 58.02* 12.50 0.33 58.49* 13.41 0.36
Happi-ness
Today 6.75 2.28 7.26* 1.79 0.25 7.31* 2.05 0.26 7.35* 1.84 0.31
Last month 6.48 2.26 6.90* 1.98 0.20 7.09* 2.14 0.28 7.05* 1.94 0.28
Whole life 6.94 2.11 7.28 1.73 0.18 7.56* 1.86 0.32 7.37* 1.78 0.23
Life satisfac-tion
Now 7.01 2.11 6.34* 1.84 0.34 6.51* 1.87 0.26 6.47* 1.89 0.28
5 years ago 6.20 2.36 5.69* 2.03 0.23 5.88 2.18 0.14 5.79* 2.06 0.19
5 years later 8.78 1.80 8.24* 1.76 0.31 8.50* 1.58 0.17 8.29* 1.71 0.29
Finan-cial con-dition
Now 5.70 1.91 4.99* 1.73 0.39 5.45 1.53 0.15 5.23* 1.83 0.25
* differences between Ciliwung mean and means of corresponding groups: matched control, Jakarta,
a
Exploring health status in more detail, the percentage of Ciliwung respondents who
that of the comparison groups, as can be seen in Table 3. When we looked at the proportions
less anxiety/depression than each of the comparison groups. For the other four dimensions,
the proportions of ‘any problems’ were similar.
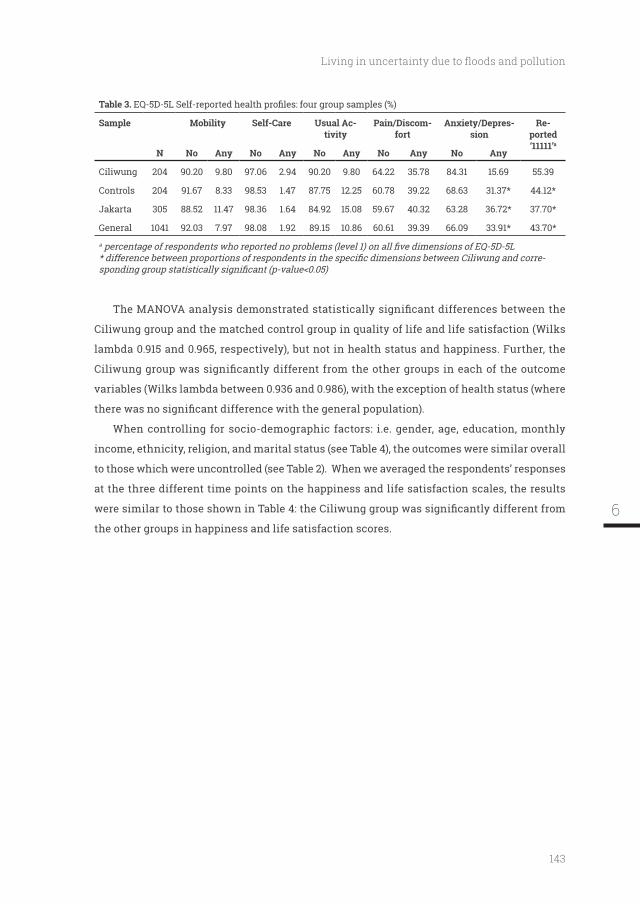
143
Table 3.
Sample Mobility Self-Care Usual Ac-tivity
Pain/Discom-fort
Anxiety/Depres-sion
Re-ported ‘11111’a
N No Any No Any No Any No Any No Any
Ciliwung 204 90.20 9.80 97.06 2.94 90.20 9.80 64.22 35.78 84.31 15.69 55.39
Controls 204 91.67 8.33 98.53 1.47 87.75 12.25 60.78 39.22 68.63 31.37* 44.12*
Jakarta 305 88.52 11.47 98.36 1.64 84.92 15.08 59.67 40.32 63.28 36.72* 37.70*
General 1041 92.03 7.97 98.08 1.92 89.15 10.86 60.61 39.39 66.09 33.91* 43.70*
a
-
Ciliwung group and the matched control group in quality of life and life satisfaction (Wilks
lambda 0.915 and 0.965, respectively), but not in health status and happiness. Further, the
variables (Wilks lambda between 0.936 and 0.986), with the exception of health status (where
When controlling for socio-demographic factors: i.e. gender, age, education, monthly
income, ethnicity, religion, and marital status (see Table 4), the outcomes were similar overall
to those which were uncontrolled (see Table 2). When we averaged the respondents’ responses
at the three different time points on the happiness and life satisfaction scales, the results
the other groups in happiness and life satisfaction scores.6
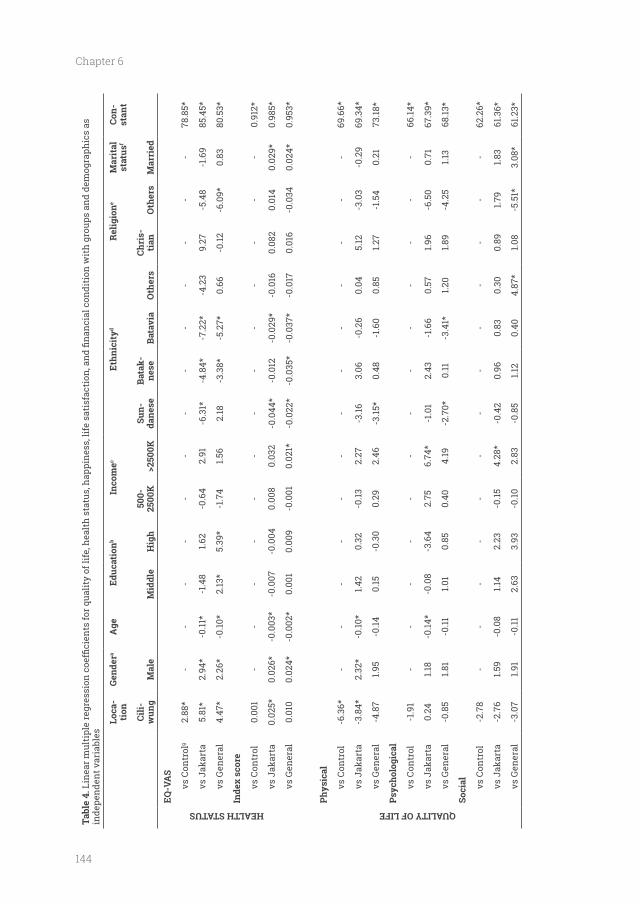
144
Chapter 6
Tabl
e 4.
inde
pend
ent v
aria
bles
Loca
-ti
onGe
nder
aEd
ucat
ionb
Inco
mec
Ethn
icit
yde
Mar
ital
st
atus
fCo
n-st
ant
Cili -
Mal
eM
iddl
e50
0-25
00K
>250
0KSu
n-da
nese
Bata
k-ne
seBa
tavi
aO
ther
sCh
ris-
tian
Oth
ers
Mar
ried
HEALTH STATUS
EQ-V
AS
vs C
ontr
olg
2.88
*-
--
--
--
--
--
--
78.8
5*
vs J
akar
ta5.
81*
2.94
*-0
.11*
-1.4
81.6
2-0
.64
2.91
-6.3
1*-4
.84*
-7.2
2*-4
.23
9.27
-5.4
8-1
.69
85.4
5*
vs G
ener
al
4.47
*2.
26*
-0.10
*2.
13*
5.39
*-1
.74
1.56
2.18
-3.3
8*-5
.27*
0.66
-0.12
-6.0
9*0.
8380
.53*
Inde
x sc
ore
vs C
ontr
ol0.
001
--
--
--
--
--
--
-0.
912*
vs J
akar
ta0.
025*
0.02
6*-0
.003
*-0
.007
-0.0
040.
008
0.03
2-0
.044
*-0
.012
-0.0
29*
-0.0
160.
082
0.01
40.
029*
0.98
5*
vs G
ener
al
0.01
00.
024*
-0.0
02*
0.00
10.
009
-0.0
010.
021*
-0.0
22*
-0.0
35*
-0.0
37*
-0.0
170.
016
-0.0
340.
024*
0.95
3*
QUALITY OF LIFE
Phys
ical
vs C
ontr
ol-6
.36*
--
--
--
--
--
--
-69
.66*
vs J
akar
ta-3
.84*
2.32
*-0
.10*
1.42
0.32
-0.13
2.27
-3.16
3.06
-0.2
60.
045.
12-3
.03
-0.2
969
.34*
vs G
ener
al
-4.8
71.9
5-0
.140.
15-0
.30
0.29
2.46
-3.15
*0.
48-1
.60
0.85
1.27
-1.5
40.
2173
.18*
vs C
ontr
ol-1
.91
--
--
--
--
--
--
-66
.14*
vs J
akar
ta0.
241.1
8-0
.14*
-0.0
8-3
.64
2.75
6.74
*-1
.01
2.43
-1.6
60.
571.9
6-6
.50
0.71
67.3
9*
vs G
ener
al
-0.8
51.8
1-0
.111.0
10.
850.
404.
19-2
.70*
0.11
-3.4
1*1.2
01.8
9-4
.25
1.13
68.13
*
Soci
al vs C
ontr
ol-2
.78
--
--
--
--
--
--
-62
.26*
vs J
akar
ta-2
.76
1.59
-0.0
81.1
42.
23-0
.154.
28*
-0.4
20.
960.
830.
300.
891.7
91.8
361
.36*
vs G
ener
al
-3.0
71.9
1-0
.112.
633.
93-0
.102.
83-0
.85
1.12
0.40
4.87
*1.0
8-5
.51*
3.08
*61
.23*
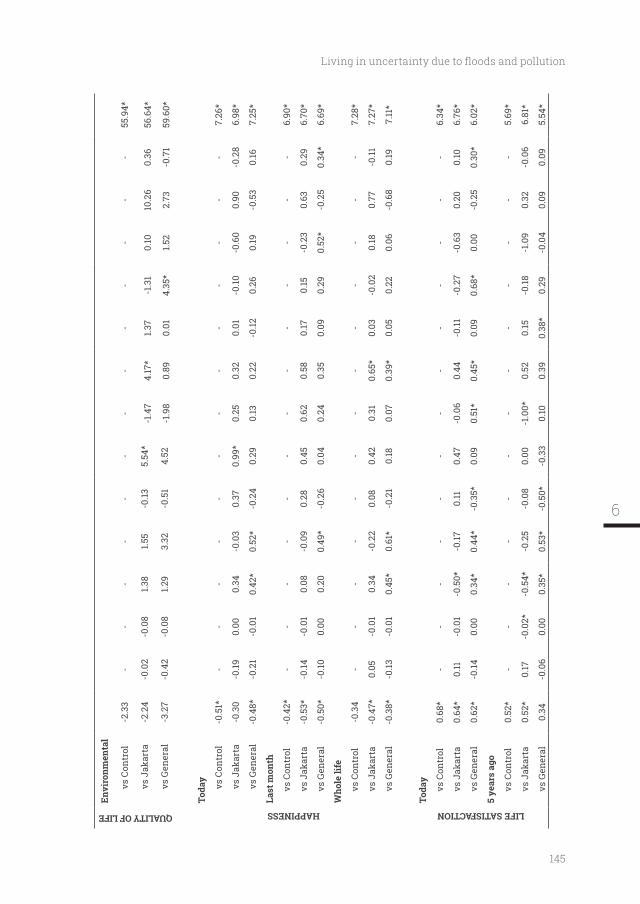
145
QUALITY OF LIFE
Envi
ronm
enta
l
vs C
ontr
ol-2
.33
--
--
--
--
--
--
-55
.94*
vs J
akar
ta-2
.24
-0.0
2-0
.08
1.38
1.55
-0.13
5.54
*-1
.47
4.17
*1.3
7-1
.31
0.10
10.2
60.
3656
.64*
vs G
ener
al
-3.2
7-0
.42
-0.0
81.2
93.
32-0
.51
4.52
-1.9
80.
890.
014.
35*
1.52
2.73
-0.7
159
.60*
HAPPINESS
Toda
y
vs C
ontr
ol-0
.51*
--
--
--
--
--
--
-7.
26*
vs J
akar
ta-0
.30
-0.19
0.00
0.34
-0.0
30.
370.
99*
0.25
0.32
0.01
-0.10
-0.6
00.
90-0
.28
6.98
*
vs G
ener
al
-0.4
8*-0
.21
-0.0
10.
42*
0.52
*-0
.24
0.29
0.13
0.22
-0.12
0.26
0.19
-0.5
30.
167.
25*
Last
mon
th
vs C
ontr
ol-0
.42*
--
--
--
--
--
--
-6.
90*
vs J
akar
ta-0
.53*
-0.14
-0.0
10.
08-0
.09
0.28
0.45
0.62
0.58
0.17
0.15
-0.2
30.
630.
296.
70*
vs G
ener
al
-0.5
0*-0
.100.
000.
200.
49*
-0.2
60.
040.
240.
350.
090.
290.
52*
-0.2
50.
34*
6.69
*
Who
le li
fe
vs C
ontr
ol-0
.34
--
--
--
--
--
--
-7.
28*
vs J
akar
ta-0
.47*
0.05
-0.0
10.
34-0
.22
0.08
0.42
0.31
0.65
*0.
03-0
.02
0.18
0.77
-0.11
7.27
*
vs G
ener
al
-0.3
8*-0
.13-0
.01
0.45
*0.
61*
-0.2
10.
180.
070.
39*
0.05
0.22
0.06
-0.6
80.
197.
11*
LIFE SATISFACTION
Toda
y
vs C
ontr
ol0.
68*
--
--
--
--
--
--
-6.
34*
vs J
akar
ta0.
64*
0.11
-0.0
1-0
.50*
-0.17
0.11
0.47
-0.0
60.
44-0
.11-0
.27
-0.6
30.
200.
106.
76*
vs G
ener
al
0.62
*-0
.140.
000.
34*
0.44
*-0
.35*
0.09
0.51
*0.
45*
0.09
0.68
*0.
00-0
.25
0.30
*6.
02*
vs C
ontr
ol0.
52*
--
--
--
--
--
--
-5.
69*
vs J
akar
ta0.
52*
0.17
-0.0
2*-0
.54*
-0.2
5-0
.08
0.00
-1.0
0*0.
520.
15-0
.18-1
.09
0.32
-0.0
66.
81*
vs G
ener
al
0.34
-0.0
60.
000.
35*
0.53
*-0
.50*
-0.3
30.
100.
390.
38*
0.29
-0.0
40.
090.
095.
54*
6
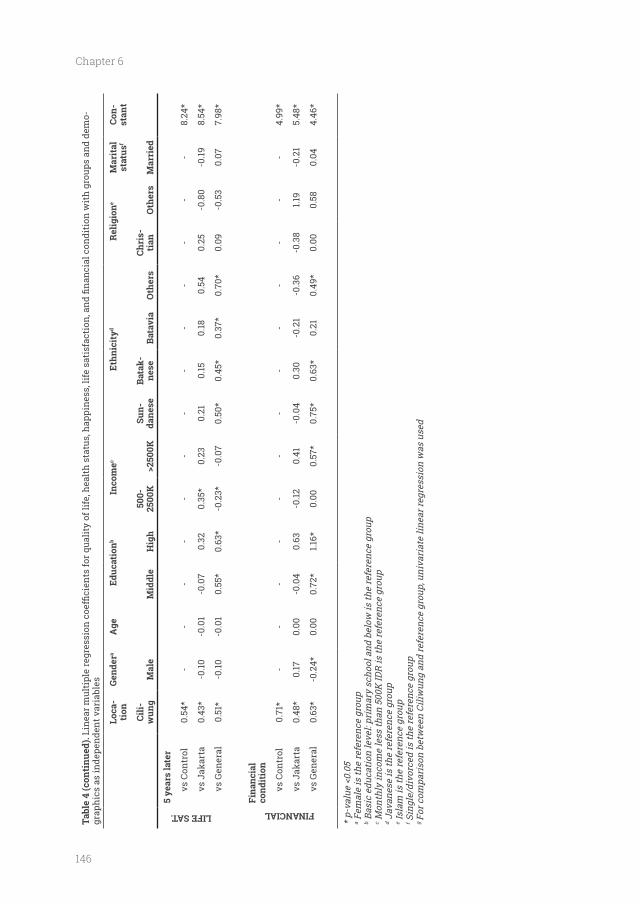
146
Chapter 6
Tabl
e 4
(con
tinu
ed).
-gr
aphi
cs a
s in
depe
nden
t var
iabl
es
Loca
-ti
onGe
nder
aEd
ucat
ionb
Inco
mec
Ethn
icit
yde
Mar
ital
st
atus
fCo
n-st
ant
Cili-
Mal
eM
iddl
e50
0-25
00K
>250
0KSu
n-da
nese
Bata
k-ne
seBa
tavi
aO
ther
sCh
ris-
tian
Oth
ers
Mar
ried
LIFE SAT.
5 ye
ars
late
r
vs C
ontr
ol0.
54*
--
--
--
--
--
--
-8.
24*
vs J
akar
ta0.
43*
-0.10
-0.0
1-0
.07
0.32
0.35
*0.
230.
210.
150.
180.
540.
25-0
.80
-0.19
8.54
*
vs G
ener
al
0.51
*-0
.10-0
.01
0.55
*0.
63*
-0.2
3*-0
.07
0.50
*0.
45*
0.37
*0.
70*
0.09
-0.5
30.
077.
98*
FINANCIAL
Fina
ncia
l co
ndit
ion
vs C
ontr
ol0.
71*
--
--
--
--
--
--
-4.
99*
vs J
akar
ta0.
48*
0.17
0.00
-0.0
40.
63-0
.120.
41-0
.04
0.30
-0.2
1-0
.36
-0.3
81.1
9-0
.21
5.48
*
vs G
ener
al
0.63
*-0
.24*
0.00
0.72
*1.1
6*0.
000.
57*
0.75
*0.
63*
0.21
0.49
*0.
000.
580.
044.
46*
a Fem
ale
is th
e re
fere
nce
grou
pb B
asic
edu
catio
n le
vel:
prim
ary
scho
ol a
nd b
elow
is th
e re
fere
nce
grou
pc M
onth
ly in
com
e le
ss th
an 5
00K
IDR
is th
e re
fere
nce
grou
pd J
avan
ese
is th
e re
fere
nce
grou
pe I
slam
is th
e re
fere
nce
grou
pf S
ingl
e/di
vorc
ed is
the
refe
renc
e gr
oup
g Fo
r com
pari
son
betw
een
Ciliw
ung
and
refe
renc
e gr
oup,
uni
vari
ate
linea
r reg
ress
ion
was
use
d
147
Discussion
banks of the Ciliwung river in Jakarta, Indonesia. A demographically-matched control group
life on the physical domain but experienced higher health status (EQ-VAS) than the matched
with their lives than the controls. Their differences with the Jakarta and general population
samples were comparable. In addition, they perceived themselves as richer than people living
in Jakarta and the general population, although their actual incomes were lower.
The lower level of physical health in the Ciliwung group was understandable given the
unhealthy environment. However, the better health status and life satisfaction compared to the
other three groups, illustrated by a higher EQ-VAS score, fewer anxiety/depression problems
and higher life satisfaction scores, was surprising considering the living environment,
populations, e.g. in Indonesia [42], Singapore [43], Sri Lanka [44], and South Australia [45],
where groups with lower education levels and incomes usually reported lower health status. It
should be noted that there is no information from these studies on whether or not their general
population respondents were living in polluted river areas. Moreover, the Ciliwung group
life satisfaction score was higher than the average Indonesian score in the World Happiness
Report 2017 published by the United Nations [46]. Notwithstanding this, the people of the
Ciliwung group reported themselves as being less happy compared to the three comparison
groups, which was more in line with what we expected.
Jakarta acknowledged that they faced many problems: e.g. poverty, lack of facilities, space
health, emotional, security, and economic circumstances [13, 47, 48]. However, the present study
found positive outcomes in terms of better self-reported health status and life satisfaction
and are also mentioned in the literature, often based on qualitative research: adaptation,
relative comparisons, and social capital. First, the people living on the banks of the Ciliwung
a normal part of everyday life to which they had become accustomed. These people knew
6
148
Chapter 6
As a close community, they developed physical (e.g. raising house levels) and non-physical
the Ciliwung respondents might have been comparing their life situations with those of their
nearest neighbors, with similar low levels of income and life conditions, which might have
prevented them from becoming envious, whilst the comparison group respondents might
have had a broader range of incomes in their neighborhoods. Third, these people had lived
there for generations amongst those they had known for life, often with similar ethnicity and
religion. They knew their neighbors, which meant: they could depend upon them in times of
distress, they had quick access to formal and informal job opportunities, and support in times
of lifecycle events such as marriage, sickness, and death [12, 49]. Moreover, they developed
This ‘social capital’ might have raised their levels of life satisfaction. Some members of the
community who succeeded in improving their economic situation and relocated to a middle-
class neighborhood returned after a short time because they: (i) missed the strong social
former community was cheaper than in their new neighborhood, and (iii) acknowledged the
advantage of the strategic location of their previous neighborhood [49].
Several limitations of this study should be considered. First, the data was collected at
a time of escalation of tension between the people of Kampung Pulo and the government
of Jakarta, i.e. in the area across the river from Bukit Duri, concerning the possibility of
relocate people from Bukit Duri who lived on the riverbank after the relocation of Kampung
the possibility of relocation in the near future may have had an impact on the respondents’
subjective well-being. In the event, a month after completion of the data collection, the
demolished in order to improve the river’s condition.
Second, respondent recruitment might raise questions about the objectivity/
of interdependent data collection. However, we matched the proportions of the Bukit Duri
149
population with respect to gender, age, and level of education with a control group. As can be
seen in Table 1, we succeeded in constructing a representative sample.
Implications
Our results have some implications for future studies. During the writing of this manuscript,
the relocation of the respondents living on the banks of the Ciliwung river in Bukit Duri to
of lower levels of physical health and happiness of the Ciliwung respondents, relocation to
a better living environment might be expected to have improved these aspects of their life.
from a distance might be considered as providing better living conditions, would indeed affect
health status and life satisfaction in a positive way. Furthermore, it would be interesting to
instead of houses, would impact upon the dynamic inter-relationships within the community,
their social capital, and community resilience. Future studies combining quantitative and
qualitative methods could obtain a comprehensive picture of the effects of relocation on the
people involved. A quantitative study could be undertaken by repeating the measurement of
HRQOL in the current research population with respect to happiness, life satisfaction, and
perceived economic circumstances in their new living environment and to compare these
data with the previous data before their relocation. A qualitative study could be accomplished
experiences of being relocated. Results from the present and future studies could be used by
government, local and national, when developing policies related to people living in unhealthy
areas, such as on the riverbank of a polluted river.
Conclusion
particularly physical, and fewer feelings of happiness, than a comparable group that did not
live there. The differences were small overall. Moreover, the people living on the riverbank
perceived themselves to be better in terms of health status in general, life satisfaction, and
6
150
Chapter 6
might be expected to improve their physical health and quality of life, but not necessarily
Abbreviations
QoL: Quality of life
Declarations
Ethics approval and consent to participate
The study was approved by the Health Research Ethics Committee, YARSI University, Jakarta
number 008/KEP-UY/BIA/V/2014.
Respondents who participated signed informed consent forms.
Consent for publication
Not applicable
Availability of data and material
corresponding author on reasonable request.
Competing interests
The authors declare that they have no competing interests.
Funding
Directorate General of Higher Education of Indonesia (http://www.dikti.go.id; number: 58.18/
E4.4/2014). There was no additional external funding received for this study. The funders
had no role in study design, data collection and analysis, decision to publish, or preparation
of the manuscript.
Authors' contributions
and AI carried out the data collection. FP and TS conducted the analyses. JP, JH, and JB were
151
Acknowledgements
omissions are the responsibility of the authors alone.
6
152
Chapter 6
References1.
speciation of dissolved copper, cadmium and
Bull. 2002;45(1):210-217.
2. Berg M, Stengel C, Pham TK, Pham HV, Sampson ML, Leng M, Samreth S, Fredericks D. Magnitude of arsenic pollution in the Mekong and Red River Deltas--Cambodia and Vietnam. Sci Total Environ. 2007;372(2-3):413-425.
3. Wongsanit J, Teartisup P, Kerdsueb P, Tharnpoophasiam P, Worakhunpiset S. Contamination of nitrate in groundwater and its potential human health: a case study of lower Mae Klong river basin, Thailand. Environmental Science and Pollution Research. 2015;22(15):11504-11512.
4. Chea R, Grenouillet G, Lek S. Evidence of Water Quality Degradation in Lower Mekong
One. 2016;11(1):e0145527.
5. Nakayama T, Tuyet Hoa TT, Harada K, Warisaya M, Asayama M, Hinenoya A, Lee JW, Phu TM, Ueda S, Sumimura Y et al. Water metagenomic analysis reveals low bacterial diversity and the presence of antimicrobial residues and resistance genes in a river containing wastewater from backyard aquacultures in the Mekong Delta, Vietnam. Environ Pollut. 2017;222:294-306.
6. Kido M, Yustiawati, Syawal MS, Sulastri, Hosokawa T, Tanaka S, Saito T, Iwakuma T, Kurasaki M. Comparison of general water quality of rivers in Indonesia and Japan. Environ Monit Assess. 2008;156(1):317.
7. Palupi K, Sumengen S, Inswiasri S, Agustina L, Nunik SA, Sunarya W, Quraisyn A. River water quality study in the vicinity of Jakarta. Water Sci Technol. 1995;31(9):17-25.
8. Rumanta M. Analysis of lead (Pb) pollution in the river estuaries of jakarta bay. WIT Transactions on Ecology and the Environment Conference: 9th International Conference on Urban Regeneration and Sustainability, SC. 2014;191(pp 1555-1564):1555-1564.
9. Gracey M, Ostergaard P, Adnan SW, Iveson JB. Faecal pollution of surface waters in Jakarta. Trans R Soc Trop Med Hyg. 1979;73(3):306-308.
10. Yasuda M, Yustiawati, Syawal MS, Sikder MT, Hosokawa T, Saito T, Tanaka S, Kurasaki M. Metal concentrations of river water and sediments in West Java, Indonesia. Bull Environ Contam Toxicol. 2011;87(6):669-673.
11. H, Yunika A, Ohgaki S. Monitoring of human enteric viruses and coliform bacteria in
Water Sci Technol. 2006;54(3):203-210.
12. with vulnerability. Disaster Prevention and Management. 2015;24(4):468-483.
13. Van Voorst R. Applying the risk society thesis
in Jakarta, Indonesia. Health, Risk & Society. 2015;17(3):246-262.
14. Soetomenggolo HA, Firmansyah A, Kurniawan A, Trihono PP. Cryptosporidiosis in children less than three years old in Ciliwung Riverside, Kampung Melayu Village, Jakarta, Indonesia. 2008. 2008;48(2):5.
15. control of Ciliwung river, Jakarta, Indonesia. WIT Transactions on Ecology and the Environment Conference: 7th International Conference on Sustainable Water Resources Management, WRM. 2013;171(pp 275-285):275-285.
16. Puskesmas Kecamatan Tebet. Laporan tahunan. In.; 2015.
17. Purba FD, Hunfeld JAM, Iskandarsyah A, Fitriana TS, Sadarjoen SS, Ramos-Goni JM, Passchier J, Busschbach JJV. The Indonesian EQ-5D-5L Value Set. Pharmacoeconomics. 2017;35(11):1153-1165.
18. Rabin R, Gudex C, Selai C, Herdman M. From translation to version management: a history and review of methods for the cultural
questionnaire. Value Health. 2014;17(1):70-76.
19. Tran BX, Ohinmaa A, Nguyen LT. Quality of
the EQ-5D-5L in HIV/AIDS patients. Health Qual Life Outcomes. 2012;10:132.
20. Hunger M, Sabariego C, Stollenwerk B,
responsiveness of the EQ-5D in German stroke patients undergoing rehabilitation. Qual Life Res. 2012;21(7):1205-1216.
21. Kim TH, Jo MW, Lee SI, Kim SH, Chung SM. Psychometric properties of the EQ-5D-5L in the general population of South Korea. Qual Life Res. 2013;22(8):2245-2253.
22. Janssen MF, Pickard AS, Golicki D, Gudex C, Niewada M, Scalone L, Swinburn P, Busschbach J. Measurement properties of the EQ-5D-5L compared to the EQ-5D-3L across eight patient groups: a multi-country study. Qual Life Res. 2013;22(7):1717-1727.
153
23. Asselt ADI, Postma MJ. Health-Related Quality of Life of Patients with HPV-Related Cancers in Indonesia. Value in Health Regional Issues. 2018;15:63-69.
24. Purba FD, Hunfeld JA, Iskandarsyah A, Fitriana TS, Sadarjoen SS, Passchier J, Busschbach JJ. Quality of life of the Indonesian general population: Test-retest reliability and population norms of the EQ-5D-5L and WHOQOL-BREF. PLoS One. 2018;13(5):e0197098.
25. Herdman M, Gudex C, Lloyd A, Janssen M, Kind P, Parkin D, Bonsel G, Badia X. Development and preliminary testing of the
Qual Life Res. 2011;20(10):1727-1736.
26. The WHOQOL Group. Development of the
quality of life assessment. . Psychol Med. 1998;28(3):551-558.
27. The WHOQOL Group. WHOQOL-BREF Introduction, Administration, Scoring And Generic Version of The Assessment. In.
28. Skevington SM, Lotfy M, O'Connell KA. The
quality of life assessment: psychometric properties and results of the international
Qual Life Res. 2004;13(2):299-310.
29. Hanestad BR, Rustoen T, Knudsen O, Jr., Lerdal A, Wahl AK. Psychometric properties of the WHOQOL-BREF questionnaire for the Norwegian general population. J Nurs Meas. 2004;12(2):147-159.
30. Chachamovich E, Trentini C, Fleck MP. Assessment of the psychometric performance of the WHOQOL-BREF instrument in a sample
2007;19(4):635-646.
31. Mallik S, Baghaei AM, Rabiei K. Psychometric properties of the WHOQOL-BREF in an Iranian adult sample. Community Ment Health J. 2010;46(2):139-147.
32. Ohaeri JU, Awadalla AW. The reliability and validity of the short version of the WHO Quality of Life Instrument in an Arab general population. Ann Saudi Med. 2009;29(2):98-104.
33. Salim OC, Sudharma NI, Rina K, Kusumaratna RK, Hidayat A. Validity and reliability of World
assess the quality of life in the elderly (in Bahasa Indonesia). Univ Med. 2007;26:27-38.
34. Fordyce MW. Development of a program to increase personal happiness. J Couns Psychol. 1977;24(6):511-521.
35. Fordyce MW. A Review of Research on the Happiness Measures: A Sixty Second Index of Happiness and Mental Health. Social Indicators Research. 1988;20(4):355-381.
36. Baptista A, Camilo C, Santos I, de Almeida
What are people saying when they report
Psicologia. 2016;32(3):803-809.
37. Cantril H. The pattern of human concerns: Rutgers University Press; 1966.
38. Bjørnskov C. How Comparable are the Gallup World Poll Life Satisfaction Data? Journal of Happiness Studies. 2010;11(1):41-60.
39. Guillemin F, Bombardier C, Beaton D. Cross-cultural adaptation of health-related quality of life measures: literature review and proposed guidelines. J Clin Epidemiol. 1993;46(12):1417-1432.
40. van Reenen M, Janssen MF. EQ-5D-5L user guide: Basic information on how to use the EQ-5D-5L instrument version 2.1. In.; 2015.
41. Cohen J. Statistical Power Analysis for the Behavioral Sciences, 2 edn: Routledge; 1988.
42. Tampubolon G, Hanandita W. Poverty and mental health in Indonesia. Soc Sci Med. 2014;106:20-27.
43. Abdin E, Subramaniam M, Vaingankar JA, Luo N, Chong SA. Measuring health-related quality of life among adults in Singapore: population norms for the EQ-5D. Qual Life Res. 2013;22(10):2983-2991.
44. Kularatna S, Whitty JA, Johnson NW, Jayasinghe R, Scuffham PA. EQ-5D-3L derived population norms for health related quality of life in Sri Lanka. PLoS One. 2014;9(11):e108434.
45. McCaffrey N, Kaambwa B, Currow DC, Ratcliffe J. Health-related quality of life measured using the EQ-5D-5L: South Australian population norms. Health Qual Life Outcomes. 2016;14(1):133.
46. Helliwell J, Layard R, Sachs J. World Happiness Report 2017. New York: Sustainable Development Solutions Network; 2017.
47. Rahmayati Y, Parnell M, Himmayani V. Understanding community-led resilience:
Journal of Emergency Management, The. 2017;32(4):58.
48. Marfai MA, Sekaranom AB, Ward P. Community responses and adaptation
1144.
6

154
Chapter 6
49. Wilhelm M. Approaching Disaster Vulnerability in a Megacity: Community Resilience to Flooding in two Kampungs in Jakarta. University of Passau; 2012.
50. Maring P, Hasugian F, Kaligis RAW. Social Strategy of Ciliwung River Bank Community. Komunitas: International Journal of Indonesian Society and Culture. 2015;7(1).
155
6

General discussion
158
Chapter 7
Quality of life improvement is one of the main objectives of the Indonesian government.
Various programs have been implemented by different ministries, including the Ministry of
Health (MoH). One major MoH program is the implementation of a national health insurance
scheme for all the Indonesian population. The national health budget allocation would
evidence-based policy is helpful not only for health budget allocation, but also for various
other intervention programs such as clean water supply. To measure the effects of these
efforts in improving the quality of life of the Indonesian population, objective estimates of
health-related quality of life (HRQOL) are needed. However, neither norm scores nor a value
set obtained from the Indonesian people are available for internationally accepted HRQOL
measures, such as WHOQOL-BREF and EQ-5D-5L.
This thesis sets out to provide valid and reliable EQ-5D-5L and WHOQOL-BREF instruments
to be used in Indonesia, including population norms and a national value set for EQ-5D-5L. Data
the best quality of data. The test-retest reliability of both questionnaires, and two methods
of eliciting a population’s health preferences: Composite Time-Trade Off (C-TTO) and Discrete
Choice Experiments (DCE) were investigated. The use of the questionnaires, their norm scores,
and the value set are illustrated in an investigation of the quality of life of people living on
the bank of a highly polluted river in Jakarta.
This chapter provides a summary of the main findings, followed by limitations,
implications and recommendations for those using HRQOL measures, and directions for
future research.
Research Objectives
1. To obtain the values of different EQ-5D-5L health states according to the Indonesian
2. To establish the test-retest reliability of the methods used to obtain the value set: C-TTO
3. To establish the test-retest reliability of two frequently-used HRQOL measures: EQ-5D-5L
and WHOQOL-BREF.
4. To obtain population norm scores for EQ-5D-5L and WHOQOL-BREF.
5.
159
General discussion
This thesis reports on the successful
collection of the health preferences of the Indonesian general population using EQ-5D-5L and a
by a quality control (QC) tool (1-3). Key to this successful outcome was the education, coaching,
and retraining of the interviewers after feedback from the QC process. They should be
Chapter 2). For the
interviewers themselves, recruiting suitable respondents was considered to be a major
networks, and to use different scripts to explain the goals of the study to obtain respondents’
approval to participate. After establishing the values for different EQ-5D-5L health states in a
representative sample of the Indonesian population, the C-TTO and DCE data were combined
using a Hybrid Model approach to produce the Indonesian EQ-5D-5L value set (Chapter 4).
Objective 2. To establish the test-retest reliability of the methods used to obtain the
. The paper on which chapter 3
report of the test-retest reliability of the C-TTO and DCE of the EQ-VT template, the standard
protocol for health preference valuation using EQ-5D-5L which has resulted in, to date, seven
national value sets (4-10). A strong point of the investigation was that the retest interview
favorable test-retest result than C-TTO, given that DCE is usually considered an easier task to
complete. Indeed, if the latter is the case, it is unclear why this was not expressed by better
test-retest reliability. It might well be that DCE is not as simple as it looks.
Objective 3. To establish the test-retest reliability of two frequently-used HRQOL measures:
EQ-5D-5L and WHOQOL-BREF. EQ-5D-5L and WHOQOL-BREF were completed twice by a
sample representative of the general population. The descriptive part of EQ-5D-5L and the
four domains of the WHOQOL-BREF had high test-retest reliability scores (Chapter 5). These
results supported the use of the two HRQOL questionnaires in the Indonesian population.
Objective 4. To obtain population norm scores for EQ-5D-5L and WHOQOL-BREF. EQ-5D-5L
and WHOQOL-BREF can be used by different parties, e.g. clinicians, researchers, public health
experts, and health care workers, for different purposes. In all cases, they most likely need to
(Chapter 5). More than 1000 respondents, representative of the national population, completed
the two questionnaires and norm scores were derived for the total sample, including the
subgroups, with respect to residence, gender, level of education, age, religion, and ethnicity.
Since this exercise, the WHOQOL-BREF instrument used in this study has been acknowledged
7
160
Chapter 7
population.
riverbank. The HRQOL of people living on the banks of one of the main rivers in Jakarta,
Indonesia (the Ciliwung) was measured using EQ-5D-5L and WHOQOL-BREF. In addition,
and 3) the Indonesian general population (Chapter 6). The results showed that the Ciliwung
respondents reported lower physical quality of life and less personal happiness than the
controls, but, interestingly, rated their health and life satisfaction better than the controls.
controls even though their incomes were lower. A possible explanation for these contradictory
and had become accustomed to their deprived surroundings.
Limitations
The investigation in this thesis has several limitations which require consideration when
interpreting the results, of which the most important are mentioned below.
The majority of the respondents interviewed to obtain the population norms and value
set were living on Java island. This might raise questions about the representativeness of
collection on Java island was because it is the most populous island (57% of the population)
and the main migration target from all over Indonesia. The diversity of its population in
way, leading to a similar distribution of the main demographic characteristics between our
sample and that of the Indonesian population. However, it is still unknown whether the
results obtained in Java from these migrants would have differed from the values should the
interviews have been conducted on their original islands. The future research section below
presents a study design which can help overcome this limitation.
C-TTO and DCE tasks, resulting in a more highly educated retest population. As the retest
population was of a higher educational level, it could be expected that the results would have
a bias towards favourable test-retest variations compared with “real-life” valuations which
include everyone regardless of their ability to comprehend the tasks.
Another limitation is that the interval time of the second test in the test-retest procedure
overlapped with the WHOQOL-BREF’s reference period of 4 weeks (“We ask that you think
161
General discussion
about your life in the last four weeks.”) This might have biased the test-retest result. However,
this could be considered as an advantage because it implies that the respondent was, in part,
looking back to the same health condition. Thus, concerning the overlap, variation between
test-retest results cannot be explained by a change in the respondent’s health.
With respect to the respondents who lived on the impoverished riverbank in Jakarta,
the data was collected at a time of escalation of tension between the people there and the
by the Jakarta government. The plan was to relocate the people from Bukit Duri who lived on
the riverbank after the relocation of the people who lived across the river, namely Kampung
Pulo, was completed. How the possibility of relocation in the near future may have had an
impact on the respondents’ responses to the HRQOL exercise is still unknown.
The contrasting results from the Ciliwung people, who reported lower physical quality of
life and less personal happiness compared to the matched controls, but rated their health, life
satisfaction, and economic condition better, should be explored thoroughly in a qualitative
interview after data collection. Such a qualitative approach could provide clearer answers
concerning the underlying reason for these contrasting results.
Implications for users of EQ-5D-5L and WHOQOL-BREF in Indonesia
This thesis has a number of implications for researchers, clinicians, and policymakers
who wish to use EQ-5D-5L and WHOQOL-BREF in Indonesia. For three groups of users, it is
important to obtain the latest version of the questionnaire.
To obtain the correct version of the questionnaire
The most up-to-date version of the Indonesian EQ-5D-5L will be provided by the EuroQol
study, a registration form has to be completed on the EuroQol Group website: http://www.
euroqol.org/. User guidelines can also be downloaded from the same website: these provide a
presenting the results. The EuroQol Group is not a commercial entity, and for non-commercial
users, registration and use of the questionnaire are free of charge.
(WHO) Quality of Life Group is the copyright holder of the WHOQOL-BREF questionnaire,
together with other WHOQOL instruments such as WHOQOL-HIV and WHOQOL-OLD. To
obtain permission to use the WHOQOL-BREF questionnaire, a user-agreement form needs to
be completed and submitted to the email address provided on the website: http://www.who.
int. After permission is given, the latest version of the questionnaire is received.
7
162
Chapter 7
The two questionnaires are self-completed, meaning that most respondents should be able to
was recommended that interviewers help them by reading an item aloud and asking them to
indicate the answer in the questionnaire (Chapter 6).
Scoring the questionnaires
EQ-5D has a non-standard scoring system, which is often not well understood. The responses
provided by respondents for each dimension of EQ-5D-5L describe ‘health states’. A 1-digit
problems with mobility, slight problems with washing or dressing, moderate problems with
doing usual activities, severe pain or discomfort and extreme anxiety or depression’. The
EQ-5D-5L instrument has 3125 (55) unique health states. Each of these health states should
be converted into a single index value that can be obtained from the Indonesian value set
(Chapter 4). For the EQ-VAS, the number provided by the respondents can be used in any
required calculation. Note that the single index value is a value from the ‘general public’ and
thus represents a value from the ‘societal perspective’ for the health state of the patient. The
EQ-VAS provides value from the patient themselves: the patient perspective.
WHOQOL-BREF uses the classical scoring system. Each domain of the WHOQOL-BREF:
physical, psychological, social, and environmental, consists of several items. Each domain
score obtained from averaging the respondents’ responses to the items belongs to the same
domain. For example, the social domain score is obtained from the average of responses to
quality of life and general health, respectively (11).
Using the population norms
Chapter 5 provides the population norm scores for the two questionnaires. For EQ-5D-5L:
EQ-VAS and index value, and for WHOQOL-BREF: the four domains, the overall quality of life
of residence, gender, level of education, and age. Hence, this enables researchers to compare
the HRQOL data they have measured with the same demographic characteristics as in the
general population.
163
General discussion
Clinicians
Using the HRQOL measures in clinical practices
In addition to researchers, clinicians might also wish to use EQ-5D-5L and the WHOQOL-BREF.
Collecting the HRQOL data at multiple time points enables an individual patient’s progress
to be followed over time, to inform upon whether the care plan goals of the patient are being
achieved, and at the aggregate level could inform clinicians or health service providers
concerning their clinical interventions from the patients’ point of view.
EQ-5D-5L. In those cases, EQ-VAS becomes useful as an alternative. For instance, it can pick up
problems related to low energy. Chapter 5
WHOQOL-BREF is also an alternative, and will probably prove more sensitive in the higher
regions of quality of life. Indeed, since WHOQOL-BREF measures four broad domains of HRQOL
- physical, psychological, social and environmental - using 26 questions, the information
obtained is more comprehensive than from EQ-5D. This information, together with other
to the best care choices for patients. The downside of such an approach is that WHOQOL-BREF
is a much longer questionnaire than EQ-5D-5L. The choice between EQ-5D and WHOQOL-BREF
in routine use in clinical practice is thus a trade-off between logistics and sensitivity.
When comparing the measurement of the same patient over time, the ‘Paretian
EQ-5D-5L health state (e.g. post treatment or care) is considered to be ‘better’ than another
health state (e.g. baseline) if it is better on at least one dimension and is no worse on any other
dimension. An EQ-5D-5L health state is considered to be ‘worse’ than another health state if
it is worse on at least one dimension and is no better on any other dimension. This approach
delivers the following possible results: better, worse, stable (unchanged), mixed.
The use in clinical practice of quality of life questionnaires, such as WHOQOL-BREF, EQ-5D-
5L, or indeed any other HRQOL instrument can improve the communication between patient
and clinicians. This can be achieved by asking patients to complete such questionnaires
before their consultations, preferably using an electronic device or online form that can
instantly produce domain scores and indicate their relative position with respect to the
general population scores displaying the same sociodemographic characteristics such as
gender and age. The clinician can then use the results during the meeting with the patient
to discuss issues that are less observable (e.g. social relationships) or are of a more diffuse
7
164
Chapter 7
and long-term nature (e.g. energy and fatigue) than might usually be addressed in a regular
consultation (13-17).
Policymakers
One way to achieve this is by health technology assessment (HTA) or economic evaluation
(18). One type of study in economic evaluation is cost-utility analysis (CUA), which can be
used to evaluate HRQOL outcomes and to compare costs and outcomes between different
healthcare programs in terms of cost per quality-adjusted life years (QALYs). A QALY is a
It is calculated by estimating the years of life remaining for a patient following a particular
treatment or intervention and weighting each year with a quality-of-life score (on a 0 to 1 scale).
This quality of life score is obtained by using multi-attribute utility instruments (MAUs).
The EQ-5D instrument is one of the most-used MAUs in the world, and several national HTA
EQ-5D as the preferred method for deriving utilities for CUA (19-21). Since this thesis now
makes the national Indonesian value set of EQ-5D-5L available (Chapter 4), HTA studies in
not match the characteristics and values of the Indonesian population.
Future research directions
Psychometric properties of EQ-5D-5L and WHOQOL-BREF in different patient groups
This thesis investigates the test-retest reliability of EQ-5D-5L and WHOQOL-BREF in a
general healthy population. The results have shown that the two questionnaires have good
reproducibility. Furthermore, the two seem to be able to differentiate between different socio-
demographic subsamples, for instance between male and female, lower and higher education,
and lower and higher income. This indicates their validity for use in Indonesia. However,
published studies concerning the psychometric properties of the two questionnaires, e.g.,
validity, reliability, discriminatory power, and responsiveness, in patient groups in Indonesia,
are rare. One example is a study that validated EQ-5D-5L in Indonesian human papillomavirus
(HPV)-related cancer patients which found that EQ-5D-5L has good construct validity and
test-retest reliability (22). Another study validated WHOQOL-BREF in Indonesian elderly
samples and found that it showed excellent discriminant validity, construct validity and
good internal consistency (23). A recent study by Setyowibowo et al., (24) found differences
in HRQOL, measured by EQ-5D-5L and WHOQOL-BREF, between patients with breast cancer-
165
General discussion
symptomology and controls, in the predicted direction. Further investigation concerning the
psychometric properties of the two questionnaires in different patient populations, followed
by the HRQOL of the respective patient groups, is needed in the near future.
Health preference comparison between areas of Indonesia: an east - west study
As stated in the limitations section, one main limitation of the thesis is that the majority of the
respondents interviewed was living on Java Island. One way to investigate whether location
is indeed an issue in valuing health in Indonesia would be to sample values for health states
at different places/islands in the archipelago. It is planned to conduct an extended valuation
study where a group of well-trained interviewers will be sent to different areas of Indonesia to
collect data. Data collection will be carried out in the western part of Indonesia, e.g. Aceh or
North Sumatera province, the central part, e.g. Borneo and Sulawesi island, and in the eastern
part, e.g. West Papua or Papua province. Similar quota sampling will be implemented in respect
of residence, gender, age, and level of education. Comparison of data from the different areas
and the current value set would indicate any differences in health states valuation. In addition,
any differences in HRQOL between these areas would also become apparent.
Follow-up HRQOL measurement of the Ciliwung respondents
Some of the respondents living on the banks of the Ciliwung river in Jakarta have been
of their HRQOL, happiness, life satisfaction, and perceived economic circumstances, which
then compared these scores with their previous data before relocation, would indicate any
differences that most likely could be attributed to the relocation to better housing and an
improved environment.
HRQOL measures for the Indonesian youth population
An EQ-5D version for the youth population aged 7-16, EQ-5D-Y, has been validated in several
countries (25-28). However, an Indonesian version of EQ-5D-Y does not yet exist. By having
groups in Indonesia could be estimated and compared in order to set priorities for health
care. Furthermore, a validated EQ-5D-Y is needed for the many upcoming (cost-) effectiveness
studies. Another internationally-accepted HRQOL questionnaire for youth population is the
PedsQL, a generic multidimensional questionnaire that measures HRQOL on four domains:
physical, emotional, social, and school (29). The validity, reliability, and responsiveness of
EQ-5D-Y and PedsQL in Indonesian pediatric patient populations: e.g. cancer, asthma, and
malnutrition, and in the healthy population, will be assessed.
7
166
Chapter 7
For children or adolescents who are mentally or physically incapable of reporting their
HRQOL, proxy versions of EQ-5D-Y and PedsQL are available. Validation of this proxy version
will be undertaken by asking the caregiver (the proxy): parent(s) and/or physician, to rate the
child’s/ adolescent’s health-related quality of life in their (the proxy’s) opinion.
Conclusion
This thesis aimed to provide information on the psychometric properties, population norms,
and value sets of two internationally-accepted HRQOL measures, EQ-5D-5L and WHOQOL-BREF,
based on the Indonesian general population, and to apply the two measures in a population
who lived on a highly polluted riverbank. The availability of the EQ-5D-5L and WHOQOL-BREF
population norms and value sets enabled these two questionnaires to be used by Indonesian
researchers in their investigations, by clinicians in their daily practice, and by policymakers
in the decision-making process, to obtain HRQOL values for the population sample they
measured and, where required, to compare their scores with the scores of the samples from
the general population with similar demographic characteristics.
167
General discussion
References
1. Oppe M, Devlin NJ, van Hout B, et al. A program of methodological research to arrive at the new international EQ-5D-5L valuation protocol. Value Health. 2014; 17: 445-53.
2. Oppe M, Rand-Hendriksen K, Shah K, et al. EuroQol Protocols for Time Trade-Off Valuation of Health Outcomes. Pharmacoeconomics. 2016; 34: 993-1004.
3. Ramos-Goñi JM, Oppe M, Slaap B, et al. Quality Control Process for EQ-5D-5L Valuation Studies. Value Health. 2016.
4. An EQ-5D-5L value set based on Uruguayan population preferences. Qual Life Res. 2016; 25: 323-33.
5. Xie F, Pullenayegum EM, Gaebel K, et al. The canadian EQ-5D valuation study: Estimating time trade-off values for the EQ-5D-5l. Value Health. 2014; 17: A163.
6. Versteegh MM, Vermeulen KM, Evers SMAA, et al. Dutch Tariff for the Five-Level Version of EQ-5D. Value Health. 2016; 19: 343-52.
7. Luo N, Liu G, Li M, et al. Estimating an EQ-5D-5L Value Set for China. Value Health. 2017; 20: 662-69.
8. Ramos-Goñi JM, Craig BM, Oppe M, et al. Handling Data Quality Issues to Estimate the Spanish EQ-5D-5L Value Set Using a Hybrid Interval Regression Approach. Value Health.
9. Shiroiwa T, Ikeda S, Noto S, et al. Comparison of Value Set Based on DCE and/or TTO Data: Scoring for EQ-5D-5L Health States in Japan. Value Health. 2016; 19: 648-54.
10. Kim SH, Ahn J, Ock M, et al. The EQ-5D-5L valuation study in Korea. Qual Life Res. 2016; 25: 1845-52.
11. The WHOQOL Group. WHOQOL-BREF Introduction, Administration, Scoring And Generic Version of The Assessment. Geneva:
12. Devlin NJ, Parkin D, Browne J. Patient-reported outcome measures in the NHS: new methods for analysing and reporting EQ-5D data. Health Econ. 2010; 19: 886-905.
13. Llewellyn AM, Skevington SM. Evaluating a new methodology for providing
quality of life and its importance, using the WHOQOL-BREF in a community population. Qual Life Res. 2016; 25: 605-14.
14. Detmar SB, Muller MJ, Schornagel JH, et al. Health-related quality-of-life assessments and patient-physician communication: a
3027-34.
15. of patient-reported outcome measures on routine practice: a structured review. J Eval Clin Pract. 2006; 12: 559-68.
16. Hilarius DL, Kloeg PH, Gundy CM, et al. Use of health-related quality-of-life assessments in daily clinical oncology nursing practice. Cancer. 2008; 113: 628-37.
17. Chen J, Ou L, Hollis SJ. A systematic review of the impact of routine collection of patient reported outcome measures on patients, providers and health organisations in an oncologic setting. BMC Health Serv Res. 2013; 13: 211.
18. and technology assessment in support of universal health coverage. Sixty-seventh World Health Assembly WHA67. 2014; 23.
19. Rawlins MD, Culyer AJ. National Institute for Clinical Excellence and its value judgments. BMJ. 2004; 329: 224-7.
20. National Health Care Institute The Netherlands. Guideline for economic evaluations in healthcare 2016.
21. Sakthong P. Measurement of clinical-effect: utility. J Med Assoc Thai. 2008; 91 Suppl 2: S43-52.
22. Health-Related Quality of Life of Patients with HPV-Related Cancers in Indonesia. Value in Health Regional Issues. 2018; 15: 63-69.
23. Salim OC, Sudharma NI, Rina K, et al. Validity
Quality of Life-BREF to assess the quality of life in the elderly (in Bahasa Indonesia). Univ Med. 2007; 26: 27-38.
24. Setyowibowo H, Purba FD, Hunfeld JAM, et al. Quality of life and health status of Indonesian women with breast cancer symptoms before
Indonesian women in general. PLoS One. 2018; 13: e0200966.
25. Wille N, Badia X, Bonsel G, et al. Development of the EQ-5D-Y: a child-friendly version of the EQ-5D. Qual Life Res. 2010; 19: 875-86.
26. Ravens-Sieberer U, Wille N, Badia X, et al. Feasibility, reliability, and validity of the EQ-5D-Y: results from a multinational study. Qual Life Res. 2010; 19: 887-97.
7
168
Chapter 7
27. Eidt-Koch D, Mittendorf T, Greiner W. Cross-sectional validity of the EQ-5D-Y as a generic health outcome instrument in children and
BMC Pediatr. 2009; 9: 55.
28. Burstrom K, Bartonek A, Brostrom EW, et al. EQ-5D-Y as a health-related quality of life measure in children and adolescents with functional disability in Sweden: testing feasibility and validity. Acta Paediatr. 2014; 103: 426-35.
29. Varni JW, Seid M, Kurtin PS. PedsQL 4.0: reliability and validity of the Pediatric Quality of Life Inventory version 4.0 generic core scales in healthy and patient populations. Med Care. 2001; 39: 800-12.

169
General discussion
7


SummarySamenvatting
About the Author
Acknowledgements
Summary
Chapter 1 introduces the topic of health-related quality of life (HRQOL) measurement and its
application in Indonesia. Although the economy of Indonesia continues to grow, the health
budget cannot keep up with the increasing needs for better health care. Hence, help for rational
priority setting in health policy is warranted, such as that provided by health technology
assessment (HTA) and economic evaluations. HTA and economic evaluations require objective
estimates of HRQOL. To date, several internationally-accepted HRQOL measures, such as
WHOQOL-BREF and EQ-5D-5L, have begun to be used in several investigations in Indonesia.
There is only limited information regarding their psychometric properties when used in
these needs, the aims of this thesis were to investigate the psychometric properties and
provide norm scores and value sets for the WHOQOL-BREF and EQ-5D-5L in Indonesia, using
a large, representative sample of the general population. The two questionnaires and their
norm scores were also used to investigate the quality of life of people living on the bank of
the polluted Ciliwung river in Jakarta.
The objectives of this thesis were:
1. To obtain the values (utilities) of different EQ-5D-5L health states according to the
2. To establish the test-retest reliability of the methods used to obtain the value set: C-TTO
3. To establish the test-retest reliability of two frequently-used HRQOL measures, namely
the EQ-5D-5L and WHOQOL-BREF.
4. To obtain population norm scores for EQ-5D-5L and WHOQOL-BREF.
5.
Chapter 2 describes the problems encountered during the valuation data collection and
improved the interviewers’ performance and the quality of the data collected. The interviewers
respondents in completing the interviews according to the interviewers, and the solutions
implemented by the interviewers to solve those problems. In addition, the data collected from
steps and time used to explain the example, explanation of the worse-than-dead element
of the example, and minimal time to complete the interview. The quality of the data from
172
Appendix
subsequent 168 respondents. From the thematic analysis of the interviewers’ answers using
NVivo, it was shown that they encountered problems in recruiting respondents, conducting
use of different scripts to explain the goals of the project to respondents. Solutions applied to
help respondents during the interview were: developing the technical and personal skills of
the interviewers and stimulating the respondents’ thought processes. To solve the technical
considerable problems in data quality according to several quality indicators. The retraining
program and subsequent feedback based on the QC tool were then implemented. Data from
the subsequent 168 interviews were judged as of good quality.
In Chapter 3, the test–retest reliability of the two techniques used in the EuroQol valuation
protocol (EQ-VT), the Composite Time Trade-Off (C-TTO) and Discrete Choice Experiments
(DCE), was investigated. 226 respondents completed the C-TTO and DCE twice, within a 10
day to 2 months interval, at each time by the same interviewer. The results showed that
for C-TTO, 82 of 86 (95.3%) of health states and 155 of 226 (68.6%) of the respondents had no
identical. The DCE retest showed a different pattern concerning the relative importance of the
dimensions, while the C-TTO remained the same. The Hybrid model, where C-TTO and DCE data
were combined, showed no different pattern of relative importance of the 5 EQ dimensions
between test and retest. It can be concluded that C-TTO as a value elicitation technique is
stable over time, while for DCE the relative values of the 5 dimensions shift. When both data
are combined, the resulting Hybrid model is stable.
For EQ-5D-5L to be suitable for use in economic evaluations or HTA, a societal-based value
set is needed. Chapter 4 provides the procedure to obtain such value set, including different
modelling approaches. 1054 respondents aged 17 years and over were recruited from the
residence, gender, age, level of education, religion, and ethnicity. Two elicitation technique,
C-TTO and DCE, were applied. To estimate the value set, a hybrid regression model combining
C-TTO and DCE data was used. In the value set, the maximum value was 1.000 for the health
state with no problems in all dimensions (health state ‘11111’), followed by the health state ‘11112’
with value 0.921. The minimum value was -0.865 for the worst state (‘55555’). Preference values
were most affected by the mobility dimension and least by the pain/discomfort dimension.
Chapter 5 presents two results that support the use of EQ-5D-5L and WHOQOL-BREF in
Indonesia: the test-retest reliability of the questionnaires and population norms. From the
A
173
same Indonesian general population sample that was interviewed for the EQ-5D-5L value
set, the norm data for both instruments were calculated. For the test-retest evaluations, a
sub-sample of 206 respondents completed both instruments twice. The results showed that
EQ-5D-5L displays almost perfect agreement between test and retest (Gwet’s AC: 0.85-0.99 and
EQ-VAS and index scores were considered poor (ICC: 0.45 and 0.37 respectively). For WHOQOL-
BREF, ICCs of the four domains were between 0.70 and 0.79, which indicated moderate to good
reproducibility. For EQ-5D-5L norm scores, female and older respondents showed lower EQ-
index scores, whilst rural, younger, and higher-educated respondents showed higher EQ-VAS
scores. In most of the WHOQOL-BREF domains, being male, younger, higher-educated, and
having a high-income was associated with the highest scores. These norm scores are useful
of the Indonesian general population.
Chapter 6 presents an investigation of HRQOL in a sample of people living on the banks
of a polluted river in Jakarta, Indonesia, the Ciliwung. 204 respondents 17 years and older
completed EQ-5D-5L, WHOQOL-BREF, the Happiness Scale, and the Life Satisfaction Index.
circumstances was added. Their scores were then compared to three samples: i) a socio-
demographically matched control group, not living on the river bank (n=204); ii) inhabitants of
Jakarta (n=305); and iii) the Indonesian general population (n=1041). The Ciliwung respondents
reported lower physical quality of life on WHOQOL-BREF and less personal happiness than
the matched controls. Interestingly, they rated their health, reported on EQ-5D-5L, and life
satisfaction better than the matched controls. Similar results were obtained in comparison
with the Jakarta inhabitants and the general population. In addition, the Ciliwung respondents
comparison groups, even though their incomes were lower.
Chapter 7
the valuation set for Indonesia. In addition, it reviews the application of the two questionnaires
this thesis, recommendations and implications for researchers, clinicians, and policymakers
are outlined.
Recommendations for future research are: i) to obtain the psychometric properties of
EQ-5D-5L and WHOQOL-BREF in different patient groups, ii) to obtain and compare health
preferences between different areas of Indonesia, iii) to provide valid and reliable HRQOL
measures, their norm scores, and value sets with respect to the Indonesian populations
174
Appendix
of children and adolescents, and iv) to follow up the HRQOL measurement of the Ciliwung
respondents after relocation.
measures in Indonesia. The Indonesian national value set and population norms are now
available for different stakeholders, such as researchers, clinicians, and policymakers.
A
175
Hoofdstuk 1
metingen in Indonesië. Hoewel de economie van Indonesië een langdurige groei kent, kan
wordt door Health Technology Assessment (HTA) en economische evaluaties. Voor HTA en
5D-5L. Helaas is er maar weinig informatie over de psychometrische eigenschappen van die
vragenlijsten bij het gebruik in Indonesië, en ontbreken er Indonesische normwaarden en value
sets
value
set
in Indonesië. De twee vragenlijsten en hun norm scores werden ook gebruikt om de kwaliteit
van leven te meten van de bewoners aan de Ciliwung in Jakarta.
De doelstellingen van dit proefschrift waren:
1. Het verkrijgen van waarden (utiliteiten) voor de verschillende EQ-5D-5L
2. Het vaststellen van de test-hertest betrouwbaarheid van de methoden die gebruikt worden
om de value sets te verkrijgen: C-TTO en DCE, beide vastgesteld met de EQ-VT.
3.
gerelateerde kwaliteit van leven vragenlijsten, namelijk de EQ-5D-5L en WHOQOL-BREF.
4. Het verkrijgen van normscores van de algemene populatie voor de EQ-5D-5L en WHOQOL-
BREF.
5.
een vervuilde rivier.
Hoofdstuk 2 value
sets voor de EQ-5D-5L. Daarnaast beschrijft hoofdstuk 2 hoe de toepassing van een kwaliteits-
controle en de daaropvolgende extra training van de interviewers, de kwaliteit van de ver-
176
Appendix
-
den tijdens het interview, en de oplossingen die de interviewers daar vervolgens voor aan-
droegen. In aanvulling hierop werden de data van de eerste 98 respondenten geanalyseerd op
bij het voorbeeld, de uitleg over het lager-dan-dood-aspect van het voorbeeld, en de tijd die no-
dig was om het interview af te ronden. De kwaliteit van de data van de eerste 98 respondenten
respondenten. Vanuit de thematische analyse van de antwoorden van de interviewers met
behulp van ‘NVivo’, bleek dat de interviewers problemen hadden bij het rekruteren van res-
pondenten, het afnemen van het interview, en het oplossen van IT-problemen. Oplossingen
voor de rekruteringsproblemen waren: het optimaliseren van het tijdstip van het interview,
het gebruik van grotere sociale netwerken, en het gebruik van verschillende scripts bij het uit-
gepast om respondenten te helpen tijdens het interview waren: het ontwikkelen van de tech-
nische en sociale vaardigheden van de interviewers en het stimuleren van het denkproces van
de respondenten. Voor het oplossen van de technische (IT-)problemen werden de interviewers
aan het EuroQol Bureau. De data van de eerste 98 respondenten liet bij verschillen kwaliteits-
werd een extra trainingsprogramma gegeven aan de interviewers, en de feedback gebaseerd
op de kwaliteitscontrole indicatoren werd met hen gedeeld. De data die daarna werd ver-
In Hoofdstuk 3 is
-
de-Off (C-TTO) en de Discrete Choice Experiments (DCE). 226 respondenten vulden de C-TTO
en DCE twee keer in, met een interval variërend van 10 dagen tot 2 maanden en met steeds met
-
in gemiddelde waarderingen tussen test en re-test. Bij DCE was 72.5% van de antwoorden iden-
tiek. The DCE re-test data liet een verschillend patroon wat betreft het relatieve belang van de
5 EQ dimensies, terwijl dat bij C-TTO gelijk bleef. Het hybride model, waarin C-TTO and DCE
conclusie getrokken dat C-TTO als waarderingsmethode stabiel is over de tijd, in vergelijking
met DCE waarbij de relatieve waardes van de dimensies kunnen verschuiven. Wanneer beide
data werden gecombineerd, was het resulterende hybride model stabiel.
Om de EQ-5D-5L toepasbaar te maken in economische evaluaties of HTA, is een maat-
A
177
schappelijke waardenset (value set) nodig. Hoofdstuk 4 value
set te verkrijgen, inclusief verschillende manieren van modelleren. 1054 respondenten in de
leeftijd van 17 jaar en ouder werden gerekruteerd vanuit de algemene Indonesische bevolking,
leeftijd, onderwijsniveau, religie en etniciteit. Er werden waarderingsmethoden toegepast: en
wel C-TTO and DCE. Om de value set te schatten, werd een hybride regressiemodel gebruikt,
-
heidsproblemen werden waargenomen in de dimensie ‘pijn en andere klachten’ (39.7%) en het
value set was de maximale waarde
-0.865 voor de slechtste toestand (‘55555’). De waarden werden het meeste beïnvloed door de di-
mensie “mobiliteit” en het minst door de dimensie “pijn/ongemak”.
Hoofdstuk 5 presenteert twee resultaten, die het gebruik van de EQ-5D-5L en WHO-
QOL-BREF in Indonesië ondersteunen: de test-hertest betrouwbaarheid van de vragenlijsten en
die was geïnterviewd voor de EQ-5D-5L value set, werden de normdata voor beide vragenlijsten
berekend. Voor de test-hertest evaluaties, vulde een subgroep van 206 respondenten beide vra-
-
een 90-99% overeenstemming. Daartegenover werden de reproduceerbaarheid van EQ-VAS en
bedroegen de ICCs van de vier domeinen tussen 0.70 en 0.79, wat wijst op gemiddelde tot goede
reproduceerbaarheid. Bij de EQ-5D-5L lieten vrouwelijke en oudere repsondenten lagere EQ-
-
teland hogere EQ-VAS scores rapporteerden. Voor de meeste domeinen binnen WHOQOL-BREF
Indonesië die nu hun bevindingen kunnen vergelijken met die van de Indonesische algemene
bevolking.
Hoofdstuk 6 -
ven van oeverbewoners van een vervuilde rivier in Jakarta; de Ciliwung. 204 respondenten
van 17 jaar en ouder completeerden de EQ-5D-5L, de WHOQOL-BREF, de Happiness Scale, en
de Life Satisfaction Index. Daarna werd een visuele analogie schaal voorgelegd betreffende de
-
178
Appendix
de oevers van de rivier woonden (n=204); ii) inwoners van Jakarta (n=305); en iii) de algemene
Indonesische bevolking. De oeverbewoners van de Ciliwung rapporteerden een lagere fysieke
kwaliteit van leven op de WHOQOL-BREF en minder persoonlijk geluk dan de gematchte con-
tevredenheid met het leven rapporteerden dan hun gematchte controlegroepen. Soortgelijke
resultaten werden verkregen in vergelijking met de inwoners van Jakarta en de algemene
Hoofdstuk 7 bevat een algemene discussie van de belangrijkste vindingen van de stu-
metrische eigenschappen, de normscores, en de value set voor Indonesië. Verder beschouwt
het de toepassing van twee vragenlijsten bij de oeverbewoners van een vervuilde rivier in
metrische eigenschappen van EQ-5D-5L en WHOQOL-BREF in verschillende patiënten-
groepen, ii) het verkrijgen en vergelijken van value sets van verschillende gebieden van Indo-
-
teit van leven meetmethodes, hun normscores en value sets voor de Inonesische bevolkings-
Samenvattend kan gesteld worden dat de EQ-5D-5L en de WHOQOL-BREF inmiddels ge-
in Indonesië. De Indonesische nationale value set
makers.
A
179
About the Author
Fredrick Dermawan Purba was born on 26th February 1981 in Medan, North Sumatra,
spent a year working on different projects for a variety of psychological service bureaus
in Bandung. In 2005, he commenced his education in the Master of Psychology program,
teaching staff in the Department of Developmental Psychology and conducted psychological
Erasmus MC involving a number of HRQOL projects in Indonesia. During his PhD study, he
Institute of Health Science (NIHES), Erasmus MC, and completed this second Master’s degree
in 2016. Under the supervision of Professor Jan van Busschbach, he became involved in
activities related to the EuroQol Group. In addition to the validation and valuation of EQ-5D-
papers and posters at around ten international conferences, and collaborated internationally
with other researchers to conduct and publish EQ-5D related studies, notably helping the
EQ-5D valuation study in the Philippines as trainer and author. In 2015, together with Jan
Passchier and Jan van Busschbach, he inaugurated a research group named ‘Quality of Life
Measurement and its Application in the Republic of Indonesia (QOLMARI)’ and serves as its
secretary. To widen his professional network, he became a member of the International Society
for Pharmacoeconomics and Outcomes Research (ISPOR) and the International Society for
Quality of Life Research (ISOQOL).
180
Appendix
In this thesis
Purba FD, Hunfeld JAM, Iskandarsyah A, Fitriana TS, Sadarjoen SS, Passchier J, Busschbach JJV. Employing quality control and feedback to the EQ-5D-5L valuation protocol to improve the quality of data collection. Qual Life Res. 2017;26(5):1197-1208
Purba FD, Hunfeld JAM, Timman R, Iskandarsyah A, Fitriana TS, Sadarjoen SS, Passchier J, Busschbach JJV. Test-Retest Reliability of EQ-5D-5L Valuation Techniques: The Composite Time Trade-Off and Discrete Choice Experiments. Value Health. (in press)
Purba FD, Hunfeld JAM, Iskandarsyah A, Fitriana TS, Sadarjoen SS, Ramos-Goni JM, Passchier J, Busschbach JJV. The Indonesian EQ-5D-5L Value Set. Pharmacoeconomics. 2017;35(11):1153-1165
Purba FD, Hunfeld JA, Iskandarsyah A, Fitriana TS, Sadarjoen SS, Passchier J, Busschbach JJ. Quality of life of the Indonesian general population: Test-retest reliability and population norms of the EQ-5D-5L and WHOQOL-BREF. PLoS One. 2018;13(5):e0197098.
Purba FD, Hunfeld JAM, Fitriana TS, Iskandarsyah A, Sadarjoen SS, Busschbach JJV, Passchier
people living on an unhealthy riverbank. BMC Public Health. 2018;18(1):782.
Other publications
Setyowibowo, H., Purba, F. D., Hunfeld, J. A. M., Iskandarsyah, A., Fitriana, T. S., Sadarjoen, S. S., Passchier, J., Sijbrandij, M. Quality of life and health status of Indonesian women with breast
general. PLoS One. 2018; 13: e0200966.
Purba, F. D., Herman, H., John MF Adam, J.M.F., Atthobari, J., Catharina C M Schuiling-Veninga, C.C.M., Krabbe, P.F.M., Postma, M.J. (2018). Comparing the EQ-5D-3L and EQ-5D-5L: studying measurement and scores in Indonesian type 2 diabetes mellitus patients (under review)
Purba, F. D., Perwitasari, D.A., Atthobari, J., Cao, Q., Krabbe, P.F.M., Postma, M.J. (2018). Association between patient characteristics and EQ-5D-based utility measures in Indonesian type 2 diabetes mellitus outpatients (under review)
Wang, P., Liu, G., Jo, M.W., Purba, F.D., Yang, Z., Gandhi, M., Pattanaphesaj, J., Ahn, J., Wong,
Comparison of Seven Asian Populations (under review)
A
181
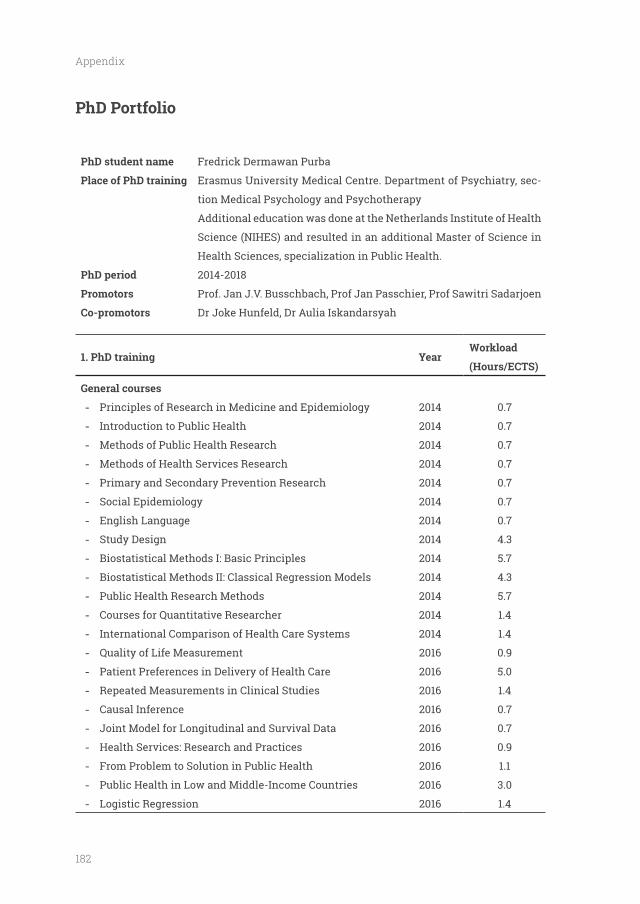
PhD Portfolio
PhD student name
PhD period
Promotors
Co-promotors
Fredrick Dermawan Purba
Erasmus University Medical Centre. Department of Psychiatry, sec-
tion Medical Psychology and Psychotherapy
Additional education was done at the Netherlands Institute of Health
Science (NIHES) and resulted in an additional Master of Science in
2014-2018
Prof. Jan J.V. Busschbach, Prof Jan Passchier, Prof Sawitri Sadarjoen
Dr Joke Hunfeld, Dr Aulia Iskandarsyah
YearWorkload
(Hours/ECTS)
General courses
- Principles of Research in Medicine and Epidemiology
- Introduction to Public Health
- Methods of Public Health Research
- Methods of Health Services Research
- Primary and Secondary Prevention Research
- Social Epidemiology
- English Language
- Study Design
- Biostatistical Methods I: Basic Principles
- Biostatistical Methods II: Classical Regression Models
- Public Health Research Methods
- Courses for Quantitative Researcher
- International Comparison of Health Care Systems
- Quality of Life Measurement
- Patient Preferences in Delivery of Health Care
- Repeated Measurements in Clinical Studies
- Causal Inference
- Joint Model for Longitudinal and Survival Data
- Health Services: Research and Practices
- From Problem to Solution in Public Health
- Public Health in Low and Middle-Income Countries
- Logistic Regression
2014
2014
2014
2014
2014
2014
2014
2014
2014
2014
2014
2014
2014
2016
2016
2016
2016
2016
2016
2016
2016
2016
0.7
0.7
0.7
0.7
0.7
0.7
0.7
4.3
5.7
4.3
5.7
1.4
1.4
0.9
5.0
1.4
0.7
0.7
0.9
1.1
3.0
1.4
182
Appendix
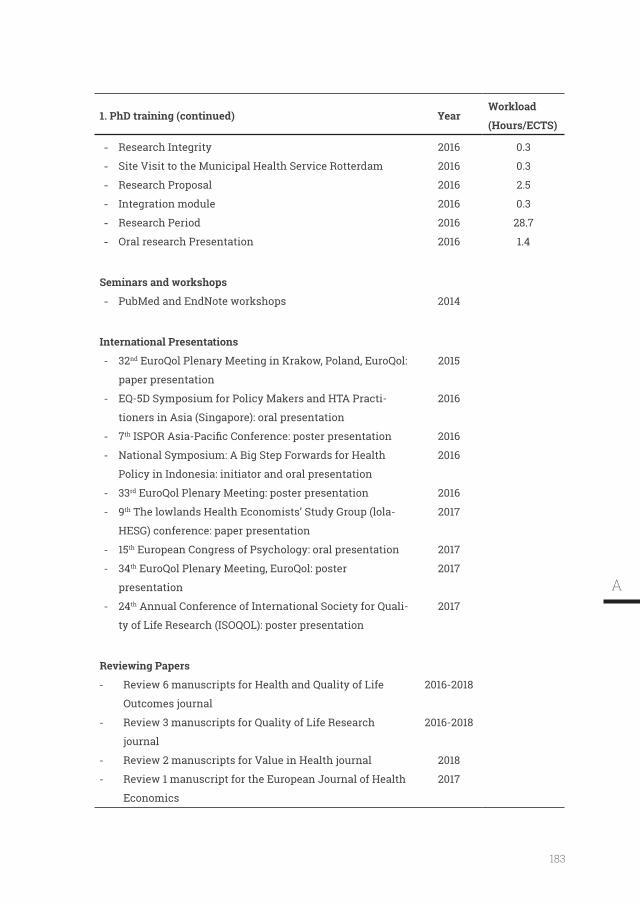
YearWorkload
(Hours/ECTS)
- Research Integrity
- Site Visit to the Municipal Health Service Rotterdam
- Research Proposal
- Integration module
- Research Period
- Oral research Presentation
2016
2016
2016
2016
2016
2016
0.3
0.3
2.5
0.3
28.7
1.4
Seminars and workshops
- PubMed and EndNote workshops 2014
International Presentations
- 32nd EuroQol Plenary Meeting in Krakow, Poland, EuroQol:
paper presentation
- EQ-5D Symposium for Policy Makers and HTA Practi-
tioners in Asia (Singapore): oral presentation
- 7th
- National Symposium: A Big Step Forwards for Health
Policy in Indonesia: initiator and oral presentation
- 33rd EuroQol Plenary Meeting: poster presentation
- 9th The lowlands Health Economists’ Study Group (lola-
HESG) conference: paper presentation
- 15th European Congress of Psychology: oral presentation
- 34th EuroQol Plenary Meeting, EuroQol: poster
presentation
- 24th Annual Conference of International Society for Quali-
ty of Life Research (ISOQOL): poster presentation
2015
2016
2016
2016
2016
2017
2017
2017
2017
- Review 6 manuscripts for Health and Quality of Life
Outcomes journal
- Review 3 manuscripts for Quality of Life Research
journal
- Review 2 manuscripts for Value in Health journal
- Review 1 manuscript for the European Journal of Health
Economics
2016-2018
2016-2018
2018
2017
A
183
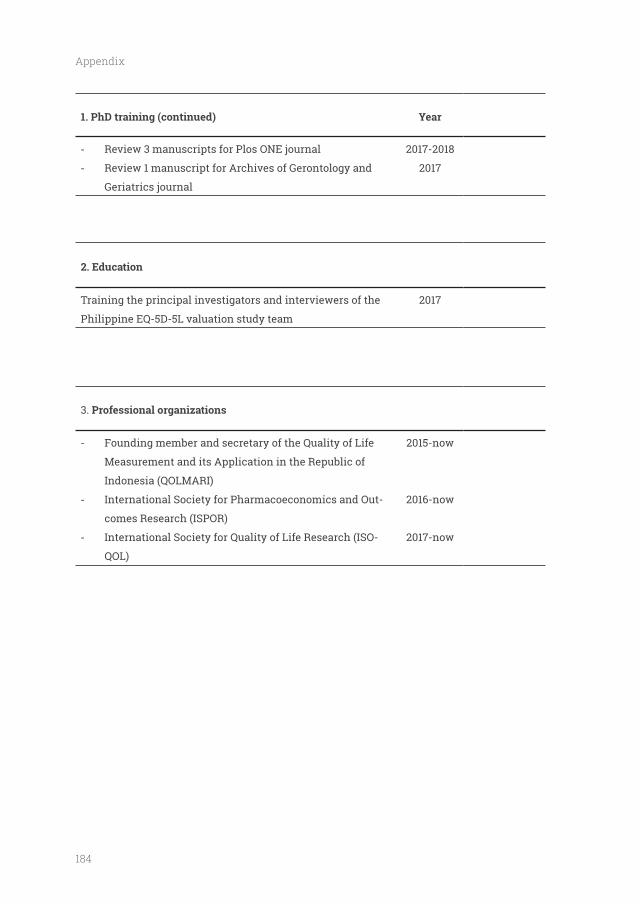
Year
- Review 3 manuscripts for Plos ONE journal
- Review 1 manuscript for Archives of Gerontology and
Geriatrics journal
2017-2018
2017
2. Education
Training the principal investigators and interviewers of the
Philippine EQ-5D-5L valuation study team
2017
3.
- Founding member and secretary of the Quality of Life
Measurement and its Application in the Republic of
Indonesia (QOLMARI)
- International Society for Pharmacoeconomics and Out-
comes Research (ISPOR)
- International Society for Quality of Life Research (ISO-
QOL)
2015-now
2016-now
2017-now
184
Appendix
This thesis represents a milestone in four years of work at the Erasmus Medical Center
people that play important roles in every step of this wonderful journey.
First and foremost, I would like to express my gratitude to my promotor, Jan van
Busschbach, not only for his tremendous academic support but also for giving me so many
wonderful opportunities. He involves me in the activities of the EuroQol Group at every
possible opportunity, for he believes that I should be the ‘person of EQ-5D in Indonesia’. He
where the use of EQ-5D (and other HRQOL tools) are increasing rapidly. For a Ph.D. student
coming to the Netherlands from abroad like me, who depends on a quite limited scholarship,
he facilitates me to attend several international conferences and meetings around the globe
that we valued as good opportunity to learn and establish a professional network. I learned a
lot from him about how to be a good supervisor/mentor and researcher.
My sincere gratitude goes to pak Jan Passchier and bu Joke Hunfeld, who has been truly
dedicated co-promotors. The two of them, together with bu Sawitri, arranged this Ph.D. position
at Erasmus MC after two years of failed attempts to continue my study in the United States.
They acted not only as supervisors but also as good friends for me and numerous Indonesian
student who studied in Rotterdam and Amsterdam. They invited me to visit places in the
Netherlands, sailed with their boat in the Ijsselmeer, and spent hours of discussion about
everything in their lovely apartment. For every manuscript included in this thesis, they
provided valuable and insightful comments and questions that surely lead to better writings.
My fellow Ph.D. students might have to wait for weeks even months to get their supervisors
to comment on their draft, mine usually available within three days thanks to Jan and Joke.
I would like to thank my Indonesian co-promotors: bu Sawitri Sadarjoen and Aulia
Iskandarsyah. Bu Sawitri supervises and supports me since 2005 in various opportunities
and roles. She arranged this Ph.D. position together with my Dutch promotors and supported
during my study. Aulia is a good friend that supported my study in any way possible, especially
Special thank for all parties who helped during the data collection and publication of
interviewers that worked hard to collect high quality data. Special mention goes to Juanma,
A
185
Besides my promotor team, I would like to thank my colleagues in the MPP. One very
important person: Hetty, the wonderful secretary and my defense paranimfen that helped me a
and to meet you will be my priority every time I visit Rotterdam in the future. Special mention
also for Zhihao, with whom I shared the working room in weekdays and (many) weekends,
traveled together to many places that even his wife was getting bored of him mentioning my
name as his travel mate, and wrote proposals and papers. The MPP people were a big help for
me adjusting to the life in the Netherlands and having a fun time in most of it, except for the
Dutch language that I never able to speak. I am proud to say I am part of the MPP.
Special thanks also for my colleagues in the Faculty of Psychology, Universitas Padjadjaran,
Indonesia, especially the department of developmental psychology. Your continuous support
and good wishes during my study in the Netherlands were a powerful motivation for me to
Words cannot express how grateful I am for having good friends from the Scots
International Church Rotterdam, the ‘Sunday Brunch’ group: Alfa, Carol, Debby, Dorcas, Heather,
Imelda, Indra, Joshua, Juliet, Ling, Michelle, Ranee, Ricky, Septian. Sunday was the day I look
forward to every week, not only because it is church time, but also time for our lunch and coffee
afterwards. Travels, parties, celebrations, games, even simple meet-ups: those are precious
moments of our friendship that I will cherish forever.
I also would like to thank my friends in the Netherlands that accompany me along this
journey. Special mention goes to Benny and family whom I lived with during my stay in
Rotterdam; my friends from NIHES time, especially: Anja, Alma, Raquel, Katerina; Indonesian
Gersen, Dilfa, Hary, Runa, Acil, Ides, Olin, mas Aji, and Pai; Sjoerd and his family, who welcomed
me in Den Haag; and others that I could not mention individually: I thank you all.
Finally, but by no means least, my deepest gratitude goes to my family: papa, mama, Edu,
Adis, Abam, Jose, Morgan, Rafael, Ago, Tela, Bistok, Jei, and also Gaga and Kimo. They are
the most important people in my world, and I dedicate this Ph.D. thesis to them. Not forget to
mention Moci who supports me from day one, I forever grateful.
186
Appendix

A
187