Embed Size (px)
Citation preview
STATE OF TENNESSEE
DEPARTMENT OF
ENVIRONMENT AND CONSERVATION
Division of Water Pollution Control
Quality System
Standard Operating Procedure
for
PERIPHYTON
STREAM SURVEYS
January 2010
This SOP is an intra-departmental document intended to govern the internal management of the
Tennessee Department of Environment and Conservation and to meet requirements of the U.S.
Environmental Protection Agency for a quality system. It is not intended to affect rights,
privileges, or procedures available to the public.

Division of Water Pollution Control
QSSOP for Periphyton Stream Surveys
Effective Date: January 2010
Page ii of xiii
DIVISION OF WATER POLLUTION CONTROL
QUALITY SYSTEMS STANDARD OPERATING PROCEDURES
FOR PERIPHYTON STREAM SURVEYS
TABLE OF CONTENTS
DOCUMENT ADMINISTRATION
PAGE
Title and Approval Page…..…………………………...………………………………… v
Approvals and Concurrences…………………………………………………………….. vi
Revisions and Annual Review Procedure………………………………………………... ix
Notice of Revisions Record……………………………………………………………… x
Evaluation Procedure…………………………………………………………………….. xi
QS-SOP Document Distribution List……………………………………………………. xii
Preface…………………………………………………………………………………… xiii
I. PROCEDURES
I.A SCOPE, APPLICABILITY AND REGULATORY REQUIREMENTS……….. I.A-1
I.B METHOD SUMMARY…………………………………………………………. I.B-1
I.C DEFINITIONS AND ACRONYMS…………………………………………….. I.C-1
I.D HEALTH AND SAFETY WARNINGS………………………………………… I.D-1
I.E CAUTIONS……………………………………………………………………… I.E-1
I.F INTERFERENCES……………………………………………………………… I.F-1
I.G PERSONNEL QUALIFICATIONS……………………………………………... I.G-1
I.H EQUIPMENT AND SUPPLIES………………………………………………… I.H-1
I.I PROCEDURES
Protocol A – Selection of Survey Type and Station Location…………………… I.I-A-1
Protocol B – Assigning Station Numbers………………………………………... I.I-B-1
Protocol C – Buffered Formalin Preparation…………………………………….. I.I-C-1
Protocol D – Field Parameters…………………………………………………… I.I-D-1
Protocol E – Habitat Assessment………………………………………………... I.I-E-1
Protocol F – Rapid Periphyton Survey….……………………………………….. I.I-F-1
Protocol G – Multi-habitat Periphyton Sample………….………………………. I.I-G-1
Protocol H – Sample Logging…………………………………………………… I.I-H-1
Protocol I – Taxonomy of Periphyton Samples…………………………………. I.I-I-1
Protocol J – Data Reduction of Periphyton Samples……………………………. I.I-J-1
Protocol K – Report Preparation……………………………………………….... I.I-K-1
I.J DATA AND RECORDS MANAGEMENT…………………………………….. I.J-1
Division of Water Pollution Control
QSSOP for Periphyton Stream Surveys
Effective Date: January 2010
Page iii of xiii
II. QUALITY ASSURANCE/QUALITY CONTROL
A – General QC Practices……………………………………………………….. II -1
B – Field Quality Control – Habitat Assessment and Biological Sampling
Methodology………………………………………………………………
II-1
C – QC Log……………………………………………………………………… II-2
D – Percent Community Similarity……………………….…………………….. II-4
E – Reference Collections……………………………………………………….. II-4
F – Data Reduction QC………………………………………………………….. II-5
III. REFERENCES III-1
LIST OF TABLES
TABLE 1: EPA Recommended Vaccinations…………….………………………. I.D-2
TABLE 2: Instantaneous Probe Mimimum Specifications…………………..…… I.I-D-1
TABLE 3: Habitat Assessment Guidelines……………..………………………… I.I-E-5
TABLE 4: Percent Cover and Thickness Classes……………...…………………. I.I-F-3
TABLE 5: Example of Aliquot Apportion Strageties…………………………….. I.I-G-3
TABLE 6: Metric Scoring Formulae for the Kentucky Diatom Bioassessment
Index…...……………………………..………………………….…….
I.I-J-3
TABLE 7: Bioassessment Guidelines for the KDBI Scores……………………… I.I-J-3
TABLE 8: Example of Periphyton QC Log………...…………………………….. II-3
LIST OF FIGURES
FIGURE 1: Example of Meter Calibration Log…………………………………... I.I-D-2
FIGURE 2: Rapid Periphyton Survey Board……………………………………… I.I-F-3
FIGURE 3: Spherical Densiometer……….………………………………………. I.I-F-3
FIGURE 4: Example of External Tag………….…………………………………. I.I-G-3
FIGURE 5: Example of Periphyton Sample Log…..……………………………... I.I-H-1
APPENDIX A: ECOREGION REFERENCE INFORMATION ………………... A-1
Ecoregion Reference Streams….………………………………………………. A-2
Regional Expectations for Individual Habitat Parameters…………………….. A-11
APPENDIX B: FORMS AND DATA SHEETS…………………………………. B-1
County and State Abbreviations and Code Numbers………………………….. B-2
Habitat Assessment Data Sheet – High Gradient Streams…………………….. B-4
Habitat Assessment Data Sheet – Low Gradient Streams……………………... B-6
Rapid Periphyton Survey Data Sheet.…………..……………………………… B-8
Biological Sample Request Form (including Chain of Custody)……………… B-10
Non-Diatom Algae Taxonomic Bench Sheet………………………………….. B-11
Diatom Algae Taxonomic Bench Sheet………………………………………..
Periphyton Assessment Report…………………………………………………
B-12
B-13
Division of Water Pollution Control
QSSOP for Periphyton Stream Surveys
Effective Date: January 2010
Page iv of xiii
APPENDIX C: PERIPHYTON METRICS……………………………………... C-1
Diatoms Metrics…..…………………………………………………………… C-2
Non-Diatom “Soft Algae” Metrics.....…………………………………………. C-8
Rapid Periphyton Survey Metrics............……………………………………… C-9
APPENDIX D: TAXONOMIC INFORMATION……………………………….. D-1
Taxonomic Keys……………………………………………………………….. D-2
Taxonomic Specialists for Reference Verifications……………………………
Verified Taxa List
Diatom Taxa List.……………………………………………………….
Non-Diatom Taxa List.………………………………………………….
D-5
D-6
D-27
APPENDIX E: BIOVOLUME CALCULATION………………………………... E-1
Geometric Shapes and Equations for Calculations of Biovolume…………...... E-2
Models for Biovolume Calculations of Microalgal Taxa……………………… E-7

Division of Water Pollution Control
QSSOP for Periphyton Stream Surveys
Effective Date: January 2010
Page v of xiii
DIVISION OF WATER POLLUTION CONTROL
QUALITY SYSTEM STANDARD OPERATING PROCEDURE FOR
PERIPHYTON STREAM SURVEYS
TITLE AND APPROVAL PAGE
DOCUMENT TITLE Quality System Standard Operating Procedure for
Periphyton Stream Surveys
ORGANIZATION TITLE Tennessee Department of Environment and Conservation
Division of Water Pollution Control
ADDRESS 401 Church Street
L&C
Nashville, TN 37243-1534
COMMISSIONER James H. Fyke
QUALITY ASSURANCE
MANAGER
Charles Head
ADDRESS
401 Church Street L&C Annex 1st Floor
Nashville, TN 37243-1534
(615) 532-0998
DIVISION PROJECT
MANAGER
Michael Graf
ADDRESS
401 Church Street L&C Annex 7th
Floor
Nashville, TN 37243-1534
(615) 253-2244
PLAN COVERAGE General instructions for periphyton stream surveys in
Tennessee

Division of Water Pollution Control
QSSOP for Periphyton Stream Surveys
Effective Date: January 2010
Page vi of xiii
APPROVALS AND CONCURRENCES
Approvals. This is to certify that we have reviewed this document and approve its contents.
Division of Water Pollution Control
QSSOP for Periphyton Stream Surveys
Effective Date: January 2010
Page vii of xiii
Concurrences and Reviews. The following staff in the Division of Water Pollution Control participated in the
planning and development of this project:
As a part of the internal review process, the following individuals reviewed this document:

Division of Water Pollution Control
QSSOP for Periphyton Stream Surveys
Effective Date: January 2010
Page viii of xiii
Tennessee Department of Environment and Conservation
Division of Water Pollution Control
Paul Davis, Director
Garland Wiggins, Deputy Director
Gregory Denton, Environmental Program Manager I, Planning and Standards Section
Deborah Arnwine, Environmental Specialist V, Planning and Standards Section
Linda Cartwright, Biologist IV, Planning and Standards Section
Courtney Brame, Biologist III, Planning and Standards
Michael Graf, Environmental Specialist III, Planning and Standards Section
Chuck Head, Quality Assurance Manager
Amy Fritz, Environmental Specialist 5, Jackson EFO
Elizabeth Williams, Biologist 3, Jackson EFO
Kim Sparks, Environmental Specialist 4, Nashville EFO
Brandon Chance, Biologist 4, Cookeville EFO
Jonathan Burr, Environmental Specialist 5, Knoxville EFO
Beverly Brown, Biologist 4, Johnson City EFO
Tennessee Department of Environment and Conservation
Department of Energy Oversight Division
R. Gerry Middleton, Environmental Specialist III, Environmental Monitoring Section
Tennessee Department of Health
Environmental Laboratory
Pat Alicea, Manager, Aquatic Biology Section

Division of Water Pollution Control
QSSOP for Periphyton Stream Surveys
Effective Date: January 2010
Page ix of xiii
REVISIONS AND ANNUAL REVIEW PROCEDURE:
QS-SOP FOR PERIPHYTON STREAM SURVEYS
1. This document shall be reviewed annually to reconfirm the suitability and effectiveness of the
program components described in this document.
2. A report of the evaluation of effectiveness of this document shall be developed at the time of
review and submitted to appropriate stakeholders. Peer Reviews shall be conducted, if
necessary and appropriate. It shall be reconfirmed that the document is suitable and effective.
It shall include, if necessary, clarification of roles and responsibilities, response to problem
areas and acknowledgement of successes. Progress toward meeting TDEC–BOE mission,
program goals and objectives shall be documented. Plans shall be made for the upcoming
cycle and communicated to appropriate stakeholders.
3. The record identified as “Revisions” shall be used to document all changes.
4. A copy of any document revisions made during the year shall be sent to all appropriate
stakeholders. A report shall be made to the Assistant Commissioner and Quality Assurance
Manager of any changes that occur. Other stakeholders shall be notified, as appropriate and
documented on the “Document Distribution” list.

Division of Water Pollution Control
QSSOP for Periphyton Stream Surveys
Effective Date: January 2010
Page x of xiii
NOTICE OF REVISION(S) RECORD
Date Specific
Section or
Page
Revision Type (major or minor)
Revision Description

Division of Water Pollution Control
QSSOP for Periphyton Stream Surveys
Effective Date: January 2010
Page xi of xiii
EVALUATION PROCEDURE:
QS-SOP FOR PERIPHYTON STREAM SURVEYS
As this document is used, needed changes or improvements will be apparent. Specific
recommendations for improvements or changes are solicited as well as information concerning
typographical or formatting errors.
1. Copy this page and complete all questions. Electronic versions of this are encouraged
especially if comments are significant.
2. Send specific recommendations for improvements or changes, along with the following
information, to:
Michael Graf
TDEC, Division of Water Pollution Control
7th
Floor L&C Annex
401 Church Street
Nashville, TN 37243-1534
615-253-2244
E-mail address: [email protected]
Your Name
Division, EFO or Section
Address
E-mail Address
Telephone Number
Document Effective Date
Section(s) and Page
Number(s) to which your
comments apply
Comments

Division of Water Pollution Control
QSSOP for Periphyton Stream Surveys
Effective Date: January 2010
Page xii of xiii
QS-SOP DOCUMENT DISTRIBUTION LIST
Copies of this document were distributed to the following individuals in TDEC and TDH
Additional copies were distributed to non-TDEC agencies and individuals upon request
(including other state and federal agencies, consultants, universities etc.). An updated
distribution list is maintained in the Planning and Standards Section.
The system for document distribution is described in TDEC-BOE Quality Manual, Chapters 5 and 10.
QS-SOP
Recipient Name
Organization Title Telephone Number
Document
Control
Number
Chad Augustin WPC – CLEFO
TDEC
Biologist IV 931-490-3945
Mark Barb WPC – NEFO
TDEC
Biologist IV 423-634-5774
Brandon Chance WPC - CKEFO
TDEC
Biologist IV 931-432-4015
Jonathon Burr WPC – KEFO
TDEC
Environmental
Specialist V
865-594-5520
Amy Fritz WPC – JEFO
TDEC
Environmental
Specialist V
731-512-1307
Joellyn Brazile WPC – MEFO
TDEC
Environmental
Specialist V
901- 365-3214
Dan Murray WPC – KEFO
TDEC
Biologist IV 865-594-5549
R. Gerry
Middleton
DOE-O
TDEC
Environmental
Specialist III
865-481-0995
Tina Robinson WPC – JCEFO
TDEC
Environmental
Specialist VI
423-854-5453
Jimmy Smith WPC - NEFO
TDEC
Environmental
Specialist V
615-689-7122
Pat Alicea AB – LS
TDH
Biologist IV
(Manager)
615-262-6327
Garland Wiggins WPC – CO Deputy
Director
615-532-0633

Division of Water Pollution Control
QSSOP for Periphyton Stream Surveys
Effective Date: January 2010
Page xiii of xiii
PREFACE
The U.S. EPA requires that a centrally planned, directed and coordinated quality assurance and
quality control program be applied to efforts supported by them through grants, contracts or
other formalized agreements. This includes the implementation of a Quality Management Plan
as written by the contract holder with Data Quality Objectives (DQOs) set in Quality Assurance
Project Plans (QAPPs) for specific projects. The organization may elect to support portions of
the QAPP through technical or administrative standard operating procedures (SOPs), as
specified by the quality system. As a contract holder and through memoranda of agreement, the
Tennessee Department of Environment and Conservation is required to maintain such a system.
This quality system technical Standard Operating Procedure (QS-SOP) was prepared, reviewed
and distributed in accordance with TDEC’s Quality Management Plan and other quality system
documents in response to U.S. EPA’s requirements for a Quality Management Program. QS-
SOPs are integral parts of successful quality systems as they provide staff with the information
to perform a job properly and facilitate consistency in the quality and integrity of the process.
This QS-SOP is specific to the Division of Water Pollution Control and is intended to assist the
division in maintaining their quality control and quality assurance processes and to ensure
compliance with government regulations. It provides specific operational direction for the
division’s Quality Assurance Project Plan for Periphyton Stream Surveys.
Division of Water Pollution Control
QSSOP for Periphyton Stream Surveys
Effective Date: January 2010
Section I.A: Page 1 of 1
I. PROCEDURES
I.A SCOPE, APPLICABILITY AND REGULATORY REQUIREMENTS
The purpose of this Quality Systems Standard Operating Procedure (QS-SOP) is to support the
Quality Assurance Program. The document provides a consolidated reference document for use
in training and orientation of employees. This guide will also be a reference tool for more
experienced employees. It establishes an approach that can be recommended to sister agencies
that monitor Tennessee water or stipulated to members of the regulated community given
monitoring requirements in receiving streams. This SOP describes the periphyton stream survey
process and will delineate all steps in the process, including habitat assessments, field
collections, sample analysis, data reduction and reporting. This SOP is only intended to
describe routine conditions encountered during a periphyton stream survey.
Federal Statutory Authority
Federal Water Pollution Control Act (amended through P.L. 106-308, October 13,2000) as Amended by the Clean
Water Act of 1977 enacted by Public Law 92-500, October 18, 1972, 86 Stat. 816; 33 U.S.C. 1251 et. seq.
Title III, Sec. 302: Water Quality Related Effluent Limitations Title III, Sec. 303: Water Quality Standards and Implementation Plans
Title III, Sec. 304: Information and Guidelines
Title III, Sec. 305: Water Quality Inventory
Tennessee Statutory Authority
Tennessee Water Quality Control Act of 1977 (Acts 1971, ch. 164, § 1; 1977 ch. 366, § 1; T.C.A., § 69-3-101 et
seq.
Tennessee Regulatory Authority
General Water Quality Criteria and the Antidegradation Statement: Rule 1200-4-3
(specifically 1200-4-3-.03(3) j: Biological Integrity and 1200-4-3-.06 Tennessee Antidegradation Statement)
Use Classification for Surface Waters: Rule 1200-4-4
Division of Water Pollution Control
QSSOP for Periphyton Surveys
Effective Date: January 2010
Section I.B: Page 1 of 1
I.B METHOD SUMMARY
This document describes procedures for performing periphyton surveys approved by the
Division of Water Pollution Control for assessing biological integrity of streams. The entire
procedure is described, including protocols for sample collection, habitat assessment, sample
analysis, data reduction and reporting.
Due to the sedentary nature of periphyton, the community composition and biomass are
sensitive to changes in water quality. A diverse community of periphyton can be found in
healthy streams. Nuisance blooms are usually symptoms of a system stressed by factors such as
excessive nutrients, elevated temperatures, or stagnant conditions. Therefore, the division will
use periphyton as secondary biological indicators of impairment in streams. The primary
biological indicators are macroinvertebrates.
Two periphyton sampling protocols are described in this document. Both will be performed
every time periphyton sampling is indicated. The first, Rapid Periphyton Survey (RPS), is an
estimate of algal biomass found in the stream. The second, more intensive protocol involves
collecting a sample of periphyton and analyzing the periphyton community found there. Both
sampling protocols will be carried out in monitoring stations where nutrient impairment is
suspected or known, as well as ecoregion reference streams.
Habitat assessments (high gradient and low gradient) are also described in this document.
Habitat assessments are to be conducted in conjunction with all types of biological surveys since
habitat is often a limiting factor to the complexity of the benthic community. By following this
assessment procedure, habitat can either be confirmed or eliminated as a cause of stress to the
periphyton community.
Division of Water Pollution Control
QSSOP for Periphyton Stream Surveys
Effective Date: January 2010
Section I.C: Page 1 of 2
I.C DEFINITIONS AND ACRONYMS
Ambient Monitoring: Routine sampling and evaluation of receiving waters not necessarily
associated with periodic disturbance.
Benthic Community: Plants and animals living on the bottom of the stream.
Ecoregion: A relatively homogenous area defined by similarity of climate, landform, soil,
potential natural vegetation, hydrology, and other ecologically relevant variables. There are
eight (Level III) ecoregions in Tennessee.
Ecological Subregion (or subecoregion): A smaller area that has been delineated within an
ecoregion that has even more homogenous characteristics than does the original ecoregion.
There are 31 (Level IV) ecological subregions in Tennessee.
Ecoregion Reference: Least impacted waters within an ecoregion that have been monitored to
establish a baseline to which alterations of other waters can be compared.
Frustule: The silicate cell wall of a diatom. The frustule is composed of two valves.
Habitat: The instream and riparian features that influence the structure and function of the
aquatic community in a stream.
Macroalgae: Long filamentous strands of algae such as Cladophora or Spirogyra spp.
Microalgae: Primarily single celled algae which coat the substrate and are generally composed
of diatoms and soft algae such as blue-green algae
Moss: Member of the division Bryophyta
Periphyton: Algae attached to submerged substrate in aquatic environments.
Reference database: Biological and chemical data from ecoregion reference sites.
Riparian Zone: An area that borders a waterbody (approximately 18 meters wide).
Valve: Half of a frustule.
Watershed: The area that drains to a particular body of water or common point.

Division of Water Pollution Control
QSSOP for Periphyton Stream Surveys
Effective Date: January 2010
Section I.C: Page 2 of 2
Acronyms
CGR Cymbella Group Richness
D.O. Dissolved Oxygen
D/S Downstream
EFO Environmental Field Office
ES Environmental Specialist
FGR Fragilaria Group Richness
GPS Global Positioning System
H’ Shannon Diversity Index
KDBI Kentucky Diatom Bioassessment Index
KPTI Kentucky Pollution Tolerance Index
LDB Left Descending Bank
MPS Multi-habitat Periphyton Sample
MT Mountain Region
MVIR Mississippi Valley-Interior Region
% NNS Percent Navicula, Nitzschia, and Surirella
PAS Planning and Standards Section
PN Pennyroyal Region
QA/QC Quality Assurance/Quality Control
RDB Right Descending Bank
RPS Rapid Periphyton Survey
SOP Standard Operating Procedure
TDEC Tennessee Department of Environment and Conservation
TMDL Total Maximum Daily Loading
TNDT Total Number of Diatom Taxa
TOPO Topographic Map
TR Taxa Richness
U/S Upstream
WPC Water Pollution Control
Division of Water Pollution Control
QSSOP for Periphyton Stream Surveys
Effective Date: January 2010
Section I.D: Page 1 of 2
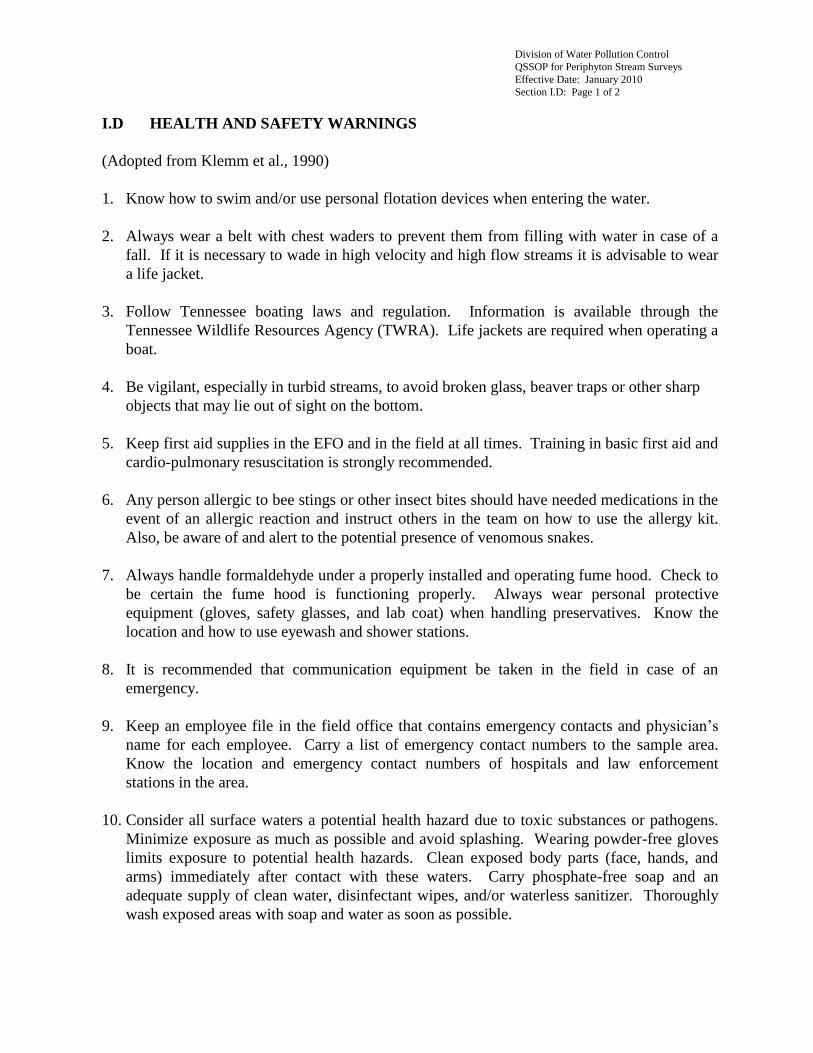
I.D HEALTH AND SAFETY WARNINGS
(Adopted from Klemm et al., 1990)
1. Know how to swim and/or use personal flotation devices when entering the water.
2. Always wear a belt with chest waders to prevent them from filling with water in case of a
fall. If it is necessary to wade in high velocity and high flow streams it is advisable to wear
a life jacket.
3. Follow Tennessee boating laws and regulation. Information is available through the
Tennessee Wildlife Resources Agency (TWRA). Life jackets are required when operating a
boat.
4. Be vigilant, especially in turbid streams, to avoid broken glass, beaver traps or other sharp
objects that may lie out of sight on the bottom.
5. Keep first aid supplies in the EFO and in the field at all times. Training in basic first aid and
cardio-pulmonary resuscitation is strongly recommended.
6. Any person allergic to bee stings or other insect bites should have needed medications in the
event of an allergic reaction and instruct others in the team on how to use the allergy kit.
Also, be aware of and alert to the potential presence of venomous snakes.
7. Always handle formaldehyde under a properly installed and operating fume hood. Check to
be certain the fume hood is functioning properly. Always wear personal protective
equipment (gloves, safety glasses, and lab coat) when handling preservatives. Know the
location and how to use eyewash and shower stations.
8. It is recommended that communication equipment be taken in the field in case of an
emergency.
9. Keep an employee file in the field office that contains emergency contacts and physician’s
name for each employee. Carry a list of emergency contact numbers to the sample area.
Know the location and emergency contact numbers of hospitals and law enforcement
stations in the area.
10. Consider all surface waters a potential health hazard due to toxic substances or pathogens.
Minimize exposure as much as possible and avoid splashing. Wearing powder-free gloves
limits exposure to potential health hazards. Clean exposed body parts (face, hands, and
arms) immediately after contact with these waters. Carry phosphate-free soap and an
adequate supply of clean water, disinfectant wipes, and/or waterless sanitizer. Thoroughly
wash exposed areas with soap and water as soon as possible.
Division of Water Pollution Control
SOP for Periphyton Stream Surveys
Effective Date: January 2010
Section 1.D.: Page 2 of 2
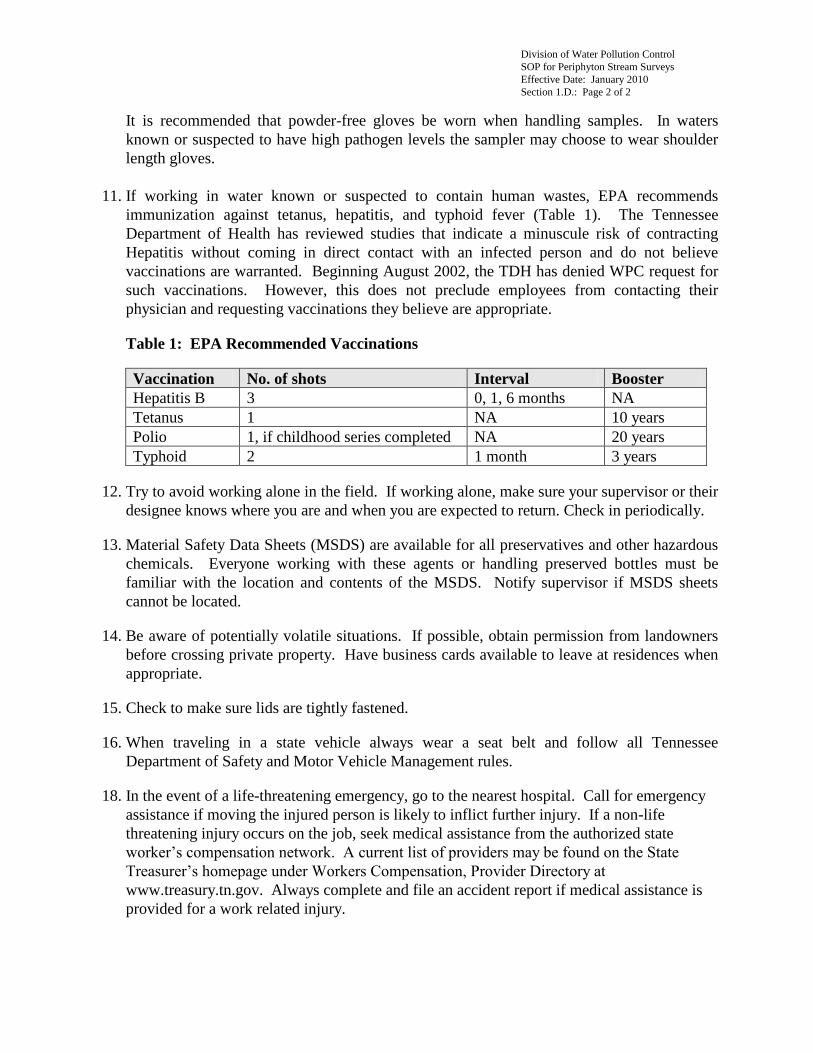
It is recommended that powder-free gloves be worn when handling samples. In waters
known or suspected to have high pathogen levels the sampler may choose to wear shoulder
length gloves.
11. If working in water known or suspected to contain human wastes, EPA recommends
immunization against tetanus, hepatitis, and typhoid fever (Table 1). The Tennessee
Department of Health has reviewed studies that indicate a minuscule risk of contracting
Hepatitis without coming in direct contact with an infected person and do not believe
vaccinations are warranted. Beginning August 2002, the TDH has denied WPC request for
such vaccinations. However, this does not preclude employees from contacting their
physician and requesting vaccinations they believe are appropriate.
Table 1: EPA Recommended Vaccinations
Vaccination No. of shots Interval Booster
Hepatitis B 3 0, 1, 6 months NA
Tetanus 1 NA 10 years
Polio 1, if childhood series completed NA 20 years
Typhoid 2 1 month 3 years
12. Try to avoid working alone in the field. If working alone, make sure your supervisor or their
designee knows where you are and when you are expected to return. Check in periodically.
13. Material Safety Data Sheets (MSDS) are available for all preservatives and other hazardous
chemicals. Everyone working with these agents or handling preserved bottles must be
familiar with the location and contents of the MSDS. Notify supervisor if MSDS sheets
cannot be located.
14. Be aware of potentially volatile situations. If possible, obtain permission from landowners
before crossing private property. Have business cards available to leave at residences when
appropriate.
15. Check to make sure lids are tightly fastened.
16. When traveling in a state vehicle always wear a seat belt and follow all Tennessee
Department of Safety and Motor Vehicle Management rules.
18. In the event of a life-threatening emergency, go to the nearest hospital. Call for emergency
assistance if moving the injured person is likely to inflict further injury. If a non-life
threatening injury occurs on the job, seek medical assistance from the authorized state
worker’s compensation network. A current list of providers may be found on the State
Treasurer’s homepage under Workers Compensation, Provider Directory at
www.treasury.tn.gov. Always complete and file an accident report if medical assistance is
provided for a work related injury.
Division of Water Pollution Control
SOP for Periphyton Stream Surveys
Effective Date: January 2010
Section 1.E.: Page 1 of 1
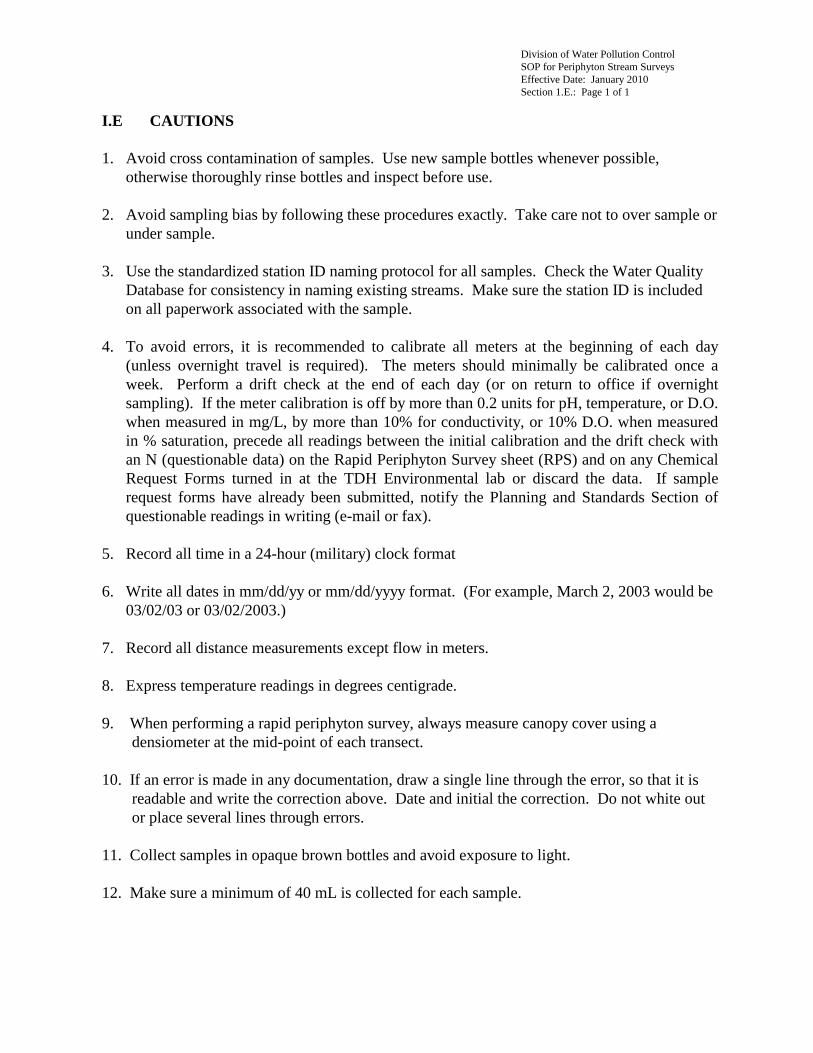
I.E CAUTIONS
1. Avoid cross contamination of samples. Use new sample bottles whenever possible,
otherwise thoroughly rinse bottles and inspect before use.
2. Avoid sampling bias by following these procedures exactly. Take care not to over sample or
under sample.
3. Use the standardized station ID naming protocol for all samples. Check the Water Quality
Database for consistency in naming existing streams. Make sure the station ID is included
on all paperwork associated with the sample.
4. To avoid errors, it is recommended to calibrate all meters at the beginning of each day
(unless overnight travel is required). The meters should minimally be calibrated once a
week. Perform a drift check at the end of each day (or on return to office if overnight
sampling). If the meter calibration is off by more than 0.2 units for pH, temperature, or D.O.
when measured in mg/L, by more than 10% for conductivity, or 10% D.O. when measured
in % saturation, precede all readings between the initial calibration and the drift check with
an N (questionable data) on the Rapid Periphyton Survey sheet (RPS) and on any Chemical
Request Forms turned in at the TDH Environmental lab or discard the data. If sample
request forms have already been submitted, notify the Planning and Standards Section of
questionable readings in writing (e-mail or fax).
5. Record all time in a 24-hour (military) clock format
6. Write all dates in mm/dd/yy or mm/dd/yyyy format. (For example, March 2, 2003 would be
03/02/03 or 03/02/2003.)
7. Record all distance measurements except flow in meters.
8. Express temperature readings in degrees centigrade.
9. When performing a rapid periphyton survey, always measure canopy cover using a
densiometer at the mid-point of each transect.
10. If an error is made in any documentation, draw a single line through the error, so that it is
readable and write the correction above. Date and initial the correction. Do not white out
or place several lines through errors.
11. Collect samples in opaque brown bottles and avoid exposure to light.
12. Make sure a minimum of 40 mL is collected for each sample.
Division of Water Pollution Control
QSSOP for Periphyton Stream Surveys
Effective Date: January 2010
Section I.F: Page 1 of 1
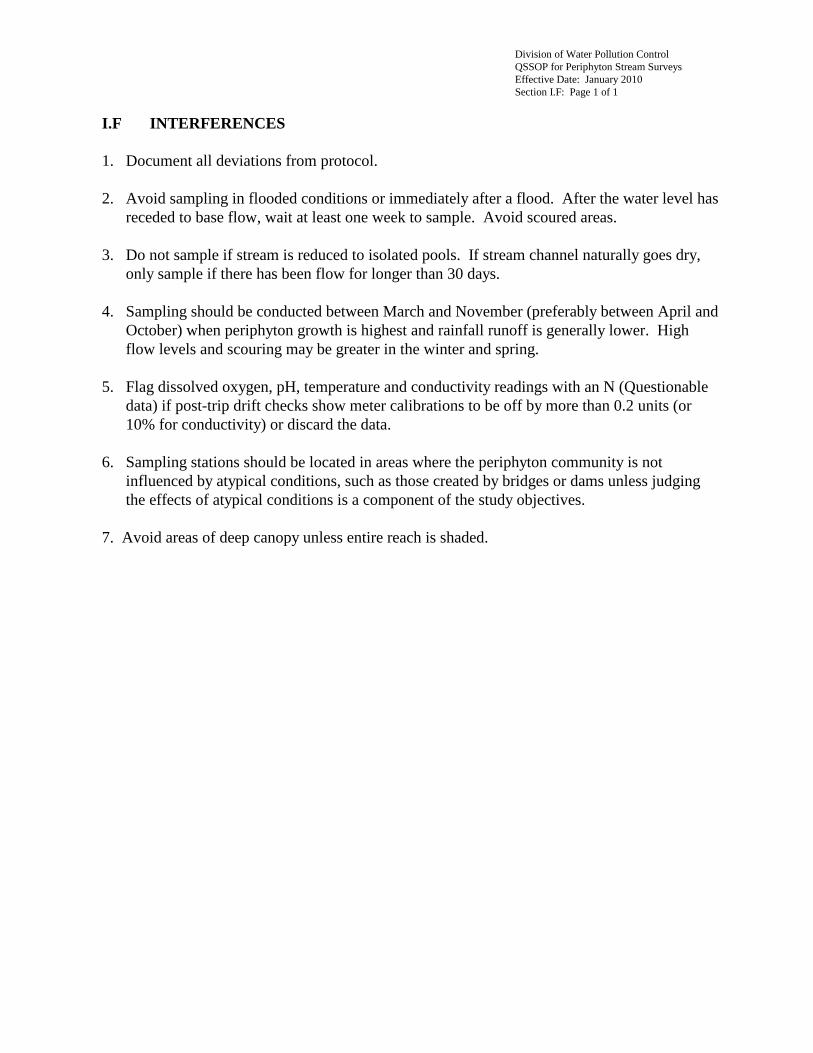
I.F INTERFERENCES
1. Document all deviations from protocol.
2. Avoid sampling in flooded conditions or immediately after a flood. After the water level has
receded to base flow, wait at least one week to sample. Avoid scoured areas.
3. Do not sample if stream is reduced to isolated pools. If stream channel naturally goes dry,
only sample if there has been flow for longer than 30 days.
4. Sampling should be conducted between March and November (preferably between April and
October) when periphyton growth is highest and rainfall runoff is generally lower. High
flow levels and scouring may be greater in the winter and spring.
5. Flag dissolved oxygen, pH, temperature and conductivity readings with an N (Questionable
data) if post-trip drift checks show meter calibrations to be off by more than 0.2 units (or
10% for conductivity) or discard the data.
6. Sampling stations should be located in areas where the periphyton community is not
influenced by atypical conditions, such as those created by bridges or dams unless judging
the effects of atypical conditions is a component of the study objectives.
7. Avoid areas of deep canopy unless entire reach is shaded.

Division of Water Pollution Control
QSSOP for Periphyton Stream Surveys
Effective Date: January 2010
Section I.G: Page 1 of 1
I.G PERSONNEL QUALIFICATIONS
Tennessee Civil Service Titles: Biologist, Environmental Specialist, Environmental Protection
Specialist, Environmental Program Manager, Environmental Field Office Manager, or trained
co-op/intern (state employees only). For the purpose of this report, all position titles will be
referred to as biologist.
Minimum Education Requirements: B.S. in a biological science. Coursework in stream
ecology and/or phycology is desirable. A graduate level degree in phycology, aquatic biology,
stream ecology or similar field is preferable.
Minimum experience: one year (specific class-work involving biological stream surveys can be
substituted for experience).
Expertise: Computation of basic statistics, use of standard water quality monitoring meters,
habitat evaluations and general water quality assessments, ability to recognize macroalgae and
microalgae.
Training: Protocols outlined in this SOP
Quality System Requirements
Quality Assurance Project Plan
Division of Water Pollution Control
QSSOP for Periphyton Stream Surveys
Effective Date: January 2010
Section I.H: Page 1 of 3
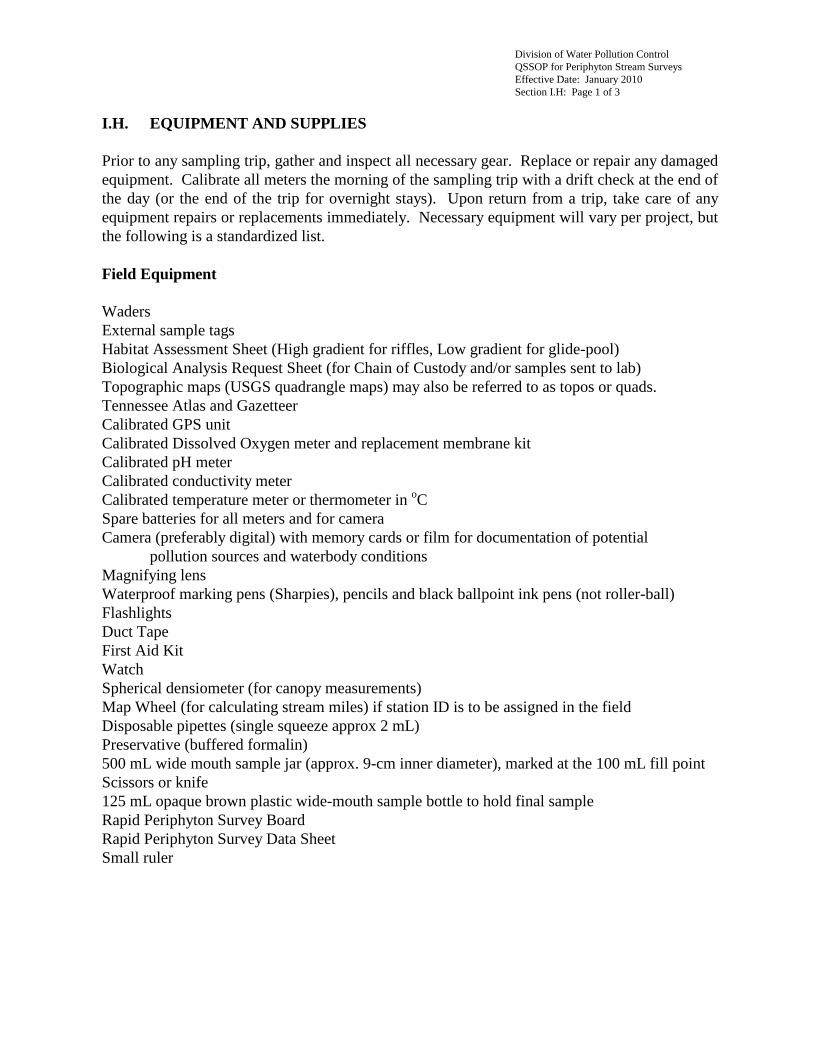
I.H. EQUIPMENT AND SUPPLIES
Prior to any sampling trip, gather and inspect all necessary gear. Replace or repair any damaged
equipment. Calibrate all meters the morning of the sampling trip with a drift check at the end of
the day (or the end of the trip for overnight stays). Upon return from a trip, take care of any
equipment repairs or replacements immediately. Necessary equipment will vary per project, but
the following is a standardized list.
Field Equipment
Waders
External sample tags
Habitat Assessment Sheet (High gradient for riffles, Low gradient for glide-pool)
Biological Analysis Request Sheet (for Chain of Custody and/or samples sent to lab)
Topographic maps (USGS quadrangle maps) may also be referred to as topos or quads.
Tennessee Atlas and Gazetteer
Calibrated GPS unit
Calibrated Dissolved Oxygen meter and replacement membrane kit
Calibrated pH meter
Calibrated conductivity meter
Calibrated temperature meter or thermometer in oC
Spare batteries for all meters and for camera
Camera (preferably digital) with memory cards or film for documentation of potential
pollution sources and waterbody conditions
Magnifying lens
Waterproof marking pens (Sharpies), pencils and black ballpoint ink pens (not roller-ball)
Flashlights
Duct Tape
First Aid Kit
Watch
Spherical densiometer (for canopy measurements)
Map Wheel (for calculating stream miles) if station ID is to be assigned in the field
Disposable pipettes (single squeeze approx 2 mL)
Preservative (buffered formalin)
500 mL wide mouth sample jar (approx. 9-cm inner diameter), marked at the 100 mL fill point
Scissors or knife
125 mL opaque brown plastic wide-mouth sample bottle to hold final sample
Rapid Periphyton Survey Board
Rapid Periphyton Survey Data Sheet
Small ruler
Division of Water Pollution Control
QSSOP for Periphyton Stream Surveys
Effective Date: January 2010
Section 1.H: Page 2 of 3
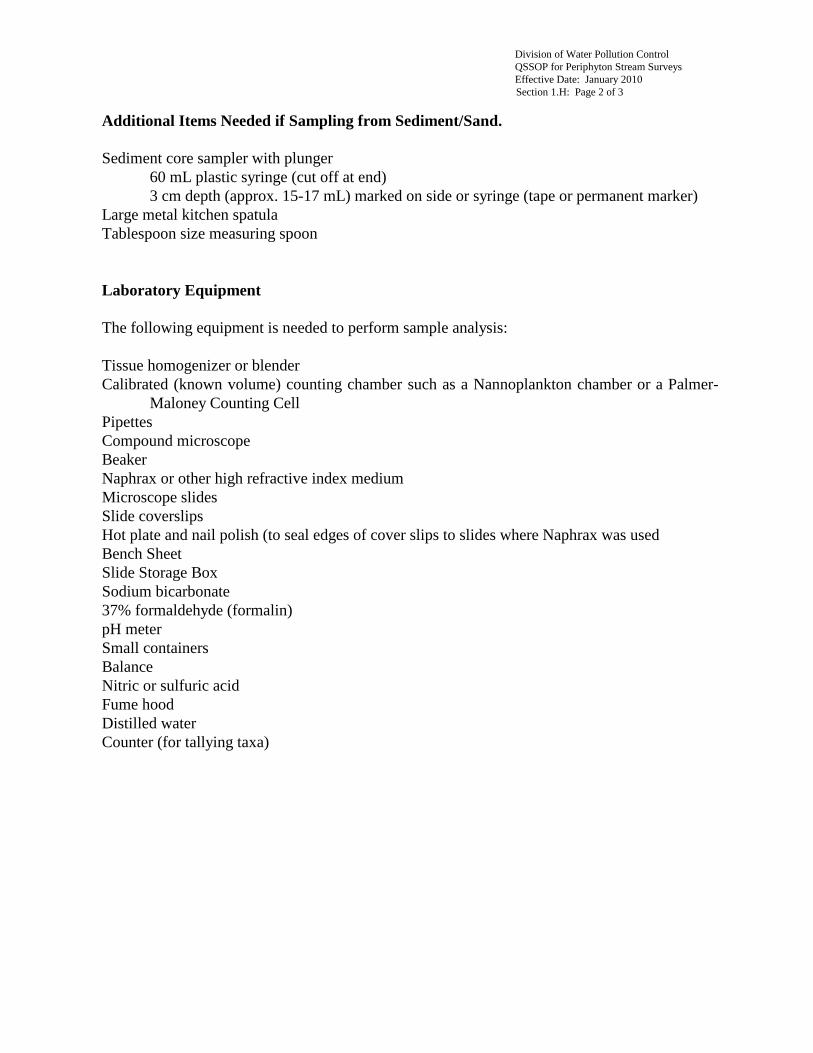
Additional Items Needed if Sampling from Sediment/Sand.
Sediment core sampler with plunger
60 mL plastic syringe (cut off at end)
3 cm depth (approx. 15-17 mL) marked on side or syringe (tape or permanent marker)
Large metal kitchen spatula
Tablespoon size measuring spoon
Laboratory Equipment
The following equipment is needed to perform sample analysis:
Tissue homogenizer or blender
Calibrated (known volume) counting chamber such as a Nannoplankton chamber or a Palmer-
Maloney Counting Cell
Pipettes
Compound microscope
Beaker
Naphrax or other high refractive index medium
Microscope slides
Slide coverslips
Hot plate and nail polish (to seal edges of cover slips to slides where Naphrax was used
Bench Sheet
Slide Storage Box
Sodium bicarbonate
37% formaldehyde (formalin)
pH meter
Small containers
Balance
Nitric or sulfuric acid
Fume hood
Distilled water
Counter (for tallying taxa)

Division of Water Pollution Control
QSSOP for Periphyton Stream Surveys
Effective Date: January 2010
Section 1.H: Page 3 of 3
Sample Container Acquisition
Sample containers are to be obtained through the Tennessee Department of Health
Environmental laboratory.
It is recommended that sample containers be requested at least two weeks prior to the
anticipated date they need (preferably one month).
The 125 mL opaque amber plastic wide-mouth sample bottles used for the final periphyton
collection will be available directly from Laboratory Services:
Contact: Dr. Bob Read
(615) 262-6302
Division of Water Pollution Control
QSSOP for Periphyton Stream Surveys
Effective Date: January 2010
Section I.I, Protocol A: Page 1 of 2
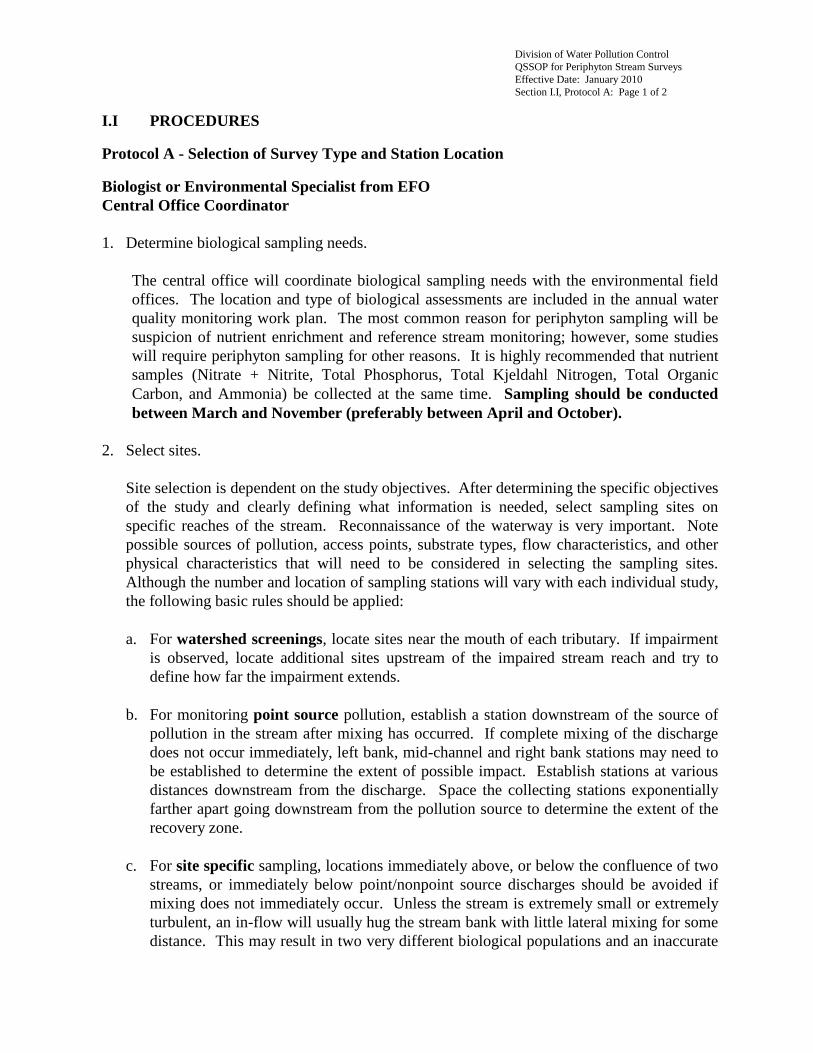
I.I PROCEDURES
Protocol A - Selection of Survey Type and Station Location
Biologist or Environmental Specialist from EFO
Central Office Coordinator
1. Determine biological sampling needs.
The central office will coordinate biological sampling needs with the environmental field
offices. The location and type of biological assessments are included in the annual water
quality monitoring work plan. The most common reason for periphyton sampling will be
suspicion of nutrient enrichment and reference stream monitoring; however, some studies
will require periphyton sampling for other reasons. It is highly recommended that nutrient
samples (Nitrate + Nitrite, Total Phosphorus, Total Kjeldahl Nitrogen, Total Organic
Carbon, and Ammonia) be collected at the same time. Sampling should be conducted
between March and November (preferably between April and October).
2. Select sites.
Site selection is dependent on the study objectives. After determining the specific objectives
of the study and clearly defining what information is needed, select sampling sites on
specific reaches of the stream. Reconnaissance of the waterway is very important. Note
possible sources of pollution, access points, substrate types, flow characteristics, and other
physical characteristics that will need to be considered in selecting the sampling sites.
Although the number and location of sampling stations will vary with each individual study,
the following basic rules should be applied:
a. For watershed screenings, locate sites near the mouth of each tributary. If impairment
is observed, locate additional sites upstream of the impaired stream reach and try to
define how far the impairment extends.
b. For monitoring point source pollution, establish a station downstream of the source of
pollution in the stream after mixing has occurred. If complete mixing of the discharge
does not occur immediately, left bank, mid-channel and right bank stations may need to
be established to determine the extent of possible impact. Establish stations at various
distances downstream from the discharge. Space the collecting stations exponentially
farther apart going downstream from the pollution source to determine the extent of the
recovery zone.
c. For site specific sampling, locations immediately above, or below the confluence of two
streams, or immediately below point/nonpoint source discharges should be avoided if
mixing does not immediately occur. Unless the stream is extremely small or extremely
turbulent, an in-flow will usually hug the stream bank with little lateral mixing for some
distance. This may result in two very different biological populations and an inaccurate
Division of Water Pollution Control
QSSOP for Periphyton Stream Surveys
Effective Date: January 2010
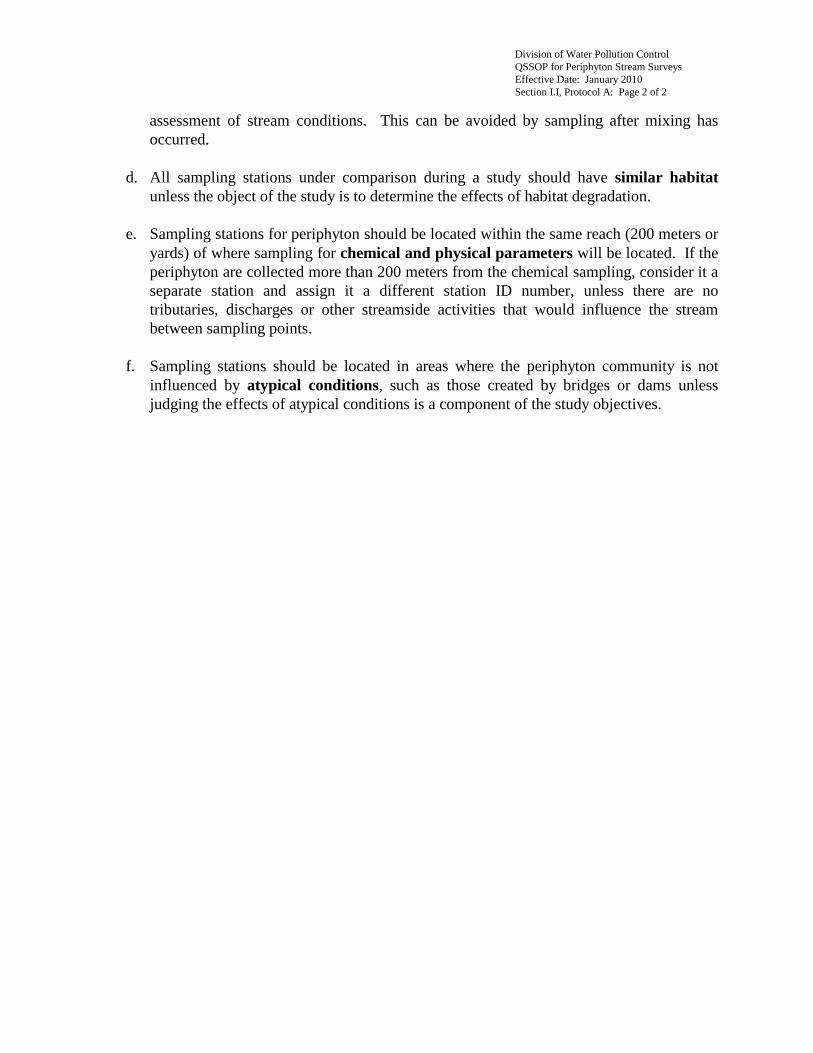
Section I.I, Protocol A: Page 2 of 2
assessment of stream conditions. This can be avoided by sampling after mixing has
occurred.
d. All sampling stations under comparison during a study should have similar habitat
unless the object of the study is to determine the effects of habitat degradation.
e. Sampling stations for periphyton should be located within the same reach (200 meters or
yards) of where sampling for chemical and physical parameters will be located. If the
periphyton are collected more than 200 meters from the chemical sampling, consider it a
separate station and assign it a different station ID number, unless there are no
tributaries, discharges or other streamside activities that would influence the stream
between sampling points.
f. Sampling stations should be located in areas where the periphyton community is not
influenced by atypical conditions, such as those created by bridges or dams unless
judging the effects of atypical conditions is a component of the study objectives.
Division of Water Pollution Control
QSSOP for Periphyton Stream Surveys
Effective Date: January 2010
Section I.I, Protocol B: Page 1 of 7
Protocol B – Assigning Station Identification Numbers
Sampler
Assign station numbers to each site using the following protocol. The station number is used to
identify the sample and must be included on all associated paperwork, results, tags, etc. This
number is to be used to identify this site every time it is sampled (benthic, fish, algae, bacteria,
or chemical). If new stations are set up that will have chemical or bacteriological monitoring,
send the station information to the Planning and Standards Section as soon as the location is
finalized and before results are received. (It is usually a least a month between sample
collection and receipt of results.) Minimally, station information should include station ID,
latitude and longitude (in decimal degrees), HUC, ecoregion, stream order and specific location
information (such as road crossing) that can be located on a map. Contact PAS if assistance is
needed to assign station numbers. Continue to use the established naming protocol for NPDES
effluent samples.
It is very important that station IDs are assigned consistently with the same location always
assigned the same ID irregardless of the sample collection type, purpose, samplers or year. It is
also important that river miles used in the station ID are measured as accurately as possible and
correspond to the latitude and longitude for easy comparison between multiple stations on the
same waterbody. The official stream name is the one found on the USGS 7.5 minute
topographic map. Do not use other sources such as a gazetteer, TDOT bridge signs or local
names, which may differ.
1. Before assigning a new station number, check the “current stations” table in the Water
Quality Database to make sure a number has not already been assigned to that site. Even if
the site has not been collected before by the EFO, a station ID may have already been
assigned based on other agency data. Do not assume that a station does not exist because it
has not been collected by the EFO. Contact the Planning and Standards Section if there is
any question.
If the station is not in the database, coordinate the naming of the station with staff members
who may be collecting chemical and/or macroinvertebrate samples at the same site. Stations
collected within 200 meters (yards) of each other are considered the same site and should be
assigned the same station ID. If it is necessary to go more than 200 meters for chemical
sampling or to find a suitable macroinvertebrate habitat, the samples can be assigned the
same station ID provided there are no tributaries or potential pollution sources between the
chemical and biological sample points. If there are tributaries or potential pollution sources,
considerate it a separate station and assign it a different station ID.
Division of Water Pollution Control
QSSOP for Periphyton Stream Surveys
Effective Date: January 2010
Section I.I, Protocol B: Page 2 of 7
The only exception to the following naming scheme is sites that have been designated as
Ecoregion reference sites. These sites are always identified with either an ECO or FECO
(headwater stream) designation no matter what the purpose of sampling. If new ecoregion
reference sites are added, contact Planning and Standards (PAS) to determine the
appropriate station number.
2. If a number does not already exist for the site, create a 12-character or less identification
number. All letters in the station name are capitalized. Do not use more than 12 characters
including the decimal.
a. The first five digits will be the first five letters of the stream/river name (capitalized). If
the stream/river name has more than one word, use the first letter of each word finishing
out the five letters with the last word. For example, South Fork Forked Deer River
would be SFFDE. If the creek name has fewer than five letters use the entire name. Do
not use the words River, Creek, or Branch. (Fork is only used if the stream is also
designated river, creek, branch etc.) For example, Dry Fork would be DRY but Dry
Fork Creek would be DFORK.
b. The next five characters designate the river mile. This will be written as three whole
numbers, a decimal and a tenth space. For example, river mile 1.2 would be written as
001.2. Do not add zeros to make a short stream name longer. It is very important that
the river mile be determined as accurately as possible. Ideally, this would be done by
GIS. It can also be done using a topo map and a map wheel. The river mile is always
measured upstream from the confluence with the main stem. If there are other stations
located on the same stream, make sure that the assigned river miles are appropriately
upstream or downstream of existing stations. If errors are discovered, contact PAS to
have the station re-assigned.
c. The last two characters designate the county or state, if not in Tennessee. Use the county
and state identification table in Appendix A to determine the appropriate county or state
abbreviation. The county or state is expressed with two letters; do not use the numeric
state code. If the station is in another state, add an underscore _ before the two letter
state abbreviation.
Example 1: A station located at river mile 1.5 on Puncheoncamp Creek in Greene
County would be PUNCH001.5GE.
Example 2: A station located at river mile 25 on the North Fork Forked Deer River in
Gibson County would be NFFDE025.0GI.
Example 3. A station that is located in Kentucky at river mile 15.2 of Spring Creek
would be SPRIN015.2_KY.
Division of Water Pollution Control
QSSOP for Periphyton Stream Surveys
Effective Date: January 2010
Section I.I, Protocol B: Page 3 of 7
3. Unnamed Streams/Tributaries
Check a 24k scale topo map (hardcopy or GIS layer) to see if the unnamed stream is within a
named geographical feature such as a Cove, Hollow, Gulf, Gulch, or Valley.
a. For streams that are not within a named geographical feature:
(1) Use the first five letters of the receiving stream the tributary enters.
(2) Use 1T for the first unnamed tributary station sampled, 2T for the second unnamed
tributary sampled etc.
(3) Use a 3-character stream mile including one whole number, the decimal and a tenth
space. For example river mile 1.2 would be written as 1.2.
(4) Use the two letter county or state abbreviation from Appendix A. If the station is in
another state, add an underscore _ before the two letter state abbreviation.
Example 1: A station located at river mile 0.2 on an unnamed tributary that entered the
North Fork Forked Deer River in Gibson County would be
NFFDE1T0.2GI.
Example 2: A second station located at mile 5.5 on the same unnamed tributary would
be NFFDE1T5.5GI.
Example 3: A site at river mile 8.5 on a different unnamed tributary to the North Fork
Forked Deer would be NFFDE2T8.5GI.
(5) When naming an unnamed tributary to an unnamed tributary, use the first three
letters of the main stem followed by the 1T1T, the river mile and the county. For
example, a station at river mile 0.5 on an unnamed tributary to an unnamed tributary
to Turkey Creek in Gibson County would be called TUR1T1T0.5GI.
b. For streams that are within a named geographical feature:
(1) The first five digits will be the first five letters of the name of the geographical
feature (capitalized). If the feature name has more than one word, use the first letter
of each word finishing out the five letters with the last word. Do not use the words
Cove, Hollow, Gulch, Gulf, or Valley. If the feature name has fewer than five
letters use the entire name.
(2) Add underscore_G to indicate that the station is named after a geographical feature
and not a named stream. Streams with “_G” will be the main branch running
through the feature. Use 1G for the first unnamed tributary that flows into the main
Division of Water Pollution Control
QSSOP for Periphyton Stream Surveys
Effective Date: January 2010
Section I.I, Protocol B: Page 4 of 7
branch of the feature, 2G for the second unnamed tributary that flows into the
feature, etc.
(3) The next three characters designate the miles upstream from the nearest named
stream or waterbody. This will be written as one whole number, a decimal and a
tenth space. For example, river mile 1.2 would be written as 1.2. If the stream is an
unnamed tributary to the main branch (_G streams), the miles will be measured
upstream from the main branch instead of the nearest named stream or waterbody.
(4) Use the two letter county or state abbreviation from Appendix A. If the station is in
another state, add an underscore _ before the two letter state abbreviation.
Example 1: A station that is in Shingle Mill Hollow in Marion County and is 0.3 miles
upstream from Nickajack Reservoir, which is the closest named waterbody
would be SMILL_G0.3MI.
Example 2: A station that is located on an unnamed main branch in Cave Cove in
Marion County that is 0.4 miles upstream of the nearest named stream
would be CAVE_G0.4MI.
Example 3: A station on an unnamed tributary that is 0.2 miles upstream of the main
branch in Example 2 would be CAVE1G0.2MI.
4. Wetlands
a. For named wetlands
(1) Use the first five letters of the wetland name if one word – if more than one word
use the first letter of each word plus as many letters are needed in the last word (see
2.a).
(2) Add underscore_W.
(3) Use a 3-character stream mile including one whole number, the decimal and a tenth
space. For example river mile 1.2 would be written as 1.2.
(4) Use the two letter county or state abbreviation from Appendix A. If the station is in
another state, add an underscore _ before the two letter state abbreviation.
Example 1: A station located at DUCK wetland would be DUCK_W1.2CH.
Example 2: A station located at BLACK HORSE wetland would be BHORS_W1.2CH.
Division of Water Pollution Control
QSSOP for Periphyton Stream Surveys
Effective Date: January 2010
Section I.I, Protocol B: Page 5 of 7
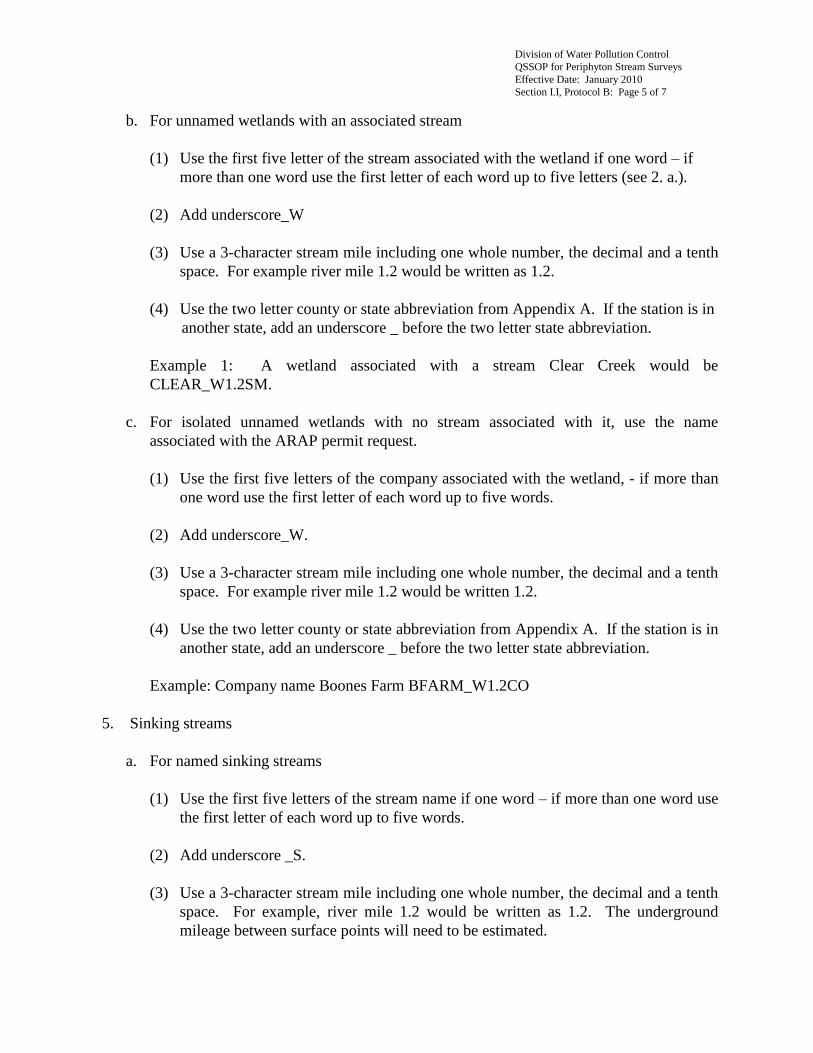
b. For unnamed wetlands with an associated stream
(1) Use the first five letter of the stream associated with the wetland if one word – if
more than one word use the first letter of each word up to five letters (see 2. a.).
(2) Add underscore_W
(3) Use a 3-character stream mile including one whole number, the decimal and a tenth
space. For example river mile 1.2 would be written as 1.2.
(4) Use the two letter county or state abbreviation from Appendix A. If the station is in
another state, add an underscore _ before the two letter state abbreviation.
Example 1: A wetland associated with a stream Clear Creek would be
CLEAR_W1.2SM.
c. For isolated unnamed wetlands with no stream associated with it, use the name
associated with the ARAP permit request.
(1) Use the first five letters of the company associated with the wetland, - if more than
one word use the first letter of each word up to five words.
(2) Add underscore_W.
(3) Use a 3-character stream mile including one whole number, the decimal and a tenth
space. For example river mile 1.2 would be written 1.2.
(4) Use the two letter county or state abbreviation from Appendix A. If the station is in
another state, add an underscore _ before the two letter state abbreviation.
Example: Company name Boones Farm BFARM_W1.2CO
5. Sinking streams
a. For named sinking streams
(1) Use the first five letters of the stream name if one word – if more than one word use
the first letter of each word up to five words.
(2) Add underscore _S.
(3) Use a 3-character stream mile including one whole number, the decimal and a tenth
space. For example, river mile 1.2 would be written as 1.2. The underground
mileage between surface points will need to be estimated.
Division of Water Pollution Control
QSSOP for Periphyton Stream Surveys
Effective Date: January 2010
Section I.I, Protocol B: Page 6 of 7
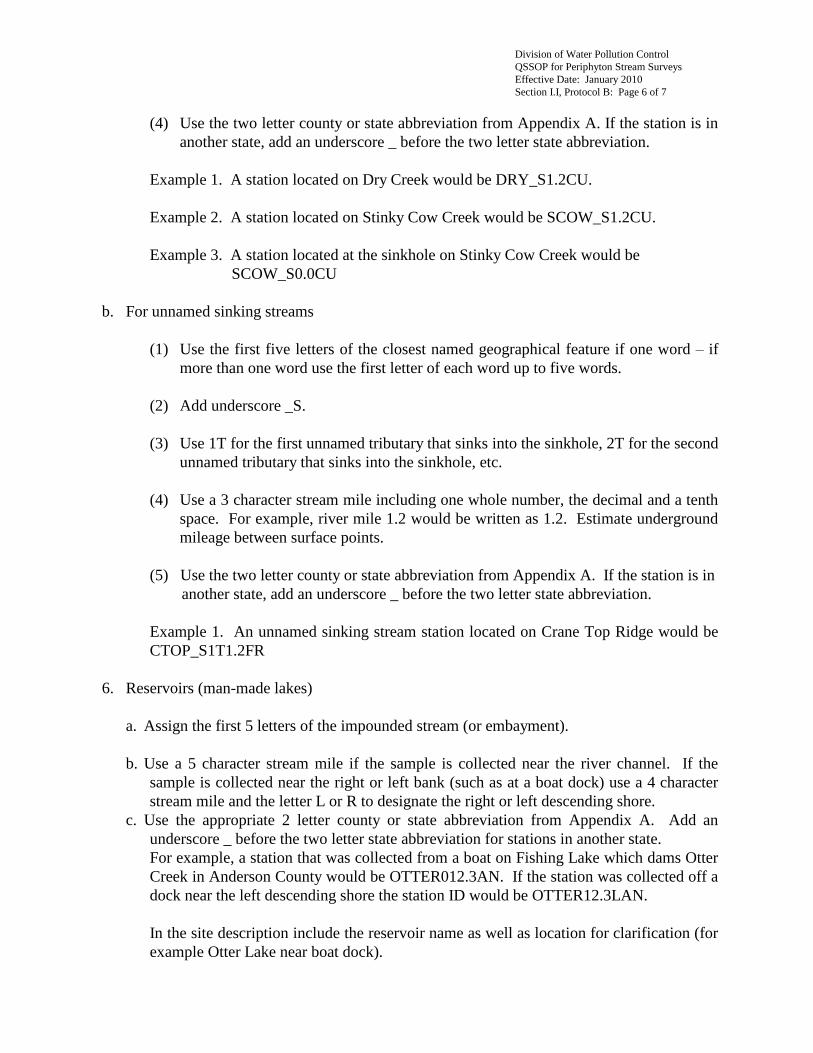
(4) Use the two letter county or state abbreviation from Appendix A. If the station is in
another state, add an underscore _ before the two letter state abbreviation.
Example 1. A station located on Dry Creek would be DRY_S1.2CU.
Example 2. A station located on Stinky Cow Creek would be SCOW_S1.2CU.
Example 3. A station located at the sinkhole on Stinky Cow Creek would be
SCOW_S0.0CU
b. For unnamed sinking streams
(1) Use the first five letters of the closest named geographical feature if one word – if
more than one word use the first letter of each word up to five words.
(2) Add underscore _S.
(3) Use 1T for the first unnamed tributary that sinks into the sinkhole, 2T for the second
unnamed tributary that sinks into the sinkhole, etc.
(4) Use a 3 character stream mile including one whole number, the decimal and a tenth
space. For example, river mile 1.2 would be written as 1.2. Estimate underground
mileage between surface points.
(5) Use the two letter county or state abbreviation from Appendix A. If the station is in
another state, add an underscore _ before the two letter state abbreviation.
Example 1. An unnamed sinking stream station located on Crane Top Ridge would be
CTOP_S1T1.2FR
6. Reservoirs (man-made lakes)
a. Assign the first 5 letters of the impounded stream (or embayment).
b. Use a 5 character stream mile if the sample is collected near the river channel. If the
sample is collected near the right or left bank (such as at a boat dock) use a 4 character
stream mile and the letter L or R to designate the right or left descending shore.
c. Use the appropriate 2 letter county or state abbreviation from Appendix A. Add an
underscore _ before the two letter state abbreviation for stations in another state.
For example, a station that was collected from a boat on Fishing Lake which dams Otter
Creek in Anderson County would be OTTER012.3AN. If the station was collected off a
dock near the left descending shore the station ID would be OTTER12.3LAN.
In the site description include the reservoir name as well as location for clarification (for
example Otter Lake near boat dock).
Division of Water Pollution Control
QSSOP for Periphyton Stream Surveys
Effective Date: January 2010
Section I.I, Protocol B: Page 7 of 7
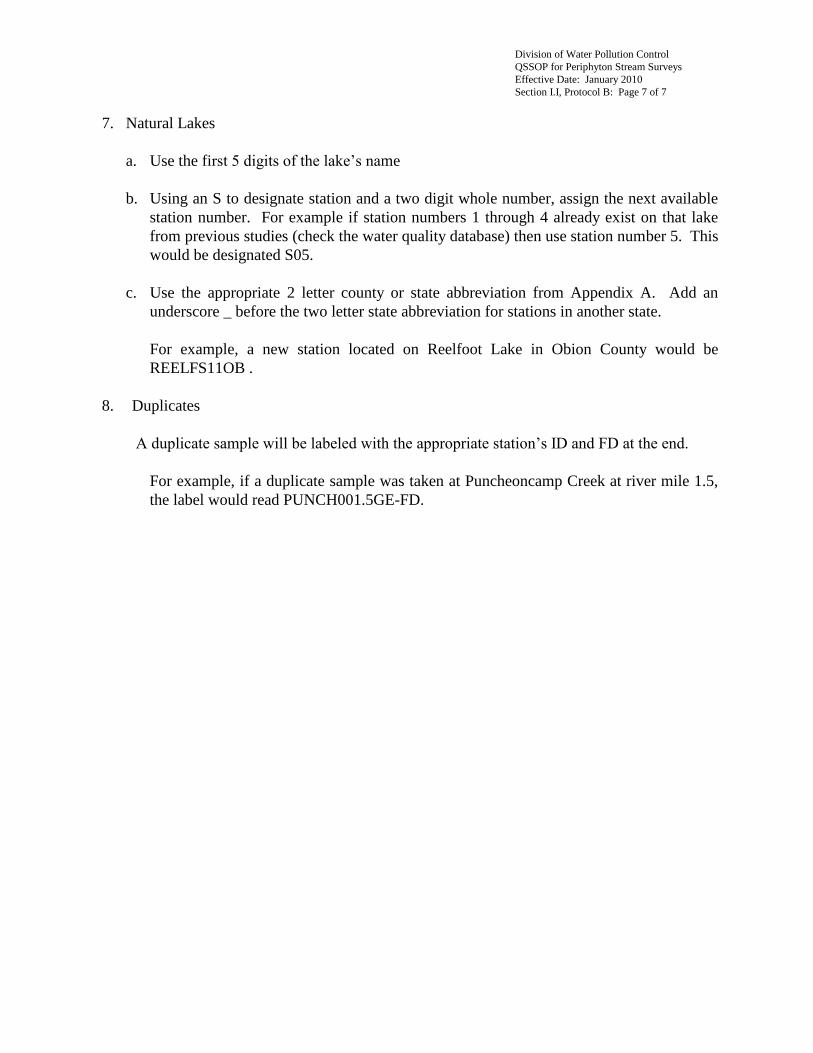
7. Natural Lakes
a. Use the first 5 digits of the lake’s name
b. Using an S to designate station and a two digit whole number, assign the next available
station number. For example if station numbers 1 through 4 already exist on that lake
from previous studies (check the water quality database) then use station number 5. This
would be designated S05.
c. Use the appropriate 2 letter county or state abbreviation from Appendix A. Add an
underscore _ before the two letter state abbreviation for stations in another state.
For example, a new station located on Reelfoot Lake in Obion County would be
REELFS11OB .
8. Duplicates
A duplicate sample will be labeled with the appropriate station’s ID and FD at the end.
For example, if a duplicate sample was taken at Puncheoncamp Creek at river mile 1.5,
the label would read PUNCH001.5GE-FD.
Division of Water Pollution Control
QSSOP for Periphyton Stream Surveys
Effective Date: January 2010
Section I.I, Protocol C: Page 1 of 1
Protocol C –Buffered Formalin Preparation
Biologist/Environmental Specialist
1. Place a clean weigh pan on the balance. Tare the balance.
2. Weigh out approximately 1 gram of sodium bicarbonate for each liter of formalin.
3. Use extreme caution when handling formalin. It is a very toxic chemical and can cause
irritation to skin, eyes, and respiratory system. It is also highly flammable. A lab coat, latex
or vinyl gloves, and eye protection are required when working with formalin. Avoid
breathing vapors or exposing co-workers to them. Work in a well ventilated area (preferably
a lab hood or chemical ventilation system). Keep face away from open containers of
formalin. Refer to the MSDS for information and first aid measures for reagents and
chemicals in this SOP.
4. Gradually add the sodium bicarbonate to your container of formalin (37%). In general, one
gram of sodium bicarbonate will buffer about one liter of formalin, but it is necessary to
check the pH of the buffered solution, as individual batches of formalin may vary in pH.
Close the container and shake vigorously after each addition. Check the pH at each interval
until reaching a pH between 7.5-8.0 S.U. The sodium bicarbonate may not all dissolve into
the formaldehyde, as this is a supersaturated solution. The solution should not be milky
white; this indicates that too much sodium bicarbonate was added. Store the buffered
formalin in an appropriate container such as Nalgene plastic and label the container
“Buffered Formalin” and also write the date of preparation. The shelf life for the buffered
formalin is two years.
Division of Water Pollution Control
QSSOP for Periphyton Stream Surveys
Effective Date: January 2010
Section I.I, Protocol D: Page 1 of 4
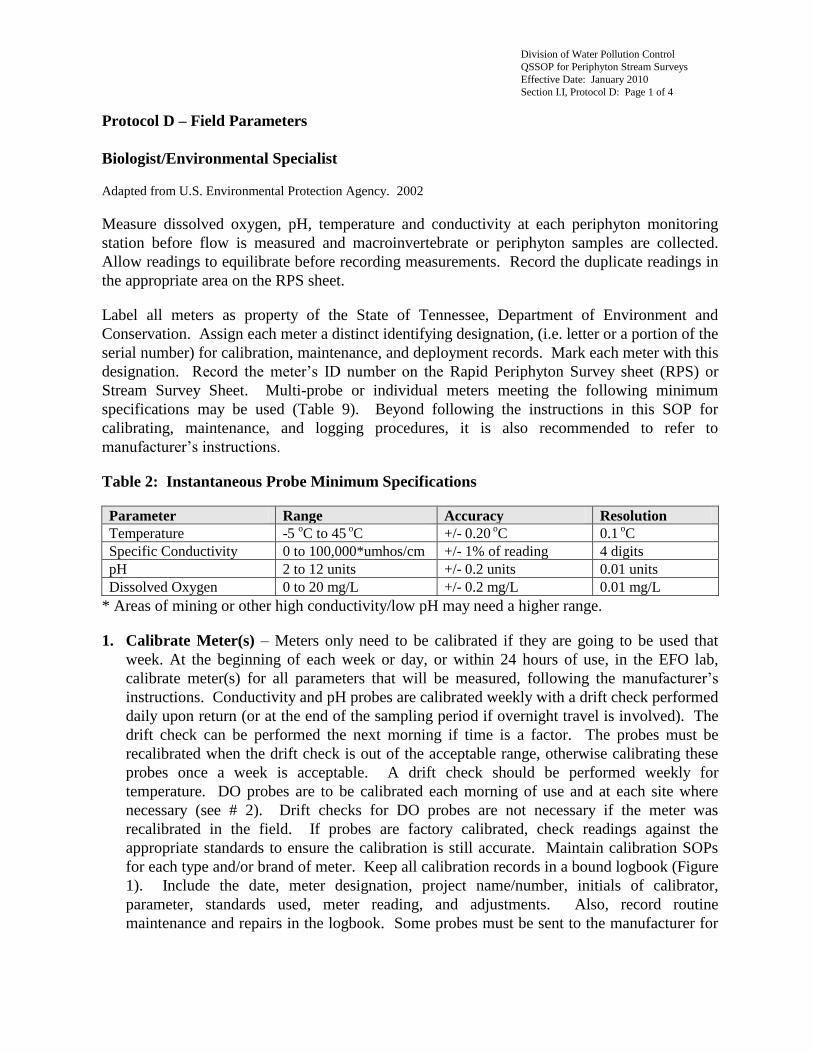
Protocol D – Field Parameters
Biologist/Environmental Specialist
Adapted from U.S. Environmental Protection Agency. 2002
Measure dissolved oxygen, pH, temperature and conductivity at each periphyton monitoring
station before flow is measured and macroinvertebrate or periphyton samples are collected.
Allow readings to equilibrate before recording measurements. Record the duplicate readings in
the appropriate area on the RPS sheet.
Label all meters as property of the State of Tennessee, Department of Environment and
Conservation. Assign each meter a distinct identifying designation, (i.e. letter or a portion of the
serial number) for calibration, maintenance, and deployment records. Mark each meter with this
designation. Record the meter’s ID number on the Rapid Periphyton Survey sheet (RPS) or
Stream Survey Sheet. Multi-probe or individual meters meeting the following minimum
specifications may be used (Table 9). Beyond following the instructions in this SOP for
calibrating, maintenance, and logging procedures, it is also recommended to refer to
manufacturer’s instructions.
Table 2: Instantaneous Probe Minimum Specifications
Parameter Range Accuracy Resolution
Temperature -5 oC to 45
oC +/- 0.20
oC 0.1
oC
Specific Conductivity 0 to 100,000*umhos/cm +/- 1% of reading 4 digits
pH 2 to 12 units +/- 0.2 units 0.01 units
Dissolved Oxygen 0 to 20 mg/L +/- 0.2 mg/L 0.01 mg/L
* Areas of mining or other high conductivity/low pH may need a higher range.
1. Calibrate Meter(s) – Meters only need to be calibrated if they are going to be used that
week. At the beginning of each week or day, or within 24 hours of use, in the EFO lab,
calibrate meter(s) for all parameters that will be measured, following the manufacturer’s
instructions. Conductivity and pH probes are calibrated weekly with a drift check performed
daily upon return (or at the end of the sampling period if overnight travel is involved). The
drift check can be performed the next morning if time is a factor. The probes must be
recalibrated when the drift check is out of the acceptable range, otherwise calibrating these
probes once a week is acceptable. A drift check should be performed weekly for
temperature. DO probes are to be calibrated each morning of use and at each site where
necessary (see # 2). Drift checks for DO probes are not necessary if the meter was
recalibrated in the field. If probes are factory calibrated, check readings against the
appropriate standards to ensure the calibration is still accurate. Maintain calibration SOPs
for each type and/or brand of meter. Keep all calibration records in a bound logbook (Figure
1). Include the date, meter designation, project name/number, initials of calibrator,
parameter, standards used, meter reading, and adjustments. Also, record routine
maintenance and repairs in the logbook. Some probes must be sent to the manufacturer for
Division of Water Pollution Control
QSSOP for Periphyton Stream Surveys
Effective Date: January 2010
Section I.I, Protocol D: Page 2 of 4
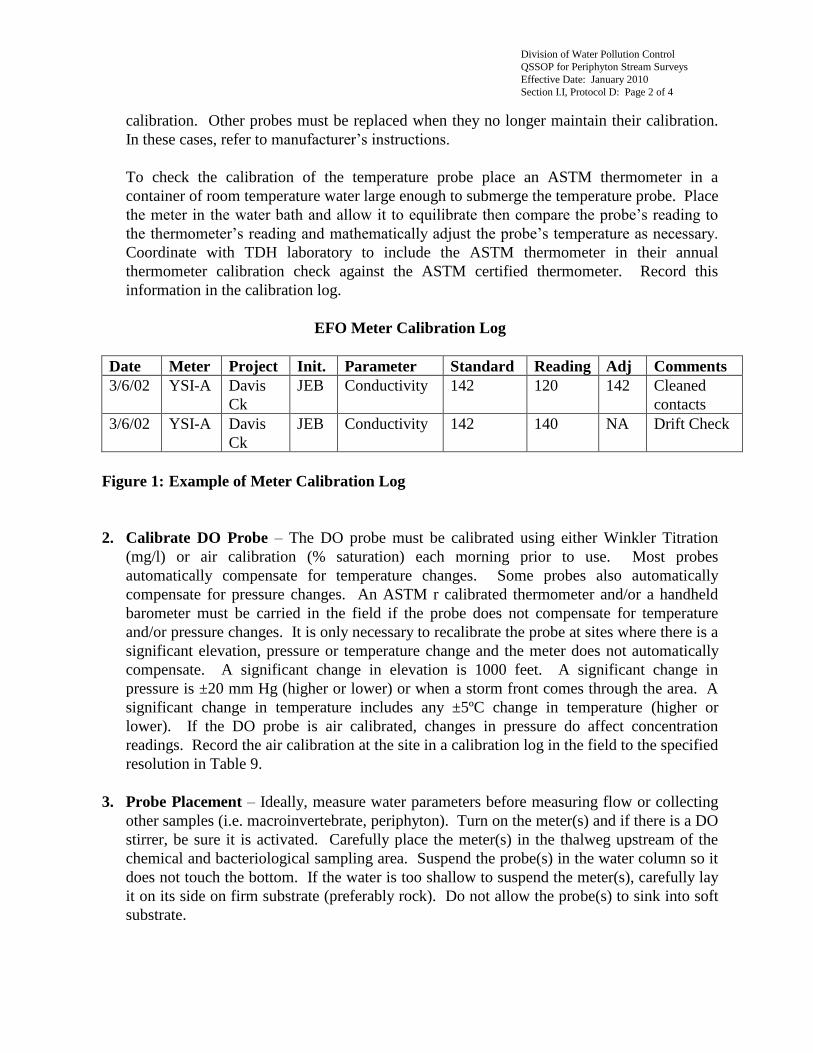
calibration. Other probes must be replaced when they no longer maintain their calibration.
In these cases, refer to manufacturer’s instructions.
To check the calibration of the temperature probe place an ASTM thermometer in a
container of room temperature water large enough to submerge the temperature probe. Place
the meter in the water bath and allow it to equilibrate then compare the probe’s reading to
the thermometer’s reading and mathematically adjust the probe’s temperature as necessary.
Coordinate with TDH laboratory to include the ASTM thermometer in their annual
thermometer calibration check against the ASTM certified thermometer. Record this
information in the calibration log.
EFO Meter Calibration Log
Date Meter Project Init. Parameter Standard Reading Adj Comments
3/6/02 YSI-A Davis
Ck
JEB Conductivity 142 120 142 Cleaned
contacts
3/6/02 YSI-A Davis
Ck
JEB Conductivity 142 140 NA Drift Check
Figure 1: Example of Meter Calibration Log
2. Calibrate DO Probe – The DO probe must be calibrated using either Winkler Titration
(mg/l) or air calibration (% saturation) each morning prior to use. Most probes
automatically compensate for temperature changes. Some probes also automatically
compensate for pressure changes. An ASTM r calibrated thermometer and/or a handheld
barometer must be carried in the field if the probe does not compensate for temperature
and/or pressure changes. It is only necessary to recalibrate the probe at sites where there is a
significant elevation, pressure or temperature change and the meter does not automatically
compensate. A significant change in elevation is 1000 feet. A significant change in
pressure is ±20 mm Hg (higher or lower) or when a storm front comes through the area. A
significant change in temperature includes any ±5ºC change in temperature (higher or
lower). If the DO probe is air calibrated, changes in pressure do affect concentration
readings. Record the air calibration at the site in a calibration log in the field to the specified
resolution in Table 9.
3. Probe Placement – Ideally, measure water parameters before measuring flow or collecting
other samples (i.e. macroinvertebrate, periphyton). Turn on the meter(s) and if there is a DO
stirrer, be sure it is activated. Carefully place the meter(s) in the thalweg upstream of the
chemical and bacteriological sampling area. Suspend the probe(s) in the water column so it
does not touch the bottom. If the water is too shallow to suspend the meter(s), carefully lay
it on its side on firm substrate (preferably rock). Do not allow the probe(s) to sink into soft
substrate.
Division of Water Pollution Control
QSSOP for Periphyton Stream Surveys
Effective Date: January 2010
Section I.I, Protocol D: Page 3 of 4
Stand downstream of the probe, being careful not to disturb the substrate in the area of the
probe(s). Allow enough time for each reading to stabilize before it is recorded. Depending
on the meter, it may take a couple of minutes for dissolved oxygen to equilibrate. Record
initial readings in the field notebook or the field survey form to the specified resolution
(Table 9). The multi-parameter probe may also be placed in a bucket filled with surface
water with the DO stirrer activated and allowed to equilibrate. Rinse the bucket and probe
once with surface water before placing probe in the bucket of water.
4. Duplicate Readings – Take duplicate measurements at each site. If time is a constraint
(short sample holding times or daylight), duplicate readings may be reduced to the first and
last site each day. To take a duplicate measurement, lift the probe completely out of the
water, wait for the readings to change, then return it to the original location or slightly
upstream if the sediment was disturbed. Allow the meter to equilibrate before recording
readings. If the readings are off by more than 0.2 units for pH, temperature, and DO in mg/L
or off by more than 10% for specific conductivity, repeat the procedure until reproducible
results are obtained. Record all readings on the RPS sheet and in the field notebook or the
stream survey form. All results are to be recorded to the resolution specified in Table 9.
5. Record Field Parameters – Document the field parameters on the RPS form (Appendix B).
Specific conductivity must be recorded in umhos/cm or uS/cm, dissolved oxygen in ppm
(mg/l), and temperature in oC. If meter readings are in other units, record the exact readings
on the RPS sheet and in the field survey form or field book and record the converted
readings.
6. Drift Check – Without post-calibration checks, the accuracy of the water parameter
measurements cannot be demonstrated. At the EFO lab, perform a drift check on each meter
at the end of the day (or at the end of the trip on multiple night trips) and record results in
the logbook (Figure 1). Drift checks can be done in the field as long as you have the proper
equipment. To check the probes have maintained their calibration for pH and conductivity,
compare the probe’s readings against the appropriate pH, and conductivity standards.
Adjust calibration if the probe is going to be used again that week. If the meter’s calibration
is off by more than 0.2 for pH or more than 10% for conductivity, all readings between the
initial calibration and the drift check must be marked as questionable (N). To check the
probes have maintained their calibration for temperature, compare the probe’s readings
against a standard ASTM thermometer. If the meter’s calibration is off by more than 0.2, all
the readings between the initial calibration and the drift check must be marked as
questionable (N). When the DO probe has been air calibrated in the field due to pressure,
elevation or temperature changes, a drift check is unnecessary at the end of the day. If the
DO probe was not re-calibrated since leaving the base office, a drift check (Winkler or air
calibration) should be performed at the end of the day. If the meter’s calibration is off by
more than 0.2 mg/L (Winkler) or 10% (air), all readings between the initial calibration and
the drift check must be marked as questionable (N). On the Rapid periphyton Survey sheets
(RPS), precede all questionable readings with an N (questionable data). If the RPS forms
have already been submitted to TDH Environmental Laboratory, notify the Planning and

Division of Water Pollution Control
QSSOP for Periphyton Stream Surveys
Effective Date: January 2010
Section I.I, Protocol D: Page 4 of 4
Standards Section in writing (e-mail or fax) of questionable readings so they may be noted in
the Water Quality Database.
7. Other Parameters – some multi-parameter probes contain sensors for other water quality
parameters such as turbidity or suspended solids. If these parameters are also measured,
they should be calibrated following manufacturer’s specifications prior to use with drift
checks performed at the end of each day. Duplicate measurements should be taken at each
site and recorded on the RPS sheet.

Division of Water Pollution Control
QSSOP for Periphyton Stream Surveys
Effective Date: January 2010
Section I.I, Protocol E: Page 1 of 5
Protocol E – Habitat Assessment
Biologist/Environmental Specialist
Please note that a Standard Operating Procedure manual for Habitat Assessments will be
published in 2010. When that document is published, it will supersede this protocol.
Conduct a habitat assessment any time a biological sample is collected. Use habitat data sheets
finalized in Rapid Bioassessment Protocols for Use in Wadeable Streams and Rivers (Barbour
et. al., 1999) to evaluate the integrity of the habitat at each site (Appendix B). When possible,
two or more investigators should collaborate on habitat assessments to reduce the potential for
individual bias.
Two different habitat assessment sheets will be used dependent on the ecoregion and/or stream
type. (For habitat assessments, it does not matter if the upstream watershed is contained in the
same bioregion). In order for the site to be compared to the habitat guidelines (Table 9), the
assessment sheet used will depend on the ecoregion. Information on ecoregion boundaries can
be found in the Tennessee Ecoregion Project (Arnwine et al, 2000). Each Environmental Field
Office should have copies of ecoregion maps for their area. The Planning and Standards section
should be contacted if there is uncertainty about what ecoregion a stream is located in.
In ecoregions 65j, 66d, 66e, 66f, 66g, 67f, 67g, 67h, 67i, 68a, 68b, 68c, 69d, 71e, 71f, 71g, 71h,
and 74a as well as riffle streams in 71i, use the High Gradient Stream (formerly Riffle-Run)
assessment sheet to evaluate habitat based on the guidelines in Table 9. Note that the guidelines
cannot be used in non-riffle streams in these ecoregions. Therefore, a suitable upstream or
watershed reference must be selected for comparison in non-riffle streams.
In ecoregions 65a, 65b, 65e, 65i, 73a, and 74b as well as non-riffle steams in 71i, use the Low
Gradient (formerly Glide-Pool) assessment sheet. Copies of these sheets are located in
Appendix B.
Evaluate all ten habitat parameters. Base score on a scale of 0 to 20 for each parameter, with 20
being the highest attainable score. Scores are divided into four categories (optimal, suboptimal,
marginal and poor) with a range of five scores possible in each category. Specific guidance for
scoring is located on the habitat sheets (Appendix B). The parameters that are evaluated in each
sample reach are:
1. Epifaunal Substrate/Available Cover (high and low gradient streams)
Estimate the relative quantity and variety of natural structures in the stream such as cobble
riffles, large rocks, fallen trees, logs and branches, and undercut banks that are available as
refugia, feeding, spawning or nursery functions for macroinvertebrates and fish. Do not
count “newly” fallen trees and unstable habitats.
Division of Water Pollution Control
QSSOP for Periphyton Stream Surveys
Effective Date: January 2010
Section I.I, Protocol E: Page 2 of 5
2a. Embeddedness (high gradient streams)
Estimate the percent that rocks (gravel, cobble, and boulders) and snags are covered or
sunken into the silt, sand, or mud of the stream bottom. To avoid confusion with sediment
deposition (another habitat parameter), observations of embeddedness should be taken in
the upstream and central portions of riffles and cobble substrate areas.
2b. Pool Substrate Characterization (Low gradient)
Evaluate the type and condition of the bottom substrate in the pools. Firmer sediment such
as gravel and sand, and rooted aquatic plants support a wider variety of organisms and
should be scored higher than a pool substrate dominated by mud or bedrock with no
plants. In addition, a stream that has a uniform substrate will support fewer types of
organisms and should score lower than a stream that has a variety of substrate types.
3a. Velocity/Depth Combinations (high gradient)
Determine the patterns of velocity and depth. The four basic patterns are slow-deep, slow-
shallow, fast-deep, and fast-shallow. The best streams will have all four patterns present.
The general guidelines are 0.5 meter depth to separate shallow from deep and 0.3 m/sec to
separate fast from slow.
3b. Pool Variability (low gradient)
Rate the overall mixture of pool types found in the stream, according to size and depth.
The four basic types of pools are large-shallow, large-deep, small-shallow, and small-deep.
A stream having many different pool types will support a wider variety of aquatic species
and should score higher. General guidelines are any pool dimension (length, width,
oblique) greater than half the cross-section of the stream for separating large from small
and 1 meter depth separating shallow and deep.
4. Sediment Deposition (high and low gradient)
Estimate the amount of sediment deposition. This is observable through the formation of
islands, point bars (areas of increased deposition at the beginning of a meander that
increase in size as the channel is diverted toward the outer bank) or shoals. Determine
whether pools and runs are filling in. Usually deposition is evident in areas that are
obstructed by natural or manmade debris and areas where the stream flow decreases, such
as bends or pools.
Division of Water Pollution Control
QSSOP for Periphyton Stream Surveys
Effective Date: January 2010
Section I.I, Protocol E: Page 3 of 5
5. Channel Flow Status (high and low gradient)
Estimate the degree to which the channel is filled with water. When water does not cover
much of the streambed, the amount of suitable substrate for aquatic organisms is limited
and the stream should score lower.
6. Channel Alteration (high and low gradient)
Determine how much, if at all, the stream has been altered. Channel alteration is present
when artificial embankments, riprap, and other forms of artificial bank stabilization or
structures are present; when the stream is very straight for significant distances; when
dams and bridges are present; when dredging or gravel removal is evident and when other
such artificial changes have occurred. Scouring is often associated with channel alteration.
7a. Frequency of Riffles or Bends (high gradient)
Determine the pattern of stream morphology by estimating the sequencing of riffles. In
high gradient streams where distinct riffles are uncommon, a run/bend ratio can be used as
a measure of meandering or sinuosity. In headwaters, riffles are usually continuous and
the presence of cascades or boulders provides a form of sinuosity. To determine this
parameter, a longer segment or reach than that designated for sampling should be
incorporated into the evaluation.
7b. Channel Sinuosity (low gradient)
Evaluate the meandering or sinuosity of the stream. A high degree of sinuosity provides
diverse habitat for macroinvertebrates and the stream is better able to handle surges when
the flow fluctuates due to rain events. To estimate this parameter, a longer segment or
reach than that designated for sampling should be incorporated into the evaluation. (This
will vary by site, but should include at least two bends).
8. Bank Stability (high and low gradient)
Determine whether the stream banks are eroded or have the potential for erosion. Steep
banks are more likely to collapse and suffer from erosion than are gently sloping banks,
and are therefore considered less stable. Signs of erosion include crumbling, unvegetated
banks, exposed tree roots, and exposed soil. Each bank is evaluated separately on a scale
of 0 to 10 and the cumulative score of both banks is used for this parameter. (This
parameter should be evaluated within the 100-meter sample reach.)
Division of Water Pollution Control
QSSOP for Periphyton Stream Surveys
Effective Date: January 2010
Section I.I, Protocol E: Page 4 of 5
9. Bank Vegetative Protection (high and low gradient)
Determine the amount of vegetative protection afforded to the stream bank and near-
stream portion of the riparian zone. The object is to determine the ability of the bank to
resist erosion as well as the ability of the plants to uptake nutrients, control instream
scouring, supply food to shredders and provide stream shading. Streams that have various
types (shrubs, trees etc.) of native vegetation providing full natural plant growth will score
highest. In some regions, the introduction of exotics, such as kudzu, has virtually replaced
all native vegetation. The value of exotic vegetation to the quality of the habitat structure
and contribution to the stream ecosystem should be evaluated, generally resulting in a
lower score. Each bank is evaluated separately on a scale of 0 to 10 and the cumulative
score of both banks is used for this parameter. (This parameter should be evaluated within
the 100-meter sample reach.)
10. Riparian Vegetative Zone Width (high and low gradient)
Estimate the width of natural vegetation from the edge of the stream bank out through the
riparian zone (approximately 18 meters). Disturbance to the riparian zone occurs when
roads, parking lots, fields, lawns, bare soil, or buildings are near the stream bank.
Residential developments, urban centers, golf courses, pastures and row crops are common
causes of degradation of the riparian zone. However, the presence of old fields (previously
grazed fields, not currently in use), paths, and walkways in an otherwise undisturbed
riparian zone may be judged to be inconsequential to altering the riparian zone and may be
given relatively high scores. Each bank is evaluated separately on a scale of 0 to 10 and
the cumulative score of both banks is used for this parameter. (This parameter should be
evaluated within the 100-meter sample reach.)
Total the 10 habitat parameters and compare the score to the Habitat Assessment
Guidelines (Table 1) to determine whether the habitat is capable of supporting a healthy
benthic community. Note that habitat scores in five ecoregions (68a, 68b, 68c, 69d and
71i) vary by season.
Sometimes it may be useful to evaluate individual parameters in addition to the total
habitat score. For example even if the total habitat score meets regional guidelines, the
individual parameters of embeddedness and sediment deposition may be low indicating a
problem with sedimentation. Likewise, there may be a problem with riparian removal
even though habitat scores meet regional guidelines. On the other hand, a low total score
may not indicate a habitat problem if the channel flow status and velocity depth regime
score low in a region where reference streams have extremely reduced flow during the
summer and fall. Appendix A provides ecoregion specific expectations for each parameter
on the Habitat guidelines form.
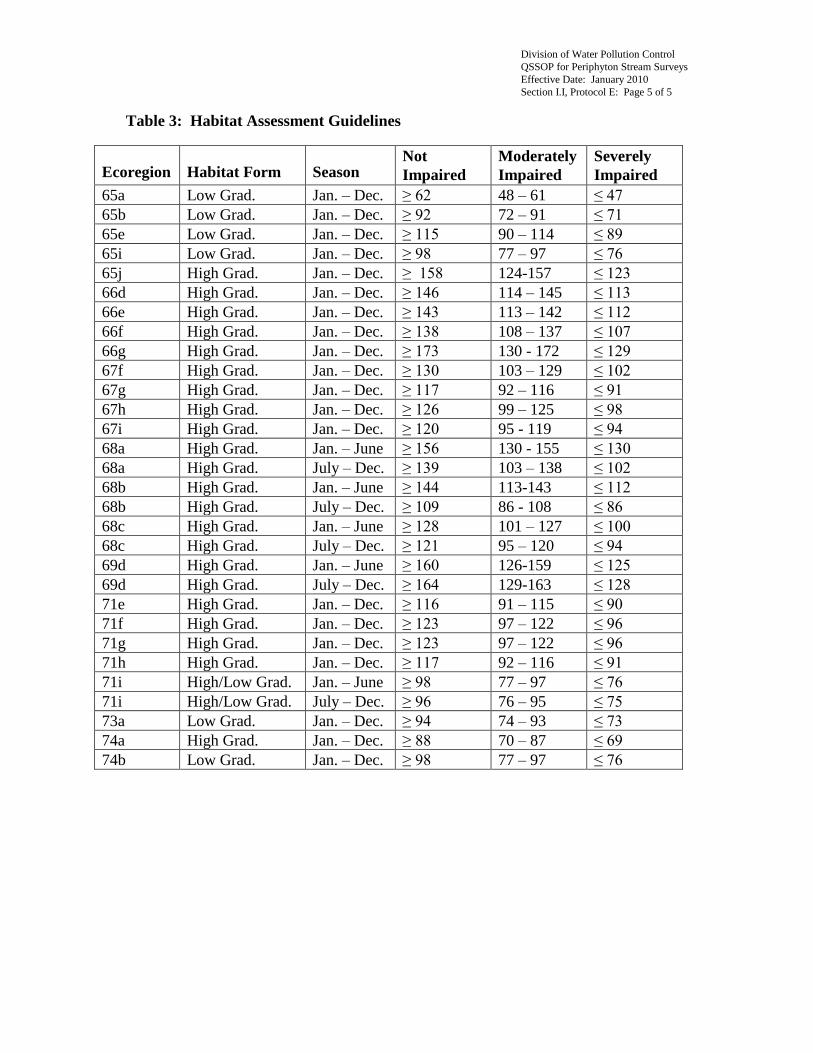
Division of Water Pollution Control
QSSOP for Periphyton Stream Surveys
Effective Date: January 2010
Section I.I, Protocol E: Page 5 of 5
Table 3: Habitat Assessment Guidelines
Ecoregion Habitat Form Season Not
Impaired
Moderately
Impaired
Severely
Impaired
65a Low Grad. Jan. – Dec. ≥ 62 48 – 61 ≤ 47
65b Low Grad. Jan. – Dec. ≥ 92 72 – 91 ≤ 71
65e Low Grad. Jan. – Dec. ≥ 115 90 – 114 ≤ 89
65i Low Grad. Jan. – Dec. ≥ 98 77 – 97 ≤ 76
65j High Grad. Jan. – Dec. ≥ 158 124-157 ≤ 123
66d High Grad. Jan. – Dec. ≥ 146 114 – 145 ≤ 113
66e High Grad. Jan. – Dec. ≥ 143 113 – 142 ≤ 112
66f High Grad. Jan. – Dec. ≥ 138 108 – 137 ≤ 107
66g High Grad. Jan. – Dec. ≥ 173 130 - 172 ≤ 129
67f High Grad. Jan. – Dec. ≥ 130 103 – 129 ≤ 102
67g High Grad. Jan. – Dec. ≥ 117 92 – 116 ≤ 91
67h High Grad. Jan. – Dec. ≥ 126 99 – 125 ≤ 98
67i High Grad. Jan. – Dec. ≥ 120 95 - 119 ≤ 94
68a High Grad. Jan. – June ≥ 156 130 - 155 ≤ 130
68a High Grad. July – Dec. ≥ 139 103 – 138 ≤ 102
68b High Grad. Jan. – June ≥ 144 113-143 ≤ 112
68b High Grad. July – Dec. ≥ 109 86 - 108 ≤ 86
68c High Grad. Jan. – June ≥ 128 101 – 127 ≤ 100
68c High Grad. July – Dec. ≥ 121 95 – 120 ≤ 94
69d High Grad. Jan. – June ≥ 160 126-159 ≤ 125
69d High Grad. July – Dec. ≥ 164 129-163 ≤ 128
71e High Grad. Jan. – Dec. ≥ 116 91 – 115 ≤ 90
71f High Grad. Jan. – Dec. ≥ 123 97 – 122 ≤ 96
71g High Grad. Jan. – Dec. ≥ 123 97 – 122 ≤ 96
71h High Grad. Jan. – Dec. ≥ 117 92 – 116 ≤ 91
71i High/Low Grad. Jan. – June ≥ 98 77 – 97 ≤ 76
71i High/Low Grad. July – Dec. ≥ 96 76 – 95 ≤ 75
73a Low Grad. Jan. – Dec. ≥ 94 74 – 93 ≤ 73
74a High Grad. Jan. – Dec. ≥ 88 70 – 87 ≤ 69
74b Low Grad. Jan. – Dec. ≥ 98 77 – 97 ≤ 76
Division of Water Pollution Control
QSSOP for Periphyton Stream Surveys
Effective Date: January 2010
Section I.I, Protocol F: Page 1 of 4
Protocol F – Rapid Periphyton Survey (RPS)
Biologist/Environmental Specialist
Every time periphyton sampling occurs, the sampler will need to complete a Rapid Periphyton
Survey and a Multi-habitat Periphyton Sample (See Protocol G.) Completely fill out the front of
the Rapid Periphyton Survey Data Sheet (Appendix B). Complete header information: Station
ID, Sampler, and assign a log number. The back is not necessary if a Stream Survey Form (used
for macroinvertebrates stream surveys) has been filled out, otherwise complete this form also.
Add additional information not included on the sheet as needed. Only use the version provided
in Appendix B. Earlier versions should no longer be used. Consult all personnel present during
sampling for additional observations that may have been overlooked before leaving the site.
Front of RPS Data Sheet:
On the front of the Rapid Periphyton Survey Data Sheet is a form for recording algal biomass,
canopy cover, and the habitats that were sampled for the MPS. This method has been adapted
from EPA’s Rapid Bioassessment Protocols for Use in Wadeable Streams and Rivers (1999).
1. Establish five transects across each stream reach. Target locations of likely algal growth
(riffles and runs) if available. Avoid shaded areas if possible. Space transects to span full
length of the reach.
2. Along each transect, observe 10 evenly spaced points. If the stream is not wide enough to
observe 10 points (<1.5 m), observe as many points as possible and note the number of points
observed and the reason in the comment field.
3. The Rapid Periphyton Survey Board is a 15 cm by 15 cm square of Plexiglas that has been
divided into quadrants (see Figure 2). At each point on the transect, use the Rapid Periphyton
Survey Board to estimate moss cover, macroalgal cover and microalgal biofilm thickness using
the classification system defined in Table 4. The coverage class (0-5) for moss and macroalgae
and the biofilm thickness (0-5) is to be recorded in the appropriate column beside the selected
point on the transect on the RPS.
4. Optimal substrate is defined as substrate with a diameter greater than 2 cm. Smaller
substrate is not as suitable for the growth of a stable population of algae due to scouring and
shifting. At each point on the transect, determine if the substrate is of optimal size. If the
substrate is not optimal in size for a stable periphyton population, but moss, macroalgae, and/or
microalgae are visible, score and record that information on the RPS sheet in the comments.
5. At the mid-point of each transect, take a canopy reading using a spherical densiometer. The
densiometer is a convex mirror etched into 24 ¼-inch boxes (Figure 3). Each box can be
subdivided into 4 smaller squares, via an imaginary dot in the center of the box, to create a total
of 96 smaller squares that can be counted within the entire densiometer.
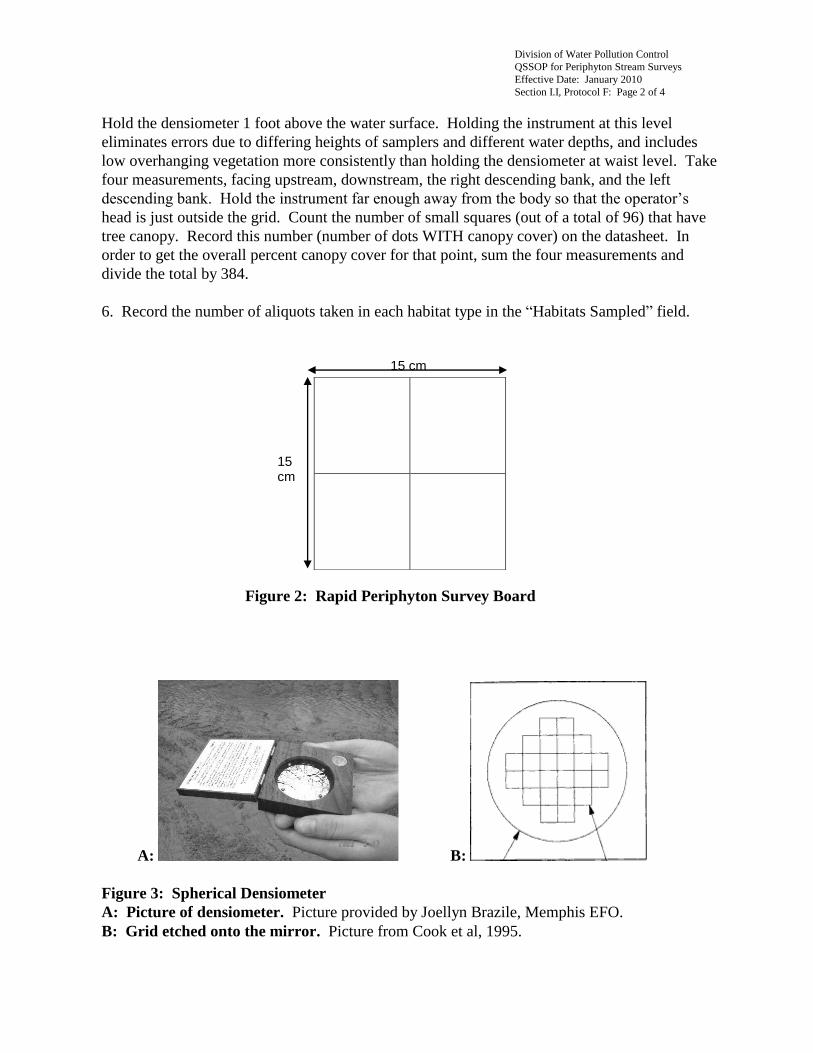
Division of Water Pollution Control
QSSOP for Periphyton Stream Surveys
Effective Date: January 2010
Section I.I, Protocol F: Page 2 of 4
15 cm
Hold the densiometer 1 foot above the water surface. Holding the instrument at this level
eliminates errors due to differing heights of samplers and different water depths, and includes
low overhanging vegetation more consistently than holding the densiometer at waist level. Take
four measurements, facing upstream, downstream, the right descending bank, and the left
descending bank. Hold the instrument far enough away from the body so that the operator’s
head is just outside the grid. Count the number of small squares (out of a total of 96) that have
tree canopy. Record this number (number of dots WITH canopy cover) on the datasheet. In
order to get the overall percent canopy cover for that point, sum the four measurements and
divide the total by 384.
6. Record the number of aliquots taken in each habitat type in the “Habitats Sampled” field.
Figure 2: Rapid Periphyton Survey Board
A: B:
Figure 3: Spherical Densiometer
A: Picture of densiometer. Picture provided by Joellyn Brazile, Memphis EFO.
B: Grid etched onto the mirror. Picture from Cook et al, 1995.
15 cm
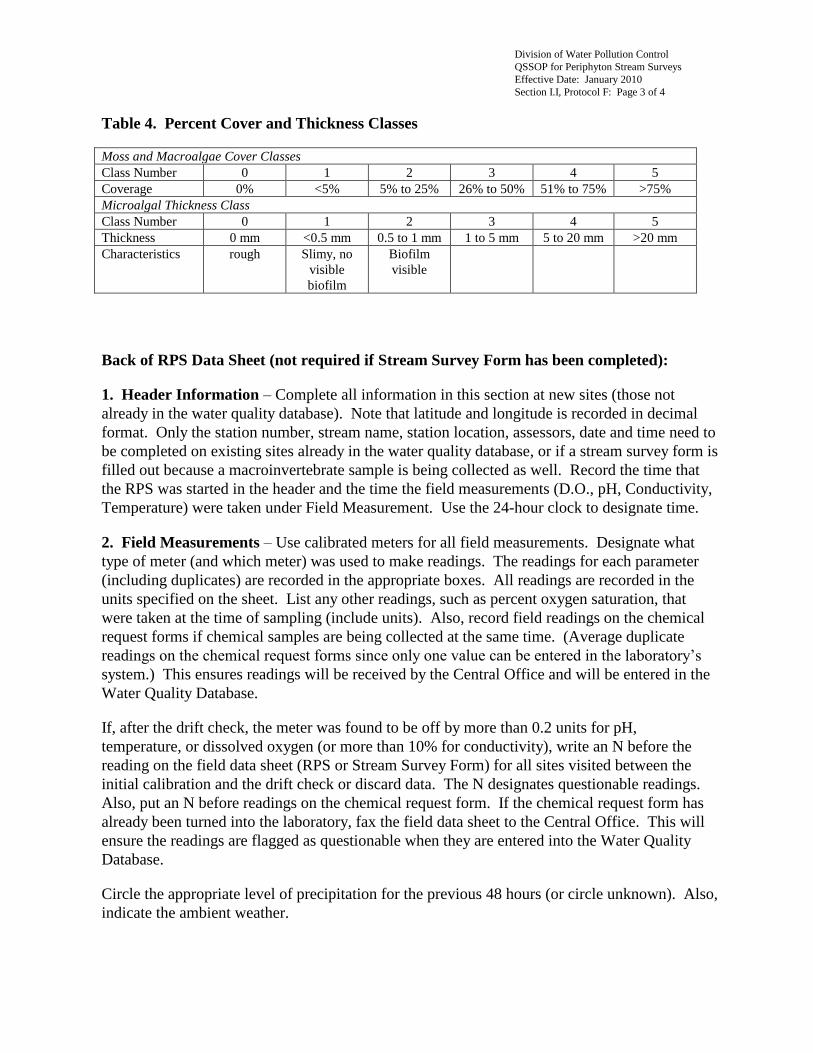
Division of Water Pollution Control
QSSOP for Periphyton Stream Surveys
Effective Date: January 2010
Section I.I, Protocol F: Page 3 of 4
Table 4. Percent Cover and Thickness Classes
Moss and Macroalgae Cover Classes
Class Number 0 1 2 3 4 5
Coverage 0% <5% 5% to 25% 26% to 50% 51% to 75% >75%
Microalgal Thickness Class
Class Number 0 1 2 3 4 5
Thickness 0 mm <0.5 mm 0.5 to 1 mm 1 to 5 mm 5 to 20 mm >20 mm
Characteristics rough Slimy, no
visible
biofilm
Biofilm
visible
Back of RPS Data Sheet (not required if Stream Survey Form has been completed):
1. Header Information – Complete all information in this section at new sites (those not
already in the water quality database). Note that latitude and longitude is recorded in decimal
format. Only the station number, stream name, station location, assessors, date and time need to
be completed on existing sites already in the water quality database, or if a stream survey form is
filled out because a macroinvertebrate sample is being collected as well. Record the time that
the RPS was started in the header and the time the field measurements (D.O., pH, Conductivity,
Temperature) were taken under Field Measurement. Use the 24-hour clock to designate time.
2. Field Measurements – Use calibrated meters for all field measurements. Designate what
type of meter (and which meter) was used to make readings. The readings for each parameter
(including duplicates) are recorded in the appropriate boxes. All readings are recorded in the
units specified on the sheet. List any other readings, such as percent oxygen saturation, that
were taken at the time of sampling (include units). Also, record field readings on the chemical
request forms if chemical samples are being collected at the same time. (Average duplicate
readings on the chemical request forms since only one value can be entered in the laboratory’s
system.) This ensures readings will be received by the Central Office and will be entered in the
Water Quality Database.
If, after the drift check, the meter was found to be off by more than 0.2 units for pH,
temperature, or dissolved oxygen (or more than 10% for conductivity), write an N before the
reading on the field data sheet (RPS or Stream Survey Form) for all sites visited between the
initial calibration and the drift check or discard data. The N designates questionable readings.
Also, put an N before readings on the chemical request form. If the chemical request form has
already been turned into the laboratory, fax the field data sheet to the Central Office. This will
ensure the readings are flagged as questionable when they are entered into the Water Quality
Database.
Circle the appropriate level of precipitation for the previous 48 hours (or circle unknown). Also,
indicate the ambient weather.
Division of Water Pollution Control
QSSOP for Periphyton Stream Surveys
Effective Date: January 2010
Section I.I, Protocol F: Page 4 of 4
3. Sediment Deposits – Circle the appropriate level of sediment deposits for the site. Also
indicate the type of sediment found there, and the level of turbidity.
4. Stream Sketch– A station sketch is made at the time of sampling. This sketch should be
detailed enough so that subsequent sampling teams or data reviewers can determine where
samples were taken and what potential sources of impairment were present. Use a separate
sheet of paper if necessary. At a minimum, the sketch should include a rough outline of stream
sinuosity, direction of flow, location of riffles and pools, location of samples (benthic,
periphyton, chemical, probe), location of bridges or any other man-made structures (include
distance from sampling point), location of tributaries, run-off ditches, discharges, livestock
access, and any other potential pollution sources. If a stream sketch has already been done on
one of the other forms there is no need to duplicate, just indicate what form it is on.
5. Additional Comments – Describe any other conditions observed at the time of sampling
(additional pages are to be used if necessary). Include any changes observed from previous
sampling efforts. Note directions to the site and any special permission or keys needed for
access. Ask other team members for input.
Division of Water Pollution Control
QSSOP for Periphyton Stream Surveys
Effective Date: January 2010
Section I.I, Protocol G: Page 1 of 3
Protocol G – Multi-habitat Periphyton Sample (MPS)
Biologist or Environmental Specialist
Every time periphyton sampling occurs, the sampler will need to complete a Rapid Periphyton
Survey (see Protocol F) and complete a Multi-habitat Periphyton Survey. There are two
different sampling methods for the Multi-habitat Periphyton Survey that are used based on
substrate type. One method is for non-sediment substrates and is the standard method of
collection. The alternative method is for substrates that are sediment/sand and is only used if no
other productive habitats are available. The number of aliquots collected using the standard
method should be proportional to the substrate types found in the stream.
1. Examine the habitat for optimal periphyton collection.
a. Standard Method
Identify target substrates where algae can be collected within arm’s length (0.5
m) of the surface.
Typical substrates include removable portions of vascular plants or mosses,
snags, roots, leaf packs, and rocks.
Substrate should be “seasoned” (not recent or “new fall”).
Substrate should be exposed to sunlight.
Every effort should be made to collect from undisturbed areas. Avoid areas of
recent walking or scouring.
Sampling should be conducted at low flow conditions, at least 1 week after high
flow events.
Equally apportion substrates into 10 aliquots.
See Table 5 for examples of aliquot apportionments.
b. Alternative Method - used for sampling in sediment (only if no other productive
habitats are available)
Identify target substrates that are representative of different sediment conditions
present along the entire reach of the stream.
Sediment condition factors to consider: Erosional, depositional, current velocity,
and sunlight exposure.
Only consider sediment areas that are within arm’s length (0.5m) of the surface.
Every effort should be made to collect from undisturbed areas. Avoid areas of
recent walking or scouring.
Sampling should be conducted at low flow conditions, at least 1 week after high
flow events.
Equally apportion substrates into 10 aliquots.
Division of Water Pollution Control
QSSOP for Periphyton Stream Surveys
Effective Date: January 2010
Section I.I, Protocol G: Page 2 of 3
2. Collect Sample
a. Standard Method (Scrape)
Fill the 500 mL wide mouth sample jar with site water to 100 mL fill mark.
Carefully remove target substrate from water (must break or cut, so select smaller
snags, removable roots, etc.) Do not limit rock size to sample jar diameter.
Remove algae from substrate.
Using fingers, rub substrate surface in the 100 mL of site water.
The amount of surface area rubbed should be approximately 9 cm in diameter.
Use mouth of 500 mL sample jar to estimate.
Rub the entire substrate surface a minimum of three times to ensure algae
removal.
Rinse fingers in the jar.
Discard substrate.
Take 2 sub-samples and composite into the 125 mL amber sample bottle.
- Stir well to homogenize periphyton in the 100 mL slurry.
- Remove first 2 mL subsample with a disposable pipette and transfer into
sample bottle. The pipette needs to be completely filled.
- Repeat stirring procedure in 100 mL slurry.
- Remove second 2 mL subsample with pipette and transfer into sample
bottle.
b. Alternative Method (Syringe)
At the selected sample point, pull the plunger of the syringe core back to the 3
cm mark (15 mL) and insert the open end of the syringe core into the surface of
the sediment until the core is level with the sediment surface.
Try to be extremely delicate, so that the overlying sediment will be disturbed as
little as possible.
Slide the spatula through the sediment to cover the opening of the syringe core.
Remove the syringe core and spatula together, and invert positioning so that the
spatula is on top of the syringe core opening.
Using the plunger, push sample into the 500 mL wide-mouth sample jar.
Repeat the previous steps until all of the sediment samples are collected and
contained in the 500 mL wide-mouth sample jar.
Use the measuring spoon (tablespoon) to homogenize the sample in the beaker
until the sediment is consistent in color and texture throughout.
Using the tablespoon, remove 1 flat spoonful of sediment and place into the
125 mL opaque amber plastic wide-mouth sample bottle.
Place enough water in the sample bottle so that the sediment is submerged.
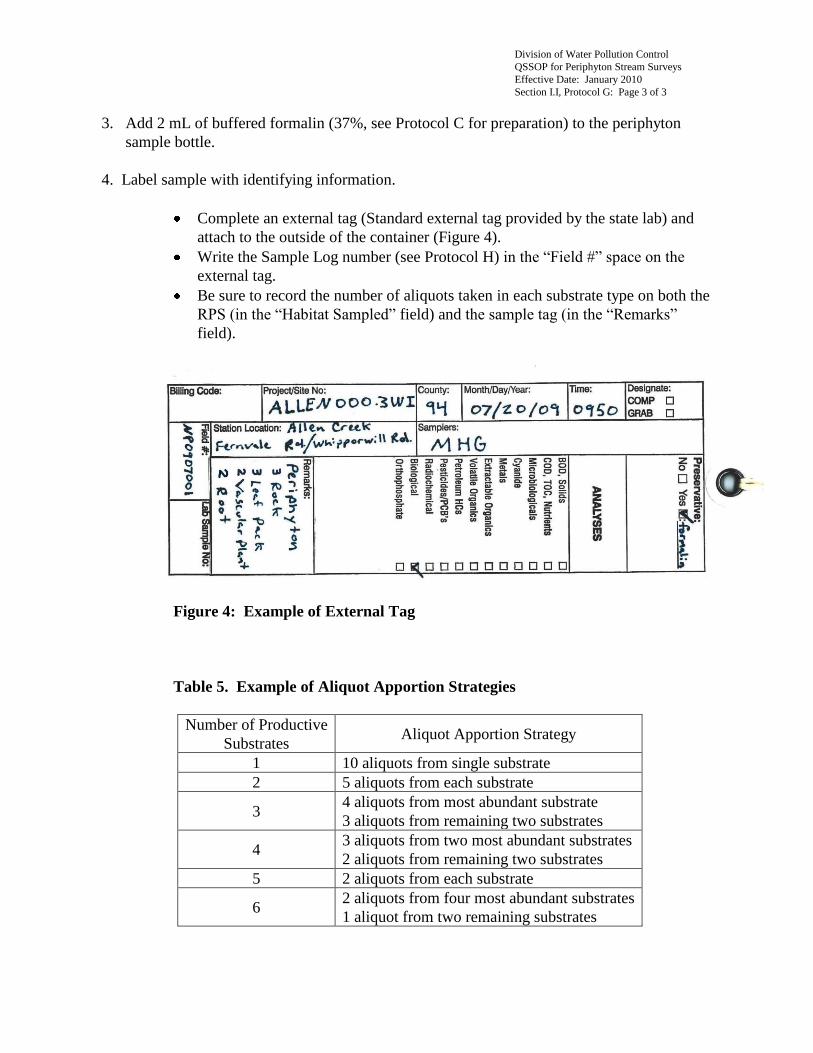
Division of Water Pollution Control
QSSOP for Periphyton Stream Surveys
Effective Date: January 2010
Section I.I, Protocol G: Page 3 of 3
3. Add 2 mL of buffered formalin (37%, see Protocol C for preparation) to the periphyton
sample bottle.
4. Label sample with identifying information.
Complete an external tag (Standard external tag provided by the state lab) and
attach to the outside of the container (Figure 4).
Write the Sample Log number (see Protocol H) in the “Field #” space on the
external tag.
Be sure to record the number of aliquots taken in each substrate type on both the
RPS (in the “Habitat Sampled” field) and the sample tag (in the “Remarks”
field).
Figure 4: Example of External Tag
Table 5. Example of Aliquot Apportion Strategies
Number of Productive
Substrates Aliquot Apportion Strategy
1 10 aliquots from single substrate
2 5 aliquots from each substrate
3 4 aliquots from most abundant substrate
3 aliquots from remaining two substrates
4 3 aliquots from two most abundant substrates
2 aliquots from remaining two substrates
5 2 aliquots from each substrate
6 2 aliquots from four most abundant substrates
1 aliquot from two remaining substrates
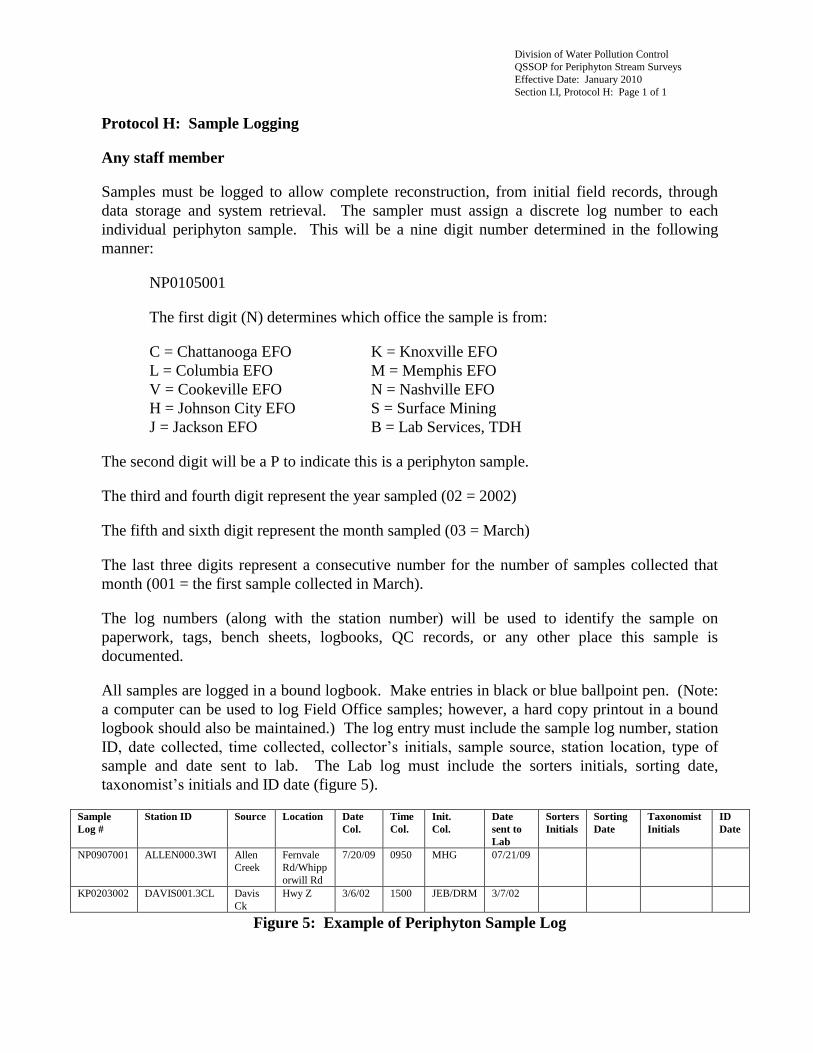
Division of Water Pollution Control
QSSOP for Periphyton Stream Surveys
Effective Date: January 2010
Section I.I, Protocol H: Page 1 of 1
Protocol H: Sample Logging
Any staff member
Samples must be logged to allow complete reconstruction, from initial field records, through
data storage and system retrieval. The sampler must assign a discrete log number to each
individual periphyton sample. This will be a nine digit number determined in the following
manner:
NP0105001
The first digit (N) determines which office the sample is from:
C = Chattanooga EFO K = Knoxville EFO
L = Columbia EFO M = Memphis EFO
V = Cookeville EFO N = Nashville EFO
H = Johnson City EFO S = Surface Mining
J = Jackson EFO B = Lab Services, TDH
The second digit will be a P to indicate this is a periphyton sample.
The third and fourth digit represent the year sampled (02 = 2002)
The fifth and sixth digit represent the month sampled (03 = March)
The last three digits represent a consecutive number for the number of samples collected that
month (001 = the first sample collected in March).
The log numbers (along with the station number) will be used to identify the sample on
paperwork, tags, bench sheets, logbooks, QC records, or any other place this sample is
documented.
All samples are logged in a bound logbook. Make entries in black or blue ballpoint pen. (Note:
a computer can be used to log Field Office samples; however, a hard copy printout in a bound
logbook should also be maintained.) The log entry must include the sample log number, station
ID, date collected, time collected, collector’s initials, sample source, station location, type of
sample and date sent to lab. The Lab log must include the sorters initials, sorting date,
taxonomist’s initials and ID date (figure 5).
Sample
Log #
Station ID Source Location Date
Col.
Time
Col.
Init.
Col.
Date
sent to
Lab
Sorters
Initials
Sorting
Date
Taxonomist
Initials
ID
Date
NP0907001 ALLEN000.3WI Allen
Creek
Fernvale
Rd/Whipp
orwill Rd
7/20/09 0950 MHG 07/21/09
KP0203002 DAVIS001.3CL Davis
Ck
Hwy Z 3/6/02 1500 JEB/DRM 3/7/02
Figure 5: Example of Periphyton Sample Log
Division of Water Pollution Control
QSSOP for Periphyton Stream Surveys
Effective Date: January 2010
Section I.I, Protocol I: Page 1 of 2
Protocol I - Taxonomy of Periphyton Samples
Laboratory biologist or contractor with demonstrated expertise in periphyton taxonomy
All Periphyton samples are to be sent to the central lab for analysis. This is to be coordinated
through the Planning and Standards Section.
1. The concentrated preserved periphyton sample will be divided for analysis. A 10mL
subsample will be analyzed for non-diatom algae, and a separate 10 mL subsample will be
analyzed for diatoms.
a. Non-diatom (―Soft‖) Algae Relative Abundance and Taxa Richness
1. Homogenize the subsample with a tissue homogenizer or blender.
2. Thoroughly mix the homogenized subsample and pipette into a calibrated (known
volume) counting chamber for quantitative counting of cells, such as a Nannoplankton
chamber or a Palmer-Maloney Counting Cell or other.
3. Fill in the top portion of the Non-diatom Algae Taxonomic Bench Sheet for “soft” algae
(Appendix B).
4. Identify and count 300 algal “cell units” to the lowest possible taxonomic level at 400x
magnification.
“Cell units” for coenocytic algae or filamentous algae can be defined as 10 µm
sections of the thallus or filament.
In the non-diatom subsample, count only live diatoms. Identify these only to
phylum; do not identify diatoms to a lower taxonomic level.
Record numbers of cells or cell units observed for each taxon on the bench sheet
Make taxonomic notes and drawings on bench sheets of important specimens.
5. Relative abundances of “soft” algae are determined by dividing the number of cells (cell
units) counted for each taxon by the number of cells counted (e.g., 300). Enter this
information on the Non-diatom Algae Taxonomic Bench Sheet (Appendix B).
6. Measure the linear dimensions of the first 25 cell units of each taxon found. To calculate
biovolume, use the median of those 25 linear dimensions. If fewer than 25 cell units are
found for that taxon, then measure all cell units.
7. Use the tables in Appendix E to calculate biovolume for each taxon. Enter this
information on the Non-diatom Algae Taxonomic Bench Sheet (Appendix B).
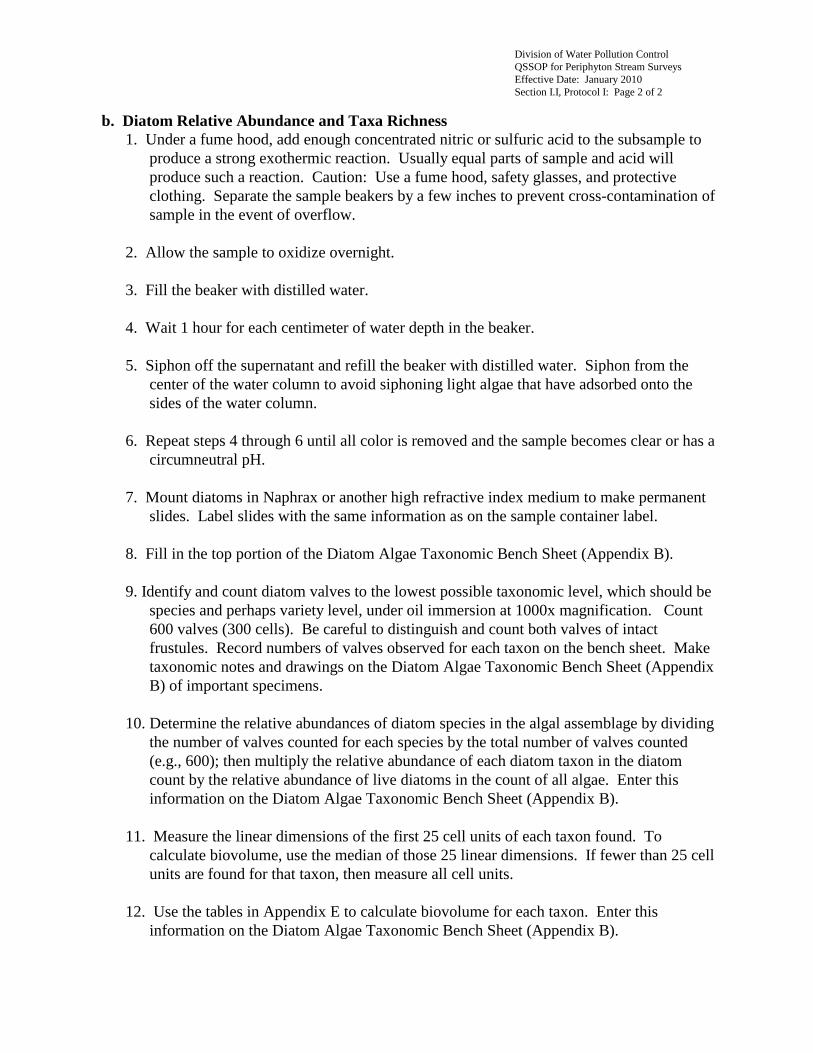
Division of Water Pollution Control
QSSOP for Periphyton Stream Surveys
Effective Date: January 2010
Section I.I, Protocol I: Page 2 of 2
b. Diatom Relative Abundance and Taxa Richness
1. Under a fume hood, add enough concentrated nitric or sulfuric acid to the subsample to
produce a strong exothermic reaction. Usually equal parts of sample and acid will
produce such a reaction. Caution: Use a fume hood, safety glasses, and protective
clothing. Separate the sample beakers by a few inches to prevent cross-contamination of
sample in the event of overflow.
2. Allow the sample to oxidize overnight.
3. Fill the beaker with distilled water.
4. Wait 1 hour for each centimeter of water depth in the beaker.
5. Siphon off the supernatant and refill the beaker with distilled water. Siphon from the
center of the water column to avoid siphoning light algae that have adsorbed onto the
sides of the water column.
6. Repeat steps 4 through 6 until all color is removed and the sample becomes clear or has a
circumneutral pH.
7. Mount diatoms in Naphrax or another high refractive index medium to make permanent
slides. Label slides with the same information as on the sample container label.
8. Fill in the top portion of the Diatom Algae Taxonomic Bench Sheet (Appendix B).
9. Identify and count diatom valves to the lowest possible taxonomic level, which should be
species and perhaps variety level, under oil immersion at 1000x magnification. Count
600 valves (300 cells). Be careful to distinguish and count both valves of intact
frustules. Record numbers of valves observed for each taxon on the bench sheet. Make
taxonomic notes and drawings on the Diatom Algae Taxonomic Bench Sheet (Appendix
B) of important specimens.
10. Determine the relative abundances of diatom species in the algal assemblage by dividing
the number of valves counted for each species by the total number of valves counted
(e.g., 600); then multiply the relative abundance of each diatom taxon in the diatom
count by the relative abundance of live diatoms in the count of all algae. Enter this
information on the Diatom Algae Taxonomic Bench Sheet (Appendix B).
11. Measure the linear dimensions of the first 25 cell units of each taxon found. To
calculate biovolume, use the median of those 25 linear dimensions. If fewer than 25 cell
units are found for that taxon, then measure all cell units.
12. Use the tables in Appendix E to calculate biovolume for each taxon. Enter this
information on the Diatom Algae Taxonomic Bench Sheet (Appendix B).
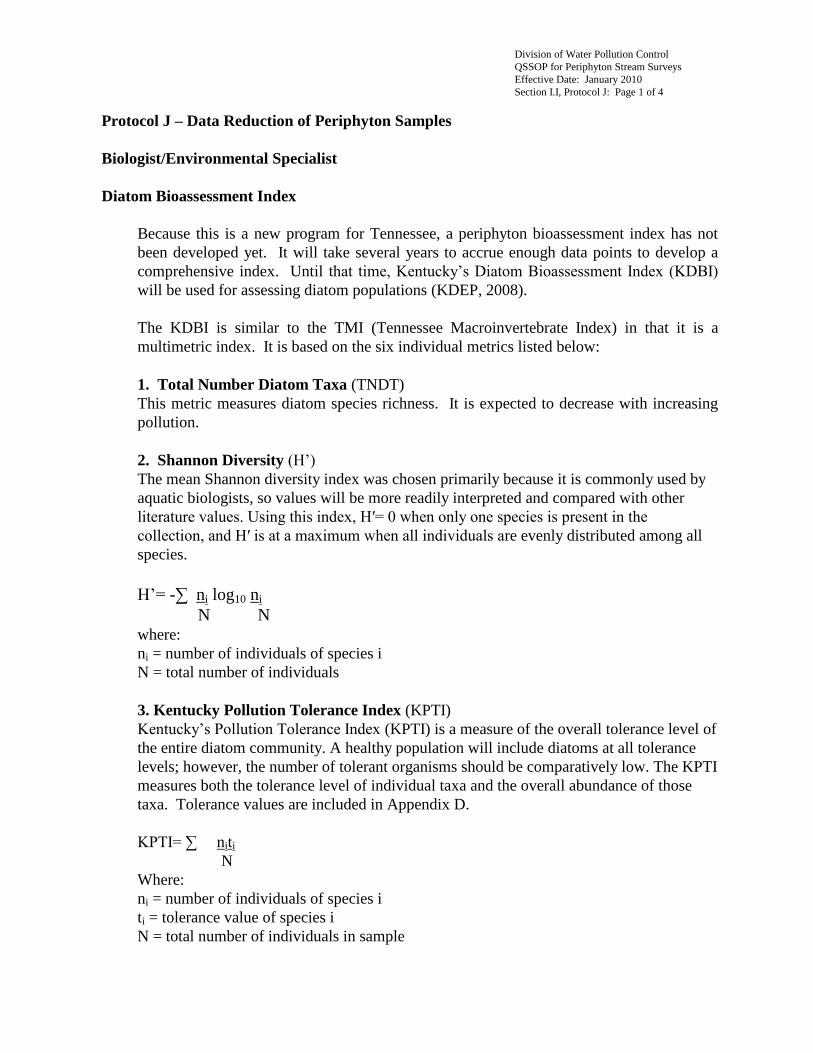
Division of Water Pollution Control
QSSOP for Periphyton Stream Surveys
Effective Date: January 2010
Section I.I, Protocol J: Page 1 of 4
Protocol J – Data Reduction of Periphyton Samples
Biologist/Environmental Specialist
Diatom Bioassessment Index
Because this is a new program for Tennessee, a periphyton bioassessment index has not
been developed yet. It will take several years to accrue enough data points to develop a
comprehensive index. Until that time, Kentucky’s Diatom Bioassessment Index (KDBI)
will be used for assessing diatom populations (KDEP, 2008).
The KDBI is similar to the TMI (Tennessee Macroinvertebrate Index) in that it is a
multimetric index. It is based on the six individual metrics listed below:
1. Total Number Diatom Taxa (TNDT)
This metric measures diatom species richness. It is expected to decrease with increasing
pollution.
2. Shannon Diversity (H’)
The mean Shannon diversity index was chosen primarily because it is commonly used by
aquatic biologists, so values will be more readily interpreted and compared with other
literature values. Using this index, H′= 0 when only one species is present in the
collection, and H′ is at a maximum when all individuals are evenly distributed among all
species.
H’= -∑ ni log10 ni
N N where:
ni = number of individuals of species i
N = total number of individuals
3. Kentucky Pollution Tolerance Index (KPTI)
Kentucky’s Pollution Tolerance Index (KPTI) is a measure of the overall tolerance level of
the entire diatom community. A healthy population will include diatoms at all tolerance
levels; however, the number of tolerant organisms should be comparatively low. The KPTI
measures both the tolerance level of individual taxa and the overall abundance of those
taxa. Tolerance values are included in Appendix D.
KPTI= ∑ niti
N
Where:
ni = number of individuals of species i
ti = tolerance value of species i
N = total number of individuals in sample
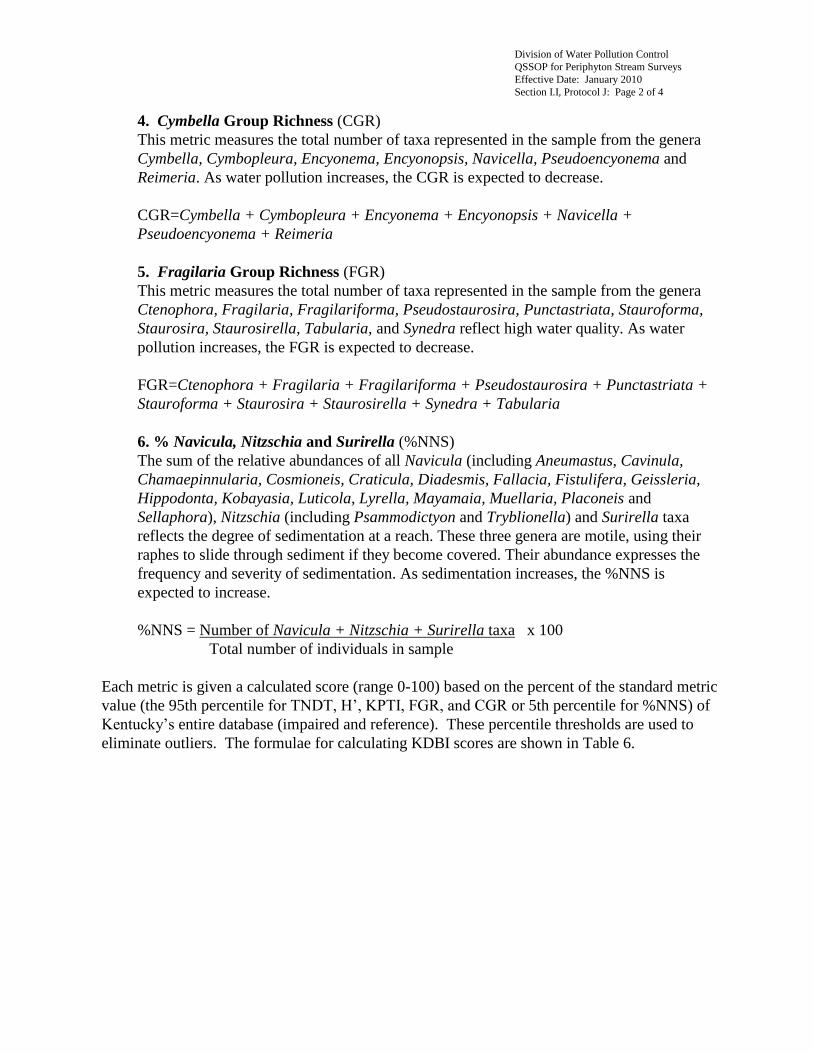
Division of Water Pollution Control
QSSOP for Periphyton Stream Surveys
Effective Date: January 2010
Section I.I, Protocol J: Page 2 of 4
4. Cymbella Group Richness (CGR)
This metric measures the total number of taxa represented in the sample from the genera
Cymbella, Cymbopleura, Encyonema, Encyonopsis, Navicella, Pseudoencyonema and
Reimeria. As water pollution increases, the CGR is expected to decrease.
CGR=Cymbella + Cymbopleura + Encyonema + Encyonopsis + Navicella +
Pseudoencyonema + Reimeria
5. Fragilaria Group Richness (FGR)
This metric measures the total number of taxa represented in the sample from the genera
Ctenophora, Fragilaria, Fragilariforma, Pseudostaurosira, Punctastriata, Stauroforma,
Staurosira, Staurosirella, Tabularia, and Synedra reflect high water quality. As water
pollution increases, the FGR is expected to decrease.
FGR=Ctenophora + Fragilaria + Fragilariforma + Pseudostaurosira + Punctastriata +
Stauroforma + Staurosira + Staurosirella + Synedra + Tabularia
6. % Navicula, Nitzschia and Surirella (%NNS)
The sum of the relative abundances of all Navicula (including Aneumastus, Cavinula,
Chamaepinnularia, Cosmioneis, Craticula, Diadesmis, Fallacia, Fistulifera, Geissleria,
Hippodonta, Kobayasia, Luticola, Lyrella, Mayamaia, Muellaria, Placoneis and
Sellaphora), Nitzschia (including Psammodictyon and Tryblionella) and Surirella taxa
reflects the degree of sedimentation at a reach. These three genera are motile, using their
raphes to slide through sediment if they become covered. Their abundance expresses the
frequency and severity of sedimentation. As sedimentation increases, the %NNS is
expected to increase.
%NNS = Number of Navicula + Nitzschia + Surirella taxa x 100
Total number of individuals in sample
Each metric is given a calculated score (range 0-100) based on the percent of the standard metric
value (the 95th percentile for TNDT, H’, KPTI, FGR, and CGR or 5th percentile for %NNS) of
Kentucky’s entire database (impaired and reference). These percentile thresholds are used to
eliminate outliers. The formulae for calculating KDBI scores are shown in Table 6.
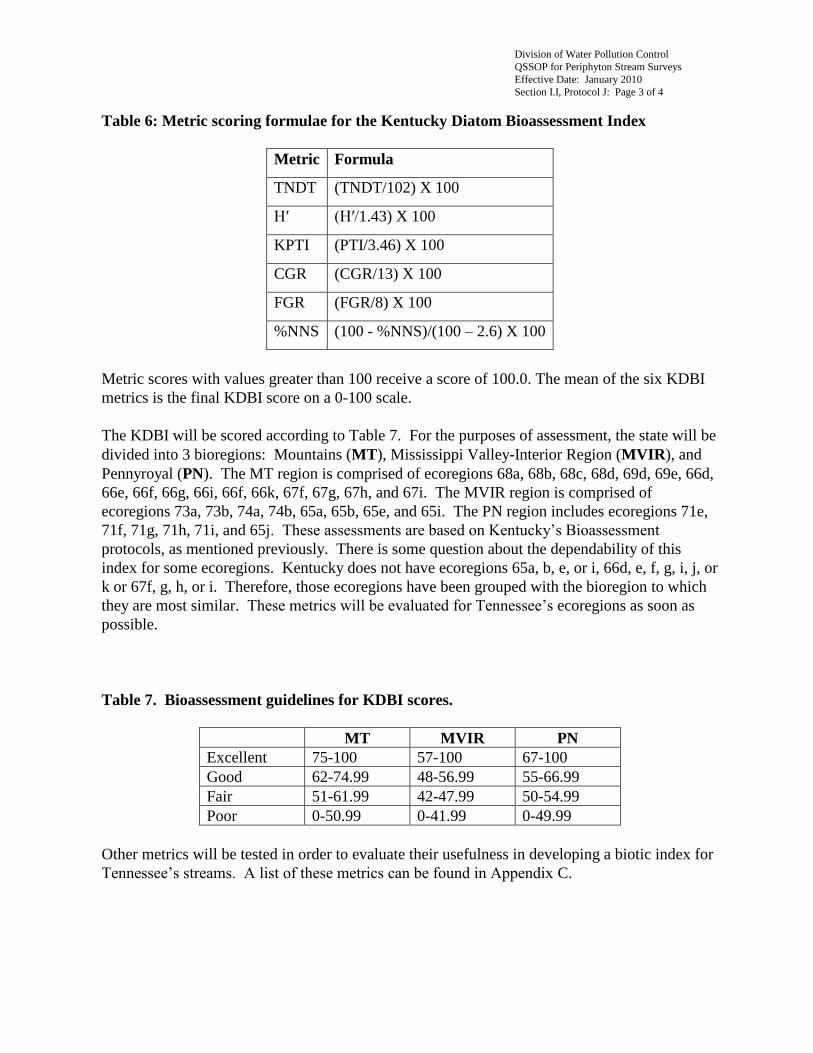
Division of Water Pollution Control
QSSOP for Periphyton Stream Surveys
Effective Date: January 2010
Section I.I, Protocol J: Page 3 of 4
Table 6: Metric scoring formulae for the Kentucky Diatom Bioassessment Index
Metric Formula
TNDT (TNDT/102) X 100
H′ (H′/1.43) X 100
KPTI (PTI/3.46) X 100
CGR (CGR/13) X 100
FGR (FGR/8) X 100
%NNS (100 - %NNS)/(100 – 2.6) X 100
Metric scores with values greater than 100 receive a score of 100.0. The mean of the six KDBI
metrics is the final KDBI score on a 0-100 scale.
The KDBI will be scored according to Table 7. For the purposes of assessment, the state will be
divided into 3 bioregions: Mountains (MT), Mississippi Valley-Interior Region (MVIR), and
Pennyroyal (PN). The MT region is comprised of ecoregions 68a, 68b, 68c, 68d, 69d, 69e, 66d,
66e, 66f, 66g, 66i, 66f, 66k, 67f, 67g, 67h, and 67i. The MVIR region is comprised of
ecoregions 73a, 73b, 74a, 74b, 65a, 65b, 65e, and 65i. The PN region includes ecoregions 71e,
71f, 71g, 71h, 71i, and 65j. These assessments are based on Kentucky’s Bioassessment
protocols, as mentioned previously. There is some question about the dependability of this
index for some ecoregions. Kentucky does not have ecoregions 65a, b, e, or i, 66d, e, f, g, i, j, or
k or 67f, g, h, or i. Therefore, those ecoregions have been grouped with the bioregion to which
they are most similar. These metrics will be evaluated for Tennessee’s ecoregions as soon as
possible.
Table 7. Bioassessment guidelines for KDBI scores.
MT MVIR PN
Excellent 75-100 57-100 67-100
Good 62-74.99 48-56.99 55-66.99
Fair 51-61.99 42-47.99 50-54.99
Poor 0-50.99 0-41.99 0-49.99
Other metrics will be tested in order to evaluate their usefulness in developing a biotic index for
Tennessee’s streams. A list of these metrics can be found in Appendix C.
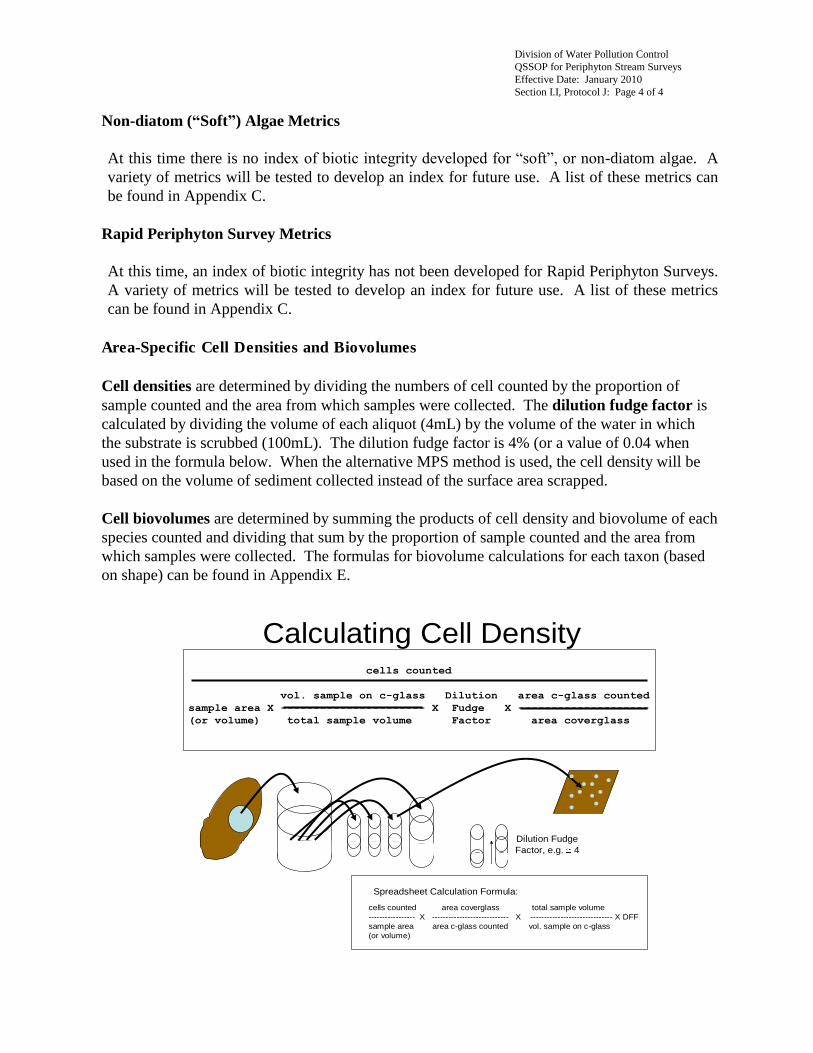
Division of Water Pollution Control
QSSOP for Periphyton Stream Surveys
Effective Date: January 2010
Section I.I, Protocol J: Page 4 of 4
Non-diatom (―Soft‖) Algae Metrics
At this time there is no index of biotic integrity developed for “soft”, or non-diatom algae. A
variety of metrics will be tested to develop an index for future use. A list of these metrics can
be found in Appendix C.
Rapid Periphyton Survey Metrics
At this time, an index of biotic integrity has not been developed for Rapid Periphyton Surveys.
A variety of metrics will be tested to develop an index for future use. A list of these metrics
can be found in Appendix C.
Area-Specific Cell Densities and Biovolumes
Cell densities are determined by dividing the numbers of cell counted by the proportion of
sample counted and the area from which samples were collected. The dilution fudge factor is
calculated by dividing the volume of each aliquot (4mL) by the volume of the water in which
the substrate is scrubbed (100mL). The dilution fudge factor is 4% (or a value of 0.04 when
used in the formula below. When the alternative MPS method is used, the cell density will be
based on the volume of sediment collected instead of the surface area scrapped.
Cell biovolumes are determined by summing the products of cell density and biovolume of each
species counted and dividing that sum by the proportion of sample counted and the area from
which samples were collected. The formulas for biovolume calculations for each taxon (based
on shape) can be found in Appendix E.
Calculating Cell Density
cells counted area coverglass total sample volume
----------------- X ---------------------------- X ------------------------------ X DFF
sample area area c-glass counted vol. sample on c-glass
(or volume)
Spreadsheet Calculation Formula:
Dilution Fudge
Factor, e.g. 4
cells counted
vol. sample on c-glass Dilution area c-glass counted
sample area X ---------------------- X Fudge X --------------------
(or volume) total sample volume Factor area coverglass

Division of Water Pollution Control
QSSOP for Periphyton Stream Surveys
Effective Date: January 2010
Section I.I, Protocol K: Page 1 of 1
Protocol K – Report Preparation
Upon completion of a periphyton survey, the EFO will submit a copy of the Rapid Periphyton
Survey data sheet, habitat assessment, map, and photos to PAS (also include stream survey form
if completed). The EFO will submit the Sample Request Form, including the Chain of Custody
to the lab along with the sample.
Once received at the Lab, a separate lab number will be assigned. Upon completion of sample,
the lab will enter taxa into the SQSH database. The lab will submit a copy of the diatom taxa
list, soft algae taxa list, sample request form, and periphyton assessment report to PAS and
appropriate EFO.

Division of Water Pollution Control
QSSOP for Periphyton Stream Surveys
Effective Date: January 2010
Section I.J: Page 1 of 1
I.J - DATA AND RECORDS MANAGEMENT
Results from periphyton samples (including taxa lists) are entered by the Aquatic Biology
Section, Lab Services, TDH in an Access 2000 file called SQDATA (date). This database will
be sent by the Aquatic Biology Section to the Planning and Standards Section at the completion
of each project and/or quarterly.
Following processing and quality control checks, periphyton results are entered into Tennessee’s
Water Quality Database (WQDB), an Access file maintained by PAS. A copy of the WQDB is
sent quarterly to EFO and CO personnel.
Assessment information for each stream segment will be entered in the Access 2000 Assessment
Database (ADB) by the Planning and Standards Section (PAS). PAS staff will meet with WPC
managers and biologists in each EFO before assessments are finalized. This database will
eventually be accessible on the web for public access.
The original field sheets and taxa lists are to be kept in files at the sampling agency
(Environmental Field Office or Aquatic Biology Section). Copies of the Non-Diatom Algae
Taxonomic Bench Sheets (Appendix B), Diatom Algae Taxonomic Bench Sheets (Appendix B),
habitat assessment sheets (Appendix B), Rapid Periphyton Survey Data Sheets (Appendix B),
Periphyton Assessment Report (Appendix B), map of sample location, Chain of Custody forms
(Appendix B), and photographs are to be sent (printed in color, emailed, or on CD) to the
Planning and Standards Section. These copies will be kept in the watershed files for five years
before being archived.

Division of Water Pollution Control
QSSOP for Periphyton Stream Surveys
Effective Date: January 2010
Section II: Page 1 of 5
II. QUALITY ASSURANCE / QUALITY CONTROL
The U.S. EPA requires that a centrally planned, directed and coordinated quality assurance and
quality control program be applied to efforts supported by them through grants, contracts or
other formalized agreements. This time allocation is an essential component of biological
sampling and analysis and will be included in annual work plans. This is not an optional or “as
time allows” activity. The goal is to demonstrate the accuracy and precision of the biologists, as
well as the reproducibility of the methodology, and to ensure unbiased treatment of all samples.
A. General QC Practices
1. Quality Team Leader (QC Coordinator) - A centralized biological QC coordinator will be
designated with the responsibility to ensure that all QC protocols are met. This person will
be an experienced water quality biologist. Major responsibilities will include monitoring
QC activities to determine conformance, distributing quality related information, training
personnel on QC requirements and procedures, reviewing QA/QC plans for completeness,
noting inconsistencies, and signing off on the QA plan and reports.
2. Quality Team Member (In-house QC officer) - One WPC biologist/environmental specialist
in each EFO will be designated as the Quality Team Member (in-house QC officer.) This
person will be responsible for performing and/or ensuring that quality control is maintained
and for coordinating activities with the central Quality Team Leader (QC coordinator).
3. Training - Unless prohibited by budgetary travel restrictions, training will be conducted at
least once a year through workshops, seminars and/or field demonstrations in an effort to
maintain consistency, repeatability and precision between biologists/environmental
specialists conducting periphyton surveys. This will also be an opportunity for personnel to
discuss problems they have encountered with the methodologies and to suggest SOP
revisions prior to the annual SOP review. Note: topics of discussion should be submitted to
the central Quality Team Leader (QC coordinator) before the meeting so that a planned
agenda can be followed, thus making the best use of limited time.
B. Field Quality Control – Habitat Assessment and Biological Sampling Methodology
1. Habitat Assessments - At minimally 10% of sites, two trained biologists/environmental
specialists will complete habitat assessment forms independently. Scores are compared for
each parameter with discrepancies arbitrated while in the field.
2. Rapid Periphyton Survey - A second survey will be collected at a minimum of 10% of the
sites by a separate biologist/environmental specialist. This should be conducted at the same
time, or at least within two weeks of the original survey if flow characteristics are the same.
Division of Water Pollution Control
QSSOP for Periphyton Stream Surveys
Effective Date: January 2010
Section II: Page 2 of 5
3. Periphyton Sample - A second multi-habitat periphyton sample will be collected at 10% of
the sites.
4. Chain of Custody Chain of custody is required by the TDEC Office of General Counsel for
samples that have the potential of being used in court, reviewed by state boards, or involved
in state hearings. Chain of custody must also accompany any contract samples (periphyton
samples being sent to the lab). Chain of custody is the far right column of the biological
analysis form (Appendix B). The entire form must be filled out completely.
The chain of custody follows the sample through collection, transfer, storage, taxonomic
identification, quality assurance and disposal. The biologist who collected the sample must
sign (not print) their name in full (not initial) in the Collected By space with the date and
time (24-hour clock). If the sample is given to anyone else before it is delivered to the lab
(or returned to the office), each person responsible for the sample must sign their full name
on the Received By space with the date and time. The person in the laboratory (or office)
who receives the sample will sign line four. The person who logs the sample in signs the
last line.
C. QC Log
A list of all samples sorted and/or identified by each biologist/environmental specialist will be
kept in a bound log or a backed-up computer spreadsheet/database so that QC requirements and
results can be documented (Table 8). The QC log must contain the following information:
1. Sample log number
2. Station ID
3. Sample type
4. Initials of sampler and taxonomist
5. Date completed
6. Initials of person performing QC
7. Percent community similarity
8. Date of QC
9. Initials of QC taxonomist
10. Results of QC (satisfactory/unsatisfactory)
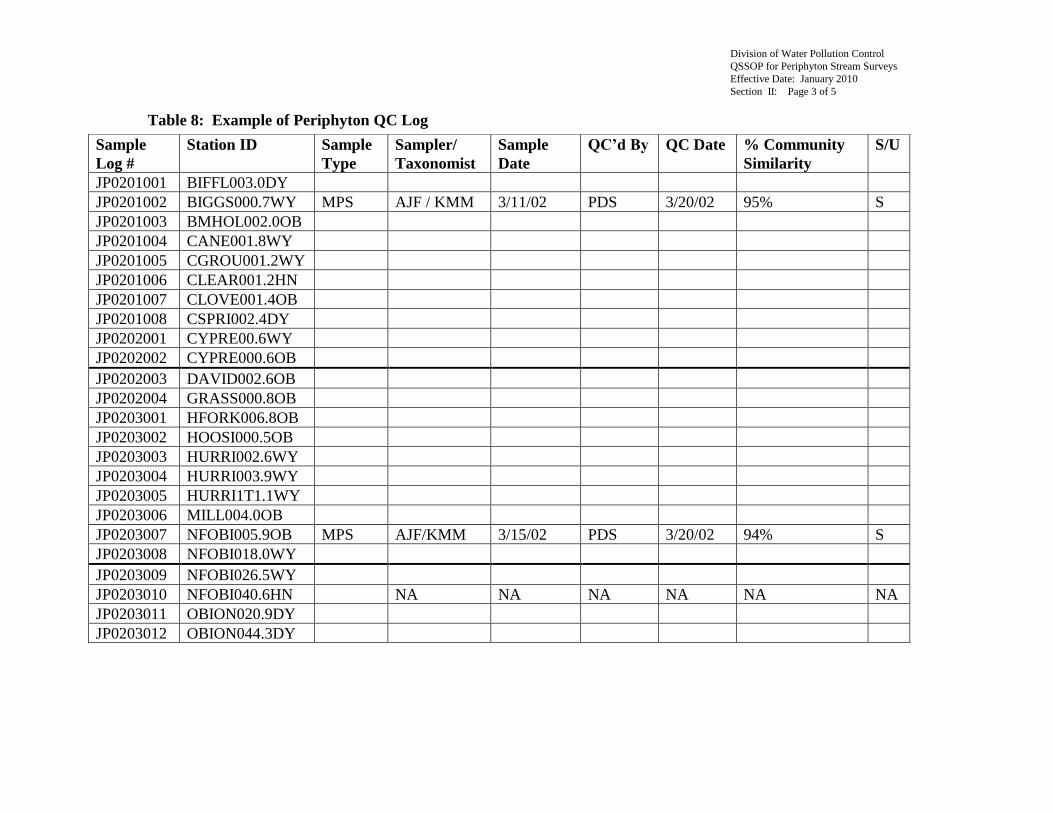
Division of Water Pollution Control
QSSOP for Periphyton Stream Surveys
Effective Date: January 2010
Section II: Page 3 of 5
Table 8: Example of Periphyton QC Log
Sample
Log #
Station ID Sample
Type
Sampler/
Taxonomist
Sample
Date
QC’d By QC Date % Community
Similarity
S/U
JP0201001 BIFFL003.0DY
JP0201002 BIGGS000.7WY MPS AJF / KMM 3/11/02 PDS 3/20/02 95% S
JP0201003 BMHOL002.0OB
JP0201004 CANE001.8WY
JP0201005 CGROU001.2WY
JP0201006 CLEAR001.2HN
JP0201007 CLOVE001.4OB
JP0201008 CSPRI002.4DY
JP0202001 CYPRE00.6WY
JP0202002 CYPRE000.6OB
JP0202003 DAVID002.6OB
JP0202004 GRASS000.8OB
JP0203001 HFORK006.8OB
JP0203002 HOOSI000.5OB
JP0203003 HURRI002.6WY
JP0203004 HURRI003.9WY
JP0203005 HURRI1T1.1WY
JP0203006 MILL004.0OB
JP0203007 NFOBI005.9OB MPS AJF/KMM 3/15/02 PDS 3/20/02 94% S
JP0203008 NFOBI018.0WY
JP0203009 NFOBI026.5WY
JP0203010 NFOBI040.6HN NA NA NA NA NA NA
JP0203011 OBION020.9DY
JP0203012 OBION044.3DY
Division of Water Pollution Control
QSSOP for Periphyton Stream Surveys
Effective Date: January 2010
Section II: Page 4 of 5
D. Percent Community Similarity
1. Each biologist/ES responsible for taxonomic identification, regardless of previous
experience, will have every sample QC’d by a second biologist/ES who has already achieved
75% community similarity (documented) until the original biologist/ES has passed 75%
community similarity on a sample. A record of this is kept in the QC log. Once a
biologist/ES has passed their first QC, they are QC’d on 10% of subsequent samples
(randomly selected). A community similarity of 75% must be maintained. If the community
similarity is lower than 75%, every sample prior to that one in the same group of 10 is re-
sorted until a sample that has met the 75% requirement is found. The next group of 10 starts
after the unsatisfactory sample.
The community similarity is calculated by:
Percent Community Similarity = 100-.5∑i=1
s │a
i-b
i│ = ∑
i=1
s min (a
i, b
i)
2. Log results in the QC log.
3. All QC must be completed before the data are released to ensure accuracy of results. If, for
any reason, a report is released prior to QC completion, an addendum will be sent to all
report recipients with any corrected information after QC is complete.
E. Reference Collections
1. A master collection of images of all taxa identified in the state will be kept in the central
laboratory. The organisms in the centralized master reference collection will be verified by
outside experts recognized for expertise in a particular taxonomic group. A list of verified
organisms found in the state is provided in Appendix D. New taxa will be verified by an
outside expert (Appendix D).
2. The central laboratory reference collection will be catalogued with discrete collection
numbers assigned to each taxon. Assign sequential numbers to specimens as they are added
into the collection. For example, 0001 would be the first specimen in the collection.
Maintain an accession catalog of all reference material in a permanently bound log and on
disk. Each entry must contain the following information:
Accession number (This must be unique for each group of organisms in each collection)
Complete name (genus, species, variety (if applicable), authority, date)
Higher taxa (family, order, class)
Locality data (Waterbody, site, county, ecoregion, station number)
Sample type
Name of collector/date of collection
Name of taxonomist
Name of verifier if appropriate
Number of specimens

Division of Water Pollution Control
QSSOP for Periphyton Stream Surveys
Effective Date: January 2010
Section II: Page 5 of 5
F. Data Reduction QC
1. Store raw data (non-manipulated) in one or more separate locations and in an electronic
database with backup.
2. A second staff member checks all computer data entry correctness by direct comparison with
the field or laboratory handwritten data sheets. The person performing the data entry QC
initial and dates each page of the checked printout in red ink.
3. Keep QC information in a file with the other information for that project a minimum of five
years.
4. Complete all data reduction QC before results are released.
Division of Water Pollution Control
QSSOP for Periphyton Stream Surveys
Effective Date: January 2010
Section III:: Page 1 of 1
III. REFERENCES
Bahls, Lauren L. 1993. Periphyton Bioassessment Methods for Montana Streams. Montana
Department of Health and Environmental Sciences. Water Quality Division. Helena, Montana.
Barbour, M.T., Gerritsen, J., Snyder B.D. and J.B. Stribling. 1999. Rapid Bioassessment
Protocols for Use in Streams and Wadeable Rivers. EPA 841-B-99-002. U.S. Environmental
Protection Agency, Office of Water, Washington D.C.
DeLorme. 2004. Tennessee Atlas & Gazetteer. DeLorme, Yarmouth, Maine.
Fore, Leska S. and Cynthia Grafe. 2002. Using Diatoms to Assess Biological Condition of
Large Rivers in Idaho (U.S.A.). Freshwater Biology. 47, 2015-2037.
Griffith, G.E., J.M. Omernik and S. Azevedo. 1997. Ecoregions of Tennessee. EPA/600/R-
97/022. NHREEL, Western Ecological Division, U.S. Environmental Protection Agency,
Corvalis, Oregon.
Hill, B.H., A. T. Herlihy, P.R. Kaufmann, R. J. Stevenson, F. H. McCormick, and C. Burch
Johnson. 2000. Use of Periphyton Assemblage Data as an Index of Biotic Integrity. Journal of
the North American Benthological Society. 19(1): 50-67.
Hillebrand, H., C. Durselen, D. Kirschtel, U. Pollingher, and T. Zohary. 1999. Biovolume
Calculation for Pelagic and Benthic Microalgae. Journal of Phycology. 35: 403-424.
Kentucky Department of Environmental Protection. 2008. Standard Methods for Assessing
Biological Integrity of Surface Waters in Kentucky. Division of Water. Frankfort, Kentucky.
U.S. Environmental Protection Agency. 1995. Generic Quality Assurance Project Plan
Guidance for Programs Using Community Level Biological Assessment in Wadeable Streams
and Rivers. EPA 841-B-95-004. U.S. EPA, Washington D.C.
Wang, Yi-Kuang, R. Jan Stevenson, Lythia Metzmeier. 2005. Development and evaluation of a
diatom-based index of biotic Integrity for the Interior Plateau Ecoregion, USA. Journal of the
North American Benthological Society. 24(4): 990-1008.
Division of Water Pollution Control
QSSOP for Periphyton Stream Surveys
Effective Date: January 2010
Appendix A: Page 1 of 11
APPENDIX A
ECOREGION REFERENCE
INFORMATION
ECOREGION REFERENCE STREAMS
REGIONAL EXPECTATIONS FOR INDIVIDUAL HABITAT PARAMETERS
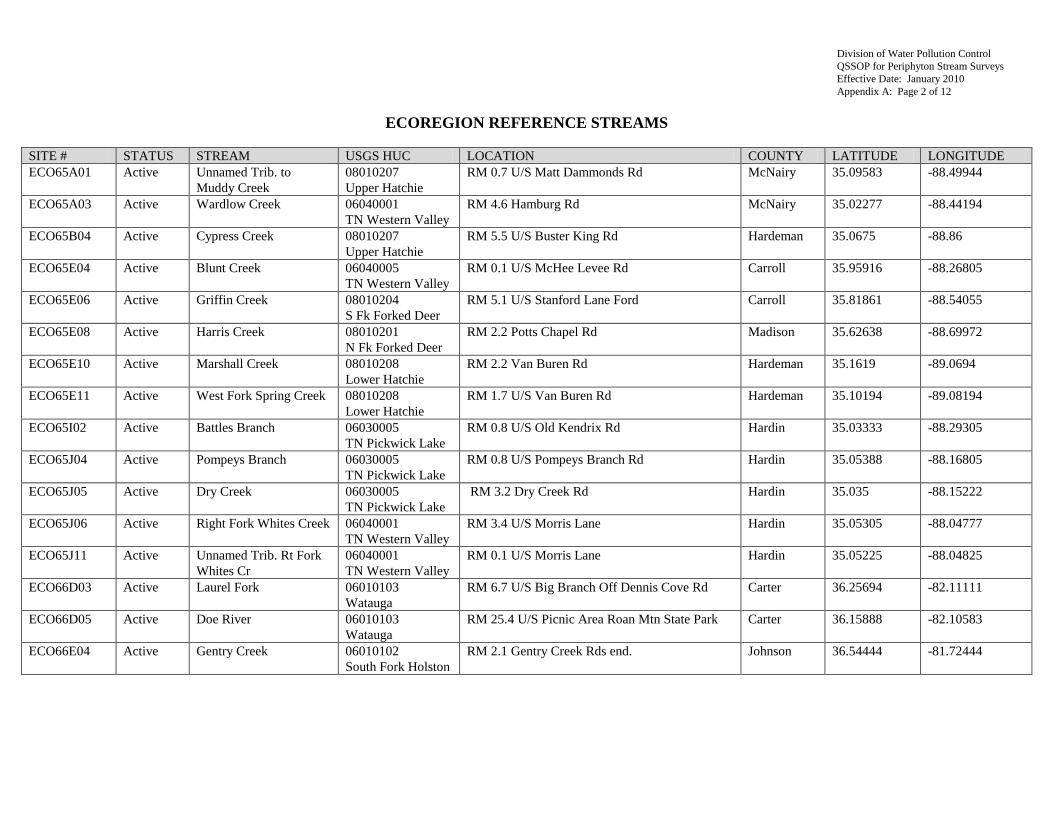
Division of Water Pollution Control
QSSOP for Periphyton Stream Surveys
Effective Date: January 2010
Appendix A: Page 2 of 12
ECOREGION REFERENCE STREAMS
SITE # STATUS STREAM USGS HUC LOCATION COUNTY LATITUDE LONGITUDE
ECO65A01 Active Unnamed Trib. to
Muddy Creek
08010207
Upper Hatchie
RM 0.7 U/S Matt Dammonds Rd McNairy 35.09583
-88.49944
ECO65A03 Active Wardlow Creek 06040001
TN Western Valley
RM 4.6 Hamburg Rd McNairy 35.02277
-88.44194
ECO65B04 Active Cypress Creek 08010207
Upper Hatchie
RM 5.5 U/S Buster King Rd Hardeman 35.0675
-88.86
ECO65E04 Active Blunt Creek 06040005
TN Western Valley
RM 0.1 U/S McHee Levee Rd Carroll 35.95916
-88.26805
ECO65E06 Active Griffin Creek 08010204
S Fk Forked Deer
RM 5.1 U/S Stanford Lane Ford Carroll 35.81861
-88.54055
ECO65E08 Active Harris Creek 08010201
N Fk Forked Deer
RM 2.2 Potts Chapel Rd Madison 35.62638
-88.69972
ECO65E10 Active Marshall Creek 08010208
Lower Hatchie
RM 2.2 Van Buren Rd Hardeman 35.1619
-89.0694
ECO65E11 Active West Fork Spring Creek 08010208
Lower Hatchie
RM 1.7 U/S Van Buren Rd Hardeman 35.10194
-89.08194
ECO65I02 Active Battles Branch 06030005
TN Pickwick Lake
RM 0.8 U/S Old Kendrix Rd Hardin 35.03333
-88.29305
ECO65J04 Active Pompeys Branch 06030005
TN Pickwick Lake
RM 0.8 U/S Pompeys Branch Rd Hardin 35.05388
-88.16805
ECO65J05 Active Dry Creek 06030005
TN Pickwick Lake
RM 3.2 Dry Creek Rd Hardin 35.035
-88.15222
ECO65J06 Active Right Fork Whites Creek 06040001
TN Western Valley
RM 3.4 U/S Morris Lane Hardin 35.05305
-88.04777
ECO65J11 Active Unnamed Trib. Rt Fork
Whites Cr
06040001
TN Western Valley
RM 0.1 U/S Morris Lane Hardin 35.05225
-88.04825
ECO66D03 Active Laurel Fork 06010103
Watauga
RM 6.7 U/S Big Branch Off Dennis Cove Rd Carter 36.25694
-82.11111
ECO66D05 Active Doe River 06010103
Watauga
RM 25.4 U/S Picnic Area Roan Mtn State Park Carter 36.15888
-82.10583
ECO66E04 Active Gentry Creek 06010102
South Fork Holston
RM 2.1 Gentry Creek Rds end. Johnson 36.54444
-81.72444
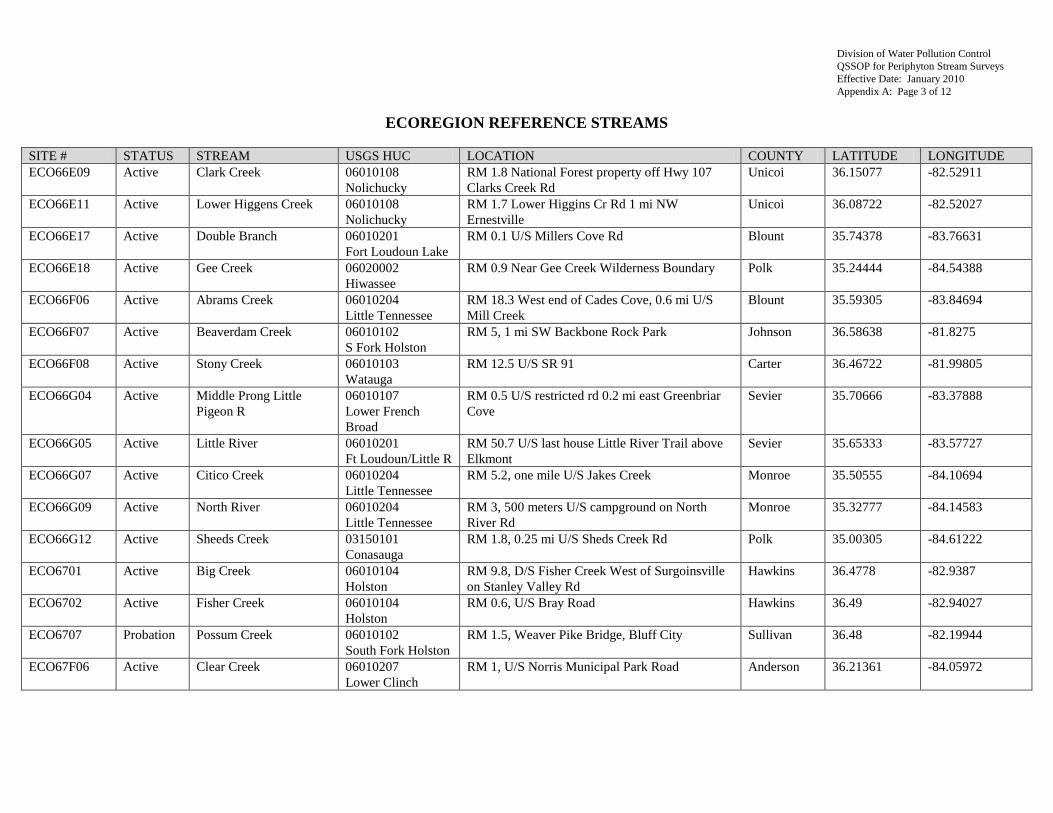
Division of Water Pollution Control
QSSOP for Periphyton Stream Surveys
Effective Date: January 2010
Appendix A: Page 3 of 12
ECOREGION REFERENCE STREAMS
SITE # STATUS STREAM USGS HUC LOCATION COUNTY LATITUDE LONGITUDE
ECO66E09 Active Clark Creek 06010108
Nolichucky
RM 1.8 National Forest property off Hwy 107
Clarks Creek Rd
Unicoi 36.15077 -82.52911
ECO66E11 Active Lower Higgens Creek 06010108
Nolichucky
RM 1.7 Lower Higgins Cr Rd 1 mi NW
Ernestville
Unicoi 36.08722
-82.52027
ECO66E17 Active Double Branch 06010201
Fort Loudoun Lake
RM 0.1 U/S Millers Cove Rd Blount 35.74378
-83.76631
ECO66E18 Active Gee Creek 06020002
Hiwassee
RM 0.9 Near Gee Creek Wilderness Boundary Polk 35.24444
-84.54388
ECO66F06 Active Abrams Creek 06010204
Little Tennessee
RM 18.3 West end of Cades Cove, 0.6 mi U/S
Mill Creek
Blount 35.59305 -83.84694
ECO66F07 Active Beaverdam Creek 06010102
S Fork Holston
RM 5, 1 mi SW Backbone Rock Park Johnson 36.58638 -81.8275
ECO66F08 Active Stony Creek 06010103
Watauga
RM 12.5 U/S SR 91 Carter 36.46722 -81.99805
ECO66G04 Active Middle Prong Little
Pigeon R
06010107
Lower French
Broad
RM 0.5 U/S restricted rd 0.2 mi east Greenbriar
Cove
Sevier 35.70666 -83.37888
ECO66G05 Active Little River 06010201
Ft Loudoun/Little R
RM 50.7 U/S last house Little River Trail above
Elkmont
Sevier 35.65333 -83.57727
ECO66G07 Active Citico Creek 06010204
Little Tennessee
RM 5.2, one mile U/S Jakes Creek Monroe 35.50555 -84.10694
ECO66G09 Active North River 06010204
Little Tennessee
RM 3, 500 meters U/S campground on North
River Rd
Monroe 35.32777 -84.14583
ECO66G12 Active Sheeds Creek 03150101
Conasauga
RM 1.8, 0.25 mi U/S Sheds Creek Rd Polk 35.00305 -84.61222
ECO6701 Active Big Creek 06010104
Holston
RM 9.8, D/S Fisher Creek West of Surgoinsville
on Stanley Valley Rd
Hawkins
36.4778 -82.9387
ECO6702 Active Fisher Creek 06010104
Holston
RM 0.6, U/S Bray Road Hawkins 36.49 -82.94027
ECO6707 Probation Possum Creek 06010102
South Fork Holston
RM 1.5, Weaver Pike Bridge, Bluff City Sullivan 36.48 -82.19944
ECO67F06 Active Clear Creek 06010207
Lower Clinch
RM 1, U/S Norris Municipal Park Road Anderson 36.21361 -84.05972
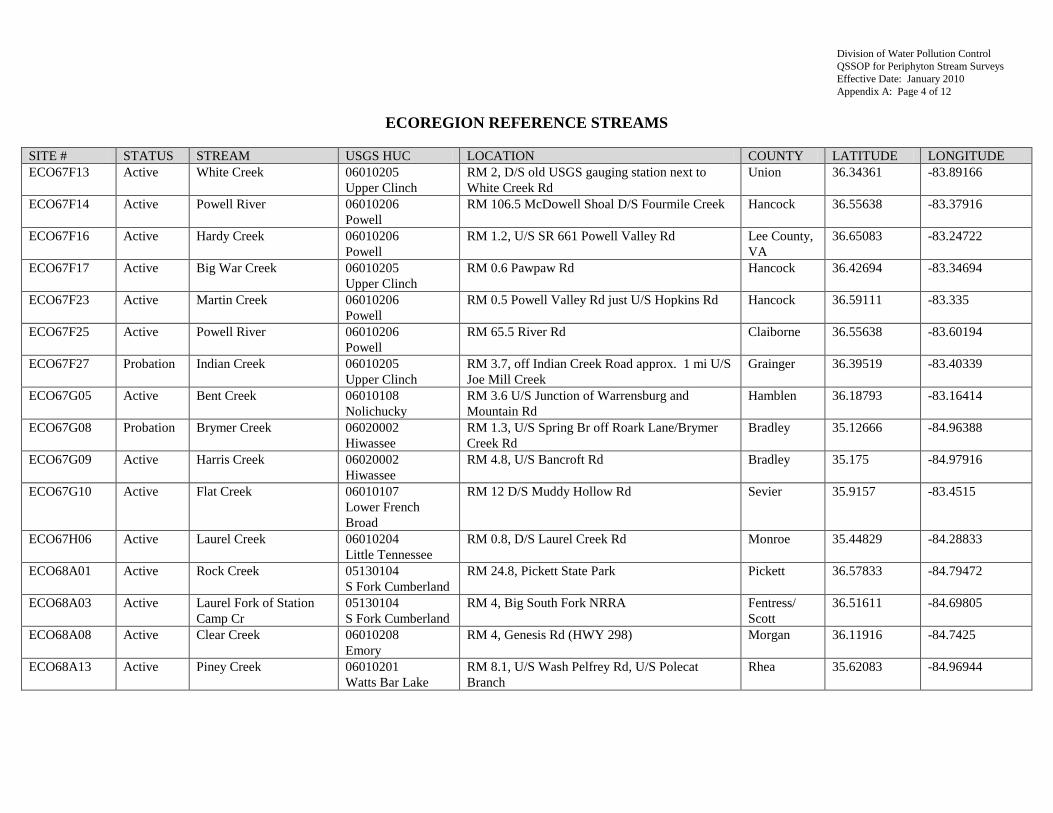
Division of Water Pollution Control
QSSOP for Periphyton Stream Surveys
Effective Date: January 2010
Appendix A: Page 4 of 12
ECOREGION REFERENCE STREAMS
SITE # STATUS STREAM USGS HUC LOCATION COUNTY LATITUDE LONGITUDE
ECO67F13 Active White Creek 06010205
Upper Clinch
RM 2, D/S old USGS gauging station next to
White Creek Rd
Union 36.34361 -83.89166
ECO67F14 Active Powell River 06010206
Powell
RM 106.5 McDowell Shoal D/S Fourmile Creek Hancock 36.55638 -83.37916
ECO67F16 Active Hardy Creek 06010206
Powell
RM 1.2, U/S SR 661 Powell Valley Rd Lee County,
VA
36.65083 -83.24722
ECO67F17 Active Big War Creek 06010205
Upper Clinch
RM 0.6 Pawpaw Rd Hancock 36.42694 -83.34694
ECO67F23 Active Martin Creek 06010206
Powell
RM 0.5 Powell Valley Rd just U/S Hopkins Rd Hancock 36.59111 -83.335
ECO67F25 Active Powell River 06010206
Powell
RM 65.5 River Rd Claiborne 36.55638 -83.60194
ECO67F27 Probation Indian Creek 06010205
Upper Clinch
RM 3.7, off Indian Creek Road approx. 1 mi U/S
Joe Mill Creek
Grainger 36.39519 -83.40339
ECO67G05 Active Bent Creek 06010108
Nolichucky
RM 3.6 U/S Junction of Warrensburg and
Mountain Rd
Hamblen 36.18793 -83.16414
ECO67G08 Probation Brymer Creek 06020002
Hiwassee
RM 1.3, U/S Spring Br off Roark Lane/Brymer
Creek Rd
Bradley 35.12666 -84.96388
ECO67G09 Active Harris Creek 06020002
Hiwassee
RM 4.8, U/S Bancroft Rd Bradley 35.175 -84.97916
ECO67G10 Active Flat Creek 06010107
Lower French
Broad
RM 12 D/S Muddy Hollow Rd Sevier 35.9157 -83.4515
ECO67H06 Active Laurel Creek 06010204
Little Tennessee
RM 0.8, D/S Laurel Creek Rd Monroe 35.44829 -84.28833
ECO68A01 Active Rock Creek 05130104
S Fork Cumberland
RM 24.8, Pickett State Park Pickett 36.57833 -84.79472
ECO68A03 Active Laurel Fork of Station
Camp Cr
05130104
S Fork Cumberland
RM 4, Big South Fork NRRA Fentress/
Scott
36.51611 -84.69805
ECO68A08 Active Clear Creek 06010208
Emory
RM 4, Genesis Rd (HWY 298) Morgan 36.11916 -84.7425
ECO68A13 Active Piney Creek 06010201
Watts Bar Lake
RM 8.1, U/S Wash Pelfrey Rd, U/S Polecat
Branch
Rhea 35.62083 -84.96944
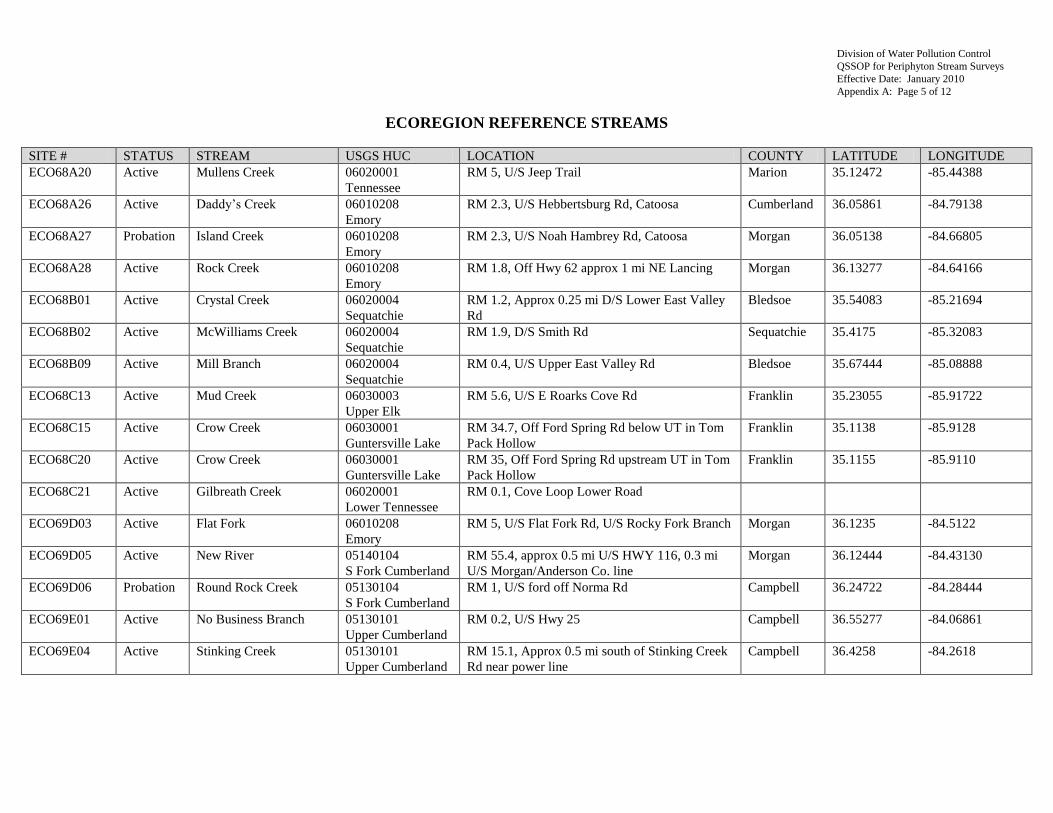
Division of Water Pollution Control
QSSOP for Periphyton Stream Surveys
Effective Date: January 2010
Appendix A: Page 5 of 12
ECOREGION REFERENCE STREAMS
SITE # STATUS STREAM USGS HUC LOCATION COUNTY LATITUDE LONGITUDE
ECO68A20 Active Mullens Creek 06020001
Tennessee
RM 5, U/S Jeep Trail Marion 35.12472 -85.44388
ECO68A26 Active Daddy’s Creek 06010208
Emory
RM 2.3, U/S Hebbertsburg Rd, Catoosa Cumberland 36.05861 -84.79138
ECO68A27 Probation Island Creek 06010208
Emory
RM 2.3, U/S Noah Hambrey Rd, Catoosa Morgan 36.05138 -84.66805
ECO68A28 Active Rock Creek 06010208
Emory
RM 1.8, Off Hwy 62 approx 1 mi NE Lancing Morgan 36.13277 -84.64166
ECO68B01 Active Crystal Creek 06020004
Sequatchie
RM 1.2, Approx 0.25 mi D/S Lower East Valley
Rd
Bledsoe 35.54083 -85.21694
ECO68B02 Active McWilliams Creek 06020004
Sequatchie
RM 1.9, D/S Smith Rd Sequatchie 35.4175 -85.32083
ECO68B09 Active Mill Branch 06020004
Sequatchie
RM 0.4, U/S Upper East Valley Rd Bledsoe 35.67444 -85.08888
ECO68C13 Active Mud Creek 06030003
Upper Elk
RM 5.6, U/S E Roarks Cove Rd Franklin 35.23055 -85.91722
ECO68C15 Active Crow Creek 06030001
Guntersville Lake
RM 34.7, Off Ford Spring Rd below UT in Tom
Pack Hollow
Franklin 35.1138 -85.9128
ECO68C20 Active Crow Creek 06030001
Guntersville Lake
RM 35, Off Ford Spring Rd upstream UT in Tom
Pack Hollow
Franklin 35.1155 -85.9110
ECO68C21 Active Gilbreath Creek 06020001
Lower Tennessee
RM 0.1, Cove Loop Lower Road
ECO69D03 Active Flat Fork 06010208
Emory
RM 5, U/S Flat Fork Rd, U/S Rocky Fork Branch Morgan 36.1235 -84.5122
ECO69D05 Active New River 05140104
S Fork Cumberland
RM 55.4, approx 0.5 mi U/S HWY 116, 0.3 mi
U/S Morgan/Anderson Co. line
Morgan 36.12444 -84.43130
ECO69D06 Probation Round Rock Creek 05130104
S Fork Cumberland
RM 1, U/S ford off Norma Rd Campbell 36.24722 -84.28444
ECO69E01 Active No Business Branch 05130101
Upper Cumberland
RM 0.2, U/S Hwy 25 Campbell 36.55277 -84.06861
ECO69E04 Active Stinking Creek 05130101
Upper Cumberland
RM 15.1, Approx 0.5 mi south of Stinking Creek
Rd near power line
Campbell 36.4258 -84.2618
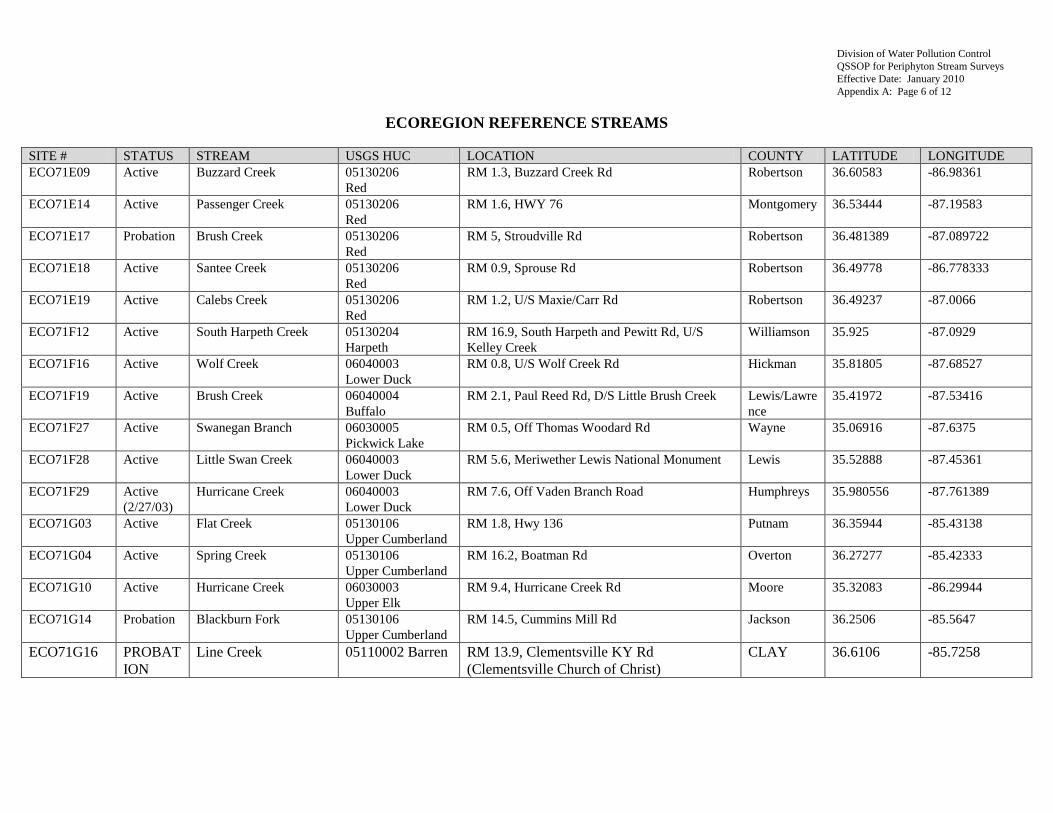
Division of Water Pollution Control
QSSOP for Periphyton Stream Surveys
Effective Date: January 2010
Appendix A: Page 6 of 12
ECOREGION REFERENCE STREAMS
SITE # STATUS STREAM USGS HUC LOCATION COUNTY LATITUDE LONGITUDE
ECO71E09 Active Buzzard Creek 05130206
Red
RM 1.3, Buzzard Creek Rd Robertson 36.60583 -86.98361
ECO71E14 Active Passenger Creek 05130206
Red
RM 1.6, HWY 76 Montgomery 36.53444 -87.19583
ECO71E17 Probation
Brush Creek 05130206
Red
RM 5, Stroudville Rd Robertson 36.481389 -87.089722
ECO71E18 Active
Santee Creek 05130206
Red
RM 0.9, Sprouse Rd Robertson 36.49778 -86.778333
ECO71E19 Active
Calebs Creek 05130206
Red
RM 1.2, U/S Maxie/Carr Rd Robertson 36.49237 -87.0066
ECO71F12 Active South Harpeth Creek 05130204
Harpeth
RM 16.9, South Harpeth and Pewitt Rd, U/S
Kelley Creek
Williamson 35.925 -87.0929
ECO71F16 Active Wolf Creek 06040003
Lower Duck
RM 0.8, U/S Wolf Creek Rd Hickman 35.81805 -87.68527
ECO71F19 Active Brush Creek 06040004
Buffalo
RM 2.1, Paul Reed Rd, D/S Little Brush Creek Lewis/Lawre
nce
35.41972 -87.53416
ECO71F27 Active Swanegan Branch 06030005
Pickwick Lake
RM 0.5, Off Thomas Woodard Rd Wayne 35.06916 -87.6375
ECO71F28 Active Little Swan Creek 06040003
Lower Duck
RM 5.6, Meriwether Lewis National Monument Lewis 35.52888 -87.45361
ECO71F29 Active
(2/27/03)
Hurricane Creek 06040003
Lower Duck
RM 7.6, Off Vaden Branch Road Humphreys 35.980556 -87.761389
ECO71G03 Active Flat Creek 05130106
Upper Cumberland
RM 1.8, Hwy 136 Putnam 36.35944 -85.43138
ECO71G04 Active Spring Creek 05130106
Upper Cumberland
RM 16.2, Boatman Rd Overton 36.27277 -85.42333
ECO71G10 Active Hurricane Creek 06030003
Upper Elk
RM 9.4, Hurricane Creek Rd Moore 35.32083 -86.29944
ECO71G14 Probation Blackburn Fork 05130106
Upper Cumberland
RM 14.5, Cummins Mill Rd Jackson 36.2506 -85.5647
ECO71G16 PROBAT
ION
Line Creek 05110002 Barren RM 13.9, Clementsville KY Rd
(Clementsville Church of Christ)
CLAY 36.6106 -85.7258
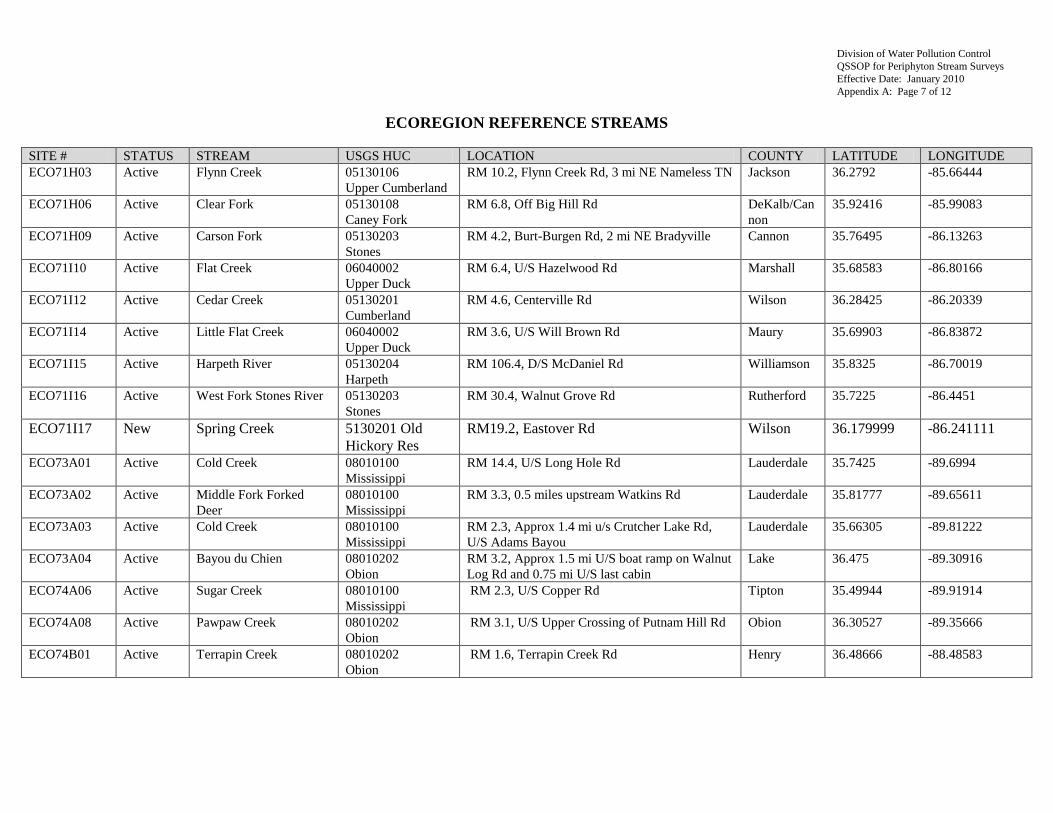
Division of Water Pollution Control
QSSOP for Periphyton Stream Surveys
Effective Date: January 2010
Appendix A: Page 7 of 12
ECOREGION REFERENCE STREAMS
SITE # STATUS STREAM USGS HUC LOCATION COUNTY LATITUDE LONGITUDE
ECO71H03 Active Flynn Creek 05130106
Upper Cumberland
RM 10.2, Flynn Creek Rd, 3 mi NE Nameless TN Jackson 36.2792 -85.66444
ECO71H06 Active Clear Fork 05130108
Caney Fork
RM 6.8, Off Big Hill Rd DeKalb/Can
non
35.92416 -85.99083
ECO71H09 Active Carson Fork 05130203
Stones
RM 4.2, Burt-Burgen Rd, 2 mi NE Bradyville Cannon 35.76495 -86.13263
ECO71I10 Active Flat Creek 06040002
Upper Duck
RM 6.4, U/S Hazelwood Rd Marshall 35.68583 -86.80166
ECO71I12 Active Cedar Creek 05130201
Cumberland
RM 4.6, Centerville Rd Wilson 36.28425 -86.20339
ECO71I14 Active Little Flat Creek 06040002
Upper Duck
RM 3.6, U/S Will Brown Rd Maury 35.69903 -86.83872
ECO71I15 Active Harpeth River 05130204
Harpeth
RM 106.4, D/S McDaniel Rd Williamson 35.8325 -86.70019
ECO71I16 Active
West Fork Stones River 05130203
Stones
RM 30.4, Walnut Grove Rd Rutherford 35.7225 -86.4451
ECO71I17 New Spring Creek 5130201 Old
Hickory Res
RM19.2, Eastover Rd Wilson 36.179999 -86.241111
ECO73A01 Active Cold Creek 08010100
Mississippi
RM 14.4, U/S Long Hole Rd Lauderdale 35.7425 -89.6994
ECO73A02 Active Middle Fork Forked
Deer
08010100
Mississippi
RM 3.3, 0.5 miles upstream Watkins Rd Lauderdale 35.81777 -89.65611
ECO73A03 Active Cold Creek 08010100
Mississippi
RM 2.3, Approx 1.4 mi u/s Crutcher Lake Rd,
U/S Adams Bayou
Lauderdale 35.66305 -89.81222
ECO73A04 Active Bayou du Chien 08010202
Obion
RM 3.2, Approx 1.5 mi U/S boat ramp on Walnut
Log Rd and 0.75 mi U/S last cabin
Lake 36.475 -89.30916
ECO74A06 Active Sugar Creek 08010100
Mississippi
RM 2.3, U/S Copper Rd Tipton 35.49944 -89.91914
ECO74A08 Active Pawpaw Creek 08010202
Obion
RM 3.1, U/S Upper Crossing of Putnam Hill Rd Obion 36.30527 -89.35666
ECO74B01 Active Terrapin Creek 08010202
Obion
RM 1.6, Terrapin Creek Rd Henry 36.48666 -88.48583
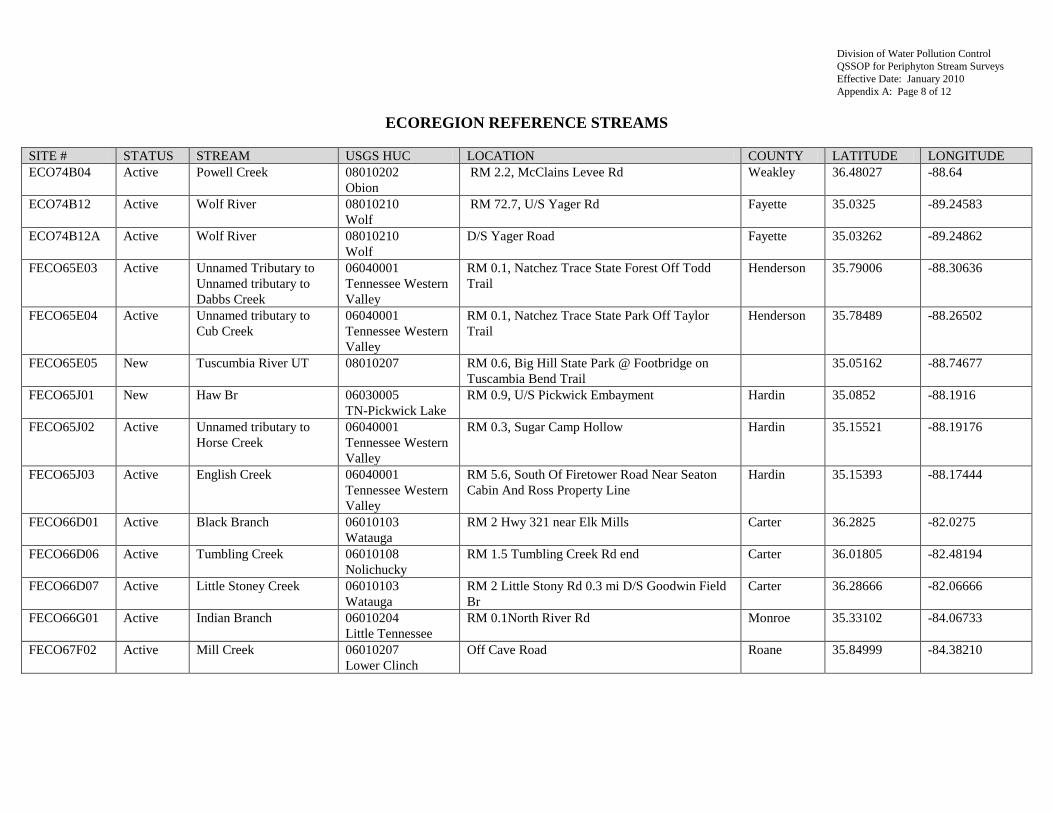
Division of Water Pollution Control
QSSOP for Periphyton Stream Surveys
Effective Date: January 2010
Appendix A: Page 8 of 12
ECOREGION REFERENCE STREAMS
SITE # STATUS STREAM USGS HUC LOCATION COUNTY LATITUDE LONGITUDE
ECO74B04 Active Powell Creek 08010202
Obion
RM 2.2, McClains Levee Rd Weakley 36.48027 -88.64
ECO74B12 Active Wolf River 08010210
Wolf
RM 72.7, U/S Yager Rd Fayette 35.0325 -89.24583
ECO74B12A Active Wolf River 08010210
Wolf
D/S Yager Road Fayette 35.03262 -89.24862
FECO65E03 Active Unnamed Tributary to
Unnamed tributary to
Dabbs Creek
06040001
Tennessee Western
Valley
RM 0.1, Natchez Trace State Forest Off Todd
Trail
Henderson 35.79006 -88.30636
FECO65E04 Active Unnamed tributary to
Cub Creek
06040001
Tennessee Western
Valley
RM 0.1, Natchez Trace State Park Off Taylor
Trail
Henderson 35.78489 -88.26502
FECO65E05 New Tuscumbia River UT 08010207 RM 0.6, Big Hill State Park @ Footbridge on
Tuscambia Bend Trail
35.05162 -88.74677
FECO65J01 New Haw Br 06030005
TN-Pickwick Lake
RM 0.9, U/S Pickwick Embayment Hardin 35.0852 -88.1916
FECO65J02 Active Unnamed tributary to
Horse Creek
06040001
Tennessee Western
Valley
RM 0.3, Sugar Camp Hollow Hardin 35.15521 -88.19176
FECO65J03 Active English Creek 06040001
Tennessee Western
Valley
RM 5.6, South Of Firetower Road Near Seaton
Cabin And Ross Property Line
Hardin 35.15393 -88.17444
FECO66D01 Active Black Branch 06010103
Watauga
RM 2 Hwy 321 near Elk Mills Carter 36.2825
-82.0275
FECO66D06 Active Tumbling Creek 06010108
Nolichucky
RM 1.5 Tumbling Creek Rd end Carter 36.01805
-82.48194
FECO66D07 Active Little Stoney Creek 06010103
Watauga
RM 2 Little Stony Rd 0.3 mi D/S Goodwin Field
Br
Carter 36.28666
-82.06666
FECO66G01 Active Indian Branch 06010204
Little Tennessee
RM 0.1North River Rd Monroe 35.33102 -84.06733
FECO67F02 Active Mill Creek 06010207
Lower Clinch
Off Cave Road Roane 35.84999 -84.38210
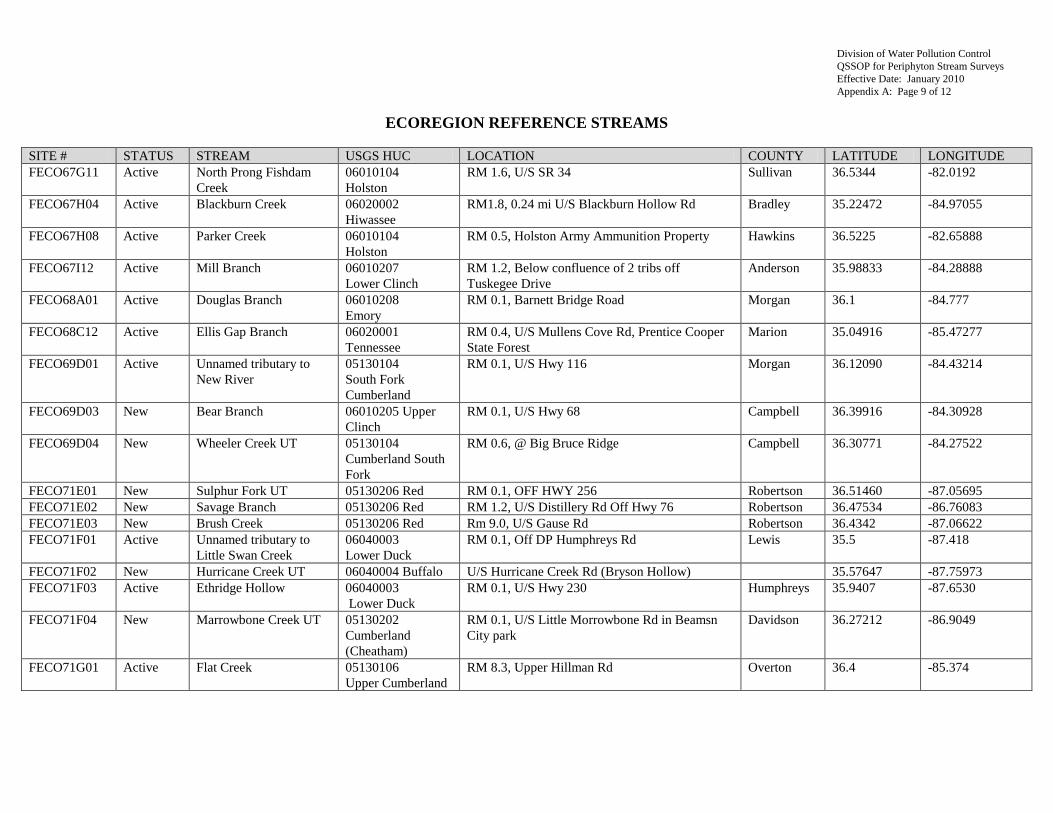
Division of Water Pollution Control
QSSOP for Periphyton Stream Surveys
Effective Date: January 2010
Appendix A: Page 9 of 12
ECOREGION REFERENCE STREAMS
SITE # STATUS STREAM USGS HUC LOCATION COUNTY LATITUDE LONGITUDE
FECO67G11 Active North Prong Fishdam
Creek
06010104
Holston
RM 1.6, U/S SR 34 Sullivan 36.5344 -82.0192
FECO67H04 Active Blackburn Creek 06020002
Hiwassee
RM1.8, 0.24 mi U/S Blackburn Hollow Rd Bradley 35.22472 -84.97055
FECO67H08 Active Parker Creek 06010104
Holston
RM 0.5, Holston Army Ammunition Property Hawkins 36.5225 -82.65888
FECO67I12 Active Mill Branch 06010207
Lower Clinch
RM 1.2, Below confluence of 2 tribs off
Tuskegee Drive
Anderson 35.98833 -84.28888
FECO68A01 Active Douglas Branch 06010208
Emory
RM 0.1, Barnett Bridge Road Morgan 36.1 -84.777
FECO68C12 Active Ellis Gap Branch 06020001
Tennessee
RM 0.4, U/S Mullens Cove Rd, Prentice Cooper
State Forest
Marion 35.04916 -85.47277
FECO69D01 Active Unnamed tributary to
New River
05130104
South Fork
Cumberland
RM 0.1, U/S Hwy 116 Morgan 36.12090 -84.43214
FECO69D03 New Bear Branch 06010205 Upper
Clinch
RM 0.1, U/S Hwy 68 Campbell 36.39916 -84.30928
FECO69D04 New Wheeler Creek UT 05130104
Cumberland South
Fork
RM 0.6, @ Big Bruce Ridge Campbell 36.30771 -84.27522
FECO71E01 New Sulphur Fork UT 05130206 Red RM 0.1, OFF HWY 256 Robertson 36.51460 -87.05695
FECO71E02 New Savage Branch 05130206 Red RM 1.2, U/S Distillery Rd Off Hwy 76 Robertson 36.47534 -86.76083
FECO71E03 New Brush Creek 05130206 Red Rm 9.0, U/S Gause Rd Robertson 36.4342 -87.06622
FECO71F01 Active Unnamed tributary to
Little Swan Creek
06040003
Lower Duck
RM 0.1, Off DP Humphreys Rd Lewis 35.5 -87.418
FECO71F02 New Hurricane Creek UT 06040004 Buffalo U/S Hurricane Creek Rd (Bryson Hollow) 35.57647 -87.75973
FECO71F03 Active Ethridge Hollow 06040003
Lower Duck
RM 0.1, U/S Hwy 230 Humphreys 35.9407 -87.6530
FECO71F04 New Marrowbone Creek UT 05130202
Cumberland
(Cheatham)
RM 0.1, U/S Little Morrowbone Rd in Beamsn
City park
Davidson 36.27212 -86.9049
FECO71G01 Active Flat Creek 05130106
Upper Cumberland
RM 8.3, Upper Hillman Rd Overton 36.4 -85.374
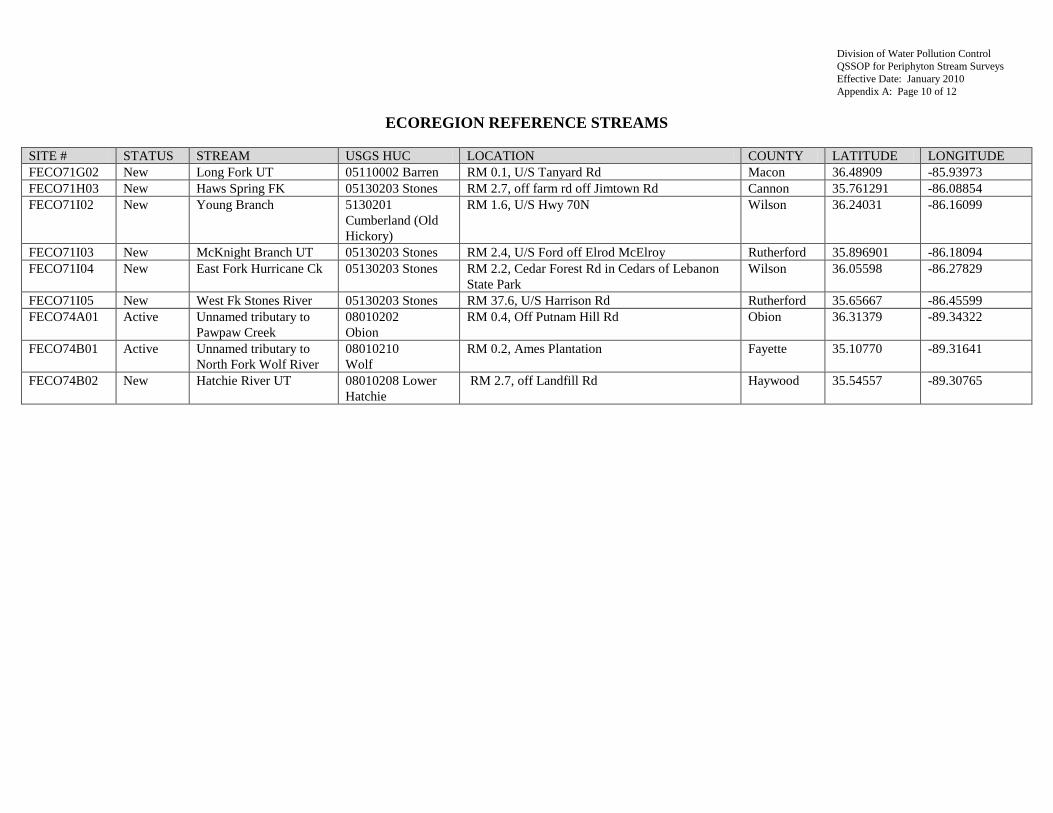
Division of Water Pollution Control
QSSOP for Periphyton Stream Surveys
Effective Date: January 2010
Appendix A: Page 10 of 12
ECOREGION REFERENCE STREAMS
SITE # STATUS STREAM USGS HUC LOCATION COUNTY LATITUDE LONGITUDE
FECO71G02 New Long Fork UT 05110002 Barren RM 0.1, U/S Tanyard Rd Macon 36.48909 -85.93973
FECO71H03 New Haws Spring FK 05130203 Stones RM 2.7, off farm rd off Jimtown Rd Cannon 35.761291 -86.08854
FECO71I02 New Young Branch 5130201
Cumberland (Old
Hickory)
RM 1.6, U/S Hwy 70N Wilson 36.24031 -86.16099
FECO71I03 New McKnight Branch UT 05130203 Stones RM 2.4, U/S Ford off Elrod McElroy Rutherford 35.896901 -86.18094
FECO71I04 New East Fork Hurricane Ck 05130203 Stones RM 2.2, Cedar Forest Rd in Cedars of Lebanon
State Park
Wilson 36.05598 -86.27829
FECO71I05 New West Fk Stones River 05130203 Stones RM 37.6, U/S Harrison Rd Rutherford 35.65667 -86.45599
FECO74A01 Active Unnamed tributary to
Pawpaw Creek
08010202
Obion
RM 0.4, Off Putnam Hill Rd Obion 36.31379 -89.34322
FECO74B01 Active Unnamed tributary to
North Fork Wolf River
08010210
Wolf
RM 0.2, Ames Plantation Fayette 35.10770 -89.31641
FECO74B02 New Hatchie River UT 08010208 Lower
Hatchie
RM 2.7, off Landfill Rd Haywood 35.54557 -89.30765
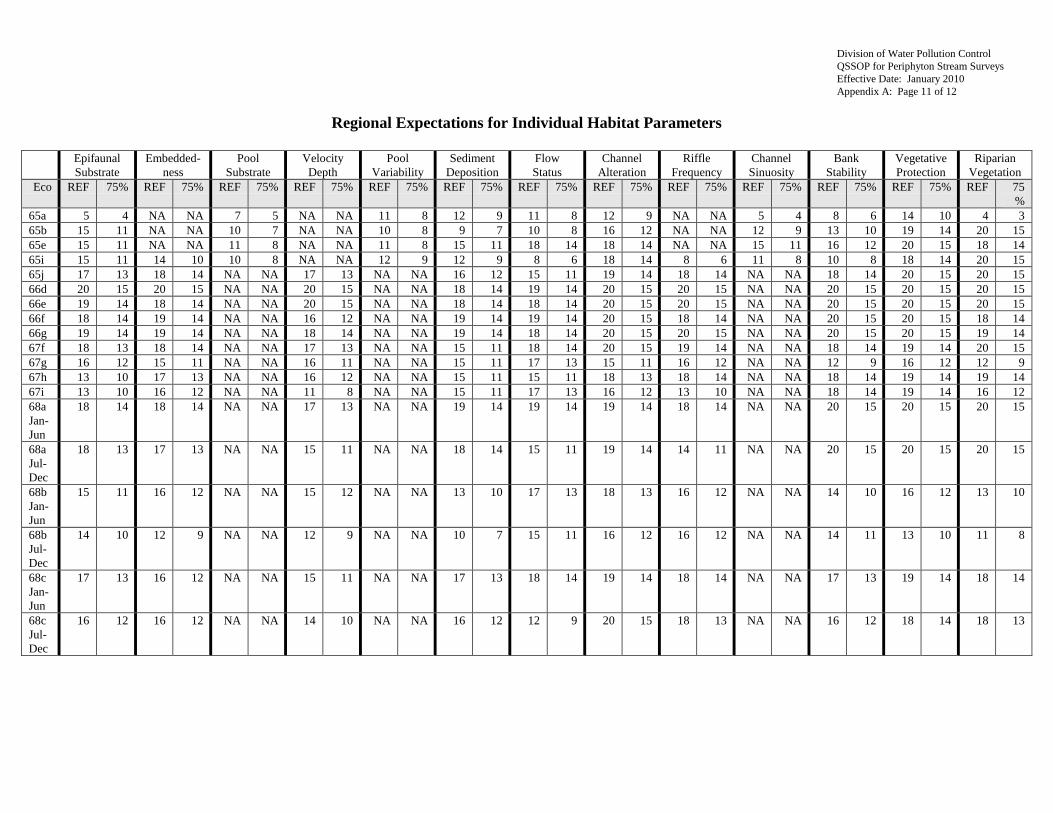
Division of Water Pollution Control
QSSOP for Periphyton Stream Surveys
Effective Date: January 2010
Appendix A: Page 11 of 12
Regional Expectations for Individual Habitat Parameters
Epifaunal
Substrate
Embedded-
ness
Pool
Substrate
Velocity
Depth
Pool
Variability
Sediment
Deposition
Flow
Status
Channel
Alteration
Riffle
Frequency
Channel
Sinuosity
Bank
Stability
Vegetative
Protection
Riparian
Vegetation
Eco REF 75% REF 75% REF 75% REF 75% REF 75% REF 75% REF 75% REF 75% REF 75% REF 75% REF 75% REF 75% REF 75
%
65a 5 4 NA NA 7 5 NA NA 11 8 12 9 11 8 12 9 NA NA 5 4 8 6 14 10 4 3
65b 15 11 NA NA 10 7 NA NA 10 8 9 7 10 8 16 12 NA NA 12 9 13 10 19 14 20 15
65e 15 11 NA NA 11 8 NA NA 11 8 15 11 18 14 18 14 NA NA 15 11 16 12 20 15 18 14
65i 15 11 14 10 10 8 NA NA 12 9 12 9 8 6 18 14 8 6 11 8 10 8 18 14 20 15
65j 17 13 18 14 NA NA 17 13 NA NA 16 12 15 11 19 14 18 14 NA NA 18 14 20 15 20 15
66d 20 15 20 15 NA NA 20 15 NA NA 18 14 19 14 20 15 20 15 NA NA 20 15 20 15 20 15
66e 19 14 18 14 NA NA 20 15 NA NA 18 14 18 14 20 15 20 15 NA NA 20 15 20 15 20 15
66f 18 14 19 14 NA NA 16 12 NA NA 19 14 19 14 20 15 18 14 NA NA 20 15 20 15 18 14
66g 19 14 19 14 NA NA 18 14 NA NA 19 14 18 14 20 15 20 15 NA NA 20 15 20 15 19 14
67f 18 13 18 14 NA NA 17 13 NA NA 15 11 18 14 20 15 19 14 NA NA 18 14 19 14 20 15
67g 16 12 15 11 NA NA 16 11 NA NA 15 11 17 13 15 11 16 12 NA NA 12 9 16 12 12 9
67h 13 10 17 13 NA NA 16 12 NA NA 15 11 15 11 18 13 18 14 NA NA 18 14 19 14 19 14
67i 13 10 16 12 NA NA 11 8 NA NA 15 11 17 13 16 12 13 10 NA NA 18 14 19 14 16 12
68a
Jan-
Jun
18 14 18 14 NA NA 17 13 NA NA 19 14 19 14 19 14 18 14 NA NA 20 15 20 15 20 15
68a
Jul-
Dec
18 13 17 13 NA NA 15 11 NA NA 18 14 15 11 19 14 14 11 NA NA 20 15 20 15 20 15
68b
Jan-
Jun
15 11 16 12 NA NA 15 12 NA NA 13 10 17 13 18 13 16 12 NA NA 14 10 16 12 13 10
68b
Jul-
Dec
14 10 12 9 NA NA 12 9 NA NA 10 7 15 11 16 12 16 12 NA NA 14 11 13 10 11 8
68c
Jan-
Jun
17 13 16 12 NA NA 15 11 NA NA 17 13 18 14 19 14 18 14 NA NA 17 13 19 14 18 14
68c
Jul-
Dec
16 12 16 12 NA NA 14 10 NA NA 16 12 12 9 20 15 18 13 NA NA 16 12 18 14 18 13
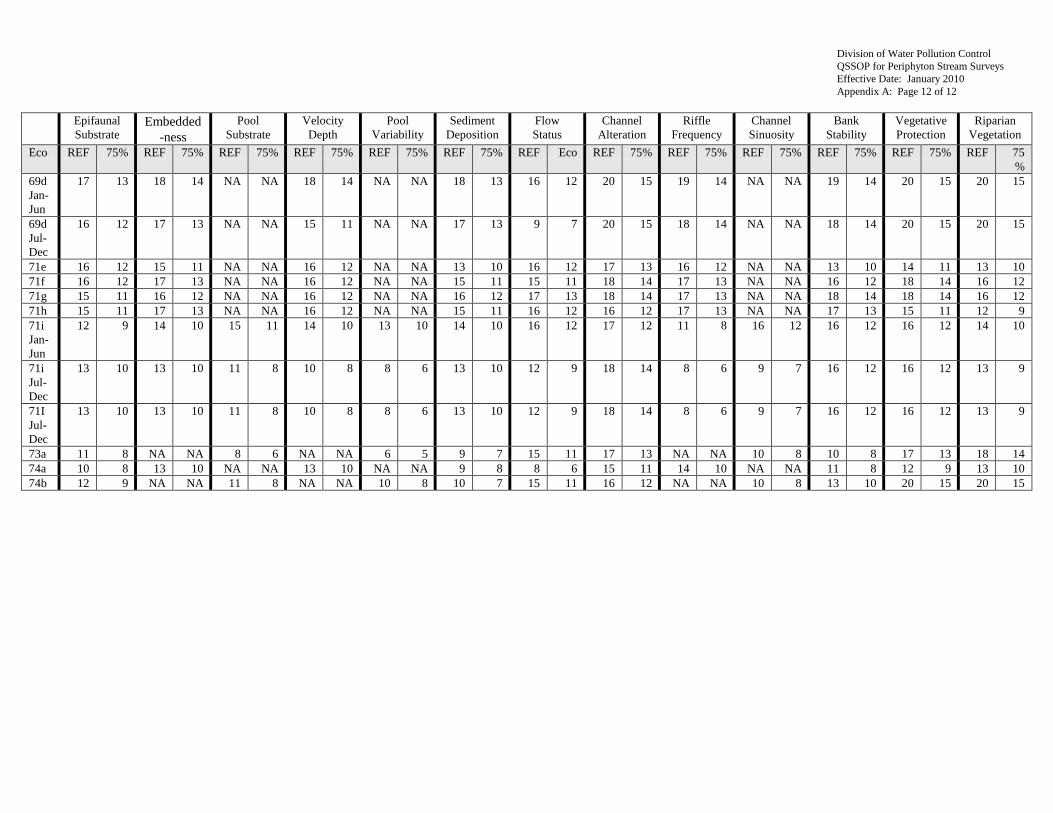
Division of Water Pollution Control
QSSOP for Periphyton Stream Surveys
Effective Date: January 2010
Appendix A: Page 12 of 12
Epifaunal
Substrate Embedded
-ness
Pool
Substrate
Velocity
Depth
Pool
Variability
Sediment
Deposition
Flow
Status
Channel
Alteration
Riffle
Frequency
Channel
Sinuosity
Bank
Stability
Vegetative
Protection
Riparian
Vegetation
Eco REF 75% REF 75% REF 75% REF 75% REF 75% REF 75% REF Eco REF 75% REF 75% REF 75% REF 75% REF 75% REF 75
%
69d
Jan-
Jun
17 13 18 14 NA NA 18 14 NA NA 18 13 16 12 20 15 19 14 NA NA 19 14 20 15 20 15
69d
Jul-
Dec
16 12 17 13 NA NA 15 11 NA NA 17 13 9 7 20 15 18 14 NA NA 18 14 20 15 20 15
71e 16 12 15 11 NA NA 16 12 NA NA 13 10 16 12 17 13 16 12 NA NA 13 10 14 11 13 10
71f 16 12 17 13 NA NA 16 12 NA NA 15 11 15 11 18 14 17 13 NA NA 16 12 18 14 16 12
71g 15 11 16 12 NA NA 16 12 NA NA 16 12 17 13 18 14 17 13 NA NA 18 14 18 14 16 12
71h 15 11 17 13 NA NA 16 12 NA NA 15 11 16 12 16 12 17 13 NA NA 17 13 15 11 12 9
71i
Jan-
Jun
12 9 14 10 15 11 14 10 13 10 14 10 16 12 17 12 11 8 16 12 16 12 16 12 14 10
71i
Jul-
Dec
13 10 13 10 11 8 10 8 8 6 13 10 12 9 18 14 8 6 9 7 16 12 16 12 13 9
71I
Jul-
Dec
13 10 13 10 11 8 10 8 8 6 13 10 12 9 18 14 8 6 9 7 16 12 16 12 13 9
73a 11 8 NA NA 8 6 NA NA 6 5 9 7 15 11 17 13 NA NA 10 8 10 8 17 13 18 14
74a 10 8 13 10 NA NA 13 10 NA NA 9 8 8 6 15 11 14 10 NA NA 11 8 12 9 13 10
74b 12 9 NA NA 11 8 NA NA 10 8 10 7 15 11 16 12 NA NA 10 8 13 10 20 15 20 15

Division of Water Pollution Control
QSSOP for Periphyton Stream Surveys
Effective Date: January 2010
Appendix B: Page 1 of 13
APPENDIX B
FORMS AND DATA SHEETS
COUNTY AND STATE ABBREVIATIONS AND CODE NUMBERS
HABITAT ASSESSMENT DATA SHEETS
RAPID PERIPHYTON SURVEY (RPS) DATA SHEET
BIOLOGICAL SAMPLE REQUEST INCLUDING CHAIN OF CUSTODY FORM
NON-DIATOM ALGAE TAXONOMIC BENCH SHEET
DIATOM ALGAE TAXONOMIC BENCH SHEET
PERIPHYTON ASSESSMENT REPORT
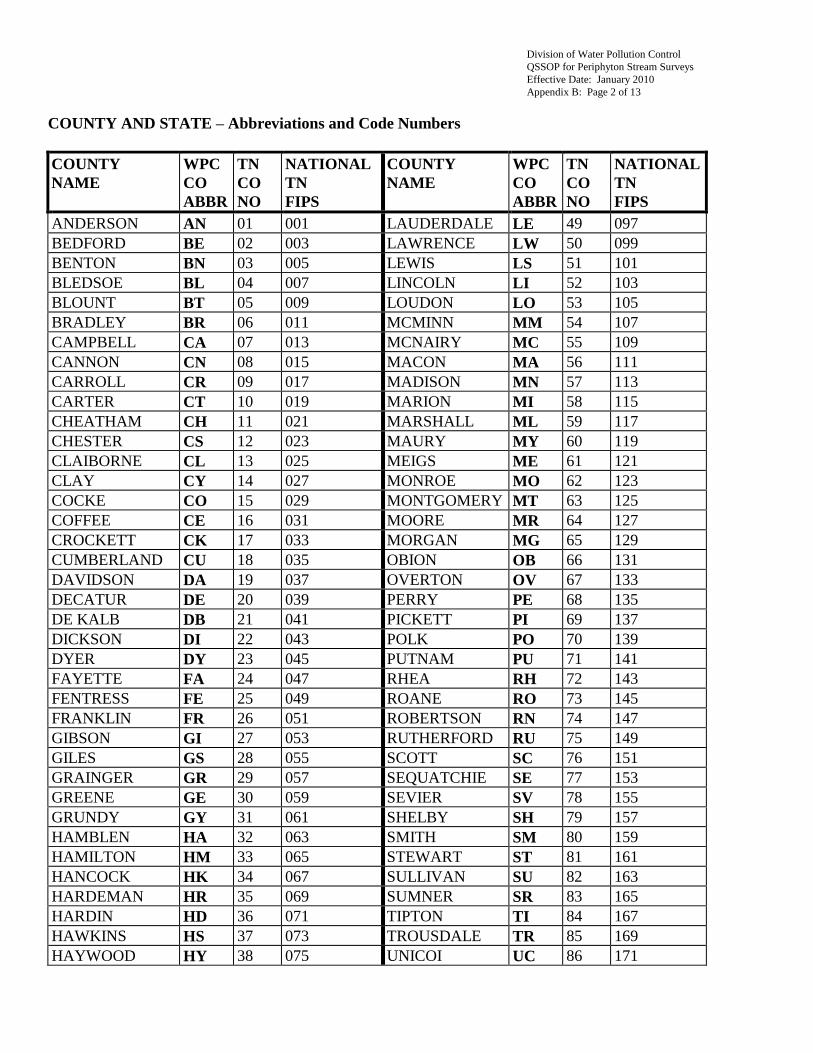
Division of Water Pollution Control
QSSOP for Periphyton Stream Surveys
Effective Date: January 2010
Appendix B: Page 2 of 13
COUNTY AND STATE – Abbreviations and Code Numbers
COUNTY
NAME
WPC
CO
ABBR
TN
CO
NO
NATIONAL
TN
FIPS
COUNTY
NAME
WPC
CO
ABBR
TN
CO
NO
NATIONAL
TN
FIPS
ANDERSON AN 01 001 LAUDERDALE LE 49 097
BEDFORD BE 02 003 LAWRENCE LW 50 099
BENTON BN 03 005 LEWIS LS 51 101
BLEDSOE BL 04 007 LINCOLN LI 52 103
BLOUNT BT 05 009 LOUDON LO 53 105
BRADLEY BR 06 011 MCMINN MM 54 107
CAMPBELL CA 07 013 MCNAIRY MC 55 109
CANNON CN 08 015 MACON MA 56 111
CARROLL CR 09 017 MADISON MN 57 113
CARTER CT 10 019 MARION MI 58 115
CHEATHAM CH 11 021 MARSHALL ML 59 117
CHESTER CS 12 023 MAURY MY 60 119
CLAIBORNE CL 13 025 MEIGS ME 61 121
CLAY CY 14 027 MONROE MO 62 123
COCKE CO 15 029 MONTGOMERY MT 63 125
COFFEE CE 16 031 MOORE MR 64 127
CROCKETT CK 17 033 MORGAN MG 65 129
CUMBERLAND CU 18 035 OBION OB 66 131
DAVIDSON DA 19 037 OVERTON OV 67 133
DECATUR DE 20 039 PERRY PE 68 135
DE KALB DB 21 041 PICKETT PI 69 137
DICKSON DI 22 043 POLK PO 70 139
DYER DY 23 045 PUTNAM PU 71 141
FAYETTE FA 24 047 RHEA RH 72 143
FENTRESS FE 25 049 ROANE RO 73 145
FRANKLIN FR 26 051 ROBERTSON RN 74 147
GIBSON GI 27 053 RUTHERFORD RU 75 149
GILES GS 28 055 SCOTT SC 76 151
GRAINGER GR 29 057 SEQUATCHIE SE 77 153
GREENE GE 30 059 SEVIER SV 78 155
GRUNDY GY 31 061 SHELBY SH 79 157
HAMBLEN HA 32 063 SMITH SM 80 159
HAMILTON HM 33 065 STEWART ST 81 161
HANCOCK HK 34 067 SULLIVAN SU 82 163
HARDEMAN HR 35 069 SUMNER SR 83 165
HARDIN HD 36 071 TIPTON TI 84 167
HAWKINS HS 37 073 TROUSDALE TR 85 169
HAYWOOD HY 38 075 UNICOI UC 86 171
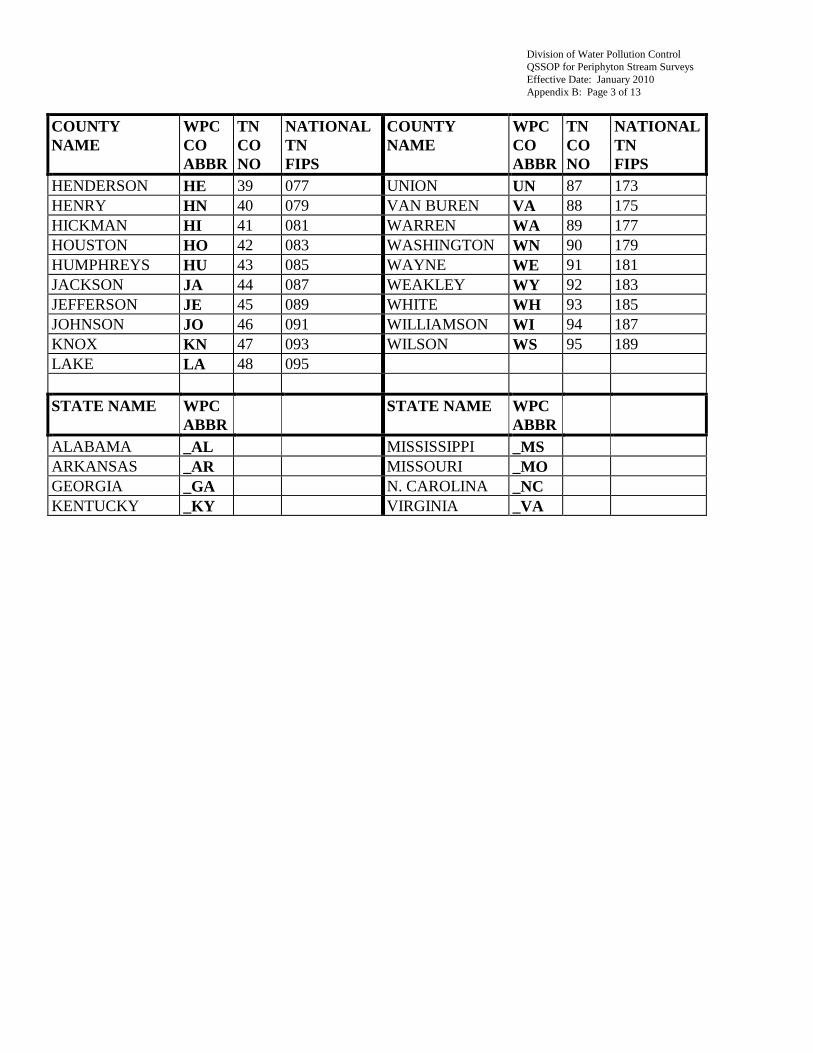
Division of Water Pollution Control
QSSOP for Periphyton Stream Surveys
Effective Date: January 2010
Appendix B: Page 3 of 13
COUNTY
NAME
WPC
CO
ABBR
TN
CO
NO
NATIONAL
TN
FIPS
COUNTY
NAME
WPC
CO
ABBR
TN
CO
NO
NATIONAL
TN
FIPS
HENDERSON HE 39 077 UNION UN 87 173
HENRY HN 40 079 VAN BUREN VA 88 175
HICKMAN HI 41 081 WARREN WA 89 177
HOUSTON HO 42 083 WASHINGTON WN 90 179
HUMPHREYS HU 43 085 WAYNE WE 91 181
JACKSON JA 44 087 WEAKLEY WY 92 183
JEFFERSON JE 45 089 WHITE WH 93 185
JOHNSON JO 46 091 WILLIAMSON WI 94 187
KNOX KN 47 093 WILSON WS 95 189
LAKE LA 48 095
STATE NAME WPC
ABBR
STATE NAME WPC
ABBR
ALABAMA _AL MISSISSIPPI _MS
ARKANSAS _AR MISSOURI _MO
GEORGIA _GA N. CAROLINA _NC
KENTUCKY _KY VIRGINIA _VA
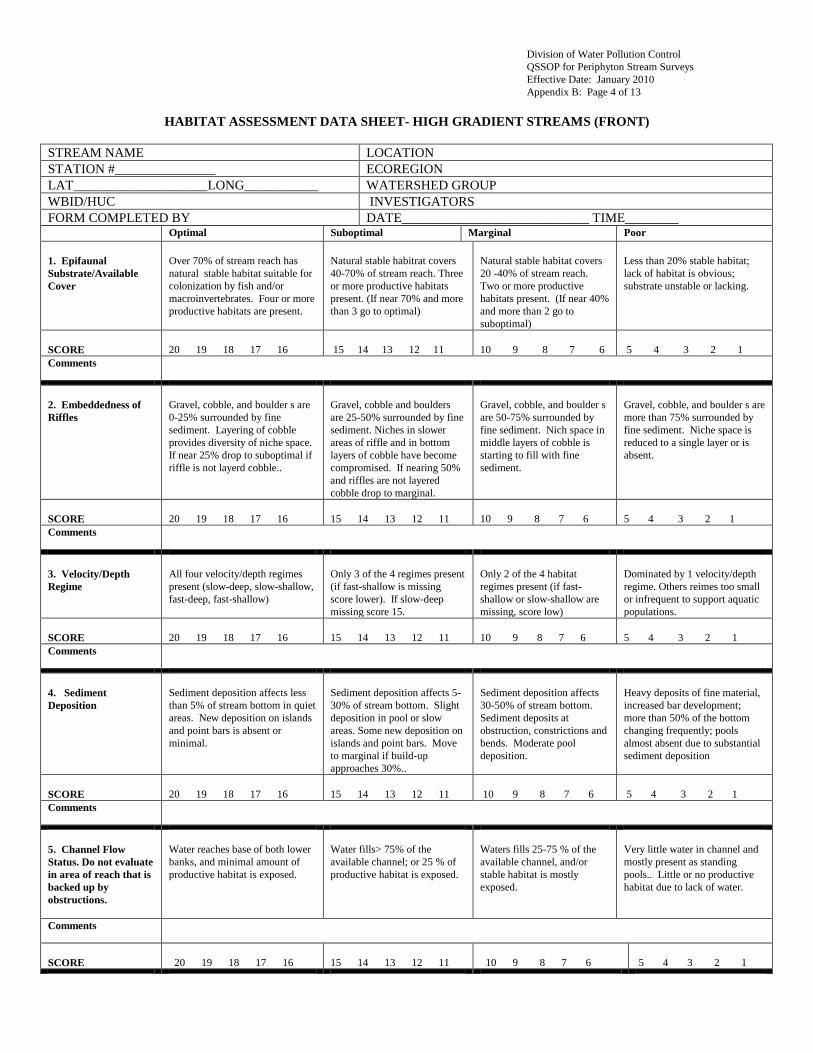
Division of Water Pollution Control
QSSOP for Periphyton Stream Surveys
Effective Date: January 2010
Appendix B: Page 4 of 13
HABITAT ASSESSMENT DATA SHEET- HIGH GRADIENT STREAMS (FRONT)
STREAM NAME LOCATION
STATION #_______________ ECOREGION
LAT____________________LONG___________ WATERSHED GROUP
WBID/HUC INVESTIGATORS
FORM COMPLETED BY DATE____________________________ TIME________ Optimal Suboptimal Marginal Poor
1. Epifaunal
Substrate/Available
Cover
Over 70% of stream reach has
natural stable habitat suitable for
colonization by fish and/or
macroinvertebrates. Four or more
productive habitats are present.
Natural stable habitrat covers
40-70% of stream reach. Three
or more productive habitats
present. (If near 70% and more
than 3 go to optimal)
Natural stable habitat covers
20 -40% of stream reach.
Two or more productive
habitats present. (If near 40%
and more than 2 go to
suboptimal)
Less than 20% stable habitat;
lack of habitat is obvious;
substrate unstable or lacking.
SCORE
20 19 18 17 16
15 14 13 12 11
10 9 8 7 6
5 4 3 2 1
Comments
2. Embeddedness of
Riffles
Gravel, cobble, and boulder s are
0-25% surrounded by fine
sediment. Layering of cobble
provides diversity of niche space.
If near 25% drop to suboptimal if
riffle is not layerd cobble..
Gravel, cobble and boulders
are 25-50% surrounded by fine
sediment. Niches in slower
areas of riffle and in bottom
layers of cobble have become
compromised. If nearing 50%
and riffles are not layered
cobble drop to marginal.
Gravel, cobble, and boulder s
are 50-75% surrounded by
fine sediment. Nich space in
middle layers of cobble is
starting to fill with fine
sediment.
Gravel, cobble, and boulder s are
more than 75% surrounded by
fine sediment. Niche space is
reduced to a single layer or is
absent.
SCORE
20 19 18 17 16
15 14 13 12 11
10 9 8 7 6
5 4 3 2 1
Comments
3. Velocity/Depth
Regime
All four velocity/depth regimes
present (slow-deep, slow-shallow,
fast-deep, fast-shallow)
Only 3 of the 4 regimes present
(if fast-shallow is missing
score lower). If slow-deep
missing score 15.
Only 2 of the 4 habitat
regimes present (if fast-
shallow or slow-shallow are
missing, score low)
Dominated by 1 velocity/depth
regime. Others reimes too small
or infrequent to support aquatic
populations.
SCORE
20 19 18 17 16
15 14 13 12 11
10 9 8 7 6
5 4 3 2 1
Comments
4. Sediment
Deposition
Sediment deposition affects less
than 5% of stream bottom in quiet
areas. New deposition on islands
and point bars is absent or
minimal.
Sediment deposition affects 5-
30% of stream bottom. Slight
deposition in pool or slow
areas. Some new deposition on
islands and point bars. Move
to marginal if build-up
approaches 30%..
Sediment deposition affects
30-50% of stream bottom.
Sediment deposits at
obstruction, constrictions and
bends. Moderate pool
deposition.
Heavy deposits of fine material,
increased bar development;
more than 50% of the bottom
changing frequently; pools
almost absent due to substantial
sediment deposition
SCORE
20 19 18 17 16
15 14 13 12 11
10 9 8 7 6
5 4 3 2 1
Comments
5. Channel Flow
Status. Do not evaluate
in area of reach that is
backed up by
obstructions.
Water reaches base of both lower
banks, and minimal amount of
productive habitat is exposed.
Water fills> 75% of the
available channel; or 25 % of
productive habitat is exposed.
Waters fills 25-75 % of the
available channel, and/or
stable habitat is mostly
exposed.
Very little water in channel and
mostly present as standing
pools.. Little or no productive
habitat due to lack of water.
Comments
SCORE
20 19 18 17 16
15 14 13 12 11
10 9 8 7 6
5 4 3 2 1
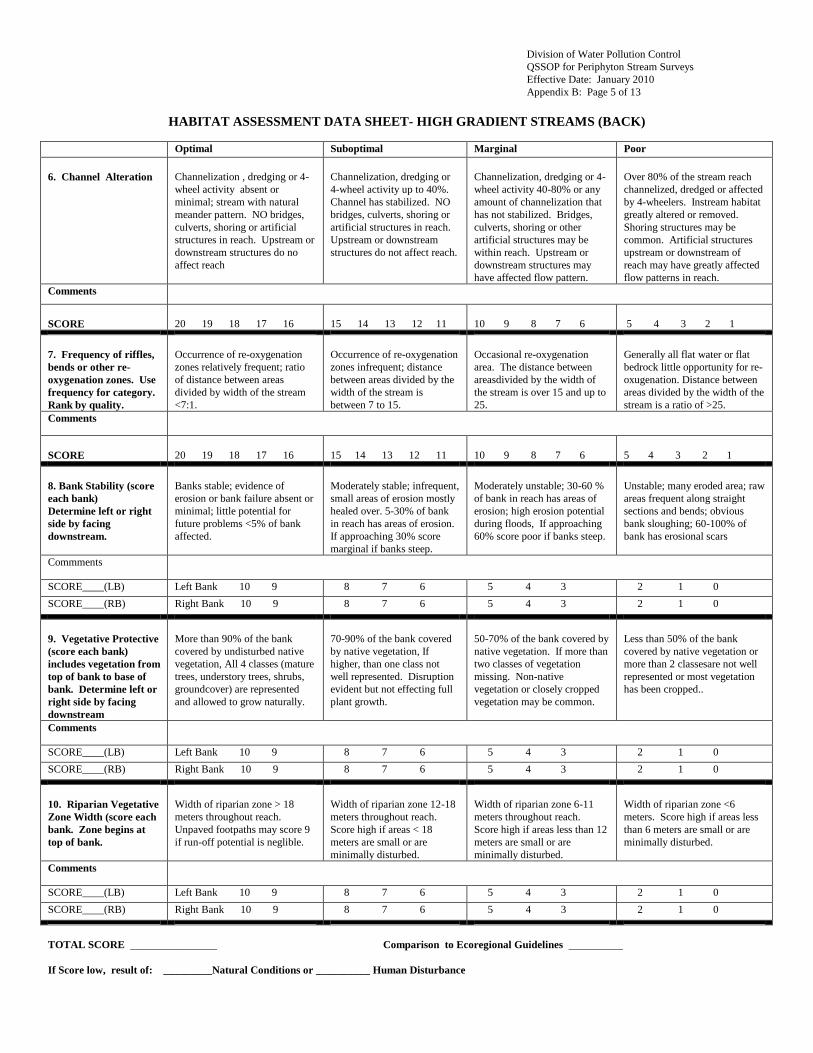
Division of Water Pollution Control
QSSOP for Periphyton Stream Surveys
Effective Date: January 2010
Appendix B: Page 5 of 13
HABITAT ASSESSMENT DATA SHEET- HIGH GRADIENT STREAMS (BACK)
Optimal Suboptimal Marginal Poor
6. Channel Alteration
Channelization , dredging or 4-
wheel activity absent or
minimal; stream with natural
meander pattern. NO bridges,
culverts, shoring or artificial
structures in reach. Upstream or
downstream structures do no
affect reach
Channelization, dredging or
4-wheel activity up to 40%.
Channel has stabilized. NO
bridges, culverts, shoring or
artificial structures in reach.
Upstream or downstream
structures do not affect reach.
Channelization, dredging or 4-
wheel activity 40-80% or any
amount of channelization that
has not stabilized. Bridges,
culverts, shoring or other
artificial structures may be
within reach. Upstream or
downstream structures may
have affected flow pattern.
Over 80% of the stream reach
channelized, dredged or affected
by 4-wheelers. Instream habitat
greatly altered or removed.
Shoring structures may be
common. Artificial structures
upstream or downstream of
reach may have greatly affected
flow patterns in reach.
Comments
SCORE
20 19 18 17 16
15 14 13 12 11
10 9 8 7 6
5 4 3 2 1
7. Frequency of riffles,
bends or other re-
oxygenation zones. Use
frequency for category.
Rank by quality.
Occurrence of re-oxygenation
zones relatively frequent; ratio
of distance between areas
divided by width of the stream
<7:1.
Occurrence of re-oxygenation
zones infrequent; distance
between areas divided by the
width of the stream is
between 7 to 15.
Occasional re-oxygenation
area. The distance between
areasdivided by the width of
the stream is over 15 and up to
25.
Generally all flat water or flat
bedrock little opportunity for re-
oxugenation. Distance between
areas divided by the width of the
stream is a ratio of >25.
Comments
SCORE
20 19 18 17 16
15 14 13 12 11
10 9 8 7 6
5 4 3 2 1
8. Bank Stability (score
each bank)
Determine left or right
side by facing
downstream.
Banks stable; evidence of
erosion or bank failure absent or
minimal; little potential for
future problems <5% of bank
affected.
Moderately stable; infrequent,
small areas of erosion mostly
healed over. 5-30% of bank
in reach has areas of erosion.
If approaching 30% score
marginal if banks steep.
Moderately unstable; 30-60 %
of bank in reach has areas of
erosion; high erosion potential
during floods, If approaching
60% score poor if banks steep.
Unstable; many eroded area; raw
areas frequent along straight
sections and bends; obvious
bank sloughing; 60-100% of
bank has erosional scars
Commments
SCORE____(LB) Left Bank 10 9 8 7 6 5 4 3 2 1 0
SCORE____(RB) Right Bank 10 9 8 7 6 5 4 3 2 1 0
9. Vegetative Protective
(score each bank)
includes vegetation from
top of bank to base of
bank. Determine left or
right side by facing
downstream
More than 90% of the bank
covered by undisturbed native
vegetation, All 4 classes (mature
trees, understory trees, shrubs,
groundcover) are represented
and allowed to grow naturally.
70-90% of the bank covered
by native vegetation, If
higher, than one class not
well represented. Disruption
evident but not effecting full
plant growth.
50-70% of the bank covered by
native vegetation. If more than
two classes of vegetation
missing. Non-native
vegetation or closely cropped
vegetation may be common.
Less than 50% of the bank
covered by native vegetation or
more than 2 classesare not well
represented or most vegetation
has been cropped..
Comments
SCORE____(LB) Left Bank 10 9 8 7 6 5 4 3 2 1 0
SCORE____(RB) Right Bank 10 9 8 7 6 5 4 3 2 1 0
10. Riparian Vegetative
Zone Width (score each
bank. Zone begins at
top of bank.
Width of riparian zone > 18
meters throughout reach.
Unpaved footpaths may score 9
if run-off potential is neglible.
Width of riparian zone 12-18
meters throughout reach.
Score high if areas < 18
meters are small or are
minimally disturbed.
Width of riparian zone 6-11
meters throughout reach.
Score high if areas less than 12
meters are small or are
minimally disturbed.
Width of riparian zone <6
meters. Score high if areas less
than 6 meters are small or are
minimally disturbed.
Comments
SCORE____(LB) Left Bank 10 9 8 7 6 5 4 3 2 1 0
SCORE____(RB) Right Bank 10 9 8 7 6 5 4 3 2 1 0
TOTAL SCORE ________________ Comparison to Ecoregional Guidelines __________
If Score low, result of: _________Natural Conditions or __________ Human Disturbance
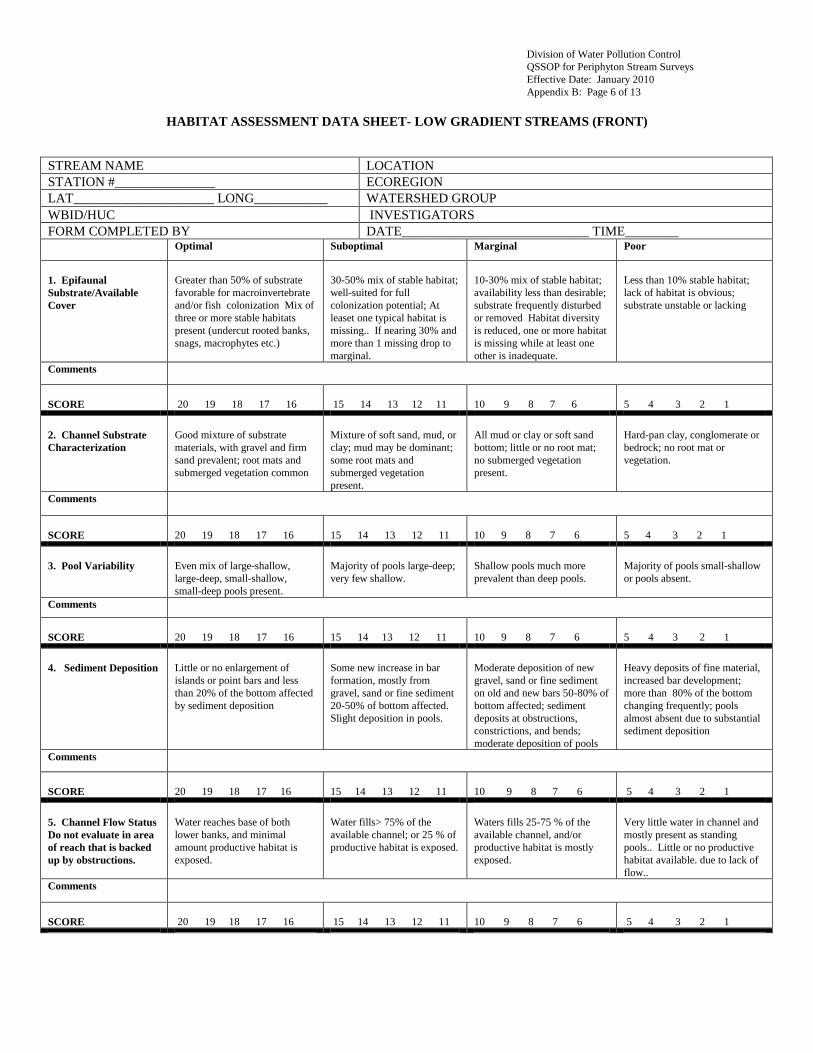
Division of Water Pollution Control
QSSOP for Periphyton Stream Surveys
Effective Date: January 2010
Appendix B: Page 6 of 13
HABITAT ASSESSMENT DATA SHEET- LOW GRADIENT STREAMS (FRONT)
STREAM NAME LOCATION
STATION #_______________ ECOREGION
LAT_____________________ LONG___________ WATERSHED GROUP
WBID/HUC INVESTIGATORS
FORM COMPLETED BY DATE____________________________ TIME________ Optimal Suboptimal Marginal Poor
1. Epifaunal
Substrate/Available
Cover
Greater than 50% of substrate
favorable for macroinvertebrate
and/or fish colonization Mix of
three or more stable habitats
present (undercut rooted banks,
snags, macrophytes etc.)
30-50% mix of stable habitat;
well-suited for full
colonization potential; At
leaset one typical habitat is
missing.. If nearing 30% and
more than 1 missing drop to
marginal.
10-30% mix of stable habitat;
availability less than desirable;
substrate frequently disturbed
or removed Habitat diversity
is reduced, one or more habitat
is missing while at least one
other is inadequate.
Less than 10% stable habitat;
lack of habitat is obvious;
substrate unstable or lacking
Comments
SCORE
20 19 18 17 16
15 14 13 12 11
10 9 8 7 6
5 4 3 2 1
2. Channel Substrate
Characterization
Good mixture of substrate
materials, with gravel and firm
sand prevalent; root mats and
submerged vegetation common
Mixture of soft sand, mud, or
clay; mud may be dominant;
some root mats and
submerged vegetation
present.
All mud or clay or soft sand
bottom; little or no root mat;
no submerged vegetation
present.
Hard-pan clay, conglomerate or
bedrock; no root mat or
vegetation.
Comments
SCORE
20 19 18 17 16
15 14 13 12 11
10 9 8 7 6
5 4 3 2 1
3. Pool Variability
Even mix of large-shallow,
large-deep, small-shallow,
small-deep pools present.
Majority of pools large-deep;
very few shallow.
Shallow pools much more
prevalent than deep pools.
Majority of pools small-shallow
or pools absent.
Comments
SCORE
20 19 18 17 16
15 14 13 12 11
10 9 8 7 6
5 4 3 2 1
4. Sediment Deposition
Little or no enlargement of
islands or point bars and less
than 20% of the bottom affected
by sediment deposition
Some new increase in bar
formation, mostly from
gravel, sand or fine sediment
20-50% of bottom affected.
Slight deposition in pools.
Moderate deposition of new
gravel, sand or fine sediment
on old and new bars 50-80% of
bottom affected; sediment
deposits at obstructions,
constrictions, and bends;
moderate deposition of pools
Heavy deposits of fine material,
increased bar development;
more than 80% of the bottom
changing frequently; pools
almost absent due to substantial
sediment deposition
Comments
SCORE
20 19 18 17 16
15 14 13 12 11
10 9 8 7 6
5 4 3 2 1
5. Channel Flow Status
Do not evaluate in area
of reach that is backed
up by obstructions.
Water reaches base of both
lower banks, and minimal
amount productive habitat is
exposed.
Water fills> 75% of the
available channel; or 25 % of
productive habitat is exposed.
Waters fills 25-75 % of the
available channel, and/or
productive habitat is mostly
exposed.
Very little water in channel and
mostly present as standing
pools.. Little or no productive
habitat available. due to lack of
flow..
Comments
SCORE
20 19 18 17 16
15 14 13 12 11
10 9 8 7 6
5 4 3 2 1
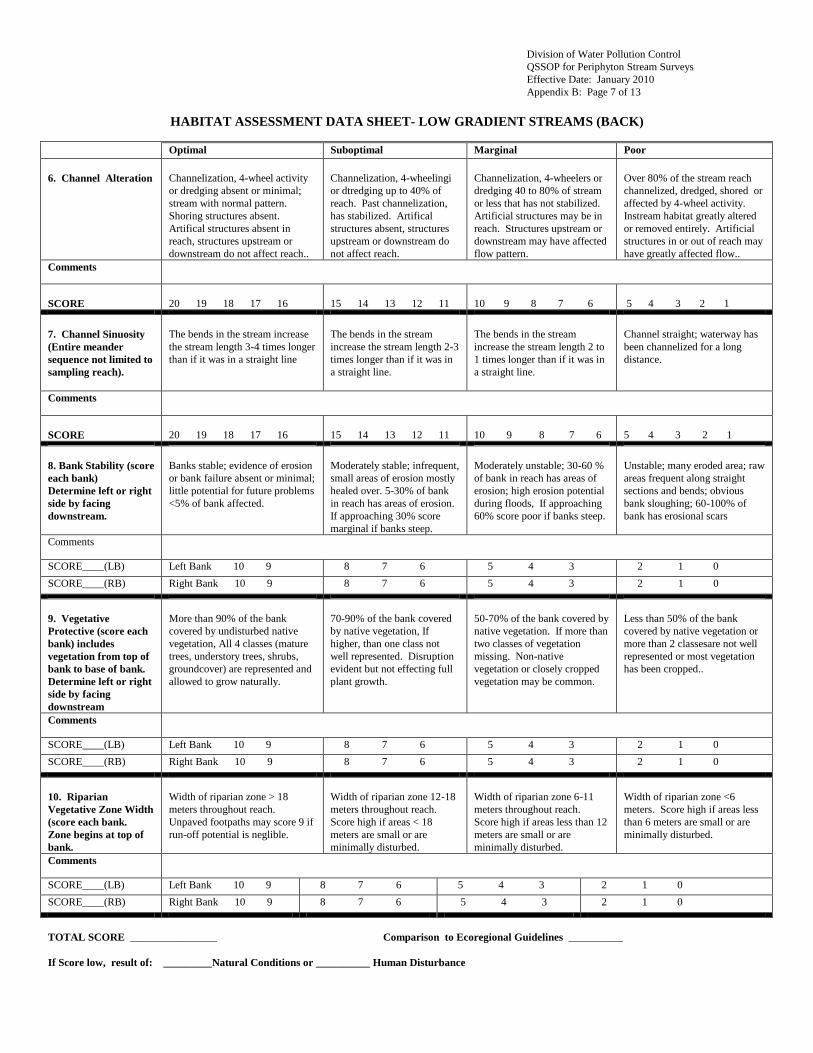
Division of Water Pollution Control
QSSOP for Periphyton Stream Surveys
Effective Date: January 2010
Appendix B: Page 7 of 13
HABITAT ASSESSMENT DATA SHEET- LOW GRADIENT STREAMS (BACK)
Section 1:
Optimal Suboptimal Marginal Poor
6. Channel Alteration
Channelization, 4-wheel activity
or dredging absent or minimal;
stream with normal pattern.
Shoring structures absent.
Artifical structures absent in
reach, structures upstream or
downstream do not affect reach..
Channelization, 4-wheelingi
or dtredging up to 40% of
reach. Past channelization,
has stabilized. Artifical
structures absent, structures
upstream or downstream do
not affect reach.
Channelization, 4-wheelers or
dredging 40 to 80% of stream
or less that has not stabilized.
Artificial structures may be in
reach. Structures upstream or
downstream may have affected
flow pattern.
Over 80% of the stream reach
channelized, dredged, shored or
affected by 4-wheel activity.
Instream habitat greatly altered
or removed entirely. Artificial
structures in or out of reach may
have greatly affected flow..
Comments
SCORE
20 19 18 17 16
15 14 13 12 11
10 9 8 7 6
5 4 3 2 1
7. Channel Sinuosity
(Entire meander
sequence not limited to
sampling reach).
The bends in the stream increase
the stream length 3-4 times longer
than if it was in a straight line
The bends in the stream
increase the stream length 2-3
times longer than if it was in
a straight line.
The bends in the stream
increase the stream length 2 to
1 times longer than if it was in
a straight line.
Channel straight; waterway has
been channelized for a long
distance.
Comments
SCORE
20 19 18 17 16
15 14 13 12 11
10 9 8 7 6
5 4 3 2 1
8. Bank Stability (score
each bank)
Determine left or right
side by facing
downstream.
Banks stable; evidence of erosion
or bank failure absent or minimal;
little potential for future problems
<5% of bank affected.
Moderately stable; infrequent,
small areas of erosion mostly
healed over. 5-30% of bank
in reach has areas of erosion.
If approaching 30% score
marginal if banks steep.
Moderately unstable; 30-60 %
of bank in reach has areas of
erosion; high erosion potential
during floods, If approaching
60% score poor if banks steep.
Unstable; many eroded area; raw
areas frequent along straight
sections and bends; obvious
bank sloughing; 60-100% of
bank has erosional scars
Comments
SCORE____(LB) Left Bank 10 9 8 7 6 5 4 3 2 1 0
SCORE____(RB) Right Bank 10 9 8 7 6 5 4 3 2 1 0
9. Vegetative
Protective (score each
bank) includes
vegetation from top of
bank to base of bank.
Determine left or right
side by facing
downstream
More than 90% of the bank
covered by undisturbed native
vegetation, All 4 classes (mature
trees, understory trees, shrubs,
groundcover) are represented and
allowed to grow naturally.
70-90% of the bank covered
by native vegetation, If
higher, than one class not
well represented. Disruption
evident but not effecting full
plant growth.
50-70% of the bank covered by
native vegetation. If more than
two classes of vegetation
missing. Non-native
vegetation or closely cropped
vegetation may be common.
Less than 50% of the bank
covered by native vegetation or
more than 2 classesare not well
represented or most vegetation
has been cropped..
Comments
SCORE____(LB) Left Bank 10 9 8 7 6 5 4 3 2 1 0
SCORE____(RB) Right Bank 10 9 8 7 6 5 4 3 2 1 0
10. Riparian
Vegetative Zone Width
(score each bank.
Zone begins at top of
bank.
Width of riparian zone > 18
meters throughout reach.
Unpaved footpaths may score 9 if
run-off potential is neglible.
Width of riparian zone 12-18
meters throughout reach.
Score high if areas < 18
meters are small or are
minimally disturbed.
Width of riparian zone 6-11
meters throughout reach.
Score high if areas less than 12
meters are small or are
minimally disturbed.
Width of riparian zone <6
meters. Score high if areas less
than 6 meters are small or are
minimally disturbed.
Comments
SCORE____(LB) Left Bank 10 9 8 7 6 5 4 3 2 1 0
SCORE____(RB) Right Bank 10 9 8 7 6 5 4 3 2 1 0
TOTAL SCORE ________________ Comparison to Ecoregional Guidelines __________
If Score low, result of: _________Natural Conditions or __________ Human Disturbance
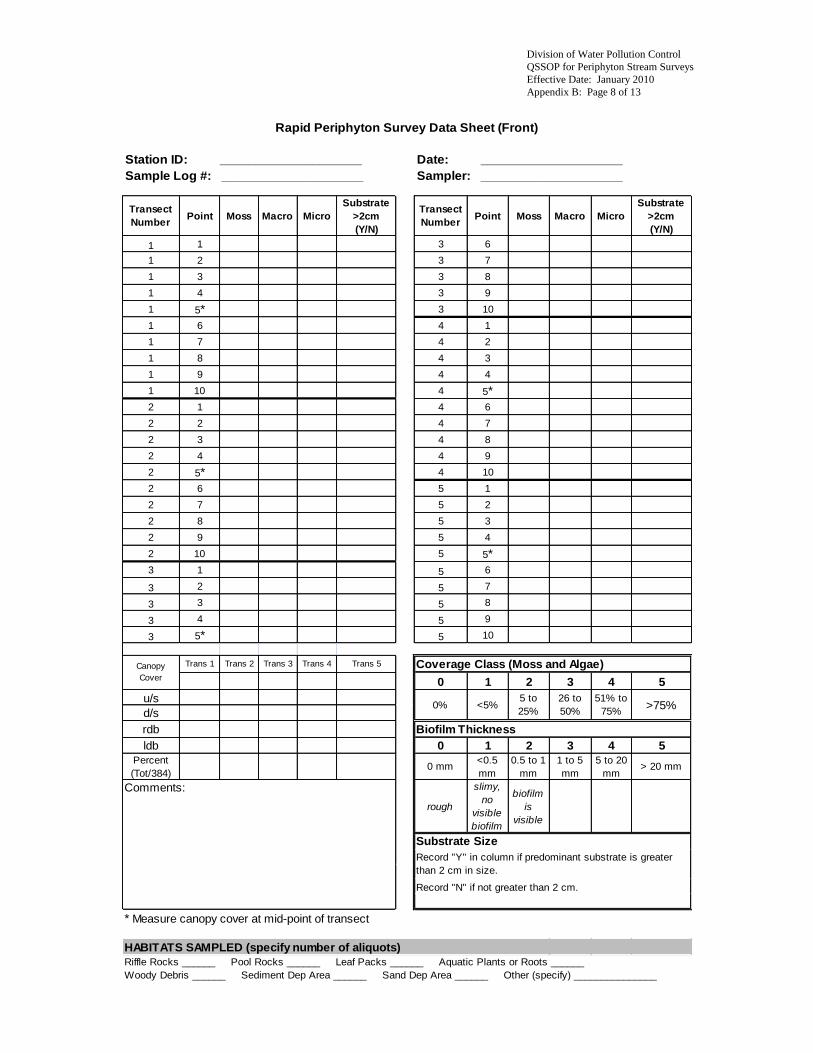
Division of Water Pollution Control
QSSOP for Periphyton Stream Surveys
Effective Date: January 2010
Appendix B: Page 8 of 13
Station ID: ____________________ Date: ____________________
Sample Log #: ____________________ Sampler: ____________________
Transect
NumberPoint Moss Macro Micro
Substrate
>2cm
(Y/N)
Transect
NumberPoint Moss Macro Micro
Substrate
>2cm
(Y/N)
1 1 3 6
1 2 3 7
1 3 3 8
1 4 3 9
1 5* 3 10
1 6 4 1
1 7 4 2
1 8 4 3
1 9 4 4
1 10 4 5*
2 1 4 6
2 2 4 7
2 3 4 8
2 4 4 9
2 5* 4 10
2 6 5 1
2 7 5 2
2 8 5 3
2 9 5 4
2 10 5 5*
3 1 5 6
3 2 5 7
3 3 5 8
3 4 5 9
3 5* 5 10
Trans 1 Trans 2 Trans 3 Trans 4 Trans 5
0 1 2 3 4 5
u/s
d/s
rdb
ldb 0 1 2 3 4 5
Percent
(Tot/384)0 mm
<0.5
mm
0.5 to 1
mm
1 to 5
mm
5 to 20
mm> 20 mm
rough
slimy,
no
visible
biofilm
biofilm
is
visible
Substrate Size
Record "N" if not greater than 2 cm.
* Measure canopy cover at mid-point of transect
HABITATS SAMPLED (specify number of aliquots)
Riffle Rocks ______ Pool Rocks ______ Leaf Packs ______ Aquatic Plants or Roots ______
Woody Debris ______ Sediment Dep Area ______ Sand Dep Area ______ Other (specify) _______________
Rapid Periphyton Survey Data Sheet (Front)
Comments:
Record "Y" in column if predominant substrate is greater
than 2 cm in size.
<5%51% to
75%>75%
5 to
25%
26 to
50%
Canopy
Cover
Coverage Class (Moss and Algae)
0%
Biofilm Thickness
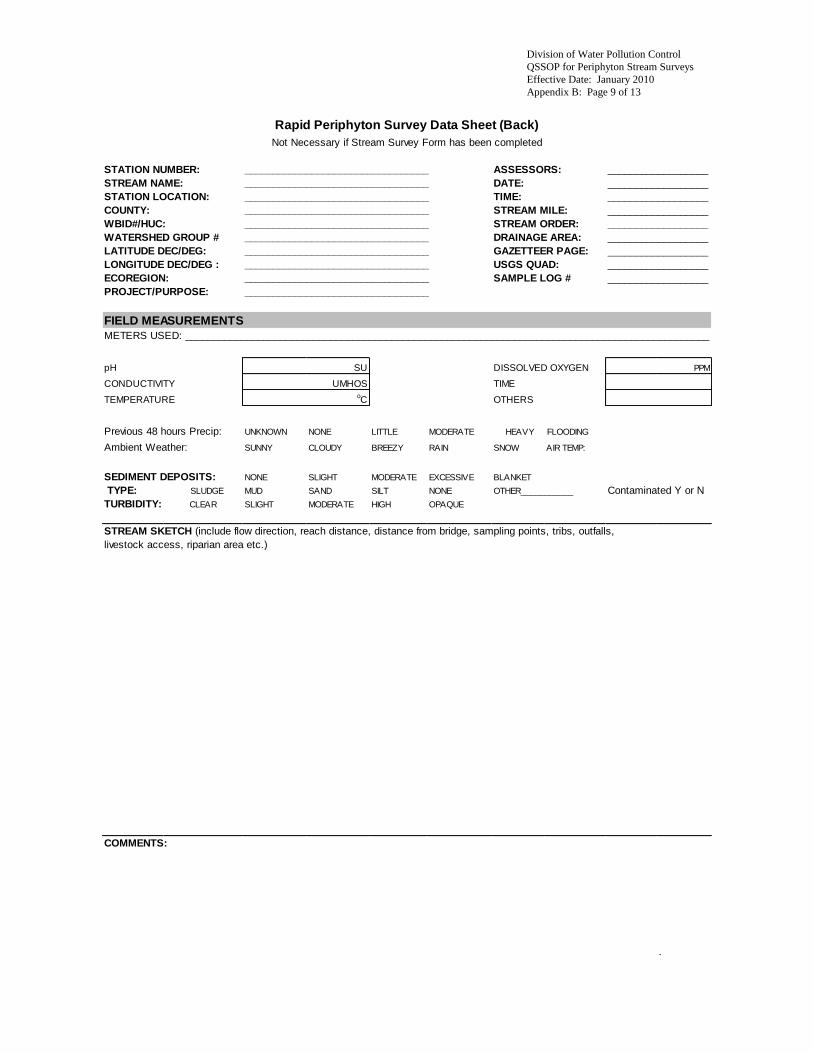
Division of Water Pollution Control
QSSOP for Periphyton Stream Surveys
Effective Date: January 2010
Appendix B: Page 9 of 13
STATION NUMBER: _________________________________ ASSESSORS:
STREAM NAME: _________________________________ DATE:
STATION LOCATION: _________________________________ TIME:
COUNTY: _________________________________ STREAM MILE:
WBID#/HUC: _________________________________ STREAM ORDER:
WATERSHED GROUP # _________________________________ DRAINAGE AREA:
LATITUDE DEC/DEG: _________________________________ GAZETTEER PAGE:
LONGITUDE DEC/DEG : _________________________________ USGS QUAD:
ECOREGION: _________________________________ SAMPLE LOG #
PROJECT/PURPOSE: _________________________________
FIELD MEASUREMENTS
pH DISSOLVED OXYGEN PPM
CONDUCTIVITY UMHOS TIME
TEMPERATURE oC OTHERS
Previous 48 hours Precip: UNKNOWN NONE LITTLE MODERATE HEAVY FLOODING
Ambient Weather: SUNNY CLOUDY BREEZY RAIN SNOW AIR TEMP:
SEDIMENT DEPOSITS: NONE SLIGHT MODERATE EXCESSIVE BLANKET
TYPE: SLUDGE MUD SAND SILT NONE
TURBIDITY: CLEAR SLIGHT MODERATE HIGH OPAQUE
STREAM SKETCH (include flow direction, reach distance, distance from bridge, sampling points, tribs, outfalls,
livestock access, riparian area etc.)
COMMENTS:
.
METERS USED: ______________________________________________________________________________________________
SU
OTHER___________ Contaminated Y or N
Rapid Periphyton Survey Data Sheet (Back)
__________________
__________________
__________________
__________________
__________________
__________________
__________________
__________________
__________________
Not Necessary if Stream Survey Form has been completed
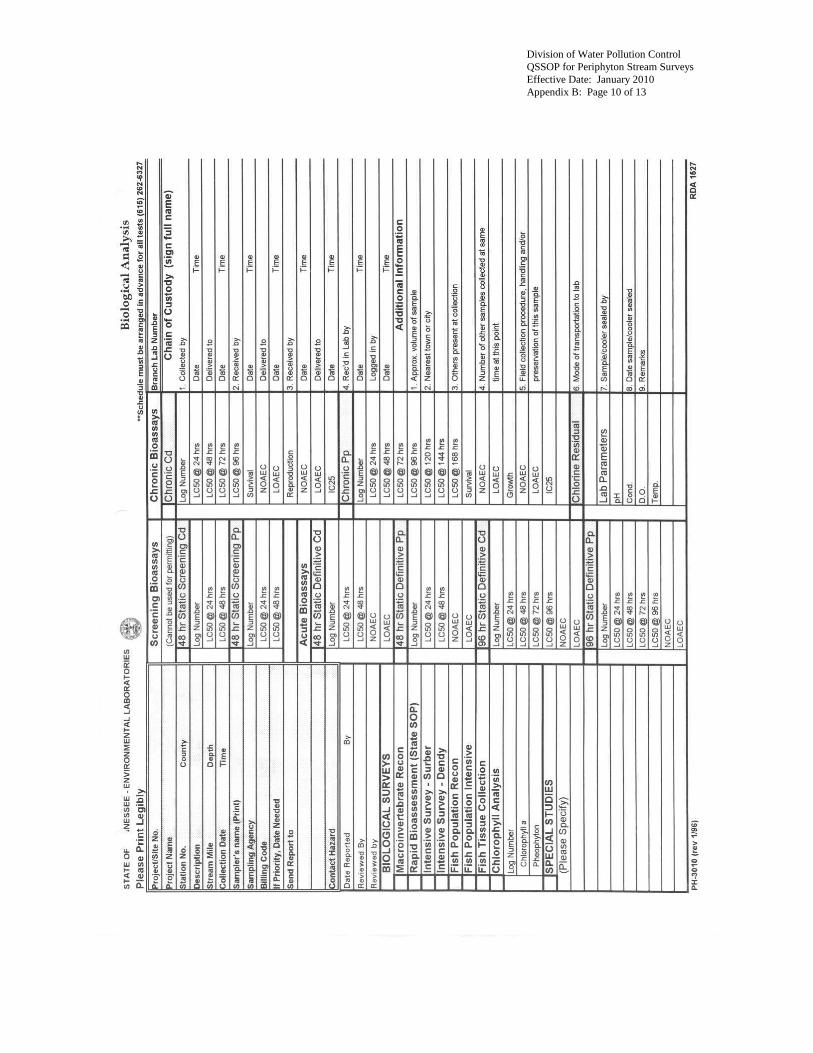
Division of Water Pollution Control
QSSOP for Periphyton Stream Surveys
Effective Date: January 2010
Appendix B: Page 10 of 13
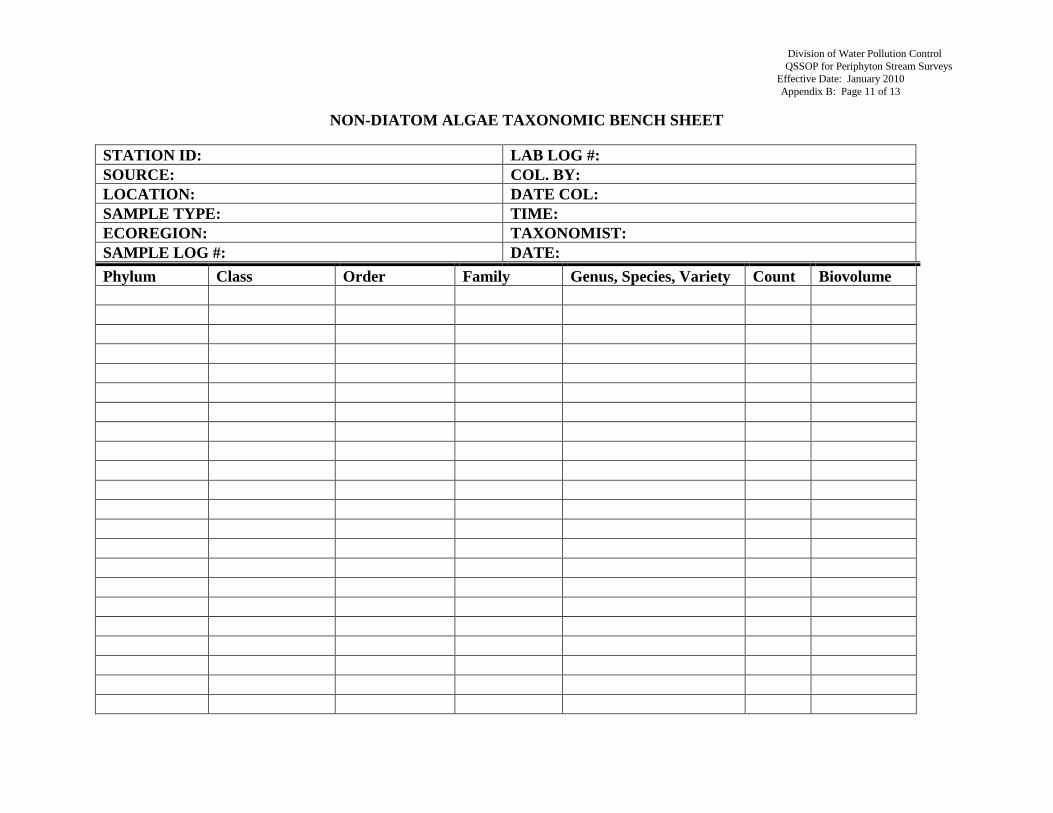
Division of Water Pollution Control
QSSOP for Periphyton Stream Surveys
Effective Date: January 2010
Appendix B: Page 11 of 13
NON-DIATOM ALGAE TAXONOMIC BENCH SHEET
STATION ID: LAB LOG #:
SOURCE: COL. BY:
LOCATION: DATE COL:
SAMPLE TYPE: TIME:
ECOREGION: TAXONOMIST:
SAMPLE LOG #: DATE:
Phylum Class Order Family Genus, Species, Variety Count Biovolume

Division of Water Pollution Control
QSSOP for Periphyton Stream Surveys
Effective Date: January 2010
Appendix B: Page 12 of 13
DIATOM ALGAE TAXONOMIC BENCH SHEET
STATION ID: LAB LOG #:
SOURCE: COL. BY:
LOCATION: DATE COL:
SAMPLE TYPE: TIME:
ECOREGION: TAXONOMIST:
SAMPLE LOG #: DATE:
Phylum Class Order Family Genus, Species, Variety Count Biovolume
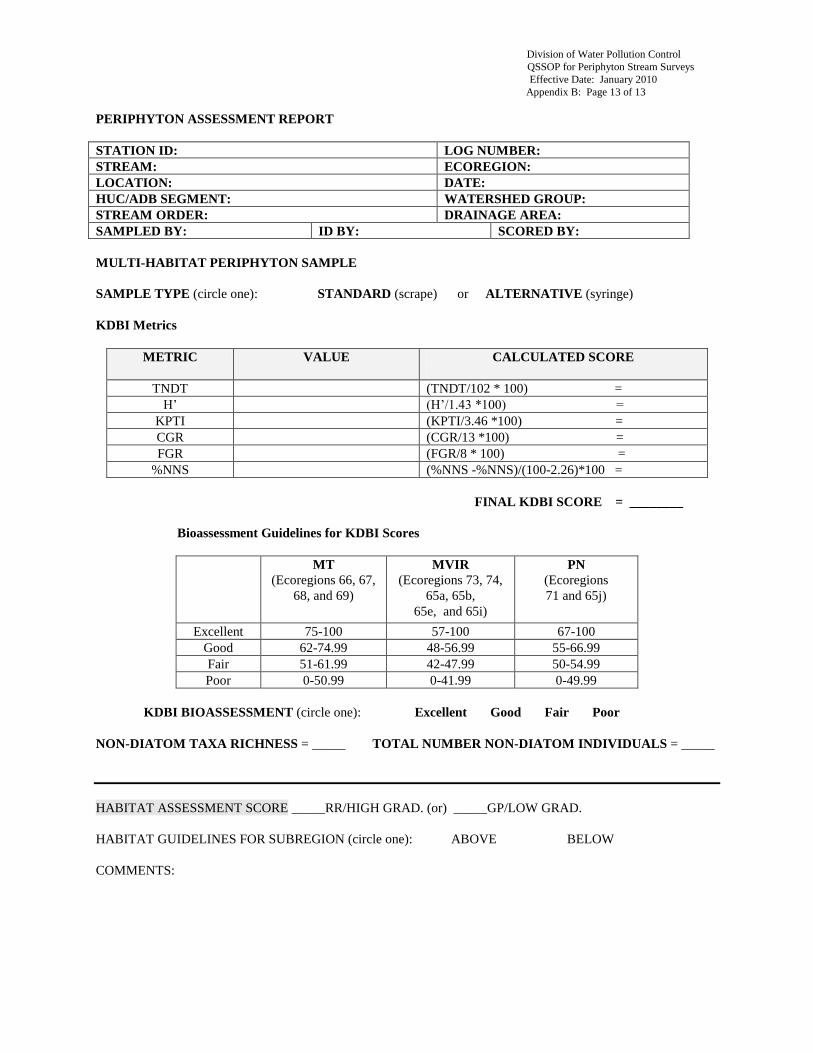
Division of Water Pollution Control
QSSOP for Periphyton Stream Surveys
Effective Date: January 2010
Appendix B: Page 13 of 13
PERIPHYTON ASSESSMENT REPORT
STATION ID: LOG NUMBER:
STREAM: ECOREGION:
LOCATION: DATE:
HUC/ADB SEGMENT: WATERSHED GROUP:
STREAM ORDER: DRAINAGE AREA:
SAMPLED BY: ID BY: SCORED BY:
MULTI-HABITAT PERIPHYTON SAMPLE
SAMPLE TYPE (circle one): STANDARD (scrape) or ALTERNATIVE (syringe)
KDBI Metrics
METRIC VALUE CALCULATED SCORE
TNDT (TNDT/102 * 100) =
H’ (H’/1.43 *100) =
KPTI (KPTI/3.46 *100) =
CGR (CGR/13 *100) =
FGR (FGR/8 * 100) =
%NNS (%NNS -%NNS)/(100-2.26)*100 =
FINAL KDBI SCORE = ________
Bioassessment Guidelines for KDBI Scores
MT
(Ecoregions 66, 67,
68, and 69)
MVIR
(Ecoregions 73, 74,
65a, 65b,
65e, and 65i)
PN
(Ecoregions
71 and 65j)
Excellent 75-100 57-100 67-100
Good 62-74.99 48-56.99 55-66.99
Fair 51-61.99 42-47.99 50-54.99
Poor 0-50.99 0-41.99 0-49.99
KDBI BIOASSESSMENT (circle one): Excellent Good Fair Poor
NON-DIATOM TAXA RICHNESS = _____ TOTAL NUMBER NON-DIATOM INDIVIDUALS = _____
HABITAT ASSESSMENT SCORE _____RR/HIGH GRAD. (or) _____GP/LOW GRAD.
HABITAT GUIDELINES FOR SUBREGION (circle one): ABOVE BELOW
COMMENTS:
Division of Water Pollution Control
QSSOP for Periphyton Stream Surveys
Effective Date: January 2010
Appendix C: Page 1 of 9
APPENDIX C
PERIPHYTON METRICS
DIATOM METRICS
NON-DIATOM ―SOFT ALGAE‖ METRICS
RAPID PERIPHYTON SURVEY METRICS
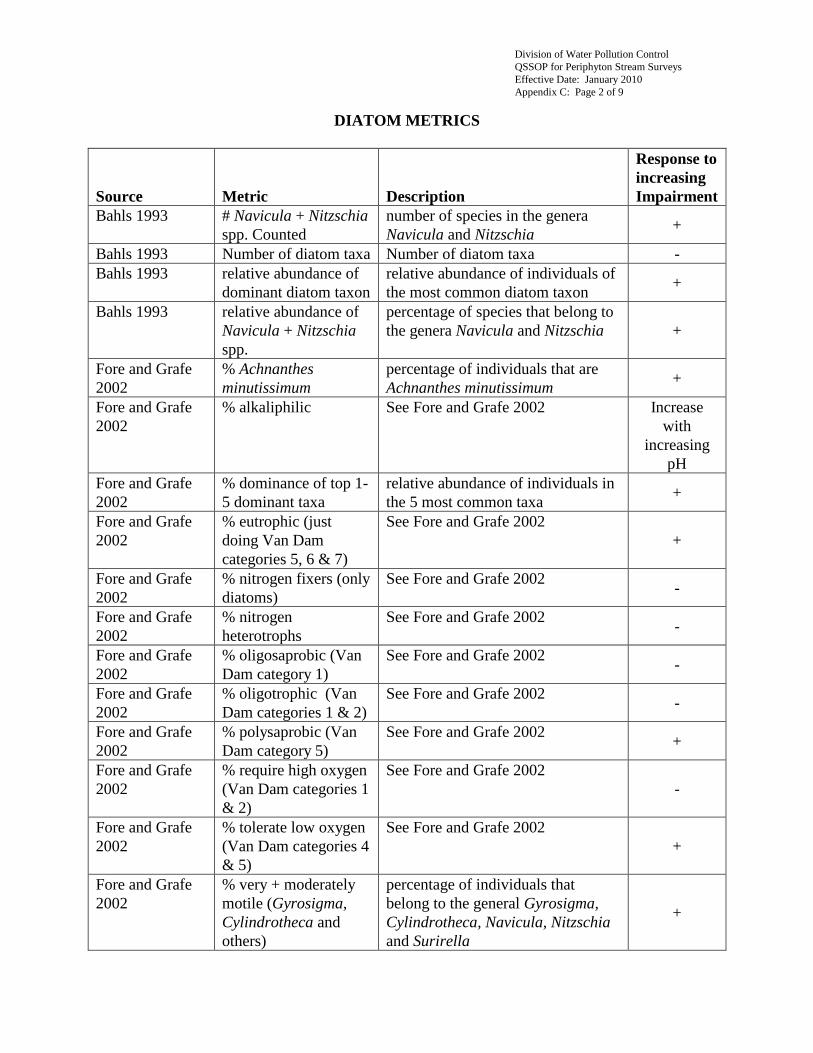
Division of Water Pollution Control
QSSOP for Periphyton Stream Surveys
Effective Date: January 2010
Appendix C: Page 2 of 9
DIATOM METRICS
Source Metric Description
Response to
increasing
Impairment
Bahls 1993 # Navicula + Nitzschia
spp. Counted
number of species in the genera
Navicula and Nitzschia +
Bahls 1993 Number of diatom taxa Number of diatom taxa -
Bahls 1993 relative abundance of
dominant diatom taxon
relative abundance of individuals of
the most common diatom taxon +
Bahls 1993 relative abundance of
Navicula + Nitzschia
spp.
percentage of species that belong to
the genera Navicula and Nitzschia +
Fore and Grafe
2002
% Achnanthes
minutissimum
percentage of individuals that are
Achnanthes minutissimum +
Fore and Grafe
2002
% alkaliphilic See Fore and Grafe 2002 Increase
with
increasing
pH
Fore and Grafe
2002
% dominance of top 1-
5 dominant taxa
relative abundance of individuals in
the 5 most common taxa +
Fore and Grafe
2002
% eutrophic (just
doing Van Dam
categories 5, 6 & 7)
See Fore and Grafe 2002
+
Fore and Grafe
2002
% nitrogen fixers (only
diatoms)
See Fore and Grafe 2002 -
Fore and Grafe
2002
% nitrogen
heterotrophs
See Fore and Grafe 2002 -
Fore and Grafe
2002
% oligosaprobic (Van
Dam category 1)
See Fore and Grafe 2002 -
Fore and Grafe
2002
% oligotrophic (Van
Dam categories 1 & 2)
See Fore and Grafe 2002 -
Fore and Grafe
2002
% polysaprobic (Van
Dam category 5)
See Fore and Grafe 2002 +
Fore and Grafe
2002
% require high oxygen
(Van Dam categories 1
& 2)
See Fore and Grafe 2002
-
Fore and Grafe
2002
% tolerate low oxygen
(Van Dam categories 4
& 5)
See Fore and Grafe 2002
+
Fore and Grafe
2002
% very + moderately
motile (Gyrosigma,
Cylindrotheca and
others)
percentage of individuals that
belong to the general Gyrosigma,
Cylindrotheca, Navicula, Nitzschia
and Surirella
+
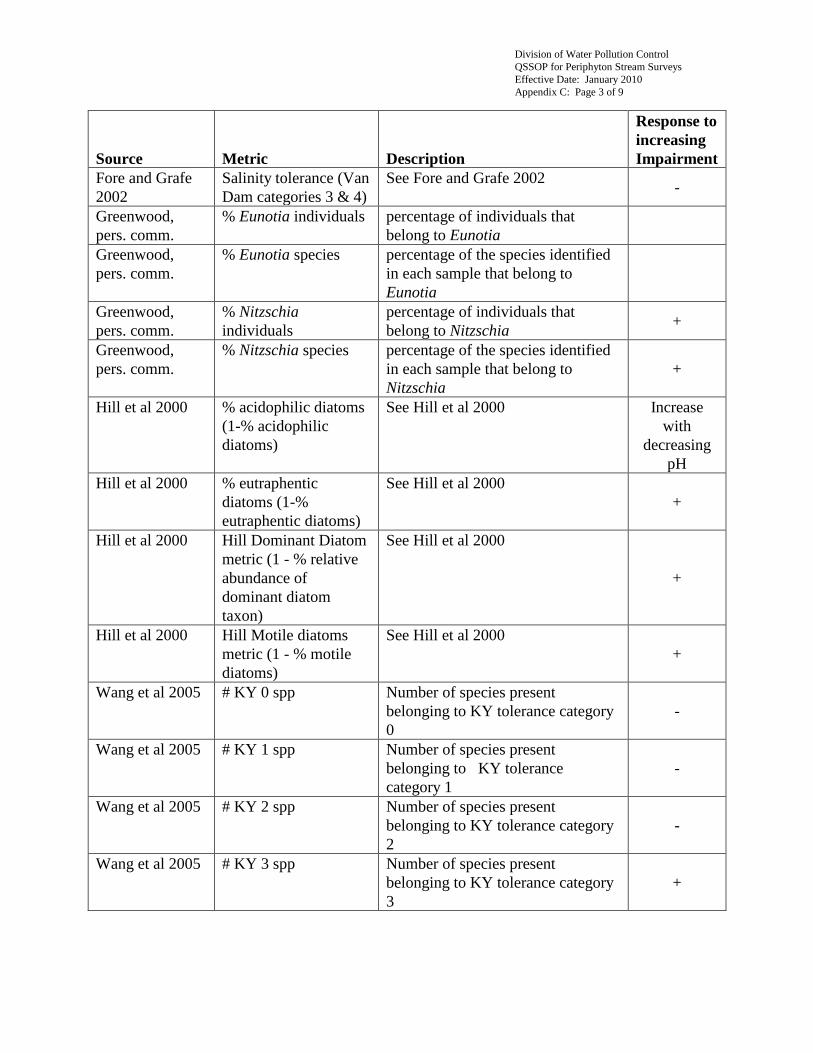
Division of Water Pollution Control
QSSOP for Periphyton Stream Surveys
Effective Date: January 2010
Appendix C: Page 3 of 9
Source Metric Description
Response to
increasing
Impairment
Fore and Grafe
2002
Salinity tolerance (Van
Dam categories 3 & 4)
See Fore and Grafe 2002 -
Greenwood,
pers. comm.
% Eunotia individuals percentage of individuals that
belong to Eunotia
Greenwood,
pers. comm.
% Eunotia species percentage of the species identified
in each sample that belong to
Eunotia
Greenwood,
pers. comm.
% Nitzschia
individuals
percentage of individuals that
belong to Nitzschia +
Greenwood,
pers. comm.
% Nitzschia species percentage of the species identified
in each sample that belong to
Nitzschia
+
Hill et al 2000 % acidophilic diatoms
(1-% acidophilic
diatoms)
See Hill et al 2000 Increase
with
decreasing
pH
Hill et al 2000 % eutraphentic
diatoms (1-%
eutraphentic diatoms)
See Hill et al 2000
+
Hill et al 2000 Hill Dominant Diatom
metric (1 - % relative
abundance of
dominant diatom
taxon)
See Hill et al 2000
+
Hill et al 2000 Hill Motile diatoms
metric (1 - % motile
diatoms)
See Hill et al 2000
+
Wang et al 2005 # KY 0 spp Number of species present
belonging to KY tolerance category
0
-
Wang et al 2005 # KY 1 spp Number of species present
belonging to KY tolerance
category 1
-
Wang et al 2005 # KY 2 spp Number of species present
belonging to KY tolerance category
2
-
Wang et al 2005 # KY 3 spp Number of species present
belonging to KY tolerance category
3
+
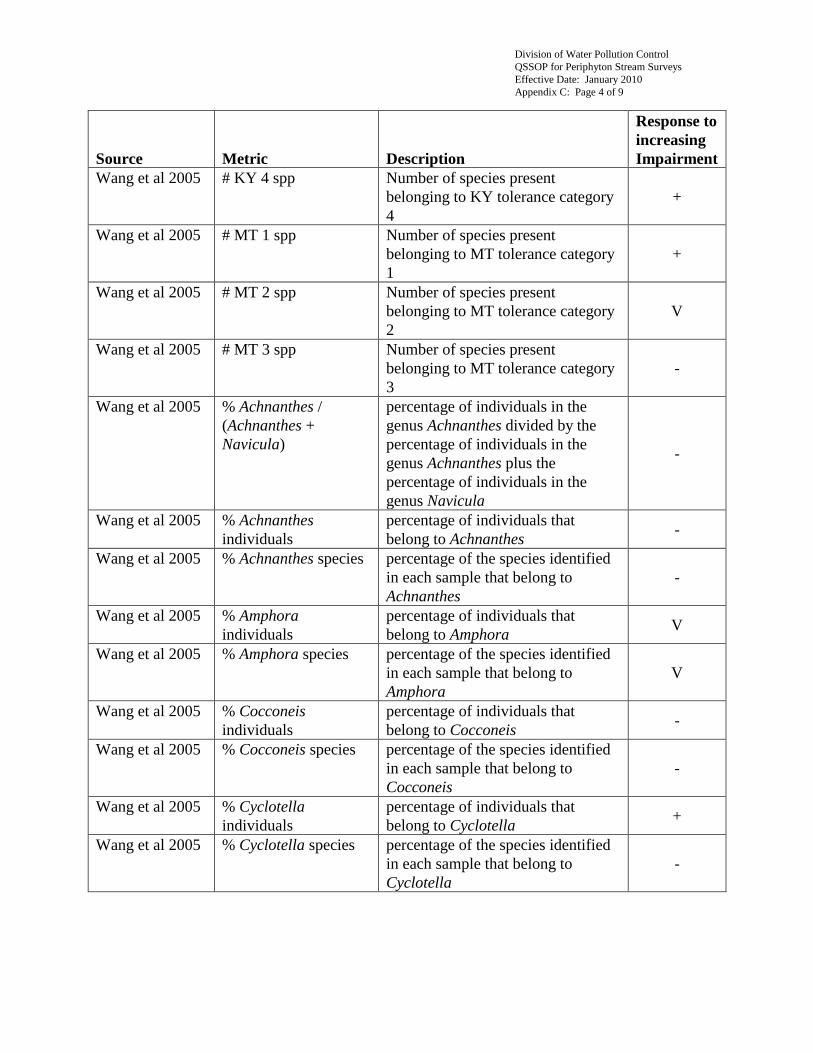
Division of Water Pollution Control
QSSOP for Periphyton Stream Surveys
Effective Date: January 2010
Appendix C: Page 4 of 9
Source Metric Description
Response to
increasing
Impairment
Wang et al 2005 # KY 4 spp Number of species present
belonging to KY tolerance category
4
+
Wang et al 2005 # MT 1 spp Number of species present
belonging to MT tolerance category
1
+
Wang et al 2005 # MT 2 spp Number of species present
belonging to MT tolerance category
2
V
Wang et al 2005 # MT 3 spp Number of species present
belonging to MT tolerance category
3
-
Wang et al 2005 % Achnanthes /
(Achnanthes +
Navicula)
percentage of individuals in the
genus Achnanthes divided by the
percentage of individuals in the
genus Achnanthes plus the
percentage of individuals in the
genus Navicula
-
Wang et al 2005 % Achnanthes
individuals
percentage of individuals that
belong to Achnanthes -
Wang et al 2005 % Achnanthes species percentage of the species identified
in each sample that belong to
Achnanthes
-
Wang et al 2005 % Amphora
individuals
percentage of individuals that
belong to Amphora V
Wang et al 2005 % Amphora species percentage of the species identified
in each sample that belong to
Amphora
V
Wang et al 2005 % Cocconeis
individuals
percentage of individuals that
belong to Cocconeis -
Wang et al 2005 % Cocconeis species percentage of the species identified
in each sample that belong to
Cocconeis
-
Wang et al 2005 % Cyclotella
individuals
percentage of individuals that
belong to Cyclotella +
Wang et al 2005 % Cyclotella species percentage of the species identified
in each sample that belong to
Cyclotella
-
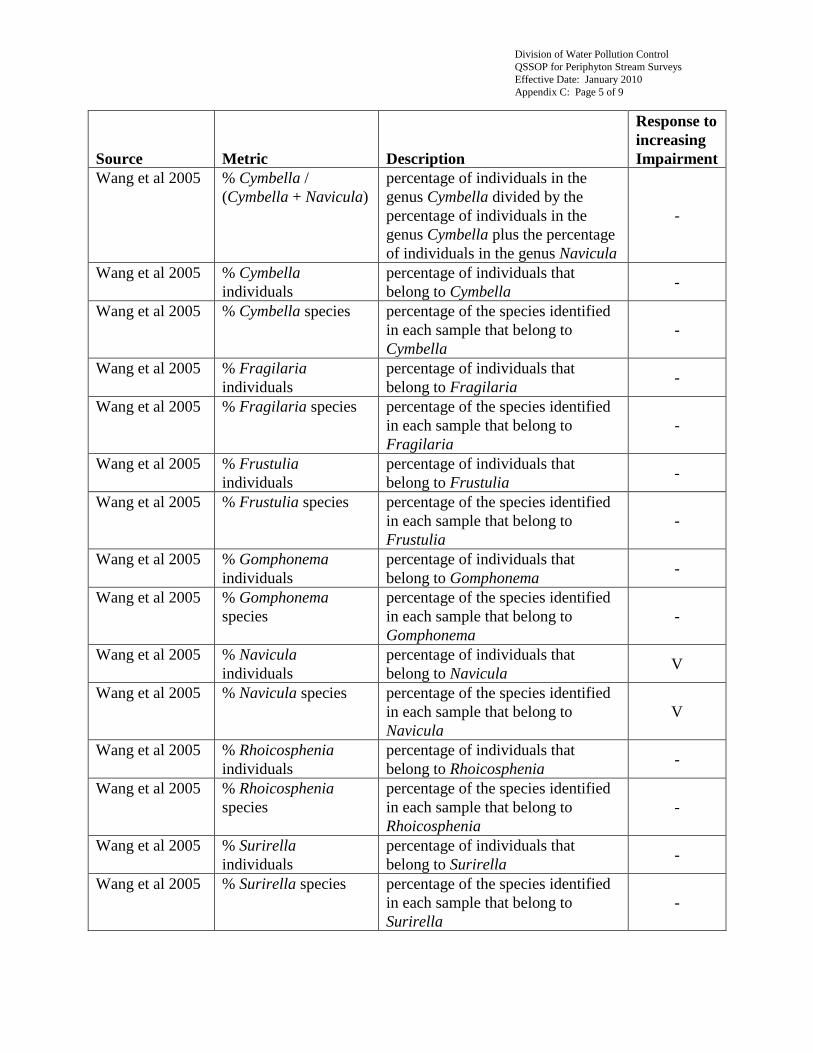
Division of Water Pollution Control
QSSOP for Periphyton Stream Surveys
Effective Date: January 2010
Appendix C: Page 5 of 9
Source Metric Description
Response to
increasing
Impairment
Wang et al 2005 % Cymbella /
(Cymbella + Navicula)
percentage of individuals in the
genus Cymbella divided by the
percentage of individuals in the
genus Cymbella plus the percentage
of individuals in the genus Navicula
-
Wang et al 2005 % Cymbella
individuals
percentage of individuals that
belong to Cymbella -
Wang et al 2005 % Cymbella species percentage of the species identified
in each sample that belong to
Cymbella
-
Wang et al 2005 % Fragilaria
individuals
percentage of individuals that
belong to Fragilaria -
Wang et al 2005 % Fragilaria species percentage of the species identified
in each sample that belong to
Fragilaria
-
Wang et al 2005 % Frustulia
individuals
percentage of individuals that
belong to Frustulia -
Wang et al 2005 % Frustulia species percentage of the species identified
in each sample that belong to
Frustulia
-
Wang et al 2005 % Gomphonema
individuals
percentage of individuals that
belong to Gomphonema -
Wang et al 2005 % Gomphonema
species
percentage of the species identified
in each sample that belong to
Gomphonema
-
Wang et al 2005 % Navicula
individuals
percentage of individuals that
belong to Navicula V
Wang et al 2005 % Navicula species percentage of the species identified
in each sample that belong to
Navicula
V
Wang et al 2005 % Rhoicosphenia
individuals
percentage of individuals that
belong to Rhoicosphenia -
Wang et al 2005 % Rhoicosphenia
species
percentage of the species identified
in each sample that belong to
Rhoicosphenia
-
Wang et al 2005 % Surirella
individuals
percentage of individuals that
belong to Surirella -
Wang et al 2005 % Surirella species percentage of the species identified
in each sample that belong to
Surirella
-
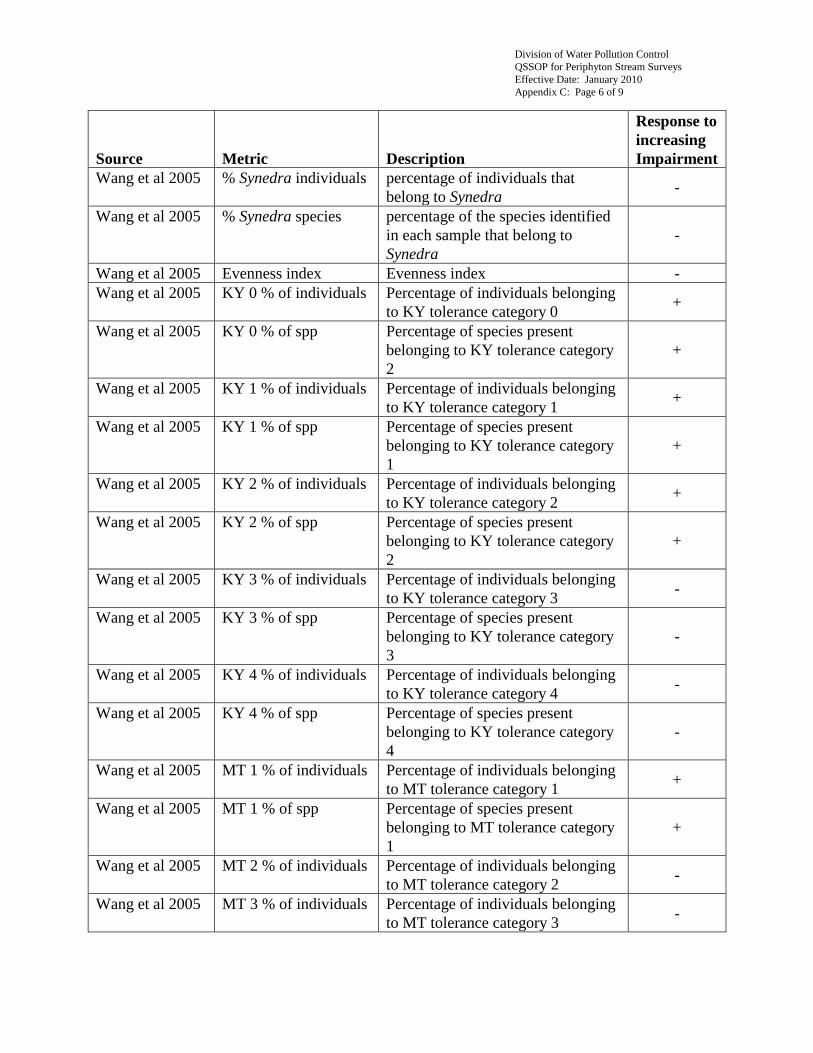
Division of Water Pollution Control
QSSOP for Periphyton Stream Surveys
Effective Date: January 2010
Appendix C: Page 6 of 9
Source Metric Description
Response to
increasing
Impairment
Wang et al 2005 % Synedra individuals percentage of individuals that
belong to Synedra -
Wang et al 2005 % Synedra species percentage of the species identified
in each sample that belong to
Synedra
-
Wang et al 2005 Evenness index Evenness index -
Wang et al 2005 KY 0 % of individuals Percentage of individuals belonging
to KY tolerance category 0 +
Wang et al 2005 KY 0 % of spp Percentage of species present
belonging to KY tolerance category
2
+
Wang et al 2005 KY 1 % of individuals Percentage of individuals belonging
to KY tolerance category 1 +
Wang et al 2005 KY 1 % of spp Percentage of species present
belonging to KY tolerance category
1
+
Wang et al 2005 KY 2 % of individuals Percentage of individuals belonging
to KY tolerance category 2 +
Wang et al 2005 KY 2 % of spp Percentage of species present
belonging to KY tolerance category
2
+
Wang et al 2005 KY 3 % of individuals Percentage of individuals belonging
to KY tolerance category 3 -
Wang et al 2005 KY 3 % of spp Percentage of species present
belonging to KY tolerance category
3
-
Wang et al 2005 KY 4 % of individuals Percentage of individuals belonging
to KY tolerance category 4 -
Wang et al 2005 KY 4 % of spp Percentage of species present
belonging to KY tolerance category
4
-
Wang et al 2005 MT 1 % of individuals Percentage of individuals belonging
to MT tolerance category 1 +
Wang et al 2005 MT 1 % of spp Percentage of species present
belonging to MT tolerance category
1
+
Wang et al 2005 MT 2 % of individuals Percentage of individuals belonging
to MT tolerance category 2 -
Wang et al 2005 MT 3 % of individuals Percentage of individuals belonging
to MT tolerance category 3 -
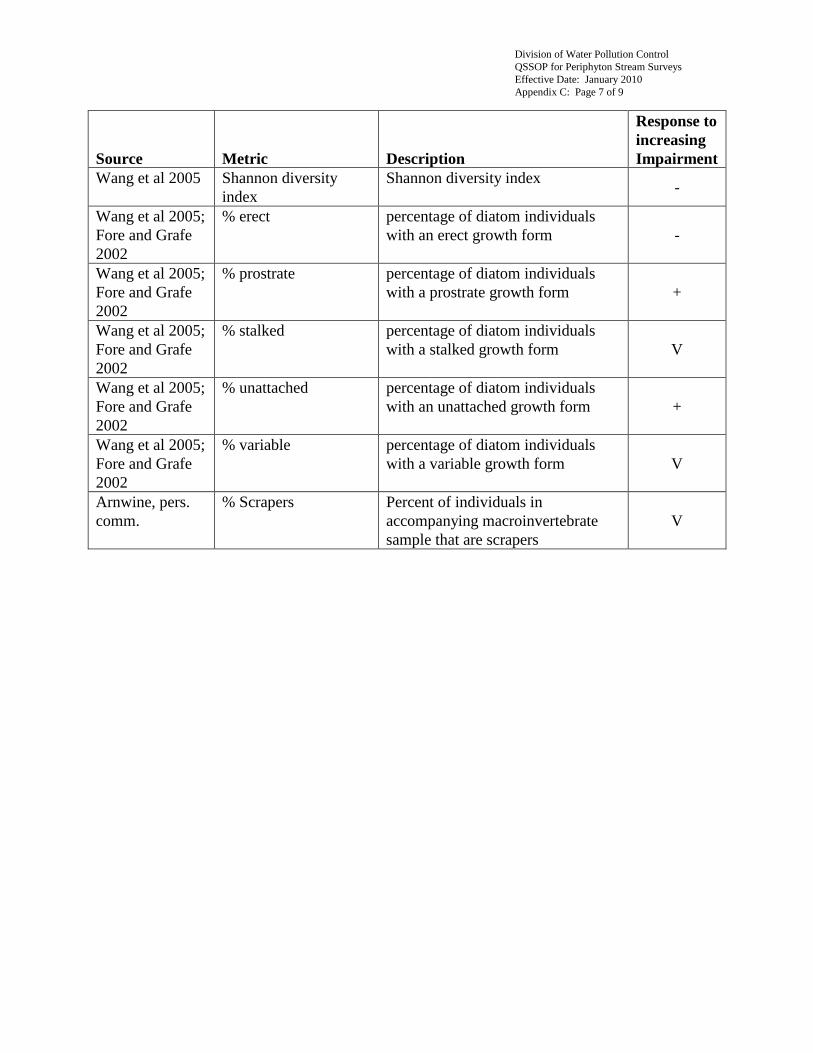
Division of Water Pollution Control
QSSOP for Periphyton Stream Surveys
Effective Date: January 2010
Appendix C: Page 7 of 9
Source Metric Description
Response to
increasing
Impairment
Wang et al 2005 Shannon diversity
index
Shannon diversity index -
Wang et al 2005;
Fore and Grafe
2002
% erect percentage of diatom individuals
with an erect growth form -
Wang et al 2005;
Fore and Grafe
2002
% prostrate percentage of diatom individuals
with a prostrate growth form +
Wang et al 2005;
Fore and Grafe
2002
% stalked percentage of diatom individuals
with a stalked growth form V
Wang et al 2005;
Fore and Grafe
2002
% unattached percentage of diatom individuals
with an unattached growth form +
Wang et al 2005;
Fore and Grafe
2002
% variable percentage of diatom individuals
with a variable growth form V
Arnwine, pers.
comm.
% Scrapers Percent of individuals in
accompanying macroinvertebrate
sample that are scrapers
V
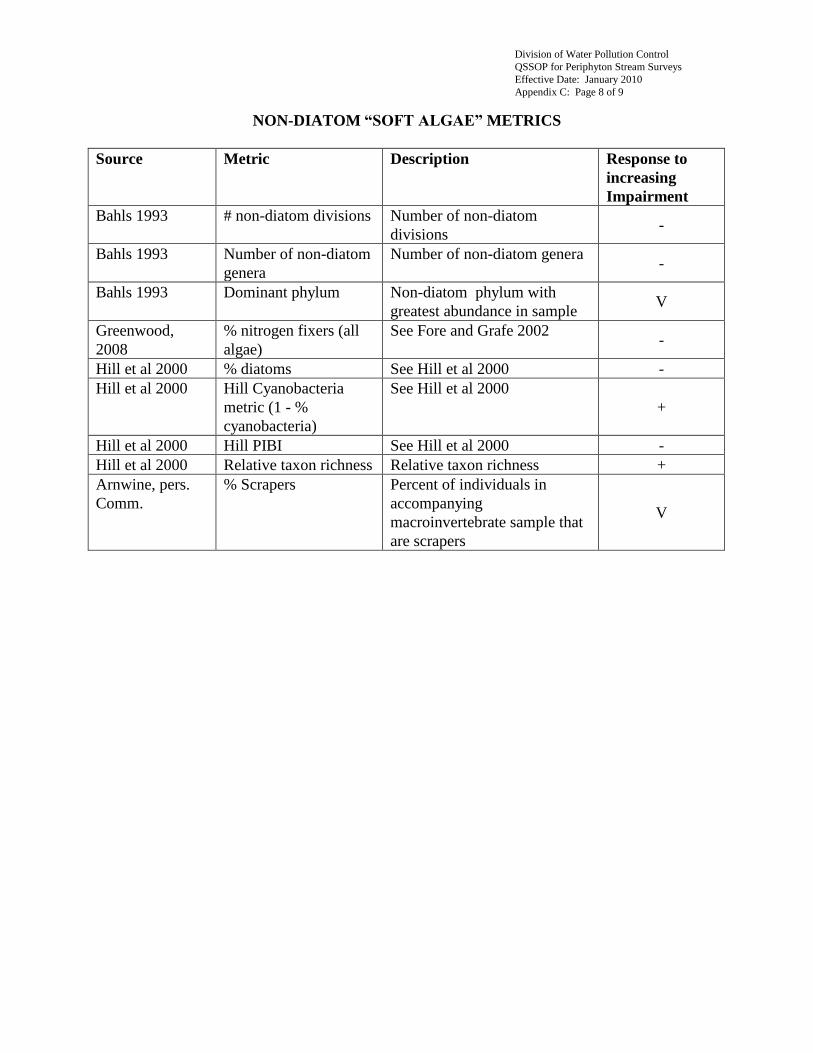
Division of Water Pollution Control
QSSOP for Periphyton Stream Surveys
Effective Date: January 2010
Appendix C: Page 8 of 9
NON-DIATOM ―SOFT ALGAE‖ METRICS
Source Metric Description Response to
increasing
Impairment
Bahls 1993 # non-diatom divisions Number of non-diatom
divisions -
Bahls 1993 Number of non-diatom
genera
Number of non-diatom genera -
Bahls 1993 Dominant phylum Non-diatom phylum with
greatest abundance in sample V
Greenwood,
2008
% nitrogen fixers (all
algae)
See Fore and Grafe 2002 -
Hill et al 2000 % diatoms See Hill et al 2000 -
Hill et al 2000 Hill Cyanobacteria
metric (1 - %
cyanobacteria)
See Hill et al 2000
+
Hill et al 2000 Hill PIBI See Hill et al 2000 -
Hill et al 2000 Relative taxon richness Relative taxon richness +
Arnwine, pers.
Comm.
% Scrapers Percent of individuals in
accompanying
macroinvertebrate sample that
are scrapers
V
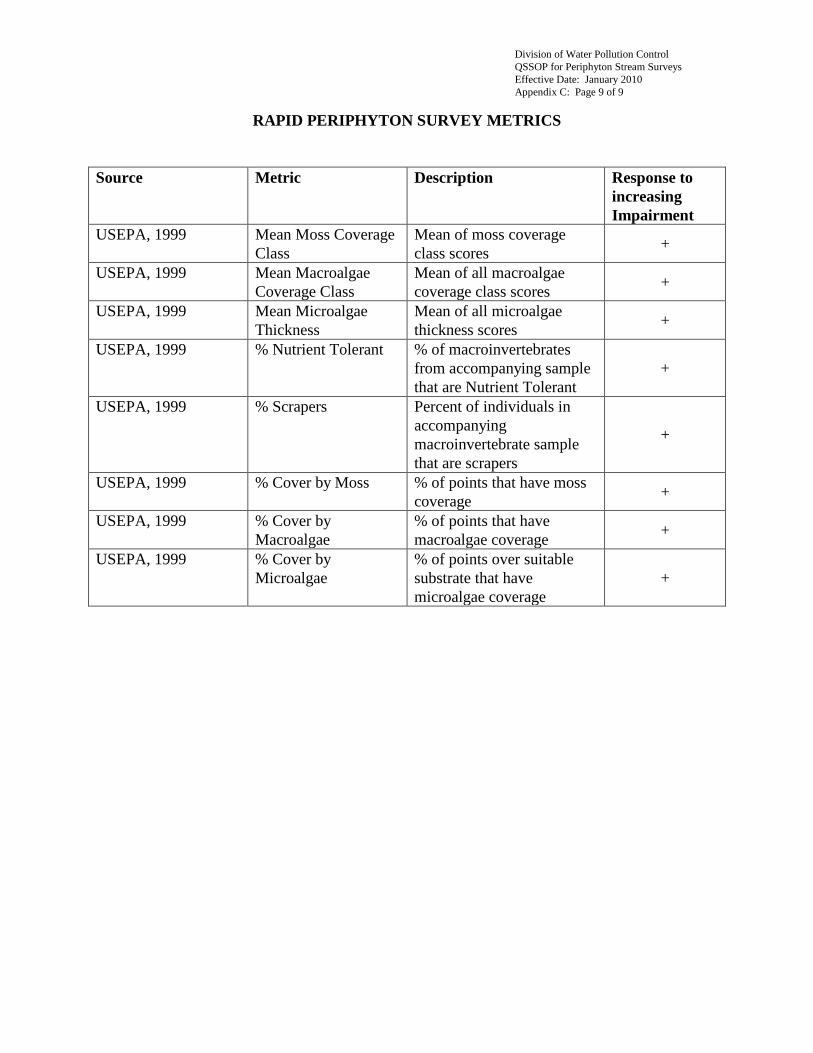
Division of Water Pollution Control
QSSOP for Periphyton Stream Surveys
Effective Date: January 2010
Appendix C: Page 9 of 9
RAPID PERIPHYTON SURVEY METRICS
Source Metric Description Response to
increasing
Impairment
USEPA, 1999 Mean Moss Coverage
Class
Mean of moss coverage
class scores +
USEPA, 1999 Mean Macroalgae
Coverage Class
Mean of all macroalgae
coverage class scores +
USEPA, 1999 Mean Microalgae
Thickness
Mean of all microalgae
thickness scores +
USEPA, 1999 % Nutrient Tolerant % of macroinvertebrates
from accompanying sample
that are Nutrient Tolerant
+
USEPA, 1999 % Scrapers Percent of individuals in
accompanying
macroinvertebrate sample
that are scrapers
+
USEPA, 1999 % Cover by Moss % of points that have moss
coverage +
USEPA, 1999 % Cover by
Macroalgae
% of points that have
macroalgae coverage +
USEPA, 1999 % Cover by
Microalgae
% of points over suitable
substrate that have
microalgae coverage
+

Division of Water Pollution Control
QSSOP for Periphyton Stream Surveys
Effective Date: January 2010
Appendix D: Page 1 of 29
APPENDIX D
TAXONOMIC INFORMATION
TAXONOMIC KEYS
TAXONOMIC SPECIALISTS FOR REFERENCE VERIFICATION
VERIFIED TAXA LIST FOR DIATOMS -
(INCLUDING KENTUCKY POLLUTION TOLERANCE INDEX VALUES)
VERIFIED TAXA LIST FOR SOFT ALGAE (NON-DIATONS)
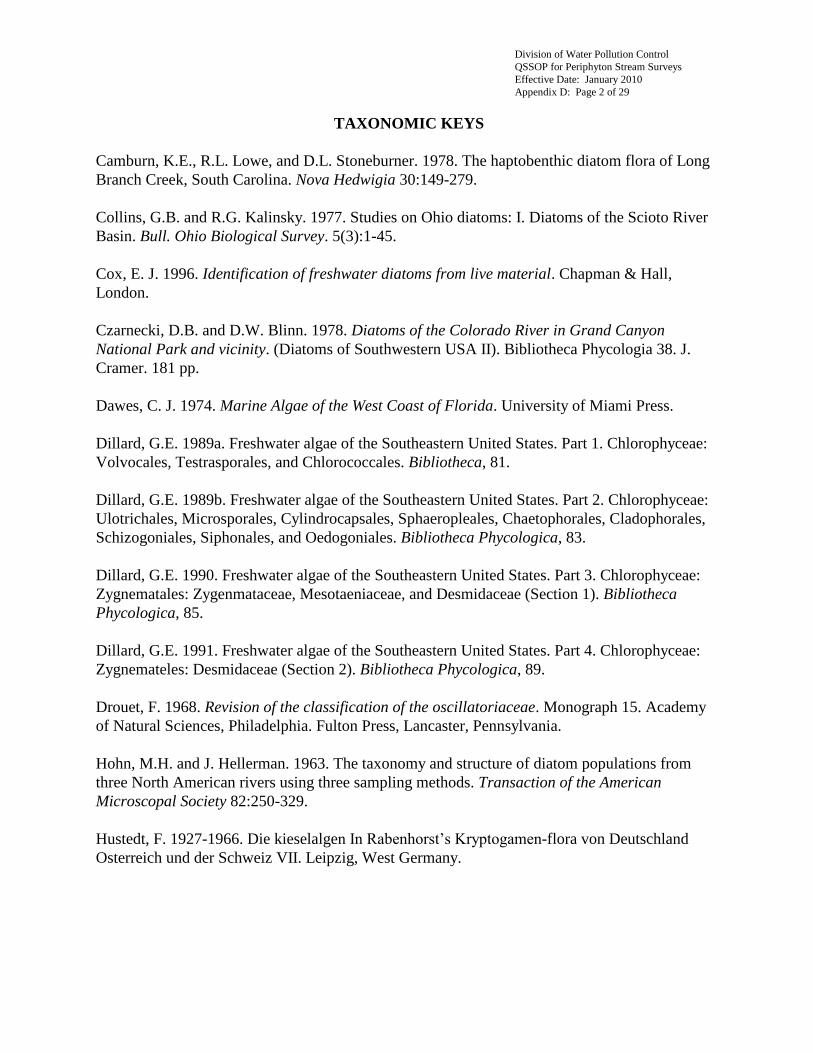
Division of Water Pollution Control
QSSOP for Periphyton Stream Surveys
Effective Date: January 2010
Appendix D: Page 2 of 29
TAXONOMIC KEYS
Camburn, K.E., R.L. Lowe, and D.L. Stoneburner. 1978. The haptobenthic diatom flora of Long
Branch Creek, South Carolina. Nova Hedwigia 30:149-279.
Collins, G.B. and R.G. Kalinsky. 1977. Studies on Ohio diatoms: I. Diatoms of the Scioto River
Basin. Bull. Ohio Biological Survey. 5(3):1-45.
Cox, E. J. 1996. Identification of freshwater diatoms from live material. Chapman & Hall,
London.
Czarnecki, D.B. and D.W. Blinn. 1978. Diatoms of the Colorado River in Grand Canyon
National Park and vicinity. (Diatoms of Southwestern USA II). Bibliotheca Phycologia 38. J.
Cramer. 181 pp.
Dawes, C. J. 1974. Marine Algae of the West Coast of Florida. University of Miami Press.
Dillard, G.E. 1989a. Freshwater algae of the Southeastern United States. Part 1. Chlorophyceae:
Volvocales, Testrasporales, and Chlorococcales. Bibliotheca, 81.
Dillard, G.E. 1989b. Freshwater algae of the Southeastern United States. Part 2. Chlorophyceae:
Ulotrichales, Microsporales, Cylindrocapsales, Sphaeropleales, Chaetophorales, Cladophorales,
Schizogoniales, Siphonales, and Oedogoniales. Bibliotheca Phycologica, 83.
Dillard, G.E. 1990. Freshwater algae of the Southeastern United States. Part 3. Chlorophyceae:
Zygnematales: Zygenmataceae, Mesotaeniaceae, and Desmidaceae (Section 1). Bibliotheca
Phycologica, 85.
Dillard, G.E. 1991. Freshwater algae of the Southeastern United States. Part 4. Chlorophyceae:
Zygnemateles: Desmidaceae (Section 2). Bibliotheca Phycologica, 89.
DRAFT REVISION—September 25, 1998
Drouet, F. 1968. Revision of the classification of the oscillatoriaceae. Monograph 15. Academy
of Natural Sciences, Philadelphia. Fulton Press, Lancaster, Pennsylvania.
Hohn, M.H. and J. Hellerman. 1963. The taxonomy and structure of diatom populations from
three North American rivers using three sampling methods. Transaction of the American
Microscopal Society 82:250-329.
Hustedt, F. 1927-1966. Die kieselalgen In Rabenhorst’s Kryptogamen-flora von Deutschland
Osterreich und der Schweiz VII. Leipzig, West Germany.
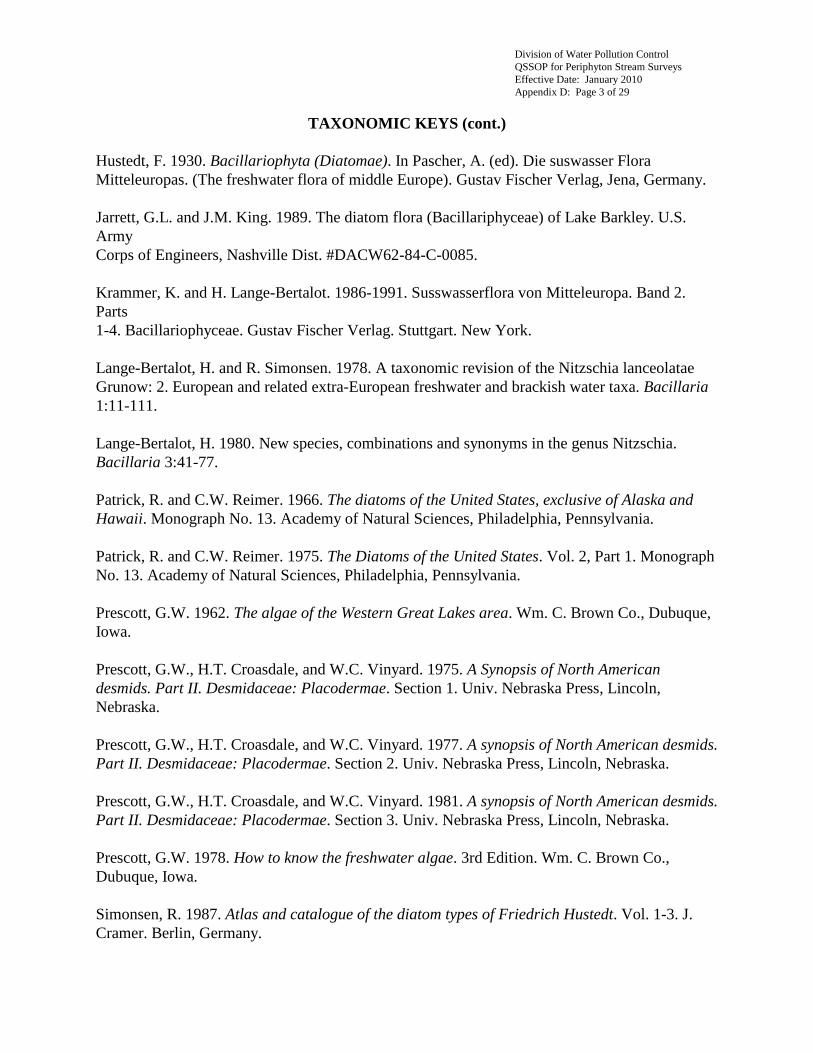
Division of Water Pollution Control
QSSOP for Periphyton Stream Surveys
Effective Date: January 2010
Appendix D: Page 3 of 29
TAXONOMIC KEYS (cont.)
Hustedt, F. 1930. Bacillariophyta (Diatomae). In Pascher, A. (ed). Die suswasser Flora
Mitteleuropas. (The freshwater flora of middle Europe). Gustav Fischer Verlag, Jena, Germany.
Jarrett, G.L. and J.M. King. 1989. The diatom flora (Bacillariphyceae) of Lake Barkley. U.S.
Army
Corps of Engineers, Nashville Dist. #DACW62-84-C-0085.
Krammer, K. and H. Lange-Bertalot. 1986-1991. Susswasserflora von Mitteleuropa. Band 2.
Parts
1-4. Bacillariophyceae. Gustav Fischer Verlag. Stuttgart. New York.
Lange-Bertalot, H. and R. Simonsen. 1978. A taxonomic revision of the Nitzschia lanceolatae
Grunow: 2. European and related extra-European freshwater and brackish water taxa. Bacillaria
1:11-111.
Lange-Bertalot, H. 1980. New species, combinations and synonyms in the genus Nitzschia.
Bacillaria 3:41-77.
Patrick, R. and C.W. Reimer. 1966. The diatoms of the United States, exclusive of Alaska and
Hawaii. Monograph No. 13. Academy of Natural Sciences, Philadelphia, Pennsylvania.
Patrick, R. and C.W. Reimer. 1975. The Diatoms of the United States. Vol. 2, Part 1. Monograph
No. 13. Academy of Natural Sciences, Philadelphia, Pennsylvania.
Prescott, G.W. 1962. The algae of the Western Great Lakes area. Wm. C. Brown Co., Dubuque,
Iowa.
Prescott, G.W., H.T. Croasdale, and W.C. Vinyard. 1975. A Synopsis of North American
desmids. Part II. Desmidaceae: Placodermae. Section 1. Univ. Nebraska Press, Lincoln,
Nebraska.
Prescott, G.W., H.T. Croasdale, and W.C. Vinyard. 1977. A synopsis of North American desmids.
Part II. Desmidaceae: Placodermae. Section 2. Univ. Nebraska Press, Lincoln, Nebraska.
Prescott, G.W., H.T. Croasdale, and W.C. Vinyard. 1981. A synopsis of North American desmids.
Part II. Desmidaceae: Placodermae. Section 3. Univ. Nebraska Press, Lincoln, Nebraska.
Prescott, G.W. 1978. How to know the freshwater algae. 3rd Edition. Wm. C. Brown Co.,
Dubuque, Iowa.
Simonsen, R. 1987. Atlas and catalogue of the diatom types of Friedrich Hustedt. Vol. 1-3. J.
Cramer. Berlin, Germany.
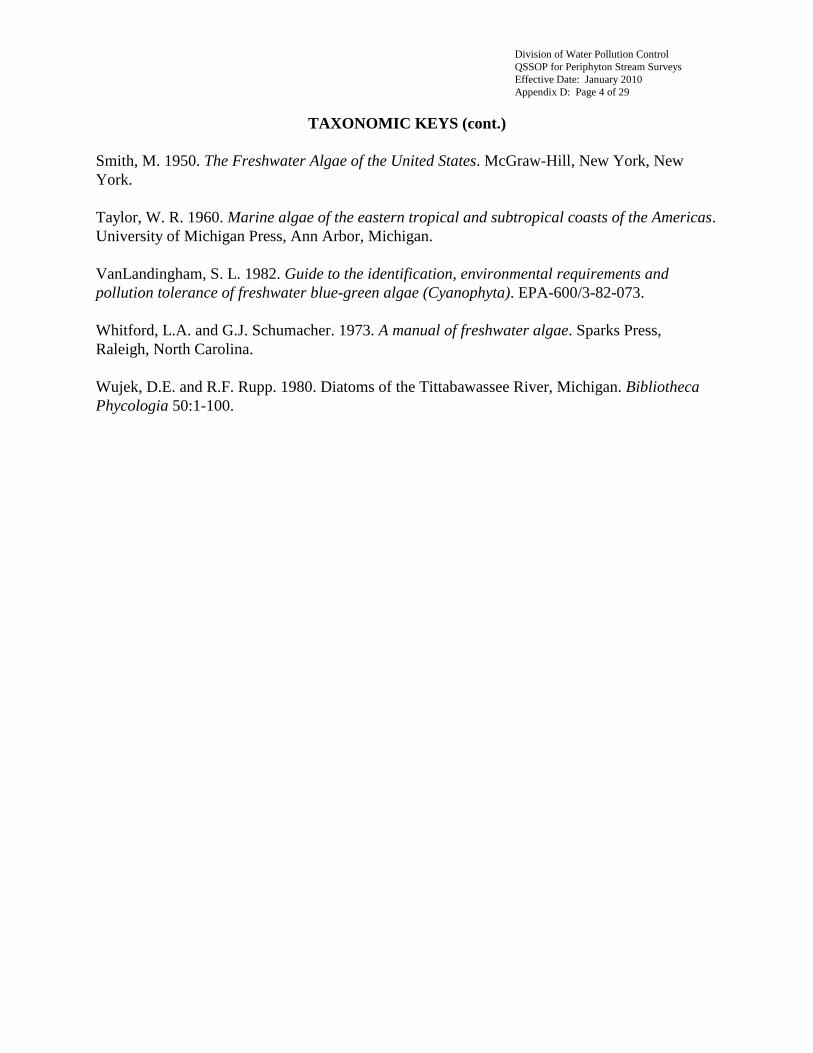
Division of Water Pollution Control
QSSOP for Periphyton Stream Surveys
Effective Date: January 2010
Appendix D: Page 4 of 29
TAXONOMIC KEYS (cont.)
Smith, M. 1950. The Freshwater Algae of the United States. McGraw-Hill, New York, New
York.
Taylor, W. R. 1960. Marine algae of the eastern tropical and subtropical coasts of the Americas.
University of Michigan Press, Ann Arbor, Michigan.
VanLandingham, S. L. 1982. Guide to the identification, environmental requirements and
pollution tolerance of freshwater blue-green algae (Cyanophyta). EPA-600/3-82-073.
Whitford, L.A. and G.J. Schumacher. 1973. A manual of freshwater algae. Sparks Press,
Raleigh, North Carolina.
Wujek, D.E. and R.F. Rupp. 1980. Diatoms of the Tittabawassee River, Michigan. Bibliotheca
Phycologia 50:1-100.

Division of Water Pollution Control
QSSOP for Periphyton Stream Surveys
Effective Date: January 2010
Appendix D: Page 5 of 29
TAXONOMIC SPECIALISTS FOR REFERENCE VERIFICATION
R. Jan Stevenson, Ph. D.
Co-Director, Center for Water Sciences
And Professor, Department of Zoology
203 Natural Science Building
Michigan State University
East Lansing, MI 48824
Phone: 517-432-8083
Kalina Manoylov, Ph. D.
Assistant Professor of Biology
Department of Biological and Environmental Sciences
Georgia College and State University
202 Herty Hall
Campus Box 81
Milledgeville, GA 31061
Phone: 478 445-2439
Jennifer Greenwood, Ph. D.
Assistant Professor
Department of Biological Sciences
University of Tennessee at Martin
314 Brehm Hall
Martin, TN 38238
Phone: 731-881-7175
Marina Potapova, Ph. D.
The Academy of Natural Sciences,
1900 Benjamin Franklin Parkway
Philadelphia, PA 19103
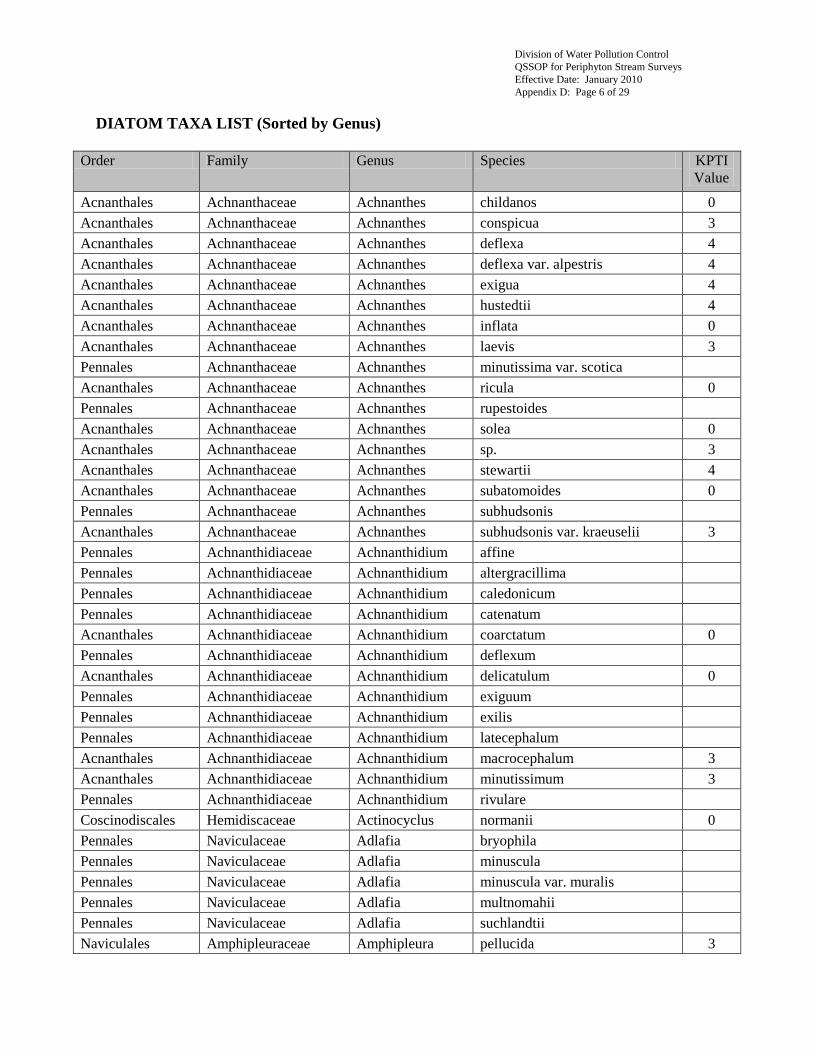
Division of Water Pollution Control
QSSOP for Periphyton Stream Surveys
Effective Date: January 2010
Appendix D: Page 6 of 29
DIATOM TAXA LIST (Sorted by Genus)
Order Family Genus Species KPTI
Value
Acnanthales Achnanthaceae Achnanthes childanos 0
Acnanthales Achnanthaceae Achnanthes conspicua 3
Acnanthales Achnanthaceae Achnanthes deflexa 4
Acnanthales Achnanthaceae Achnanthes deflexa var. alpestris 4
Acnanthales Achnanthaceae Achnanthes exigua 4
Acnanthales Achnanthaceae Achnanthes hustedtii 4
Acnanthales Achnanthaceae Achnanthes inflata 0
Acnanthales Achnanthaceae Achnanthes laevis 3
Pennales Achnanthaceae Achnanthes minutissima var. scotica
Acnanthales Achnanthaceae Achnanthes ricula 0
Pennales Achnanthaceae Achnanthes rupestoides
Acnanthales Achnanthaceae Achnanthes solea 0
Acnanthales Achnanthaceae Achnanthes sp. 3
Acnanthales Achnanthaceae Achnanthes stewartii 4
Acnanthales Achnanthaceae Achnanthes subatomoides 0
Pennales Achnanthaceae Achnanthes subhudsonis
Acnanthales Achnanthaceae Achnanthes subhudsonis var. kraeuselii 3
Pennales Achnanthidiaceae Achnanthidium affine
Pennales Achnanthidiaceae Achnanthidium altergracillima
Pennales Achnanthidiaceae Achnanthidium caledonicum
Pennales Achnanthidiaceae Achnanthidium catenatum
Acnanthales Achnanthidiaceae Achnanthidium coarctatum 0
Pennales Achnanthidiaceae Achnanthidium deflexum
Acnanthales Achnanthidiaceae Achnanthidium delicatulum 0
Pennales Achnanthidiaceae Achnanthidium exiguum
Pennales Achnanthidiaceae Achnanthidium exilis
Pennales Achnanthidiaceae Achnanthidium latecephalum
Acnanthales Achnanthidiaceae Achnanthidium macrocephalum 3
Acnanthales Achnanthidiaceae Achnanthidium minutissimum 3
Pennales Achnanthidiaceae Achnanthidium rivulare
Coscinodiscales Hemidiscaceae Actinocyclus normanii 0
Pennales Naviculaceae Adlafia bryophila
Pennales Naviculaceae Adlafia minuscula
Pennales Naviculaceae Adlafia minuscula var. muralis
Pennales Naviculaceae Adlafia multnomahii
Pennales Naviculaceae Adlafia suchlandtii
Naviculales Amphipleuraceae Amphipleura pellucida 3
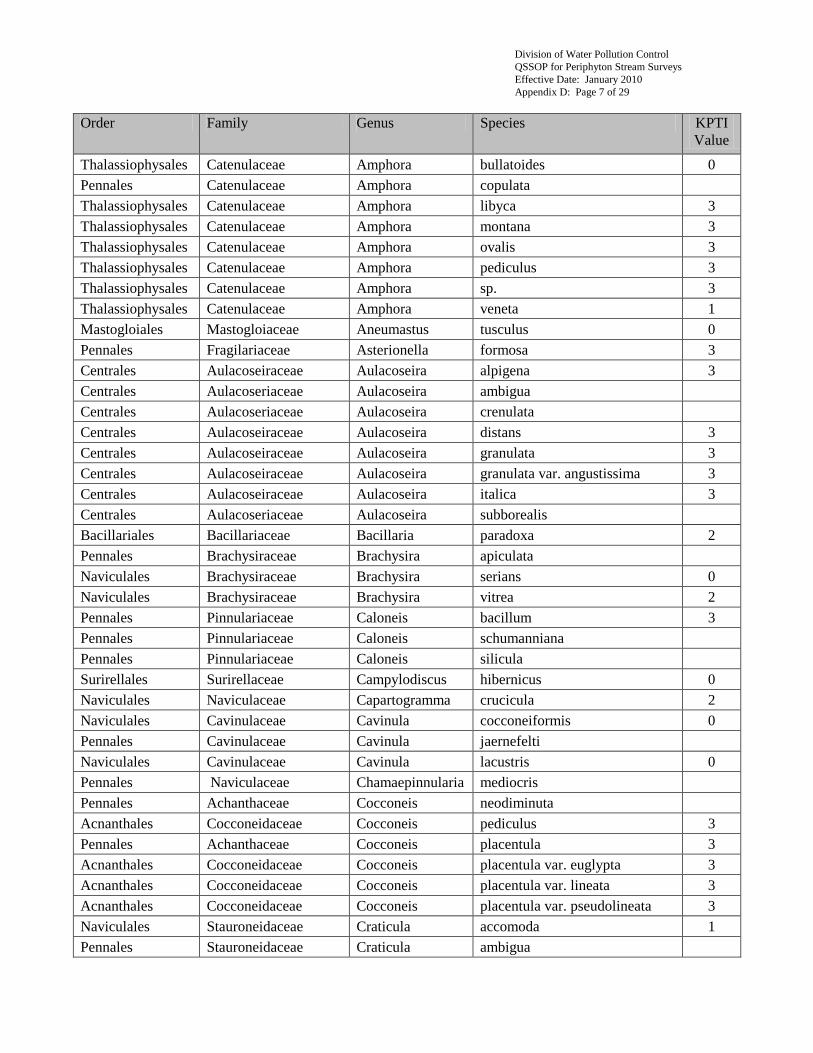
Division of Water Pollution Control
QSSOP for Periphyton Stream Surveys
Effective Date: January 2010
Appendix D: Page 7 of 29
Order Family Genus Species KPTI
Value
Thalassiophysales Catenulaceae Amphora bullatoides 0
Pennales Catenulaceae Amphora copulata
Thalassiophysales Catenulaceae Amphora libyca 3
Thalassiophysales Catenulaceae Amphora montana 3
Thalassiophysales Catenulaceae Amphora ovalis 3
Thalassiophysales Catenulaceae Amphora pediculus 3
Thalassiophysales Catenulaceae Amphora sp. 3
Thalassiophysales Catenulaceae Amphora veneta 1
Mastogloiales Mastogloiaceae Aneumastus tusculus 0
Pennales Fragilariaceae Asterionella formosa 3
Centrales Aulacoseiraceae Aulacoseira alpigena 3
Centrales Aulacoseriaceae Aulacoseira ambigua
Centrales Aulacoseriaceae Aulacoseira crenulata
Centrales Aulacoseiraceae Aulacoseira distans 3
Centrales Aulacoseiraceae Aulacoseira granulata 3
Centrales Aulacoseiraceae Aulacoseira granulata var. angustissima 3
Centrales Aulacoseiraceae Aulacoseira italica 3
Centrales Aulacoseriaceae Aulacoseira subborealis
Bacillariales Bacillariaceae Bacillaria paradoxa 2
Pennales Brachysiraceae Brachysira apiculata
Naviculales Brachysiraceae Brachysira serians 0
Naviculales Brachysiraceae Brachysira vitrea 2
Pennales Pinnulariaceae Caloneis bacillum 3
Pennales Pinnulariaceae Caloneis schumanniana
Pennales Pinnulariaceae Caloneis silicula
Surirellales Surirellaceae Campylodiscus hibernicus 0
Naviculales Naviculaceae Capartogramma crucicula 2
Naviculales Cavinulaceae Cavinula cocconeiformis 0
Pennales Cavinulaceae Cavinula jaernefelti
Naviculales Cavinulaceae Cavinula lacustris 0
Pennales Naviculaceae Chamaepinnularia mediocris
Pennales Achanthaceae Cocconeis neodiminuta
Acnanthales Cocconeidaceae Cocconeis pediculus 3
Pennales Achanthaceae Cocconeis placentula 3
Acnanthales Cocconeidaceae Cocconeis placentula var. euglypta 3
Acnanthales Cocconeidaceae Cocconeis placentula var. lineata 3
Acnanthales Cocconeidaceae Cocconeis placentula var. pseudolineata 3
Naviculales Stauroneidaceae Craticula accomoda 1
Pennales Stauroneidaceae Craticula ambigua
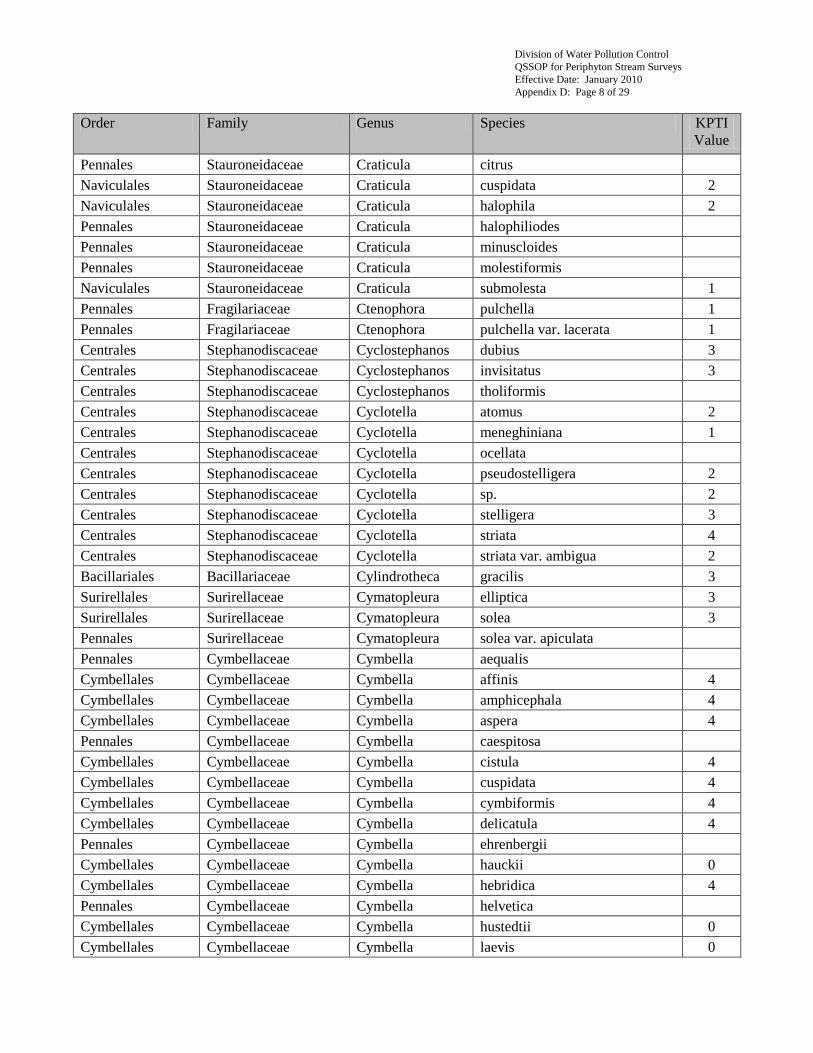
Division of Water Pollution Control
QSSOP for Periphyton Stream Surveys
Effective Date: January 2010
Appendix D: Page 8 of 29
Order Family Genus Species KPTI
Value
Pennales Stauroneidaceae Craticula citrus
Naviculales Stauroneidaceae Craticula cuspidata 2
Naviculales Stauroneidaceae Craticula halophila 2
Pennales Stauroneidaceae Craticula halophiliodes
Pennales Stauroneidaceae Craticula minuscloides
Pennales Stauroneidaceae Craticula molestiformis
Naviculales Stauroneidaceae Craticula submolesta 1
Pennales Fragilariaceae Ctenophora pulchella 1
Pennales Fragilariaceae Ctenophora pulchella var. lacerata 1
Centrales Stephanodiscaceae Cyclostephanos dubius 3
Centrales Stephanodiscaceae Cyclostephanos invisitatus 3
Centrales Stephanodiscaceae Cyclostephanos tholiformis
Centrales Stephanodiscaceae Cyclotella atomus 2
Centrales Stephanodiscaceae Cyclotella meneghiniana 1
Centrales Stephanodiscaceae Cyclotella ocellata
Centrales Stephanodiscaceae Cyclotella pseudostelligera 2
Centrales Stephanodiscaceae Cyclotella sp. 2
Centrales Stephanodiscaceae Cyclotella stelligera 3
Centrales Stephanodiscaceae Cyclotella striata 4
Centrales Stephanodiscaceae Cyclotella striata var. ambigua 2
Bacillariales Bacillariaceae Cylindrotheca gracilis 3
Surirellales Surirellaceae Cymatopleura elliptica 3
Surirellales Surirellaceae Cymatopleura solea 3
Pennales Surirellaceae Cymatopleura solea var. apiculata
Pennales Cymbellaceae Cymbella aequalis
Cymbellales Cymbellaceae Cymbella affinis 4
Cymbellales Cymbellaceae Cymbella amphicephala 4
Cymbellales Cymbellaceae Cymbella aspera 4
Pennales Cymbellaceae Cymbella caespitosa
Cymbellales Cymbellaceae Cymbella cistula 4
Cymbellales Cymbellaceae Cymbella cuspidata 4
Cymbellales Cymbellaceae Cymbella cymbiformis 4
Cymbellales Cymbellaceae Cymbella delicatula 4
Pennales Cymbellaceae Cymbella ehrenbergii
Cymbellales Cymbellaceae Cymbella hauckii 0
Cymbellales Cymbellaceae Cymbella hebridica 4
Pennales Cymbellaceae Cymbella helvetica
Cymbellales Cymbellaceae Cymbella hustedtii 0
Cymbellales Cymbellaceae Cymbella laevis 0
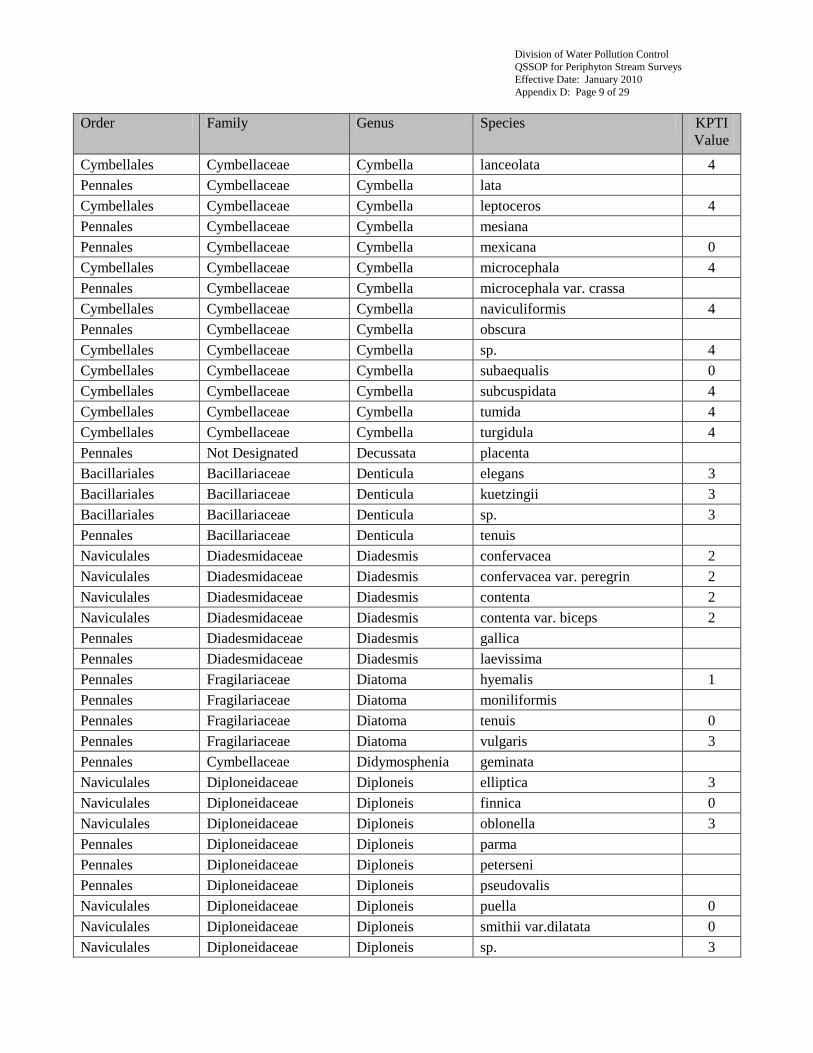
Division of Water Pollution Control
QSSOP for Periphyton Stream Surveys
Effective Date: January 2010
Appendix D: Page 9 of 29
Order Family Genus Species KPTI
Value
Cymbellales Cymbellaceae Cymbella lanceolata 4
Pennales Cymbellaceae Cymbella lata
Cymbellales Cymbellaceae Cymbella leptoceros 4
Pennales Cymbellaceae Cymbella mesiana
Pennales Cymbellaceae Cymbella mexicana 0
Cymbellales Cymbellaceae Cymbella microcephala 4
Pennales Cymbellaceae Cymbella microcephala var. crassa
Cymbellales Cymbellaceae Cymbella naviculiformis 4
Pennales Cymbellaceae Cymbella obscura
Cymbellales Cymbellaceae Cymbella sp. 4
Cymbellales Cymbellaceae Cymbella subaequalis 0
Cymbellales Cymbellaceae Cymbella subcuspidata 4
Cymbellales Cymbellaceae Cymbella tumida 4
Cymbellales Cymbellaceae Cymbella turgidula 4
Pennales Not Designated Decussata placenta
Bacillariales Bacillariaceae Denticula elegans 3
Bacillariales Bacillariaceae Denticula kuetzingii 3
Bacillariales Bacillariaceae Denticula sp. 3
Pennales Bacillariaceae Denticula tenuis
Naviculales Diadesmidaceae Diadesmis confervacea 2
Naviculales Diadesmidaceae Diadesmis confervacea var. peregrin 2
Naviculales Diadesmidaceae Diadesmis contenta 2
Naviculales Diadesmidaceae Diadesmis contenta var. biceps 2
Pennales Diadesmidaceae Diadesmis gallica
Pennales Diadesmidaceae Diadesmis laevissima
Pennales Fragilariaceae Diatoma hyemalis 1
Pennales Fragilariaceae Diatoma moniliformis
Pennales Fragilariaceae Diatoma tenuis 0
Pennales Fragilariaceae Diatoma vulgaris 3
Pennales Cymbellaceae Didymosphenia geminata
Naviculales Diploneidaceae Diploneis elliptica 3
Naviculales Diploneidaceae Diploneis finnica 0
Naviculales Diploneidaceae Diploneis oblonella 3
Pennales Diploneidaceae Diploneis parma
Pennales Diploneidaceae Diploneis peterseni
Pennales Diploneidaceae Diploneis pseudovalis
Naviculales Diploneidaceae Diploneis puella 0
Naviculales Diploneidaceae Diploneis smithii var.dilatata 0
Naviculales Diploneidaceae Diploneis sp. 3
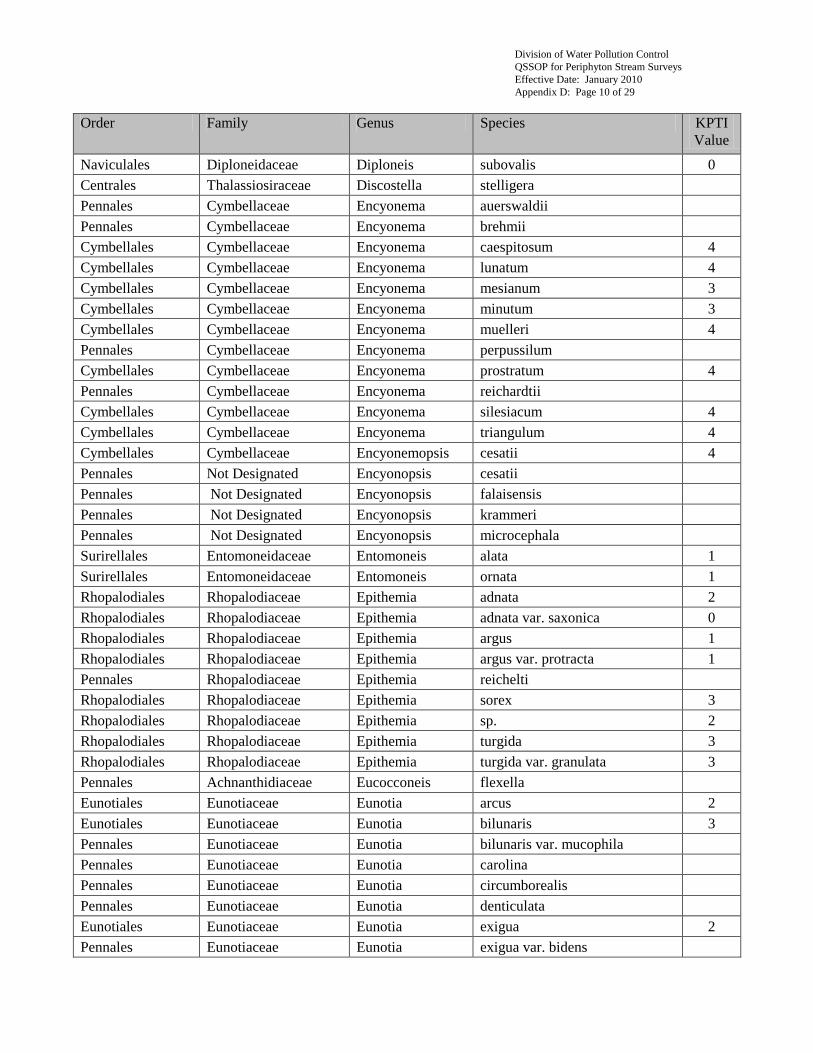
Division of Water Pollution Control
QSSOP for Periphyton Stream Surveys
Effective Date: January 2010
Appendix D: Page 10 of 29
Order Family Genus Species KPTI
Value
Naviculales Diploneidaceae Diploneis subovalis 0
Centrales Thalassiosiraceae Discostella stelligera
Pennales Cymbellaceae Encyonema auerswaldii
Pennales Cymbellaceae Encyonema brehmii
Cymbellales Cymbellaceae Encyonema caespitosum 4
Cymbellales Cymbellaceae Encyonema lunatum 4
Cymbellales Cymbellaceae Encyonema mesianum 3
Cymbellales Cymbellaceae Encyonema minutum 3
Cymbellales Cymbellaceae Encyonema muelleri 4
Pennales Cymbellaceae Encyonema perpussilum
Cymbellales Cymbellaceae Encyonema prostratum 4
Pennales Cymbellaceae Encyonema reichardtii
Cymbellales Cymbellaceae Encyonema silesiacum 4
Cymbellales Cymbellaceae Encyonema triangulum 4
Cymbellales Cymbellaceae Encyonemopsis cesatii 4
Pennales Not Designated Encyonopsis cesatii
Pennales Not Designated Encyonopsis falaisensis
Pennales Not Designated Encyonopsis krammeri
Pennales Not Designated Encyonopsis microcephala
Surirellales Entomoneidaceae Entomoneis alata 1
Surirellales Entomoneidaceae Entomoneis ornata 1
Rhopalodiales Rhopalodiaceae Epithemia adnata 2
Rhopalodiales Rhopalodiaceae Epithemia adnata var. saxonica 0
Rhopalodiales Rhopalodiaceae Epithemia argus 1
Rhopalodiales Rhopalodiaceae Epithemia argus var. protracta 1
Pennales Rhopalodiaceae Epithemia reichelti
Rhopalodiales Rhopalodiaceae Epithemia sorex 3
Rhopalodiales Rhopalodiaceae Epithemia sp. 2
Rhopalodiales Rhopalodiaceae Epithemia turgida 3
Rhopalodiales Rhopalodiaceae Epithemia turgida var. granulata 3
Pennales Achnanthidiaceae Eucocconeis flexella
Eunotiales Eunotiaceae Eunotia arcus 2
Eunotiales Eunotiaceae Eunotia bilunaris 3
Pennales Eunotiaceae Eunotia bilunaris var. mucophila
Pennales Eunotiaceae Eunotia carolina
Pennales Eunotiaceae Eunotia circumborealis
Pennales Eunotiaceae Eunotia denticulata
Eunotiales Eunotiaceae Eunotia exigua 2
Pennales Eunotiaceae Eunotia exigua var. bidens
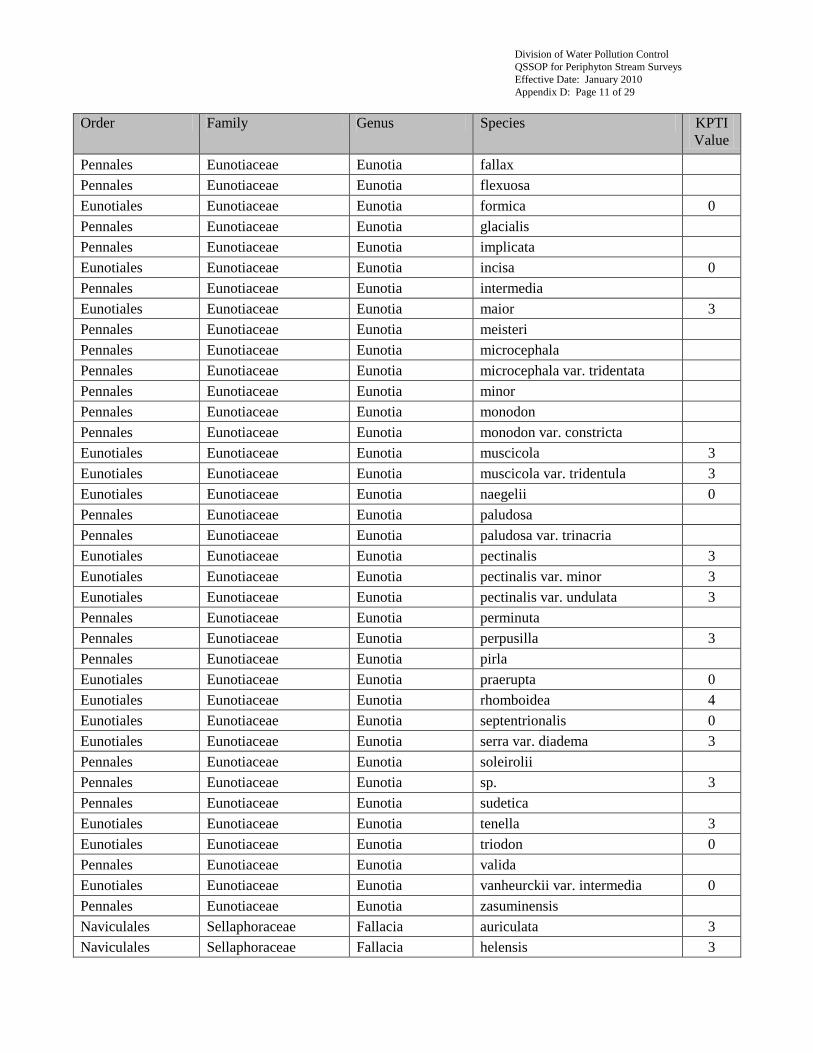
Division of Water Pollution Control
QSSOP for Periphyton Stream Surveys
Effective Date: January 2010
Appendix D: Page 11 of 29
Order Family Genus Species KPTI
Value
Pennales Eunotiaceae Eunotia fallax
Pennales Eunotiaceae Eunotia flexuosa
Eunotiales Eunotiaceae Eunotia formica 0
Pennales Eunotiaceae Eunotia glacialis
Pennales Eunotiaceae Eunotia implicata
Eunotiales Eunotiaceae Eunotia incisa 0
Pennales Eunotiaceae Eunotia intermedia
Eunotiales Eunotiaceae Eunotia maior 3
Pennales Eunotiaceae Eunotia meisteri
Pennales Eunotiaceae Eunotia microcephala
Pennales Eunotiaceae Eunotia microcephala var. tridentata
Pennales Eunotiaceae Eunotia minor
Pennales Eunotiaceae Eunotia monodon
Pennales Eunotiaceae Eunotia monodon var. constricta
Eunotiales Eunotiaceae Eunotia muscicola 3
Eunotiales Eunotiaceae Eunotia muscicola var. tridentula 3
Eunotiales Eunotiaceae Eunotia naegelii 0
Pennales Eunotiaceae Eunotia paludosa
Pennales Eunotiaceae Eunotia paludosa var. trinacria
Eunotiales Eunotiaceae Eunotia pectinalis 3
Eunotiales Eunotiaceae Eunotia pectinalis var. minor 3
Eunotiales Eunotiaceae Eunotia pectinalis var. undulata 3
Pennales Eunotiaceae Eunotia perminuta
Pennales Eunotiaceae Eunotia perpusilla 3
Pennales Eunotiaceae Eunotia pirla
Eunotiales Eunotiaceae Eunotia praerupta 0
Eunotiales Eunotiaceae Eunotia rhomboidea 4
Eunotiales Eunotiaceae Eunotia septentrionalis 0
Eunotiales Eunotiaceae Eunotia serra var. diadema 3
Pennales Eunotiaceae Eunotia soleirolii
Pennales Eunotiaceae Eunotia sp. 3
Pennales Eunotiaceae Eunotia sudetica
Eunotiales Eunotiaceae Eunotia tenella 3
Eunotiales Eunotiaceae Eunotia triodon 0
Pennales Eunotiaceae Eunotia valida
Eunotiales Eunotiaceae Eunotia vanheurckii var. intermedia 0
Pennales Eunotiaceae Eunotia zasuminensis
Naviculales Sellaphoraceae Fallacia auriculata 3
Naviculales Sellaphoraceae Fallacia helensis 3
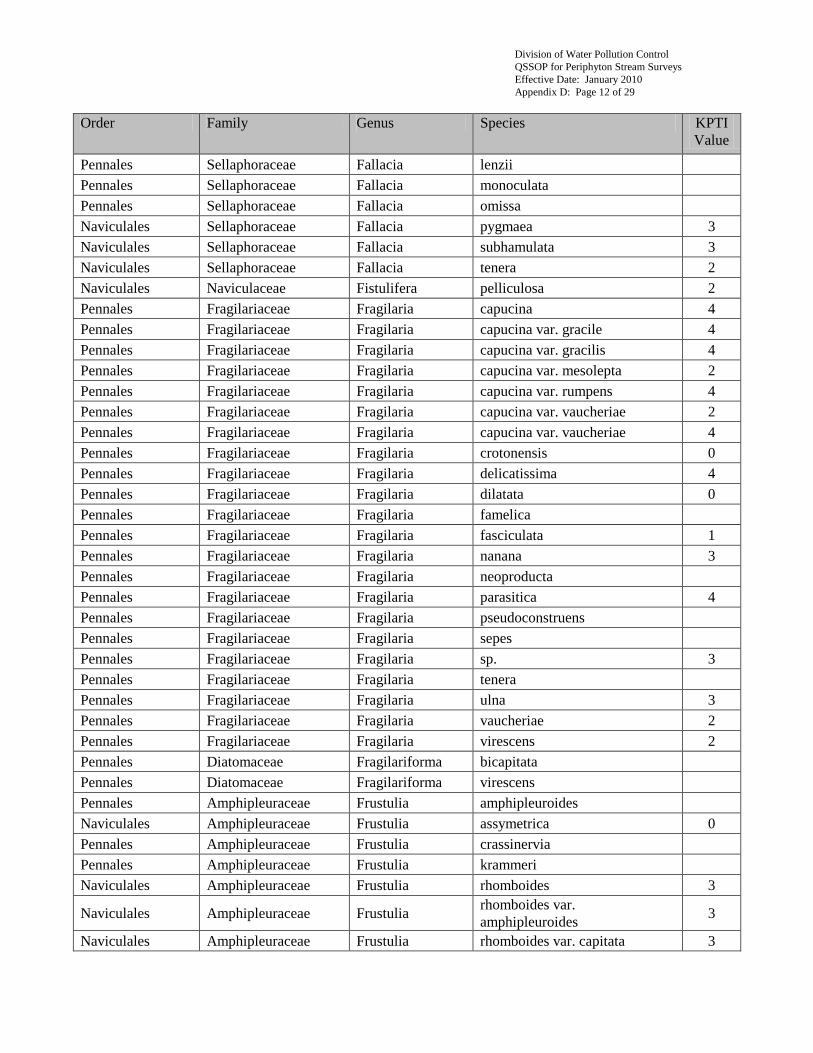
Division of Water Pollution Control
QSSOP for Periphyton Stream Surveys
Effective Date: January 2010
Appendix D: Page 12 of 29
Order Family Genus Species KPTI
Value
Pennales Sellaphoraceae Fallacia lenzii
Pennales Sellaphoraceae Fallacia monoculata
Pennales Sellaphoraceae Fallacia omissa
Naviculales Sellaphoraceae Fallacia pygmaea 3
Naviculales Sellaphoraceae Fallacia subhamulata 3
Naviculales Sellaphoraceae Fallacia tenera 2
Naviculales Naviculaceae Fistulifera pelliculosa 2
Pennales Fragilariaceae Fragilaria capucina 4
Pennales Fragilariaceae Fragilaria capucina var. gracile 4
Pennales Fragilariaceae Fragilaria capucina var. gracilis 4
Pennales Fragilariaceae Fragilaria capucina var. mesolepta 2
Pennales Fragilariaceae Fragilaria capucina var. rumpens 4
Pennales Fragilariaceae Fragilaria capucina var. vaucheriae 2
Pennales Fragilariaceae Fragilaria capucina var. vaucheriae 4
Pennales Fragilariaceae Fragilaria crotonensis 0
Pennales Fragilariaceae Fragilaria delicatissima 4
Pennales Fragilariaceae Fragilaria dilatata 0
Pennales Fragilariaceae Fragilaria famelica
Pennales Fragilariaceae Fragilaria fasciculata 1
Pennales Fragilariaceae Fragilaria nanana 3
Pennales Fragilariaceae Fragilaria neoproducta
Pennales Fragilariaceae Fragilaria parasitica 4
Pennales Fragilariaceae Fragilaria pseudoconstruens
Pennales Fragilariaceae Fragilaria sepes
Pennales Fragilariaceae Fragilaria sp. 3
Pennales Fragilariaceae Fragilaria tenera
Pennales Fragilariaceae Fragilaria ulna 3
Pennales Fragilariaceae Fragilaria vaucheriae 2
Pennales Fragilariaceae Fragilaria virescens 2
Pennales Diatomaceae Fragilariforma bicapitata
Pennales Diatomaceae Fragilariforma virescens
Pennales Amphipleuraceae Frustulia amphipleuroides
Naviculales Amphipleuraceae Frustulia assymetrica 0
Pennales Amphipleuraceae Frustulia crassinervia
Pennales Amphipleuraceae Frustulia krammeri
Naviculales Amphipleuraceae Frustulia rhomboides 3
Naviculales Amphipleuraceae Frustulia rhomboides var.
amphipleuroides 3
Naviculales Amphipleuraceae Frustulia rhomboides var. capitata 3
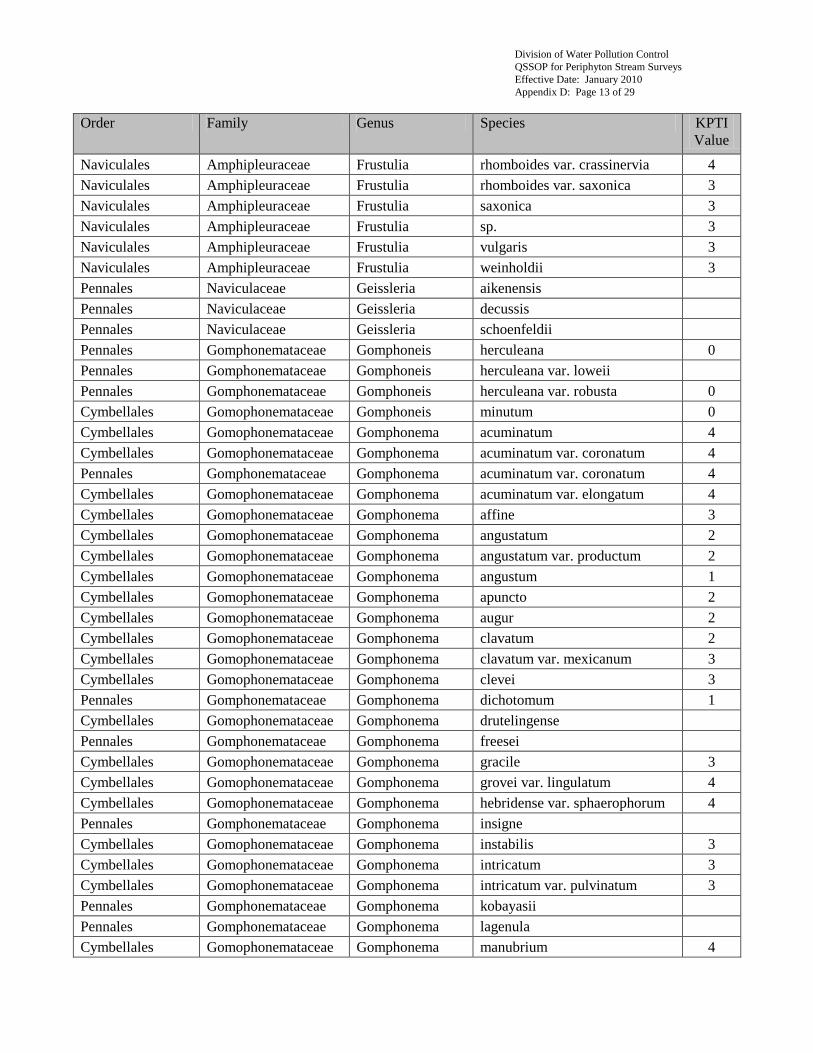
Division of Water Pollution Control
QSSOP for Periphyton Stream Surveys
Effective Date: January 2010
Appendix D: Page 13 of 29
Order Family Genus Species KPTI
Value
Naviculales Amphipleuraceae Frustulia rhomboides var. crassinervia 4
Naviculales Amphipleuraceae Frustulia rhomboides var. saxonica 3
Naviculales Amphipleuraceae Frustulia saxonica 3
Naviculales Amphipleuraceae Frustulia sp. 3
Naviculales Amphipleuraceae Frustulia vulgaris 3
Naviculales Amphipleuraceae Frustulia weinholdii 3
Pennales Naviculaceae Geissleria aikenensis
Pennales Naviculaceae Geissleria decussis
Pennales Naviculaceae Geissleria schoenfeldii
Pennales Gomphonemataceae Gomphoneis herculeana 0
Pennales Gomphonemataceae Gomphoneis herculeana var. loweii
Pennales Gomphonemataceae Gomphoneis herculeana var. robusta 0
Cymbellales Gomophonemataceae Gomphoneis minutum 0
Cymbellales Gomophonemataceae Gomphonema acuminatum 4
Cymbellales Gomophonemataceae Gomphonema acuminatum var. coronatum 4
Pennales Gomphonemataceae Gomphonema acuminatum var. coronatum 4
Cymbellales Gomophonemataceae Gomphonema acuminatum var. elongatum 4
Cymbellales Gomophonemataceae Gomphonema affine 3
Cymbellales Gomophonemataceae Gomphonema angustatum 2
Cymbellales Gomophonemataceae Gomphonema angustatum var. productum 2
Cymbellales Gomophonemataceae Gomphonema angustum 1
Cymbellales Gomophonemataceae Gomphonema apuncto 2
Cymbellales Gomophonemataceae Gomphonema augur 2
Cymbellales Gomophonemataceae Gomphonema clavatum 2
Cymbellales Gomophonemataceae Gomphonema clavatum var. mexicanum 3
Cymbellales Gomophonemataceae Gomphonema clevei 3
Pennales Gomphonemataceae Gomphonema dichotomum 1
Cymbellales Gomophonemataceae Gomphonema drutelingense
Pennales Gomphonemataceae Gomphonema freesei
Cymbellales Gomophonemataceae Gomphonema gracile 3
Cymbellales Gomophonemataceae Gomphonema grovei var. lingulatum 4
Cymbellales Gomophonemataceae Gomphonema hebridense var. sphaerophorum 4
Pennales Gomphonemataceae Gomphonema insigne
Cymbellales Gomophonemataceae Gomphonema instabilis 3
Cymbellales Gomophonemataceae Gomphonema intricatum 3
Cymbellales Gomophonemataceae Gomphonema intricatum var. pulvinatum 3
Pennales Gomphonemataceae Gomphonema kobayasii
Pennales Gomphonemataceae Gomphonema lagenula
Cymbellales Gomophonemataceae Gomphonema manubrium 4
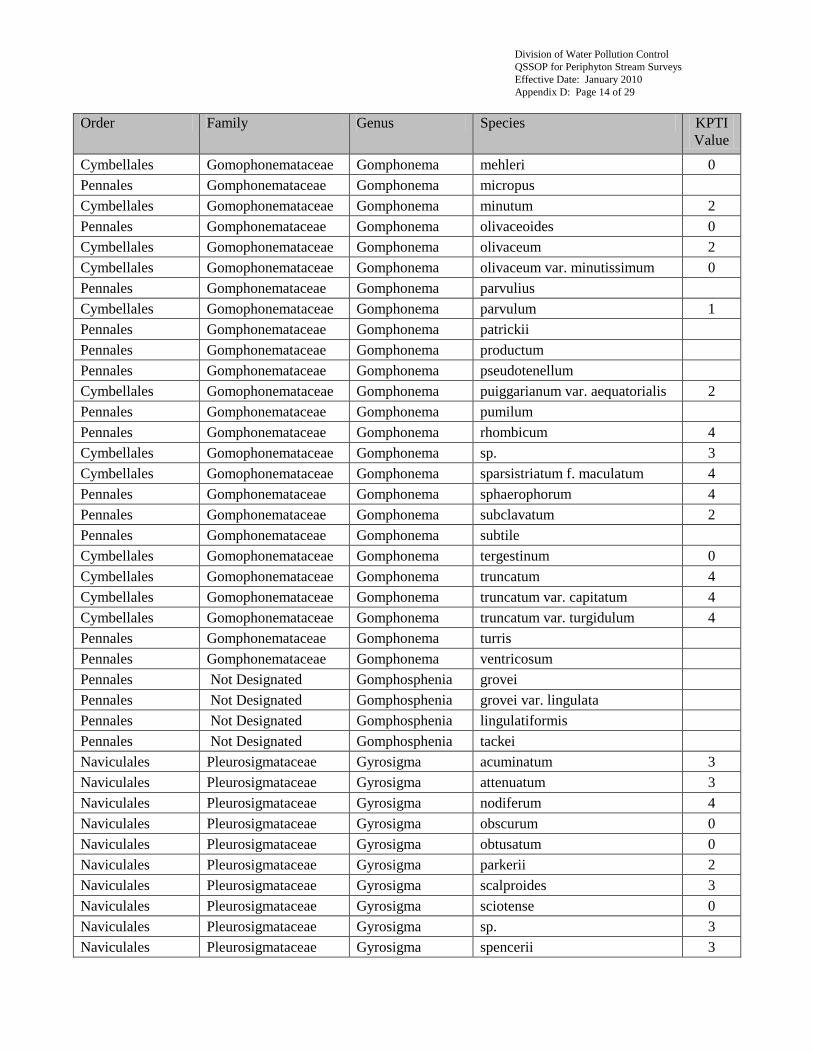
Division of Water Pollution Control
QSSOP for Periphyton Stream Surveys
Effective Date: January 2010
Appendix D: Page 14 of 29
Order Family Genus Species KPTI
Value
Cymbellales Gomophonemataceae Gomphonema mehleri 0
Pennales Gomphonemataceae Gomphonema micropus
Cymbellales Gomophonemataceae Gomphonema minutum 2
Pennales Gomphonemataceae Gomphonema olivaceoides 0
Cymbellales Gomophonemataceae Gomphonema olivaceum 2
Cymbellales Gomophonemataceae Gomphonema olivaceum var. minutissimum 0
Pennales Gomphonemataceae Gomphonema parvulius
Cymbellales Gomophonemataceae Gomphonema parvulum 1
Pennales Gomphonemataceae Gomphonema patrickii
Pennales Gomphonemataceae Gomphonema productum
Pennales Gomphonemataceae Gomphonema pseudotenellum
Cymbellales Gomophonemataceae Gomphonema puiggarianum var. aequatorialis 2
Pennales Gomphonemataceae Gomphonema pumilum
Pennales Gomphonemataceae Gomphonema rhombicum 4
Cymbellales Gomophonemataceae Gomphonema sp. 3
Cymbellales Gomophonemataceae Gomphonema sparsistriatum f. maculatum 4
Pennales Gomphonemataceae Gomphonema sphaerophorum 4
Pennales Gomphonemataceae Gomphonema subclavatum 2
Pennales Gomphonemataceae Gomphonema subtile
Cymbellales Gomophonemataceae Gomphonema tergestinum 0
Cymbellales Gomophonemataceae Gomphonema truncatum 4
Cymbellales Gomophonemataceae Gomphonema truncatum var. capitatum 4
Cymbellales Gomophonemataceae Gomphonema truncatum var. turgidulum 4
Pennales Gomphonemataceae Gomphonema turris
Pennales Gomphonemataceae Gomphonema ventricosum
Pennales Not Designated Gomphosphenia grovei
Pennales Not Designated Gomphosphenia grovei var. lingulata
Pennales Not Designated Gomphosphenia lingulatiformis
Pennales Not Designated Gomphosphenia tackei
Naviculales Pleurosigmataceae Gyrosigma acuminatum 3
Naviculales Pleurosigmataceae Gyrosigma attenuatum 3
Naviculales Pleurosigmataceae Gyrosigma nodiferum 4
Naviculales Pleurosigmataceae Gyrosigma obscurum 0
Naviculales Pleurosigmataceae Gyrosigma obtusatum 0
Naviculales Pleurosigmataceae Gyrosigma parkerii 2
Naviculales Pleurosigmataceae Gyrosigma scalproides 3
Naviculales Pleurosigmataceae Gyrosigma sciotense 0
Naviculales Pleurosigmataceae Gyrosigma sp. 3
Naviculales Pleurosigmataceae Gyrosigma spencerii 3
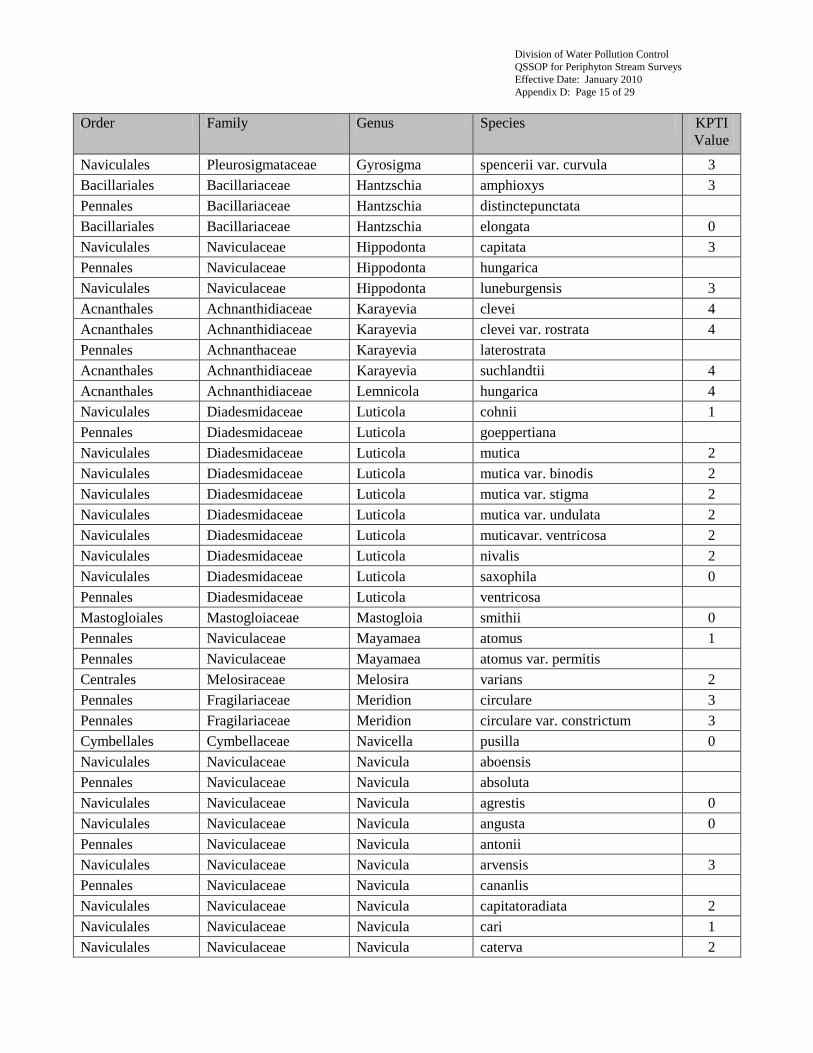
Division of Water Pollution Control
QSSOP for Periphyton Stream Surveys
Effective Date: January 2010
Appendix D: Page 15 of 29
Order Family Genus Species KPTI
Value
Naviculales Pleurosigmataceae Gyrosigma spencerii var. curvula 3
Bacillariales Bacillariaceae Hantzschia amphioxys 3
Pennales Bacillariaceae Hantzschia distinctepunctata
Bacillariales Bacillariaceae Hantzschia elongata 0
Naviculales Naviculaceae Hippodonta capitata 3
Pennales Naviculaceae Hippodonta hungarica
Naviculales Naviculaceae Hippodonta luneburgensis 3
Acnanthales Achnanthidiaceae Karayevia clevei 4
Acnanthales Achnanthidiaceae Karayevia clevei var. rostrata 4
Pennales Achnanthaceae Karayevia laterostrata
Acnanthales Achnanthidiaceae Karayevia suchlandtii 4
Acnanthales Achnanthidiaceae Lemnicola hungarica 4
Naviculales Diadesmidaceae Luticola cohnii 1
Pennales Diadesmidaceae Luticola goeppertiana
Naviculales Diadesmidaceae Luticola mutica 2
Naviculales Diadesmidaceae Luticola mutica var. binodis 2
Naviculales Diadesmidaceae Luticola mutica var. stigma 2
Naviculales Diadesmidaceae Luticola mutica var. undulata 2
Naviculales Diadesmidaceae Luticola muticavar. ventricosa 2
Naviculales Diadesmidaceae Luticola nivalis 2
Naviculales Diadesmidaceae Luticola saxophila 0
Pennales Diadesmidaceae Luticola ventricosa
Mastogloiales Mastogloiaceae Mastogloia smithii 0
Pennales Naviculaceae Mayamaea atomus 1
Pennales Naviculaceae Mayamaea atomus var. permitis
Centrales Melosiraceae Melosira varians 2
Pennales Fragilariaceae Meridion circulare 3
Pennales Fragilariaceae Meridion circulare var. constrictum 3
Cymbellales Cymbellaceae Navicella pusilla 0
Naviculales Naviculaceae Navicula aboensis
Pennales Naviculaceae Navicula absoluta
Naviculales Naviculaceae Navicula agrestis 0
Naviculales Naviculaceae Navicula angusta 0
Pennales Naviculaceae Navicula antonii
Naviculales Naviculaceae Navicula arvensis 3
Pennales Naviculaceae Navicula cananlis
Naviculales Naviculaceae Navicula capitatoradiata 2
Naviculales Naviculaceae Navicula cari 1
Naviculales Naviculaceae Navicula caterva 2
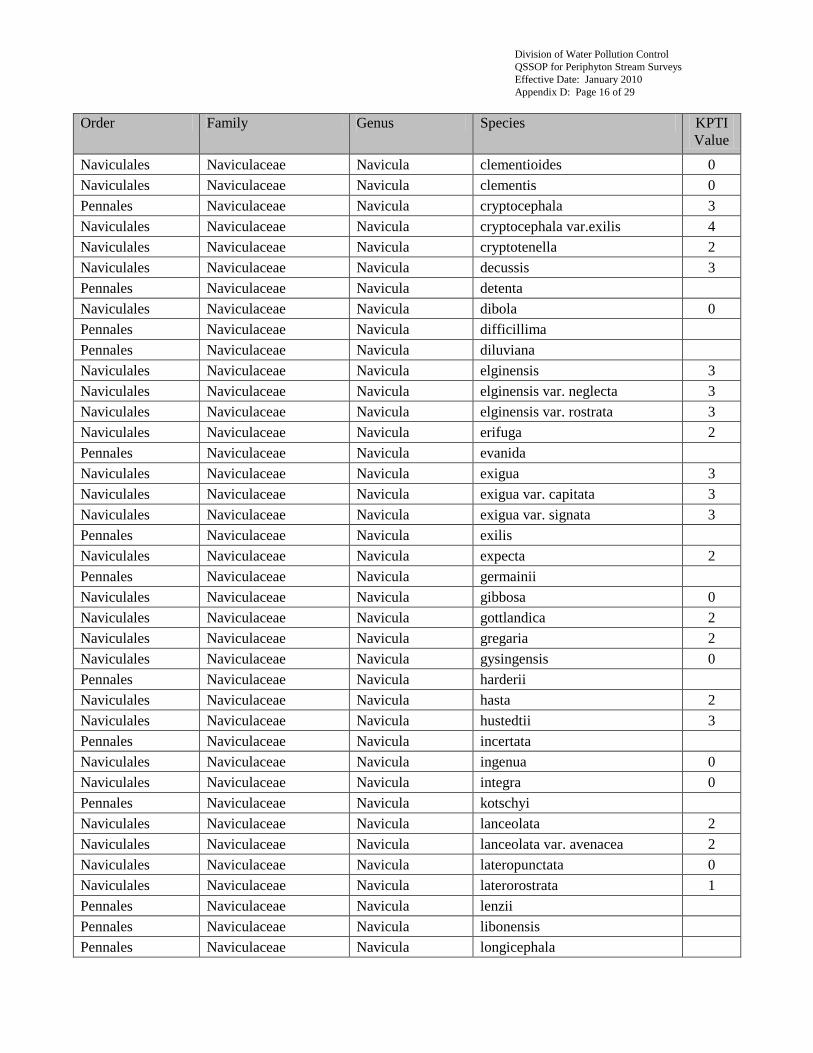
Division of Water Pollution Control
QSSOP for Periphyton Stream Surveys
Effective Date: January 2010
Appendix D: Page 16 of 29
Order Family Genus Species KPTI
Value
Naviculales Naviculaceae Navicula clementioides 0
Naviculales Naviculaceae Navicula clementis 0
Pennales Naviculaceae Navicula cryptocephala 3
Naviculales Naviculaceae Navicula cryptocephala var.exilis 4
Naviculales Naviculaceae Navicula cryptotenella 2
Naviculales Naviculaceae Navicula decussis 3
Pennales Naviculaceae Navicula detenta
Naviculales Naviculaceae Navicula dibola 0
Pennales Naviculaceae Navicula difficillima
Pennales Naviculaceae Navicula diluviana
Naviculales Naviculaceae Navicula elginensis 3
Naviculales Naviculaceae Navicula elginensis var. neglecta 3
Naviculales Naviculaceae Navicula elginensis var. rostrata 3
Naviculales Naviculaceae Navicula erifuga 2
Pennales Naviculaceae Navicula evanida
Naviculales Naviculaceae Navicula exigua 3
Naviculales Naviculaceae Navicula exigua var. capitata 3
Naviculales Naviculaceae Navicula exigua var. signata 3
Pennales Naviculaceae Navicula exilis
Naviculales Naviculaceae Navicula expecta 2
Pennales Naviculaceae Navicula germainii
Naviculales Naviculaceae Navicula gibbosa 0
Naviculales Naviculaceae Navicula gottlandica 2
Naviculales Naviculaceae Navicula gregaria 2
Naviculales Naviculaceae Navicula gysingensis 0
Pennales Naviculaceae Navicula harderii
Naviculales Naviculaceae Navicula hasta 2
Naviculales Naviculaceae Navicula hustedtii 3
Pennales Naviculaceae Navicula incertata
Naviculales Naviculaceae Navicula ingenua 0
Naviculales Naviculaceae Navicula integra 0
Pennales Naviculaceae Navicula kotschyi
Naviculales Naviculaceae Navicula lanceolata 2
Naviculales Naviculaceae Navicula lanceolata var. avenacea 2
Naviculales Naviculaceae Navicula lateropunctata 0
Naviculales Naviculaceae Navicula laterorostrata 1
Pennales Naviculaceae Navicula lenzii
Pennales Naviculaceae Navicula libonensis
Pennales Naviculaceae Navicula longicephala
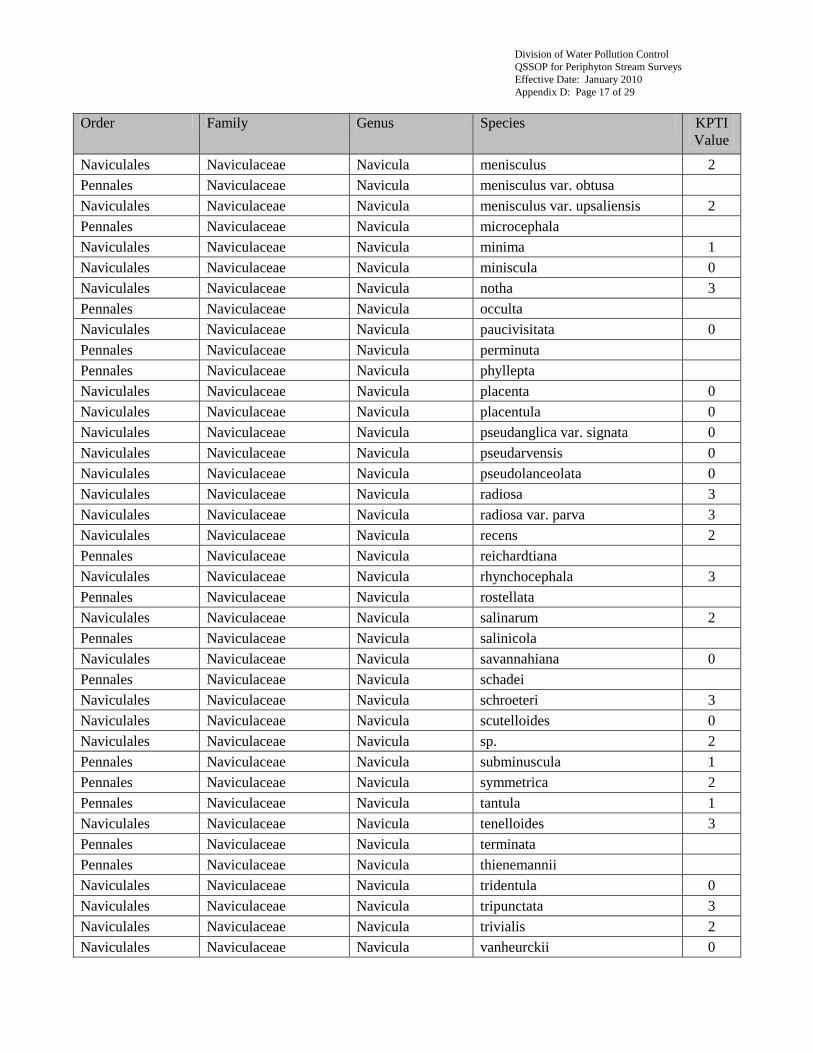
Division of Water Pollution Control
QSSOP for Periphyton Stream Surveys
Effective Date: January 2010
Appendix D: Page 17 of 29
Order Family Genus Species KPTI
Value
Naviculales Naviculaceae Navicula menisculus 2
Pennales Naviculaceae Navicula menisculus var. obtusa
Naviculales Naviculaceae Navicula menisculus var. upsaliensis 2
Pennales Naviculaceae Navicula microcephala
Naviculales Naviculaceae Navicula minima 1
Naviculales Naviculaceae Navicula miniscula 0
Naviculales Naviculaceae Navicula notha 3
Pennales Naviculaceae Navicula occulta
Naviculales Naviculaceae Navicula paucivisitata 0
Pennales Naviculaceae Navicula perminuta
Pennales Naviculaceae Navicula phyllepta
Naviculales Naviculaceae Navicula placenta 0
Naviculales Naviculaceae Navicula placentula 0
Naviculales Naviculaceae Navicula pseudanglica var. signata 0
Naviculales Naviculaceae Navicula pseudarvensis 0
Naviculales Naviculaceae Navicula pseudolanceolata 0
Naviculales Naviculaceae Navicula radiosa 3
Naviculales Naviculaceae Navicula radiosa var. parva 3
Naviculales Naviculaceae Navicula recens 2
Pennales Naviculaceae Navicula reichardtiana
Naviculales Naviculaceae Navicula rhynchocephala 3
Pennales Naviculaceae Navicula rostellata
Naviculales Naviculaceae Navicula salinarum 2
Pennales Naviculaceae Navicula salinicola
Naviculales Naviculaceae Navicula savannahiana 0
Pennales Naviculaceae Navicula schadei
Naviculales Naviculaceae Navicula schroeteri 3
Naviculales Naviculaceae Navicula scutelloides 0
Naviculales Naviculaceae Navicula sp. 2
Pennales Naviculaceae Navicula subminuscula 1
Pennales Naviculaceae Navicula symmetrica 2
Pennales Naviculaceae Navicula tantula 1
Naviculales Naviculaceae Navicula tenelloides 3
Pennales Naviculaceae Navicula terminata
Pennales Naviculaceae Navicula thienemannii
Naviculales Naviculaceae Navicula tridentula 0
Naviculales Naviculaceae Navicula tripunctata 3
Naviculales Naviculaceae Navicula trivialis 2
Naviculales Naviculaceae Navicula vanheurckii 0
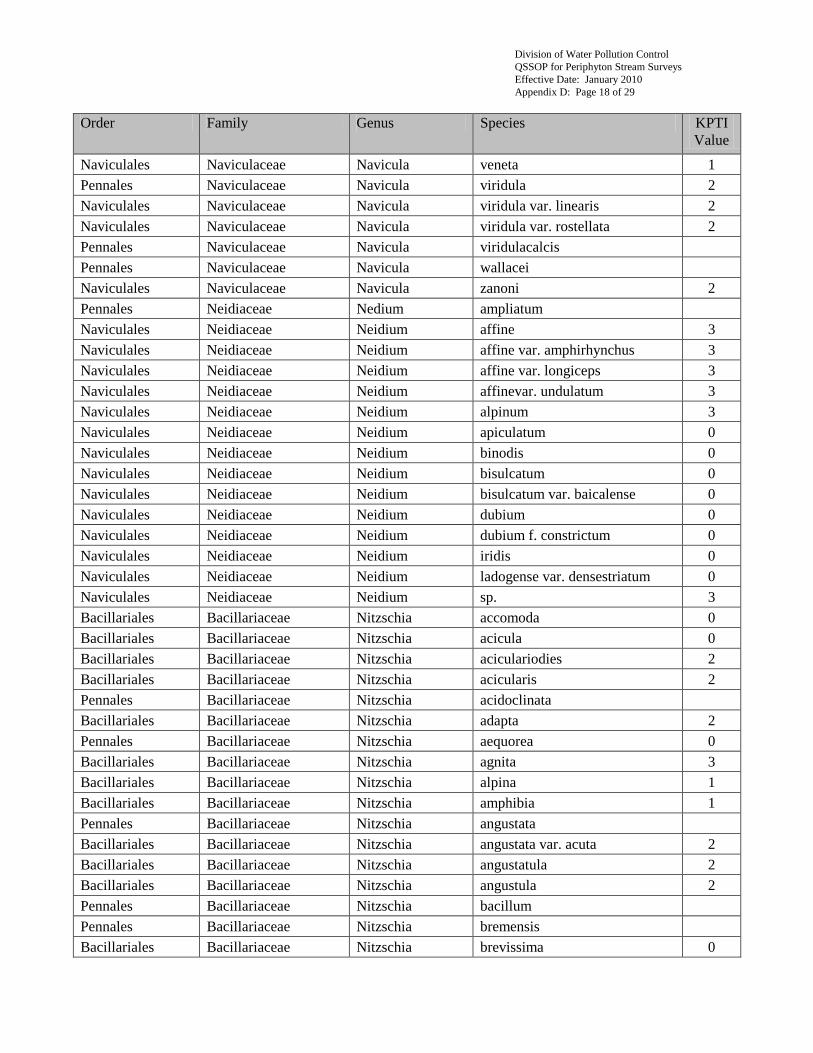
Division of Water Pollution Control
QSSOP for Periphyton Stream Surveys
Effective Date: January 2010
Appendix D: Page 18 of 29
Order Family Genus Species KPTI
Value
Naviculales Naviculaceae Navicula veneta 1
Pennales Naviculaceae Navicula viridula 2
Naviculales Naviculaceae Navicula viridula var. linearis 2
Naviculales Naviculaceae Navicula viridula var. rostellata 2
Pennales Naviculaceae Navicula viridulacalcis
Pennales Naviculaceae Navicula wallacei
Naviculales Naviculaceae Navicula zanoni 2
Pennales Neidiaceae Nedium ampliatum
Naviculales Neidiaceae Neidium affine 3
Naviculales Neidiaceae Neidium affine var. amphirhynchus 3
Naviculales Neidiaceae Neidium affine var. longiceps 3
Naviculales Neidiaceae Neidium affinevar. undulatum 3
Naviculales Neidiaceae Neidium alpinum 3
Naviculales Neidiaceae Neidium apiculatum 0
Naviculales Neidiaceae Neidium binodis 0
Naviculales Neidiaceae Neidium bisulcatum 0
Naviculales Neidiaceae Neidium bisulcatum var. baicalense 0
Naviculales Neidiaceae Neidium dubium 0
Naviculales Neidiaceae Neidium dubium f. constrictum 0
Naviculales Neidiaceae Neidium iridis 0
Naviculales Neidiaceae Neidium ladogense var. densestriatum 0
Naviculales Neidiaceae Neidium sp. 3
Bacillariales Bacillariaceae Nitzschia accomoda 0
Bacillariales Bacillariaceae Nitzschia acicula 0
Bacillariales Bacillariaceae Nitzschia aciculariodies 2
Bacillariales Bacillariaceae Nitzschia acicularis 2
Pennales Bacillariaceae Nitzschia acidoclinata
Bacillariales Bacillariaceae Nitzschia adapta 2
Pennales Bacillariaceae Nitzschia aequorea 0
Bacillariales Bacillariaceae Nitzschia agnita 3
Bacillariales Bacillariaceae Nitzschia alpina 1
Bacillariales Bacillariaceae Nitzschia amphibia 1
Pennales Bacillariaceae Nitzschia angustata
Bacillariales Bacillariaceae Nitzschia angustata var. acuta 2
Bacillariales Bacillariaceae Nitzschia angustatula 2
Bacillariales Bacillariaceae Nitzschia angustula 2
Pennales Bacillariaceae Nitzschia bacillum
Pennales Bacillariaceae Nitzschia bremensis
Bacillariales Bacillariaceae Nitzschia brevissima 0
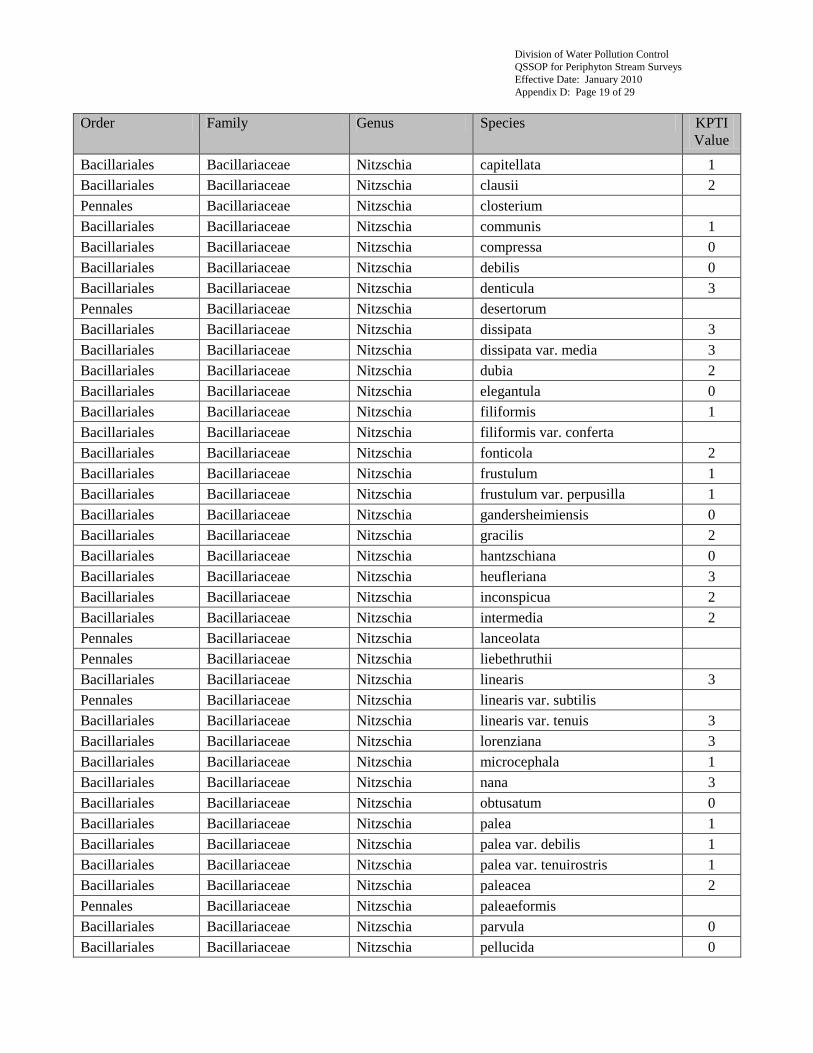
Division of Water Pollution Control
QSSOP for Periphyton Stream Surveys
Effective Date: January 2010
Appendix D: Page 19 of 29
Order Family Genus Species KPTI
Value
Bacillariales Bacillariaceae Nitzschia capitellata 1
Bacillariales Bacillariaceae Nitzschia clausii 2
Pennales Bacillariaceae Nitzschia closterium
Bacillariales Bacillariaceae Nitzschia communis 1
Bacillariales Bacillariaceae Nitzschia compressa 0
Bacillariales Bacillariaceae Nitzschia debilis 0
Bacillariales Bacillariaceae Nitzschia denticula 3
Pennales Bacillariaceae Nitzschia desertorum
Bacillariales Bacillariaceae Nitzschia dissipata 3
Bacillariales Bacillariaceae Nitzschia dissipata var. media 3
Bacillariales Bacillariaceae Nitzschia dubia 2
Bacillariales Bacillariaceae Nitzschia elegantula 0
Bacillariales Bacillariaceae Nitzschia filiformis 1
Bacillariales Bacillariaceae Nitzschia filiformis var. conferta
Bacillariales Bacillariaceae Nitzschia fonticola 2
Bacillariales Bacillariaceae Nitzschia frustulum 1
Bacillariales Bacillariaceae Nitzschia frustulum var. perpusilla 1
Bacillariales Bacillariaceae Nitzschia gandersheimiensis 0
Bacillariales Bacillariaceae Nitzschia gracilis 2
Bacillariales Bacillariaceae Nitzschia hantzschiana 0
Bacillariales Bacillariaceae Nitzschia heufleriana 3
Bacillariales Bacillariaceae Nitzschia inconspicua 2
Bacillariales Bacillariaceae Nitzschia intermedia 2
Pennales Bacillariaceae Nitzschia lanceolata
Pennales Bacillariaceae Nitzschia liebethruthii
Bacillariales Bacillariaceae Nitzschia linearis 3
Pennales Bacillariaceae Nitzschia linearis var. subtilis
Bacillariales Bacillariaceae Nitzschia linearis var. tenuis 3
Bacillariales Bacillariaceae Nitzschia lorenziana 3
Bacillariales Bacillariaceae Nitzschia microcephala 1
Bacillariales Bacillariaceae Nitzschia nana 3
Bacillariales Bacillariaceae Nitzschia obtusatum 0
Bacillariales Bacillariaceae Nitzschia palea 1
Bacillariales Bacillariaceae Nitzschia palea var. debilis 1
Bacillariales Bacillariaceae Nitzschia palea var. tenuirostris 1
Bacillariales Bacillariaceae Nitzschia paleacea 2
Pennales Bacillariaceae Nitzschia paleaeformis
Bacillariales Bacillariaceae Nitzschia parvula 0
Bacillariales Bacillariaceae Nitzschia pellucida 0
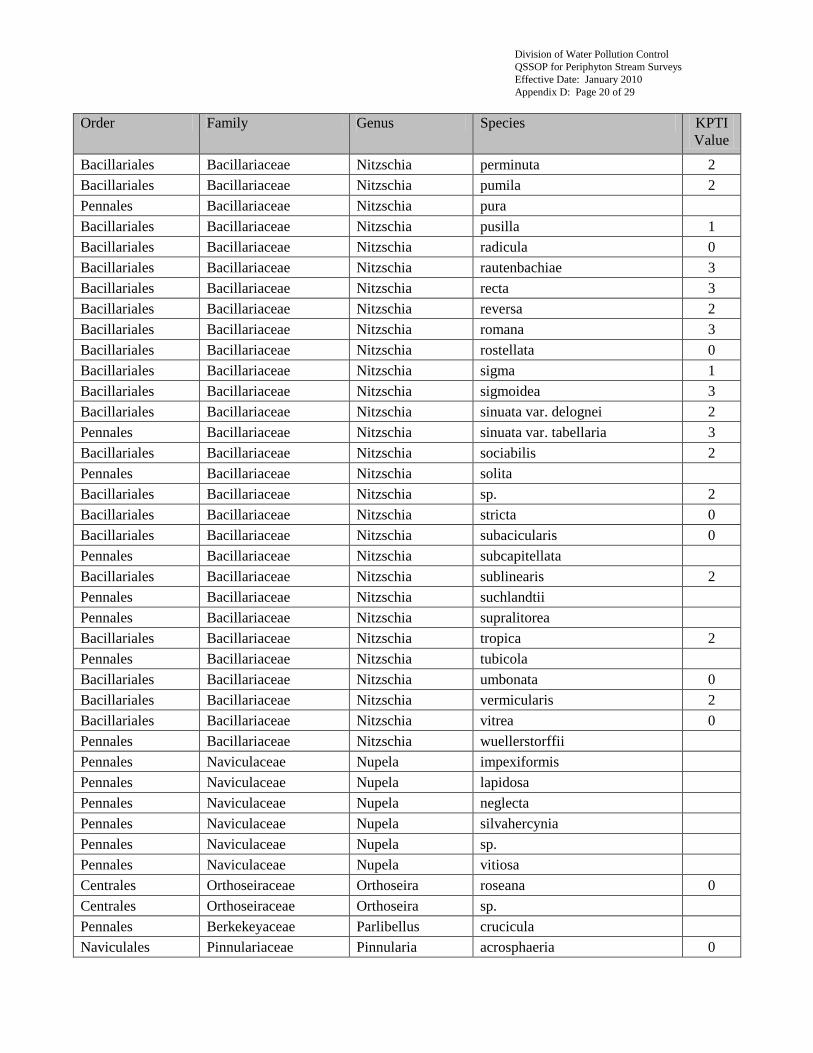
Division of Water Pollution Control
QSSOP for Periphyton Stream Surveys
Effective Date: January 2010
Appendix D: Page 20 of 29
Order Family Genus Species KPTI
Value
Bacillariales Bacillariaceae Nitzschia perminuta 2
Bacillariales Bacillariaceae Nitzschia pumila 2
Pennales Bacillariaceae Nitzschia pura
Bacillariales Bacillariaceae Nitzschia pusilla 1
Bacillariales Bacillariaceae Nitzschia radicula 0
Bacillariales Bacillariaceae Nitzschia rautenbachiae 3
Bacillariales Bacillariaceae Nitzschia recta 3
Bacillariales Bacillariaceae Nitzschia reversa 2
Bacillariales Bacillariaceae Nitzschia romana 3
Bacillariales Bacillariaceae Nitzschia rostellata 0
Bacillariales Bacillariaceae Nitzschia sigma 1
Bacillariales Bacillariaceae Nitzschia sigmoidea 3
Bacillariales Bacillariaceae Nitzschia sinuata var. delognei 2
Pennales Bacillariaceae Nitzschia sinuata var. tabellaria 3
Bacillariales Bacillariaceae Nitzschia sociabilis 2
Pennales Bacillariaceae Nitzschia solita
Bacillariales Bacillariaceae Nitzschia sp. 2
Bacillariales Bacillariaceae Nitzschia stricta 0
Bacillariales Bacillariaceae Nitzschia subacicularis 0
Pennales Bacillariaceae Nitzschia subcapitellata
Bacillariales Bacillariaceae Nitzschia sublinearis 2
Pennales Bacillariaceae Nitzschia suchlandtii
Pennales Bacillariaceae Nitzschia supralitorea
Bacillariales Bacillariaceae Nitzschia tropica 2
Pennales Bacillariaceae Nitzschia tubicola
Bacillariales Bacillariaceae Nitzschia umbonata 0
Bacillariales Bacillariaceae Nitzschia vermicularis 2
Bacillariales Bacillariaceae Nitzschia vitrea 0
Pennales Bacillariaceae Nitzschia wuellerstorffii
Pennales Naviculaceae Nupela impexiformis
Pennales Naviculaceae Nupela lapidosa
Pennales Naviculaceae Nupela neglecta
Pennales Naviculaceae Nupela silvahercynia
Pennales Naviculaceae Nupela sp.
Pennales Naviculaceae Nupela vitiosa
Centrales Orthoseiraceae Orthoseira roseana 0
Centrales Orthoseiraceae Orthoseira sp.
Pennales Berkekeyaceae Parlibellus crucicula
Naviculales Pinnulariaceae Pinnularia acrosphaeria 0
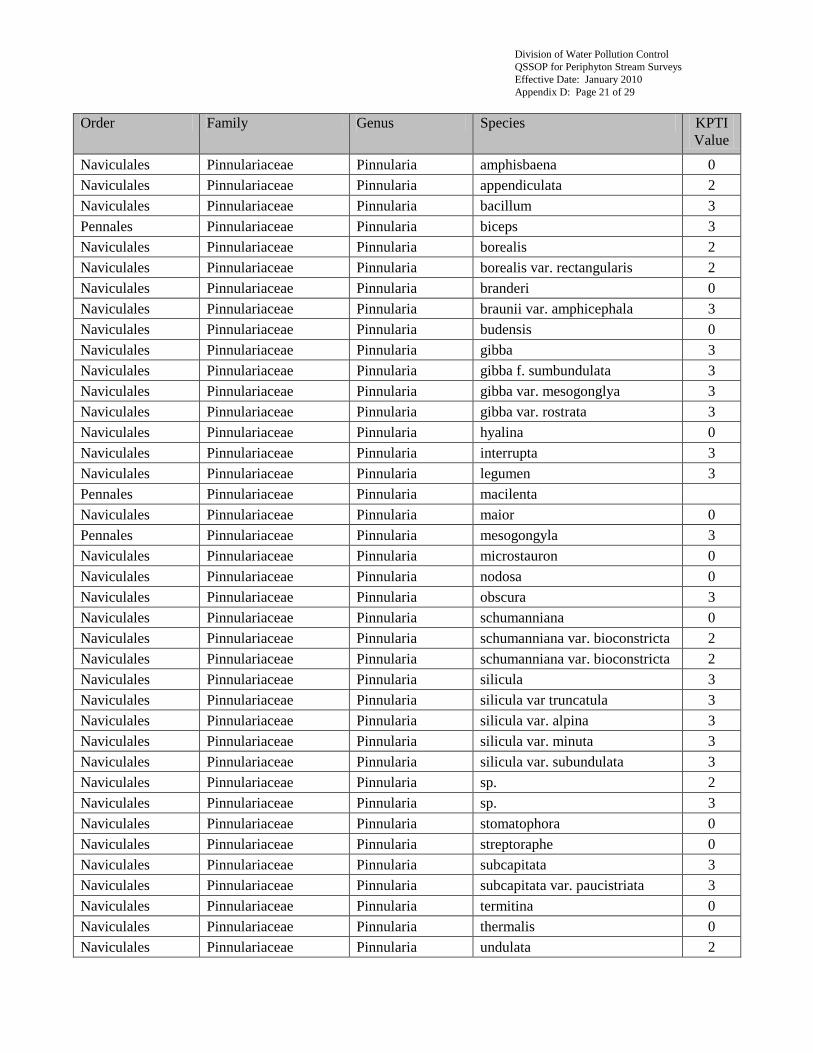
Division of Water Pollution Control
QSSOP for Periphyton Stream Surveys
Effective Date: January 2010
Appendix D: Page 21 of 29
Order Family Genus Species KPTI
Value
Naviculales Pinnulariaceae Pinnularia amphisbaena 0
Naviculales Pinnulariaceae Pinnularia appendiculata 2
Naviculales Pinnulariaceae Pinnularia bacillum 3
Pennales Pinnulariaceae Pinnularia biceps 3
Naviculales Pinnulariaceae Pinnularia borealis 2
Naviculales Pinnulariaceae Pinnularia borealis var. rectangularis 2
Naviculales Pinnulariaceae Pinnularia branderi 0
Naviculales Pinnulariaceae Pinnularia braunii var. amphicephala 3
Naviculales Pinnulariaceae Pinnularia budensis 0
Naviculales Pinnulariaceae Pinnularia gibba 3
Naviculales Pinnulariaceae Pinnularia gibba f. sumbundulata 3
Naviculales Pinnulariaceae Pinnularia gibba var. mesogonglya 3
Naviculales Pinnulariaceae Pinnularia gibba var. rostrata 3
Naviculales Pinnulariaceae Pinnularia hyalina 0
Naviculales Pinnulariaceae Pinnularia interrupta 3
Naviculales Pinnulariaceae Pinnularia legumen 3
Pennales Pinnulariaceae Pinnularia macilenta
Naviculales Pinnulariaceae Pinnularia maior 0
Pennales Pinnulariaceae Pinnularia mesogongyla 3
Naviculales Pinnulariaceae Pinnularia microstauron 0
Naviculales Pinnulariaceae Pinnularia nodosa 0
Naviculales Pinnulariaceae Pinnularia obscura 3
Naviculales Pinnulariaceae Pinnularia schumanniana 0
Naviculales Pinnulariaceae Pinnularia schumanniana var. bioconstricta 2
Naviculales Pinnulariaceae Pinnularia schumanniana var. bioconstricta 2
Naviculales Pinnulariaceae Pinnularia silicula 3
Naviculales Pinnulariaceae Pinnularia silicula var truncatula 3
Naviculales Pinnulariaceae Pinnularia silicula var. alpina 3
Naviculales Pinnulariaceae Pinnularia silicula var. minuta 3
Naviculales Pinnulariaceae Pinnularia silicula var. subundulata 3
Naviculales Pinnulariaceae Pinnularia sp. 2
Naviculales Pinnulariaceae Pinnularia sp. 3
Naviculales Pinnulariaceae Pinnularia stomatophora 0
Naviculales Pinnulariaceae Pinnularia streptoraphe 0
Naviculales Pinnulariaceae Pinnularia subcapitata 3
Naviculales Pinnulariaceae Pinnularia subcapitata var. paucistriata 3
Naviculales Pinnulariaceae Pinnularia termitina 0
Naviculales Pinnulariaceae Pinnularia thermalis 0
Naviculales Pinnulariaceae Pinnularia undulata 2
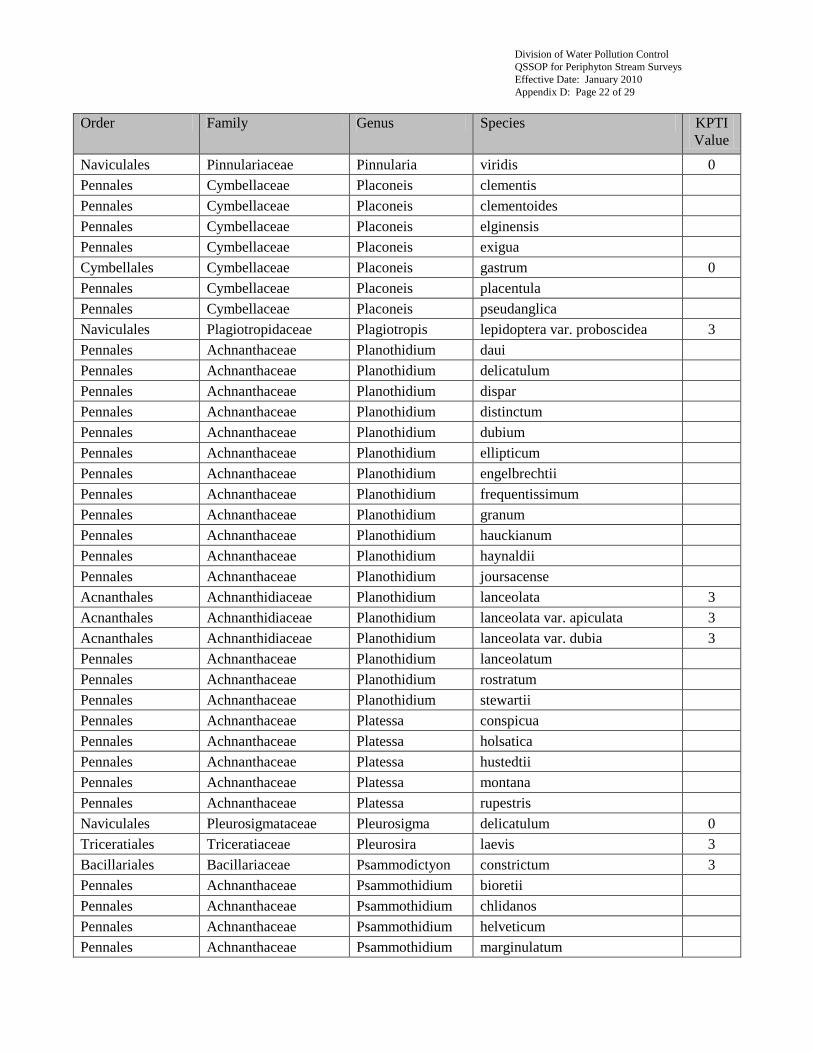
Division of Water Pollution Control
QSSOP for Periphyton Stream Surveys
Effective Date: January 2010
Appendix D: Page 22 of 29
Order Family Genus Species KPTI
Value
Naviculales Pinnulariaceae Pinnularia viridis 0
Pennales Cymbellaceae Placoneis clementis
Pennales Cymbellaceae Placoneis clementoides
Pennales Cymbellaceae Placoneis elginensis
Pennales Cymbellaceae Placoneis exigua
Cymbellales Cymbellaceae Placoneis gastrum 0
Pennales Cymbellaceae Placoneis placentula
Pennales Cymbellaceae Placoneis pseudanglica
Naviculales Plagiotropidaceae Plagiotropis lepidoptera var. proboscidea 3
Pennales Achnanthaceae Planothidium daui
Pennales Achnanthaceae Planothidium delicatulum
Pennales Achnanthaceae Planothidium dispar
Pennales Achnanthaceae Planothidium distinctum
Pennales Achnanthaceae Planothidium dubium
Pennales Achnanthaceae Planothidium ellipticum
Pennales Achnanthaceae Planothidium engelbrechtii
Pennales Achnanthaceae Planothidium frequentissimum
Pennales Achnanthaceae Planothidium granum
Pennales Achnanthaceae Planothidium hauckianum
Pennales Achnanthaceae Planothidium haynaldii
Pennales Achnanthaceae Planothidium joursacense
Acnanthales Achnanthidiaceae Planothidium lanceolata 3
Acnanthales Achnanthidiaceae Planothidium lanceolata var. apiculata 3
Acnanthales Achnanthidiaceae Planothidium lanceolata var. dubia 3
Pennales Achnanthaceae Planothidium lanceolatum
Pennales Achnanthaceae Planothidium rostratum
Pennales Achnanthaceae Planothidium stewartii
Pennales Achnanthaceae Platessa conspicua
Pennales Achnanthaceae Platessa holsatica
Pennales Achnanthaceae Platessa hustedtii
Pennales Achnanthaceae Platessa montana
Pennales Achnanthaceae Platessa rupestris
Naviculales Pleurosigmataceae Pleurosigma delicatulum 0
Triceratiales Triceratiaceae Pleurosira laevis 3
Bacillariales Bacillariaceae Psammodictyon constrictum 3
Pennales Achnanthaceae Psammothidium bioretii
Pennales Achnanthaceae Psammothidium chlidanos
Pennales Achnanthaceae Psammothidium helveticum
Pennales Achnanthaceae Psammothidium marginulatum
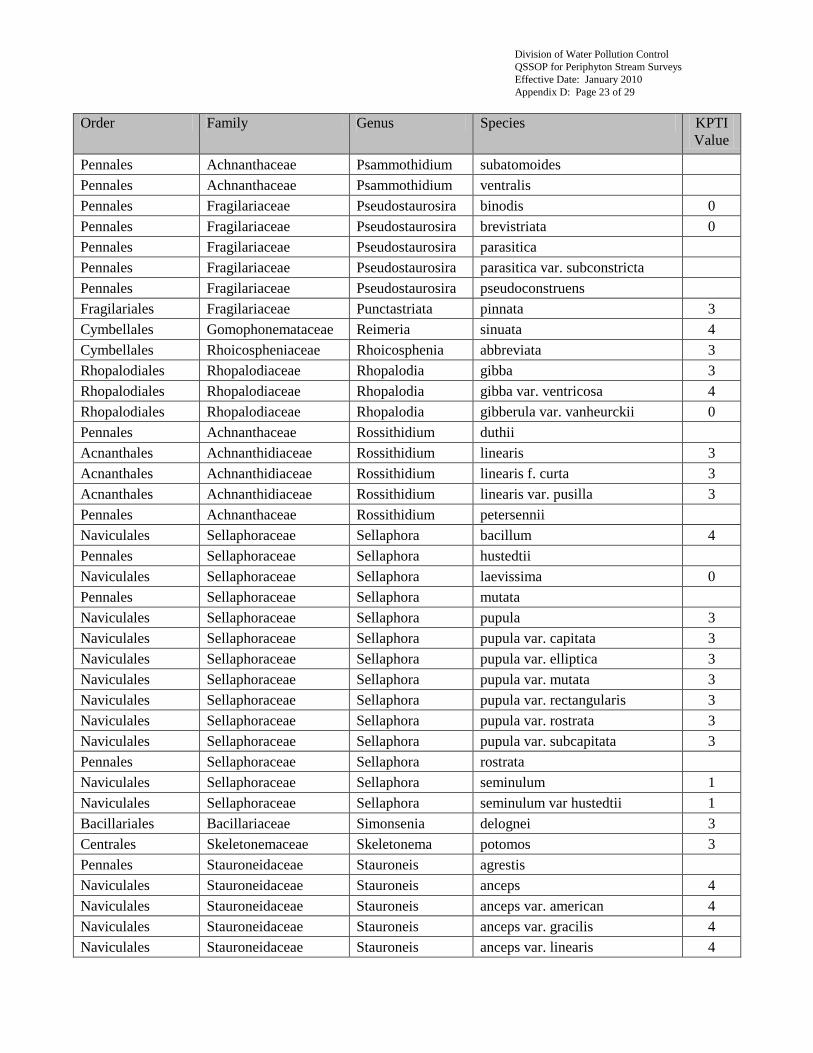
Division of Water Pollution Control
QSSOP for Periphyton Stream Surveys
Effective Date: January 2010
Appendix D: Page 23 of 29
Order Family Genus Species KPTI
Value
Pennales Achnanthaceae Psammothidium subatomoides
Pennales Achnanthaceae Psammothidium ventralis
Pennales Fragilariaceae Pseudostaurosira binodis 0
Pennales Fragilariaceae Pseudostaurosira brevistriata 0
Pennales Fragilariaceae Pseudostaurosira parasitica
Pennales Fragilariaceae Pseudostaurosira parasitica var. subconstricta
Pennales Fragilariaceae Pseudostaurosira pseudoconstruens
Fragilariales Fragilariaceae Punctastriata pinnata 3
Cymbellales Gomophonemataceae Reimeria sinuata 4
Cymbellales Rhoicospheniaceae Rhoicosphenia abbreviata 3
Rhopalodiales Rhopalodiaceae Rhopalodia gibba 3
Rhopalodiales Rhopalodiaceae Rhopalodia gibba var. ventricosa 4
Rhopalodiales Rhopalodiaceae Rhopalodia gibberula var. vanheurckii 0
Pennales Achnanthaceae Rossithidium duthii
Acnanthales Achnanthidiaceae Rossithidium linearis 3
Acnanthales Achnanthidiaceae Rossithidium linearis f. curta 3
Acnanthales Achnanthidiaceae Rossithidium linearis var. pusilla 3
Pennales Achnanthaceae Rossithidium petersennii
Naviculales Sellaphoraceae Sellaphora bacillum 4
Pennales Sellaphoraceae Sellaphora hustedtii
Naviculales Sellaphoraceae Sellaphora laevissima 0
Pennales Sellaphoraceae Sellaphora mutata
Naviculales Sellaphoraceae Sellaphora pupula 3
Naviculales Sellaphoraceae Sellaphora pupula var. capitata 3
Naviculales Sellaphoraceae Sellaphora pupula var. elliptica 3
Naviculales Sellaphoraceae Sellaphora pupula var. mutata 3
Naviculales Sellaphoraceae Sellaphora pupula var. rectangularis 3
Naviculales Sellaphoraceae Sellaphora pupula var. rostrata 3
Naviculales Sellaphoraceae Sellaphora pupula var. subcapitata 3
Pennales Sellaphoraceae Sellaphora rostrata
Naviculales Sellaphoraceae Sellaphora seminulum 1
Naviculales Sellaphoraceae Sellaphora seminulum var hustedtii 1
Bacillariales Bacillariaceae Simonsenia delognei 3
Centrales Skeletonemaceae Skeletonema potomos 3
Pennales Stauroneidaceae Stauroneis agrestis
Naviculales Stauroneidaceae Stauroneis anceps 4
Naviculales Stauroneidaceae Stauroneis anceps var. american 4
Naviculales Stauroneidaceae Stauroneis anceps var. gracilis 4
Naviculales Stauroneidaceae Stauroneis anceps var. linearis 4
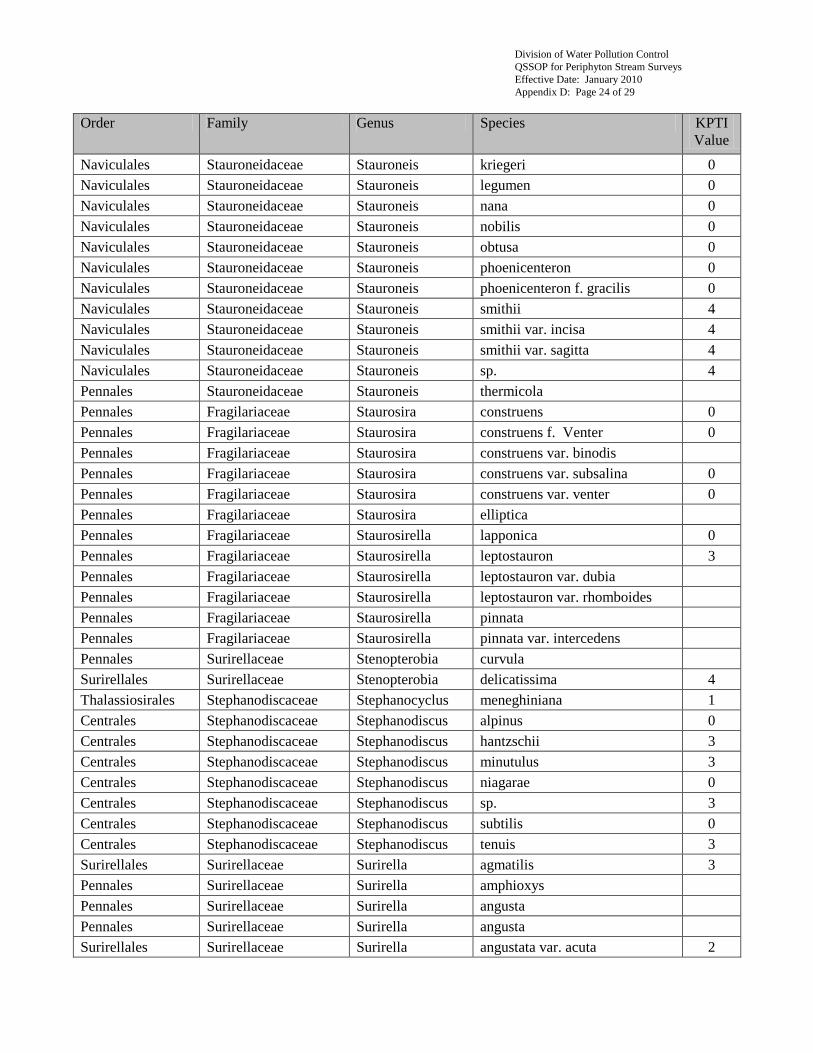
Division of Water Pollution Control
QSSOP for Periphyton Stream Surveys
Effective Date: January 2010
Appendix D: Page 24 of 29
Order Family Genus Species KPTI
Value
Naviculales Stauroneidaceae Stauroneis kriegeri 0
Naviculales Stauroneidaceae Stauroneis legumen 0
Naviculales Stauroneidaceae Stauroneis nana 0
Naviculales Stauroneidaceae Stauroneis nobilis 0
Naviculales Stauroneidaceae Stauroneis obtusa 0
Naviculales Stauroneidaceae Stauroneis phoenicenteron 0
Naviculales Stauroneidaceae Stauroneis phoenicenteron f. gracilis 0
Naviculales Stauroneidaceae Stauroneis smithii 4
Naviculales Stauroneidaceae Stauroneis smithii var. incisa 4
Naviculales Stauroneidaceae Stauroneis smithii var. sagitta 4
Naviculales Stauroneidaceae Stauroneis sp. 4
Pennales Stauroneidaceae Stauroneis thermicola
Pennales Fragilariaceae Staurosira construens 0
Pennales Fragilariaceae Staurosira construens f. Venter 0
Pennales Fragilariaceae Staurosira construens var. binodis
Pennales Fragilariaceae Staurosira construens var. subsalina 0
Pennales Fragilariaceae Staurosira construens var. venter 0
Pennales Fragilariaceae Staurosira elliptica
Pennales Fragilariaceae Staurosirella lapponica 0
Pennales Fragilariaceae Staurosirella leptostauron 3
Pennales Fragilariaceae Staurosirella leptostauron var. dubia
Pennales Fragilariaceae Staurosirella leptostauron var. rhomboides
Pennales Fragilariaceae Staurosirella pinnata
Pennales Fragilariaceae Staurosirella pinnata var. intercedens
Pennales Surirellaceae Stenopterobia curvula
Surirellales Surirellaceae Stenopterobia delicatissima 4
Thalassiosirales Stephanodiscaceae Stephanocyclus meneghiniana 1
Centrales Stephanodiscaceae Stephanodiscus alpinus 0
Centrales Stephanodiscaceae Stephanodiscus hantzschii 3
Centrales Stephanodiscaceae Stephanodiscus minutulus 3
Centrales Stephanodiscaceae Stephanodiscus niagarae 0
Centrales Stephanodiscaceae Stephanodiscus sp. 3
Centrales Stephanodiscaceae Stephanodiscus subtilis 0
Centrales Stephanodiscaceae Stephanodiscus tenuis 3
Surirellales Surirellaceae Surirella agmatilis 3
Pennales Surirellaceae Surirella amphioxys
Pennales Surirellaceae Surirella angusta
Pennales Surirellaceae Surirella angusta
Surirellales Surirellaceae Surirella angustata var. acuta 2
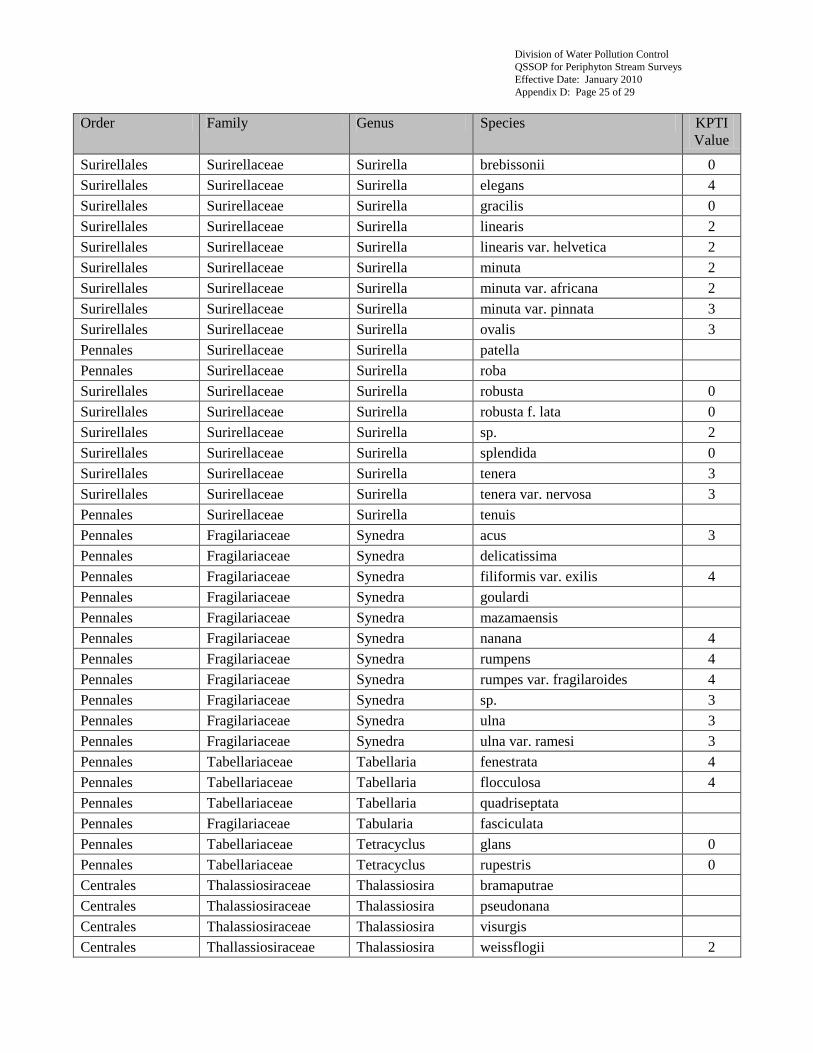
Division of Water Pollution Control
QSSOP for Periphyton Stream Surveys
Effective Date: January 2010
Appendix D: Page 25 of 29
Order Family Genus Species KPTI
Value
Surirellales Surirellaceae Surirella brebissonii 0
Surirellales Surirellaceae Surirella elegans 4
Surirellales Surirellaceae Surirella gracilis 0
Surirellales Surirellaceae Surirella linearis 2
Surirellales Surirellaceae Surirella linearis var. helvetica 2
Surirellales Surirellaceae Surirella minuta 2
Surirellales Surirellaceae Surirella minuta var. africana 2
Surirellales Surirellaceae Surirella minuta var. pinnata 3
Surirellales Surirellaceae Surirella ovalis 3
Pennales Surirellaceae Surirella patella
Pennales Surirellaceae Surirella roba
Surirellales Surirellaceae Surirella robusta 0
Surirellales Surirellaceae Surirella robusta f. lata 0
Surirellales Surirellaceae Surirella sp. 2
Surirellales Surirellaceae Surirella splendida 0
Surirellales Surirellaceae Surirella tenera 3
Surirellales Surirellaceae Surirella tenera var. nervosa 3
Pennales Surirellaceae Surirella tenuis
Pennales Fragilariaceae Synedra acus 3
Pennales Fragilariaceae Synedra delicatissima
Pennales Fragilariaceae Synedra filiformis var. exilis 4
Pennales Fragilariaceae Synedra goulardi
Pennales Fragilariaceae Synedra mazamaensis
Pennales Fragilariaceae Synedra nanana 4
Pennales Fragilariaceae Synedra rumpens 4
Pennales Fragilariaceae Synedra rumpes var. fragilaroides 4
Pennales Fragilariaceae Synedra sp. 3
Pennales Fragilariaceae Synedra ulna 3
Pennales Fragilariaceae Synedra ulna var. ramesi 3
Pennales Tabellariaceae Tabellaria fenestrata 4
Pennales Tabellariaceae Tabellaria flocculosa 4
Pennales Tabellariaceae Tabellaria quadriseptata
Pennales Fragilariaceae Tabularia fasciculata
Pennales Tabellariaceae Tetracyclus glans 0
Pennales Tabellariaceae Tetracyclus rupestris 0
Centrales Thalassiosiraceae Thalassiosira bramaputrae
Centrales Thalassiosiraceae Thalassiosira pseudonana
Centrales Thalassiosiraceae Thalassiosira visurgis
Centrales Thallassiosiraceae Thalassiosira weissflogii 2
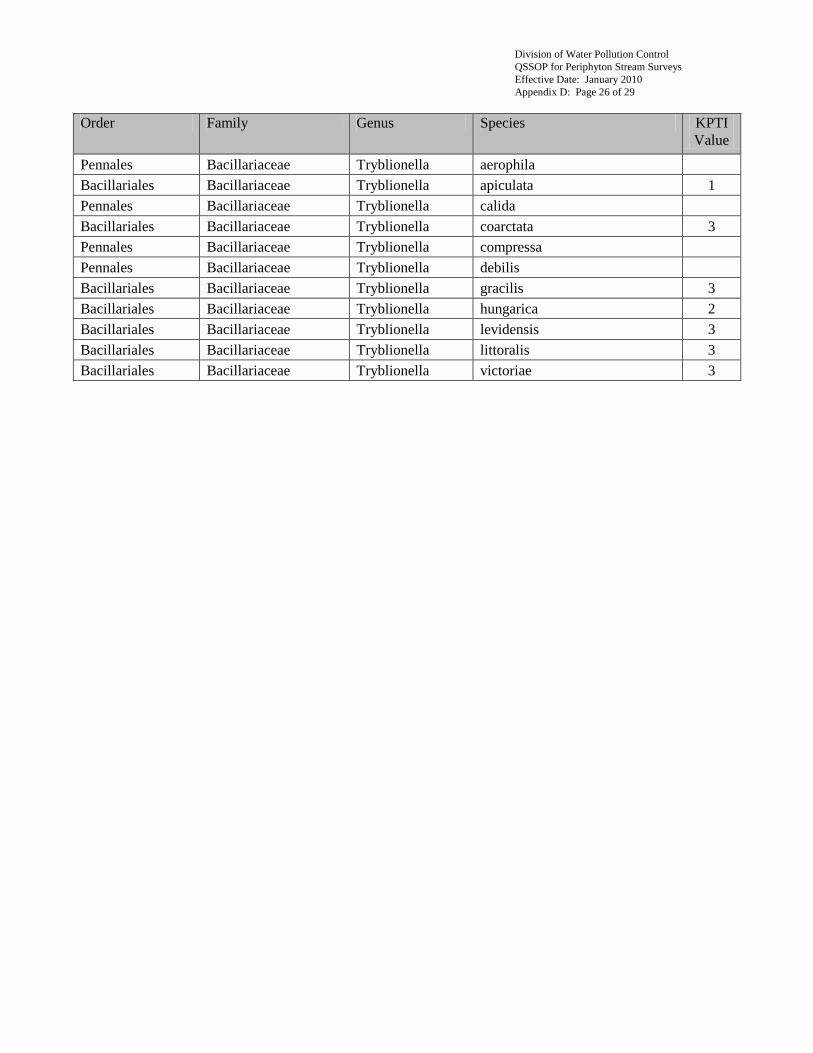
Division of Water Pollution Control
QSSOP for Periphyton Stream Surveys
Effective Date: January 2010
Appendix D: Page 26 of 29
Order Family Genus Species KPTI
Value
Pennales Bacillariaceae Tryblionella aerophila
Bacillariales Bacillariaceae Tryblionella apiculata 1
Pennales Bacillariaceae Tryblionella calida
Bacillariales Bacillariaceae Tryblionella coarctata 3
Pennales Bacillariaceae Tryblionella compressa
Pennales Bacillariaceae Tryblionella debilis
Bacillariales Bacillariaceae Tryblionella gracilis 3
Bacillariales Bacillariaceae Tryblionella hungarica 2
Bacillariales Bacillariaceae Tryblionella levidensis 3
Bacillariales Bacillariaceae Tryblionella littoralis 3
Bacillariales Bacillariaceae Tryblionella victoriae 3
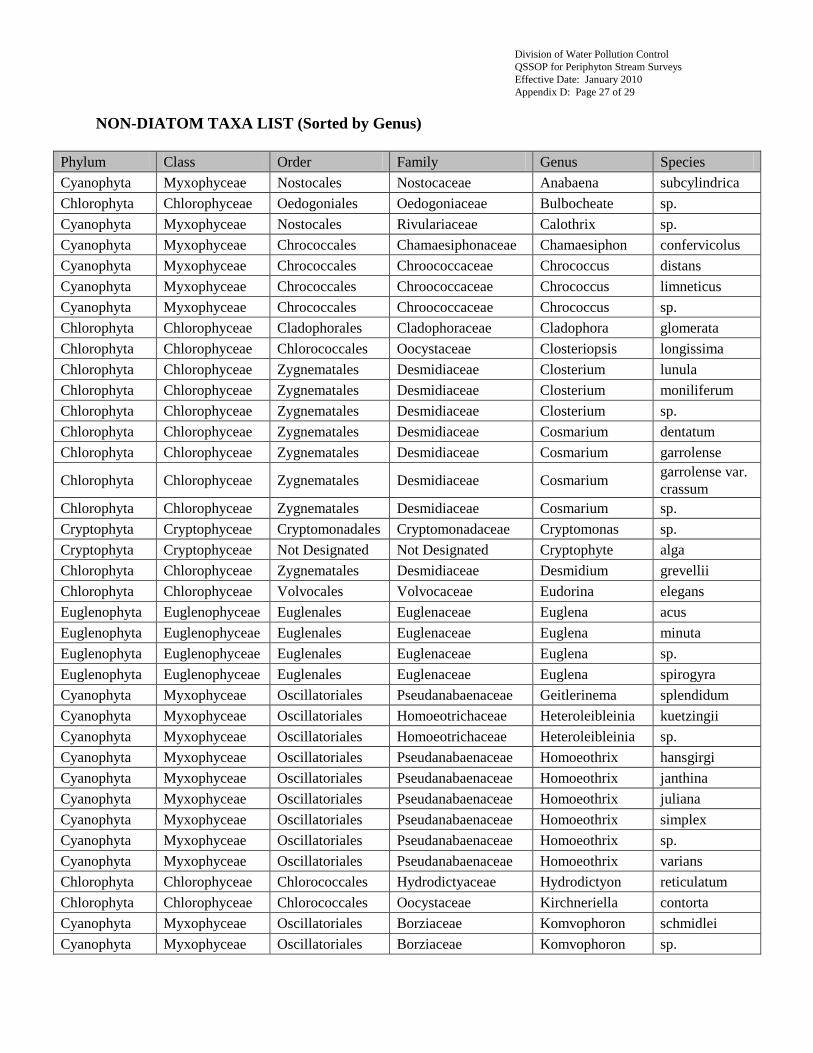
Division of Water Pollution Control
QSSOP for Periphyton Stream Surveys
Effective Date: January 2010
Appendix D: Page 27 of 29
NON-DIATOM TAXA LIST (Sorted by Genus)
Phylum Class Order Family Genus Species
Cyanophyta Myxophyceae Nostocales Nostocaceae Anabaena subcylindrica
Chlorophyta Chlorophyceae Oedogoniales Oedogoniaceae Bulbocheate sp.
Cyanophyta Myxophyceae Nostocales Rivulariaceae Calothrix sp.
Cyanophyta Myxophyceae Chrococcales Chamaesiphonaceae Chamaesiphon confervicolus
Cyanophyta Myxophyceae Chrococcales Chroococcaceae Chrococcus distans
Cyanophyta Myxophyceae Chrococcales Chroococcaceae Chrococcus limneticus
Cyanophyta Myxophyceae Chrococcales Chroococcaceae Chrococcus sp.
Chlorophyta Chlorophyceae Cladophorales Cladophoraceae Cladophora glomerata
Chlorophyta Chlorophyceae Chlorococcales Oocystaceae Closteriopsis longissima
Chlorophyta Chlorophyceae Zygnematales Desmidiaceae Closterium lunula
Chlorophyta Chlorophyceae Zygnematales Desmidiaceae Closterium moniliferum
Chlorophyta Chlorophyceae Zygnematales Desmidiaceae Closterium sp.
Chlorophyta Chlorophyceae Zygnematales Desmidiaceae Cosmarium dentatum
Chlorophyta Chlorophyceae Zygnematales Desmidiaceae Cosmarium garrolense
Chlorophyta Chlorophyceae Zygnematales Desmidiaceae Cosmarium garrolense var.
crassum
Chlorophyta Chlorophyceae Zygnematales Desmidiaceae Cosmarium sp.
Cryptophyta Cryptophyceae Cryptomonadales Cryptomonadaceae Cryptomonas sp.
Cryptophyta Cryptophyceae Not Designated Not Designated Cryptophyte alga
Chlorophyta Chlorophyceae Zygnematales Desmidiaceae Desmidium grevellii
Chlorophyta Chlorophyceae Volvocales Volvocaceae Eudorina elegans
Euglenophyta Euglenophyceae Euglenales Euglenaceae Euglena acus
Euglenophyta Euglenophyceae Euglenales Euglenaceae Euglena minuta
Euglenophyta Euglenophyceae Euglenales Euglenaceae Euglena sp.
Euglenophyta Euglenophyceae Euglenales Euglenaceae Euglena spirogyra
Cyanophyta Myxophyceae Oscillatoriales Pseudanabaenaceae Geitlerinema splendidum
Cyanophyta Myxophyceae Oscillatoriales Homoeotrichaceae Heteroleibleinia kuetzingii
Cyanophyta Myxophyceae Oscillatoriales Homoeotrichaceae Heteroleibleinia sp.
Cyanophyta Myxophyceae Oscillatoriales Pseudanabaenaceae Homoeothrix hansgirgi
Cyanophyta Myxophyceae Oscillatoriales Pseudanabaenaceae Homoeothrix janthina
Cyanophyta Myxophyceae Oscillatoriales Pseudanabaenaceae Homoeothrix juliana
Cyanophyta Myxophyceae Oscillatoriales Pseudanabaenaceae Homoeothrix simplex
Cyanophyta Myxophyceae Oscillatoriales Pseudanabaenaceae Homoeothrix sp.
Cyanophyta Myxophyceae Oscillatoriales Pseudanabaenaceae Homoeothrix varians
Chlorophyta Chlorophyceae Chlorococcales Hydrodictyaceae Hydrodictyon reticulatum
Chlorophyta Chlorophyceae Chlorococcales Oocystaceae Kirchneriella contorta
Cyanophyta Myxophyceae Oscillatoriales Borziaceae Komvophoron schmidlei
Cyanophyta Myxophyceae Oscillatoriales Borziaceae Komvophoron sp.
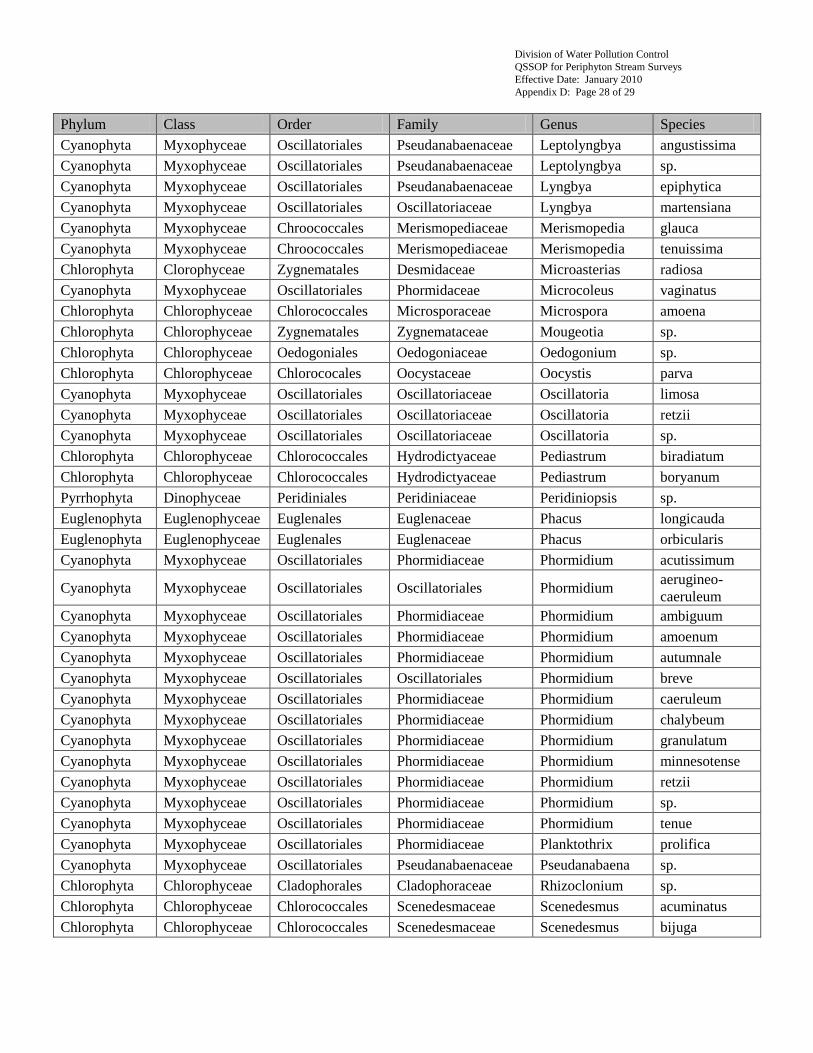
Division of Water Pollution Control
QSSOP for Periphyton Stream Surveys
Effective Date: January 2010
Appendix D: Page 28 of 29
Phylum Class Order Family Genus Species
Cyanophyta Myxophyceae Oscillatoriales Pseudanabaenaceae Leptolyngbya angustissima
Cyanophyta Myxophyceae Oscillatoriales Pseudanabaenaceae Leptolyngbya sp.
Cyanophyta Myxophyceae Oscillatoriales Pseudanabaenaceae Lyngbya epiphytica
Cyanophyta Myxophyceae Oscillatoriales Oscillatoriaceae Lyngbya martensiana
Cyanophyta Myxophyceae Chroococcales Merismopediaceae Merismopedia glauca
Cyanophyta Myxophyceae Chroococcales Merismopediaceae Merismopedia tenuissima
Chlorophyta Clorophyceae Zygnematales Desmidaceae Microasterias radiosa
Cyanophyta Myxophyceae Oscillatoriales Phormidaceae Microcoleus vaginatus
Chlorophyta Chlorophyceae Chlorococcales Microsporaceae Microspora amoena
Chlorophyta Chlorophyceae Zygnematales Zygnemataceae Mougeotia sp.
Chlorophyta Chlorophyceae Oedogoniales Oedogoniaceae Oedogonium sp.
Chlorophyta Chlorophyceae Chlorococales Oocystaceae Oocystis parva
Cyanophyta Myxophyceae Oscillatoriales Oscillatoriaceae Oscillatoria limosa
Cyanophyta Myxophyceae Oscillatoriales Oscillatoriaceae Oscillatoria retzii
Cyanophyta Myxophyceae Oscillatoriales Oscillatoriaceae Oscillatoria sp.
Chlorophyta Chlorophyceae Chlorococcales Hydrodictyaceae Pediastrum biradiatum
Chlorophyta Chlorophyceae Chlorococcales Hydrodictyaceae Pediastrum boryanum
Pyrrhophyta Dinophyceae Peridiniales Peridiniaceae Peridiniopsis sp.
Euglenophyta Euglenophyceae Euglenales Euglenaceae Phacus longicauda
Euglenophyta Euglenophyceae Euglenales Euglenaceae Phacus orbicularis
Cyanophyta Myxophyceae Oscillatoriales Phormidiaceae Phormidium acutissimum
Cyanophyta Myxophyceae Oscillatoriales Oscillatoriales Phormidium aerugineo-
caeruleum
Cyanophyta Myxophyceae Oscillatoriales Phormidiaceae Phormidium ambiguum
Cyanophyta Myxophyceae Oscillatoriales Phormidiaceae Phormidium amoenum
Cyanophyta Myxophyceae Oscillatoriales Phormidiaceae Phormidium autumnale
Cyanophyta Myxophyceae Oscillatoriales Oscillatoriales Phormidium breve
Cyanophyta Myxophyceae Oscillatoriales Phormidiaceae Phormidium caeruleum
Cyanophyta Myxophyceae Oscillatoriales Phormidiaceae Phormidium chalybeum
Cyanophyta Myxophyceae Oscillatoriales Phormidiaceae Phormidium granulatum
Cyanophyta Myxophyceae Oscillatoriales Phormidiaceae Phormidium minnesotense
Cyanophyta Myxophyceae Oscillatoriales Phormidiaceae Phormidium retzii
Cyanophyta Myxophyceae Oscillatoriales Phormidiaceae Phormidium sp.
Cyanophyta Myxophyceae Oscillatoriales Phormidiaceae Phormidium tenue
Cyanophyta Myxophyceae Oscillatoriales Phormidiaceae Planktothrix prolifica
Cyanophyta Myxophyceae Oscillatoriales Pseudanabaenaceae Pseudanabaena sp.
Chlorophyta Chlorophyceae Cladophorales Cladophoraceae Rhizoclonium sp.
Chlorophyta Chlorophyceae Chlorococcales Scenedesmaceae Scenedesmus acuminatus
Chlorophyta Chlorophyceae Chlorococcales Scenedesmaceae Scenedesmus bijuga
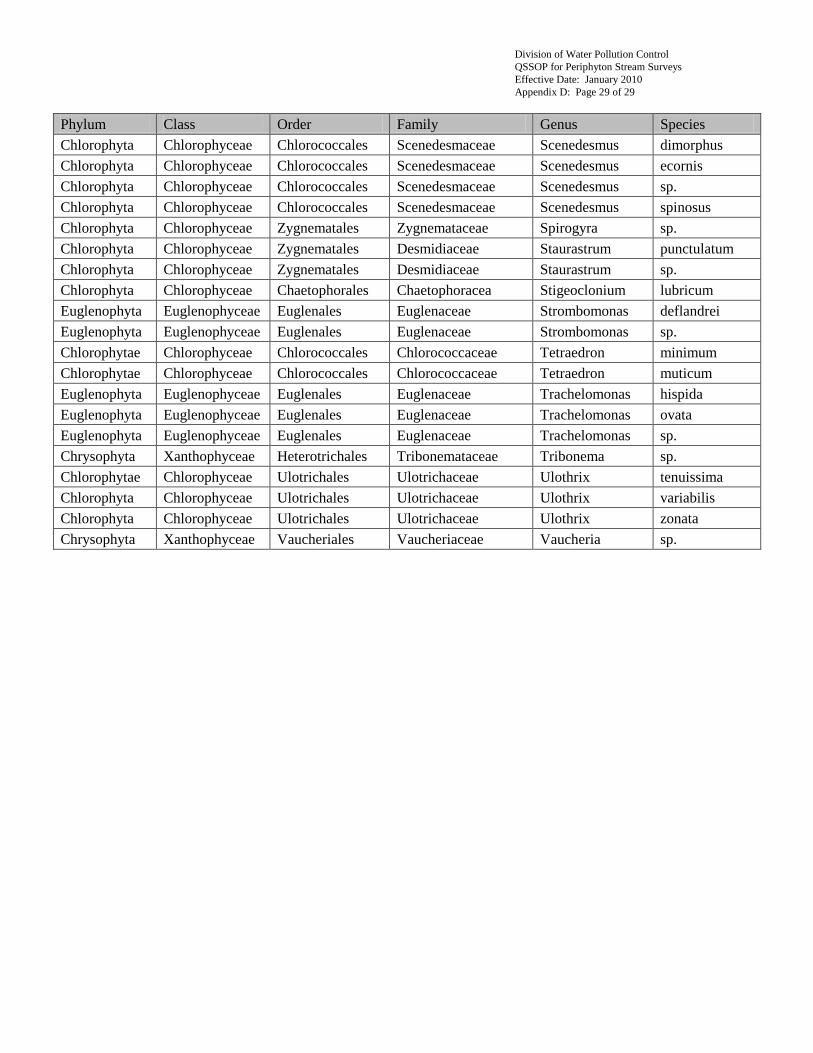
Division of Water Pollution Control
QSSOP for Periphyton Stream Surveys
Effective Date: January 2010
Appendix D: Page 29 of 29
Phylum Class Order Family Genus Species
Chlorophyta Chlorophyceae Chlorococcales Scenedesmaceae Scenedesmus dimorphus
Chlorophyta Chlorophyceae Chlorococcales Scenedesmaceae Scenedesmus ecornis
Chlorophyta Chlorophyceae Chlorococcales Scenedesmaceae Scenedesmus sp.
Chlorophyta Chlorophyceae Chlorococcales Scenedesmaceae Scenedesmus spinosus
Chlorophyta Chlorophyceae Zygnematales Zygnemataceae Spirogyra sp.
Chlorophyta Chlorophyceae Zygnematales Desmidiaceae Staurastrum punctulatum
Chlorophyta Chlorophyceae Zygnematales Desmidiaceae Staurastrum sp.
Chlorophyta Chlorophyceae Chaetophorales Chaetophoracea Stigeoclonium lubricum
Euglenophyta Euglenophyceae Euglenales Euglenaceae Strombomonas deflandrei
Euglenophyta Euglenophyceae Euglenales Euglenaceae Strombomonas sp.
Chlorophytae Chlorophyceae Chlorococcales Chlorococcaceae Tetraedron minimum
Chlorophytae Chlorophyceae Chlorococcales Chlorococcaceae Tetraedron muticum
Euglenophyta Euglenophyceae Euglenales Euglenaceae Trachelomonas hispida
Euglenophyta Euglenophyceae Euglenales Euglenaceae Trachelomonas ovata
Euglenophyta Euglenophyceae Euglenales Euglenaceae Trachelomonas sp.
Chrysophyta Xanthophyceae Heterotrichales Tribonemataceae Tribonema sp.
Chlorophytae Chlorophyceae Ulotrichales Ulotrichaceae Ulothrix tenuissima
Chlorophyta Chlorophyceae Ulotrichales Ulotrichaceae Ulothrix variabilis
Chlorophyta Chlorophyceae Ulotrichales Ulotrichaceae Ulothrix zonata
Chrysophyta Xanthophyceae Vaucheriales Vaucheriaceae Vaucheria sp.
Division of Water Pollution Control
QSSOP for Periphyton Stream Surveys
Effective Date: January 2010
Appendix E: Page 1 of 16
APPENDIX E
BIOVOLUME CALCULATION
GEOMETRIC SHAPES AND EQUATIONS FOR CALCULATION OF BIOVOLUME
MODELS FOR BIOVOLUME CALCULATIONS OF MICROALGAL TAXA
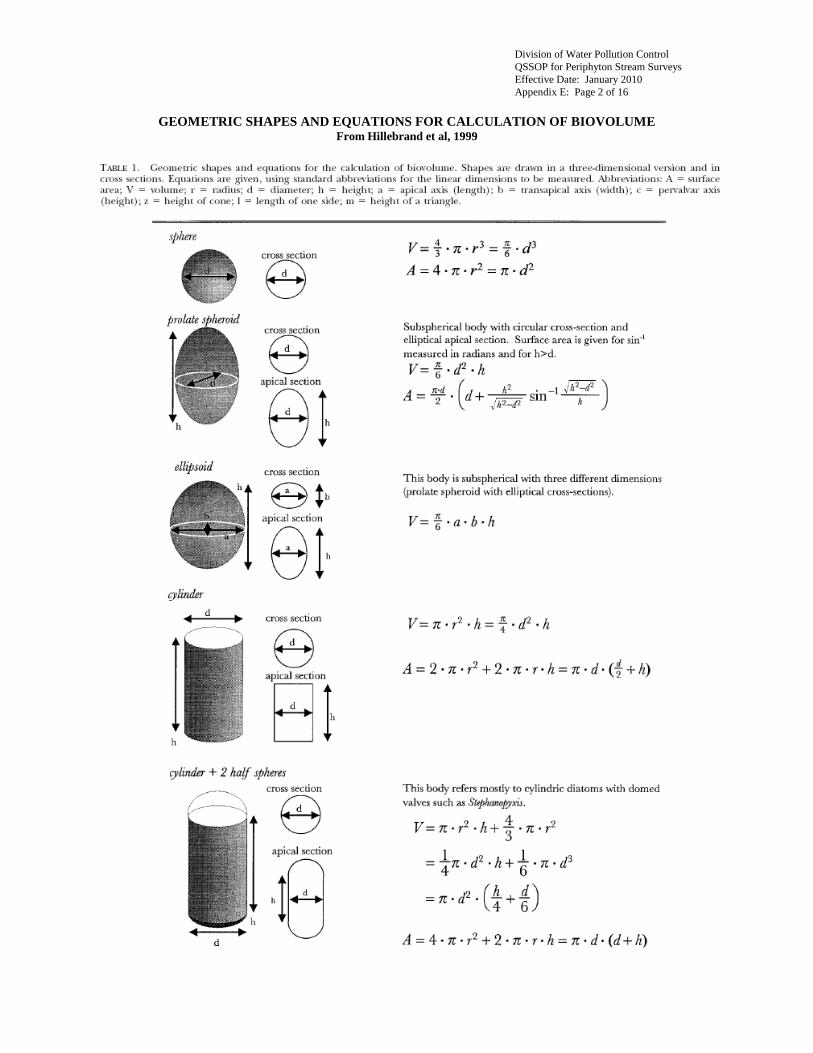
Division of Water Pollution Control
QSSOP for Periphyton Stream Surveys
Effective Date: January 2010
Appendix E: Page 2 of 16
GEOMETRIC SHAPES AND EQUATIONS FOR CALCULATION OF BIOVOLUME From Hillebrand et al, 1999
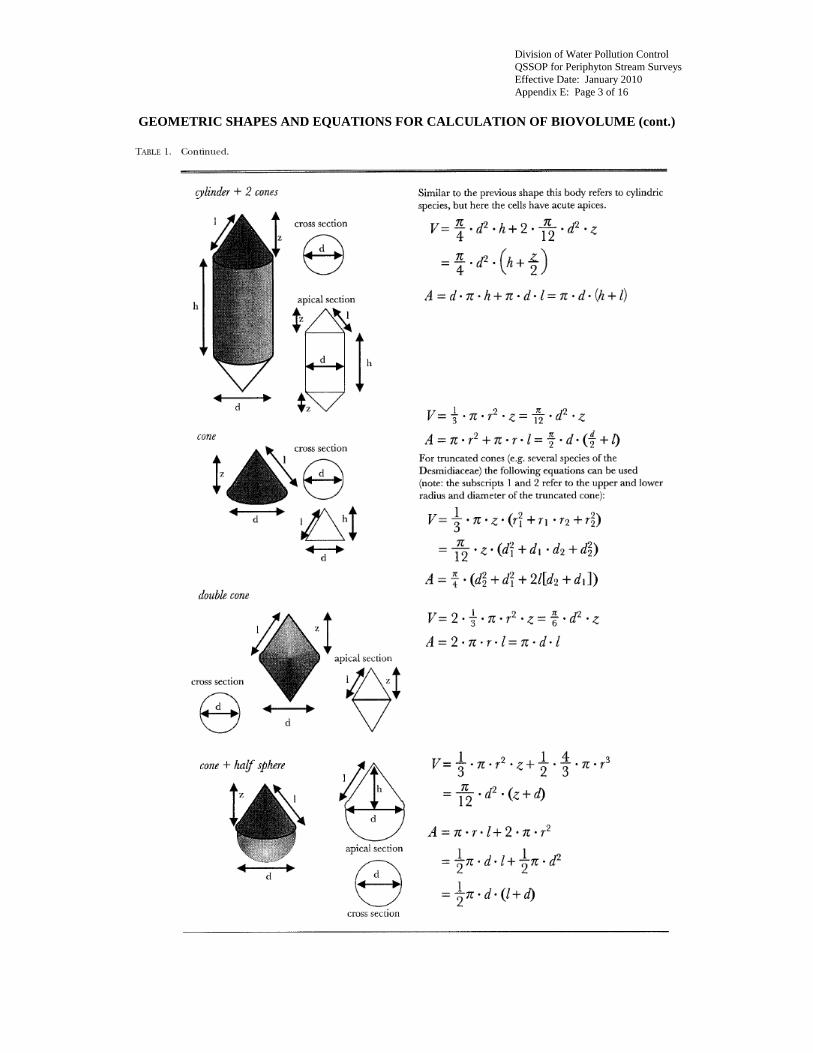
Division of Water Pollution Control
QSSOP for Periphyton Stream Surveys
Effective Date: January 2010
Appendix E: Page 3 of 16
GEOMETRIC SHAPES AND EQUATIONS FOR CALCULATION OF BIOVOLUME (cont.)
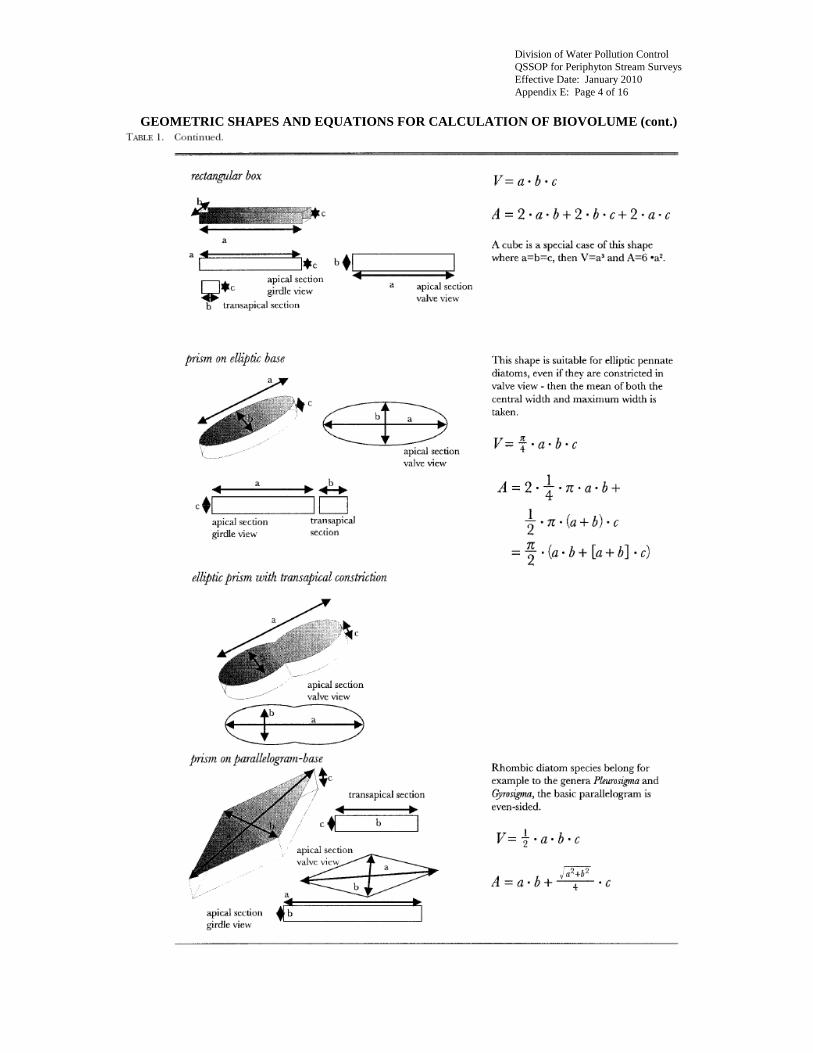
Division of Water Pollution Control
QSSOP for Periphyton Stream Surveys
Effective Date: January 2010
Appendix E: Page 4 of 16
GEOMETRIC SHAPES AND EQUATIONS FOR CALCULATION OF BIOVOLUME (cont.)
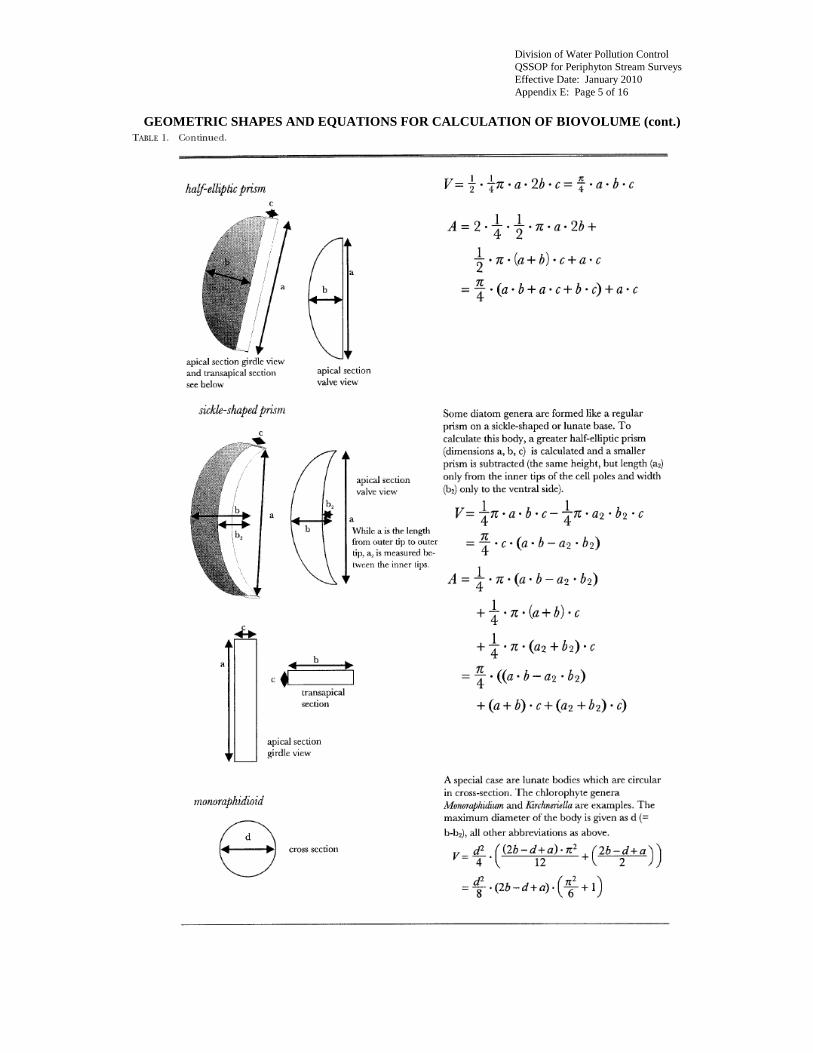
Division of Water Pollution Control
QSSOP for Periphyton Stream Surveys
Effective Date: January 2010
Appendix E: Page 5 of 16
GEOMETRIC SHAPES AND EQUATIONS FOR CALCULATION OF BIOVOLUME (cont.)
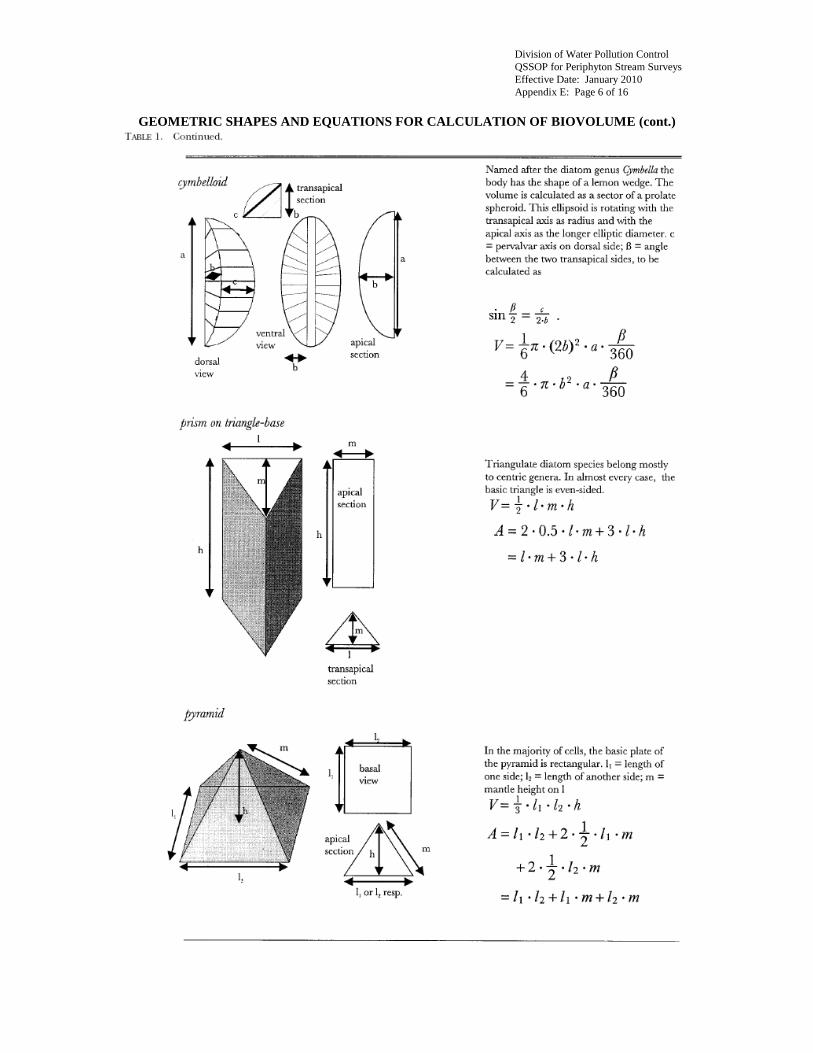
Division of Water Pollution Control
QSSOP for Periphyton Stream Surveys
Effective Date: January 2010
Appendix E: Page 6 of 16
GEOMETRIC SHAPES AND EQUATIONS FOR CALCULATION OF BIOVOLUME (cont.)
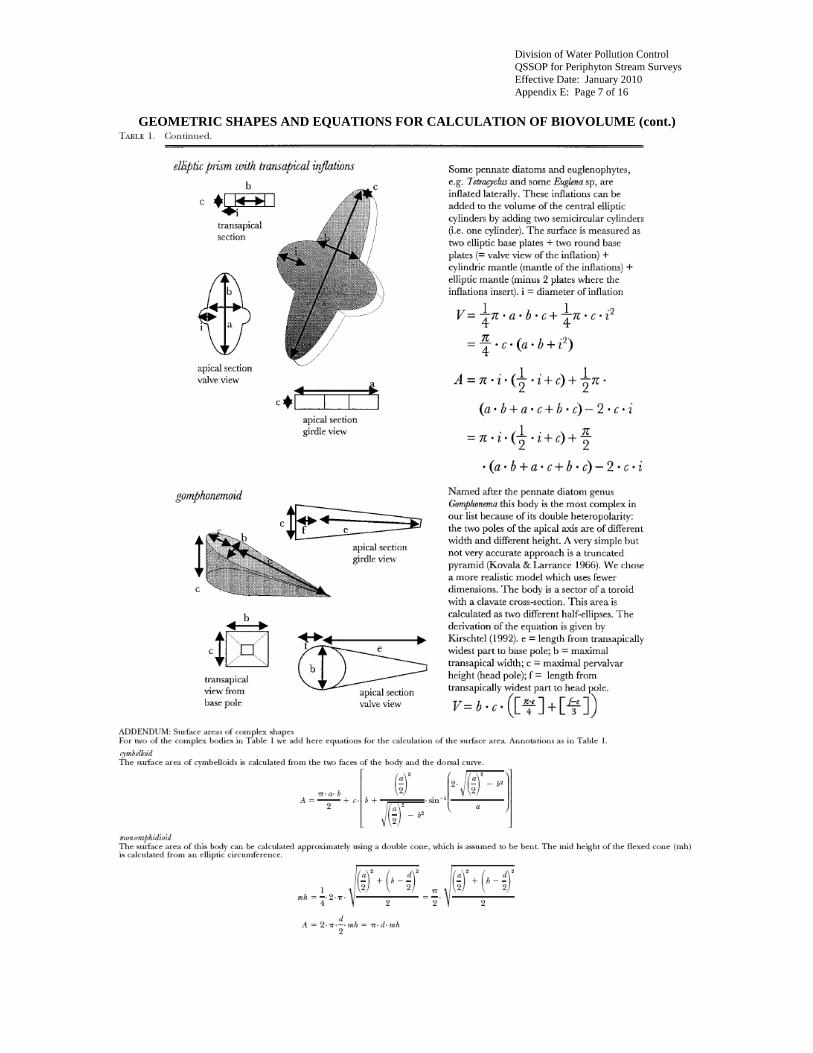
Division of Water Pollution Control
QSSOP for Periphyton Stream Surveys
Effective Date: January 2010
Appendix E: Page 7 of 16
GEOMETRIC SHAPES AND EQUATIONS FOR CALCULATION OF BIOVOLUME (cont.)
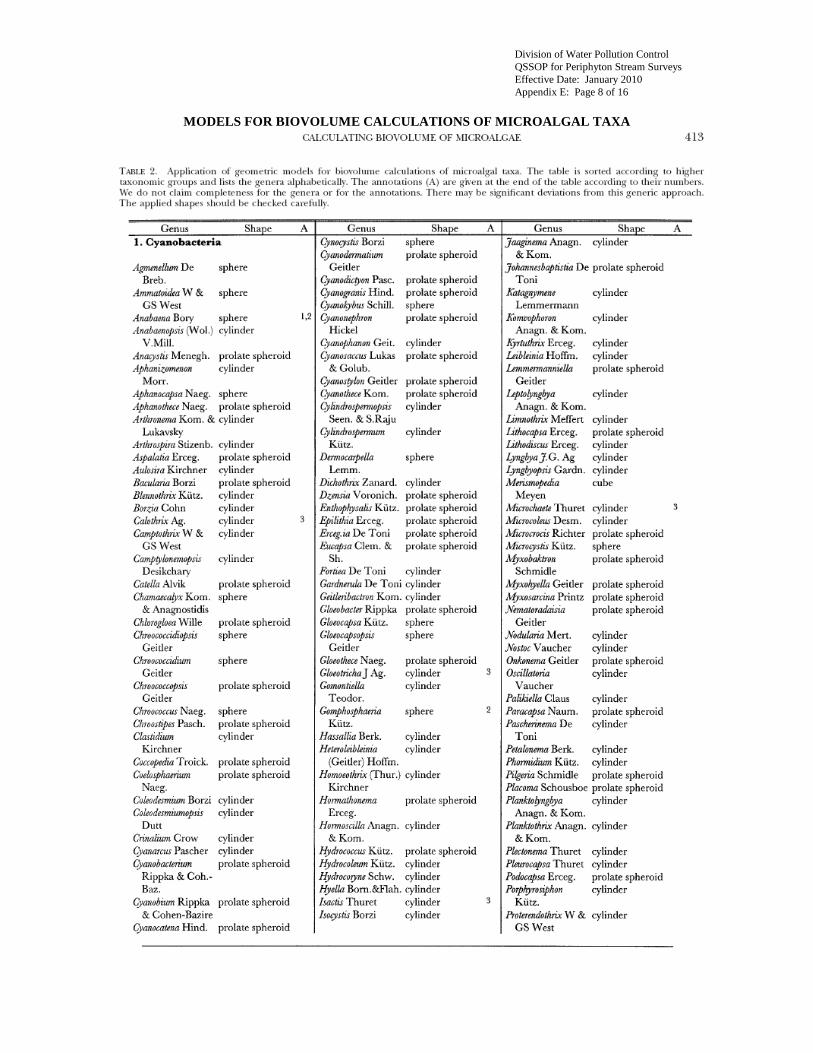
Division of Water Pollution Control
QSSOP for Periphyton Stream Surveys
Effective Date: January 2010
Appendix E: Page 8 of 16
MODELS FOR BIOVOLUME CALCULATIONS OF MICROALGAL TAXA
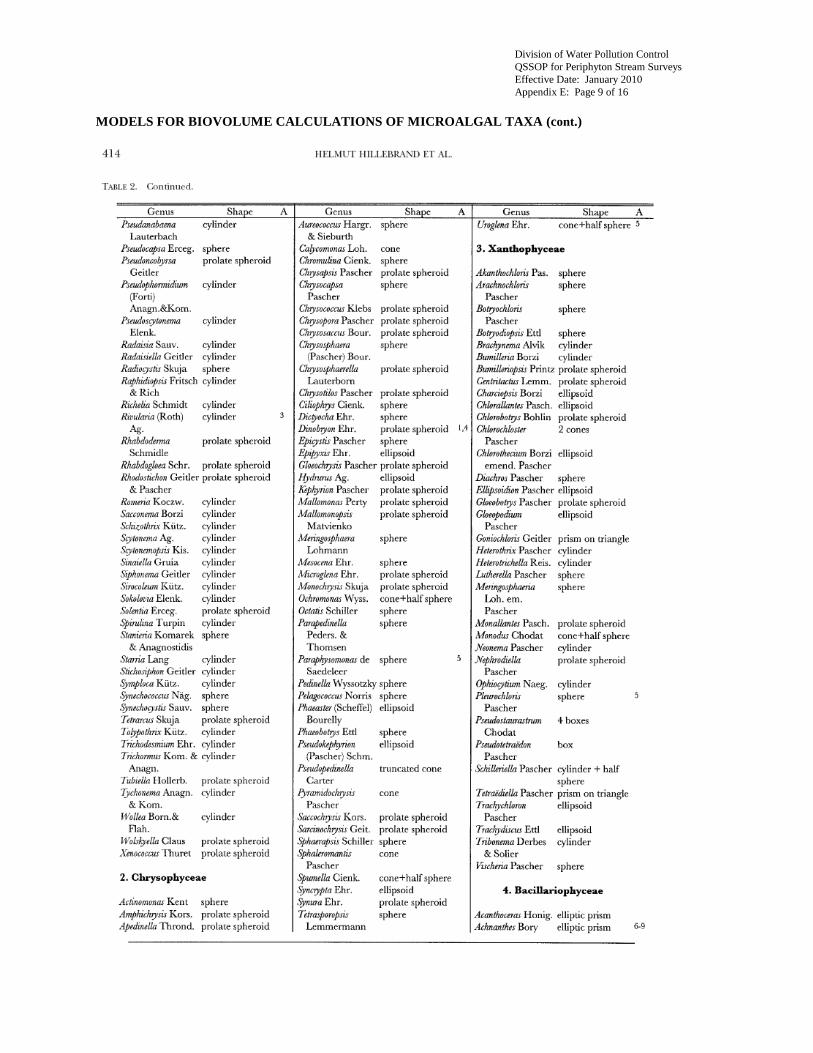
Division of Water Pollution Control
QSSOP for Periphyton Stream Surveys
Effective Date: January 2010
Appendix E: Page 9 of 16
MODELS FOR BIOVOLUME CALCULATIONS OF MICROALGAL TAXA (cont.)
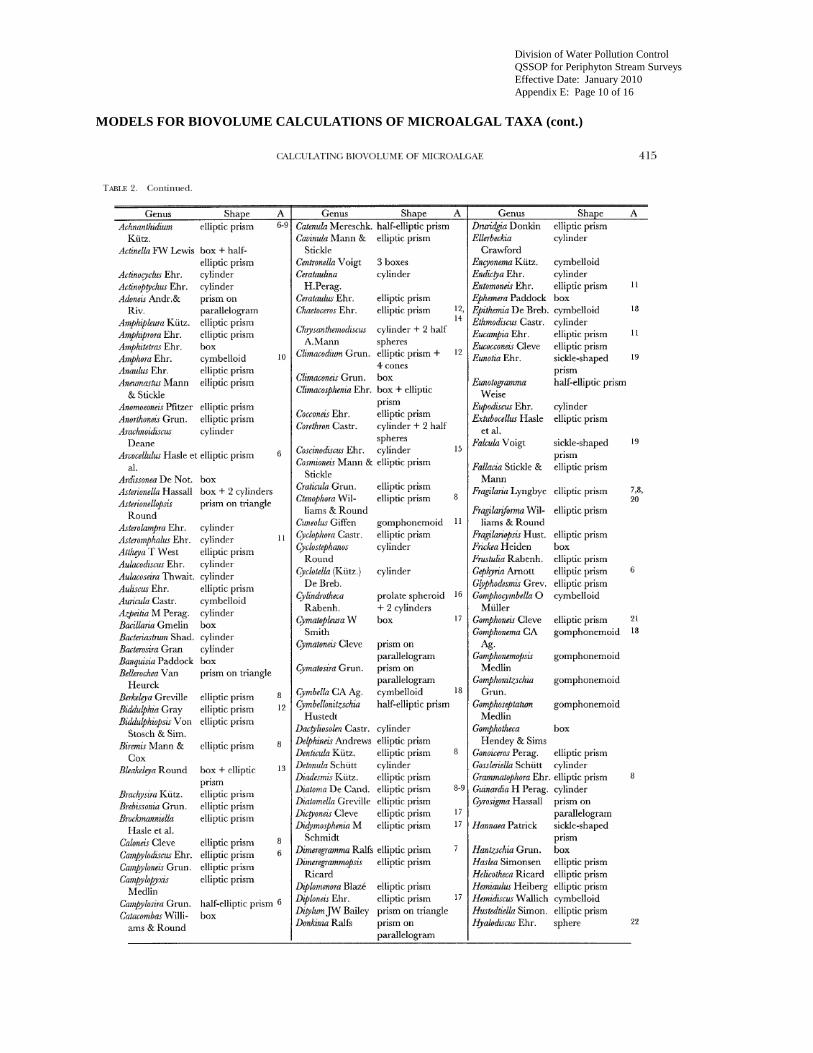
Division of Water Pollution Control
QSSOP for Periphyton Stream Surveys
Effective Date: January 2010
Appendix E: Page 10 of 16
MODELS FOR BIOVOLUME CALCULATIONS OF MICROALGAL TAXA (cont.)
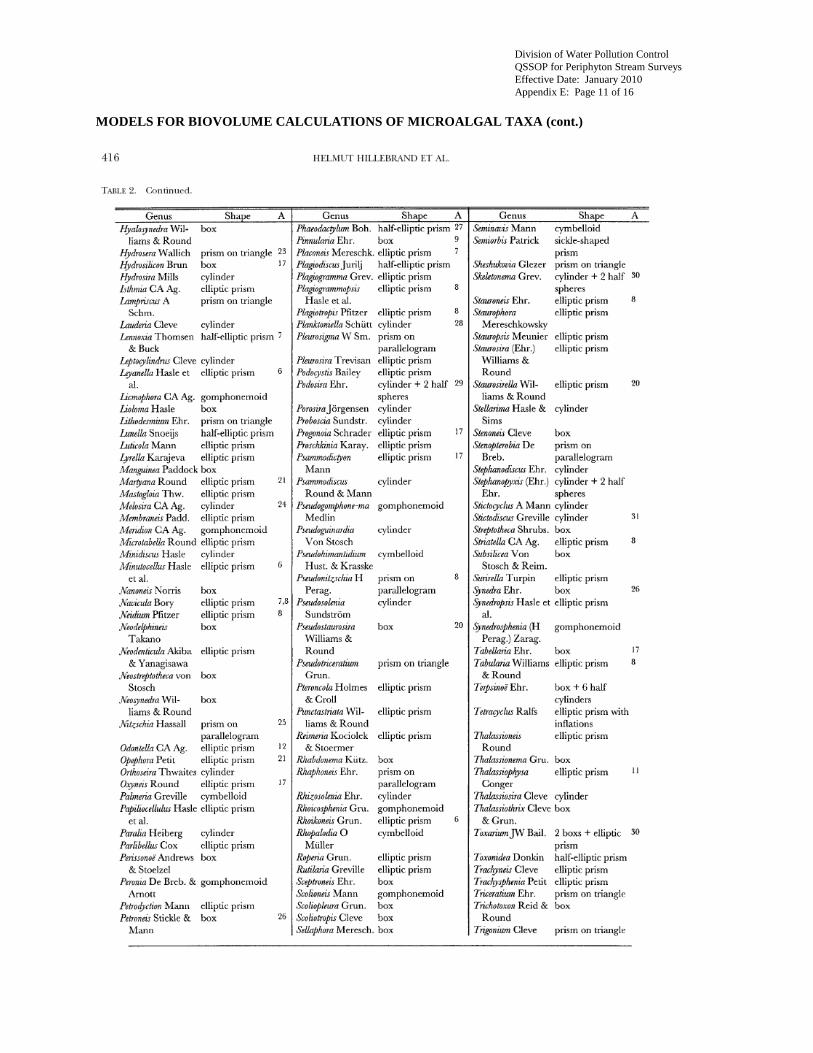
Division of Water Pollution Control
QSSOP for Periphyton Stream Surveys
Effective Date: January 2010
Appendix E: Page 11 of 16
MODELS FOR BIOVOLUME CALCULATIONS OF MICROALGAL TAXA (cont.)
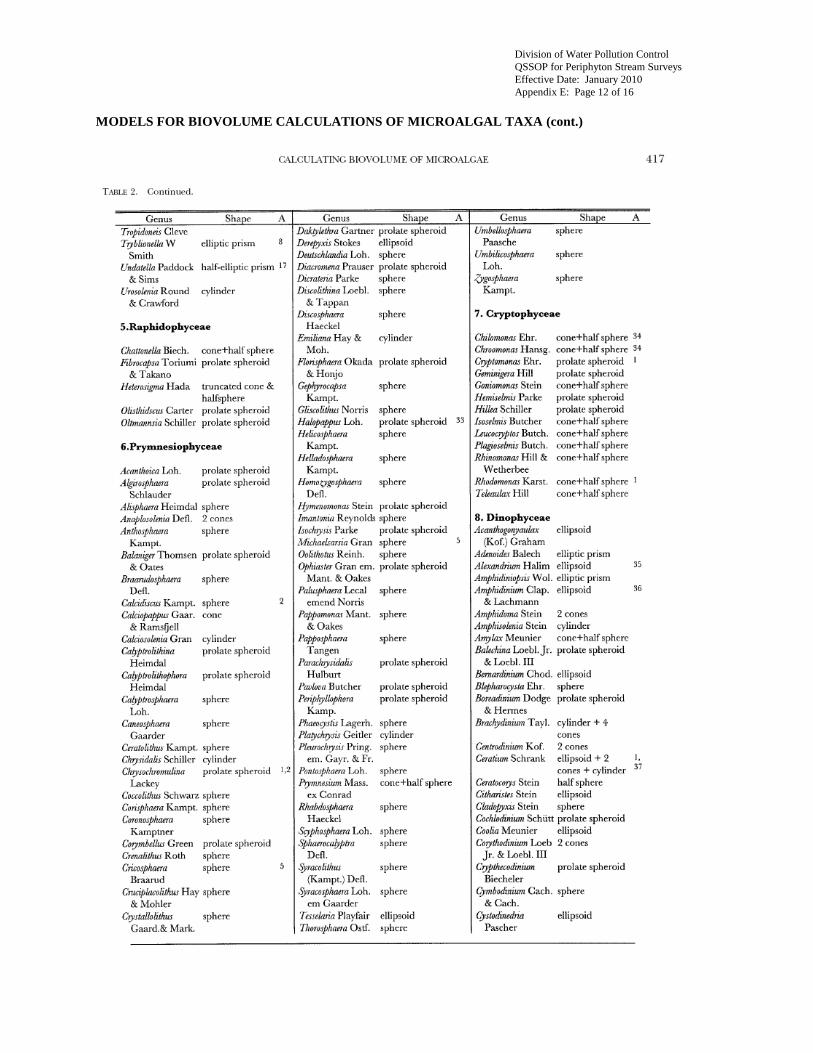
Division of Water Pollution Control
QSSOP for Periphyton Stream Surveys
Effective Date: January 2010
Appendix E: Page 12 of 16
MODELS FOR BIOVOLUME CALCULATIONS OF MICROALGAL TAXA (cont.)
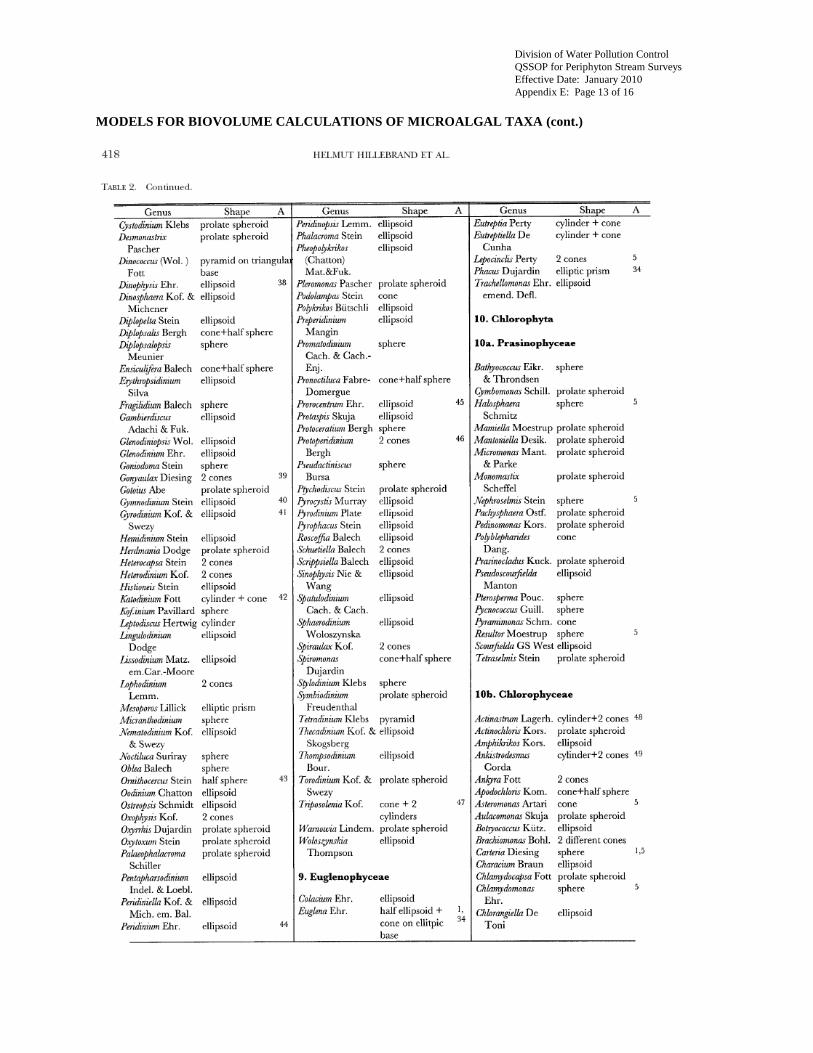
Division of Water Pollution Control
QSSOP for Periphyton Stream Surveys
Effective Date: January 2010
Appendix E: Page 13 of 16
MODELS FOR BIOVOLUME CALCULATIONS OF MICROALGAL TAXA (cont.)
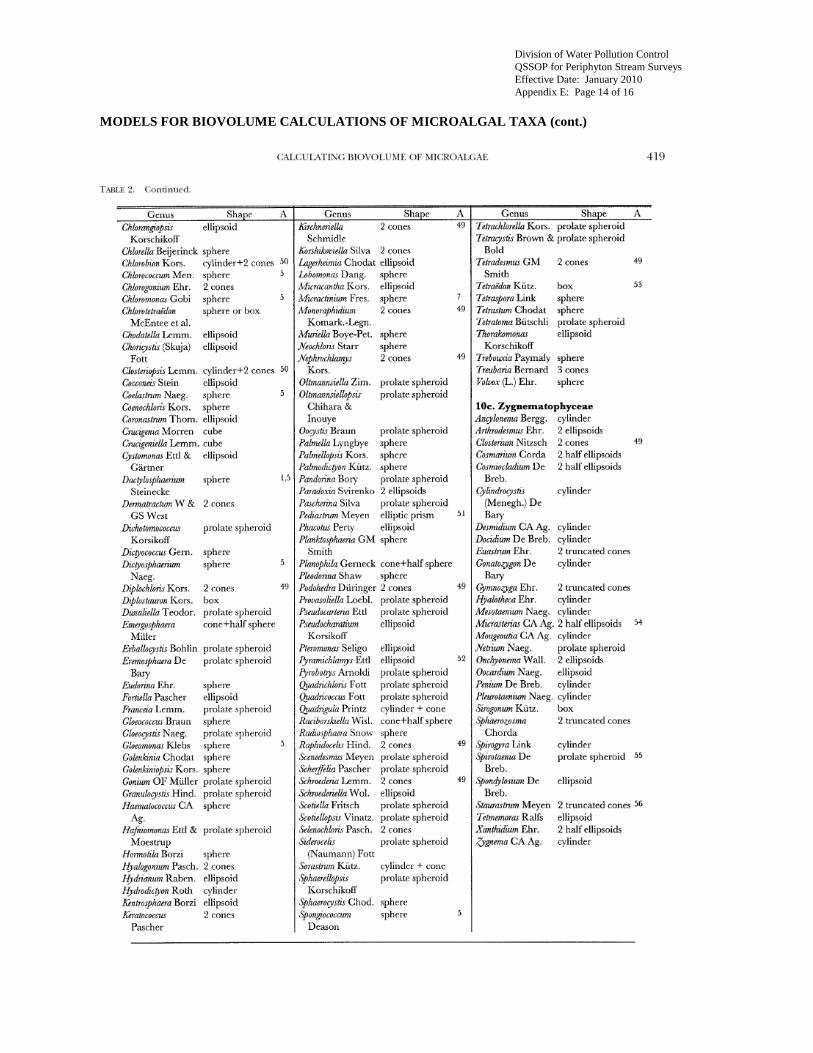
Division of Water Pollution Control
QSSOP for Periphyton Stream Surveys
Effective Date: January 2010
Appendix E: Page 14 of 16
MODELS FOR BIOVOLUME CALCULATIONS OF MICROALGAL TAXA (cont.)
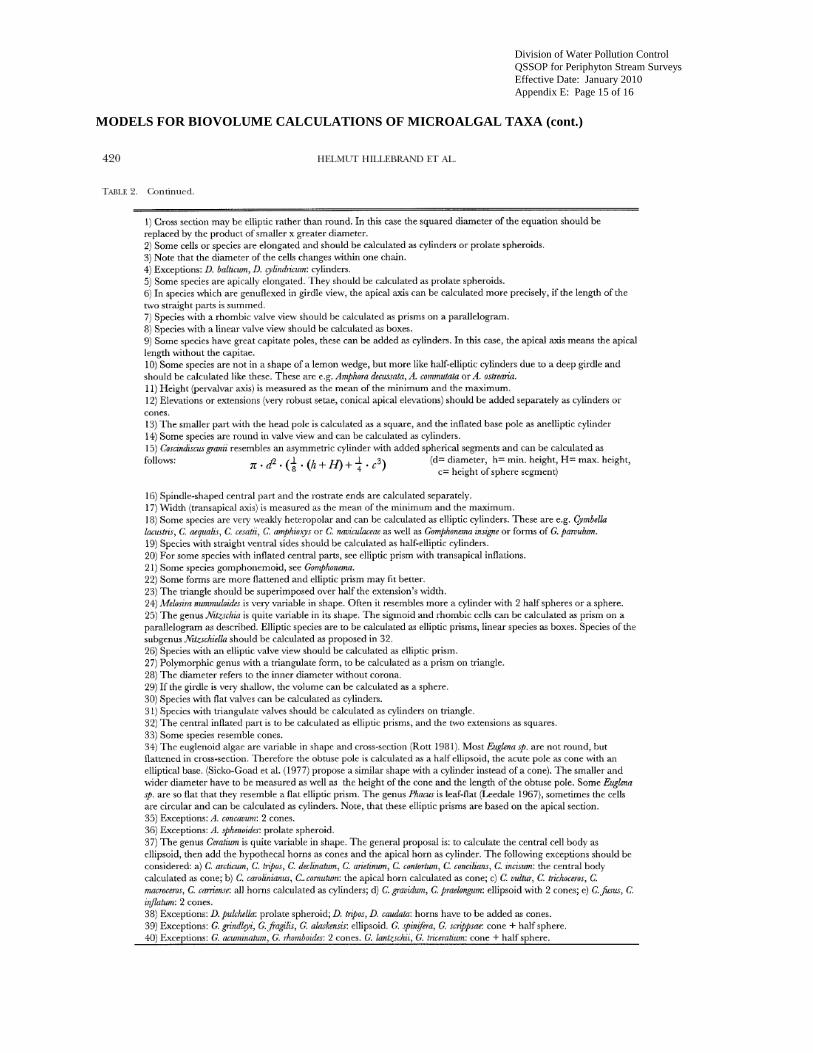
Division of Water Pollution Control
QSSOP for Periphyton Stream Surveys
Effective Date: January 2010
Appendix E: Page 15 of 16
MODELS FOR BIOVOLUME CALCULATIONS OF MICROALGAL TAXA (cont.)
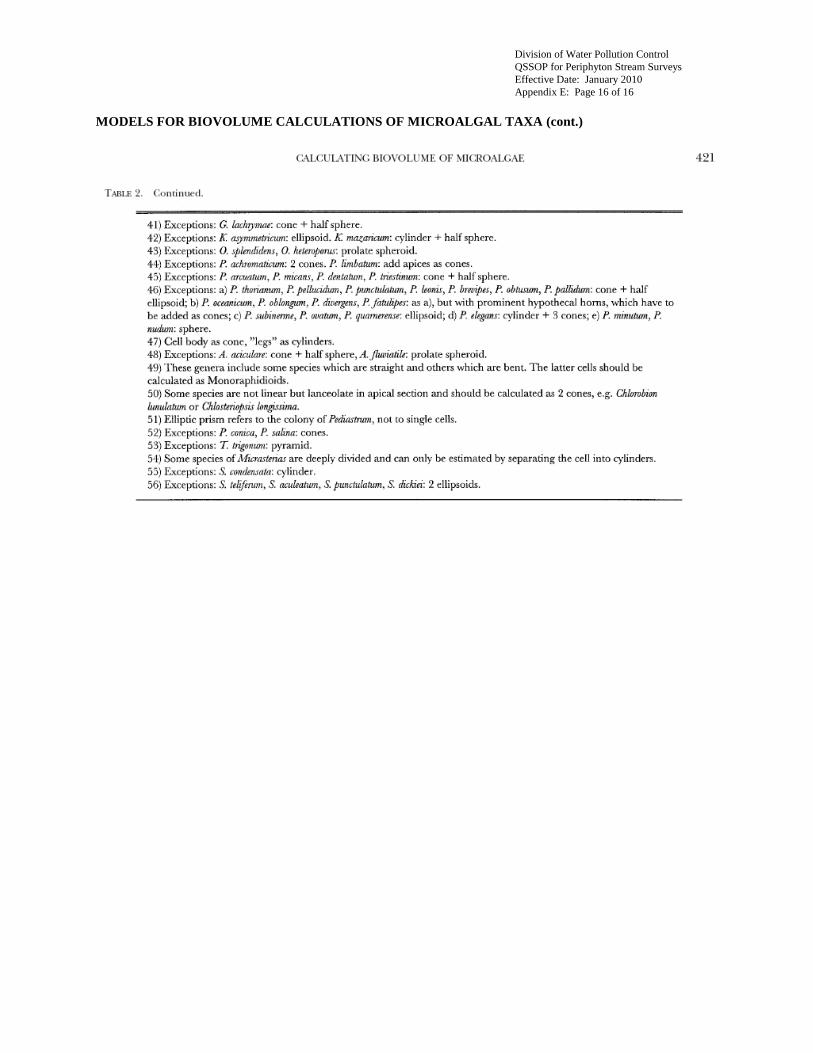
Division of Water Pollution Control
QSSOP for Periphyton Stream Surveys
Effective Date: January 2010
Appendix E: Page 16 of 16
MODELS FOR BIOVOLUME CALCULATIONS OF MICROALGAL TAXA (cont.)
Pursuant to the State of Tennessee’s policy of non-discrimination, the
Tennessee Department of Environment and Conservation does not
discriminate on the basis of race, sex, religion, color, national or ethnic
origin, age, disability, or military service in its policies, or in the admission or
access to, or treatment or employment in its programs, services or activities.
Equal Employment Opportunity/Affirmative Action inquiries or complaints
should be directed to the EEO/AA Coordinator, Office of General Counsel,
401 Church Street, 20th
Floor L & C Tower, Nashville, TN 37243, 1-888-867-
7455. ADA inquiries or complaints should be directed to the ADA
Coordinator, Human Resources Division, 401 Church Street, 12th Floor L & C
Tower, Nashville, TN 37243, 1-866-253-5827. Hearing impaired callers may
use the Tennessee Relay Service (1-800-848-0298).
To reach your local
ENVIRONMENTAL FIELD OFFICE
Call 1-888-891-8332 OR 1-888-891-TDEC
Tennessee Department of Environment and Conservation,
Authorization No. 327247, 111 copies. This public document was
promulgated at a cost of $7.02 per copy. January 2010


![· Standard ' Standard' Standard Cost 'Standard Cost ' Quality standard 'Quality standard' Quantity standard 'Quantity standard ' [15 marks] [15 markah] Outline TEN (10) steps of](https://img.pdfslide.net/doc/110x75/5e4ad3aa693c4f498143a31a/standard-standard-standard-cost-standard-cost-quality-standard-quality-standard.jpg)