Embed Size (px)
Citation preview

Enabling Life Science Tools Based on Mass Spectrometry™
ApplicationNotes
Accurate Quantifi cation with ICPL: The Quantifi cation Study of the ABRF Proteomics Research Group 2006
Sample
Eight proteins were supplied by ABRF PRG in 2 mixtures. BSA was speci-fied as being present at 1:1 ratio. 3 unspecified proteins were also 1:1 “regulated”, for the other 4 proteins a maximum regulation of 1:100 was possible. Absolute protein amounts and ratios of the mixture were provi-ded by the organizer after all experi-mental results had been submitted, these are shown in Figure 1.
# MT-83
The objective of the ABRF PRG study was to quantify 8 proteins in 2 mixtures. An ultraflex IITM was used to analyze ICPL-labeled protein digests using an LC-MALDI approach under control of the WARP-LCTM software. An average quantification error of 9.3 % was achieved using high performance instrumentation, Prespotted AnchorChips, ICPL technology and sophis-ticated bioinformatics tools - being the best result amongst all iTRAQTM and ICPLTM data returned to the study.
Methods
ICPL-labeling of the 8 protein mixtures
The two protein samples were labeled with the ICPL (light or heavy, L or H) reagent after reduction and carb-amidomethylation, as specified in the manual of the SERVA-ICPL-KitTM, using a protein concentration of 4 mg/ml. The concentrations of the individual proteins in each mixture varied from 3-600 pmol. After ICPL-
labeling, the two samples were com-bined and subjected to a proteolytic digest overnight using either trypsin (Promega) or endoproteinase Glu-C (Roche) following standard protocols. The digestion was stopped with 0.1% TFA.
LC and fractionation of samples
The Agilent CapLC 1100 was used for chromatographic separation controlled by the HyStar software. An aliquot of 8 μl ICPL-labeled protein digest mixture was injected onto a C18-PepMap column (180μm id.x15cm; LC Packings) and separated with an 80 min gradient (5-35% acetonitrile in 0.1% TFA).
The eluting peptides were deposi-ted directly onto a 384 Prespotted AnchorChipTM (PAC384) using the PROTEINEER fcTM fraction collec-tor. The PAC targets come ready to use with prespotted matrix anchors, therefore, an additional matrix make-up flow was not required, and calibra-tion standards are also pre-spotted, for easy external calibration. Prior to the MS-analysis the dried samples were washed for approx. 5 sec with 10mM NH4H2PO4 (Sigma-Aldrich) in 0.1% TFA.
Fig. 1: Composition of the samples A and B analyzed in the PRG study.
MS and MS/MS data acquisition
All spectra were obtained fully auto-matically on a MALDI-TOF/TOF (ultraflex II TOF/TOFTM). MS spec-tra were acquired at constant laser power and externally calibrated with the peptide calibrant mixture provided on the PACs. After the MS-analysis of the complete LC-MALDI run, the software WARP-LC defined a list of unique compounds and selected best suited precursor ions for MS/MS data acquisition. All MS/MS spectra were acquired for each chromatographic compound satisfying quality criteria (S/N etc.). H/L ratio thresholds were not applied as criteria for selecting MS/MS precursors in order to quan-tify 1:1 regulated proteins. In real experiments such regulation thres-
holds would be used to significantly reduce analysis time for LC-MALDI-MS/MS. The Glu-C digest was ana-lyzed twice by LC-MALDI and the trypsin digest once. After data acquisi-tion of each LC-run a MASCOT data-base search was triggered.
Quantification and data validation
All peaks were picked using the pro-prietary SNAP algorithm that fits isotopic patterns to the matching experimental data even under condi-tions of significant overlap of isotopic peak clusters. The algorithm provides the monoisotopic mass, the intensity and area under the envelope of the isotopic cluster and the resolution of the peaks in the cluster. In particu-lar, peaks of lower intensity in general suffer noise interferences and, there-
fore, reduced reliability of the deter-mination of peak resolution. For best quantification results under conditions of high dynamic range (1:100 was the given dynamic range in this study), peak intensities and not areas were used for quantification. After acquisi-tion of MS and MS/MS spectra and database searching, fully automatic quantitative analyses were calculated during the Mascot result compilation in the WARP-LC ProteinBrowserTM (see Fig. 4). The average and median H/L values plus the CV values were the major parameters used for the validation of the data. Additional para-meters that were included in the inter-active result acceptance process were the relative intensity and the Mascot scores of the individual peptides.
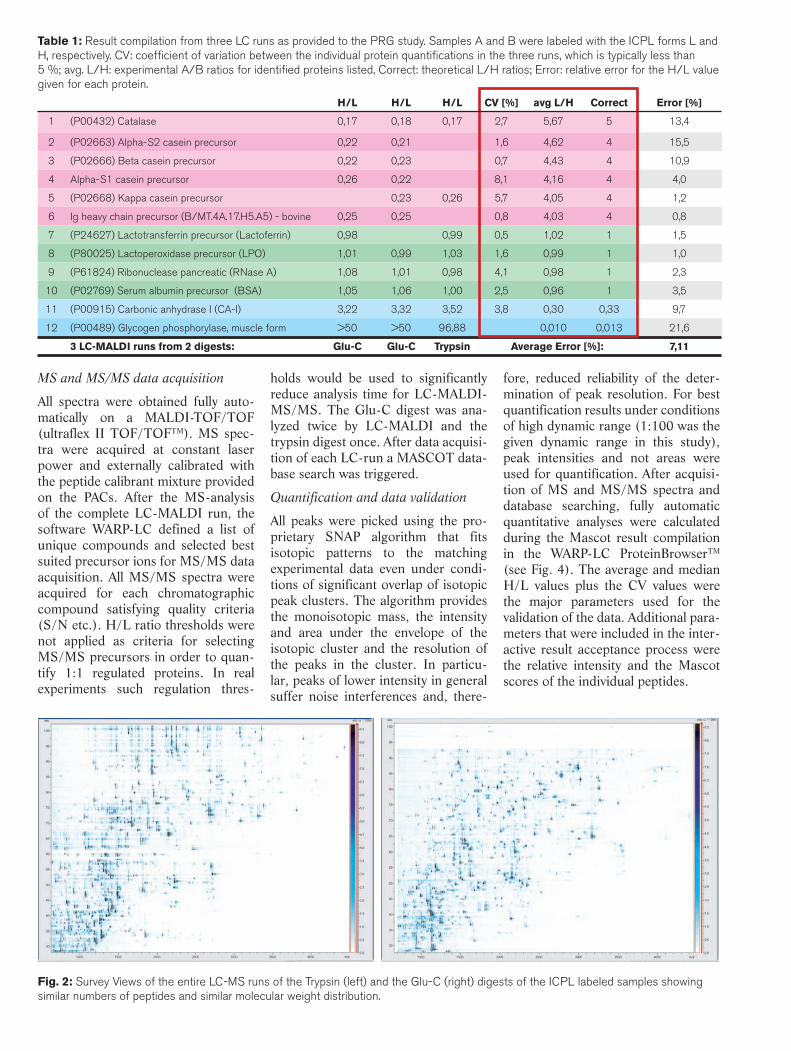
Fig. 2: Survey Views of the entire LC-MS runs of the Trypsin (left) and the Glu-C (right) digests of the ICPL labeled samples showing similar numbers of peptides and similar molecular weight distribution.
Table 1: Result compilation from three LC runs as provided to the PRG study. Samples A and B were labeled with the ICPL forms L and H, respectively. CV: coeffi cient of variation between the individual protein quantifi cations in the three runs, which is typically less than 5 %; avg. L/H: experimental A/B ratios for identifi ed proteins listed, Correct: theoretical L/H ratios; Error: relative error for the H/L value given for each protein.
H/L H/L H/L CV [%] avg L/H Correct Error [%]
1 (P00432) Catalase 0,17 0,18 0,17 2,7 5,67 5 13,4
2 (P02663) Alpha-S2 casein precursor 0,22 0,21 1,6 4,62 4 15,5
3 (P02666) Beta casein precursor 0,22 0,23 0,7 4,43 4 10,9
4 Alpha-S1 casein precursor 0,26 0,22 8,1 4,16 4 4,0
5 (P02668) Kappa casein precursor 0,23 0,26 5,7 4,05 4 1,2
6 Ig heavy chain precursor (B/MT.4A.17.H5.A5) - bovine 0,25 0,25 0,8 4,03 4 0,8
7 (P24627) Lactotransferrin precursor (Lactoferrin) 0,98 0,99 0,5 1,02 1 1,5
8 (P80025) Lactoperoxidase precursor (LPO) 1,01 0,99 1,03 1,6 0,99 1 1,0
9 (P61824) Ribonuclease pancreatic (RNase A) 1,08 1,01 0,98 4,1 0,98 1 2,3
10 (P02769) Serum albumin precursor (BSA) 1,05 1,06 1,00 2,5 0,96 1 3,5
11 (P00915) Carbonic anhydrase I (CA-I) 3,22 3,32 3,52 3,8 0,30 0,33 9,7
12 (P00489) Glycogen phosphorylase, muscle form >50 >50 96,88 0,010 0,013 21,6
3 LC-MALDI runs from 2 digests: Glu-C Glu-C Trypsin Average Error [%]: 7,11
additional α-S1 and α-S2 and β-casein found with identical L/H value.
A more detailed comparison of the quantification results was obtained using data compiled by the organizers of the PRG study. This comparison examined the data quality obtained from different labeling strategies using standard commercial kits, i.e., ICPL-Kit (Bruker Daltonics/SERVA) and iTRAQ (ABI/Invitrogen) (Tab. 2). Some participants also used C-ter-minal 18O/16O labeling. Interestingly, ICATTM or iPROTTM were not used at all.
Results
More proteins were obtained from the Glu-C digest as compared to the trypsin digest (see Tab. 1) although differences in terms of numbers and molecular weight distributions of the peptides were not obvious (Fig. 2). The sequence coverage of identified prote-ins was found to be dependent upon the individual protein rather than the protease with which it was digested. However, this result suggests that in any approach to quantification it is important to use more than one pro-tease to ensure sufficient peptide pair numbers for reliable quantification
covering a greater number of proteins. Glu-C certainly is one attractive selec-tion for that purpose. Across all iden-tified proteins and including data from proteins which were contaminants of the expected proteins, the absolute average error of quantification was found to be 7.1 % (Tab. 1).
Several proteins were identified in addition to the 8 proteins included in this study, which were obviously contaminants of the proteins from the commercial source and which provi-ded identical quantitative readings as the intended specified proteins: e.g. ß-casein (L/H = 4) is accompanied by
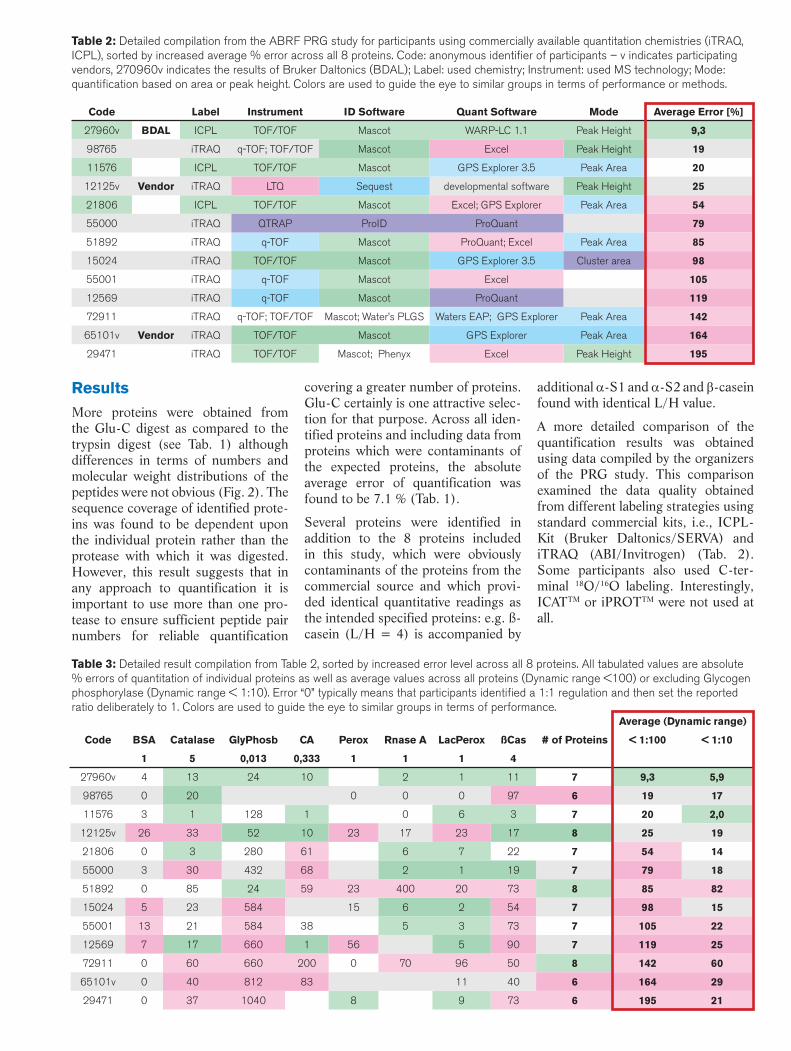
Table 2: Detailed compilation from the ABRF PRG study for participants using commercially available quantitation chemistries (iTRAQ, ICPL), sorted by increased average % error across all 8 proteins. Code: anonymous identifi er of participants – v indicates participating vendors, 270960v indicates the results of Bruker Daltonics (BDAL); Label: used chemistry; Instrument: used MS technology; Mode: quantifi cation based on area or peak height. Colors are used to guide the eye to similar groups in terms of performance or methods.
Table 3: Detailed result compilation from Table 2, sorted by increased error level across all 8 proteins. All tabulated values are absolute % errors of quantitation of individual proteins as well as average values across all proteins (Dynamic range <100) or excluding Glycogen phosphorylase (Dynamic range < 1:10). Error “0” typically means that participants identifi ed a 1:1 regulation and then set the reported ratio deliberately to 1. Colors are used to guide the eye to similar groups in terms of performance.
Average (Dynamic range)
Code BSA Catalase GlyPhosb CA Perox Rnase A LacPerox ßCas # of Proteins < 1:100 < 1:10
1 5 0,013 0,333 1 1 1 4
27960v 4 13 24 10 2 1 11 7 9,3 5,9
98765 0 20 0 0 0 97 6 19 17
11576 3 1 128 1 0 6 3 7 20 2,0
12125v 26 33 52 10 23 17 23 17 8 25 19
21806 0 3 280 61 6 7 22 7 54 14
55000 3 30 432 68 2 1 19 7 79 18
51892 0 85 24 59 23 400 20 73 8 85 82
15024 5 23 584 15 6 2 54 7 98 15
55001 13 21 584 38 5 3 73 7 105 22
12569 7 17 660 1 56 5 90 7 119 25
72911 0 60 660 200 0 70 96 50 8 142 60
65101v 0 40 812 83 11 40 6 164 29
29471 0 37 1040 8 9 73 6 195 21
Code Label Instrument ID Software Quant Software Mode Average Error [%]
27960v BDAL ICPL TOF/TOF Mascot WARP-LC 1.1 Peak Height 9,3
98765 iTRAQ q-TOF; TOF/TOF Mascot Excel Peak Height 19
11576 ICPL TOF/TOF Mascot GPS Explorer 3.5 Peak Area 20
12125v Vendor iTRAQ LTQ Sequest developmental software Peak Height 25
21806 ICPL TOF/TOF Mascot Excel; GPS Explorer Peak Area 54
55000 iTRAQ QTRAP ProID ProQuant 79
51892 iTRAQ q-TOF Mascot ProQuant; Excel Peak Area 85
15024 iTRAQ TOF/TOF Mascot GPS Explorer 3.5 Cluster area 98
55001 iTRAQ q-TOF Mascot Excel 105
12569 iTRAQ q-TOF Mascot ProQuant 119
72911 iTRAQ q-TOF; TOF/TOF Mascot; Water’s PLGS Waters EAP; GPS Explorer Peak Area 142
65101v Vendor iTRAQ TOF/TOF Mascot GPS Explorer Peak Area 164
29471 iTRAQ TOF/TOF Mascot; Phenyx Excel Peak Height 195

Typical average errors of the protein quantifications across all participants are listed in Table 2 in the red box. In Table 3 the average errors obtained for the individual proteins are listed. The errors range from 5 % for BSA (this was the known 1:1 standard) through 20-50 for most proteins to > 400 %for the highly regulated Glycogen Phosphorylase, H/L = 1:76. Across all proteins the average quantification results for the individual participants ranged from 9.3 to 195 % error mar-gins and from 8 to 6 identified prote-ins (only results > 5 IDed proteins are
listed here).
The Bruker Daltonics result using ICPL and dedicated quantification software (WARP-LC 1.1) is coded 270960v and ranked at the top of the quality sorted list. In addition, the ICPL chemistry was used by 3 parti-cipants within the top 5, indicating its usefulness for quantitative proteomics. Surprisingly, the iTRAQ-labeling approach using the standard quanti-fication software that was written for it, provided dramatically high average quantitation errors of 80-200%, even
Microsoft Excel based interpretation or developmental software provided superior results. Another interesting aspect was that in the top performing group of participants, the quantifica-tion based on the peak height rather than peak area was preferred.
Compared to the average results from all other quantification strategies, our results of 9.3 % average error was very competitive (see Fig. 3). We identified proteins with H/L = 1 with errors < 5 % and proteins with 2 < H/L < 10 with approx. 10 % errors. The quality of the quantification results was not significantly increased by repeated LC-runs (see Tab. 1) in agreement with Figure 3. This indica-tes a high level of confidence of the individual quantification results (CV values of quantification typically less than 5 % between LC runs, Tab. 1), provided sufficient numbers of pepti-des for calculation. This robustness is required if more complex samples on true proteomics scale are to be ana-lyzed. On this scale the suitability of the ICPL chemistry for protein pre-fractionation in case of high proteome complexity will become important as high repetition numbers (>>2) need to be avoided due to outrageous wor-kload problems.
Fig. 3: Average % errors for the different analysis methods as a function of experiment repetition and quantifi cation technique.
Fig. 4: WARP-LC ProteinBrowser displays the identifi cation and quantifi cation results and allows the manual acceptance of the results or validation on the level of peptides and proteins. Peroxidase has been selected from the protein table, the corresponding peptides and regulations are shown in the peptide list. Horseradish peroxidase was IDed and quantifi ed on the 1 % CV level.

Data Analysis
We used the advanced data validation tools of WARP-LC 1.1 to determine reliable quantitative data (Fig. 4). For each identified protein a number of protein chemical parameters are
listed in the visualization tool (WARP-LC ProteinBrowser) of the software including the total peptide score, pro-tein MW and pI, sequence coverage (%) and the number of IDed peptides. Information relevant to quantifica-tion includes the average H/L ratio, the number of peptide pairs utilized
for quantification, the coefficient of variation (CV: the ratio of the stan-dard deviation to the mean) and the median of all values for a particular protein. Validation is typically based on the CV plus the difference bet-ween the average H/L value and the median. The box-and-whiskers plot is
Fig. 5: BioTools Sequence coverage map of horseradish peroxidase. Matching peptides are shown as grey bars, darkness indicating peak intensity. The red bricks indicate the matching N-terminal (upper row) and C-terminal (lower row) fragment ions. Putative glycosyla-tion sites are coded in yellow.
Fig. 6: Zoom View into the LC-run of the trypsin digest (see Fig. 2) that displays the 1:1 regulated pair of ions from lactoperoxidase. All selected precursors for MS/MS are labeled with squares by the WARP-LC software; the MS spectrum and extracted ion chromatogram for the 85 min fraction with m/z 2783.49 are shown on top and on the right side of the 2D display, respectively. MS/MS spectra of m/z 2783.49 shown in Fig. 7 were selected at 85 and 108 min.

also displayed, which visually descri-bes the maximal and minimal data point that is not detected as an outlier, the median and the body of the central 50 % of the data, i.e., the box.
In Figure 4, the WARP-LC Protein-Browser view highlights the peroxi-dase data, where median as well as the average H/L ratio were calculated as H/L = 1.01 (1.0 expected) with a CV of 0.8 %. Typical precursor mass accuracies achieved across all detec-ted peptides of the identified proteins were in the 5-10 ppm range. Although horseradish peroxidase was found (P00433) (Figs. 4 and 5) it was not provided in the result list due to a transmission error to the ABRF web-site during the results upload via the web.
The ability to manually judge the quantification results and to select or deselect individual peptides to include or exclude them for the calculation of average/median values of protein
regulation (see Fig. 4), was an incre-dibly valuable tool for the high quality data provided in this study.
The high analytical sensitivity of LC-MALDI MS/MS was shown by the peptide m/z 2783.49 (matching lac-toperoxidase) detected at 85 min then later at 108 min in a small maximum of a peak smear (Fig. 6). In the WARP-LC software, the automatic picking of precursor ions in such smears can be controlled. In the example, reacquisi-tion of the same peptides was disabled for a long time, however after 25 min and after interruption of the ion trace along the chromatogram, the same parent mass was readily accessible for further MS/MS analysis even though the latter peak was represen-ted by a weak ion . At both times, the same peptide was identified and the matching fragments are displayed (Fig. 7).
Conclusions
The analytical platform chosen for this study consisted of a number of unique components that laid the foun-dation for a great performance in the PRG-ABRF ‘06 quantification study (http://www.abrf.org/index.cfm/group.show/Proteomics.34.htm). An average error level < 10 % at a dyna-mic range of up to 1:100 was the out-standing result of all stable isotope labeling results reported in the study and far beyond the average perfor-mance of gel, labeling or label free approaches reported in this study. The components of this analytical platform were:
1. A high performance MALDI- TOF/TOF with sub fmol MS/MS sensitivity and a high performance precursor ion selector (> 750 resolving power). The spectra acquisition under fuzzy logic con- trol prevented peak saturation and large quantification errors for strongly regulated peptides and proteins.
2. Prespotted AnchorChips as single-use MALDI targets with zero memory effect (peptide background from previous LC- runs) that could interfere with high quality quantification and a high reproducibility of the ion current from different spots within one chromatographic fraction.
3. The ICPL label technology provi- ding isotopically pure labels that work well even for proteins that are greatly regulated. In contrast to several other methods used in the study (iTRAQ, ion current), ICPL is fully compatible with quantification on the proteomics level in conjunction with protein pre-fractionation.
4. Bioinformatics with numeric as well as visual and interactive validation tools that are unique in the market and that ensure high quality results as the scientist has full control over the analytical process without the need to work with external tools such as spreadsheet calculation.
m /z500 1000 1500 2000 2500
0
10
20
30
40
50
60
70
80
90
100
110
120
Abs. Int. * 1000b L F Q P T H K* I H G L A Ny R Q L N I A A L D F G H I K* Q F L
175.18y 1
354.18b 2
303.17y 2
a 3
467.26b 3
416.25y 3
614.42b 4
530.29y 4
a 5
742.53b 5
643.49y 5
839.53b 6
714.43y 6
939.66b 7
785.59y 7
a 8
1077.78b 8
898.69y 8
a 9
1316.87b 9
1013.72y 9
1429.87b 10
1160.87y 10
a 11
1566.96b 11
1217.87y 11
1623.92b 12
1354.89y 12
1468.02y 13
1886.10b 14
1707.12y 14
1998.25b 15
a 16
2070.13b 16
2042.28y 17
2254.52b 18
2170.59y 18
2368.71b 19
2317.61y 19
2430.82y 20
2609.73b 21
2783.47y 22
m /z500 1000 1500 2000 2500
0
1
2
3
4
5
6
7
8
9
Abs. Int. * 1000b Ly R A A L D F G H I K* H
175.17y 1
354.28b 2
467.38b 3
416.32y 3
a 5
643.49y 5
714.67y 6
785.77y 7
898.85y 8
1014.00y 9
1161.27y 10
1217.93y 11
1355.14y 12
1468.14y 13
1886.41b 14
1707.06y 14
1844.45y 15
a 16
2042.40y 17
2783.32y 22
Fig. 7: BioTools 3.0 display of the m/z 2783.49 peptide from lactoperoxidase at 85 min (top) and 108 min (bottom) that were both identifi ed automatically in the course of the analysis.

References
[1] PRG-ABRF ‘06 quantification study (http://www.abrf.org/index.cfm/group.show/Proteomics.34.htm)
Authors:
Detlev Suckau, Stephanie Hahner, Laura C. Main, Wolfgang Jabs
1: Bruker Daltonik GmbH, Bremen, Germany
2: Bruker Daltonics Ltd., Coventry, United Kingdom
Keywords:
Quantitation of proteomes, ICPL, Stable Isotope Labelling (SILE), MALDI-TOF/TOF
Instrumentation & Software:
Agilent CapLC 1100 (Agilent), C18-PepMap column (LC Packings), HyStar, SERVA ICPL-Kit, Prespotted AnchorChip (PAC384), PROTEINEER fc, ultraflex II TOF/TOF, WARP-LC, BioTools (all Bruker Daltonics)
The SERVA ICPL-Kit is available from BDAL‘s CARE online portal (www.bdal.de/care).
Product Cat. No. Size
SERVA ICPLTM-Kit #234017 1 Kit (2 x 6 samples)
WARP-LC, HyStar, Prespotted AnchorChip, PROTEINEER fc, ultraflex II TOF/TOF and BioTools are trademarks of Bruker Daltonics corporation. ICPL is a trademark of TopLab GmbH, Germany. iTRAQ is a trademark of Applied Biosystems. ICAT is a trademark of the University of Washington. iPROT is a trademark of Agilix Corporation Inc.

www.bdal.de www.bdal.com
Bruker Daltonics Inc.
Billerica, MA · USA
Phone +1 (978) 663-36 60Fax +1 (978) 667-59 93
E-Mail [email protected]
Bruker Daltonik GmbH
Bremen · Germany
Phone +49 (421) 22 05-0Fax +49 (421) 22 05-104
E-Mail [email protected]
See our website for worldwide sales and service contacts.
© B
ruke
r D
alto
nics
04
-20
06
, MT-
83