Embed Size (px)
Citation preview

Andreia Sofia do Cabo Pascoal
BSc in Applied Chemistry
Quantification and Characterization of the phenolic compounds of kenaf leaves
Dissertation for the Master Degree in Technology and Food Security
Orientador: António Segura Carretero, Professor, CIDAF-UGR Co-orientador: Ana Luísa Fernando, Assistent Professor, FCT-
UNL
Júri:
Presidente: Prof. Doutor Nuno Carlos Lapa dos Santos Nunes
Arguente: Prof. Doutora Maria Lúcia Almeida da Silva Vogal: Prof. Doutora Ana Luísa Almaça da Cruz Fernando
September, 2013

II
Andreia Sofia do Cabo Pascoal
Quantification and Characterization of the phenolic compounds of kenaf leaves
Dissertation for the Master Degree in Technology and Food Security
Orientador: António Segura Carretero, Professor, CIDAF-UGR Co-orientador: Ana Luísa Fernando, Assistent Professor, FCT-
UNL
Júri:
Presidente: Prof. Doutor Nuno Carlos Lapa dos Santos Nunes
Arguente: Prof. Doutora Maria Lúcia Almeida da Silva Vogal: Prof. Doutora Ana Luísa Almaça da Cruz Fernando
September, 2013

III
Copyright in the name of Andreia Sofia do Cabo Pascoal, FCT / UNL and UNL
The Faculty of Science and Technology and the New University of Lisbon has the right, perpetual and without
geographical boundaries, archive and publish this dissertation through printed copies reproduced on paper or
digital form, or by any other means known or hereafter be invented, and through the promotion of scientific
repositories and admit your copying and distributing educational purposes or research, non-commercial, as long
as credit is given to the author and publisher.

IV

V
Acknowledgments
The preparation of this dissertation was only possible with the support and dedication of some people
to whom I would like to express my gratitude.
A special acknowledgment to Prof. Ana Luísa Fernando for giving me all the support, availability and
encouragement I needed and most important of all for believing in me with this project, giving me the
opportunity to pursue this investigation outside Portugal.
To Prof. António Segura Carretero, for receive me in his group and for giving me this excellent
opportunity to learn and work.
I also would like to thank the CIDAF group for the support and friendship, without them I would have
enjoyed this experience so much, a special thank you to Dr. Rosa Quirantes for all the patience and
guidance through this journey since the first day to the last I always could count on her.
To my Spanish friends, Maria del Mar, Hakim, Patricia, Ana, Nassima, Celia, Cecilia, David, Isa, Jesus,
for all the moral support in the lab, the fun and laugh outside, the good tapas and foods that were
introduced to me, for showing me the beautiful town of Granada and the moments of fun and laugh, for
all good times that will never be forgotten.
I also thank Carolina and Cristiano for all the help and guidance during the experiments and analysis,
the words cannot express all the friendship and support that I received, thank you for making me feel at
home.
To my friends from FCT, that helped me during the course and master degree, Diana, Cláudia, Milton,
Daniel, Joana, Rita and also Andreia, Carolina, João, Carlos those years wouldn’t be the same without
you. To my friends Sara, Tânia, Maria João and Margarida I’m a fortunate person to have you by my
side.
Last but not least, to my family for their endless support and love, for never doubt me and encourage
me to go further and do better. To my mother, without her I would never have reached this point of my
life.

VI

VII
Astract:
In the food industry is necessary to bring new ways to improve the taste and quality of food and add
health benefits for the consumer, some herbs and plants are a good natural source of antioxidants having
the ability to protect the human system from many chronicle diseases, such as Parkinson and
inflammatory processes. Combining these two worlds there is a way to acquire a new product.
To know if the plant chosen is suitable to be a future add to a certain food it’s necessary to study the
components of the plant and determinate the quantitative and qualitative composition of the metabolite
group of interest, in this case phenolic compounds.
The plant of interest was Hibiscus cannabinus L. (Kenaf), from Malvaceae family that it’s known for
its fibres but it is also used as an infusion or condimental herb and in traditional medicine as an antidote
to poisoning with chemicals and venomous mushrooms, it’s known in Asia and Africa but still barely
approached by European countries.
In order to separate and identify the phenolic compounds a liquid extraction with a polar solvent was
the first step, it was chosen MeOH/H2O and MeOH (80% w/w; 100%).
Was determinate the antioxidant capacity and the quantification of the phenolic content of the plant
samples, for Everglades 41 the DPPH value of Ec50 was 27,33, The ORAC value was 1273,7 (μmol
Trolox/mg sample) and the Folin-Ciocalteu 26,40 EAG (mg)/Sample (g)). For the Tainung 2 type was
43,00, 307.54 and 18,67, respectively.
The final step was the identification of the compounds by liquid chromatography followed by mass
spectrometry with time of fly analyzer and quadrupole time of fly (HPLC-ESI-MS), were obtained 47
compounds for Everglades leaf and 37 for Tainung 2.
Key-Words: food quality, phenolic compounds, liquid extraction, antioxidant capacity, HPLC-ESI-MS,
Kenaf.

VIII

IX
Resumo:
Na indústria alimentar é necessário investigar novas formas de melhorar o sabor e qualidade dos
alimentos, de preferência trazendo seus benefícios para a saúde do consumidor. Neste sentido, algumas
ervas e plantas são fontes naturais de antioxidantes, apresentando capacidade de conferir protecção ao
corpo humano de algumas doenças crónicas, tal como Parkinson e processos inflamatórios. A
combinação destes dois mundos é um caminho para o desenvolvimento de um novo produto.
Para saber se a planta em questão é adequada para ser uma futura adição a um certo alimento (ou algum
dos seus componentes) é necessário estudar os componentes da planta e determinar a composição
quantitativa e qualitativa do grupo metabólico de interesse, neste caso os compostos fenólicos.
A planta de interesse foi a Hibiscus cannabinus L. (Kenaf), da família Malvaceae conhecida pelo teor
de fibra de qualidade (os caules) mas também utilizada como chá ou condimento e na medicina
tradicional como um antibiótico contra o envenenamento com químicos e cogumelos venenosos; é
conhecida na Ásia e Africa mas ainda pouco estudada nos países Europeus.
De modo a separar e identificar os compostos fenólicos o primeiro passo utilizado foi a extracção líquida
com um solvente polar, foi escolhido o MeOH/H2O e MeOH (80% v/v; 100% v/v).
Foi determinada a capacidade antioxidante e a quantificados os compostos fenólicos das amostras, para
a Everglades 41 o valor de Ec50 (método DPPH) foi de 27,33, o valor de ORAC de 1273,7 (μmol
Trolox/mg amostra) e o de Folin-Ciocalteu 26,40 EAG (mg)/amostra (g)). Para a Tainung 2 foram 43,00,
307,54 e 18,67, respectivamente.
O passo final foi a identificação dos compostos por cromatografia líquida seguida de espetrometria de
massa com analizador de tempo de voo e quadrupólo tempo de voo (HPLC-ESI-MS), foram obtidos 47
compostos nas folhas Everglades 41 e 37 em Tainung 2.
Key-Words: qualidade alimentar, compostos fenólicos, extracção líquida, capacidade antioxidante,
HPLC-ESI-MS, Kenaf.

X
XI
Table of Contents
Acknowledgments .................................................................................................................................. V
Abstract ...............................................................................................................................................VII
Resumo ................................................................................................................................................. IX
Table of Contents ................................................................................................................................ XI
Index of Figures ................................................................................................................................ XIII
List of Tables ....................................................................................................................................... XV
Abbreviations ……………………………………………………………………………………….
XVII
Chapter 1 ................................................................................................................................................ 1
1. Introduction ………………………………………………………...…………………........ 3 1.1. Antioxidant Activity .............................................................................................................................. 4
1.1.1. Where to find Antioxidants and their Role ….…………………………………………………........ 6
1.1.2. DPPH assay …………………………………………………………..……………………………... 7
1.1.3 ORAC assay ……………..………………..………………....…………………………………...….. 8
1.1.4. Folin-Ciocalteu assay ………………......…………………………………………………………… 9
1.2. Phenolic Compounds .............................................................. Erro! Marcador não definido.
1.2.1. Interest in Phenolic Compounds …………………………………………………………………. 12
1.3. Characterization of Phenolic Compounds ....................... Erro! Marcador não definido.13
1.3.1. Metabolomics …………………………………………………………………………………….. 13
1.3.2. Vegetable Samples Treatment ……………………………………………………………………. 14
1.3.3. Characterization and Quantification of Phenolic Compounds ………….………………………... 15
1.3.3.1. Liquid Chromatography ……………………………………………………………………...… 15
1.3.3.2. Detectors ……………………………………………………………………………………….. 18
1.3.3.2.1.UV-Vis Spectrophotometry …………………………………………………………………... 18
1.3.3.2.2. MS ……………………………………………………………………………………………. 21
1.3.3.2.3. ESI ……………………………………………………………………………………………. 22
1.3.3.2.4. Q-TOF …………………………………………………………………………………………23
1.4. Kenaf ................................................................................................................................. 26
1.4.1. The Origins of Kenaf ……………………………………………………………………………... 25
1.4.2. Uses of Kenaf …………………………………………………………………………………….. 27
1.4.3. Production of Kenaf ………………………………………………………………………...……. 28
1.4.4. Kenaf Leaf ……………………………………………………………………………………….. 29
1.5. Objective .......................................................................................................................... 31
Chapter 2 .............................................................................................................................................. 31
2. Matherial and Methods ………………………………………………………………….. 34
2.1. Chemicals ………………...……………………..………………………………………. 34
2.2. Plant Samples ......………...…………………………………..………………………… 34
2.3. Plant Extracts …………….……………………………………..……………………… 34 2.3.1 Overnight Maceration ...……………………………………………………………………………. 35
2.3.2 Ultrasound-Assisted Extraction ……………………………………………………………………..35
2.4. Antioxidant assays …………………………………………………………………….. 35 2.4.1. DPPH ……………………………………………………………………………………………… 35
2.4.2. ORAC ……………………………………………………………………………………………... 36

XII
2.4.3. Folin-Ciocalteu ……………………………………………………………………………………. 37
2.5. HPLC-ESI-QTOF-MS Analyses ……………………………………………………… 37
Chapter 3 .............................................................................................................................................. 38
3. Results and Discussion …………...……………………………………………………… 41
3.1. Extraction method …………………………………………………………………….. 41
3.2. HPLC-ESI-QTOF-MS analyses of Kenaf leaf ………………………………………. 45
Chapter 4 .............................................................................................................................................. 56
4. Conclusion ……………………………………………………………………………….. 59
5. References ……………………………………………………………………………….. 61
6. Appendix …..…………………………………………………………………………….. 67
XIII
Index of Figures:
Figure 1.1: Formation of the reactive peroxyl radical …………………………………..…. 5
Figure 1.2: Molecular structure of DPPH• …………………………………………….…... 6
Figure 1.3: Reduction of the DPPH radical …………………………………………........... 6
Figure 1.4: Molecular structure of Trolox, an analogue to vitamin E ……………...…….... 7
Figure 1.5: Main reactions of the ORAC assay ……………………………………….…… 8
Figure 1.6: Reaction of the Folin-Ciocalteu reagent with a phenolic compound …….......... 8
Figure 1.7: Principal families of phenolic compounds ………………………………......… 9
Figure 1.8: Subclasses of the flavonoids ……………………………………………..…... 10
Figure 1.9: Diagram of ‘’omic’' sciences ……………………………………………...….. 12
Figure 1.10: Extraction systems …………………………………………………….....….. 14
Figure 1.11: Schematic representation of a LC system ……………………………......….. 15
Figure 1.12: Schematic representation of a UV-Vis detector ………………………........... 17
Figure 1.13: Schematic representation of a MS equipment coupled to a HPLC …...…....... 20
Figure 1.14: Representation of the formation of electrospray ………………..…...……..... 22
Figure 1.15: Schematic representation of a Q-TOF …………………………...………...… 23
Figure 1.16: Kenaf ………………………………………………………………...…….… 25
Figure 1.17: Graphic representation of world production of Kenaf ……………………..... 28
Figure 1.19: Photograph of two types of Kenaf leaf: Everglades 41 and Tainung 2……… 29
Figure 2.1: Schematic illustration of the microplate in the ORAC assay …………...….… 35
Figure 3.1: Base peak chromatogram (50–1100 m/z) of Everglades 41, in which the peaks are identified
with numbers (1-47) according to the order of elution ……………………………….……. 44
Figure 3.2: Basic structure of kaempferol, principal fragmentation routes and sites of substitution (X,
Y, and Z) ……………………………………………………………………………….…... 48
Figure 3.3: Fragmentation of kaempferol-galactoside-rhamnoside, pathway a gives origin to fragment
430 m/z while pathway b originates the fragment 447 m/z ……………………………....... 50
Figure 3.4: Example of the retrocyclisation that occurred in quercetin originating fragments at m/z 179
and 121, adapted from Febre et. al, 2001 ……………………………………...…..…….…. 51
Figure 3.5: Representation of peak 39/40 and its fragments, at left the one correspondent to the m/z 285
and at right the one correspondent to m/z 255 …………………………………...….……… 52
Figure 3.6: Proposed compound for peak 21, IUPAC name: [butoxy-hydroxy-methyl-trihydroxy-
(hydroxymethyl)oxan]-oxy-hexahydro-cyclopenta[c]pyran-yl] acetate ………..…......……. 53
Figure 3.7: Base peak chromatogram (50–1100 m/z) of Tainung 2, in which the peaks are identified
with numbers (1-37) according to the order of elution ……………………………….….… 54

XIV

XV
List of Tables:
Table 1.1: Beneficial vs. Harmful effects of ROS ………………………………….…..…. 4
Table 1.2: Characteristic absorption bands of some families of phenolic compounds.......... 18
Table 1.3: Taxonomic status of Kenaf …………..…………………………………....…… 25 Table 1.4: Utilities of different parts of Kenaf …………………………………...……..… 26
Table 1.5: Overview of Kenaf’s production ……………………………………..…...…… 27
Table 3.1: Percentage of extraction in each experiment, 1st, 2nd and 3rd extraction and the maceration
……………………………………………………………………………………….…….. 40
Table 3.2: Results of Folin-Ciocalteau (EAG (mg)/Sample (g)) and DPPH (Ec50) assay for Everglades
41 and Tainung 2 ………………………………………………………………..…..…….. 41
Table 3.3: Results of Folin-Ciocalteu (EAG (mg)/Sample (g)), DPPH (Ec50) and ORAC (μmol
Trolox/mg sample) assay for Everglades 41 and Tainung 2, successive extraction ...……. 43
Table 3.4: List of compounds of Everglades 41 and its presence/absence in type Tainung 2
………………………………………………………………………………….…….……. 45

XVI

XVII
Abbreviations
FOSHU FOod for Specified Health Uses
ROS Reactive Oxygen Species
AAPH 2,2’azobis(2-amidinopropane)dihydrochloride
DPPH 2,2-diphenyl-1-picrylhydrazyl hydrate
ORAC Oxygen Radical Absorbance Capacity
MeOH Methanol
LC Liquid Chromatography
HPLC High Pressure Liquid Chromatography
UV Ultra-Violet
MS Mass Spectrometry
ESI Electrospray

XVIII

1
Chapter 1

2
1. Introduction
Food industry has always aimed to present new ideas and chased new techniques to improve the brands
already on the market. In this scenario, functional food is an opportunity to innovate and one of the most
interesting areas of study within this industry.
In Europe the functional foods are a topic of discrepancy, while in some Northern countries they have
been questioned by the public, in Finland the consumers have accepted them with a more open mind
(Annunziata, 2011). This study also reported that in general the consumers don’t have a clear idea of
what are functional foods yet, so there is a need to clarify the audience that will purchase these new
products.
The term of functional food arises in 1984 coined by Japanese scientists when studied the correlation
between nutrition, sensory satisfaction, fortification and modulation of physiological systems. Some
years later, in 1991 the FOod for Specified Health Uses (FOSHU) was approved, where the rules for
approval of a specific health-related food category were established (Siró et al., 2008).
While the studies on this new type were explored, other countries started to define the term ‘’Functional
Foods’’ and it began to appear more as a concept than an actual food category. According to the EU
definition cited in Siró et al 2008 “a food product can only be considered functional if together with the
basic nutritional impact it has beneficial effects on one or more functions of the human organism thus
either improving the general and physical conditions or/and decreasing the risk of the evolution of
diseases. The amount of intake and form of the functional food should be as it is normally expected for
dietary purposes. Therefore, it could not be in the form of pill or capsule just as normal food form”.
In Portugal the functional food theme is not yet being discussed by the population although the typical
Portuguese food has always been a point of interest for both tourism and their own people, following
the Mediterranean type (FAO.org1).
The Mediterranean diet is characterized by a nutritional consisting in olive oil, cereals, fresh or dried
fruits and vegetables, a moderate amount of fish, dairy and meat, and many condiments and spices with
a touch of infusions and wine, depending on the country. Also in 2010, UNESCO inscribed the
Mediterranean diet on the Representative List of the Intangible Cultural Heritage of Humanity.
1 http://www.fao.org/docrep/016/i3004e/i3004e04.pdf. 02-05-2013, Granada, ES

3
1.1. Antioxidant Activity
Every day the human body takes oxygen that produces, along with other biological reactions such as
mitochondrial respiratory chain and inflammatory condition (Fernandez-Panchon et al., 2008), free
radicals commonly named ROS (reactive oxygen species) including superoxide (•O2-), hydroxyl radical
(•OH), nitric oxide (NO•) and other peroxides. Nevertheless, ROS encompasses not only oxygen radicals
but also other non-radicals oxidizing agents (Buonocore et al., 2010).
Free radicals are extremely reactive species with tendency to interact with other species and form new
radicals that are not beneficial for human organism. They are capable to begin a chain of reactions that
involve a number of steps, in which each step forms a free radical that is the trigger for the next one.
There are three phases in this process, namely initiation (first step), propagation (second step) and
termination (third step) (Buonocore et al., 2010). During the first step, alkyl radicals are formed from
reaction with oxygen molecules that propagate hydroperoxide and peroxide radicals in the second step,
and finally, the third step encloses this process by the association of two radicals in a stable adduct form
(Brand-Williams et al., 1995).
Some studies (Fernandez-Panchon et al., 2008) have associated free radical activity with the
development of certain degenerative diseases like cancer and coronary heart disease but it shouldn’t be
forgotten that ROS have also a beneficial side, as shown in the Table 1.1.
ROS are neutralized by antioxidants, naturally occurring or added to food such as certain vitamins (A,
E, C), chlorophylls, carotenoids and phenolic compounds (Bianchi, 1999). Synthetic antioxidants could
be considered not safe because of the toxicity associated with them so there is an aim of searching for
natural antioxidants that could be added to food in order to produce a healthier and safer product. A
variety of them have been already identified and isolated from fruits like acai berry, gogi berry, green
tea (Finley, 2011) and vegetables.

4
Table 1.1: Beneficial vs. Harmful effects of ROS.
Equilibrium is needed in human organism between antioxidants and ROS, since this balance is destroyed
and the antioxidant defenses become depleted, oxidative stress could occur and the damages would be
inevitable. However, overtake of antioxidants also could be harmful because all natural compounds may
cause toxicity when taken in excess. For example, a study (Finley, 2011) reported that caspase-3 and
JNK, the cell death proteins, were activated by green tea epigallocatechin-3-gallate when taken in high
doses so in order to promote the beneficial effects of these compounds an attention to the physiological
conditions and the dosage used is needed.
Beneficial effects
Regulatory mechanisms:
NADPH oxidase (NOX) enzymes required for the differentiation and activation of myofibroblasts.
Intracellular signaling:
Transmission of biochemical signals from cell surface receptor-ligand
Host defence against invading microbes:
ROS-generating NOX enzymes
Harmful effects
Lipid peroxidation within cell membranes
Oxidative damage to proteins
Activation of pro-cell death factors
ROS

5
1.1.1. Where to Find Antioxidants and Their Role
Fruits and vegetables are a good natural source of antioxidants which have the ability to protect the
human system from many chronicle diseases, as above discussed. The antioxidants are also important
in the food industry since oxidation of lipids cause off-flavours (Brand-Williams et al., 1995) and some
chemicals that could not be healthy so the antioxidants will contribute to delay this process and maintain
for a longer time the quality and good aspect of food.
Due to the toxicity and carcinogenicity of some synthetic antioxidants (Akter et al., 2010), there is a
need from the food sector for new natural antioxidants such as plant-derived polyphenols. There is a
rage of methods that allow the quantification of the antioxidant capacity of a certain sample, especially
based on spectrophotometric measures.
Some of them measure the ability of the antioxidant to break the chain reaction of lipid peroxidation. In
these cases, the lag phase is observed during the consumption of the antioxidant and then, a more rapid
peroxidation occurs which could be detected by oxygen uptake or chemiluminescence (Bisby et al.,
2008).
The oxidizing peroxyl radical source is usually an ‘’azoinitiator’’ as reported in Bisby et al., 2008,
2,2’azobis(2-amidinopropane)dihydrochloride (AAPH) which generates a carbon-centered radical by
thermolysis and reacts with oxygen giving a reactive peroxyl radical, as shown in figure 1.1.
AAPH + 2O2→2ROO•
Figure 1.1: Formation of the reactive peroxyl radical (Adapted Bisby et al., 2008).
In other methods, the reducing power of the antioxidant is established by the ability to reduce a colored
radical such as 2,2-diphenyl-1-picrylhydrazyl hydrate (DPPH) and the antioxidant capacity is given by
the measurement of the absorbance.
Alternatively, peroxyl radicals could be reduced by the antioxidant in competition with an indicator and
so simple competition kinetics may be used to evaluate the rate constant for reaction of peroxyl radical
with the antioxidant such as the case of the oxygen radical absorbance capacity assay (ORAC) (Bisby
et al., 2008).

6
1.1.2. DPPH assay
The DPPH assay is based on the reduction of the radical DPPH• by receiving a hydrogen from the
antioxidant species, the DPPH• is a stable radical which has an unpaired valence electron at one atom
of Nitrogen Bridge, the molecular structure of this reagent is shown in figure 1.2. It is a simple and
practical method so it has been used in plenty of laboratories for this kind of measurements.
Figure 1.2: Molecular structure of DPPH• (Adapted from Sigma-Aldrich2).
In its radical form the DPPH absorbs at 515 nm (Brand-Williams et al., 1995) showing a violet color.
When the reduction occurs by another radical or an antioxidant, the absorption disappears according to
the figure 1.3 (Brand-Williams et al., 1995). Therefore, this method will give an overlook of the
antioxidant power of the sample in question.
DPPH• + AH DPPH-H + A•
DPPH• + R• DPPH-R
Figure 1.3: Reduction of the DPPH radical (Adapted from Brand-Williams et al., 1995).
This method has been reported in some studies to determine the antioxidant activity in food and
vegetable matrices (Brand-Williams et al., 1995; Herrero et al., 2011) and particularly, Mohd-Esa et al.,
2010 studied samples of the genus Hibiscus L., species sabdariffa by this method.
2http://www.sigmaaldrich.com/catalog/product/aldrich/d9132?lang=es®ion=ES, 26-04-2013, Granada, ES.

7
There are a number of different ways to apply this method with variations on the DPPH concentration
or incubation time. In 2009, Sharma presented a study about the applications of the method and some
differences on the protocols that resulted in variations in the results, especially in the Ec50 (the amount
of sample needed to reduce the initial concentration of DPPH by 50%), and an extra difficulty in
comparing data. This study also presents a standard procedure based in the use of a DPPH concentration
of 50 µM in methanol, ethanol or buffered under dark or dim light within the sensitivity range of
spectrophotometry (Sharma, 2009).
1.1.3. ORAC assay
Another widely used method to determine the antioxidant capacity is the ORAC assay which compares
the antioxidant activity of the matrix with an analogue of vitamin E, commonly known as Trolox (Figure
1.4).
Figure 1.4: Molecular structure of Trolox, an analogue to vitamin E (Adapted from Sigma-Aldrich).
This assay has been reported as successful in the determination of antioxidant activity in fruits,
beverages and plasma as well as more complex samples, so it also has been applied in cosmetic industry
and nutraceuticals (Stockham et al., 2011).
In this assay, the β-phycoerythrin was introduced as an indicator for the estimation of antioxidants but
nowadays the fluorescein is used as a more reliable indicator. The decrease of its fluorescence indicates
the lag phase where there is a competition between indicator and antioxidant to react with peroxyl
radical. On this method, it is possible to evaluate if the antioxidant is effective and the total antioxidant
capacity of a plant extract by measurement of the area under the curve of fluorescence intensity versus
time (Bisby et al., 2008).

8
For better understanding of the ORAC assay, the figure 1.5 shows the major reactions which include the
reaction between the peroxyl radicals (ROO•) with fluorescein (FH) and the antioxidant (AH).
FH +ROO• → F•+ROOH
F• +F• → Products
AH + ROO• → A• + ROOH
A•+A• → Products
Figure 1.5: Main reactions of the ORAC assay (Adapted from Bisby et al., 2008).
1.1.4. Folin-Ciocalteu assay
A method widely used to quantify the total phenolic content in plant products is the Folin–Ciocalteu
method. It is based on the reaction of phenols with a colorimetric reagent composed of
phosphomolybdate and phosphotungstate, exemplified in figure 1.6. This method has been widely used
for this kind of determination in food since it is simple and standardized, and the reagent is commercially
available (Ramirez-Sanchez et al., 2010; Magalhães et al., 2010).
H3PW12O40 + H3Mo12O40 + Phenolic compound W3O23 + Mo3O23
Figure 1.6: Reaction of the Folin-Ciocalteu reagent with a phenolic compound.
The former products present a blue coloration absorbing UV-vis radiation in wavelength range of 700-
760 nm (Cicco et al., 2009) so it is an easy method to apply, it has a simple interpretation and it may be
used in any laboratory.
Nevertheless, this assay is limited by its lack of specificity, since other products of oxidation could
interfere causing over estimation of the polyphenol content within the sample. Substances as sugars,
aromatic amines, sulphur dioxide, organic acids and bases can react with the Folin–Ciocalteu reagent
(Ramirez-Sanchez et al., 2010).

9
This method has been used in the study of a wide range of plant samples, including species belonging
to the genus Hibiscus (Mohd-Esa et al., 2010).
1.2. Phenolic compounds
Phenolic compounds or polyphenols are extremely diverse, indeed, there are more than 8000 phenolic
structures known according to Bravo, 1998 and they constitute one of the widest groups in plant
metabolism. According to same authors, phenolic compounds can be classified by the number of phenol
rings and their linkage, ranging from simple phenols to more complex structures. In figure 1.7 there are
represented the principle families.
Figure 1.7: Principal families of phenolic compounds (adapted from Bravo, 1998).
Phenolic compounds also exhibit multiple forms, being divided into subclasses, within the families of
phenolic compounds the flavonoids are one of the most important and one of the widest distributed in
nature; they are distributed in subclasses as shown in figure 1.8.
Ph
en
oli
c C
om
po
un
ds Simple Phenols
Polyphenols
Phenols
Phenolic acids
Benzoquinones
Acetophenones
Phenylpropenes
Coumarins, Isocoumarins
Chromones
Naftoquinones
Flavonoids
Xanthones
Stilbenes
Anthraquinones
Lignans, Neolignans
Lignins
Tannins

10
Figure 1.8: Subclasses of the flavonoids (Adapted from Bravo, 1998).
They primarily occur in conjugated form with one or more sugar rings linked to hydroxyl group or
directly to an aromatic carbon, being glucose the most common although galactoses or xyloses are also
found. Other common substitutes of phenolic rings are carboxyl, amines, lipids and other phenols
(Bravo, 1998).
Despite phenols and hydroxybenzoic acids (Figure 1.8) have the simplest structures in phenolic
compounds; they have been mentioned in many studies related with plant taxonomy, growth or
reproduction (Bravo, 1998; Escarpa, 2001). They contribute to the color and taste of fruits and
vegetables and they also are responsible for the lack of color when these are processed because of the
formation of complexes with metal ions and proteins (Belitz et al., 2009).
Phenolic compounds are not homogeneously distributed in the plants. The insoluble phenols can be
found in the cell walls where contribute to their strength while the soluble phenols are usually located
within the plant cells vacuoles. In all cases, they play a regulatory role in the growth and morphogenesis
of the plant and take part in the stress response to pathogens attack, (Naczk, 2006).
Chalcones
Dihydrochalcones
Aurones
Flavones
Flavonols
Dihydroflavonols
Flavanones
Flavanols
Flavandiols or Leucoanthocyanidins
Anthocyanidins
Isoflavonoids
Biflavonoids
Proanthocyanidins or condensed tannins
Fla
vo
no
ids

11
1.2.1. Interest in Phenolic Compounds
As said before phenolic compounds are antioxidants, which is especially important once they could act
as anti-inflammatory and anti-carcinogenic.
Inflammation is a response of the organism to exposure to infectious agents, physical injury or antigenic
stimuli however if the process is not efficient it becomes chronic, it becomes pathological. Some studies
(Conforti et al., 2009; Soberón et al., 2010) showed that certain phenolic compounds are potent radical
scavengers which moderately inhibited COX-2 activity, as an indication of anti-inflammatory potential.
COX-2 is a key enzyme in prostaglandin biosynthesis and hyaluronidase, an enzymatic activity
increased during chronic inflammation and it has been studied for anti-inflammatory aims (Soberón et
al., 2010).
Cancer is a group of diseases associated with an altered control of the cell cycle, the imbalance in the
control of cell proliferation is a primary characteristic of the cancer cells, so any molecule capable of
inhibiting the proliferation of cancer cells may be useful as potential chemo preventive agent.
In order to study a solution for this problem Ren et al., 2003 correlated the activity of flavonoids and
carcinogenic disease. Ornithine decarboxylase, a rate-limiting enzyme in polyamine biosynthesis related
to cell proliferation in several tissues could be inhibited by flavonoids causing a decrease in polyamine
and inhibition of DNA/protein synthesis. Furthermore, flavonoids are also effective at inhibiting signal
transduction enzymes, for example, protein tyrosine kinase, protein kinase C and phosphoinositide 3-
kinases which are involved in the regulation of cell proliferation.
Also Birt et al., 2001 and Yao et al., 2004 correlated the consumption of flavonols with the combat to
cancer cells.
There have been found a relationship between their antioxidant activity and the chemical structure
depend on the number and position of the hydroxyl group and on the pH, for phenolic acids the
antioxidant capacity will be as higher as the hydroxyl group is free (Fernandez-Panchon et al., 2008),
while in flavonoids this capacity will increase with the increase of hydroxyl groups and a decrease in
glycosylation (Yao et al., 2004).

12
1.3. Characterization of phenolic compounds
To investigate the bioavailability and biochemical effect of a particularly plant of interest, there is the
need to know the quantitative and qualitative composition of the metabolite group that occurs on that
plant. These types of studies have become a growing field and a powerful tool in food science.
1.3.1. Metabolomics
Metabolomics is a group of integrated sciences that has the aim of identifying and quantifying the
intercellular or extracellular metabolites. It could be considered as the final step in the study of the
‘’omic’’ sciences, beginning with the genomics (study of the evolution and functioning of the genes),
transcriptomics (the study of the genes expression), proteomics (study of the structure and function of
proteins) and finally, metabolomics as represented in figure 1.9.
Figure 1.9: Diagram of ‘’omic’' sciences
There are different analytical strategies within metabolomics.
Target analysis: Centered in one or a small group of metabolites of interest.
Metabolite profiling: Focus on identifying and quantifying a certain number of related
metabolites that could belong to the same family, for example phenolic compounds, or
participate in the same metabolic pathway.
Metabolomics: Analysis in which all the metabolites of a system are identified and quantified,
revealing the metabolome of the system.

13
Metabolite fingerprinting: Based on a qualitative screening to classify the samples according to
their origin or biological relevance.
In order to obtain the required information about the metabolites of a system, the right techniques should
be applied. The technique must be rapid and simple, comprehensive and give as much information as
possible. Furthermore, the applied method must be standardized to enable the comparison of new
samples with data from literature.
Anyway the first important step to a good characterization is the treatment of the sample.
1.3.2. Vegetable samples treatment
A considerable amount of methods have been proposed for the extraction of phenolic compounds from
vegetable samples, the procedure of choice has a direct relationship with the matrix in question and the
complexity of these compounds. Generally, the extraction process should be as mild as possible to
maintain the integrity of the components in question.
The first step is to dry the sample by heat or lyophilization and freeze them with liquid nitrogen for
example so it can be stored and then analyzed when suitable. When that moment comes, phenolic
compounds could be extracted from the matrix by several different systems as exemplified in figure
1.10.
In general, phenolic compounds are weak organic acids with pKa range between 8 and 12 (Tura, 2002;
Harnly et al., 2007), they can go from hydrophilic to hydrophobic and are usually readily extracted into
aqueous alcohol, solvents such as methanol, ethanol, propanol, acetone, ethyl acetate, DMSO have been
used for the extraction (Harnly et al., 2007; Naczk, 2006).
Taamalli et al., 2012 studied a conventional method for extraction of bioactive compounds from raw
materials, such as olive leaves, combining a mixture of methanol and water and maintaining it during
24h in the dark at room temperature.
It is important to remain in mind that to extract bioactive compounds from a plant is typically used a
solvent extraction so the yield and antioxidant activity will depend strongly on the solvents.

14
Figure 1.10: Extraction systems.
1.3.3. Characterization and quantification of phenolic compounds
The separation and identification of phenolic compounds is the next step to take after the extraction. In
order to do that, analytical chemistry has some techniques based on the differences between the physical-
chemical properties of the compounds which form the complex samples, including liquid
chromatography.
1.3.3.1. Liquid chromatography
Chromatography is a vast area but, in a simple way, it could be separated in two distinct branches, gas
chromatography (GC) and liquid chromatography (LC). GC provides better and faster separations and
very good resolution, despite these advantages, many samples can’t be handled by GC because they are
insufficiently volatile and cannot pass through the column, or they are thermally unstable and
decompose under the conditions of separation.
Snyder 1979 wrote that approximately only 20% of known organic compounds can be satisfactorily
separated by GC, without prior chemical modification of the sample, whereas LC is ideally suited for
Filtration•Ultrafiltration
•Dialysis
Extraction with
solvents
•Solid-liquid
•Liquid-liquid
•Pressurized fluids
•Supercritical fluids
•Microwave assited
•Ultrasound assisted
Solid phase
extraction
•Solid phase extraction
•Solid phase microextraction
Extraction Systems

15
the separation of macromolecules and ionic species of biomedical interest, labile natural products and a
wide variety of other high molecular-weight and/or less stable compounds.
LC is a technique based on the separation of the compounds of a sample due to their different distribution
between a liquid mobile phase and a stationary phase placed in a column. The stationary phase can be a
porous solid or a thin layer of substance bound to a solid support, contained within a metallic tube that
usually leads to the chromatographic column. The mobile phase is a solvent or a mixture of them which
may present different pH values by addition of acids, bases or buffer solutions.
To separate its components, the sample is injected in the LC equipment and forced by a high pressure
created by the pump to flow through the chromatographic column. In the column the components of the
sample are separated according to their affinities by the mobile or the stationary phases in such a way
that those components with higher affinity by the mobile phase will elute before than other components
with higher affinity by the stationary phase (Snyder 1979).
When the analytes reach the end of the column, the detector produces a signal that is as intense and
durable as the nature and quantity of the analyte. That signal is processed by a computer and recorded
by the form of a chromatogram.
The LC equipment has the basics components which are shown in figure 1.11: the pump, the injector,
the column, the oven, the detector and the recorder (computer).
Figure 1.11: Schematic representation of a LC system.

16
The characteristics of the column are decisive for the type of LC applied, when the internal diameter of
the column is between 1,5 - 4,5 mm and its length is between 3 – 30 cm it is a high pressure liquid
chromatography (HPLC), in this case the flow of the mobile phase can be between 0,2 - 2,5 ml/min.
Inside this category there is another section, when the size of the stationary phase particles are beneath
2 μm and its length is between 3 – 15 cm it’s called RRLC (rapid resolution liquid chromatography) or
UPLC (ultra pressure liquid chromatography), in this case the flow can be between 0,2 - 5 ml/min.
LC technique can be described in four different processes according to the nature of the stationary phase,
the liquid-liquid (or partition), the liquid-solid (or adsorption), the ion-exchange and the size-exclusion
(or gel) chromatography (Snyder, 1979).
When a liquid-liquid chromatography, also called partition chromatography (Snyder, 1979), is applied
both phases are liquid but different in composition, once they must be immiscible, and the components
of the sample distribute between these two phases. It is possible to differentiate two modes, normal-
phase chromatography which the stationary phase is polar and the mobile phase non-polar, so the polar
molecules stay stronger attached to the column and the elution starts with the non-polar compounds.
However, in reverse-phase chromatography the opposite happens since the stationary phase is non-polar
and the mobile phase polar in consequence the non-polar molecules stay in the column more time.
In the liquid-solid chromatography, or adsorption chromatography (Snyder, 1979), the column packing
is solid and the liquid phase transports the molecules of interest and the retention of these molecules
occurs by adsorption over the solid phase surface.
Ion-exchange chromatography is characterized by the stationary phase containing fixed ionic groups
such as SO-3, along with counter-ions of opposite charge.
Finally, in size-exclusion chromatography the stationary phase is a porous matrix and the size of the
pore is determined so certain sized molecules could not pass into that matrix so they are excluded while
the smaller molecules penetrate into the pores lasting longer than the larger molecules (Snyder, 1979).
Over the years, innumerous authors reported liquid chromatography as the technique of choice to
analyze phenolic compounds (Harnly, 2007, Kalili, 2011, Taamalli, 2012), normally by reverse-phase
because of their polar nature. The most common columns in the separation of phenolic compounds are
those with modified silica with hydrocarbons chains such as C8 (n-octyl) or C18 (n-octadecyl), what
changes between the numerous columns available in the market is the length, diameter and pore size
(Harnly, 2007; Kalili, 2011).
The mobile phases are usually made by different mixtures of solvents like acetonitrile, water and
methanol containing some modifiers such as acetic, formic or trifluoroacetic acids and salts as
17
ammonium phosphate (Robards, 1999). The elution begin with the most polar compounds followed by
a decrease of polarity, then the elution order can be synthetized as phenolic acids first followed by
cinnamic acids and then flavonoids (Robards, 1999) although the overlap of some components could be
practically impossible to avoid once that there are numerous components within these families.
1.3.3.2. Detectors
A number of detection systems might be combined with a LC instrument, ultraviolet-visible molecular
absorption spectrophotometry (UV-Vis) and mass spectrometry (MS) are the most widely used to detect
phenolic compounds.
1.3.3.2.1. UV-Vis Spectrophotometry
One detection system typically combined with HPLC is the UV-Vis spectrophotometry that is based on
the interaction between the UV-Vis radiation and the analytes giving rise to a phenomenon of absorption
of specific wavelengths of the radiation by the compounds.
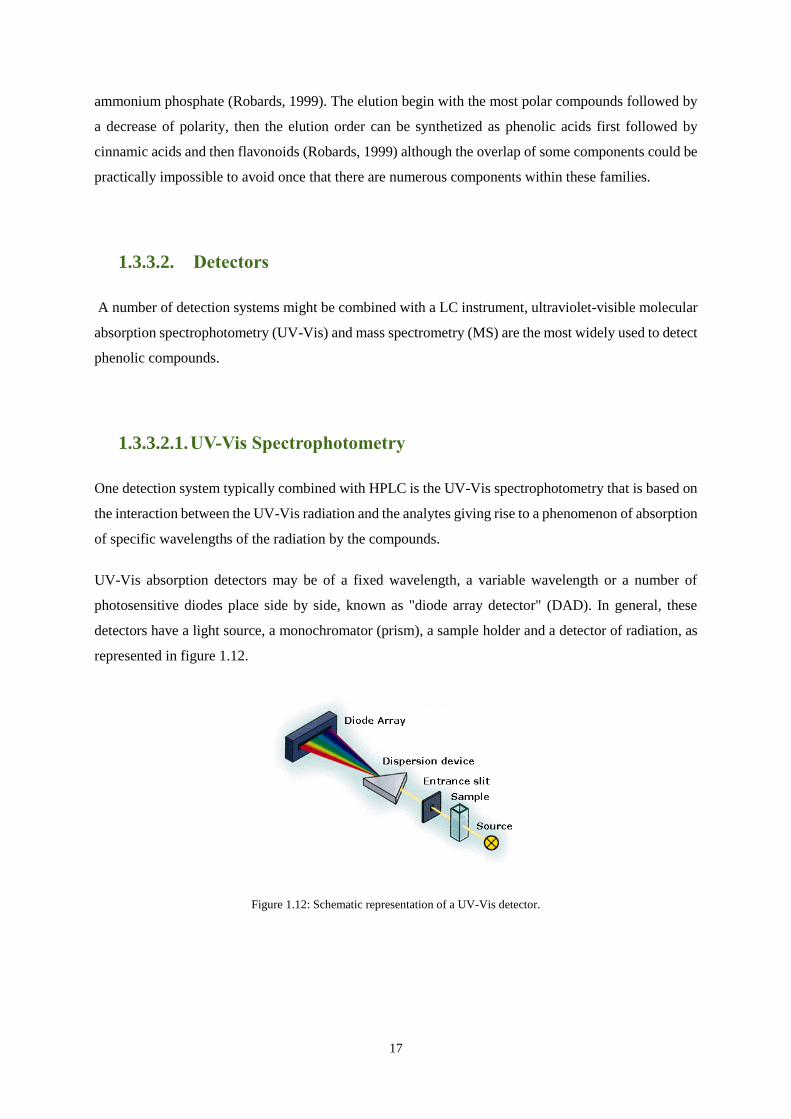
UV-Vis absorption detectors may be of a fixed wavelength, a variable wavelength or a number of
photosensitive diodes place side by side, known as "diode array detector" (DAD). In general, these
detectors have a light source, a monochromator (prism), a sample holder and a detector of radiation, as
represented in figure 1.12.
Figure 1.12: Schematic representation of a UV-Vis detector.

18
The light source, the most important part, consists in a lamp of deuterium filament (190-330 nm) and a
lamp of tungsten filament (330-800 nm) so together they produce a light beam that runs the full range
of the spectrum (Verma M. et al., 2011).
Phenolic compounds have multiple conjugated bonds that convert them into chromophores so they will
present absorption bands in the UV and even in the visible (Skoog et al., 1998) as is the case with some
flavonols and anthocyanins.
This detector is very useful since a huge range of molecules absorb radiation in this area of the
electromagnetic spectrum but this fact has also become an inconvenient because of its lack of specificity.
UV-Vis does not provide structural information and by itself does not enable the unambiguous
identification of compounds if standards are not available. In complex samples, compounds without
commercially available standards are usually much more numerous than those with them. However, this
technique provides useful information of the family which the analytes belong to once that each family
has characteristic absorption bands, as explained in table 1.2.
Table 1.2: Characteristic absorption bands of some families of phenolic compounds.
Compound Structure UV Bands (nm)
Phenolic acids
270-280
Cinnamic acids
305-325
Coumarins
220-230 310-350
Chalcones
220-270 340-390
Dihydrochalcones
~ 220 ~ 280

19
Aurones
240-270 340-370
Flavones
250-270 330-350
Flavonols
250-270 350-380
Flavanones
270-295
Flavanols
270-280
Anthocyanidins
240-280 450-560
Isoflavones
245-270 300-340
Proanthocyanidins
~280

20
1.3.3.2.2. MS
Mass Spectrometry can be used as a detector combined with LC. The major advantage of this technique
is its selectivity and its capability to give structural information about the analytes. This coupling
(HPLC-MS) also presents the advantage of providing a second dimension of separation once that the
compounds are separated according to their retention time by the HPLC, another separation takes place
according to the mass to charge ratio (m/z).
MS is a technique in which the ions are separated in the vacuum by some kind of force according to
their m/z. In general MS equipment has four essential parts, as seen in figure 1.13.
Sample inlet system
Ionization source
Mass analyzer
Detector
The sample can be introduced from a connection with a previous separation system, such as HPLC, or
directly by infusion, heating or desorption.
Figure 1.13: Schematic representation of a MS equipment coupled to a HPLC.

21
In the ion source the sample is ionized and then, the formed ions are transported by electric fields to the
mass analyzer. The ionization of the sample could occur by several phenomena, among them the most
important are:
Chemical ionization (CI)
Electrons impact (EI)
Electrospray (ESI)
Fast Atom Bombardment (FAB)
Matrix Assisted Laser Desorption Ionization (MALDI)
When they come to the mass analyzer, the ions are separated according to their mass/charge and the
analyzers could be:
Electric or magnetic sector (could be together or not)
Quadrupole (Q) or triple quadrupole (QqQ)
Time of flight (TOF)
Ion trap (IT)
Quadrupole-time of flight (Q-TOF)
Mass spectrometry is the most popular technique in the field of metabolomics and LC-DAD-ESI-MS
starts to be used for screening of botanical metabolites. Harnly, 2007 reported a LC-DAD-ESI-MS
method for the identification of glycosylated flavonoids and other phenolic compounds and its versatility
to identify 78 compounds, eight subclasses, in fruits, beans and herbs.
1.3.3.2.3. ESI
In the process of electrospray formation, the sample dissolved in a volatile solvent passes through a
spray needle and high voltage is applied. The generated electric field produces oxidation-reduction
reactions in a way that the sample comes out as electrically charged droplets (figure 1.14). This
nebulization is assisted by the nebulizer gas flow, commonly N2 (Bruker Daltonics, 2008).
The solvent evaporates from the droplets formed (desolvation) and those will increase the density of
their electric charge. In consequence, the droplets shrink and the ions on the surface are forced to
approach to each other due to electrostatic field applied between the capillary exit and the entrance to
the mass spectrometer (Bruker Daltonics, 2008).

22
Figure 1.14: Representation of the formation of electrospray (Adapted from Bruker Daltonics, 2008).
At one point, the forces of repulsion become higher than the surface tension that keeps drops united in
spherical form and the droplets are broken. Because of Coulombic repulsion forces, the surface tension
of the droplets increases and they "explode" ("Coulomb explosion"), forming a series of charged droplets
that continue suffering processes of evaporation and subsequent explosions.
Finally, charged ions are formed and pass to gas phase with one or more charge and they are attracted
towards the entrance of the mass spectrometer in consequence of the voltage applied. In the ionization
process, ions mono-or multicharged could be formed allowing the detection of compounds with high
molecular weights in mass analyzers which work with limited range of m/z ratio.
The ionization could be in negative or in positive mode, forming [M-nH] n- by deprotonation or [M+nH]
n+ by protonation, respectively.
1.3.3.2.4. Q-TOF
The mass analyzers allow the separation of the previously formed ions in basis of different phenomena
depending on the type of analyzer with different resolution degrees, providing information on their
molecular mass.
One of these analyzers is the Quadrupole-Time-Of-Flight (Q-TOF) which has been seen as a powerful
and robust instrument with unique capabilities since it provides data which enable positive identification
by matching characteristics of the samples with standards or provisional identification based on
structural information for the compound subunits (Harnly, 2007). The rapid acceptance of these
instruments is mainly due to the combination of high sensitivity and mass accuracy for precursor and

23
product ions and also to the simplicity of operation for those familiar with LC/MS analysis on
quadrupole (Chernushevichet al., 2001).
This analyzer separates the ions according to different speeds in the tube of flight according to their m/z
ratio. The ions are extracted from the ionization chamber and accelerated towards the flight tube by an
electrostatic field which gives them a high kinetic energy. The ions with higher m/z will "fly" at a slower
rate than ions with lower m/z so the resolution between ions of different m/z is as better as the tube
length is longer and as lower is the dispersion of the initial kinetic energy between ions. The follow
figure exemplifies the Q-TOF equipment (Figure 1.15):
Figure 1.15: Schematic representation of a Q-TOF (Bruker Daltonics, 2008).
The sample gets in the nebulizing camera and there happens the formation of the spray. The formed ions
pass through the unit of desolvation, which separates the areas with atmospheric pressure from the first
area of vacuum and has a heater of the drying gas and a glass capillary.
Then the ions pass to the area of transmission of optical transfer that is composed by three parts in
vacuum and are separated by funnels (concentric rings stacked in form of funnel) that prevent the loss
of ions during the transmission ionic, increasing the intensity.
The ions are transferred by the hexopole to the more interesting part of the equipment, the quadrupole
where it’s possible to select certain ions to fragment in a collision chamber, with the help of a collision
gas normally N2, so the fragmentation pattern would be better and, consequently, the final mass spectra
improved.
24
After collision chamber the ions pass to the area of high vacuum while the lenses focus and direct them.
After that, the ions reach the area of orthogonal acceleration that accelerates the ions in the inside of the
fight tube, through an intermittent electric field (Bruker Daltonics, 2008).
According to their masses the ions are introduced to a greater or lesser extent in the reflector, behind it
there are areas of tension which repel the ions that come, as expected the smaller ions repel easier. This
reflector enables the correction of the initial dispersion of kinetic energies of the ions and
simultaneously, it doubles the effective length of the tube of flight since the ions have to go through it
twice until reaching the detector.
Finally, the detector converts an ion signal into an electrical signal and then it is transmitted to a digitizer,
which card is mounted in the computer. Modern detectors used in QTOF mass spectrometers are
designed as micro channel plate detectors; a microchannel plate assembly is a solid core with millions
of small pores that are internally coated with a semiconductive layer. These pores are called
microchannels and each of them works as an electron multiplier independently from the others (Bruker
Daltonics, 2008).
1.4. Kenaf
1.4.1. The origins of Kenaf
The Malvaceae family, native from east-central Africa (Tao et al. 2011) is known for its high levels of
cellulose within the stalk. The genus Hibiscus is typically used as an infusion or condimental herb but
it can also be used in traditional medicine as antidote to poisoning with chemicals and venomous
mushrooms (Maganha et al. 2010). This genus is very extensive with about 200 species, annual and
perennial; the United States department of Agriculture (USDA) presented the taxonomic status of the
species as shown in table 1.3.
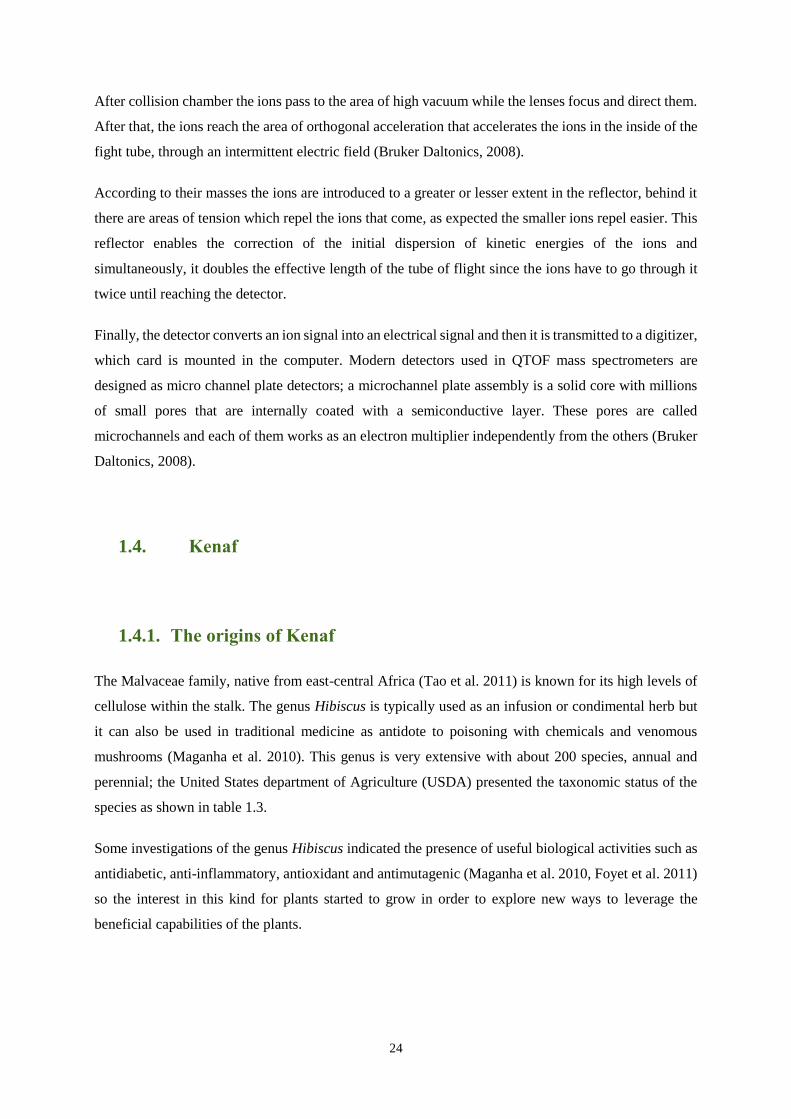
Some investigations of the genus Hibiscus indicated the presence of useful biological activities such as
antidiabetic, anti-inflammatory, antioxidant and antimutagenic (Maganha et al. 2010, Foyet et al. 2011)
so the interest in this kind for plants started to grow in order to explore new ways to leverage the
beneficial capabilities of the plants.

25
Table 1.3: Taxonomic status of Kenaf (Adapted from plants.usda.gov3 ).
Kingdom Plantae – Plants
Subkingdom Tracheobionta – Vascular plants
Superdivision Spermatophyta – Seed plants
Division Magnoliophyta – Flowering plants
Class Magnoliopsida
Subclass Dilleniidae
Order Malvales
Family Malvaceae – Mallow family
Genus Hibiscus L. – Rosemallow
Species Hibiscus cannabinus L. – Kenaf
One member of this genus is Hibiscus cannabinus L. (Figure 1.16) or Kenaf, the most common name,
that is an annual dicotyledonous herbaceous plant (Maganha et al. 2010) similar to cotton (Gossypium
hirsutum L.) and okra (Abelmoschu sesculentus L.) (Webber III, 1999), well known in Asia and Africa
while in Europe the production is not yet extensive and it is used for the extraction of fibers.
Figure 1.16: Kenaf (omafra.gov.on.ca4).
3http://plants.usda.gov/java/profile?symbol=HICA5, 19-06-2013, Granada, ES. 4http://www.omafra.gov.on.ca/CropOp/en/indus_misc/fibre/ken.html, 25-06-2013, Granada, ES.

26
1.4.2. Uses of Kenaf
Despite its use as a spice in some Asian countries, in Europe it appears in middle 90’s to be planted in
lands not used for food stocks and to produced fiber, although the whole plant could be used as a
profitable product, as shown in table 1.4.
Table 1.4: Utilities of different parts of Kenaf (Adapted from FAO1).
Uses of Kenaf
Main use Detailed use Used part
Material Fibres Bark
Food & beverage Seeds
Material Lipids/oil & fats Seeds
Food additive Condiment/seasoning Leaves
Fuels Fuelwood Entire plant
Animal food (feed) Seeds
Material Dye/tannin Bark
Fuels Petroleum substitutes/alcohol Seeds
It has been used for double panels, absorbent materials, strings, bags, wires, plastic biocomposites,
materials for thermochemical processes like combustion, gasification and pyrolysis for energy
production (ecocrop.fao.org3).
As said, this family is very rich in fibers and Kenaf is not an exception. Its fiber is similar to others from
vegetable steams like hemp or flax, the average fiber length is about 2.5 mm and its composition is
formed by cellulose (58 to 63%), hemicelluloses (21 to 24%) and lignin (12 to 14%). Compared with
the hemp, the presence of lignin may represent a negative factor in the elasticity of the fiber what makes
it less appropriated for textiles (Barbosa, 2010).
However, Kenaf is not used in its full potentials. Since the food sector is not paying much attention to
Kenaf’s leaves, the competition for water or land with food planting is not on the equation. As a result,
Kenaf is very resistant and in semi-arid conditions like those found in Mediterranean region, it reaches
significant levels of production only with a range of 250 to 400 mm of water, much less than those
required for traditional crops such as maize, sugar beets or alfalfa (Alexopoulou et al., 2009). Therefore,
it could be used as an important alternative crop in lands with poor or moderate water availability.
Furthermore, it needs relatively low nitrogen levels, 50 to 100 kg N ha-1 (Alexopoulou et al., 2009).
27
Taking all this into account, kenaf could be cultivated in rotation system what is important for lands
with just one type of cultivation such as cotton or cereals, helping the agriculture market as well.
1.4.3. Production of Kenaf
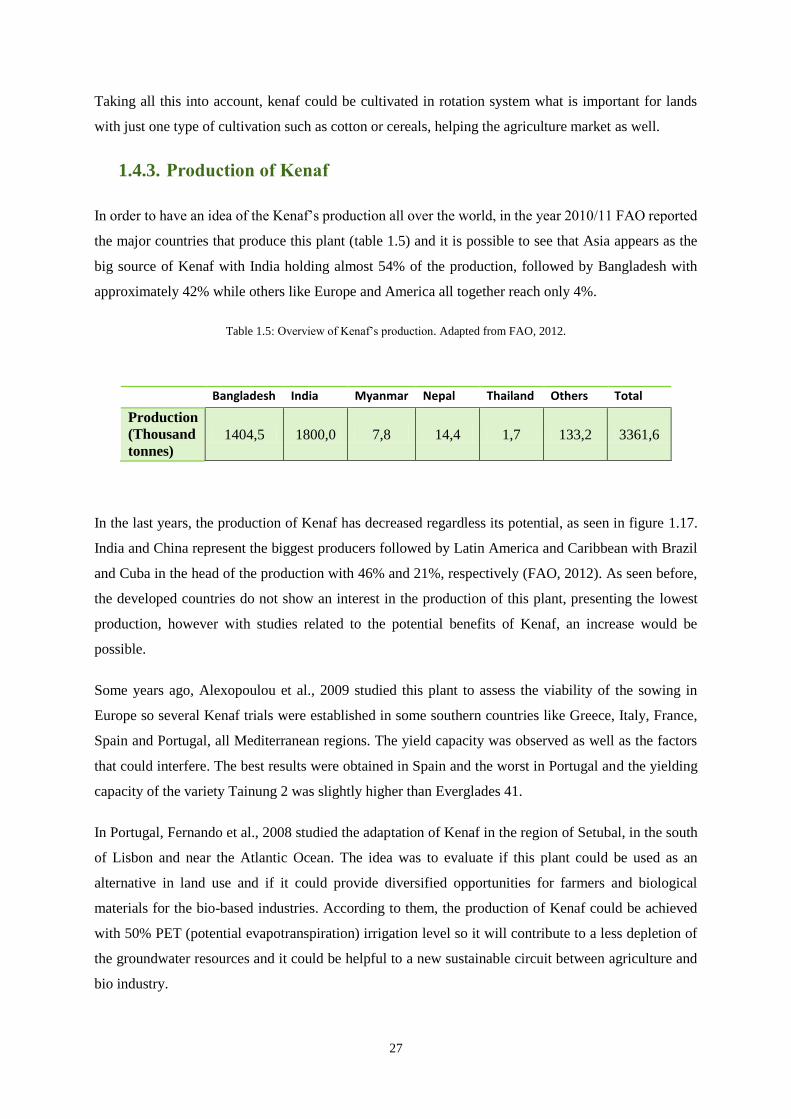
In order to have an idea of the Kenaf’s production all over the world, in the year 2010/11 FAO reported
the major countries that produce this plant (table 1.5) and it is possible to see that Asia appears as the
big source of Kenaf with India holding almost 54% of the production, followed by Bangladesh with
approximately 42% while others like Europe and America all together reach only 4%.
Table 1.5: Overview of Kenaf’s production. Adapted from FAO, 2012.
Bangladesh India Myanmar Nepal Thailand Others Total
Production
(Thousand
tonnes)
1404,5 1800,0 7,8 14,4 1,7 133,2 3361,6
In the last years, the production of Kenaf has decreased regardless its potential, as seen in figure 1.17.
India and China represent the biggest producers followed by Latin America and Caribbean with Brazil
and Cuba in the head of the production with 46% and 21%, respectively (FAO, 2012). As seen before,
the developed countries do not show an interest in the production of this plant, presenting the lowest
production, however with studies related to the potential benefits of Kenaf, an increase would be
possible.
Some years ago, Alexopoulou et al., 2009 studied this plant to assess the viability of the sowing in
Europe so several Kenaf trials were established in some southern countries like Greece, Italy, France,
Spain and Portugal, all Mediterranean regions. The yield capacity was observed as well as the factors
that could interfere. The best results were obtained in Spain and the worst in Portugal and the yielding
capacity of the variety Tainung 2 was slightly higher than Everglades 41.
In Portugal, Fernando et al., 2008 studied the adaptation of Kenaf in the region of Setubal, in the south
of Lisbon and near the Atlantic Ocean. The idea was to evaluate if this plant could be used as an
alternative in land use and if it could provide diversified opportunities for farmers and biological
materials for the bio-based industries. According to them, the production of Kenaf could be achieved
with 50% PET (potential evapotranspiration) irrigation level so it will contribute to a less depletion of
the groundwater resources and it could be helpful to a new sustainable circuit between agriculture and
bio industry.

28
Figure 1.17: Graphic representation of world production of Kenaf. Adapted from FAO, 2012 .
1.4.4. Kenaf Leaf
Kenaf produces simple leaves with jagged edges, which are positioned on the main stem (stalk) and
along the branches. The shape of the sheet is determined by the variety of the plant which can be divided
or whole. Varieties with divided leaves have three, five or seven lobes per sheet. Everglades-71,
Tainung-1 and Tainung-2 are examples of varieties with leaf divided. The varieties of whole leaf are
slightly lobed and heart-shaped, some examples are Everglades-41, Guatemala-4 and Guatemala-45
(Barbosa, 2010), shown in Figure 1.18.
Figure 1.18: Photograph of two types of Kenaf leaf: Everglades 41 and Tainung 2.
0,0
50,0
100,0
150,0
200,0
250,0
300,0
350,0
2006/07 2007/08 2008/09 2009/10 2010/11 2011/12
Tho
usa
nd
to
nn
es
World production of Kenaf
World
China
India
Latin America andCaribbean
Africa
Developed countries

29
The good properties of Kenaf leaves already had started to hold attention. A study (Lee et al. 2007)
shown that this plant could be able to modulate macrophage-mediated responses which could be good
for therapeutic uses. There are some references to the presence of 10 components like ethyl alcohol,
isobutyl alcohol, limonene, phellandrene, R-terpenyl acetate, citral, and other unidentified components
in kenaf from Egypt (Maganha et al, 2010). Bindhu and Umadevi, 2013 also reported that Kenaf it is
rich in calcium, iron, nitrogen, phosphorus and vitamin C.

30
1.5. Objective
The objective of this work was to identify and quantify the phenolic compounds on Kenaf’s leaves,
comparing variety Everglades 41 with Tainung 2. In order to accomplish this, a study of the best
extraction system took place and posterior study of the antioxidant capacity of the leaves by DPPH,
ORAC and Folin–Ciocalteu assays.
The identification of the phenolic compounds in the leaves was carried out using advanced analytical
techniques such as liquid chromatography coupled to electrospray ionization mass spectrometry using
quadrupole time-of-flight analyzers (HPLC-ESI-MS (Q-TOF)).

31
Chapter 2

32

33
2. Materials and Methods
All the extracts and measurements were done in triplicate.
2.1. Chemicals
All chemicals were of analytical reagent grade and used as received. The standards utilized, fluorescein,
trolox, Folin–Ciocalteau reagent, AAPH and DPPH were from Sigma-Aldrich (Steinheim, Germany);
methanol used for the extraction of the phenolic compounds was from Panreac (Barcelona, Spain);
acetonitrile from Lab-Scan (Dublin, Ireland), and acetic acid from Sigma–Aldrich (Steinheim,
Germany). Distilled water with a resistance of 18.2 M was deionized in a Milli-Q system (Bedford, MA,
USA).
2.2. Plant samples
Kenaf (two varieties, Everglades 41 and Tainung 2) was planted in May and harvested in September
2005 at FCT-UNL, Portugal, before flowering. The leaves were then dried at 70ºC and stored in the dark
at room temperature.
2.3. Plant extracts
Four different extraction protocols were tested. Two of them based on conventional solid-liquid
extraction (maceration) and other two based on ultrasound-assisted extraction using MeOH or a mixture
MeOH/H2O (80:20) as extracting solvents. 500 mg of Kenaf’s leaves, weighed by an analytical scale
Mettler Toledo AB204-s/fact, were milled in 15 mL of MeOH or MeOH/H2O (80:20), depending on the
protocol, by an electric mill, IKA®T18basic ultra-turrax. Then, there were applied the two different
methods of extraction of phenolic compounds: the overnight maceration and the ultrasound-assisted
extraction.
34
2.3.1. Overnight maceration
The mixture of sample and 15 ml of MeOH or MeOH/H2O (80:20) was maintained 12 h in the dark at
room temperature in a stir plate (Agimatic-N) (Adapted from Taamalli, 2012). The extracts were dried
in a rotary evaporator (Büchi R-200) at 40 ºC and then dissolved in 1 or 2ml of MeOH, depending on
the oil obtained. These solutions were filtered through a 0.45 µm syringe filter and saved at −20 ºC to
avoid any possible degradation until analysis.
2.3.2. Ultrasound-assisted extraction
To extract the phenolic compounds by ultrasound an adaption of the method used by Agbor, 2005 was
applied. The mixture of 15 ml of MeOH or MeOH/H2O (80:20) and sample was maintained for 2 h in
the ultrasound bath (Branson 3510) at room temperature. Then, samples were centrifuged for 15 min at
4000 rpm using a centrifuge (Labofuge 200, Heraeussepatech) to remove solids. The supernatants were
dried in a rotary evaporator at 40 ºC and then dissolved in 1 or 2 ml of MeOH, depending on the oil
obtained. These solutions were filtered through a 0.45 µm syringe filter and saved at −20 ºC to avoid
any possible degradation until analysis.
The pellet obtained after centrifugation was then utilized for 3 more cycles of extraction in the same
conditions and the liquid phases saved every time in a different tube.
2.4. Antioxidant assays
2.4.1. DPPH
The antioxidant capacity of Kenaf leaves extracts was determined by the DPPH radical scavenging
method, based on a procedure described by (Brand-Williams et al. 1995). Briefly, a solution was
prepared dissolving 19.7 mg of DPPH in 100 mL of MeOH to obtain the stock solution at 500 µM. This
stock solution was further diluted 1:10 with MeOH. Both solutions were stored at 4 ºC in dark bottles
until use.
Different concentrations of extracts were tested (10 to 120 ppm) in such a way that 20 μL of these
extracts solutions were added to 980 μL of DPPH diluted solution to complete the final reaction medium

35
(1 ml). After 4 h at room temperature in the dark, 200 μl of the mixture was transferred into a well of
the microplate, and the absorbance was measured at 516 nm in a microplate spectrophotometer reader
(BioTek). DPPH–methanol solution was used as a reference sample and the DPPH concentration
remaining in the reaction medium was calculated from a calibration curve. The percentage of remaining
DPPH against the extract concentration was then plotted to obtain the amount of antioxidant necessary
to decrease the initial DPPH concentration by 50% or Ec50.
2.4.2. ORAC
Other method applied to determine the antioxidant capacity was the ORAC assay, based on the method
described in Huang et al., 2002. A solution of fluorescein was prepared at a concentration of 56 nM and
kept at least 30 min at 37ºC before use. Trolox solution was also prepared at a concentration of 1mM to
make the calibration curve in a range from 1 to 13.5 μM. The extracts were tested in a range of
concentrations from 0.1 to 50 ppm. All solutions were diluted in a buffer solution consisting of NaH2PO4
0,2M + Na2HPO4 0,2M (20:80, v/v) at pH 7.4 and kept at 4ºC.
The ratios of different mixtures were added to the well of the microplate as shown in figure 2.1, firstly
without the radical AAPH which was added after 15 min at 37ºC in the microplate spectrophotometer
reader and then, fluorescence was read at 520 nm (excitation wavelength at 485 nm) during 3 h which
comprises 200 cycles with 8 s of orbital agitation.
Figure 2.1: Schematic illustration of the microplate in the ORAC assay.
36
2.4.3. Folin-Ciocalteu
The total phenolic content was estimated in the extracts as gallic acid equivalents (GAE), expressed as
mg gallic acid/g Sample according to the Folin–Ciocalteau method, based on a procedure described by
Herrero et al. (2011). 10 μL of sample (3000 ppm) and 600 μL of H2O were mixed and 50 μL of Folin–
Ciocalteau reagent was added, and after 10 min 150 μL of Na2CO3 20% (w/v) and 19 μL of H2O were
added. After 2h of incubation at room temperature in the dark, 200 μL were transferred into a well of
the microplate and the absorbance was measured at 760 nm in a microplate spectrophotometer and
compared to the gallic acid calibration curve (from 25 to 2000 ppm) elaborated in the same way,
substituting the sample by gallic acid.
2.5. HPLC-ESI-QTOF-MS analyses
HPLC analyses were made using an Agilent 1200 Series Rapid Resolution LC system (Agilent
Technologies, Palo Alto, CA, USA), equipped with a vacuum degasser, an autosampler, a binary pump
and a Diode Array Detector (DAD). The column used for the chromatographic separation was a Zorbax
Eclipse Plus C18 (1.8 μm, 150 mm×4.6 mm) (Agilent Technologies, Palo Alto, CA, USA).
The conditions consisted of a gradient elution using aqueous acetic acid 0.5% (v/v) as mobile phase A
and MeOH as phase B at a flow rate of 0.5 ml/min. The following gradient was applied: 0-7 min, 5-30%
B; 7-65 min, 30-95% B; 65-67 min, 95-5% B and 67-75 min, 95-5% B. With 5 μLof sample injected.
HPLC system was coupled to microTOF-Q II (Bruker Daltonik, Bremen, Germany) equipped with an
ESI interface operating in negative ion mode, considering a mass range of 50–1100 m/z and using a
capillary voltage of +4000 V; dry gas temperature, 210 ºC; dry gas flow, 8.0 l/min; nebulizer pressure,
2.0 bar; and spectra rate 1 Hz. The flow delivered into the MS detector from HPLC was split using a
flow splitter 0.5 for stable electrospray ionization and reproducible results.
Moreover, automatic MS/MS experiments were performed adjusting the collision energy values as
follows: m/z 100, 20 eV; m/z500, 25 eV; m/z 1000, 30 eV; and using nitrogen as the collision gas. For
the necessary mass accuracy to identify compounds, external instrument calibration was used, for this,
the calibrant used was sodium acetate clusters consisting of 5 mM sodium hydroxide and water: 2-
propanol 1:1 (v/v) with 0.2% of acetic acid. This calibrant solution was injected in the instrument at the
beginning of the run using a 74900-00-05 Cole Palmer syringe pump (Vernon Hills, IL, USA) directly
connected to the interface, equipped with a Hamilton syringe (Reno, Nevada, USA). The accuracy of
the mass data for the molecular ions was controlled by Data Analysis 4.0. Software (Bruker Daltonik)
that offers a list of possible elemental formulas by using the GenerateMolecularFormulaTMEditor. The

37
Editor uses a CHNO algorithm, which provides standard functionalities such as minimum/maximum
elemental range, electron configuration, and ring-plus double-bond equivalents, as well as a
sophisticated comparison of the theoretical with the measured isotope pattern (sigma value) for
increased confidence in the suggested molecular formula.

38
Chapter 3

39

40
3. Results and Discussion
3.1. Extraction method
To determine the best extraction methodology of phenolic compounds from kenaf leaf the two methods
were tested, three ultrasound-assisted extractions and the overnight maceration, both cases with 100%
and 80% of methanol. The respective concentrations of the obtained extracts were in Appendix 6.1, the
percentage of extraction in each case was evaluated based on the ratio between the concentration of each
extraction (mg extract/ml dissolution) and the summation of all extractions (Table 3.1).
Table 3.1: Percentage of extraction in each experiment, 1st, 2nd and 3rd ultrasound-assisted extraction.
100% MeOH 80% MeOH
% Ultrasound
Extraction
Ultrasound
Extraction
1st 2nd 3rd 1st 2nd 3rd
Tainung 2 88,00 9,00 3,00 67,50 27,30 5,20
Everglades
41 77,40 13,80 8,80 79,70 15,50 4,80
As seen in both cases (Tainung 2 and Everglades 41) the percentage of extraction was higher in the first
one, extracting more than 50% of mass, followed by the second and the third, giving reason to believe
that probably a major quantity of the main components were obtained in the first extraction, anyway the
second and third extraction weren’t a waste.
In the Tainung 2 case the first extraction showed a better result with 100% MeOH than with 80% while
in the second and third extraction the experiments with 80% MeOH showed better results. In the
Everglades case the first and second extractions showed similar behavior with 100% and 80% of MeOH
while in the third extraction the experiment with 100% was better than with 80%.
Another fact that was to take into account, the raw material was very fibrous, it wasn’t possible to be
sure that was homogenous. If in this point of sample collection the fiber was taken in more quantity than
the soft part of the leave then the percentage of extraction wouldn’t be so efficient.
In order to seen which method of extraction was better to obtain the phenolic compounds, the following
step was to search for its antioxidant capacity, with the data provided by Folin–Ciocalteau and DPPH
assay, showed in table 3.2 were all the results were referent to the initial sample of Kenaf leaf.

41
Table 3.2: Results of Folin-Ciocalteau (EAG (mg)/Sample (g)) and DPPH (Ec50) assay for Everglades 41 and Tainung 2,
both ultrasound-assisted and maceration systems.
Everglades
41
Extraction
100%
MeOH
Maceration
100%
MeOH
Extraction
80%
MeOH
Maceration
80% MeOH
1 2 3 1 2 3
Folin–
Ciocalteau
13,67 3,06 0,74 15,08 19,26 3,40 0,43 43,56
DPPH
Ec50
41,68 45,12 53,60 63,11
Tainung 2
Extraction
100%
MeOH
Maceration
100%
MeOH
Extraction
80%
MeOH
Maceration
80% MeOH
1 2 3 1 2 3
Folin–
Ciocalteau
9,64 0,86 0,37 10,17 19,17 1,98 0,49 8,69
DPPH
Ec50
37,69 38,96 51,62 37,62
In terms of the DPPH assay, the Ec50 was used to compare the antioxidant activity of the samples.
Following the analysis done by Brand-Williams et al., 1995, a lower value of Ec50 indicate a small
quantity of sample needed to neutralize the radical DPPH, according to that a sample with high
antioxidant capacity will present a lower Ec50 value. The time of reaction was also studied once that
according to Alves et. al, 2010 this a parameter taking into consideration, was observed that after 1h of
reaction this wasn’t complete, longer times of incubation under room temperature and in the dark were
tested and established that after 4h the reaction was completed and it was possible to make a more
accurate interpretation of the data.
Focusing of table 3.2 the extractions at 100% MeOH presented a lower Ec50 than the extractions at 80%
in both leaf cases, which indicate that with a solution only of methanol and this type of extraction the
efficiency of the reaction with the radical DPPH was better.
When the macerations were observed we can distinguish two ways, comparing only the Everglades case,
the Ec50 of the macerations was higher with 100% MeOH and with 80% comparing with the extractions.
While in the Tainung 2 case the maceration at 100% MeOH showed a value of Ec50 very close to the
extraction also with 100% MeOH, in the maceration with 80% MeOH it showed a lower value than the
extraction.

42
On the other hand comparing Tainung 2 and Everglades 41, the macerations of the Tainung 2 leave
showed better results than the Everglades 41 leave, especially in the maceration with 80% MeOH in
which Everglades 41 presented an Ec50 of 63, the highest value. Analysing just the results of the DPPH
assay we could say that Tainung 2 as a better antioxidant capacity than Everglades 41. In order to better
understand how the total phenolic content of the Kenaf leaves, the results from the Folin–Ciocalteu
method will be analyzed.
In each extraction the results were steady, the first extraction showed always better results followed by
the second extraction and then the third. In the Everglades 41 case, comparing the Folin–Ciocalteu
between the 100% extractions and the 80%, the first extraction at 80% showed a better result and the
second and third ones appeared to be very close, nevertheless the difference in values between the first
extraction to the second and third was high, which indicated that the majority of phenolic compounds
were extracted in the first extraction and a small amount in the second and third.
In relation to the Tainung 2 leafs the behavior of the extractions appeared to be similar to the Everglades
41 case, except in the first extraction at 100% MeOH that it showed a lower value.
Comparing the Folin–Ciocalteu results of the macerations, the values didn’t show similarities and the
maceration at 80% of MeOH in the Everglades 41 case appeared to be very high in relation to the others,
this result was also contradictory to the result of DPPH, as seen this maceration as a very high value of
Ec50 which pointed to a low antioxidant capacity so it wasn’t probable such a high value of phenolic
content.
The Folin-Ciocalteu results aren’t very trustworthy once that, as explained in the section 1.1.4, other
substances like sugars, aromatic amines, sulphur dioxide, organic acids and bases can react with the
Folin–Ciocalteu reagent (Ramirez-Sanchez et al., 2010). So it was useful to give an idea of the amount
of phenolic compounds, nevertheless it can’t be said with all sure that those values translate correctly
the phenolic content of the samples.
The lake of stability in the results could be explained by the method itself once that the maceration takes
place during 12 h at room temperature in a stir plate which could lead to an uncontrolled temperature or
was possible that the stir wasn’t homogeneous, another possibility to take in count was the time of the
experiment that could be too much and some products of degradation could appeared and alter the results
of antioxidant activity and phenolic contents.
Taken all the experiments in account, in order to be more certain of the results and because they appeared
to be more trustworthy, the extractions at 100% MeOH were chosen as a better method for the
quantification of phenolic compounds, and as seen the three extraction were still extracting compounds,
because of that the next step was to combine the three of them, collecting the product of each one to the

43
same falcon tube, then dried in a rotary evaporator and analyze the product of the three extractions
together (The respective concentrations of the obtained extracts were in Appendix 6.2). The results were
exposed in table 3.3 and were denominated by successive extraction.
Table 3.3: Results of Folin-Ciocalteu (EAG (mg)/Sample (g)), DPPH (Ec50) and ORAC (μmol Trolox/mg sample) assay for
Everglades 41 and Tainung 2, successive extractions (complete data in appendix 6.3).
Everglades 41 Sucessive Extraction
Folin–Ciocalteau 26,40
DPPH Ec50 27,33
ORAC 1273,7
Tainung 2 Sucessive Extraction
Folin–Ciocalteau 18,67
DPPH Ec50 43,00
ORAC 307,54
In relation to the other methods tested, overall the Everglades 41 type showed better results than the
Tainung 2, especially when it comes to DPPH and ORAC values. Giving a closer look to the data
provided by the Folin-Ciocalteu assay the Everglades 41 showed a better result, so quantitatively this
type appeared richer that Tainung 2 and for this it made sense that the Ec50 of the Everglades type
showed a lower result once that if it has more content in phenolic compounds it will have a better
antioxidant capacity.
In order to better understand the antioxidant capacity of the sample, the ORAC assay was performed, in
this assay, according to Huang et al., 2002 the antioxidant capacity is translated by the equivalents of
Trolox, expressed in μmol, per unit of mass of sample, in this case it was presented in milligrams of
leaf.
The previous results on table 3.3 were confirmed; in this method the Everglades 41 case also has a
superior result than Tainung 2, so if it has a higher ORAC result then it has a higher quantity of
equivalents of Trolox implying a better antioxidant capacity of the sample.
In their study, Alves et. al, 2010 pointed out that the compounds that presented a higher number of OH
substitutions show better activity in this assay, also referred the importance of the kaempferol and
quercetin once that between compounds with similar structures the antioxidant activity will be
proportional to the number of OH substitutions. So considering this theory, it was expected that the
samples were rich in substituted molecules with OH and the presence of some kaempferol and quercetin
derivatives.

44
3.2. HPLC-ESI-QTOF-MS analyses of Kenaf leaf
In order to identify the phenolic compounds in Kenaf the following HPLC/ESI-QTOF-MS
chromatogram was obtained and interpreted.
Figure 3.1: Base peak chromatogram (50–1100 m/z) of Everglades 41, in which the peaks are identified with numbers (1-47)
according to the order of elution.
The interpretation of the MS and MS/MS spectra of each peak (figure 3.1) in comparison with those
found in the literature, SciFinder data-base for chemical compounds and mass spectra data-bases such
as Metlin, Metfrag and MassBank, was the main tool for identification of phenolic compounds.
The following table 3.4 shows the list of compounds identified in Everglades 41 type of leave, along
with their retention time (RT) (min), the experimental mass of each compound, molecular formula,
accurate mass of each molecular formula, the error (ppm) between both masses, the MS/MS ions used
for the identification and proposed compounds. It also contains the mSigma value that is a numerical
value that indicates how similar the theoretical and measured isotopic patterns are, in such a way that a

45
low mSigma value indicates that the measured isotopic pattern of the peak is very similar to the
theoretical isotopic pattern for the proposed molecular formula. The tolerance in the mSigma value is
usually established at 50, although it is influenced by co-eluting analytes or matrix compounds, so it
may be higher in some cases. In this table there is also the correspondent peak, for each compound, in
the type Tainung 2 or the absence of that compound.
Table 3.4: List of compounds of Everglades 41 and its presence/absence in type Tainung 2.
Beginning with the analyses of the peaks in the table 3.4, peaks 1 and 2 were proposed to be derivatives
from citric acid. Peak 1 was proposed to be hydroxycitric acid also reported in Hibiscus sabdariffa
Peak RT
(min)
m/z
experime
ntal
Molecular
formula
m/z
calculated
Abslute
Error
(ppm)
mSigma
value
MS/MS
Fragments
(%intensity)
Proposed
compound
Tainun
g 2 -
Peaks
1 3.7 207.0140 C6H8O8 207.0146 2.5 4.5
127,0022 (100)
115,0035(41.3)
133,0124(28.2)
189,0026(10.9)
Hydroxycitric acid
2
2 5.4 221,0294 C7H10O8 221,0303 4.1 2.0
127,0033(100)
103,0026(17.8)
189,0036(10.4) Methoxycitric acid 3
4 11.2 353,0892 C16H18O9 353,0878 2.7 23.2
191,0561(100)
179,0367(28.1)
135,0447(18.5)
Chlorogenic acid
isomer 1 5
5 11.6 353,0904 C16H18O9 353,0878 7.2 13.7
191,0562(100),
179,0351(71.7)
135,0453(30.3)
Chlorogenic acid
11
11 14.0 353,0876 C16H18O9 353,0878 0.3 1.8 191,0563(100) Chlorogenic acid
isomer 2
13 14.6 353,0889 C16H18O9 353,0878 3.0 2.5
173,0455(100)
191,0563(94.7)
179,0355(81.6)1
35,0452(41.6)
Chlorogenic acid
isomer 3:
Cryptochlorogenic
acid (4-
caffeoylquinic
acid)
12

46
15 16.4 353,0868 C16H18O9 353,0878 2.7 3.3 191 (100) Chlorogenic acid
isomer 4 14
17 17.0 337,0915 C16H18O8 337,0929 4.2 18.6
191,0561(100)
163,0397(12.6)
173,0041(11.0)
Coumaroylquinic
acid 15
19 17.7 367,1023 C17H20O9 367,1035 3.2 5.8
191,0558(100)
173,0454(17.6)
193,0498(17.2)
Feruloylquinic
acid 17
21 18.4 463,2176 C21H36O11 463,2185 1.9 4.3
179,0553(100)
113,0236(59.9)
403,1946(52.2)
161,0416(49.4)
119,0342(38.2)
101,0235(36.1)
223,1339(32.5)
149.0445(24)
131,0339(18.3)
143,0363(16.4)
[butoxy-hydroxy-
methyl-trihydroxy-
(hydroxymethyl)ox
an]-oxy-
hexahydro-
cyclopenta[c]pyran
-yl] acetate.
18
23 19.5 593,1504 C27H30O15 593,1512 1.4 5.0
285,0410(100)
447,0936(64.5)
431,0981(18.9)
286,0426(16.6)
Kaempferol-
glucoside-
rhamnoside
19
27 21.2 609.1433 C27H30O16 609.1461 4.6 8.3
462,0798(50.5)
463,0873(26.6)
317,0277(4.5)
hexahydroxyflavon
e-rhamnoside
28 22.0 609,1449 C27H30O16 609,1461 1.9 1.5
446,0845(49,7)
447,0909(43.3)
463,0872(13.5)
301,0347(5.7)
Quercetin-
glucopyranosyl-
rhamnopyranoside
22
30 24.1 593.1491 C27H30O15 593.1512 3.5 13.6
447,0931(100)
430,0905(50.8)
431,0936(28.7)
285.0400(8.7)
Kaempferol-
galactoside-
rhamnoside isomer
24
31 24.9 593, 1514 C27H30O15 593, 1512 0.6 14.1
431,0971(80.1)
430,0898(64.7)
447,0920(45.9)
285,0410(21.9)
Kaempferol-
galactoside-
rhamnoside isomer
2
25
32 25.8 563,1429 C26H28O14 563,1406 4.0 14.9
430,0898(100)
431,0963(76.3)
285,0401(22.1)
417,0812(11.8)
Kaempferol-
rhamnoside-
xyloside
26
33 26.3 463,0875 C21H20O12 463,0882 1.6 5.1 300,0274(100)
301,0339(50.8) Isoquercitrin 27
35 28.5 577,1604 C27H30O14 577,1563 7.1 39.7
431,0970(100)
430,0895(42.1)
285,0402(33.7)
Kaempferitrin
29
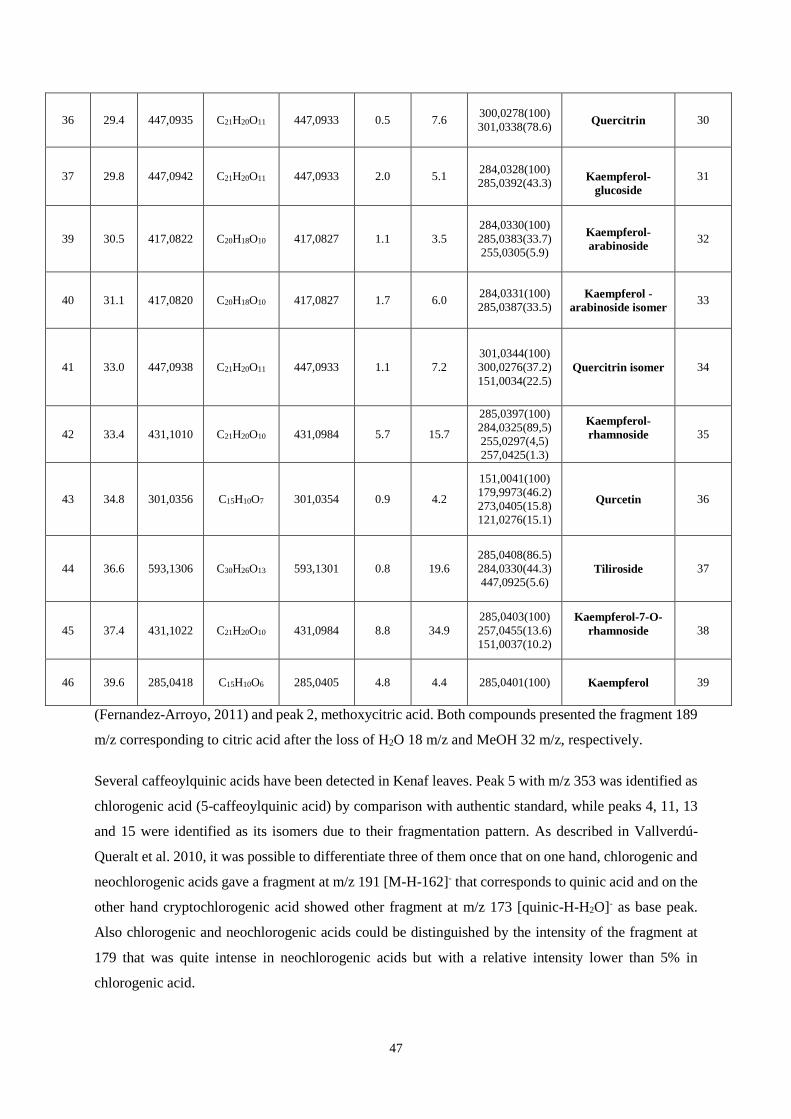
47
(Fernandez-Arroyo, 2011) and peak 2, methoxycitric acid. Both compounds presented the fragment 189
m/z corresponding to citric acid after the loss of H2O 18 m/z and MeOH 32 m/z, respectively.
Several caffeoylquinic acids have been detected in Kenaf leaves. Peak 5 with m/z 353 was identified as
chlorogenic acid (5-caffeoylquinic acid) by comparison with authentic standard, while peaks 4, 11, 13
and 15 were identified as its isomers due to their fragmentation pattern. As described in Vallverdú-
Queralt et al. 2010, it was possible to differentiate three of them once that on one hand, chlorogenic and
neochlorogenic acids gave a fragment at m/z 191 [M-H-162]- that corresponds to quinic acid and on the
other hand cryptochlorogenic acid showed other fragment at m/z 173 [quinic-H-H2O]- as base peak.
Also chlorogenic and neochlorogenic acids could be distinguished by the intensity of the fragment at
179 that was quite intense in neochlorogenic acids but with a relative intensity lower than 5% in
chlorogenic acid.
36 29.4 447,0935 C21H20O11 447,0933 0.5 7.6 300,0278(100)
301,0338(78.6) Quercitrin 30
37 29.8 447,0942 C21H20O11 447,0933 2.0 5.1 284,0328(100)
285,0392(43.3)
Kaempferol-
glucoside
31
39 30.5 417,0822 C20H18O10 417,0827 1.1 3.5
284,0330(100)
285,0383(33.7)
255,0305(5.9)
Kaempferol-
arabinoside 32
40 31.1 417,0820 C20H18O10 417,0827 1.7 6.0 284,0331(100)
285,0387(33.5) Kaempferol -
arabinoside isomer 33
41 33.0 447,0938 C21H20O11 447,0933 1.1 7.2
301,0344(100)
300,0276(37.2)
151,0034(22.5)
Quercitrin isomer 34
42 33.4 431,1010 C21H20O10 431,0984 5.7 15.7
285,0397(100)
284,0325(89,5)
255,0297(4,5)
257,0425(1.3)
Kaempferol-
rhamnoside
35
43 34.8 301,0356 C15H10O7 301,0354 0.9 4.2
151,0041(100)
179,9973(46.2)
273,0405(15.8)
121,0276(15.1)
Qurcetin 36
44 36.6 593,1306 C30H26O13 593,1301 0.8 19.6
285,0408(86.5)
284,0330(44.3)
447,0925(5.6) Tiliroside 37
45 37.4 431,1022 C21H20O10 431,0984 8.8 34.9
285,0403(100)
257,0455(13.6)
151,0037(10.2)
Kaempferol-7-O-
rhamnoside
38
46 39.6 285,0418 C15H10O6 285,0405 4.8 4.4 285,0401(100) Kaempferol 39

48
So with all these facts in count the peak 4 was established as neochlorogenic acid (3-caffeoylquinic acid)
and the peak 13 as cryptochlorogenic acid (4-caffeoylquinic acid). The peaks 11 and 15 were other
isomers with a fragmentation pattern more similar to chlorogenic and neochlorogenic acids than
cryptochlorogenic acid but it wasn’t defined were the substitution occurs.
Peak 28 at m/z 609 was identified as a quercetin-glucopyranosyl-rhamnopyranoside. There were two
possible losses, hexose or rhamnose so they correspond to the fragments observed at m/z 447 [M-H-
162]- and 463 [M-H-146]-, as reported in Kerhoas et al., 2006, there is observed also a fragment at m/z
301 corresponding to the quercitin nucleus after the cleavage of the two sugars.
Peak 27 also with m/z 609, presented the molecular formula C27H30O16 like peak 28 and fragment at m/z
463 [M-H-146]-, nevertheless it presented a fragment at m/z 317 instead of 301 which indicates that the
substitution is a rhamnose but the flavonoid core is not quercetin. The proposed molecular formula of
this core was C15H9O8, so this compound was proposed to be a hexahydroxyflavone-rhamnoside.
Kaempferol derivatives are major constituents of Everglades 41, such in a way that elution after 20 min
shown many derivatives and with strong intensity. Kaempferol (figure 3.2) is a multiply-substituted
flavonoid aglycone with different possibilities of substitution.
Figure 3.2: Basic structure of kaempferol, principal fragmentation routes and sites of substitution (X, Y, and Z).
Peaks 23, 30 and 31 were isomers with m/z 593 and their fragmentation patterns were very similar with
differences between the relative intensities of the peaks, so all were proposed to be isomers of
kaempferol-galactoside-rhamnoside.
So analyzing the fragments one by one, the fragment at m/z 431 was proposed to be the core kaempferol
with a galactoside substitution after losing the rahmnoside moiety and the fragment at m/z 430 the some
substituted kaempferol but deprotonated, while the fragment at m/z 447 appears also to be the
kaempferol with the galactoside but the fragmentation of the rahmnose occurred differently, given origin

49
to a fragment with higher m/z ratio. The fragmentation also allowed identifying kaempferol core at m/z
285.
Different stereochemistry of the kaempferol-galactoside-rhamnoside molecule could influence different
fragmentation patterns, to distinguish the conformation of the molecules other analysis were necessary
like NMR, anyway based on the information given by the utilized method it was possible to compare
the different isomers.
The peak 23 showed, with higher relative intensity, the fragments at m/z 285 and 447 (100% and 64.5%,
respectively) and with lower relative intensity the fragment at m/z 431 (18.9%). However, in the case
of peak 31 the fragment at m/z 431 showed to be the main fragment (80.1%) while the ion at m/z 447
presented lower intensity (45.9%), in opposite to peak 30 that showed the fragment 447 as base peak
and the 431 with 28.7%.
So according to figure 3.3, the kaempferol-galactoside-rhamnoside of peaks 23 and 30 could break
preferably according to pathway b while the compound of peak 31 according to pathway a.
Moving to the peaks 35 and 46, they were identified as kaempferitrin (m/z 577) and kaempferol (m/z
285), respectively. In relation to kaempferol it was identified by comparison with its standard.
Kaempferitrin showed a fragment at m/z 431 corresponding to the loss of a desoxyhexose molecule
(Kerhoas et al., 2006) and another fragment at m/z 285 originated by the loss of the two desoxyhexose
moieties and remaining the kaempferol core. These two phenolic compounds have been already reported
as constituents of kenaf’s leaves by HPLC-FTIR analyses in Rho et al., 2010.
Peaks 33 and 36 were identified as isoquercitrin and quercitrin, respectively, by comparison with their
standards.

50
b
Figure 3.3: Fragmentation of kaempferol-galactoside-rhamnoside, pathway a gives origin to fragment 430 m/z while pathway
b originates the fragment 447 m/z.
Peaks 37 and 41 presented the same molecular formula, nevertheless, the fragmentation pattern showed
some differences, the peak 41, identified as a quercitrin isomer (quercetin-rhamnoside) produced the ion
with m/z 301 (100% of relative probability) that corresponds to the core flavonoid quercetin
deprotonated, supported by some studies like Sánchez-Rabaneda et al., 2003; Kammerer et al., 2004.
The ion at m/z 300, [M-H-147]- mainly formed by the loss of the rhamnoside radical from the
deprotonated core quercetin.
For other side, peak 37 was identified as kaempferol-glucoside, based on the similarity of fragmentation
studied in Kammerer et al., 2004. This molecule showed the fragment 284 with 100% of relative
intensity suggesting the loss of the glycoside radical [M-H-163]- from the deprotonated core of
kaempferol, while the ion with m/z 285 corresponds to a depronated kaempferol. This compound was
identified in the genus Hibiscus (Hibiscus sabdariffa) by Peng et al., 2011.
OH
a

51
In relation to peak 43, data bases pointed to be quercetin. The study of fragmentation done by Febre et.
al, 2001 showed that the fragmentation pattern could be very complex but one of the ways the C ring
suffers a break, 1,3A by figure 3.2, gives origin to the fragment at m/z 151 (base peak of the MS/MS
spectrum). This study also pointed out a pattern in which the bonds 1 and 2 are broken (figure 3.2) and
a retrocyclization originates fragments at m/z 179 and 121, exemplified in figure 3.4.
Quercetin was also identified in the seedcake of Kenaf by Mariod et al., 2012 what reinforces the
possibility of its presence also in the leaf.
Figure 3.4: Example of the retrocyclisation that occurred in quercetin originating fragments at m/z 179 and 121, adapted from
Febre et. al, 2001.
Peak 45 with m/z 431 and molecular formula of C21H20O10 was primarily proposed to be a kaempferol-
rahmnoside with the tipycal loss of the rhamnoside substitution [M-H-146]- giving origin to the fragment
at m/z 285 (kaempferol core) with 100% of relative intensity.
Lu et al., 2009 studies of fragmentation of kaempferol-7-O-rhamnoside showed that this deprotonated
molecule suffers conventional heterolytic cleavage to a large scale yielding abundant 285 m/z fragment;
it was also observed a loss of [M-H-174]- that the same study assigned to the loss of CO by the aglycone
to yield an ion at m/z 257. The subsequent cleave of the C ring as exemplified in figure 3.2, 1,3A,
originated the fragment at m/z 151.
With the same molecular formula and m/z ratio appears the peak 42, nevertheless the fragment with m/z
257 showed very low relative intensity, suggesting that the position of the rhamnoside substitution is
different. Also the fragment at m/z 255 appears with low intensity, this could be due to the loss of COH•
by the ion at m/z 284, product of a homolytic cleavage (Lu et al., 2009).
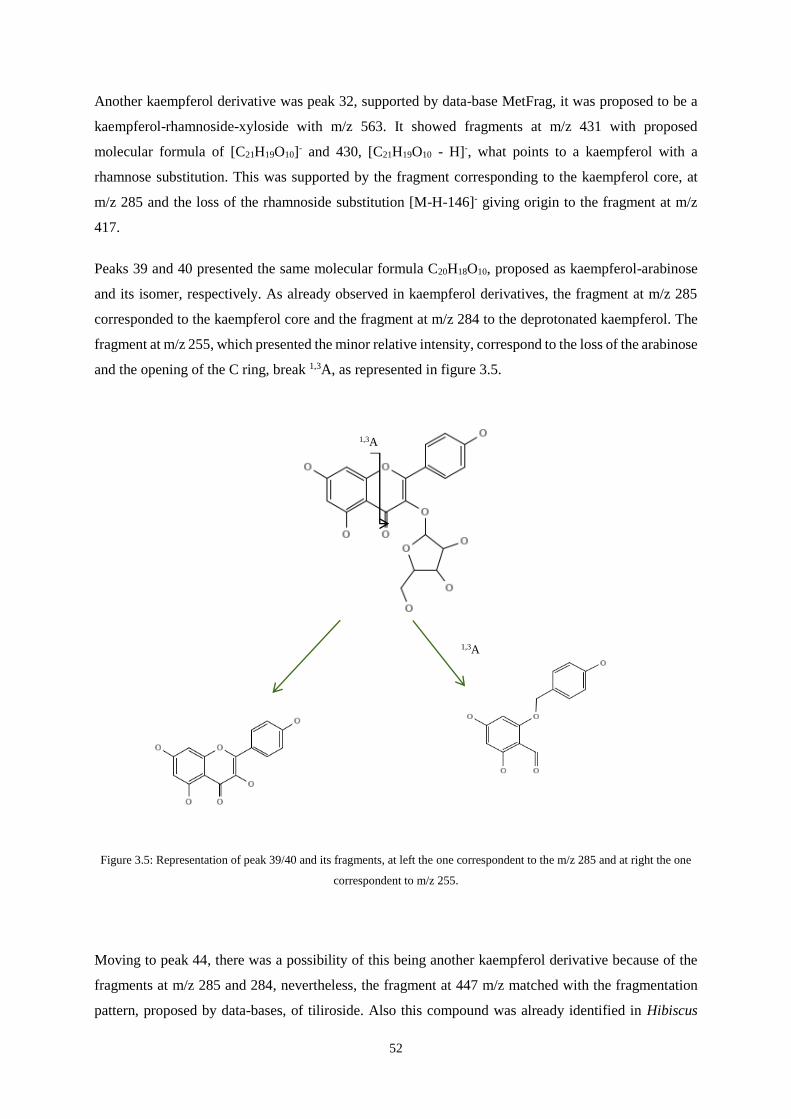
52
Another kaempferol derivative was peak 32, supported by data-base MetFrag, it was proposed to be a
kaempferol-rhamnoside-xyloside with m/z 563. It showed fragments at m/z 431 with proposed
molecular formula of [C21H19O10]- and 430, [C21H19O10 - H]-, what points to a kaempferol with a
rhamnose substitution. This was supported by the fragment corresponding to the kaempferol core, at
m/z 285 and the loss of the rhamnoside substitution [M-H-146]- giving origin to the fragment at m/z
417.
Peaks 39 and 40 presented the same molecular formula C20H18O10, proposed as kaempferol-arabinose
and its isomer, respectively. As already observed in kaempferol derivatives, the fragment at m/z 285
corresponded to the kaempferol core and the fragment at m/z 284 to the deprotonated kaempferol. The
fragment at m/z 255, which presented the minor relative intensity, correspond to the loss of the arabinose
and the opening of the C ring, break 1,3A, as represented in figure 3.5.
Figure 3.5: Representation of peak 39/40 and its fragments, at left the one correspondent to the m/z 285 and at right the one
correspondent to m/z 255.
Moving to peak 44, there was a possibility of this being another kaempferol derivative because of the
fragments at m/z 285 and 284, nevertheless, the fragment at 447 m/z matched with the fragmentation
pattern, proposed by data-bases, of tiliroside. Also this compound was already identified in Hibiscus
1,3A
1,3A

53
sabdariffa (Peng et. al, 2011) and mutabilis (Shanker et. al, 2007) so it is possible that another species
of Hibiscus, such as Hibiscus cannabinus, also has this compound.
In relation to the minor peaks appearing between minutes 15 and 22, it was possible to propose some
compounds. Peak 17 was proposed to be coumaroylquinic acid since the base peak of MS/MS spectrum
was a fragment at m/z 191, which presented the molecular formula [C7H11O6]- corresponding to quinic
acid. The other fragment related to this molecule presented a relative intensity of 12.6% and a molecular
formula [C9H7O3]- and m/z 163 corresponding to the coumaric acid. The last fragment at m/z 173 could
be explained by a loss of a water molecule from the quinic acid.
A similar compound was also identified in peak 19, with the fragment at m/z 191 as quinic acid and the
fragment at m/z 173 the same molecule but with a loss of H2O just like the previous case. The difference
between both compounds appeared in the absence of the fragment at m/z 163 and the appearance of the
fragment at m/z 193 with relative intensity of 17.2% and C10H10O4 as molecular formula, like ferulic
acid, these facts gave reason to propose this compound as feruloylquinic acid.
The peak 21 was proposed to be [butoxy-hydroxy-methyl-trihydroxy-(hydroxymethyl)oxan]-oxy-
hexahydro-cyclopenta[c]pyran-yl] acetate (figure 3.6), not yet proposed to be a component of the
Hibiscus genus. The fragments obtained by Data Analysis were found in this compound with the
exception of the fragment at 223 m/z.
Figure 3.6: Proposed compound for peak 21, IUPAC name: [butoxy-hydroxy-methyl-trihydroxy-(hydroxymethyl)oxan]-oxy-
hexahydro-cyclopenta[c]pyran-yl] acetate.
After analyzing the Everglades 41 list of compounds, it was demanding to compare with the Tainung 2
and one thing that was ease to observe was that the Tainung 2 chromatogram has fewer compounds than
the Everglades one, while the Everglades 41 chromatogram has 47 peaks, the Tainung 2 has 37, a total
difference of 10 compounds. It was also possible to see that between the 12 and 14 min and 16 and 22

54
min there were more compounds in the Everglades 41 chromatogram than in the Tainung 2, presented
in the following figure (figure 3.7).
Figure 3.7: Base peak chromatogram (50–1100 m/z) of Tainung 2, in which the peaks are identified with numbers (1-37)
according to the order of elution.
Nevertheless it was possible to find in the list of compounds of Tainung 2 (table 3.4), the majority of
compounds found in the Everglades 41 list, with a few exceptions like the isomer 2 of chlorogenic acid
(peak 11 of Everglades 41 chromatogram) that wasn’t possible to find in the Tainung 2 one.
The peaks from the Everglades 41 chromatogram are also slightly more intense than the Tainung 2, but
the of proportion of the intensity inside each chromatogram is similar, for example, peaks 30 and 31 of
Everglades 41 chromatogram showed a similar difference of intensity as it’s correspondents in the
Tainung 2 chromatogram, the peaks 22 and 23. As the major difference between the two chromatograms,
in the Tainung 2 one the peak 27 proposed as kaempferitrin is more intense than in the Everglades 41
(peak 35).
Thinking about the results obtained before, of the antioxidant activity and the total phenolic content,
which were better results for Everglades 41 leaf, it made sense that in the Everglades 41 case the
chromatogram appeared with more compounds and with peaks more intense (with the kaempferitrin
exception).

55

56
Chapter 4

57

58
4. Conclusion
Considering the objectives for this work, that were to identify and quantify the phenolic compounds on
Kenaf’s leaves, comparing variety Everglades 41 with Tainung 2, and for that different extraction
systems were tested, the antioxidant assays were carried out and then the identification of the phenolic
compounds in the leaves, using advanced analytical techniques such as liquid chromatography coupled
to electrospray ionization mass spectrometry using quadrupole time-of-flight analyzers (HPLC-ESI-MS
(Q-TOF)). It can be stated that the objectives were accomplished.
The extraction system evaluated to be the best was the ultrasound-assisted extraction with 100% MeOH,
the results of Folin–Ciocalteau, DPPH and ORAC pointed to Everglades 41 type to have more
antioxidant potential and more phenolic contents.
After analyzing the HPLC/ESI-QTOF-MS chromatogram of Everglades 41 and Tainung 2 leaf, the one
from Everglades 41 appeared to be richer in phenolic compounds, presenting 47 compounds against 37
from Tainung 2. Despite the fact that not all the compounds were identified, it was possible to propose
28 compounds for the Everglades 41 type and 26 of those compounds were also proposed to be in the
Tainung 2 type.
Some of the compounds found in the Kenaf leaf were related before with the Hibiscus genus,
nevertheless this study was a step forward for the comprehension of the phenolic compounds of Kenaf
leaf.
It is important to reinforce the idea that this study was made also with the purpose to search for a
candidate of a future add to food. Once that Kenaf is a source of antioxidants it could be seen as a
possible candidate to grow in European countries and contribute with its phenolic compounds to a
healthier food.

59

60
References

61

62

63
Agbor, G. A., Oben, J. E., Ngogang, J. Y., Xinxing, C., Vinson, J. A., Antioxidant capacity of
some herbs/spices from Cameroon: A comparative study of two methods, J. Agric. Food Chem.
53, 2005, 6819-6824.
Akter, M. S., Ahmed, M., Eun, J., Solvent effects on antioxidant properties of persimmon
(Diospyros kaki L. cv. Daebong) seeds, International Journal of Food and Technology 45 2010,
2248-2264.
Alexopoulou, E. Cosentino, S.L., Danalatos, N., Venturi, G., Fernando, A.L., Tenorio, J.L.,
Cadoux, S., Veccheit, M., Kipriotis, E. (2009) Biomass Yields of kenaf in Europe: Effect of
site, year and cultural practices on yields. In: De Santi, G.F., Dallemand, J.F. Ossenbrink, H.,
Grassi, A., Helm, P. (eds) Proceedings of the 17th European Biomass Conference and
Exhibition, From Research to Industry and Markets. 29 June - 3 July 2009, Hamburg,
Germany, ETA-Renewable Energies and WIP-Renewable Energies, pp 138-141.
Alves, C.Q., David, J. M., David, J. P., Bahia, M. V., Aguiar, R. M., Métodos para determinação
de atividade antioxidante in vitro em substratos orgânicos, Quim. Nova. 2010; 33(10), 2202-
2210.
Annunziata, A., Vecchio, R., Functional foods development in the European market: A
consumer perspective, Journal of functional foods 3, 2011, 223-228.
Barbosa, B. M. G., Utilização de água residuais tratadas na irrigação de Kenaf (Hibiscus
cannabinus L.) – efeito do ião amónio, tese de doutoramento FCT-Unl, 2010.
Belitz, H. D., Grosch, W., Schieberle, P., Food Chemistry 4th Edition revised and extended
edition, Springer, 2009.
Bianchi, M., Antunes, L., Radicais livres e os principais antioxidants da dieta, Revista de
nutrição,12, 1999, 123-130.
Bindhu, M. R., Umadevi, M., Synthesis of monodispersed silver nanoparticles using Hibiscus
cannabinus leaf extract and its antimicrobial activity, Spectrochimica acta part A: Molecular
and biomolecular spectroscopy 101, 2013, 184-190.
Bisby, R. H., Brooke, R., Navaratnam, S., Effect of antioxidant oxidation potential in the oxygen
radical absorpition caparity (ORAC) assay, Food Chemistry 108 2008, 1002-1007.
Brand-Williams, W., Cuvelier, M. E., Berset, C., Use of a free radical method to evaluate
antioxidant activity, Lebensm-wiss u-technol 28 1995, 25-30.
Bravo, L., Polyphenols: Chemistry, dietary sources, metabolism and nutritional significance,
Nutrition reviews, 56, 1998, 317-333.
Bruker Daltonics, Manual U. micrOTOF-Q II. 2008;0 (October).
Buonocore, G., Perrone, S., Tataranno, M. L., Oxygen toxicity: chemistry and biology of
reactive oxygen species, Seminars in fatal & neonatal medicine 15, 2010, 186-190.

64
Cicco, N., Lanorte, M. T., Paraggio, M., Viggiano, M., Lattanzio, V., A reproducible, rapid and
inexpensive Folin-Ciocalteu micro-method in determining phenolics of plant methanol extracts,
Microchemical journal 91, 2009, 107-110.
Escarpa, A., Gonzalez, M. C., An overview of analytical chemistry of phenolic compounds in
foods, Critical reviews in analytics chemistry 31:2, 2001, 57-139.
Fabre, N., Rustan, I., de Hoffmann, E., & Quetin-Leclercq, J. (2001). Determination of flavone,
flavonol, and flavanone aglycones by negative ion liquid chromatography electrospray ion trap
mass spectrometry. Journal of the American Society for Mass Spectrometry, 12(6), 707–15.
FAO – Yute, Kenaf, Sisal, Abaca, Coir and Allied Fibres, STATISTICS, September 2012.
Fernandez-Panchon, M. S., Villano, D., Troncoso, A. M., Garcia-Parrilla, M. C., Antioxidant
activity of phenolic compounds: From in vitro results to in vivo evidence, Critical reviews in
food science and nutrition 48, 2008, 649-671.
Fernando A, Morais J, Mendes B, Oliveira JFS (2008) Is kenaf an effective land-use alternative
for the energy and industrial sectors in Portugal? Proceedings of the International Conference:
Bioenergy: Challenges and Opportunities 237-242.
Finley, J. W., Kong A. N., Hintze, K. J., Jeffery, E. H., Ji, L. L., Lei, X. G., Antioxidants in
foods: State of science importante to the food industry, j. agri. Food chem. 59, 2011, 6837-
6846.
Foyet, H. S., Hritcu, L., Ciobica, A., Stefan, M., Kamtchouing, P., Cojocaru, D., Methanolic
extract of Hibiscus asper leaves improves spatial memory deficits in the 6-hydroxydopamine-
lesion rodent model of Parkinson’s disease, Journal of ethnopharmacology 133, 2011, 773-779.
Harnly, J. M., Bhagwat, S., Lin, L., Profiling methods for the determination of phenolic
compounds in food and dietary supplements, Anal bioanal chem 389, 2007, 47-61.
Herrero, M., Temirzoda, T. N., Segura-Carretero, A., Quirantes, R., Plaza, M., Ibanez, E., New
possibilities for the valorization of olive oil by-products, Journal of chromatography A 1218,
2011, 7511-7520.
Kalili, K. M., Villiers, A., Recent developments in the HPLC separation of phenolic compounds,
J. Sep. Sci. 34, 2011, 854-876.
Kammerer, D., Claus, Carle, A. R., Schieber, A., Polyphenol Screening of Pomace from Red
and White Grape Varieties (Vitis vinifera L.) by HPLC-DAD-MS/MS J. Agric. Food
Chem., 2004, 52 (14), pp 4360–4367.
Kerhoas, L., Aouak, D., Cingöz, A., Routaboul, J.-M., Lepiniec, L., Einhorn, J., & Birlirakis,
N. (2006). Structural characterization of the major flavonoid glycosides from Arabidopsis
thaliana seeds. Journal of agricultural and food chemistry, 54 (18), 6603–12.
Lee, Y. G., Byeon, S. E., Kim, J. Y., Lee, J. Y., Rhee, M., H., Hong, S., Wu, J. C., Lee, H. S.,
Kim, M., J., Cho, D. H., Cho, J. Y., Immunomodulatory effect of Hibiscus cannabinus extract
on macrophage functions, Journal of ethnopharmacology 113, 2007, 62-71.

65
Lu, L., Song, F. R., Tsao, R., Jin, Y. R., Liu, Z. Q., Liu, S. Y., Studes on the homolytic and
heterolytic cleavage of kaempferol and kaempferide glycosides using electrospray ionization
tandem mass spectrometry, Rapid communiations in mass spectrometry, 2010, 24, 169-172.
Magalhães, L. M., Santos, F., Segundo, M. A., Reis, S., Lima, J. L. F.C., Rapid microplate high-
throughput methodology for assessment of Folin-Ciocalteu reducing capacity, Talanta 83, 2010,
441-447.
Maganha, E. G., Halmenschlager, R. C., Rosa, R. M., Henriques, J. A. P., Ramos, A. L. L. P.,
Saffi, J., Pharmacological evidences for the extracts and secondary metabolites from plants of
the genus Hibiscus, Food chemistry 1, 2010, 1-10.
Medina-remo A, Ja O, Vallverdu A, Lamuela-ravento RM, Andre C. Improved characterization
of tomato polyphenols using liquid chromatography / electrospray ionization linear ion trap
quadrupole Orbitrap mass spectrometry and liquid chromatography / electrospray ionization
tandem mass spectrometry. 2010:2986–2992.
Mohd-Esa, N., Hern, F. S., Ismail, A., Yee, C. L., Antioxidant activity in different parts of
roselle (Hibiscus sabdariffa L.) extracts and potential exploitation of the seeds, Food Chemistry
122, 2010, 1055-1060.
Mariod, A. A., Ibrahim, R. M., Ismail, M., & Ismail, N. (2012). Antioxidant activity of phenolic
extracts from kenaf (Hibiscus cannabinus) seedcake. Grasas y Aceites, 63 (2), 167–174.
Naczk, M., Shahidi, F., Phenolics in cereals, fruits and vegetables: Occurrence, extraction and
analysis, Journal of pharmaceutical and biomedical analysis 41, 2006, 1523-1542.
Peng, C.-H., Chyau, C.-C., Chan, K.-C., Chan, T.-H., Wang, C.-J., & Huang, C.-N. (2011).
Hibiscus sabdariffa polyphenolic extract inhibits hyperglycemia, hyperlipidemia, and glycation-
oxidative stress while improving insulin resistance. Journal of agricultural and food chemistry,
59(18), 9901–9.
Ramirez-Sanchez, I., Maya, L., Ceballos, G., Villarreal, F., Fluorescent detection of (−)-
epicatechin in microsamples from cacao seeds and cocoa products: Comparison with Folin–
Ciocalteu method, Journal of food composition analysis 23, 2010, 790-793.
Rho, H. S., Ahn, S. M., Lee, B. C., Kim, M. K., Ghimeray, S. K., Jin, C. W., Cho, D. H., Changes
in flavonoid content and tyrosinase inhibitory activity in kenaf leaf extract after far-infrared
treatmet, bioorganic & Medical chemistry letters 20, 2010, 7534-7536.
Robards, K., Prenzler, P. D., Tucker, G., Swatsitang, P., Glover, W., Phenolic compounds and
their role in oxidative processes in fruits, Food chemistry 66, 1999, 401-436.
Sánchez-Rabaneda, F., Jáuregui, O., Casals, I., Andrés-Lacueva, C., Izquierdo-Pulido, M., &
Lamuela-Raventós, R. M. (2003). Liquid chromatographic/electrospray ionization tandem mass
spectrometric study of the phenolic composition of cocoa (Theobroma cacao). Journal of mass
spectrometry : JMS, 38 (1), 35–42.

66
Shanker, R., Vankar, P. S., Dyeing cotton, wool and silk with Hibiscus mutabilis (Gulzuba).,
Dyes and Pigments, 2007, 74(2), 464-469.
Sharma, O. P., Bhat, T. K., DPPH antioxidant assay revisited, Food Chemistry 113, 2009, 1202-
1205.
Siró, I., Kápolna, E., Lugasi, A., Functional food, product development, marketing and
consumer acceptance – A review, Appetite 51, 2008, 456-467.
Skoog, A. Douglas, Holler, F. James, Nieman, T. A., (1998) Chapter 13: Molecular
Spectroscopy, Thomson Learning (Ed), Principles of Instrumental Analysis 5th Edition (pp. 300
– 325). UK: Brookes Cole.
Snyder, L. R., Kirkland, J. J., Introduction to modern liquid chromatography, John Wiley &
Sons, Inc. 2nd ed., 1979, USA.
Stockham, K., Paimin, R., Orbell, J. D., Adorno, P., Buddhadasa, S., Modes of handling Oxygen
Radical Absorbance Capacity (ORAC) data and reporting values in product labelling, Journal
of food composition and analysis 24, 2011, 686-61.
Taamalli, A., Arráez-Tomán, D., Barrajón-Catalán, E., Ruiz-Torres, V., Pérez-Sánchez, A.,
Herrero, M., Ibañez, E., Micol, V., Zarrouk, M., Segura-Carretero, A., Fernández-Gutiérrez, A.,
Use of advanced techniques for the extraction of phenolic compounds from Tunisian olive
leaves: Phenolic composition and cytotoxicity against human breast cancer cells, Food and
chemical toxicology 50, 2012, 1817-1825.
Tao, C., Jian-min, Q., Jian-tang, X., Pin-pin, C., Ai-fen, T., Fu-cheng, C., Wei, C., Optimization
of two-dimensional gel electrophoresis for Kenaf leaf proteins, Agriculture sciences in China
12, 2011, 1842-1850.
Tura, D., Robards, K., Sample handling strategies for the determination of biophenols in food
and plants, Journal of chromatography A 975, 2002, 71-93.
Verma, M., Nilapwar, S. M., Nardelli, M., Westerhoff, H. V. (2011) Chapter four – Absorption
Spectroscopy, Methods in Systems Biology, Volume 500, pag. 59-75.
Webber III, C. L., Whitworth, J., Dole, J., Kenaf (Hibiscus cannabinus L.) core as a
containerized growth medium component, Industrial crops and products 10, 1999, 97-105.

67

68
Appendix

69

70

71
Appendix 6.1: Data of the ultrasound-assisted extractions, divided into Tainung 2 and Everglades 41,
with 100% and 80% of MeOH, which includes the mass of the flask, flask with the dry residue after the
evaporation, volume of the MeOH used to reconstitute the dry residue, concentration of the dry residue
expressed in mg/ml. Each extraction was done in triplicate (1, 2, 3).
Tainung 2
1st
Extraction mflask (mg)
m(flask
+ dry
residue)
(mg)
m(dry
residue)
(mg)
Vol.
MeOH
(mL)
C=m/v
(mg/ml)
1 47521,0 47582,2 61,2 2 30,6
100% 2 48187,6 48252,8 65,2 2 32,6
MeOH 3 48180,2 48258,7 78,5 2 39,25
1 48179,2 48295 115,8 2 57,9
80% 2 47522,2 47672,3 150,1 2 75,05
MeOH 3 46415,3 46522,4 107,1 2 53,55
2nd Extraction
1 48207,5 48207,8 0,3 2 0,15
100% 2 46431,3 46440,8 9,5 2 4,75
MeOH 3 47521,9 47535,6 13,7 2 6,85
1 55517,9 55656,2 138,3 2 69,15
80% 2 46415,5 46442,3 26,8 2 13,4
MeOH 3 46415,2 46436,1 20,9 2 10,45
3rd Extraction
1 48185,1 48185,5 0,4 1 0,4
100% 2 47525,2 47525,8 0,6 2 0,3
MeOH 3 46416,2 46423 6,8 2 3,4
1 46417 46422,6 5,6 1 5,6
80% 2 46415,4 46426,4 11 2 5,5
MeOH 3 48179 48182,7 3,7 1 3,7

72
Everglades 41
1st Extraction mflask (mg)
m(flask +
dry
residue)
(mg)
m(dry
residue)
(mg)
Vol.
MeOH
(mL)
C=m/v
(mg/ml)
1 48179,3 48275,8 96,5 2 48,25
100 2 48179,2 48281,5 102,3 2 51,15
MeOH 3 48178,8 48268,5 89,7 2 44,85
1 48177,8 48310,6 132,8 2 66,4
80 2 46414,5 46535,6 121,1 2 60,55
MeOH 3 47525,2 47642,5 117,3 2 58,65
2nd Extraction
1 48179,8 48198,3 18,5 2 9,25
100 2 48179,8 48198,2 18,4 2 9,2
MeOH 3 46417 46431,4 14,4 2 7,2
1 47521,8 47547,2 25,4 2 12,7
80 2 46415,7 46447,3 31,6 2 15,8
MeOH 3 48179,4 48194,8 15,4 2 7,7
3rd Extraction
1 48179,3 48183,6 4,3 1 4,3
100 2 47522,5 47525,8 3,3 1 3,3
MeOH 3 47520,7 47529,4 8,7 1 8,7
1 48184 48185,1 1,1 1 1,1
80 2 46420,6 46422 1,4 1 1,4
MeOH 3 47522,4 47530,9 8,5 1 8,5

73
Appendix 6.2: Data of the successive extractions, divided into Tainung 2 and Everglades 41, with 100%
MeOH, which includes the mass of the flask, flask with the dry residue after the evaporation, volume of
the MeOH used to reconstitute the dry residue, concentration of the dry residue expressed in mg/ml.
Each extraction was done in triplicate (1, 2, 3)
Tainung 2
mflask
(mg)
m(flask +
dry
residue)
(mg)
m(dry
residue)
(mg)
Vol.
MeOH
(mL)
C=m/v
(mg/ml)
1 48181,2 48239,0 57,8 2 28,9
100% 2 48180,2 48240,0 59,8 2 29,9
MeOH 3 48185,5 48233,7 48,2 2 24,1
Everglades 41
mflask
(mg)
m(flask +
dry
residue)
(mg)
m(dry
residue)
(mg)
Vol.
MeOH
(mL)
C=m/v
(mg/ml)
1 46415,8 46478,7 62,9 2 31,45
100% 2 46417,6 46484,1 66,5 2 33,25
MeOH 3 46419,9 46482,2 62,3 2 31,15
Appendix 6.3:
DPPH: Calibration curve done with the concentration of the standards and its absorbance at 516 nm.
The equation was then utilized to calculate the concentration of DPPH.
Well ID Conc
(μmol)
516 nm
STD1 5 0,05600
5 0,06500
5 0,05500
STD2 10 0,07600
10 0,07500
10 0,07400
STD3 20 0,11900
20 0,10700
20 0,11200
STD4 30 0,15800
30 0,15400
30 0,15500
STD5 40 0,20700
40 0,18700
40 0,17000
STD6 50 0,24700
50 0,23500
50 0,23400
STD7 60 0,30600
60 0,26900
60 0,28300

72
Tainung 2
[DPPH]
(µM)
% DPPH
(µM)
[Sample]
(ppm)
36,95122 75,18610 20,9300
37,19512 75,68238 20,9300
35,24390 71,71216 20,9300
24,75610 50,37221 41,8600
25,24390 51,36476 41,8600
25,00000 50,86849 41,8600
16,21951 33,00248 59,8000
17,43902 35,48387 59,8000
17,92683 36,47643 59,8000
12,31707 25,06203 80,7300
13,29268 27,04715 80,7300
12,80488 26,05459 80,7300
6,21951 12,65509 100,4640
6,70732 13,64764 100,4640
6,70732 13,64764 100,4640
5,73171 11,66253 119,6000
5,97561 12,15881 119,6000
5,97561 12,15881 119,6000
5,97561 12,15881 140,5300
5,73171 11,66253 140,5300
5,48780 11,16625 140,5300
5,48780 11,16625 161,4600
5,48780 11,16625 161,4600
5,73171 11,66253 161,4600
49,87805 101,48883 0,0000
48,65854 99,00744 0,0000
48,90244 99,50372 0,0000
To calculate the remaining DPPH in solution:
% DPPH = ([DPPH] samples/ Average [DPPH] ctr) X 100
y = 0,0041x - 0,0045R² = 0,9836
0,000
0,050
0,100
0,150
0,200
0,250
0,300
0 20 40 60 80
Ab
s
[DPPH] (μM)
Calibration curve - DPPH

73
Everglades 41
[DPPH]
(µM)
% DPPH
(µM)
[Sample]
(ppm)
32,07317 65,26055 20,61500
31,09756 63,27543 20,61500
31,82927 64,76427 20,61500
15,00000 30,52109 40,56500
16,95122 34,49132 40,56500
16,95122 34,49132 40,56500
7,43902 15,13648 60,51500
7,19512 14,64020 60,51500
7,68293 15,63275 60,51500
5,73171 11,66253 80,46500
5,73171 11,66253 80,46500
6,70732 13,64764 80,46500
20,36585 41,43921 100,41500
5,97561 12,15881 100,41500
6,21951 12,65509 100,41500
5,73171 11,66253 120,36500
5,73171 11,66253 120,36500
5,48780 11,16625 120,36500
5,97561 12,15881 140,31500
5,97561 12,15881 140,31500
5,97561 12,15881 140,31500
5,97561 12,15881 160,26500
28,17073 57,32010 160,26500
6,46341 13,15136 160,26500
49,87805 101,48883 0,00000
48,65854 99,00744 0,00000
48,90244 99,50372 0,00000
The red values weren’t utilized to do the calibration curve. To calculate the remaining DPPH in solution:
% DPPH = ([DPPH] samples/ Average [DPPH] ctr) X 100
y = -8E-06x3 + 0,007x2 - 1,4625x + 100,58
R² = 0,9968
0,00
20,00
40,00
60,00
80,00
100,00
120,00
0,00 20,00 40,00 60,00 80,00 100,00 120,00 140,00 160,00 180,00
% D
PP
H r
est
an
te (
µM
)
[Sample] (ppm)
Tainung 2 - DPPH

74
Resolving both equations in order to X, the Ec50 was obtained.
Folin-Ciocalteu: The red values weren’t utilized to do the calibration curve. Calibration curve done, to
Tainung 2 and Everglades 41, with the concentration of the standards of Galic acid and the absorbance
at 760 nm. The equation was then utilized to calculate the concentration of equivalents of galic acid
(EAG).
Well ID [Galic acid]
(μg/mL)
Abs 760
nm
STD1 5 0,0030
5 0,0020
5 0,0060
STD2 25 0,0180
25 0,0170
25 0,0190
STD3 50 0,0300
50 0,0290
50 0,0260
STD4 75 0,0470
75 0,0500
75 0,0430
STD5 100 0,0840
100 0,0750
100 0,0670
STD6 125 0,1030
125 0,0950
125 0,1090
STD7 150 0,1010
150 0,1140
150 0,0970
y = -6E-05x3 + 0,0203x2 - 2,4003x + 101,66
R² = 0,9941
0,00
20,00
40,00
60,00
80,00
100,00
120,00
0,00 50,00 100,00 150,00 200,00
% D
PP
H (
µM
)
[Sample] (ppm)
Everglades 41 - DPPH

75
Sucessive
extractions
100%MeOH
EAG
(mg)/Extract(g)
m (dry
residue)
(g)
m simple
(g)
EAG
(mg)/Sample
(mg)
Average Standard
derivation
Average
of the 3
exp.
T1 74,61 0,0578 0,2022 21,33
77,21 0,0578 0,2022 22,07 20,6685 1,8227
65,10 0,0578 0,2022 18,61
T2 55,39 0,0598 0,2120 15,63
55,39 0,0598 0,2120 15,63 16,4505 1,4298 18,67
64,17 0,0598 0,2120 18,10
T3 74,99 0,0482 0,2134 16,94
81,47 0,0482 0,2134 18,40 18,8906 2,2369
94,44 0,0482 0,2134 21,33
E1 85,65 0,0629 0,2035 26,47
83,27 0,0629 0,2035 25,74 25,6552 0,8629
80,09 0,0629 0,2035 24,75
E2 82,51 0,0665 0,2016 27,22
89,61 0,0665 0,2016 29,56 29,7898 2,6946 26,40
98,81 0,0665 0,2016 32,59
E3 87,28 0,0623 0,2141 25,40
85,67 0,0623 0,2141 24,93 23,7623 2,4382
72,03 0,0623 0,2141 20,96
y = 0,0007x - 0,0024
R² = 0,9804
0,000
0,020
0,040
0,060
0,080
0,100
0,120
0 20 40 60 80 100 120 140 160
Ab
s
[Galic acid] (μg/mL)
Calibration curve - Folin-Ciocalteu

76

77
ORAC: The calibration curve was done, to Tainung 2 and Everglades 41, with the concentration of
the standards of trolox and the area under the curve, given by the reading equipment, with the equation
was possible to calculate the equivalents of trolox in the sample.
Well ID Conc/Dil AUC neta
STD1 1 12,542
1 7,133
1 8,724
STD2 3,5 27,267
3,5 23,165
3,5 23,159
STD3 6 40,033
6 48,094
6 47,345
STD4 8,5 60,367
8,5 54,395
8,5 54,043
STD5 11 61,504
11 82,611
11 70,37
STD6 13,5 71,529
13,5 119,315
13,5 97,094
y = 6,2318x + 3,9926
R² = 0,9516
0
20
40
60
80
100
0 2 4 6 8 10 12
AU
C
[Trolox] μM
Calibration curve

78
Tainung 2
[Trolox]eq.
(μmol/L)
[Extract]
(mg/mL)
2,5175 0,0004
1,9907 0,0004
2,6061 0,0004
2,0532 0,0006
1,9513 0,0006
2,2184 0,0006
3,0860 0,0008
2,6598 0,0008
2,6131 0,0008
3,1271 0,001
2,8623 0,001
2,6239 0,001
4,5512 0,0015
5,3717 0,0015
4,9157 0,0015
5,5826 0,002
6,7376 0,002
6,5604 0,002
In order to find the equivalents of trolox in the leaf, the following equations were needed.
m=[Trolox]/[extract] (μmol/mg)
m=2724 μmol trolox - 1mg extract
213,4mg original sample - 24,1 mg extract
1mg original sample - 0,1129 mg extract
0,1129 mg extract - 1mg origial sample
1mg extract - 8,8574 mg sample
2724μmol trolox - 8,8574 mg sample 307,54 μmol trolox - 1mg sample
y = 2724x + 0,6969
R² = 0,9104
0,00
1,00
2,00
3,00
4,00
5,00
6,00
7,00
8,00
0 0,0005 0,001 0,0015 0,002 0,0025
[Tro
lox]e
q.
(μm
ol/
L)
[Sample] (mg/mL)
Tainung 2 - ORAC

78
Everglades 41:
[Trolox]eq.
(μmol/L)
[Sample]
(mg/mL)
1,3122 0,0004
1,2300 0,0004
1,4886 0,0004
1,6463 0,0006
1,7774 0,0006
2,3309 0,0006
2,9599 0,0008
3,6460 0,0008
3,1390 0,0008
5,0184 0,001
4,3965 0,001
4,2428 0,001
7,0372 0,0015
6,0781 0,0015
6,2745 0,0015
7,9637 0,002
7,5088 0,002
7,4679 0,002
The calculi were done the same way as Tainung 2.
Everglades 41: 1273,7 umol trolox/ mg sample
y = 4120,7x - 0,1313
R² = 0,955
0,00
2,00
4,00
6,00
8,00
10,00
0 0,0005 0,001 0,0015 0,002 0,0025
[Tro
lox]e
q.
(μm
ol/
L)
[Sample] (mg/mL)
Everglades 41 - ORAC