Embed Size (px)
Citation preview

Quantifying Network Denial of Service: A Location Service Case
Study
Yan Chen, Adam Bargteil, David Bindel, Randy H. Katz and John Kubiatowicz
Computer Science DivisionUniversity of California at Berkeley
USA

Outline
• Motivation• Network DoS Attacks Benchmarking• Object Location Services• Simulation Setup and Results• Conclusions

Motivations
• Network DoS attacks increasing in frequency, severity and sophistication– 32% respondents detected DoS attacks (1999 CSI/FBI survey)
– Yahoo, Amazon, eBay and MicroSoft DDoS attacked
– About 4,000 attacks per week in 2000
• Security metrics in urgent need– Mission-critical applications built on products claiming various and
suspect DoS resilient properties
– No good benchmark for measuring security assurance
• Desired: A general methodology for quantifying arbitrary system/service resilience to network DoS attacks

Outline
• Motivation• Network DoS Attacks Benchmarking • Object Location Services• Simulation Setup and Results• Conclusions

Network DoS Benchmarking
• QoS metrics– DoS attacks resource availability, a spectrum metric rather
than binary
– General vs. App-specific metrics• General: end-to-end latency, throughput and time to recover
• Multi-dimensional Resilience Quantification– Dimension rank based on importance, frequency, severity &
sophistication
– Application/system specific, hard to generalize
– Solution: be specific in the threat model definition and only quantify resilience in the model
Network DoS Benchmarking (Cont’d)
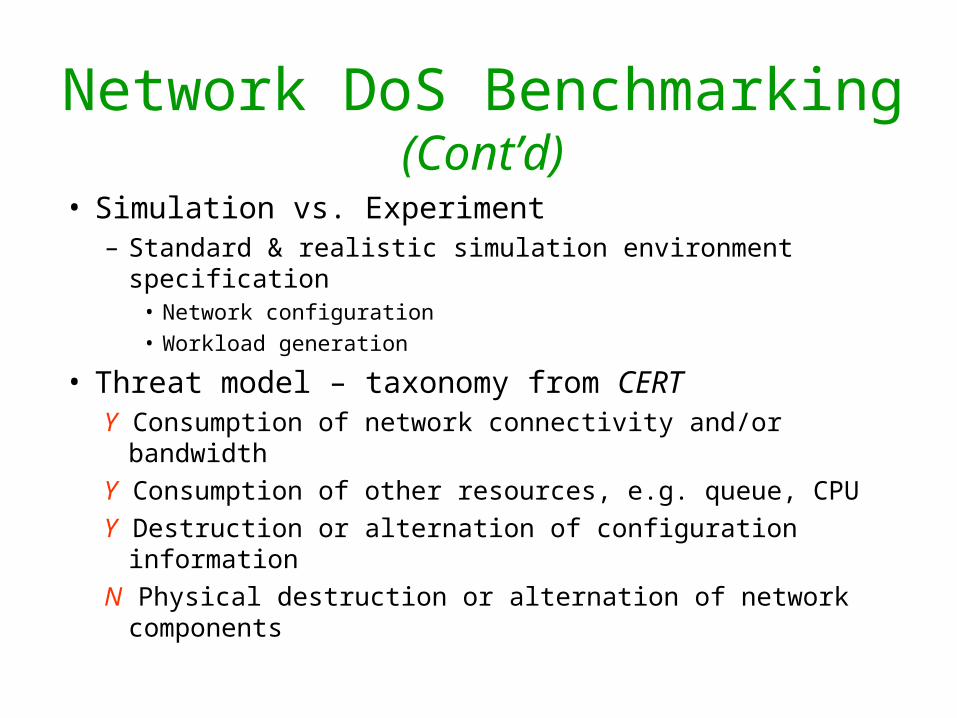
• Simulation vs. Experiment – Standard & realistic simulation environment specification
• Network configuration
• Workload generation
• Threat model – taxonomy from CERTY Consumption of network connectivity and/or bandwidth
Y Consumption of other resources, e.g. queue, CPU
Y Destruction or alternation of configuration information
N Physical destruction or alternation of network components

Two General Classes of Attacks• Flooding Attacks
– Point-to-point attacks:
TCP/UDP/ICMP flooding,
Smurf attacks
– Distributed attacks:
hierarchical structures
• Corruption Attacks– Application specific
– Impossible to test all, choose typical examples for benchmarking

Outline
• Motivation• Network DoS Attacks Benchmarking • Object Location Services• Simulation Setup and Results• Conclusions
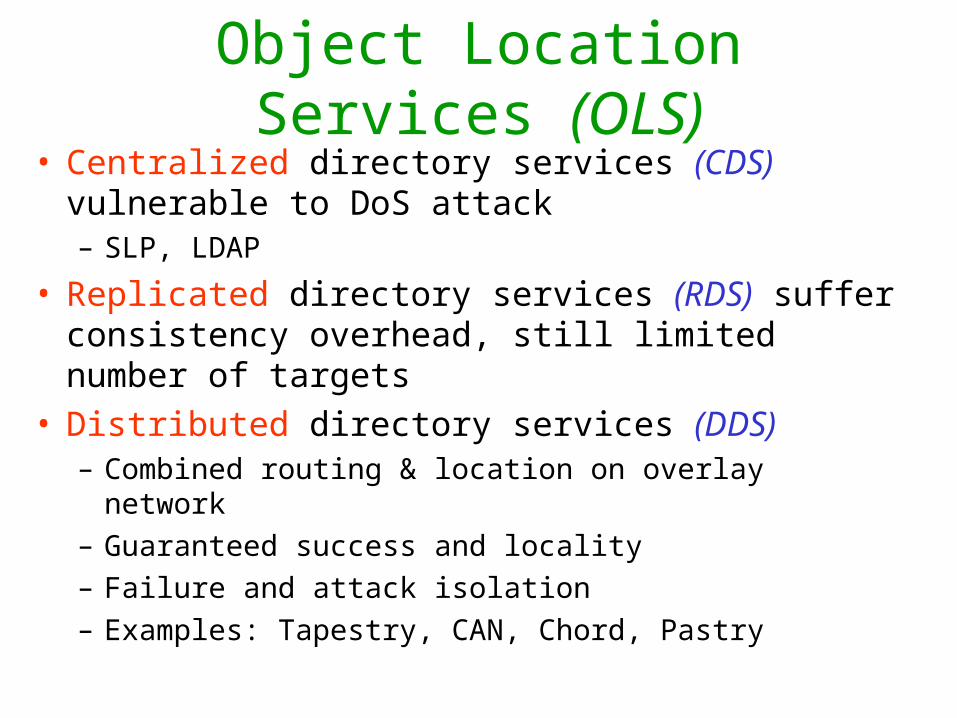
Object Location Services (OLS)• Centralized directory services (CDS) vulnerable to DoS
attack– SLP, LDAP
• Replicated directory services (RDS) suffer consistency overhead, still limited number of targets
• Distributed directory services (DDS)– Combined routing & location on overlay network
– Guaranteed success and locality
– Failure and attack isolation
– Examples: Tapestry, CAN, Chord, Pastry
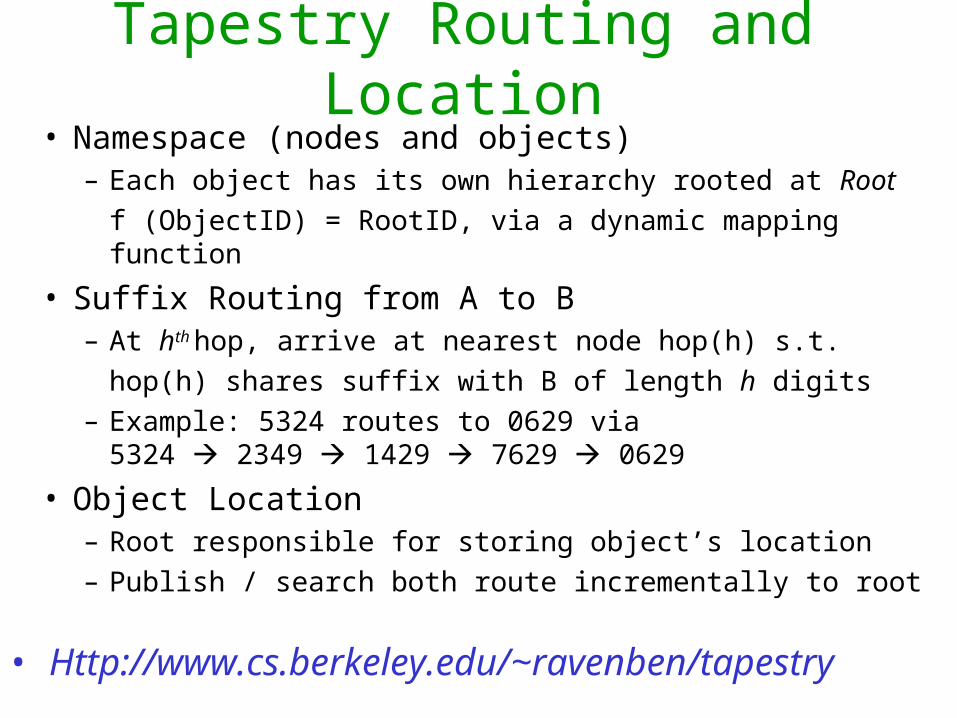
Tapestry Routing and Location• Namespace (nodes and objects)
– Each object has its own hierarchy rooted at Root
f (ObjectID) = RootID, via a dynamic mapping function
• Suffix Routing from A to B– At hth hop, arrive at nearest node hop(h) s.t.
hop(h) shares suffix with B of length h digits
– Example: 5324 routes to 0629 via5324 2349 1429 7629 0629
• Object Location– Root responsible for storing object’s location
– Publish / search both route incrementally to root
• Http://www.cs.berkeley.edu/~ravenben/tapestry

4
2
3
3
3
2
2
1
2
4
1
2
3
3
1
34
1
1
4 3
2
4
Tapestry MeshIncremental suffix-based routing
NodeID0x43FE
NodeID0x13FENodeID
0xABFE
NodeID0x1290
NodeID0x239E
NodeID0x73FE
NodeID0x423E
NodeID0x79FE
NodeID0x23FE
NodeID0x73FF
NodeID0x555E
NodeID0x035E
NodeID0x44FE
NodeID0x9990
NodeID0xF990
NodeID0x993E
NodeID0x04FE
NodeID0x43FE

Routing in Detail
5712
0880
3210
7510
4510
Neighbor MapFor “5712” (Octal)
Routing Levels1234
xxx1
5712
xxx0
xxx3
xxx4
xxx5
xxx6
xxx7
xx02
5712
xx22
xx32
xx42
xx52
xx62
xx72
x012
x112
x212
x312
x412
x512
x612
5712
0712
1712
2712
3712
4712
5712
6712
7712
5712 0 1 2 3 4 5 6 7
0880 0 1 2 3 4 5 6 7
3210 0 1 2 3 4 5 6 7
4510 0 1 2 3 4 5 6 7
7510 0 1 2 3 4 5 6 7
Example: Octal digits, 212 namespace, 5712 7510

Object LocationRandomization and Locality

Outline
• Motivation• Network DoS Attacks Benchmarking • Object Location Services• Simulation Setup and Results• Conclusions

Simulation Setup
Fast Ethernet
Fast EthernetT3
T1T1
• Distributed Information Retrieval System Built on top of ns
• 1000-node Transit-stub Topology from GT-ITM– Extended with common
network bandwidth
• Synthetic Workload – Zipf’s law and hot-cold patterns– 500 objects, 3 replicas each on 3 random nodes– Size randomly chosen as typical web contents: 5KB – 50KB
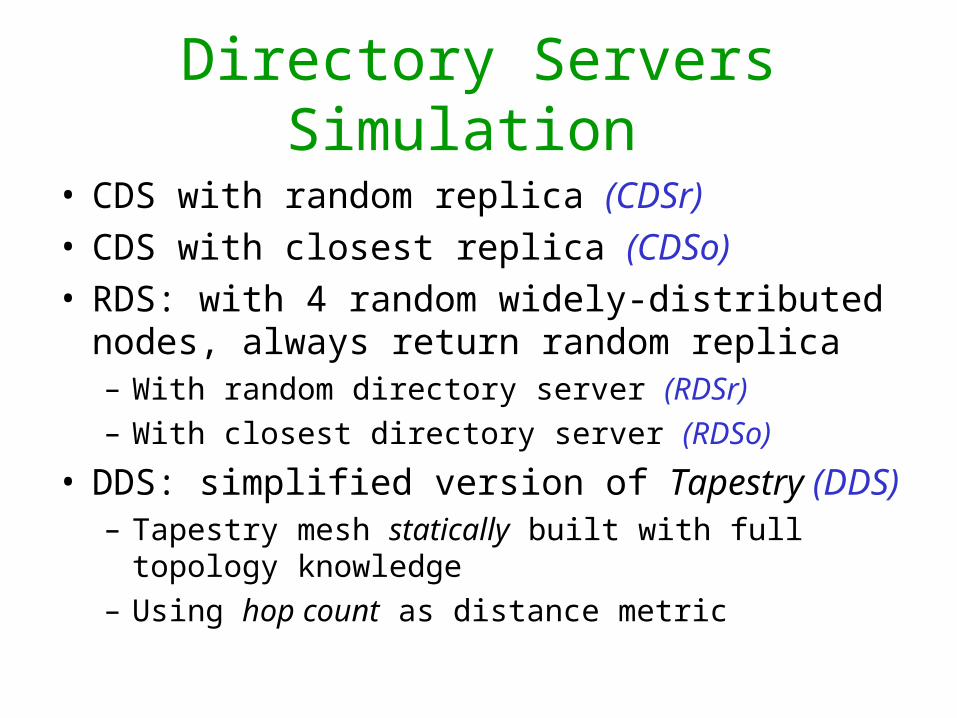
Directory Servers Simulation
• CDS with random replica (CDSr)• CDS with closest replica (CDSo)• RDS: with 4 random widely-distributed nodes, always
return random replica– With random directory server (RDSr)
– With closest directory server (RDSo)
• DDS: simplified version of Tapestry (DDS)– Tapestry mesh statically built with full topology knowledge
– Using hop count as distance metric
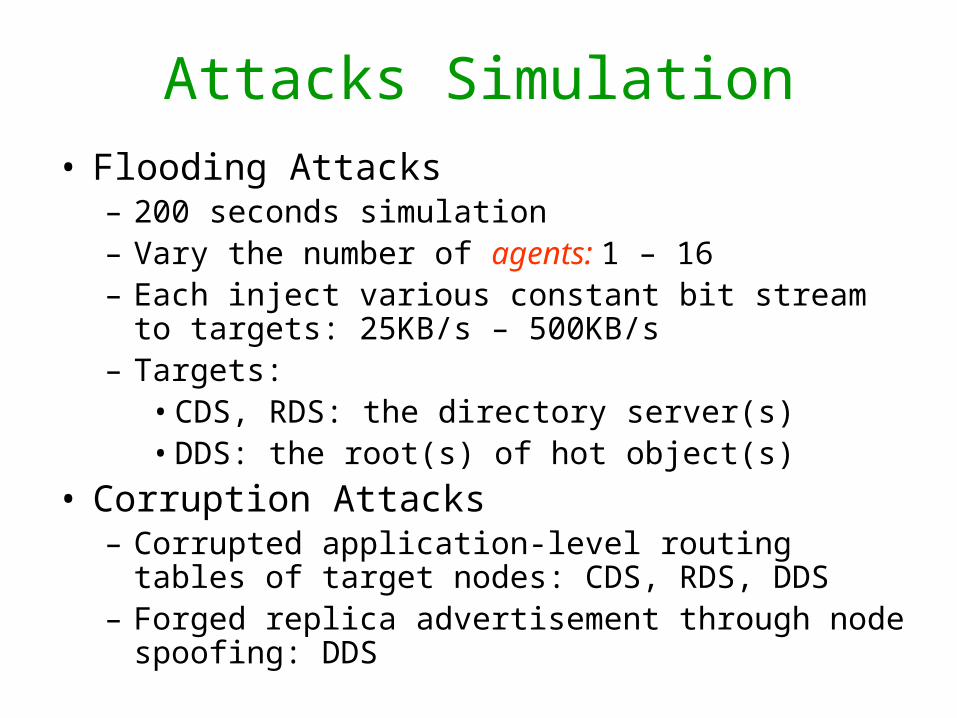
Attacks Simulation• Flooding Attacks
– 200 seconds simulation– Vary the number of agents: 1 – 16– Each inject various constant bit stream to targets: 25KB/s –
500KB/s– Targets:
• CDS, RDS: the directory server(s)• DDS: the root(s) of hot object(s)
• Corruption Attacks– Corrupted application-level routing tables of target nodes:
CDS, RDS, DDS– Forged replica advertisement through node spoofing: DDS

• CDS vs. Tapestry– 1 * 100KB/s, 4 *
25KB/s – 4 *100KB/s– Tapestry shows
resistance to DoS attacks
Results of Flooding Attacks
Average response latency Request throughput
Only the flood traffic amount matter? No!
– Bottleneck bandwidth restrict attackers’ power
– Path sharing of clients and attackers
– Hard to identify and eliminate multiple attackers simultaneously

Dynamics of Flooding Attacks• CDS vs. Tapestry (most severe case: 4 *100KB/s)
– Attacks start at 40th second, ends at 110th second
• Time to Recover– CDS (both policies): 40 seconds
– Tapestry: negligible
Average response latency Request throughput

Results of Flooding Attacks• RDS vs. Tapestry
– 4 * 100KB/s – 16 * 500KB/s
– Both RDS and Tapestry are far more resilient than CDS
– Performance: RDSo > Tapestry > RDSr
Counter DoS attacks: Decentralization and topology-aware locality
Average response latency Request throughput

Results of Corruption Attacks• Distance Corruption
– One false edge on directory/root server
– Only CDSo (85%) and Tapestry (2.2%) affected
• App-specific attacks– One Tapestry node spoofing to
be root of every object (black square node in the graph)
– 24% of nodes are affected (enclosed by round-corner rectangles)

Resiliency Ranking• Combine multiple-dimensional resiliency quantification
into a single ranking– For multiple flooding attacks, weights are assigned in
proportion to the amount of flood traffic– Normalized with the corresponding performance without
attacks
Flooding (80%)
Distance corruption (10%)
Node spoofing (10%)
Total score
Rank
CDS, rand obj 0.027 N/A N/A 0.2216 4
CDS, opt obj 0.023 0.85 N/A 0.2034 5
Random RDS 0.17 N/A N/A 0.336 3
Optimal RDS 0.48 N/A N/A 0.584 1
DDS,Tapestry 0.35 0.978 0.76 0.4538 2
Outline
• Motivation• Network DoS Attacks Benchmarking• Object Location Services• Simulation Setup and Results• Conclusions
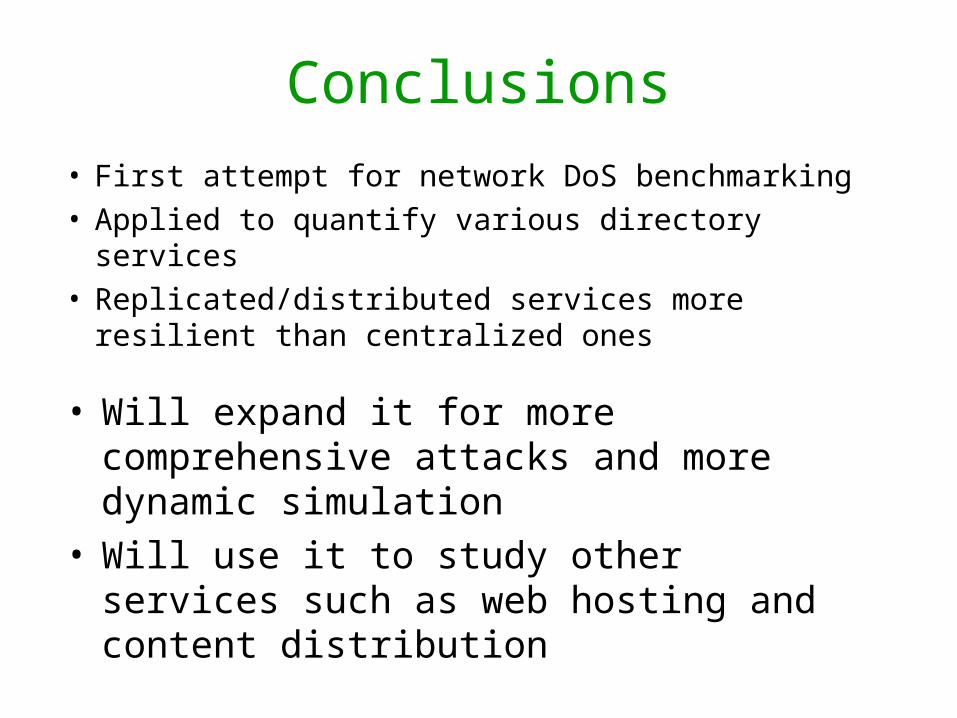
Conclusions
• First attempt for network DoS benchmarking• Applied to quantify various directory services• Replicated/distributed services more resilient than
centralized ones
• Will expand it for more comprehensive attacks and more dynamic simulation
• Will use it to study other services such as web hosting and content distribution

Queuing Theory Analysis(backup slide)
• Assume M/M/1 queuing• Predict the trends and how to choose simulation
parameters to cover enough spectrum
Average response latency (s)
Legitim
ate throughput
X axis: ratio of attack traffic vs. legitimate traffic