Embed Size (px)
Citation preview

S1
Supporting Information
Quantitative analysis of selected plastics in high commercial value
Australian seafood by Pyrolysis Gas Chromatography Mass
Spectrometry
Francisca Ribeiro1,2*, Elvis D. Okoffo1, Jake W. O’Brien1, Sarah Fraissinet-Tachet1, Stacey
O’Brien1, Michael Gallen1, Saer Samanipour1,3, Sarit Kaserzon1, Jochen F. Mueller1, Tamara
Galloway 2 and Kevin V. Thomas1
(1) Queensland Alliance for Environmental Health Sciences (QAEHS), The University of Queensland, 20
Cornwall Street, Woolloongabba, QLD, 4102, Australia
(2) College of Life and Environmental Sciences, University of Exeter, EX4 4QD, Exeter UK
(3) Van’t Hoff Institute for Molecular Sciences, University of Amsterdam 1098 XH Amsterdam, The
Netherlands
* Corresponding author
E-mail address: [email protected]
Number of pages: 20
Number of tables: 11
Number of figures: 5

S2
List of tables and figures
Table S 1 Plastic standards used for data base library matching and mass calibration. NS –
non specified .............................................................................................................................. 3
Table S 2 ASE conditions for the selected plastics.................................................................... 4
Table S 3 Conditions for Single shot Pyrolysis-GC/MS measurements................................... 5
Table S 4 Selected indicator ions of pyrolysis products of different polymers at 650 ºC; M/z
masses highlighted in bold were used for quantification; polystyrene (PS), polypropylene
(PP), polyethylene terephthalate (PET), poly-(methyl methacrylate) (PMMA), polyethylene
(PE) and polyvinyl chloride (PVC)............................................................................................ 6
Table S 5 Recovery of plastic standards after ASE with DCM at 180 ºC ................................. 8
Table S 6 Recovery of spiked oyster samples after ASE with DCM at 180 ºC ........................ 9
Table S 7 PS standard (1 mg ml-1) peak areas and correspondent mass (n = 10) .................... 10
Table S 8 Calibration functions for selected plastics. a results are based on ions for the plastic
as presented in Table S2; ......................................................................................................... 10
Table S 9 LOD and LOQ (in µg per g of tissue) ..................................................................... 11
Table S 10 Mass (µg) of each plastic found in the procedural blanks (n=10) measured by Py-
GC/MS ..................................................................................................................................... 12
Table S 11 Concentration of PS, PE, PVC, PP and PMMA (µg/g tissue) measured in seafood
(each sample was analysed in triplicate); < LOQ: below limit of quantification; when a value
was <LOQ, ½ LOD was used; ................................................................................................. 13
Figure S 1 Experimental design for the extraction of oyster’s. Filters were spiked with 6
different plastics: PS, PE, PET, PMMA, PP and PVC. Six glass fibre filters were used as a
“blank” with no plastic added and the other 36 were spiked with selected plastics (as
schematized) ............................................................................................................................ 14
Figure S 2 Total Ion Chromatogram (TIC) pyrograms of extracted plastics by ASE. Detailed
decomposition products and retention times are summarized in Table S2. Polystyrene (PS),
polypropylene (PP), poly-(methyl methacrylate) (PMMA), polyethylene (PE) and polyvinyl
chloride (PVC) ......................................................................................................................... 14
Figure S 3 Peak area (in counts per second) of indicator compounds for each selected plastic
measured over 2.5 hours. Polyethylene (PE), poly-(methyl methacrylate) (PMMA),
polypropylene (PP), Polystyrene (PS) and polyvinyl chloride (PVC) ..................................... 14
Figure S 4 Correlation between peak area (in counts per second) of specific compounds
selected for each plastic and split ratio (50:1, 20:1, 10:1 and 5:1); polystyrene (PS),
polyethylene (PE), polyvinyl chloride (PVC) polypropylene (PP) and poly-(methyl
methacrylate) (PMMA) ............................................................................................................ 14
Figure S 5 Comparison of a TIC (total ion chromatogram) of a plastic standard mixture with
TICs of analysed seafood ......................................................................................................... 14

S3
Chemicals and reference materials
Polystyrene, poly (methyl methacrylate) and polyvinylchloride were purchased from
Sigma-Aldrich and low density polyethylene (LDPE) from Thermo Fischer Scientific.
Polyethylene terephthalate (PET) was kindly provided by the Norwegian Institute for Water
Research (NIVA) in Oslo, Norway and polypropylene (PP) was donated by a plastic
manufacturer from Melbourne, Australia.
Liquid/gas chromatography grade dichloromethane (DCM) was purchased from Merck
(Darmstadt, Germany). Hydromatrix was purchased from Agilent Technologies (Santa Clara,
CA, USA). Potassium hydroxide (KOH) in pellet form was purchased from Sigma-Aldrich
(221473 – 2.5KG) and ultra-pure water (18.2 MΩ cm-1) was obtained from a Milli-Q filtration
unit (Merck Millipore, MA, USA).
Table S 1 Plastic standards used for data base library matching and mass calibration. NS – non specified
Polymer standard Abbreviation Size (µm) Source of supply
Polystyrene (327794-1G) (powder form) PS NS Sigma- Aldrich
Poly (methyl methacrylate) (81489 – 500 MG) PMMA NS Sigma- Aldrich
Low Density Polyethylene (A10239) (powder
form)
LDPE 500 Thermo Fischer Scientific
Polyethylene terephthalate (pellet form)
PET 20-110 µm NIVA
Polyvinylchloride (powder form)
(182621-25G)
PVC NS Sigma- Aldrich
Polypropylene, isotactic (EP341R) (pellet
form)
PP 20-120 µm Lyondellbasell (VIC)

S4
Extraction of plastic standards using an Accelerated Solvent Extraction (ASE) method
All samples were extracted by a Dionex ASE-350 system. High temperature Viton-O-
rings (Dionex 056325) were used in the end-caps, glass fibre filters (Dionex 056781) were used
in the cell base and Hydromatrix sorbent was used to cover the sample, reduce solvent and
prevent floatation.
To assess extraction efficiency, between 20 and 50 mg of each selected plastic was
weighed and placed inside of an ASE cell (34 mL) previously covered with a filter. Five
replicates were performed for each type of plastic (PS, PE, PET, PMMA, PP and PVC) in
addition to three controls (cells filled with only Hydromatrix). Following extraction the
recovered mass of each polymer was determined gravimetrically by evaporating the liquid in
the collection bottles to dryness in a fume hood under a gentle stream of nitrogen (40 °C).
Analysis was performed on the dried residues to quantify the mass of polymer recovered by
weight (0.01 g of precision).
Table S 2 ASE conditions for the selected plastics
Parameter Optimized extraction parameters
Extraction solvent Dichloromethane
Extraction temperature (°C) 180
Static time (s) 5
Cycles 3
Rinse volume (%) 80
Purge time (s) 75
System rinse volume (ml) 9
Heating time (min) 9
Pressure (psi) 1500

S5
Pyrolysis Gas Chromatography/ Mass Spectrometry (Py-GC/MS) analysis
Py-GC/MS was performed using a Multi-shot Pyrolyzer (EGA/PY-3030D) equipped
with an auto-shot sampler (AS-1020E) (Frontier Laboratories Ltd., Fukushima Japan) coupled
to a Shimadzu GC/MS-QP2010 plus. The MS was operated in electron ionisation (EI) mode
and compounds separated on a Frontier Laboratories Ultra ALLOY -5 capillary column (30 m
x 0.25 mm x 0.25 µm) with helium as the carrier gas.
The initial oven program was set at 40 °C for 2 min, then increased to 320 °C at 20
°C/min and held for 14 min. Data was acquired in full scan mode (mass range 40 to 600 m/z)
with a scanning rate of 2000 Hz. Library search of Shimadzu was used for peak identification
of the pyrolyzates together with Kovats retention index (RI) data.
Apparatus Parameters Settings
Micro-furnace
Pyrolyzer
(Single-shot analysis)
EGA/PY-3030D
Temperature program
Pyrolysis temperature
Interface temperature
Pyrolysis time
70 ºC (2 min.) > 320 ºC (12.5 min ) at 20 ºC min-1
650 °C
300 °C
0.20 minutes (12 seconds)
Gas Chromatograph
Column
Injector port temperature
Column oven temperature program
Injector mode
Carrier gas
Ultra-Alloy® 5 capillary column (30 m, 0.25 mm I.D.,
0.25 µm film thickness) (Frontier Lab)
300 °C
40 °C (2 min) → (20 °C /min) → 320 °C (14 min)
Split (5:1)
Helium, 52.1 cm/s, constant linear velocity
Mass Spectrometer
Ion source temperature
Ionization energy
Scan range
250 °C
Electron ionization (EI) ); 70 eV
40 to 600 m/z
Table S 3 Conditions for Single shot Pyrolysis-GC/MS measurements

S6
Table S 4 Selected indicator ions of pyrolysis products of different polymers at 650 ºC; M/z masses highlighted in bold were
used for quantification; polystyrene (PS), polypropylene (PP), polyethylene terephthalate (PET), poly-(methyl methacrylate)
(PMMA), polyethylene (PE) and polyvinyl chloride (PVC)
Polymer
Characteristic decomposition product(s) Indicator ions
(m/z ratio)
Retention time
(min)
PS Styrene
Styrene dimer: 3-butene-1,3-diyldibenzene
Styrene trimer: 5-hexene-1,3,5-triyltribenzene
104, 78
91, 130, 193, 208
91, 117, 194, 312
5.835
12.875
16.765
PP n-pentane
2-methyl-1-pentene
2,4, 6-dimethyl-1-heptene
55, 72
56, 69, 84
70, 83, 126
2.105
2.235
5.15
PET benzene
Vinyl benzoate
BENZOIC ACID
diphenyl
divinil terephthalate
4-(vinyloxycarbonyl) benzoic acid
Ethan-1,2-diyldibenzoate
2- (benzoyloxy)ethyl vinyl terephatlate
Ethan-1,2-diyl divinyl diterephthalate
Bis(2-(benzyloxy)ethyl) terephthalate
78, 52
105, 77, 148, 51
105, 122, 77
154, 131,76
175, 104,
149, 121
105, 77, 227
297, 149
364, 325, 296, 219
105, 297, 149
2.825
8.42
9.095
10.525
11.77
12.105
15.27
17.445
20.13
29
PMMA Methyl acrylate
Methyl methacrylate
(Z)-trimethyl 4,6-dimethylhept-2-ene-2,4,6-tricarboxylate
(Z)-dimethyl 2,4-dimethylpent-2-enedioate
dimethyl 2, 2-dimethyl-4-methylenepentanedioate
C11H1804
55, 85
69, 100, 89
121, 149
67, 95, 127, 111, 154
81, 101, 109, 125, 140
81, 95, 109, 123
2.4
3.405
13.425
9.065
9.45
10.055
PE 1-Nonene (C9)
1, 9-decadiene (C10)
1-decene (C10)
n-decane (C10)
1-undecene (C11)
3-tetradecene (nist) or 1-dodecene (C12)
1-tridecene (C13)
1-tetradecane (C14)
1 pentadecene (C15)
1-hexadecene (C16)
1-eicosene (C20)
C17
1-heptene (C7)
C8
C6
83,97, 111
67, 81, 95, 110,123
83, 97, 111, 140
71, 85, 98, 113, 142
83, 97,111,126, 152
83, 97, 111, 125
83, 97, 111,125
83,97, 111,125,140
83, 97,111
-
83, 97,111
83, 97
70, 83, 98
-
-
5.815
6.895
6.97
7.06
7.97
8.87
9.695
10.465
11.185
11.865
14.255
12.51
3.175
4.575
2.27
PVC Benzene
Toluene
Indene
Styrene
78,52
91,65
116, 119
104, 78
2.855
4.165
7.640
5.835

S7
Multivariate calibration curve for PE
To generate a multivariate calibration curve for quantification of PE in different
matrices, we used a least square approach, where the algorithm minimizes the sum of squares
of the distance between each point and the line. The final calibration curve with an adjusted R2
of 0.99 included four coefficients and the intercept term. These four coefficients consisted of
three associated to each independent variable (i.e. peak intensity) and the interaction between
1-decene and 1-dodecene. For the validation of this multivariate calibration curve, we
employed leave one out approach, where during each iteration one of the points in the curve
will be removed while generating a new curve using the remaining points 1, 2. This process was
repeated in order to have each point the calibration curve removed at least once.

S8
Table S 5 Recovery of plastic standards after ASE with DCM at 180 ºC
Polymer type Spike amount (mg)
Recovered amount (mg)
(%) Recovery
Average
recovery
mean ± STD
(%)
RSD (%)
Rep 1 Rep 2 Rep 3 Rep 4 Rep 5
PMMA 45.4
42.5
93.6
50.1
48.8
97.4
44.4
42.4
95.5
47.6
48.2
101.3
44.9
45.2
100.7
97.7 ± 3.3
3.4
PS 29.5
31.7
107.5
22.7
25.4
111.9
20.8
18.6
89.4
25.8
20.5
79.5
21.8
22.4
102.8
98.2 ± 13.4
13.7
PET 22.6
20.3
89.8
50.8
47.3
93.1
43.6
40.2
92.2
36.7
30.2
82.3
45.9
48.9
106.5
92.8 ± 8.8
9.4
PP 37.4
35.1
93.9
43.6
39.9
91.5
45.4
43.4
95.6
43.4
38.2
88.0
41.1
42.0
102.2
94.2 ± 5.3
5.6
PE 45.1
35.3
78.2
41.7
41.1
98.6
45.6
42.4
93.0
37.8
34.3
90.7
44.6
41.6
93.3
90.8 ± 7.6
8.4
PVC 45.5
38.9
85.4
40.3
36.6
90.7
37.4
31.6
84.4
28.5
21.9
76.7
39.2
38.0
96.9
86.8 ± 7.5
8.7 Replicate (Rep) 1, 2, 3, 4 and 5 represent the number of experiments for each polymer standard; blue numbers represent the
percentage of recovery of each trial; average recovery represents the mean recovery from the five replicates; STD: standard
deviation RSD: relative standard deviation (%); poly-(methyl methacrylate) (PMMA), polystyrene (PS), polyethylene
terephthalate (PET), polypropylene (PP), polyethylene (PE) and polyvinyl chloride (PVC)

S9
Table S 6 Recovery of spiked oyster samples after ASE with DCM at 180 ºC
Polymer
type
Spike amount (mg)
Recovered amount (mg)
(%) Recovery
Average
recovery
mean ± STD
(%)
RSD
(%)
Rep. 1 Rep. 2 Rep. 3 Rep. 4 Rep. 5 Rep. 6
PS 14.01
17.06
121.77
14.95
10.87
72.71
16.23
13.69
84.35
15.06
11.19
74.30
17.49
13.42
76.72
14.29
9.82
68.719
83.1 ± 17.9 21.6
PE 19.45
19.01
97.74
21.20
16.28
76.79
18.58
15.55
83.69
18.51
15.69
84.76
18.37
16.37
89.11
18.82
15.40
81.83
85.7 ± 6.5 7.6
PP 21.57
14.28
66.20
18.17
13.58
74.74
19.59
14.09
71.92
18.58
12.01
64.64
18.47
21.96
118.90
18.76
13.76
73.35
78.3 ± 18.5 23.7
PVC 22.05
17.69
80.23
19.32
14.41
74.59
20.55
17.44
84.87
18.97
17.02
89.72
21.48
24.36
113.41
21.43
16.29
76.01
86.5 ± 13.1 15.1
PMMA 15.92
17.98
112.94
15.64
13.15
84.08
16.71
15.07
90.19
15.90
18.90
118.87
15.93
13.56
85.12
15.37
17.34
112.82
100.7 ± 14.5 14.4
PET 25.95
12.96
49.94
21.39
5.67
26.51
22.94
6.16
26.85
27.46
6.69
24.36
24.24
10.77
44.43
25.85
5.27
20.39
32.1 ± 11 34.3
Replicate (Rep) 1, 2, 3, 4, 5 and 6 represent the number of experiments for each polymer standard; blue numbers represent the
percentage of recovery of each trial; average recovery represents the mean recovery from the five replicates; STD: standard
deviation RSD: relative standard deviation (%); polystyrene (PS), polyethylene (PE), polypropylene (PP), polyvinyl chloride
(PVC), poly-(methyl methacrylate) (PMMA) and polyethylene terephthalate (PET)

S10
Table S 7 PS standard (1 mg ml-1) peak areas and correspondent mass (n = 10)
Table S 8 Calibration functions for selected plastics. a results are based on ions for the plastic as presented in Table S4;
Polystyrene (PS), polyethylene (PE), polyvinyl chloride (PVC) polypropylene (PP) and poly-(methyl methacrylate) (PMMA)
Number of
runs
Peak area
(styrene dimer: 3-butene-
1,3-diyldibenzene)
Total mass (µg) Mean ± STD RSD (%)
1 1045825 3454
4145 ± 707 17
2 1009723 3335
3 1399269 4619
4 1180607 3898
5 1255677 4146
6 1406879 4644
7 985000 3253
8 1149959 3797
9 1428720 4716
10 1692921 5587
Plastic type Indicator ions Linear range
(µg) Calibration functions
Linearity
(R2) a
PS
3-butene-1,3-
diyldibenzene
(styrene dimer)
0.02 - 10 Y = 189548 * X - 1580.9 0.99
PE 1-decene (C10)
0.02 - 10 Y = 99469 * X -10677 0.98
PVC Benzene
0.02 - 10 Y = 3825975.5 * X - 594914.38 0.98
PP 2,4, 6-dimethyl-1-
heptene 0.02 - 10 Y = 63821 * X - 118.72 0.98
PMMA Methyl methacrylate
0.02 - 10 Y = 30793 * X – 7518.4 0.99

S11
Table S 9 LOD and LOQ (in µg per g of tissue)
Sample Plastic LOD (µg/g tissue) LOQ (µg/g tissue)
Oysters PS 0.70 0.96
PE 0.90 9.41
PVC 1.04 10.93
PP 0.83 2.45
PMMA 0.95 24.29
Prawns PS 0.70 0.96
PE 8.05 9.35
PVC 10.82 10.87
PP 0.85 2.44
PMMA 19.22 24.15
Squid PS 0.54 0.75
PE 0.69 7.28
PVC 0.81 8.46
PP 0.64 1.90
PMMA 0.74 18.80
Sardines PS 0.51 0.70
PE 5.85 6.79
PVC 7.86 7.90
PP 0.62 1.77
PMMA 13.96 17.54
Crabs PS 0.05 0.07
PE 0.62 0.72
PVC 0.83 0.83
PP 0.07 0.19
PMMA 1.48 1.86

S12
Table S 10 Mass (µg) of each plastic found in the procedural blanks (n=10) measured by Py-GC/MS
Sample mass (ug)
KOH filters PS PE PVC PP PMMA
1 - 0.2 0.2 1.4 -
2 - 0.1 - - -
3 - - - - -
4 - 0.1 - - -
5 - - - - -
6 - - - - -
7 - - - - -
8 - 0.1 - - -
9 - - - - -
10 - 0.1 - - -
Sum - 0.6 0.2 1.5 -
Average - 0.1 - 0.1 -
Std - 0.1 - 0.4 -

S13
Table S 11 Concentration of PS, PE, PVC, PP and PMMA (µg/g tissue) measured in seafood (each sample was analysed in
triplicate); < LOQ: below limit of quantification; when a value was <LOQ, ½ LOD was used;
Sample ID Concentration (µg g-1)
ƩPlastic
(µg g-1)
Oysters PS PE PVC PP PMMA
Crassostrea gigas
1 - - 23.55 - - 23.55
2 - - 13.40 - - 13.40
3 - - < LOQ - - 0.52
4 - - < LOQ - - 0.52
5 - - 14.32 - - 14.32
6 - - 14.82 < LOQ - 15.23
7 - - 17.60 < LOQ - 18.01
8 - - - - - -
9 - - - < LOQ - 0.41
10 - - 16.18 < LOQ - 16.59
Prawns PS PE PVC PP PMMA
Penaeus esculentus
1 - - 11.52 < LOQ - 11.95
2 - - 15.93 10.46 - 26.39
3 - - - - - -
4 - - - < LOQ - 0.43
5 - - - - - -
6 - - - 3.53 - 3.53
7 - - - 7.24 - 7.24
8 - - - 15.43 - 15.43
9 - - - 2.92 - 2.92
10 - - - 4.50 - 4.50
Squid PS PE PVC PP PMMA
Nototodarus gouldi
1 - - 10.91 < LOQ - 11.23
2 - - - - - -
3 - - - < LOQ - 0.32
4 - - - - - -
5 - - - 23.85 - 23.85
6 - - - - - -
7 - - - - - -
8 - - - - - -
9 - - - - - -
10 - - - - - -

S14
Crabs PS PE PVC PP PMMA
Portunus armatus
1 8.07 - 29.05 10.27 4.53 51.92
2 2.86 - 1.18 11.82 < LOQ 16.60
3 4.98 - 5.39 19.30 - 29.67
4 0.58 - 1.15 25.76 - 27.49
5 0.69 - 20.53 14.74 - 35.96
6 0.28 - 3.68 2.55 - 6.51
7 0.57 - 3.32 14.29 - 18.18
8 6.80 - 39.31 3.26 2.43 51.80
9 0.86 - 18.61 7.25 - 26.72
10 1.21 43.18 29.34 2.53 - 76.26
Sardines PS PE PVC PP PMMA
Sardinops neopilchardus
1 - - - 3.32 13.96 17.28
2 - - - - - -
3 < LOQ - - 13.44 - 13.69
4 0.87 111.55 - 5.38 - 117.80
5 27.30 - < LOQ 59.89 - 87.44
6 < LOQ - - 12.96 - 13.21
7 0.85 70.24 - 1.59 - 72.68
8 1.93 - - 45.54 - 47.47
9 - - - 1.78 - 1.78
10 102.65 2352.28 9.72 - 26.76 2491.41

S15
Figure S 1 Experimental design for the extraction of oyster’s. Filters were spiked with 6 different plastics:
PS, PE, PET, PMMA, PP and PVC. Six glass fibre filters were used as a “blank” with no plastic added and
the other 36 were spiked with selected plastics (as schematized)

S16
PVC Benzene 2.88 min
Figure S 2 Total Ion Chromatogram (TIC) pyrograms of extracted plastics by ASE. Detailed decomposition
products and retention times are summarized in Table S4. Polystyrene (PS), polypropylene (PP), poly-(methyl
methacrylate) (PMMA), polyethylene (PE) and polyvinyl chloride (PVC)
S17
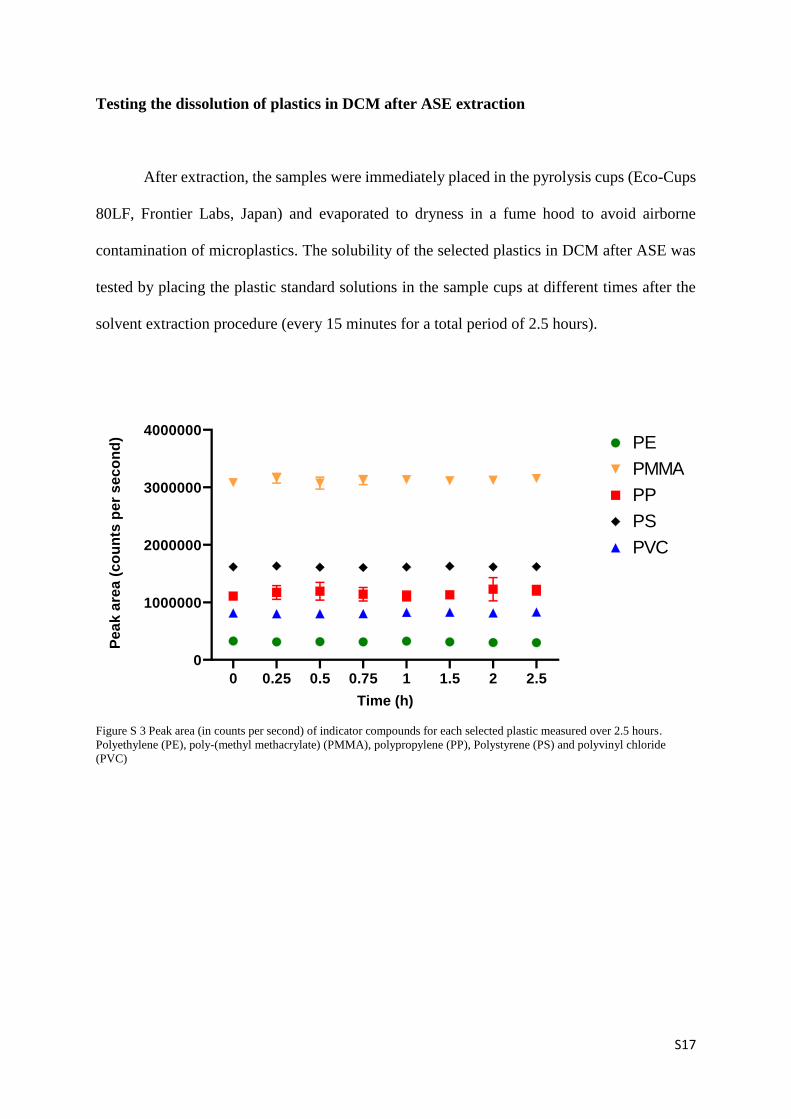
Testing the dissolution of plastics in DCM after ASE extraction
After extraction, the samples were immediately placed in the pyrolysis cups (Eco-Cups
80LF, Frontier Labs, Japan) and evaporated to dryness in a fume hood to avoid airborne
contamination of microplastics. The solubility of the selected plastics in DCM after ASE was
tested by placing the plastic standard solutions in the sample cups at different times after the
solvent extraction procedure (every 15 minutes for a total period of 2.5 hours).
0 0.25 0.5 0.75 1 1.5 2 2.5
0
1000000
2000000
3000000
4000000
Time (h)
Pe
ak
are
a (
co
un
ts p
er
se
co
nd
) PE
PMMA
PP
PS
PVC
Figure S 3 Peak area (in counts per second) of indicator compounds for each selected plastic measured over 2.5 hours.
Polyethylene (PE), poly-(methyl methacrylate) (PMMA), polypropylene (PP), Polystyrene (PS) and polyvinyl chloride
(PVC)

S18
Relation between peak area of specific indicator compounds and split ratio
For all the indicator ions of selected plastics, areas significantly decreased with the
increase of the split ratio (p < 0.05, One Way ANOVA) - Figure S4. Assuming linearity, the
split ratio was set at 5 ensuring that the selected plastics in our samples were efficiently
quantified and saturation of the mass spectrometer was avoided.
0 10 20 30 40 50
0
1×10⁶
2×10⁶
3×10⁶
4×10⁶
5×10⁶
Split ratio
Peak a
rea (
co
un
ts p
er
seco
nd
)
1 - decene (C10) (PE)
2,4, 6-dimethyl-1-heptene (PP)
Benzene (PVC)
Methyl Methacrylate (PMMA)
3-butene-1,3- diyldibenzene (PS)
R2=0.83
5
R2=0.91
R2=0.68
R2=0.98
R2=0.94
Figure S 4 Correlation between peak area (in counts per second) of specific compounds selected for each plastic and split ratio
(50:1, 20:1, 10:1 and 5:1); polystyrene (PS), polyethylene (PE), polyvinyl chloride (PVC) polypropylene (PP) and poly-(methyl
methacrylate) (PMMA)

S19
Figure S 5 Comparison of a TIC (total ion chromatogram) of a plastic standard mixture with TICs of analysed seafood

S20
References
1. Molinaro, A. M.; Simon, R.; Pfeiffer, R. M., Prediction error estimation: a
comparison of resampling methods. Bioinformatics 2005, 21, (15), 3301-3307.
2. Samanipour, S.; Dimitriou-Christidis, P.; Gros, J.; Grange, A.; Samuel Arey, J.,
Analyte quantification with comprehensive two-dimensional gas chromatography:
Assessment of methods for baseline correction, peak delineation, and matrix effect
elimination for real samples. J. Chromatogr. A 2015, 1375, 123-139.