Embed Size (px)
Citation preview
Int. J. Electrochem. Sci., 7 (2012) 569 - 587
International Journal of
ELECTROCHEMICAL SCIENCE
www.electrochemsci.org
Quantitative Determination of Alendronate in Human Urine
Vinod Kumar Gupta1,2,*
, Rajeev Jain3, Sandeep Sharma
3, Shilpi Agarwal
1, Ashish Dwivedi
3
1 Department of Chemistry, Indian Institute of Technology, Roorkee, Uttarakhand, India
2Chemistry Department, King Fahd University of Petroleum & Minerals, Dhahran 31261, Saudi
Arabia 3
School of Studies in Chemistry, Jiwaji University, Gwalior-474011, India *E-mail: [email protected]
Received: 4 November 2011 / Accepted: 9 December 2011 / Published: 1 January 2012
A rapid method based on high-performance liquid chromatography/electrospray–mass spectrometry
(HPLC/ESI-MS) for the quantitative determination of alendronate in human urine has been developed
and validated. Improved chromatographic separation and increased sensitivity of the detection was
achieved by derivatisation. Higher efficiency of derivatisation as well as, more discriminatory recovery
of the drug’s derivatives was obtained by the use of ‘on-cartridge’ reaction with diazomethane.
Important parameters such as sensitivity, linearity, matrix effect, reproducibility, stability, carry-over
and recovery were investigated during the validation. The lower limit of detection was found to be
0.250 ng/mL. The intra- and inter-run precision, calculated from quality control (QC) samples was less
than 5.0 %. The accuracy as determined from QC samples was in the range of 93.4–107.0% for the
analyte. The mean recoveries for the low, medium and high quality control samples were 97.6 %, 97.0
% and 98.7 % respectively. Various conditions arising from potential interference peaks as a result of
chromatographic separation of desired analytes were optimized. The developed method can provide a
very useful technique for the analysis of drugs in human subjects.
Keywords: Alendronate; Liquid Chromatography-Mass Spectrometry/Mass Spectrometry;
Derivatisation; Diazomethane; Human Urine; Bisphosphonates
1. INTRODUCTION
Alendronate, like other bisphosphonates, is a bone resorption inhibitor [1] being used in
prevention and treatment of bone diseases. It is used in the prevention and treatment of
postmenopausal osteoporosis [2], Paget’s disease, primary hyperparathyroidism, malignant
hypercalcemia and metastatic bone diseases. The pharmacological action of alendronate relies on its
interfering with the mevalonate pathway by inhibiting farnesyl pyrophosphate(FPP) synthase [3], and
thus reducing levels of geranylgeranyl diphosphate (GGPP), which is required for the prenylation of
Int. J. Electrochem. Sci., Vol. 7, 2012
570
guanosine triphosphate (GTP)-binding proteins (eg. Rab, Rac, Ras, Rho and Cdc42) that are essential
for osteoclast activity and survival [4,5]. Consequently alendronate interferes with the stability of the
ruffled border and stimulates osteoclast apoptosis, which reduces bone resorption, lowers bone
turnover, and promotes a positive bone balance [6]. Moreover, studies indicate that bisphosphonates
also influence osteoblasts and increase bone formation, and more recently others have reported that
bisphosphonates enhance osteoblast proliferation and maturation [7-9], and inhibit osteoblast apoptosis
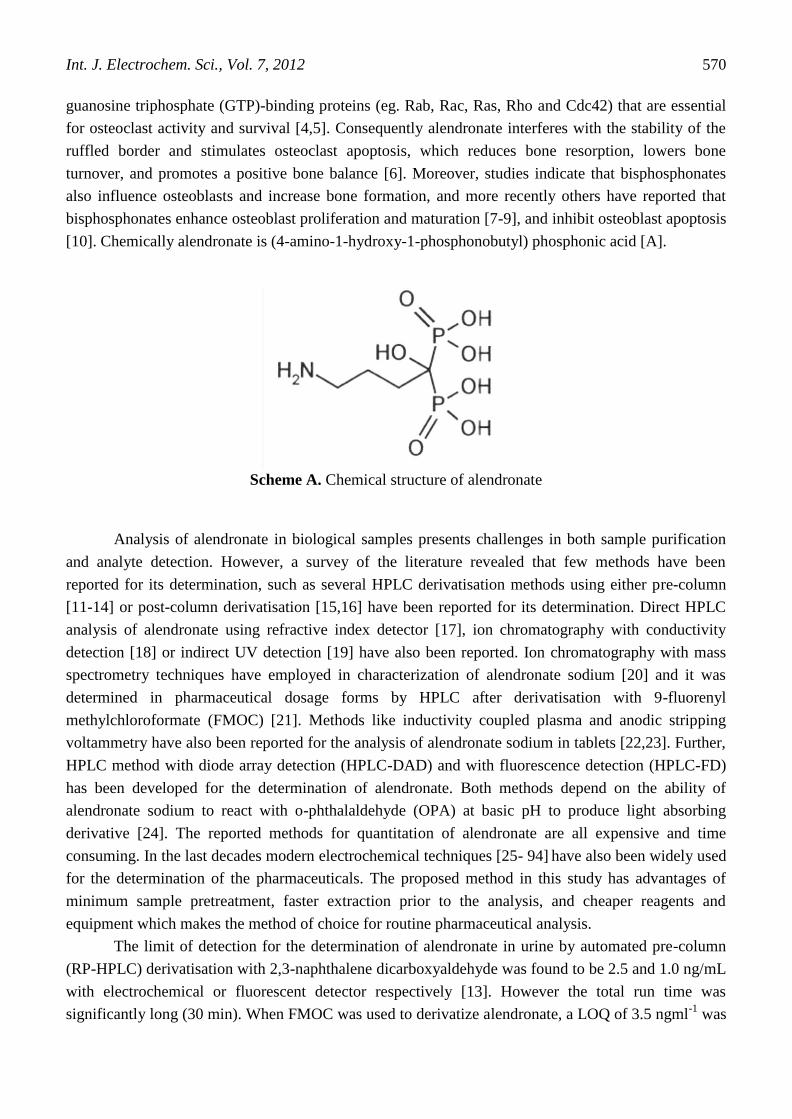
[10]. Chemically alendronate is (4-amino-1-hydroxy-1-phosphonobutyl) phosphonic acid [A].
Scheme A. Chemical structure of alendronate
Analysis of alendronate in biological samples presents challenges in both sample purification
and analyte detection. However, a survey of the literature revealed that few methods have been
reported for its determination, such as several HPLC derivatisation methods using either pre-column
[11-14] or post-column derivatisation [15,16] have been reported for its determination. Direct HPLC
analysis of alendronate using refractive index detector [17], ion chromatography with conductivity
detection [18] or indirect UV detection [19] have also been reported. Ion chromatography with mass
spectrometry techniques have employed in characterization of alendronate sodium [20] and it was
determined in pharmaceutical dosage forms by HPLC after derivatisation with 9-fluorenyl
methylchloroformate (FMOC) [21]. Methods like inductivity coupled plasma and anodic stripping
voltammetry have also been reported for the analysis of alendronate sodium in tablets [22,23]. Further,
HPLC method with diode array detection (HPLC-DAD) and with fluorescence detection (HPLC-FD)
has been developed for the determination of alendronate. Both methods depend on the ability of
alendronate sodium to react with o-phthalaldehyde (OPA) at basic pH to produce light absorbing
derivative [24]. The reported methods for quantitation of alendronate are all expensive and time
consuming. In the last decades modern electrochemical techniques [25- 94] have also been widely used
for the determination of the pharmaceuticals. The proposed method in this study has advantages of
minimum sample pretreatment, faster extraction prior to the analysis, and cheaper reagents and
equipment which makes the method of choice for routine pharmaceutical analysis.
The limit of detection for the determination of alendronate in urine by automated pre-column
(RP-HPLC) derivatisation with 2,3-naphthalene dicarboxyaldehyde was found to be 2.5 and 1.0 ng/mL
with electrochemical or fluorescent detector respectively [13]. However the total run time was
significantly long (30 min). When FMOC was used to derivatize alendronate, a LOQ of 3.5 ngml-1
was
Int. J. Electrochem. Sci., Vol. 7, 2012
571
achieved with fluorescence detection [14]. In that method a gradient system was required and total run
time for one sample was 21 min. Immunochemical methods [95, 96] on the other hand offers higher
sensitivity, but inadequate selectivity and matrix effect are some of the known inherent drawbacks of
such methods. Thus, clinical analysis of alendronate demands a more sensitive and robust method.
Bisphosphonates were reported as not being amenable to analysis by HPLC with tandem mass
spectrometric detection (HPLC/MS/MS) due to strong interaction with metal ions and their tendency to
form adducts and multiple charged species [97]. The objective of the current work is to develop and
validate the LC-MS/MS bioanalytical method which has high sensitivity, selectivity, minimizes matrix
effect and has high sample throughput. The basis of the approach behind the objective is to derivatise
alendronate with diazomethane [98] on silica-based anion exchange columns during solid-phase
extraction (SPE).
2. MATERIALS AND METHODS
2.1. Reagents and materials
Alendronate sodium and d6 alendronate disodium (internal standard) were obtained from LGC
Promochem India Pvt. Ltd (Mumbai, India) and Neucon Pharma Pvt. Ltd. (Goa, India) respectively.
HPLC Grade acetonitrile and methanol were obtained from Merck, India. Deionized (18 MΏ /cm)
water was generated in house using a Milli-Q System from Millipore (Bedford, MA, USA).All other
solvents and reagents are of analytical grade and purchased from Merck, India or Spectrochem, India.
2.2. Preparation of Diazomethane
Diazomethane is a yellow gas at room temperature, liquefies at -230C, and freezes at -145
0C. It
is extremely toxic and highly irritating gas which when inhaled in high concentrations can result in
pulmonary edema. Long-term low- level exposure can lead to sensitization with asthma like
symptoms. Furthermore, diazomethane is cited as carcinogens. Rough surfaces and strong light are
known to detonate diazomethane. Keeping in view the toxicity of diazomethane, and as a preventive
measure, all reactions pertaining its preparation and subsequent use are carried out in a chemical fume
hood and behind a safety shield.
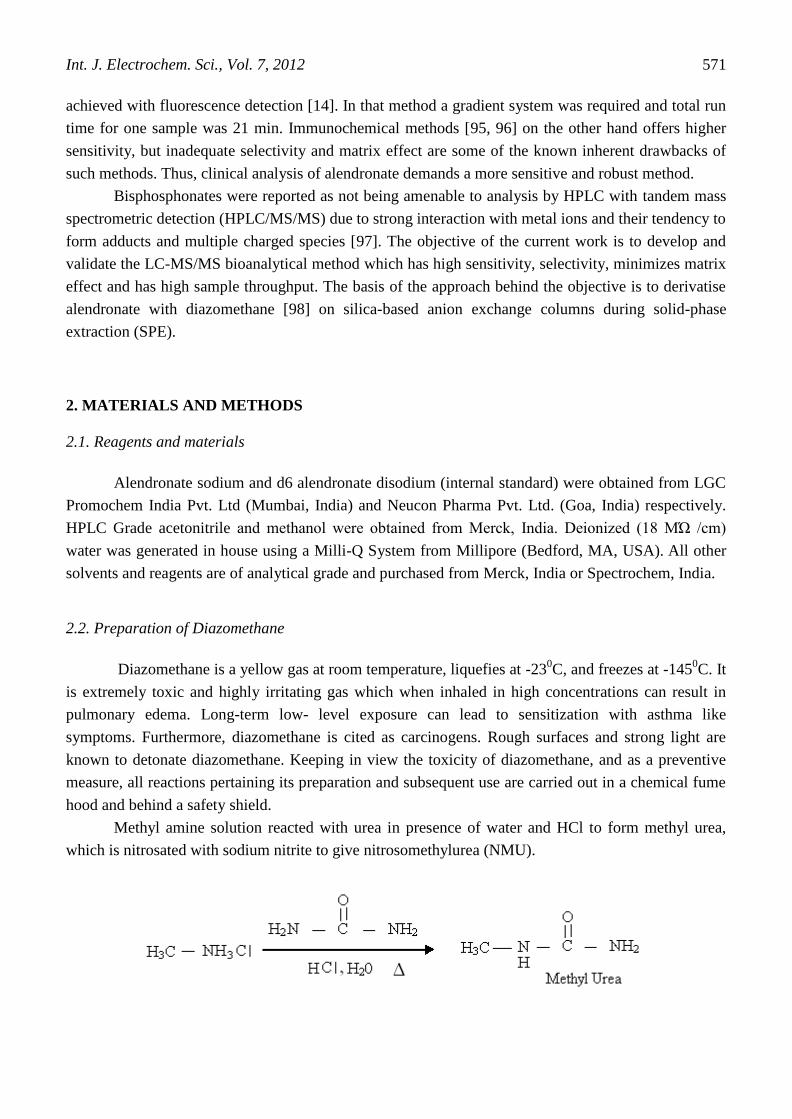
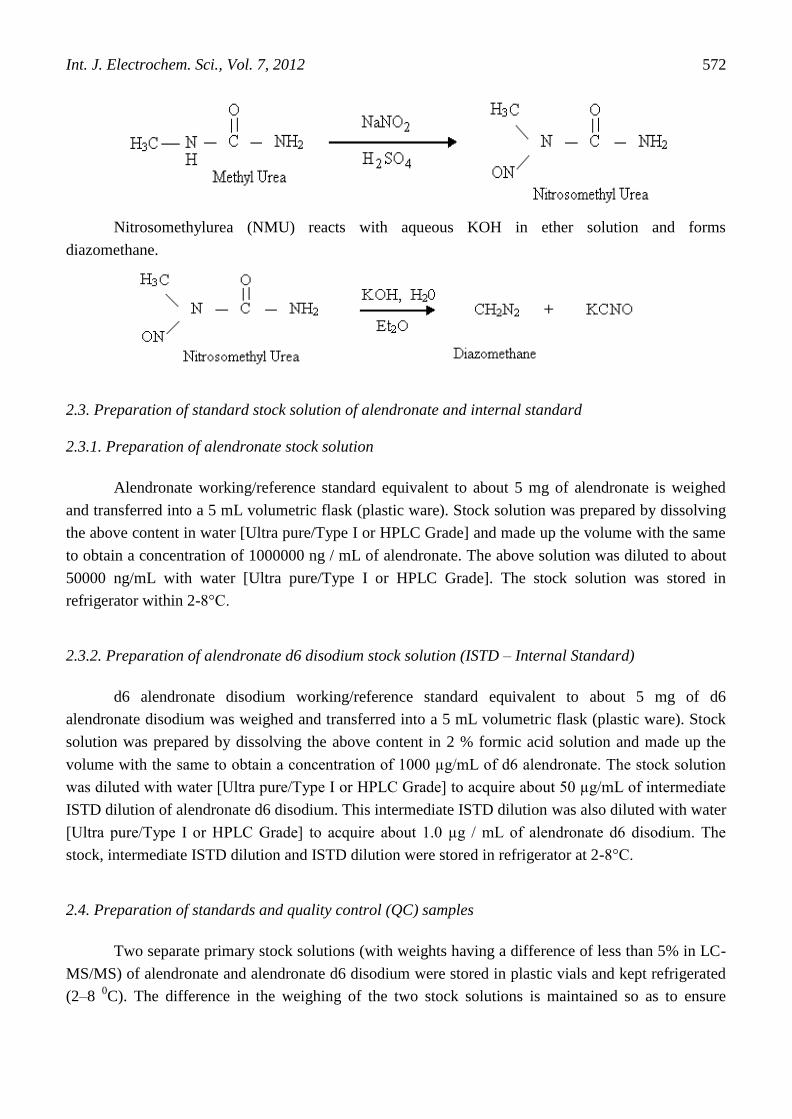
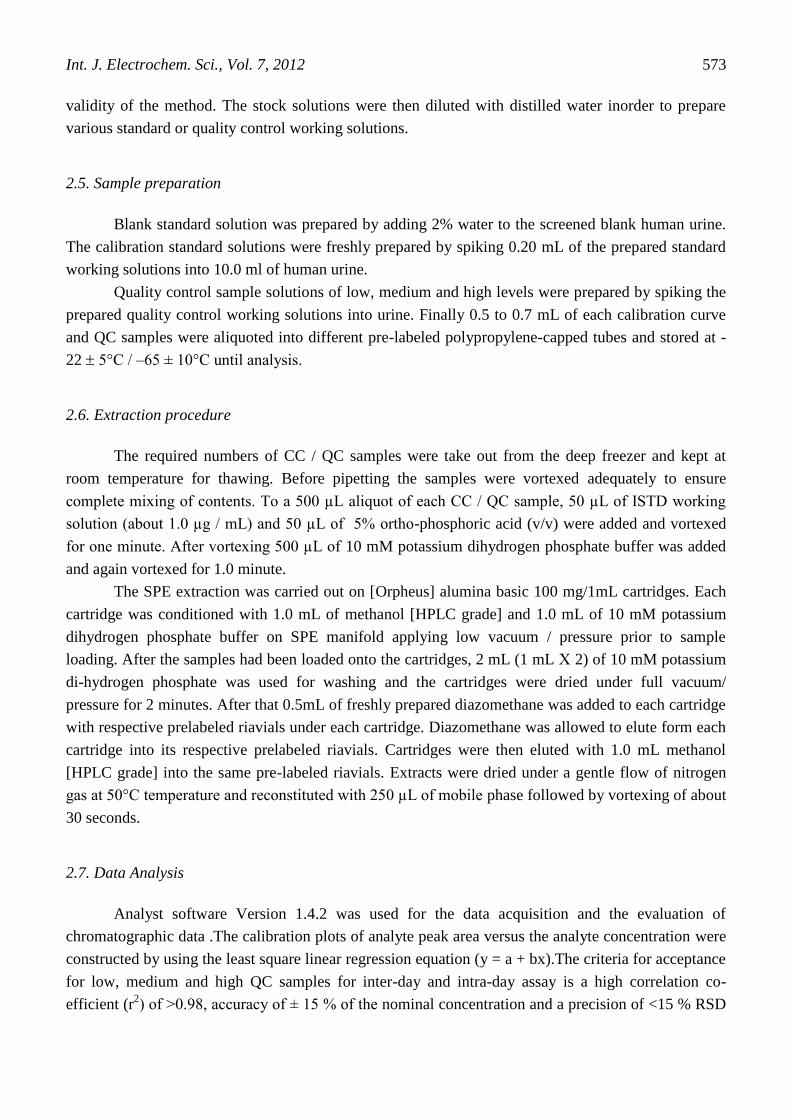
Methyl amine solution reacted with urea in presence of water and HCl to form methyl urea,
which is nitrosated with sodium nitrite to give nitrosomethylurea (NMU).
Int. J. Electrochem. Sci., Vol. 7, 2012
572
Nitrosomethylurea (NMU) reacts with aqueous KOH in ether solution and forms
diazomethane.
2.3. Preparation of standard stock solution of alendronate and internal standard
2.3.1. Preparation of alendronate stock solution
Alendronate working/reference standard equivalent to about 5 mg of alendronate is weighed
and transferred into a 5 mL volumetric flask (plastic ware). Stock solution was prepared by dissolving
the above content in water [Ultra pure/Type I or HPLC Grade] and made up the volume with the same
to obtain a concentration of 1000000 ng / mL of alendronate. The above solution was diluted to about
50000 ng/mL with water [Ultra pure/Type I or HPLC Grade]. The stock solution was stored in
refrigerator within 2-8°C.
2.3.2. Preparation of alendronate d6 disodium stock solution (ISTD – Internal Standard)
d6 alendronate disodium working/reference standard equivalent to about 5 mg of d6
alendronate disodium was weighed and transferred into a 5 mL volumetric flask (plastic ware). Stock
solution was prepared by dissolving the above content in 2 % formic acid solution and made up the
volume with the same to obtain a concentration of 1000 µg/mL of d6 alendronate. The stock solution
was diluted with water [Ultra pure/Type I or HPLC Grade] to acquire about 50 µg/mL of intermediate
ISTD dilution of alendronate d6 disodium. This intermediate ISTD dilution was also diluted with water
[Ultra pure/Type I or HPLC Grade] to acquire about 1.0 µg / mL of alendronate d6 disodium. The
stock, intermediate ISTD dilution and ISTD dilution were stored in refrigerator at 2-8°C.
2.4. Preparation of standards and quality control (QC) samples
Two separate primary stock solutions (with weights having a difference of less than 5% in LC-
MS/MS) of alendronate and alendronate d6 disodium were stored in plastic vials and kept refrigerated
(2–8 0C). The difference in the weighing of the two stock solutions is maintained so as to ensure
Int. J. Electrochem. Sci., Vol. 7, 2012
573
validity of the method. The stock solutions were then diluted with distilled water inorder to prepare
various standard or quality control working solutions.
2.5. Sample preparation
Blank standard solution was prepared by adding 2% water to the screened blank human urine.
The calibration standard solutions were freshly prepared by spiking 0.20 mL of the prepared standard
working solutions into 10.0 ml of human urine.
Quality control sample solutions of low, medium and high levels were prepared by spiking the
prepared quality control working solutions into urine. Finally 0.5 to 0.7 mL of each calibration curve
and QC samples were aliquoted into different pre-labeled polypropylene-capped tubes and stored at -
22 5°C / –65 ± 10°C until analysis.
2.6. Extraction procedure
The required numbers of CC / QC samples were take out from the deep freezer and kept at
room temperature for thawing. Before pipetting the samples were vortexed adequately to ensure
complete mixing of contents. To a 500 µL aliquot of each CC / QC sample, 50 µL of ISTD working
solution (about 1.0 µg / mL) and 50 µL of 5% ortho-phosphoric acid (v/v) were added and vortexed
for one minute. After vortexing 500 µL of 10 mM potassium dihydrogen phosphate buffer was added
and again vortexed for 1.0 minute.
The SPE extraction was carried out on [Orpheus] alumina basic 100 mg/1mL cartridges. Each
cartridge was conditioned with 1.0 mL of methanol [HPLC grade] and 1.0 mL of 10 mM potassium
dihydrogen phosphate buffer on SPE manifold applying low vacuum / pressure prior to sample
loading. After the samples had been loaded onto the cartridges, 2 mL (1 mL 2) of 10 mM potassium
di-hydrogen phosphate was used for washing and the cartridges were dried under full vacuum/
pressure for 2 minutes. After that 0.5mL of freshly prepared diazomethane was added to each cartridge
with respective prelabeled riavials under each cartridge. Diazomethane was allowed to elute form each
cartridge into its respective prelabeled riavials. Cartridges were then eluted with 1.0 mL methanol
[HPLC grade] into the same pre-labeled riavials. Extracts were dried under a gentle flow of nitrogen
gas at 50°C temperature and reconstituted with 250 µL of mobile phase followed by vortexing of about
30 seconds.
2.7. Data Analysis
Analyst software Version 1.4.2 was used for the data acquisition and the evaluation of
chromatographic data .The calibration plots of analyte peak area versus the analyte concentration were
constructed by using the least square linear regression equation (y = a + bx).The criteria for acceptance
for low, medium and high QC samples for inter-day and intra-day assay is a high correlation co-
efficient (r2) of >0.98, accuracy of ± 15 % of the nominal concentration and a precision of <15 % RSD
Int. J. Electrochem. Sci., Vol. 7, 2012
574
. The acceptance criteria for LLOQ sample is the same high correlation co-efficient and accuracy of ±
20 % of the nominal concentration and precision of <20 % RSD for the inter-day and intra-day assay.
The accuracy, sensitivity, precision, stability, recovery, reproducibility and reliability of the
analytical method were confirmed by validation in accordance with the USFDA guidelines [99].
3. MATERIAL AND METHODS
3.1. Method Development
3.1.1. Mass Spectrometric Conditions
Ionization and fragmentation efficiency were the two main mass parameters which determines
the detection or quantitation limit of alendronate compound. The ionization efficiency was typically a
compound dependent parameter which was significantly influenced by the gas phase basicity or acidity
in atmospheric pressure ionization. For electrospray, the important factor affecting the ionization
efficiency was the mobile phase.
Methylation of alendronate by using diazomethane was employed inorder to enhance the
sensitivity of the LC–MS/MS method for the quantification of alendronate. The mass spectrometry
was operated in the positive ion electrospray mode. The temperature of heated capillary was set at 350 0C and its potential to 4.5 K.V. Nitrogen was used as a curtain gas and zero air was used as a turbo and
nebulizer gas, set to 45 psi and 50 psi units respectively. The ultra pure nitrogen was used as a collision
gas and pressure was set to 5 mtorr, subsequently collision energy was set to 32 eV for analyte and
internal standard. Multi reaction monitoring (MRM) mode was employed and involved transition of
the [M-H]+ precursor ions to select ions at m/z 348 for drug and 354 for internal standard (IS)
respectively. The half height mass peak was set to 0.7+ 0.1 amu (unit resolution) for both Q1 & Q3
and dwell time of 200 msec for each MRM channel.
In this method deuterated analyte was used as the internal standard. Stable isotope of
alendronate i.e. d6 alendronate was used as internal standard to compensate for the potential matrix
effects, caused by co-eluting endogenous components in biological fluids. The detrimental matrix
effects have been identified as the primary cause for the failure of the quantitative bioanalytical LC-
MS/MS method.
To optimize above mentioned parameters, alendronate and internal standard were tuned in
development. A full scan electrospray positive ion mass spectrum was scanned and optimized. The
mass and instrument dependent parameters were optimized at various conditions for drug and internal
standard. A molecular ion was obtained by direct infusion of aqueous samples (500 ng/ml) at the flow
rate of 10 L/min. The Full scan spectra of alendronate showed [M+Na]+, [M+k]
+ and [M+NH4]
+ in
addition to the [M+H]+ ion, although the mobile phase contained no known sources of sodium,
potassium and other ions. The overall relative response of the [M+H]+ [M+NH4]
+ and [M+Na]
+
affected not only by presence of mobile phase additives (ammonium acetate) but also by the heated
capillary temperature. These adduct ions were eliminated by changing the decluster potential from 25
Int. J. Electrochem. Sci., Vol. 7, 2012
575
V to 45 V and finally it was kept at 60 V for both and entrance potential from 9 V to 10 V. The
condition was finally selected which favored the formation of the [M+H]+ ions. It was essential to
investigate the adduction of the ions because these ions were known to cause interference during
spectral analysis. After investigation it was found that P-C-P structure and phosphonic group was
responsible in producing adducts in the solution because they have a tendency to form chelate
compounds. In this whole process glassware was not used because glassware was the main source of
these adducts ions. The formation of dimmer and multimer in analyte spectra was also investigated
(Table 1) and it was not observed in the scanned graph. It was paramount to evaluate the ruggedness of
this mass spectral condition and consequently some more experiments were performed to evaluate the
method performances which are being mentioned below:
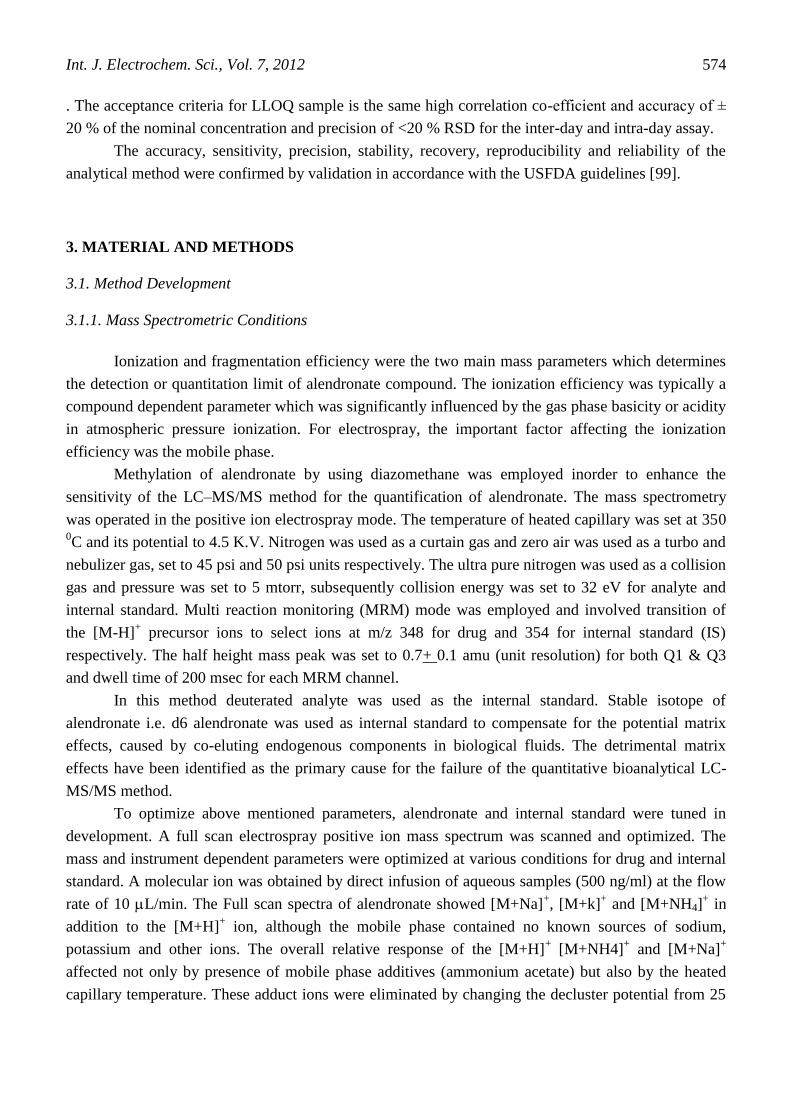
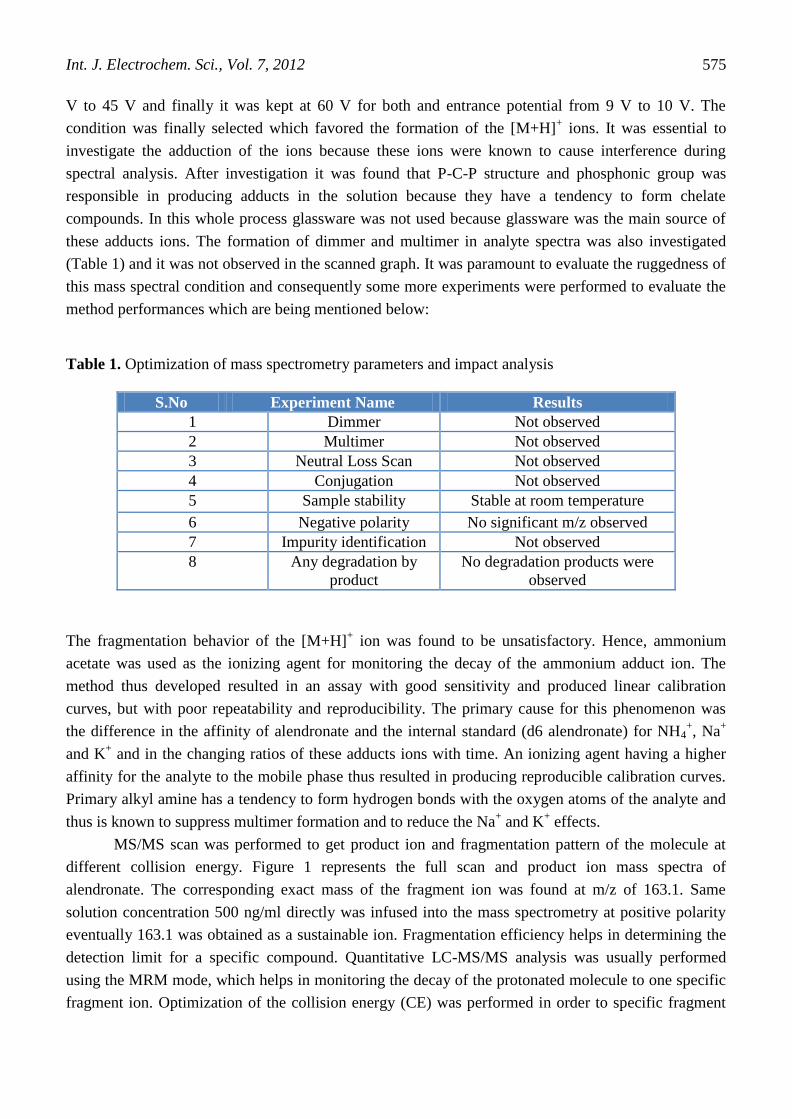
Table 1. Optimization of mass spectrometry parameters and impact analysis
S.No Experiment Name Results
1 Dimmer Not observed
2 Multimer Not observed
3 Neutral Loss Scan Not observed
4 Conjugation Not observed
5 Sample stability Stable at room temperature
6 Negative polarity No significant m/z observed
7 Impurity identification Not observed
8 Any degradation by
product
No degradation products were
observed
The fragmentation behavior of the [M+H]+ ion was found to be unsatisfactory. Hence, ammonium
acetate was used as the ionizing agent for monitoring the decay of the ammonium adduct ion. The
method thus developed resulted in an assay with good sensitivity and produced linear calibration
curves, but with poor repeatability and reproducibility. The primary cause for this phenomenon was
the difference in the affinity of alendronate and the internal standard (d6 alendronate) for NH4+, Na
+
and K+ and in the changing ratios of these adducts ions with time. An ionizing agent having a higher
affinity for the analyte to the mobile phase thus resulted in producing reproducible calibration curves.
Primary alkyl amine has a tendency to form hydrogen bonds with the oxygen atoms of the analyte and
thus is known to suppress multimer formation and to reduce the Na+ and K
+ effects.
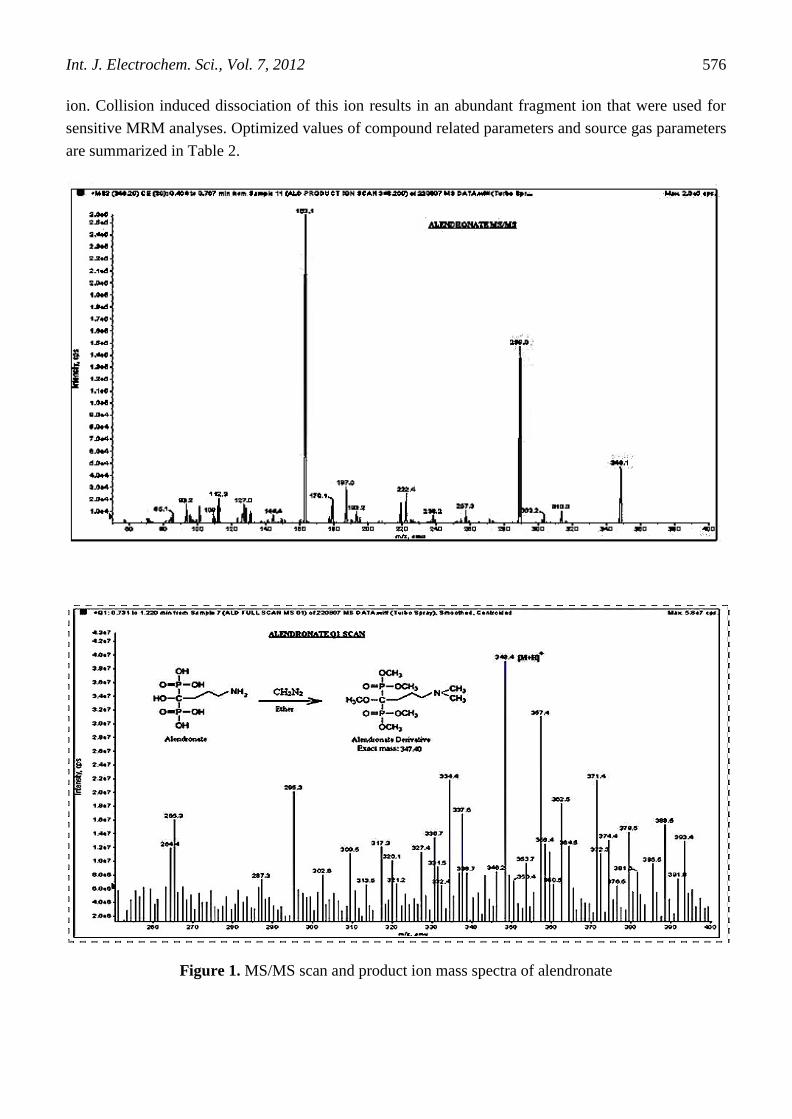
MS/MS scan was performed to get product ion and fragmentation pattern of the molecule at
different collision energy. Figure 1 represents the full scan and product ion mass spectra of
alendronate. The corresponding exact mass of the fragment ion was found at m/z of 163.1. Same
solution concentration 500 ng/ml directly was infused into the mass spectrometry at positive polarity
eventually 163.1 was obtained as a sustainable ion. Fragmentation efficiency helps in determining the
detection limit for a specific compound. Quantitative LC-MS/MS analysis was usually performed
using the MRM mode, which helps in monitoring the decay of the protonated molecule to one specific
fragment ion. Optimization of the collision energy (CE) was performed in order to specific fragment
Int. J. Electrochem. Sci., Vol. 7, 2012
576
ion. Collision induced dissociation of this ion results in an abundant fragment ion that were used for
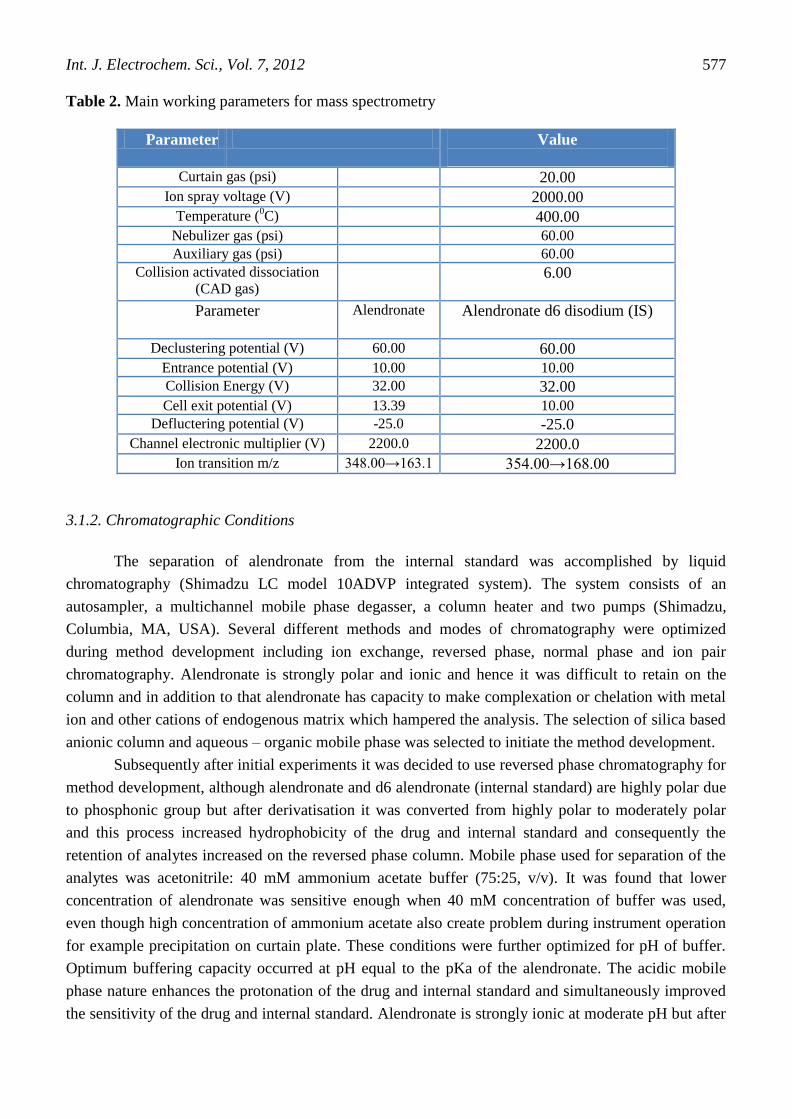
sensitive MRM analyses. Optimized values of compound related parameters and source gas parameters
are summarized in Table 2.
Figure 1. MS/MS scan and product ion mass spectra of alendronate
Int. J. Electrochem. Sci., Vol. 7, 2012
577
Table 2. Main working parameters for mass spectrometry
Parameter Value
Curtain gas (psi) 20.00
Ion spray voltage (V) 2000.00
Temperature (0C) 400.00
Nebulizer gas (psi) 60.00
Auxiliary gas (psi) 60.00
Collision activated dissociation
(CAD gas) 6.00
Parameter Alendronate Alendronate d6 disodium (IS)
Declustering potential (V) 60.00 60.00
Entrance potential (V) 10.00 10.00 Collision Energy (V) 32.00 32.00
Cell exit potential (V) 13.39 10.00 Defluctering potential (V) -25.0 -25.0
Channel electronic multiplier (V) 2200.0 2200.0
Ion transition m/z 348.00→163.1 354.00→168.00
3.1.2. Chromatographic Conditions
The separation of alendronate from the internal standard was accomplished by liquid
chromatography (Shimadzu LC model 10ADVP integrated system). The system consists of an
autosampler, a multichannel mobile phase degasser, a column heater and two pumps (Shimadzu,
Columbia, MA, USA). Several different methods and modes of chromatography were optimized
during method development including ion exchange, reversed phase, normal phase and ion pair
chromatography. Alendronate is strongly polar and ionic and hence it was difficult to retain on the
column and in addition to that alendronate has capacity to make complexation or chelation with metal
ion and other cations of endogenous matrix which hampered the analysis. The selection of silica based
anionic column and aqueous – organic mobile phase was selected to initiate the method development.
Subsequently after initial experiments it was decided to use reversed phase chromatography for
method development, although alendronate and d6 alendronate (internal standard) are highly polar due
to phosphonic group but after derivatisation it was converted from highly polar to moderately polar
and this process increased hydrophobicity of the drug and internal standard and consequently the
retention of analytes increased on the reversed phase column. Mobile phase used for separation of the
analytes was acetonitrile: 40 mM ammonium acetate buffer (75:25, v/v). It was found that lower
concentration of alendronate was sensitive enough when 40 mM concentration of buffer was used,
even though high concentration of ammonium acetate also create problem during instrument operation
for example precipitation on curtain plate. These conditions were further optimized for pH of buffer.
Optimum buffering capacity occurred at pH equal to the pKa of the alendronate. The acidic mobile
phase nature enhances the protonation of the drug and internal standard and simultaneously improved
the sensitivity of the drug and internal standard. Alendronate is strongly ionic at moderate pH but after
Int. J. Electrochem. Sci., Vol. 7, 2012
578
derivatisation, pKa of compound got changed and hence ionic formation was also reequbilirate which
was significantly helpful to retain compound on column. Chromatography of these anionic analyte was
possible on SCX column and it was also maintained that irreversible reaction should not occur during
actual sample analysis. The stationary phase (SCX) was modified into an ion exchange resin after
often with quaternary ammonium functional group and these were suitable for the chromatography of
relatively strong ionic species. The pH played a major role for retaining these ionic compounds at
column so it was thoroughly planned to maintain ionic equilibration in the mobile phase system
henceforth different pH from 2.0 to 6.5 were checked in mobile phase composition and critical points
were insured against the sustainability of injection, reproducibility of the signal at interday and
intraday, ruggedness, sensitivity, selectivity, specificity and retention of the drug and internal standard
on column. The largest peak area for the alendronate was obtained when the on column solution pH
was pH 4.0.
Biological samples particularly plasma and urine samples were likely to have pyrophosphate in
the sample, which could possibly be an interference. Because a strong eluent condition of 40 mM
ammonium acetate concentration was used, pyrophosphate elutes early and consequently did not
interfere in the determination of alendronate. Furthermore initial reversed phase HPLC experiment
showed that acceptable chromatography could be obtained for alendronate and internal standard in
urine extracts using a Zorbax SCX column in addition to that flow rate was also optimized and it has
significantly improved peak symmetry and chromatographic conditions. Earlier 0.6 mL/min of flow
rate was taken but it was optimized and changed to 1.0 mL/min. Consequently in initial experiments,
drug and internal standard peak width at half height was found to be 48 sec but after optimization of
the flow rate, the peak area remarkably improved from 48 to 35 secs.
Alendronate intensity was significantly depending on the on column pH during derivatisation.
Phosphonic ion is highly pH dependent. Column pH was checked and optimized. This is because
alendronate sensitivity is totally dependent on its methylation during derivatisation. Derivatisation
occurred at hepta level and hence it was only possible due to pH of adsorption phase when
diazomethane was loaded to the column. Initially sample buffer pH was 7.8 but after optimization it
was kept at 4.5. Furthermore the presence of alcohols affects the solubility of hydroxyl groups of
alendronate. In some experiments it was noticed that the analyte methylation peak area was obtained
with significant intensity when the pH of the solid phase column reaction was 3.5 at the loading time
of diazomethane. Hence a washing buffer was used because it was a poor ligand for alendronate and it
did not alter sensitivity significantly. Diazomethane concentration had a major impact on the
ruggedness of the method. Diazomethane reaction could be performed efficiently on silica base anion
cartridge sorbents. Underivatised alendronate binds strongly with quaternary ammonium ion and its
interaction was mainly due to wander-walls, pi-pi bonding and hydrogen bonding. This bonding was
disrupted by diazomethane when it was slowly added to the solid phase tube. It reacted with
alendronate sites; subsequently methylation reaction started and it reacted on all available sites of the
alendronate molecules. As a result it was converted from highly polar compound to moderately polar
and hence it was easy to analyze alendronate at LC-MS/MS platform by employing reversed phase
chromatography. However diazomethane volume was optimized to enhance the analyte signal. The
volume was used from 250 µL to 1000 µL and it was found that there were very poor signal from 250
Int. J. Electrochem. Sci., Vol. 7, 2012
579
µL to 350 µL, but the signal was good at 400 µL to 1000 µL. Consequently most sensitive signal was
observed at 500 µL which was also sustainable at different conditions. Attempt was made to keep
diazomethane volume as much low as possible because diazomethane is highly toxic and explosive in
nature; hence all reactions starting from its preparation to its use were carried out under a highly
efficient chemical fume hood and behind a safety shield.
3.2. Method Validation
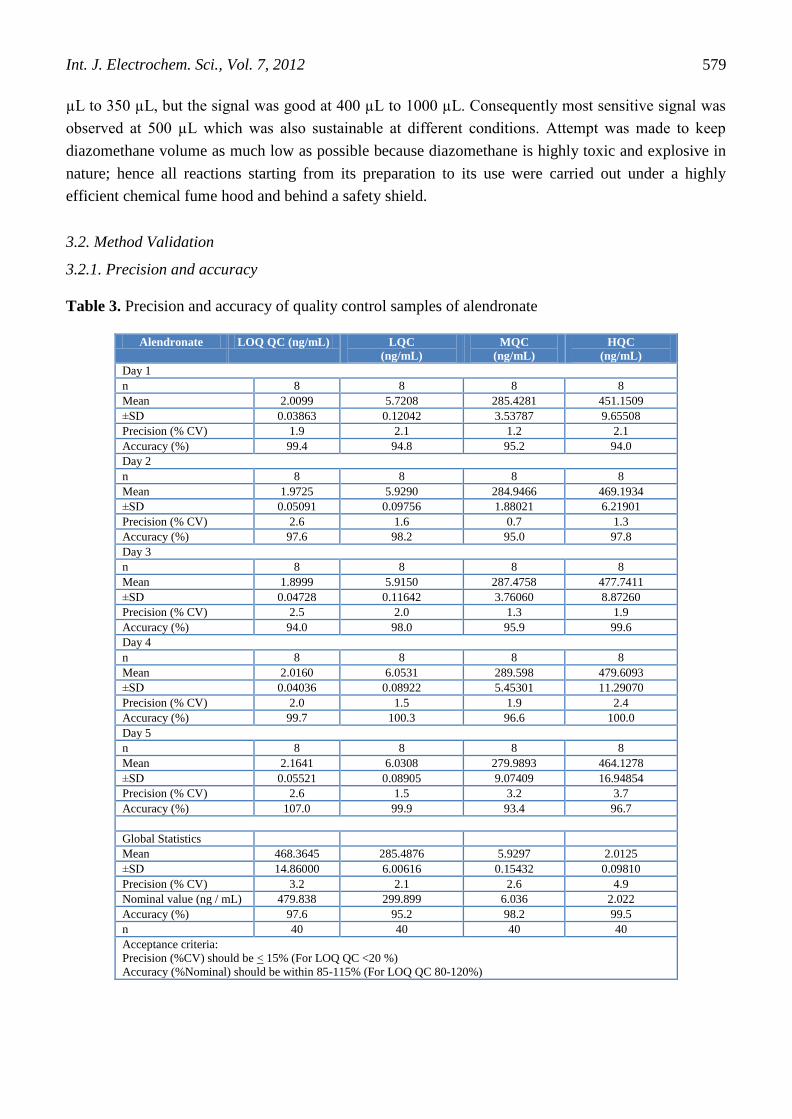
3.2.1. Precision and accuracy
Table 3. Precision and accuracy of quality control samples of alendronate
Alendronate LOQ QC (ng/mL) LQC
(ng/mL)
MQC
(ng/mL)
HQC
(ng/mL)
Day 1
n 8 8 8 8
Mean 2.0099 5.7208 285.4281 451.1509
±SD 0.03863 0.12042 3.53787 9.65508
Precision (% CV) 1.9 2.1 1.2 2.1
Accuracy (%) 99.4 94.8 95.2 94.0
Day 2
n 8 8 8 8
Mean 1.9725 5.9290 284.9466 469.1934
±SD 0.05091 0.09756 1.88021 6.21901
Precision (% CV) 2.6 1.6 0.7 1.3
Accuracy (%) 97.6 98.2 95.0 97.8
Day 3
n 8 8 8 8
Mean 1.8999 5.9150 287.4758 477.7411
±SD 0.04728 0.11642 3.76060 8.87260
Precision (% CV) 2.5 2.0 1.3 1.9
Accuracy (%) 94.0 98.0 95.9 99.6
Day 4
n 8 8 8 8
Mean 2.0160 6.0531 289.598 479.6093
±SD 0.04036 0.08922 5.45301 11.29070
Precision (% CV) 2.0 1.5 1.9 2.4
Accuracy (%) 99.7 100.3 96.6 100.0
Day 5
n 8 8 8 8
Mean 2.1641 6.0308 279.9893 464.1278
±SD 0.05521 0.08905 9.07409 16.94854
Precision (% CV) 2.6 1.5 3.2 3.7
Accuracy (%) 107.0 99.9 93.4 96.7
Global Statistics
Mean 468.3645 285.4876 5.9297 2.0125
±SD 14.86000 6.00616 0.15432 0.09810
Precision (% CV) 3.2 2.1 2.6 4.9
Nominal value (ng / mL) 479.838 299.899 6.036 2.022
Accuracy (%) 97.6 95.2 98.2 99.5
n 40 40 40 40
Acceptance criteria:
Precision (%CV) should be < 15% (For LOQ QC <20 %)
Accuracy (%Nominal) should be within 85-115% (For LOQ QC 80-120%)
Int. J. Electrochem. Sci., Vol. 7, 2012
580
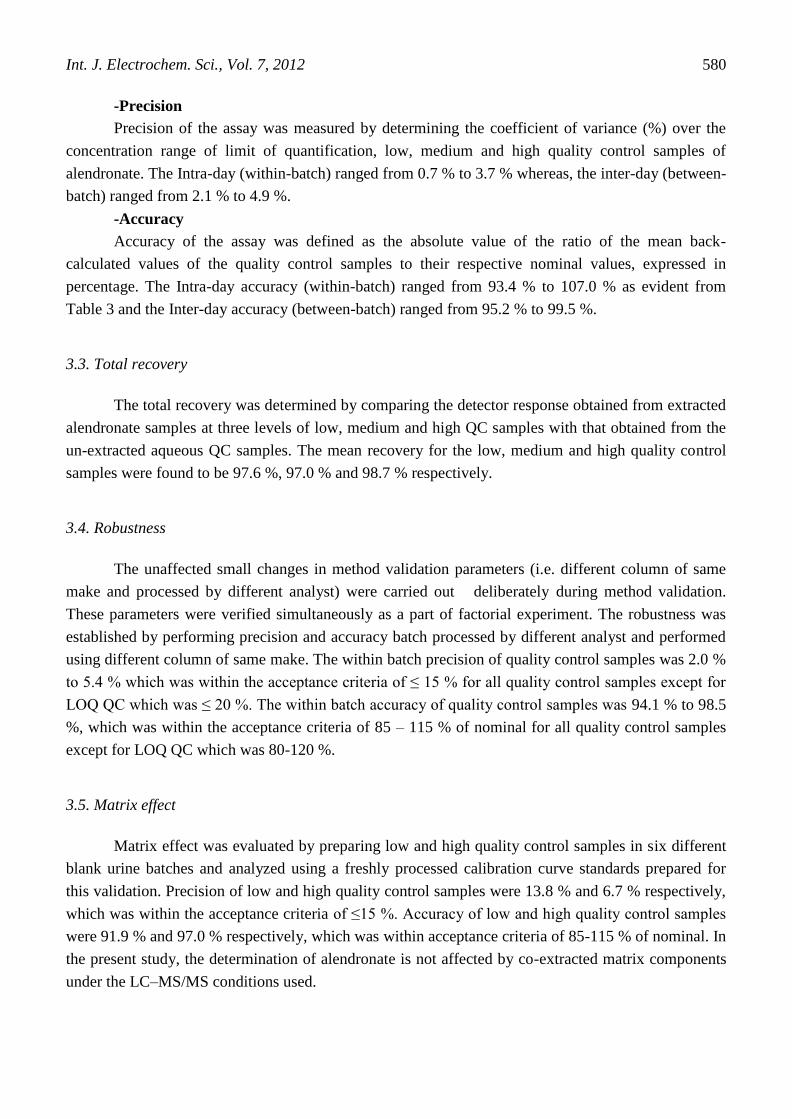
-Precision
Precision of the assay was measured by determining the coefficient of variance (%) over the
concentration range of limit of quantification, low, medium and high quality control samples of
alendronate. The Intra-day (within-batch) ranged from 0.7 % to 3.7 % whereas, the inter-day (between-
batch) ranged from 2.1 % to 4.9 %.
-Accuracy
Accuracy of the assay was defined as the absolute value of the ratio of the mean back-
calculated values of the quality control samples to their respective nominal values, expressed in
percentage. The Intra-day accuracy (within-batch) ranged from 93.4 % to 107.0 % as evident from
Table 3 and the Inter-day accuracy (between-batch) ranged from 95.2 % to 99.5 %.
3.3. Total recovery
The total recovery was determined by comparing the detector response obtained from extracted
alendronate samples at three levels of low, medium and high QC samples with that obtained from the
un-extracted aqueous QC samples. The mean recovery for the low, medium and high quality control
samples were found to be 97.6 %, 97.0 % and 98.7 % respectively.
3.4. Robustness
The unaffected small changes in method validation parameters (i.e. different column of same
make and processed by different analyst) were carried out deliberately during method validation.
These parameters were verified simultaneously as a part of factorial experiment. The robustness was
established by performing precision and accuracy batch processed by different analyst and performed
using different column of same make. The within batch precision of quality control samples was 2.0 %
to 5.4 % which was within the acceptance criteria of ≤ 15 % for all quality control samples except for
LOQ QC which was ≤ 20 %. The within batch accuracy of quality control samples was 94.1 % to 98.5
%, which was within the acceptance criteria of 85 – 115 % of nominal for all quality control samples
except for LOQ QC which was 80-120 %.
3.5. Matrix effect
Matrix effect was evaluated by preparing low and high quality control samples in six different
blank urine batches and analyzed using a freshly processed calibration curve standards prepared for
this validation. Precision of low and high quality control samples were 13.8 % and 6.7 % respectively,
which was within the acceptance criteria of ≤15 %. Accuracy of low and high quality control samples
were 91.9 % and 97.0 % respectively, which was within acceptance criteria of 85-115 % of nominal. In
the present study, the determination of alendronate is not affected by co-extracted matrix components
under the LC–MS/MS conditions used.
Int. J. Electrochem. Sci., Vol. 7, 2012
581
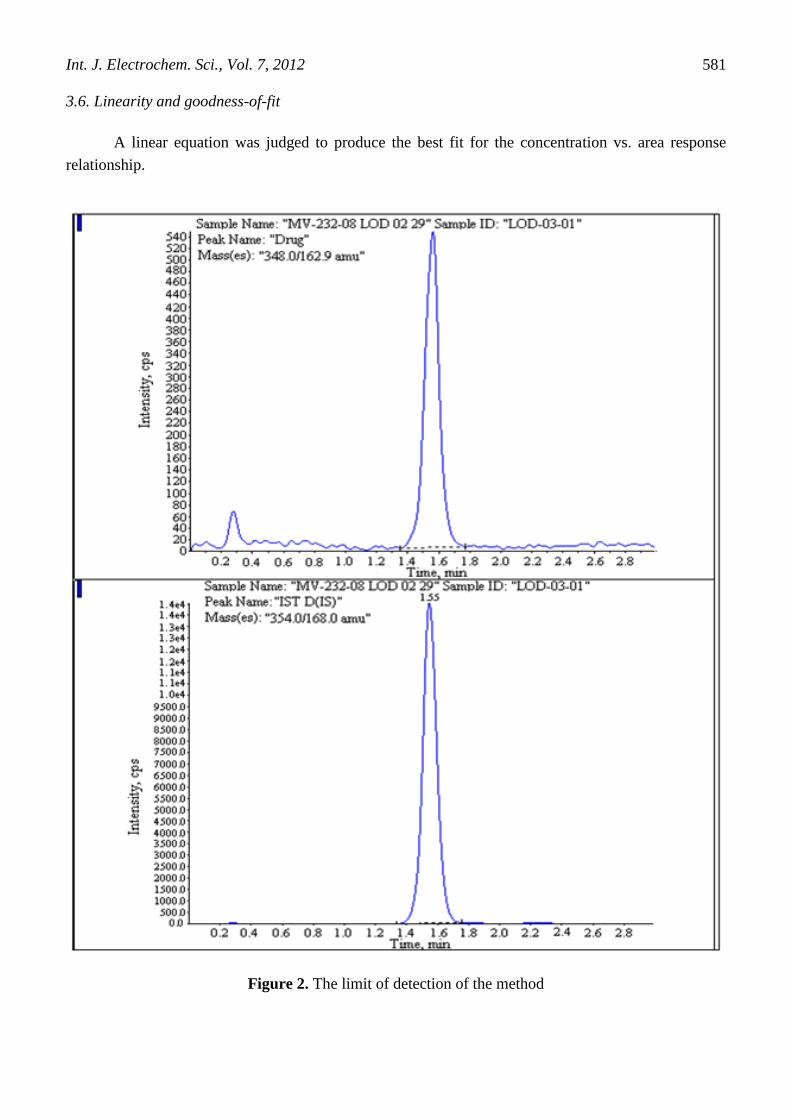
3.6. Linearity and goodness-of-fit
A linear equation was judged to produce the best fit for the concentration vs. area response
relationship.
Figure 2. The limit of detection of the method
Int. J. Electrochem. Sci., Vol. 7, 2012
582
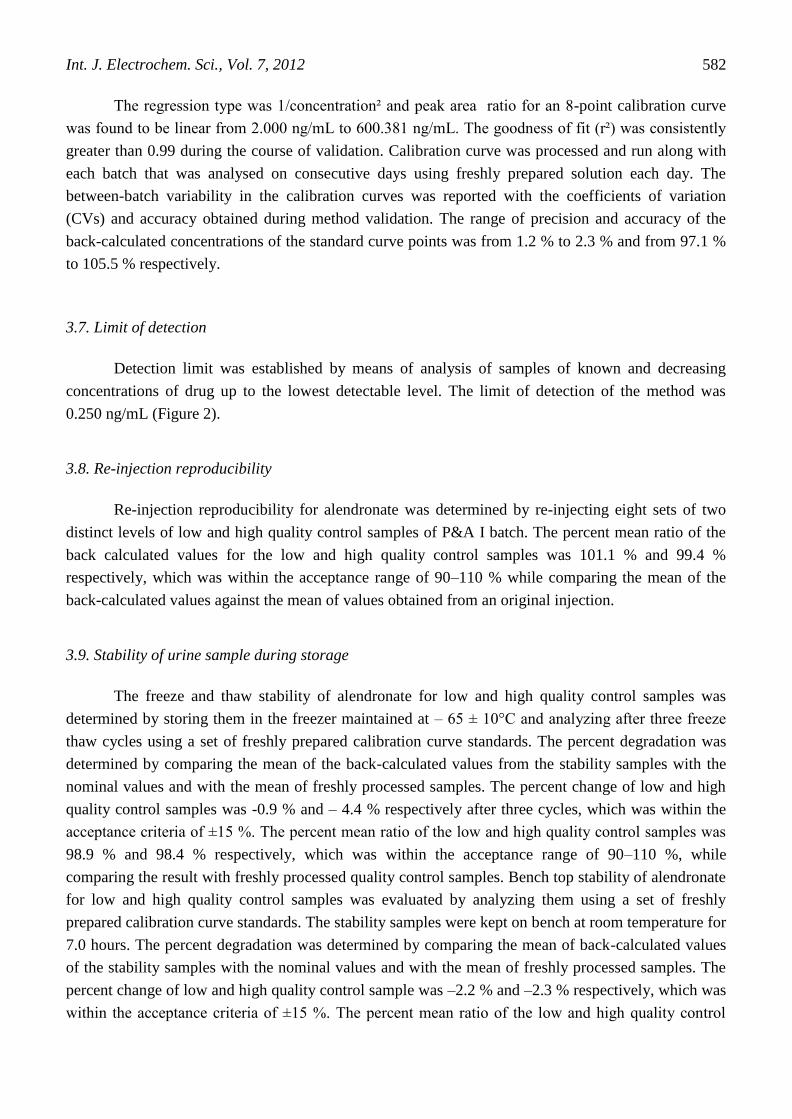
The regression type was 1/concentration² and peak area ratio for an 8-point calibration curve
was found to be linear from 2.000 ng/mL to 600.381 ng/mL. The goodness of fit (r²) was consistently
greater than 0.99 during the course of validation. Calibration curve was processed and run along with
each batch that was analysed on consecutive days using freshly prepared solution each day. The
between-batch variability in the calibration curves was reported with the coefficients of variation
(CVs) and accuracy obtained during method validation. The range of precision and accuracy of the
back-calculated concentrations of the standard curve points was from 1.2 % to 2.3 % and from 97.1 %
to 105.5 % respectively.
3.7. Limit of detection
Detection limit was established by means of analysis of samples of known and decreasing
concentrations of drug up to the lowest detectable level. The limit of detection of the method was
0.250 ng/mL (Figure 2).
3.8. Re-injection reproducibility
Re-injection reproducibility for alendronate was determined by re-injecting eight sets of two
distinct levels of low and high quality control samples of P&A I batch. The percent mean ratio of the
back calculated values for the low and high quality control samples was 101.1 % and 99.4 %
respectively, which was within the acceptance range of 90–110 % while comparing the mean of the
back-calculated values against the mean of values obtained from an original injection.
3.9. Stability of urine sample during storage
The freeze and thaw stability of alendronate for low and high quality control samples was
determined by storing them in the freezer maintained at – 65 ± 10°C and analyzing after three freeze
thaw cycles using a set of freshly prepared calibration curve standards. The percent degradation was
determined by comparing the mean of the back-calculated values from the stability samples with the
nominal values and with the mean of freshly processed samples. The percent change of low and high
quality control samples was -0.9 % and – 4.4 % respectively after three cycles, which was within the
acceptance criteria of ±15 %. The percent mean ratio of the low and high quality control samples was
98.9 % and 98.4 % respectively, which was within the acceptance range of 90–110 %, while
comparing the result with freshly processed quality control samples. Bench top stability of alendronate
for low and high quality control samples was evaluated by analyzing them using a set of freshly
prepared calibration curve standards. The stability samples were kept on bench at room temperature for
7.0 hours. The percent degradation was determined by comparing the mean of back-calculated values
of the stability samples with the nominal values and with the mean of freshly processed samples. The
percent change of low and high quality control sample was –2.2 % and –2.3 % respectively, which was
within the acceptance criteria of ±15 %. The percent mean ratio of the low and high quality control
Int. J. Electrochem. Sci., Vol. 7, 2012
583
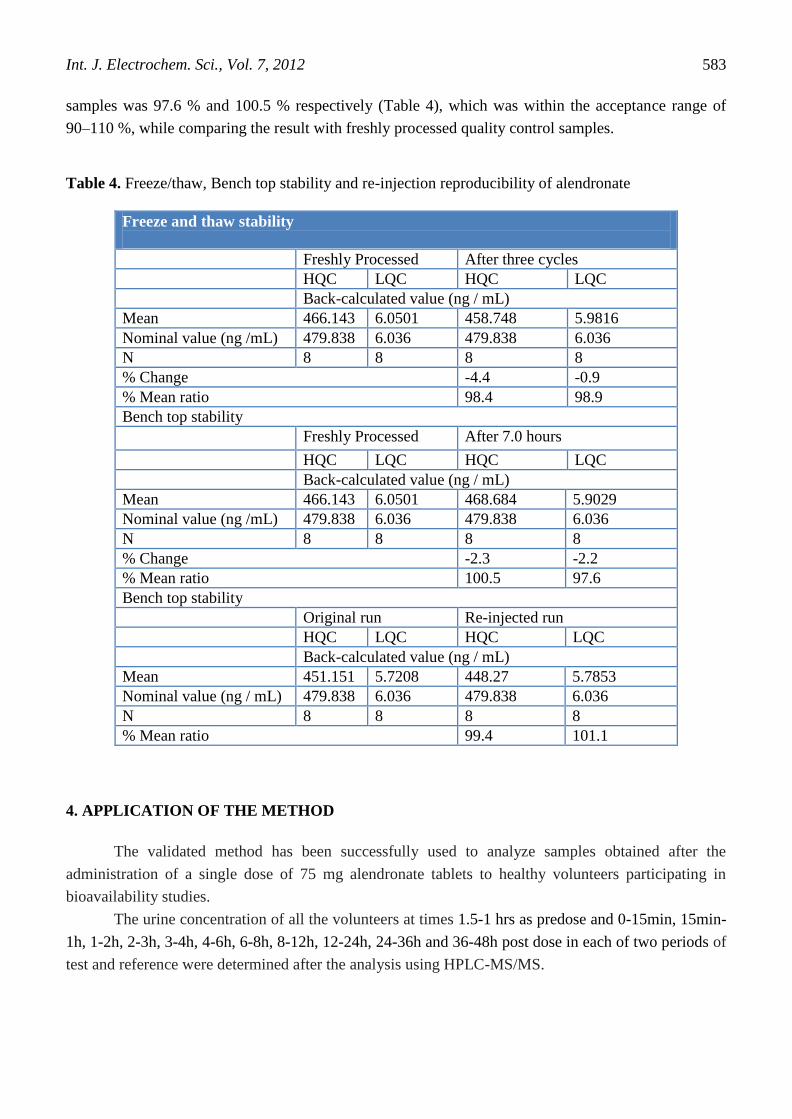
samples was 97.6 % and 100.5 % respectively (Table 4), which was within the acceptance range of
90–110 %, while comparing the result with freshly processed quality control samples.
Table 4. Freeze/thaw, Bench top stability and re-injection reproducibility of alendronate
Freeze and thaw stability
Freshly Processed After three cycles
HQC LQC HQC LQC
Back-calculated value (ng / mL)
Mean 466.143 6.0501 458.748 5.9816
Nominal value (ng /mL) 479.838 6.036 479.838 6.036
N 8 8 8 8
% Change -4.4 -0.9
% Mean ratio 98.4 98.9
Bench top stability
Freshly Processed After 7.0 hours
HQC LQC HQC LQC
Back-calculated value (ng / mL)
Mean 466.143 6.0501 468.684 5.9029
Nominal value (ng /mL) 479.838 6.036 479.838 6.036
N 8 8 8 8
% Change -2.3 -2.2
% Mean ratio 100.5 97.6
Bench top stability
Original run Re-injected run
HQC LQC HQC LQC
Back-calculated value (ng / mL)
Mean 451.151 5.7208 448.27 5.7853
Nominal value (ng / mL) 479.838 6.036 479.838 6.036
N 8 8 8 8
% Mean ratio 99.4 101.1
4. APPLICATION OF THE METHOD
The validated method has been successfully used to analyze samples obtained after the
administration of a single dose of 75 mg alendronate tablets to healthy volunteers participating in
bioavailability studies.
The urine concentration of all the volunteers at times 1.5-1 hrs as predose and 0-15min, 15min-
1h, 1-2h, 2-3h, 3-4h, 4-6h, 6-8h, 8-12h, 12-24h, 24-36h and 36-48h post dose in each of two periods of
test and reference were determined after the analysis using HPLC-MS/MS.
Int. J. Electrochem. Sci., Vol. 7, 2012
584
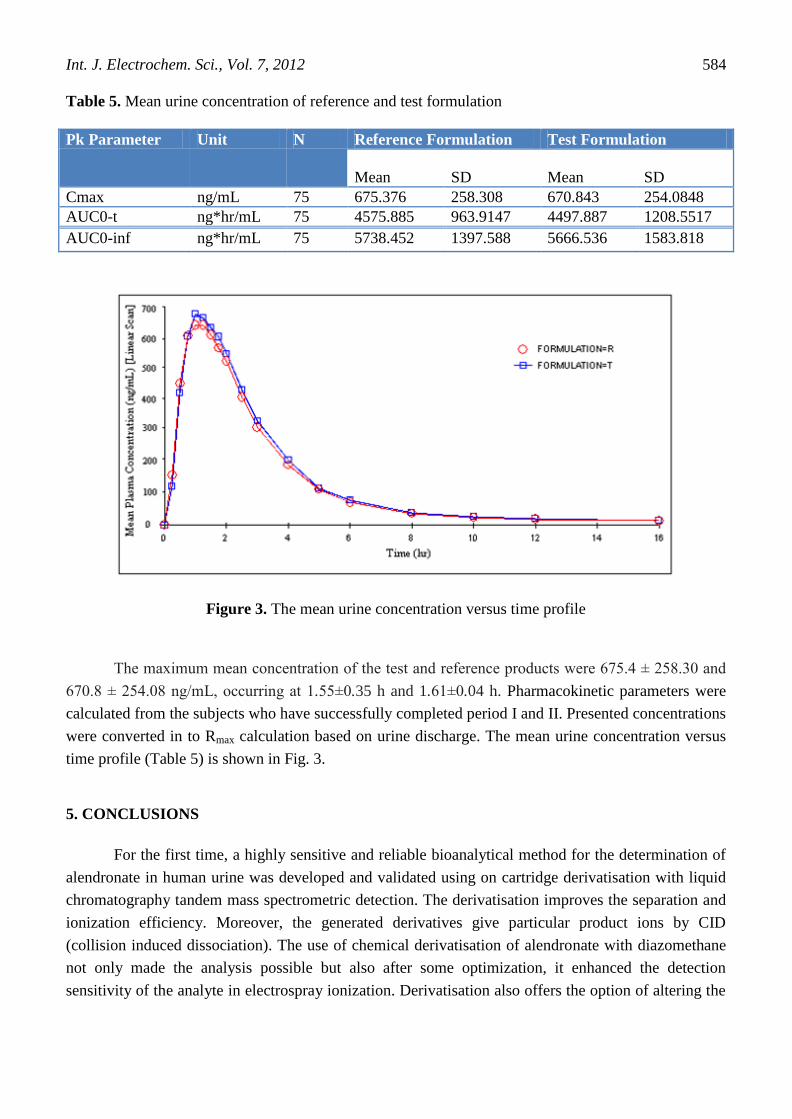
Table 5. Mean urine concentration of reference and test formulation
Pk Parameter Unit N Reference Formulation Test Formulation
Mean
SD
Mean
SD
Cmax ng/mL 75 675.376 258.308 670.843 254.0848
AUC0-t ng*hr/mL 75 4575.885 963.9147 4497.887 1208.5517
AUC0-inf ng*hr/mL 75 5738.452 1397.588 5666.536 1583.818
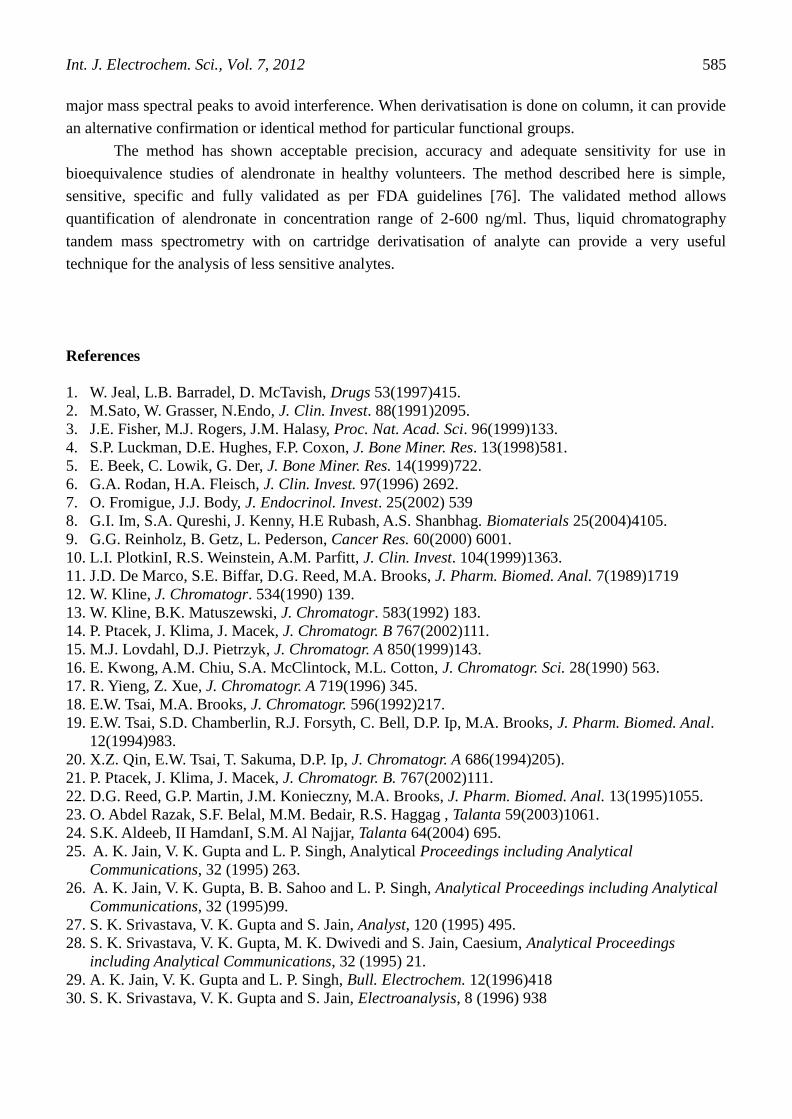
Figure 3. The mean urine concentration versus time profile
The maximum mean concentration of the test and reference products were 675.4 ± 258.30 and
670.8 ± 254.08 ng/mL, occurring at 1.55±0.35 h and 1.61±0.04 h. Pharmacokinetic parameters were
calculated from the subjects who have successfully completed period I and II. Presented concentrations
were converted in to Rmax calculation based on urine discharge. The mean urine concentration versus
time profile (Table 5) is shown in Fig. 3.
5. CONCLUSIONS
For the first time, a highly sensitive and reliable bioanalytical method for the determination of
alendronate in human urine was developed and validated using on cartridge derivatisation with liquid
chromatography tandem mass spectrometric detection. The derivatisation improves the separation and
ionization efficiency. Moreover, the generated derivatives give particular product ions by CID
(collision induced dissociation). The use of chemical derivatisation of alendronate with diazomethane
not only made the analysis possible but also after some optimization, it enhanced the detection
sensitivity of the analyte in electrospray ionization. Derivatisation also offers the option of altering the
Int. J. Electrochem. Sci., Vol. 7, 2012
585
major mass spectral peaks to avoid interference. When derivatisation is done on column, it can provide
an alternative confirmation or identical method for particular functional groups.
The method has shown acceptable precision, accuracy and adequate sensitivity for use in
bioequivalence studies of alendronate in healthy volunteers. The method described here is simple,
sensitive, specific and fully validated as per FDA guidelines [76]. The validated method allows
quantification of alendronate in concentration range of 2-600 ng/ml. Thus, liquid chromatography
tandem mass spectrometry with on cartridge derivatisation of analyte can provide a very useful
technique for the analysis of less sensitive analytes.
References
1. W. Jeal, L.B. Barradel, D. McTavish, Drugs 53(1997)415.
2. M.Sato, W. Grasser, N.Endo, J. Clin. Invest. 88(1991)2095.
3. J.E. Fisher, M.J. Rogers, J.M. Halasy, Proc. Nat. Acad. Sci. 96(1999)133.
4. S.P. Luckman, D.E. Hughes, F.P. Coxon, J. Bone Miner. Res. 13(1998)581.
5. E. Beek, C. Lowik, G. Der, J. Bone Miner. Res. 14(1999)722.
6. G.A. Rodan, H.A. Fleisch, J. Clin. Invest. 97(1996) 2692.
7. O. Fromigue, J.J. Body, J. Endocrinol. Invest. 25(2002) 539
8. G.I. Im, S.A. Qureshi, J. Kenny, H.E Rubash, A.S. Shanbhag. Biomaterials 25(2004)4105.
9. G.G. Reinholz, B. Getz, L. Pederson, Cancer Res. 60(2000) 6001.
10. L.I. PlotkinI, R.S. Weinstein, A.M. Parfitt, J. Clin. Invest. 104(1999)1363.
11. J.D. De Marco, S.E. Biffar, D.G. Reed, M.A. Brooks, J. Pharm. Biomed. Anal. 7(1989)1719
12. W. Kline, J. Chromatogr. 534(1990) 139.
13. W. Kline, B.K. Matuszewski, J. Chromatogr. 583(1992) 183.
14. P. Ptacek, J. Klima, J. Macek, J. Chromatogr. B 767(2002)111.
15. M.J. Lovdahl, D.J. Pietrzyk, J. Chromatogr. A 850(1999)143.
16. E. Kwong, A.M. Chiu, S.A. McClintock, M.L. Cotton, J. Chromatogr. Sci. 28(1990) 563.
17. R. Yieng, Z. Xue, J. Chromatogr. A 719(1996) 345.
18. E.W. Tsai, M.A. Brooks, J. Chromatogr. 596(1992)217.
19. E.W. Tsai, S.D. Chamberlin, R.J. Forsyth, C. Bell, D.P. Ip, M.A. Brooks, J. Pharm. Biomed. Anal.
12(1994)983.
20. X.Z. Qin, E.W. Tsai, T. Sakuma, D.P. Ip, J. Chromatogr. A 686(1994)205).
21. P. Ptacek, J. Klima, J. Macek, J. Chromatogr. B. 767(2002)111.
22. D.G. Reed, G.P. Martin, J.M. Konieczny, M.A. Brooks, J. Pharm. Biomed. Anal. 13(1995)1055.
23. O. Abdel Razak, S.F. Belal, M.M. Bedair, R.S. Haggag , Talanta 59(2003)1061.
24. S.K. Aldeeb, II HamdanI, S.M. Al Najjar, Talanta 64(2004) 695.
25. A. K. Jain, V. K. Gupta and L. P. Singh, Analytical Proceedings including Analytical
Communications, 32 (1995) 263.
26. A. K. Jain, V. K. Gupta, B. B. Sahoo and L. P. Singh, Analytical Proceedings including Analytical
Communications, 32 (1995)99.
27. S. K. Srivastava, V. K. Gupta and S. Jain, Analyst, 120 (1995) 495.
28. S. K. Srivastava, V. K. Gupta, M. K. Dwivedi and S. Jain, Caesium, Analytical Proceedings
including Analytical Communications, 32 (1995) 21.
29. A. K. Jain, V. K. Gupta and L. P. Singh, Bull. Electrochem. 12(1996)418
30. S. K. Srivastava, V. K. Gupta and S. Jain, Electroanalysis, 8 (1996) 938
Int. J. Electrochem. Sci., Vol. 7, 2012
586
31. S. K. Srivastava, V. K. Gupta and S. Jain, Anal. Chem. 68(1996)1272.
32. A. K. Jain, V. K. Gupta, L. P. Singh and U. Khurana, Electroanalysis, 9(1997)1360.
33. V. K. Gupta, A. K. Jain, L. P. Singh and U. Khurana, Anal. Chim. Acta, 355(1997)33.
34. A. K. Jain, V. K.Gupta, U. Khurana and L. P. Singh, Electroanalysis, 9 (1997) 857.
35. A. K. Jain, V. K. Gupta, L. P. Singh and U. Khurana, Analyst, 122(1997) 583.
36. V. K. Gupta, S. Jain and U. Khurana, Electroanalysis, 9 (1997) 478
37. V. K. Gupta and P. Kumar, Anal. Chim. Acta, 389(1999) 205
38. V. K. Gupta, A. K. Jain, L. P. Singh and U. Khurana, Sens. Actuators B, 55(1999)201
39. V.K. Gupta, R. Mangla, U. Khurana and P. Kumar, Electroanalysis, 11 (1999)573
40. V. K. Gupta, R. Prasad, R. Mangla, and P. Kumar, Anal. Chim. Acta, 420(2000)19
41. V.K.Gupta, Rajni Mangla and S. Agarwal, Electroanalysis, 14, (2002) 1127
42. V. K. Gupta, R. Prasad, A. Kumar, J. Appl. Electrochem., 33(2003)381.
43. V. K. Gupta, R. Prasad, A. Kumar, Talanta, 60(2003)149.
44. V.K Gupta, S. Jain, S. Chandra, Anal. Chim. Acta , 486(2) (2003)199.
45. V. K. Gupta, R. Prasad and Azad Kumar, Talanta, 63(2004)1027
46. R. Prasad, V. K. Gupta and Azad Kumar, Anal. Chim. Acta , 508(2004)61
47. R.N. Goyal, V.K. Gupta, M. Oyama and N. Bachheti, Electrochem. Commun., 7 (2005)803
48. R.N. Goyal, V.K. Gupta, A. Sangal and N. Bachheti, Electroanalysis, 17 (2005)2217.
49. V. K. Gupta, S. Chandra and H. Lang, Talanta, 66(2005)575
50. V. K. Gupta, R. Ludwig and S. Agarwal, Anal. Chim. Acta, 538 (2005)213
51. A. K. Jain, V. K. Gupta, L. P. Singh, P. Srivastava and J. R. Raisoni, Talanta, 6(2005)716
52. A.K. Jain, V.K. Gupta, S. Radi, L.P. Singh, J.R. Raisoni, Electrochim. Acta,51(2006) 2547
53. V. K. Gupta, A. K. Singh and Barkha Gupta, Anal. Chim. Acta, 575 (2006)198
54. R.N. Goyal, V.K. Gupta, A. Sangal and N. Bachheti, Electrochem. Commun.,8 (2006)65
55. A.K. Singh, V. K. Gupta and Barkha Gupta, Anal. Chim. Acta, 585(2007)171
56. V. K. Gupta, A. K. Jain and G. Maheshwari, Int. J. Electrochem. Sci., 2 (2007) 102.
57. V. K. Gupta, A. K. Singh, M. Al Khayat, B. Gupta, Anal. Chim. Acta, 590(2007)81
58. V.K. Gupta, A.K. Jain, M. Al Khayat, S. K. Bhargava, J.R. Raisoni, Electrochim. Acta,
53(2008)5409
59. R.N. Goyal, V.K. Gupta and S. Chatterjee, Electrochim. Acta, 53 (2008)5354
60. R.N. Goyal, V.K. Gupta, N. Bachheti and R.A. Sharma, Electroanalysis, 20 (2008)757.
61. V. K. Gupta, R. N. Goyal, and R. A. Sharma, Int. J. Electrochem. Sci. 4 (2009) 156.
62. V. K. Gupta, M. Al Khayat, A.K. Singh and Manoj. K. Pal, Anal.Chim. Acta, 634(2009)36
63. R.N. Goyal, V.K. Gupta and S. Chatterjee, Biosens. Bioelectron., 24 (2009)1649
64. Vinod K. Gupta, Rajeev Jain, Manoj K. Pal, Int. J. Electrochem. Sci., 5 (2010) 996
65. V. K. Gupta, A. J. Hamdan, R. Jain, S. Agarwal, A. K. Bharti, Anal. Chim. Acta, 681(2010) 27
66. R. Jain, V.K. Gupta, N. Jadon and K. Radhapyari, Anal. Biochem., 407 (2010)79.
67. V.K. Gupta, The Arabian Journal for Science and Engineering A-Science 35(2A) (2010) 7
68. R.N. Goyal, V.K. Gupta and S. Chatterjee, Sens. Actuators B, 149 (2010)252
69. V. K. Gupta, R. Jain, K. Radhapyari, N. Jadon, Shilpi Agarwal, Anal. Biochem,408(2011)179
70. V.K. Gupta, S. Agarwal, B. Singhal, International Journal of Electrochemical Science,6(2011)
3036-3056
71. V.K. Gupta, A. Nayak, S. Agarwal, B. Singhal, Combinatorial Chemistry and High Throughput
Screening,14(2011)284-302
72. V.K. Gupta, R. Jain, M.M. Antonijevic, H. Khani, M.N. Siddiqui, A. Dwivedi, R. Mishra, S.
Agarwal, International Journal of Electrochemical Science,6(2011)37-51
73. V.K. Gupta, I. Ali, Separation and Purification Technology 18 (2000)131-140
74. I. Ali, V.K. Gupta, Nature Protocols 1 (2007) 2661-2667
75. V.K. Gupta, P.J.M. Carrott, M.M.L. Ribeiro Carrott, Suhas, Critical Reviews in Environmental
Science and Technology 39(2009) 783-842
Int. J. Electrochem. Sci., Vol. 7, 2012
587
76. V.K.Gupta, D. Mohan, S. Sharma, Separation Science and Technology 33(1998)1331-1343
77. A. Mittal, L. Kurup, V.K.Gupta, Journal of Hazardous Materials,117(2005)171-178
78. V.K.Gupta, I. Ali, Environmental Science and Technology,42(2008)766-770
79. V.K.Gupta, A. Rastogi, Colloids and Surfaces B: Biointerfaces, 64 (2008)170-178
80. V.K.Gupta, A.Rastogi, Journal of Hazardous Materials, 154 (2008)347-354
81. V.K.Gupta, A. Rastogi, M.K. Dwivedi, D. Mohan, Separation Science and Technology, 32 (1997),
2883-2912
82. V.K. Gupta, A. Mittal, V. Gajbe, J. Mittal, Industrial and Engineering Chemistry Research, 45
(2006)1446-1453
83. V.K.Gupta, I. Ali, V.K. Saini, Journal of Colloid and Interface Science,315 (2007)87-93
84. V.K. Gupta, R. Jain, S. Varshney, Journal of Hazardous Materials,142(2007)443-448
85. V.K. Gupta, A. Rastogi, Journal of Hazardous Materials,153(2008)759-766
86. V.K. Gupta, R. Jain, A. Mittal, M. Mathur, S. Sikarwar, Journal of Colloid and Interface Science,
309 (2007)464-469
87. V.K. Gupta, A. Rastogi, Journal of Hazardous Materials,163(2009)396-402
88. V.K. Gupta, A. Mittal, L. Kurup, J. Mittal, Journal of Colloid and Interface Science, 304 (2006)52-
57
89. V.K. Gupta, R. Jain, S. Varshney, Journal of Colloid and Interface Science, 312 (2007)292-296
90. V.K.Gupta, I. Ali, V.K. Saini, Water Research, 41(2007)3307-3316
91. V.K. Gupta, R.N. Goyal, R.A. Sharma, Analytica Chimica Acta, 647 (2009) 66-71
92. V.K. Gupta, A. Rastogi, A. Nayak, Journal of Colloid and Interface Science,342(2010)135-141
93. V. K. Gupta, I. Ali and Shilpi Agarwal, Int. J. Electrochem. Sci., 6(2011) 5639-5648.
94. V. K. Gupta, M. R. Ganjali, Hadi Khani, P. Norouzi, A. Nayak, Shilpi Agarwal, , Critical Reviews
in Analytical Chemistry, 41, (4) (2011)1-32.
95. B.J. Gertz, P. Shao, D.A. Hanson, H. Quan, S.T. Harris, H.K. Genant, C.H. Chesnut, D.R. Eyre, J.
Bone Mineral Res. 9(1994)135.
96. R. Endele, H. Loew, F. Bauss, J. Pharm. Biomed. Anal. 39(2005)246.
97. P.T. Vallano, S.B. Shugarts, W.F. Kline, E. Woolf, B.K. Matuszewski, J. Chromatogr. 794(2003)23.
98. I. Tarcomnicu, M.C. Gheorghe, L. Silvestro, S.R. Savu, I. Boaru, A. Tudoroniu, J. Chromatogr. B.
877(2009)3159.
99. Guidance for industry, Bioanalytical Method Validation. US Department of Health and Human
Services. Food and Drug Administration. Centre for Drug Evaluation and Research, Rockville,
MD, 2001.
© 2012 by ESG (www.electrochemsci.org)