Embed Size (px)
Citation preview
Quantitative Evaluation Center for Working Families
July 22, 2010

Quantitative Evaluation of Center for Working Families 2
This analysis examines services delivered to participants and their achievements in 3 AECF supported organizations (evaluation sites)• The Service Pathways analysis examines:
– Characteristics of CWF participants
– Outcomes CWF participants have achieved
– Characteristics of high achievers and services received
• The Financial Progress analysis examines:
– Changes in earned and work support income for a sample of participants
– Changes in credit scores
– Changes in spending patterns
• Cost assessments examine total cost per client of providing services and changes in costs over time
Quantitative Evaluation of Center for Working Families 3Quantitative Evaluation of Center for Working Families 3
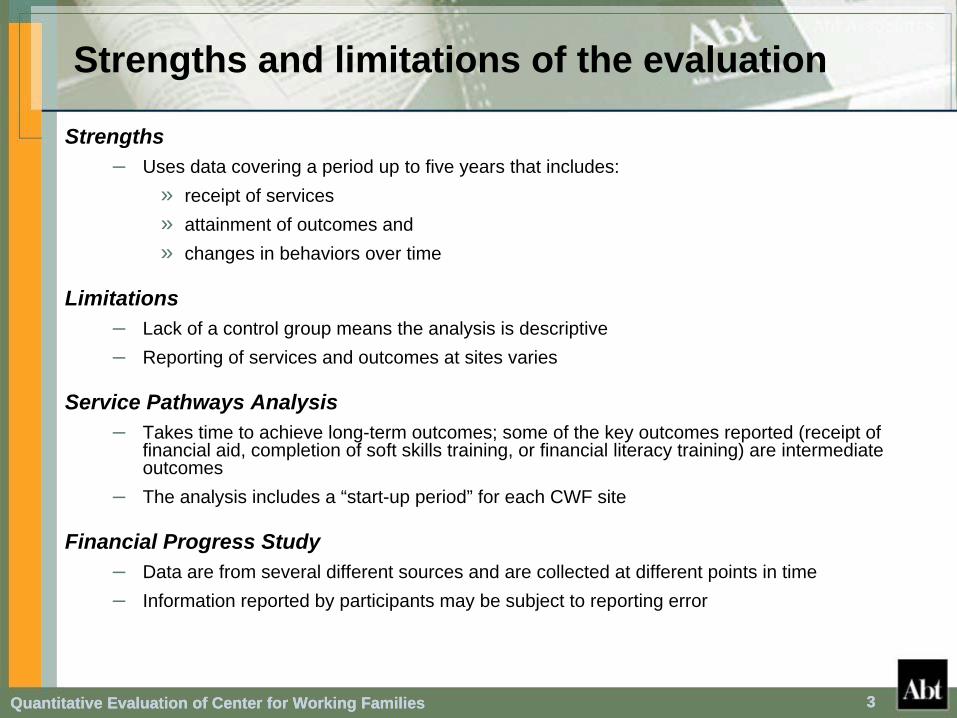
Strengths and limitations of the evaluation
Strengths– Uses data covering a period up to five years that includes:
» receipt of services» attainment of outcomes and» changes in behaviors over time
Limitations– Lack of a control group means the analysis is descriptive– Reporting of services and outcomes at sites varies
Service Pathways Analysis– Takes time to achieve long-term outcomes; some of the key outcomes reported (receipt of
financial aid, completion of soft skills training, or financial literacy training) are intermediate outcomes
– The analysis includes a “start-up period” for each CWF site
Financial Progress Study– Data are from several different sources and are collected at different points in time– Information reported by participants may be subject to reporting error

Quantitative Evaluation of Center for Working Families 4Quantitative Evaluation of Center for Working Families 4
CWF sites are serving AECF’s target population
Characteristics at Program Enrollment (for CWF enrollees through December 2009)
CNM MET Center Bon SecoursTotal participants 910 8,221 892
Gender 62% female 73% female 51% female
Marital status 18% married or with a domestic partner
16% married or with a domestic partner
8% married or with a domestic partner
Presence of children 67% with children 77% with children 74% with children
Race Majority Hispanic, 11% Native American 90% African American 95% African American
Median age at enrollment 32 years 26 years 36 years
Education at program enrollment
75% had at least a high school diploma
62% had at least a high school diploma
61% had at least a high school diploma
Median monthly earnings* $800 $1,057 $1,200
* Based on a sample of participants
Quantitative Evaluation of Center for Working Families 5Quantitative Evaluation of Center for Working Families 5
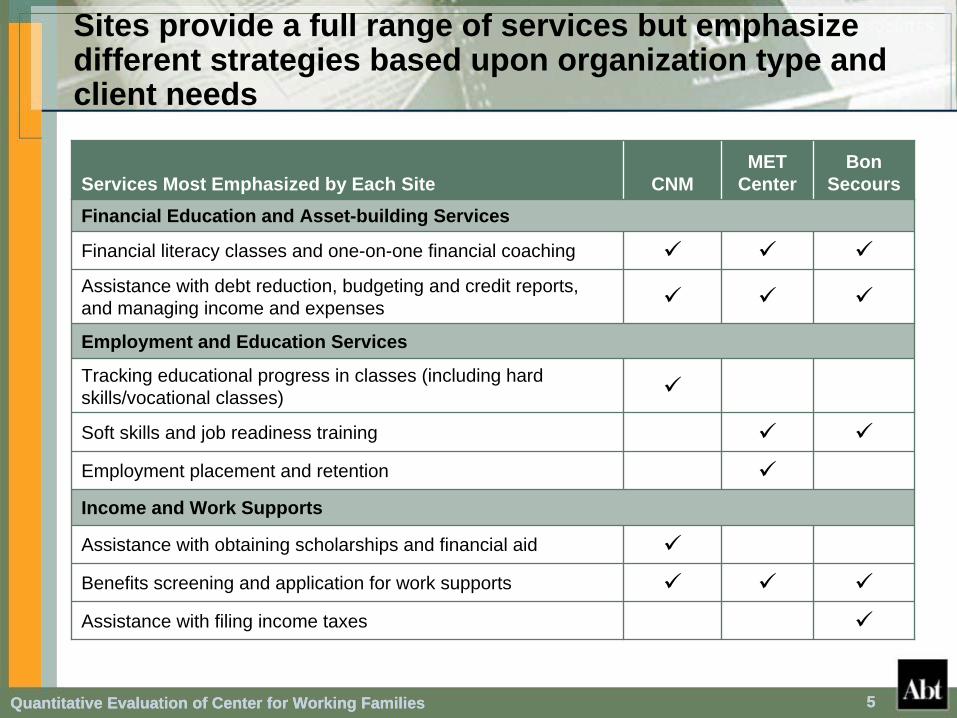
Sites provide a full range of services but emphasize different strategies based upon organization type and client needs
Services Most Emphasized by Each Site CNMMET
CenterBon
SecoursFinancial Education and Asset-building Services
Financial literacy classes and one-on-one financial coaching
Assistance with debt reduction, budgeting and credit reports, and managing income and expenses
Employment and Education Services
Tracking educational progress in classes (including hard skills/vocational classes)
Soft skills and job readiness training
Employment placement and retention
Income and Work Supports
Assistance with obtaining scholarships and financial aid
Benefits screening and application for work supports
Assistance with filing income taxes
Quantitative Evaluation of Center for Working Families 6Quantitative Evaluation of Center for Working Families 6
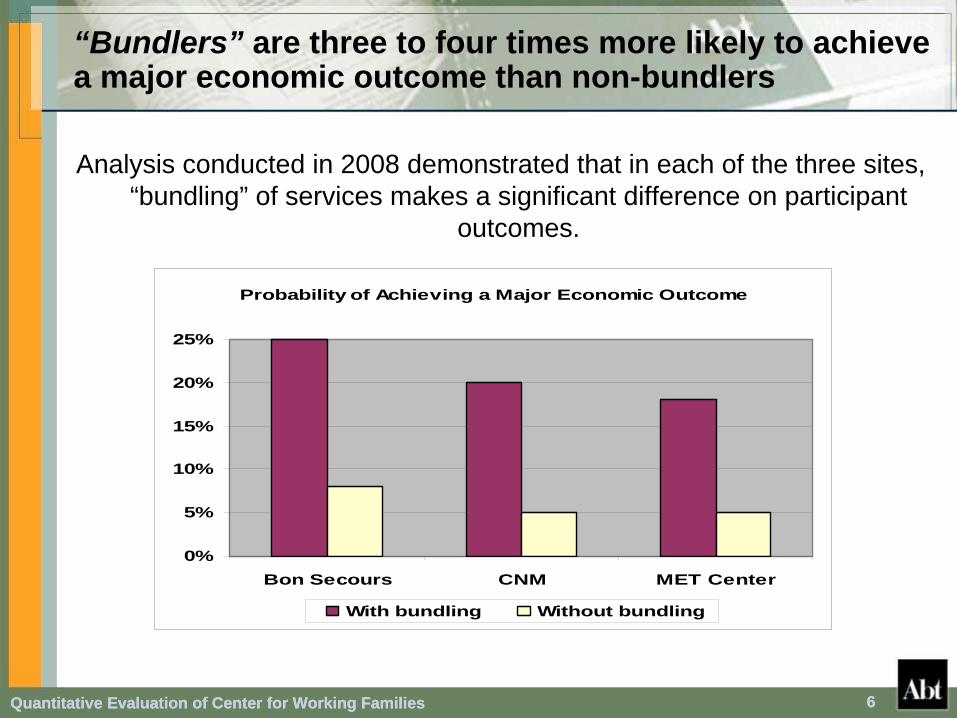
“Bundlers” are three to four times more likely to achieve a major economic outcome than non-bundlers
Analysis conducted in 2008 demonstrated that in each of the three sites, “bundling” of services makes a significant difference on participant
outcomes.
Probability of Achieving a Major Economic Outcome
0%
5%
10%
15%
20%
25%
Bon Secours CNM MET Center
With bundling Without bundling
Quantitative Evaluation of Center for Working Families 7Quantitative Evaluation of Center for Working Families 7
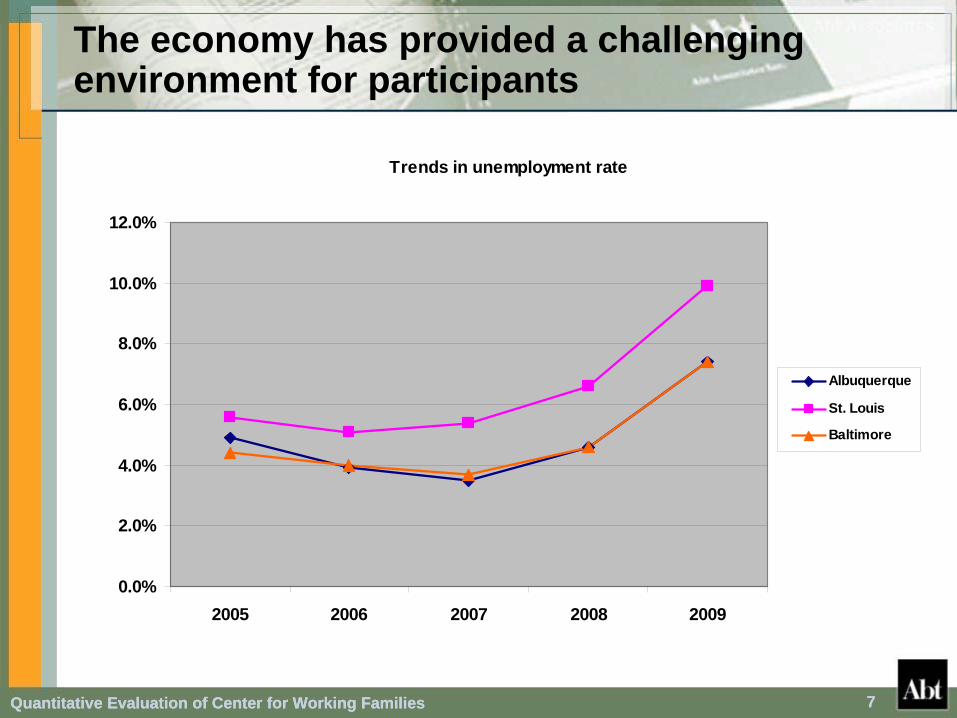
The economy has provided a challenging environment for participants
Trends in unemployment rate
0.0%
2.0%
4.0%
6.0%
8.0%
10.0%
12.0%
2005 2006 2007 2008 2009
Albuquerque
St. Louis
Baltimore
Quantitative Evaluation of Center for Working Families 8Quantitative Evaluation of Center for Working Families 8
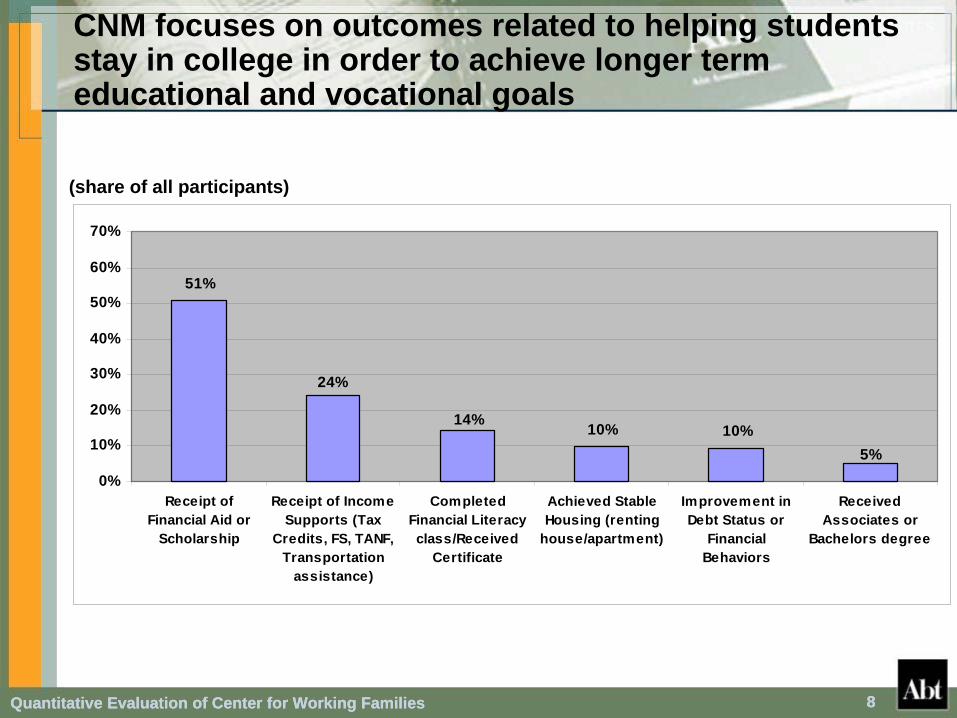
CNM focuses on outcomes related to helping students stay in college in order to achieve longer term educational and vocational goals
(share of all participants)
51%
10% 10%14%
5%
24%
0%
10%
20%
30%
40%
50%
60%
70%
Receipt ofFinancial Aid or
Scholarship
Receipt of IncomeSupports (Tax
Credits, FS, TANF,Transportation
assistance)
CompletedFinancial Literacyclass/Received
Certificate
Achieved StableHousing (renting
house/apartment)
Improvement inDebt Status or
FinancialBehaviors
ReceivedAssociates or
Bachelors degree

Quantitative Evaluation of Center for Working Families 9Quantitative Evaluation of Center for Working Families 9
MET Center key outcomes focus on job placement and retention
43%
26%
60%
77%72%
89%
0%
20%
40%
60%
80%
100%
P assed So ft Skills(share o f tho seenro lled in so ft
skills)
P assed H ard Skills (share o f tho seenro lled in hard
skills)
Jo b P lacements(share o f a llpart ic ipants)
3 M o nth R etent io n
6 M o nth R etent io n
12 M o nth R etent io n
share of eligible placements
Quantitative Evaluation of Center for Working Families 10
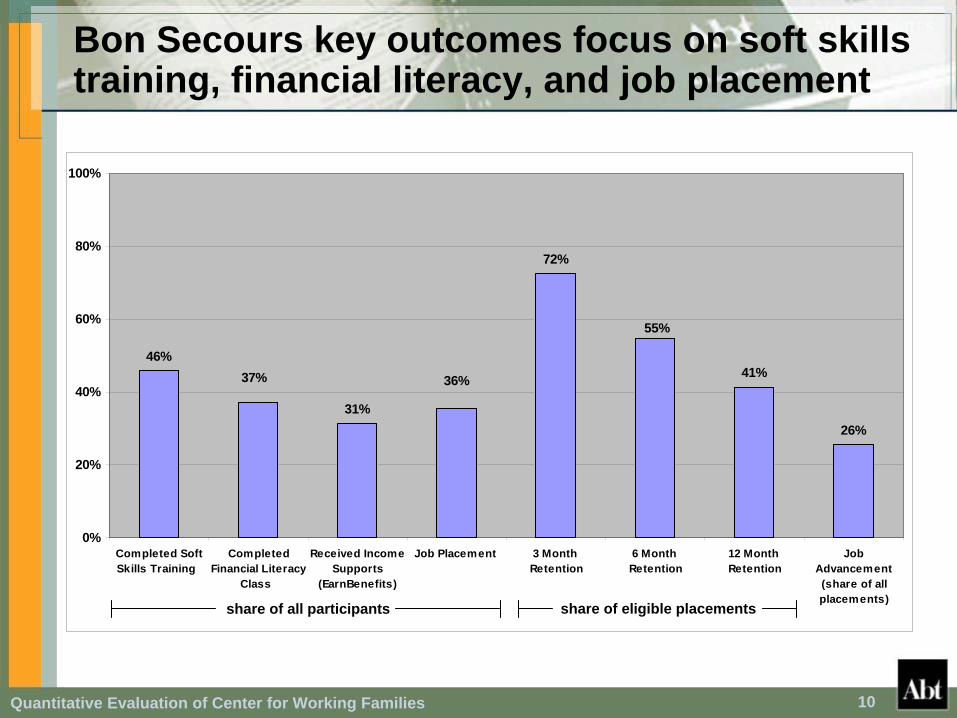
Bon Secours key outcomes focus on soft skills training, financial literacy, and job placement
46%
31%
72%
41%
26%
37% 36%
55%
0%
20%
40%
60%
80%
100%
Completed SoftSkills Training
CompletedFinancial Literacy
Class
Received IncomeSupports
(EarnBenefits)
Job Placement 3 Month Retention
6 Month Retention
12 Month Retention
JobAdvancement(share of allplacements)
share of all participants share of eligible placements
Quantitative Evaluation of Center for Working Families 11Quantitative Evaluation of Center for Working Families 11
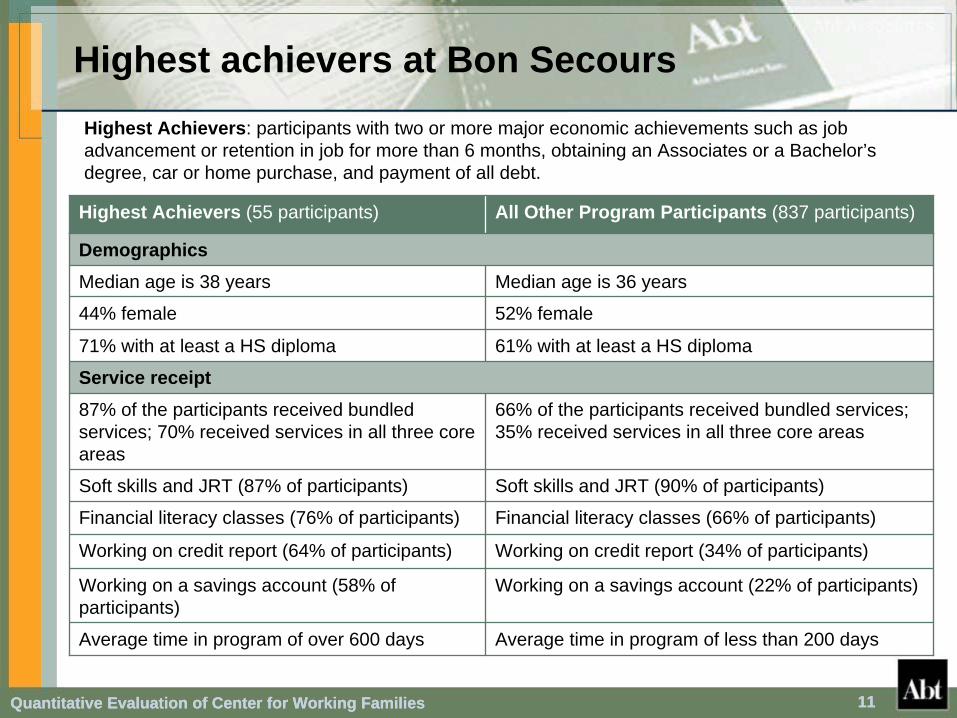
Highest achievers at Bon SecoursHighest Achievers: participants with two or more major economic achievements such as job advancement or retention in job for more than 6 months, obtaining an Associates or a Bachelor’s degree, car or home purchase, and payment of all debt.
Highest Achievers (55 participants) All Other Program Participants (837 participants)
DemographicsMedian age is 38 years Median age is 36 years
44% female 52% female
71% with at least a HS diploma 61% with at least a HS diploma
Service receipt87% of the participants received bundled services; 70% received services in all three core areas
66% of the participants received bundled services; 35% received services in all three core areas
Soft skills and JRT (87% of participants) Soft skills and JRT (90% of participants)
Financial literacy classes (76% of participants) Financial literacy classes (66% of participants)
Working on credit report (64% of participants) Working on credit report (34% of participants)
Working on a savings account (58% of participants)
Working on a savings account (22% of participants)
Average time in program of over 600 days Average time in program of less than 200 days

Quantitative Evaluation of Center for Working Families 12Quantitative Evaluation of Center for Working Families 12
Bon Secours’ participant incomes rose after enrollment
$0
$500
$1,000
$1,500
$2,000
$2,500
$3,000
$3,500
qp4 qp3 qp2 qp1 q0 q1 q2 q3 q4 q5 q6 q7 q8
200520062007
Average quarterly earnings (in 2009 $s) – for enrollments in 2005, 2006, and 2007
Pre-Enrollment Post-Enrollment

Quantitative Evaluation of Center for Working Families 13
Financial progress study participants have made improvements in financial behaviors
Percentage of Study Participants
0%
10%
20%
30%
40%
50%
60%
70%
80%
90%
Track expenses bywriting them down
File a tax return in thelast season
Take out a refundanticipation loan
Average Score, Scale of 1-5
0
0.5
1
1.5
2
2.5
3
3.5
4
4.5
Put money aside for futurepurchases
Look for ways to cutexpenses
Check credit report regularly
Scale of 1-5
Initial Survey Follow-up
Quantitative Evaluation of Center for Working Families 14
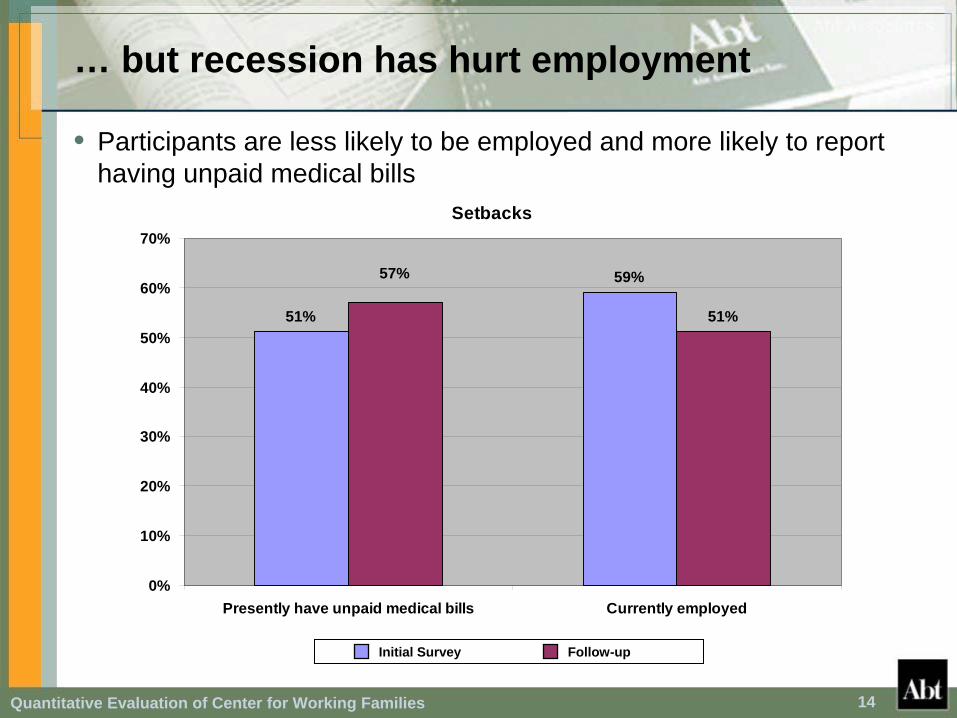
… but recession has hurt employment
• Participants are less likely to be employed and more likely to report having unpaid medical bills
Setbacks
51%
59%
51%
57%
0%
10%
20%
30%
40%
50%
60%
70%
Presently have unpaid medical bills Currently employed
Initial Survey Follow-up
Quantitative Evaluation of Center for Working Families 15
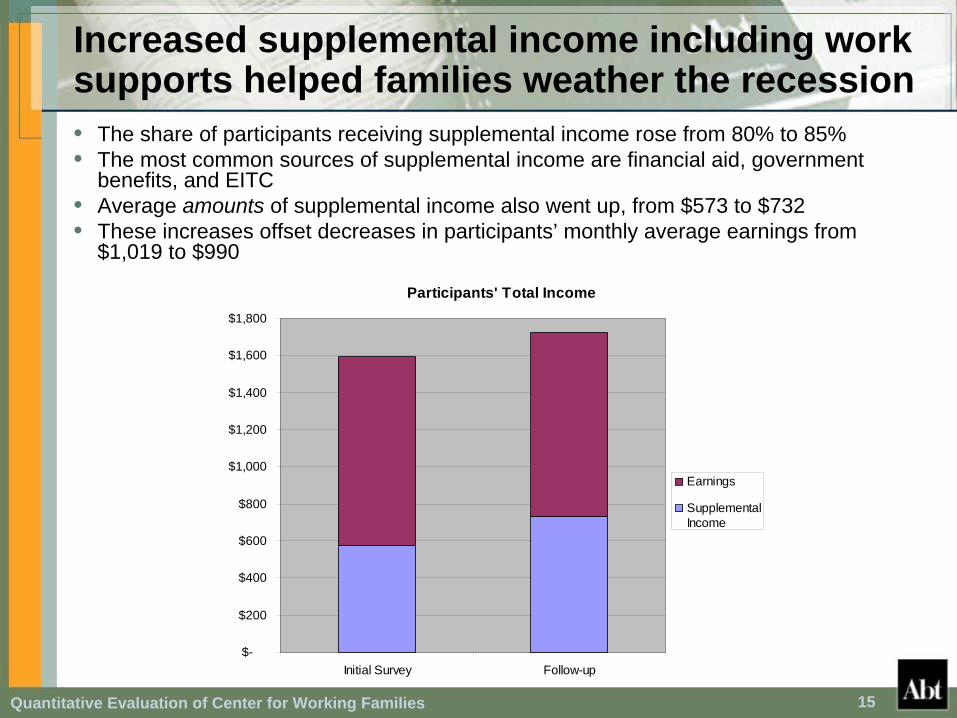
Increased supplemental income including work supports helped families weather the recession• The share of participants receiving supplemental income rose from 80% to 85% • The most common sources of supplemental income are financial aid, government
benefits, and EITC • Average amounts of supplemental income also went up, from $573 to $732• These increases offset decreases in participants’ monthly average earnings from
$1,019 to $990
Participants' Total Income
$-
$200
$400
$600
$800
$1,000
$1,200
$1,400
$1,600
$1,800
Initial Survey Follow-up
Earnings
SupplementalIncome
Quantitative Evaluation of Center for Working Families 16
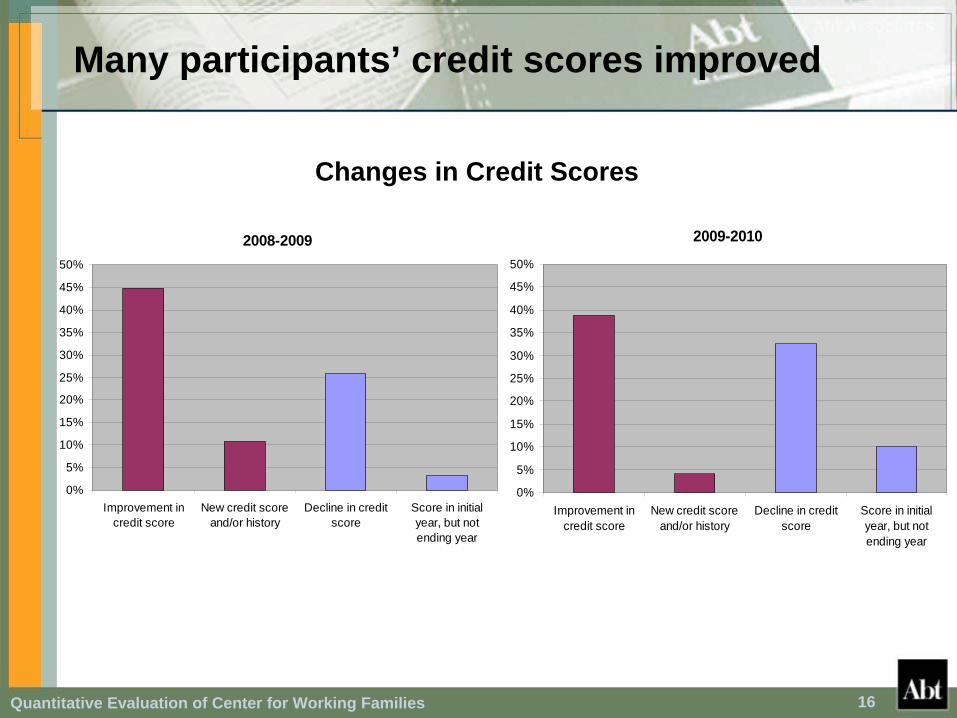
Many participants’ credit scores improved
Changes in Credit Scores
2009-2010
0%
5%
10%
15%
20%
25%
30%
35%
40%
45%
50%
Improvement incredit score
New credit scoreand/or history
Decline in creditscore
Score in initialyear, but notending year
2008-2009
0%
5%
10%
15%
20%
25%
30%
35%
40%
45%
50%
Improvement incredit score
New credit scoreand/or history
Decline in creditscore
Score in initialyear, but notending year
Quantitative Evaluation of Center for Working Families 17
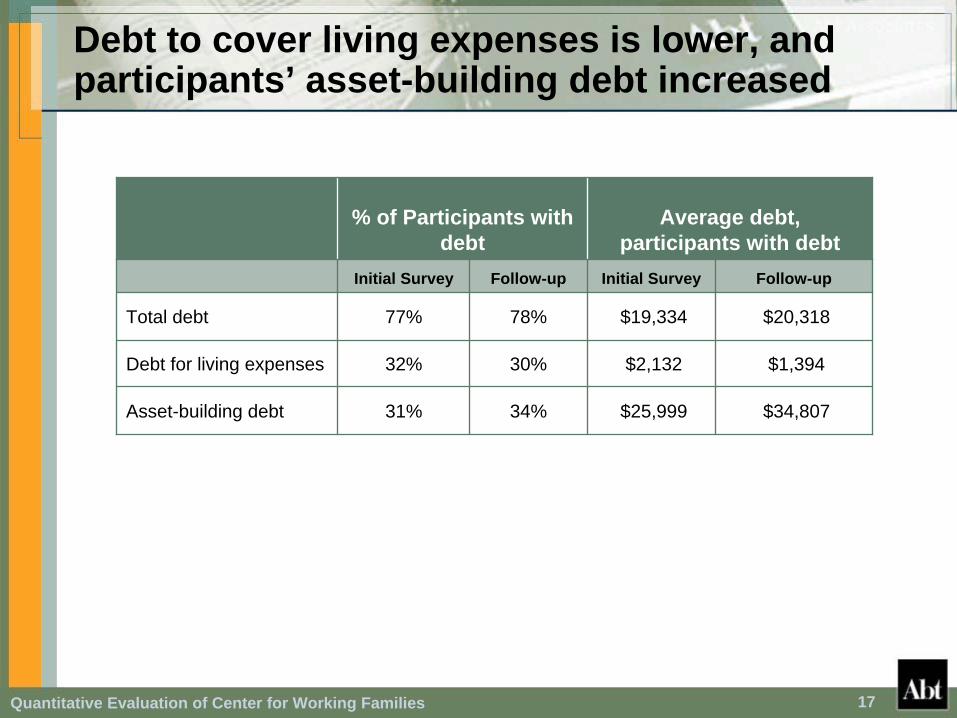
Debt to cover living expenses is lower, and participants’ asset-building debt increased
% of Participants with debt
Average debt, participants with debt
Initial Survey Follow-up Initial Survey Follow-up
Total debt 77% 78% $19,334 $20,318
Debt for living expenses 32% 30% $2,132 $1,394
Asset-building debt 31% 34% $25,999 $34,807
Quantitative Evaluation of Center for Working Families 18
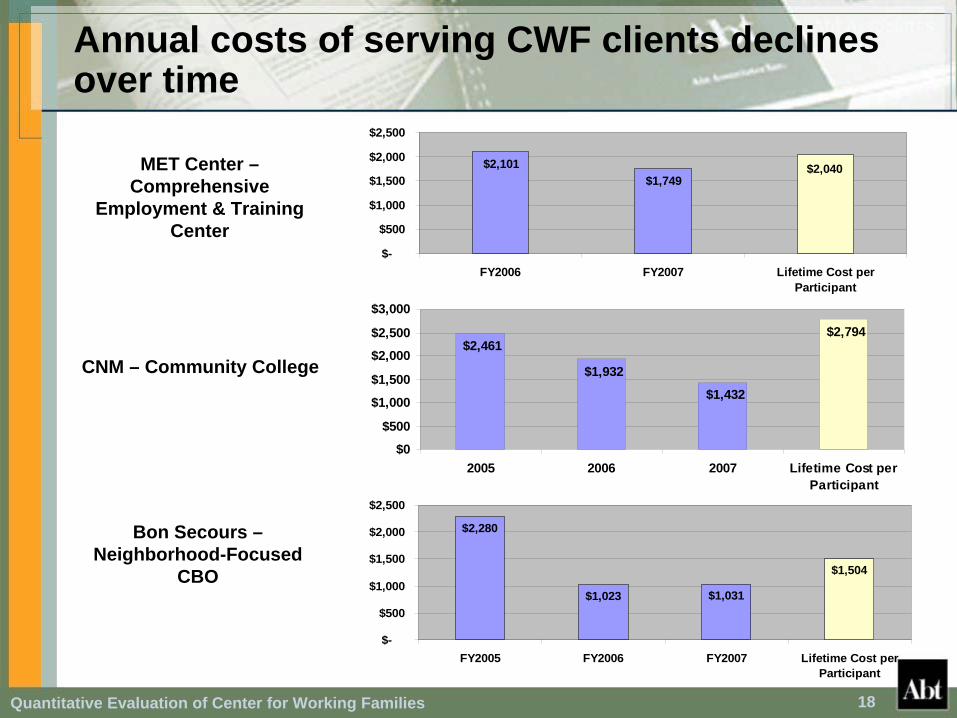
Annual costs of serving CWF clients declines over time
$2,040$1,749
$2,101
$-
$500
$1,000
$1,500
$2,000
$2,500
FY2006 FY2007 Lifetime Cost perParticipant
$2,794$2,461
$1,932
$1,432
$0
$500
$1,000
$1,500
$2,000
$2,500
$3,000
2005 2006 2007 Lifetime Cost perParticipant
$2,280
$1,023 $1,031
$1,504
$-
$500
$1,000
$1,500
$2,000
$2,500
FY2005 FY2006 FY2007 Lifetime Cost perParticipant
MET Center – Comprehensive
Employment & Training Center
CNM – Community College
Bon Secours – Neighborhood-Focused
CBO

Quantitative Evaluation of Center for Working Families 19
Conclusions
• Participants showed progress toward attaining family economic success
– Improvements in financial behaviors
– Improvements in credit scores
– Better use of debt
– Educational and job achievements
• The recession has created a difficult environment for families striving to make earnings and income gains
• Increases in supplemental income helped offset earnings declines that may be related to the recession
• Major economic achievements take time
Quantitative Evaluation of Center for Working Families 20
For more information
Kimberly Burnett, Abt [email protected]
Christopher Herbert, Abt [email protected]
Anne St. George, Abt [email protected]
Bulbul Kaul, Abt [email protected]
Quantitative Evaluation of Center for Working Families 21