Embed Size (px)
Citation preview

Svensk Kärnbränslehantering ABSwedish Nuclear Fueland Waste Management Co
Box 250, SE-101 24 Stockholm Phone +46 8 459 84 00
Technical Report
TR-10-25
Quantitative modelling of the degradation processes of cement groutProject CEMMOD
Fidel Grandia, Juan-Manuel Galíndez, David Arcos, Jorge Molinero Amphos21
May 2010
TR-10-25
CM
Gru
ppen
AB
, Bro
mm
a, 2
010
Tänd ett lager: P, R eller TR.
Quantitative modelling of the degradation processes of cement groutProject CEMMOD
Fidel Grandia, Juan-Manuel Galíndez, David Arcos, Jorge Molinero Amphos21
May 2010
ISSN 1404-0344
SKB TR-10-25
This report concerns a study which was conducted for SKB. The conclusions and viewpoints presented in the report are those of the authors. SKB may draw modified conclusions, based on additional literature sources and/or expert opinions.
A pdf version of this document can be downloaded from www.skb.se.
TR-10-25 3
Summary
Grout cement is planned to be used in the sealing of water-conducting fractures in the deep geologi-cal storage of spent nuclear fuel waste. Unlike other engineered barriers, grout materials are not designed to play any role in the long term safety of the spent fuel repository but they only help to reduce groundwater infiltration and improve stability of fractured rock during the excavation and the operation stage of the facilities. Then, the integrity of such cementitious materials should be ensured in a time framework of decades to a hundred of years as maximum. However, their durability must be quantified since grout degradation may jeopardize the stability of other components in the reposi-tory due to the potential release of hyperalkaline plumes.
The model prediction of the cement alteration has been challenging in the last years mainly due to the difficulty to reproduce the progressive change in composition of the Calcium-Silicate-Hydrate (CSH) compounds as the alteration proceeds (incongruent dissolution-precipitation). In general, the data obtained from laboratory experiments show a rather similar dependence between the pH of pore water and the Ca-Si ratio of the CSH phases. The Ca-Si ratio decreases as the CSH is progressively replaced by Si-enriched phases. An elegant and reasonable approach is the use of solid solution models even keeping in mind that CSH phases are not crystalline solids but gels. An additional obstacle is the uncertainty in the initial composition of the grout to be considered in the calculations because only the recipe of low-pH clinker is commonly provided by the manufacturer. The hydration process leads to the formation of new phases (CSH and others) and, importantly, creates porosity. Both composition and porosity needs to be precisely determined prior to the modelling of the altera-tion.
A number of solid solution models have been reported in literature. Most of them assumed a strong non-ideal binary solid solution series to account for the observed changes in the Ca-Si ratios in CSH. However, it results very difficult to reproduce the degradation of the CSH in the whole Ca-Si range of compositions (commonly Ca/Si=0.5–2.5) by considering only two end-members and fixed non-ideality parameters. Models with multiple non-ideal end-members with interaction parameters as a function of the solid composition can solve the problem but these can not be managed in the existing codes of reactive transport (e.g. PHREEQC).
Two distinct solid solution approaches have been selected in this work for the implementation into reactive transport codes. Both approaches deal with SiO2(am) and Ca(OH)2 as end members. The first one, developed by /Carey and Lichtner 2007/, is capable of reproducing the experimental data by /Chen et al. 2004/ although the fit is quite poor when dealing low-pH cements. Secondly, the approach by /Sugiyama and Fujita 2006/ fits well with the whole range of cement compositions in the experiments performed by /Harris et al. 2002/, including the low-pH samples.
The solid solution approach has been validated by modelling the leaching experiments of a grout material performed by NUMO-CRIEPI /Yamamoto et al. 2007/. In these experiments, a hardened cement paste was cut into cubes of 8 cm3, and then they were immersed in a vessel with two litres of leachant for up to 1 year. When using deionised water, a 6 mm rim depleted in Ca is achieved. Molar Ca/Si ratios in the altered zone decreases from at least 1.8 to less than 1. The experimental data have been well-reproduced in a 1D, fully diffusive model by implementing the solid solution approach by /Sugiyama and Fujita 2006/, and considering reasonable values for the kinetic constant of dis-solution/precipitation for the CSH phases (1×10⁻⁵ molCSH·m–3
rock·s–1), the initial reactive area of CSH (100 m2
CSH·m–3rock), and their molar volume (160 cm3·mol–1). The most sensitive parameters seem to
be porosity and the diffusion coefficient. The model that best fits the experimental data is obtained using an initial value for interconnected porosity of 5% and a diffusion coefficient of 5×10–11 m2·s–1. The model predicts very well the final Ca/Si distribution and the final porosity generated from reac-tions (18.6%), in very good agreement with the measured value (19%).
Once the solid solution approach is validated, a reactive transport model of grout degradation has been used to predict the interaction of granitic water flowing through a fracture in contact with a grouted borehole for 1,000 years. Two 1D cases have been modelled taking into account the hydro-geochemical features of the Forsmark site /SKB 2006/: (1) grout alteration due to interaction with
4 TR-10-25
granitic water in which diffusion is the only solute transport mechanism, and (2) grout alteration associated to advective fluxes of granitic water through grouted borehole. For the simulations, the code CRUNCH has been used.
Prior to this reactive transport modelling, the initial composition of the grout hydrated paste is deter-mined from the selected clinker, following successive steps, from the creation of the particle size distribution and distribution of cement phases to the simulation of hydration process. The numerical tool used for this calculation is CEMHYD3D. The calculated hydrated grout is essentially CSH with Ca/Si=1.1 together with silica.
The results of the reactive transport calculations in the fully diffusive case predict the formation of a rim of Si-rich CSH mainly after 50–100 years due to the dissolution of silica fume. The large difference in molar volume between silica (29 cm3·mol–1) and CSH (160 cm3·mol–1) results in a quick porosity clogging at this rim. As a consequence, the solute transport from the fracture to the grout becomes very limited. After 100 years, the main CSH phase in the altered grout is a CSH with Ca/Si=1.00. Si-richer phases are only predicted at the alteration front, with Ca/Si as low as 0.64. The pH at the granite-grout contact is not alkaline but it is close to the initial value of the granitic water. Therefore, a plume of alkaline water is not predicted away from the grout, at least for the very fast flow conditions selected for the fracture. After 1,000 years, the predicted amount of dissolved grout is very small, and the alteration front only progressed 0.22 cm.
In the simulations of grout alteration associated to advective fluxes of granitic water through grouted borehole, the model results show an initial fast CSH replacement if the flow rates are quite high. In just one year, the alteration front should progress 0.2 to 0.3 cm and Si-rich, low pH CSH would occur (Ca/Si as low as 0.69). However, carbonation is predicted to be active at the alteration front, and coupled to the CSH replacement, leads to porosity loss, limiting the progression of the degrada-tion front at earlier times than in fully diffusive case. In less than 100 years, porosity clogging leads to stop this progression.
From the modelling results obtained in this work, it can be concluded that the quick reduction of porosity makes relatively irrelevant the effect of advective flow through the grout compared with the diffusion-only case, although diffusion coefficient also decreases since is a function of porosity. As a consequence, the progression of the alteration fronts in the grouted boreholes is not significant under the repository conditions for times lower than 1,000 years, and no worrying alkaline plumes are expected.
TR-10-25 5
Contents
1 Motivation and objectives 7
2 Modelling approaches in CSH alteration: The use of solid solutions 92.1 What do the cement alteration experiments tell us? 92.2 Cement alteration modelling 102.3 Implementation of the /Sugiyama and Fujita 2006/ and /Carey and Lichtner
2007/ models into the reactive transport code RCB 132.3.1 Modelled system and initial conditions 132.3.2 /Carey and Lichtner 2007/ approach 162.3.3 /Sugiyama and Fujita 2006/ approach 172.3.4 The numerical code RCB (Retraso+Code Bright) 202.3.5 Results 21
3 Model testing and evaluation: Block leaching tests 273.1 The NUMO-CRIEPI experiments 273.2 Modelled domain and simulation time 283.3 Reactive transport simulations: Initial conditions and reference case 30
3.3.1 Concrete composition and porosity 303.3.2 Leachant and pore water composition 313.3.3 Ion transport 323.3.4 Molar volumes of newly formed CSH phases 32
3.4 Results 343.4.1 Reference case 343.4.2 Sensitivity analysis 36
4 Modelling of the degradation of grouted boreholes 394.1 Introduction 394.2 Simulation of the microstructure of grout 39
4.2.1 Cement materials 394.2.2 Methodology and calculations using CEMHYD3D 41
4.3 1D reactive transport models 444.3.1 Case 1: 1D axisymmetric diffusive model 454.3.2 Case 2: 1D (planar) advective/diffusive model with two fractures 56
5 General discussion and conclusions 65
References 67
Appendix 1 Abbreviations used in the text 71
TR-10-25 7
1 Motivation and objectives
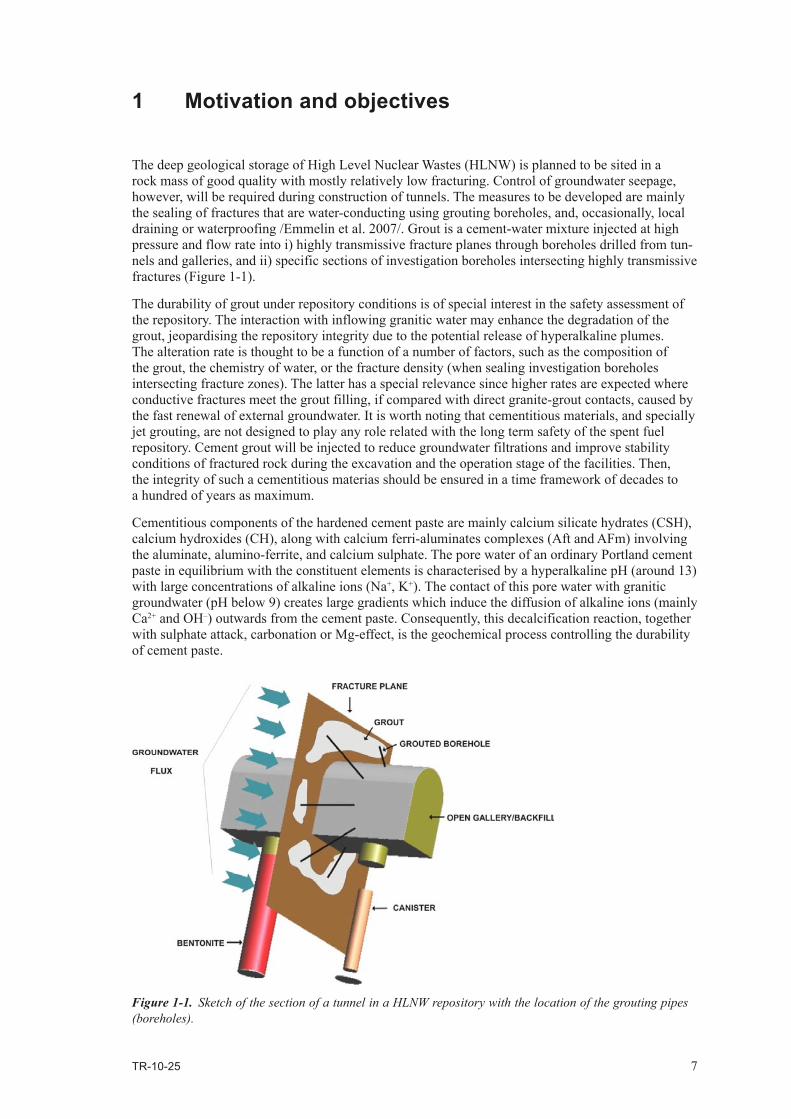
The deep geological storage of High Level Nuclear Wastes (HLNW) is planned to be sited in a rock mass of good quality with mostly relatively low fracturing. Control of groundwater seepage, however, will be required during construction of tunnels. The measures to be developed are mainly the sealing of fractures that are water-conducting using grouting boreholes, and, occasionally, local draining or waterproofing /Emmelin et al. 2007/. Grout is a cement-water mixture injected at high pressure and flow rate into i) highly transmissive fracture planes through boreholes drilled from tun-nels and galleries, and ii) specific sections of investigation boreholes intersecting highly transmissive fractures (Figure 1-1).
The durability of grout under repository conditions is of special interest in the safety assessment of the repository. The interaction with inflowing granitic water may enhance the degradation of the grout, jeopardising the repository integrity due to the potential release of hyperalkaline plumes. The alteration rate is thought to be a function of a number of factors, such as the composition of the grout, the chemistry of water, or the fracture density (when sealing investigation boreholes intersecting fracture zones). The latter has a special relevance since higher rates are expected where conductive fractures meet the grout filling, if compared with direct granite-grout contacts, caused by the fast renewal of external groundwater. It is worth noting that cementitious materials, and specially jet grouting, are not designed to play any role related with the long term safety of the spent fuel repository. Cement grout will be injected to reduce groundwater filtrations and improve stability conditions of fractured rock during the excavation and the operation stage of the facilities. Then, the integrity of such a cementitious materias should be ensured in a time framework of decades to a hundred of years as maximum.
Cementitious components of the hardened cement paste are mainly calcium silicate hydrates (CSH), calcium hydroxides (CH), along with calcium ferri-aluminates complexes (Aft and AFm) involving the aluminate, alumino-ferrite, and calcium sulphate. The pore water of an ordinary Portland cement paste in equilibrium with the constituent elements is characterised by a hyperalkaline pH (around 13) with large concentrations of alkaline ions (Na+, K+). The contact of this pore water with granitic groundwater (pH below 9) creates large gradients which induce the diffusion of alkaline ions (mainly Ca2+ and OH–) outwards from the cement paste. Consequently, this decalcification reaction, together with sulphate attack, carbonation or Mg-effect, is the geochemical process controlling the durability of cement paste.
Figure 1‑1. Sketch of the section of a tunnel in a HLNW repository with the location of the grouting pipes (boreholes).
8 TR-10-25
The model prediction of the cement alteration has been challenging in the last years mainly due to two issues. Firstly, the progressive change in composition of the CSH compounds as the alteration proceeds (incongruent dissolution-precipitation) have required the use of solid solution approaches. Most common approaches, however, are of difficult implementation in commercial reactive transport codes, limiting thus their applicability. Secondly, initial composition of the grout to be considered in the calculations is usually uncertain because only the recipe of low-pH clinker (provided by the manufacturer) and the water-to-cement ratio used to be known. Hydration process leads to the formation of new phases (CSH and others) and, importantly, creates porosity. Both composition and porosity needs to be precisely determined prior to the modelling of the alteration. It is worth noting that grout hydration inside the fracture will introduce additional uncertainty.
The main objective of the CEMMOD project is to evaluate the time evolution and durability of the grouted boreholes in the repository using reactive transport simulations. From the above exposed, this evaluation requires, in a first step, the implementation and validation of a solid solution approach. In this project, laboratory data of grout degradation performed by the Nuclear Waste Organisation (NUMO) and the Central Research Institute of Electric Power Industry (CRIEPI) have been adopted for a such validation. In a second step, the clinker recipe from manufacturer is used to perform hydration calculations in order to determine the initial composition of the grout. Finally, 1D reactive transport simulations are carried out.

TR-10-25 9
2 Modelling approaches in CSH alteration: The use of solid solutions
2.1 What do the cement alteration experiments tell us?The alteration of the cementitious materials has been repeatedly performed in laboratory /e.g. Flint and Wells 1934, Taylor 1950, Kalousek 1952, Greenberg and Chang 1965, Fuji and Kondo 1981, Harris et al. 2002, Chen et al. 2004, and many others/. In general, the data obtained from laboratory experiments show a rather similar dependence between the pH of pore water and the Ca-Si ratio of the hydrated calcium-silicate (CSH) phases. The Ca-Si ratio decreases as the CSH is progressively replaced by Si-enriched phases since CSH dissolution is clearly incongruent. In the initial stages, the cement alteration is limited to portlandite dissolution as pure phase or as a Ca(OH)2 hypothetical end-member of CSH phases. In the latter case, the loss of calcium results in the formation of new CSH with lower Ca/Si ratio. The precise chemistry of these CSH formed during this evolution is not clear because of their gel-like nature.
Some differences in the Ca/Si relationship with pH in the experimental datasets in literature are observed, especially in the experiments dealing with initial Ca/Si ratios between 0.7 and 1.2. First, a sharp and sudden drop in pH coupled with an almost stable Ca/Si is reported, as an example, by /Harris et al. 2002/ (Figure 2-1). Milder variations are, in contrast, provided by /Flint and Wells 1934, Greenberg and Chan 1965/ and /Chen et al. 2004/.
The incongruent dissolution of Ca-rich solids leads to an increase in the calcium concentration in solution at the beginning of the alteration process (Figure 2-2). In time, the calcium concentration decreases reflecting the equilibrium with Ca-poor CSH phases. Part of this calcium can be precipi-tated back as calcite if the concentration of aqueous C(IV) species is high enough. The concentration of silicon shows an opposite behaviour, increasing through time (Figure 2-3). As pH decreases, silica saturation can be achieved and, consequently, part of the Si goes back to the solid phase.
9
10
11
12
13
0 0.5 1 1.5 2 2.5 3
Initial Ca/Si=2.7Initial Ca/Si=1.6Initial Ca/Si=1.4Initial Ca/Si=1.1Initial Ca/Si=0.90Initial Ca/Si=0.81Initial Ca/Si=0.76Initial Ca/Si=0.72Flint and Wells (1934)Greenberg and Chang (1965)Chen et al. (2004)
Har
ris e
t al.
(200
2)
9
10
11
12
13
0 0.5 1 1.5 2 2.5 3
Ca/Si ratio
pH
Initial Ca/Si=2.7Initial Ca/Si=1.6Initial Ca/Si=1.4Initial Ca/Si=1.1Initial Ca/Si=0.90Initial Ca/Si=0.81Initial Ca/Si=0.76Initial Ca/Si=0.72/Flint and Wells 1934//Greenberg and Chang 1965//Chen et al. 2004/
/Har
ris e
t al.
2002
/
Figure 2‑1. Evolution of the CSH composition vs. pH reported from the experiments by /Harris et al. 2002, Flint and Wells 1934, Greenberg and Chan 1965/ and /Chen et al. 2004/. Note the different shape of the curve at Ca/Si ratio from 0.7 to 1.2 mol/mol.

10 TR-10-25
2.2 Cement alteration modellingMany attempts have been carried out to model the changes in the cement chemistry and the pore water in equilibrium by looking at the data obtained in the laboratory experiments. The fundamental aim is to reproduce the complete Ca-Si ratio evolution even assuming that the laboratory data were built from experiments dealing with a small range of Ca/Si each one, see for example the sets of experiments by /Harris et al. 2002/ (Figure 2-1). Moreover, the data of CSH with very low Ca/Si ratio (Ca/Si~0.5) were not obtained adding Si to the system to promote alteration of Ca-rich CSH but adding Ca to SiO2 material.
Figure 2‑2. Evolution of the CSH composition (mol/mol) vs. [Ca]T reported from the experiments by /Harris et al. 2002, Flint and Wells 1934, Greenberg and Chan 1965/ and /Chen et al. 2004/.
Figure 2‑3. Evolution of the CSH composition (mol/mol) vs. [Si]T reported from the experiments by /Harris et al. 2002, Greenberg and Chan 1965/ and /Chen et al. 2004/.
0
0.5
1
1.5
2
2.5
3
3.5
0.0E+00 5.0E-03 1.0E-02 1.5E-02 2.0E-02 2.5E-02
[Ca] (mol·L-1)
Ca/
Si
/Harris et al. 2002/
/Flint and Wells 1934/
/Greenberg and Chang 1965/
/Chen et al. 2004/
0.4
0.8
1.2
1.6
2
2.4
2.8
1.0E-06 1.0E-05 1.0E-04 1.0E-03 1.0E-02 1.0E-01
[Si] mol·L-1
Ca/
Si
/Harris et al. 2002/
/Greenberg and Chang 1965/
/Chen et al. 2004/
TR-10-25 11
The initial modelling approaches used a (usually) small number of crystalline CSH (14Å tober-morite, Ca/Si=0.83; Jennite, Ca/Si=1.5) in thermodynamic equilibrium with the cement pore water. The main problem in these approaches was the inability to precisely model the incongruent dissolu-tion of the CSH.
Another approach has been the consideration of the CSH phases as solid solutions. This was adopted since it is an elegant way to model an incongruent dissolution. However, it is worth keeping in mind that CSH are not solid solutions; actually, they are not crystalline solids, which is an imperative requirement for a solid solution. In addition, crystalline equivalents of CSH are not proved to be solid solutions.
Many recent studies have used solid solutions to model cement degradation /e.g. Berner 1988, 1992, Kersten 1996, Börjesson et al. 1997, Rahman et al. 1999, Kulik and Kersten 2001, Sugiyama and Fujita 2006, Carey and Lichtner 2007, Walker et al. 2007, Small and Thompson 2008/. Most of them assumed a strong non-ideality of a binary solid solution series (meaning that the solubility constant of a CSH member is depending not only in its molar fraction but also in the composition of the solid itself (eq. 2-1).
( ) ( ) ssss xss
xssssss xKxKxK −−= 1
2211 )1()( λλ (eq. 2-1)
where K1 and K2 are the solubility constants of the end-members, x is the molar fraction of the CSH solid. λ1 and λ2 are activity constants that govern the non-ideality of the system and can be treated mathematically by means of the Guggenheim expressions (eq. 2-2 and eq. 2-3 for a development of a model with 3 terms).
ln λ1 = (1-x1)2[α0+α1(4x1-1)+(2x1-1)(α2(6x1-1)+α3(16x12-10x1+1))] (eq. 2-2)
ln λ2 = x12 [α0+α1(4x1-3)+(2x1-1)(α2(6x1-5)+α3(16x1
2-22x1+7))] (eq. 2-3)
where α0, …, αn are the interaction parameters.
The complex nature of the CSH system is reflected in the fact that it has resulted impossible to reproduce the degradation of the CSH in the whole Ca-Si range of compositions (commonly Ca/Si=0.5–2.5) by considering only two end-members and fixed interaction parameters. This is true a least when dealing with the data trend shown by the /Harris et al. 2002/ dataset type. Multiple non-ideal end-members with interaction parameters as a function of the solid composition can not be managed in the existing codes of reactive transport (e.g, PHREEQC).
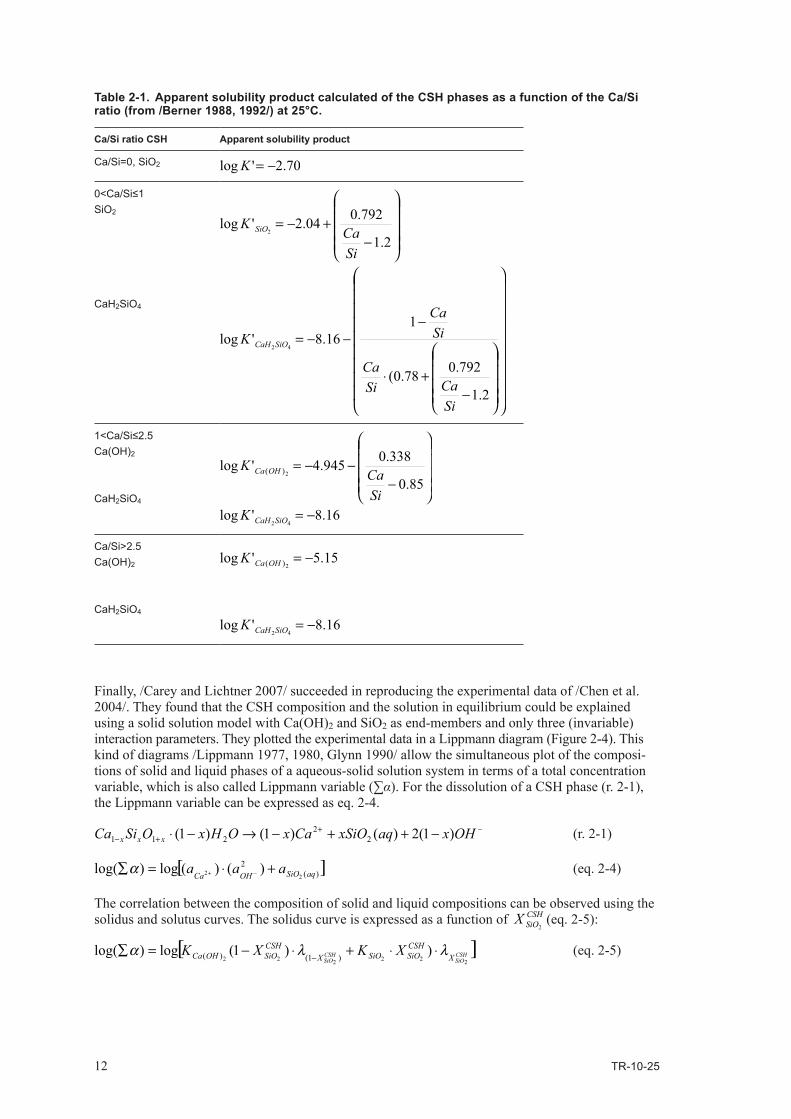
/Berner 1988, 1992/ used three different end-members to calculate the apparent solubility product (conditional K or K’) of the CSH phases (Table 2-1). The end-members were SiO2(am), CaH2SiO4 and Ca(OH)2 (portlandite). The use of apparent solubility products is equivalent to the use of activity constants λ, as in eq. 2-2 and 2-3.
/Börjesson et al. 1997/ and /Rahman et al. 1999/ and, later, /Walker et al. 2007/ used two end members (Ca(OH)2 and CaH2SiO4) and two interaction parameters but the model can only reproduce CSH phases with Ca/Si>1, excluding the alteration of low-pH cements.
Later, /Kulik and Kersten 2001/ selected two binary, ideal solid solutions (CSH-I and CSH-II) based on structural calculations. CSH-I involves SiO2 and tobermorite-I, and CSH-II has as end-members tobermorite-II (with the same formula as tobermorite-I but different solubility constant) and jennite. The solubility products of the end-members were optimised to fit the experimental data by modify-ing the number of Si moles in the structural formula.
/Sugiyama and Fujita 2006/ calculated the corresponding conditional solubility constants for four groups of CSH compositions considering only two end-members, Ca(OH)2 and SiO2, covering the whole Ca/Si range (see below for details). They used variable interaction parameters for the CSH with compositions above and below Ca/Si=0.833. This model was subsequently used by /Benbow et al. 2007/ in a reactive transport model of a cement block.
12 TR-10-25
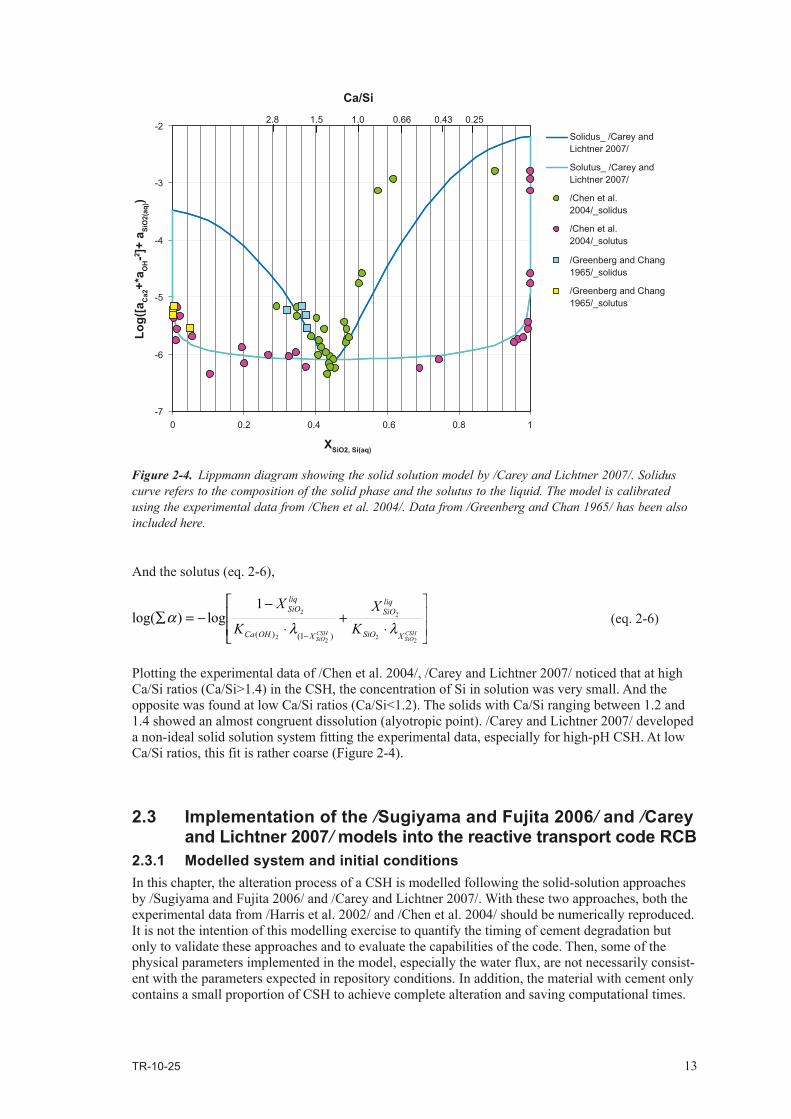
Finally, /Carey and Lichtner 2007/ succeeded in reproducing the experimental data of /Chen et al. 2004/. They found that the CSH composition and the solution in equilibrium could be explained using a solid solution model with Ca(OH)2 and SiO2 as end-members and only three (invariable) interaction parameters. They plotted the experimental data in a Lippmann diagram (Figure 2-4). This kind of diagrams /Lippmann 1977, 1980, Glynn 1990/ allow the simultaneous plot of the composi-tions of solid and liquid phases of a aqueous-solid solution system in terms of a total concentration variable, which is also called Lippmann variable (∑α). For the dissolution of a CSH phase (r. 2-1), the Lippmann variable can be expressed as eq. 2-4.
−++− −++−→−⋅ OHxaqxSiOCaxOHxOSiCa xxx )1(2)()1()1( 2
2211 (r. 2-1)
[ ])(2
22 )()(log)log( aqSiOOHCa aaa +⋅=∑ −+α (eq. 2-4)
The correlation between the composition of solid and liquid compositions can be observed using the solidus and solutus curves. The solidus curve is expressed as a function of CSH
SiOX2
(eq. 2-5):
[ ]CSHSiO
CSHSiO X
CSHSiOSiOX
CSHSiOOHCa XKXK
222222))1(log)log( )1()( λλα ⋅⋅+⋅−=∑
− (eq. 2-5)
Table 2‑1. Apparent solubility product calculated of the CSH phases as a function of the Ca/Si ratio (from /Berner 1988, 1992/) at 25°C.
Ca/Si ratio CSH Apparent solubility product
Ca/Si=0, SiO2 70.2'log −=K
0<Ca/Si≤1 SiO2
CaH2SiO4
−+⋅
−−−=
−+−=
2.1
792.078.0(
116.8'log
2.1
792.004.2'log
42
2
SiCaSi
Ca
SiCa
K
SiCa
K
SiOCaH
SiO
1<Ca/Si≤2.5 Ca(OH)2
CaH2SiO4
16.8'log
85.0
338.0945.4'log
42
2)(
−=
−−−=
SiOCaH
OHCa
KSiCa
K
Ca/Si>2.5 Ca(OH)2
CaH2SiO4
16.8'log
15.5'log
42
2)(
−=
−=
SiOCaH
OHCa
K
K
TR-10-25 13
And the solutus (eq. 2-6),
⋅+
⋅
−−=∑
− CSHSiO
CSHSiO XSiO
liqSiO
XOHCa
liqSiO
KX
K
X
22
2
22
2
)1()(
1log)log(
λλα (eq. 2-6)
Plotting the experimental data of /Chen et al. 2004/, /Carey and Lichtner 2007/ noticed that at high Ca/Si ratios (Ca/Si>1.4) in the CSH, the concentration of Si in solution was very small. And the opposite was found at low Ca/Si ratios (Ca/Si<1.2). The solids with Ca/Si ranging between 1.2 and 1.4 showed an almost congruent dissolution (alyotropic point). /Carey and Lichtner 2007/ developed a non-ideal solid solution system fitting the experimental data, especially for high-pH CSH. At low Ca/Si ratios, this fit is rather coarse (Figure 2-4).
2.3 Implementation of the /Sugiyama and Fujita 2006/ and /Carey and Lichtner 2007/ models into the reactive transport code RCB
2.3.1 Modelled system and initial conditionsIn this chapter, the alteration process of a CSH is modelled following the solid-solution approaches by /Sugiyama and Fujita 2006/ and /Carey and Lichtner 2007/. With these two approaches, both the experimental data from /Harris et al. 2002/ and /Chen et al. 2004/ should be numerically reproduced. It is not the intention of this modelling exercise to quantify the timing of cement degradation but only to validate these approaches and to evaluate the capabilities of the code. Then, some of the physical parameters implemented in the model, especially the water flux, are not necessarily consist-ent with the parameters expected in repository conditions. In addition, the material with cement only contains a small proportion of CSH to achieve complete alteration and saving computational times.
-7
-6
-5
-4
-3
-2
0 0.2 0.4 0.6 0.8 1
Solidus_ /Carey andLichtner 2007/
Solutus_ /Carey andLichtner 2007/
/Chen et al.2004/_solidus
/Chen et al.2004/_solutus
/Greenberg and Chang1965/_solidus
/Greenberg and Chang1965/_solutus
2.8 1.5 1.0 0.66 0.43 0.25
Ca/Si
XSiO2, Si(aq)
Log(
[aC
a2+*
a OH-2 ]+
aSi
O2(
aq))
Figure 2‑4. Lippmann diagram showing the solid solution model by /Carey and Lichtner 2007/. Solidus curve refers to the composition of the solid phase and the solutus to the liquid. The model is calibrated using the experimental data from /Chen et al. 2004/. Data from /Greenberg and Chan 1965/ has been also included here.
14 TR-10-25
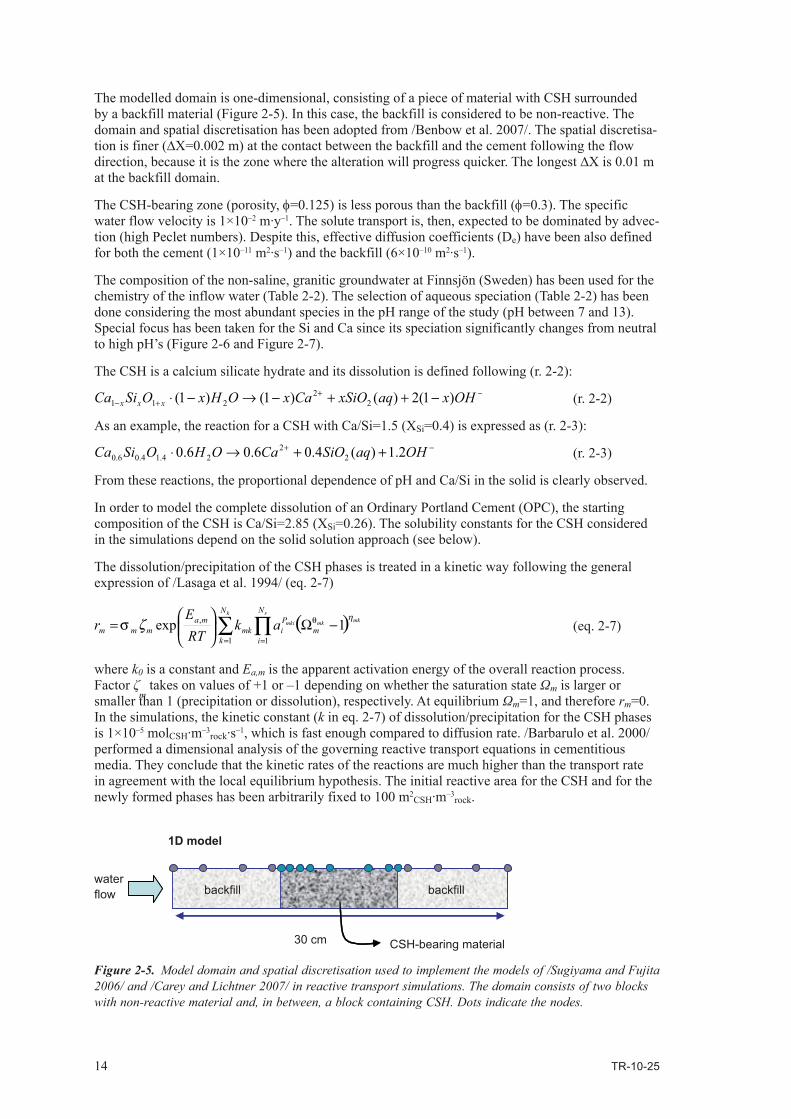
The modelled domain is one-dimensional, consisting of a piece of material with CSH surrounded by a backfill material (Figure 2-5). In this case, the backfill is considered to be non-reactive. The domain and spatial discretisation has been adopted from /Benbow et al. 2007/. The spatial discretisa-tion is finer (∆X=0.002 m) at the contact between the backfill and the cement following the flow direction, because it is the zone where the alteration will progress quicker. The longest ∆X is 0.01 m at the backfill domain.
The CSH-bearing zone (porosity, φ=0.125) is less porous than the backfill (φ=0.3). The specific water flow velocity is 1×10⁻² m·y–1. The solute transport is, then, expected to be dominated by advec-tion (high Peclet numbers). Despite this, effective diffusion coefficients (De) have been also defined for both the cement (1×10–11 m2·s–1) and the backfill (6×10⁻¹⁰ m2·s–1).
The composition of the non-saline, granitic groundwater at Finnsjön (Sweden) has been used for the chemistry of the inflow water (Table 2-2). The selection of aqueous speciation (Table 2-2) has been done considering the most abundant species in the pH range of the study (pH between 7 and 13). Special focus has been taken for the Si and Ca since its speciation significantly changes from neutral to high pH’s (Figure 2-6 and Figure 2-7).
The CSH is a calcium silicate hydrate and its dissolution is defined following (r. 2-2):−+
+− −++−→−⋅ OHxaqxSiOCaxOHxOSiCa xxx )1(2)()1()1( 22
211 (r. 2-2)
As an example, the reaction for a CSH with Ca/Si=1.5 (XSi=0.4) is expressed as (r. 2-3):−+ ++→⋅ OHaqSiOCaOHOSiCa 2.1)(4.06.06.0 2
224.14.06.0 (r. 2-3)
From these reactions, the proportional dependence of pH and Ca/Si in the solid is clearly observed.
In order to model the complete dissolution of an Ordinary Portland Cement (OPC), the starting composition of the CSH is Ca/Si=2.85 (XSi=0.26). The solubility constants for the CSH considered in the simulations depend on the solid solution approach (see below).
The dissolution/precipitation of the CSH phases is treated in a kinetic way following the general expression of /Lasaga et al. 1994/ (eq. 2-7)
( ) mkmk
s
mki
k
m
N
i
Pi
N
kmk
mammm ak
RTE
r ηθζσ 1exp11
, −Ω
= ∏∑
== (eq. 2-7)
where k0 is a constant and Ea,m is the apparent activation energy of the overall reaction process. Factor ζ
m takes on values of +1 or –1 depending on whether the saturation state Ωm is larger or
smaller than 1 (precipitation or dissolution), respectively. At equilibrium Ωm=1, and therefore rm=0. In the simulations, the kinetic constant (k in eq. 2-7) of dissolution/precipitation for the CSH phases is 1×10⁻⁵ molCSH·m–3
rock·s–1, which is fast enough compared to diffusion rate. /Barbarulo et al. 2000/ performed a dimensional analysis of the governing reactive transport equations in cementitious media. They conclude that the kinetic rates of the reactions are much higher than the transport rate in agreement with the local equilibrium hypothesis. The initial reactive area for the CSH and for the newly formed phases has been arbitrarily fixed to 100 m2
CSH·m–3rock.
30 cm
1D model
waterflow backfill backfill
CSH-bearing material
backfill backfill
Figure 2‑5. Model domain and spatial discretisation used to implement the models of /Sugiyama and Fujita 2006/ and /Carey and Lichtner 2007/ in reactive transport simulations. The domain consists of two blocks with non-reactive material and, in between, a block containing CSH. Dots indicate the nodes.

TR-10-25 15
Table 2‑2. Composition of the inflow groundwater and aqueous species selected in the reactive transport calculations.
Aqueous species
T (°) 25pH 7.9 H+, OH–
Ca 3.5×10⁻³ Ca2+, Ca(OH)+
Si 2.0×10⁻⁴ SiO2(aq), HSiO3–, H2SiO4
2–
Na 1.2×10⁻² Na+
K 5.1×10⁻⁵ K+
Mg 7.0×10⁻⁴ Mg2+, Mg(OH)+
Cl 1.6×10⁻² Cl–
S(VI) 5.1×10⁻⁴ SO42–
C(IV) 4.6×10⁻³ CO32–, HCO3
–
Ionic strength 2.6×10⁻²
Concentration in mol·L–1
Figure 2‑6. Fraction diagram showing the speciation of aqueous Si in the pH range of interest in the numerical simulations, at 25°C.
Figure 2‑7. Fraction diagram showing the speciation of aqueous Ca in the pH range of interest in the numerical simulations. The thermodynamic database used is the SKB-TDB. This database is that developed by /Hummel et al. 2002/ with substantial modifications as reported in /Duro et al. 2006/.
8 9 10 11 12 13 140.0
0.2
0.4
0.6
0.8
1.0
pH
SiO2(aq)
HSiO3- H2SiO4
2-
Frac
tion
[Si]total= 1×10⁻⁴ mol·L-1
8 9 10 11 12 13 140.0
0.2
0.4
0.6
0.8
1.0
SiO2(aq)
HSiO3- H2SiO4
2-
[Si]total= 1×10⁻⁴ mol·L-1
8 9 10 11 12 13 140.0
0.2
0.4
0.6
0.8
1.0
Frac
tion
pH
[Ca]total= 1×10⁻² mol·L-1
Ca2+
CaOH+
8 9 10 11 12 13 140.0
0.2
0.4
0.6
0.8
1.0
[Ca]total= 1×10⁻² mol·L-1
Ca2+
CaOH+
16 TR-10-25
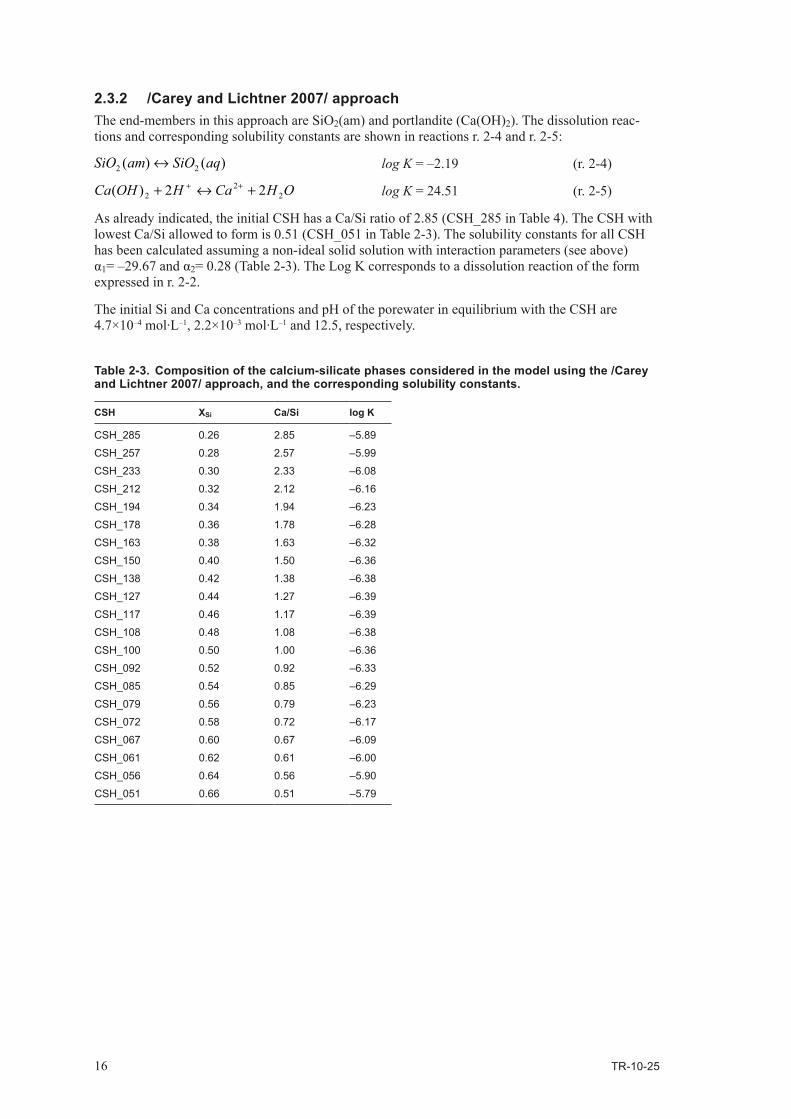
2.3.2 /Carey and Lichtner 2007/ approachThe end-members in this approach are SiO2(am) and portlandite (Ca(OH)2). The dissolution reac-tions and corresponding solubility constants are shown in reactions r. 2-4 and r. 2-5:
)()( 22 aqSiOamSiO ↔ log K = –2.19 (r. 2-4)
OHCaHOHCa 22
2 22)( +↔+ ++ log K = 24.51 (r. 2-5)
As already indicated, the initial CSH has a Ca/Si ratio of 2.85 (CSH_285 in Table 4). The CSH with lowest Ca/Si allowed to form is 0.51 (CSH_051 in Table 2-3). The solubility constants for all CSH has been calculated assuming a non-ideal solid solution with interaction parameters (see above) α1= –29.67 and α2= 0.28 (Table 2-3). The Log K corresponds to a dissolution reaction of the form expressed in r. 2-2.
The initial Si and Ca concentrations and pH of the porewater in equilibrium with the CSH are 4.7×10⁻⁴ mol·L–1, 2.2×10⁻³ mol·L–1 and 12.5, respectively.
Table 2‑3. Composition of the calcium‑silicate phases considered in the model using the /Carey and Lichtner 2007/ approach, and the corresponding solubility constants.
CSH XSi Ca/Si log K
CSH_285 0.26 2.85 –5.89
CSH_257 0.28 2.57 –5.99
CSH_233 0.30 2.33 –6.08
CSH_212 0.32 2.12 –6.16
CSH_194 0.34 1.94 –6.23
CSH_178 0.36 1.78 –6.28
CSH_163 0.38 1.63 –6.32
CSH_150 0.40 1.50 –6.36
CSH_138 0.42 1.38 –6.38
CSH_127 0.44 1.27 –6.39
CSH_117 0.46 1.17 –6.39
CSH_108 0.48 1.08 –6.38
CSH_100 0.50 1.00 –6.36
CSH_092 0.52 0.92 –6.33
CSH_085 0.54 0.85 –6.29
CSH_079 0.56 0.79 –6.23
CSH_072 0.58 0.72 –6.17
CSH_067 0.60 0.67 –6.09
CSH_061 0.62 0.61 –6.00
CSH_056 0.64 0.56 –5.90
CSH_051 0.66 0.51 –5.79

TR-10-25 17
2.3.3 /Sugiyama and Fujita 2006/ approach/Sugiyama and Fujita 2006/ calculated the conditional solubility constants for the end members (SiO2 and portlandite) as a function of the Ca/Si ratio of the solid solution following the next equali-ties:
(1) For 0<Ca/SiCSH≤0.461:
+⋅=
1)/(1loglogSiCa
KK SoS
+−
⋅+
+−
⋅+
⋅
++
+
⋅+
−⋅+
=
2
2
)/(11)/(17.164
)/(11)/(724.36019.37
)/(1)/(
)/(1)/(
log)/(1
)/(log
)/(1)/(
log
SiCaSiCa
SiCaSiCa
SiCaSiCa
SiCaSiCa
SiCaSiCaK
SiCaSiCaK CoC
(2) For 0.461<Ca/SiCSH≤0.833:
+−
⋅−
+−
⋅+−
⋅
++
+
⋅+
−⋅+
=
2
2
)/(1)/(1241.58
)/(1)/(1754.57623.18
)/(1)/(
)/(11log
)/(11log
)/(11log
SiCaSiCa
SiCaSiCa
SiCaSiCa
SiCaSiCaK
SiCaK SoS
+−⋅+
+−⋅+
⋅
+
+
+
⋅+
−⋅+
=
2
2
)/(11)/(17.164
)/(11)/(724.36019.37
)/(1)/(
)/(1)/(log
)/(1)/(log
)/(1)/(log
SiCaSiCa
SiCaSiCa
SiCaSiCa
SiCaSiCa
SiCaSiCaK
SiCaSiCaK CoC
(3) For 0.833<Ca/SiCSH≤1.755:
+−
⋅+
+−
⋅+−
⋅
++
+
⋅+
−⋅+
=
2
2
)/(1)/(1033.25
)/(1)/(1712.49656.18
)/(1)/(
)/(11log
)/(11log
)/(11log
SiCaSiCa
SiCaSiCa
SiCaSiCa
SiCaSiCaK
SiCaK SoS
+−
⋅−
+−
⋅+
⋅
++
+
⋅+
−⋅+
=
2
2
)/(11)/(792.50
)/(11)/(8302.7937.36
)/(1)/(
)/(1)/(log
)/(1)/(log
)/(1)/(log
SiCaSiCa
SiCaSiCa
SiCaSiCa
SiCaSiCa
SiCaSiCaK
SiCaSiCaK CoC
(4) For 1.755<Ca/SiCSH:
log KS = –7.853
log KC = 22.81
18 TR-10-25
In all cases, log KS0 and log KC0 are the solubility constants for SiO2 and portlandite respectively (r. 2-6 and r. 2-7) at 25°C. log KS log KC are the calculated conditional solubility products of both end members in the solid solution.
)()( 22 aqSiOamSiO ↔ log KSo = –2.71 (r. 2-6)
OHCaHOHCa 22
2 22)( +↔+ ++ log KCo = 22.81 (r. 2-7)
Once KS and KC for each solid solution is calculated, the KCSH can be obtained using eq. 2-8:
( ) ( ) ssss xssC
xssSssss xKxKxK −−⋅⋅= 1)1()( (eq. 2-8)
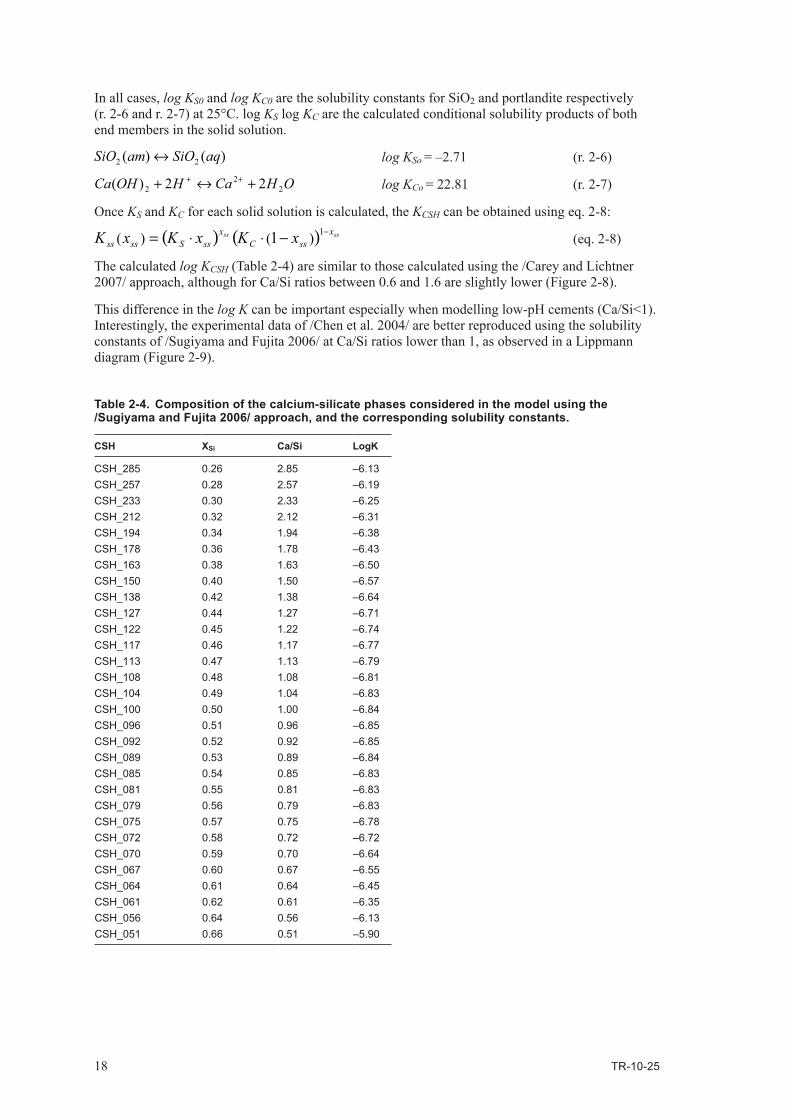
The calculated log KCSH (Table 2-4) are similar to those calculated using the /Carey and Lichtner 2007/ approach, although for Ca/Si ratios between 0.6 and 1.6 are slightly lower (Figure 2-8).
This difference in the log K can be important especially when modelling low-pH cements (Ca/Si<1). Interestingly, the experimental data of /Chen et al. 2004/ are better reproduced using the solubility constants of /Sugiyama and Fujita 2006/ at Ca/Si ratios lower than 1, as observed in a Lippmann diagram (Figure 2-9).
Table 2‑4. Composition of the calcium‑silicate phases considered in the model using the /Sugiyama and Fujita 2006/ approach, and the corresponding solubility constants.
CSH XSi Ca/Si LogK
CSH_285 0.26 2.85 –6.13CSH_257 0.28 2.57 –6.19CSH_233 0.30 2.33 –6.25CSH_212 0.32 2.12 –6.31CSH_194 0.34 1.94 –6.38CSH_178 0.36 1.78 –6.43CSH_163 0.38 1.63 –6.50CSH_150 0.40 1.50 –6.57CSH_138 0.42 1.38 –6.64CSH_127 0.44 1.27 –6.71CSH_122 0.45 1.22 –6.74CSH_117 0.46 1.17 –6.77CSH_113 0.47 1.13 –6.79CSH_108 0.48 1.08 –6.81CSH_104 0.49 1.04 –6.83CSH_100 0.50 1.00 –6.84CSH_096 0.51 0.96 –6.85CSH_092 0.52 0.92 –6.85CSH_089 0.53 0.89 –6.84CSH_085 0.54 0.85 –6.83CSH_081 0.55 0.81 –6.83CSH_079 0.56 0.79 –6.83CSH_075 0.57 0.75 –6.78CSH_072 0.58 0.72 –6.72CSH_070 0.59 0.70 –6.64CSH_067 0.60 0.67 –6.55CSH_064 0.61 0.64 –6.45CSH_061 0.62 0.61 –6.35CSH_056 0.64 0.56 –6.13CSH_051 0.66 0.51 –5.90

TR-10-25 19
Figure 2‑8. Comparison between the log K of the CSH as a function of the Ca/Si ratio calculated using the /Sugiyama and Fujita 2006/ and /Carey and Lichtner 2007/.
Figure 2‑9. Lippmann diagram showing the solidus curves as calculated following the approaches of /Sugiyama and Fujita 2006/ and /Carey and Lichtner 2007/.
-8
-7
-6
-5
-4
-3
-2
-1
0 0.4 0.8 1.2 1.6 2 2.4 2.8
Ca/Si
Log
Ksp
CSH
/Sugiyama and Fujita 2006/
/Carey and Lichtner 2007/
-7
-6
-5
-4
-3
-2
0 0.2 0.4 0.6 0.8 1
Solidus_/Carey andLichtner 2007/ Solutus_/Carey andLichtner 2007/Solidus_ /Sugiyama and Fujita 2006//Chen et al.2004/_solidus/Chen et al.2004/_solutus/Greenberg and Chang1965/_solidus/Greenberg and Chang1965/_solutus
Log(
[aC
a2+*
a OH
-2 ]+
a SiO
2(aq
))
XSiO2, Si(aq)
20 TR-10-25
2.3.4 The numerical code RCB (Retraso+Code Bright)The capabilities of several reactive transport codes have been reviewed prior to the selection of the code to be used in the present work. Among these codes, PHREEQC /Parkhurst and Appelo 1999/, CRUNCHFLOW /Steefel 2008/, CORE /Samper et al. 2000/ and RCB /Saaltink et al. 1997/ have been thoroughly examined.
The numerical tool selected was RCB. This code is the result of coupling two independent codes: RETRASO (REactive TRAnsport of SOlutes) and CodeBright (COupled DEformation of BRIne Gas and Heat Transport). The former solves reactive transport of solutes /Saaltink et al. 1997/ and the latter is able to simulate thermo-hydraulic-mechanical processes in multiphase, saline media /Olivella et al. 1996/. The general capabilities of this code are:
• multiphase flow modelling (liquid and/or gas),• heat flow modelling,• water condensation and evaporation and their effect on heat transport,• simulation of meteorological phenomena as boundary conditions,• simulation of solute transport by advection, dispersion and diffusion in gas and liquid phase,• simulation of chemical reactions.
RCB solves problems in one, two and three dimensions. The modelled domains are defined from finite elements: In two dimensions the elements are triangular or quadratic, whereas in 3-dimensions the elements are tetrahedrons, triangular prisms or quadrilateral prisms. Boundary conditions can be fixed either for the multiphase (water and gas) or heat or solute transport. In addition to that, atmospheric conditions can also be included when modelling meteorological phenomena (rain, evaporation, radiation and atmosphere-soil exchange). Among the water flow boundary conditions, RCB includes fixed head or constant water flux (including no flux condition). When dealing with gaseous phases, the code allows the user to fix the density, the gas flux or the gas pressure. For heat transport, the heat flux or the boundary temperature can be prescribed. In the case of solute transport, it is allowed to assume a prescribed concentration or a fixed solute flow.
The chemical system in RCB is built from a selection of a set of atomic constituents or elements (master or primary species). The combination of these species results in secondary species that are also going to participate in the chemical speciation calculations. Chemical reactions considered in the code are aqueous complexation, precipitation and dissolution of minerals, sorption, and gas-liquid interaction. The activity coefficients used for the aqueous complexation are calculated by means of the extended Debye-Hückel approach. It is worth mentioning that RCB is able to model adsorption processes following a number of electrostatic (diffuse layer, triple layer or constant capacitance) or non electrostatic (linear isotherm, non-linear isotherm, cation exchange) models. In the cation exchange models the code allows the definition of exchange reactions following different conventions (Gaines-Thomas, Gapon).
RCB can simulate equilibrium between aqueous and binary solid solutions following the approach by /Lichtner and Carey 2006/. The solid solution can be ideal or non-ideal. RCB does not compute a continuous set of solid solutions but the user must discretise the solid solution into a discrete number of intermediate solids.
The calculation method used in RCB is the DSA (Direct Substitution Approach), in which all chemical equations are substituted in the transport equations and then they are solved by using Newton-Raphson and Picard methods. The DSA approach is more robust and can use longer time increments that those utilised by the two-step approaches, as SIA (Sequential Iteration Approach) /Saaltink 1999/.
The capabilities of the RCB have been tested in a large number of cases of reactive transport of solutes /Ayora et al. 1998, Ayora et al. 2007, Corbella et al. 2006, Saaltink et al. 2002, among others/.
TR-10-25 21
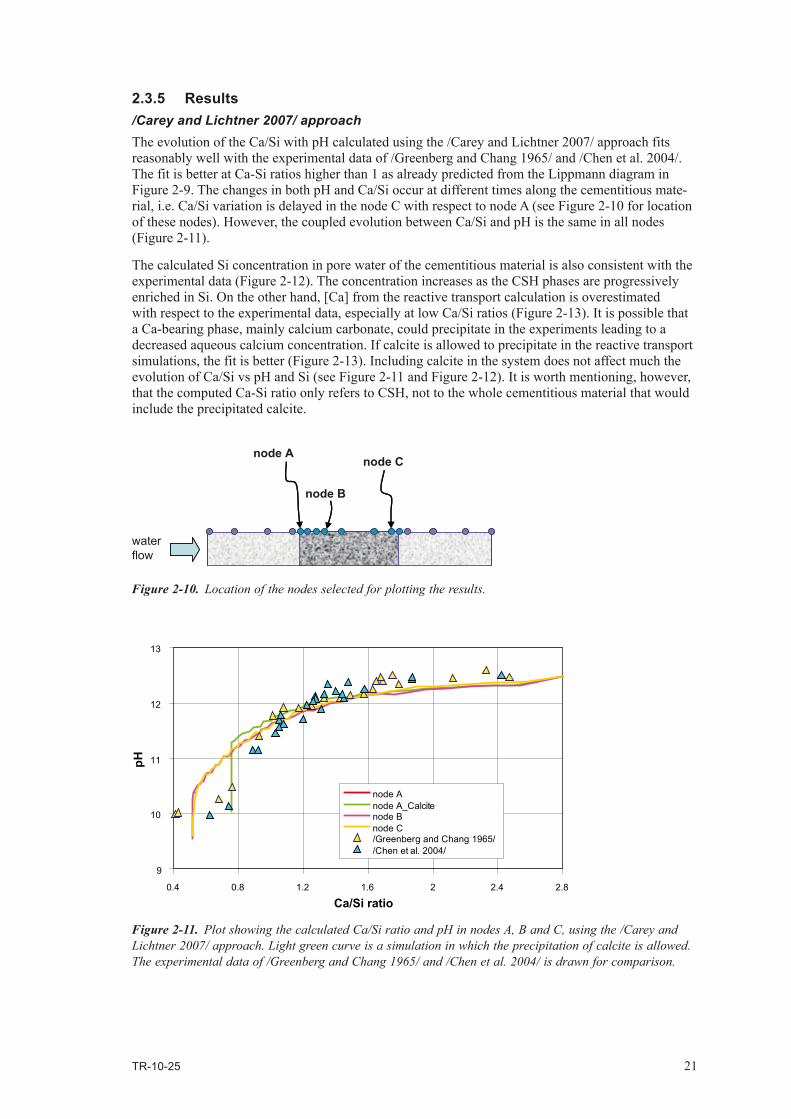
2.3.5 Results/Carey and Lichtner 2007/ approachThe evolution of the Ca/Si with pH calculated using the /Carey and Lichtner 2007/ approach fits reasonably well with the experimental data of /Greenberg and Chang 1965/ and /Chen et al. 2004/. The fit is better at Ca-Si ratios higher than 1 as already predicted from the Lippmann diagram in Figure 2-9. The changes in both pH and Ca/Si occur at different times along the cementitious mate-rial, i.e. Ca/Si variation is delayed in the node C with respect to node A (see Figure 2-10 for location of these nodes). However, the coupled evolution between Ca/Si and pH is the same in all nodes (Figure 2-11).
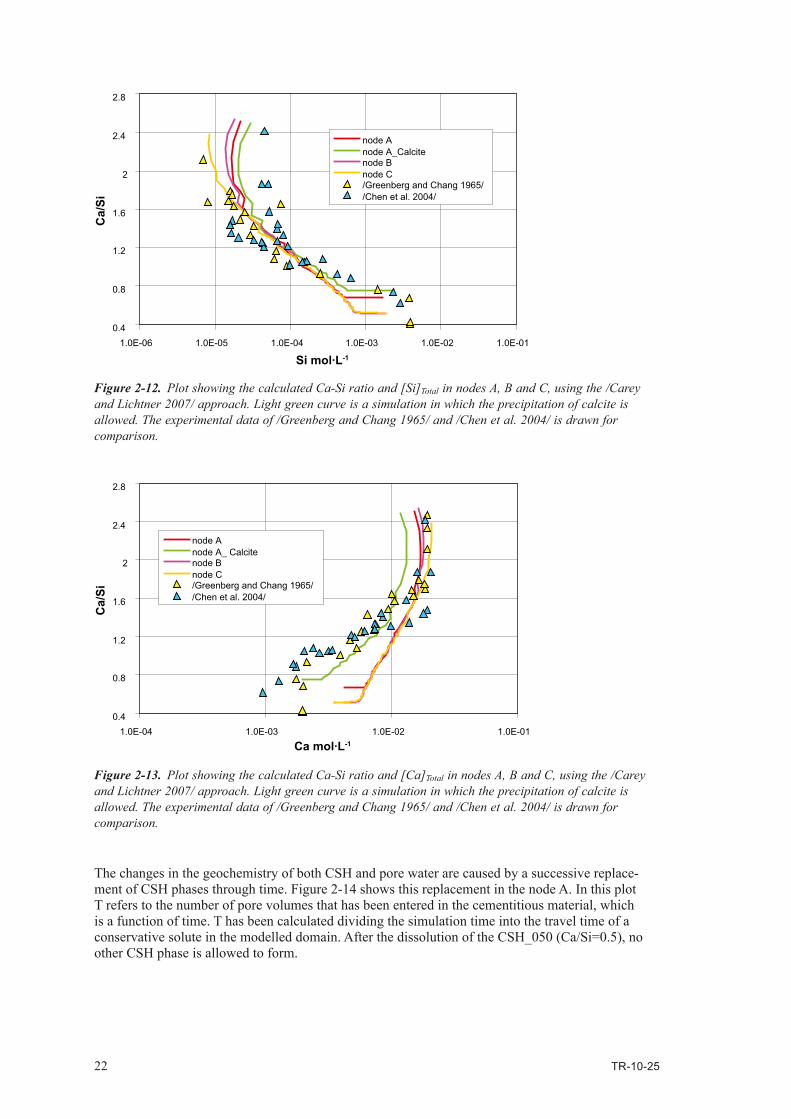
The calculated Si concentration in pore water of the cementitious material is also consistent with the experimental data (Figure 2-12). The concentration increases as the CSH phases are progressively enriched in Si. On the other hand, [Ca] from the reactive transport calculation is overestimated with respect to the experimental data, especially at low Ca/Si ratios (Figure 2-13). It is possible that a Ca-bearing phase, mainly calcium carbonate, could precipitate in the experiments leading to a decreased aqueous calcium concentration. If calcite is allowed to precipitate in the reactive transport simulations, the fit is better (Figure 2-13). Including calcite in the system does not affect much the evolution of Ca/Si vs pH and Si (see Figure 2-11 and Figure 2-12). It is worth mentioning, however, that the computed Ca-Si ratio only refers to CSH, not to the whole cementitious material that would include the precipitated calcite.
Figure 2‑11. Plot showing the calculated Ca/Si ratio and pH in nodes A, B and C, using the /Carey and Lichtner 2007/ approach. Light green curve is a simulation in which the precipitation of calcite is allowed. The experimental data of /Greenberg and Chang 1965/ and /Chen et al. 2004/ is drawn for comparison.
Figure 2‑10. Location of the nodes selected for plotting the results.
waterflow
node A
node B
node C
9
10
11
12
13
0.4 0.8 1.2 1.6 2 2.4 2.8
Ca/Si ratio
pH
node Anode A_Calcitenode Bnode C/Greenberg and Chang 1965//Chen et al. 2004/
22 TR-10-25
Figure 2‑12. Plot showing the calculated Ca-Si ratio and [Si]Total in nodes A, B and C, using the /Carey and Lichtner 2007/ approach. Light green curve is a simulation in which the precipitation of calcite is allowed. The experimental data of /Greenberg and Chang 1965/ and /Chen et al. 2004/ is drawn for comparison.
Figure 2‑13. Plot showing the calculated Ca-Si ratio and [Ca]Total in nodes A, B and C, using the /Carey and Lichtner 2007/ approach. Light green curve is a simulation in which the precipitation of calcite is allowed. The experimental data of /Greenberg and Chang 1965/ and /Chen et al. 2004/ is drawn for comparison.
0.4
0.8
1.2
1.6
2
2.4
2.8
1.0E-06 1.0E-05 1.0E-04 1.0E-03 1.0E-02 1.0E-01
Si mol·L-1
Ca/
Si
node Anode A_Calcitenode Bnode C/Greenberg and Chang 1965//Chen et al. 2004/
0.4
0.8
1.2
1.6
2
2.4
2.8
1.0E-04 1.0E-03 1.0E-02 1.0E-01
Ca mol·L-1
Ca/
Si
node Anode A_ Calcitenode Bnode C/Greenberg and Chang 1965//Chen et al. 2004/
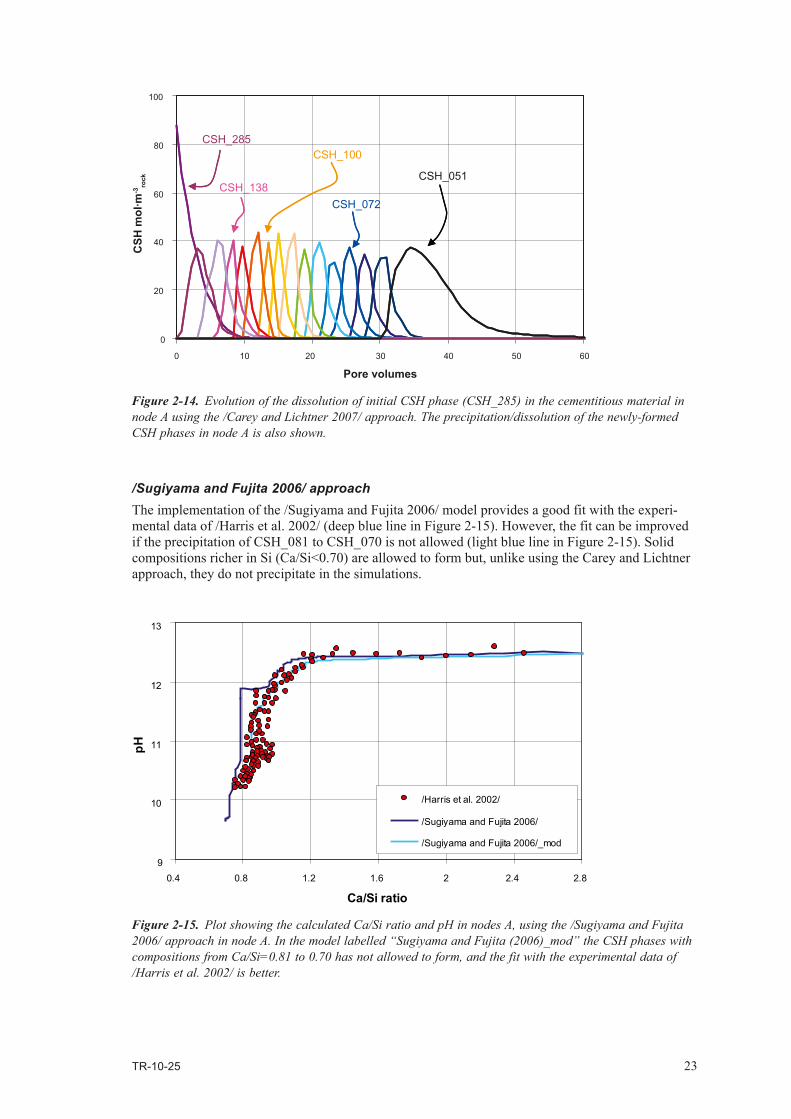
The changes in the geochemistry of both CSH and pore water are caused by a successive replace-ment of CSH phases through time. Figure 2-14 shows this replacement in the node A. In this plot T refers to the number of pore volumes that has been entered in the cementitious material, which is a function of time. T has been calculated dividing the simulation time into the travel time of a conservative solute in the modelled domain. After the dissolution of the CSH_050 (Ca/Si=0.5), no other CSH phase is allowed to form.
TR-10-25 23
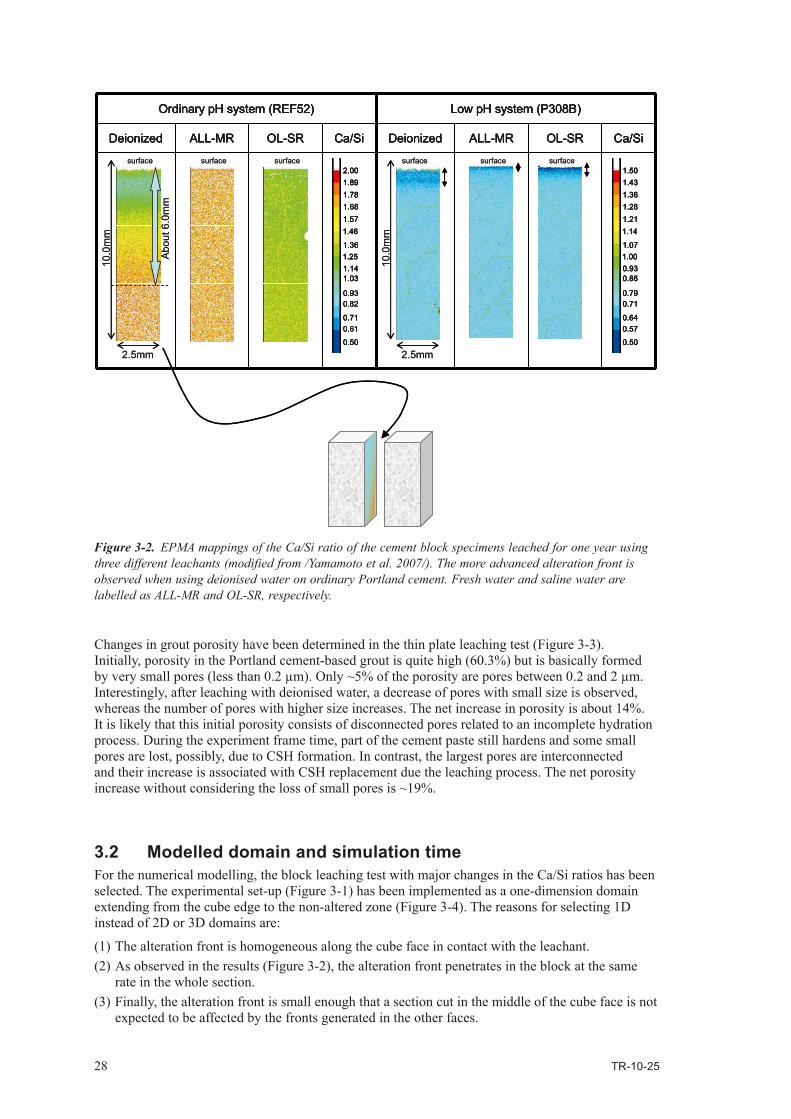
/Sugiyama and Fujita 2006/ approachThe implementation of the /Sugiyama and Fujita 2006/ model provides a good fit with the experi-mental data of /Harris et al. 2002/ (deep blue line in Figure 2-15). However, the fit can be improved if the precipitation of CSH_081 to CSH_070 is not allowed (light blue line in Figure 2-15). Solid compositions richer in Si (Ca/Si<0.70) are allowed to form but, unlike using the Carey and Lichtner approach, they do not precipitate in the simulations.
0
20
40
60
80
100
0 10 20 30 40 50 60
Pore volumes
CSH
mol
·m-3
rock
CSH_285
CSH_138
CSH_100
CSH_072
CSH_051
Figure 2‑14. Evolution of the dissolution of initial CSH phase (CSH_285) in the cementitious material in node A using the /Carey and Lichtner 2007/ approach. The precipitation/dissolution of the newly-formed CSH phases in node A is also shown.
9
10
11
12
13
0.4 0.8 1.2 1.6 2 2.4 2.8
Ca/Si ratio
pH
/Harris et al. 2002/
/Sugiyama and Fujita 2006/
/Sugiyama and Fujita 2006/_mod
Figure 2‑15. Plot showing the calculated Ca/Si ratio and pH in nodes A, using the /Sugiyama and Fujita 2006/ approach in node A. In the model labelled “Sugiyama and Fujita (2006)_mod” the CSH phases with compositions from Ca/Si=0.81 to 0.70 has not allowed to form, and the fit with the experimental data of /Harris et al. 2002/ is better.

24 TR-10-25
On the other hand, the measured concentrations of Ca and Si are fairly well reproduced by the reactive transport calculations (Figure 2-16 and Figure 2-17). For calcium, the fit is better if the precipitation of calcite is allowed.
Figure 2-18 shows the progressive replacement of CSH phases in the node A. As in Figure 2-14, T refers to the number of pore volumes that has been entered in the cementitious material.
According to the model results shown previously, it can be stated that the solid solution model proposed by /Sugiyama and Fujita 2006/ reproduces reasonably well the available experimental results in the low pH range of interest for the present study.
0.4
0.8
1.2
1.6
2
2.4
2.8
0.000 0.005 0.010 0.015 0.020 0.025
Ca moles·L-1
Ca/
Si
/Harris et al. 2002/
/Sugiyama and Fujita 2006/
/Sugiyama and Fujita 2006/_mod
/Sugiyama and Fujita 2006/_Calcite
Figure 2‑17. Plot showing the calculated Ca-Si ratio and [Si]Total in node A, using the /Sugiyama and Fujita 2006/ approach. Light green curve is a simulation in which the precipitation of calcite is allowed. In the model labelled “Sugiyama and Fujita (2006)_mod” the CSH phases with compositions from Ca/Si=0.81 to 0.70 has not allowed to form. The experimental data of /Harris et al. 2002/ is drawn for comparison.
Figure 2‑16. Plot showing the calculated Ca-Si ratio and [Ca]Total in node A, using the /Sugiyama and Fujita 2006/ approach. Light green curve is a simulation in which the precipitation of calcite is allowed. In the model labelled “Sugiyama and Fujita (2006)_mod” the CSH phases with compositions from Ca/Si=0.81 to 0.70 has not allowed to form. The experimental data of /Harris et al. 2002/ is drawn for comparison.
0.4
0.8
1.2
1.6
2
2.4
2.8
1.0E-06 1.0E-05 1.0E-04 1.0E-03 1.0E-02 1.0E-01
Si mol·L-1
Ca/
Si
/Harris et al. 2002/
/Sugiyama and Fujita 2006/
/Sugiyama and Fujita 2006/_mod
/Sugiyama and Fujita 2006/_Calcite

TR-10-25 25
Figure 2‑18. Evolution through time of the dissolution of initial CSH phase (CSH_285) in the cementitious material in node A using the /Sugiyama and Fujita 2006/ approach. The precipitation/dissolution of the newly-formed CSH phases in node A is also shown.
0
10
20
30
40
50
60
70
80
90
100
0 5 10 15 20 25 30 35 40
CSH
mol
·m-3
rock
CSH_285
CSH_113
CSH_100
CSH_072
CSH_085
Porevolumes

TR-10-25 27
3 Model testing and evaluation: Block leaching tests
3.1 The NUMO‑CRIEPI experimentsOnce the solid solution approaches have been implemented in the reactive transport code RCB, the solid solution approach by /Sugiyama and Fujita 2006/ is used to model the leaching experiments of a grout material performed by NUMO-CRIEPI /Yamamoto et al. 2007/. In these experiments, a set of cements with organic additives has been leached using three compositionally different waters (deionised, fresh water and saline water). Four tests have been developed:
(1) Fresh leaching test: the leachant solution was directly poured over the grout in a vessel and then sealed and kept in N2 atmosphere. The maximum contact time was 56 days, and the water-cement volume ratio was fixed at 4.
(2) Powder leaching test: Once hardened, the grout material was grinded (grain size <100 µm), and then immersed in the leachant for 38 weeks. The leachant/powder ratios ranged from 10 to 1,000 cm3·g–1.
(3) Thin plate leaching test: Very thin plates (0.5×20 mm) of grout were immersed in the leachants during 30 weeks.
(4) Block leaching test: The hardened cement paste was cut into cubes of 8 cm3, In the cutting procedure, deionized water was used as the cooling agent for the blade. Cubic specimens were dried by aspirator for 24 hours after slicing. Then, the cubes were immersed in a vessel with two litres of leachant for up to 1 year (Figure 3-1).
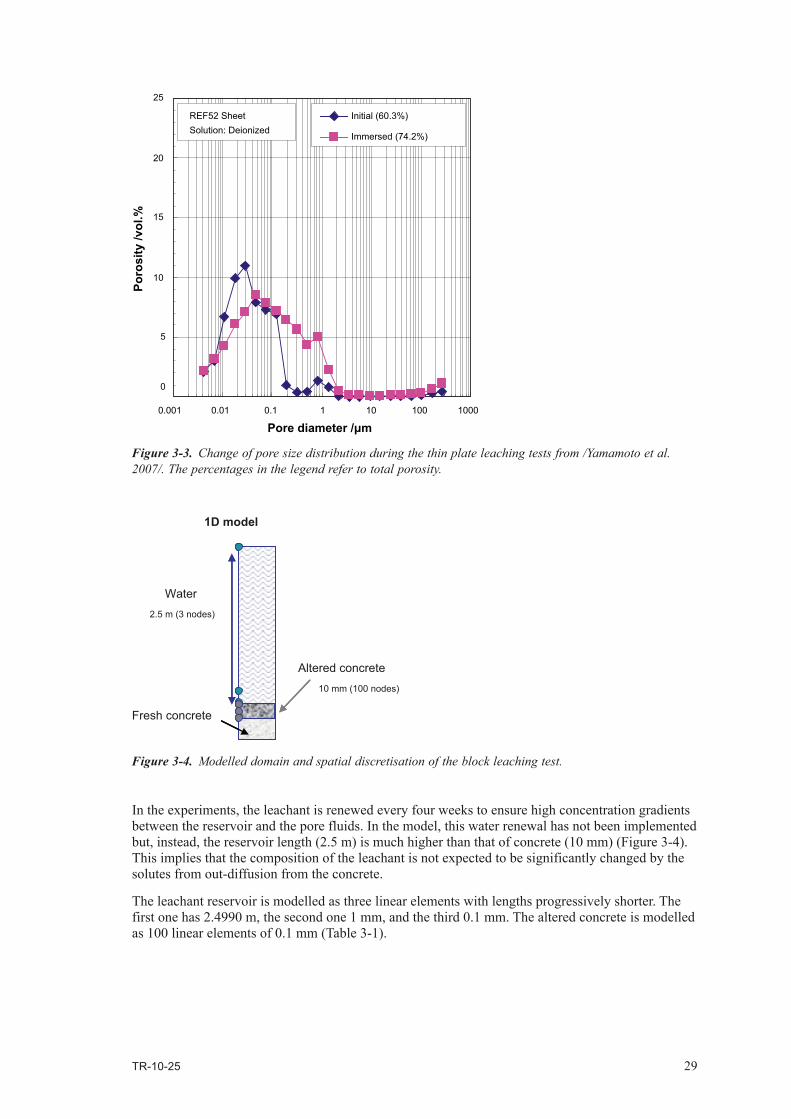
After the exposition to water leachants, the solid phases were analysed using a wide number of methods, including elemental concentration mapping (EPMA) and pore size distribution determina-tion (MIP). EPMA data from the block leaching tests provided interesting mapping of Ca-Si ratio after the leaching, denoting the degree of grout alteration (Figure 3-2). It is observed that only the test using the paste based on sulphate resistant Portland cement (93 wt%) and deionised water as a leachant shows significant changes in the Ca-Si ratios. The initial ratio is close to Ca/Si=2, and after one year leaching, the alteration front penetrates over 6 mm into the block, with minimum Ca/Si~1. Surprisingly, the cement block does not show any degradation when fresh water was used as leach-ant despite the very low ionic strength (2.8×10⁻³ mol·L–1). On the other hand, leaching experiments using a cement with high contents (40 wt%) of silica additives (silica fume) lead to a very narrow (<1 mm) alteration rim.
2 litres
deionised water
8 cm3
Figure 3‑1. Sketch showing the block leaching experiment.
28 TR-10-25
Changes in grout porosity have been determined in the thin plate leaching test (Figure 3-3). Initially, porosity in the Portland cement-based grout is quite high (60.3%) but is basically formed by very small pores (less than 0.2 µm). Only ~5% of the porosity are pores between 0.2 and 2 µm. Interestingly, after leaching with deionised water, a decrease of pores with small size is observed, whereas the number of pores with higher size increases. The net increase in porosity is about 14%. It is likely that this initial porosity consists of disconnected pores related to an incomplete hydration process. During the experiment frame time, part of the cement paste still hardens and some small pores are lost, possibly, due to CSH formation. In contrast, the largest pores are interconnected and their increase is associated with CSH replacement due the leaching process. The net porosity increase without considering the loss of small pores is ~19%.
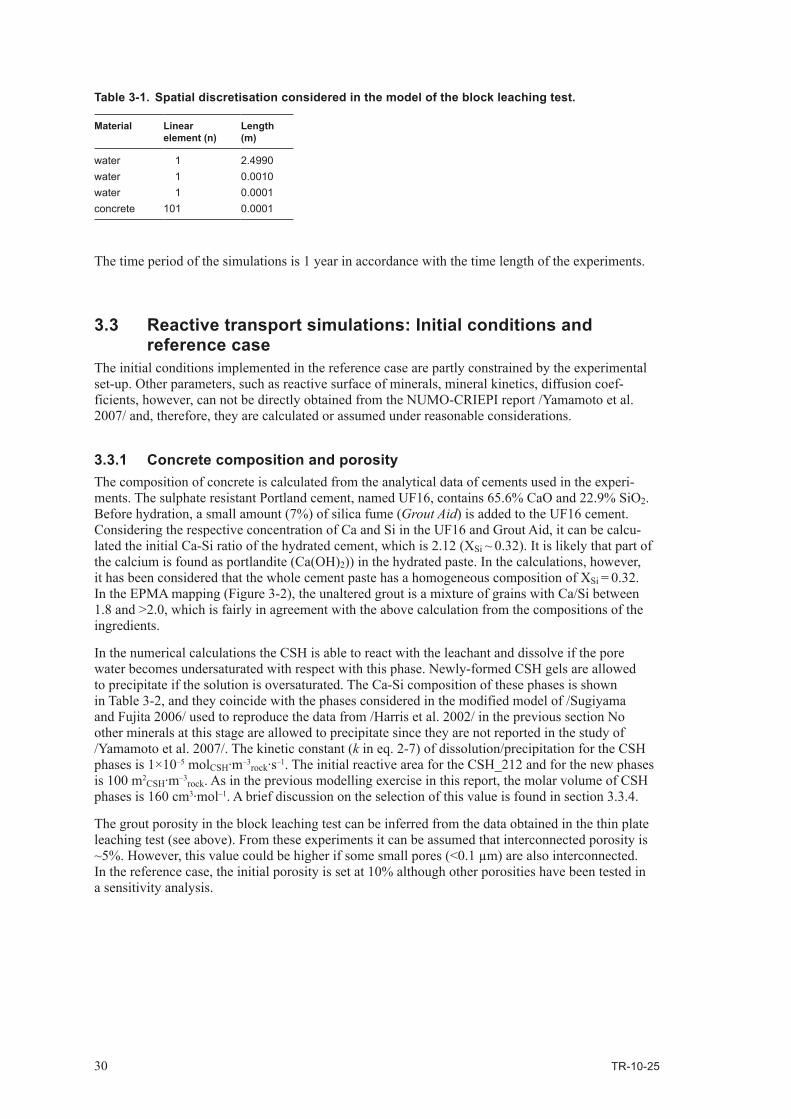
3.2 Modelled domain and simulation timeFor the numerical modelling, the block leaching test with major changes in the Ca/Si ratios has been selected. The experimental set-up (Figure 3-1) has been implemented as a one-dimension domain extending from the cube edge to the non-altered zone (Figure 3-4). The reasons for selecting 1D instead of 2D or 3D domains are:
(1) The alteration front is homogeneous along the cube face in contact with the leachant. (2) As observed in the results (Figure 3-2), the alteration front penetrates in the block at the same
rate in the whole section. (3) Finally, the alteration front is small enough that a section cut in the middle of the cube face is not
expected to be affected by the fronts generated in the other faces.
Figure 3‑2. EPMA mappings of the Ca/Si ratio of the cement block specimens leached for one year using three different leachants (modified from /Yamamoto et al. 2007/). The more advanced alteration front is observed when using deionised water on ordinary Portland cement. Fresh water and saline water are labelled as ALL-MR and OL-SR, respectively.
Low pH system (P308B)
Ca/SiOL-SRALL-MRDeionized
Low pH system (P308B)
Ca/SiOL-SRALL-MRDeionized
2.5mm
10.0
mm
Ordinary pH system (REF52)
Ca/SiOL-SRALL-MRDeionized
Ordinary pH system (REF52)
Ca/SiOL-SRALL-MRDeionized
2.5mm
10.0
mm
ecafrusecafrusecafrusecafrusecafrusecafrus1.50
0.50
0.64
1.36
1.21
1.071.00
0.79
1.43
1.28
1.14
0.930.86
0.71
0.57
1.50
0.50
0.64
1.36
1.21
1.071.00
0.79
1.43
1.28
1.14
0.930.86
0.71
0.57
2.00
0.50
0.71
1.78
1.57
1.361.25
0.93
1.89
1.68
1.46
1.141.03
0.82
0.61
2.00
0.50
0.71
1.78
1.57
1.361.25
0.93
1.89
1.68
1.46
1.141.03
0.82
0.61
Abo
ut 6
.0m
m
Low pH system (P308B)
Ca/SiOL-SRALL-MRDeionized
Low pH system (P308B)
Ca/SiOL-SRALL-MRDeionized
2.5mm
10.0
mm
Ordinary pH system (REF52)
Ca/SiOL-SRALL-MRDeionized
Ordinary pH system (REF52)
Ca/SiOL-SRALL-MRDeionized
2.5mm
10.0
mm
ecafrusecafrusecafrusecafrusecafrusecafrus1.50
0.50
0.64
1.36
1.21
1.071.00
0.79
1.43
1.28
1.14
0.930.86
0.71
0.57
1.50
0.50
0.64
1.36
1.21
1.071.00
0.79
1.43
1.28
1.14
0.930.86
0.71
0.57
2.00
0.50
0.71
1.78
1.57
1.361.25
0.93
1.89
1.68
1.46
1.141.03
0.82
0.61
2.00
0.50
0.71
1.78
1.57
1.361.25
0.93
1.89
1.68
1.46
1.141.03
0.82
0.61
Abo
ut 6
.0m
m
TR-10-25 29
In the experiments, the leachant is renewed every four weeks to ensure high concentration gradients between the reservoir and the pore fluids. In the model, this water renewal has not been implemented but, instead, the reservoir length (2.5 m) is much higher than that of concrete (10 mm) (Figure 3-4). This implies that the composition of the leachant is not expected to be significantly changed by the solutes from out-diffusion from the concrete.
The leachant reservoir is modelled as three linear elements with lengths progressively shorter. The first one has 2.4990 m, the second one 1 mm, and the third 0.1 mm. The altered concrete is modelled as 100 linear elements of 0.1 mm (Table 3-1).
Figure 3‑3. Change of pore size distribution during the thin plate leaching tests from /Yamamoto et al. 2007/. The percentages in the legend refer to total porosity.
0
5
10
15
20
25
0.001 0.01 0.1 1 10 100 1000
Pore diameter /μm
Poro
sity
/vol
.%
Initial (60.3%)
Immersed (74.2%)
REF52 SheetSolution: Deionized
Figure 3‑4. Modelled domain and spatial discretisation of the block leaching test.
Altered concrete
2.5 m (3 nodes)
10 mm (100 nodes)
Water
1D model
Fresh concrete
30 TR-10-25
Table 3‑1. Spatial discretisation considered in the model of the block leaching test.
Material Linear element (n)
Length (m)
water 1 2.4990water 1 0.0010water 1 0.0001concrete 101 0.0001
The time period of the simulations is 1 year in accordance with the time length of the experiments.
3.3 Reactive transport simulations: Initial conditions and reference case
The initial conditions implemented in the reference case are partly constrained by the experimental set-up. Other parameters, such as reactive surface of minerals, mineral kinetics, diffusion coef-ficients, however, can not be directly obtained from the NUMO-CRIEPI report /Yamamoto et al. 2007/ and, therefore, they are calculated or assumed under reasonable considerations.
3.3.1 Concrete composition and porosityThe composition of concrete is calculated from the analytical data of cements used in the experi-ments. The sulphate resistant Portland cement, named UF16, contains 65.6% CaO and 22.9% SiO2. Before hydration, a small amount (7%) of silica fume (Grout Aid) is added to the UF16 cement. Considering the respective concentration of Ca and Si in the UF16 and Grout Aid, it can be calcu-lated the initial Ca-Si ratio of the hydrated cement, which is 2.12 (XSi ~ 0.32). It is likely that part of the calcium is found as portlandite (Ca(OH)2)) in the hydrated paste. In the calculations, however, it has been considered that the whole cement paste has a homogeneous composition of XSi = 0.32. In the EPMA mapping (Figure 3-2), the unaltered grout is a mixture of grains with Ca/Si between 1.8 and >2.0, which is fairly in agreement with the above calculation from the compositions of the ingredients.
In the numerical calculations the CSH is able to react with the leachant and dissolve if the pore water becomes undersaturated with respect with this phase. Newly-formed CSH gels are allowed to precipitate if the solution is oversaturated. The Ca-Si composition of these phases is shown in Table 3-2, and they coincide with the phases considered in the modified model of /Sugiyama and Fujita 2006/ used to reproduce the data from /Harris et al. 2002/ in the previous section No other minerals at this stage are allowed to precipitate since they are not reported in the study of /Yamamoto et al. 2007/. The kinetic constant (k in eq. 2-7) of dissolution/precipitation for the CSH phases is 1×10⁻⁵ molCSH·m–3
rock·s–1. The initial reactive area for the CSH_212 and for the new phases is 100 m2
CSH·m–3rock. As in the previous modelling exercise in this report, the molar volume of CSH
phases is 160 cm3·mol–1. A brief discussion on the selection of this value is found in section 3.3.4.
The grout porosity in the block leaching test can be inferred from the data obtained in the thin plate leaching test (see above). From these experiments it can be assumed that interconnected porosity is ~5%. However, this value could be higher if some small pores (<0.1 µm) are also interconnected. In the reference case, the initial porosity is set at 10% although other porosities have been tested in a sensitivity analysis.
TR-10-25 31
3.3.2 Leachant and pore water compositionThe deionised water has been selected as leachant since it causes major changes in the cement composition according to the experimental data. In the models, the only reactive mineral is the CSH, and consequently, the relevant concentration data is that of Si, Ca and pH. Their concentration will mainly drive the alteration of the cement via ion diffusion. The composition of these components in the deionised water in the experiments is not reported in /Yamamoto et al. 2007/. In the model set-up, it has been considered 1×10⁻⁶ mol·L–1 as an initial value, which is typical of laboratory deionised water. For the initial pH of the leachant, a neutral value (pH=7) has been selected. Other elements considered in the models are Na, K, Mg, Al, sulphate, Cl and C(IV). Consideration of aqueous concentration and speciation for these elements is necessary to take into account ionic strength effects. The total ionic strength of the deionised water is 2.2×10⁻⁵ mol·L–1, assuming chloride and sodium to be the most concentrated ions.
The composition of the initial pore water was not analysed by /Yamamoto et al. 2007/. In the model, it has reasonably been assumed that the pore water is in equilibrium with a CSH gel of Ca/Si=2.2. The resulting Ca and Si concentrations are 2.2×10⁻³ mol·L–1 and 4.7×10⁻⁴ mol·L–1, respectively. The ionic strength of the solution is 0.53 mol·L–1, with major contribution of Na and K. The pH value is 12.49.
In all cases, the temperature of both waters is prescribed at 25°C.
Table 3‑2. Composition of the calcium‑silicate phases considered in the simulations of the NUMO‑CRIEPI experiments.
CSH XSi Ca/Si
CSH_212 0.32 2.12CSH_194 0.34 1.94CSH_178 0.36 1.78CSH_163 0.38 1.63CSH_150 0.40 1.50CSH_144 0.41 1.44CSH_138 0.42 1.38CSH_133 0.43 1.33CSH_127 0.44 1.27CSH_122 0.45 1.22CSH_117 0.46 1.17CSH_113 0.47 1.13CSH_108 0.48 1.08CSH_104 0.49 1.04CSH_100 0.50 1.00CSH_096 0.51 0.96CSH_092 0.52 0.92CSH_089 0.53 0.89CSH_085 0.54 0.85CSH_079 0.56 0.79CSH_075 0.57 0.75CSH_072 0.58 0.72CSH_069 0.59 0.69CSH_067 0.60 0.67

32 TR-10-25
3.3.3 Ion transportThe advective transport of solutes in the modelled experiment is completely negligible since water is not mobile. Instead, the sharp concentration gradients between leachant and concrete pore water make molecular diffusion to be the main solute transport. The selection of a molecular diffusion coefficient has been done after a literature review. Experimental and calculated effective diffusion coefficients (De) in cementitious media commonly ranges from 10–10 and 10–12 m2·s–1 /Friedman et al. 2004, Moranville et al. 2004, Planel et al. 2006, among others/. In the reference case of the present study, it has been selected a value of De = 5×10–11 m2·s–1 (for a porosity of 0.1). This parameter has a strong influence on the alteration rate of the cement and, therefore, a sensitivity analysis concerning this parameter has been carried out (see below).
The diffusion coefficient is a function of porosity following the /Simunek and Suares 1994/ relation-ship (eq. 3-1 and 3-2):
αα τ·,0DDe = (eq. 3-1)
2
37
)(φ
φτ S= (eq. 3-2)
where τ is the tortuosity.
3.3.4 Molar volumes of newly formed CSH phasesOne of the major uncertainties when modelling cement alteration is the change in the molar volumes of the newly formed CSH phases. This change may have great importance in the porosity variations. In general, there is some rough, negative correlation between the molar volume of the crystalline CSH (e.g. tobermorite) with Ca/Si ratio (Table 3-3 and Figure 3-5). However, there is no evidence that gel-like CSH phases follow the same trend. On the other hand, the increase of molar volume as the alteration proceeds does not necessarily mean that porosity clogging is going to occur. If it is considered that CSH replacement is essentially a Ca-loss from the gel, and then the molar volumes are normalised to 1 mol of Si, the net volume of the gels decreases with the Ca/Si ratio (Figure 3-6).
At this stage, an intermediate value between the crystalline CSH with Ca/Si=2 and the CSH with Ca/Si=0.83 has been considered for all CSH phases (160 cm3·mol–1).
Table 3‑3. Molar volume of some crystalline CSH phases, which increases as the Ca/Si decreases. Normalised molar volumes respect to 1 mol of Si are also shown.
Mineral Formula Ca/Si ratio
Molar volume (cm3·mol–1)
Molar volume (normal vs. Si)
Ref.
Reinhardbraunsite Ca5(SiO4)2(OH,F)2 2.50 145.79 72.89 (1)Dellaite Ca6Si3O11(OH)2 2.00 181.46 60.48 (1)Bultfonteinite Ca2SiO2(OH,F)4 2.00 76.63 76.63 (1)Hillebrandite Ca2SiO3(OH)2·0.17(H2O) 2.00 71.79 71.79 (2)Afwillite Ca3Si2O4(OH)6 1.50 130.71 65.35 (3)Jennite Ca9Si6O18(OH)6·8H2O 1.50 458.35 76.39 (3)Foshagite Ca4Si3O9(OH)2·0.5(H2O) 1.33 124.23 41.41 (2)Xonotlite Ca6Si6O17(OH)2 1.00 264.81 44.14 (2)Tobermorite Ca5Si6O16(OH)2·4(H2O) 0.83 300.81 50.13 (3)Gyrolite Ca2Si3O7(OH)2·1.5(H2O) 0.83 136.85 45.62 (4)Okenite CaSi2O4(OH)2·(H2O) 0.50 94.77 47.38 (2)
(1) /Mincryst database 2009/, (2) /Jennings 1986/, (3) /Bourbon 2003/, (4) /Clodic and Meike 1997/

TR-10-25 33
0
50
100
150
200
250
300
350
400
450
500
0.0 0.5 1.0 1.5 2.0 2.5 3.0
Ca/Si mol
Mol
ar v
olum
e (c
m3 ·m
ol-1)
Figure 3‑5. Molar volumes of crystalline CSH phases as a function of their Ca-Si ratio (see Table 3-3 for references).
Figure 3‑6. Molar volumes of crystalline CSH phases – normalised to 1 mol of Si – as a function of their Ca-Si ratio (see Table 3-3 for references). For comparison, SiO2 (am) has a molar volume of 29 cm3·mol–1.
30
35
40
45
50
55
60
65
70
75
80
0.0 0.5 1.0 1.5 2.0 2.5 3.0
Ca/Si mol
Nor
mal
ised
vol
ume
to S
i (cm
3 ·mol
-1)
34 TR-10-25
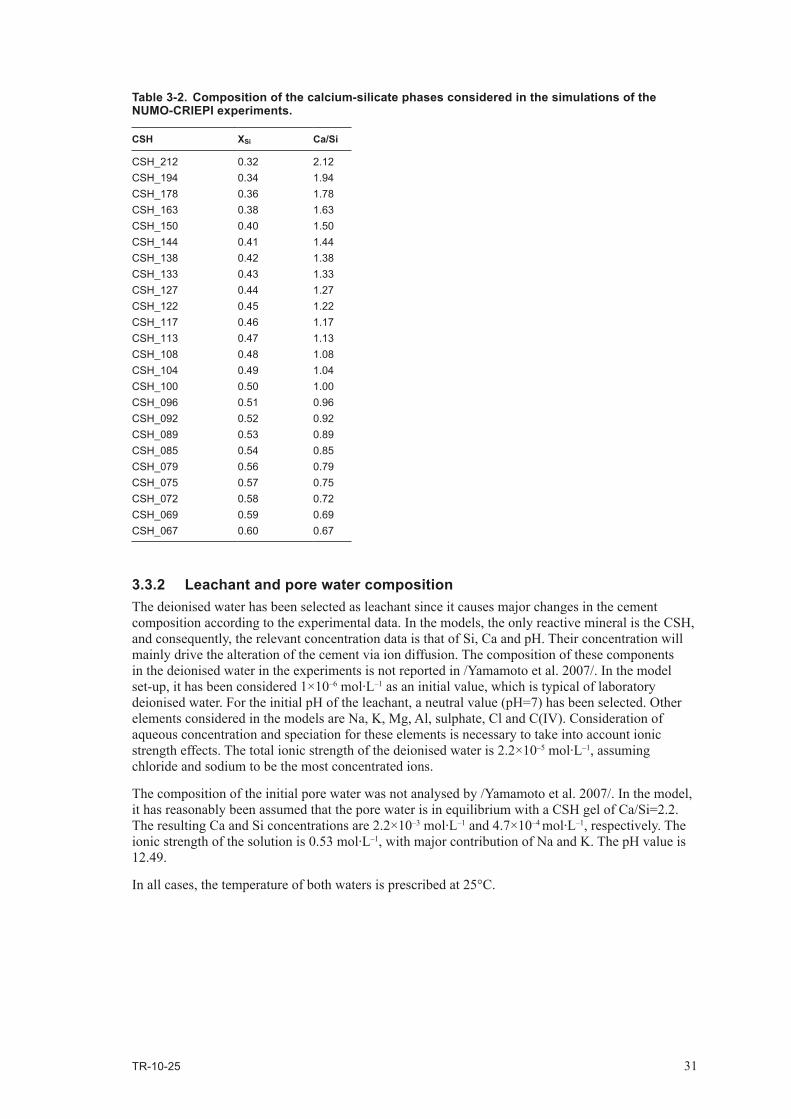
3.4 Results3.4.1 Reference caseThe results of the numerical calculations predict that cement would be altered by the contact with deionised water. The out-diffusion of Ca, Si and OH– from cement pores to the water reservoir causes sharp changes in the chemistry of the pore water leading to subsaturation and dissolution of initial CSH phases and subsequent precipitation of Si-enriched CSH solids. The model yields similar alteration pattern as observed in the experiments, i.e. a highly degraded rim with much lower Ca/Si than initial and increased porosity. This rim reaches depths ~6 mm and does not progress further. The evolution of the Ca/Si through time in the first 6 mm of the concrete sample is shown in Figure 3-7. The calculated lowest Ca/Si ratios are close to 1 at the cement leachant interface and increases to the original composition around 2 inside the cement block.
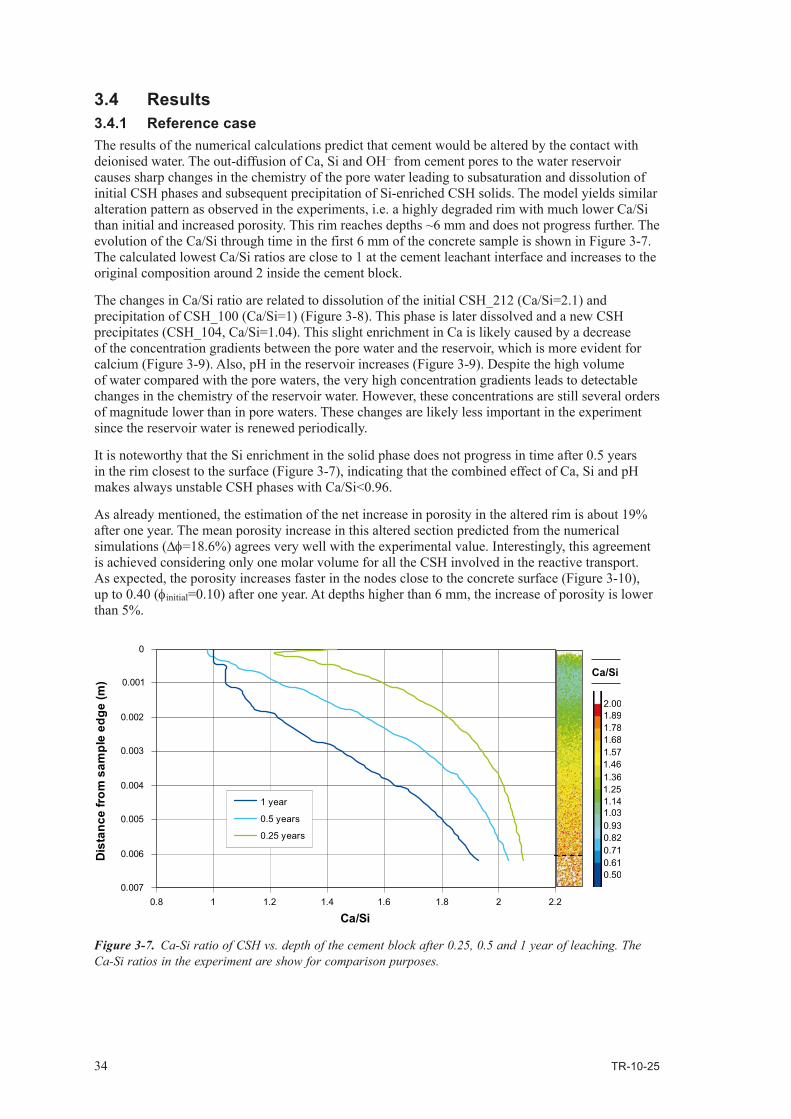
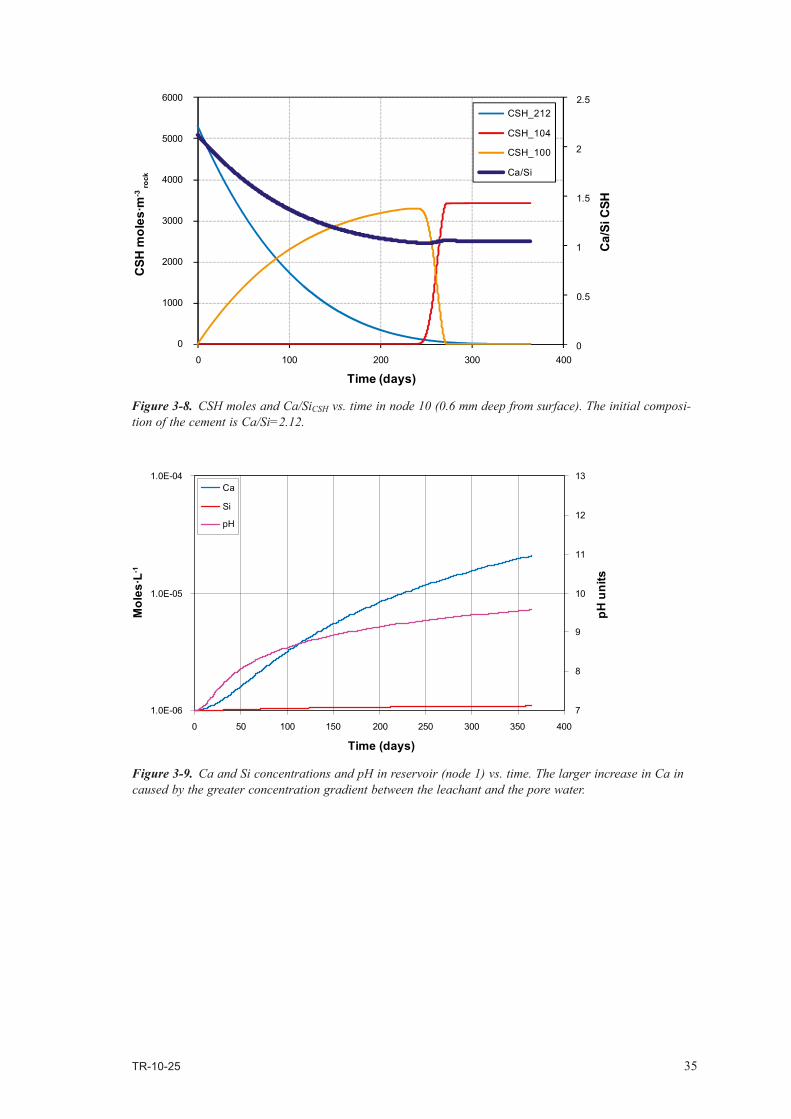
The changes in Ca/Si ratio are related to dissolution of the initial CSH_212 (Ca/Si=2.1) and precipitation of CSH_100 (Ca/Si=1) (Figure 3-8). This phase is later dissolved and a new CSH precipitates (CSH_104, Ca/Si=1.04). This slight enrichment in Ca is likely caused by a decrease of the concentration gradients between the pore water and the reservoir, which is more evident for calcium (Figure 3-9). Also, pH in the reservoir increases (Figure 3-9). Despite the high volume of water compared with the pore waters, the very high concentration gradients leads to detectable changes in the chemistry of the reservoir water. However, these concentrations are still several orders of magnitude lower than in pore waters. These changes are likely less important in the experiment since the reservoir water is renewed periodically.
It is noteworthy that the Si enrichment in the solid phase does not progress in time after 0.5 years in the rim closest to the surface (Figure 3-7), indicating that the combined effect of Ca, Si and pH makes always unstable CSH phases with Ca/Si<0.96.
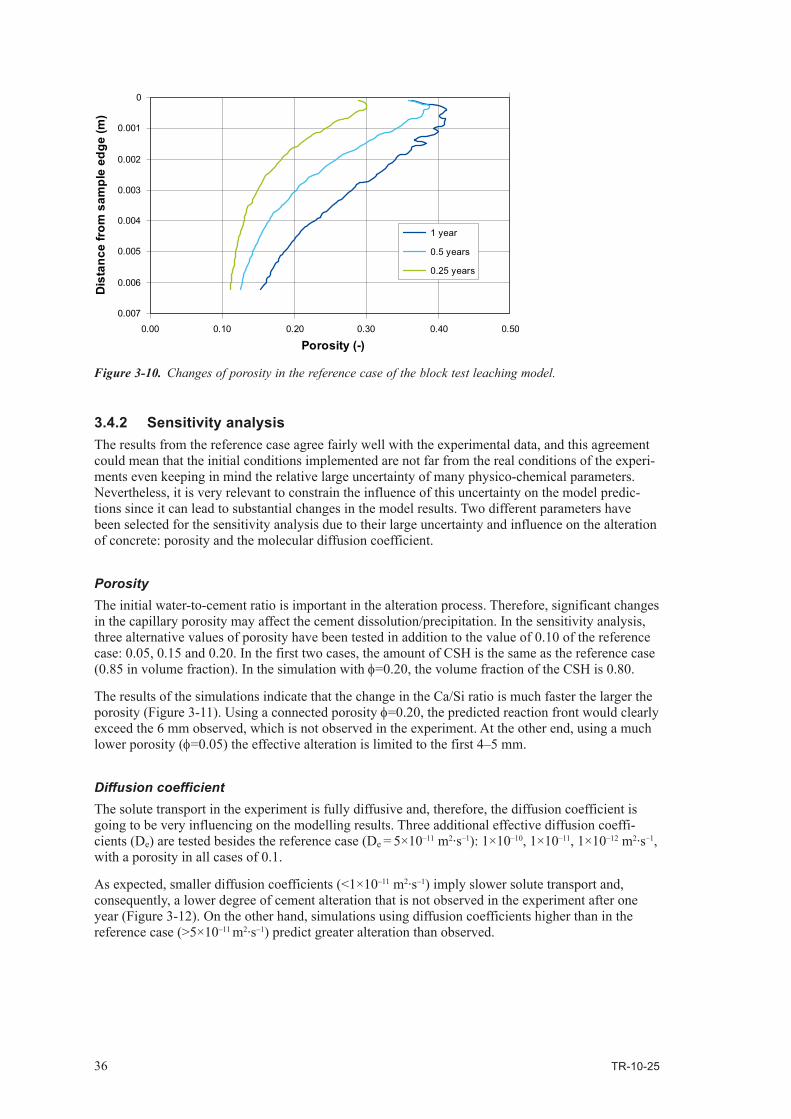
As already mentioned, the estimation of the net increase in porosity in the altered rim is about 19% after one year. The mean porosity increase in this altered section predicted from the numerical simulations (∆φ=18.6%) agrees very well with the experimental value. Interestingly, this agreement is achieved considering only one molar volume for all the CSH involved in the reactive transport. As expected, the porosity increases faster in the nodes close to the concrete surface (Figure 3-10), up to 0.40 (φinitial=0.10) after one year. At depths higher than 6 mm, the increase of porosity is lower than 5%.
Figure 3‑7. Ca-Si ratio of CSH vs. depth of the cement block after 0.25, 0.5 and 1 year of leaching. The Ca-Si ratios in the experiment are show for comparison purposes.
0
0.001
0.002
0.003
0.004
0.005
0.006
0.0070.8 1 1.2 1.4 1.6 1.8 2 2.2
1 year
0.5 years
0.25 years
Ca/Si
2.00
0.50
0.71
1.78
1.57
1.361.25
0.93
1.89
1.68
1.46
1.141.03
0.82
0.61
Ca/Si
Dis
tanc
e fr
om s
ampl
e ed
ge (m
)
TR-10-25 35
Figure 3‑8. CSH moles and Ca/SiCSH vs. time in node 10 (0.6 mm deep from surface). The initial composi-tion of the cement is Ca/Si=2.12.
Figure 3‑9. Ca and Si concentrations and pH in reservoir (node 1) vs. time. The larger increase in Ca in caused by the greater concentration gradient between the leachant and the pore water.
0
0.5
1
1.5
2
2.5
0
1000
2000
3000
4000
5000
6000
0 100 200 300 400
Ca/
Si C
SH
Time (days)
CSH_212
CSH_104
CSH_100
Ca/Si
CSH
mol
es·m
-3 ro
ck
1.0E-06
1.0E-05
1.0E-04
0 50 100 150 200 250 300 350 400
Time (days)
7
8
9
10
11
12
13
pH u
nits
Ca
Si
pH
Mol
es·L
-1
36 TR-10-25
3.4.2 Sensitivity analysisThe results from the reference case agree fairly well with the experimental data, and this agreement could mean that the initial conditions implemented are not far from the real conditions of the experi-ments even keeping in mind the relative large uncertainty of many physico-chemical parameters. Nevertheless, it is very relevant to constrain the influence of this uncertainty on the model predic-tions since it can lead to substantial changes in the model results. Two different parameters have been selected for the sensitivity analysis due to their large uncertainty and influence on the alteration of concrete: porosity and the molecular diffusion coefficient.
Porosity The initial water-to-cement ratio is important in the alteration process. Therefore, significant changes in the capillary porosity may affect the cement dissolution/precipitation. In the sensitivity analysis, three alternative values of porosity have been tested in addition to the value of 0.10 of the reference case: 0.05, 0.15 and 0.20. In the first two cases, the amount of CSH is the same as the reference case (0.85 in volume fraction). In the simulation with φ=0.20, the volume fraction of the CSH is 0.80.
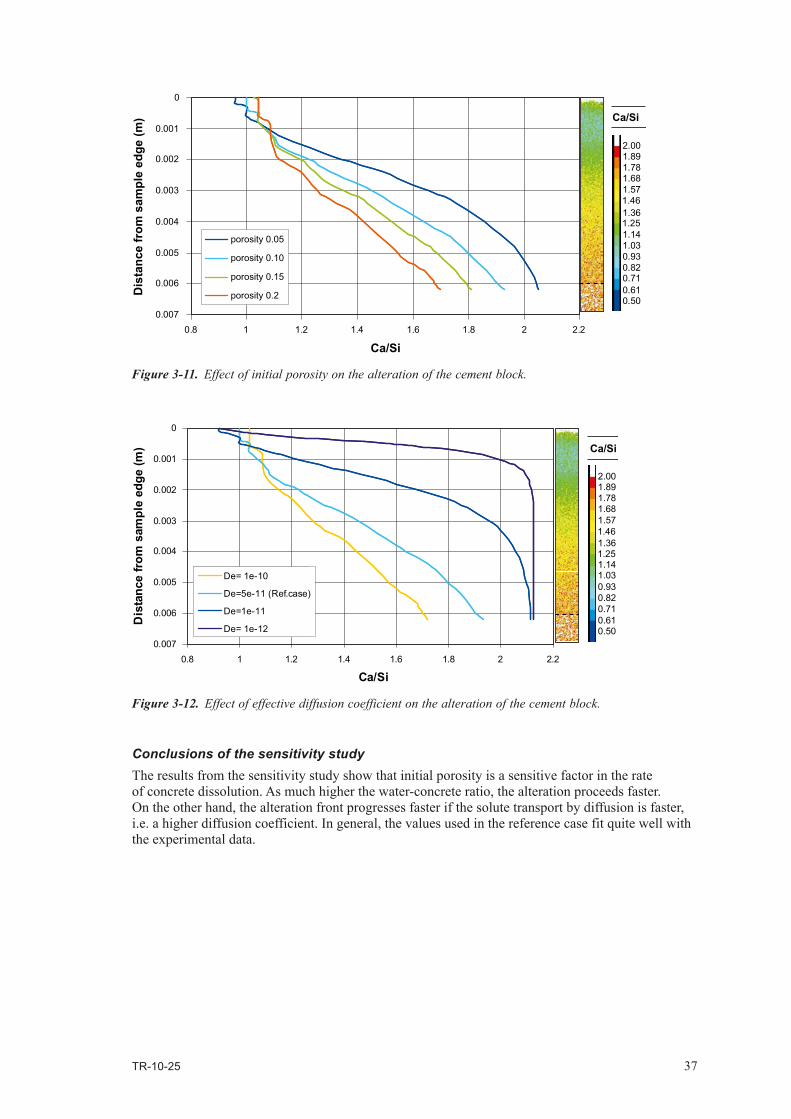
The results of the simulations indicate that the change in the Ca/Si ratio is much faster the larger the porosity (Figure 3-11). Using a connected porosity φ=0.20, the predicted reaction front would clearly exceed the 6 mm observed, which is not observed in the experiment. At the other end, using a much lower porosity (φ=0.05) the effective alteration is limited to the first 4–5 mm.
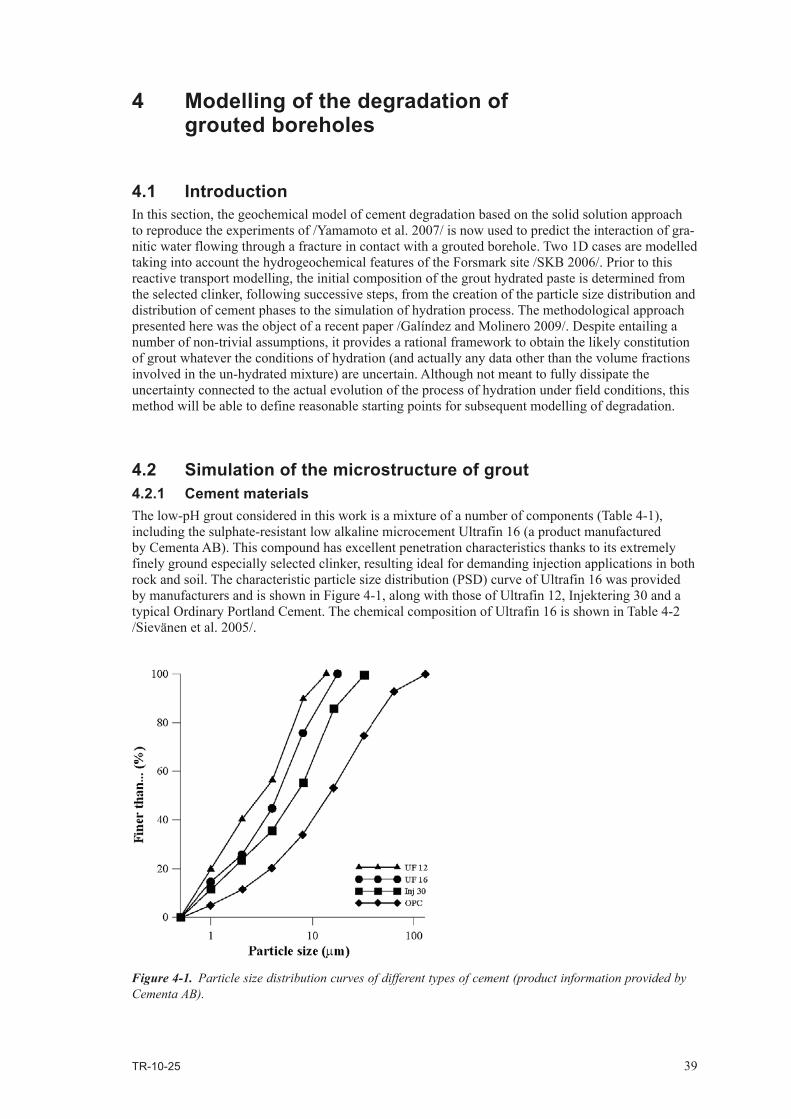
Diffusion coefficientThe solute transport in the experiment is fully diffusive and, therefore, the diffusion coefficient is going to be very influencing on the modelling results. Three additional effective diffusion coeffi-cients (De) are tested besides the reference case (De = 5×10–11 m2·s–1): 1×10⁻¹⁰, 1×10–11, 1×10–12 m2·s–1, with a porosity in all cases of 0.1.
As expected, smaller diffusion coefficients (<1×10–11 m2·s–1) imply slower solute transport and, consequently, a lower degree of cement alteration that is not observed in the experiment after one year (Figure 3-12). On the other hand, simulations using diffusion coefficients higher than in the reference case (>5×10–11 m2·s–1) predict greater alteration than observed.
Figure 3‑10. Changes of porosity in the reference case of the block test leaching model.
0
0.001
0.002
0.003
0.004
0.005
0.006
0.007
0.00 0.10 0.20 0.30 0.40 0.50
Porosity (-)
Dis
tanc
e fr
om s
ampl
e ed
ge (m
)
1 year
0.5 years
0.25 years
TR-10-25 37
Conclusions of the sensitivity studyThe results from the sensitivity study show that initial porosity is a sensitive factor in the rate of concrete dissolution. As much higher the water-concrete ratio, the alteration proceeds faster. On the other hand, the alteration front progresses faster if the solute transport by diffusion is faster, i.e. a higher diffusion coefficient. In general, the values used in the reference case fit quite well with the experimental data.
Figure 3‑11. Effect of initial porosity on the alteration of the cement block.
Figure 3‑12. Effect of effective diffusion coefficient on the alteration of the cement block.
0
0.001
0.002
0.003
0.004
0.005
0.006
0.0070.8 1 1.2 1.4 1.6 1.8 2 2.2
2.00
0.50
0.71
1.78
1.57
1.361.25
0.93
1.89
1.68
1.46
1.141.03
0.82
0.61
Ca/Si
Dis
tanc
e fr
om s
ampl
e ed
ge (m
)
porosity 0.05
porosity 0.10
porosity 0.15
porosity 0.2
Ca/Si
0
0.001
0.002
0.003
0.004
0.005
0.006
0.0070.8 1 1.2 1.4 1.6 1.8 2 2.2
Ca/Si
Dis
tanc
e fro
m s
ampl
e ed
ge (m
)
De= 1e-10
De=5e-11 (Ref.case)
De=1e-11
De= 1e-12
Ca/Si
2.00
0.50
0.71
1.78
1.57
1.361.25
0.93
1.89
1.68
1.46
1.141.03
0.82
0.61
De= 1e-10
De=5e-11 (Ref.case)
De=1e-11
De= 1e-12
TR-10-25 39
4 Modelling of the degradation of grouted boreholes
4.1 IntroductionIn this section, the geochemical model of cement degradation based on the solid solution approach to reproduce the experiments of /Yamamoto et al. 2007/ is now used to predict the interaction of gra-nitic water flowing through a fracture in contact with a grouted borehole. Two 1D cases are modelled taking into account the hydrogeochemical features of the Forsmark site /SKB 2006/. Prior to this reactive transport modelling, the initial composition of the grout hydrated paste is determined from the selected clinker, following successive steps, from the creation of the particle size distribution and distribution of cement phases to the simulation of hydration process. The methodological approach presented here was the object of a recent paper /Galíndez and Molinero 2009/. Despite entailing a number of non-trivial assumptions, it provides a rational framework to obtain the likely constitution of grout whatever the conditions of hydration (and actually any data other than the volume fractions involved in the un-hydrated mixture) are uncertain. Although not meant to fully dissipate the uncertainty connected to the actual evolution of the process of hydration under field conditions, this method will be able to define reasonable starting points for subsequent modelling of degradation.
4.2 Simulation of the microstructure of grout4.2.1 Cement materialsThe low-pH grout considered in this work is a mixture of a number of components (Table 4-1), including the sulphate-resistant low alkaline microcement Ultrafin 16 (a product manufactured by Cementa AB). This compound has excellent penetration characteristics thanks to its extremely finely ground especially selected clinker, resulting ideal for demanding injection applications in both rock and soil. The characteristic particle size distribution (PSD) curve of Ultrafin 16 was provided by manufacturers and is shown in Figure 4-1, along with those of Ultrafin 12, Injektering 30 and a typical Ordinary Portland Cement. The chemical composition of Ultrafin 16 is shown in Table 4-2 /Sievänen et al. 2005/.
Figure 4‑1. Particle size distribution curves of different types of cement (product information provided by Cementa AB).
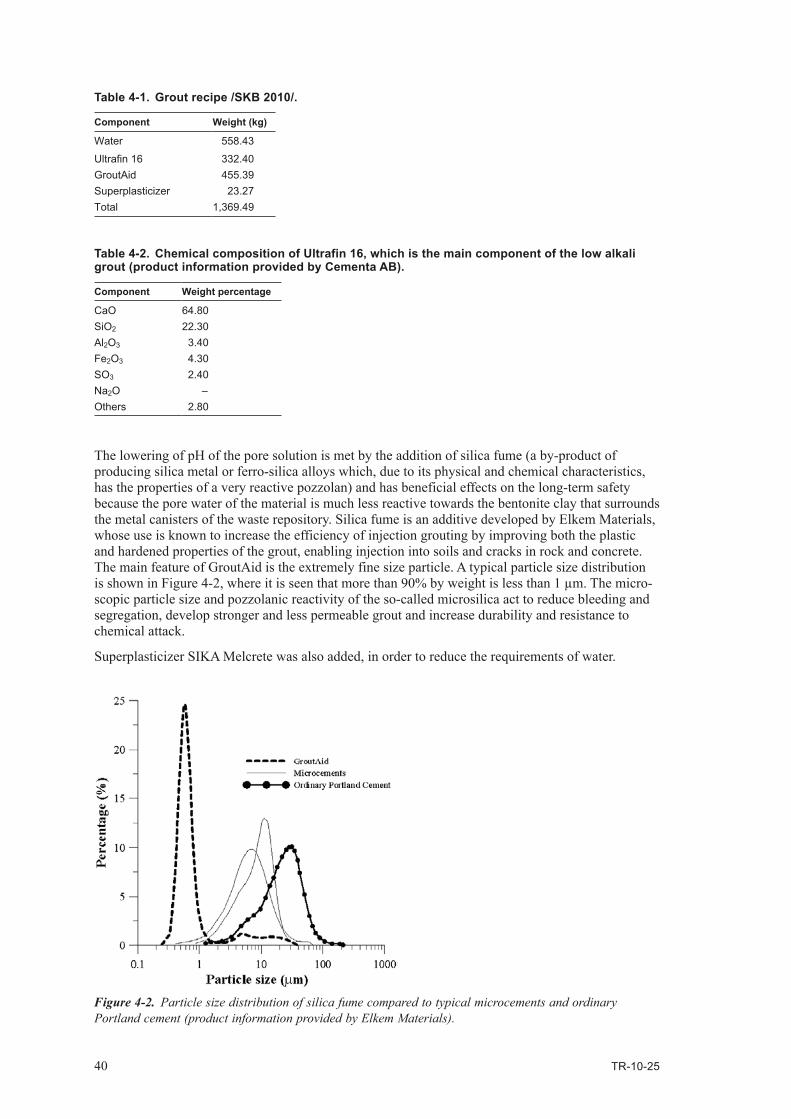
40 TR-10-25
Table 4‑1. Grout recipe /SKB 2010/.
Component Weight (kg)
Water 558.43
Ultrafin 16 332.40GroutAid 455.39Superplasticizer 23.27Total 1,369.49
Table 4‑2. Chemical composition of Ultrafin 16, which is the main component of the low alkali grout (product information provided by Cementa AB).
Component Weight percentage
CaO 64.80SiO2 22.30Al2O3 3.40Fe2O3 4.30SO3 2.40Na2O –Others 2.80
The lowering of pH of the pore solution is met by the addition of silica fume (a by-product of producing silica metal or ferro-silica alloys which, due to its physical and chemical characteristics, has the properties of a very reactive pozzolan) and has beneficial effects on the long-term safety because the pore water of the material is much less reactive towards the bentonite clay that surrounds the metal canisters of the waste repository. Silica fume is an additive developed by Elkem Materials, whose use is known to increase the efficiency of injection grouting by improving both the plastic and hardened properties of the grout, enabling injection into soils and cracks in rock and concrete. The main feature of GroutAid is the extremely fine size particle. A typical particle size distribution is shown in Figure 4-2, where it is seen that more than 90% by weight is less than 1 µm. The micro-scopic particle size and pozzolanic reactivity of the so-called microsilica act to reduce bleeding and segregation, develop stronger and less permeable grout and increase durability and resistance to chemical attack.
Superplasticizer SIKA Melcrete was also added, in order to reduce the requirements of water.
Figure 4‑2. Particle size distribution of silica fume compared to typical microcements and ordinary Portland cement (product information provided by Elkem Materials).
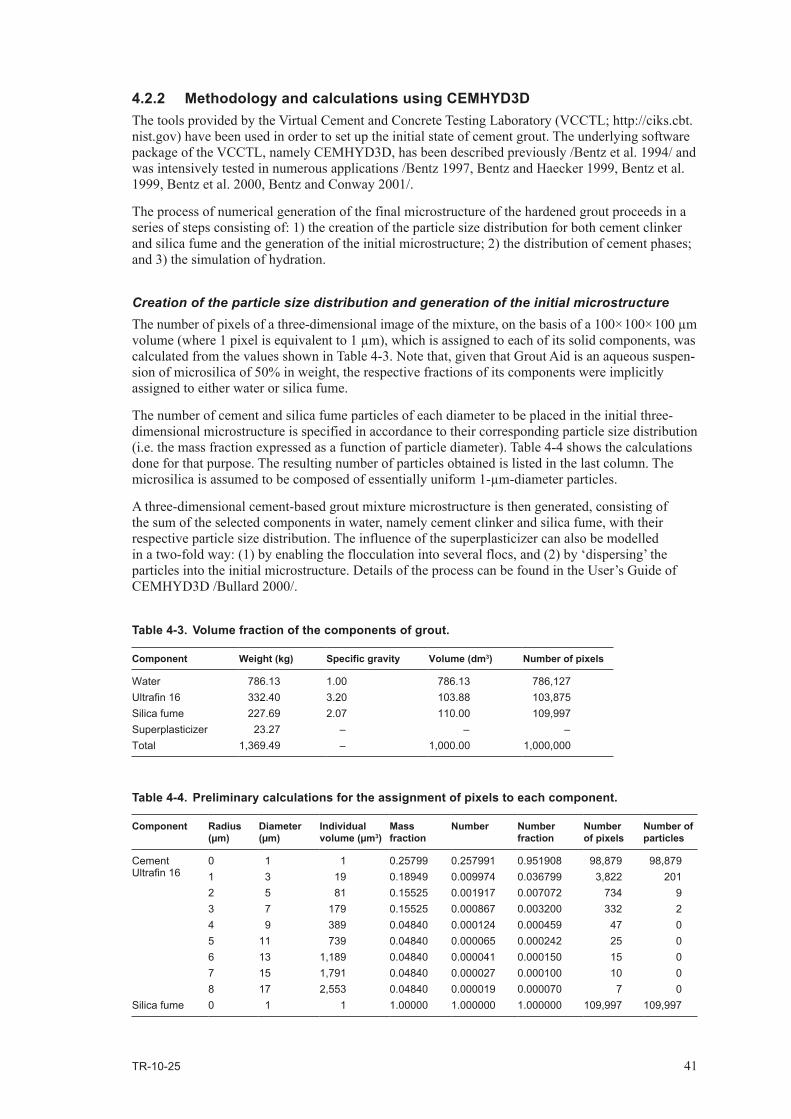
TR-10-25 41
4.2.2 Methodology and calculations using CEMHYD3DThe tools provided by the Virtual Cement and Concrete Testing Laboratory (VCCTL; http://ciks.cbt.nist.gov) have been used in order to set up the initial state of cement grout. The underlying software package of the VCCTL, namely CEMHYD3D, has been described previously /Bentz et al. 1994/ and was intensively tested in numerous applications /Bentz 1997, Bentz and Haecker 1999, Bentz et al. 1999, Bentz et al. 2000, Bentz and Conway 2001/.
The process of numerical generation of the final microstructure of the hardened grout proceeds in a series of steps consisting of: 1) the creation of the particle size distribution for both cement clinker and silica fume and the generation of the initial microstructure; 2) the distribution of cement phases; and 3) the simulation of hydration.
Creation of the particle size distribution and generation of the initial microstructureThe number of pixels of a three-dimensional image of the mixture, on the basis of a 100×100×100 µm volume (where 1 pixel is equivalent to 1 µm), which is assigned to each of its solid components, was calculated from the values shown in Table 4-3. Note that, given that Grout Aid is an aqueous suspen-sion of microsilica of 50% in weight, the respective fractions of its components were implicitly assigned to either water or silica fume.
The number of cement and silica fume particles of each diameter to be placed in the initial three-dimensional microstructure is specified in accordance to their corresponding particle size distribution (i.e. the mass fraction expressed as a function of particle diameter). Table 4-4 shows the calculations done for that purpose. The resulting number of particles obtained is listed in the last column. The microsilica is assumed to be composed of essentially uniform 1-µm-diameter particles.
A three-dimensional cement-based grout mixture microstructure is then generated, consisting of the sum of the selected components in water, namely cement clinker and silica fume, with their respective particle size distribution. The influence of the superplasticizer can also be modelled in a two-fold way: (1) by enabling the flocculation into several flocs, and (2) by ‘dispersing’ the particles into the initial microstructure. Details of the process can be found in the User’s Guide of CEMHYD3D /Bullard 2000/.
Table 4‑3. Volume fraction of the components of grout.
Component Weight (kg) Specific gravity Volume (dm3) Number of pixels
Water 786.13 1.00 786.13 786,127Ultrafin 16 332.40 3.20 103.88 103,875Silica fume 227.69 2.07 110.00 109,997Superplasticizer 23.27 – – –Total 1,369.49 – 1,000.00 1,000,000
Table 4‑4. Preliminary calculations for the assignment of pixels to each component.
Component Radius (µm)
Diameter (µm)
Individual volume (µm3)
Mass fraction
Number Number fraction
Number of pixels
Number of particles
Cement Ultrafin 16
0 1 1 0.25799 0.257991 0.951908 98,879 98,8791 3 19 0.18949 0.009974 0.036799 3,822 2012 5 81 0.15525 0.001917 0.007072 734 93 7 179 0.15525 0.000867 0.003200 332 24 9 389 0.04840 0.000124 0.000459 47 05 11 739 0.04840 0.000065 0.000242 25 06 13 1,189 0.04840 0.000041 0.000150 15 07 15 1,791 0.04840 0.000027 0.000100 10 08 17 2,553 0.04840 0.000019 0.000070 7 0
Silica fume 0 1 1 1.00000 1.000000 1.000000 109,997 109,997
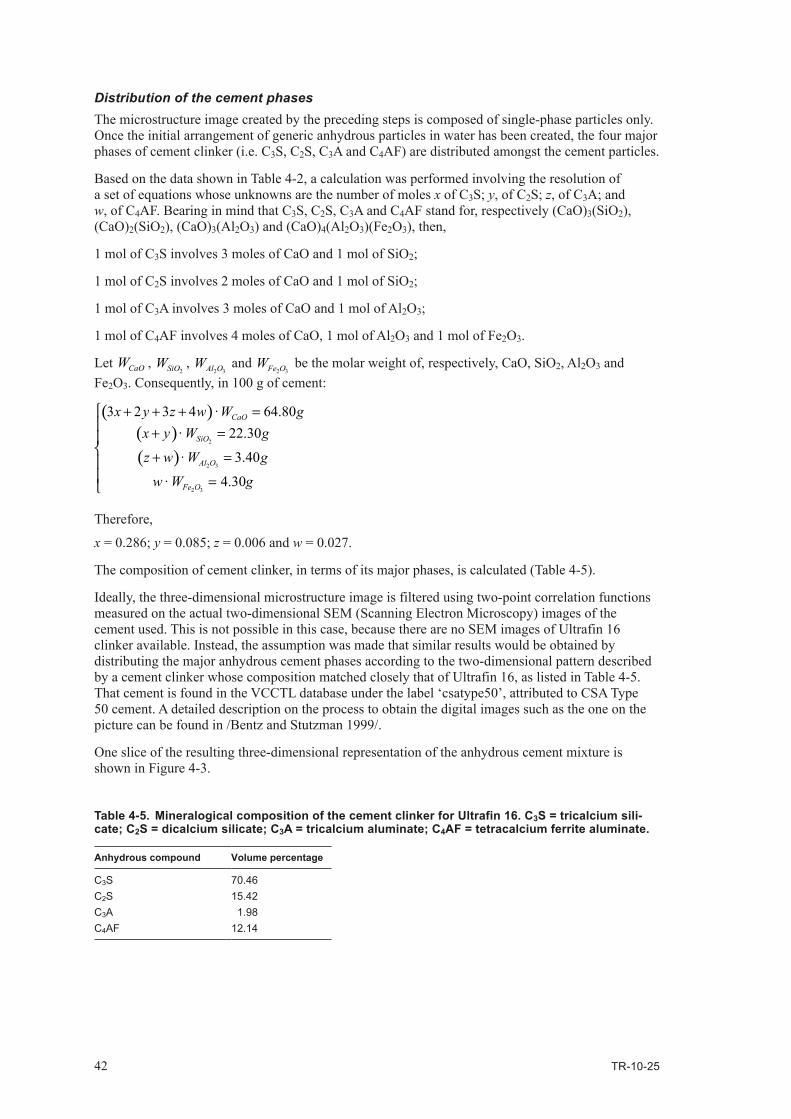
42 TR-10-25
Distribution of the cement phasesThe microstructure image created by the preceding steps is composed of single-phase particles only. Once the initial arrangement of generic anhydrous particles in water has been created, the four major phases of cement clinker (i.e. C3S, C2S, C3A and C4AF) are distributed amongst the cement particles.
Based on the data shown in Table 4-2, a calculation was performed involving the resolution of a set of equations whose unknowns are the number of moles x of C3S; y, of C2S; z, of C3A; and w, of C4AF. Bearing in mind that C3S, C2S, C3A and C4AF stand for, respectively (CaO)3(SiO2), (CaO)2(SiO2), (CaO)3(Al2O3) and (CaO)4(Al2O3)(Fe2O3), then,
1 mol of C3S involves 3 moles of CaO and 1 mol of SiO2;
1 mol of C2S involves 2 moles of CaO and 1 mol of SiO2;
1 mol of C3A involves 3 moles of CaO and 1 mol of Al2O3;
1 mol of C4AF involves 4 moles of CaO, 1 mol of Al2O3 and 1 mol of Fe2O3.
Let CaOW , 2SiOW ,
2 3Al OW and 2 3Fe OW be the molar weight of, respectively, CaO, SiO2, Al2O3 and
Fe2O3. Consequently, in 100 g of cement:
+ =
w W g
( )( )( )
2
2 3
2 3
3 2 3 4 · 64.80· 22.30
· 3.40
· 4.30
CaO
SiO
Al O
Fe O
x y z w W gx y W g
z w W g
+ + + = + = =
Therefore,
x = 0.286; y = 0.085; z = 0.006 and w = 0.027.
The composition of cement clinker, in terms of its major phases, is calculated (Table 4-5).
Ideally, the three-dimensional microstructure image is filtered using two-point correlation functions measured on the actual two-dimensional SEM (Scanning Electron Microscopy) images of the cement used. This is not possible in this case, because there are no SEM images of Ultrafin 16 clinker available. Instead, the assumption was made that similar results would be obtained by distributing the major anhydrous cement phases according to the two-dimensional pattern described by a cement clinker whose composition matched closely that of Ultrafin 16, as listed in Table 4-5. That cement is found in the VCCTL database under the label ‘csatype50’, attributed to CSA Type 50 cement. A detailed description on the process to obtain the digital images such as the one on the picture can be found in /Bentz and Stutzman 1999/.
One slice of the resulting three-dimensional representation of the anhydrous cement mixture is shown in Figure 4-3.
Table 4‑5. Mineralogical composition of the cement clinker for Ultrafin 16. C3S = tricalcium sili‑cate; C2S = dicalcium silicate; C3A = tricalcium aluminate; C4AF = tetracalcium ferrite aluminate.
Anhydrous compound Volume percentage
C3S 70.46C2S 15.42C3A 1.98C4AF 12.14

TR-10-25 43
Simulation of hydrationOnce the anhydrous mixture was sketched, the simulation of the hydration process was performed by means of a program included in the CEMHYD3D package, called Disreal3D. In this simulation, it was assumed that the microstructural characteristics of the hydrated paste would be roughly the same regardless of the conditions of curing if the degree of hydration was high. The period of hydration (under saturated conditions and constant temperature of 25°C) was simulated to extend for more than 100 days.
Hydrated grout compositionThe volume fraction distribution of the components of the hydrated microstructure of cement-based grout for the Disreal3D simulation is shown in Table 4-6. The extremely low volume fractions obtained for the anhydrous components of cement denote that the degree of hydration reached is close to 100%. Also, the high water-to-binder ratio is reflected in the large porosity of the mixture design. Also, the use of sulphate-resistant cement and the addition of silica fume lead to a low Al content.
One two-dimensional slice of the generated microstructure of the hardened cement paste is shown in Figure 4-4. It is apparent that the addition of silica fume results in a substantial decrease of the volume fraction of portlandite (Ca(OH)2), which is almost absent in the final microstructure.
These results of the microstructure simulations match the characteristic properties expected for injec-tion grout. Computed microstructures display a high degree of hydration (evident in the low fraction of anhydrous compounds), high porosity (61.77%), low contents of aluminium compounds, with no amounts of ettringite and hydrogarnet (the cement used, Ultrafin 16, is a sulphate-resistant one) and low contents of portlandite due to the addition of silica fume.
Figure 4‑3. 2D statistical distribution of mineral phases before hydration.

44 TR-10-25
4.3 1D reactive transport modelsIn this section, reactive transport simulations are performed using the grout composition calculated section 4.2, and considering the composition of granitic water as external fluid interacting with grout. The geochemical model is based on the results from models tested and validated in sections 2 and 3. Two different cases are presented: (1) grout alteration due to interaction with granitic water in which diffusion is the only solute transport mechanism, and (2) grout alteration associated to advective fluxes of granitic water through grouted borehole.
Table 4‑6. Calculated volume fractions (%) for the mix design analyzed. CH = calcium hydroxide; C‑S‑H = calcium silicate hydrates (C1.7SH4); C3AH6 = katoite; FH3 = iron hydroxide; PozzC‑S‑H = pozzolanic calcium silicate hydrates (C1.1SH3.9).
Component Volume fraction (%)
Porosity 57.636C3S 0.002C2S 0.156C3A 0.000C4AF 0.175Silica fume 5.405CH 0.000C-S-H 0.026C3AH6 1.746FH3 0.523PozzC-S-H 34.329
Figure 4‑4. Slice of the three-dimensional microstructure of the hydrated cement paste of the mix design analyzed. See also Table 4-6.
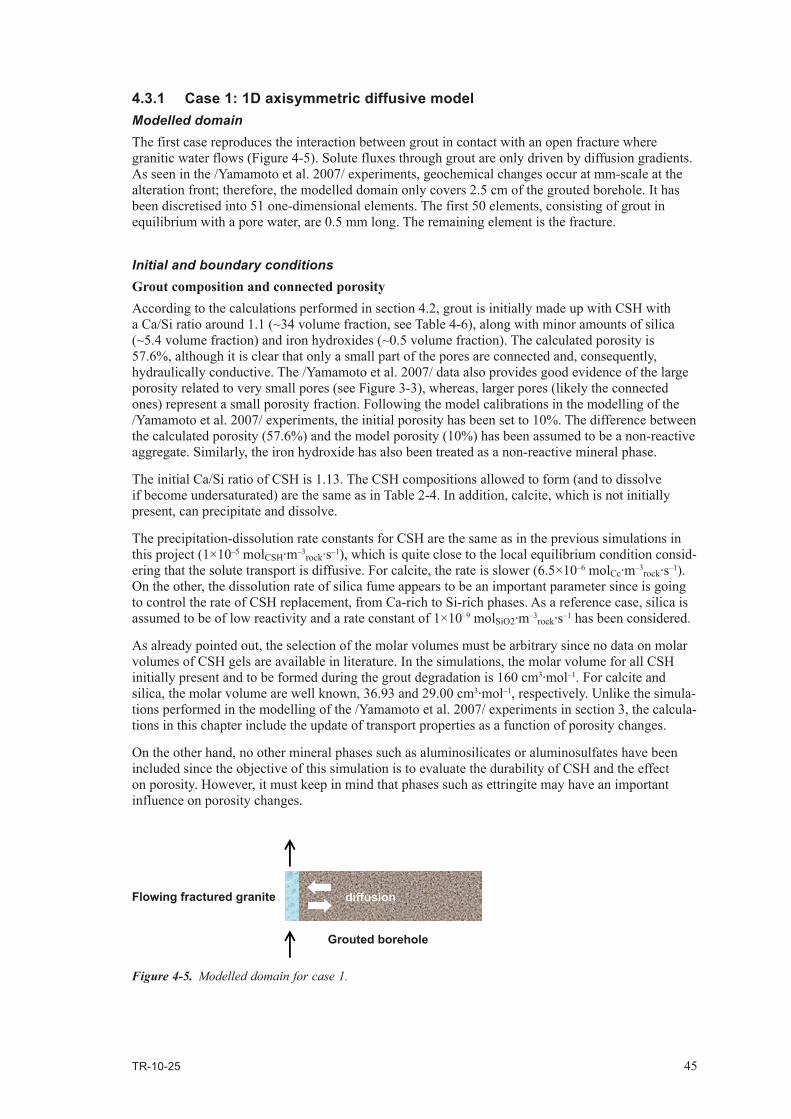
TR-10-25 45
4.3.1 Case 1: 1D axisymmetric diffusive modelModelled domainThe first case reproduces the interaction between grout in contact with an open fracture where granitic water flows (Figure 4-5). Solute fluxes through grout are only driven by diffusion gradients. As seen in the /Yamamoto et al. 2007/ experiments, geochemical changes occur at mm-scale at the alteration front; therefore, the modelled domain only covers 2.5 cm of the grouted borehole. It has been discretised into 51 one-dimensional elements. The first 50 elements, consisting of grout in equilibrium with a pore water, are 0.5 mm long. The remaining element is the fracture.
Initial and boundary conditionsGrout composition and connected porosityAccording to the calculations performed in section 4.2, grout is initially made up with CSH with a Ca/Si ratio around 1.1 (~34 volume fraction, see Table 4-6), along with minor amounts of silica (~5.4 volume fraction) and iron hydroxides (~0.5 volume fraction). The calculated porosity is 57.6%, although it is clear that only a small part of the pores are connected and, consequently, hydraulically conductive. The /Yamamoto et al. 2007/ data also provides good evidence of the large porosity related to very small pores (see Figure 3-3), whereas, larger pores (likely the connected ones) represent a small porosity fraction. Following the model calibrations in the modelling of the /Yamamoto et al. 2007/ experiments, the initial porosity has been set to 10%. The difference between the calculated porosity (57.6%) and the model porosity (10%) has been assumed to be a non-reactive aggregate. Similarly, the iron hydroxide has also been treated as a non-reactive mineral phase.
The initial Ca/Si ratio of CSH is 1.13. The CSH compositions allowed to form (and to dissolve if become undersaturated) are the same as in Table 2-4. In addition, calcite, which is not initially present, can precipitate and dissolve.
The precipitation-dissolution rate constants for CSH are the same as in the previous simulations in this project (1×10⁻⁵ molCSH·m–3
rock·s–1), which is quite close to the local equilibrium condition consid-ering that the solute transport is diffusive. For calcite, the rate is slower (6.5×10⁻⁶ molCc·m–3
rock·s–1). On the other, the dissolution rate of silica fume appears to be an important parameter since is going to control the rate of CSH replacement, from Ca-rich to Si-rich phases. As a reference case, silica is assumed to be of low reactivity and a rate constant of 1×10⁻⁹ molSiO2·m–3
rock·s–1 has been considered.
As already pointed out, the selection of the molar volumes must be arbitrary since no data on molar volumes of CSH gels are available in literature. In the simulations, the molar volume for all CSH initially present and to be formed during the grout degradation is 160 cm3·mol–1. For calcite and silica, the molar volume are well known, 36.93 and 29.00 cm3·mol–1, respectively. Unlike the simula-tions performed in the modelling of the /Yamamoto et al. 2007/ experiments in section 3, the calcula-tions in this chapter include the update of transport properties as a function of porosity changes.
On the other hand, no other mineral phases such as aluminosilicates or aluminosulfates have been included since the objective of this simulation is to evaluate the durability of CSH and the effect on porosity. However, it must keep in mind that phases such as ettringite may have an important influence on porosity changes.
Flowing fractured granite diffusion
Grouted borehole
Figure 4‑5. Modelled domain for case 1.
46 TR-10-25
Initial and boundary watersTwo chemically distinct types of waters are initially considered in the system: (1) grout pore water, and (2) granitic, Forsmark-type water.
The determination of the initial composition of grout pore water is not straightforward. Grout is essentially a mixture of CSH and silica fume. Following the solid solution approach in which CSH is a intermediate solid between Ca(OH)2 and SiO2(am), it is clear that any solution can not met equi-librium with CSH and SiO2(am) at the same time. Since CSH is volumetrically more important in the grout, the initial composition of pore water in the model (and likely in the reality due to the faster kinetics of CSH respect to silica) is considered to be in equilibrium with CSH of Ca/Si=1.13–1.17 (Table 4-7). The other CSH phases and the end members of the solid solution are undersaturated (Table 4-8).
The equilibrium with CSH of Ca/Si~1.1 leads to an initial pH of 11.8. In the reference case, a low carbonate concentration has been assumed (3×10⁻⁵ mol·L–1).
On the other hand, a typical deep groundwater at Forsmark has been selected as external groundwa-ter. This is a neutral, saline (essentially Na and Cl) water. Also, it contains moderate concentrations of calcium, sulphate and carbonate (Table 4-7). It is significantly undersaturated with respect to CSH gels in the grout (Table 4-8).
The aqueous species included in the simulations are shown in Table 4-9.
The temperature for water-grout interaction is in all cases set to 25°C.
Solute transport and flow boundary conditionsAccording to Figure 4-5, advective solute flow is limited to the fracture. In the numerical model, this is represented considering a fixed solute composition in the element corresponding to fracture. As a consequence, a quick renewal of granitic groundwater is ensured, leading to a chemically “aggressive” boundary condition. Inside the grout, solutes move due to concentration gradients, i.e. by molecular diffusion. The coefficient of molecular diffusion has been set to 5×10⁻¹⁰ m2·s–1.
Simulation timeAlteration front evolution in the fracture-grout contact has been simulated for 1,000 years. As revealed by the results, the progressive decrease of porosity in the grout slows down the solute transport and the interaction between external water and the grout is extremely small at times higher than 1,000 years.
Table 4‑7. Chemistry of grout pore water and granitic groundwater (solutes in mol·L–1).
Granitic Gw Grout pore water
T(°C) 25 25pH 7.0 11.8SiO2(aq) 1.85×10⁻⁴ 3.58×10⁻⁶
Na 8.88×10⁻² 7.14×10⁻²
K 8.75×10⁻⁴ 1.09×10⁻¹
Ca 2.33×10⁻² 6.50×10⁻²
C(IV) 2.20×10⁻³ 3.00×10⁻⁵
sulphate 6.80×10⁻³ 3.00×10⁻⁵
Cl 1.53×10⁻¹ 1.46×10⁻³
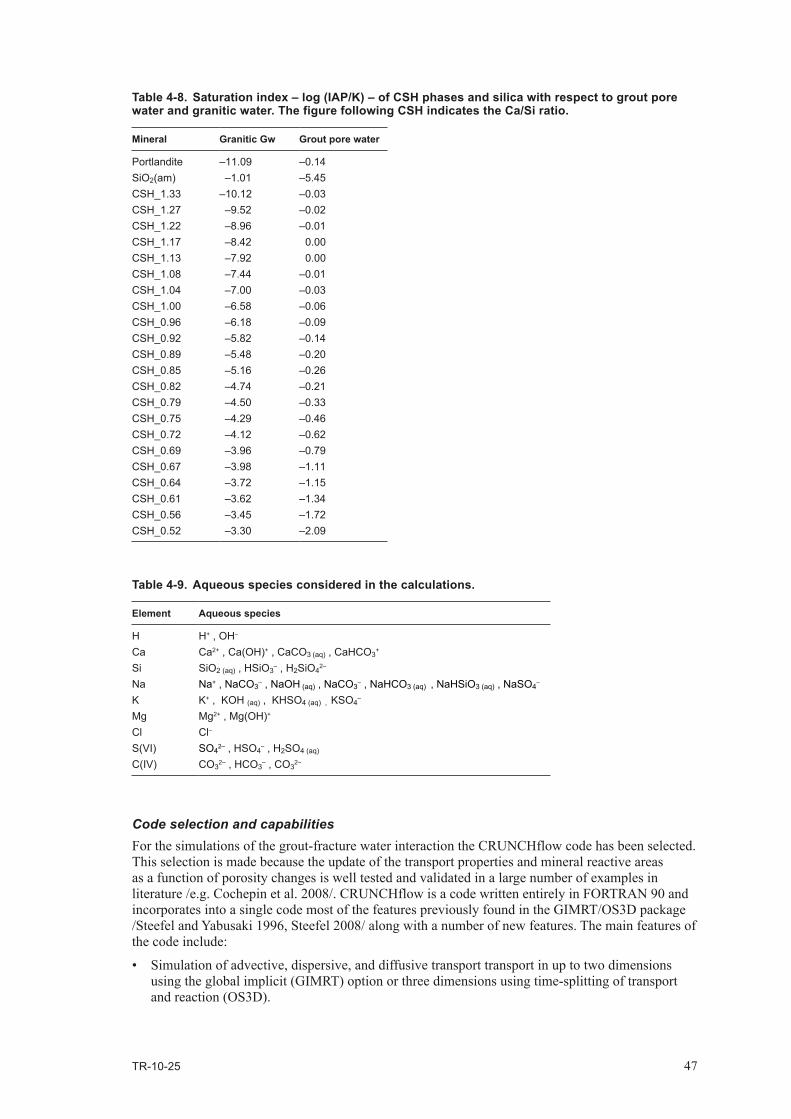
TR-10-25 47
Code selection and capabilitiesFor the simulations of the grout-fracture water interaction the CRUNCHflow code has been selected. This selection is made because the update of the transport properties and mineral reactive areas as a function of porosity changes is well tested and validated in a large number of examples in literature /e.g. Cochepin et al. 2008/. CRUNCHflow is a code written entirely in FORTRAN 90 and incorporates into a single code most of the features previously found in the GIMRT/OS3D package /Steefel and Yabusaki 1996, Steefel 2008/ along with a number of new features. The main features of the code include:
• Simulation of advective, dispersive, and diffusive transport transport in up to two dimensions using the global implicit (GIMRT) option or three dimensions using time-splitting of transport and reaction (OS3D).
Table 4‑8. Saturation index – log (IAP/K) – of CSH phases and silica with respect to grout pore water and granitic water. The figure following CSH indicates the Ca/Si ratio.
Mineral Granitic Gw Grout pore water
Portlandite –11.09 –0.14SiO2(am) –1.01 –5.45CSH_1.33 –10.12 –0.03CSH_1.27 –9.52 –0.02CSH_1.22 –8.96 –0.01CSH_1.17 –8.42 0.00CSH_1.13 –7.92 0.00CSH_1.08 –7.44 –0.01CSH_1.04 –7.00 –0.03CSH_1.00 –6.58 –0.06CSH_0.96 –6.18 –0.09CSH_0.92 –5.82 –0.14CSH_0.89 –5.48 –0.20CSH_0.85 –5.16 –0.26CSH_0.82 –4.74 –0.21CSH_0.79 –4.50 –0.33CSH_0.75 –4.29 –0.46CSH_0.72 –4.12 –0.62CSH_0.69 –3.96 –0.79CSH_0.67 –3.98 –1.11CSH_0.64 –3.72 –1.15CSH_0.61 –3.62 –1.34CSH_0.56 –3.45 –1.72CSH_0.52 –3.30 –2.09
Table 4‑9. Aqueous species considered in the calculations.
Element Aqueous species
H H+ , OH–
Ca Ca2+ , Ca(OH)+ , CaCO3 (aq) , CaHCO3
+
Si SiO2 (aq) , HSiO3– , H2SiO4
2–
Na Na+ , NaCO3– , NaOH (aq) , NaCO3
– , NaHCO3 (aq) , NaHSiO3 (aq) , NaSO4
–
K K+ , KOH (aq) , KHSO4 (aq) , KSO4–
Mg Mg2+ , Mg(OH)+
Cl Cl–
S(VI) SO42– , HSO4
– , H2SO4 (aq)
C(IV) CO32– , HCO3
– , CO32–

48 TR-10-25
• Non-isothermal transport and reaction.
• Reaction-induced porosity and permeability feedback to both diffusion and flow.
• Unsaturated (gas-liquid) transport with equilibrium gas-aqueous phase exchange.
• Multicomponent diffusion with an electrochemical migration term to correct for electroneutrality where diffusion coefficients of charged species differ.
ResultsAt early contact times (t~1 day), the effect of external water is very low. Only, a thin rim (<0.5 mm) starts to dissolve (Figure 4-6). The main consequence is the “intrusion” of low-pH fluid, which is not completely buffered due to the kinetics of grout phases. In addition, in spite of the initial disequilibrium between grout-pore water system (the pore fluid is only equilibrated with CSH, but clearly undersaturated with respect to silica fume, see Table 4-8), the CSH alteration is insignificant in the grout. Due to very slow dissolution kinetics of silica fume, the formation of new, Si-rich CSH is very small (below 0.03% in volume; Figure 4-7). On the other hand, limited amounts of calcite precipitate in the alteration front.
The formation of Si-rich CSH is predicted to be more important after one year, although the progres-sion of dissolution front is not much significant (Figure 4-8). The low-pH plume penetrates faster in the grout than the CSH replacement process. This replacement is active in the degradation front, caused mainly by the diffusion of Si from granitic water (Figure 4-9). The Si provided by the dis-solution of silica fume is negligible. New CSH phases are progressively richer in Si as the alteration front progresses (Figure 4-9). At distances from the fracture longer than 0.2 cm, the original CSH (Ca/Si=1.13) is still predominant. On the other hand, carbonation process (calcite precipitation) is clearly active at the contact, accounting for the 14% volume fraction of the grout.
The formation of CSH richer in Si is enhanced from 50–100 years due to the dissolution of silica fume at the alteration rim (Figure 4-10). The large difference in molar volume between silica (29 cm3·mol–1) and CSH (160 cm3·mol–1) results in a porosity clogging at this rim (Figure 4-11); therefore, the solute transport from the fracture to the grout is very limited. After 100 years, the main CSH phase in the grout is a CSH with Ca/Si=1.00. Si-richer phases are only predicted at the altera-tion front, with Ca/Si as low as 0.64 (Figure 4-10). pH at the contact is not alkaline but it is close to the initial value of the granitic water. Therefore, a plume of alkaline water is not predicted away from the grout (Figure 4-11), at least for the very fast flow conditions selected for the fracture.
The molar volume difference between silica and CSH has an increasing importance at longer times. The disequilibrium between silica and the pore fluid leads to slow but progressive dissolution of silica and subsequent formation of Si-rich CSH (Figure 4-12). This replacement process occurs even if the solute transfer in/out from/to the fracture is very low due to the porosity clogging at the grout rim. Interestingly, the model predicts a faster change in CSH phases in the “unaffected” grout than in the alteration rim. So, main CSH phases in the grout has Ca/Si from 0.72 to 0.79, whereas in the contact between granitic water and grout the CSH with Ca/Si=0.82 is still the dominant phase. This is caused by the porosity clogging at the alteration front.
The mineral volume increases in time and, after 1,000 years, the connected porosity is minimal in the grout. Pore water pH progressively decreases due to the formation of Si-rich CSH (Figure 4-13).
After 1,000 years, the predicted amount of dissolved grout is very small, and the alteration front only progressed 0.22 cm.
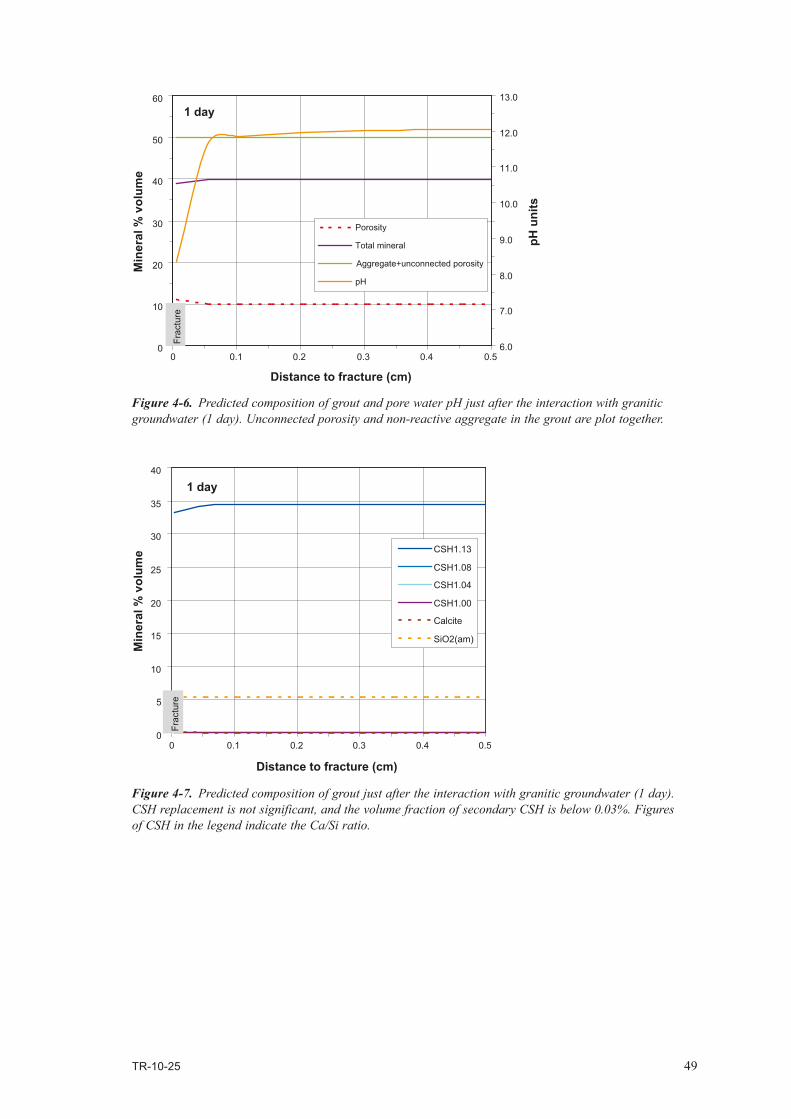
TR-10-25 49
Figure 4‑6. Predicted composition of grout and pore water pH just after the interaction with granitic groundwater (1 day). Unconnected porosity and non-reactive aggregate in the grout are plot together.
Figure 4‑7. Predicted composition of grout just after the interaction with granitic groundwater (1 day). CSH replacement is not significant, and the volume fraction of secondary CSH is below 0.03%. Figures of CSH in the legend indicate the Ca/Si ratio.
0
10
20
30
40
50
60
0 0.1 0.2 0.3 0.4 0.5
Min
eral
% v
olum
e
6.0
7.0
8.0
9.0
10.0
11.0
12.0
13.0
pH u
nits
Porosity
Total mineral
pH
1 day
Distance to fracture (cm)
Aggregate+unconnected porosity
Frac
ture
0
5
10
15
20
25
30
35
40
0 0.1 0.2 0.3 0.4 0.5
Distance to fracture (cm)
Min
eral
% v
olum
e CSH1.13
CSH1.08
CSH1.04
CSH1.00
Calcite
SiO2(am)
Frac
ture
1 day
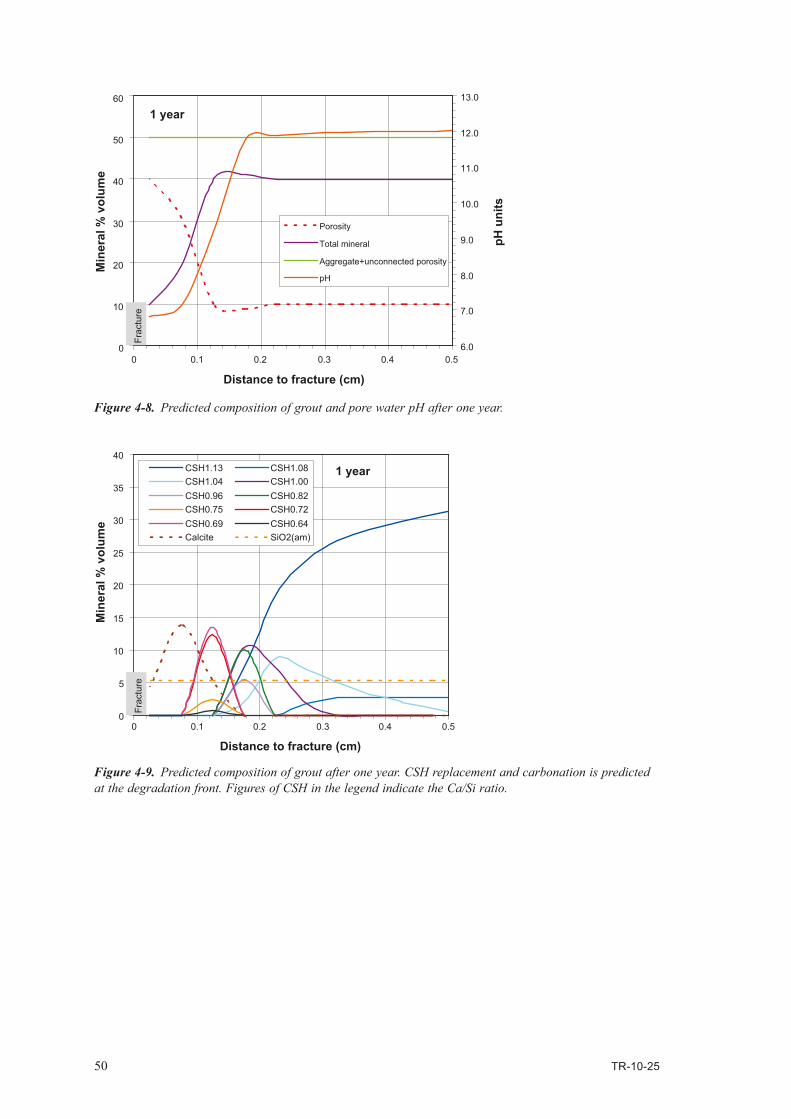
50 TR-10-25
Figure 4‑9. Predicted composition of grout after one year. CSH replacement and carbonation is predicted at the degradation front. Figures of CSH in the legend indicate the Ca/Si ratio.
0
10
20
30
40
50
60
0 0.1 0.2 0.3 0.4 0.5
Distance to fracture (cm)
Min
eral
% v
olum
e
6.0
7.0
8.0
9.0
10.0
11.0
12.0
13.0
pH u
nits
Porosity
Total mineral
Aggregate+unconnected porosity
pH
Frac
ture
1 year
Figure 4‑8. Predicted composition of grout and pore water pH after one year.
0
5
10
15
20
25
30
35
40
0 0.1 0.2 0.3 0.4 0.5
Distance to fracture (cm)
Min
eral
% v
olum
e
CSH1.13 CSH1.08CSH1.04 CSH1.00CSH0.96 CSH0.82CSH0.75 CSH0.72CSH0.69 CSH0.64Calcite SiO2(am)
Frac
ture
1 year

TR-10-25 51
Figure 4‑10. Predicted composition of grout after 100 years. Main CSH phase has Ca/Si=1.00. Figures of CSH in the legend indicate the Ca/Si ratio.
Figure 4‑11. Predicted composition of grout and pore water pH after 100 years. Note the porosity clogging at 0.25 cm from the fracture due to change in molar volume from dissolved silica and newly-formed CSH.
0
5
10
15
20
25
30
35
40
0 0.1 0.2 0.3 0.4 0.5 0.6 0.7 0.8 0.9 1
Distance to fracture (cm)
Min
eral
% v
olum
e
Frac
ture
100 years
CSH1.00 CSH0.82CSH0.79 CSH0.75CSH0.72 CSH0.69CSH0.64 CalciteSiO2(am)
0
10
20
30
40
50
60
0 0.1 0.2 0.3 0.4 0.5 0.6 0.7 0.8 0.9 1
Distance to fracture (cm)
Min
eral
% v
olum
e
6.0
7.0
8.0
9.0
10.0
11.0
12.0
13.0
pH u
nitsPorosity
Total mineral
Aggregate+unconnected porosity
pH
Frac
ture
100 years
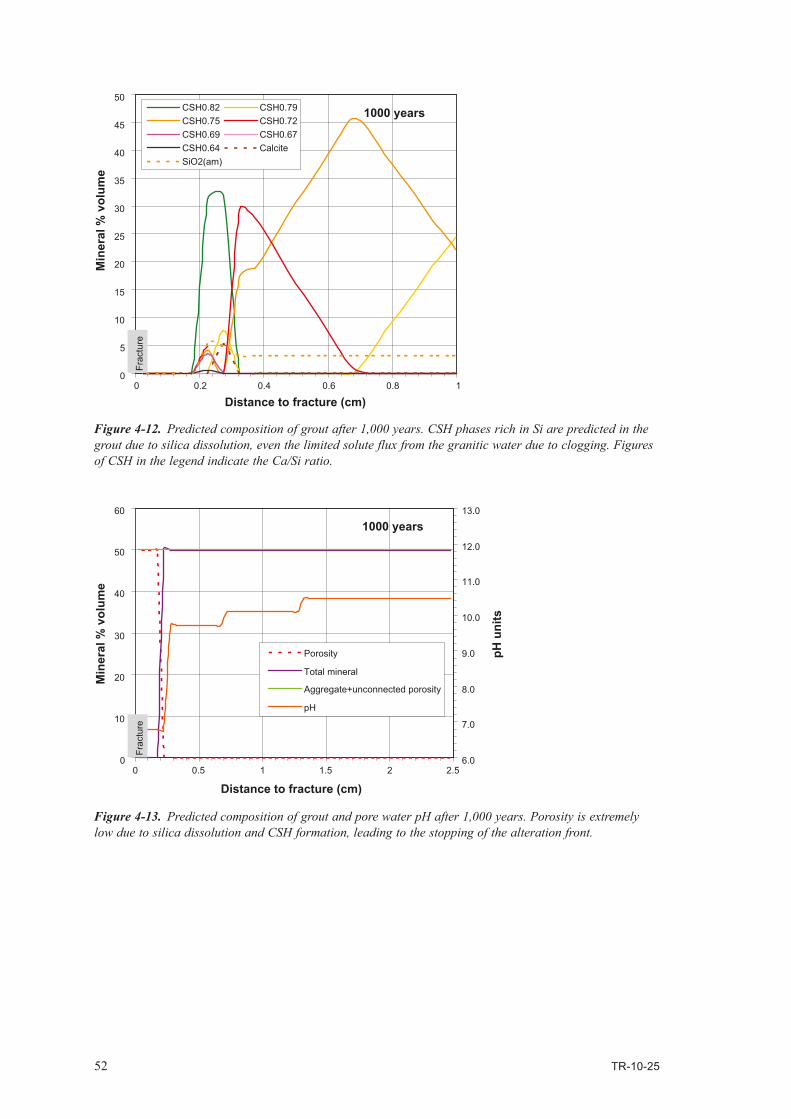
52 TR-10-25
Figure 4‑12. Predicted composition of grout after 1,000 years. CSH phases rich in Si are predicted in the grout due to silica dissolution, even the limited solute flux from the granitic water due to clogging. Figures of CSH in the legend indicate the Ca/Si ratio.
Figure 4‑13. Predicted composition of grout and pore water pH after 1,000 years. Porosity is extremely low due to silica dissolution and CSH formation, leading to the stopping of the alteration front.
0
5
10
15
20
25
30
35
40
45
50
0 0.2 0.4 0.6 0.8 1
Distance to fracture (cm)
Min
eral
% v
olum
e CSH0.82 CSH0.79CSH0.75 CSH0.72CSH0.69 CSH0.67CSH0.64 CalciteSiO2(am)
Frac
ture
1000 years
0
10
20
30
40
50
60
0 0.5 1 1.5 2 2.5
Distance to fracture (cm)
Min
eral
% v
olum
e
6.0
7.0
8.0
9.0
10.0
11.0
12.0
13.0pH
uni
ts
Porosity
Total mineral
Aggregate+unconnected porosity
pH
Frac
ture
1000 years
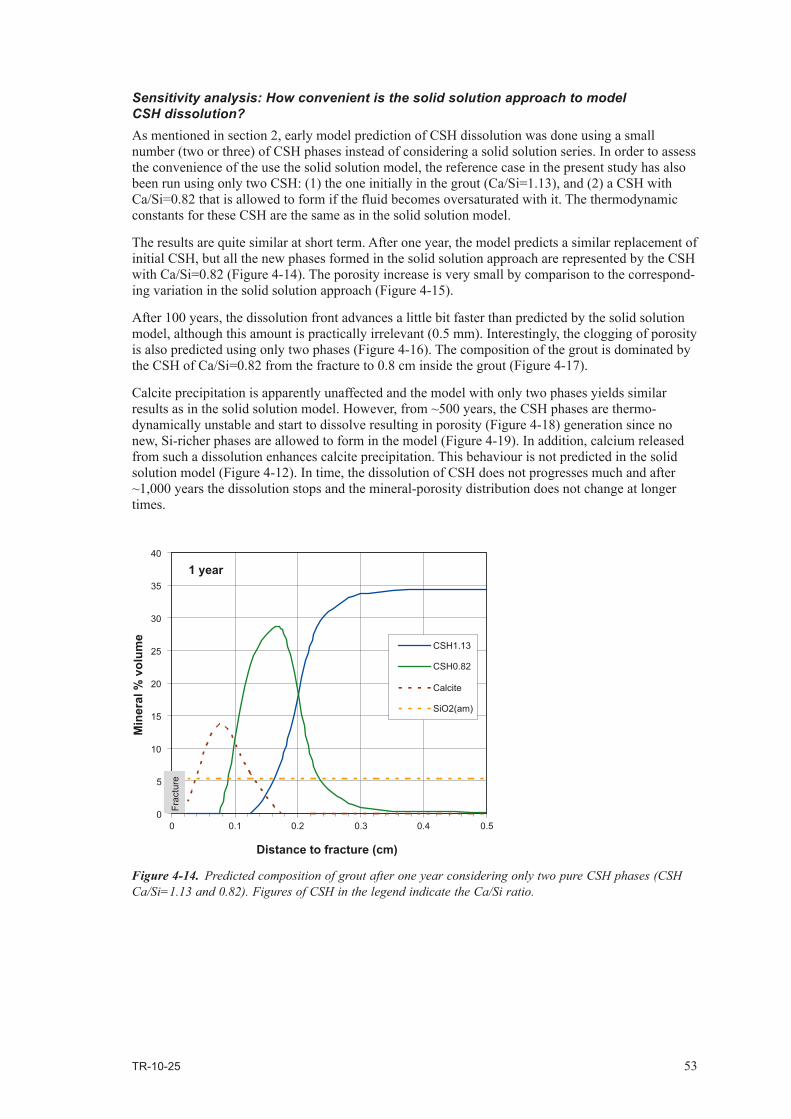
TR-10-25 53
Sensitivity analysis: How convenient is the solid solution approach to model CSH dissolution? As mentioned in section 2, early model prediction of CSH dissolution was done using a small number (two or three) of CSH phases instead of considering a solid solution series. In order to assess the convenience of the use the solid solution model, the reference case in the present study has also been run using only two CSH: (1) the one initially in the grout (Ca/Si=1.13), and (2) a CSH with Ca/Si=0.82 that is allowed to form if the fluid becomes oversaturated with it. The thermodynamic constants for these CSH are the same as in the solid solution model.
The results are quite similar at short term. After one year, the model predicts a similar replacement of initial CSH, but all the new phases formed in the solid solution approach are represented by the CSH with Ca/Si=0.82 (Figure 4-14). The porosity increase is very small by comparison to the correspond-ing variation in the solid solution approach (Figure 4-15).
After 100 years, the dissolution front advances a little bit faster than predicted by the solid solution model, although this amount is practically irrelevant (0.5 mm). Interestingly, the clogging of porosity is also predicted using only two phases (Figure 4-16). The composition of the grout is dominated by the CSH of Ca/Si=0.82 from the fracture to 0.8 cm inside the grout (Figure 4-17).
Calcite precipitation is apparently unaffected and the model with only two phases yields similar results as in the solid solution model. However, from ~500 years, the CSH phases are thermo-dynamically unstable and start to dissolve resulting in porosity (Figure 4-18) generation since no new, Si-richer phases are allowed to form in the model (Figure 4-19). In addition, calcium released from such a dissolution enhances calcite precipitation. This behaviour is not predicted in the solid solution model (Figure 4-12). In time, the dissolution of CSH does not progresses much and after ~1,000 years the dissolution stops and the mineral-porosity distribution does not change at longer times.
Figure 4‑14. Predicted composition of grout after one year considering only two pure CSH phases (CSH Ca/Si=1.13 and 0.82). Figures of CSH in the legend indicate the Ca/Si ratio.
0
5
10
15
20
25
30
35
40
0 0.1 0.2 0.3 0.4 0.5
Distance to fracture (cm)
Min
eral
% v
olum
e
CSH1.13
CSH0.82
Calcite
SiO2(am)
Frac
ture
1 year
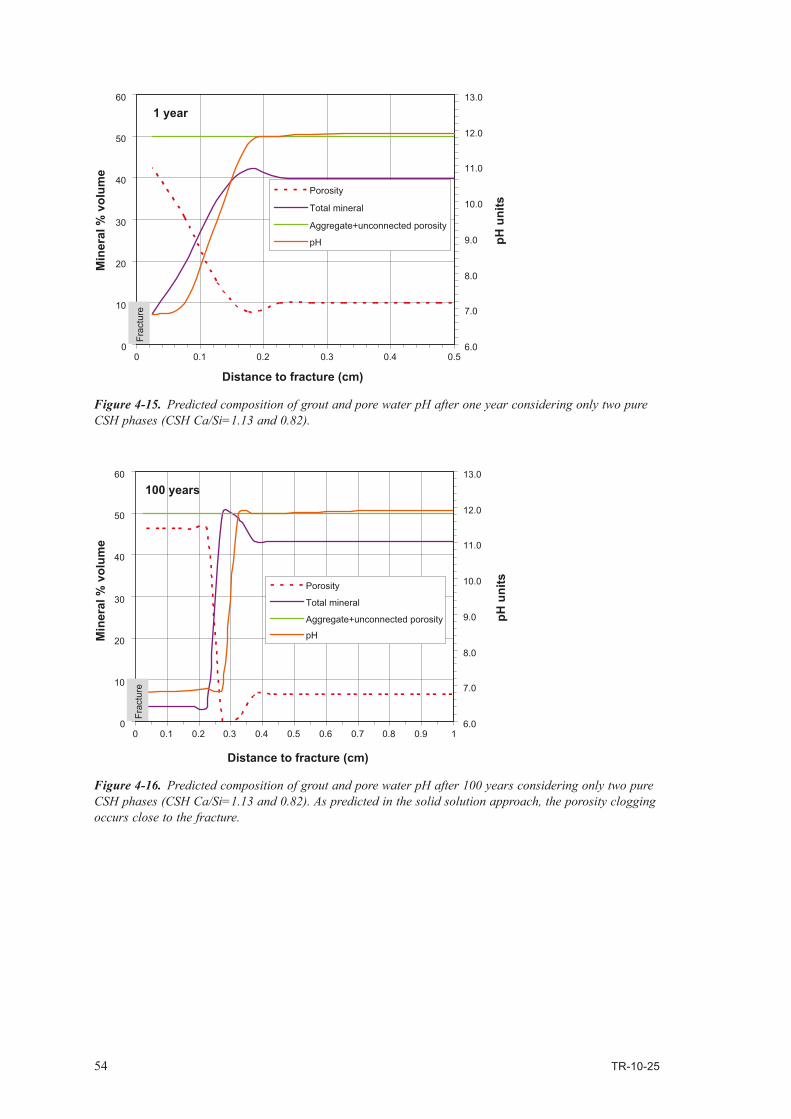
54 TR-10-25
Figure 4‑15. Predicted composition of grout and pore water pH after one year considering only two pure CSH phases (CSH Ca/Si=1.13 and 0.82).
Figure 4‑16. Predicted composition of grout and pore water pH after 100 years considering only two pure CSH phases (CSH Ca/Si=1.13 and 0.82). As predicted in the solid solution approach, the porosity clogging occurs close to the fracture.
0
10
20
30
40
50
60
0 0.1 0.2 0.3 0.4 0.5
Distance to fracture (cm)
Min
eral
% v
olum
e
6.0
7.0
8.0
9.0
10.0
11.0
12.0
13.0
pH u
nits
Porosity
Total mineral
Aggregate+unconnected porosity
pH
Frac
ture
1 year
0
10
20
30
40
50
60
0 0.1 0.2 0.3 0.4 0.5 0.6 0.7 0.8 0.9 1
Distance to fracture (cm)
Min
eral
% v
olum
e
6.0
7.0
8.0
9.0
10.0
11.0
12.0
13.0
pH u
nitsPorosity
Total mineral
Aggregate+unconnected porosity
pH
Frac
ture
100 years
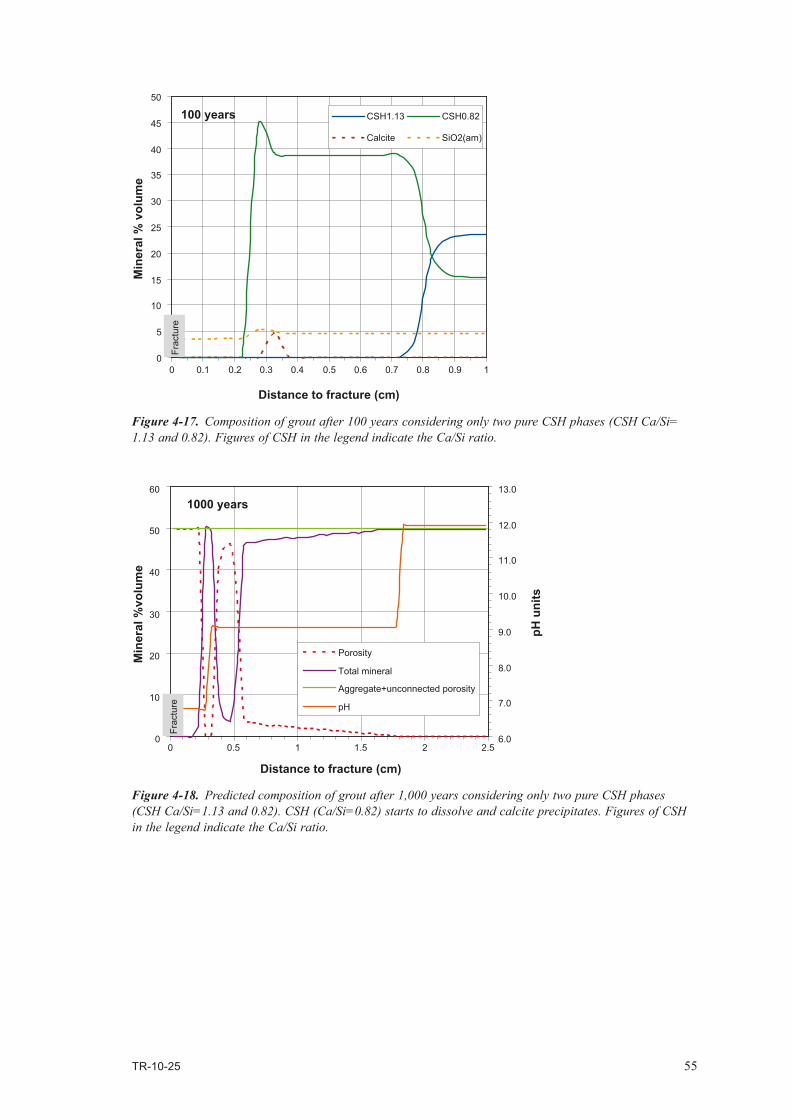
TR-10-25 55
Figure 4‑17. Composition of grout after 100 years considering only two pure CSH phases (CSH Ca/Si= 1.13 and 0.82). Figures of CSH in the legend indicate the Ca/Si ratio.
Figure 4‑18. Predicted composition of grout after 1,000 years considering only two pure CSH phases (CSH Ca/Si=1.13 and 0.82). CSH (Ca/Si=0.82) starts to dissolve and calcite precipitates. Figures of CSH in the legend indicate the Ca/Si ratio.
0
5
10
15
20
25
30
35
40
45
50
0 0.1 0.2 0.3 0.4 0.5 0.6 0.7 0.8 0.9 1
Distance to fracture (cm)
Min
eral
% v
olum
e
CSH1.13 CSH0.82
Calcite SiO2(am)
Frac
ture
100 years
0
10
20
30
40
50
60
0 0.5 1 1.5 2 2.5
Distance to fracture (cm)
Min
eral
%vo
lum
e
6.0
7.0
8.0
9.0
10.0
11.0
12.0
13.0
pH u
nits
Porosity
Total mineral
Aggregate+unconnected porosity
pH
Frac
ture
1000 years

56 TR-10-25
4.3.2 Case 2: 1D (planar) advective/diffusive model with two fracturesModelled domainUnlike the case 1, advective flow is forced through the grout since a hydraulic gradient is considered between two fractures that limits the borehole. Figure 4-20 is a sketch of the modelled domain and flow conditions included in this second case.
The length of grout limited by the fractures is 0.5 metres, which is a reasonable thickness of grout-ing. The grout material has been discretised into 280 elements. The first 100 elements from each fracture have a length of 0.5 mm, and the central 80 elements have 5 mm. Two elements at both boundaries are also included to represent the fractures.
Initial geochemical conditionsThe initial composition of the grout, the chemistry of the granitic water and grout pore fluid, and aqueous species involved are the same as in the case 1, as well as the mineral phases that are allowed to form.
Solute transport and flow boundary conditionsThe water flow through the grouted borehole has been implemented considering two distinct hydraulic gradients between fractures. In the first case (case 2a), a very low gradient is considered, 5×10⁻⁷ m·m–1, just to show the transition between a pure diffusive case (case 1 in the previous section) and a combined advective + diffusive case. The results of this case are fairly useful to a better interpretation of the case with much higher water flow. In this second example (case 2b), the hydraulic gradient is quite high, 2×10⁻³ m·m–1 and solutes are transported mainly in an advective way.
In both cases, permeability of the media is set to 1×10⁻¹⁰ m2.
Moreover, an additional case has been run assuming no advective flux between fractures, just to check that the results are the same as the case 1. In this case, no hydraulic pressure gradient has implemented.
Simulation time As in the case 1, the temporal length of the simulation is 1,000 years.
Figure 4‑19. Predicted amount of grout and pore water pH after 1,000 years considering only two pure CSH phases (CSH Ca/Si=1.13 and 0.82). Formation of secondary porosity is predicted due to dissolution of CSH.
0
5
10
15
20
25
30
35
40
45
50
0 0.5 1 1.5 2 2.5
Distance to fracture (cm)
Min
eral
%vo
lum
e CSH1.13 CSH0.82
Calcite SiO2(am)
Frac
ture
1000 years

TR-10-25 57
ResultsNo advective flux caseThe effect of diffusive transport is the same as predicted in case 1, and a symmetric alteration front is calculated in both grout-fracture contacts. Figure 4-21 shows the evolution of the right contact after 100 years, which is analogous to Figure 4-10 and Figure 4-11.
Case 2aEven assuming a very small water flux through the grout material, the solute advective transport has significant consequences in the replacement process of CSH at short times. Figure 4-22 shows the composition of grout close to the fracture with higher water level after 1 year (fracture 2). This picture is quite similar to that in the pure diffusive case (case 1, Figure 4-9) although the amount of CSH with Ca/Si=0.82 is increased. The porosity and carbonation profiles, however, are fairly similar.
The alteration front at the other end (fracture 1) does not differ much from that in fracture 2, although the formation of Si-rich CSH is less favoured (Figure 4-23). In addition, porosity clogging starts to occur in the CSH-replacement front.
At longer times, the asymmetry between both grout-water fronts significantly increases, especially in terms of CSH composition. In both cases, however, the fronts are predicted to progress very slowly due to porosity clogging, as observed in Figure 4-24 (100 years). The dissolution only reaches as much 0.3 mm. The predominant CSH phase in contact with water in fracture 2 is that of Ca/Si=0.82.
This picture does not change much until the end of the simulation. Porosity is completely occluded due to CSH replacement from silica dissolution (Figure 4-25 to Figure 4-27).
At 1,000 years, CSH with Ca/Si=0.82 is still the dominant phase at degradation fronts although close to fracture 2 Si-rich phases are favoured (Figure 4-25 and Figure 4-26). Looking at the whole grout section, it is predicted that dissolution is restricted to the first millimetres and the remaining grout is fairly intact (Figure 4-27). pH front progresses faster than the dissolution front, and the pH value at the grout-water contact is slightly alkaline (~9.7, Figure 4-27).
Figure 4‑20. Modelled domain for case 2. Hydraulic gradient between fractures leads to advective flow through the borehole.
Flowing fractured granite
Grouted borehole
Flowing fractured granitediffusion
advection
h1 h2
diffusion
advection

58 TR-10-25
0
5
10
15
20
25
30
35
40
45
50
49.5
Distance to fracture 1 (cm)
Min
eral
% v
olum
e CSH0.82CSH0.79CSH0.75CSH0.72CSH0.69CSH0.64CSH0.61CalciteSiO2(am)Porosity
Frac
ture
100 years
5049.949.849.749.6
Figure 4‑21. Predicted composition of grout after 100 years in the right boundary (fracture 2), with no advective flux condition.
Figure 4‑22. Predicted composition in the grout close to the fracture with higher water level after one year (fracture 2) under Case 2a conditions. Figures of CSH in the legend indicate the Ca-Si ratio. Water flow is from right to left.
0
5
10
15
20
25
30
35
40
49.5
Distance to fracture 1 (cm)
Min
eral
% v
olum
e
CSH1.17 CSH1.13CSH1.08 CSH1.04CSH1.00 CSH0.96CSH0.92 CSH0.89CSH0.82 CSH0.79CSH0.75 CSH0.72CSH0.69 CSH0.64Calcite SiO2(am)Porosity
Frac
ture
water flow1 year
5049.949.849.749.6

TR-10-25 59
Figure 4‑23. Predicted composition in the grout close to the fracture with lower water level after one year (fracture 1) under Case 2a conditions. Figures of CSH in the legend indicate the Ca-Si ratio. Water flow is from right to left.
Figure 4‑24. Predicted composition in the grout close to the fracture with higher water level after 100 years (fracture 2) under Case 2a conditions. Figures of CSH in the legend indicate the Ca-Si ratio. Water flow is from right to left.
0
5
10
15
20
25
30
35
40
0
Distance to fracture 1 (cm)
Min
eral
% v
olum
e
CSH1.13CSH1.08CSH1.04CSH1.00CSH0.96CSH0.82CSH0.79CSH0.75CSH0.72CSH0.69CalciteSiO2(am)Porosity
water flow1 year
0.50.40.30.20.1
Frac
ture
0
10
20
30
40
50
60
49.5
Distance to fracture 1 (cm)
Min
eral
% v
olum
e CSH0.82CSH0.79CSH0.75CSH0.72CSH0.69CSH0.67CSH0.64CalciteSiO2(am)Porosity
Frac
ture
water flow100 years
5049.949.849.749.6
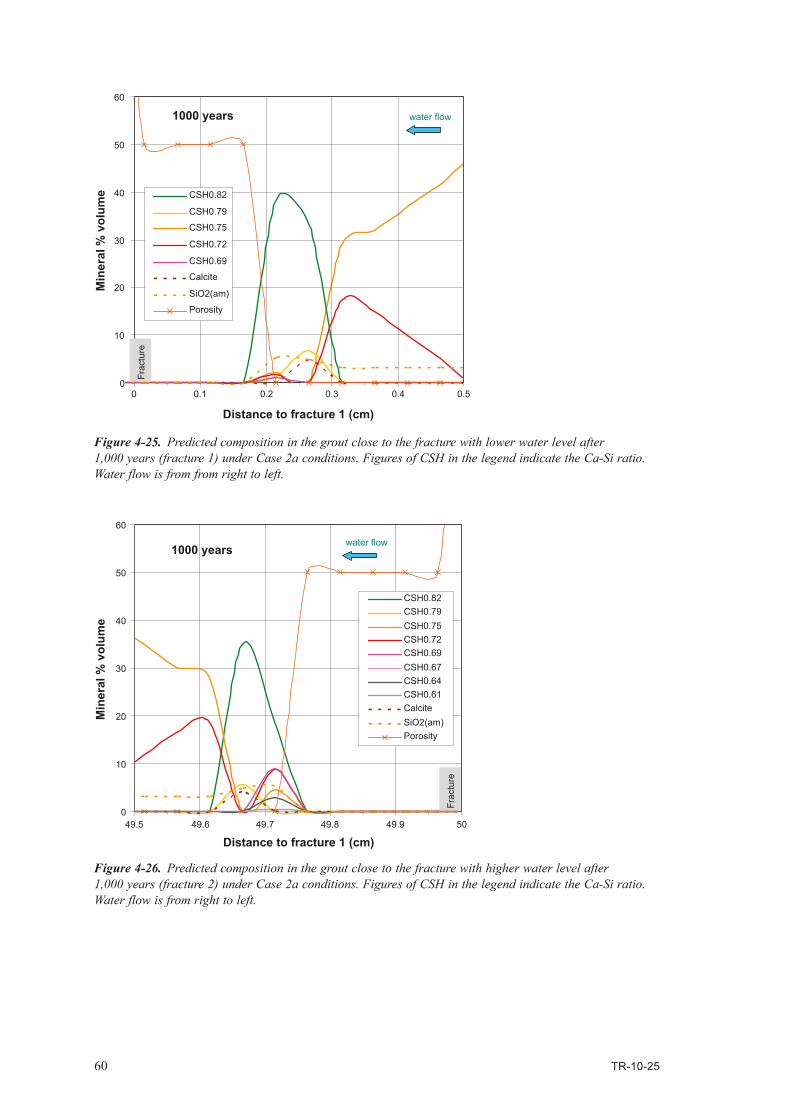
60 TR-10-25
Figure 4‑25. Predicted composition in the grout close to the fracture with lower water level after 1,000 years (fracture 1) under Case 2a conditions. Figures of CSH in the legend indicate the Ca-Si ratio. Water flow is from from right to left.
Figure 4‑26. Predicted composition in the grout close to the fracture with higher water level after 1,000 years (fracture 2) under Case 2a conditions. Figures of CSH in the legend indicate the Ca-Si ratio. Water flow is from right to left.
10
20
30
40
50
60
Distance to fracture 1 (cm)
Min
eral
% v
olum
e CSH0.82
CSH0.79
CSH0.75
CSH0.72
CSH0.69
Calcite
SiO2(am)
Porosity
water flow1000 years
00 0.50.40.30.20.1
Frac
ture
0
10
20
30
40
50
60
49.5
Distance to fracture 1 (cm)
Min
eral
% v
olum
e
CSH0.82CSH0.79CSH0.75CSH0.72CSH0.69CSH0.67CSH0.64CSH0.61CalciteSiO2(am)Porosity
Frac
ture
water flow1000 years
5049.949.849.749.6

TR-10-25 61
Case 2bConsidering much higher flow rates the rate of CSH replacement is highly enhanced especially at the front in fracture 2. In just one year (Figure 4-28 and Figure 4-29), the alteration front has progressed 0.2 to 0.3 cm and Si-rich, low pH CSH are already predicted to occur (Figure 4-28 and Figure 4-29). Also, carbonation is an active process at the front. Coupled to the CSH replacement, porosity loss is also increased, limiting the progression of the degradation front at earlier times than the previous cases. Therefore, at long term the main geochemical process is the replacement of CSH due to Si release from silica fume (Figure 4-30 to Figure 4-32).
Figure 4‑27. Predicted amount of CSH, silica, calcite, aggregate (non-reactive) and porosity in the whole grout section after 1,000 years under Case 2a conditions. Also pH profile is shown. Water flow is from from right to left.
0
10
20
30
40
50
60
0
Distance to fracture 1 (cm)
Min
eral
% v
olum
e
8.0
8.5
9.0
9.5
10.0
10.5
11.0
11.5
12.0
12.5
pH
total CSH
Calcite
SiO2(am)
Porosity
aggregate
pH
water flow1000 years
5040302010
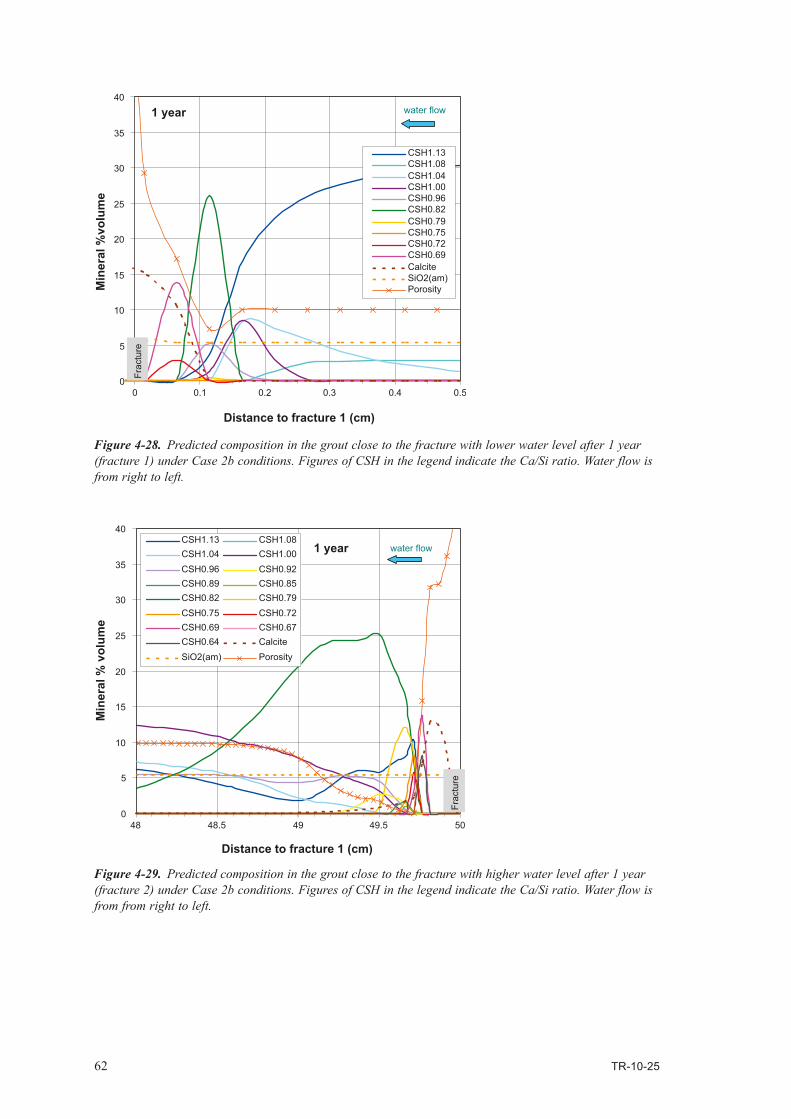
62 TR-10-25
0
5
10
15
20
25
30
35
40
0
Distance to fracture 1 (cm)
Min
eral
%vo
lum
e
CSH1.13CSH1.08CSH1.04CSH1.00CSH0.96CSH0.82CSH0.79CSH0.75CSH0.72CSH0.69CalciteSiO2(am)Porosity
Frac
ture
water flow1 year
0.50.40.30.20.1
Figure 4‑28. Predicted composition in the grout close to the fracture with lower water level after 1 year (fracture 1) under Case 2b conditions. Figures of CSH in the legend indicate the Ca/Si ratio. Water flow is from right to left.
Figure 4‑29. Predicted composition in the grout close to the fracture with higher water level after 1 year (fracture 2) under Case 2b conditions. Figures of CSH in the legend indicate the Ca/Si ratio. Water flow is from from right to left.
0
5
10
15
20
25
30
35
40
48 48.5 49 49.5 50
Distance to fracture 1 (cm)
Min
eral
% v
olum
e
CSH1.13 CSH1.08CSH1.04 CSH1.00CSH0.96 CSH0.92CSH0.89 CSH0.85CSH0.82 CSH0.79CSH0.75 CSH0.72CSH0.69 CSH0.67CSH0.64 CalciteSiO2(am) Porosity
Frac
ture
water flow1 year
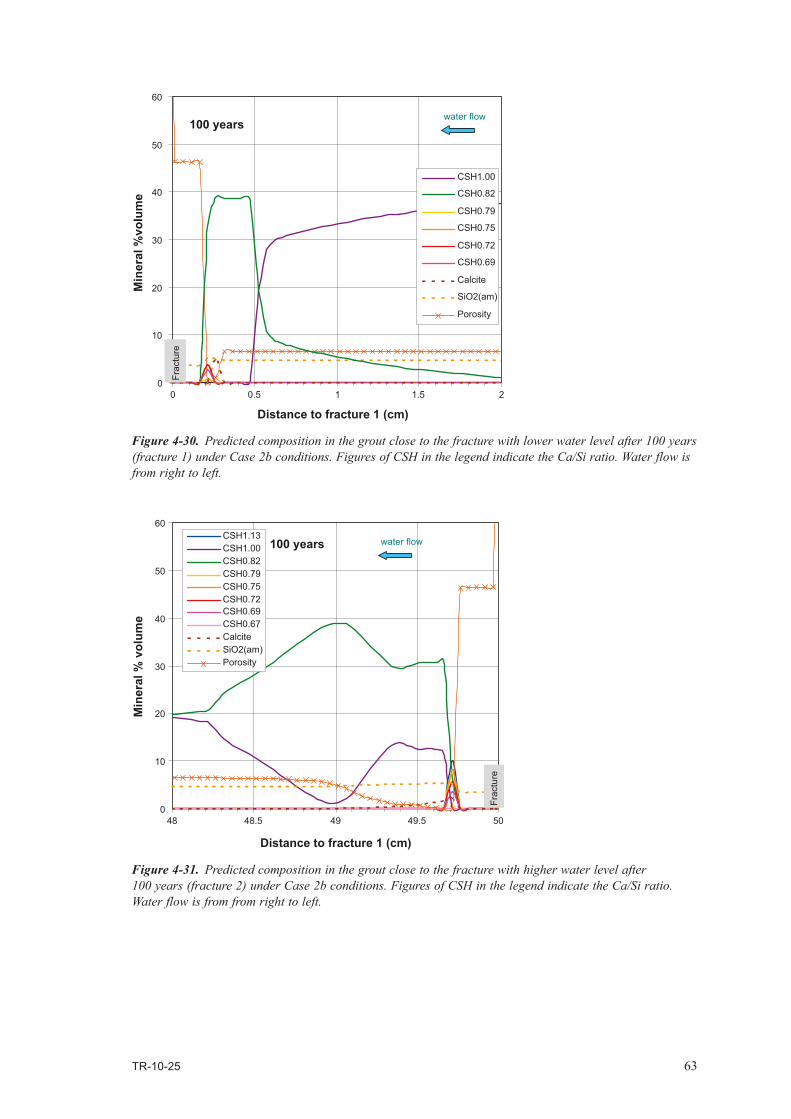
TR-10-25 63
Figure 4‑30. Predicted composition in the grout close to the fracture with lower water level after 100 years (fracture 1) under Case 2b conditions. Figures of CSH in the legend indicate the Ca/Si ratio. Water flow is from right to left.
Figure 4‑31. Predicted composition in the grout close to the fracture with higher water level after 100 years (fracture 2) under Case 2b conditions. Figures of CSH in the legend indicate the Ca/Si ratio. Water flow is from from right to left.
0
10
20
30
40
50
60
0 0.5 1 1.5 2
Distance to fracture 1 (cm)
Min
eral
%vo
lum
e
CSH1.00
CSH0.82
CSH0.79
CSH0.75
CSH0.72
CSH0.69
Calcite
SiO2(am)
Porosity
water flow100 years
Frac
ture
0
10
20
30
40
50
60
48 48.5 49 49.5 50
Distance to fracture 1 (cm)
Min
eral
% v
olum
e
CSH1.13CSH1.00CSH0.82CSH0.79CSH0.75CSH0.72CSH0.69CSH0.67CalciteSiO2(am)Porosity
Frac
ture
water flow100 years
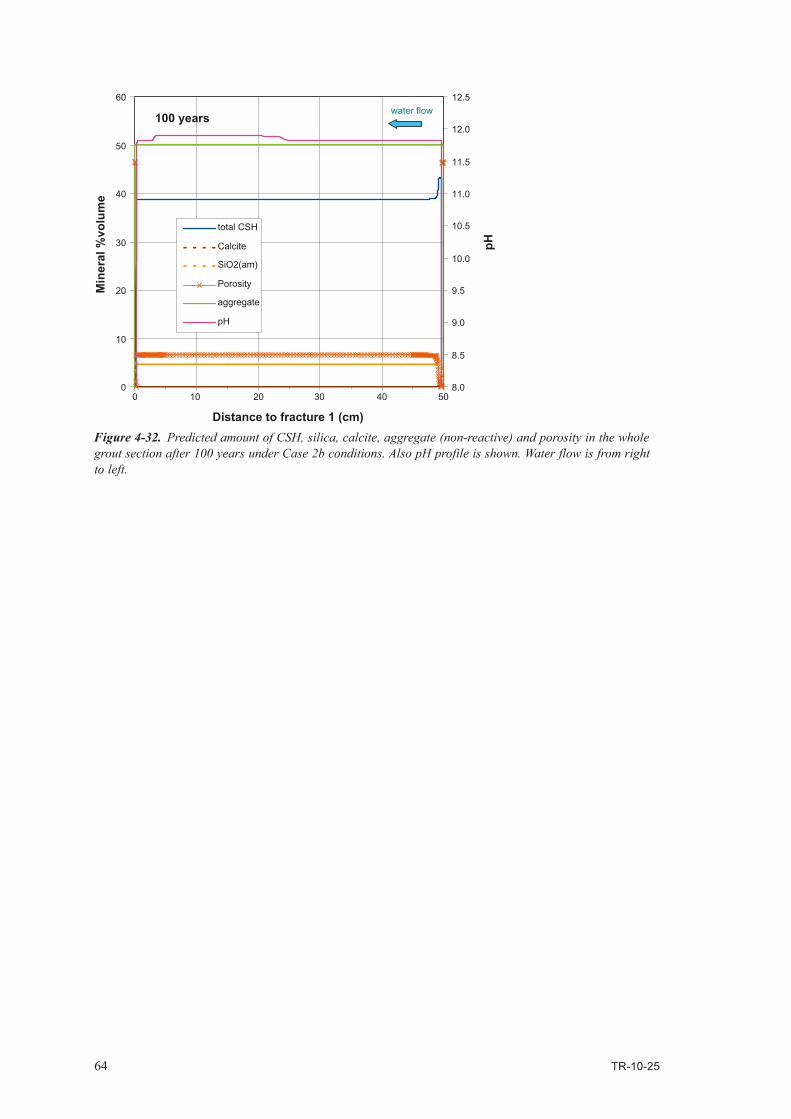
64 TR-10-25
Figure 4‑32. Predicted amount of CSH, silica, calcite, aggregate (non-reactive) and porosity in the whole grout section after 100 years under Case 2b conditions. Also pH profile is shown. Water flow is from right to left.
0
10
20
30
40
50
60
0
Distance to fracture 1 (cm)
Min
eral
%vo
lum
e
8.0
8.5
9.0
9.5
10.0
10.5
11.0
11.5
12.0
12.5
pH
total CSH
Calcite
SiO2(am)
Porosity
aggregate
pH
water flow100 years
5040302010

TR-10-25 65
5 General discussion and conclusions
The use of the aqueous solution – solid solution equilibrium theory has provided a new way to numerically model the geochemical processes occurring during the alteration of cementitious materials. This modelling presents the advantage to easily simulate the incongruent dissolution of the cement, in which Ca is preferentially solubilised with respect to Si. A number of approaches using solid solutions are available in literature but most can not be effectively implemented into the reactive transport codes existing today. In addition, many can not be used to model low-pH cements. In this work, two approaches /Sugiyama and Fujita 2006/ and /Carey and Lichtner 2007/ that include the same end-members (Ca(OH)2 and SiO2) are tested using the reactive transport code RCB /Saaltink et al. 1997/. The results of the modelling indicate that the approach by /Carey and Lichtner 2007/ is able to reproduce fairly well the coupled changes between pore water pH and Ca/Si ratio of the cement at Ca/Si>1, but fails at ratios lower than 1. Instead, the approach by /Sugiyama and Fujita 2006/, with slight modifications, provides model curves that fit quite well with the experimental data even at low Ca/Si ratios. Only, calcium concentration in pore water is not well reproduced. However, it is likely that Ca-rich phases such as carbonates could have been precipitated in many experiments and lowering the aqueous Ca concentration. Simulations considering the precipitation of calcite improve the results.
The approach by /Sugiyama and Fujita 2006/ is also valid to reproduce the experimental data of cement block leaching experiments performed by NUMO-CRIEPI /Yamamoto et al. 2007/. In this experiment, a small cement block is contacted with deionised water. Adjusting the initial values of parameters such as the porosity and the effective diffusion coefficient, the alteration pattern after one year of leaching is well predicted by the reactive transport model with RCB. In addition, the final porosity gain observed in the experiment agrees very well with model calculations. In this model exercise, however, many uncertainties still remain, such as the change in the molar volume of CSH gels as a function of their Ca-Si ratio and the kinetics of CSH dissolution-precipitation.
The prediction of grout durability under repository conditions needs model simulations at longer times (1,000 years). An additional concern is the formation of alkaline plumes that can destabilize the clay barriers in the near field system. All these issues are faced in the present work in 1D models in which water (and solute) is permanently flowing through fractures. Since the models span long simulation times, the effect of porosity changes on permeability of the media must be considered. That is the reason for the use of CRUNCH /Steefel 2008/ in these simulations.
Unlike the model reproduction of /Yamamoto et al. 2007/ experiments, in which cement was ordinary (“high pH”) concrete, the implementation of the geochemical approach using low pH grouts is conceptually more complex. This is because the co-existence of silica and CSH is not possible under equilibrium conditions; this means that no fluid is thermodynamically in equilibrium at the same time with a solid solution end-member (silica) and a intermediate member (CSH). This initial disequilibrium, however, is perfectly assumed in real grout conditions since kinetics prevents fast dissolution of silica fume.
The role of CSH gel replacement by other CSH with lower Ca-Si ratio favoured by silica dissolution leads to a progressive porosity clogging at long times (10–100 years) at the alteration fronts. This clogging is mainly caused by the large molar volume difference between silica and CSH, and forces a dramatic reduction of the rate and progress of the alteration. This is the key process that controls the predicted evolution of grout in the 1D models presented here. At this point, it is worth remembering that the simulations assume constant molar volume for all CSH. The validity of the model is, consequently, strongly linked to the acquisition of new experimental data concerning the molar volumes as a function of the Ca-Si ratio. Interestingly, at short times (~100 years), the solid solution approach yields similar results as a two-phase model (with CSH with Ca/Si=1.13 and 0.82). However, it is likely that this similarity is caused by the relative higher stability of the CSH082 compared with other low-pH CSH. The selection of other CSH would possibly lead to very different results.
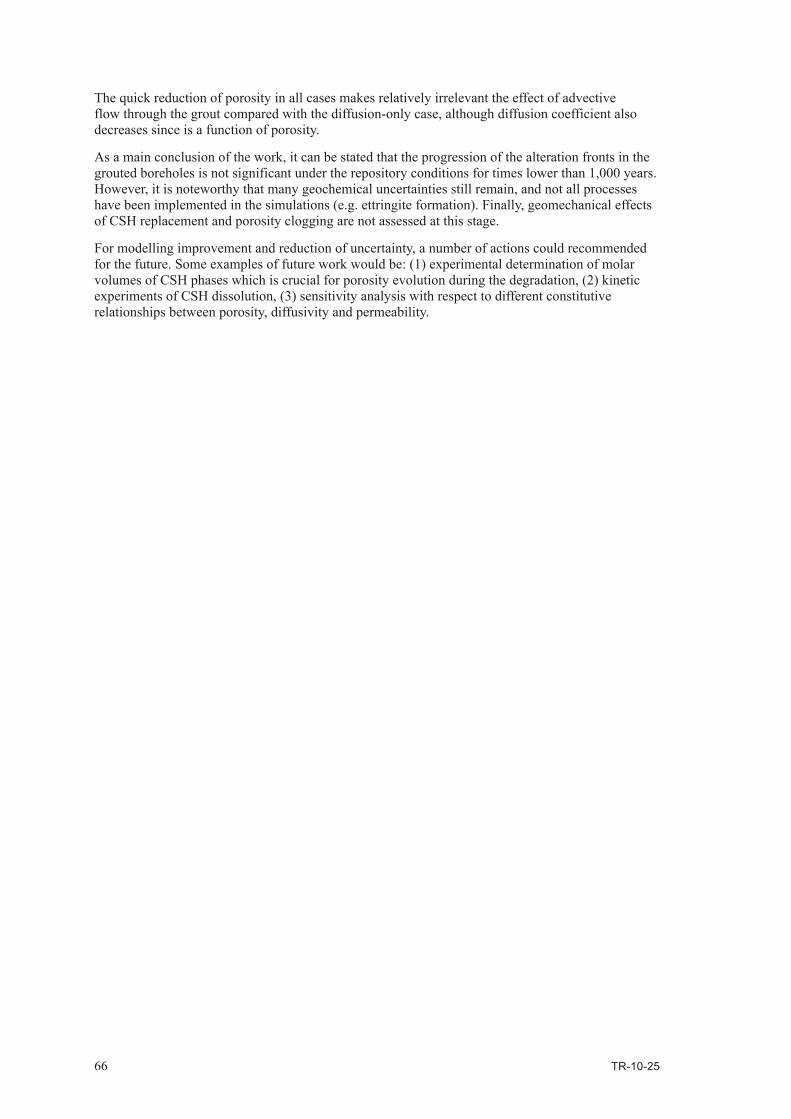
66 TR-10-25
The quick reduction of porosity in all cases makes relatively irrelevant the effect of advective flow through the grout compared with the diffusion-only case, although diffusion coefficient also decreases since is a function of porosity.
As a main conclusion of the work, it can be stated that the progression of the alteration fronts in the grouted boreholes is not significant under the repository conditions for times lower than 1,000 years. However, it is noteworthy that many geochemical uncertainties still remain, and not all processes have been implemented in the simulations (e.g. ettringite formation). Finally, geomechanical effects of CSH replacement and porosity clogging are not assessed at this stage.
For modelling improvement and reduction of uncertainty, a number of actions could recommended for the future. Some examples of future work would be: (1) experimental determination of molar volumes of CSH phases which is crucial for porosity evolution during the degradation, (2) kinetic experiments of CSH dissolution, (3) sensitivity analysis with respect to different constitutive relationships between porosity, diffusivity and permeability.
TR-10-25 67
References
SKB’s (Svensk Kärnbränslehantering AB) publications can be found at www.skb.se/publications.
Ayora C, Taberner C, Saaltink M W, Carrera J, 1998. The genesis of dedolomites: a discussion based on reactive transport modeling. Journal of Hydrology, 209, pp 346–365.
Ayora C, Soler J, Saaltink M W, Carrera J, 2007. Modelo de transporte reactivo sobre la lixiviación del hormigón por agua subterránea en la celda 16 de El Cabril. Enresa technical report 05/2007. Madrid.
Barbarulo R, Marchand J, Snyder K A, Prene S, 2000. Dimensional analysis of ionic transport problems in hydrated cement systems Part 1. Theoretical considerations, Cem. Concr. Res. 30 (2000) 1955–1960.
Benbow S, Walker C, Savage D, 2007. Intercomparison of cement solid-solution models issues affecting the geochemical evolution of repositories for radioactive waste. SKI Report 2007:29.
Bentz D P, Coveney P V, Garboczi E J, Kleyn M F, Stutzman P E, 1994. Cellular automaton simulations of cement hydration and microstructure development. Modeling and Simulation in Materials Science and Engineering, 2, pp 783–808.
Bentz D P, 1997. Three-dimensional computer simulation of cement hydration and microstructure development. Journal of the American Ceramic Society, 80(1), pp 3–21.
Bentz D P, Haecker C J, 1999. An argument for using coarse cements in high performance concretes. Cement and Concrete Research, 29, pp 615–618.
Bentz D P, Stutzman P E, 1999. SEM/X-ray imaging of cement-based materials, Proceedings of the 7th Euroseminar on Microscopy applied to building materials Pietersen H.S, Larbi J.A, Janssen H.H.A. Editors, pp 457–466.
Bentz D P, Garboczi E J, Haecker C J, Jensen O M, 1999. Effects of cement particle size distribu-tion on performance properties of cement-based materials. Cement and Concrete Research, 29, pp 1663–1671.
Bentz D P, Jensen O M, Hansen K K, Olesen J F, Stang H, Haecker C J, 2000. Influence of cement particle size distribution on early age autogenous strains and stresses in cement-based materials. Journal of the American Ceramic Society, 84 (1), pp 129–135.
Bentz D P, Conway J T, 2001. Computer modeling of the replacement of ‘coarse’ cement particles by inert fillers in low w/c ratio concretes: Hydration and strength, Cement and Concrete Research, 31, pp 503–506.
Berner U R, 1988. Modelling the incongruent dissolution of hydrated cement minerals. Radiochimica Acta, 44/45, pp 387–393.
Berner U R, 1992. Evolution of pore water chemistry during degradation of cement in a radioactive waste repository environment. Waste Management, 12, pp 201–219.
Bourbon X, 2003. Chemical conceptual model for cement based materials, mineral phases and thermodynamic data. ANDRA Report C.NT.ASCM.03.026.A. (As cited in: Gaucher et al. 2004, Modeling diffusion of an alkaline plume in a clay barrier. Applied Geochemistry, 19, 1505–1515).
Bullard J W, 2000. User’s Guide to the Virtual Cement and Concrete Testing Laboratory Version 1.1. Available online at http://www.fire.nist.gov/bfrlpubs/build00/PDF/b00110.pdf.
Börjesson S, Emrén A, Ekberg C, 1997. A thermodynamic model for the calcium silicate hydrate gel, modelled as a non-ideal binary solid solution. Cement and Concrete Research 27, pp 1649–1657.
Carey J W, Lichtner P C, 2007. Calcium Silicate Hydrate (C-S-H) Solid Solution Model Applied to Cement Degradation using the Continuum Reactive Transport Model FLOTRAN. In: Mobasher B and Skalny J, Eds, Transport Properties and Concrete Quality: Materials Science of Concrete, Special Volume, pp 73–106. American Ceramic Society.
68 TR-10-25
Chen J J, Thomas J J, Taylor H F W, Jennings H M, 2004. Solubility and structure of calcium silicate hydrate. Cement and Concrete Research, 34, pp 1499–1519.
Clodic L, Meike A, 1997. Thermodynamics of calcium silicate hydrates. Development of a database to model concrete dissolution at 25°C using the EQ3/6 geochemical modelling code. LLNL Report UCRL-ID-132088.
Cochepin B, Trotignon L, Bildstein O, Steefel C I, Lagneau V, Van der Lee J, 2008. Approaches to modelling coupled flow and reaction in a 2D cementation experiment. Advances in Water Resources, 31, pp 1540–1551.
Corbella M, Ayora C, Cardellach E, Soler A, 2006. Reactive transport modeling and hidrotermal karst genesis: The example of Rocabruna barite deposit (Eastern Pyrenees). Chemical Geology, 233, pp 113–125.
Duro L, Grivé M, Cera E, Domènech C, Bruno J, 2006. Update of a thermodynamic database for radionuclides to assist solubility limits calculation for performance assessment. SKB TR-06-17, Svensk Kärnbränslehantering AB.
Emmelin A, Brantberger M, Eriksson M, Gustafson G, Stille H, 2007. Rock grouting. Current competence and development for the final repository. SKB R-07-30, Svensk Kärnbränsle-hantering AB.
Flint E P, Wells L S, 1934. Study of the system CaO-SiO2-H2O at 30°C and of the reaction of water on the anhydrous calcium silicates. J. Res.Natl. Bur. Stand. 12, pp 751–783.
Friedman H, Amiri O, Aït-Mokhtar A, Dumargue P, 2004. A direct method for determining chlo-ride diffusion coefficient by using migration test. Cement and Concrete Research, 34, pp 1967–1973.
Fuji K, Kondo W, 1981. Heterogeneous equilibria of calcium silicate hydrate in water at 30°C. J. Chem. Soc. Dalton Trans. 2, pp 645–651.
Galíndez J M, Molinero J, 2009. Assessment of the long-term stability of cementitious barriers of radioactive waste repositories by using digital-image-based microstructure generation and reactive transport modeling. Cement and Concrete Research. doi:10.1016/j.cemconres.2009.11.006.
Glynn P D, 1990. Modeling solid-solution reactions in low temperature aqueous systems, Chemical modeling in aqueous systems II, Bassett R L and Melchior D C, Eds, vol. 416, pp 74–86, American Chemical Society.
Greenberg S A, Chang T N, 1965. Investigation of the colloidal hydrated calcium silicates: II. Solubility relationships in the calcium oxide-silica-water system at 25°C. J. Phys. Chem. 69, pp 182–188.
Harris AW, Manning MC, Tearle WM, Tweed CJ, 2002. Testing of models of the dissolution of cements-leaching of synthetic CSH gels. Cement and Concrete Research, 32, pp 731–746.
Hummel W, Berner U, Curti E, Pearson F J, Thoenen T, 2002. Nagra/PSI Chemical Thermodynamic Data Base 01/01. Universal Publishers. Florida, USA, 565 p.
Jennings H, 1986. Aqueous solubility relationships for two types of calcium silicate hydrates. American Ceramic Society Bulletin, 69, pp 614–618.
Kalousek G, 1952. Application of differential thermal analysis in a study of the system lime-silica-water, Third International Symposium on the Chemistry of Cement, Cement and Concrete Association, London, 1952.
Kersten M, 1996. Aqueous solubility diagrams for cementitious waste stabilization systems. 1. The C-S-H solid-solution system. Environmental Science an Technology 30, pp 2286–2293.
Kulik D A, Kersten M, 2001. Aqueous solubility diagrams for cementitious waste stabilization systems: II, end-member stoichiometries of ideal calcium silicate hydrate solid solutions. Journal of the American Ceramic Society 84, pp 3017–3026.
Lasaga A C, Soler J M, Ganor J, Burch T E, Nagy K L, 1994. Chemical weathering rate laws and global geochemical cycles. Geochimica et Cosmochimica Acta 58(10), pp 2361–2386.

TR-10-25 69
Lichtner P C, Carey J W, 2006. Incorporating solid solutions in reactive transport equations using a kinetic discrete-composition approach. Geochim. Cosmochim. Acta 70, pp 1356–1378.
Lippmann F, 1977. The solubility product of complex minerals, mixed crystals and three-layer clay minerals, Neues Jahrb. Mineral. Abh. 130, pp 243–263.
Lippmann F, 1980. Phase diagrams depicting aqueous solubility of binary mineral systems, Neues Jahrb. Mineral. Abh. 139 (1), pp 1–25.
Micryst database, 2009. WWW-MINCRYST, Crystallographic and Crystallochemical Database for Minerals and their Structural Analogues. Institute of Experimental Mineralogy, Russian Academy of Sciences. Available online at http://database.iem.ac.ru/mincryst/index.php.
Moranville M, Kamali S, Guillon E, 2004. Physicochemical equilibria of cement-based materials in aggressive environments – Experiment and modelling. Cement and Concrete Research, 34, pp 1569–1578.
Olivella S, Gens A, Carrera J, Alonso E E, 1996. Numerical simulator (CODE-BRIGHT) for the coupled analysis of saline media. Eng. Comput. 13, pp 87–112.
Parkhurst D L, Appelo C A J, 1999. User’s guide to PHREEQC (version 2) – a computer program for speciation, batch-reaction, one-dimensional transport, and inverse geochemical calculations. USGS, Water-Resources Investigations Report 99-04259.
Planel D, Sercombe J, Le Bescop P, Adenot F, Torrenti J M, 2006. Long-term performance of cement paste during combined calcium leaching-sulfate attack: kinetics and size effect. Cement and Concrete Research, 36, pp 137–143.
Rahman M M, Nagasaki S, Tanaka S, 1999. A model for dissolution of CaO-SiO2-H2O gel at Ca/Si>1. Cement and Concrete Research, 29, pp 1091–1097.
Saaltink M W, Benet I, Ayora C, 1997. RETRASO, Fortran Code for Solving 2D Reactive Transport of Solutes, User’s Guide. Departament de Enginyeria del Terreny, Universitat Politècnica de Catalunya and Institut de Ciències de la Terra Jaume Almera, CSIC, Barcelona.
Saaltink M, 1999. On the approaches for incorporating equilibrium and kinetic chemical reactions in transport model. PhD thesis. Universitat Politècnica de Catalunya.
Saaltink M W, Domènech C, Ayora C, Carrera J, 2002. Modelling the oxidation of sulphides in un unsaturated soil. In: Mine Water Hydrogeology and Geochemistry, Younger P L, Robins N S (eds), Geological Society, London, Special Publications, 198, pp 187–205.
Samper J, Juncosa R, Delgado J, Montenegro L, 2000. CORE2D. A code for non-isothermal water flow and reactive solute transport. Users manual version 2. ENRESA, Technical Report 6-2000, Madrid, Spain.
Sievänen U, Syrjänen P, Ranta-aho S, 2005. Injection grout for deep repositories – low-pH cemen-titious grout for larger fractures: field testing in Finland, pilot tests. Posiva working report 2004-47.
Simunek J, Suares DL, 1994. Two-dimensional transport model for variably saturated porous media with major ion chemistry. Water Resources Research, 30-4 pp 1115–1133.
SKB, 2006. Site descriptive modeling Forsmark.stage 2.1. SKB R-06-38, Svensk Kärnbränsle-hantering AB.
SKB, 2010. Design, production and initial state of the backfill and plug in deposition tunnels. SKB TR-10-16, Svensk Kärnbränslehantering AB.
Small J S, Thompson O R, 2009. Modelling the spatial and temporal evolution of pH in the cementitious backfill of a geological disposal facility, in Scientific Basis for Nuclear Waste Management XXXII, edited by Neil C. Hyatt, David A. Pickett, Raul B. Rebak (Mater. Res. Soc. Symp. Proc. Volume 1124, Warrendale, PA, 2009), 1124-Q05-06.
Steefel C I, Yabusaki S B, 1996. OS3D/GIMRT, Software for Multicomponent-Multidimensional Reactive Transport: User_s Manual and Programmer_s Guide. Pacific Northwest National Laboratory, Richland, Washington.
70 TR-10-25
Steefel I, 2008. CrunchFlow: Software for Modelling Multicomponent Reactive Flow and Transport. Earth Sciences Division. Lawrence Berkeley National Laboratory. Berkeley, CA 94720 USA.
Sugiyama D, Fujita T, 2006. A thermodynamic model of dissolution and precipitation of calcium silicate hydrates. Cement and Concrete Research, 36, pp 227–237.
Taylor H F W, 1950. Hydrated calcium silicates. Part I. Compound formation at ordinary tempera-ture, J. Chem. Soc. 726, pp 3682–3690.
Walker C S, Savage D, Tyrer M, Ragnarsdottir K V, 2007. Non-ideal solid solution aqueous solu-tion modeling of synthetic calcium silicate hydrate. Cement and Concrete Research, 37, pp 502–511.
Yamamoto T, Imoto H, Ueda H, Hironaga M, 2007. Leaching alteration of cementitious materials and release of organic additives. Proceedings of R&D on low pH cement for a geological repository, 3rd workshop, Paris June 13–14, 2007.

TR-10-25 71
Appendix 1
Abbreviations used in the textCEMMOD Cement modelling
CRIEPI Central Research Institute of Electric Power Industry
CSH Calcium silicate hydrate phases
EPMA Element concentration mapping
NUMO Nuclear waste organisation
OPC Ordinary Portland Cement