Embed Size (px)
Citation preview
Objectives
Estimate DB performance early What design/architecture decisions impact performance?Is the project/architecture feasible?
Production database performance tuning
Reduces guess work, but there are easier ways
Server Performance CharacteristicsProcessor Architecture:
Pentium III – Xeon – Itanium 2– OpteronSystem Architecture: 2, 4, 8, 16-way etc
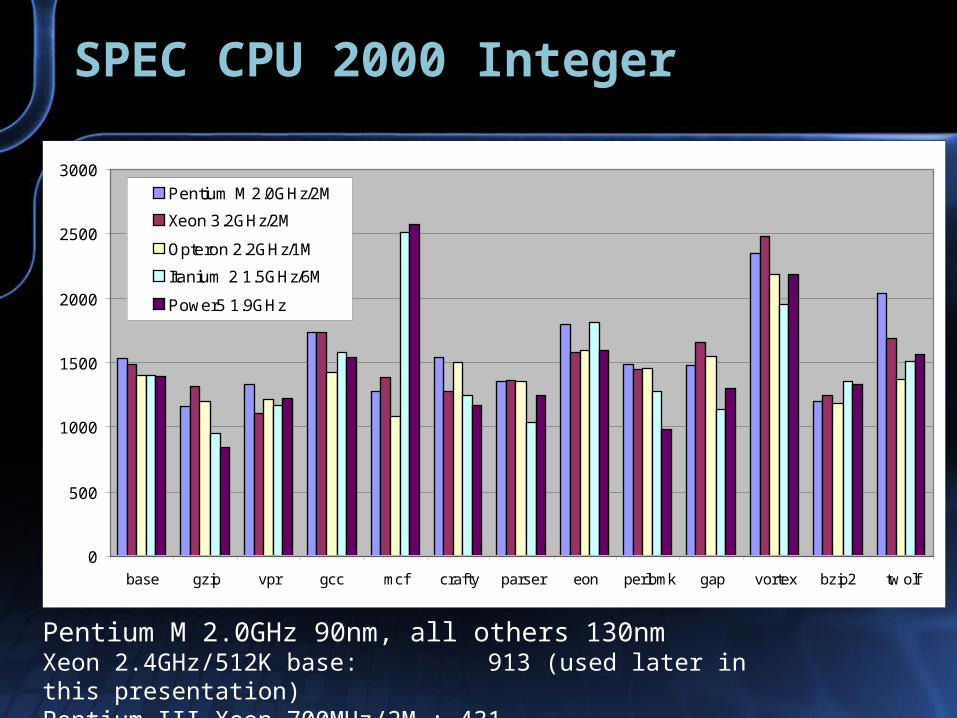
SPEC CPU 2000 Integer
Pentium M 2.0GHz 90nm, all others 130nmXeon 2.4GHz/512K base: 913 (used later in this presentation)Pentium III Xeon 700MHz/2M : 431
0
500
1000
1500
2000
2500
3000
base gzip vpr gcc mcf crafty parser eon perlbmk gap vortex bzip2 tw olf
Pentium M 2.0GHz/2M
Xeon 3.2GHz/2M
Opteron 2.2GHz/1M
Itanium 2 1.5GHz/6M
Power5 1.9GHz

TPC-C Performance – SQL Server
# CPUs System tpm-C $/tpm-C Mem(GB) # Disks
1 HP (3.2GHz/2M) 35,030 $1.88 12 43+4
2 HP (3.2GHz/2M) 60,364 $3.51 12 280+10
4 IBM x365 102,667 $3.52 32 266
8 IBM x445 156,195 $4.31 64 616
16 Unisys ES7000 237,869 $5.08 64 700+10
32 Unisys ES7000 304,148 $6.18 64 1092+12
# CPUs System tpm-C $/tpm-C Mem(GB) # Disks
4 HP DL585 115,110 2.62 32 295+8
Xeon 3.2GHz/2M & Xeon MP 3.0GHz/4M
Opteron 2.2GHz/1M
IA-32 limited max memory (64GB), AWE overhead , bus architecture

Itanium 2 (SQL Server) vs IBM Power 5
# CPUs System tpm-C $/tpm-C Mem(GB) # Disks
4 Pwr5 570 /Oracle 194,391 $5.62 128 432+16
8 Pwr5 570 /UDB 429,900 $4.99 256 880+40
16 Pwr5 570 /UDB 809,144 $4.95 512 1600+40
32 Pwr5 695 /Oracle 1,601,785 $5.27 1024 3200+96
64 Pwr5 695 /UDB 3,210,540 $5.19 2048 6400+140
IBM Power 4+/5 1.9GHz
# CPUs System tpm-C $/tpm-C Mem(GB) # Disks
4 HP rx5670 121,065 $4.49 64 448+20
8 Bull 175,366 $4.54 128 225
16 Unisys ES7000 309,037 $4.49 128 770+24
32 NEC Express 577,531 $7.74 512 1150
64 HP Superdome 786,646 $6.49 512 1792+60
Itanium 2 1.5GHz/6M

Scaling
Pn / P1 = S ** log2(n)
Pn Performance with n processors P1 Perf. with 1 processorS Scale Factor n Number of processors
0
4
8
12
16
20
24
28
32
36
2 4 8 16 32 64
Processors
Sca
lin
gS=1.5
S=1.6
S=1.7
S=1.8
Linear

Unit of Measure – CPU-Cycles
Query costs measured in CPU-cyclesAlternative: CPU-sec
Cost = Runtime (sec) × CPU Util. × Available CPU-cycles ÷ Iterations
Available CPU-cycles = Number of CPUs × FrequencyExample 4 x 700MHz = 2.8B cycles/sec
CPU-cycles does not imply CPU instructions, Unit of time same as CPU clock
1GHz CPU: time unit = 1ns2GHz CPU: time unit = 0.5ns
All tests on Windows 2000/2003, SQL Server 2000 SP1-3

CPU-Cycles dependencies
CPU-cycles on one processor architecture has no relation to another – ex. Pentium III, Pentium 4, Itanium, Opteron
Some platform dependencies – cache size, bus speed, SMP
Notes: Some platform dependencies – cache size, bus speed, SMP
Processor System/Cache/Mem
Performance Cost / trans.
Itanium 2 4 x 1.5GHz/6M /64G
121,065 2.974M
Xeon 4 x 3.0GHz/4M /32G
102,667 7.013M
Opteron 4 x 2.2GHz/1M /32G
105,687 4.996M

Cost Structure - Model
Stored Procedure Call Cost = RPC cost (once per procedure)+ Type cost (once per procedure?)+ Query costs (one or more per
procedure)
Query – one or more components
Component Cost = Cost for component operation base
+ Cost per additional row or page
Only stored procedures are examined

RPC Cost
Cost of RPC to SQL Server includes:1) Network roundtrip2) SQL Server handling costs
Calls to SQL Server are made with RPC (not SQL Batch)Profiler -> Event Class: RPC
ADO.NET Command Type Stored Procedure or Text with parametersCommand Text without parameters: SQL Batch

Type Cost?
Blank Procedure: ~250,000 CPU-cyclesCREATE PROC p_ProcBlank ASRETURN
Proc with Single Query ~320K CPU-cyclesCREATE PROC p_ProcSingleQuery ASSELECT … FROM TableA WHERE ID = @ID
Proc with Two Queries ~360K CPU-cyclesCREATE PROC p_ProcTwoQueries ASSELECT … FROM TableA WHERE ID = @IDSELECT … FROM TableB WHERE ID = @ID
RPC Cost ~250K CPU-cycles,Type Cost ~30K CPU-cycles, Query Cost ~40K CPU-cycles

Blank RPC Performance
All systems with 2 processors, Xeon 3.2GHz with 800MHz busRPC’s are expensive relative to simple query
0
5,000
10,000
15,000
20,000
25,000
30,000
Pent III900M/2M
Xeon3.06G/512K
Xeon3.06G/512
w/HT
Xeon3.20G/1M
800
Xeon3.20G/1M
w/HT
Itanium 21.50G/6M
Opteron2.20G/1M
RP
C/s
ec
120K
270K240K
260K
195K
154K
140K
Costs in CPU-Cycles

RPC Cost
Processor PIII PIII X Xeon Opteron Itanium 2* It2
CPUs 2 4 2 2 2 4 8
RPC cost 140K 200K 250 140K 155K 290K 350K270K (2.xx driver)
Type Cost Select 20-30K ~5K 35-55K ~20K ~8K
Systems: Pentium III 2x 600MHz/256K, 2x 733MHz/256K, PIII Xeon 2x 500MHz/2M, 4x 700MHz/2M, 4x900/2M Xeon (P4) 2x 2.0GHz/512K 2x 2.4GHz/512K Opteron 2x 2.2GHz/1M Itanium 2 2x 900MHz/1.5M 8x1.5GHz/6M
OS: W2K, W2K3, various spSQL Server 2000, various spPIII: Intel PRO/100+, Others: Broadcom Gigabit Ethernet driver 5.xx+
*Itanium 2 system booted with 2, 4 or 8 processors(4P config may have had procs from more than 1 cell)
Costs in CPU-Cycles
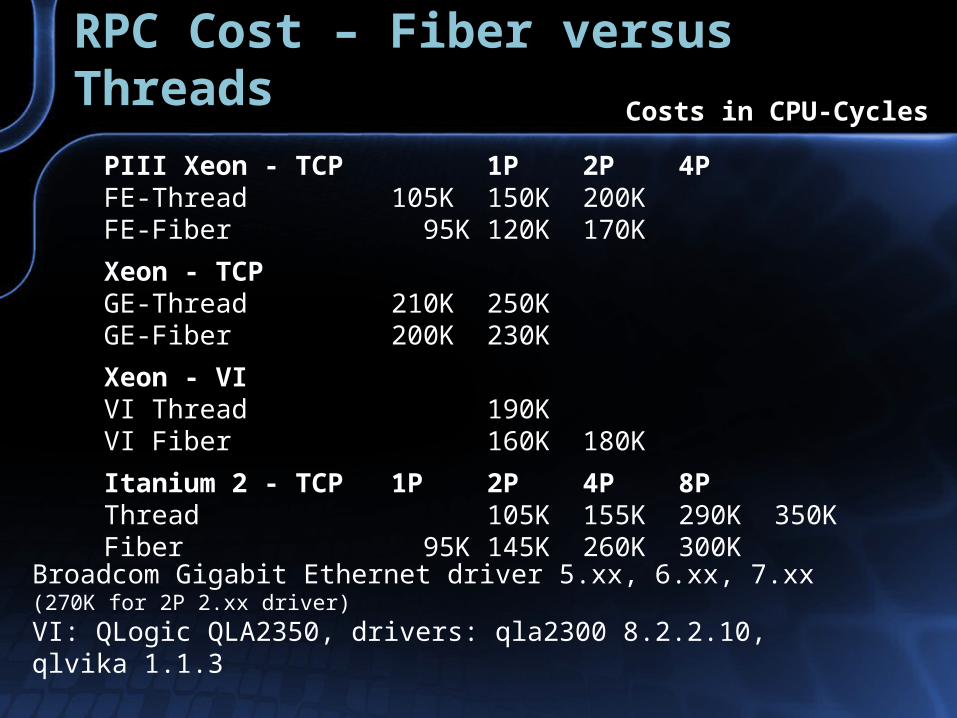
RPC Cost – Fiber versus Threads
PIII Xeon - TCP 1P 2P 4PFE-Thread 105K 150K 200KFE-Fiber 95K 120K 170K
Xeon - TCPGE-Thread 210K 250KGE-Fiber 200K 230K
Xeon - VIVI Thread 190KVI Fiber 160K 180K
Itanium 2 - TCP 1P 2P 4P 8PThread 105K 155K 290K 350KFiber 95K 145K 260K 300K
Costs in CPU-Cycles
Broadcom Gigabit Ethernet driver 5.xx, 6.xx, 7.xx (270K for 2P 2.xx driver)
VI: QLogic QLA2350, drivers: qla2300 8.2.2.10, qlvika 1.1.3

RPC Cost TCP vs Named Pipes
PIII Xeon 4P TCP named pipesFE-Thread 200K 315KFE-Fiber 170K 370K
Xeon, Thread 1P 2PGE, TCP 210K 250KGE, Named Pipes 320K 360K
Broadcom Gigabit Ethernet driver 5.xx, 6.xx, 7.xx (270K for 2P 2.xx driver)
VI: QLogic QLA2350, drivers: qla2300 8.2.2.10, qlvika 1.1.3
Costs in CPU-Cycles
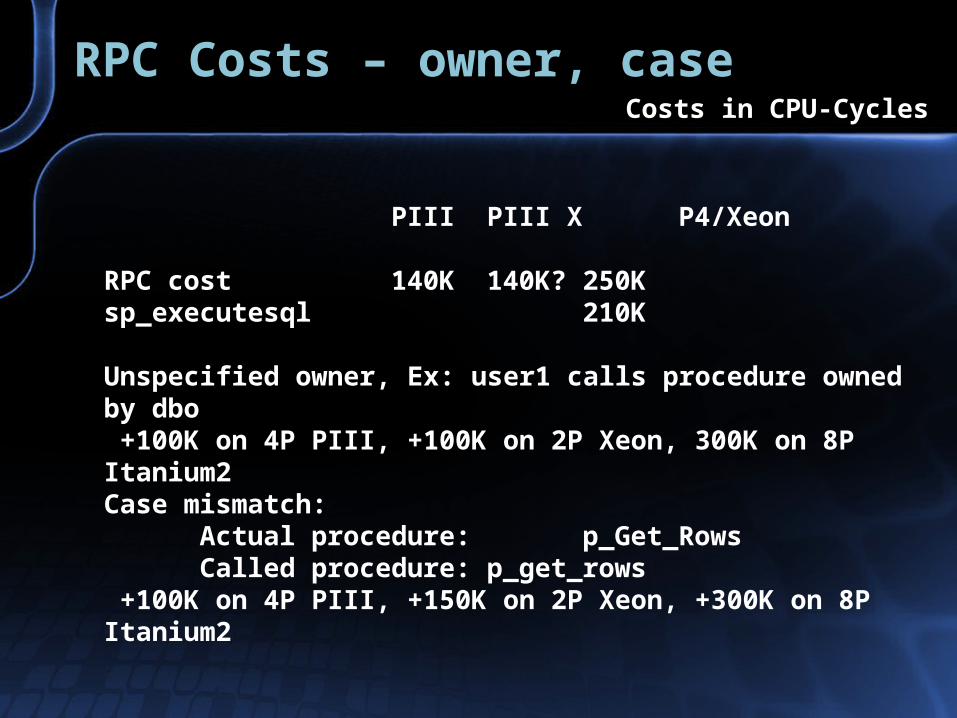
RPC Costs – owner, case
PIII PIII X P4/Xeon
RPC cost 140K 140K? 250Ksp_executesql 210K
Unspecified owner, Ex: user1 calls procedure owned by dbo +100K on 4P PIII, +100K on 2P Xeon, 300K on 8P Itanium2Case mismatch:
Actual procedure: p_Get_RowsCalled procedure: p_get_rows
+100K on 4P PIII, +150K on 2P Xeon, +300K on 8P Itanium2
Costs in CPU-Cycles

Single Row Select Costs
Clustered Index SeekDoes cost depend on index depth?
Role of I/O count in cost
Index Seek with Bookmark LookupDoes cost depend on table type?
Heap versus clustered index
Table Scan

Single Row Index Seek vs Index Depth
010,000
20,00030,000
40,00050,000
60,00070,000
80,00090,000
100,000110,000
0 2 4 6 8 10SELECT's per Stored Procedure
CP
U-c
ycle
s p
er S
EL
EC
T
Cl 50K Cl 200K Cl 500K
NH 50K NH 200K NH 500KNC 50K NC 200K NC 500K
Index depth: 50K rows -2 both, 200K 3-Cl, 2-NC, 500K 3 Pentium III 2x733
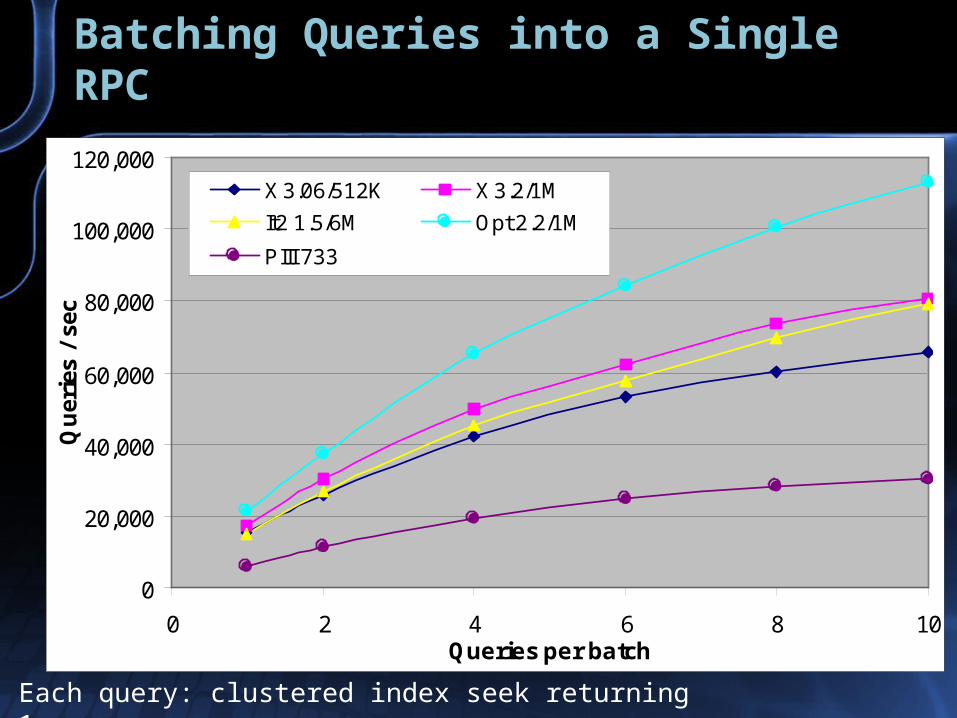
Batching Queries into a Single RPC
Each query: clustered index seek returning 1 row
0
20,000
40,000
60,000
80,000
100,000
120,000
0 2 4 6 8 10Queries per batch
Qu
erie
s /
sec
X 3.06/512K X 3.2/1M
It2 1.5/6M Opt 2.2/1M
PIII 733

Single Row Cost Summary
Index depthPlan – no, True cost -yes
Cost versus index depth not fully examined
Fill factor dependence not tested
Bookmark Lookup – Table typePlan cost -no
True cost higher for clustered index than heap

Multi-row Select Queries
Queries return aggregate- Not a test of network bandwidthSingle Table Example SELECT @Count = count(*), @Value1 = AVG(randDecimal) FROM M3C_01 WHERE GroupID = @ID
1 Count, 1 AVG on 5 byte decimal
Join ExampleSELECT count(*), AVG(m.randDecimal), min(n.randDecimal) FROM M2A_02 m INNER LOOP JOIN M2B_02 n ON n.ID = m.IDWHERE m.GroupID = @ID AND n.GroupID = @ID
1 Count, 2 AVG on 5 byte decimal
Table Scan tests return either- a single row- 1 Count, 1 aggregate on 5 byte decimal
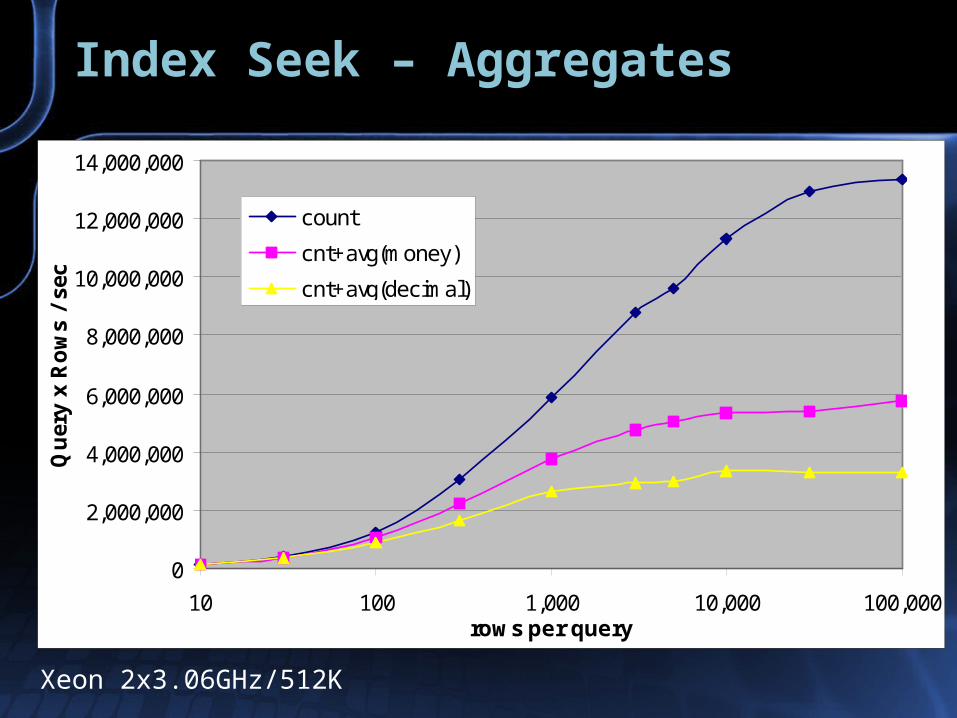
Index Seek – Aggregates
Xeon 2x3.06GHz/512K
0
2,000,000
4,000,000
6,000,000
8,000,000
10,000,000
12,000,000
14,000,000
10 100 1,000 10,000 100,000rows per query
Qu
ery
x R
ow
s /
sec
count
cnt+avg(money)
cnt+avg(decimal)

0
100,000
200,000
300,000
400,000
500,000
600,000
700,000
800,000
900,000
1,000,000
10 100 1,000 10,000rows per query
Qu
ery
x R
ow
s /
sec
Seq Heap Dist Heap Seq Cl IX Dist Cl IX
Seq Hp PL Dist Hp PL Seq Cl PL Dist Cl PL
Multi-row Bookmark Lookups
Table lock escalation at >5K rows ?
2x2.2GHz/1M Opteron
1 Count, 1 AVG on decimal
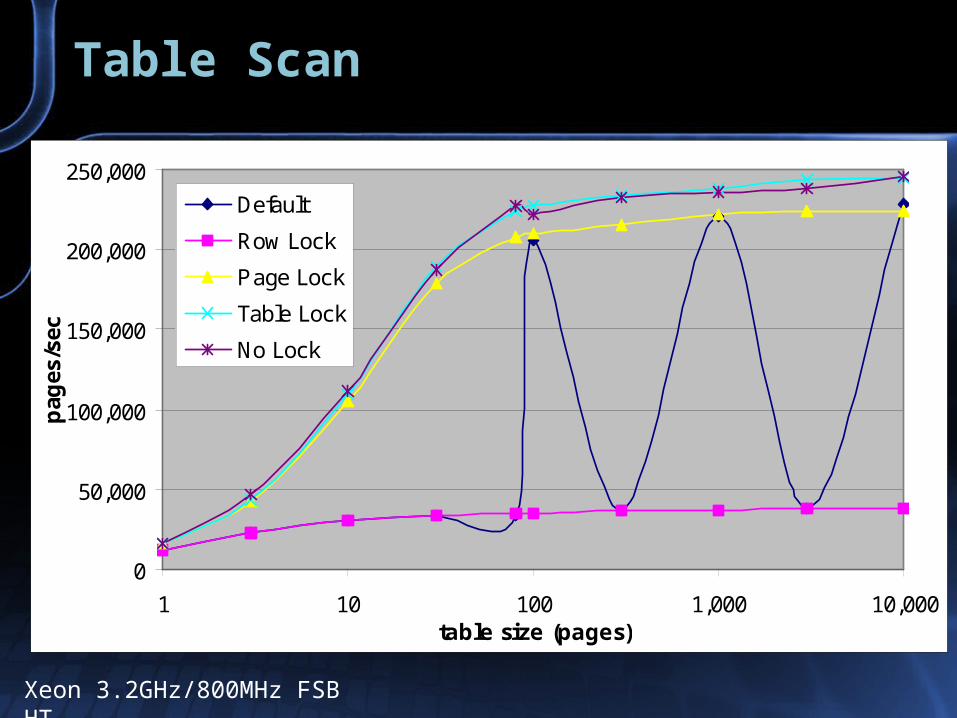
Table Scan
0
50,000
100,000
150,000
200,000
250,000
1 10 100 1,000 10,000table size (pages)
pag
es/s
ec
Default
Row Lock
Page Lock
Table Lock
No Lock
Xeon 3.2GHz/800MHz FSB HT

Table Scan – Component Cost
Total cost = RPC + Type + Base + per page costsPIII (X) P4/Xeon Opteron It2 2P 8P
Type + Base cost 60K/40K 145K 35K 90K
Cost per page: NOLOCK: 24K - 16K 23-35KTABLOCK: 24K 25K 16KPAGLOCK: 26K 26K 20K 17K 23-35KROWLOCK: 140K 250K 110K 100K 150K
Table Scan or Index Scan – Plan Formula
I/O: 0.0375785 + 0.0007407 per pageCPU: 0.0000785 + 0.0000011 per row
Measured Table Scan cost formulas for 99 rows per page
Costs in CPU-Cycles per page

Table Scan Cost per Page
0
1
2
3
4
5
6
7
1 10 100 1000Table size (pages)
No
rmal
ized
co
st p
er p
age
Default Row LockPage Lock Table LockNo Lock Plan
2x733MHz/256KB Pentium III

Bookmark – Table Scan Cross-over
1
10
100
1,000
10 100 1000 10000rows
No
rmal
ized
Co
st
Bk on ClusterBk on HeapTable ScanClust. IndexPlan Cost, BkPlan Cost, ScanPlan, Clust. IX
Plan Costs: ≤1GB 2x733MHz/256K Pentium III

Loop, Hash and Merge Join
Loop joins: Case 1, 2, 3 etc
Hash joins: in-memory versus others
Merge: regular versus many-to-many
Merge join with sort operations
Locks – page lock
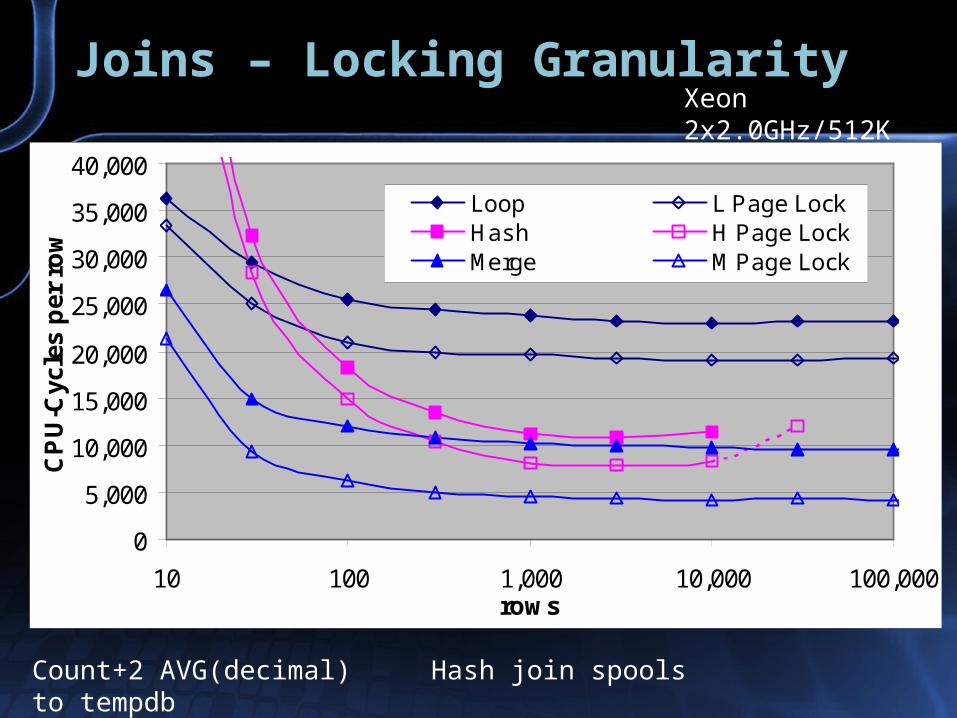
Joins – Locking GranularityXeon 2x2.0GHz/512K
Count+2 AVG(decimal) Hash join spools to tempdb
0
5,000
10,000
15,000
20,000
25,000
30,000
35,000
40,000
10 100 1,000 10,000 100,000rows
CP
U-C
ycle
s p
er r
ow
Loop L Page LockHash H Page LockMerge M Page Lock

Loop, Hash & Merge Joins
Xeon 2x3.06GHz/512K (Count)
100,000
1,000,000
10,000,000
10 100 1,000 10,000 100,000rows per query
Qu
ery
x R
ow
s /
sec
Loop Loop PLHash Hash PLMerge Merge PL
Processor Architecture
Pentium III, Xeon Opteron, Itanium 2

Index Seek
COUNT(*) + AVG(Decimal)
0
500,000
1,000,000
1,500,000
2,000,000
2,500,000
3,000,000
3,500,000
4,000,000
4,500,000
10 100 1,000 10,000 100,000rows per query
Qu
ery
x R
ow
s /
sec
Xeon 3.06/512K
Xeon 3.2 w/HT
Itanium 2
Opteron 2.2

Bookmark Lookup
Heap, Page Lock, sequential rows 1 Count, 1 AVG on decimal
0
100,000
200,000
300,000
400,000
500,000
600,000
700,000
800,000
900,000
1,000,000
10 100 1,000 10,000rows per query
Qu
ery
x R
ow
s /
sec
PIII 900/2M
Xeon 2.4
Itanium 2
Opteron 2.2
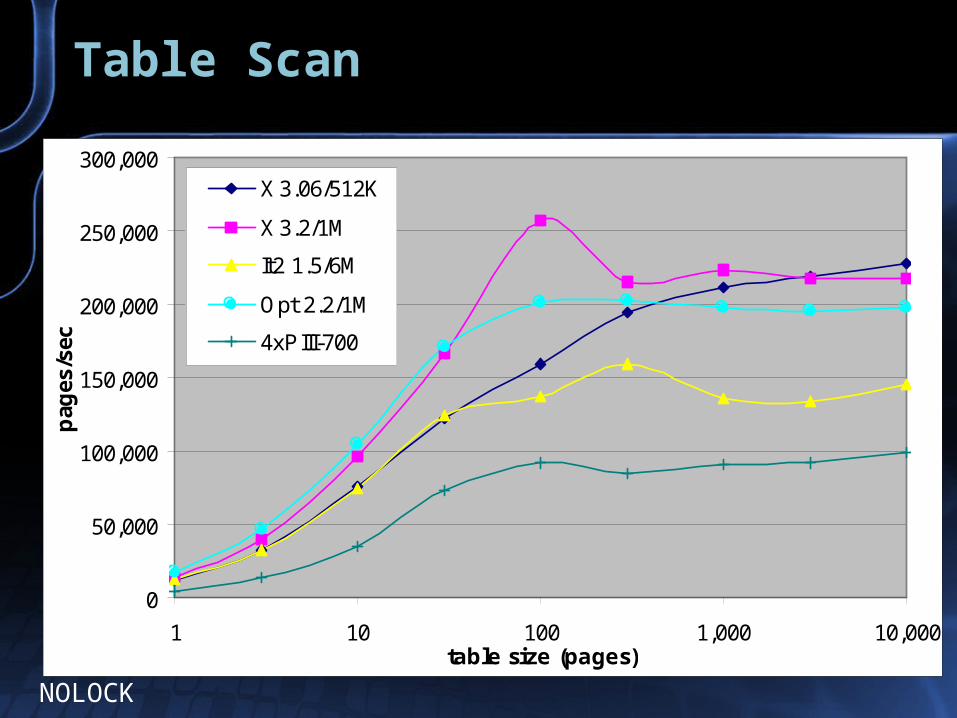
Table Scan
NOLOCK
0
50,000
100,000
150,000
200,000
250,000
300,000
1 10 100 1,000 10,000table size (pages)
pag
es/s
ec
X 3.06/512K
X 3.2/1M
It2 1.5/6M
Opt 2.2/1M
4xPIII-700
Hyper-Threading
Xeon 3.06GHz/512K (130nm) vs.
Xeon 3.2GHz/1M & 800MHz FSB (90nm)
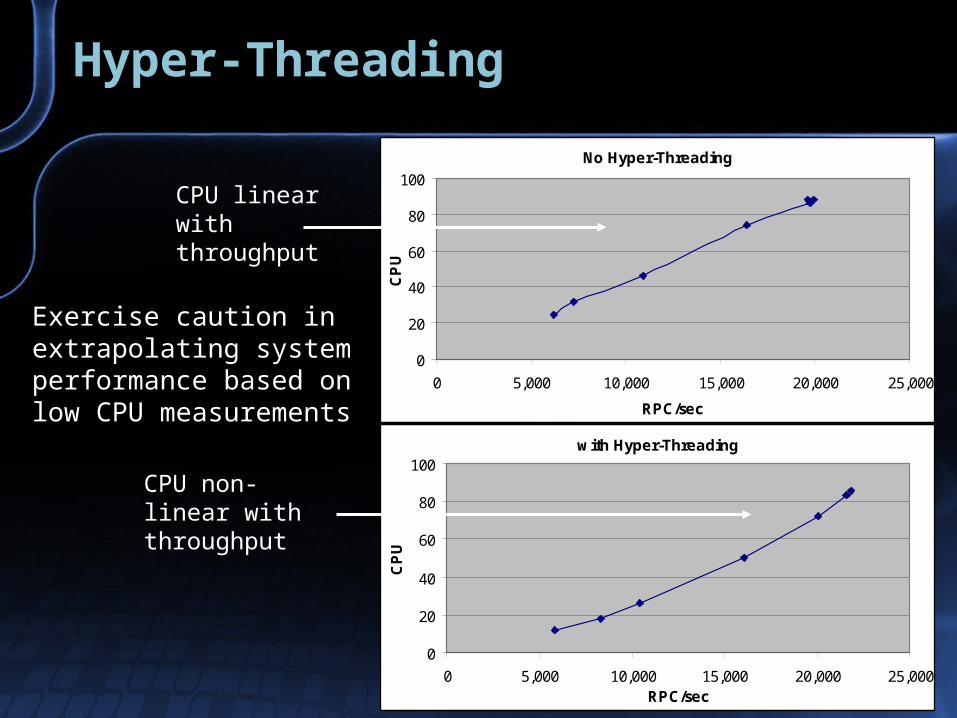
Hyper-Threading
No Hyper-Threading
0
20
40
60
80
100
0 5,000 10,000 15,000 20,000 25,000
RPC/secC
PU
with Hyper-Threading
0
20
40
60
80
100
0 5,000 10,000 15,000 20,000 25,000RPC/sec
CP
U
CPU linear with throughput
CPU non-linear with throughput
Exercise caution in extrapolating system performance based on low CPU measurements
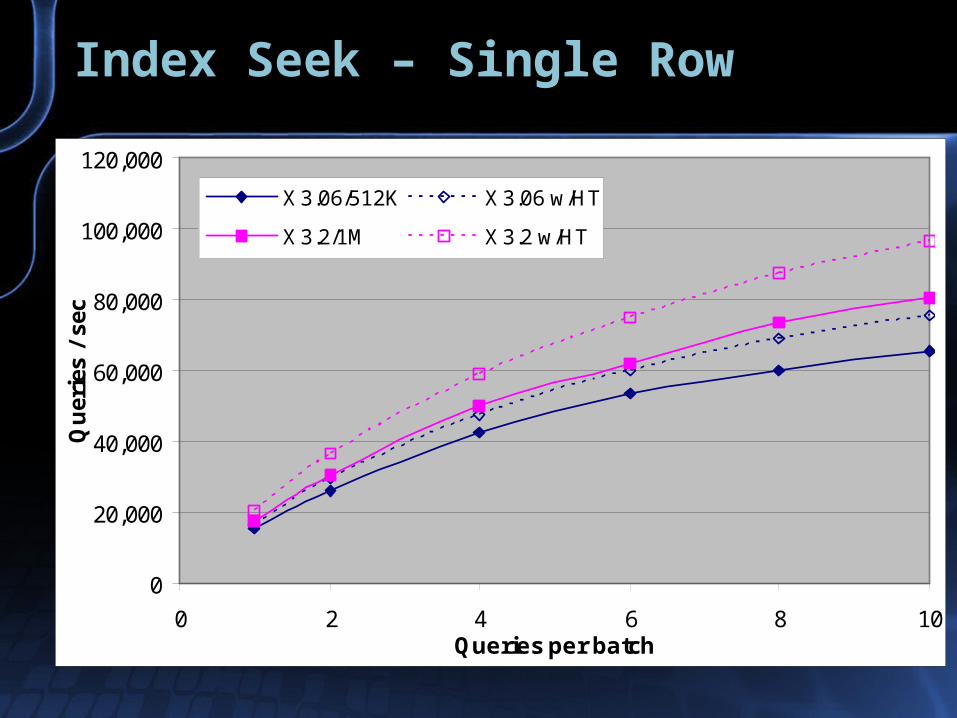
Index Seek – Single Row
0
20,000
40,000
60,000
80,000
100,000
120,000
0 2 4 6 8 10Queries per batch
Qu
erie
s /
sec
X 3.06/512K X 3.06 w/HT
X 3.2/1M X 3.2 w/HT

Index Seek - Multiple Rows
0
2,000,000
4,000,000
6,000,000
8,000,000
10,000,000
12,000,000
14,000,000
16,000,000
10 100 1,000 10,000 100,000rows per query
Qu
ery
x R
ow
s /s
ec
Xeon 3.06/512K
Xeon 3.06 w/HT
Xeon 3.2/1M
Xeon 3.2 w/HT

Table Scan - NOLOCK
0
50,000
100,000
150,000
200,000
250,000
300,000
1 10 100 1,000 10,000table size (pages)
pag
es/s
ec
X 3.06/512K X 3.06 w/HT
X 3.2/1M X 3.2 w/HT
Xeon, Xeon/800 NOLOCK

Bookmark Lookup – Cl. IX, Seq, PL
1 Count, Clustered Index, Sequential rows, Page Lock
0
100,000
200,000
300,000
400,000
500,000
600,000
10 100 1,000 10,000 100,000
rows per query
qu
ery
x r
ow
s /
se
c
Xeon 3.06/512K Xeon 3.06 w/HT
Xeon 3.2/1M Xeon 3.2 w/HT

Bookmark Lookup – Heap, Seq, PL
1 Count, Heap, Sequential rows, Page Lock
0
100,000
200,000
300,000
400,000
500,000
600,000
700,000
800,000
900,000
1,000,000
10 100 1,000 10,000 100,000rows per query
Qu
ery
x R
ow
s /
sec
Xeon 3.06/512K Xeon 3.06 w/HT
Xeon 3.2/1M Xeon 3.2 w/HT
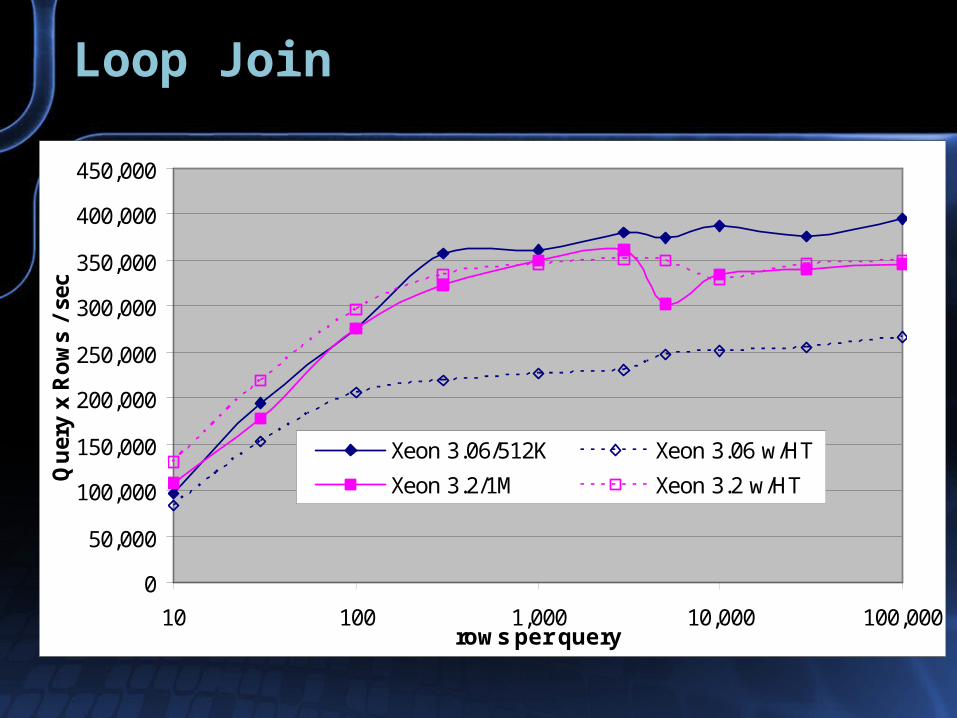
Loop Join
0
50,000
100,000
150,000
200,000
250,000
300,000
350,000
400,000
450,000
10 100 1,000 10,000 100,000rows per query
Qu
ery
x R
ow
s /
sec
Xeon 3.06/512K Xeon 3.06 w/HT
Xeon 3.2/1M Xeon 3.2 w/HT

Hash Join
0
200,000
400,000
600,000
800,000
1,000,000
1,200,000
1,400,000
10 100 1,000 10,000 100,000rows per query
Qu
ery
x R
ow
s /
sec
Xeon 3.06/512K Xeon 3.06 w/HT
Xeon 3.2/1M Xeon 3.2 w/HT
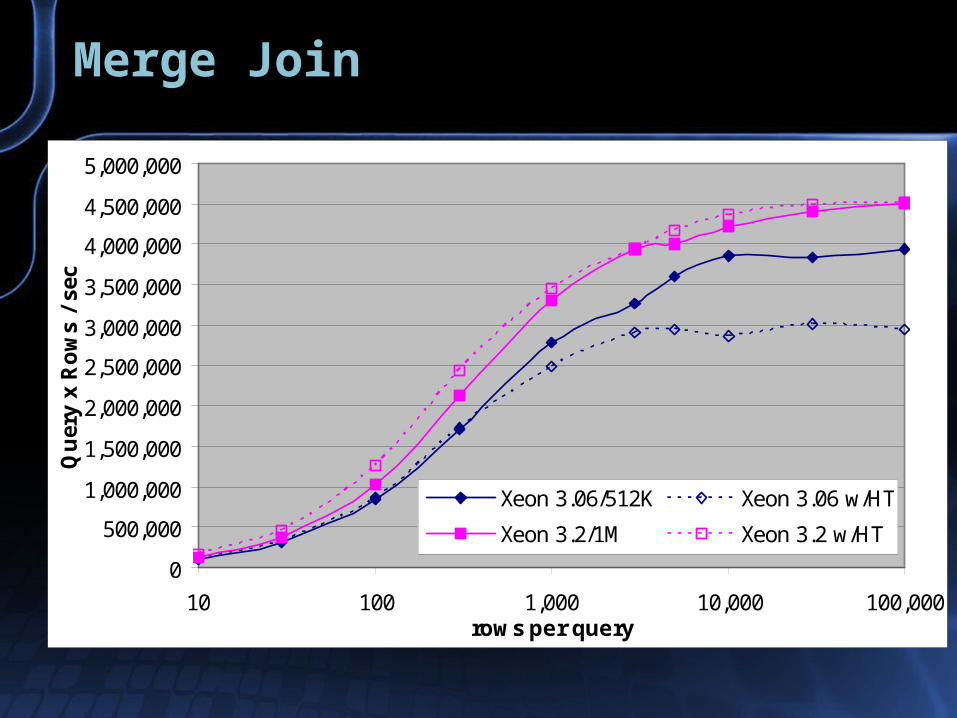
Merge Join
0
500,000
1,000,000
1,500,000
2,000,000
2,500,000
3,000,000
3,500,000
4,000,000
4,500,000
5,000,000
10 100 1,000 10,000 100,000rows per query
Qu
ery
x R
ow
s /
sec
Xeon 3.06/512K Xeon 3.06 w/HT
Xeon 3.2/1M Xeon 3.2 w/HT

Hyper-Threading Summary
Lower cost RPCImproves performance of low cost queries
May improve performance on some ops
Degrades performance on others
Xeon 800MHz FSB with 90nm core better than 130nm

Scaling
Itanium 2, 1.5GHz/6M, 1, 2, 4, 8, 16 CPUs

Scaling
First System: HP rx76208-way Itanium 2 1.5GHz/6MBoot with /NUMPROC = xxQuery: Count + 1 or 2 AVG(Decimal)
Second System: Unisys ES7000 Aries 42016-way Itanium 2 1.5GHz/6MBooted with all 16 CPUs, Affinity Mask = 1, 2, …Query: Count onlySQL Server 2000, Service Pack 3 (build 760)
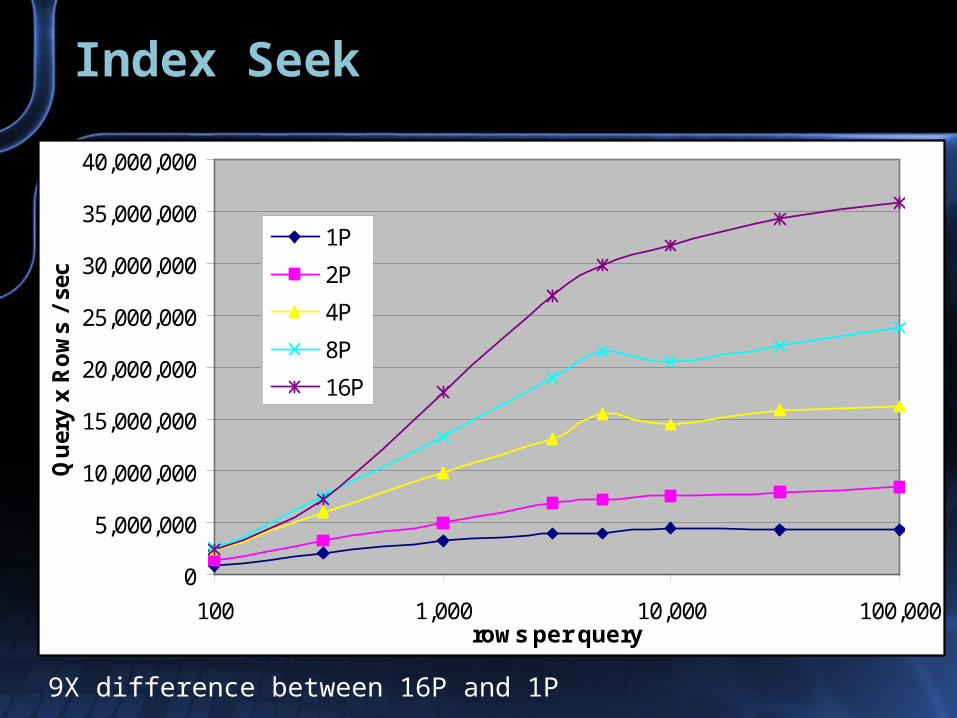
Index Seek
9X difference between 16P and 1P
0
5,000,000
10,000,000
15,000,000
20,000,000
25,000,000
30,000,000
35,000,000
40,000,000
100 1,000 10,000 100,000rows per query
Qu
ery
x R
ow
s /
sec
1P
2P
4P
8P
16P

Bookmark Lookup 1-way
Minor differences between Table org & lock granularity
0
50,000
100,000
150,000
200,000
250,000
300,000
100 1,000 10,000 100,000rows per query
Qu
ery
x R
ow
s /
sec
Seq Heap PL
Seq Heap
Seq Cl PL
Seq Clustered

Bookmark Lookup – 16 way
Major differences! 100X !!
10,000
100,000
1,000,000
10,000,000
10 100 1,000 10,000 100,000rows per query
Qu
ery
x R
ow
s /
sec
Seq Heap PL
Seq Heap
Seq Cl PL
Seq Clustered

Bookmark Lookup – Clustered Index
Really bad news beyond 2P, especially bad ~5K rows
0
50,000
100,000
150,000
200,000
250,000
300,000
350,000
100 1,000 10,000 100,000rows per query
Qu
ery
x R
ow
s /
sec
1P 2P 4P8P 16P

Bookmark Lookup – Cl. IX, PL
No scaling beyond 2P, but no disaster at 5K rows
0
50,000
100,000
150,000
200,000
250,000
300,000
350,000
100 1,000 10,000 100,000rows per query
Qu
ery
x R
ow
s /
sec
1P 2P 4P
8P 16P
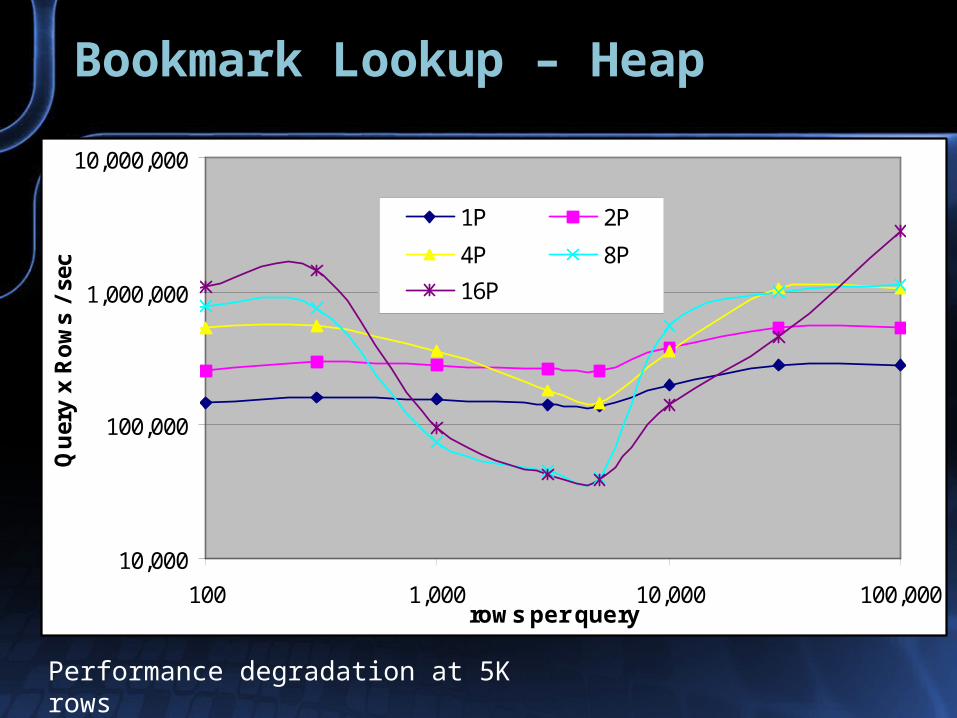
Bookmark Lookup – Heap
Performance degradation at 5K rows
10,000
100,000
1,000,000
10,000,000
100 1,000 10,000 100,000rows per query
Qu
ery
x R
ow
s /
sec
1P 2P
4P 8P
16P

Bookmark Lookup – Heap Page Lock
Excellent scaling, 8P anomaly?
0
500,000
1,000,000
1,500,000
2,000,000
2,500,000
3,000,000
3,500,000
4,000,000
4,500,000
100 1,000 10,000 100,000rows per query
Qu
ery
x R
ow
s /
sec
1P 2P 4P
8P 16P

Joins – 1P
Up to 10X difference between loop, hash & merge
100,000
1,000,000
10,000,000
100 1,000 10,000 100,000rows per query
Qu
ery
x R
ow
s /
sec
Loop
Hash
Merge

Joins – 16P
Up to 100X difference between loop, hash & merge
100,000
1,000,000
10,000,000
100,000,000
100 1,000 10,000 100,000rows per query
Qu
ery
x R
ow
s /
sec
Loop
Hash
Merge

Loop Join
No scaling beyond 2P
0
50,000
100,000
150,000
200,000
250,000
300,000
100 1,000 10,000 100,000rows per query
Qu
ery
x R
ow
s /
sec
1P 2P 4P
8P 16P

Hash Join
Scales to 8P, peaks at ~5K rows
0
500,000
1,000,000
1,500,000
2,000,000
2,500,000
3,000,000
3,500,000
4,000,000
100 1,000 10,000 100,000rows per query
Qu
ery
x R
ow
s /
sec
1P 2P 4P8P 16P

Merge Join
Scales well all around
0
2,000,000
4,000,000
6,000,000
8,000,000
10,000,000
12,000,000
14,000,000
16,000,000
18,000,000
20,000,000
100 1,000 10,000 100,000rows per query
Qu
ery
x R
ow
s /
sec
1P
2P
4P
8P
16P

Table Scans
Questionable scaling, peaks at 300 pages, cache size ?
0
200,000
400,000
600,000
800,000
1,000,000
1,200,000
100 1,000 10,000 100,000table size (pages)
Pag
es /
sec
1P
2P
4P
8P
16P

Scaling Summary
Avoid Bookmark Lookups on Tables with Clustered indexes
Use Heap tables
Use NOLOCK, especially ~5000 rows / query
Avoid Loop JoinsDesign for Merge or Hash Joins
Avoid table scans (Itanium only?)

Bookmark HP 32P, SP3 build 760/818
10,000
100,000
1,000,000
10,000,000
10 100 1,000 10,000 100,000rows per query
Qu
ery
x R
ow
s /
sec
Seq Heap PL
Seq Heap
Seq Cl PL
Seq Clustered

Bookmark HP 32P, SP4 build 2000?
10,000
100,000
1,000,000
10,000,000
10 100 1,000 10,000 100,000rows per query
Qu
ery
x R
ow
s /
sec
Seq Heap PL
Seq Heap
Seq Cl PL
Seq Clustered
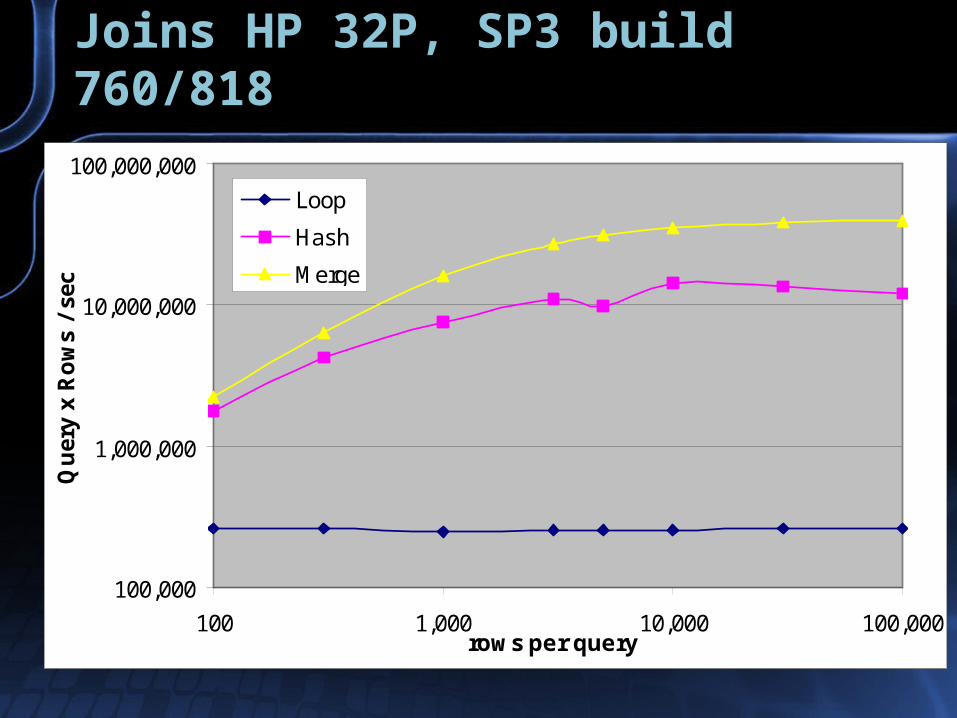
Joins HP 32P, SP3 build 760/818
100,000
1,000,000
10,000,000
100,000,000
100 1,000 10,000 100,000rows per query
Qu
ery
x R
ow
s /
sec
Loop
Hash
Merge
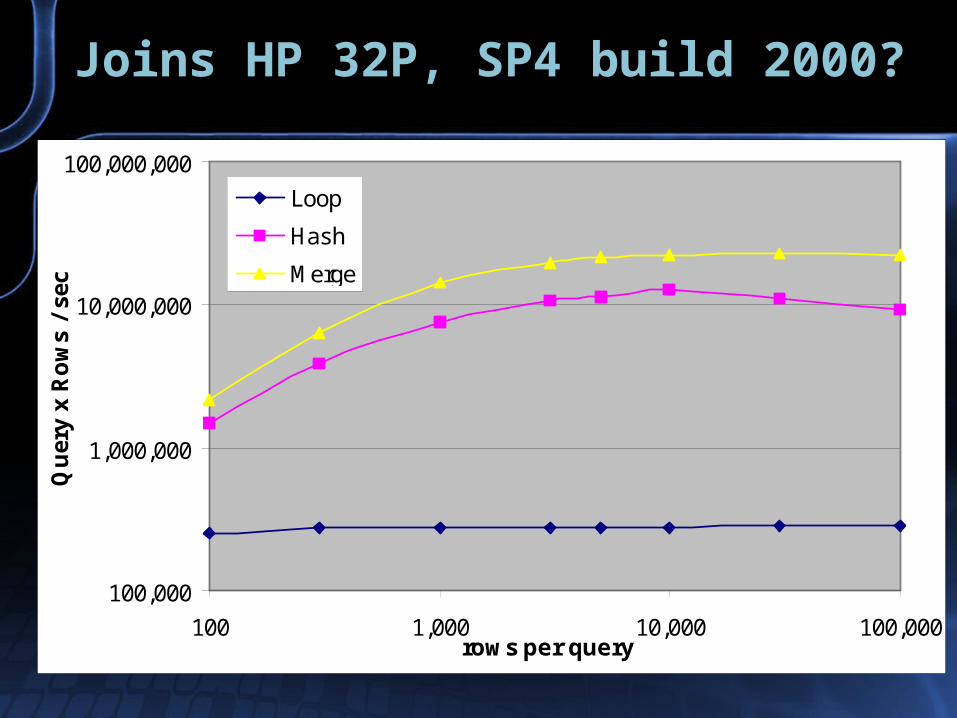
Joins HP 32P, SP4 build 2000?
100,000
1,000,000
10,000,000
100,000,000
100 1,000 10,000 100,000rows per query
Qu
ery
x R
ow
s /
sec
Loop
Hash
Merge

Table Scan HP 32P,
0
200,000
400,000
600,000
800,000
1,000,000
1,200,000
1,400,000
1,600,000
1,800,000
2,000,000
10 100 1,000 10,000 100,000
table size (pages)
Pag
es/s
ec
760 Def 760 NL
818 Def 818 NL
sp4 Def sp4 NL

Bookmark Lookup (PL Sequential)
0
1,000,000
2,000,000
3,000,000
4,000,000
5,000,000
6,000,000
7,000,000
8,000,000
9,000,000
10,000,000
100 1,000 10,000 100,000rows per query
Qu
ery-
row
s/se
c
16P Xeon
16P It2
32P It2

Index Seek
1,000,000
10,000,000
100,000,000
100 1,000 10,000 100,000rows per query
Qu
ery-
row
s/se
c
16P Xeon
16P It2
32P It2

Loop Join
0
50,000
100,000
150,000
200,000
250,000
300,000
100 1,000 10,000 100,000rows per query
Qu
ery-
row
s/se
c
16P Xeon
16P It2
32P It2

Hash Join
0
2,000,000
4,000,000
6,000,000
8,000,000
10,000,000
12,000,000
14,000,000
16,000,000
100 1,000 10,000 100,000rows per query
Qu
ery-
row
s/se
c
16P Xeon
16P It2
32P It2
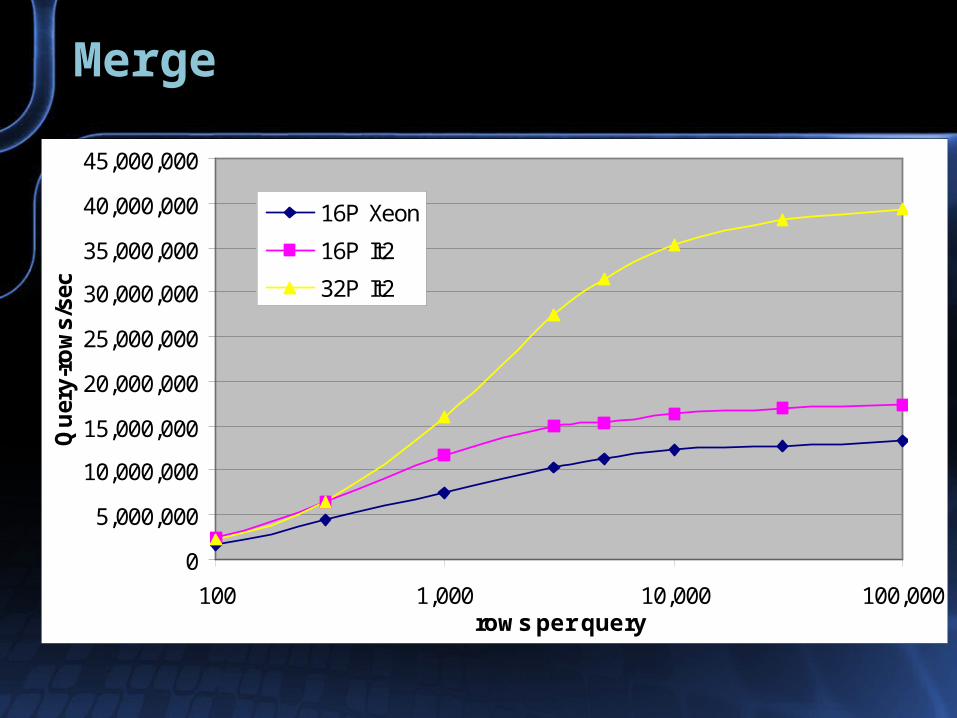
Merge
0
5,000,000
10,000,000
15,000,000
20,000,000
25,000,000
30,000,000
35,000,000
40,000,000
45,000,000
100 1,000 10,000 100,000rows per query
Qu
ery-
row
s/se
c
16P Xeon
16P It2
32P It2
Joins HP 32P, SP4 build 2000?

Joins HP 32P, SP4 build 2000?

Database Design for Performance
Round-trip minimization – RPC costRow count management – Cost per row
Indexes – isolate queried rows to a limited number of adjacent pages quickly, not most selective columns 1st
Design for low cost operationsCovered index instead of bookmark lookupsMerge joins, Indexed viewsAvoid excessive logic
NOLOCK on non-transactional data

Statistics
Accuracy & RelevanceMore than keeping statistics up to date
Data queried needs to reflect data in table
Avoid populating database with test data having different distribution than live data

Performance Issues
NC Index Seek + Bookmark Lookup vs. Table Scan
Query optimizer switches to table scantoo soon for in-memory, too late for disk bound data
Watch table scan lock levelRow count plan versus actual cost issues
May be related to WHERE clause conditionsLock hints Merge and Hash joins vs. Loop joinsFixed costs favor consolidation
Both in RPC and queries

Summary
Query cost structure
Fixed costs identifiedCosts applied once per RPC
Component operations examinedBase cost and cost per row or page
Lock hints – Row, Page, Table, No Lock
Additional Information
www.sql-server-performance.com/joe_chang.asp
SQL Server Quantitative Performance AnalysisSQL Server Quantitative Performance AnalysisServer System ArchitectureServer System ArchitectureProcessor PerformanceProcessor PerformanceDirect Connect Gigabit NetworkingDirect Connect Gigabit NetworkingParallel Execution PlansParallel Execution PlansLarge Data OperationsLarge Data OperationsTransferring StatisticsTransferring StatisticsSQL Server Backup Performance with Imceda LiteSpeedSQL Server Backup Performance with Imceda LiteSpeed

Quantitative Performance Analysis
Backup Slides

Subjects
Cost measurementTest procedure, Unit of measure
Query CostsSingle row, table scan, multi-row, joins
Discrepancies with plan costs
Logical I/O, Lock Hints, Conditions
Database design implicationsDesign, coding and indexes

Test Procedure
Load generatorDrive DB server CPU utilization as high as possible (80-100%)
Multiple load generators running same query
Single thread will not fully load DB server
Network propagation time is significant
Most queries run on single processor
Server may have more than one processor
Component operation cost derivedComparing two queries differing in one op

Index Seek by Aggregates
SELECT COUNT(*) SELECT COUNT(*), CONVERT int to bigint, etcSELECT COUNT(*), SUM(int), SELECT COUNT(*), SUM(Money)
0
0.1
0.2
0.3
0.4
0.5
0.6
0.7
0.8
Xeon 1P Opt 1P It2 1P Xeon 2P Opt 2P It 2P
Du
rati
on
/1K
ro
ws
(ms)
1 of 10M Count
Sum Convert
Max Money
Decimal

Join Cost Linearity on 32-bit
0
1
2
3
4
5
6
100 1000 10000
rows (1000's)
Du
rati
on
/1K
ro
w (
ms) Index Seek
Merge Join
Hash Join
Loop Join
Hash join cost per row is somewhat linear up to ~5M rowsDuration then jumps due to disk IO

Join Cost Linearity on Itanium 2
Loop & Merge join cost per row independent of row countHash join cost per row is not (no spooling to temp)
0
1
2
3
4
5
6
100 1,000 10,000rows (000's)
Du
rati
on
/1K
ro
ws
(ms) Index Seek
Merge Join
Hash Join
Loop Join

Hash Join – row size
Optimizer cost: depends on OS size, not IS sizeActual cost: depends on # of columns and OS/IS
0
1
2
3
4
5
6
100 1,000 10,000rows (000's)
Du
rati
on
/1K
ro
ws
(ms)
Count OS 1 Sum
IS 1 Sum OS 2 Sum
IS 2 Sum OS 3 Sum
IS 3 Sum

Type + Component Base Cost
Processor PIII PIII X Xeon Opt Itanium 2
# of CPUs 2 4 2 2 2 4 8
Frequency ~733 700 2-2.4 2.2 900
M 1.5G 1.5G
Cache 256K 2M 512K 1M 1.5M 6M 6M
Aggregate 100K 40K 135K 45K 45K 35K 66K
Table Scan 60K 40K 145K 50K 35K 40K 90K
Loop Join 110K 24K 130K 50K 45K 10K 15K
Hash Join 500K 250K 620K 250K 225K 210K 320K
Merge Join 150K 54K 170K 80K 75K 55K 110K
Merge + Sort 145K 320K 140K 230K
Many-to-Many 250K 550K 200K 320K
Costs in CPU-Cycles
Big cache lowers base cost?
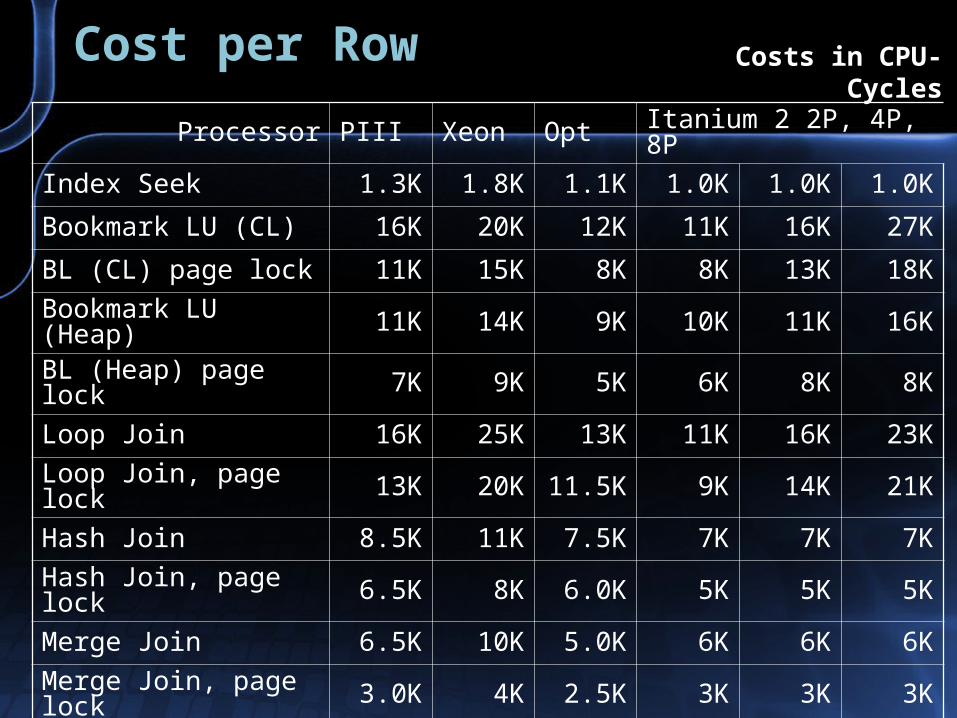
Cost per Row
Processor PIII Xeon Opt Itanium 2 2P, 4P, 8P
Index Seek 1.3K 1.8K 1.1K 1.0K 1.0K 1.0K
Bookmark LU (CL) 16K 20K 12K 11K 16K 27K
BL (CL) page lock 11K 15K 8K 8K 13K 18K
Bookmark LU (Heap) 11K 14K 9K 10K 11K 16K
BL (Heap) page lock 7K 9K 5K 6K 8K 8K
Loop Join 16K 25K 13K 11K 16K 23K
Loop Join, page lock 13K 20K 11.5K 9K 14K 21K
Hash Join 8.5K 11K 7.5K 7K 7K 7K
Hash Join, page lock 6.5K 8K 6.0K 5K 5K 5K
Merge Join 6.5K 10K 5.0K 6K 6K 6KMerge Join, page lock 3.0K 4K 2.5K 3K 3K 3K
Merge+Sort 7.5K 9K 6K 7K
Many-To-Many PL 32K 40K 18K 31K
Costs in CPU-Cycles

IUD Cost Structure
2xXeon* Notes
RPC cost 240,000 Higher for threads, owner m/m
Type Cost 130,000 once per procedureIUD Base 170,000 once per IUD statementSingle row IUD 300,000 Range: 200,000-400,000
Multi-row InsertCost per row 90,000 cost per additional row
INSERT, UPDATE & DELETE cost structure very similarMulti-row UPDATE & DELETE not fully investigated
*Use Windows NT fibers on

INSERT Cost Structure
Index and Foreign Key not fully explored
Early measurements:
50-70,000 per additional index50-70,000 per foreign key
Assumes inserts into “sequential” segmentsCluster on Identity or Cluster Key + IdentityCluster on row GUID can cause substantial disk loading!


![[XLS] · Web viewstomato 2011 oanaelena31@yahoo.com baronul2007@gmail.com geopaicu@yahoo.com pacurarusmaranda@yahoo.com paraschivrodica2001@yahoo.com CIOBANU CĂTĂLINA-CARMEN, COSTIN](https://img.pdfslide.net/doc/110x75/5aca839b7f8b9aa1298dc050/xls-viewstomato-2011-oanaelena31yahoocom-baronul2007gmailcom-geopaicuyahoocom.jpg)