Embed Size (px)
Citation preview
ObjectivesObjectives
Understand storage components
Learn how interpret performance countersHow to determine if you have a bottleneck
Sizing and configuring the storage systemHow many disks and IO channels do you need
Verify storage system performance Does the system perform as expected
How SQL operations translate to disk ops
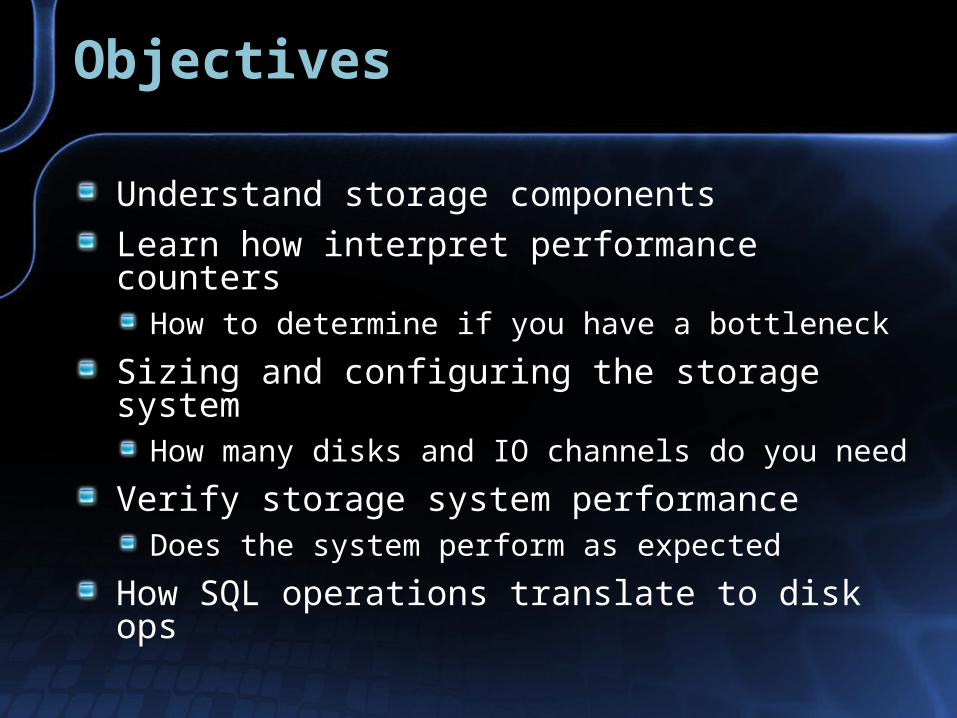
QuizQuiz
How much capacity do you have?For each data and log partition
What is the RAID level for each?
How many disks and IO channels on each?
What are the performance characteristics?
Small block low queue random IOPS
Small block high queue random IOPS
Large block sequential transfer rate
Read and write for each
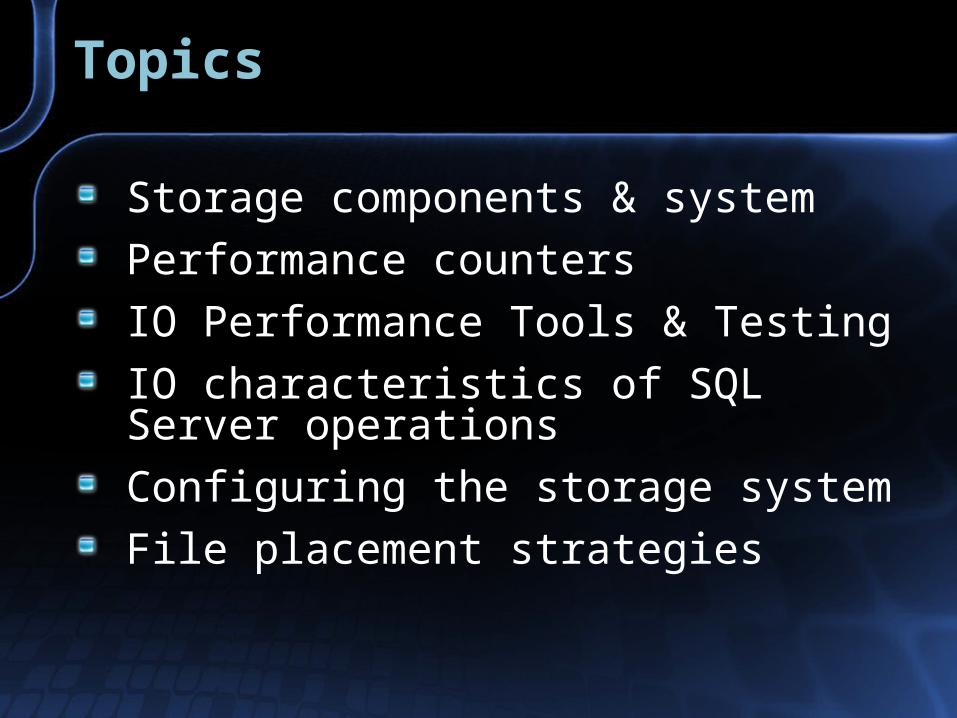
TopicsTopics
Storage components & system
Performance counters
IO Performance Tools & Testing
IO characteristics of SQL Server operations
Configuring the storage system
File placement strategies
Storage Components
Storage Performance for SQL Server
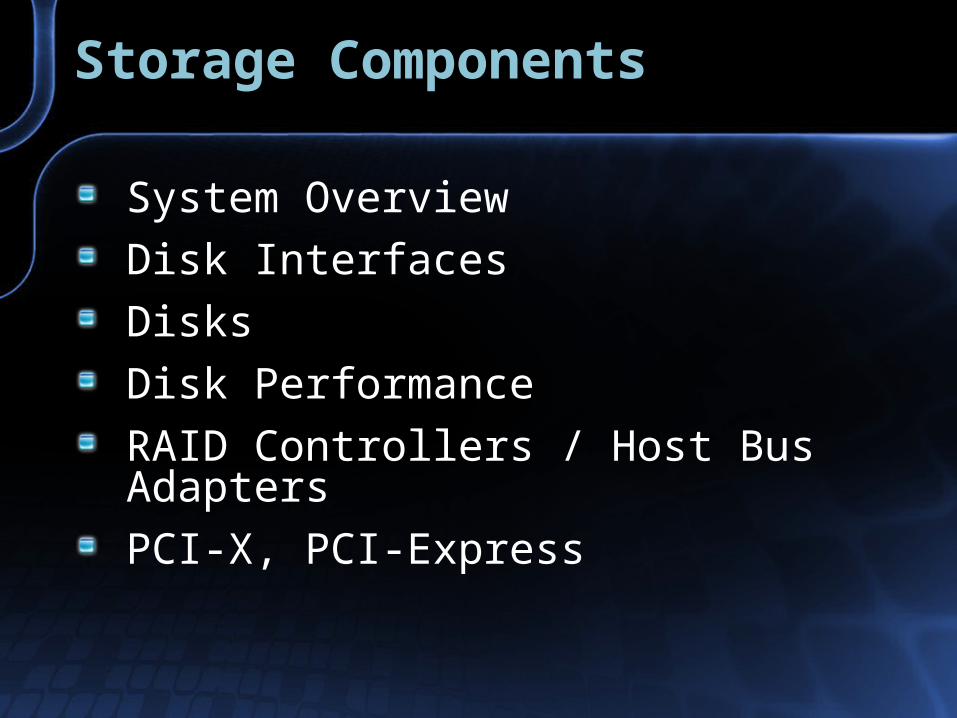
Storage ComponentsStorage Components
System Overview
Disk Interfaces
Disks
Disk Performance
RAID Controllers / Host Bus Adapters
PCI-X, PCI-Express

System OverviewSystem Overview
Chipset (memory controller & IO bridges) connects processors, memory & IO
System bus usually means processor bus
Internal IO connects memory controller to IO bridges, may be proprietary
PCI – connects IO adapters to IO bridge
Disk interface connects disks to IO adapters
MemoryController
DDR
DDR
System BusMemoryInterface
Internal IO
IOBridge
PCI
RAID HBA
CPU CPU
IOBridge
Disk Interface
MemoryController
DDRDDR
DDRDDR
System BusMemoryInterface
Internal IO
IOBridge
PCI
RAID HBAHBA
CPU CPUCPUCPU CPUCPU
IOBridge
IOBridge
Disk Interface
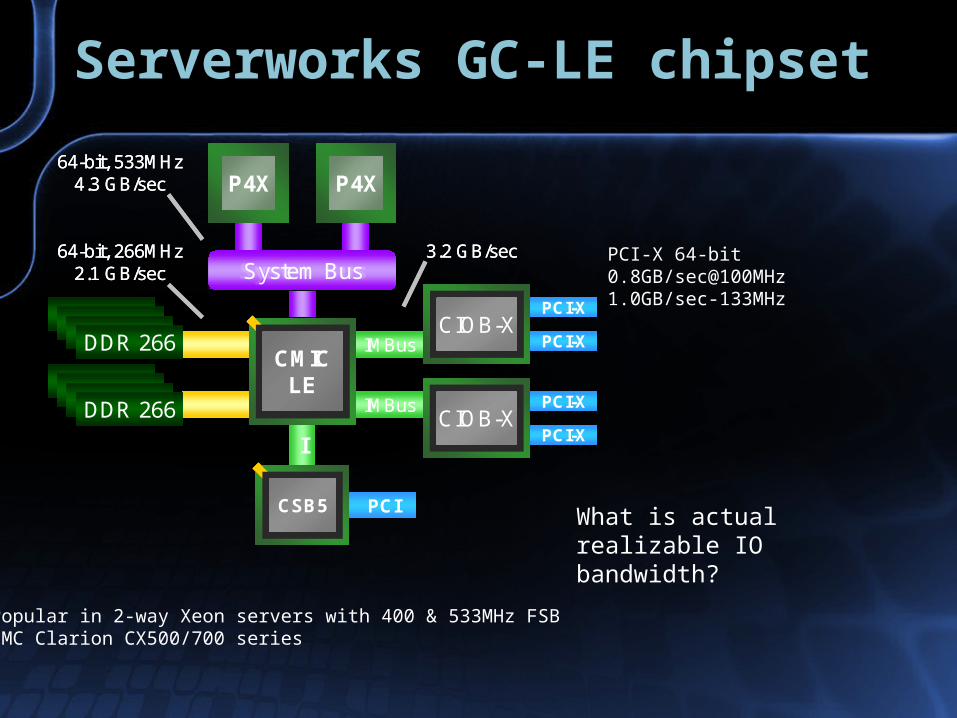
Serverworks GC-LE chipsetServerworks GC-LE chipset
I
CMICLE
System Bus
P4X P4X
DDR 266
DDR 266
CSB5
System Bus
CIOB-X
CIOB-X
64-bit, 533MHz4.3 GB/sec
64-bit, 266MHz2.1 GB/sec
3.2 GB/sec
PCI
PCI-X
PCI-X
PCI-X
PCI-X
IMBus
IMBus
I
CMICLE
CMICLE
System Bus
P4X P4X
DDR 266DDR 266
DDR 266DDR 266
CSB5CSB5
System Bus
CIOB-X
CIOB-X
64-bit, 533MHz4.3 GB/sec
64-bit, 266MHz2.1 GB/sec
3.2 GB/sec
PCI
PCI-X
PCI-X
PCI-X
PCI-X
PCI-X
PCI-X
PCI-X
PCI-X
IMBus
IMBus
PCI-X 64-bit0.8GB/[email protected]/sec-133MHz
Popular in 2-way Xeon servers with 400 & 533MHz FSBEMC Clarion CX500/700 series
What is actual realizable IO bandwidth?
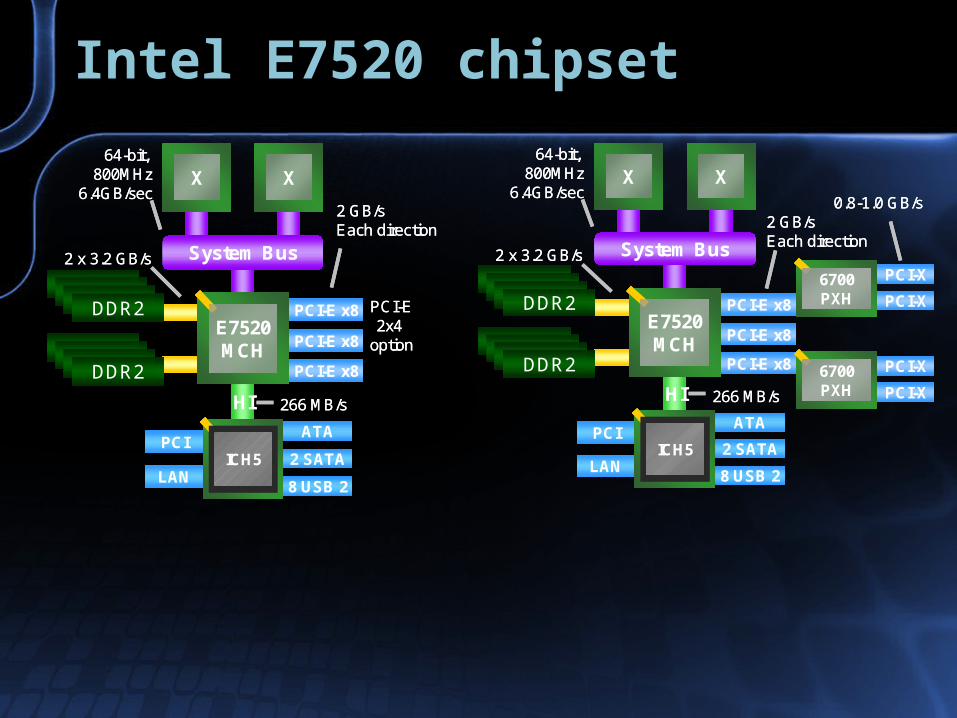
Intel E7520 chipsetIntel E7520 chipset
DDR2
DDR2
PCI-E x8
PCI-E x8
PCI-E x8
HI
E7520MCH
System Bus
X X64-bit,
800MHz6.4GB/sec
2 x 3.2 GB/s
266 MB/s
ICH5PCI
LAN
ATA
2 SATA
8 USB 2
6700PXH
PCI-X
PCI-X
2 GB/sEach direction
0.8-1.0 GB/s
6700PXH
PCI-X
PCI-X
DDR2
DDR2
DDR2DDR2
DDR2DDR2
PCI-E x8
PCI-E x8
PCI-E x8
PCI-E x8
PCI-E x8
PCI-E x8
HI
E7520MCH
E7520MCH
System Bus
X X64-bit,
800MHz6.4GB/sec
2 x 3.2 GB/s
266 MB/s
ICH5ICH5PCI
LAN
PCI
LAN
ATA
2 SATA
8 USB 2
ATA
2 SATA
8 USB 2
6700PXH
PCI-X
PCI-X6700PXH
PCI-X
PCI-X
PCI-X
PCI-X
2 GB/sEach direction
0.8-1.0 GB/s
6700PXH
PCI-X
PCI-X6700PXH
PCI-X
PCI-X
PCI-X
PCI-X
DDR2
DDR2
PCI-E x8
PCI-E x8
PCI-E x8
HI
E7520MCH
System Bus
X X64-bit,
800MHz6.4GB/sec
2 x 3.2 GB/s
266 MB/s
PCI-E2x4
option
ICH5PCI
LAN
ATA
2 SATA
8 USB 2
2 GB/sEach direction
DDR2
DDR2
DDR2DDR2
DDR2DDR2
PCI-E x8
PCI-E x8
PCI-E x8
PCI-E x8
PCI-E x8
PCI-E x8
HI
E7520MCH
E7520MCH
System Bus
X XX X64-bit,
800MHz6.4GB/sec
2 x 3.2 GB/s
266 MB/s
PCI-E2x4
option
ICH5PCI
LAN
ATA
2 SATA
8 USB 2
ICH5ICH5PCI
LAN
PCI
LAN
ATA
2 SATA
8 USB 2
ATA
2 SATA
8 USB 2
2 GB/sEach direction

Disk InterfacesDisk Interfaces
Desktop InterfacesATA 133 MBytes/secSATA 1.5 Gbit/sec (8b/10b) ~150MB/secSATA-IO (formerly SATA-II) up to 3.0 Gbit/sec defined
Enterprise InterfacesSCSI – LVD signaling 14-15 disks per SCSI bus
U160 Full speed only on data, not commandU320 More efficient protocol, full speed command
FC 126 devices per loop 1 Gbit/sec
2 Gbit/sec - 4 Gbit/sec - soon
SAS – point to point, with fan out, 128 devices3.0 Gbit/sec full duplex, 6.0 Gbit/sec second generation
SCSISCSI
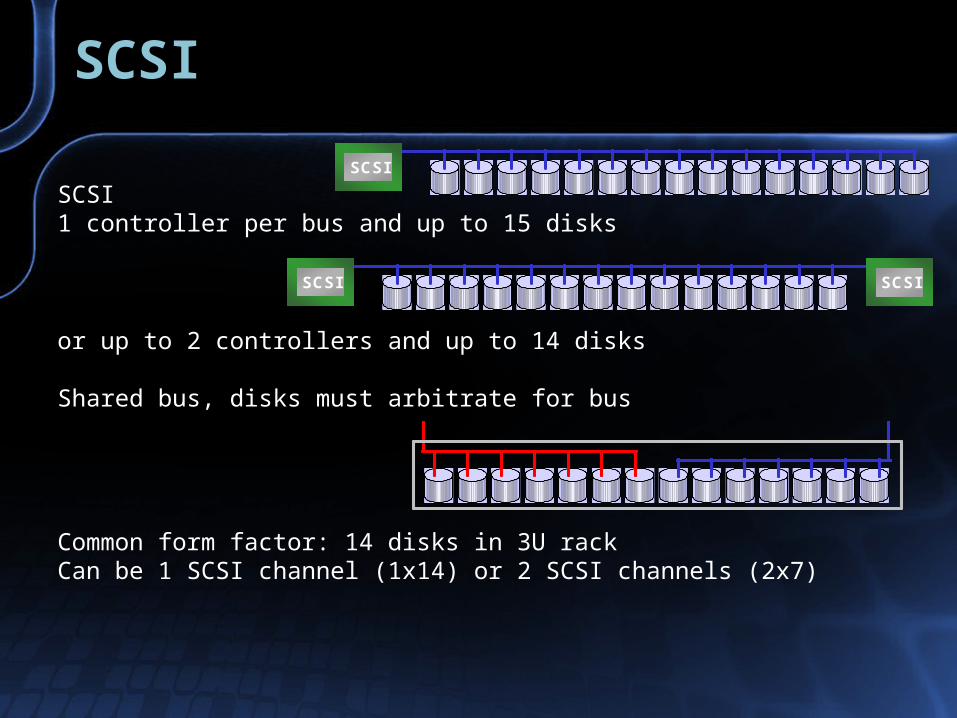
SCSI1 controller per bus and up to 15 disks
SCSISCSISCSI
SCSI SCSISCSISCSI SCSISCSI
or up to 2 controllers and up to 14 disks
Shared bus, disks must arbitrate for bus
Common form factor: 14 disks in 3U rackCan be 1 SCSI channel (1x14) or 2 SCSI channels (2x7)
Fiber ChannelFiber Channel
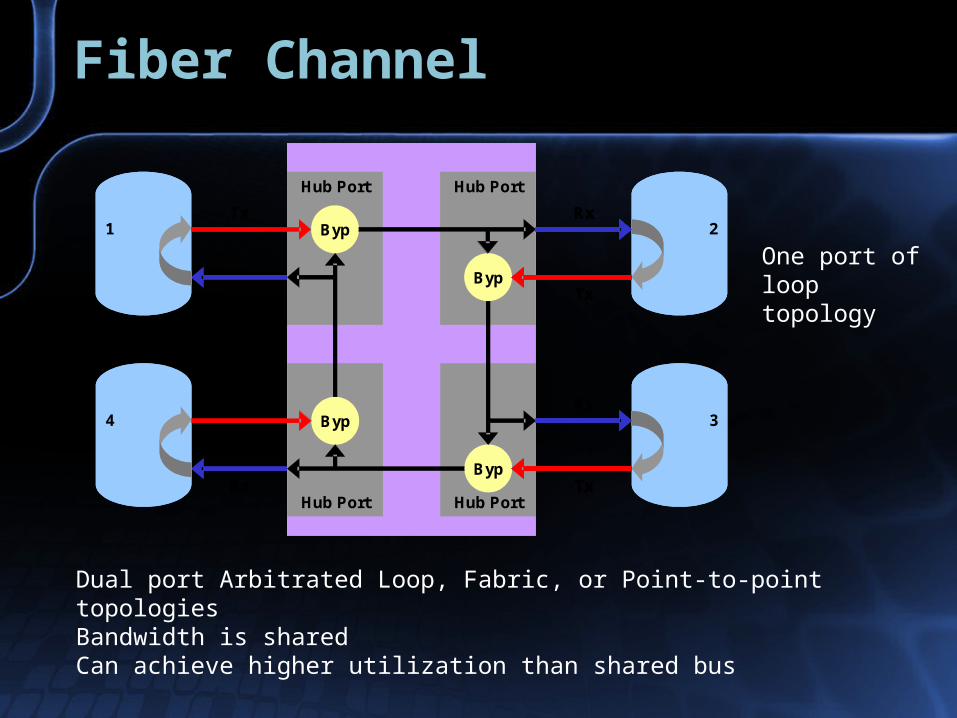
Dual port Arbitrated Loop, Fabric, or Point-to-point topologiesBandwidth is sharedCan achieve higher utilization than shared bus
1
4
Tx
Rx
Tx
Rx
Hub Port
Byp
Hub Port
Byp
Hub Port
Byp
Hub Port
Byp
2
3
Rx
Tx
Rx
Tx
1
4
Tx
Rx
Tx
Rx
Tx
Rx
Tx
Rx
Hub Port
Byp
Hub Port
Byp
Hub Port
Byp
Hub Port
Byp
2
3
Rx
Tx
Rx
Tx
Rx
Tx
Rx
Tx
Rx
Tx
Rx
Tx
One port of loop topology
SATASATA
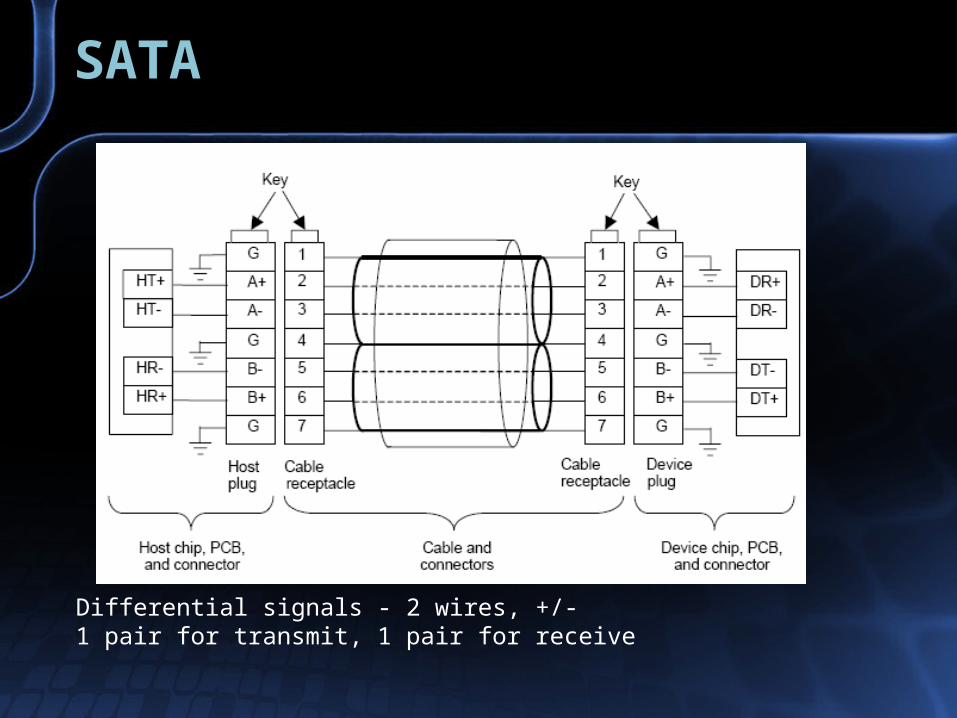
Differential signals - 2 wires, +/-1 pair for transmit, 1 pair for receive

SATASATA
1 disk per port
New features in SATA Native Command Queuing Port Multiplier 1 port can connect to multiple devices Port Selector Each disk can have 2 ports
SATASATA

Disk DrivesDisk Drives
36GB 74GB 146G 300G
7200 RPM SATA $150
10K 3.5in SCSI/FC
$200 $400 $750
15K 3.5in SCSI/FC
$200 $400 $800
10K 2.5in SAS $325 $600
Bare drive, no hot-plug carrier, no enclosure
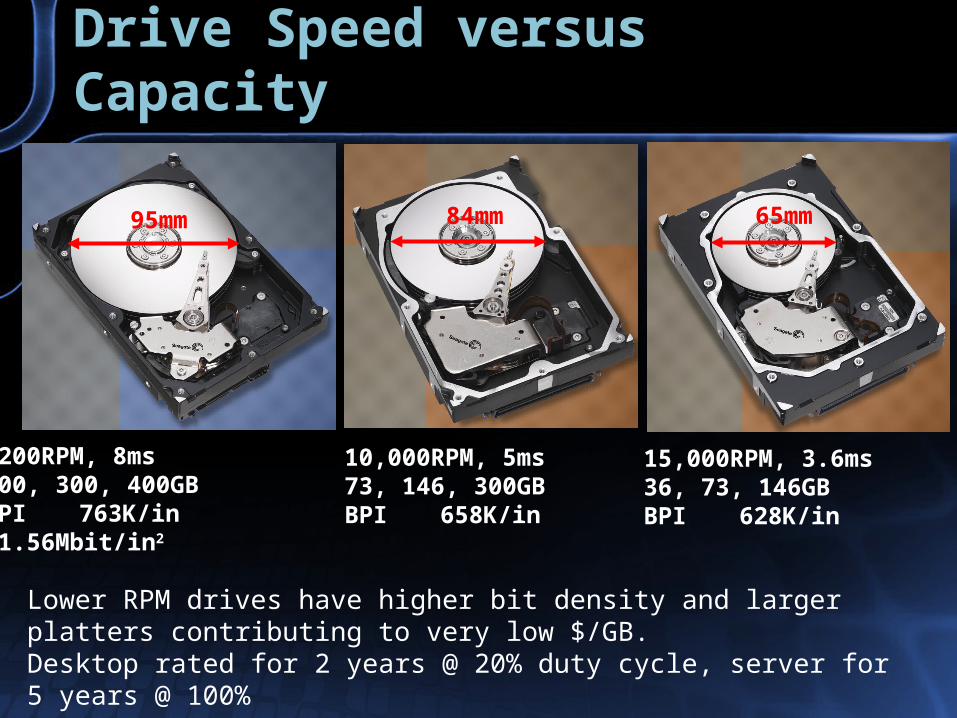
Drive Speed versus CapacityDrive Speed versus Capacity
95mm 84mm 65mm
7200RPM, 8ms 200, 300, 400GBBPI 763K/in91.56Mbit/in2
10,000RPM, 5ms 73, 146, 300GBBPI 658K/in
15,000RPM, 3.6ms 36, 73, 146GBBPI 628K/in
Lower RPM drives have higher bit density and larger platters contributing to very low $/GB. Desktop rated for 2 years @ 20% duty cycle, server for 5 years @ 100%
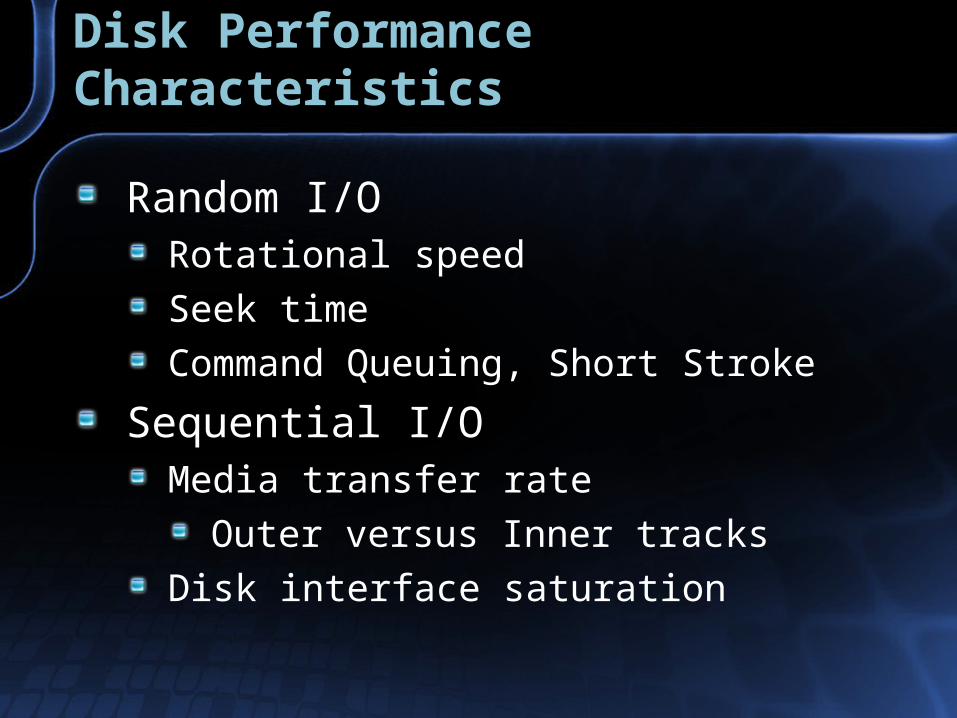
Disk Performance CharacteristicsDisk Performance Characteristics
Random I/ORotational speed
Seek time
Command Queuing, Short Stroke
Sequential I/OMedia transfer rate
Outer versus Inner tracks
Disk interface saturation
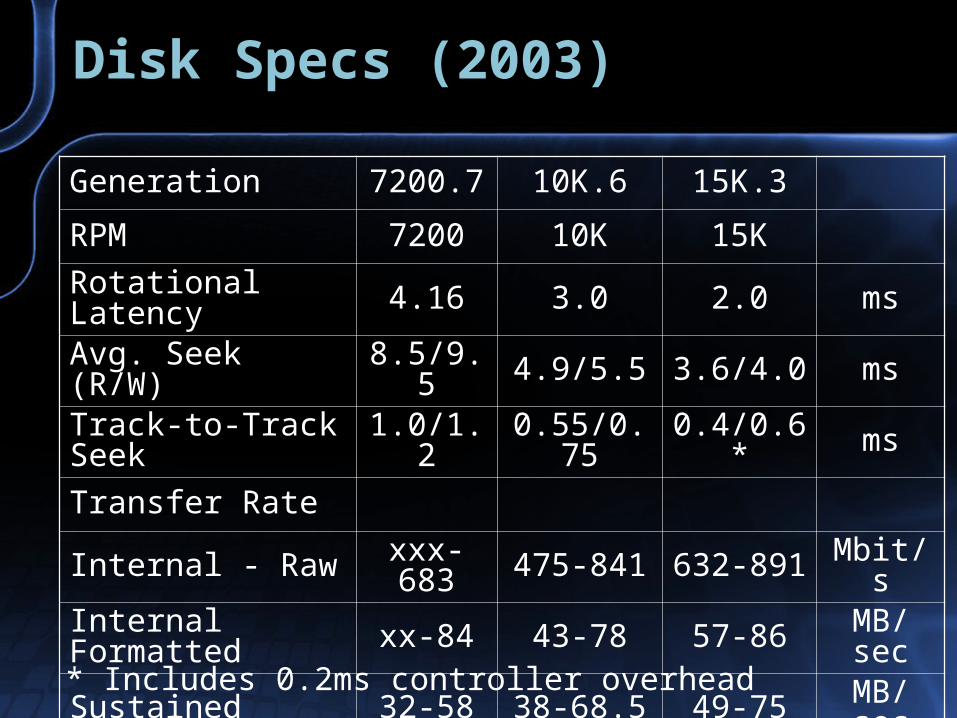
Disk Specs (2003)Disk Specs (2003)
Generation 7200.7 10K.6 15K.3
RPM 7200 10K 15KRotational Latency 4.16 3.0 2.0 ms
Avg. Seek (R/W) 8.5/9.5 4.9/5.5 3.6/4.0 msTrack-to-Track Seek 1.0/1.2 0.55/0.7
5 0.4/0.6* ms
Transfer Rate
Internal - Raw xxx-683 475-841 632-891 Mbit/s
Internal Formatted xx-84 43-78 57-86 MB/
sec
Sustained 32-58 38-68.5 49-75 MB/sec* Includes 0.2ms controller overhead
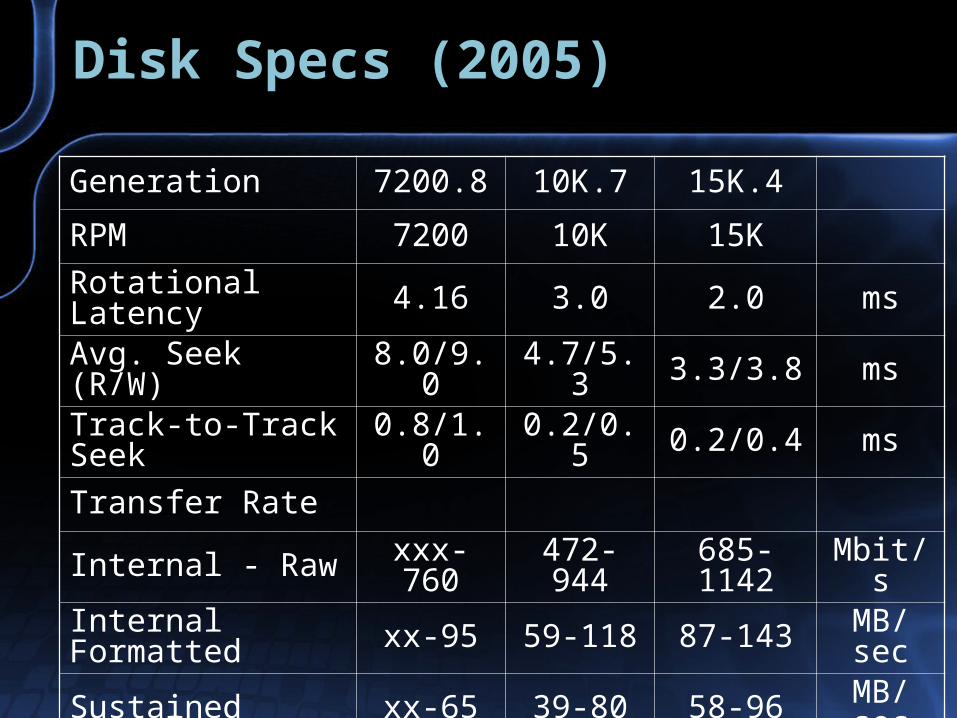
Disk Specs (2005)Disk Specs (2005)
Generation 7200.8 10K.7 15K.4
RPM 7200 10K 15KRotational Latency 4.16 3.0 2.0 ms
Avg. Seek (R/W) 8.0/9.0 4.7/5.3 3.3/3.8 msTrack-to-Track Seek 0.8/1.0 0.2/0.5 0.2/0.4 ms
Transfer Rate
Internal - Raw xxx-760 472-944
685-1142 Mbit/s
Internal Formatted xx-95 59-118 87-143 MB/
sec
Sustained xx-65 39-80 58-96 MB/sec
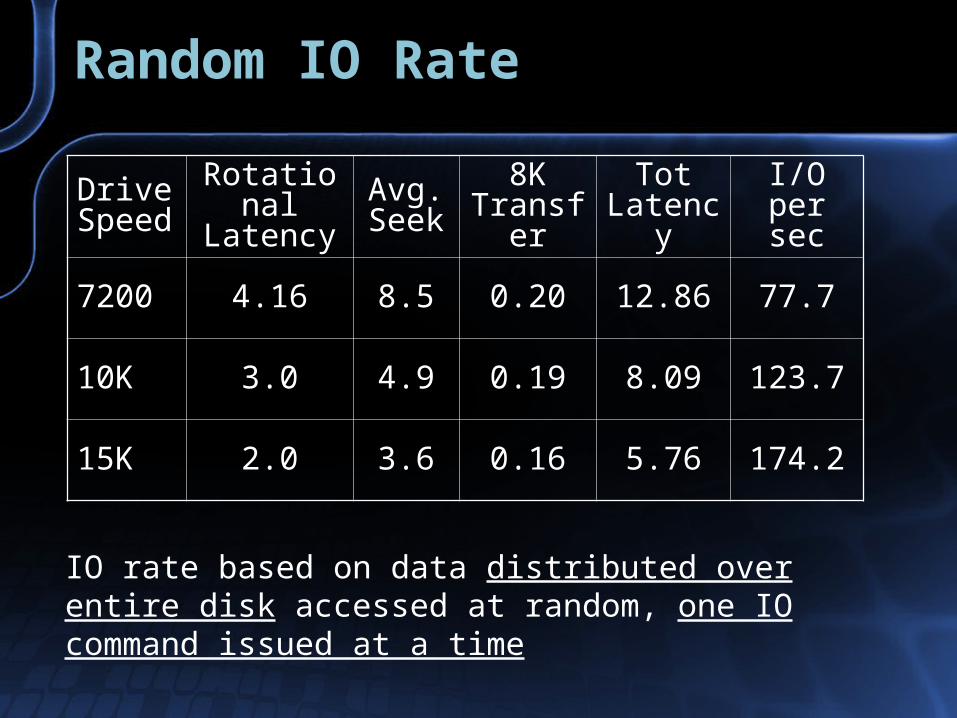
Random IO RateRandom IO Rate
Drive Speed
Rotational
LatencyAvg. Seek
8K Transf
er
Tot Latenc
yI/O per
sec
7200 4.16 8.5 0.20 12.86 77.7
10K 3.0 4.9 0.19 8.09 123.7
15K 2.0 3.6 0.16 5.76 174.2
IO rate based on data distributed over entire disk accessed at random, one IO command issued at a time
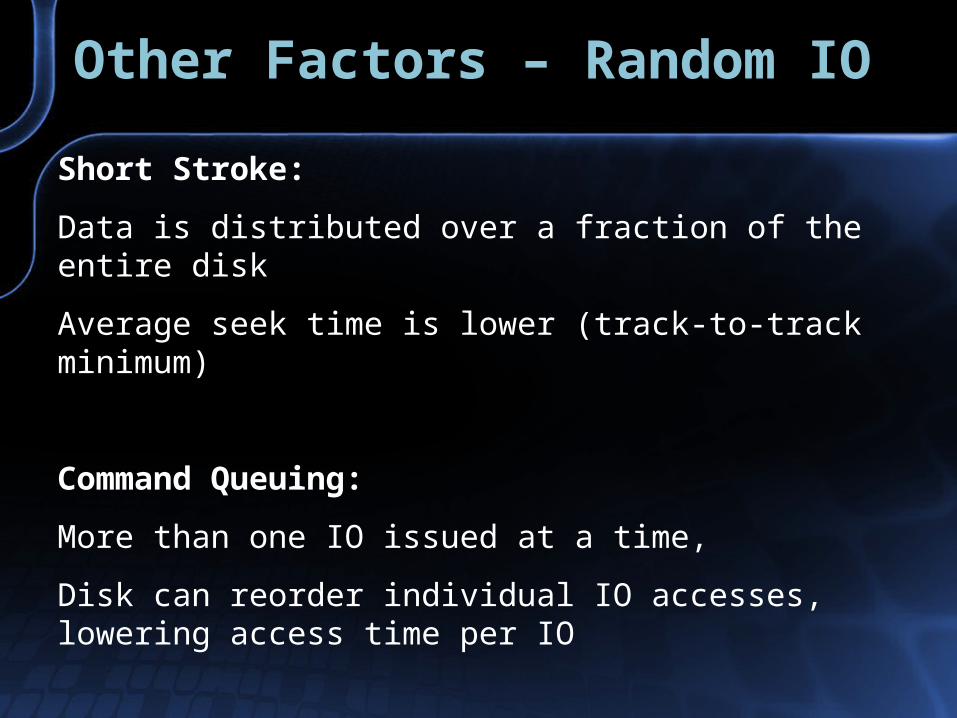
Other Factors – Random IOOther Factors – Random IO
Short Stroke:
Data is distributed over a fraction of the entire disk
Average seek time is lower (track-to-track minimum)
Command Queuing:
More than one IO issued at a time,
Disk can reorder individual IO accesses, lowering access time per IO
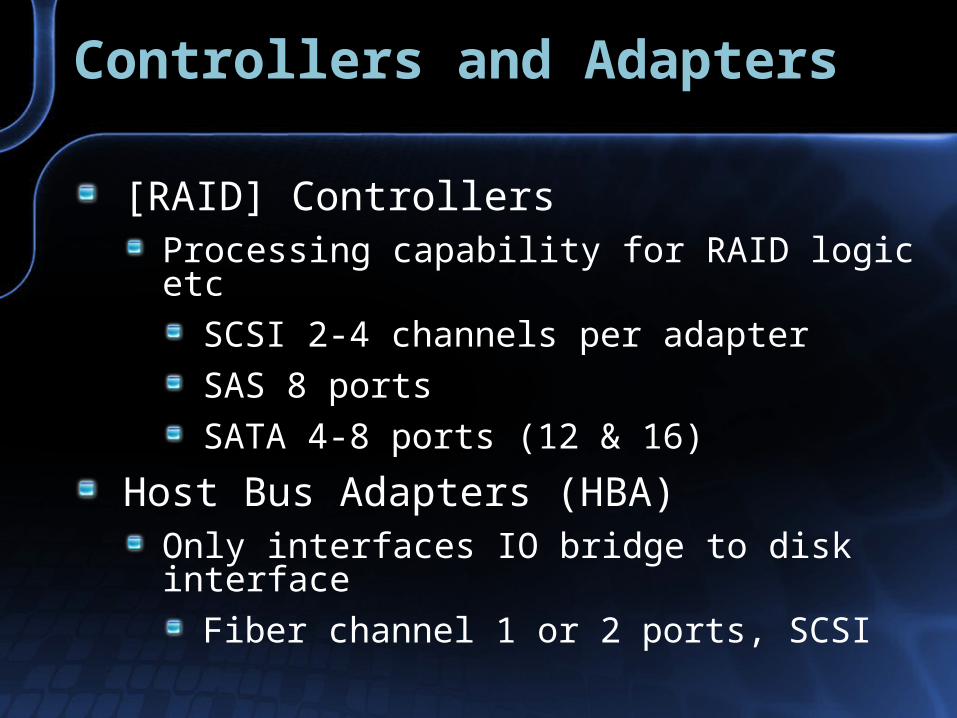
Controllers and AdaptersControllers and Adapters
[RAID] ControllersProcessing capability for RAID logic etc
SCSI 2-4 channels per adapter
SAS 8 ports
SATA 4-8 ports (12 & 16)
Host Bus Adapters (HBA)Only interfaces IO bridge to disk interface
Fiber channel 1 or 2 ports, SCSI
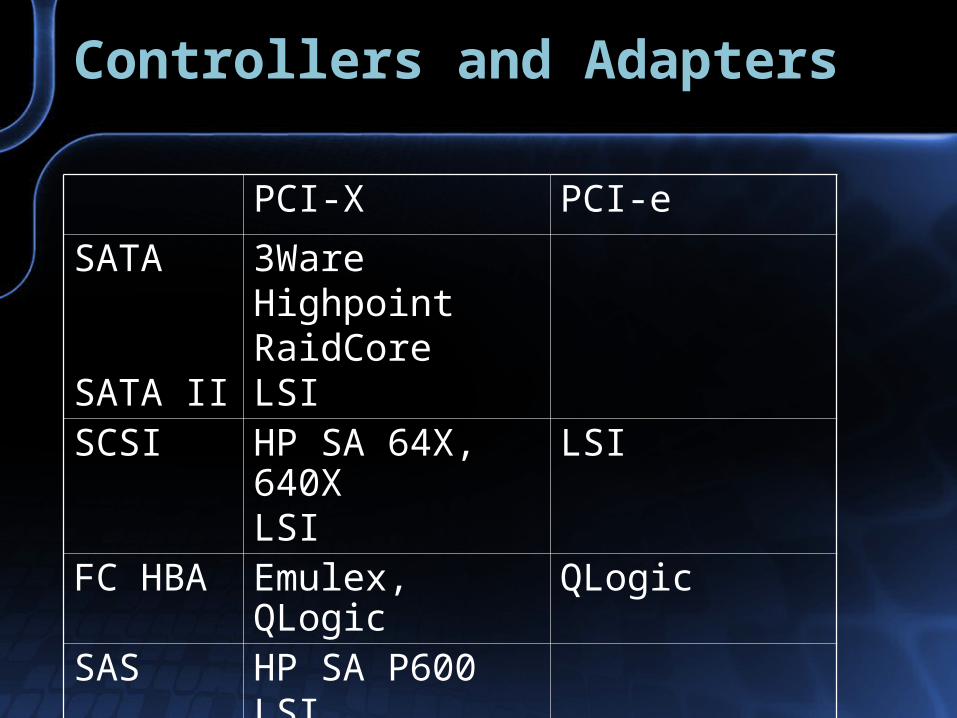
Controllers and AdaptersControllers and Adapters
PCI-X PCI-e
SATA
SATA II
3WareHighpointRaidCoreLSI
SCSI HP SA 64X, 640XLSI
LSI
FC HBA Emulex, QLogic
QLogic
SAS HP SA P600LSI
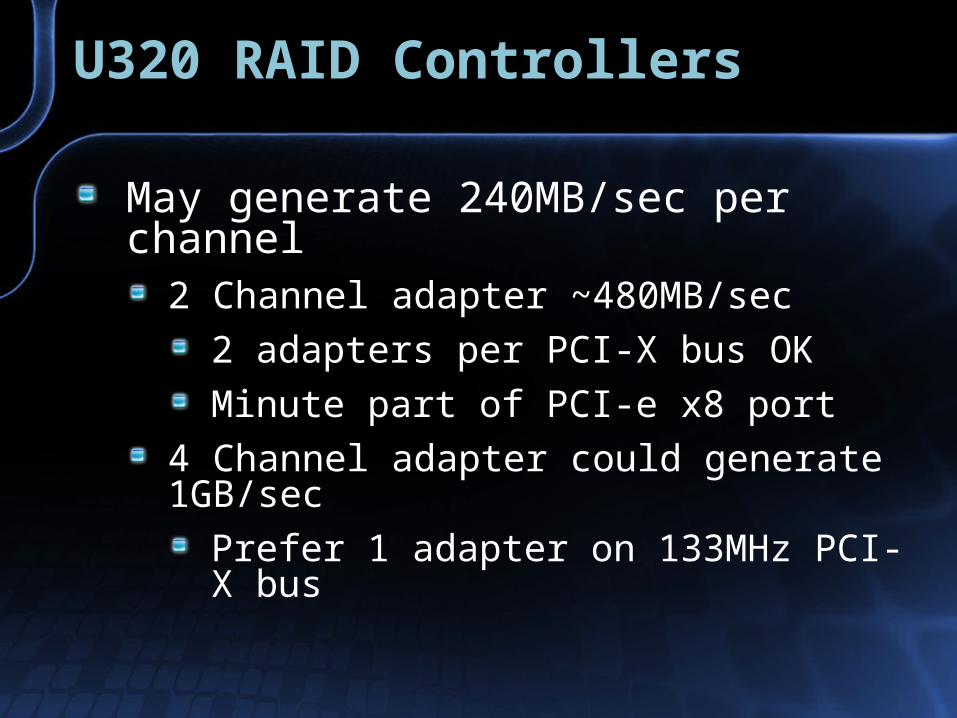
U320 RAID ControllersU320 RAID Controllers
May generate 240MB/sec per channel
2 Channel adapter ~480MB/sec
2 adapters per PCI-X bus OK
Minute part of PCI-e x8 port
4 Channel adapter could generate 1GB/sec
Prefer 1 adapter on 133MHz PCI-X bus
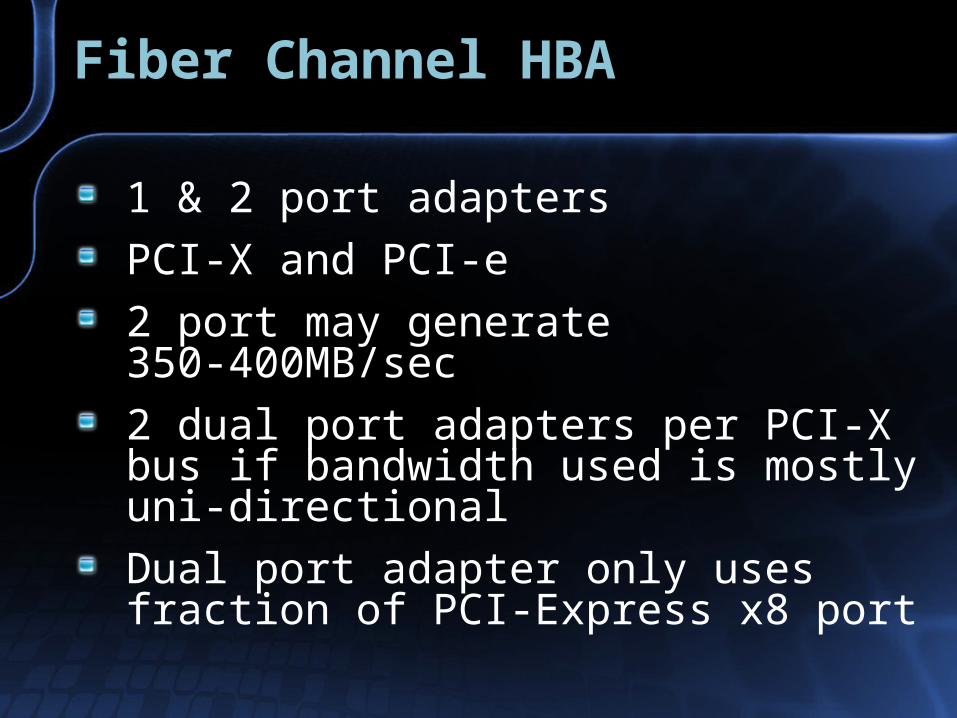
Fiber Channel HBAFiber Channel HBA
1 & 2 port adapters
PCI-X and PCI-e
2 port may generate 350-400MB/sec
2 dual port adapters per PCI-X bus if bandwidth used is mostly uni-directional
Dual port adapter only uses fraction of PCI-Express x8 port

SAS AdaptersSAS Adapters
HP Smart Array P600 RAID Controller8 3.0Gbit/sec SAS ports
2.4GB/sec each direction
2 x 4 port connectors
Max 38 drives
PCI-X
LSI Logic SAS3xxx
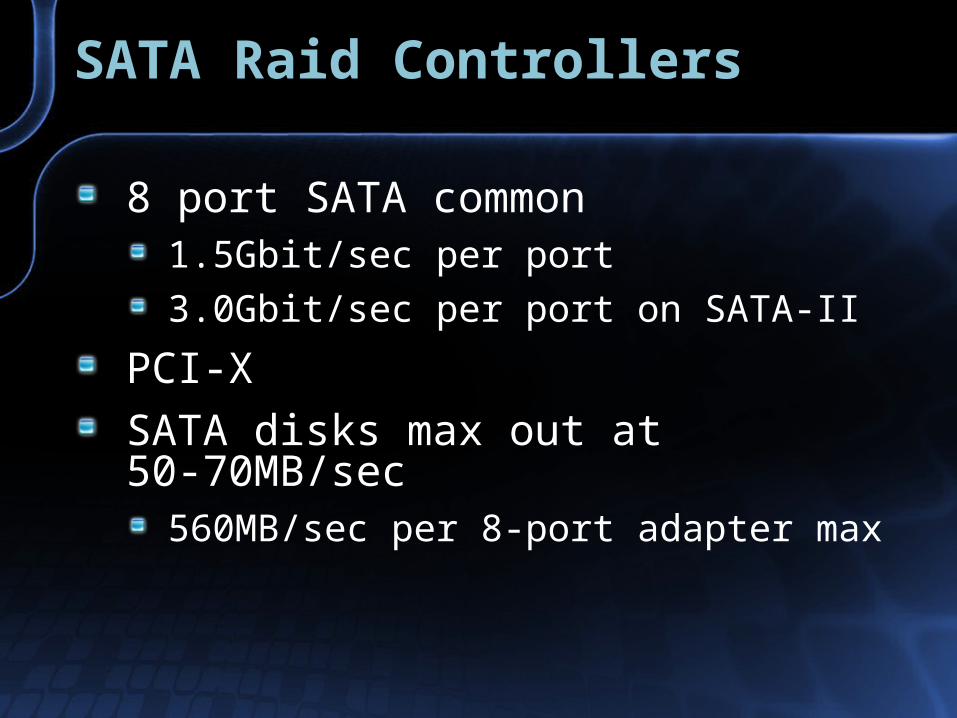
SATA Raid ControllersSATA Raid Controllers
8 port SATA common1.5Gbit/sec per port
3.0Gbit/sec per port on SATA-II
PCI-X
SATA disks max out at 50-70MB/sec560MB/sec per 8-port adapter max
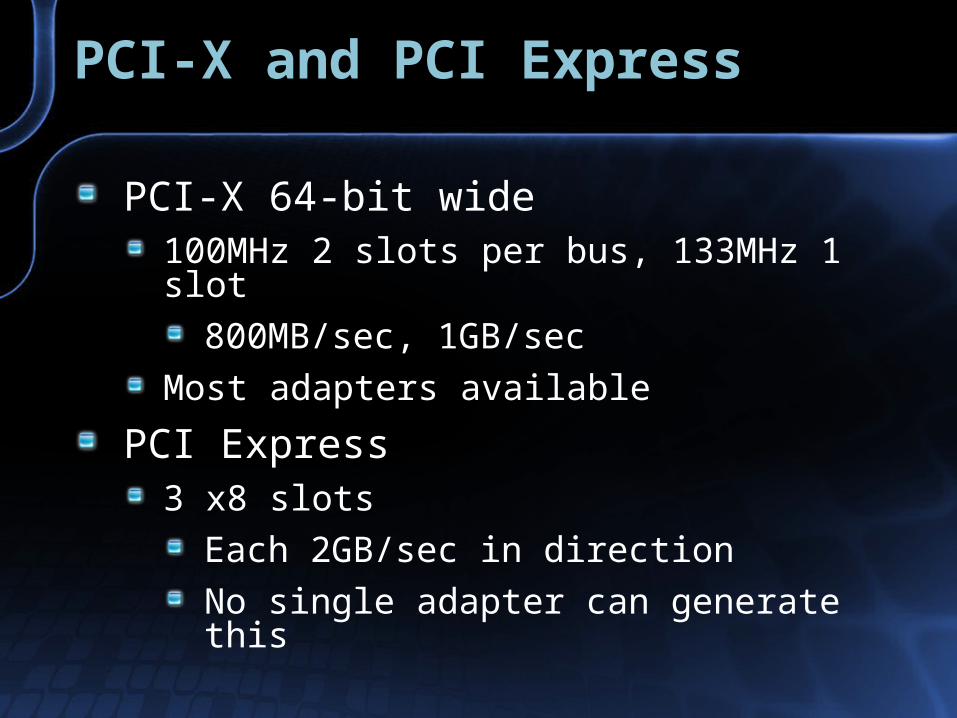
PCI-X and PCI ExpressPCI-X and PCI Express
PCI-X 64-bit wide100MHz 2 slots per bus, 133MHz 1 slot
800MB/sec, 1GB/sec
Most adapters available
PCI Express3 x8 slots
Each 2GB/sec in direction
No single adapter can generate this

Performance Counters
Storage Performance for SQL Server
Performance CountersPerformance Counters
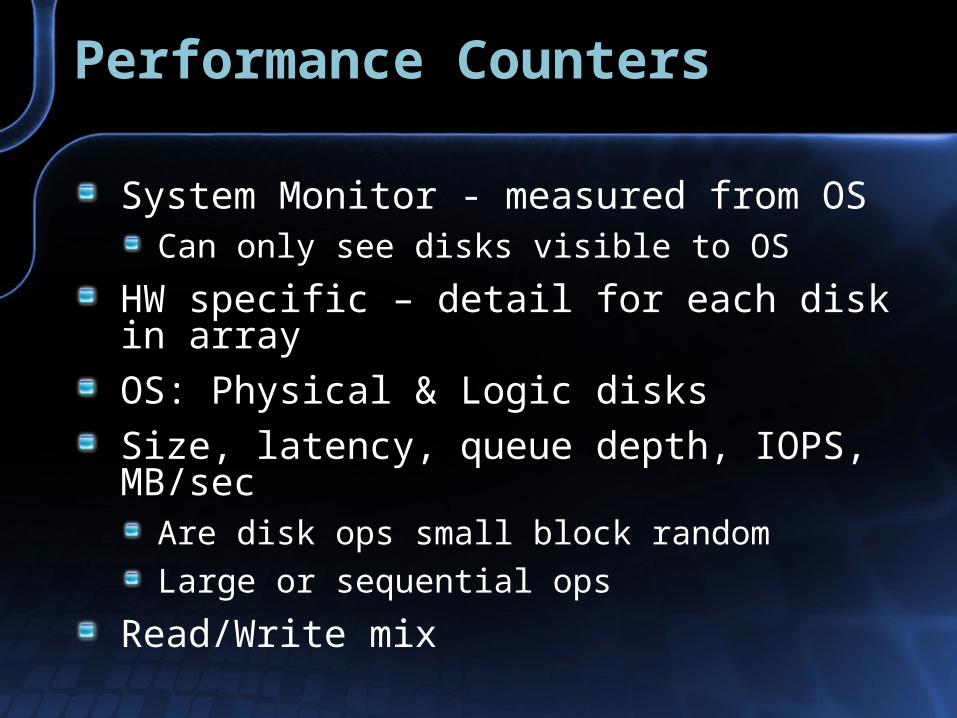
System Monitor - measured from OSCan only see disks visible to OS
HW specific – detail for each disk in array
OS: Physical & Logic disks
Size, latency, queue depth, IOPS, MB/sec
Are disk ops small block random
Large or sequential ops
Read/Write mix

OS & Hardware CountersOS & Hardware Counters
OS CountersAverage values only
Example: 100 Reads, Average Bytes 16K
Don’t actual mix of 8K, 64K etc
Hardware – Vendor SpecificMay give distribution of actual IOPS
OS: Physical & Logical DiskOS: Physical & Logical Disk
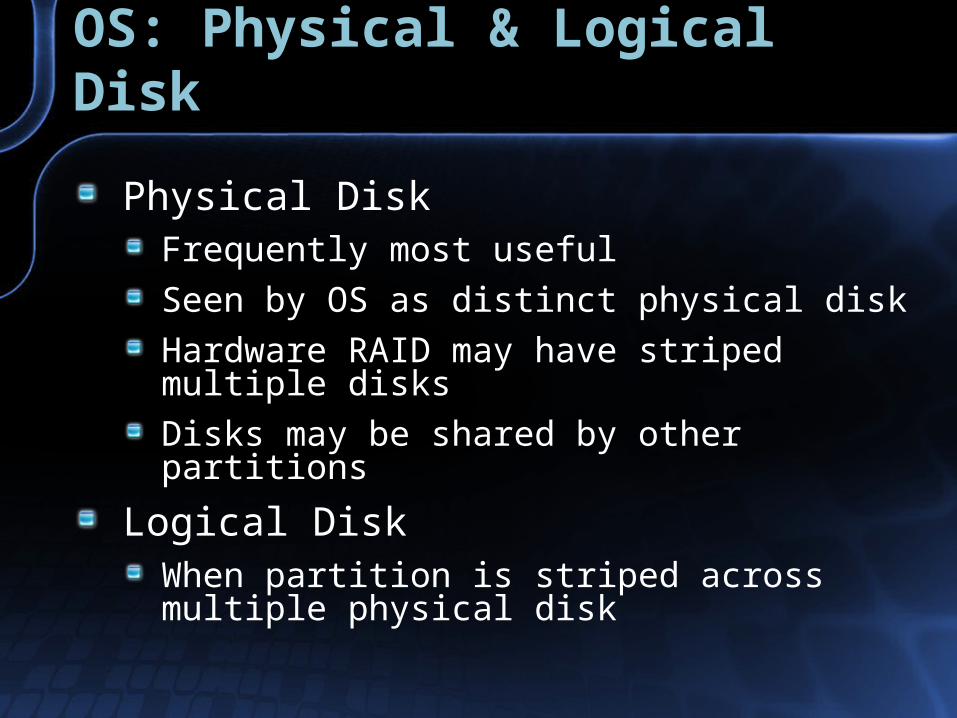
Physical DiskFrequently most useful
Seen by OS as distinct physical disk
Hardware RAID may have striped multiple disks
Disks may be shared by other partitions
Logical DiskWhen partition is striped across multiple physical disk

Counters (Transfer, Read, Write)Counters (Transfer, Read, Write)
Avg. Disk Bytes/[Read] [Write] [Transfer]
Disk [Reads] [Writes] [Transfer]/sec
Disk [Read] [Write] [] Bytes/sec
Avg. Disk [Read] [Write] [] Queue Length
Avg. Disk sec/[Read] [Write] (latency)
No simple single value interpretationMust examine all the above counters together
Interpreting CountersInterpreting Counters
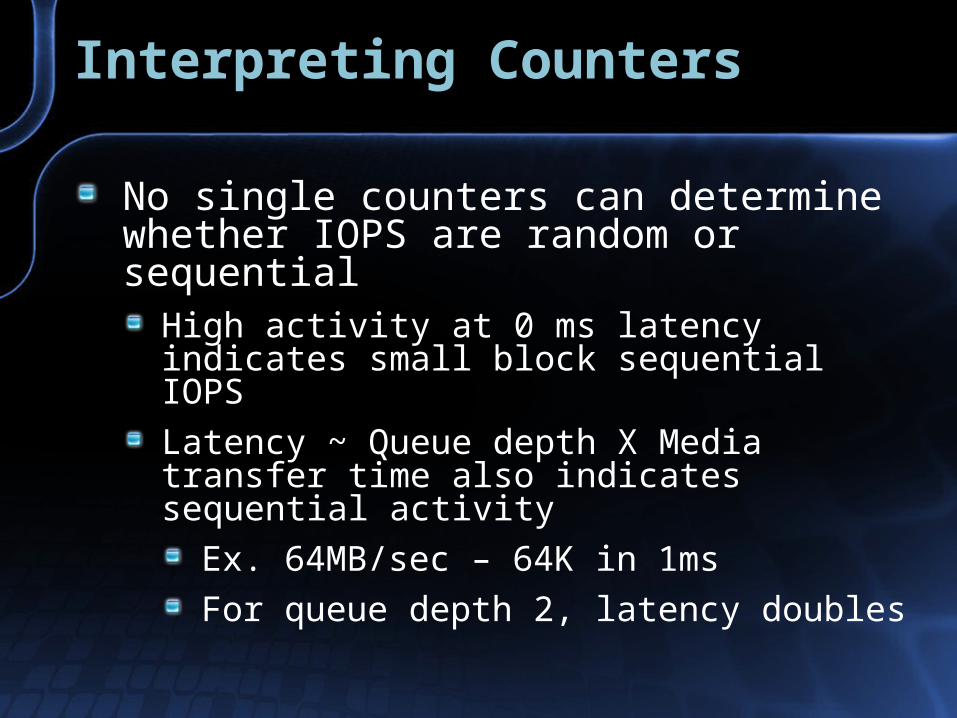
No single counters can determine whether IOPS are random or sequential
High activity at 0 ms latency indicates small block sequential IOPS
Latency ~ Queue depth X Media transfer time also indicates sequential activity
Ex. 64MB/sec – 64K in 1ms
For queue depth 2, latency doubles
Random IORandom IO
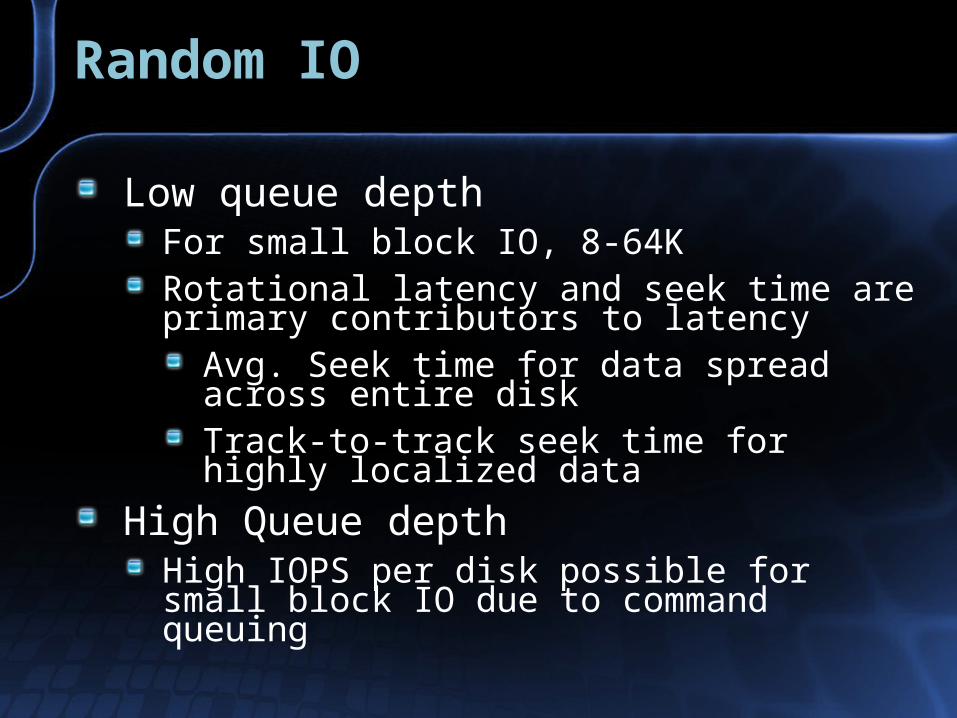
Low queue depthFor small block IO, 8-64KRotational latency and seek time are primary contributors to latency
Avg. Seek time for data spread across entire diskTrack-to-track seek time for highly localized data
High Queue depthHigh IOPS per disk possible for small block IO due to command queuing
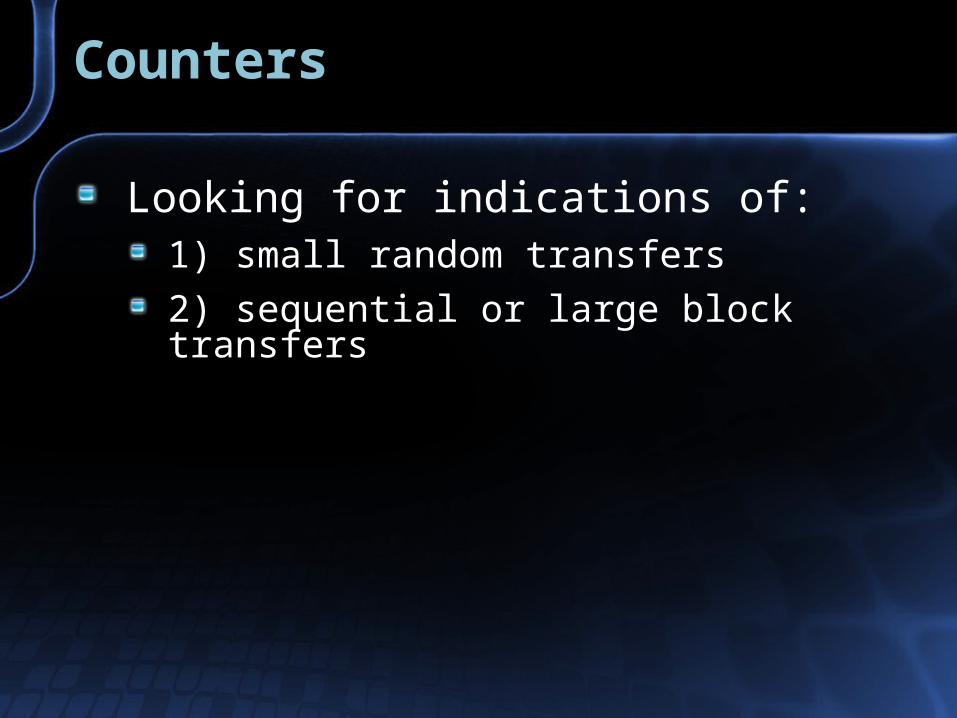
CountersCounters
Looking for indications of:1) small random transfers
2) sequential or large block transfers

IO Performance Tools
Storage Performance for SQL Server
IO Performance Tools & TestingIO Performance Tools & Testing

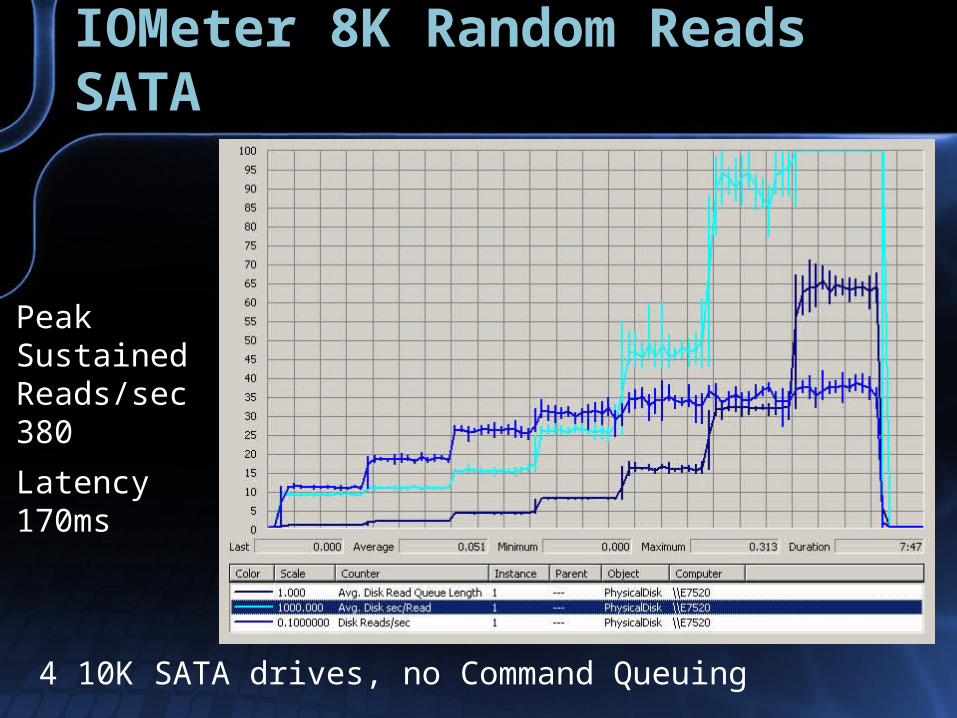
IOMeter 8K Random Reads SATAIOMeter 8K Random Reads SATA
4 10K SATA drives, no Command Queuing
Peak Sustained Reads/sec 380
Latency 170ms

8K Random Reads 10K SCSI8K Random Reads 10K SCSI
4 10K SCSI drives, Command Queuing
Peak Sustained Reads/sec 1000
Latency 127ms
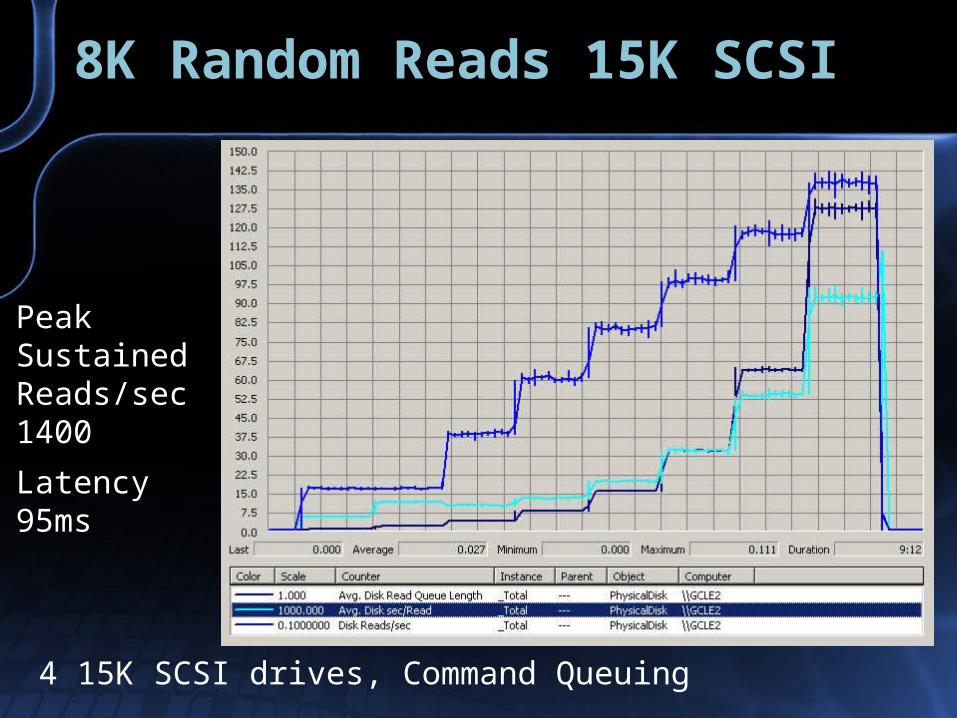
8K Random Reads 15K SCSI8K Random Reads 15K SCSI
4 15K SCSI drives, Command Queuing
Peak Sustained Reads/sec 1400
Latency 95ms

8K Random Read – Full Disk 8K Random Read – Full Disk
0
200
400
600
800
1000
1200
1400
1 2 4 8 16 32 64 128Queue Depth
Rea
ds/
sec
4-disk SATA 10K
4-disk SCSI 10K
4-disk SCSI 15K
0
50
100
150
200
1 2 4 8 16 32 64 128Queue Depth
Avg
sec
/ t
ran
sfer
4-disk SATA 10K
4-disk SCSI 10K
4-disk SCSI 15K
15K drives best on both peak IOPS and best latency
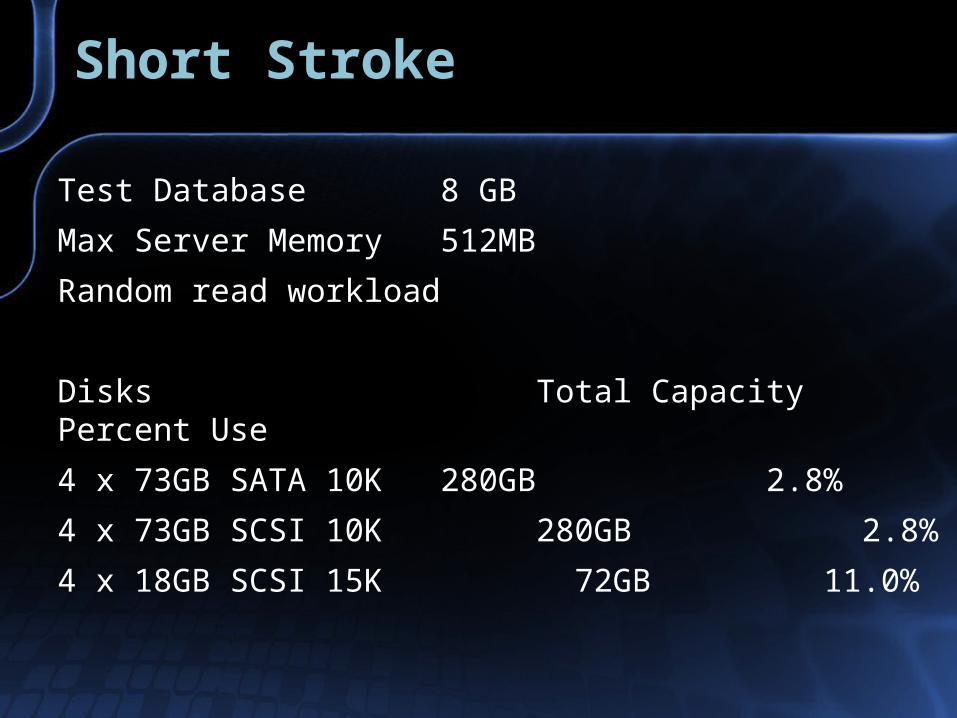
Short StrokeShort Stroke
Test Database 8 GB
Max Server Memory 512MB
Random read workload
Disks Total Capacity Percent Use
4 x 73GB SATA 10K 280GB 2.8%
4 x 73GB SCSI 10K 280GB 2.8%
4 x 18GB SCSI 15K 72GB 11.0%

Short Stroke SQL ReadsShort Stroke SQL Reads
70% more Reads/sec 10K 25% more Rd/sec 15K
50-70% lower disk latency
15K drives better than 10K at low disk queue, about equal at high queue
0
500
1000
1500
2000
1 2 4 8 16 24 32 48 64Queue Depth
Rea
d/s
ec
4-disk SATA 10K
4-disk SCSI 10K
4-disk SCSI 15K
0
20
40
60
80
100
1 2 4 8 16 24 32 48 64Queue Depth
Avg
Sec
/ T
ran
sfer 4-disk SATA 10K
4-disk SCSI 10K
4-disk SCSI 15K
IO Characteristics of SQL Server operations
Storage Performance for SQL Server
IO Characteristics of SQL Server OpsIO Characteristics of SQL Server Ops


SQL Reads 10K SATASQL Reads 10K SATA
4 10K SATA
Peak Sustained Reads/sec 670
Latency 92ms
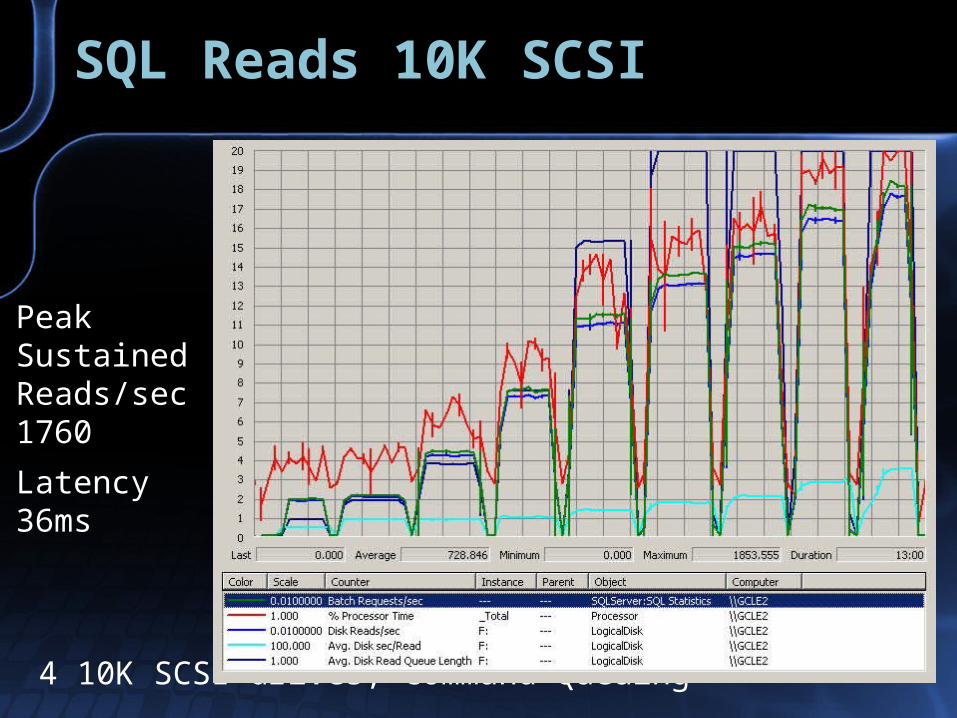
SQL Reads 10K SCSISQL Reads 10K SCSI
4 10K SCSI drives, Command Queuing
Peak Sustained Reads/sec 1760
Latency 36ms

SQL Reads 15K SCSISQL Reads 15K SCSI
4 15K SCSI drives, Command Queuing
Peak Sustained Reads/sec 1740
Latency 36ms

Low Write – Default RecoveryLow Write – Default Recovery
4 15K SCSI
Read activity drops sharply during checkpoints
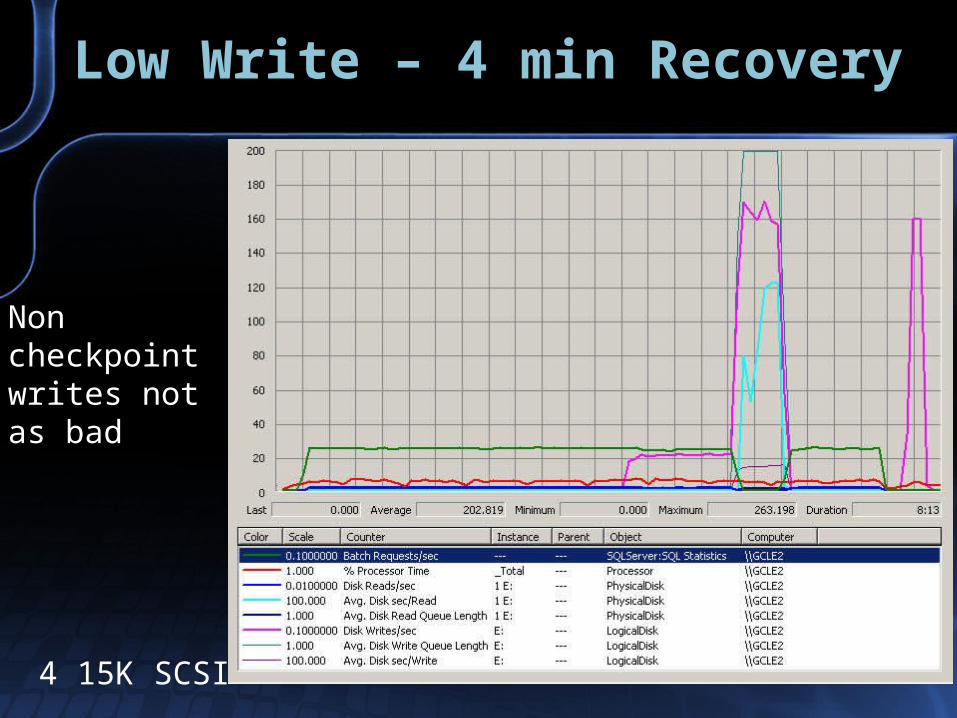
Low Write – 4 min RecoveryLow Write – 4 min Recovery
4 15K SCSI
Non checkpoint writes not as bad
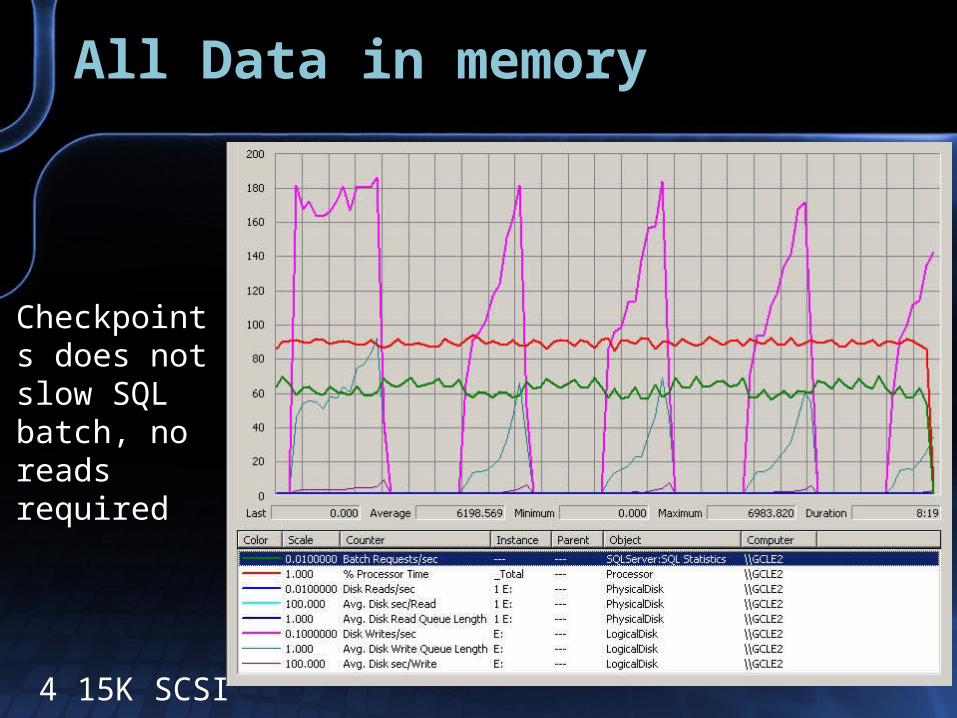
All Data in memoryAll Data in memory
4 15K SCSI
Checkpoints does not slow SQL batch, no reads required
Configuring the storage system
Storage Performance for SQL Server
Configuring Storage SystemsConfiguring Storage Systems
SCSI, FC, SATA & SAS Disk Units

RAID Performance ScalingRAID Performance Scaling
Operation RAID 0 RAID 1+0 RAID 5
Read 1 1 1
Small Write 1 1/2 1/4
Large Write 1 1/2 1 - 1/N
Theoretical performance per drive for N drives in a RAID group
RAID 5 write: 1 read data, 1 read parity, 1 write data, 1 write parity. Write penalty is reduced if entire stripe can be written
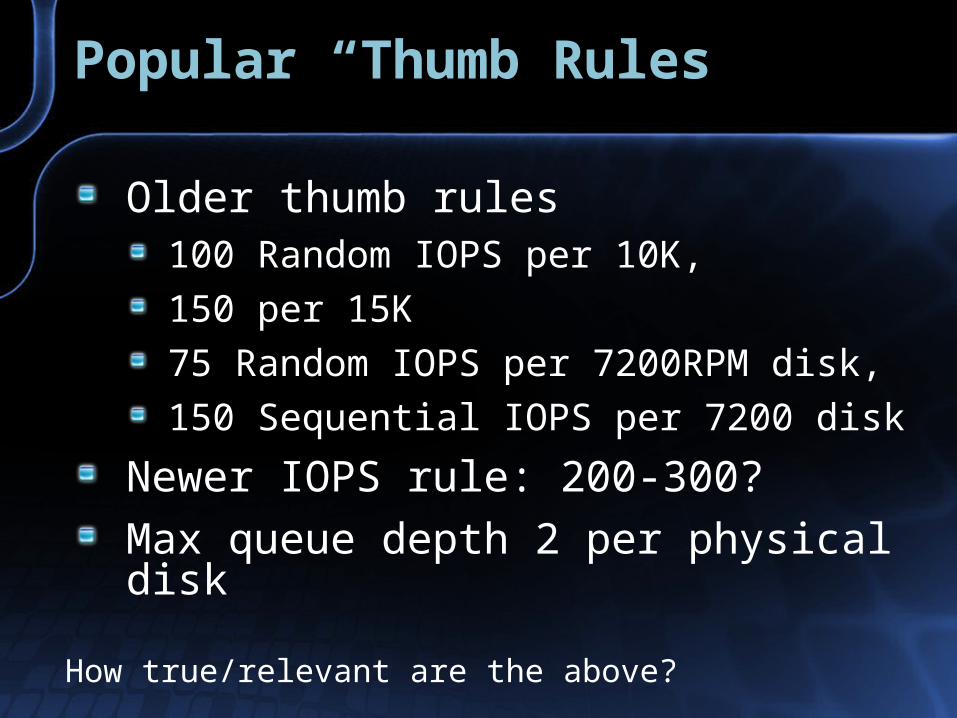
Popular “Thumb Rules”Popular “Thumb Rules”
Older thumb rules100 Random IOPS per 10K,
150 per 15K
75 Random IOPS per 7200RPM disk,
150 Sequential IOPS per 7200 disk
Newer IOPS rule: 200-300?
Max queue depth 2 per physical disk
How true/relevant are the above?
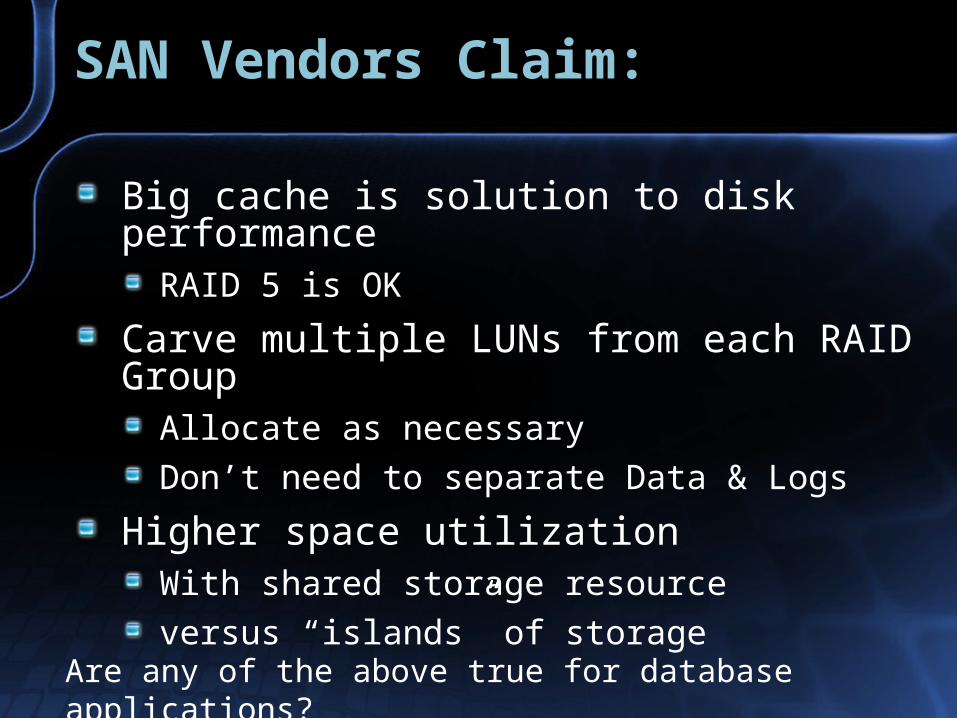
SAN Vendors Claim:SAN Vendors Claim:
Big cache is solution to disk performance
RAID 5 is OK
Carve multiple LUNs from each RAID Group
Allocate as necessary
Don’t need to separate Data & Logs
Higher space utilizationWith shared storage resource
versus “islands” of storageAre any of the above true for database applications?

File placement strategies
Storage Performance for SQL Server

TopicsTopics
Storage Performance CharacteristicsDisk – Random & Sequential access
Arrays & SAN
Database LoadData, Log & Tempdb
Transactions, Reports,
Checkpoints & Transaction log backup
Storage Recommendations

Random Read SummaryRandom Read Summary
Command QueuingSignificantly increases IOPS at high disk queue
but higher latencyFully supported in SCSI/FC systemsNew SATA disks, not yet in controllers (?)
Short StrokesUse only small fraction of disk spaceFurther increases IO Lower latency
Sequential Disk AccessSequential Disk Access
Scales nearly linear with number of disks
50-70MB/sec per diskSATA – no controller limitationsSCSI – U320 – practical limit 240MB/sec?FC – 2Gbit/sec – 170MB/sec bidirectional
Bus architecturePCI-X 2 Slots, 100MHz, 800MB/secPCI-e x4 1GB/sec bidirectional
SAN – 9.6MB/sec per disk?
Sequential Disk AccessSequential Disk Access
Distribute disks over multiple SCSI channels or FC ports
SCSI
7 disks per SCSI channel,
2 SCSI ports per 14 disk rack
FC – limited expansion in SAN?
1 rack per port
Distribute HBAs over multiple PCI-X busses
Distribute data across multiple files?
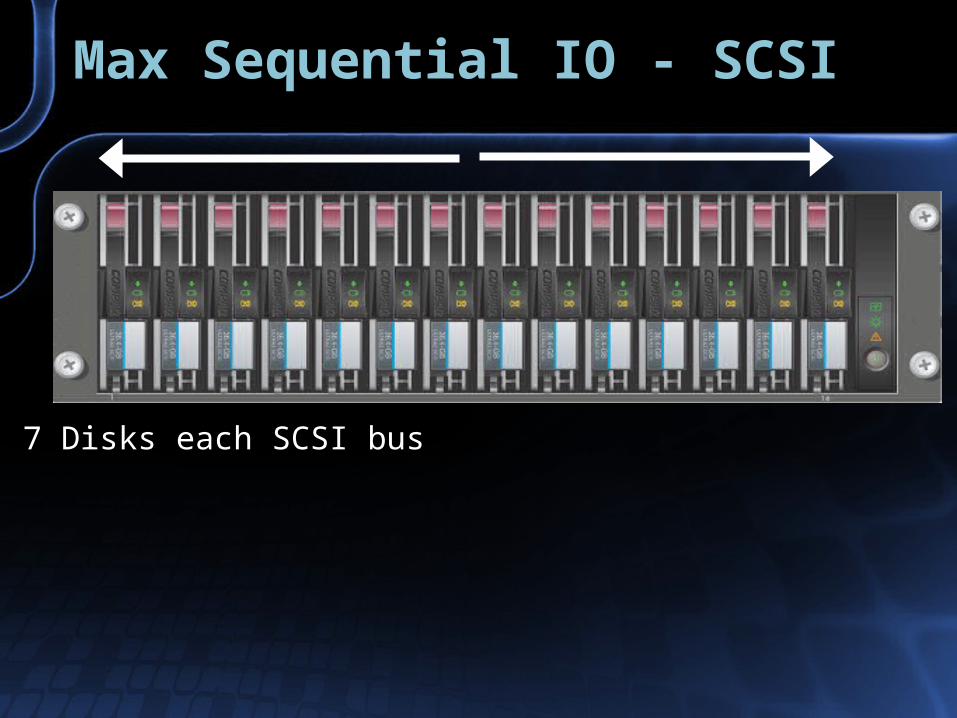
Max Sequential IO - SCSIMax Sequential IO - SCSI
7 Disks each SCSI bus
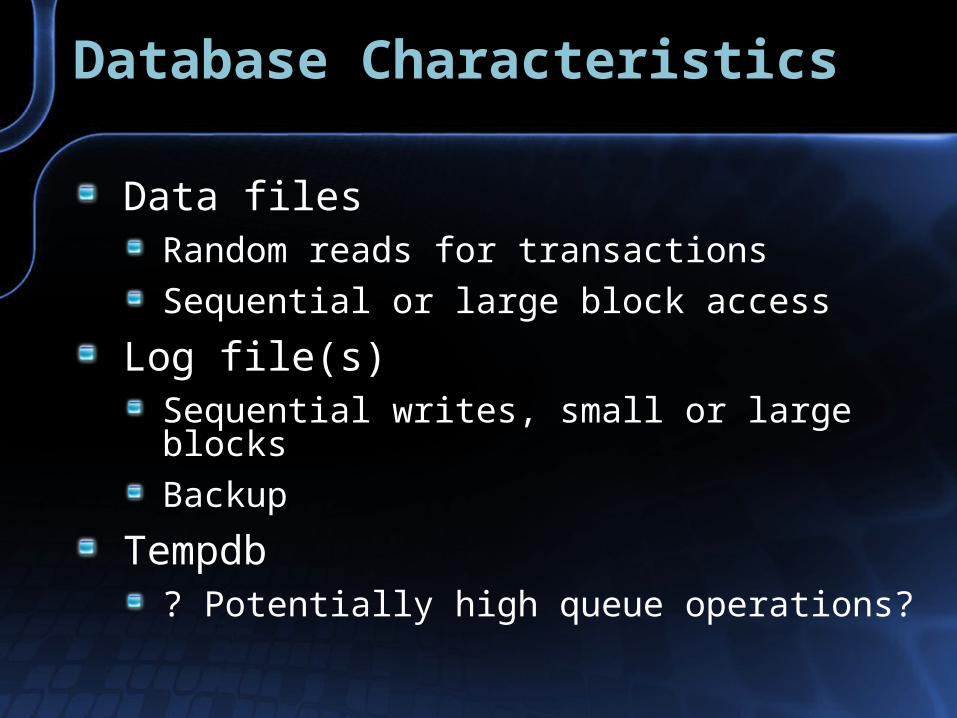
Database CharacteristicsDatabase Characteristics
Data filesRandom reads for transactions
Sequential or large block access
Log file(s)Sequential writes, small or large blocks
Backup
Tempdb? Potentially high queue operations?

Checkpoint SummaryCheckpoint Summary
All dirty data pages dumped to disk queueData reads are normally prioritized over writes,
But any reads issued during checkpoint must wait until outstanding writes complete?
SQL 2005 has smarter checkpoint
Disk should have sufficient peak IO to minimize checkpoint impact
In memory data also works
Trace Flag 3505 disable automatic checkpoint
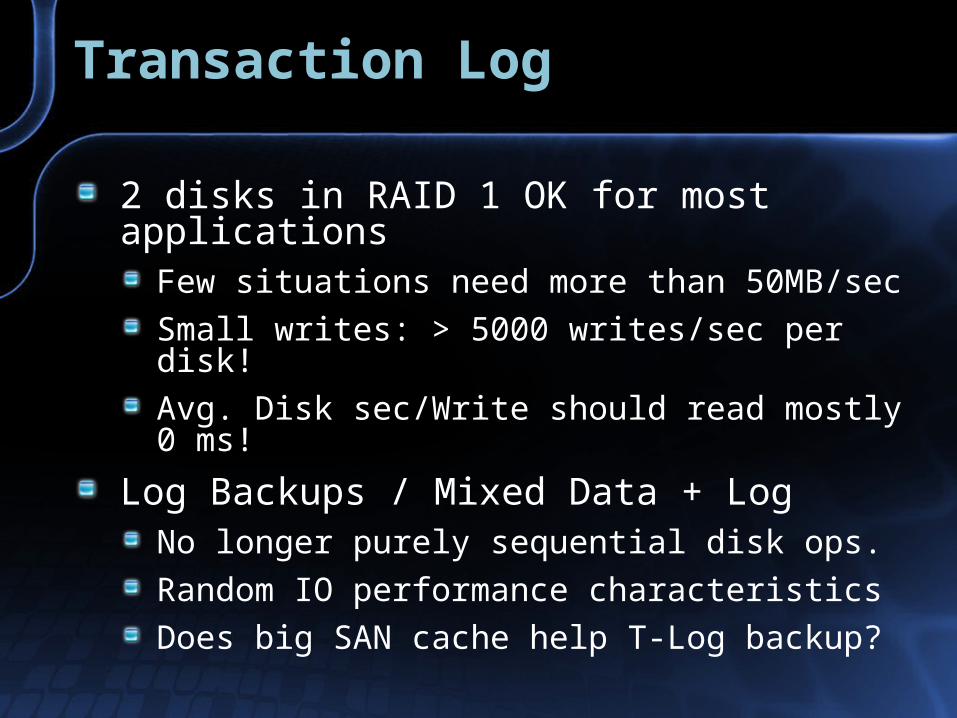
Transaction LogTransaction Log
2 disks in RAID 1 OK for most applications
Few situations need more than 50MB/sec
Small writes: > 5000 writes/sec per disk!
Avg. Disk sec/Write should read mostly 0 ms!
Log Backups / Mixed Data + LogNo longer purely sequential disk ops.
Random IO performance characteristics
Does big SAN cache help T-Log backup?
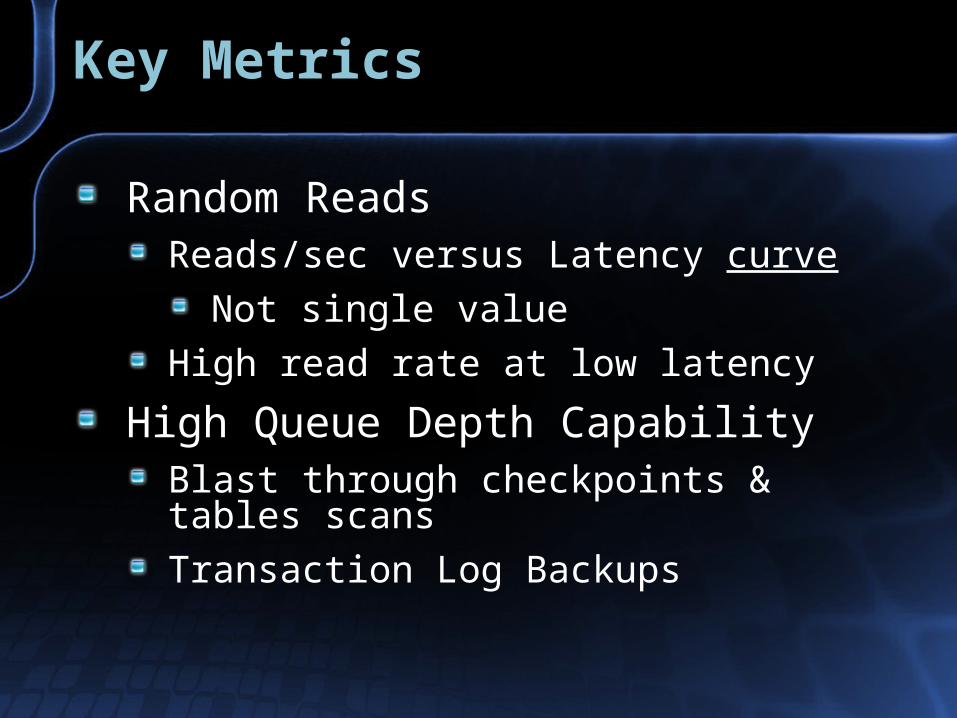
Key MetricsKey Metrics
Random ReadsReads/sec versus Latency curve
Not single value
High read rate at low latency
High Queue Depth CapabilityBlast through checkpoints & tables scans
Transaction Log Backups

Reads/sec versus LatencyReads/sec versus Latency
0
100
200
300
400
500
600
700
800
900
0.000 0.005 0.010 0.015 0.020 0.025 0.030 0.035 0.040 0.045 0.050
Avg Disk sec/Read
Rea
ds/s
ec

Queue Depth versus LatencyQueue Depth versus Latency
0
50
100
150
200
250
300
0.000 0.050 0.100 0.150 0.200 0.250 0.300 0.350 0.400
Avg. sec/Read
Avg
. Dis
k Q
ueue
Len
gth

Reads versus Queue DepthReads versus Queue Depth
0
100
200
300
400
500
600
700
800
900
1000
0 20 40 60Queue
IOP
S

Storage SystemsStorage Systems
Large Spindle count for random IONormal low queue IO rate
Checkpoint IO capability
Transaction log backup
Multiple Channels for bandwidthSCSI – U320 – 240MB/sec max?
FC 2Gbit/sec full-duplex – 170MB/sec
SATA/SAS – disk has its own bus

SAN Specs EMCSAN Specs EMC
Clariion IOPS* MB/sec Disks FC
CX300 50K 680 60 4F/2B
CX500 120K 760 120 4F/4B
CX700 200K 1520 240 8F/8B
Symmetrix IOPs MB/sec Disks FC
DMX800 60/120 8/16
DMX1000 144 16/32
DMX2000 275K? 3000? 288 32/64
Peak IOPS to cache?

SAN Specs - HPSAN Specs - HP
MSA IOPs MB/sec Disks Ports
500 14 1 SCSI
1000 30K 200 42 1 FC
1500 30K 200 56 1 FC
IOPs MB/sec Disks FC
XP12000 1.9M 120K 8000 1148 32/64
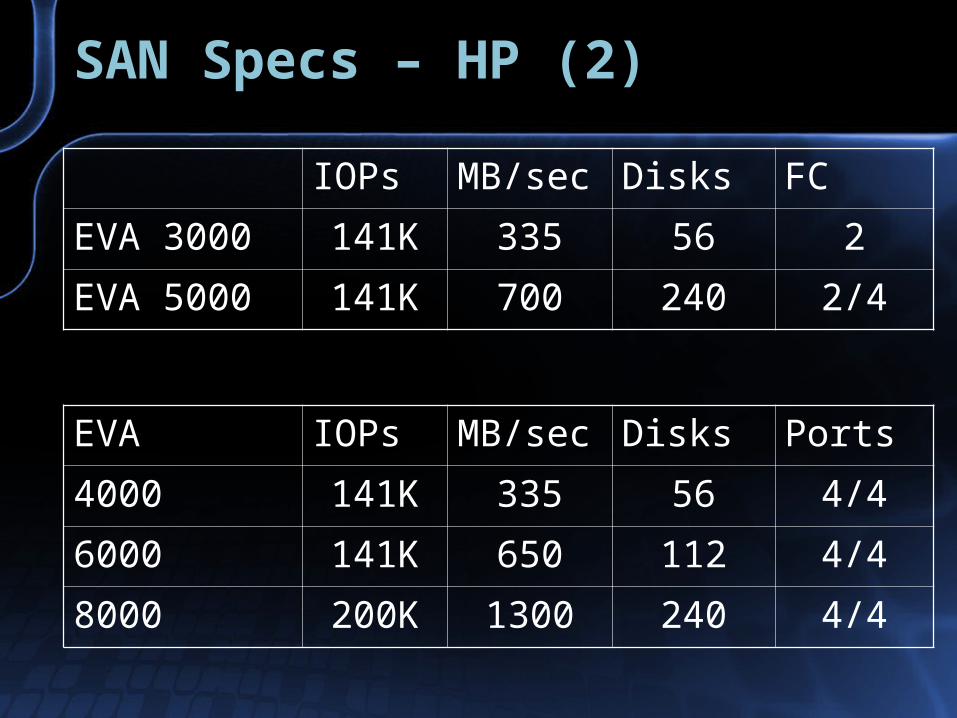
SAN Specs – HP (2)SAN Specs – HP (2)
EVA IOPs MB/sec Disks Ports
4000 141K 335 56 4/4
6000 141K 650 112 4/4
8000 200K 1300 240 4/4
IOPs MB/sec Disks FC
EVA 3000 141K 335 56 2
EVA 5000 141K 700 240 2/4
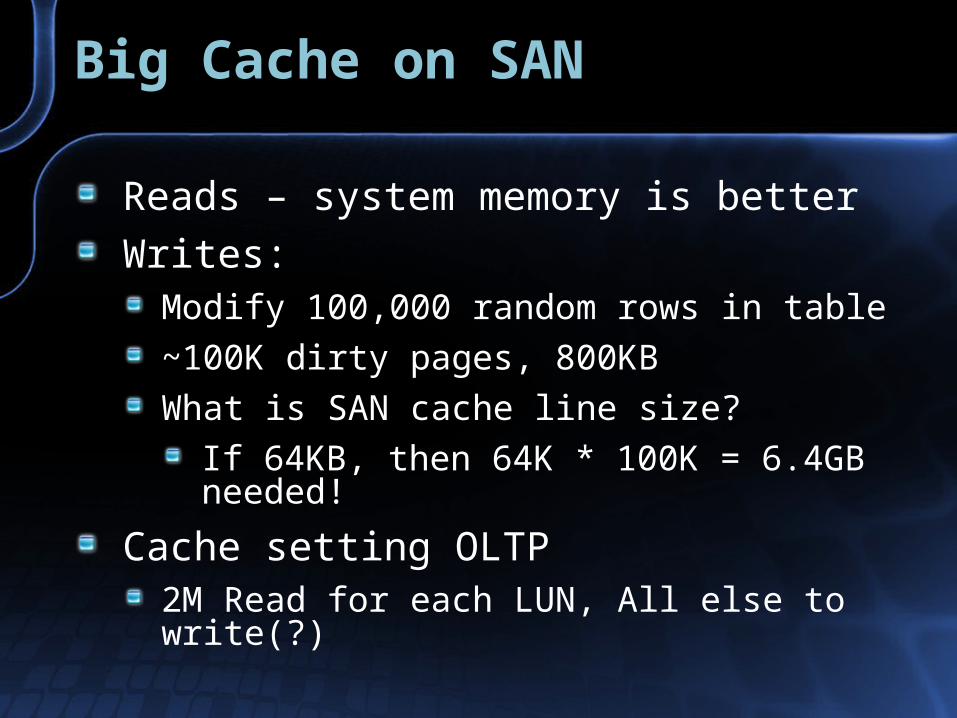
Big Cache on SANBig Cache on SAN
Reads – system memory is better
Writes:Modify 100,000 random rows in table
~100K dirty pages, 800KB
What is SAN cache line size?
If 64KB, then 64K * 100K = 6.4GB needed!
Cache setting OLTP2M Read for each LUN, All else to write(?)
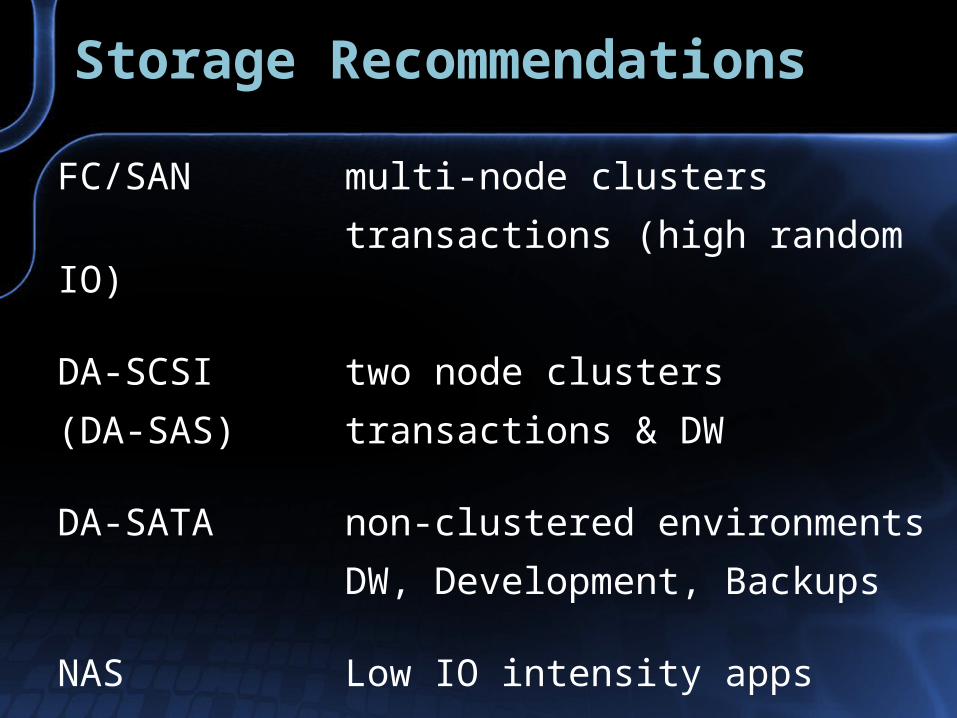
Storage RecommendationsStorage Recommendations
FC/SAN multi-node clusters
transactions (high random IO)
DA-SCSI two node clusters
(DA-SAS) transactions & DW
DA-SATA non-clustered environments
DW, Development, Backups
NAS Low IO intensity apps

SAN SummarySAN Summary
RAID 5 may have poor write performance
How likely is a large strip to be modified?
LUNs per RAID GroupAbsolutely essential to separate sequential & random loads. Low & High queue loads
Space UtilizationIs possible
But really want low space utilization for short stroke performance gains
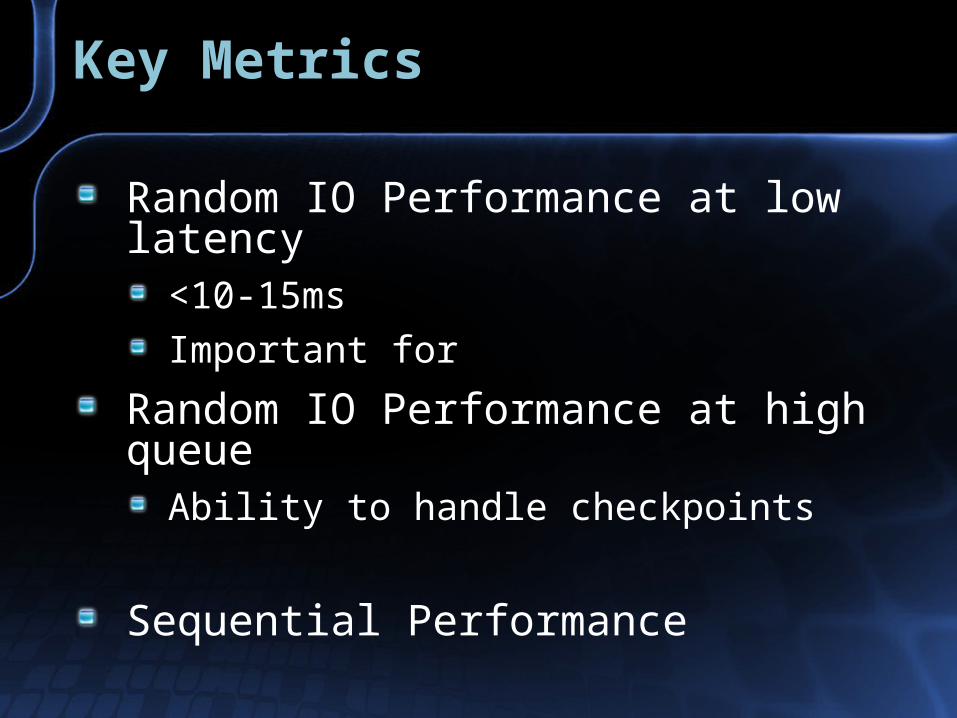
Key MetricsKey Metrics
Random IO Performance at low latency
<10-15ms
Important for
Random IO Performance at high queue
Ability to handle checkpoints
Sequential Performance

SummarySummary
Single number metrics have no meaningRandom and Sequential IO
Queue depth versus latency
Checkpoints and Transaction Log backup
Checkpoints generate high disks queuesT-Log BU disrupts zero latency writes
Very difficult to guarantee 100% fast response times (for SLA)Feedback: [email protected]