Embed Size (px)
Citation preview
Noname manuscript No.(will be inserted by the editor)
Quantitative structural analysis of simulated granularpackings of non-spherical particles
Ole Stenzel · Martin Salzer · VolkerSchmidt · Paul W. Cleary · Gary W.Delaney
Received: date / Accepted: date
Abstract A set of computationally generated granular packings of friction-less grains is statistically analyzed using tools from stochastic geometry. Weconsider both the graph of the solid phase (formed using the particle mid-points) and the pore-phase. Structural characteristics rooted in the analysis ofrandom point processes are seen to yield valuable insights into the underlyingstructure of granular systems. The graph of the solid phase is analyzed usingtraditional measures such as edge length and coordination number, as well asmore instructive measures of the overall transport properties such as geomet-ric tortuosity, where significant differences are observed in the windedness ofpaths through the different particle graphs considered. In contrast, the distri-butions of pore-phase characteristics have a similar shape for all consideredgranular packings. Interestingly, it is found that prolate and oblate ellipsoidpackings show a striking similarity between their solid-phase graphs as well asbetween their pore-phase graphs.
1 Introduction
Granular systems, such as sand, soils and powders are present throughout thenatural world [22,23], however there is still much that we do not understandabout their varied and complex behaviors. Even in their static state, we haveyet to develop methods sophisticated enough to fully characterize a granular
Ole Stenzel · Martin Salzer · Volker SchmidtInstitute of Stochastics, Ulm University, GermanyE-mail: [email protected]: [email protected]: [email protected]
Paul W. Cleary · Gary W. DelaneyCSIRO Computational Informatics, Clayton South, VIC 3169, AustraliaE-mail: [email protected]: [email protected]
2 Stenzel et al.
system, and to exactly relate the physical properties of the individual grains,and their geometric configuration, to the macroscopic properties of the system.
The study of particle packings is extremely important for understandingthe properties of granular materials but also has had significant impact inunderstanding liquids and jamming, and transitions in glasses and other ma-terials [40,39]. Since the early experimental work of Bernal on mono-dispersesphere packings [2], systems composed of purely spherical grains have been byfar the most studied. Even for the simplest mono-disperse sphere packings, arich and varied set of behaviors are observed as the density of the packing isvaried, with a key transition being found at the random close packing limit,where the system jams in its most dense disordered state. For spheres, thislimit is well established at a packing fraction of Φ ' 0.64 [2].
More recently, much attention has focused on investigating the propertiesof packings of non-spherical grains, which more realistically represent the mul-titude of grain shapes found in nature [12]. Studies of the role of anisotropy inthe grain shape using spherocylinders and ellipsoids have demonstrated thatthe packing density in random packings varies strongly with the aspect ratioof the grains [12,8,10,29]. Baram investigated the importance of polydisper-sity in ellipsoid packings and showed how the contact forces between particlesvaried as the shape deviated away from a sphere [38]. Packings of polyhedralshapes have been shown to have a strong propensity to self-assemble into var-ious ordered structures [37], while packings of tetrahedra have recently beenthe subject of considerable investigation and been shown to form hyperstaticpackings [36]. The importance of particle shape has also been demonstratedin determining the physical properties of granular packings for a range of 3Dprinted non-spherical shapes [35], with the stress response being found to bestrongly affected by the shape of the individual grains.
In this paper, we consider a set of computationally generated granularpackings and perform an extensive series of analyses to quantify the geomet-ric properties of both the solid and the pore-phase. The granular packingsconsidered have been chosen to capture several key features seen in granularsystems, and cover a range of density, anisotropy and order. The first gran-ular system is a random close packing of spheres, which represents probablyone of the most important and most studied of all granular systems [2,9,13,38]. We then consider two different ellipsoid packings composed of prolateand oblate grains, respectively. Ellipsoids are an important grain shape thatclosely approximates the shape of many real grains e.g. stones, tablets, rice,etc. These packings allow us to study the effect of anisotropy of the grainshape in random granular packings [8,10,29]. Finally, we consider a packing ofsuperballs (equiaxed superellipsoids) which have a shape similar to a roundedcube. This packing exhibits a large degree of structural ordering, and allowsus to compare and contrast the effect of such ordering compared to the otherless ordered packings.
A considerable part of the analysis is performed by the use of spatial graphs,which are widely applied to analyze or simulate complex structures in biology,materials science and many other areas, see e.g. [1,25,30,32]. Moreover, spatial
Quantitative structural analysis of simulated granular packings 3
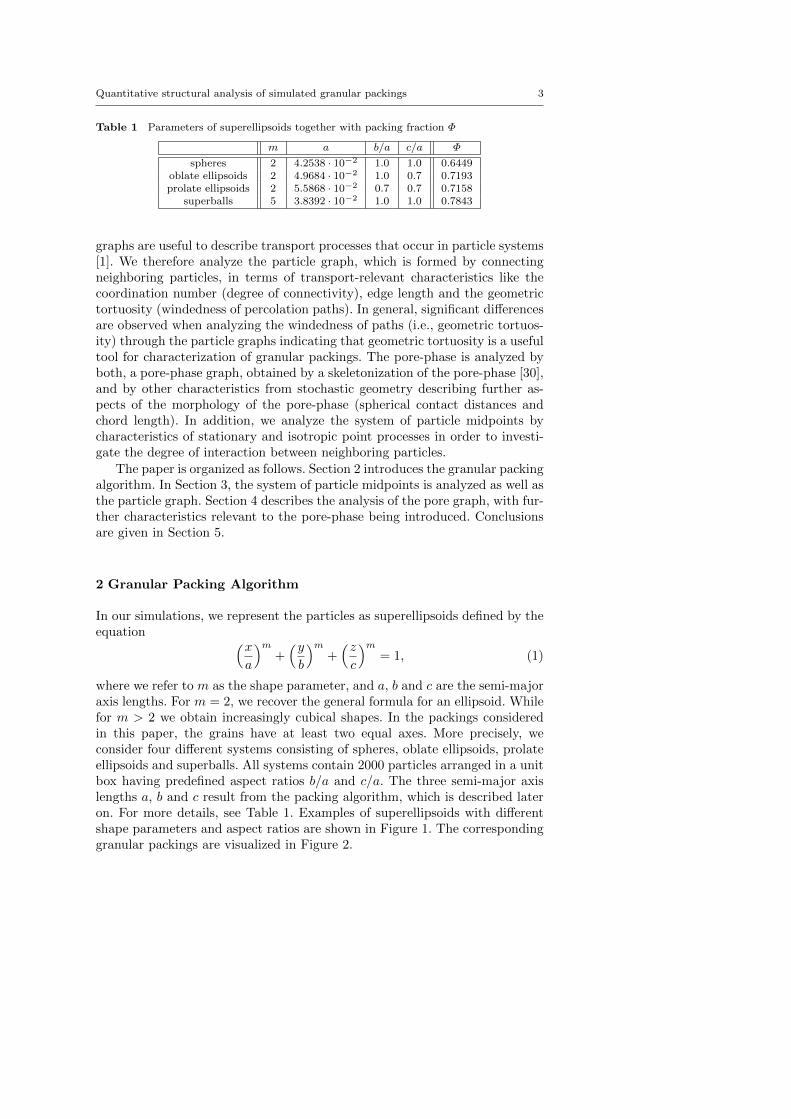
Table 1 Parameters of superellipsoids together with packing fraction Φ
m a b/a c/a Φ
spheres 2 4.2538 · 10−2 1.0 1.0 0.6449oblate ellipsoids 2 4.9684 · 10−2 1.0 0.7 0.7193prolate ellipsoids 2 5.5868 · 10−2 0.7 0.7 0.7158
superballs 5 3.8392 · 10−2 1.0 1.0 0.7843
graphs are useful to describe transport processes that occur in particle systems[1]. We therefore analyze the particle graph, which is formed by connectingneighboring particles, in terms of transport-relevant characteristics like thecoordination number (degree of connectivity), edge length and the geometrictortuosity (windedness of percolation paths). In general, significant differencesare observed when analyzing the windedness of paths (i.e., geometric tortuos-ity) through the particle graphs indicating that geometric tortuosity is a usefultool for characterization of granular packings. The pore-phase is analyzed byboth, a pore-phase graph, obtained by a skeletonization of the pore-phase [30],and by other characteristics from stochastic geometry describing further as-pects of the morphology of the pore-phase (spherical contact distances andchord length). In addition, we analyze the system of particle midpoints bycharacteristics of stationary and isotropic point processes in order to investi-gate the degree of interaction between neighboring particles.
The paper is organized as follows. Section 2 introduces the granular packingalgorithm. In Section 3, the system of particle midpoints is analyzed as well asthe particle graph. Section 4 describes the analysis of the pore graph, with fur-ther characteristics relevant to the pore-phase being introduced. Conclusionsare given in Section 5.
2 Granular Packing Algorithm
In our simulations, we represent the particles as superellipsoids defined by theequation (x
a
)m
+(yb
)m
+(zc
)m
= 1, (1)
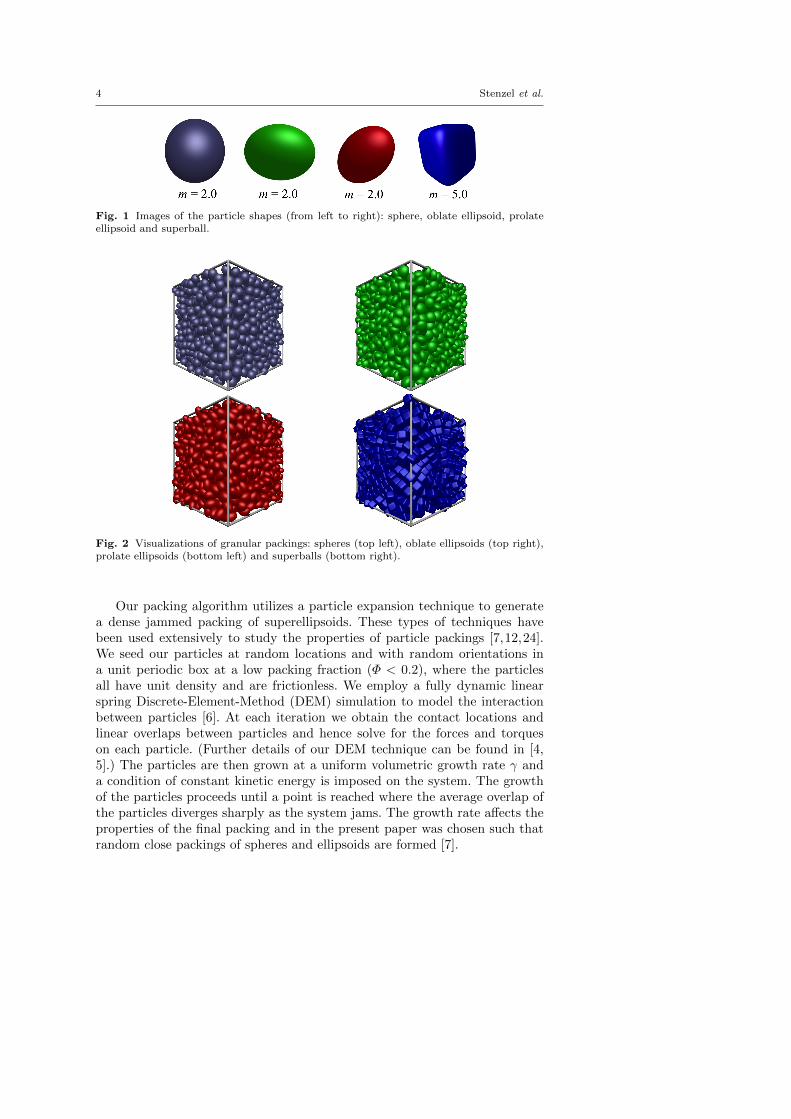
where we refer to m as the shape parameter, and a, b and c are the semi-majoraxis lengths. For m = 2, we recover the general formula for an ellipsoid. Whilefor m > 2 we obtain increasingly cubical shapes. In the packings consideredin this paper, the grains have at least two equal axes. More precisely, weconsider four different systems consisting of spheres, oblate ellipsoids, prolateellipsoids and superballs. All systems contain 2000 particles arranged in a unitbox having predefined aspect ratios b/a and c/a. The three semi-major axislengths a, b and c result from the packing algorithm, which is described lateron. For more details, see Table 1. Examples of superellipsoids with differentshape parameters and aspect ratios are shown in Figure 1. The correspondinggranular packings are visualized in Figure 2.
4 Stenzel et al.
Fig. 1 Images of the particle shapes (from left to right): sphere, oblate ellipsoid, prolateellipsoid and superball.
Fig. 2 Visualizations of granular packings: spheres (top left), oblate ellipsoids (top right),prolate ellipsoids (bottom left) and superballs (bottom right).
Our packing algorithm utilizes a particle expansion technique to generatea dense jammed packing of superellipsoids. These types of techniques havebeen used extensively to study the properties of particle packings [7,12,24].We seed our particles at random locations and with random orientations ina unit periodic box at a low packing fraction (Φ < 0.2), where the particlesall have unit density and are frictionless. We employ a fully dynamic linearspring Discrete-Element-Method (DEM) simulation to model the interactionbetween particles [6]. At each iteration we obtain the contact locations andlinear overlaps between particles and hence solve for the forces and torqueson each particle. (Further details of our DEM technique can be found in [4,5].) The particles are then grown at a uniform volumetric growth rate γ anda condition of constant kinetic energy is imposed on the system. The growthof the particles proceeds until a point is reached where the average overlap ofthe particles diverges sharply as the system jams. The growth rate affects theproperties of the final packing and in the present paper was chosen such thatrandom close packings of spheres and ellipsoids are formed [7].
Quantitative structural analysis of simulated granular packings 5
3 Analysis of Particle Systems
3.1 Analysis of particle midpoints
In this section, we analyze the structural properties of the systems of particlemidpoints. Thereby, we obtain quantitative information about the degree ofspatial interaction between neighboring particle midpoints or particles mid-points with a certain distance, respectively. We use characteristics which arecommonly applied in the analysis of stationary and isotropic point processes,see for example [21].
3.1.1 Pair-correlation function
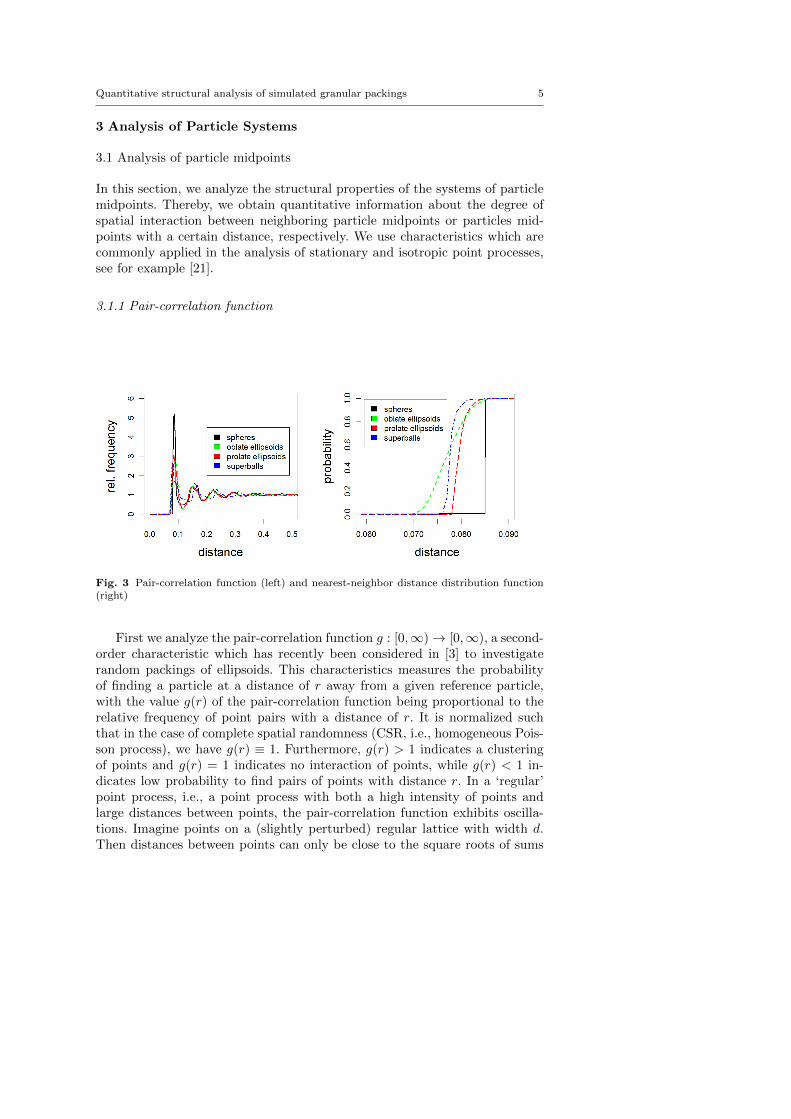
Fig. 3 Pair-correlation function (left) and nearest-neighbor distance distribution function(right)
First we analyze the pair-correlation function g : [0,∞)→ [0,∞), a second-order characteristic which has recently been considered in [3] to investigaterandom packings of ellipsoids. This characteristics measures the probabilityof finding a particle at a distance of r away from a given reference particle,with the value g(r) of the pair-correlation function being proportional to therelative frequency of point pairs with a distance of r. It is normalized suchthat in the case of complete spatial randomness (CSR, i.e., homogeneous Pois-son process), we have g(r) ≡ 1. Furthermore, g(r) > 1 indicates a clusteringof points and g(r) = 1 indicates no interaction of points, while g(r) < 1 in-dicates low probability to find pairs of points with distance r. In a ‘regular’point process, i.e., a point process with both a high intensity of points andlarge distances between points, the pair-correlation function exhibits oscilla-tions. Imagine points on a (slightly perturbed) regular lattice with width d.Then distances between points can only be close to the square roots of sums
6 Stenzel et al.
of (n1d)2, (n2d)2, (n3d)2 with n1, n2, n3 ≥ 0. Therefore, the pair-correlationfunction will only have peaks at these values.
For the particle packings, we see that the highest peak appears for thespheres, see Figure 3 (left). This is due to the constant distance from thesurface of a sphere to its center, which leads to all its contacting grains havingthe same distance between grain centers and thus a high probability to findpairs of grains at this distance. The first peak for the other three shapes islower and broader, due to the range of distances from the surface of the grainsto their centers as a result of their non-spherical shape. All the grain shapesthen exhibit decaying oscillations in the pair-correlation function for largerdistances.
3.1.2 Nearest-neighbor distance
Next, we consider the distribution function of nearest-neighbor distances. Froma so-called ‘typical grain’, we analyze the distribution of the distances fromthe center point to the center of its nearest-neighbor. Considering Figure 3(right), we see that there are significant differences for the different grainsshapes. The system of spheres has - as expected - a constant nearest-neighbordistance, corresponding to twice the sphere radius. There are large differencesbetween the prolate and oblate ellipsoids, due to the differences in their semi-minor and semi-major axis lengths. For both ellipsoid cases the probability of aneighboring contact occurring becomes non-zero at twice the semi-minor axislength. The rate of increase in the probability for the prolate grains is muchhigher than for the oblate grains, this shows that there is reduced variationin the nearest-neighbor distances for the prolate grains due to two of theiraxes having the shorter relative length, compared to one for the oblate grains.For the system of superballs, the probability of a neighboring contact becomesnon-zero at twice the distance from the center to a face on the grain’s surface.The probability again increases at a fast rate, due to the prevalence for faceon face contacts within the system, which leads to a low variability in thenearest-neighbor distances.
3.2 Analysis of particle graph
Spatial graphs are widely applied to analyze or simulate complex structuresin biology, materials science and many other areas, see [1,25,30,32]. In par-ticular, spatial graphs are useful to describe transport processes that occurin particle systems. Previous use of graph theory to study granular materialshas focused on investigations of systems of spherical particles and has mainlyconsidered the properties of the force network [19,33]. Here we will extendthis consideration to a much more detailed consideration of the geometricalproperties of both the solid phase and the pore-phase within systems of bothspherical and non-spherical grains. A graph G can be described by the pairG = (V,E), see [11], where V = {x1, . . . ,xn} ⊂ R3 is a set of vertices and
Quantitative structural analysis of simulated granular packings 7
E = {(xi1 ,xj1), . . . (xik ,xjk),xil 6= xjl ∈ V } ⊂ V × V a set of edges. Graphscan describe the main structural aspects of the granular systems and thereforeare a useful tool for the analysis and characterization of granular systems.
In order to apply spatial graphs to the granular systems, we transformthe system of particles on a voxel grid with resolution 500 × 500 × 500. Thisdiscretisation is especially useful for extraction of the pore-phase graph, seeSection 4.2, since graph-extraction algorithms are available for voxel-basedsystems. Furthermore, the discretisation allows for a less complex approachto calculate distances between particles or distances of the pore-phase to theparticle system more easily.
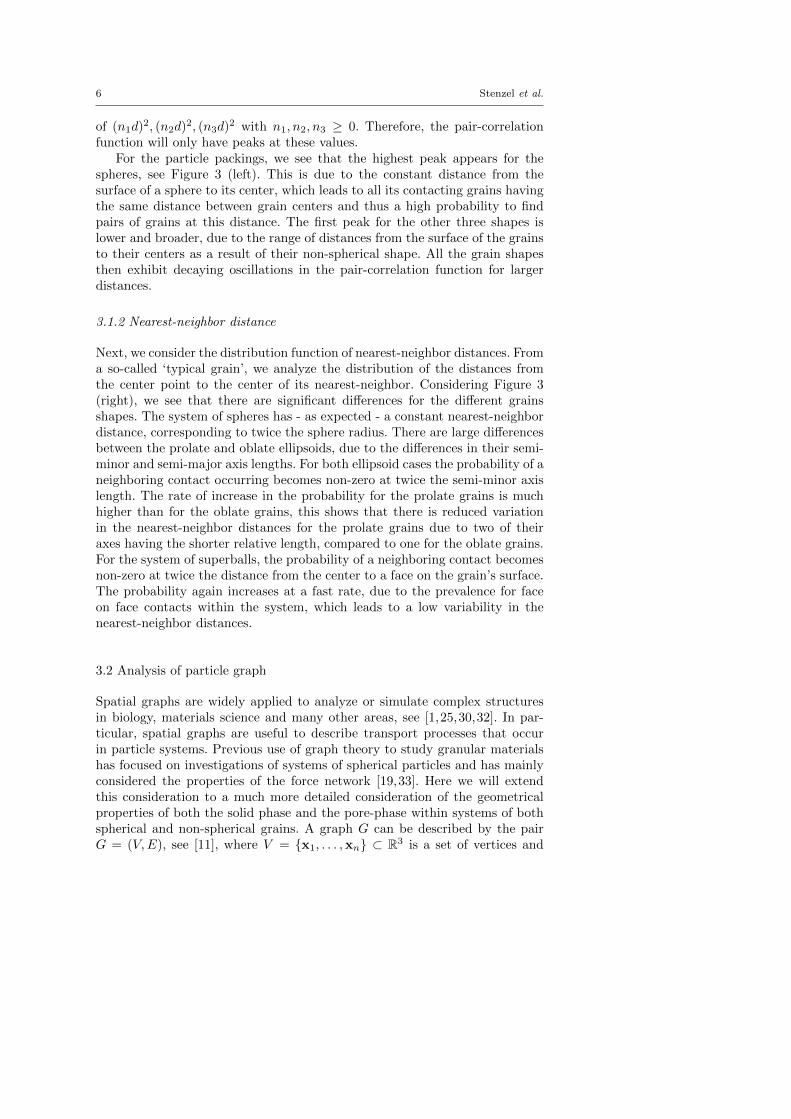
Fig. 4 Illustration of particle graph
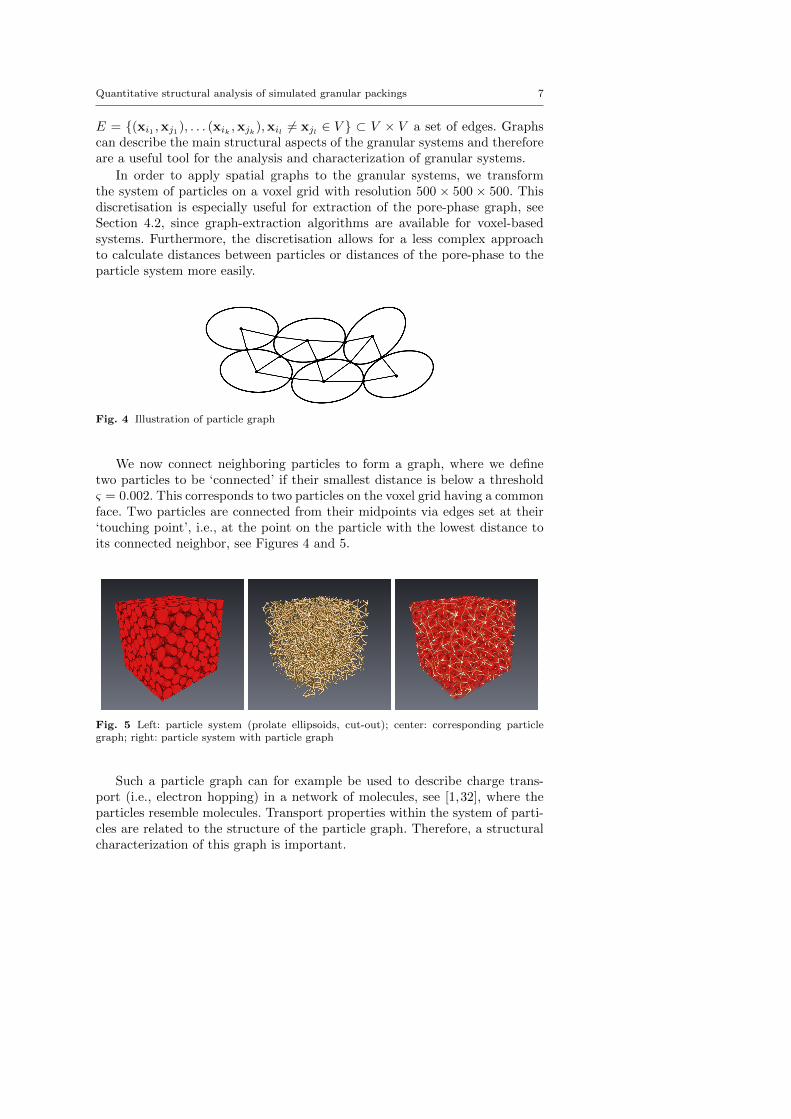
We now connect neighboring particles to form a graph, where we definetwo particles to be ‘connected’ if their smallest distance is below a thresholdς = 0.002. This corresponds to two particles on the voxel grid having a commonface. Two particles are connected from their midpoints via edges set at their‘touching point’, i.e., at the point on the particle with the lowest distance toits connected neighbor, see Figures 4 and 5.
Fig. 5 Left: particle system (prolate ellipsoids, cut-out); center: corresponding particlegraph; right: particle system with particle graph
Such a particle graph can for example be used to describe charge trans-port (i.e., electron hopping) in a network of molecules, see [1,32], where theparticles resemble molecules. Transport properties within the system of parti-cles are related to the structure of the particle graph. Therefore, a structuralcharacterization of this graph is important.
8 Stenzel et al.
3.2.1 Graph coordination number
mean variance
spheres 6.94 1.86oblate ellipsoids 10.14 1.32prolate ellipsoids 10.21 1.22
superballs 6.88 11.64
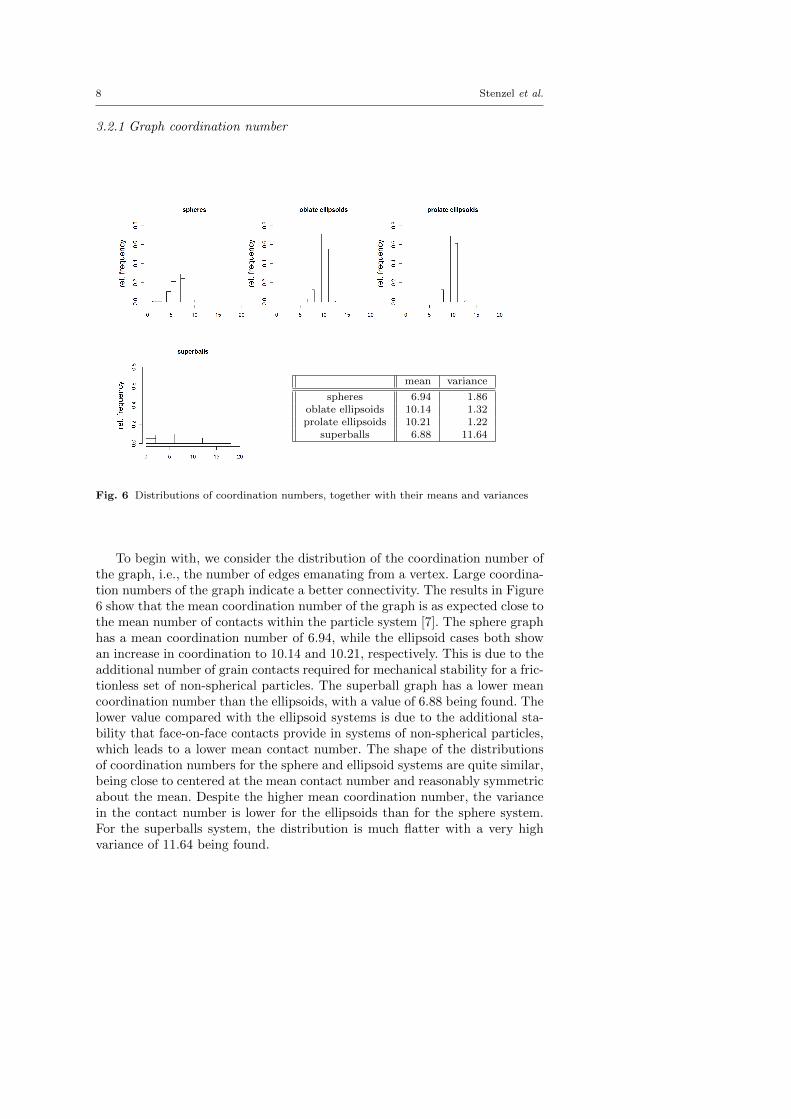
Fig. 6 Distributions of coordination numbers, together with their means and variances
To begin with, we consider the distribution of the coordination number ofthe graph, i.e., the number of edges emanating from a vertex. Large coordina-tion numbers of the graph indicate a better connectivity. The results in Figure6 show that the mean coordination number of the graph is as expected close tothe mean number of contacts within the particle system [7]. The sphere graphhas a mean coordination number of 6.94, while the ellipsoid cases both showan increase in coordination to 10.14 and 10.21, respectively. This is due to theadditional number of grain contacts required for mechanical stability for a fric-tionless set of non-spherical particles. The superball graph has a lower meancoordination number than the ellipsoids, with a value of 6.88 being found. Thelower value compared with the ellipsoid systems is due to the additional sta-bility that face-on-face contacts provide in systems of non-spherical particles,which leads to a lower mean contact number. The shape of the distributionsof coordination numbers for the sphere and ellipsoid systems are quite similar,being close to centered at the mean contact number and reasonably symmetricabout the mean. Despite the higher mean coordination number, the variancein the contact number is lower for the ellipsoids than for the sphere system.For the superballs system, the distribution is much flatter with a very highvariance of 11.64 being found.
Quantitative structural analysis of simulated granular packings 9
3.2.2 Edge length
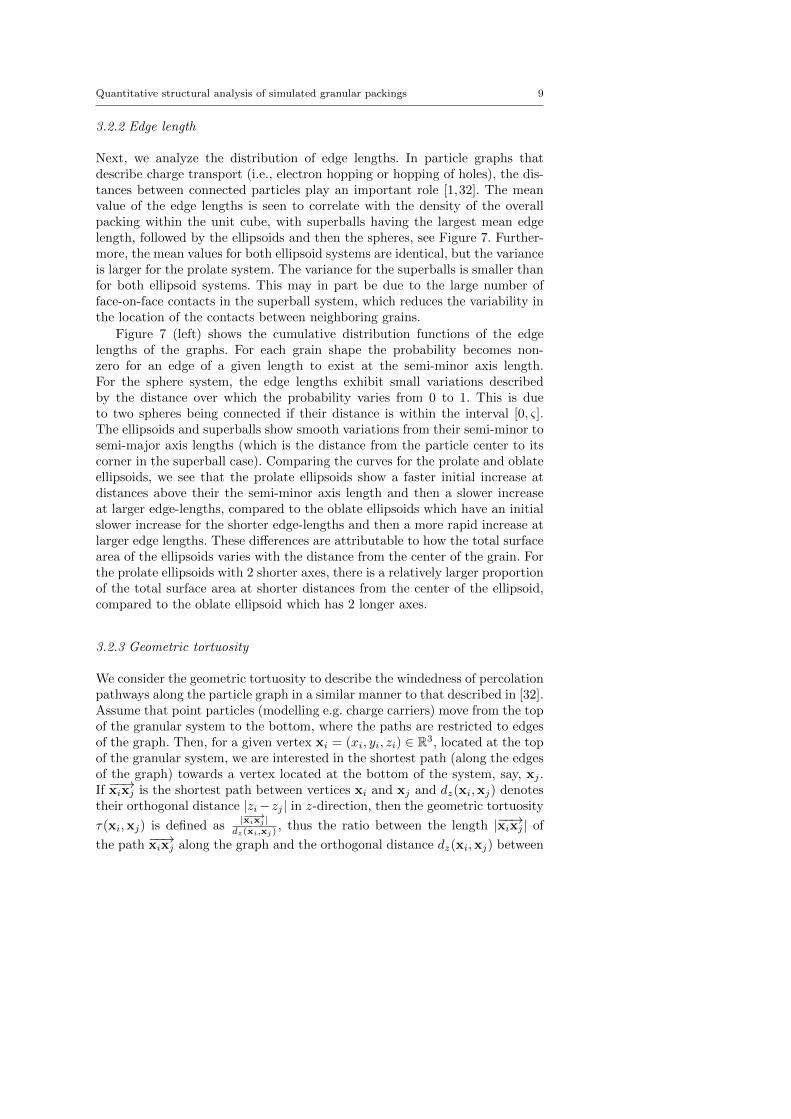
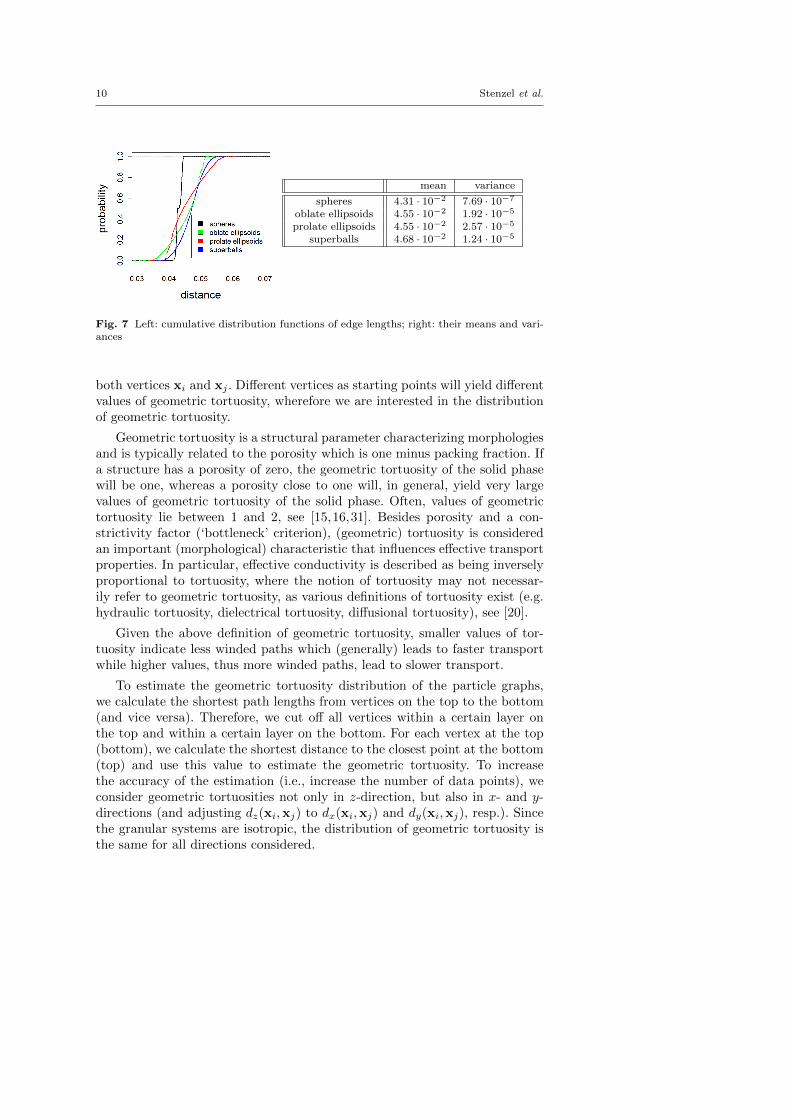
Next, we analyze the distribution of edge lengths. In particle graphs thatdescribe charge transport (i.e., electron hopping or hopping of holes), the dis-tances between connected particles play an important role [1,32]. The meanvalue of the edge lengths is seen to correlate with the density of the overallpacking within the unit cube, with superballs having the largest mean edgelength, followed by the ellipsoids and then the spheres, see Figure 7. Further-more, the mean values for both ellipsoid systems are identical, but the varianceis larger for the prolate system. The variance for the superballs is smaller thanfor both ellipsoid systems. This may in part be due to the large number offace-on-face contacts in the superball system, which reduces the variability inthe location of the contacts between neighboring grains.
Figure 7 (left) shows the cumulative distribution functions of the edgelengths of the graphs. For each grain shape the probability becomes non-zero for an edge of a given length to exist at the semi-minor axis length.For the sphere system, the edge lengths exhibit small variations describedby the distance over which the probability varies from 0 to 1. This is dueto two spheres being connected if their distance is within the interval [0, ς].The ellipsoids and superballs show smooth variations from their semi-minor tosemi-major axis lengths (which is the distance from the particle center to itscorner in the superball case). Comparing the curves for the prolate and oblateellipsoids, we see that the prolate ellipsoids show a faster initial increase atdistances above their the semi-minor axis length and then a slower increaseat larger edge-lengths, compared to the oblate ellipsoids which have an initialslower increase for the shorter edge-lengths and then a more rapid increase atlarger edge lengths. These differences are attributable to how the total surfacearea of the ellipsoids varies with the distance from the center of the grain. Forthe prolate ellipsoids with 2 shorter axes, there is a relatively larger proportionof the total surface area at shorter distances from the center of the ellipsoid,compared to the oblate ellipsoid which has 2 longer axes.
3.2.3 Geometric tortuosity
We consider the geometric tortuosity to describe the windedness of percolationpathways along the particle graph in a similar manner to that described in [32].Assume that point particles (modelling e.g. charge carriers) move from the topof the granular system to the bottom, where the paths are restricted to edgesof the graph. Then, for a given vertex xi = (xi, yi, zi) ∈ R3, located at the topof the granular system, we are interested in the shortest path (along the edgesof the graph) towards a vertex located at the bottom of the system, say, xj .If −−→xixj is the shortest path between vertices xi and xj and dz(xi,xj) denotestheir orthogonal distance |zi−zj | in z-direction, then the geometric tortuosity
τ(xi,xj) is defined as|−−→xixj |
dz(xi,xj), thus the ratio between the length |−−→xixj | of
the path −−→xixj along the graph and the orthogonal distance dz(xi,xj) between
10 Stenzel et al.
mean variance
spheres 4.31 · 10−2 7.69 · 10−7
oblate ellipsoids 4.55 · 10−2 1.92 · 10−5
prolate ellipsoids 4.55 · 10−2 2.57 · 10−5
superballs 4.68 · 10−2 1.24 · 10−5
Fig. 7 Left: cumulative distribution functions of edge lengths; right: their means and vari-ances
both vertices xi and xj . Different vertices as starting points will yield differentvalues of geometric tortuosity, wherefore we are interested in the distributionof geometric tortuosity.
Geometric tortuosity is a structural parameter characterizing morphologiesand is typically related to the porosity which is one minus packing fraction. Ifa structure has a porosity of zero, the geometric tortuosity of the solid phasewill be one, whereas a porosity close to one will, in general, yield very largevalues of geometric tortuosity of the solid phase. Often, values of geometrictortuosity lie between 1 and 2, see [15,16,31]. Besides porosity and a con-strictivity factor (‘bottleneck’ criterion), (geometric) tortuosity is consideredan important (morphological) characteristic that influences effective transportproperties. In particular, effective conductivity is described as being inverselyproportional to tortuosity, where the notion of tortuosity may not necessar-ily refer to geometric tortuosity, as various definitions of tortuosity exist (e.g.hydraulic tortuosity, dielectrical tortuosity, diffusional tortuosity), see [20].
Given the above definition of geometric tortuosity, smaller values of tor-tuosity indicate less winded paths which (generally) leads to faster transportwhile higher values, thus more winded paths, lead to slower transport.
To estimate the geometric tortuosity distribution of the particle graphs,we calculate the shortest path lengths from vertices on the top to the bottom(and vice versa). Therefore, we cut off all vertices within a certain layer onthe top and within a certain layer on the bottom. For each vertex at the top(bottom), we calculate the shortest distance to the closest point at the bottom(top) and use this value to estimate the geometric tortuosity. To increasethe accuracy of the estimation (i.e., increase the number of data points), weconsider geometric tortuosities not only in z-direction, but also in x- and y-directions (and adjusting dz(xi,xj) to dx(xi,xj) and dy(xi,xj), resp.). Sincethe granular systems are isotropic, the distribution of geometric tortuosity isthe same for all directions considered.
Quantitative structural analysis of simulated granular packings 11
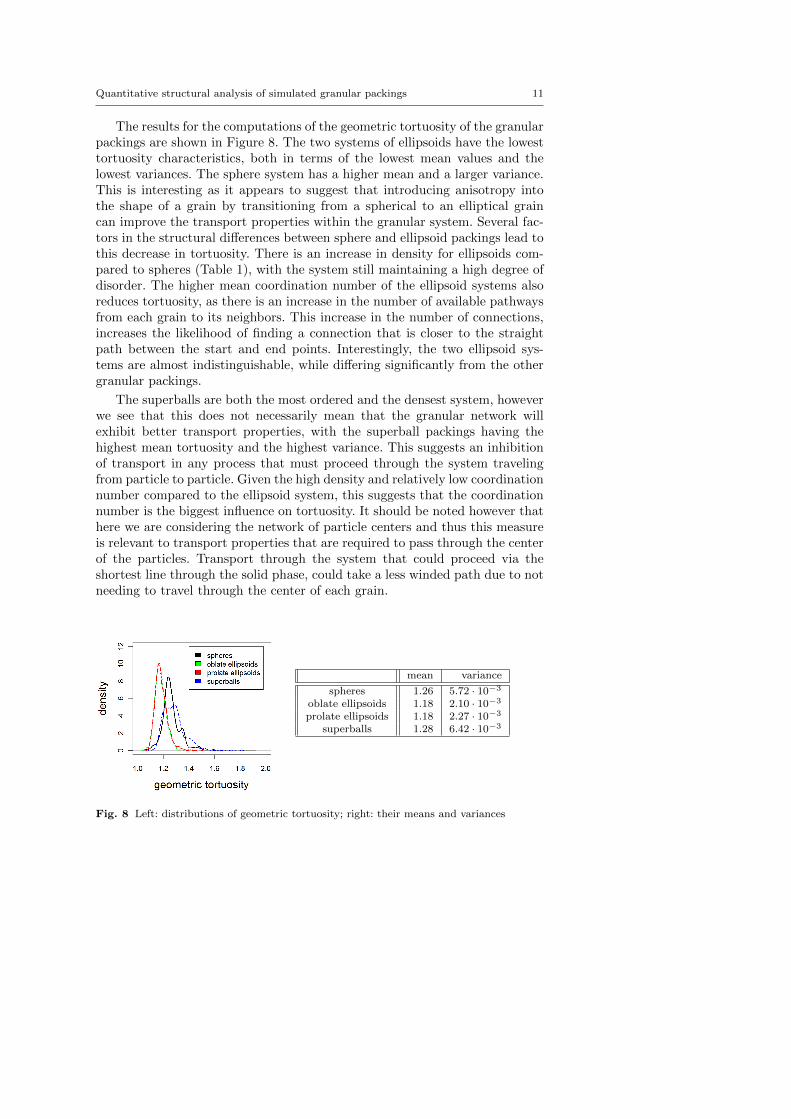
The results for the computations of the geometric tortuosity of the granularpackings are shown in Figure 8. The two systems of ellipsoids have the lowesttortuosity characteristics, both in terms of the lowest mean values and thelowest variances. The sphere system has a higher mean and a larger variance.This is interesting as it appears to suggest that introducing anisotropy intothe shape of a grain by transitioning from a spherical to an elliptical graincan improve the transport properties within the granular system. Several fac-tors in the structural differences between sphere and ellipsoid packings lead tothis decrease in tortuosity. There is an increase in density for ellipsoids com-pared to spheres (Table 1), with the system still maintaining a high degree ofdisorder. The higher mean coordination number of the ellipsoid systems alsoreduces tortuosity, as there is an increase in the number of available pathwaysfrom each grain to its neighbors. This increase in the number of connections,increases the likelihood of finding a connection that is closer to the straightpath between the start and end points. Interestingly, the two ellipsoid sys-tems are almost indistinguishable, while differing significantly from the othergranular packings.
The superballs are both the most ordered and the densest system, howeverwe see that this does not necessarily mean that the granular network willexhibit better transport properties, with the superball packings having thehighest mean tortuosity and the highest variance. This suggests an inhibitionof transport in any process that must proceed through the system travelingfrom particle to particle. Given the high density and relatively low coordinationnumber compared to the ellipsoid system, this suggests that the coordinationnumber is the biggest influence on tortuosity. It should be noted however thathere we are considering the network of particle centers and thus this measureis relevant to transport properties that are required to pass through the centerof the particles. Transport through the system that could proceed via theshortest line through the solid phase, could take a less winded path due to notneeding to travel through the center of each grain.
mean variance
spheres 1.26 5.72 · 10−3
oblate ellipsoids 1.18 2.10 · 10−3
prolate ellipsoids 1.18 2.27 · 10−3
superballs 1.28 6.42 · 10−3
Fig. 8 Left: distributions of geometric tortuosity; right: their means and variances
12 Stenzel et al.
4 Analysis of Pore-Phase
In this section, we analyze the pore-phase, which is the space complementaryto the union of particles. In various applications of granular systems, objects(e.g. fluids or gases) are transported in the pore-phase. It is thus importantto characterize morphological aspects of the pore-phase and consider theirrelation to associated transport properties.
4.1 Analysis of characteristics of spatial extent
4.1.1 Chord length
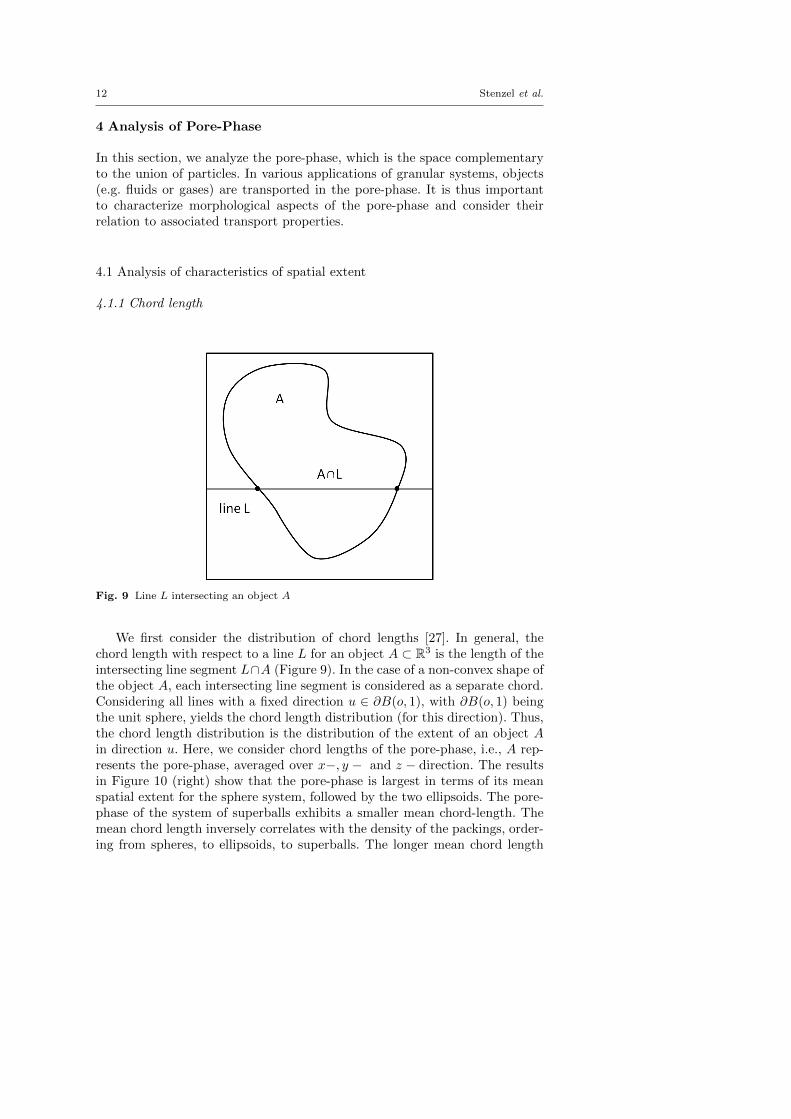
Fig. 9 Line L intersecting an object A
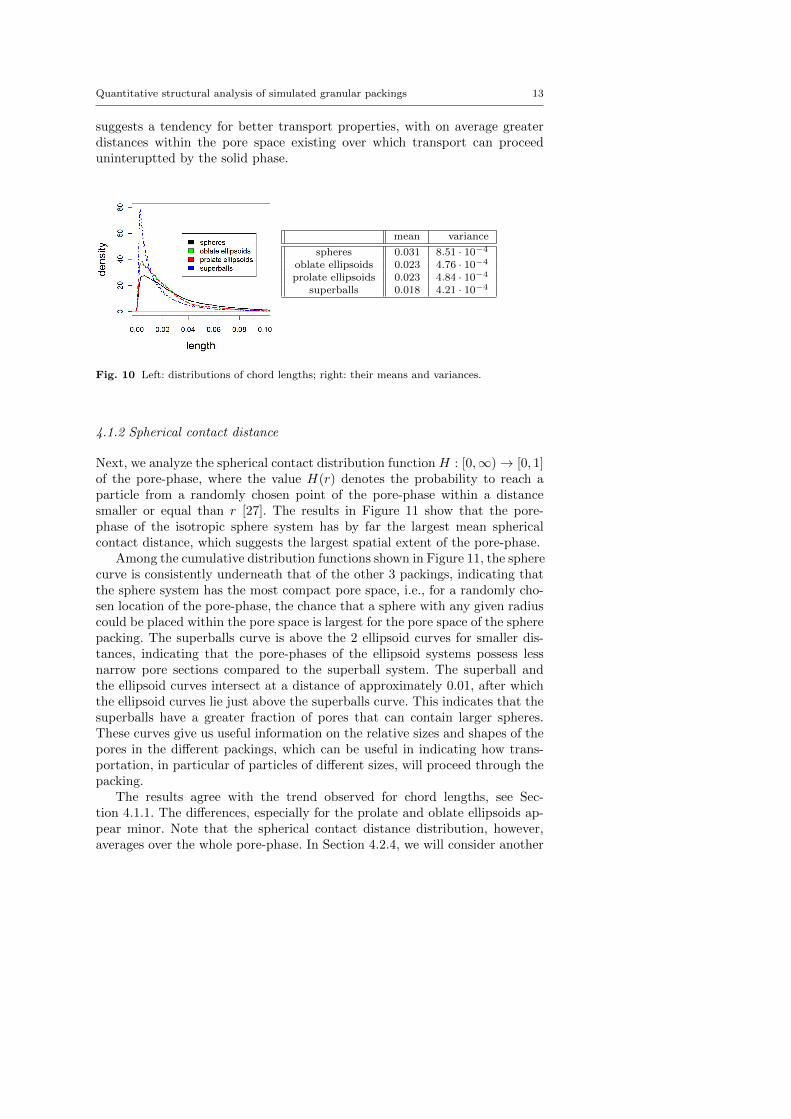
We first consider the distribution of chord lengths [27]. In general, thechord length with respect to a line L for an object A ⊂ R3 is the length of theintersecting line segment L∩A (Figure 9). In the case of a non-convex shape ofthe object A, each intersecting line segment is considered as a separate chord.Considering all lines with a fixed direction u ∈ ∂B(o, 1), with ∂B(o, 1) beingthe unit sphere, yields the chord length distribution (for this direction). Thus,the chord length distribution is the distribution of the extent of an object Ain direction u. Here, we consider chord lengths of the pore-phase, i.e., A rep-resents the pore-phase, averaged over x−, y − and z − direction. The resultsin Figure 10 (right) show that the pore-phase is largest in terms of its meanspatial extent for the sphere system, followed by the two ellipsoids. The pore-phase of the system of superballs exhibits a smaller mean chord-length. Themean chord length inversely correlates with the density of the packings, order-ing from spheres, to ellipsoids, to superballs. The longer mean chord length
Quantitative structural analysis of simulated granular packings 13
suggests a tendency for better transport properties, with on average greaterdistances within the pore space existing over which transport can proceeduninteruptted by the solid phase.
mean variance
spheres 0.031 8.51 · 10−4
oblate ellipsoids 0.023 4.76 · 10−4
prolate ellipsoids 0.023 4.84 · 10−4
superballs 0.018 4.21 · 10−4
Fig. 10 Left: distributions of chord lengths; right: their means and variances.
4.1.2 Spherical contact distance
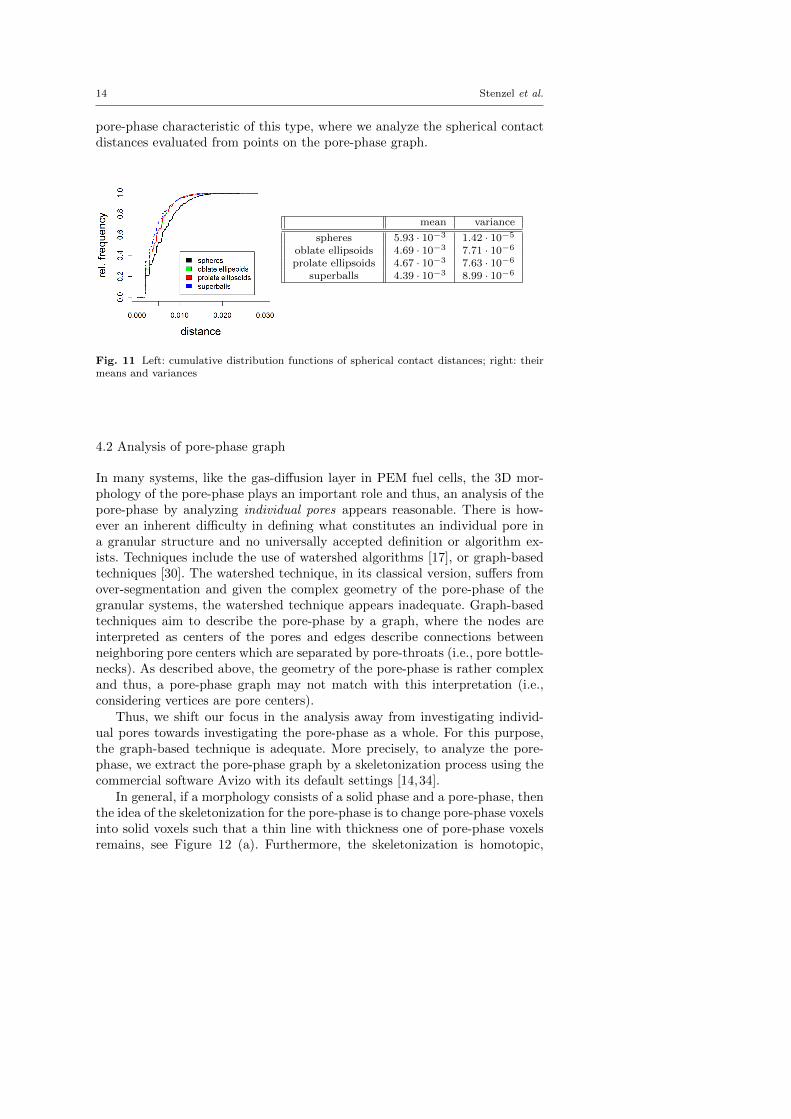
Next, we analyze the spherical contact distribution function H : [0,∞)→ [0, 1]of the pore-phase, where the value H(r) denotes the probability to reach aparticle from a randomly chosen point of the pore-phase within a distancesmaller or equal than r [27]. The results in Figure 11 show that the pore-phase of the isotropic sphere system has by far the largest mean sphericalcontact distance, which suggests the largest spatial extent of the pore-phase.
Among the cumulative distribution functions shown in Figure 11, the spherecurve is consistently underneath that of the other 3 packings, indicating thatthe sphere system has the most compact pore space, i.e., for a randomly cho-sen location of the pore-phase, the chance that a sphere with any given radiuscould be placed within the pore space is largest for the pore space of the spherepacking. The superballs curve is above the 2 ellipsoid curves for smaller dis-tances, indicating that the pore-phases of the ellipsoid systems possess lessnarrow pore sections compared to the superball system. The superball andthe ellipsoid curves intersect at a distance of approximately 0.01, after whichthe ellipsoid curves lie just above the superballs curve. This indicates that thesuperballs have a greater fraction of pores that can contain larger spheres.These curves give us useful information on the relative sizes and shapes of thepores in the different packings, which can be useful in indicating how trans-portation, in particular of particles of different sizes, will proceed through thepacking.
The results agree with the trend observed for chord lengths, see Sec-tion 4.1.1. The differences, especially for the prolate and oblate ellipsoids ap-pear minor. Note that the spherical contact distance distribution, however,averages over the whole pore-phase. In Section 4.2.4, we will consider another
14 Stenzel et al.
pore-phase characteristic of this type, where we analyze the spherical contactdistances evaluated from points on the pore-phase graph.
mean variance
spheres 5.93 · 10−3 1.42 · 10−5
oblate ellipsoids 4.69 · 10−3 7.71 · 10−6
prolate ellipsoids 4.67 · 10−3 7.63 · 10−6
superballs 4.39 · 10−3 8.99 · 10−6
Fig. 11 Left: cumulative distribution functions of spherical contact distances; right: theirmeans and variances
4.2 Analysis of pore-phase graph
In many systems, like the gas-diffusion layer in PEM fuel cells, the 3D mor-phology of the pore-phase plays an important role and thus, an analysis of thepore-phase by analyzing individual pores appears reasonable. There is how-ever an inherent difficulty in defining what constitutes an individual pore ina granular structure and no universally accepted definition or algorithm ex-ists. Techniques include the use of watershed algorithms [17], or graph-basedtechniques [30]. The watershed technique, in its classical version, suffers fromover-segmentation and given the complex geometry of the pore-phase of thegranular systems, the watershed technique appears inadequate. Graph-basedtechniques aim to describe the pore-phase by a graph, where the nodes areinterpreted as centers of the pores and edges describe connections betweenneighboring pore centers which are separated by pore-throats (i.e., pore bottle-necks). As described above, the geometry of the pore-phase is rather complexand thus, a pore-phase graph may not match with this interpretation (i.e.,considering vertices are pore centers).
Thus, we shift our focus in the analysis away from investigating individ-ual pores towards investigating the pore-phase as a whole. For this purpose,the graph-based technique is adequate. More precisely, to analyze the pore-phase, we extract the pore-phase graph by a skeletonization process using thecommercial software Avizo with its default settings [14,34].
In general, if a morphology consists of a solid phase and a pore-phase, thenthe idea of the skeletonization for the pore-phase is to change pore-phase voxelsinto solid voxels such that a thin line with thickness one of pore-phase voxelsremains, see Figure 12 (a). Furthermore, the skeletonization is homotopic,
Quantitative structural analysis of simulated granular packings 15
Fig. 12 Cartoon of pore-phase skeletonization (a) and approximation by graph (b)
i.e., connectivity-preserving. In the next step, the skeleton is transformed intovector data, i.e., it is approximated by polygonal tracks, see Figure 12 (b).These polygonal tracks are systems of line segments. The representation bysystems of line segments can be interpreted as a spatial graph, where thestart- and endpoints of the line segments form the set of vertices and the linesegments themselves the set of edges.
Note that we do not interpret the vertices of the graph as pore centers, butwe use characteristics of the graph to obtain valuable information with respectto differences in the pore-phases for the different granular packings consideredin this paper.
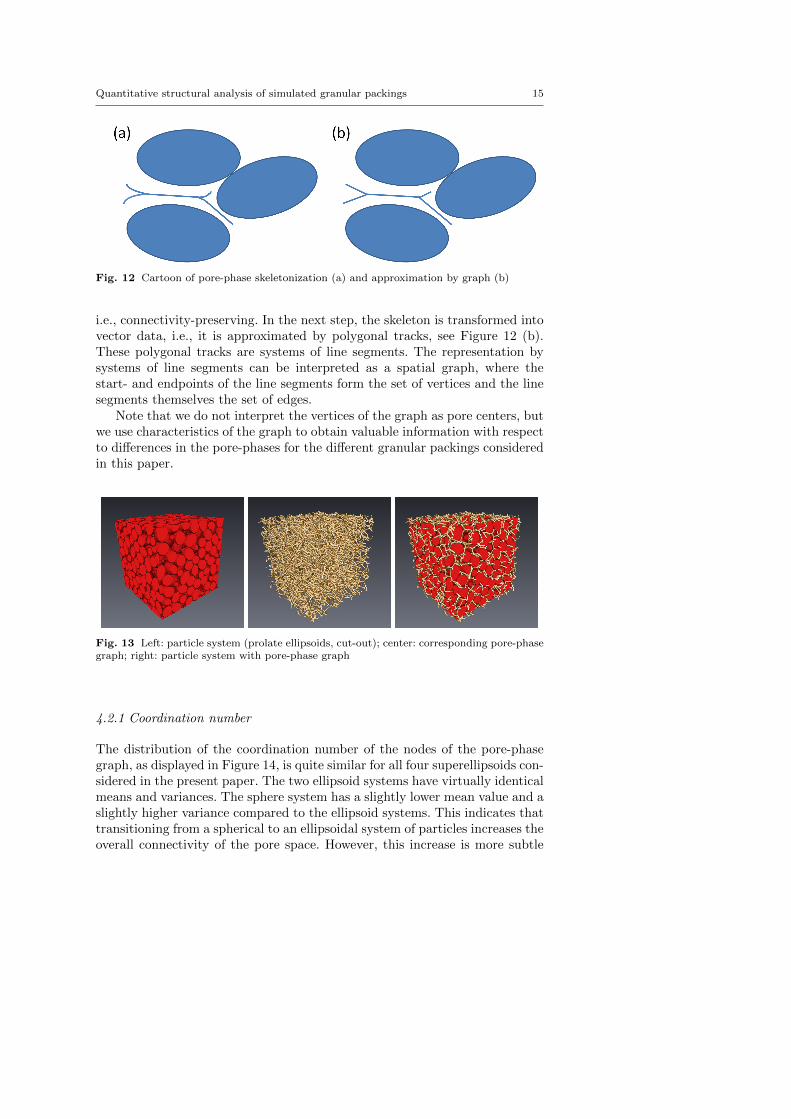
Fig. 13 Left: particle system (prolate ellipsoids, cut-out); center: corresponding pore-phasegraph; right: particle system with pore-phase graph
4.2.1 Coordination number
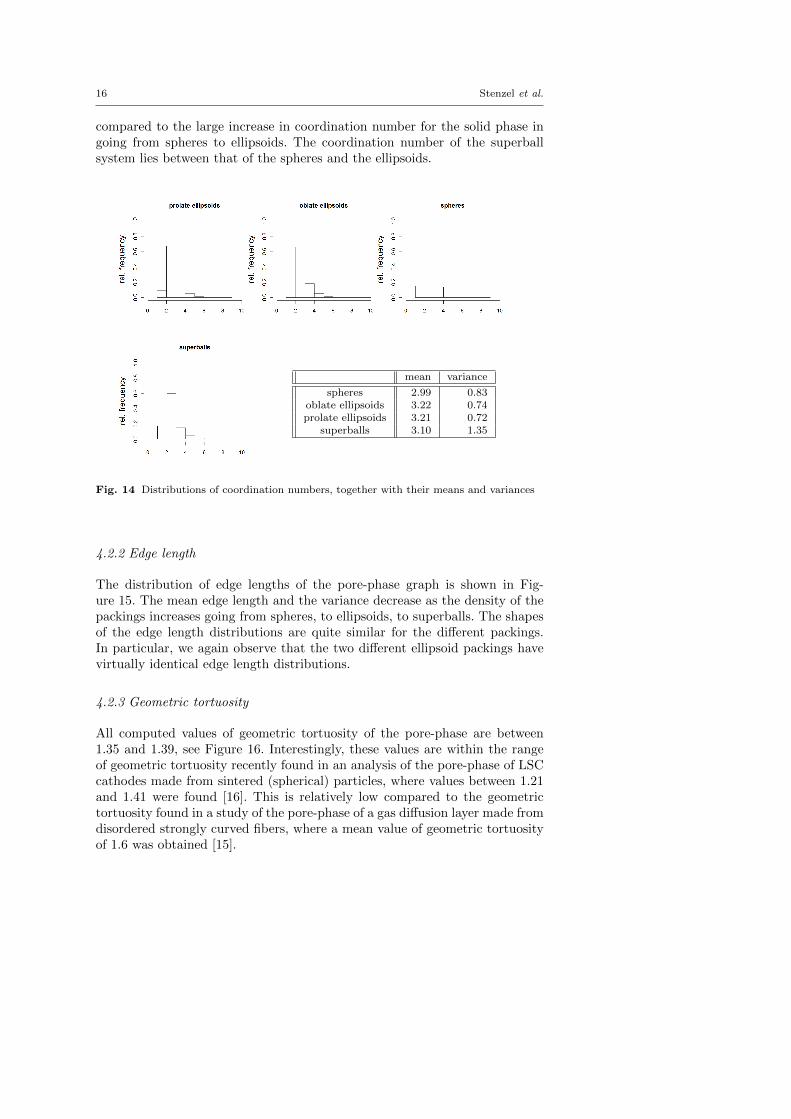
The distribution of the coordination number of the nodes of the pore-phasegraph, as displayed in Figure 14, is quite similar for all four superellipsoids con-sidered in the present paper. The two ellipsoid systems have virtually identicalmeans and variances. The sphere system has a slightly lower mean value and aslightly higher variance compared to the ellipsoid systems. This indicates thattransitioning from a spherical to an ellipsoidal system of particles increases theoverall connectivity of the pore space. However, this increase is more subtle
16 Stenzel et al.
compared to the large increase in coordination number for the solid phase ingoing from spheres to ellipsoids. The coordination number of the superballsystem lies between that of the spheres and the ellipsoids.
mean variance
spheres 2.99 0.83oblate ellipsoids 3.22 0.74prolate ellipsoids 3.21 0.72
superballs 3.10 1.35
Fig. 14 Distributions of coordination numbers, together with their means and variances
4.2.2 Edge length
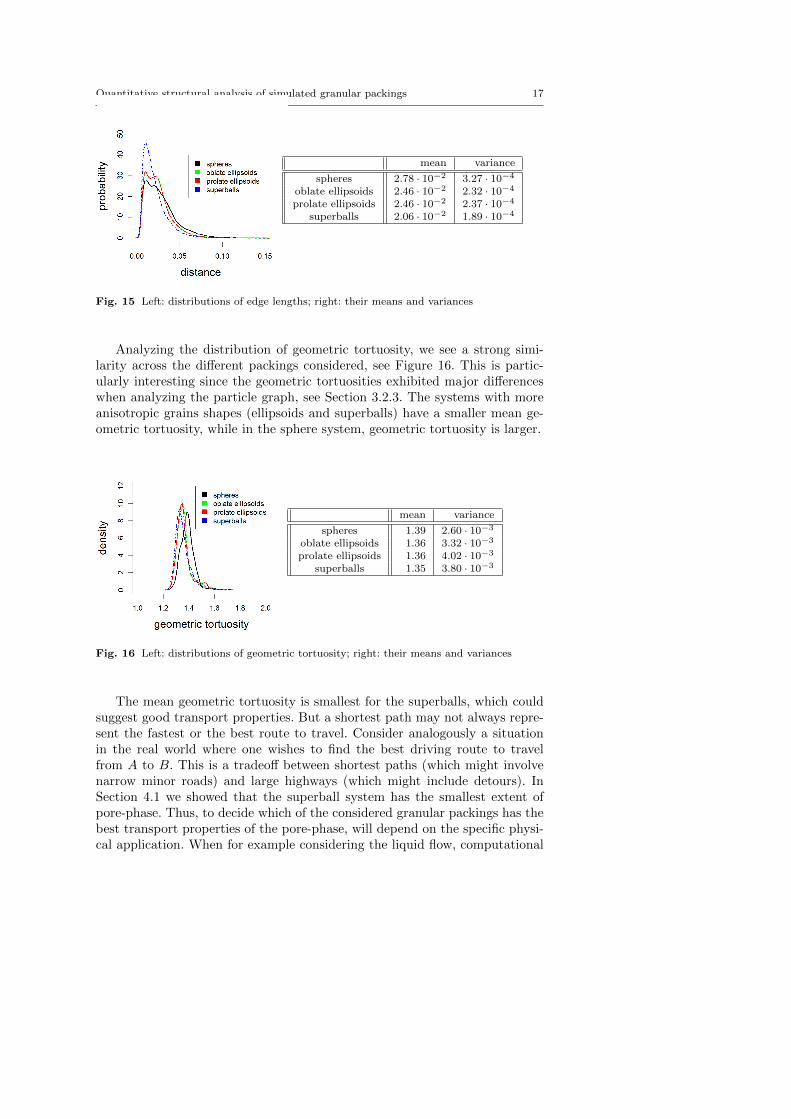
The distribution of edge lengths of the pore-phase graph is shown in Fig-ure 15. The mean edge length and the variance decrease as the density of thepackings increases going from spheres, to ellipsoids, to superballs. The shapesof the edge length distributions are quite similar for the different packings.In particular, we again observe that the two different ellipsoid packings havevirtually identical edge length distributions.
4.2.3 Geometric tortuosity
All computed values of geometric tortuosity of the pore-phase are between1.35 and 1.39, see Figure 16. Interestingly, these values are within the rangeof geometric tortuosity recently found in an analysis of the pore-phase of LSCcathodes made from sintered (spherical) particles, where values between 1.21and 1.41 were found [16]. This is relatively low compared to the geometrictortuosity found in a study of the pore-phase of a gas diffusion layer made fromdisordered strongly curved fibers, where a mean value of geometric tortuosityof 1.6 was obtained [15].
Quantitative structural analysis of simulated granular packings 17
mean variance
spheres 2.78 · 10−2 3.27 · 10−4
oblate ellipsoids 2.46 · 10−2 2.32 · 10−4
prolate ellipsoids 2.46 · 10−2 2.37 · 10−4
superballs 2.06 · 10−2 1.89 · 10−4
Fig. 15 Left: distributions of edge lengths; right: their means and variances
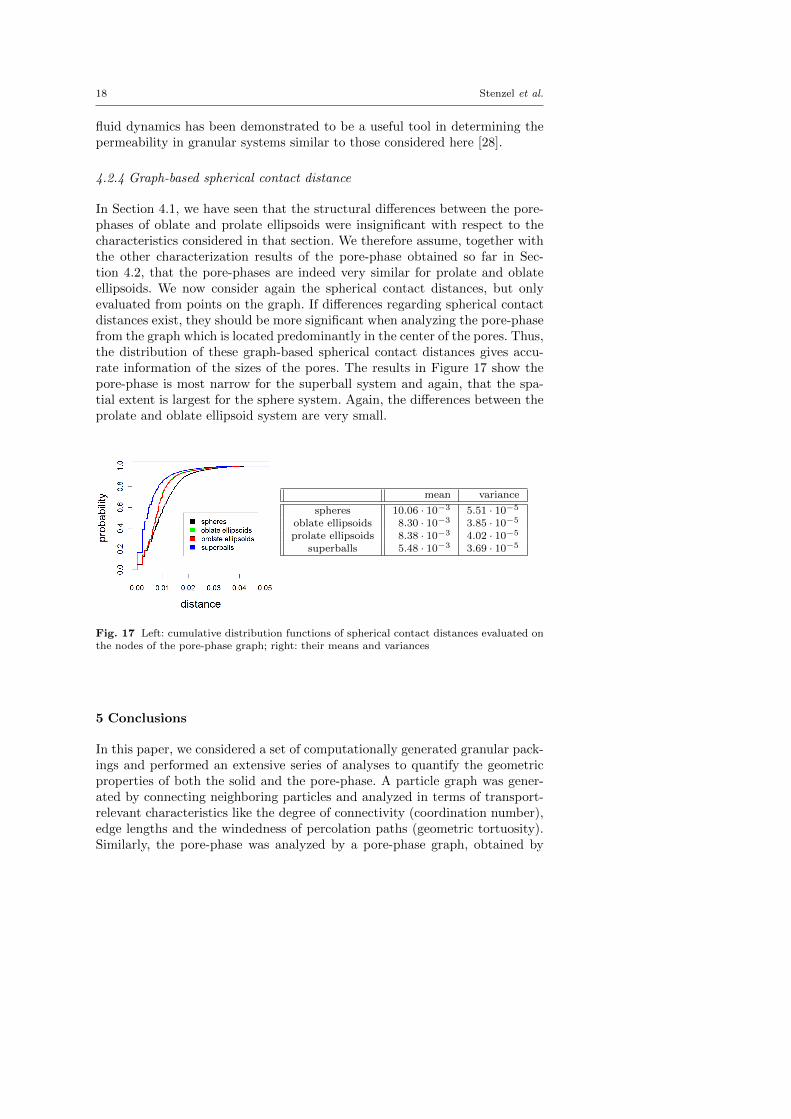
Analyzing the distribution of geometric tortuosity, we see a strong simi-larity across the different packings considered, see Figure 16. This is partic-ularly interesting since the geometric tortuosities exhibited major differenceswhen analyzing the particle graph, see Section 3.2.3. The systems with moreanisotropic grains shapes (ellipsoids and superballs) have a smaller mean ge-ometric tortuosity, while in the sphere system, geometric tortuosity is larger.
mean variance
spheres 1.39 2.60 · 10−3
oblate ellipsoids 1.36 3.32 · 10−3
prolate ellipsoids 1.36 4.02 · 10−3
superballs 1.35 3.80 · 10−3
Fig. 16 Left: distributions of geometric tortuosity; right: their means and variances
The mean geometric tortuosity is smallest for the superballs, which couldsuggest good transport properties. But a shortest path may not always repre-sent the fastest or the best route to travel. Consider analogously a situationin the real world where one wishes to find the best driving route to travelfrom A to B. This is a tradeoff between shortest paths (which might involvenarrow minor roads) and large highways (which might include detours). InSection 4.1 we showed that the superball system has the smallest extent ofpore-phase. Thus, to decide which of the considered granular packings has thebest transport properties of the pore-phase, will depend on the specific physi-cal application. When for example considering the liquid flow, computational
18 Stenzel et al.
fluid dynamics has been demonstrated to be a useful tool in determining thepermeability in granular systems similar to those considered here [28].
4.2.4 Graph-based spherical contact distance
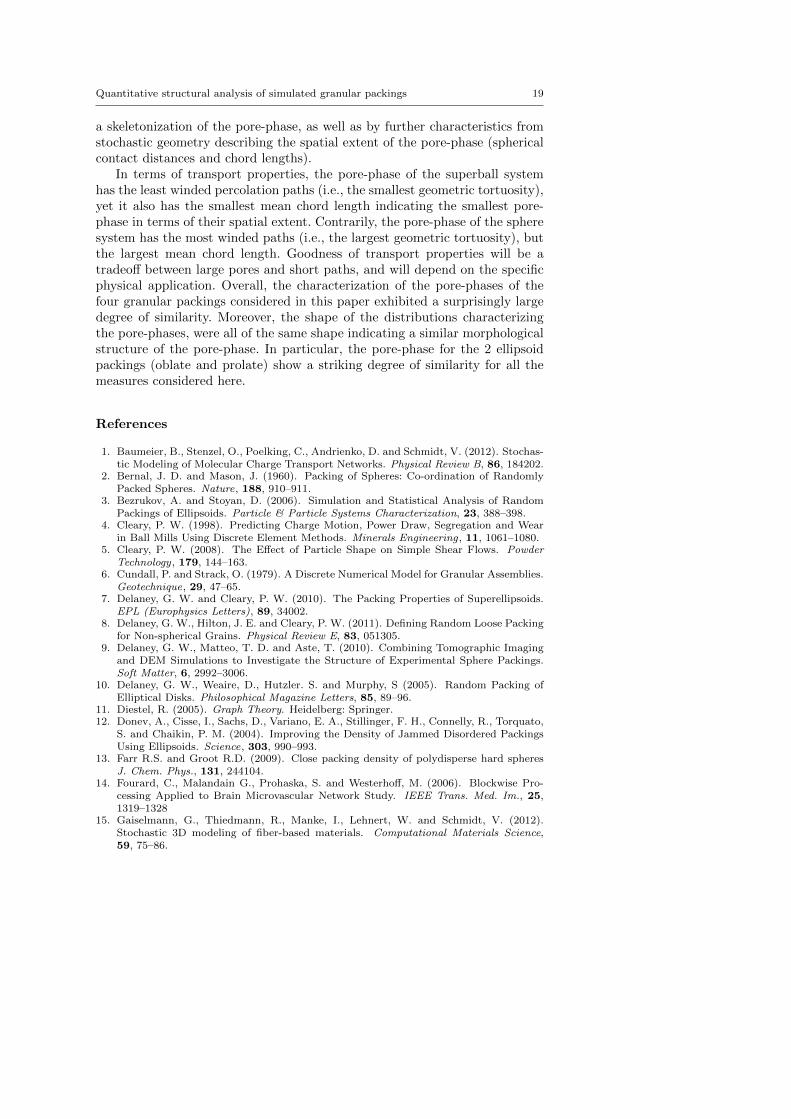
In Section 4.1, we have seen that the structural differences between the pore-phases of oblate and prolate ellipsoids were insignificant with respect to thecharacteristics considered in that section. We therefore assume, together withthe other characterization results of the pore-phase obtained so far in Sec-tion 4.2, that the pore-phases are indeed very similar for prolate and oblateellipsoids. We now consider again the spherical contact distances, but onlyevaluated from points on the graph. If differences regarding spherical contactdistances exist, they should be more significant when analyzing the pore-phasefrom the graph which is located predominantly in the center of the pores. Thus,the distribution of these graph-based spherical contact distances gives accu-rate information of the sizes of the pores. The results in Figure 17 show thepore-phase is most narrow for the superball system and again, that the spa-tial extent is largest for the sphere system. Again, the differences between theprolate and oblate ellipsoid system are very small.
mean variance
spheres 10.06 · 10−3 5.51 · 10−5
oblate ellipsoids 8.30 · 10−3 3.85 · 10−5
prolate ellipsoids 8.38 · 10−3 4.02 · 10−5
superballs 5.48 · 10−3 3.69 · 10−5
Fig. 17 Left: cumulative distribution functions of spherical contact distances evaluated onthe nodes of the pore-phase graph; right: their means and variances
5 Conclusions
In this paper, we considered a set of computationally generated granular pack-ings and performed an extensive series of analyses to quantify the geometricproperties of both the solid and the pore-phase. A particle graph was gener-ated by connecting neighboring particles and analyzed in terms of transport-relevant characteristics like the degree of connectivity (coordination number),edge lengths and the windedness of percolation paths (geometric tortuosity).Similarly, the pore-phase was analyzed by a pore-phase graph, obtained by
Quantitative structural analysis of simulated granular packings 19
a skeletonization of the pore-phase, as well as by further characteristics fromstochastic geometry describing the spatial extent of the pore-phase (sphericalcontact distances and chord lengths).
In terms of transport properties, the pore-phase of the superball systemhas the least winded percolation paths (i.e., the smallest geometric tortuosity),yet it also has the smallest mean chord length indicating the smallest pore-phase in terms of their spatial extent. Contrarily, the pore-phase of the spheresystem has the most winded paths (i.e., the largest geometric tortuosity), butthe largest mean chord length. Goodness of transport properties will be atradeoff between large pores and short paths, and will depend on the specificphysical application. Overall, the characterization of the pore-phases of thefour granular packings considered in this paper exhibited a surprisingly largedegree of similarity. Moreover, the shape of the distributions characterizingthe pore-phases, were all of the same shape indicating a similar morphologicalstructure of the pore-phase. In particular, the pore-phase for the 2 ellipsoidpackings (oblate and prolate) show a striking degree of similarity for all themeasures considered here.
References
1. Baumeier, B., Stenzel, O., Poelking, C., Andrienko, D. and Schmidt, V. (2012). Stochas-tic Modeling of Molecular Charge Transport Networks. Physical Review B, 86, 184202.
2. Bernal, J. D. and Mason, J. (1960). Packing of Spheres: Co-ordination of RandomlyPacked Spheres. Nature, 188, 910–911.
3. Bezrukov, A. and Stoyan, D. (2006). Simulation and Statistical Analysis of RandomPackings of Ellipsoids. Particle & Particle Systems Characterization, 23, 388–398.
4. Cleary, P. W. (1998). Predicting Charge Motion, Power Draw, Segregation and Wearin Ball Mills Using Discrete Element Methods. Minerals Engineering, 11, 1061–1080.
5. Cleary, P. W. (2008). The Effect of Particle Shape on Simple Shear Flows. PowderTechnology, 179, 144–163.
6. Cundall, P. and Strack, O. (1979). A Discrete Numerical Model for Granular Assemblies.Geotechnique, 29, 47–65.
7. Delaney, G. W. and Cleary, P. W. (2010). The Packing Properties of Superellipsoids.EPL (Europhysics Letters), 89, 34002.
8. Delaney, G. W., Hilton, J. E. and Cleary, P. W. (2011). Defining Random Loose Packingfor Non-spherical Grains. Physical Review E, 83, 051305.
9. Delaney, G. W., Matteo, T. D. and Aste, T. (2010). Combining Tomographic Imagingand DEM Simulations to Investigate the Structure of Experimental Sphere Packings.Soft Matter, 6, 2992–3006.
10. Delaney, G. W., Weaire, D., Hutzler. S. and Murphy, S (2005). Random Packing ofElliptical Disks. Philosophical Magazine Letters, 85, 89–96.
11. Diestel, R. (2005). Graph Theory. Heidelberg: Springer.12. Donev, A., Cisse, I., Sachs, D., Variano, E. A., Stillinger, F. H., Connelly, R., Torquato,
S. and Chaikin, P. M. (2004). Improving the Density of Jammed Disordered PackingsUsing Ellipsoids. Science, 303, 990–993.
13. Farr R.S. and Groot R.D. (2009). Close packing density of polydisperse hard spheresJ. Chem. Phys., 131, 244104.
14. Fourard, C., Malandain G., Prohaska, S. and Westerhoff, M. (2006). Blockwise Pro-cessing Applied to Brain Microvascular Network Study. IEEE Trans. Med. Im., 25,1319–1328
15. Gaiselmann, G., Thiedmann, R., Manke, I., Lehnert, W. and Schmidt, V. (2012).Stochastic 3D modeling of fiber-based materials. Computational Materials Science,59, 75–86.
20 Stenzel et al.
16. Gaiselmann, G., Neumann, M., Holzer, L., Hocker, T., Prestat, M. and Schmidt, V.(2013). Stochastic 3D modeling of LSC cathodes based on structural segmentation ofFIB-SEM images. Computational Materials Science, 67, 48–62.
17. Godehardt, M. and Schladitz, K. (2006). Geometric Characterisation of Light WeightComposites Using Computer Tomographic Images. Proceedings of the 9th EuropeanConference of Non-Destructive Testing, Berlin, 25.-29. September 2006.
18. Hales, T. (2005). A Proof of the Kepler Conjecture. Annals of Mathematics, 162,1065–1185.
19. Hilton, J. E., Cleary, P. W. and Tordesillas, A. (2013). Unitary Stick-slip Motion inGranular Beds. AIP Conference Proceedings, 1542, 843-846.
20. Holzer, L. and Wiedenmann, D. and Munch, B. and Keller, L. and Prestat, M. andGasser, Ph. and Robertson, I. and Grobety, B. (2013). The influence of constrictivityon the effective transport properties of porous layers in electrolysis and fuel cells. Journalof Materials Science, 48, 2934–2952.
21. Illian, J., Penttinen, A., Stoyan, H. and Stoyan, D. (2008). Statistical Analysis andModelling of Spatial Point Patterns. Chichester: J. Wiley & Sons.
22. Jaeger, H. M., Nagel, S. R. and Behringer, R. P. (1996). Granular Solids, Liquids, andGases. Review of Modern Physics, 68, 1259–1273.
23. Kadanoff, L. P. (1999). Built Upon Sand: Theoretical Ideas Inspired by the Flow ofGranular Materials. Review of Modern Physics, 71, 435–444.
24. Lubachevsky, B. D. and Stillinger, F. H. (1990). Geometric Properties of Random DiskPackings. Journal of Statistical Physics, 60, 561–583.
25. Lueck, S., Sailer, M., Schmidt, V. and Walther, W. (2010). Three-dimensional Analysisof the Intermediate Filament Network Using SEM-Tomography. Journal of Microscopy,239, 1–16.
26. Munch, B. and Holzer, L. (2008). Contradicting Geometrical Concepts in Pore SizeAnalysis Attained with Electron Microscopy and Mercury Intrusion. Journal of theAmerican Ceramic Society, 91, 4059–4067.
27. Ohser, J. and Mucklich, F. (2000). Statistical Analysis of Microstructures in MaterialsScience. Chichester: J. Wiley & Sons.
28. Pereira, G. G., Dupuy, P. M., Cleary, P. W. and Delaney, G. W. (2012). Comparison ofPermeability of Model Porous Media between SPH and LB. Progress in ComputationalFluid Dynamics, 12, 176–186.
29. Williams S.R. and Philipse A.P. (2003). Random packings of spheres and spherocylin-ders simulated by mechanical contraction. Physical Review E, 67, 051301.
30. Thiedmann, R., Hartnig, C., Manke, I., Schmidt, V. and Lehnert, W. (2009). LocalStructural Characteristics of Pore Space in GDL’s of PEM Fuel Cells based on Geometric3D Graphs. Journal of the Electrochemical Society, 156, B1339–B1347.
31. Thiedmann, R., Stenzel, O., Spettl, A., Shearing, P. R., Harris, S. J., Brandon, N. P. andSchmidt, V. (2011). Stochastic simulation model for the 3D morphology of compositematerials in Li-ion batteries. Computational Materials Science, 50, 3365–3376.
32. Thiedmann, R., Spettl, A., Stenzel, O., Zeibig, T., Hindson, J. C., Saghi, Z., Greenham,N. C., Midgley, P. A. and Schmidt, V. (2012). Networks of Nanoparticles in Organic-Inorganic Composites: Algorithmic Extraction and Statistical Analysis. Image Analysisand Stereology, 31, 23–42.
33. Tordesillas, A. (2011). When Failure is an Option: Rewiring Granular Networks. Mul-tiscale and Multiphysics Processes in Geomechanics, 33–36.
34. VSG – Visualization Sciences Group – Avizo Standard, Version 6.3, http://www.vsg3d.com/avizo/standard.
35. Athanassiadis A. G., Miskin M. Z., Kaplan P., Rodenberg N., Lee S.H., Merritt J.,Brown E., Amend J., Lipson H. and Jaeger H.M. (2013). Particle Shape Effects on theStress Response of Granular Packings. arXiv:1308.2241.
36. Neudecker, M., Ulrich S., Herminghaus S., and SchrA¶ter M (2013). Jammed FrictionalTetrahedra Are Hyperstatic. Physical Review Letters, 111 : 028001.
37. Damasceno, P.F., Engel M., and Glotzer S.C. (2012). Predictive Self-Assembly of Poly-hedra into Complex Structures. Science 337, 6093 : 453-457.
38. Baram, R.M. and Lind, P.G. (2012). Deposition of general ellipsoidal particles. Phys.Rev. E 85, 4 : 041301.

Quantitative structural analysis of simulated granular packings 21
39. Liu, A. J. and Nagel, S.R. (1998). Nonlinear dynamics: Jamming is not just cool anymore, Nature 396, 6706 : 21-22.
40. Aste T. and Weaire D. (2000). The Pursuit of Perfect Packing, Bristol and Philadelphia:IOP Publishing Ltd.