Embed Size (px)
Citation preview

Statistics and Probability
Quarter 4 – Module 6:
Computing Test Statistic on
Population Mean

Development Team of the Module
Writer: Nelda L. Oabel
Editors: Jerome A. Chavez, Gilberto M. Delfina, Garry S. Villaverde, and Pelagia L.
Manalang
Reviewers: Josephine V. Cabulong, and Nenita N. De Leon
Illustrator: Jeewel C. Cabriga
Layout Artist: Edna E. Eclavea
Management Team: Wilfredo E. Cabral, Regional Director
Job S. Zape Jr., CLMD Chief
Elaine T. Balaogan, Regional ADM Coordinator
Fe M. Ong-ongowan, Regional Librarian
Aniano M. Ogayon, Schools Division Superintendent
Maylani L. Galicia, Assistant Schools Division Superintendent
Randy D. Punzalan, Assistant Schools Division Superintendent
Imelda C. Raymundo, CID Chief
Generosa F. Zubieta, EPS In-charge of LRMS
Pelagia L. Manalang, EPS
Statistics and Probability – Grade 11 Alternative Delivery Mode Quarter 4 – Module 6: Computing Test Statistic on Population Mean First Edition, 2020 Republic Act 8293, Section 176 states that: No copyright shall subsist in any work of the Government of the Philippines. However, prior approval of the government agency or office wherein the work is created shall be necessary for exploitation of such work for profit. Such agency or office may, among other things, impose as a condition the payment of royalties.
Borrowed materials (i.e., songs, stories, poems, pictures, photos, brand names, trademarks, etc.) included in this module are owned by their respective copyright holders. Every effort has been exerted to locate and seek permission to use these materials from their respective copyright owners. The publisher and authors do not represent nor claim ownership over them. Published by the Department of Education Secretary: Leonor Magtolis Briones Undersecretary: Diosdado M. San Antonio
Printed in the Philippines by ________________________ Department of Education – Region IV-A CALABARZON
Office Address: Gate 2 Karangalan Village, Barangay San Isidro
Cainta, Rizal 1800
Telefax: 02-8682-5773/8684-4914/8647-7487
E-mail Address: [email protected]

Statistics and
Probability Module 6:
Computing of Test Statistic on
Population Mean

ii
Introductory Message
For the facilitator:
Welcome to the Statistics and Probability for Senior High School Alternative
Delivery Mode (ADM) Module on Computing Test Statistic on Population
Mean!
This module was collaboratively designed, developed, and reviewed by
educators both from public and private institutions to assist you, the
teacher or the facilitator, in helping the learners meet the standards set by
the K to 12 Curriculum while overcoming their personal, social, and
economic constraints in schooling.
This learning resource hopes to engage the learners into guided and
independent learning activities at their own pace and time. Furthermore,
this also aims to help learners acquire the needed 21st century skills while
taking into consideration their needs and circumstances.
In addition to the material in the main text, you will also see this box in the
body of the module:
As a facilitator, you are expected to orient the learners on how to use this
module. You also need to keep track of the learners' progress while allowing
them to manage their own learning. Furthermore, you are expected to
encourage and assist the learners as they do the tasks included in the
module.
Notes to the Teacher
This contains helpful tips or strategies
that will help you in guiding the
learners.

iii
For the learner:
Welcome to the Statistics and Probability for Senior High School Alternative
Delivery Mode (ADM) Module on Computing Test Statistic on Population
Mean!
The hand is one of the most symbolical parts of the human body. It is often
used to depict skill, action, and purpose. Through our hands, we may learn,
create, and accomplish. Hence, the hand in this learning resource signifies
that as a learner, you are capable and empowered to successfully achieve
the relevant competencies and skills at your own pace and time. Your
academic success lies in your own hands!
This module was designed to provide you with fun and meaningful
opportunities for guided and independent learning at your own pace and
time. You will be enabled to process the contents of the learning resource
while being an active learner.
This module has the following parts and corresponding icons:
What I Need to
Know
This will give you an idea of the skills or
competencies you are expected to learn
in the module.
What I Know
This part includes an activity that aims
to check what you already know about
the lesson to take. If you get all the
answers correct (100%), you may decide
to skip this module.
What’s In
This is a brief drill or review to help you
link the current lesson with the previous
one.
What’s New
In this portion, the new lesson will be
introduced to you in various ways such
as a story, a song, a poem, a problem
opener, an activity, or a situation.
What Is It
This section provides a brief discussion
of the lesson. This aims to help you
discover and understand new concepts
and skills.
What’s More
This comprises activities for independent
practice to solidify your understanding

iv
and skills of the topic. You may check
the answers to the exercises using the
Answer Key at the end of the module.
What I Have Learned
This includes questions or blank
sentences/paragraphs to be filled in to
process what you learned from the
lesson.
What I Can Do
This section provides an activity which
will help you transfer your new
knowledge or skill into real life
situations or concerns.
Assessment
This is a task which aims to evaluate
your level of mastery in achieving the
learning competency.
Additional
Activities
In this portion, another activity will be
given to you to enrich your knowledge or
skill of the lesson learned. This also
aims for retention of learned concepts.
Answer Key This contains answers to all activities in
the module.
At the end of this module, you will also find:
The following are some reminders in using this module:
1. Use the module with care. Do not put unnecessary mark/s on any part of
the module. Use a separate sheet of paper in answering the exercises.
2. Don’t forget to answer What I Know before moving on to the other
activities included in the module.
3. Read the instruction carefully before doing each task.
4. Observe honesty and integrity in doing the tasks and checking your
answers.
5. Finish the task at hand before proceeding to the next.
6. Return this module to your teacher/facilitator once you are through with
it.
If you encounter any difficulty in answering the tasks in this module, do not
hesitate to consult your teacher or facilitator. Always bear in mind that you
are not alone.
We hope that through this material, you will experience meaningful learning
and gain deep understanding of the relevant competencies. You can do it!
References This is a list of all sources used in
developing this module.

1
What I Need to Know
In this module, you will learn how to compute the test statistic on a
population mean particularly the t-test and z-test. It is a skill that you need
to develop to be able to determine whether you reject the null hypothesis or
otherwise (to be discussed in the next module). Perform each activity
independently. If you find any difficulty in answering the exercises, you may
ask the assistance of your teacher or you may consult your peers.
After going through this module, you are expected to:
1. determine the appropriate test statistic to be used in the given
problem/situation; and
2. compute for the test statistic value (population mean).
What I Know
Directions: Choose the best answer to the given questions or statements.
Write the letter of your choice on a separate sheet of paper. 1. It refers to a value calculated from sample data which is needed in
deciding whether the null hypothesis is rejected or not.
A. test statistics C. null hypothesis
B. critical region D. alternative hypothesis 2. What test statistic will be used if the sample size is above 30?
A. t-test C. population mean
B. z-test D. standard deviation
3. What test statistic can be used when the population standard deviation
is known?
A. t-test C. population mean
B. z-test D. standard deviation 4. What test statistic can be used when the population standard deviation
is unknown?
A. t – test C. population mean
B. z – test D. standard deviation

2
5. When finding the z-computed value, which formula should be used for
hypothesis testing?
A. 𝑧 = �̅�−𝜇
𝜎
√𝑛
B. 𝑧 = �̅�−𝜇
𝑠
√𝑛
C. 𝑧 = 𝜇− �̅�
𝑠
√𝑛
D. 𝑧 = 𝜇− �̅�
𝜎
√𝑛
6. When should you use the t-test?
I. When you are testing for a population mean
II. When the sample standard deviation is given
III. When the population standard deviation is given
IV. When you are testing a proportion/percentage of a
population
A. I and II B. II and III C. I and III D. II and IV
For nos. 7-8, refer to the problem below:
Given: 𝐻𝑜: μ = 8.6 𝐻𝑎: μ > 8.6 The study has a sample mean of 9.1 and a standard deviation of 2.1
conducted among 25 respondents. Use 𝛼 = 0. 05.
7. What test statistics should be used?
A. t-test C. population mean
B. z-test D. standard deviation 8. What is the computed value?
A. -1. 190 B. – 0. 567 C. 0. 567 D. 1.190
9. How many samples are best when dealing with z-test?
A. cannot be determined C. smaller than 30
B. exactly 30 D. equal or larger than 30
For nos. 10 – 12, refer to the given problem below:
The Choco Toppings, Inc. is one of the manufacturers of chocolate
toppings which uses a machine to dispense liquid ingredients into bottles
that move along a filling line. The owner claims that the machine can
dispense at an average of 50 grams with a standard deviation of 0.7 grams.
A sample of 35 bottles was selected and it was found out that the average
amount dispensed in the sample is 49.3 grams. Test the claims of the owner
of the company at 5% level of significance.
10. Which of the following information is correct?
A. 𝛼 = 0.5 B. 𝜎 = 0.7 C. �̅� = 35 D. 𝜇 = 49.3
11. What test statistic will be used?
A. t-test C. population mean
B. z-test D. standard deviation

3
12. Find the computed value.
A. -5.916 B. -4.950 C. 4.950 D. 5.916
13. Which test statistic will be used if the sample size is 15?
A. t-test C. cannot be determined
B. z-test D. neither t-test nor z-test
14. Which statistical method can you use when you have a normal
distribution of data?
A. t–test only C. either t–test or z–test
B. z–test only D. neither t–test nor z–test
15. A tire manufacturer claims that its tires have a mean life of 40,000 km. A
random sample of 46 of these tires is tested and the sample mean is
38,000 km. Assume that the population’s standard deviation is 2,000 km
and the lives of the tires are approximately normally distributed.
Determine the computed value at 5% level of significance.
A. -6.782 B. -3.033 C. 3.033 D. 6.782
How do you find this pre-test? Did you encounter both familiar and
unfamiliar terms? Kindly compare your answer in the Answer Key on the
last part of this module
If you obtain 100% or a perfect score, skip the module and
immediately move to the next module. But if you missed a point, please
proceed with the module as it will enrich your knowledge in computing the
test statistic.
4
Lesson
1 Computing Test Statistic on Population Mean
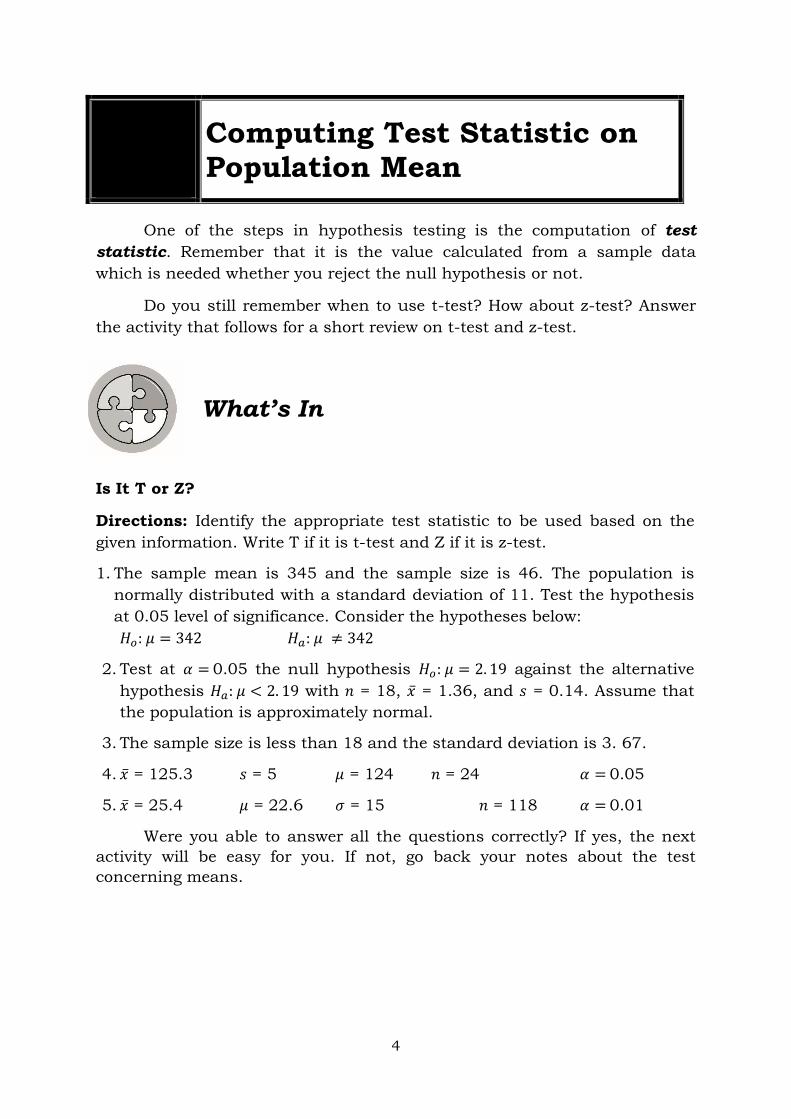
One of the steps in hypothesis testing is the computation of test
statistic. Remember that it is the value calculated from a sample data
which is needed whether you reject the null hypothesis or not.
Do you still remember when to use t-test? How about z-test? Answer
the activity that follows for a short review on t-test and z-test.
What’s In
Is It T or Z?
Directions: Identify the appropriate test statistic to be used based on the
given information. Write T if it is t-test and Z if it is z-test. 1. The sample mean is 345 and the sample size is 46. The population is
normally distributed with a standard deviation of 11. Test the hypothesis
at 0.05 level of significance. Consider the hypotheses below:
𝐻𝑜: 𝜇 = 342 𝐻𝑎: 𝜇 ≠ 342
2. Test at 𝛼 = 0.05 the null hypothesis 𝐻𝑜: 𝜇 = 2. 19 against the alternative
hypothesis 𝐻𝑎: 𝜇 < 2. 19 with 𝑛 = 18, �̅� = 1.36, and 𝑠 = 0.14. Assume that
the population is approximately normal.
3. The sample size is less than 18 and the standard deviation is 3. 67.
4. �̅� = 125.3 𝑠 = 5 𝜇 = 124 𝑛 = 24 𝛼 = 0.05
5. �̅� = 25.4 𝜇 = 22.6 𝜎 = 15 𝑛 = 118 𝛼 = 0.01
Were you able to answer all the questions correctly? If yes, the next
activity will be easy for you. If not, go back your notes about the test
concerning means.

5
What’s New
t-Test vs z-Test
Directions: Complete the diagram below.
YES NO
YES NO
I think you are very much ready for this topic. Read, analyze, and
study the given examples carefully.
What Is It
There are two specific test statistics used for hypothesis testing
concerning means: z-test and t-test.
If the sample size is large, where 𝑛 ≥ 30 and the population standard
deviation (𝜎) is known, use z-test.
In finding the z-value, use the formula below:
𝑧 = �̅� − 𝜇
𝜎
√𝑛
where: �̅� = sample mean 𝜇 = population mean
𝑛 = sample size 𝜎 = population standard deviation
Do you know the standard deviation (σ)?
1.Use:
__________
Is the sample
size above
30?
2. Use:
__________
3. Use:
__________

6
On the other hand, t- test is used when 𝑛 < 30, the population is
normal or nearly normal, and sample standard deviation (𝑠) is unknown.
The formula for the t- value is:
𝑡 = �̅� − 𝜇
𝑠
√𝑛
where: �̅� = sample mean 𝜇 = population mean
𝑛 = sample 𝑠 = sample standard deviation The degrees of freedom is 𝑛 − 1 or 𝑑𝑓 = 𝑛 − 1.
Study the following examples.
Example 1: Compute the z-value given the following information. Use one-
tailed test and 0. 05 level of significance.
�̅� = 70 𝜇 = 71.5 𝜎 = 8 𝑛 = 100 Solution: Since σ is known and n ≥ 30, we will use z-test. Thus, we have:
Example 2: In the first semester of the school year, a random sample of 200
students got a mean score of 81.72 with a population standard deviation of
15 in Statistics and Probability test. The population mean is 79.83. Use 0.05
level of significance.
Solution: To answer the problem, let us first identify the given. We have:
�̅� = 81.72 𝜇 = 79.83 𝜎 = 15 𝑛 = 200
Since σ is known and n ≥ 30, we will use z-test.
Use the formula for z-test.
Substitute the given value to the formula.
Simplify.
Therefore, the computed z-value is 1.875.
𝑧 = �̅� − 𝜇
𝜎
√𝑛
𝑧 = 71. 5 − 70
8
√100
𝑧 = 1.5
8
10
𝑧 = 1.5
0.8
𝐳 = 𝟏. 𝟖𝟕𝟓

7
In Central Limit Theorem, the sample standard deviation (𝑠) may be
used as an estimate of the population standard deviation (𝜎) when the value
of 𝜎 is unknown. Consider the given examples below: Example 3: In the past, the average length of an outgoing call from a
business office has been 140 seconds. A manager wishes to check whether
that average has decrease after the introduction of policy changes. A sample
of 150 telephone calls produced a mean of 135 second, with a standard
deviation of 30 seconds. Perform the relevant test at 1% level of significance.
Solution: Let us first identify the given. We have:
�̅� = 135 𝜇 = 140 𝑠 = 30 𝑛 = 150
Since n ≥ 30, we will use z-test by replacing 𝝈 with its estimate s.
Use the formula for z-test.
Substitute the given value to the
formula.
Simplify.
𝑧 = �̅� − 𝜇
𝜎
√𝑛
𝑧 = 81.72 − 79. 83
15
√200
𝑧 = 1. 89
1514. 14
𝑧 = 1. 89
1.06
𝐳 = 𝟏. 𝟕𝟖𝟑
Therefore, the computed z-value is
1.783.
Use the formula for z-test.
Substitute the given value to the
formula.
Simplify.
𝑧 = �̅� − 𝜇
𝜎
√𝑛
𝑧 = 135 − 140
30
√150
𝑧 = −5
3012.25
𝑧 = −5
2.45
𝐳 = − 𝟐. 𝟎𝟒𝟏
Therefore, the computed z – value
is -2.041.

8
Example 4: Compute the t-value given the following information:
�̅� = 129.5 𝜇 = 127
𝑠 = 5 𝑛 = 12
Solution: Since σ is unknown and n < 30, we will use t-test. Thus, we have:
Example 5: The government claims that the monthly expenses of a Filipino
family with four members is P10,000. A sample of 26 family’s expenses has
a mean of P10,900 and a standard deviation of P1,250. Is there enough
evidence to reject the government’s claim at 𝛼 = 0. 01?
Solution: Let us first identify the given, so we have:
�̅� = P10,900 𝜇 = P10,000 𝑠 = P1,250 𝑛 = 26
Use the formula for t-test.
Substitute the given value to the
formula.
Simplify.
𝑡 = �̅� − 𝜇
𝑠
√𝑛
𝑡 = 10 900 − 10 000
1 250
√26
𝑡 = 900
1 2505.10
𝑡 = 900
245. 10
𝐭 = 𝟑. 𝟔𝟕𝟏
Therefore, the computed t-value is
3.671.
Use the formula for t-test.
Substitute the given value to the
formula.
Simplify.
𝑡 = �̅� − 𝜇
𝑠
√𝑛
𝑡 = 129. 5 − 127
5
√12
𝑡 = 2. 5
53.46
𝑡 = 2.5
1.44
𝐭 = 𝟏. 𝟕𝟑𝟔
Therefore, the computed t – value
is 1. 736.

9
Now, it’s your turn to answer the following exercises.
What’s More
Activity 1: Find My z-Value!
Directions: Find the computed z-value of the following. Write your answer
to the nearest thousandths. Show your solutions.
1. �̅� = 21. 75
𝜇 = 20. 83
𝜎 = 2.75
𝑛 = 38
2. �̅� = 11. 23
𝜇 = 12. 01
𝜎 = 3.0
𝑛 = 44
3. �̅� = 891.75
𝜇 = 890. 25
𝜎 = 11.75
𝑛 = 90
4. �̅� = 45 000
𝜇 = 46 100
𝜎 = 1 795
𝑛 = 50
5. �̅� = 1.72
𝜇 = 1.83
𝜎 = 1.05
𝑛 = 36

10
Activity 2: Find My t-Value!
Directions: Compute the t-value of the following. Write your answer to the
nearest thousandths. Show your solutions.
1. �̅� = 16.4
𝜇 = 15.86
𝑠 = 1.25
𝑛 = 21
2. �̅� = 246
𝜇 = 245. 85
𝑠 = 3.25
𝑛 = 29
3. �̅� = 9.5
𝜇 = 8.25
𝑠 = 1.45
𝑛 = 16
4. �̅� = 1.83
𝜇 = 1. 27
𝑠 = 2.15
𝑛 = 10
5. �̅� = 30. 18
𝜇 = 31. 23
𝑠 = 3.15
𝑛 = 23
Activity 3: Compute Me!
Directions: Solve the following. Write your answer to the nearest
thousandths.

11
1. �̅� = 7.7
𝜇 = 8.1
𝜎 = 5
𝑛 = 135
2. �̅� = 19.8
𝑠 = 4
𝜇 = 18.3
𝑛 = 11
3. �̅� = 12.5
𝑠 = 3
𝜇 = 10.75
𝑛 = 18
4. �̅� = 125.3
𝑠 = 5
𝜇 = 124
𝑛 = 24
5. �̅� = 25.4
𝜇 = 22.6
𝜎 = 15
𝑛 = 118
6. �̅� = 18.1
𝑠 = 3
𝜇 = 19.2
𝑛 = 15
7. �̅� = 98.7
𝜇 = 4.6
𝜎 = 99.1
𝑛 = 105
8. �̅� = 129.1
𝑠 = 7
𝜇 = 128.3
𝑛 = 23
9. �̅� = 17.2
𝜇 = 3.1
𝜎 = 16.9
𝑛 = 100
Activity 4: Find My Value!
Directions: Determine the test statistic used. Then, find the value of the
following based on the given information.

12
1. 𝐻𝑜: 𝜇 = 85 𝐻𝑎: 𝜇 ≠ 85
The sample mean is 83, the sample size is 39, and the standard
deviation is 5. Use 𝛼 = 0.05.
2. 𝐻𝑜: 𝜇 = 7. 5 𝐻𝑎: 𝜇 > 7. 5
The sample mean is 8.3 and the sample size is 52. The population
follows a normal distribution with standard deviation 3.17. Use 𝛼 =
0.01.
3. 𝐻𝑜: 𝜇 = 15 𝐻𝑎: 𝜇 < 15
The sample mean is 10, the sample standard deviation is 6.1, and the
sample size is 9. Use 𝛼 = 0.05.
4. 𝐻𝑜: 𝜇 = 116.12 𝐻𝑎: 𝜇 > 116.12
The population follows a normal distribution with standard deviation
of 7.18, sample mean of 118.7, and sample size of 21. Use 𝛼 = 0.10.
5. 𝐻𝑜: 𝜇 = 215 𝐻𝑎: 𝜇 ≠ 215
The population is approximately normal. The sample mean is 219.3,
the sample standard deviation is 13.12, and the sample size is 22.
Use 𝛼 = 0.05.
6. 𝐻𝑜: 𝜇 = 15 𝐻𝑎: 𝜇 ≠ 15
The population is approximately normal. The sample mean is 15.3,
the sample standard deviation is 2.5, and the sample size is 12. Use 𝛼
= 0.05.
7. 𝐻𝑜: 𝜇 = 65 𝐻𝑎: 𝜇 > 65
The sample mean is 63, the sample size is 43, and the standard
deviation is 4. Use 𝛼 = 0.05.

13
8. 𝐻𝑜: 𝜇 = 25 𝐻𝑎: 𝜇 < 25
The sample mean is 23.75, the sample standard deviation is 4.5, and
the sample size is 12. Use 𝛼 = 0.05.
9. 𝐻𝑜: 𝜇 = 106.22 𝐻𝑎: 𝜇 > 106.22
The population follows a normal distribution with standard deviation
of 4.08, sample mean of 108.5 and sample size of 17. Use 𝛼 = 0.10.
10. 𝐻𝑜: 𝜇 = 25. 5 𝐻𝑎: 𝜇 > 25. 5
The sample mean is 23.8 and the sample size is 42. The population
follows a normal distribution with standard deviation 2.27. Use
𝛼 = 0.01.
What I Have Learned
Directions: What new realizations did you have about the computation of test
statistic? To answer the question, complete the sentences below.
1. The __________ is used if the sample size is large, 𝑛 ≥ ___, and the
population standard deviation (𝜎) is __________.
2. The formula of the z-test is __________.
3. The __________ is used when 𝑛 < 30, the population is normal or nearly
normal, and sample standard deviation (𝑠) is __________.
4. The formula of the t-test is __________.
5. The formula for degree of freedom is __________.

14
What I Can Do
The Corona!
Directions: Determine the test statistic to be used, then find its computed
vale.
The Coronavirus Disease (COVID-19) is an infectious disease caused
by a new strain of coronavirus. The World Health Organization (WHO) claims
that the incubation period of the virus in the infected person has a mean of
5.1 days. The doctors in the Philippines conducted a research and they
found out that incubation period of the virus in human body is 6.03 days
with a standard deviation of 3.32. The samples were 46 COVID patients. Is
there enough evidence to conclude that the incubation period of the virus is
5.1 days as stated, at 𝛼 = 0. 01?

15
Assessment
Directions: Choose the best answer to the given questions or statements.
Write the letter of your choice on a separate sheet of paper. 1. What test statistic will be used if the sample size is below 30?
A. t-test C. population mean
B. z-test D. standard deviation
2. In using t-test for a population mean, we assume that the sample is
selected randomly. The given statement is:
A. always true C. sometimes true
B. always false D. sometimes false 3. If the population standard deviation is unknown, what test statistic is to
be used?
A. t-test C. population mean
B. z-test D. standard deviation
4. In finding the t-computed value, which formula should be used?
A. 𝑡 = 𝜇− �̅�
𝜎
√𝑛
B. 𝑡 = 𝜇− �̅�
𝑠
√𝑛
C. 𝑡 = �̅�−𝜇
𝑠
√𝑛
D. 𝑡 = �̅�−𝜇
𝜎
√𝑛
5. When should you use the z-test?
I. When you are testing for a population mean
II. When the population standard deviation is given
III. When the sample standard deviation ONLY is given
IV. When you are testing with small sample sizes, n < 30.
A. I and II C. II and IV
B. II and III D. I and III For nos. 6-8, refer to the problem below:
Milky Milk is sold in packets with an advertised mean weight of
0.5kgs. The standard deviation is known to be 0.11 kilograms. A consumer
group wishes to check the accuracy of the advertised mean and takes a
sample of 36 packets finding an average weight of 0.47kgs. 6. What test statistic should be used?
A. t-test C. population mean
B. z-test D. standard deviation

16
7. What is the sample size?
A. 0. 15 B. 0. 48 C. 0. 5 D. 36
8. What is the computed value?
A. – 1. 636 B. -1.488 C. 0. 833 D. 5. 551 For nos. 9-10, refer to the problem below:
Given: 𝐻𝑜: μ = 7.25 𝐻𝑎: μ < 7.25
The study has a sample mean of 8.1 and a standard deviation of 1.18
conducted among 15 respondents. Use 𝛼 = 0.01.
9. What test statistic should be used?
A. t-test C. population mean
B. z-test D. standard deviation
10. What is the computed value?
A. – 2.790 B. -2.368 C. 2.368 D. 2.790
11. How many samples are best when dealing with t-test?
A. cannot be determined C. smaller than 30
B. exactly 30 D. equal or larger than 30
12. Which test statistic will be used if the sample is 37?
A. t-test C. population mean
B. z-test D. standard deviation
13. Which statistical method can you use when you have a normal
distribution of data?
A. t-test only C. either t-test or z-test
B. z-test only D. neither t-test nor z-test
For nos. 14-15, refer to the problem below:
A tire manufacturer claims that its tires have a mean life of 40,000
kms. A random sample of 46 of these tires is tested and the sample mean is
38,000 kms. Assume that the populations standard deviation is 2,000 kms
and the lives of tires are approximately normally distributed. 14. What test statistic should be used?
A. t-test C. population mean
B. z-test D. standard deviation
15. What is the computed value at 5% level of significance?
A. 6.782 B. 3.033 C. -6.782 D. -3.033

17
Additional Activities
Directions: Answer the following:
1. Assume that the cholesterol levels in a certain population have mean µ =
150 and standard deviation σ = 12. The cholesterol levels for a random
sample of n = 40 individuals are measured and the sample mean x is
determined. What is the computed value at 𝛼 = 0. 01 if �̅� = 147?
2. The maximum heart rate of a person at the age of 20 is 200 beats per
minute. Conduct a survey with your neighbors whose age is between 15-
20. Collect a data of 10 samples, then compute its value for 𝛼 = 0. 01?

18
Answer Key
What's In
(Is It T or Z?) 1.Z
2.T
3.T
4.T
5.Z
What I Know 1.A 9. D
2.B 10. B 3.B 11. B
4.A 12. A 5.A 13. A
6.A 14. C 7.A 15. A
8.D
What's New
(t-Test vs z-Test) 1.z-test
2.z-test
3.t-test
What's More
Activity 1: Find My
z-Value!
1.2.063
2.-1.725
3.1.211
4.-4.333
5.-0.629
What's More
Activity 2: Find My
t-Value!
1.1.980
2.0.249
3.3.448
4.0.824
5.-1.599
What's More
Activity 3: Compute
Me
1. -0.930
2.1.244
3.2.475
4.1.275
5.2.028
6.-1. 420
7.-0.891
8.0.548
9.0.968
What's More
Activity 4: Find My
Value!
1.z-test; -2.498
2.z-test; 1.820
3.t-test; -2.459
4.t-test; 1.647
5.t-test; 1.537
6.t – test; 0.416
7.z – test; -3.279
8.t – test; -0.962
9.t – test; 2.304
10.z – test; -4.853
What I Can Do
The Corona
z-test; 1.900

19
Assessment
1.A 9. A
2.A 10. D 3.A 11. C
4.C 12. B 5.A 13. C
6.B 14. B
7.D 15. C 8.A
Additional
Activities 1. z = -1.581
2.Answers may vary.
What I Have
Learned
1.z-test; 30; known
2.𝑧= 𝑥−𝜇
𝜎
√𝑛
3.t-test; unknown
4.𝑡= 𝑥−𝜇
𝑠
√𝑛
5.df = n-1

20
References
Textbooks
Albacea, Zita VJ., Mark John V. Ayaay, Isidoro P. David, and Imelda E. De Mesa. Teaching Guide for Senior High School: Statistics and Probability. Quezon City:
Commision on Higher Education, 2016.
Caraan, Avelino Jr S. Introduction to Statistics & Probability: Modular Approach.
Mandaluyong City: Jose Rizal University Press, 2011.
De Guzman, Danilo. Statistics and Probability. Quezon City: C & E Publishing Inc., 2017.
Punzalan, Joyce Raymond B. Senior High School Statistics and Probability. Malaysia: Oxford Publishing, 2018.
Sirug, Winston S. Statistics and Probability for Senior High School CORE Subject A Comprehensive Approach K to 12 Curriculum Compliant. Manila: Mindshapers Co., Inc., 2017.
Online Resources
Lauer, Stephen A., Kyra H. Grantz, Qifang Bi, Forrest K. Jones, Qulu Zheng,
Hannah R. Meredith, Andrew S. Azman, Nicolas G. Reich, and Justin Lessler.
“The Incubation Period of Coronavirus. Disease 2019 (COVID-19) From
Publicly Reported Confirmed Cases: Estimation and Application,” Annals of
Internal Medicine 172, no. 9 (2020); 577-582. Accessed May 21, 2020
https://www.acpjournals.org/doi/10.7326/M20-0504

21
For inquiries or feedback, please write or call: Department of Education - Bureau of Learning Resources (DepEd-BLR)
Ground Floor, Bonifacio Bldg., DepEd Complex Meralco Avenue, Pasig City, Philippines 1600
Telefax: (632) 8634-1072; 8634-1054; 8631-4985
Email Address: [email protected] * [email protected]