Embed Size (px)
Citation preview
Quarterly Financial Report
for Manufacturing, Mining, Trade,
and Selected Service Industries
2014 Quarter 4
Issued March 2015
QFR
QFR/14-Q4
SUGGESTED CITATION
U.S. Census Bureau,
Washington, DC 20233
Quarterly Financial Report
for Manufacturing, Mining, Trade,
and Selected Service Industries.
Fourth Quarter 2014,
Series QFR/14-Q4
U.S. Department of Commerce
Penny Pritzker,
Secretary
Bruce H. Andrews,
Deputy Secretary
ECONOMICS
AND STATISTICS
ADMINISTRATION
Economics and Statistics Administration
Mark Doms,
Under Secretary for Economic Affairs
U.S. CENSUS BUREAU
John H. Thompson,
Director of the Census
Nancy A. Potok,
Deputy Director and
Chief Operating Officer
William G. Bostic, Jr.,
Associate Director for Economic Programs
Shirin A. Ahmed,
Assistant Director for Economic Programs
Nick Orsini,
Chief, Economic Indicators Division
U.S. Census Bureau, Quarterly Financial Report, 2014 Quarter 4 ii
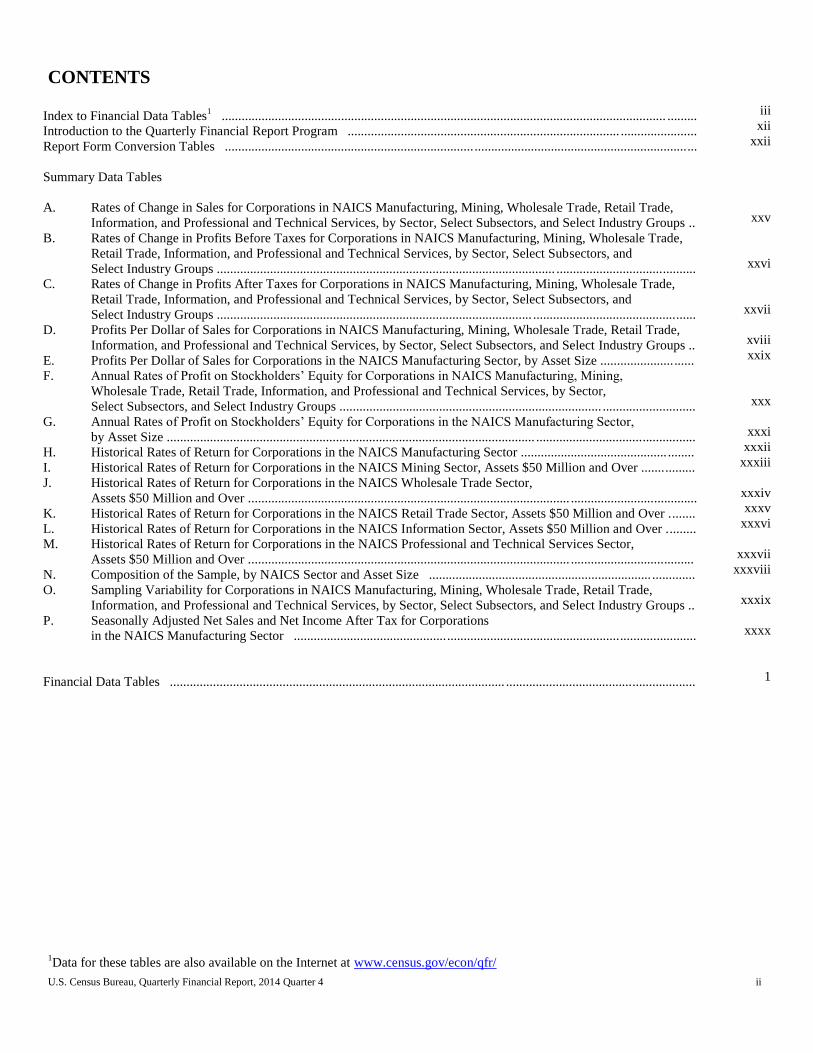
CONTENTS
Index to Financial Data Tables1 ...................................................................................................................................... .........
Introduction to the Quarterly Financial Report Program .................................................................................. .......................
Report Form Conversion Tables ........................................................................... ...................................................................
Summary Data Tables
A. Rates of Change in Sales for Corporations in NAICS Manufacturing, Mining, Wholesale Trade, Retail Trade,
Information, and Professional and Technical Services, by Sector, Select Subsectors, and Select Industry Groups ..
B. Rates of Change in Profits Before Taxes for Corporations in NAICS Manufacturing, Mining, Wholesale Trade,
Retail Trade, Information, and Professional and Technical Services, by Sector, Select Subsectors, and
Select Industry Groups ...................................................................................................... ..........................................
C. Rates of Change in Profits After Taxes for Corporations in NAICS Manufacturing, Mining, Wholesale Trade,
Retail Trade, Information, and Professional and Technical Services, by Sector, Select Subsectors, and
Select Industry Groups ............................................................................................... .................................................
D. Profits Per Dollar of Sales for Corporations in NAICS Manufacturing, Mining, Wholesale Trade, Retail Trade,
Information, and Professional and Technical Services, by Sector, Select Subsectors, and Select Industry Groups ..
E. Profits Per Dollar of Sales for Corporations in the NAICS Manufacturing Sector, by Asset Size ............................
F. Annual Rates of Profit on Stockholders’ Equity for Corporations in NAICS Manufacturing, Mining,
Wholesale Trade, Retail Trade, Information, and Professional and Technical Services, by Sector,
Select Subsectors, and Select Industry Groups ............................................................................... ............................
G. Annual Rates of Profit on Stockholders’ Equity for Corporations in the NAICS Manufacturing Sector,
by Asset Size ............................................................................................................... ................................................
H. Historical Rates of Return for Corporations in the NAICS Manufacturing Sector ............................................ ........
I. Historical Rates of Return for Corporations in the NAICS Mining Sector, Assets $50 Million and Over ................
J. Historical Rates of Return for Corporations in the NAICS Wholesale Trade Sector,
Assets $50 Million and Over ................................................................................................. ......................................
K. Historical Rates of Return for Corporations in the NAICS Retail Trade Sector, Assets $50 Million and Over ........
L. Historical Rates of Return for Corporations in the NAICS Information Sector, Assets $50 Million and Over .........
M. Historical Rates of Return for Corporations in the NAICS Professional and Technical Services Sector,
Assets $50 Million and Over ................................................................................................. .....................................
N. Composition of the Sample, by NAICS Sector and Asset Size ................................................................... .............
O. Sampling Variability for Corporations in NAICS Manufacturing, Mining, Wholesale Trade, Retail Trade,
Information, and Professional and Technical Services, by Sector, Select Subsectors, and Select Industry Groups ..
P. Seasonally Adjusted Net Sales and Net Income After Tax for Corporations
in the NAICS Manufacturing Sector .........................................................................................................................
Financial Data Tables ..................................................................................................... .........................................................
iii
xii
xxii
xxv
xxvi
xxvii
xviii
xxix
xxx
xxxi
xxxii
xxxiii
xxxiv
xxxv
xxxvi
xxxvii
xxxviii
xxxix
xxxx
1
1Data for these tables are also available on the Internet at www.census.gov/econ/qfr/
U.S. Census Bureau, Quarterly Financial Report, 2014 Quarter 4 iii
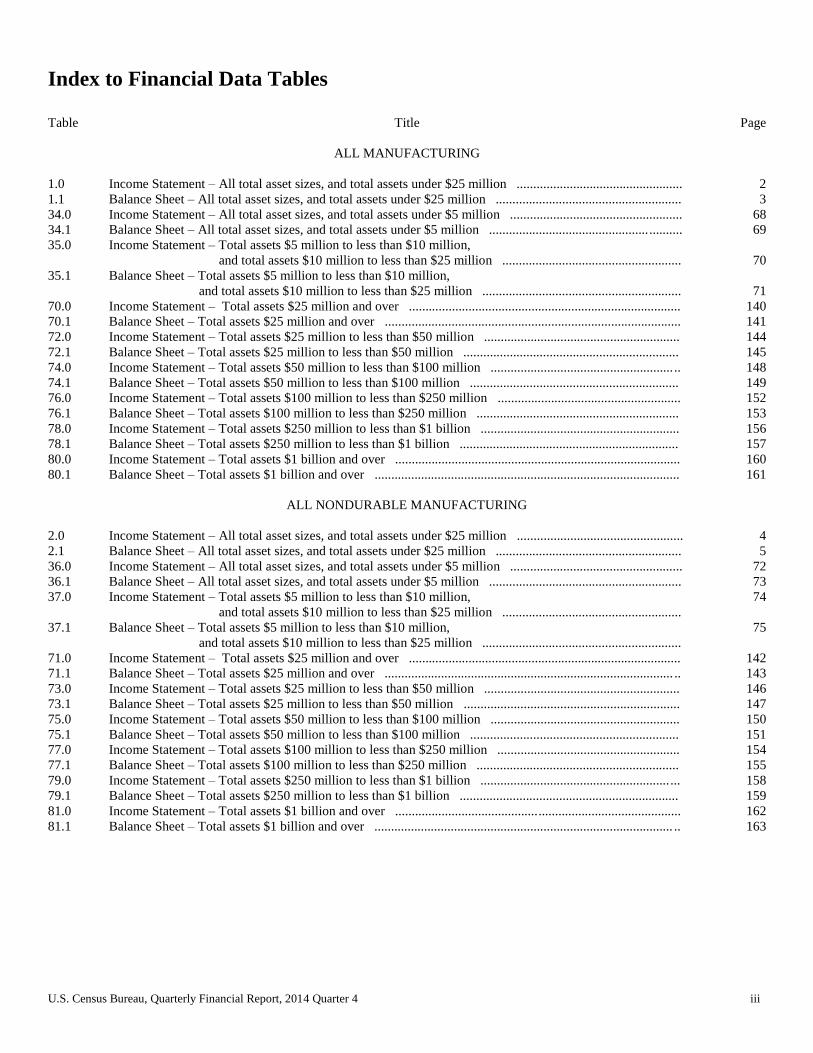
Index to Financial Data Tables
Table Title Page
ALL MANUFACTURING
1.0 Income Statement – All total asset sizes, and total assets under $25 million .................................................. 2
1.1 Balance Sheet – All total asset sizes, and total assets under $25 million ........................................................ 3
34.0 Income Statement – All total asset sizes, and total assets under $5 million .................................................... 68
34.1 Balance Sheet – All total asset sizes, and total assets under $5 million ................................................ .......... 69
35.0 Income Statement – Total assets $5 million to less than $10 million,
and total assets $10 million to less than $25 million ......................................................
70
35.1 Balance Sheet – Total assets $5 million to less than $10 million,
and total assets $10 million to less than $25 million ............................................................
71
70.0 Income Statement – Total assets $25 million and over .................................................................................. 140
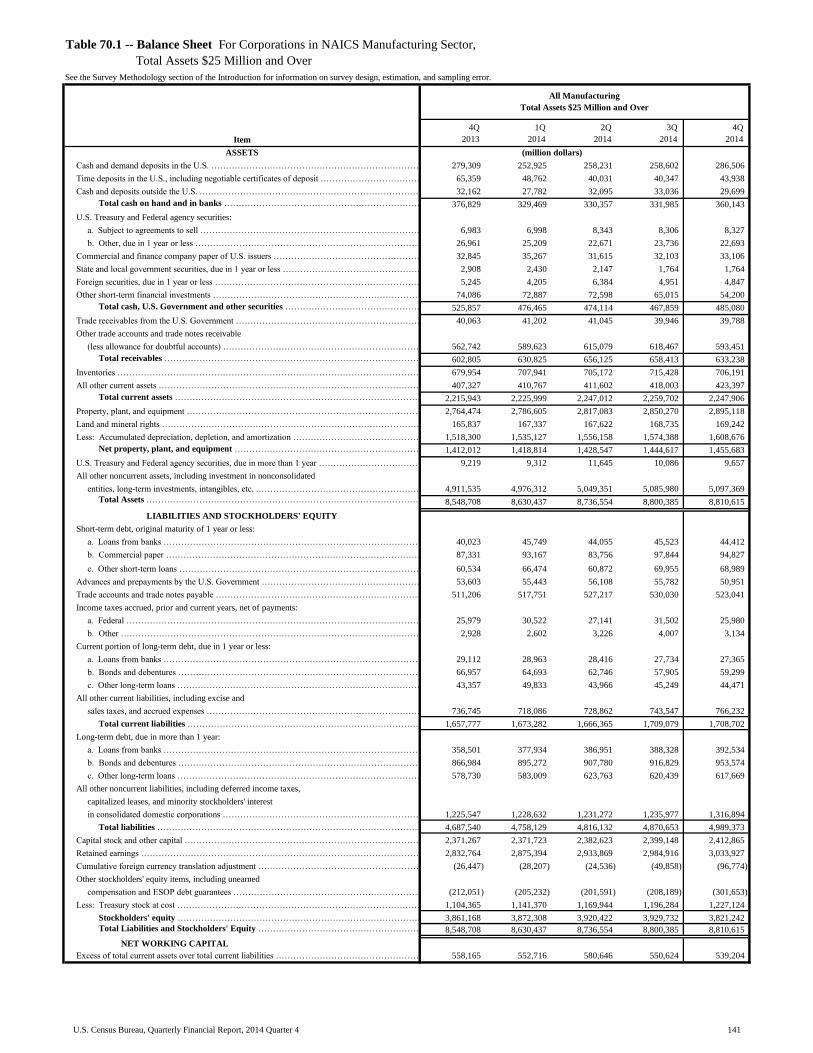
70.1 Balance Sheet – Total assets $25 million and over ......................................................................................... 141
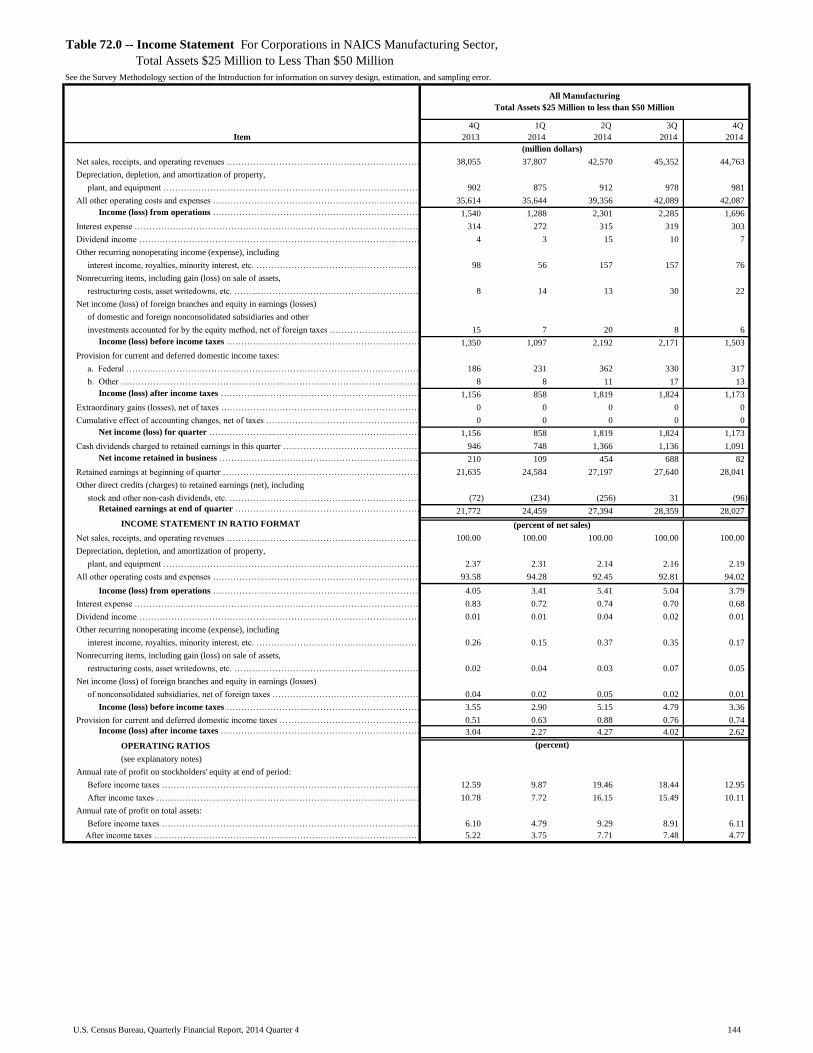
72.0 Income Statement – Total assets $25 million to less than $50 million ........................................................... 144
72.1 Balance Sheet – Total assets $25 million to less than $50 million ................................................................. 145
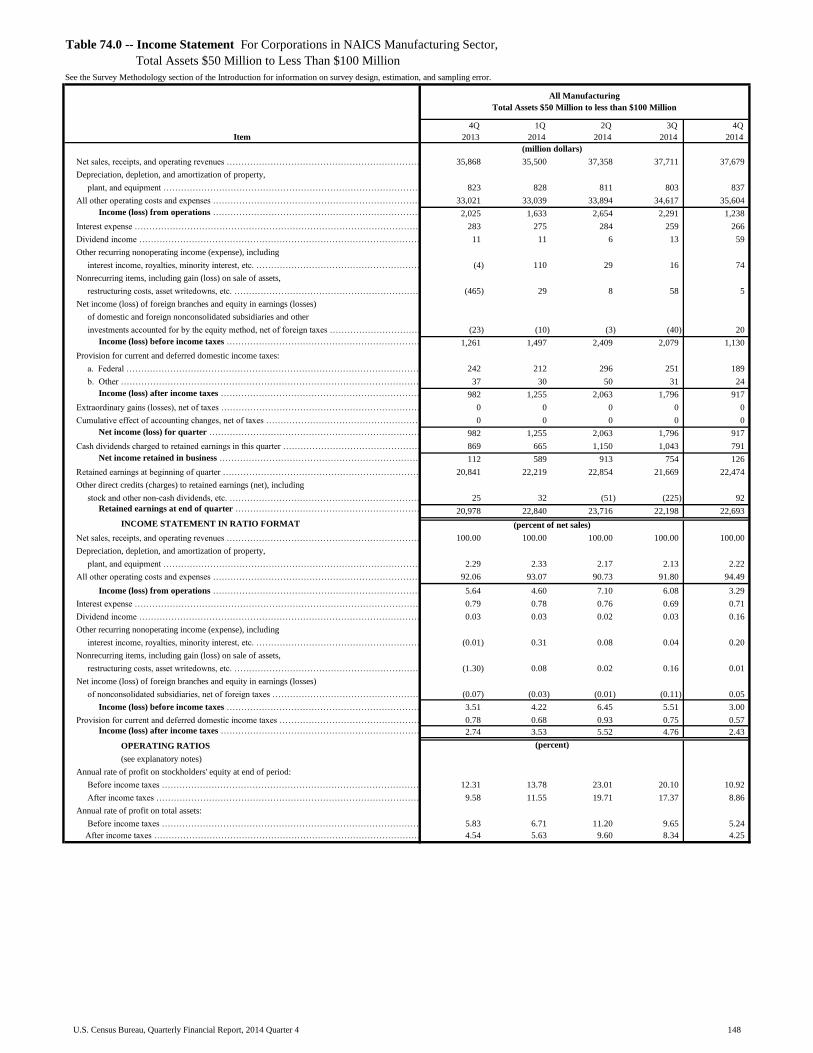
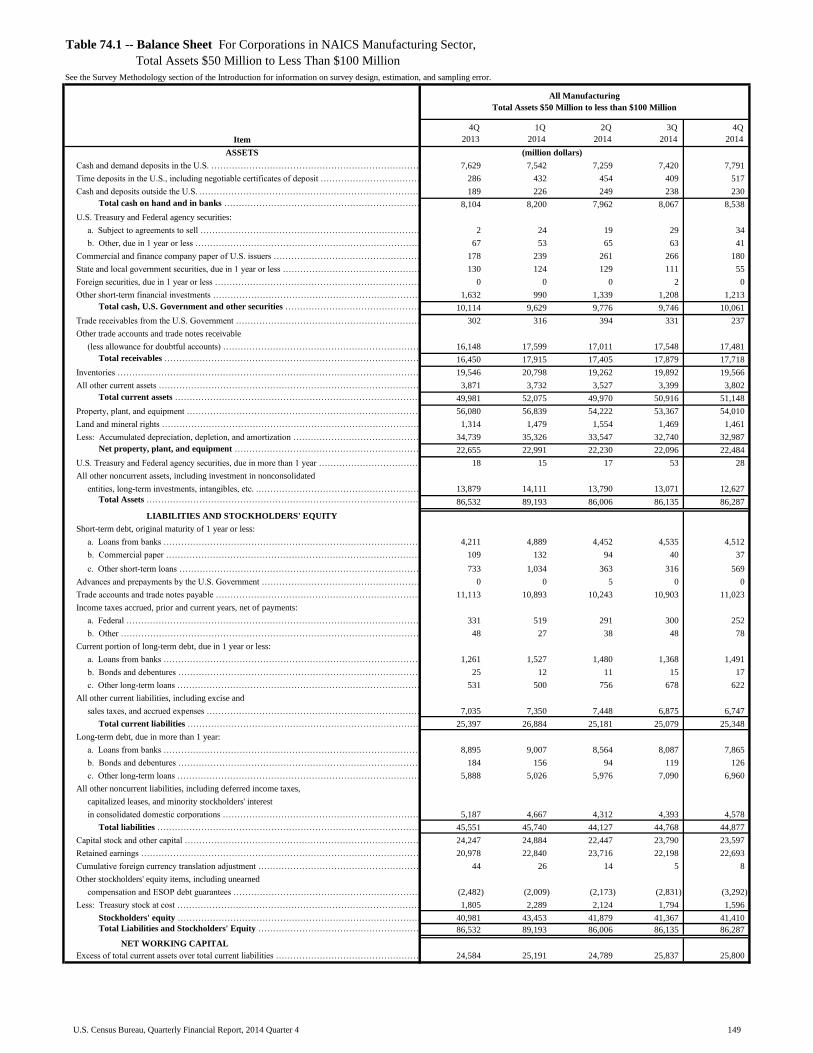
74.0 Income Statement – Total assets $50 million to less than $100 million ....................................................... .. 148
74.1 Balance Sheet – Total assets $50 million to less than $100 million ............................................................... 149
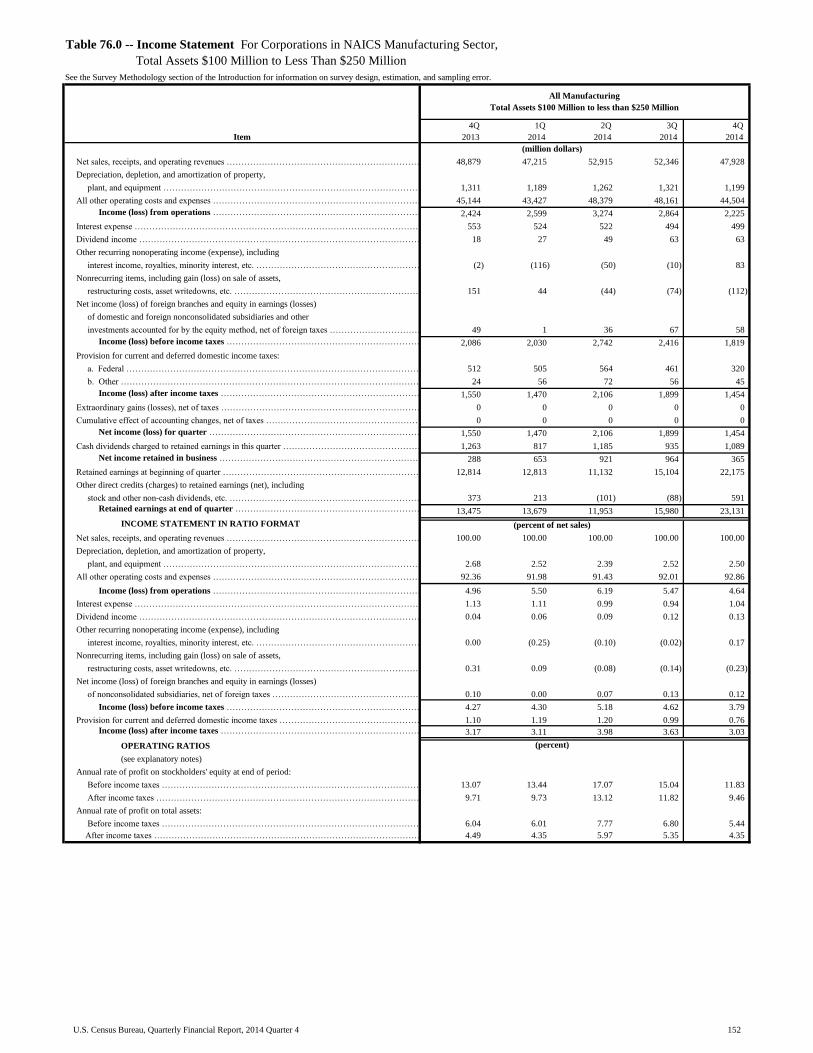
76.0 Income Statement – Total assets $100 million to less than $250 million ....................................................... 152
76.1 Balance Sheet – Total assets $100 million to less than $250 million ............................................................. 153
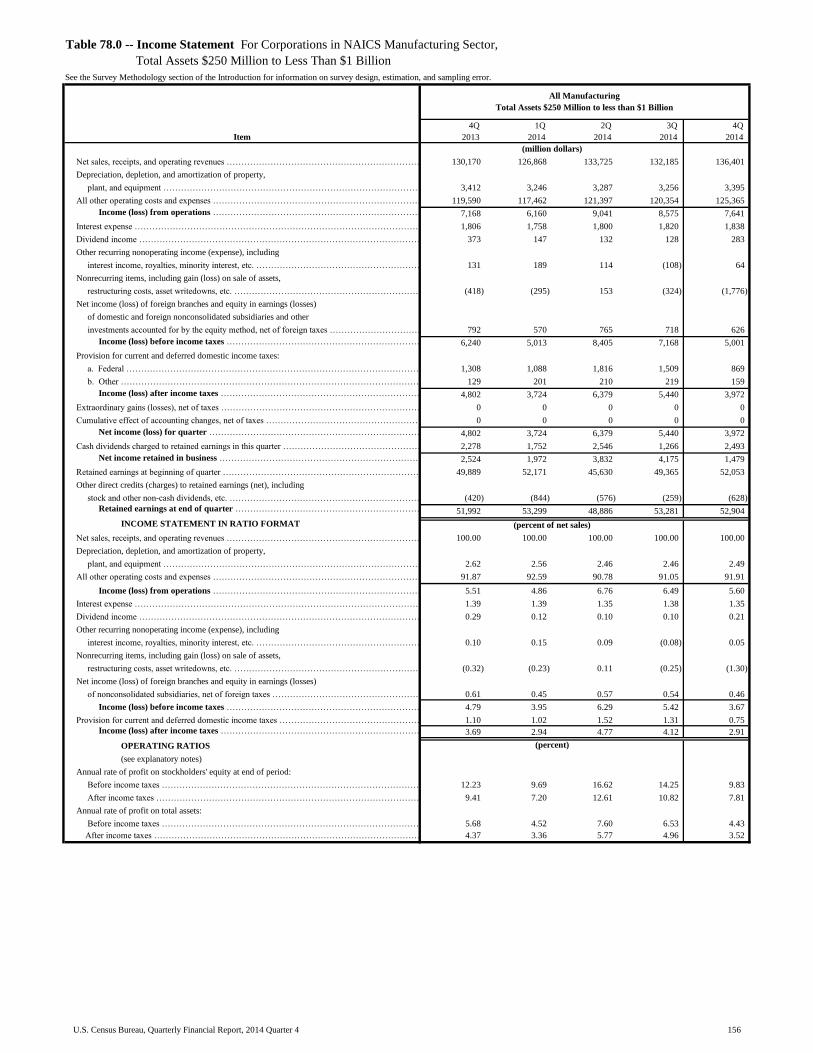
78.0 Income Statement – Total assets $250 million to less than $1 billion ............................................................ 156
78.1 Balance Sheet – Total assets $250 million to less than $1 billion .................................................................. 157
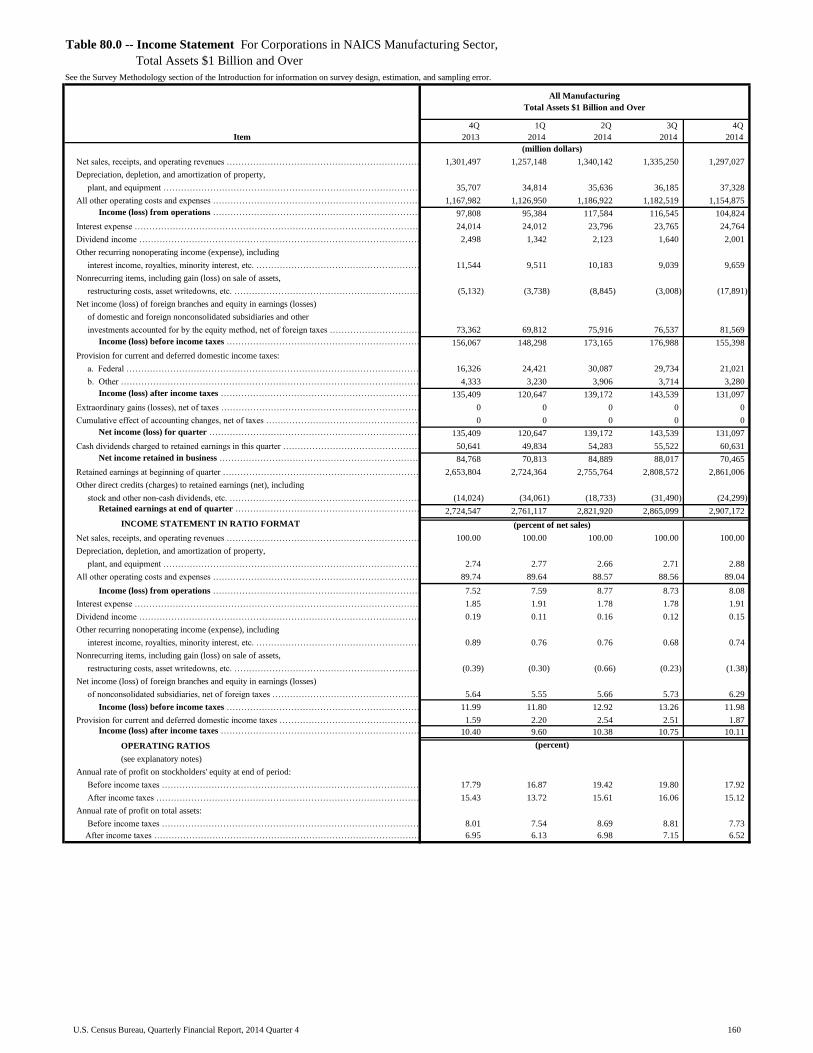
80.0 Income Statement – Total assets $1 billion and over ...................................................................................... 160
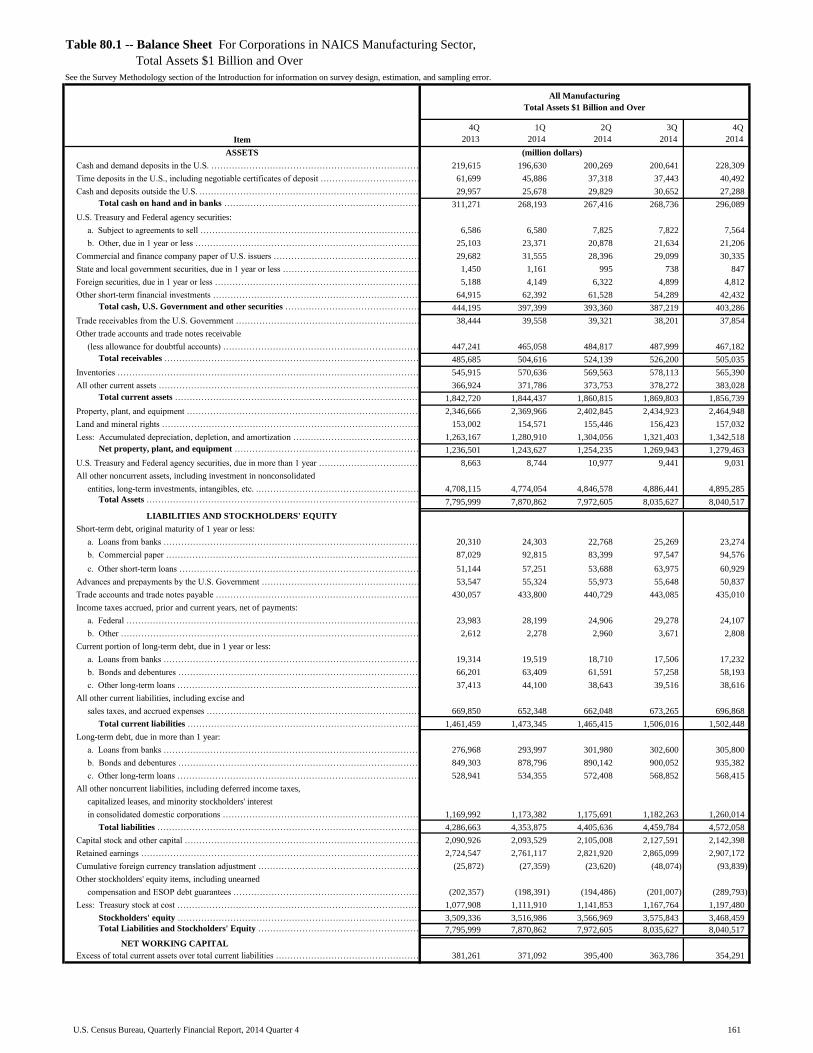
80.1 Balance Sheet – Total assets $1 billion and over ............................................................................................ 161
ALL NONDURABLE MANUFACTURING
2.0 Income Statement – All total asset sizes, and total assets under $25 million .................................................. 4
2.1 Balance Sheet – All total asset sizes, and total assets under $25 million ........................................................ 5
36.0 Income Statement – All total asset sizes, and total assets under $5 million .................................................... 72
36.1 Balance Sheet – All total asset sizes, and total assets under $5 million .......................................................... 73
37.0 Income Statement – Total assets $5 million to less than $10 million,
and total assets $10 million to less than $25 million ......................................................
74
37.1 Balance Sheet – Total assets $5 million to less than $10 million,
and total assets $10 million to less than $25 million ............................................................
75
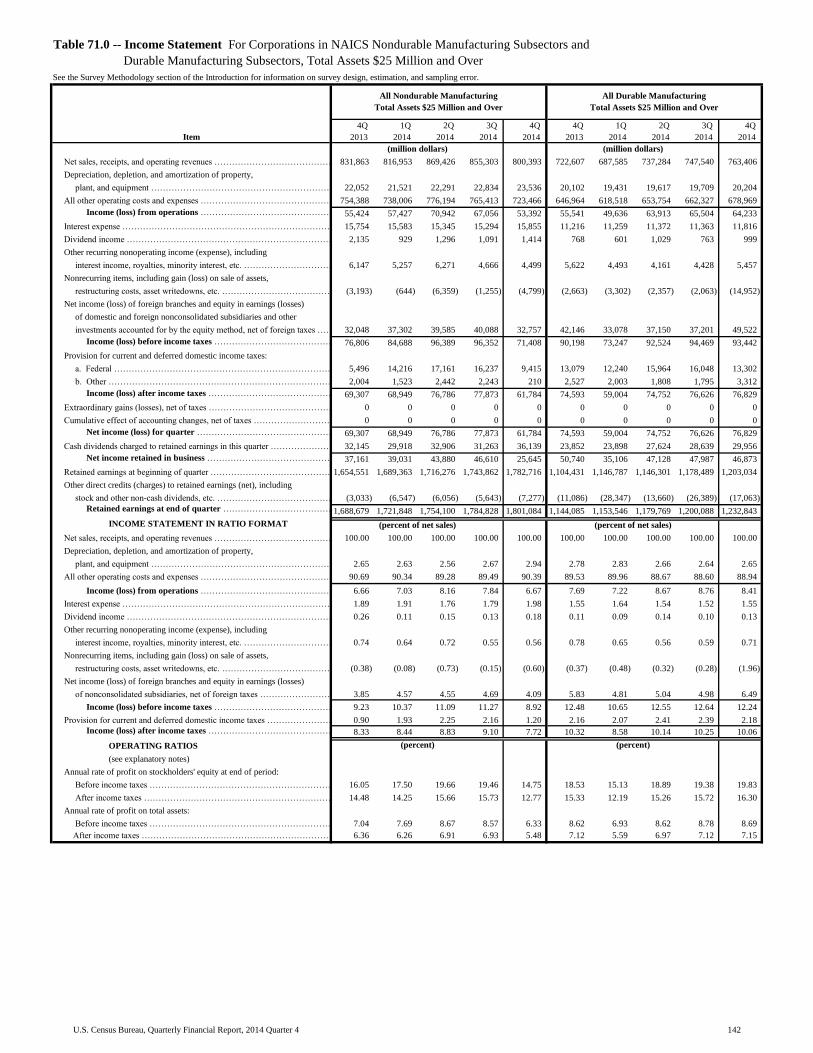
71.0 Income Statement – Total assets $25 million and over .................................................................................. 142
71.1 Balance Sheet – Total assets $25 million and over ....................................................................................... .. 143
73.0 Income Statement – Total assets $25 million to less than $50 million ........................................................... 146
73.1 Balance Sheet – Total assets $25 million to less than $50 million ................................................................. 147
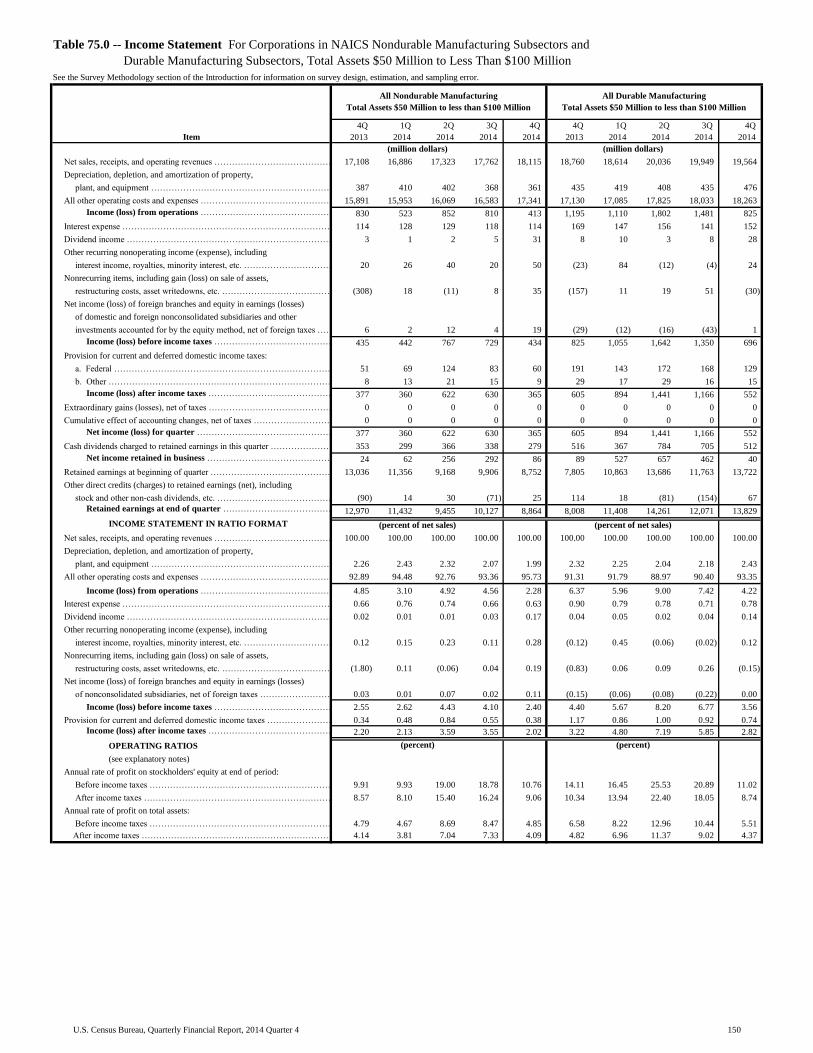
75.0 Income Statement – Total assets $50 million to less than $100 million ......................................................... 150
75.1 Balance Sheet – Total assets $50 million to less than $100 million ............................................................... 151
77.0 Income Statement – Total assets $100 million to less than $250 million ....................................................... 154
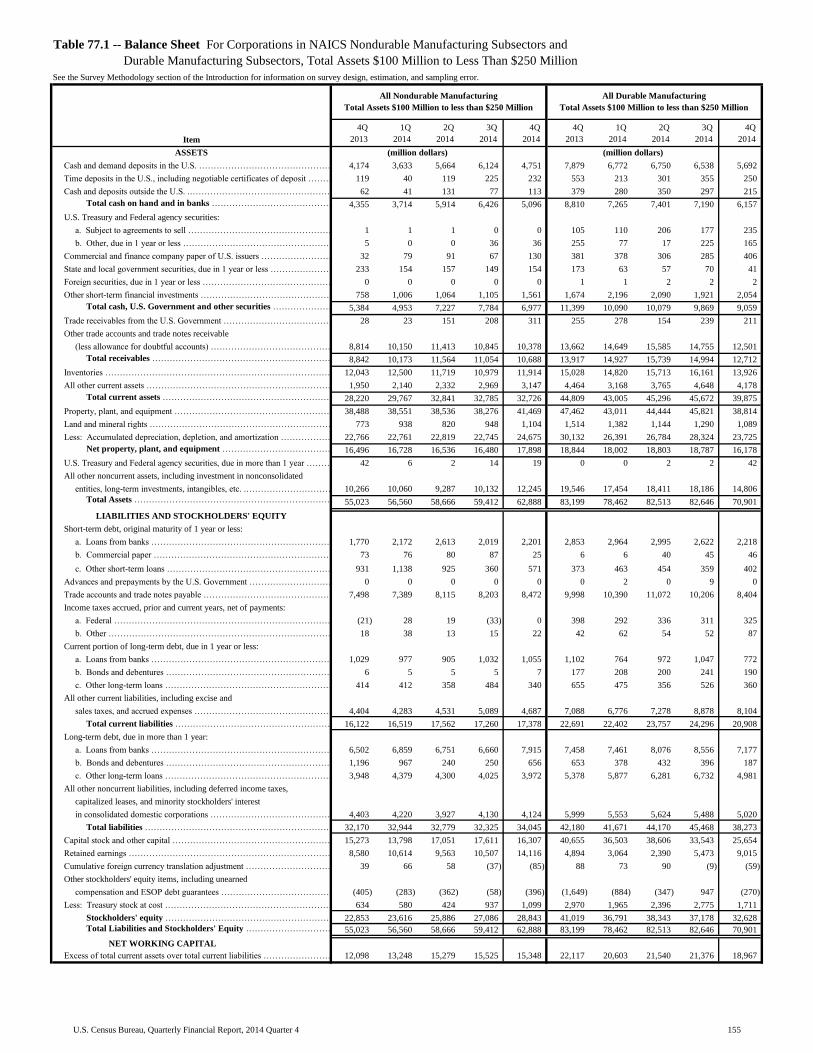
77.1 Balance Sheet – Total assets $100 million to less than $250 million ............................................................. 155
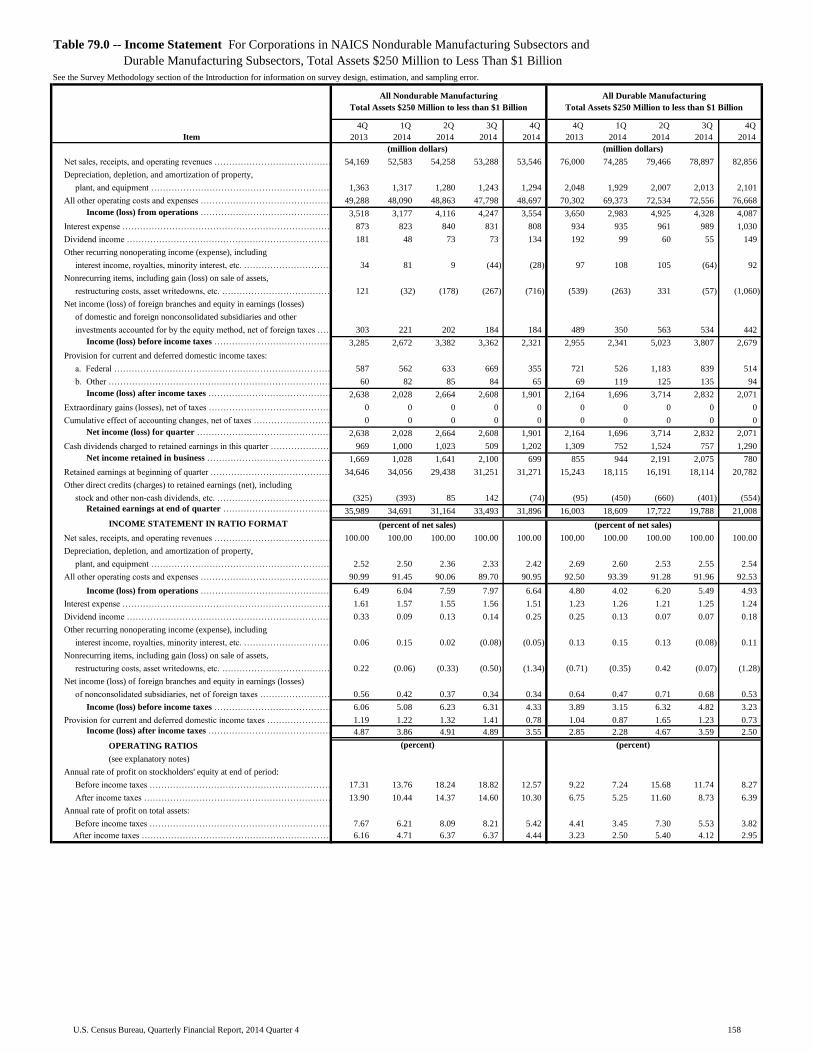
79.0 Income Statement – Total assets $250 million to less than $1 billion ......................................................... ... 158
79.1 Balance Sheet – Total assets $250 million to less than $1 billion .................................................................. 159
81.0 Income Statement – Total assets $1 billion and over ...................................................................................... 162
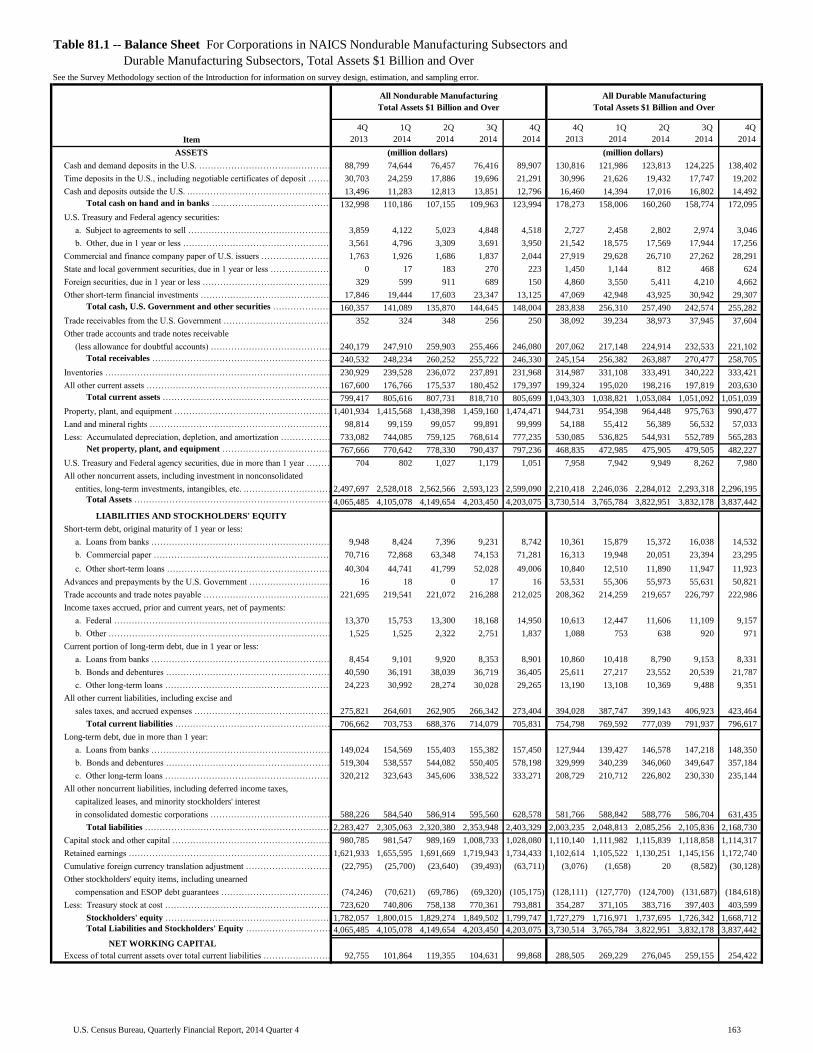
81.1 Balance Sheet – Total assets $1 billion and over .......................................................................................... .. 163
U.S. Census Bureau, Quarterly Financial Report, 2014 Quarter 4 iv
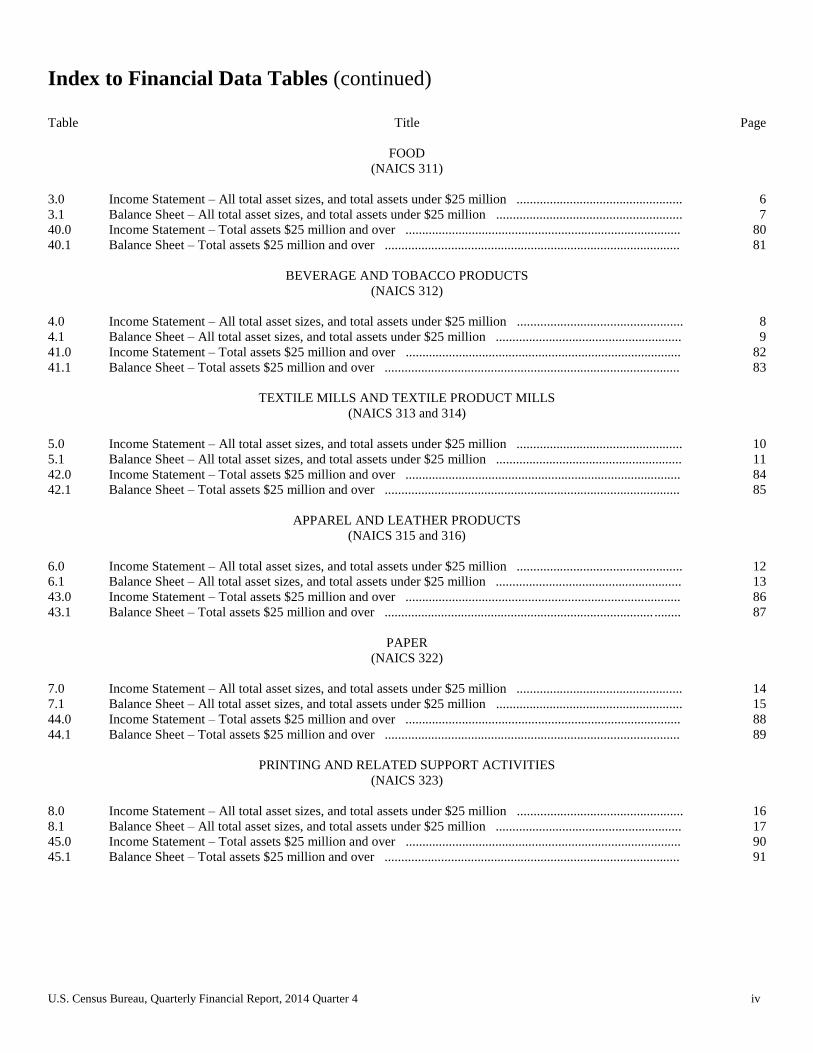
Index to Financial Data Tables (continued)
Table Title Page
FOOD
(NAICS 311)
3.0 Income Statement – All total asset sizes, and total assets under $25 million .................................................. 6
3.1 Balance Sheet – All total asset sizes, and total assets under $25 million ........................................................ 7
40.0 Income Statement – Total assets $25 million and over ................................................................................... 80
40.1 Balance Sheet – Total assets $25 million and over ......................................................................................... 81
BEVERAGE AND TOBACCO PRODUCTS
(NAICS 312)
4.0 Income Statement – All total asset sizes, and total assets under $25 million .................................................. 8
4.1 Balance Sheet – All total asset sizes, and total assets under $25 million ........................................................ 9
41.0 Income Statement – Total assets $25 million and over ................................................................................... 82
41.1 Balance Sheet – Total assets $25 million and over ......................................................................................... 83
TEXTILE MILLS AND TEXTILE PRODUCT MILLS
(NAICS 313 and 314)
5.0 Income Statement – All total asset sizes, and total assets under $25 million .................................................. 10
5.1 Balance Sheet – All total asset sizes, and total assets under $25 million ........................................................ 11
42.0 Income Statement – Total assets $25 million and over ................................................................................... 84
42.1 Balance Sheet – Total assets $25 million and over ......................................................................................... 85
APPAREL AND LEATHER PRODUCTS
(NAICS 315 and 316)
6.0 Income Statement – All total asset sizes, and total assets under $25 million .................................................. 12
6.1 Balance Sheet – All total asset sizes, and total assets under $25 million ........................................................ 13
43.0 Income Statement – Total assets $25 million and over ................................................................................... 86
43.1 Balance Sheet – Total assets $25 million and over ................................................................................. ........ 87
PAPER
(NAICS 322)
7.0 Income Statement – All total asset sizes, and total assets under $25 million .................................................. 14
7.1 Balance Sheet – All total asset sizes, and total assets under $25 million ........................................................ 15
44.0 Income Statement – Total assets $25 million and over ................................................................................... 88
44.1 Balance Sheet – Total assets $25 million and over ......................................................................................... 89
PRINTING AND RELATED SUPPORT ACTIVITIES
(NAICS 323)
8.0 Income Statement – All total asset sizes, and total assets under $25 million .................................................. 16
8.1 Balance Sheet – All total asset sizes, and total assets under $25 million ........................................................ 17
45.0 Income Statement – Total assets $25 million and over ................................................................................... 90
45.1 Balance Sheet – Total assets $25 million and over ......................................................................................... 91
U.S. Census Bureau, Quarterly Financial Report, 2014 Quarter 4 v
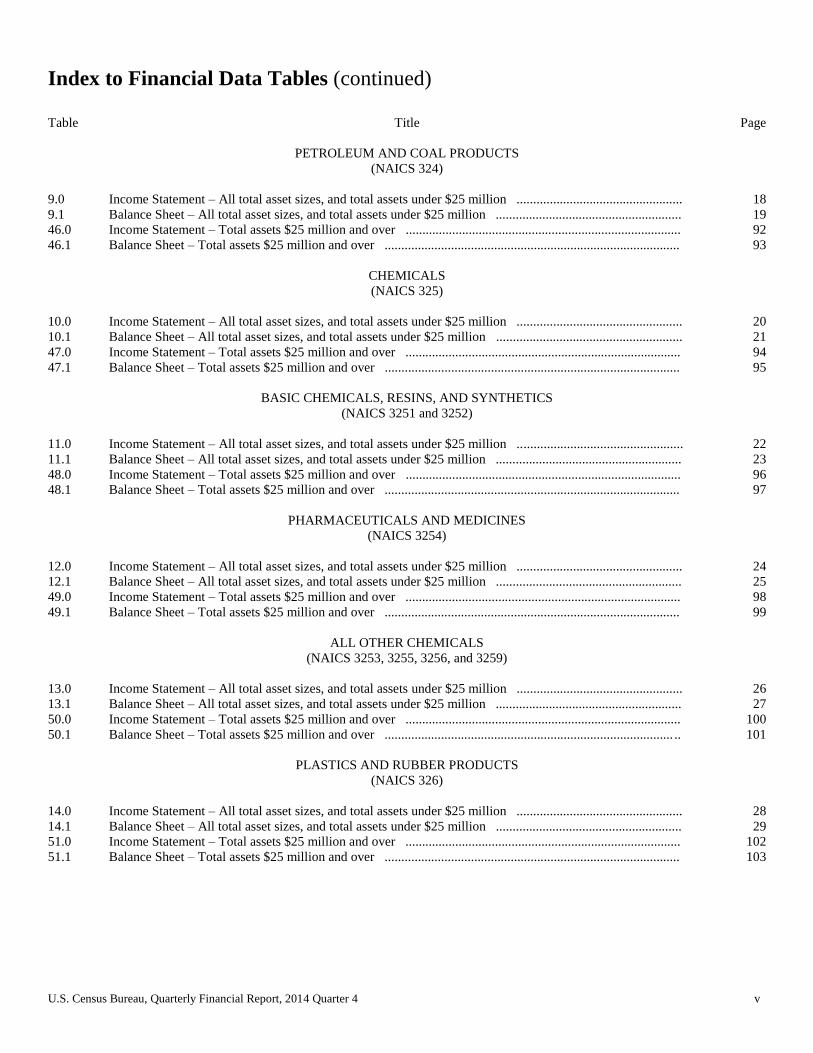
Index to Financial Data Tables (continued)
Table Title Page
PETROLEUM AND COAL PRODUCTS
(NAICS 324)
9.0 Income Statement – All total asset sizes, and total assets under $25 million .................................................. 18
9.1 Balance Sheet – All total asset sizes, and total assets under $25 million ........................................................ 19
46.0 Income Statement – Total assets $25 million and over ................................................................................... 92
46.1 Balance Sheet – Total assets $25 million and over ......................................................................................... 93
CHEMICALS
(NAICS 325)
10.0 Income Statement – All total asset sizes, and total assets under $25 million .................................................. 20
10.1 Balance Sheet – All total asset sizes, and total assets under $25 million ........................................................ 21
47.0 Income Statement – Total assets $25 million and over ................................................................................... 94
47.1 Balance Sheet – Total assets $25 million and over ......................................................................................... 95
BASIC CHEMICALS, RESINS, AND SYNTHETICS
(NAICS 3251 and 3252)
11.0 Income Statement – All total asset sizes, and total assets under $25 million .................................................. 22
11.1 Balance Sheet – All total asset sizes, and total assets under $25 million ........................................................ 23
48.0 Income Statement – Total assets $25 million and over ................................................................................... 96
48.1 Balance Sheet – Total assets $25 million and over ......................................................................................... 97
PHARMACEUTICALS AND MEDICINES
(NAICS 3254)
12.0 Income Statement – All total asset sizes, and total assets under $25 million .................................................. 24
12.1 Balance Sheet – All total asset sizes, and total assets under $25 million ........................................................ 25
49.0 Income Statement – Total assets $25 million and over ................................................................................... 98
49.1 Balance Sheet – Total assets $25 million and over ......................................................................................... 99
ALL OTHER CHEMICALS
(NAICS 3253, 3255, 3256, and 3259)
13.0 Income Statement – All total asset sizes, and total assets under $25 million .................................................. 26
13.1 Balance Sheet – All total asset sizes, and total assets under $25 million ........................................................ 27
50.0 Income Statement – Total assets $25 million and over ................................................................................... 100
50.1 Balance Sheet – Total assets $25 million and over ....................................................................................... .. 101
PLASTICS AND RUBBER PRODUCTS
(NAICS 326)
14.0 Income Statement – All total asset sizes, and total assets under $25 million .................................................. 28
14.1 Balance Sheet – All total asset sizes, and total assets under $25 million ........................................................ 29
51.0 Income Statement – Total assets $25 million and over ................................................................................... 102
51.1 Balance Sheet – Total assets $25 million and over ......................................................................................... 103
U.S. Census Bureau, Quarterly Financial Report, 2014 Quarter 4 vi
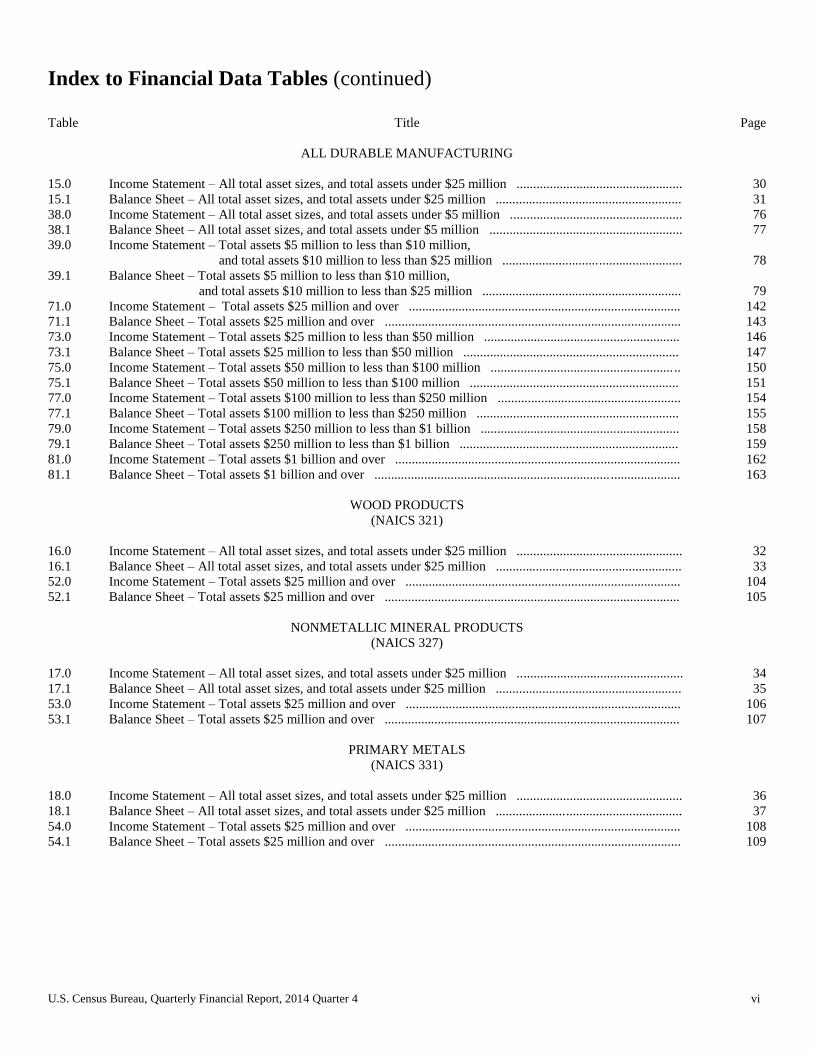
Index to Financial Data Tables (continued)
Table Title Page
ALL DURABLE MANUFACTURING
15.0 Income Statement – All total asset sizes, and total assets under $25 million .................................................. 30
15.1 Balance Sheet – All total asset sizes, and total assets under $25 million ........................................................ 31
38.0 Income Statement – All total asset sizes, and total assets under $5 million .................................................... 76
38.1 Balance Sheet – All total asset sizes, and total assets under $5 million .......................................................... 77
39.0 Income Statement – Total assets $5 million to less than $10 million,
and total assets $10 million to less than $25 million ......................................................
78
39.1 Balance Sheet – Total assets $5 million to less than $10 million,
and total assets $10 million to less than $25 million ............................................................
79
71.0 Income Statement – Total assets $25 million and over .................................................................................. 142
71.1 Balance Sheet – Total assets $25 million and over ......................................................................................... 143
73.0 Income Statement – Total assets $25 million to less than $50 million ........................................................... 146
73.1 Balance Sheet – Total assets $25 million to less than $50 million ................................................................. 147
75.0 Income Statement – Total assets $50 million to less than $100 million ....................................................... .. 150
75.1 Balance Sheet – Total assets $50 million to less than $100 million ............................................................... 151
77.0 Income Statement – Total assets $100 million to less than $250 million ....................................................... 154
77.1 Balance Sheet – Total assets $100 million to less than $250 million ............................................................. 155
79.0 Income Statement – Total assets $250 million to less than $1 billion ............................................................ 158
79.1 Balance Sheet – Total assets $250 million to less than $1 billion .................................................................. 159
81.0 Income Statement – Total assets $1 billion and over ...................................................................................... 162
81.1 Balance Sheet – Total assets $1 billion and over ....................................................................... ..................... 163
WOOD PRODUCTS
(NAICS 321)
16.0 Income Statement – All total asset sizes, and total assets under $25 million .................................................. 32
16.1 Balance Sheet – All total asset sizes, and total assets under $25 million ........................................................ 33
52.0 Income Statement – Total assets $25 million and over ................................................................................... 104
52.1 Balance Sheet – Total assets $25 million and over ......................................................................................... 105
NONMETALLIC MINERAL PRODUCTS
(NAICS 327)
17.0 Income Statement – All total asset sizes, and total assets under $25 million .................................................. 34
17.1 Balance Sheet – All total asset sizes, and total assets under $25 million ........................................................ 35
53.0 Income Statement – Total assets $25 million and over ................................................................................... 106
53.1 Balance Sheet – Total assets $25 million and over ......................................................................................... 107
PRIMARY METALS
(NAICS 331)
18.0 Income Statement – All total asset sizes, and total assets under $25 million .................................................. 36
18.1 Balance Sheet – All total asset sizes, and total assets under $25 million ........................................................ 37
54.0 Income Statement – Total assets $25 million and over ................................................................................... 108
54.1 Balance Sheet – Total assets $25 million and over ......................................................................................... 109
U.S. Census Bureau, Quarterly Financial Report, 2014 Quarter 4 vii
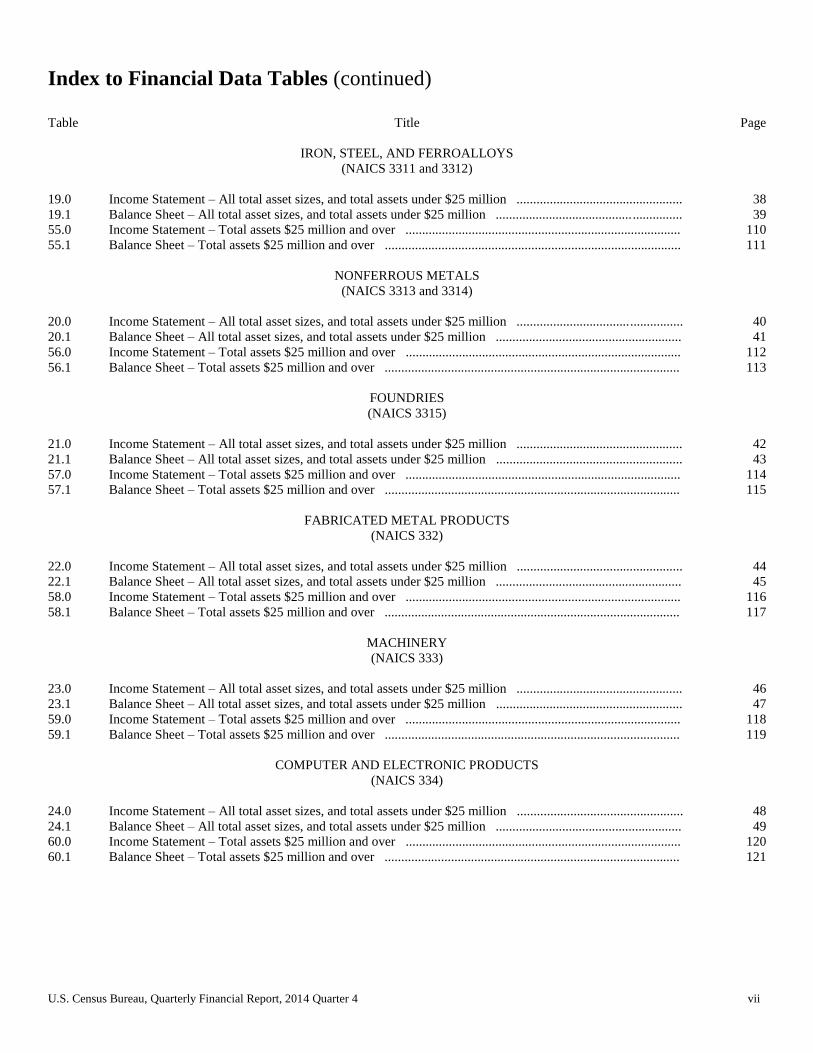
Index to Financial Data Tables (continued)
Table Title Page
IRON, STEEL, AND FERROALLOYS
(NAICS 3311 and 3312)
19.0 Income Statement – All total asset sizes, and total assets under $25 million .................................................. 38
19.1 Balance Sheet – All total asset sizes, and total assets under $25 million ........................................................ 39
55.0 Income Statement – Total assets $25 million and over ................................................................................... 110
55.1 Balance Sheet – Total assets $25 million and over ......................................................................................... 111
NONFERROUS METALS
(NAICS 3313 and 3314)
20.0 Income Statement – All total asset sizes, and total assets under $25 million .................................................. 40
20.1 Balance Sheet – All total asset sizes, and total assets under $25 million ........................................................ 41
56.0 Income Statement – Total assets $25 million and over ................................................................................... 112
56.1 Balance Sheet – Total assets $25 million and over ......................................................................................... 113
FOUNDRIES
(NAICS 3315)
21.0 Income Statement – All total asset sizes, and total assets under $25 million .................................................. 42
21.1 Balance Sheet – All total asset sizes, and total assets under $25 million ........................................................ 43
57.0 Income Statement – Total assets $25 million and over ................................................................................... 114
57.1 Balance Sheet – Total assets $25 million and over ......................................................................................... 115
FABRICATED METAL PRODUCTS
(NAICS 332)
22.0 Income Statement – All total asset sizes, and total assets under $25 million .................................................. 44
22.1 Balance Sheet – All total asset sizes, and total assets under $25 million ........................................................ 45
58.0 Income Statement – Total assets $25 million and over ................................................................................... 116
58.1 Balance Sheet – Total assets $25 million and over ......................................................................................... 117
MACHINERY
(NAICS 333)
23.0 Income Statement – All total asset sizes, and total assets under $25 million .................................................. 46
23.1 Balance Sheet – All total asset sizes, and total assets under $25 million ........................................................ 47
59.0 Income Statement – Total assets $25 million and over ................................................................................... 118
59.1 Balance Sheet – Total assets $25 million and over ......................................................................................... 119
COMPUTER AND ELECTRONIC PRODUCTS
(NAICS 334)
24.0 Income Statement – All total asset sizes, and total assets under $25 million .................................................. 48
24.1 Balance Sheet – All total asset sizes, and total assets under $25 million ........................................................ 49
60.0 Income Statement – Total assets $25 million and over ................................................................................... 120
60.1 Balance Sheet – Total assets $25 million and over ......................................................................................... 121
U.S. Census Bureau, Quarterly Financial Report, 2014 Quarter 4 viii
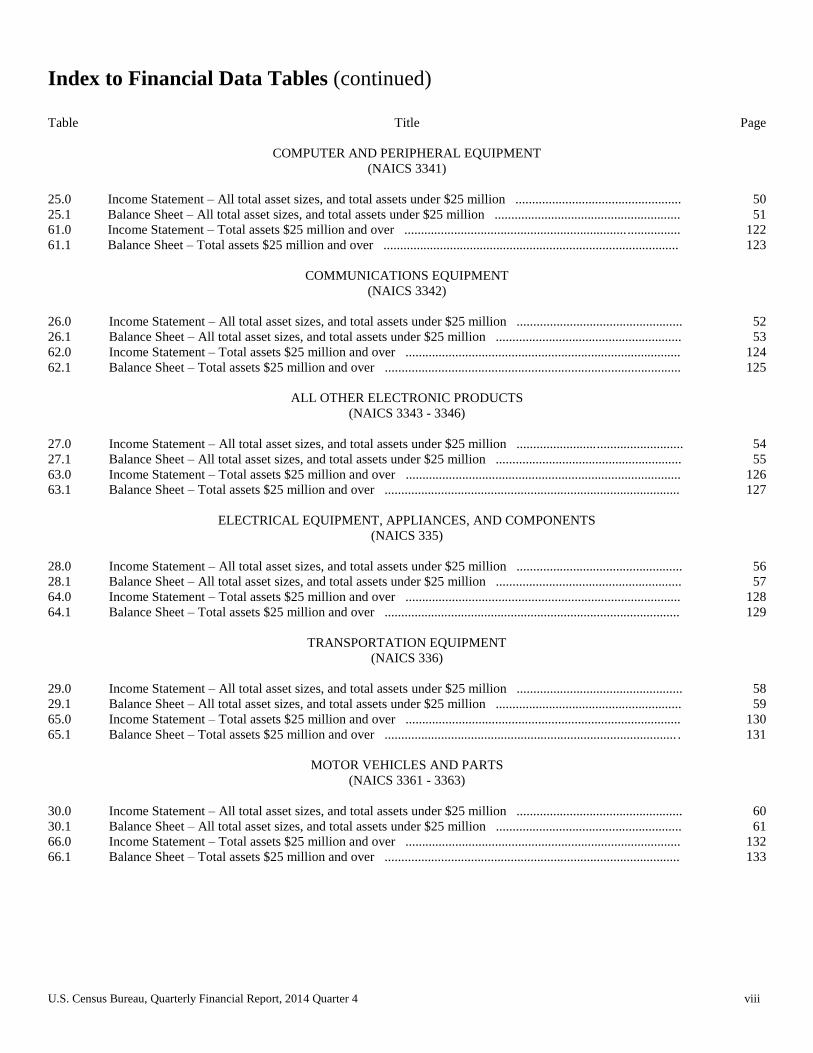
Index to Financial Data Tables (continued)
Table Title Page
COMPUTER AND PERIPHERAL EQUIPMENT
(NAICS 3341)
25.0 Income Statement – All total asset sizes, and total assets under $25 million .................................................. 50
25.1 Balance Sheet – All total asset sizes, and total assets under $25 million ........................................................ 51
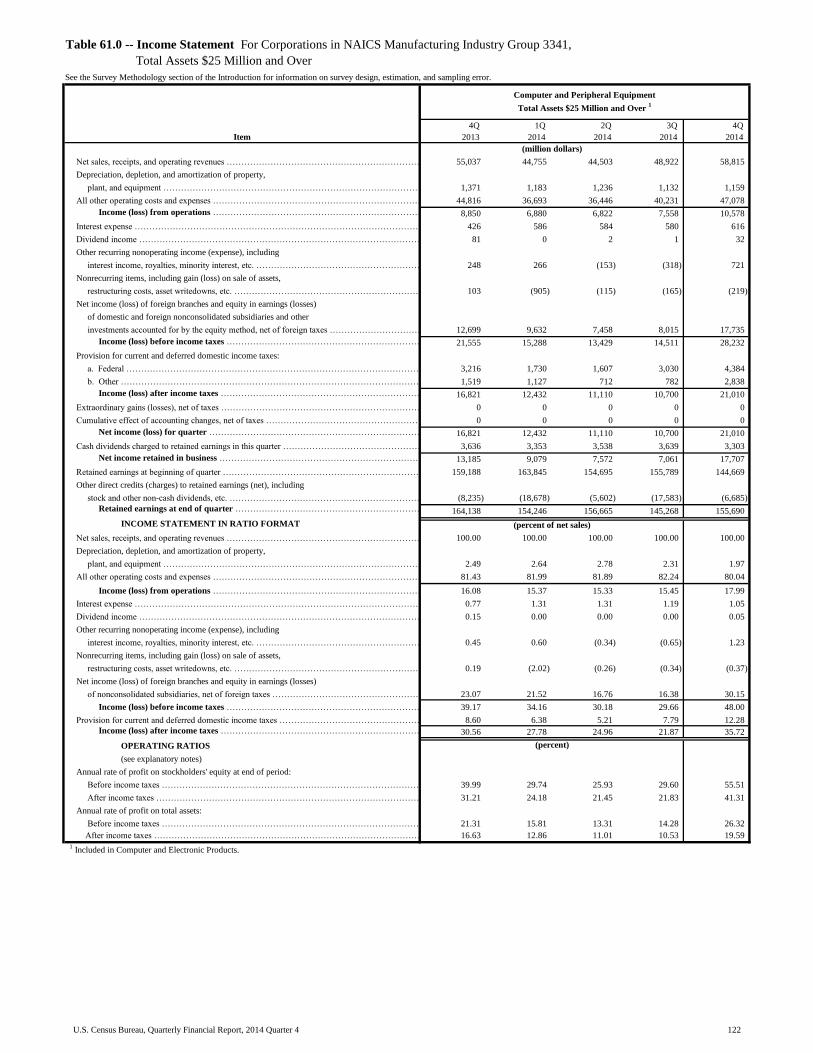
61.0 Income Statement – Total assets $25 million and over ................................................................................... 122
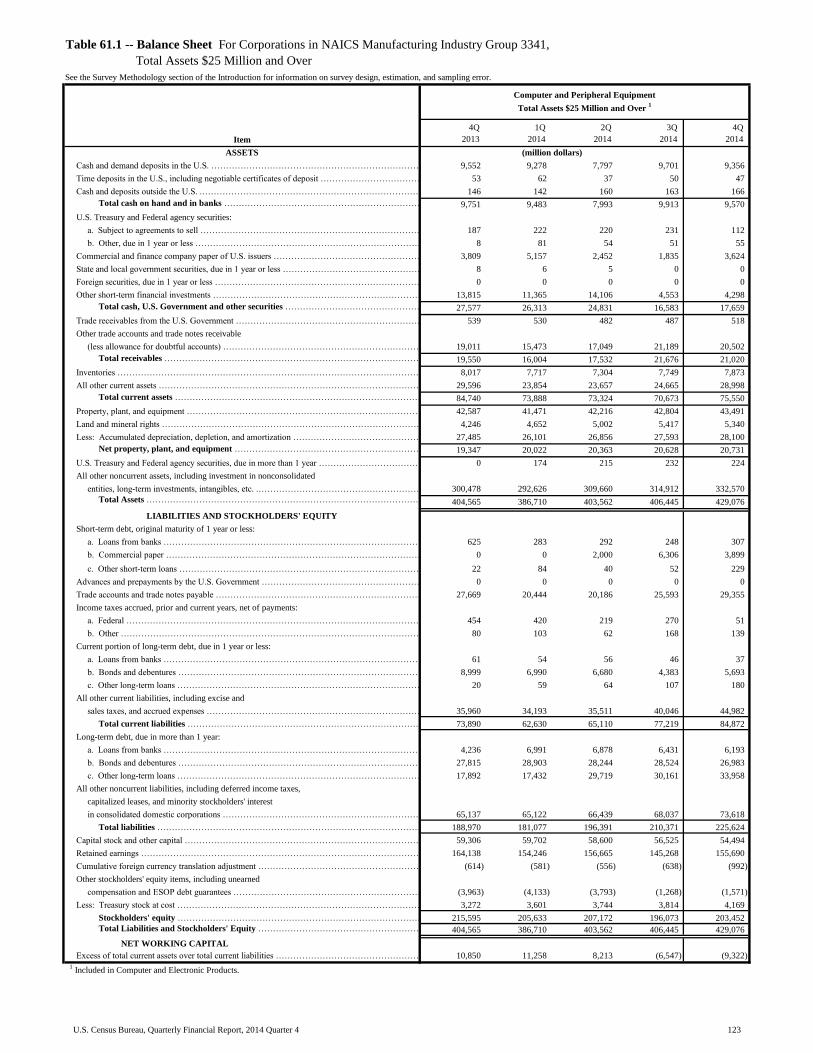
61.1 Balance Sheet – Total assets $25 million and over ......................................................................................... 123
COMMUNICATIONS EQUIPMENT
(NAICS 3342)
26.0 Income Statement – All total asset sizes, and total assets under $25 million .................................................. 52
26.1 Balance Sheet – All total asset sizes, and total assets under $25 million ........................................................ 53
62.0 Income Statement – Total assets $25 million and over ................................................................................... 124
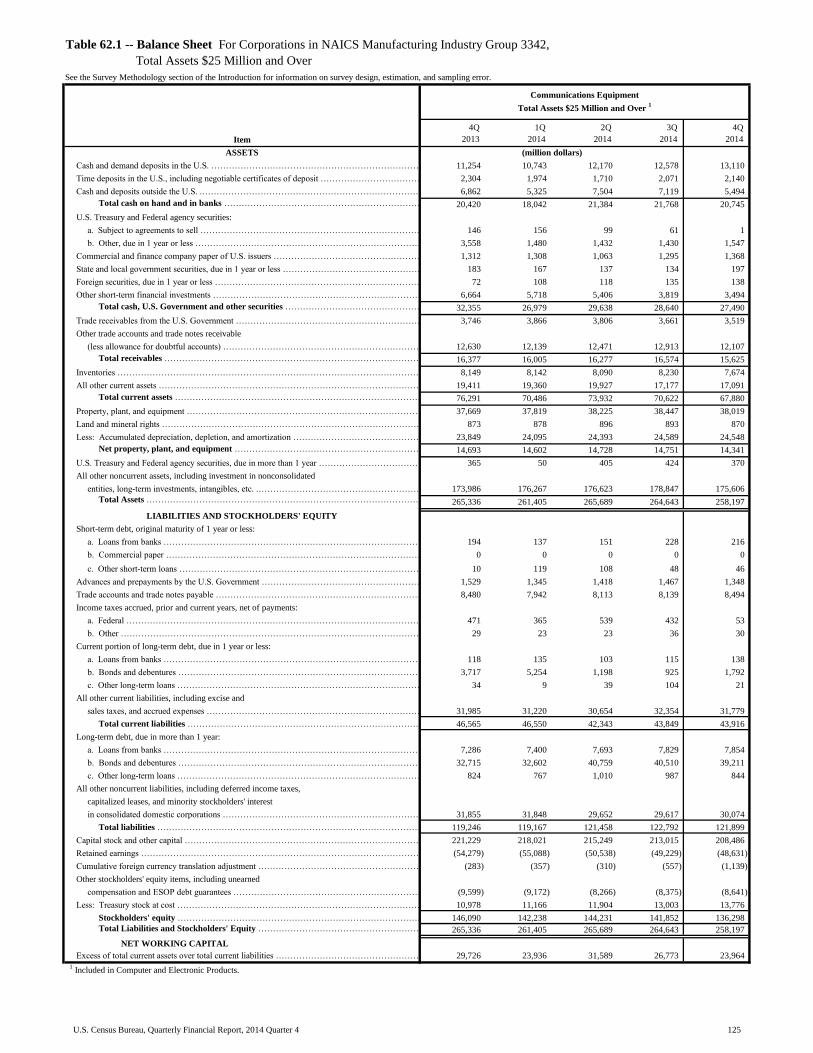
62.1 Balance Sheet – Total assets $25 million and over ......................................................................................... 125
ALL OTHER ELECTRONIC PRODUCTS
(NAICS 3343 - 3346)
27.0 Income Statement – All total asset sizes, and total assets under $25 million .................................................. 54
27.1 Balance Sheet – All total asset sizes, and total assets under $25 million ........................................................ 55
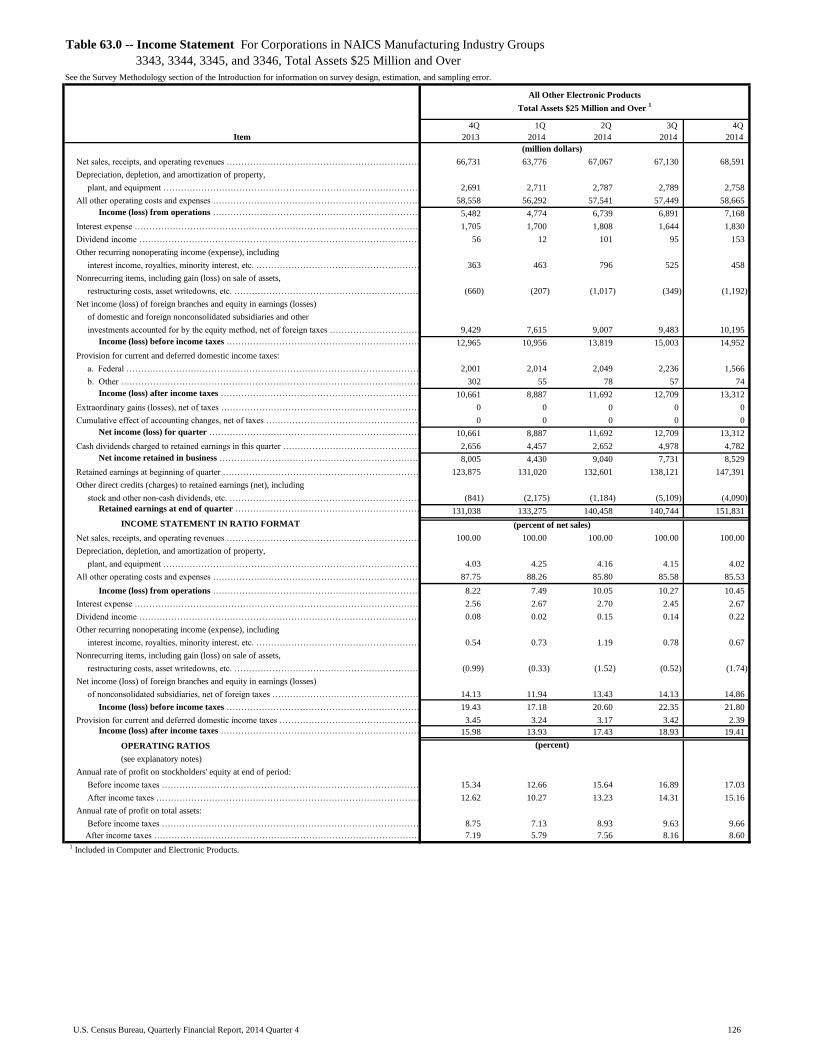
63.0 Income Statement – Total assets $25 million and over ................................................................................... 126
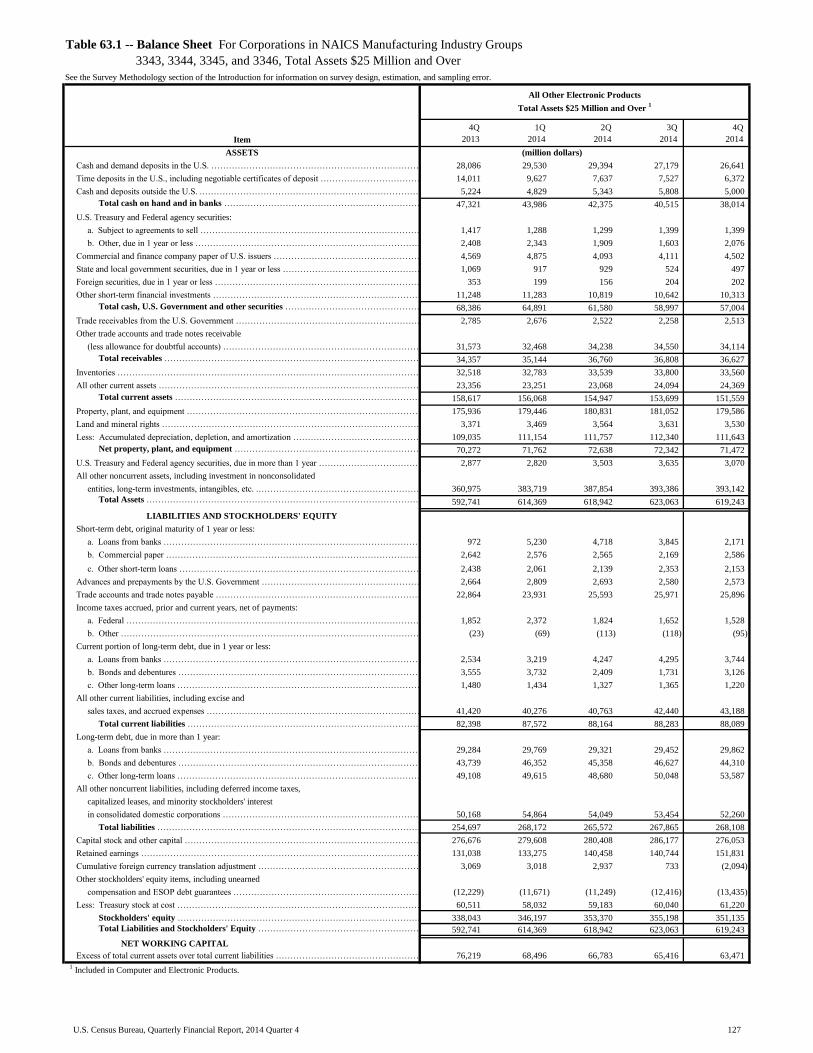
63.1 Balance Sheet – Total assets $25 million and over ......................................................................................... 127
ELECTRICAL EQUIPMENT, APPLIANCES, AND COMPONENTS
(NAICS 335)
28.0 Income Statement – All total asset sizes, and total assets under $25 million .................................................. 56
28.1 Balance Sheet – All total asset sizes, and total assets under $25 million ........................................................ 57
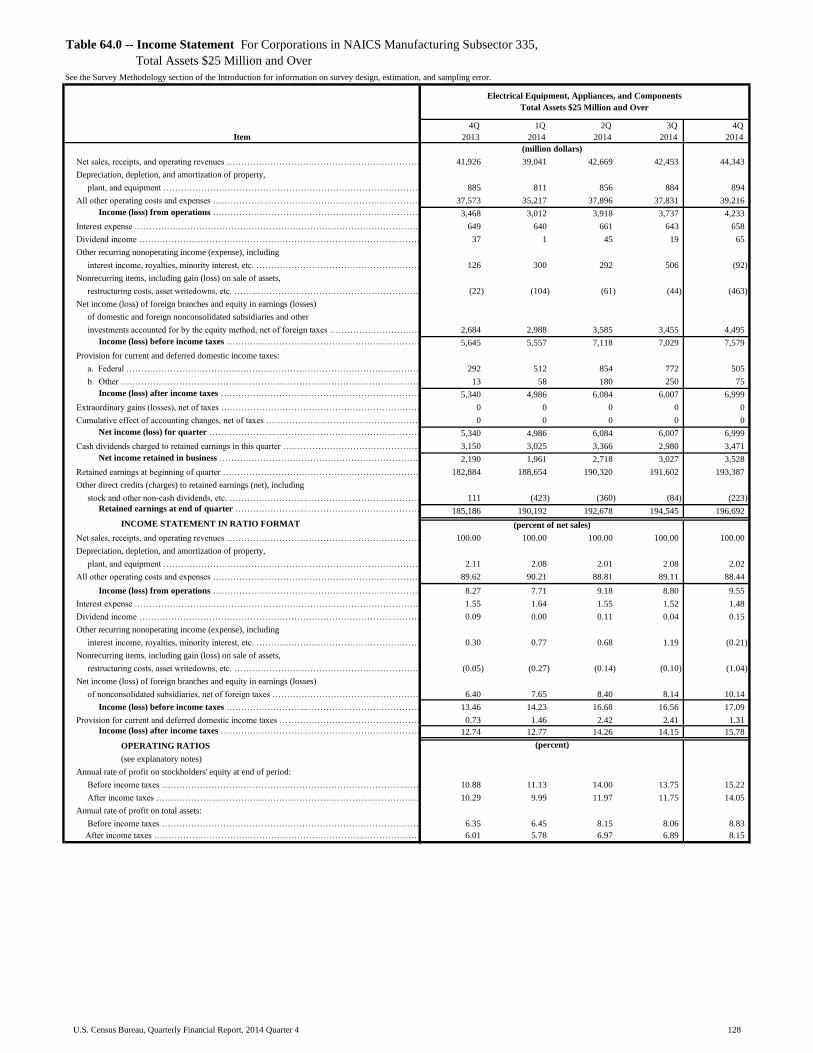
64.0 Income Statement – Total assets $25 million and over ................................................................................... 128
64.1 Balance Sheet – Total assets $25 million and over ......................................................................................... 129
TRANSPORTATION EQUIPMENT
(NAICS 336)
29.0 Income Statement – All total asset sizes, and total assets under $25 million .................................................. 58
29.1 Balance Sheet – All total asset sizes, and total assets under $25 million ........................................................ 59
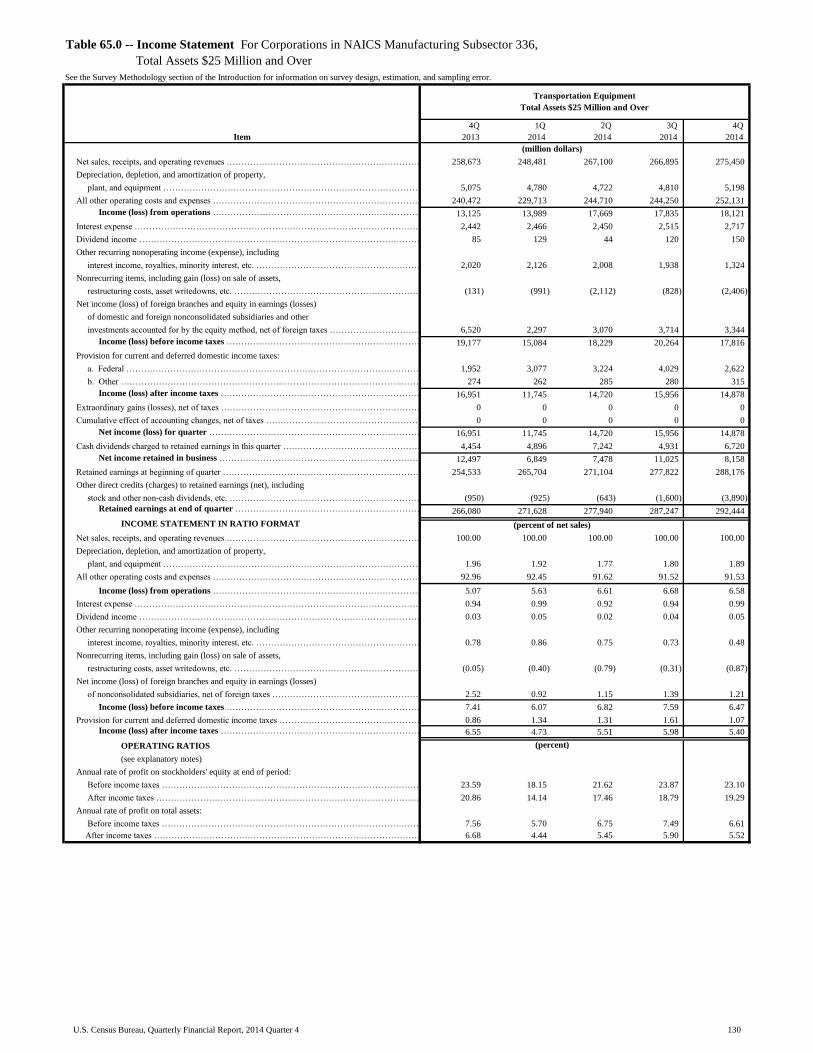
65.0 Income Statement – Total assets $25 million and over ................................................................................... 130
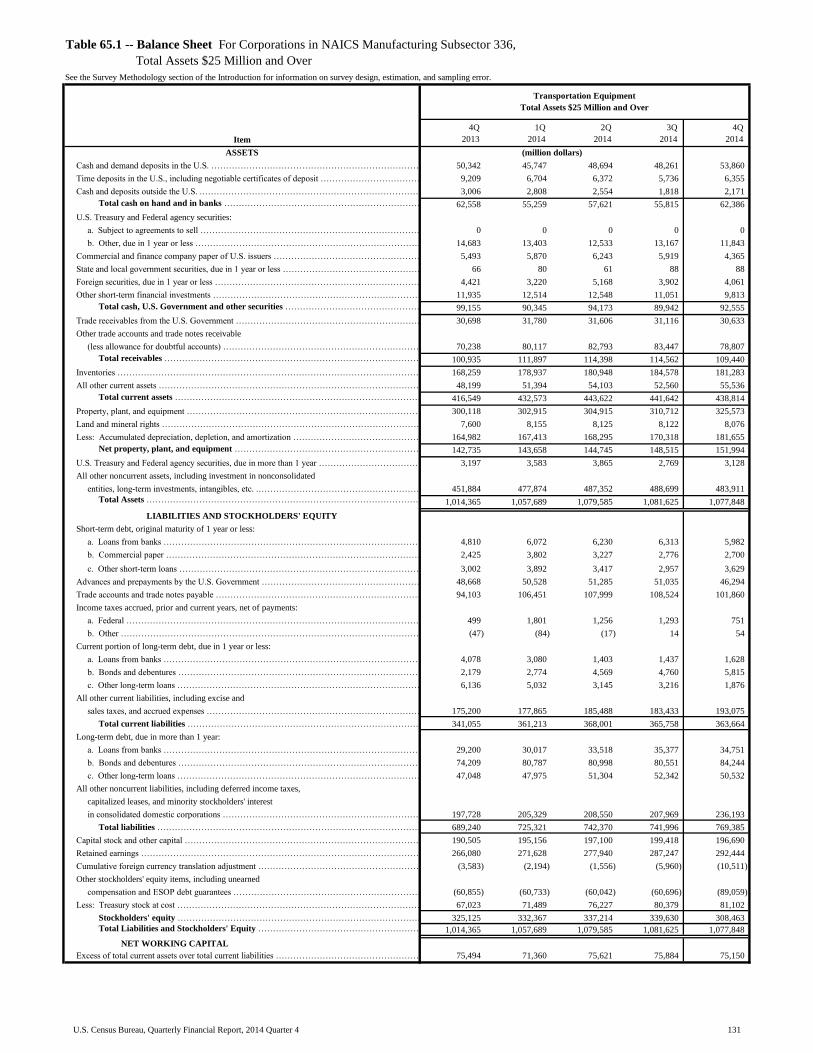
65.1 Balance Sheet – Total assets $25 million and over ........................................................................................ . 131
MOTOR VEHICLES AND PARTS
(NAICS 3361 - 3363)
30.0 Income Statement – All total asset sizes, and total assets under $25 million .................................................. 60
30.1 Balance Sheet – All total asset sizes, and total assets under $25 million ........................................................ 61
66.0 Income Statement – Total assets $25 million and over ................................................................................... 132
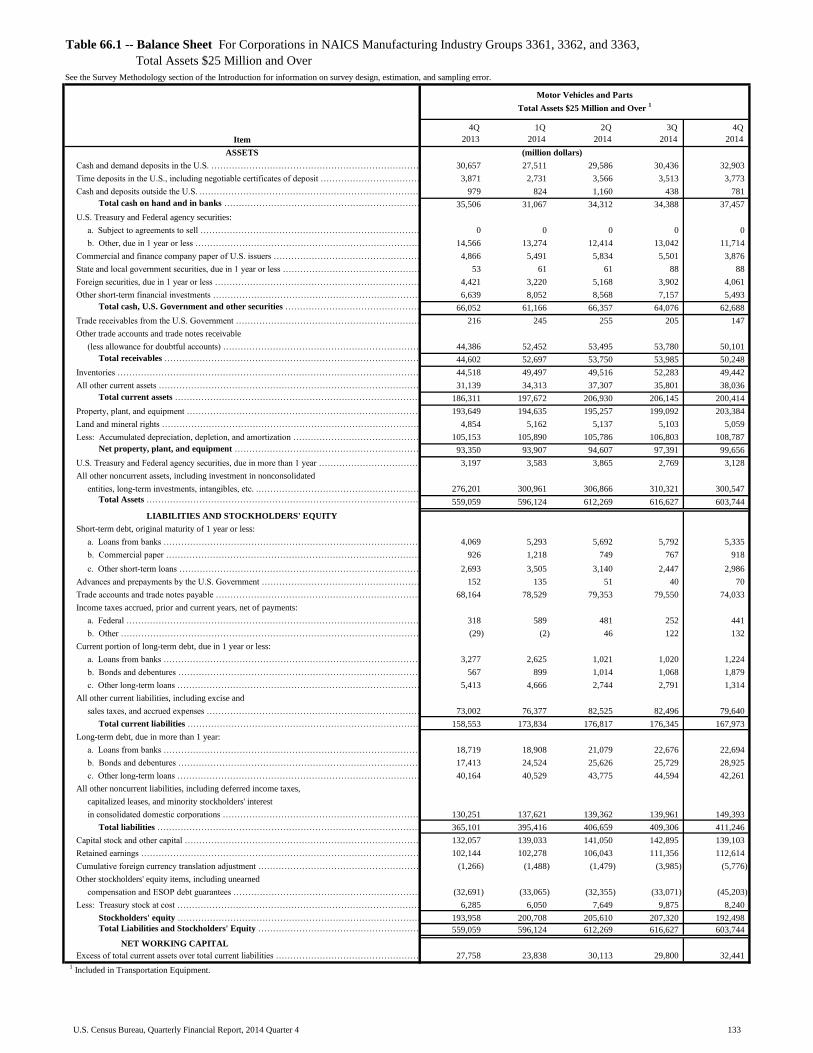
66.1 Balance Sheet – Total assets $25 million and over ......................................................................................... 133
U.S. Census Bureau, Quarterly Financial Report, 2014 Quarter 4 ix
Index to Financial Data Tables (continued)
Table Title Page
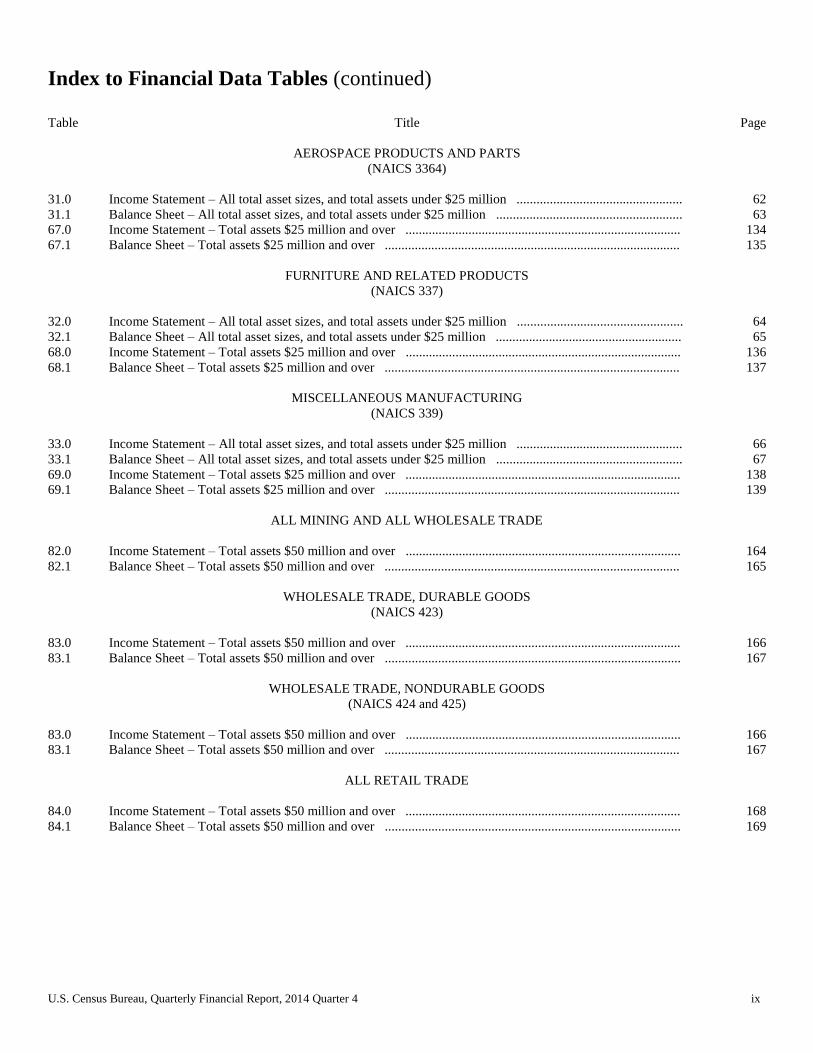
AEROSPACE PRODUCTS AND PARTS
(NAICS 3364)
31.0 Income Statement – All total asset sizes, and total assets under $25 million .................................................. 62
31.1 Balance Sheet – All total asset sizes, and total assets under $25 million ........................................................ 63
67.0 Income Statement – Total assets $25 million and over ................................................................................... 134
67.1 Balance Sheet – Total assets $25 million and over ......................................................................................... 135
FURNITURE AND RELATED PRODUCTS
(NAICS 337)
32.0 Income Statement – All total asset sizes, and total assets under $25 million .................................................. 64
32.1 Balance Sheet – All total asset sizes, and total assets under $25 million ........................................................ 65
68.0 Income Statement – Total assets $25 million and over ................................................................................... 136
68.1 Balance Sheet – Total assets $25 million and over ......................................................................................... 137
MISCELLANEOUS MANUFACTURING
(NAICS 339)
33.0 Income Statement – All total asset sizes, and total assets under $25 million .................................................. 66
33.1 Balance Sheet – All total asset sizes, and total assets under $25 million ........................................................ 67
69.0 Income Statement – Total assets $25 million and over ................................................................................... 138
69.1 Balance Sheet – Total assets $25 million and over ......................................................................................... 139
ALL MINING AND ALL WHOLESALE TRADE
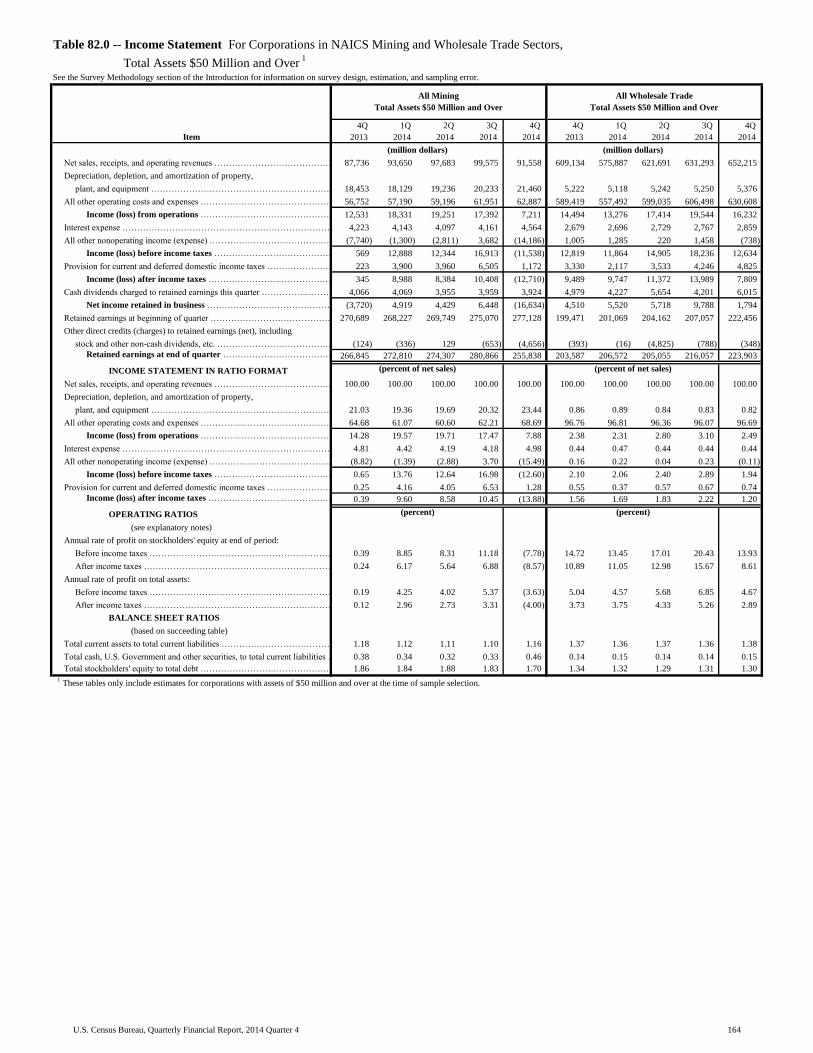
82.0 Income Statement – Total assets $50 million and over ................................................................................... 164
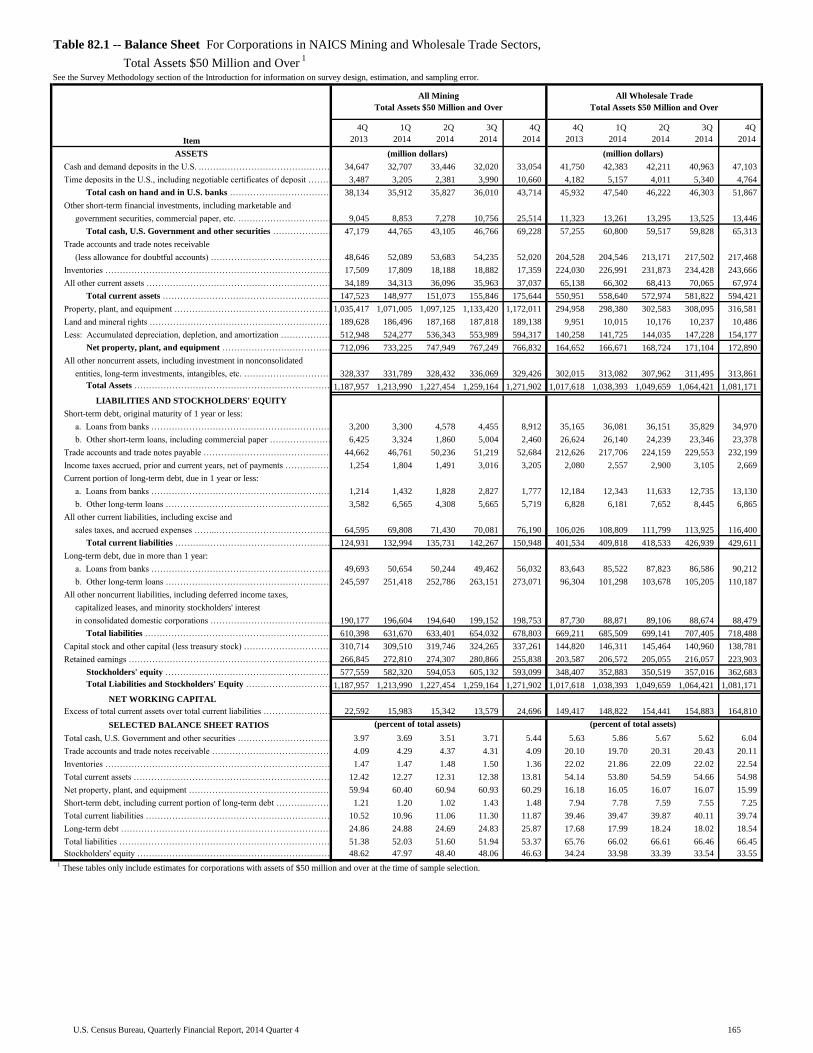
82.1 Balance Sheet – Total assets $50 million and over ......................................................................................... 165
WHOLESALE TRADE, DURABLE GOODS
(NAICS 423)
83.0 Income Statement – Total assets $50 million and over ................................................................................... 166
83.1 Balance Sheet – Total assets $50 million and over ......................................................................................... 167
WHOLESALE TRADE, NONDURABLE GOODS
(NAICS 424 and 425)
83.0 Income Statement – Total assets $50 million and over ................................................................................... 166
83.1 Balance Sheet – Total assets $50 million and over ......................................................................................... 167
ALL RETAIL TRADE
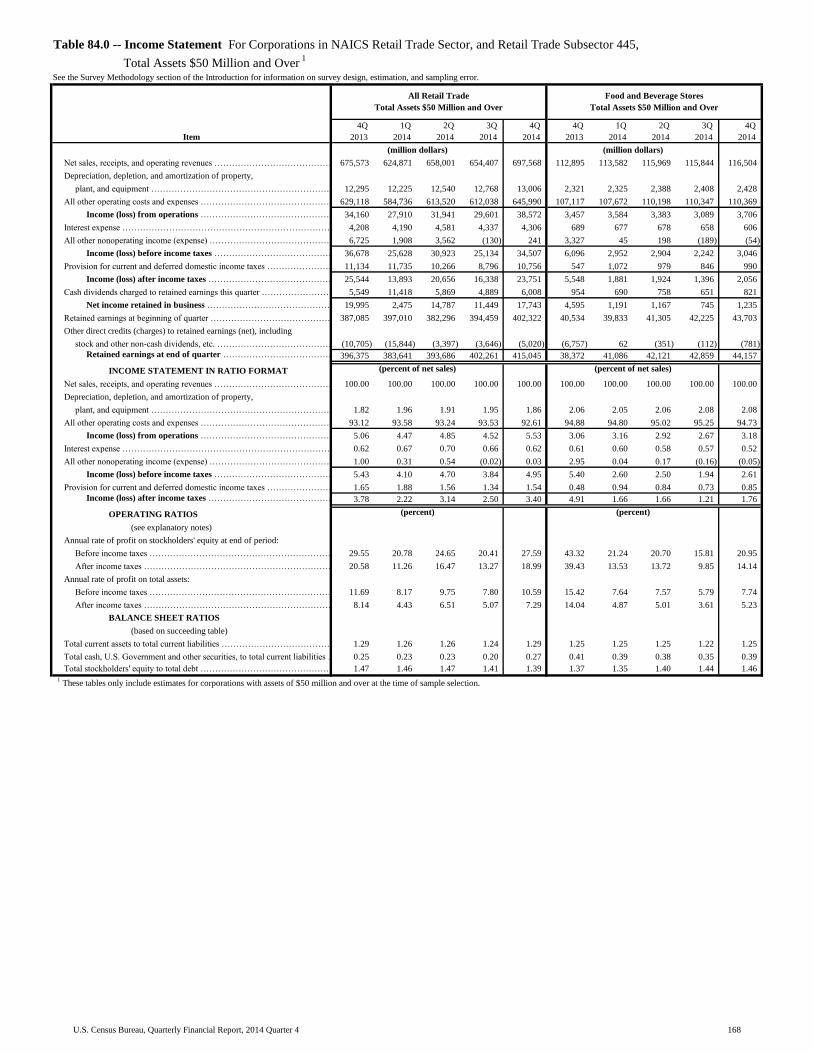
84.0 Income Statement – Total assets $50 million and over ................................................................................... 168
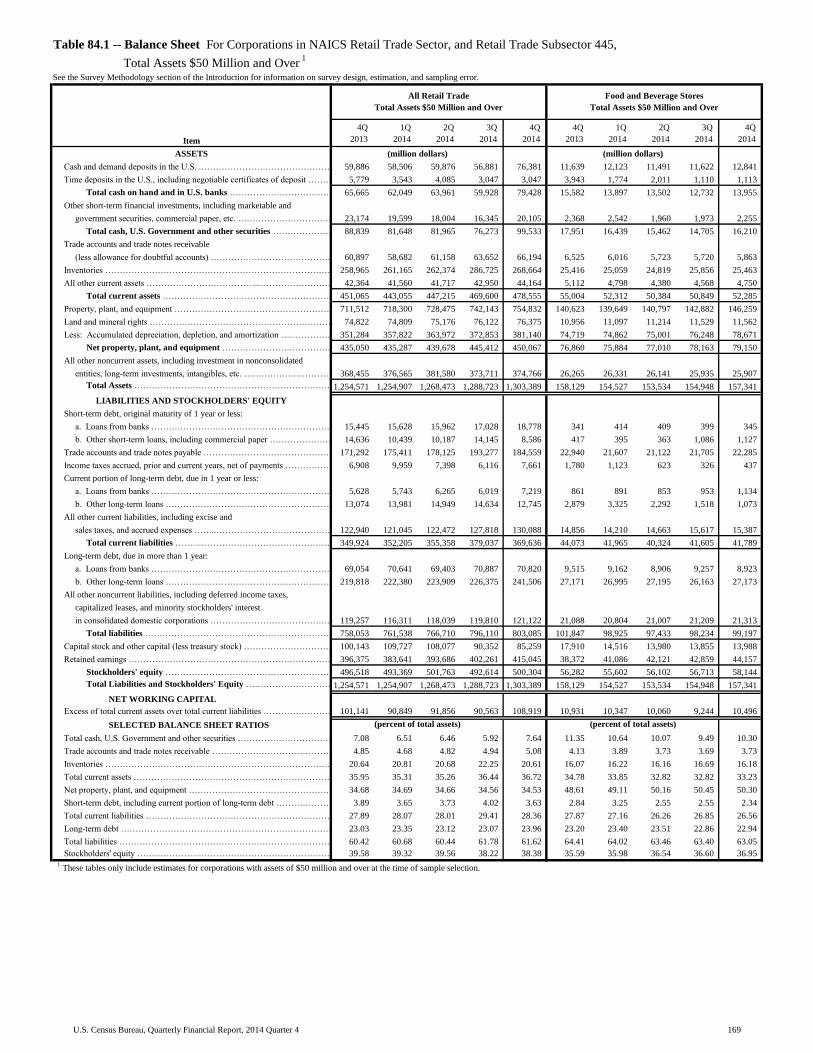
84.1 Balance Sheet – Total assets $50 million and over ......................................................................................... 169
U.S. Census Bureau, Quarterly Financial Report, 2014 Quarter 4 x
Index to Financial Data Tables (continued)
Table Title Page
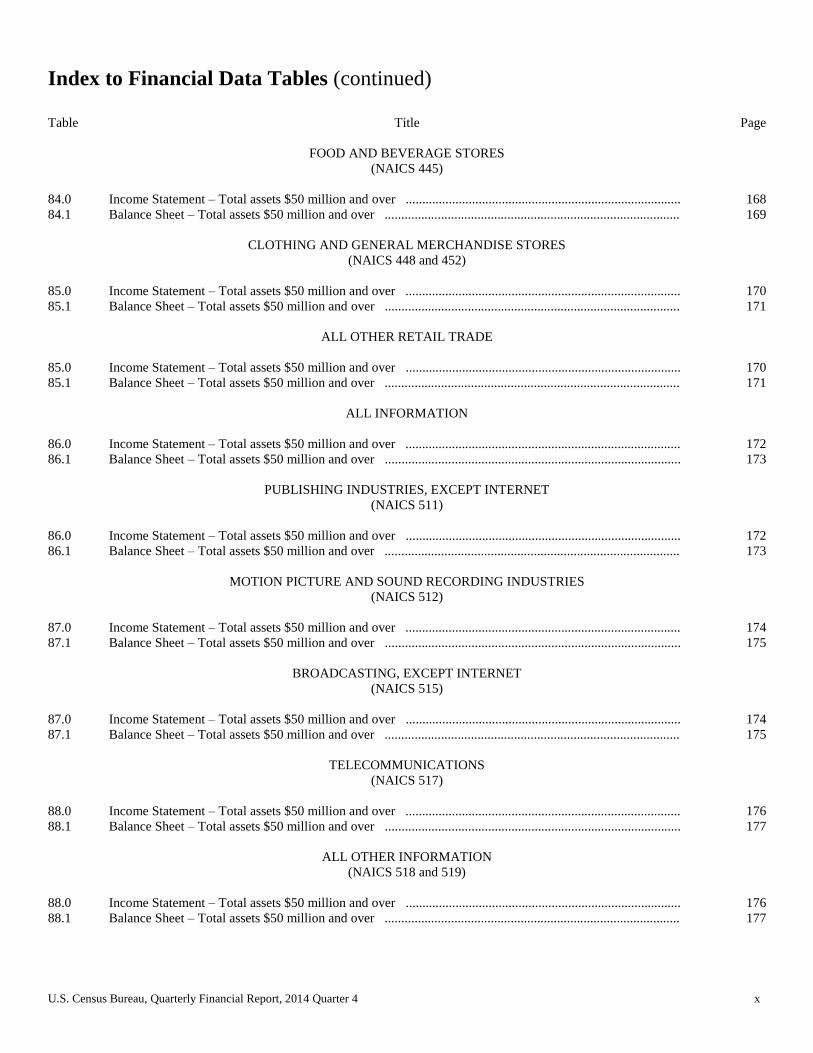
FOOD AND BEVERAGE STORES
(NAICS 445)
84.0 Income Statement – Total assets $50 million and over ................................................................................... 168
84.1 Balance Sheet – Total assets $50 million and over ......................................................................................... 169
CLOTHING AND GENERAL MERCHANDISE STORES
(NAICS 448 and 452)
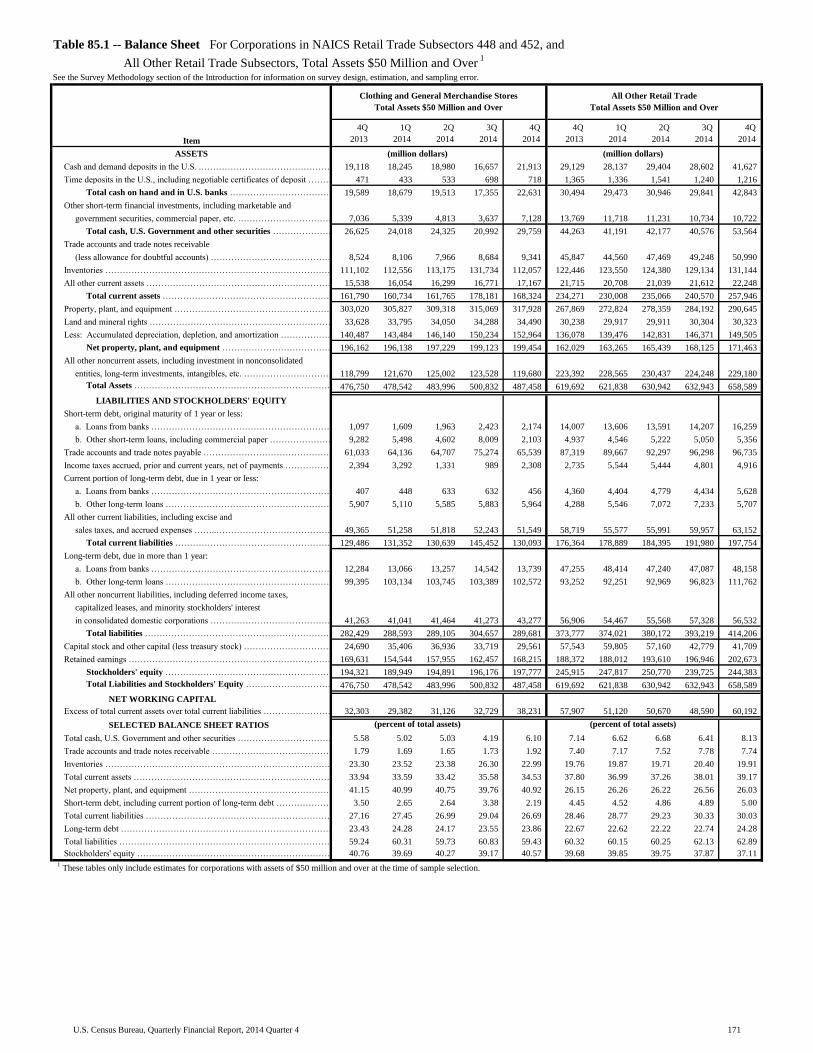
85.0 Income Statement – Total assets $50 million and over ................................................................................... 170
85.1 Balance Sheet – Total assets $50 million and over ......................................................................................... 171
ALL OTHER RETAIL TRADE
85.0 Income Statement – Total assets $50 million and over ................................................................................... 170
85.1 Balance Sheet – Total assets $50 million and over ......................................................................................... 171
ALL INFORMATION
86.0 Income Statement – Total assets $50 million and over ................................................................................... 172
86.1 Balance Sheet – Total assets $50 million and over ......................................................................................... 173
PUBLISHING INDUSTRIES, EXCEPT INTERNET
(NAICS 511)
86.0 Income Statement – Total assets $50 million and over ................................................................................... 172
86.1 Balance Sheet – Total assets $50 million and over ......................................................................................... 173
MOTION PICTURE AND SOUND RECORDING INDUSTRIES
(NAICS 512)
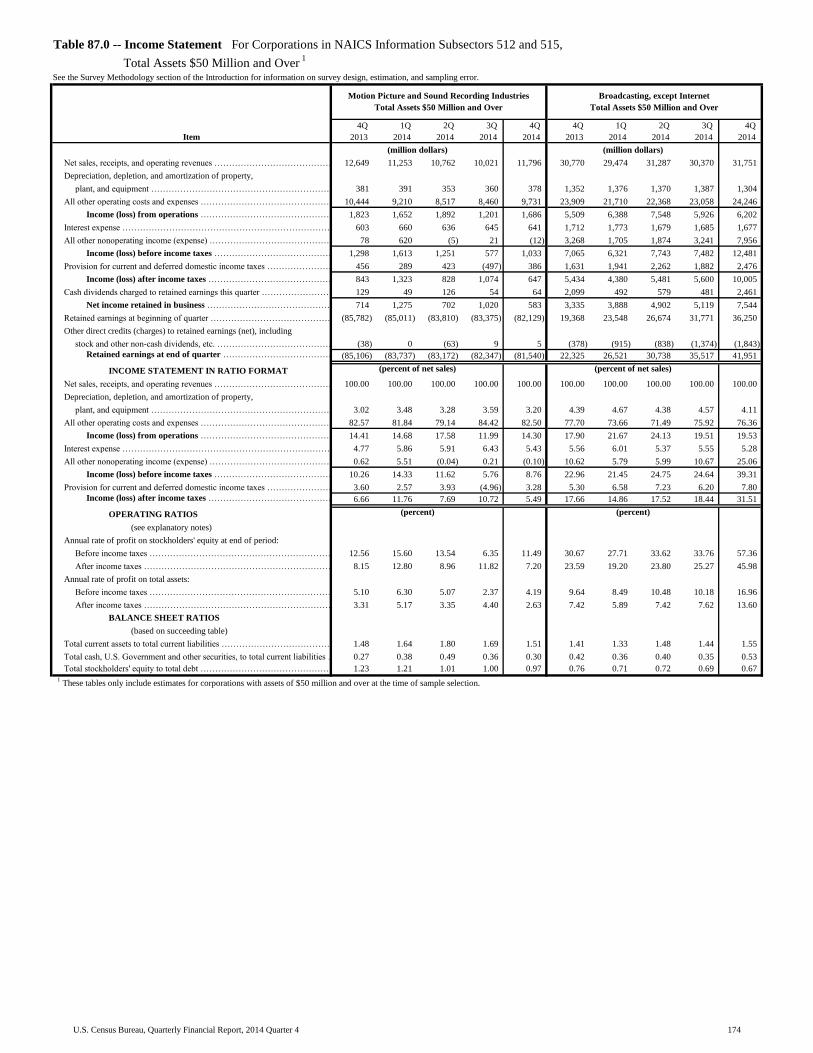
87.0 Income Statement – Total assets $50 million and over ................................................................................... 174
87.1 Balance Sheet – Total assets $50 million and over ......................................................................................... 175
BROADCASTING, EXCEPT INTERNET
(NAICS 515)
87.0 Income Statement – Total assets $50 million and over ................................................................................... 174
87.1 Balance Sheet – Total assets $50 million and over ......................................................................................... 175
TELECOMMUNICATIONS
(NAICS 517)
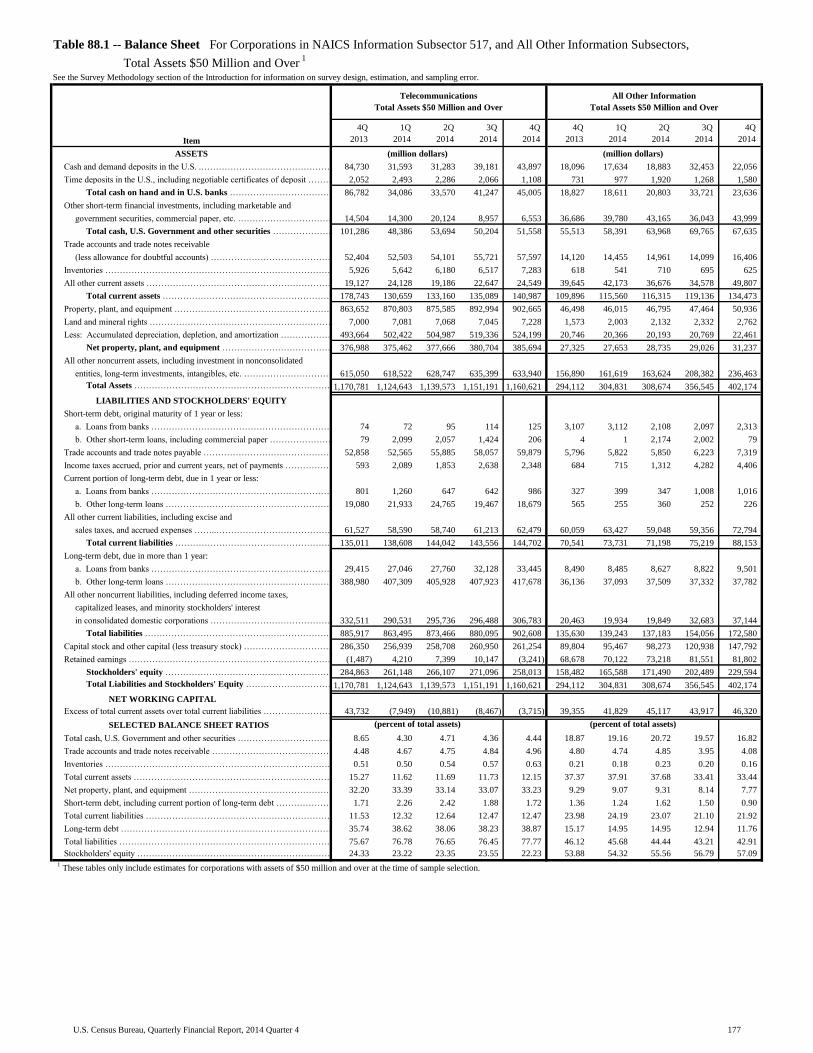
88.0 Income Statement – Total assets $50 million and over ................................................................................... 176
88.1 Balance Sheet – Total assets $50 million and over ......................................................................................... 177
ALL OTHER INFORMATION
(NAICS 518 and 519)
88.0 Income Statement – Total assets $50 million and over ................................................................................... 176
88.1 Balance Sheet – Total assets $50 million and over ......................................................................................... 177
U.S. Census Bureau, Quarterly Financial Report, 2014 Quarter 4 xi
Index to Financial Data Tables (continued)
Table Title Page
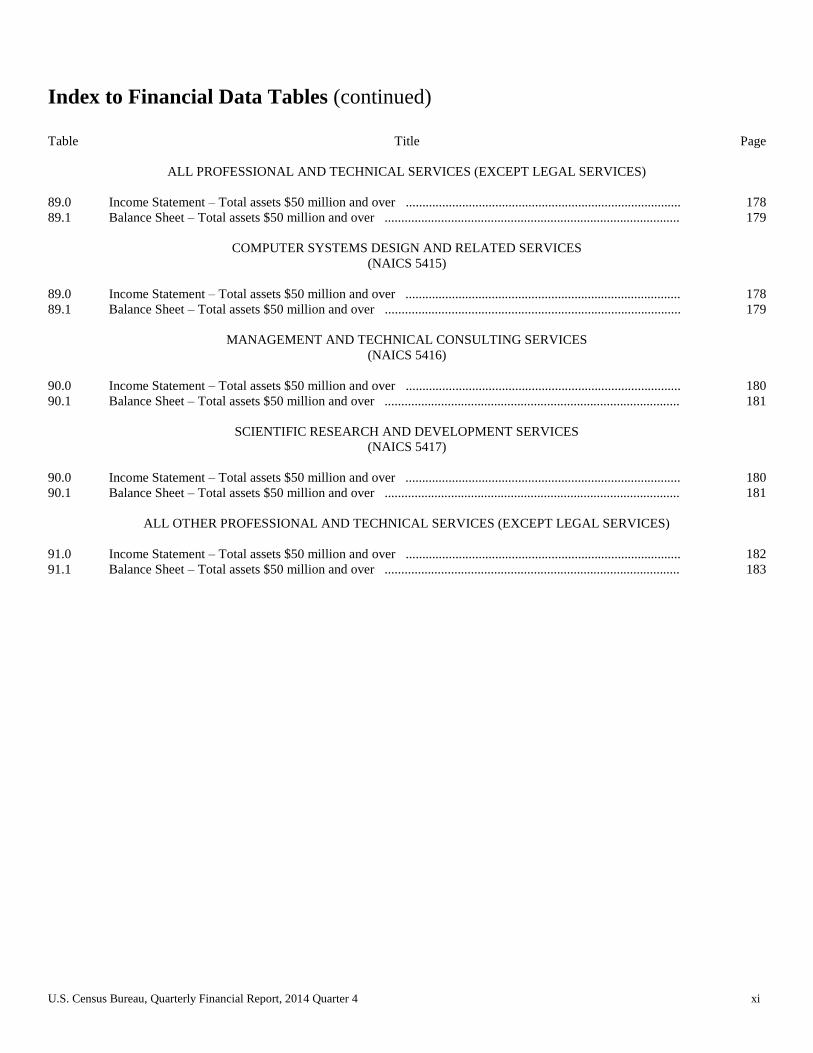
ALL PROFESSIONAL AND TECHNICAL SERVICES (EXCEPT LEGAL SERVICES)
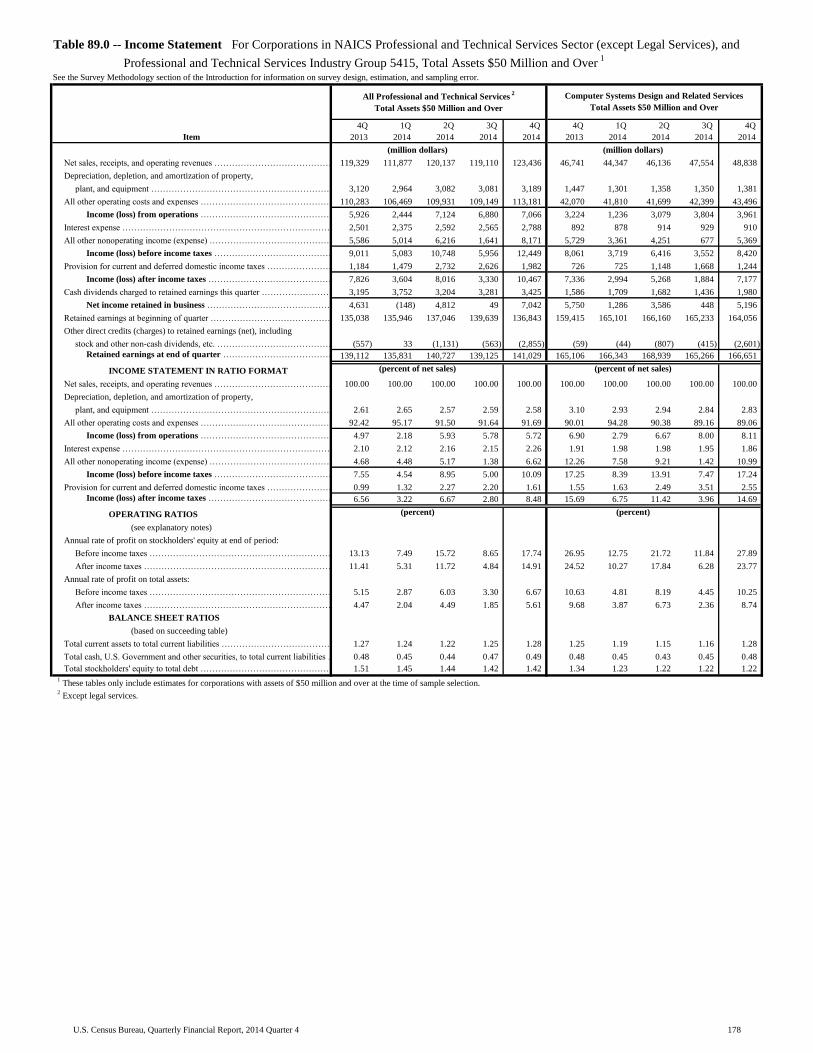
89.0 Income Statement – Total assets $50 million and over ................................................................................... 178
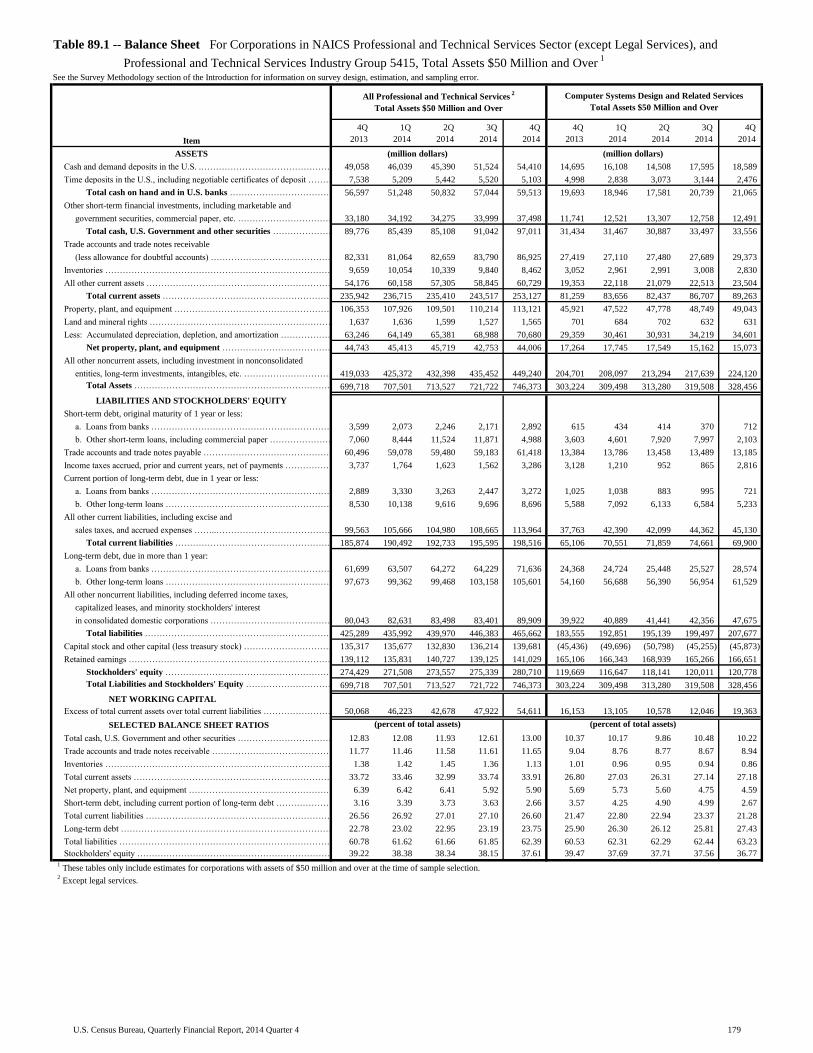
89.1 Balance Sheet – Total assets $50 million and over ......................................................................................... 179
COMPUTER SYSTEMS DESIGN AND RELATED SERVICES
(NAICS 5415)
89.0 Income Statement – Total assets $50 million and over ................................................................................... 178
89.1 Balance Sheet – Total assets $50 million and over ......................................................................................... 179
MANAGEMENT AND TECHNICAL CONSULTING SERVICES
(NAICS 5416)
90.0 Income Statement – Total assets $50 million and over ................................................................................... 180
90.1 Balance Sheet – Total assets $50 million and over ......................................................................................... 181
SCIENTIFIC RESEARCH AND DEVELOPMENT SERVICES
(NAICS 5417)
90.0 Income Statement – Total assets $50 million and over ................................................................................... 180
90.1 Balance Sheet – Total assets $50 million and over ......................................................................................... 181
ALL OTHER PROFESSIONAL AND TECHNICAL SERVICES (EXCEPT LEGAL SERVICES)
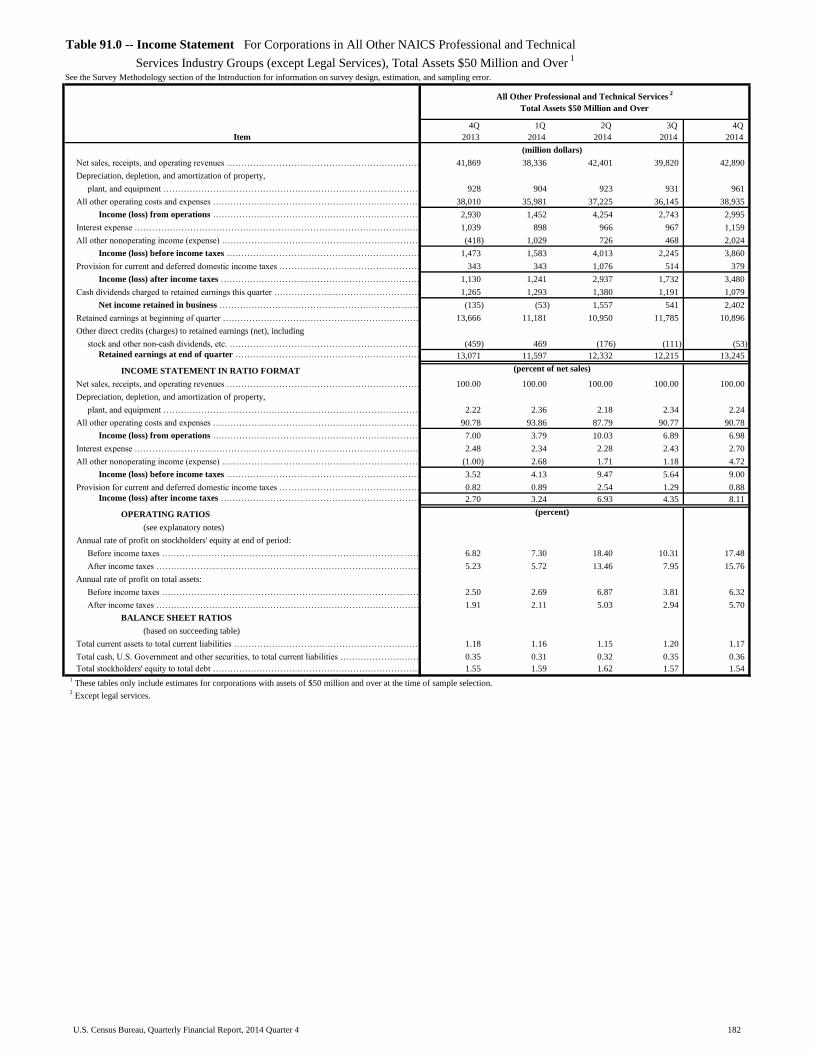
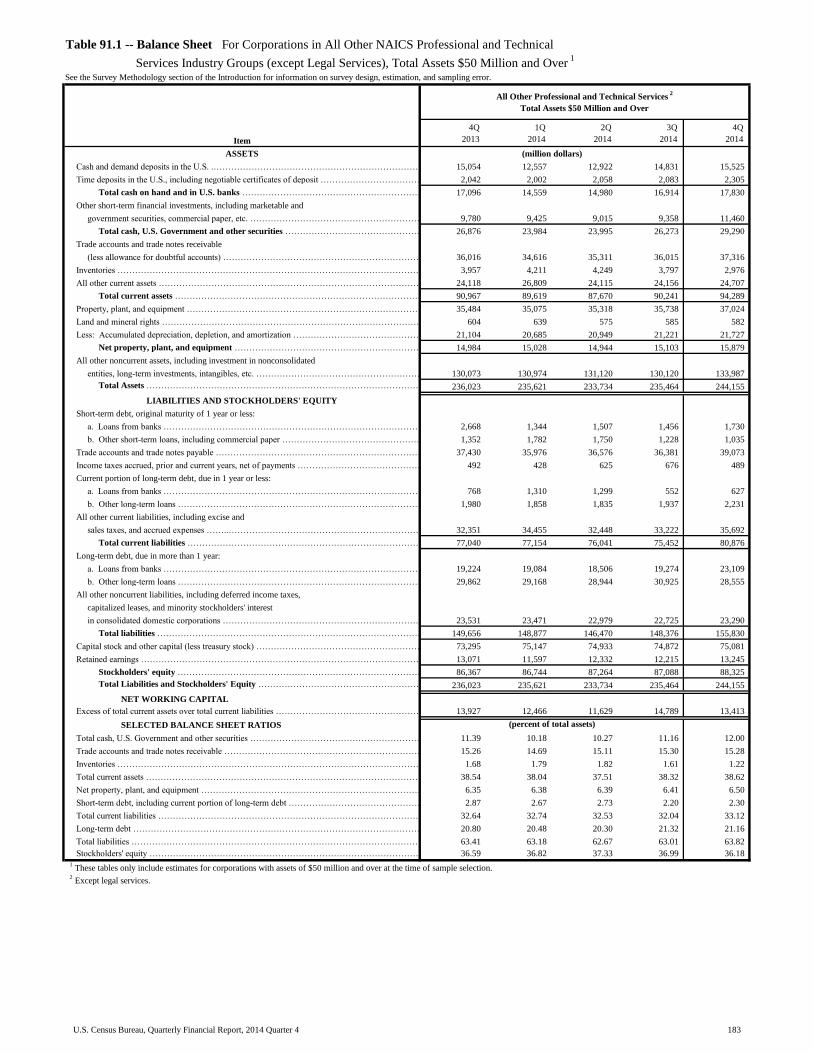
91.0 Income Statement – Total assets $50 million and over ................................................................................... 182
91.1 Balance Sheet – Total assets $50 million and over ......................................................................................... 183
U.S. Census Bureau, Quarterly Financial Report, 2014 Quarter 4 xii
Introduction
SURVEY DESCRIPTION
The Quarterly Financial Report (QFR) Program publishes up-to-date aggregate statistics on the financial results and
position of U.S. corporations. Based upon a sample survey, the QFR presents estimated statements of income and
retained earnings, balance sheets, and related financial and operating ratios for manufacturing corporations with
assets of $250,000 and over, and corporations in mining, wholesale trade, retail trade, information, and professional
and technical services (except legal services) industries, with assets of $50 million and over. The statistical data are
classified by industry and by asset size.
The Federal Trade Commission (FTC) was responsible for the program from its inception in 1947 until December
1982. That responsibility was shared with the Securities and Exchange Commission until 1971. Authority to
conduct the survey was transferred to the U.S. Census Bureau in 1982.
The Commerce Department regularly employs QFR data as an important component in determining corporate
profits for the Gross Domestic Product (GDP) and National Income estimates; the Federal Reserve Board uses QFR
data to assess industrial debt structure, liquidity, and profitability; the Treasury Department estimates corporate tax
liability through use of QFR data; the Council of Economic Advisers and Congressional Committees utilize key
indicators derived from QFR data as they design economic policies and draft legislation; the FTC utilizes the series
as a basic reference point in analyzing the financial performance of American industries; and banking institutions
and financial analysts draw upon the series in making investment evaluations.
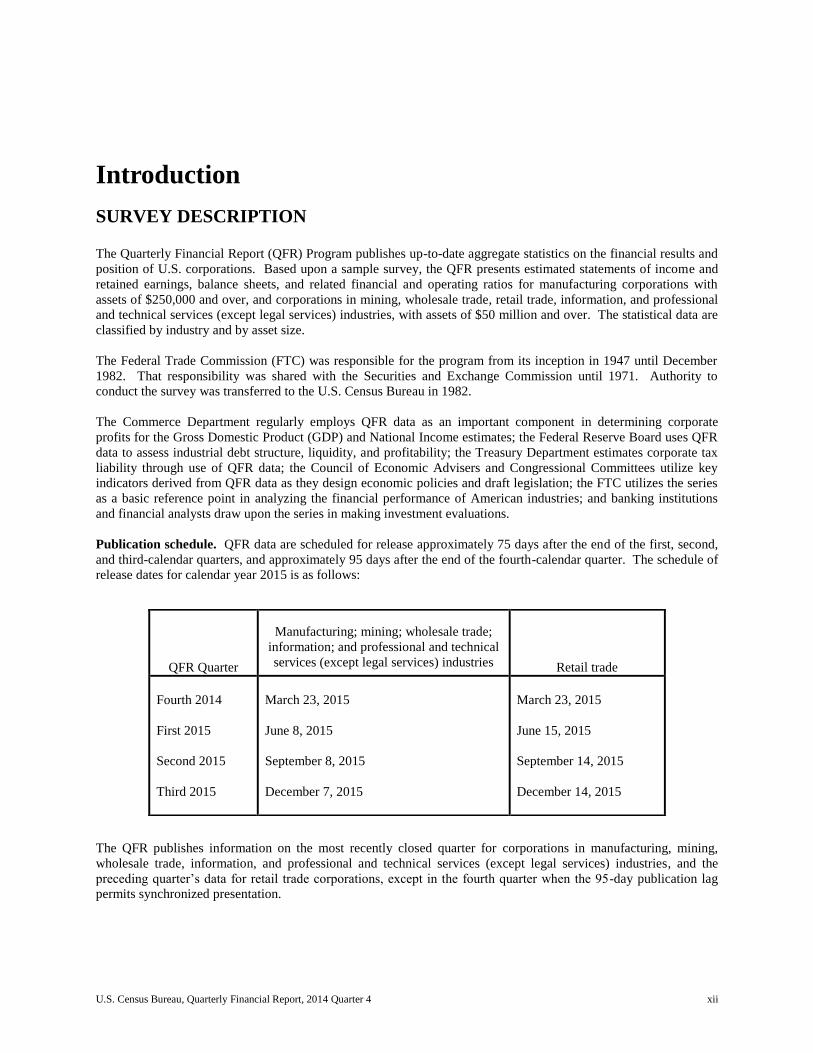
Publication schedule. QFR data are scheduled for release approximately 75 days after the end of the first, second,
and third-calendar quarters, and approximately 95 days after the end of the fourth-calendar quarter. The schedule of
release dates for calendar year 2015 is as follows:
The QFR publishes information on the most recently closed quarter for corporations in manufacturing, mining,
wholesale trade, information, and professional and technical services (except legal services) industries, and the
preceding quarter’s data for retail trade corporations, except in the fourth quarter when the 95-day publication lag
permits synchronized presentation.
QFR Quarter
Manufacturing; mining; wholesale trade;
information; and professional and technical
services (except legal services) industries Retail trade
Fourth 2014
First 2015
Second 2015
Third 2015
March 23, 2015
June 8, 2015
September 8, 2015
December 7, 2015
March 23, 2015
June 15, 2015
September 14, 2015
December 14, 2015
U.S. Census Bureau, Quarterly Financial Report, 2014 Quarter 4 xiii
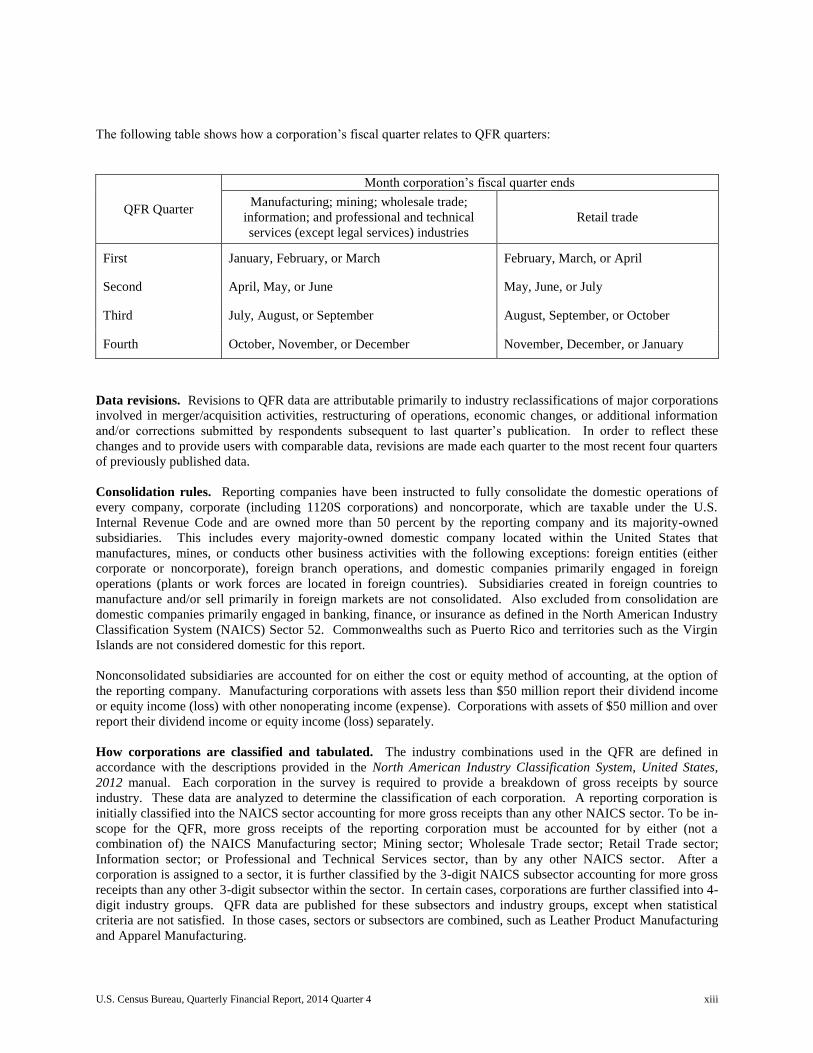
The following table shows how a corporation’s fiscal quarter relates to QFR quarters:
QFR Quarter
Month corporation’s fiscal quarter ends
Manufacturing; mining; wholesale trade;
information; and professional and technical
services (except legal services) industries
Retail trade
First January, February, or March February, March, or April
Second April, May, or June May, June, or July
Third July, August, or September August, September, or October
Fourth October, November, or December November, December, or January
Data revisions. Revisions to QFR data are attributable primarily to industry reclassifications of major corporations
involved in merger/acquisition activities, restructuring of operations, economic changes, or additional information
and/or corrections submitted by respondents subsequent to last quarter’s publication. In order to reflect these
changes and to provide users with comparable data, revisions are made each quarter to the most recent four quarters
of previously published data.
Consolidation rules. Reporting companies have been instructed to fully consolidate the domestic operations of
every company, corporate (including 1120S corporations) and noncorporate, which are taxable under the U.S.
Internal Revenue Code and are owned more than 50 percent by the reporting company and its majority-owned
subsidiaries. This includes every majority-owned domestic company located within the United States that
manufactures, mines, or conducts other business activities with the following exceptions: foreign entities (either
corporate or noncorporate), foreign branch operations, and domestic companies primarily engaged in foreign
operations (plants or work forces are located in foreign countries). Subsidiaries created in foreign countries to
manufacture and/or sell primarily in foreign markets are not consolidated. Also excluded from consolidation are
domestic companies primarily engaged in banking, finance, or insurance as defined in the North American Industry
Classification System (NAICS) Sector 52. Commonwealths such as Puerto Rico and territories such as the Virgin
Islands are not considered domestic for this report.
Nonconsolidated subsidiaries are accounted for on either the cost or equity method of accounting, at the option of
the reporting company. Manufacturing corporations with assets less than $50 million report their dividend income
or equity income (loss) with other nonoperating income (expense). Corporations with assets of $50 million and over
report their dividend income or equity income (loss) separately.
How corporations are classified and tabulated. The industry combinations used in the QFR are defined in
accordance with the descriptions provided in the North American Industry Classification System, United States,
2012 manual. Each corporation in the survey is required to provide a breakdown of gross receipts by source
industry. These data are analyzed to determine the classification of each corporation. A reporting corporation is
initially classified into the NAICS sector accounting for more gross receipts than any other NAICS sector. To be in-
scope for the QFR, more gross receipts of the reporting corporation must be accounted for by either (not a
combination of) the NAICS Manufacturing sector; Mining sector; Wholesale Trade sector; Retail Trade sector;
Information sector; or Professional and Technical Services sector, than by any other NAICS sector. After a
corporation is assigned to a sector, it is further classified by the 3-digit NAICS subsector accounting for more gross
receipts than any other 3-digit subsector within the sector. In certain cases, corporations are further classified into 4-
digit industry groups. QFR data are published for these subsectors and industry groups, except when statistical
criteria are not satisfied. In those cases, sectors or subsectors are combined, such as Leather Product Manufacturing
and Apparel Manufacturing.
U.S. Census Bureau, Quarterly Financial Report, 2014 Quarter 4 xiv
Note that these procedures may lead to a conglomerate corporation being assigned to a major group from which only
a small proportion of its receipts are obtained. For example, if a corporation obtains 20 percent of its gross receipts
from wholesale trade, 25 percent each from mining and retail trade, and 30 percent from manufacturing, it would be
classified in the manufacturing sector. Furthermore, if the 30 percent of manufacturing activity was conducted in
two subsectors, 10 percent in one and 20 percent in the other, the activities of the corporation as a whole would be
classified in the subsector accounting for 20 percent of total receipts.
When a corporation is drawn into the sample, its classification is determined using the most current information
available. This classification is reviewed periodically and changed as needed for as long as the corporation remains
in the sample. Manufacturing corporations are tabulated according to their total assets reported for that quarter.
Mining; wholesale trade; retail trade; information; and professional and technical services corporations are tabulated
according to their total assets at the time of sample selection.
DATA ANALYSIS
Financial operating ratios. Many quantitative indicators are used to assess the financial strength of an enterprise
and the success of its operations. The simplest method is to assemble related financial items, such as sales and
profits, and to express this relationship in the form of a ratio. Using these ratios, various aspects of corporate
operations may be compared with the performance of other corporations or groups of corporations of similar size or
in a similar industry.
The QFR’s ratio-formatted income statement and selected balance sheet ratios are expressed as percents of net sales
and total assets, respectively. The operating and financial characteristics of the respective industries and asset size
groups are thus reduced to a common denominator to facilitate analysis.
The ratio tables include the following additional basic operating ratios:
Annual rate of profit on stockholders’ equity at end of period. This ratio is obtained by multiplying
income for the quarter before or after domestic taxes (including branch income (loss) and equity in the
earnings of nonconsolidated subsidiaries net of foreign taxes) by four, to put it on an annual basis, and then
dividing by stockholders’ equity at the end of the quarter. This ratio measures the rate of return that
accrues to stockholders on their investment.
Annual rate of profit on total assets. This ratio is obtained by multiplying income, as defined in deriving
the rate of profit on stockholders’ equity, both before and after taxes, by four, and then dividing by total
assets at the end of the quarter. This ratio measures the productivity of assets in terms of producing
income.
Total current assets to total current liabilities. This ratio is obtained by dividing total current assets by
total current liabilities. This ratio measures the ability to discharge current maturing obligations from
existing current assets.
Total cash and U.S. Government and other securities to total current liabilities. This ratio is obtained
by dividing total cash and U.S. Government and other securities by total current liabilities. This ratio
measures the ability to discharge current liabilities from liquid assets.
Total stockholders’ equity to total debt. This ratio is obtained by dividing total stockholders’ equity by
the total of short-term loans, current installments on long-term debt, and long-term debt due in more than
one year. This ratio indicates the extent of leverage financing used.
Comparisons with other statistics. QFR estimates will not necessarily agree with other financial and industrial
statistics, whether based upon a sample or complete canvass. For example:
U.S. Census Bureau, Quarterly Financial Report, 2014 Quarter 4 xv
The QFR eliminates multiple counting of interplant and other intracompany transfers included in census
establishment statistics. It also eliminates multiple counting of intercorporate transfers included in statistics
based upon nonconsolidated, partly consolidated, or combined reports from multicorporate enterprises.
Each corporation who elect to file Form 1120 with the IRS and is in scope of the QFR is classified in one
of 46 QFR subsectors or industry groups and has a known probability of being drawn into the QFR sample.
Each corporation in the QFR sample is therefore given its proper weight in computing the QFR estimates.
The composition of the sample changes each quarter to reflect the effects of corporate births, deaths,
acquisitions, divestitures, mergers, consolidations, and the like. To redistribute the reporting responsibility
as equitably as possible among the smallest corporations, one-eighth of the noncertainty sample is replaced
each quarter. The QFR estimates may, therefore, differ significantly from estimates based upon reports for
identical groups of corporations.
The conventional accounting concept of profits is used in the QFR estimates. This differs from the concept
of profits employed in the national income and product accounts. In measuring profits for national income
accounting purposes, capital gains and dividends received by corporations are deducted from profits,
capital losses and depletion charges are added to profits, and adjustments are made for international flows
affecting profits.
Corporations’ QFR submissions generally embody the accounting conventions adopted for financial
reporting purposes. As such, they may differ from those used by corporations for reporting income to the
Internal Revenue Service (IRS); for example, in the more frequent application of accelerated depreciation
on tax returns. Therefore, annual income and balance sheet information derived from tax returns, which
can be found in the IRS report series Statistics of Income: Corporation Income Tax Returns, may not be
comparable.
QFR estimates by corporation size are based upon the total assets of consolidated corporate enterprises.
They differ from estimates based upon other criteria such as value of shipments or number of employees.
They differ also from estimates based upon other reporting units such as establishments, nonconsolidated
corporations, or enterprises consolidated differently than in the QFR.
QFR estimates are based upon a changing sample of audited, unaudited, and estimated reports required to
be submitted within 25 days after the end of each quarterly reporting period by corporations that are not
necessarily identical entities from quarter to quarter. Aggregated for any four consecutive quarters, the
QFR estimates will differ from similar aggregations of finalized and audited annual reports for accounting
years that are not necessarily identical from corporation to corporation.
Time series discontinuities. Because of various changes to the QFR program over the years, discontinuities that
affect its use as a time series for tracking economic change have been introduced. The most significant ones follow:
Accounting rules changes. When the QFR series began in 1947, corporations were instructed to
consolidate all of their subsidiaries that were taxable under the U.S. Internal Revenue Code and that were
fully consolidated in their latest report to stockholders. All other subsidiaries were to be accounted for as
investments. Closely held corporations that did not prepare stockholder reports were to report on a basis
consistent with their audited or corporation prepared reports.
The income tax liability rule was expected to eliminate most foreign operations. However, as the number
of multinational corporations increased between 1947 and 1973, foreign operations gradually became more
and more significant in the QFR data. To study these issues and develop solutions, an interagency task
force composed of user agency representatives was created. This task force proposed new consolidation
rules to maximize coverage and minimize the impact of foreign operations on QFR statistics. These new
consolidation rules were put into effect in the fourth quarter of 1973 (see Consolidation rules paragraphs
above). As a result of these changes, foreign operations are included on an investment basis. In addition,
the breadth of the new consolidation rules was expanded to include certain domestic subsidiaries previously
U.S. Census Bureau, Quarterly Financial Report, 2014 Quarter 4 xvi
excluded under the old rules. Also, the rules were clarified with respect to the scope of coverage.
Domestic subsidiaries engaged in banking, finance, or insurance are not to be consolidated.
The change in consolidation rules and the creation of a line item to reflect equity in earnings from
nonconsolidated subsidiaries, significantly lessened the comparability of pre- and post-Q4 1973 reports.
QFR internal accounting procedures prior to the rule change required the classification of equity in earnings
(losses) as direct credit or charge to retained earnings. Therefore, when a reporting corporation indicated
by footnote that its equity in nonconsolidated subsidiary earnings (losses) was included in its current
quarter’s income (loss), the QFR accounting staff made the appropriate adjustment. With the addition of
the separate line on equity, this adjustment is not made.
Equity in earnings (losses) is accounted for as an element of the parent corporation’s quarterly income
(loss) after taxes. The treatment of dividend income received from nonconsolidated subsidiaries accounted
for by the cost method has remained consistent under both the new and old format. In these instances,
dividends received are included in net income before taxes (NIBT) through the nonoperating income line.
A comparison of aggregated totals published under both the old and new consolidation rules indicates the
following:
o There was a net decrease in sales, apparently due to the exclusion of foreign activities previously
included.
o There was a net decrease in NIBT apparently due to two major effects: 1) Equity in earnings
(losses) from nonconsolidated subsidiaries is reflected on a designated line below NIBT, whereas
prior reports often included this amount in NIBT. If the reporting company did not footnote this
inclusion, QFR accountants were unable to make the proper adjustment; and 2) If foreign activity
was fully consolidated, foreign earnings were also included in NIBT. The new consolidation rules
minimize this effect as well.
o The net effect of the rule changes on net income after taxes (NIAT) was small. Under both rules,
foreign activity should be included above the NIAT line. The slight degree of difference also
suggests that the QFR footnoted equity in earnings (losses) on nonconsolidated subsidiaries were
not extensive enough to affect comparative published data materially.
o Noncurrent assets include investments in nonconsolidated subsidiaries under either the cost or
equity method. The rule change precluding full consolidation of foreign activity caused a marked
increase in this line item. Corporations that consolidated foreign activity fully up to 1973 were
required to eliminate their investment in accordance with generally accepted accounting
principles. Since foreign activity is not fully consolidated, investments in these subsidiaries are
included in noncurrent assets.
Industry classification system changes. The fourth quarter of 2001 reflects the conversion of the QFR to
the North American Industry Classification System (NAICS) from the Standard Industrial Classification
(SIC) system. With NAICS, there were major changes in how industries are defined requiring the
movement of many corporations to different industry categories. The most notable changes were: moving
publishing activities from manufacturing to the information sector; moving logging to the agriculture,
forestry, fishing, and hunting sector; moving eating and drinking places from retail trade to the
accommodation and food services sector; redistributing instruments and related products to several new or
redefined manufacturing sectors; and creating the NAICS computer and electronic products manufacturing
sector. Data for the fourth quarter of 2000 through the third quarter of 2001 were restated on the new
NAICS basis.
Sample design changes. The first sample in this survey was drawn from U.S. Corporation Income Tax
Returns (Form1120) filed with IRS for the taxable year 1943 and was used to produce estimates for 1947 to
1951. A second sample was drawn from income tax returns for the taxable year 1949 and was used to
produce data for 1951 to 1956. Since then, samples are drawn annually from income tax returns to produce
U.S. Census Bureau, Quarterly Financial Report, 2014 Quarter 4 xvii
data. Each sample through fourth quarter 1982 was supplemented by quarterly samples of applications for
a Federal Social Security Employer’s Identification Number filed with the Social Security Administration
(SSA). Subsequent to that quarter the QFR lost its authority to obtain the SSA data.
From the third quarter 1977 through the fourth quarter 1986, the strata including very small manufacturing
firms (those with assets less than $250,000) and all newly incorporated manufacturers were estimated using
multivariate techniques. Beginning in the first quarter 1987, the QFR universe of corporations was
redefined to exclude these strata. Beginning in the fourth quarter of 1988, the asset level for inclusion in
published mining, wholesale trade, and retail trade estimates was raised to $50 million at the time of sample
selection. These latter changes to the sample rules were effected to reduce reporting burden on small
companies and to meet changing budget restraints.
Effective with the fourth quarter 2001 report, cooperatives were defined out-of-scope of the QFR program.
These firms, which are primarily in the manufacturing and wholesale trade food sectors, file 990-C
Farmers’ Cooperative Association tax returns with the IRS. Also, even though many are incorporated, they
have tax exempt status with the IRS.
Beginning with the fourth quarter 2009, corporations with $50 million or more in total assets and classified
in Sector 51- Information, and Sector 54- Professional and Technical Services (except Legal Services,
Industry Group 5411), were defined as in-scope of the QFR program. The aggregated data for these sectors
were first released in the fourth quarter 2010 data release, when five quarters of data were available.
Questionnaire changes. In 1980, Congress mandated a reduction in both QFR form complexity and
sample size. In response, the program adopted an abbreviated form for surveyed corporations with total
assets of less than $50 million. Corporations with higher asset values continued to submit the long form,
which has been in use since 1974. To accomplish the sample size reduction, the threshold for sampling on
less than a 1:1 ratio was raised from $10 million to $25 million in assets. The threshold for sampling was
subsequently raised to $50 million in 1988 and to $250 million in 1995 (see Survey Methodology section
below). The resulting reduced sample size was optimally allocated with further cuts made in asset sizes
below $10 million. The results of these changes were reflected beginning in the fourth quarter of 1981.
Beginning with the first quarter of 1998, the long and short survey forms were updated to conform with
changes in accounting principles and to provide more meaningful data to users. The new format provided
for reporting of interest expense, bonds and debentures, and more detailed information on significant
economic events, such as asset sales and disposal of business segments. NIBT and NIAT were redefined to
include minority stockholders’ interest. In some instances, old data items were not fully comparable with
the new format; however, where possible, prior quarter data were restated in the new format.
Tables for converting long format data items to short format data items are located on pages xxii and xxiii.
Note that data tables presenting total estimates by NAICS sector, subsector, and industry group are
published on the short-form basis; therefore, the more detailed long form data submitted by larger
corporations (those with assets of $50 million and over) are collapsed in these tables.
Corporations filing the short form, report equity in earnings (losses) of nonconsolidated subsidiaries and
foreign branches as a component of all other nonoperating income (expense). Although this treatment will
introduce elements of foreign earnings (losses) into income (or loss) before income taxes, the contribution
of foreign earnings (losses) of these smaller asset size corporations to this data item has been historically
insignificant. Corporations with assets of $50 million and over continue to report equity in earnings
(losses) as a separate data item. As can be seen in the conversion table, this data item is collapsed for total
estimation into all other nonoperating income (expense).
However, since these larger asset size corporations continue to report equity in earnings (losses) separately,
as reflected in the tables published for corporations with assets of $25 million and over, comparability with
prior data can be achieved through subtraction.
U.S. Census Bureau, Quarterly Financial Report, 2014 Quarter 4 xviii
Imputation methodology changes: Beginning with the fourth quarter 2010 publication, a new imputation
methodology was implemented to account for nonresponding companies using statistical procedures that
utilize previously reported data (if available) and data from current respondents of similar asset size and
industry classification. Estimates for the prior four quarters (fourth quarter 2009 through third quarter
2010) were restated using this new methodology in order to provide comparability. For more information,
see the Survey Methodology section below.
SURVEY METHODOLOGY
Sampling frame. The QFR target population consists of all corporations engaged primarily in manufacturing with
total assets of $250,000 and over, and all corporations engaged primarily in mining; wholesale trade; retail trade;
information; or professional and technical services (except legal services) industries with total assets of $50 million
and over. The QFR sampling frame is developed from a file received annually from the IRS. This file contains
select information for corporations who elect to file Form 1120 with the IRS. Once this file is received, the QFR
examines the information and assigns an initial NAICS industry code to each corporation. Then this file is stratified
based on the NAICS code, size of total assets and size of receipts.
Nearly all corporations whose operations are within scope of the QFR and have total assets of $250 million and over
are included in the sample with certainty and are canvassed every quarter. In addition, receipts cut-off values are
determined on an industry basis. If a corporation has receipts at or above the receipts cut-off value for their
industry, that corporation is included in the sample with certainty and is canvassed every quarter. When a new
sample is selected, all new certainty cases are canvassed starting in the fourth quarter. Note that all certainty cases
from the prior years’ samples will remain active in the QFR survey if they still meet the in-scope criteria.
Sample selection. Simple random samples are selected from the eligible noncertainty units in the remaining
industry-by-size strata. The sample in each cell is divided systematically into four panels that are introduced over
the next year. Each noncertainty panel is in the survey for eight successive quarters. Each quarter, one noncertainty
panel is rotated out and a new panel is rotated into the sample. This means that the noncertainty sample for adjacent
quarters is seven-eighths identical, and is one half identical for quarters ending one year apart. This panel rotation
scheme also means that panels from up to three different sample frames could be active in the QFR survey. Panels
from the most recent sample are introduced into the QFR survey starting in the fourth quarter, with the remaining
three panels being introduced, one at a time, into the sample in each succeeding quarter (i.e., quarters one, two, and
three). Then this process starts over again with the new sample selected in the following year.
See Table N – Composition of the Sample, in the Summary Data Tables section of the current QFR publication
(available at http://www.census.gov/econ/qfr/index.html) for the number of active corporations in the sample by
NAICS sector and asset size for the current quarter.
As a result of the Paperwork Reduction Act of 1995, QFR sample units are subject to time-in / time-out constraints.
If a sampled company has less than $50 million in total assets and has been in the survey for eight quarters, that
company is not eligible for selection again for the next ten years. If a company has total assets between $50 million
and $250 million and has been in the survey for eight quarters, it is not eligible for selection again for the next two
years. Because of the time-in / time-out constraints, it is necessary to evaluate the frame to ensure there are enough
eligible units for the four panels of the current sample to be selected, and that there will remain enough units on the
frame that will be eligible for selection in subsequent years. If there are too few units, the optimal sample size for
the current year is reduced to allow enough units for future years’ selections. This adjustment to the optimal sample
size results in increased variance for these strata.
Sample maintenance. The file received from the IRS to create the QFR frame does not contain all corporate tax
returns. This is due to several factors, including but not limited to, corporations filing late tax returns, mergers and
acquisitions, spinoffs, corporate restructuring, etc. In an attempt to keep the coverage of certainty corporations as
complete as possible, the QFR staff reviews current corporate news releases and public records to identify any
potential additions and changes to the QFR target population. Corporations thus identified and thought to meet the
QFR in-scope criteria are contacted to verify their in-scope status. Once verified, they will be included in the survey
with certainty for the remainder of the year.
U.S. Census Bureau, Quarterly Financial Report, 2014 Quarter 4 xix
Nonresponse. Beginning with the fourth quarter 2010, the QFR implemented a new methodology to account for
companies that are active in the sample but who do not respond to the questionnaire. Prior to fourth quarter of 2010,
nonrespondent noncertainty sample companies were accounted for by adjusting the weight of the respondent
companies. At the same time, certainty companies were imputed. The new methodology imputes data for all
nonresponding companies using statistical procedures that utilize previously reported data (if available) and data
from current respondents of similar asset size and industry classification. The new imputation methodology will, on
average, produce more accurate data estimates and better reflect current financial standing.
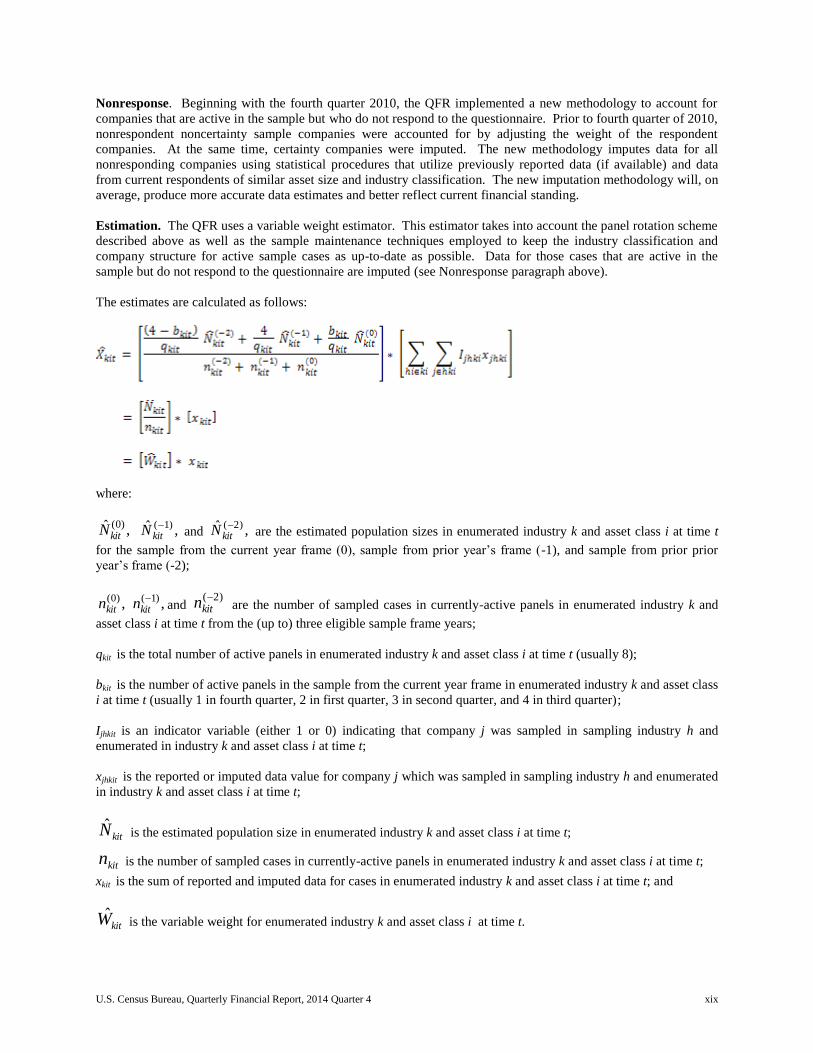
Estimation. The QFR uses a variable weight estimator. This estimator takes into account the panel rotation scheme
described above as well as the sample maintenance techniques employed to keep the industry classification and
company structure for active sample cases as up-to-date as possible. Data for those cases that are active in the
sample but do not respond to the questionnaire are imputed (see Nonresponse paragraph above).
The estimates are calculated as follows:
where:
,ˆ )0(kitN ,ˆ )1(
kitN and ,ˆ )2(kitN are the estimated population sizes in enumerated industry k and asset class i at time t
for the sample from the current year frame (0), sample from prior year’s frame (-1), and sample from prior prior
year’s frame (-2);
,)0(kitn ,)1(
kitn and )2(
kitn are the number of sampled cases in currently-active panels in enumerated industry k and
asset class i at time t from the (up to) three eligible sample frame years;
qkit is the total number of active panels in enumerated industry k and asset class i at time t (usually 8);
bkit is the number of active panels in the sample from the current year frame in enumerated industry k and asset class
i at time t (usually 1 in fourth quarter, 2 in first quarter, 3 in second quarter, and 4 in third quarter);
Ijhkit is an indicator variable (either 1 or 0) indicating that company j was sampled in sampling industry h and
enumerated in industry k and asset class i at time t;
xjhkit is the reported or imputed data value for company j which was sampled in sampling industry h and enumerated
in industry k and asset class i at time t;
kitN is the estimated population size in enumerated industry k and asset class i at time t;
kitn is the number of sampled cases in currently-active panels in enumerated industry k and asset class i at time t;
xkit is the sum of reported and imputed data for cases in enumerated industry k and asset class i at time t; and
kitW is the variable weight for enumerated industry k and asset class i at time t.

U.S. Census Bureau, Quarterly Financial Report, 2014 Quarter 4 xx
Note: Imputation for nonrespondent cases is performed for current quarter processing only. If an originally imputed
case reports data for the current quarter after the initial publication, that case’s reported data will be included in
revisions to that quarter’s data in the next scheduled publication; however, the original imputed data for the
remaining nonresponding cases for that quarter will not be reimputed.
Sampling error. The sample used in this survey is one of many possible samples that could have been selected
using the sampling methodology described earlier. Each of these possible samples would likely yield different
results. These samples give rise to a distribution of estimates for the unknown population value. A statistical
measure of the variability among these estimates is the standard error (SE), which can be estimated from any one
sample. The standard error is defined as the square root of the variance. The relative standard error (RSE) of an
estimate is the standard error of the estimate divided by the estimate, and is usually expressed as a percent. It
provides a measure of the variation of the data relative to the estimate being made. Note that measures of sampling
variability, such as the standard error and relative standard error, are estimated from the sample and are also subject
to sampling variability. Table O – Sampling Variability, in the Summary Data Tables section of the current QFR
publication, gives the estimates of the relative standard error in percent for the estimates of net sales, depreciation,
inventories, and total assets, and the estimates of standard error for income before income taxes.
Beginning with the third quarter 2006 publication, the methodology for calculating the sample variance changed.
Prior methodology used a design-based approach, whereas the new methodology uses a model-based approach.
This new approach provides a better estimate of sample variance in strata with few sample cases, and also reflects
some of the variability due to our methods used to account for nonresponding companies. The relative standard
errors presented in Table O – Sampling Variability, mentioned above, can be used to derive the standard error of the
estimate. The standard error can be used to derive interval estimates with prescribed levels of confidence that the
interval includes the average results of all samples:
Intervals defined by one standard error above and below the sample estimate will contain the true value
approximately 68 percent of the time.
Intervals defined by 1.6 standard errors above and below the sample estimate will contain the true value
approximately 90 percent of the time.
Intervals defined by two standard errors above and below the sample estimate will contain the true value
approximately 95 percent of the time.
To illustrate the computations involved in the above confidence statements as related to dollar volume net sales
estimates, assume that an estimate of net sales for all manufacturing published in Table 1.0 – Income Statement For
Corporations in the NAICS Manufacturing Sector, in the Financial Data Tables section of the current QFR
publication, is $525,000 million for a particular quarter and that the relative standard error for this estimate, as given
in Table O – Sampling Variability, in the Summary Data Tables section, is 0.2 percent. Then the SE is calculated as:
Therefore, a 90-percent confidence interval is:
$525,000 million ± 1.6 ($1,050 million)
= $525,000 ± $1,680 million,
or $523,320 million to $526,680 million.
U.S. Census Bureau, Quarterly Financial Report, 2014 Quarter 4 xxi
If corresponding confidence intervals were constructed for all possible samples of the same size and design,
approximately 90 percent of the intervals would contain the figure obtained from a complete enumeration.
Nonsampling error. The relative standard error estimates sampling variation, but does not measure all errors in the
data. Nonsampling errors can be attributed to many possible sources:
Coverage error, such as failure to accurately represent all population units in the sample, or the inability to
obtain information about all sample cases;
Response errors, possibly due to definitional difficulties or misreporting;
Mistakes in recording or coding the data obtained;
Other errors of coverage, collection, nonresponse, response, processing, or imputing for missing or
inconsistent data.
These nonsampling errors also occur in complete censuses. Although no direct measures of these errors have been
obtained, precautionary steps were taken in all phases of the collection, processing, and tabulation of the data to
minimize their influence.
Data Quality Indicators. The QFR produces two indicators of data quality: the Unit Response Rate (URR) and the
Total Quantity Response Rate (TQRR). The URR is defined as the percentage of sampled units (unweighted) that
responded to the current quarter’s survey. In determining the URR, a unit is classified as a respondent if it provided
adequate information for key QFR data items. The TQRR is defined as the weighted estimated total of a key QFR
data item that is either reported by a survey unit or acquired from some other information source (such as a
publically available quarterly or annual report) and that is determined to be equivalent in quality to reported data.
The TQRR is calculated for the QFR data items net sales, depreciation, income before income taxes, and total assets.
The imputation rate, or the percentage of the weighted estimated total of a key QFR data item that is imputed for
nonresponding units, is calculated as 100% minus TQRR. The current quarter Unit Response Rates and Total
Quantity Response Rates are published in the QFR press releases available at http://www.census.gov/econ/qfr.
Adjustment for seasonal variation. The QFR seasonally adjusts net sales and net income after taxes for all
manufacturing, all durable manufacturing, and all nondurable manufacturing; and net sales for all retail trade, using
the X-13 ARIMA-SEATS1 program.
Seasonal adjustment is the process of estimating and removing the seasonal elements in a data series. This
adjustment eliminates the seasonal trend present in the series and reveals non-seasonal features and trends. The
precision of the adjustment is dependent upon economic conditions and various other elements that introduce
significant changes to seasonal patterns. A more stable climate will result in a more precise adjustment, while
volatility can reduce precision, especially in the short-term.
Seasonally adjusted data are published in the QFR press releases available at http://www.census.gov/econ/qfr. The
releases provide seasonally adjusted estimates for the current quarter, all previously published quarters in the current
calendar year, and for eleven prior calendar years. All prior seasonally adjusted data are updated each quarter based
on the most recent data and seasonal factors.
The seasonal adjustment models are periodically reviewed and updated to account for recent changes in seasonal
trends. For more information about seasonal adjustment as it related to QFR, contact the Financial Reports Branch
at 301-763-6600 or [email protected].
1 X-13ARIMA-SEATS is an updated version of the Census Bureau’s X-12-ARIMA software. More information
about X-13ARIMA-SEATS is available at http://www.census.gov/srd/www/x13as/.
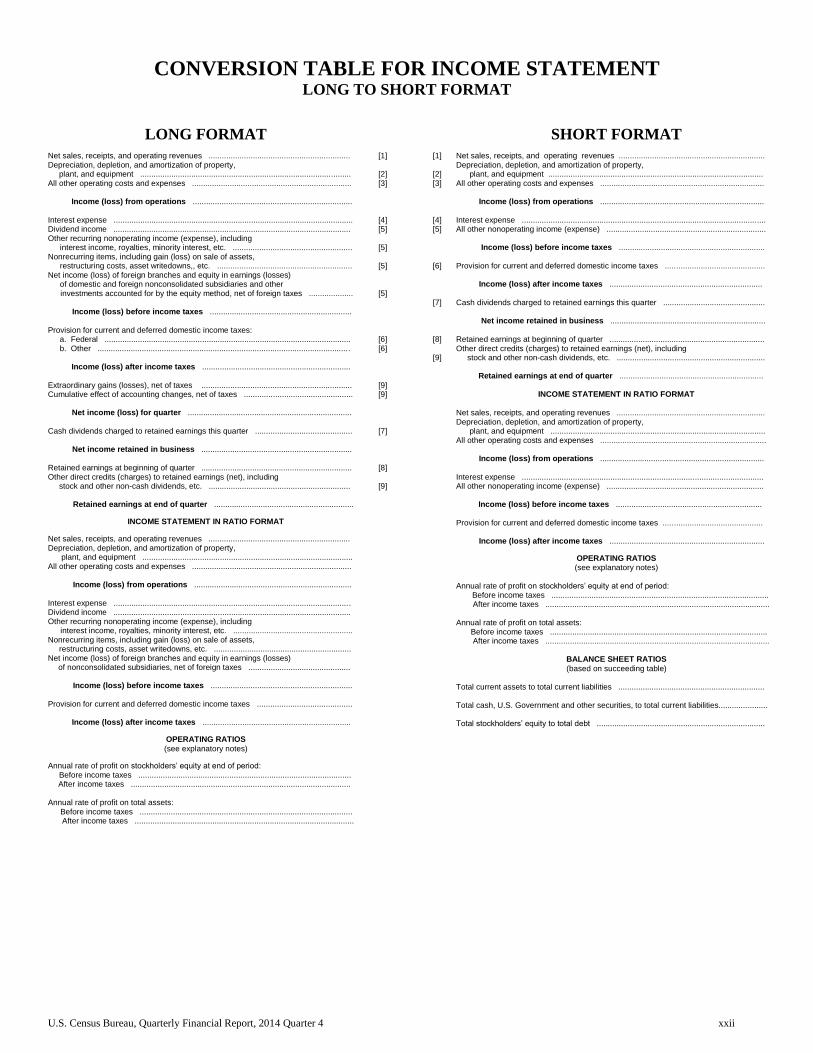
U.S. Census Bureau, Quarterly Financial Report, 2014 Quarter 4 xxii
CONVERSION TABLE FOR INCOME STATEMENT LONG TO SHORT FORMAT
LONG FORMAT
SHORT FORMAT
Net sales, receipts, and operating revenues ................................................................ Depreciation, depletion, and amortization of property, plant, and equipment ............................................................................................... All other operating costs and expenses ........................................................................ Income (loss) from operations ........................................................................ Interest expense ............................................................................................................ Dividend income ........................................................................................................... Other recurring nonoperating income (expense), including interest income, royalties, minority interest, etc. ...................................................... Nonrecurring items, including gain (loss) on sale of assets, restructuring costs, asset writedowns,, etc. ............................................................. Net income (loss) of foreign branches and equity in earnings (losses) of domestic and foreign nonconsolidated subsidiaries and other investments accounted for by the equity method, net of foreign taxes .................... Income (loss) before income taxes ................................................................ Provision for current and deferred domestic income taxes: a. Federal ............................................................................................................... b. Other .................................................................................................................. Income (loss) after income taxes ................................................................... Extraordinary gains (losses), net of taxes .................................................................... Cumulative effect of accounting changes, net of taxes ................................................. Net income (loss) for quarter ..........................................................................
Cash dividends charged to retained earnings this quarter ............................................ Net income retained in business ....................................................................
Retained earnings at beginning of quarter .................................................................... Other direct credits (charges) to retained earnings (net), including stock and other non-cash dividends, etc. ................................................................ Retained earnings at end of quarter ...............................................................
INCOME STATEMENT IN RATIO FORMAT
Net sales, receipts, and operating revenues ................................................................ Depreciation, depletion, and amortization of property, plant, and equipment ............................................................................................... All other operating costs and expenses ........................................................................ Income (loss) from operations ....................................................................... Interest expense ........................................................................................................... Dividend income ........................................................................................................... Other recurring nonoperating income (expense), including interest income, royalties, minority interest, etc. ...................................................... Nonrecurring items, including gain (loss) on sale of assets, restructuring costs, asset writedowns, etc. .............................................................. Net income (loss) of foreign branches and equity in earnings (losses) of nonconsolidated subsidiaries, net of foreign taxes .............................................. Income (loss) before income taxes ................................................................
Provision for current and deferred domestic income taxes ........................................... Income (loss) after income taxes ...................................................................
OPERATING RATIOS
(see explanatory notes)
Annual rate of profit on stockholders’ equity at end of period: Before income taxes ................................................................................................ After income taxes ................................................................................................... Annual rate of profit on total assets: Before income taxes ................................................................................................ After income taxes ...................................................................................................
[1] [2] [3] [4] [5] [5] [5] [5] [6] [6] [9] [9] [7] [8] [9]
[1]
[2] [3]
[4] [5]
[6]
[7]
[8]
[9]
Net sales, receipts, and operating revenues .................................................................. Depreciation, depletion, and amortization of property, plant, and equipment ................................................................................................. All other operating costs and expenses .......................................................................... Income (loss) from operations .......................................................................... Interest expense .............................................................................................................. All other nonoperating income (expense) ........................................................................ Income (loss) before income taxes ..................................................................
Provision for current and deferred domestic income taxes ............................................. Income (loss) after income taxes .....................................................................
Cash dividends charged to retained earnings this quarter .............................................. Net income retained in business ......................................................................
Retained earnings at beginning of quarter ...................................................................... Other direct credits (charges) to retained earnings (net), including stock and other non-cash dividends, etc. ................................................................... Retained earnings at end of quarter .................................................................
INCOME STATEMENT IN RATIO FORMAT
Net sales, receipts, and operating revenues ................................................................... Depreciation, depletion, and amortization of property, plant, and equipment ................................................................................................. All other operating costs and expenses ........................................................................... Income (loss) from operations .......................................................................... Interest expense ............................................................................................................. All other nonoperating income (expense) ....................................................................... Income (loss) before income taxes ..................................................................
Provision for current and deferred domestic income taxes ............................................. Income (loss) after income taxes ......................................................................
OPERATING RATIOS (see explanatory notes)
Annual rate of profit on stockholders’ equity at end of period: Before income taxes .................................................................................................. After income taxes ..................................................................................................... Annual rate of profit on total assets: Before income taxes .................................................................................................. After income taxes .....................................................................................................
BALANCE SHEET RATIOS
(based on succeeding table)
Total current assets to total current liabilities .................................................................. Total cash, U.S. Government and other securities, to total current liabilities...................... Total stockholders’ equity to total debt ............................................................................
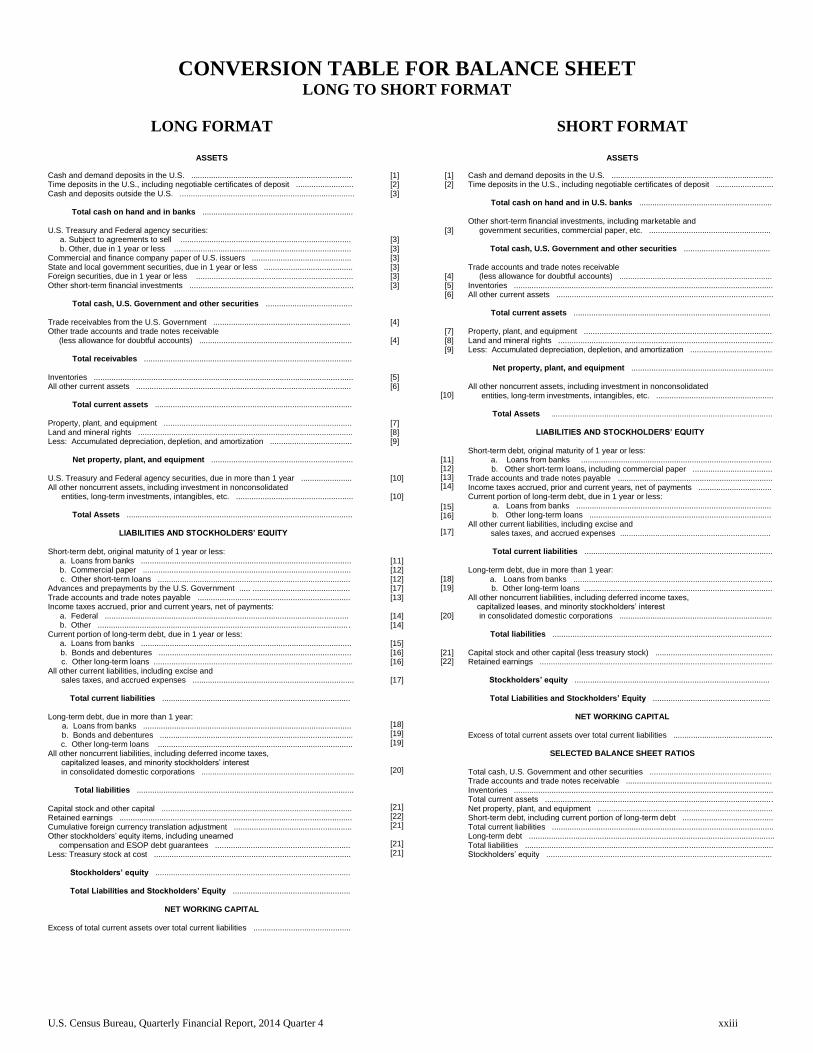
U.S. Census Bureau, Quarterly Financial Report, 2014 Quarter 4 xxiii
CONVERSION TABLE FOR BALANCE SHEET LONG TO SHORT FORMAT
LONG FORMAT
ASSETS
SHORT FORMAT
ASSETS
Cash and demand deposits in the U.S. ......................................................................... Time deposits in the U.S., including negotiable certificates of deposit .......................... Cash and deposits outside the U.S. ............................................................................... Total cash on hand and in banks .................................................................... U.S. Treasury and Federal agency securities: a. Subject to agreements to sell ............................................................................. b. Other, due in 1 year or less ................................................................................ Commercial and finance company paper of U.S. issuers ............................................. State and local government securities, due in 1 year or less ........................................ Foreign securities, due in 1 year or less ....................................................................... Other short-term financial investments .......................................................................... Total cash, U.S. Government and other securities ....................................... Trade receivables from the U.S. Government .............................................................. Other trade accounts and trade notes receivable (less allowance for doubtful accounts) ..................................................................... Total receivables .............................................................................................. Inventories ..................................................................................................................... All other current assets ................................................................................................. Total current assets .........................................................................................
Property, plant, and equipment ..................................................................................... Land and mineral rights ................................................................................................. Less: Accumulated depreciation, depletion, and amortization ..................................... Net property, plant, and equipment ................................................................
U.S. Treasury and Federal agency securities, due in more than 1 year ....................... All other noncurrent assets, including investment in nonconsolidated entities, long-term investments, intangibles, etc. ..................................................... Total Assets ......................................................................................................
LIABILITIES AND STOCKHOLDERS’ EQUITY
Short-term debt, original maturity of 1 year or less: a. Loans from banks ............................................................................................... b. Commercial paper .............................................................................................. c. Other short-term loans ....................................................................................... Advances and prepayments by the U.S. Government ..... ............................................ Trade accounts and trade notes payable ..................................................................... Income taxes accrued, prior and current years, net of payments:
a. Federal .............................................................................................................. b. Other ..................................................................................................................
Current portion of long-term debt, due in 1 year or less: a. Loans from banks ...............................................................................................
b. Bonds and debentures ....................................................................................... c. Other long-term loans .......................................................................................... All other current liabilities, including excise and sales taxes, and accrued expenses ......................................................................... Total current liabilities ..................................................................................... Long-term debt, due in more than 1 year: a. Loans from banks .............................................................................................. b. Bonds and debentures ....................................................................................... c. Other long-term loans ........................................................................................ All other noncurrent liabilities, including deferred income taxes, capitalized leases, and minority stockholders’ interest in consolidated domestic corporations ..................................................................... Total liabilities .................................................................................................. Capital stock and other capital ...................................................................................... Retained earnings ......................................................................................................... Cumulative foreign currency translation adjustment ..................................................... Other stockholders’ equity items, including unearned compensation and ESOP debt guarantees ............................................................. Less: Treasury stock at cost ......................................................................................... Stockholders’ equity ........................................................................................
Total Liabilities and Stockholders’ Equity .....................................................
NET WORKING CAPITAL
Excess of total current assets over total current liabilities ............................................
[1] [2] [3] [3] [3] [3] [3] [3] [3] [4] [4] [5] [6] [7] [8] [9] [10] [10] [11] [12] [12] [17] [13] [14] [14] [15] [16] [16] [17]
[18] [19] [19] [20] [21] [22] [21] [21] [21]
[1] [2]
[3]
[4] [5] [6]
[7] [8] [9]
[10]
[11] [12] [13] [14]
[15] [16]
[17]
[18] [19]
[20]
[21] [22]
Cash and demand deposits in the U.S. ......................................................................... Time deposits in the U.S., including negotiable certificates of deposit .......................... Total cash on hand and in U.S. banks ............................................................
Other short-term financial investments, including marketable and government securities, commercial paper, etc. ....................................................... Total cash, U.S. Government and other securities ....................................... Trade accounts and trade notes receivable (less allowance for doubtful accounts) ..................................................................... Inventories ..................................................................................................................... All other current assets .................................................................................................. Total current assets .........................................................................................
Property, plant, and equipment ..................................................................................... Land and mineral rights ................................................................................................. Less: Accumulated depreciation, depletion, and amortization ..................................... Net property, plant, and equipment ................................................................
All other noncurrent assets, including investment in nonconsolidated entities, long-term investments, intangibles, etc. ..................................................... Total Assets .................................................................................................... LIABILITIES AND STOCKHOLDERS’ EQUITY Short-term debt, original maturity of 1 year or less: a. Loans from banks ...................................................................................... b. Other short-term loans, including commercial paper .................................... Trade accounts and trade notes payable ...................................................................... Income taxes accrued, prior and current years, net of payments ................................. Current portion of long-term debt, due in 1 year or less: a. Loans from banks ........................................................................................ b. Other long-term loans .................................................................................. All other current liabilities, including excise and sales taxes, and accrued expenses .................................................................... Total current liabilities .....................................................................................
Long-term debt, due in more than 1 year: a. Loans from banks .......................................................................................... b. Other long-term loans ..................................................................................... All other noncurrent liabilities, including deferred income taxes, capitalized leases, and minority stockholders’ interest in consolidated domestic corporations ..................................................................... Total liabilities ................................................................................................... Capital stock and other capital (less treasury stock) ..................................................... Retained earnings ......................................................................................................... Stockholders’ equity ........................................................................................
Total Liabilities and Stockholders’ Equity .....................................................
NET WORKING CAPITAL Excess of total current assets over total current liabilities .............................................
SELECTED BALANCE SHEET RATIOS Total cash, U.S. Government and other securities ....................................................... Trade accounts and trade notes receivable .................................................................. Inventories ..................................................................................................................... Total current assets ....................................................................................................... Net property, plant, and equipment ............................................................................... Short-term debt, including current portion of long-term debt ......................................... Total current liabilities .................................................................................................... Long-term debt ............................................................................................................... Total liabilities ................................................................................................................ Stockholders’ equity ......................................................................................................
This workbook consists of 14 summary tables
SUMMARY DATA TABLES
Some data in these tables are revised to reflect additional
information and/or corrections submitted by respondents
subsequent to last quarter’s publication.
xxivU.S. Census Bureau, Quarterly Financial Report, 2014 Quarter 4
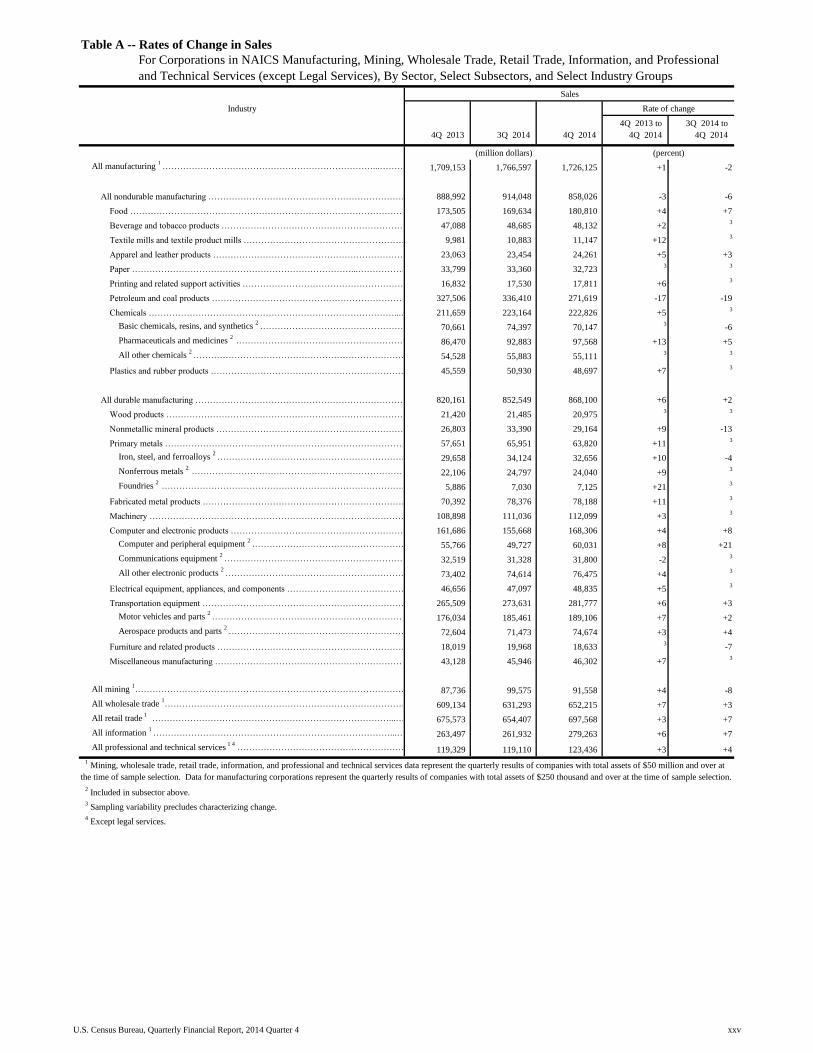
Table with row headers in column A with column headers in rows 4, 5, and 6
Industry
4Q 2013_ 3Q 2014_ 4Q 2014_
4Q 2013 to_
4Q 2014_
3Q 2014 to_
4Q 2014_
All manufacturing 1
………………………………………………………………...……………………………………………………………...………………………………………………………………………1,709,153 1,766,597 1,726,125 +1 -2
All nondurable manufacturing ……………………………………………………………...……………………………………………...……………………………………………………………888,992 914,048 858,026 -3 -6
Food …………………………………………………………………………………………………...…………………………………………………………………………………………………………………………173,505 169,634 180,810 +4 +7
Beverage and tobacco products ………………………………………………………………………...…………………………………………………………………………………47,088 48,685 48,132 +23
Textile mills and textile product mills ……………………………………………………………………...………………………………………………………………………………………………9,981 10,883 11,147 +123
Apparel and leather products ………………………………………………………………………...……………………………………………………………………………………………………23,063 23,454 24,261 +5 +3
Paper …………………………………………………………………...…………………………………………………………………………...………………………………………………………………………………………33,799 33,360 32,7233 3
Printing and related support activities …………………………………………………………………...……………………………………………………………………………………………16,832 17,530 17,811 +63
Petroleum and coal products ……………………………………………………………………...…………………………………………………………………………………………………………327,506 336,410 271,619 -17 -19
Chemicals …………………………………………………………………………...……………………………………………………………………………...…………………………………………………………………………………………211,659 223,164 222,826 +53
Basic chemicals, resins, and synthetics 2
……………………………………………………………………...…………………………………………………………………70,661 74,397 70,1473
-6
Pharmaceuticals and medicines 2
…………………………………………………………………...………………………………………………………………………………………………………86,470 92,883 97,568 +13 +5
All other chemicals 2
…………………………………………………………………………………...…………………………………………………………………………………………………………………………54,528 55,883 55,1113 3
Plastics and rubber products ………………………………………………………………………...………………………………………………………………………………………………………………45,559 50,930 48,697 +73
All durable manufacturing ………………………………………………………………………...………………………………………………………………………………………820,161 852,549 868,100 +6 +2
Wood products ………………………………………………………………………………………...……………………………………………………………………………………………………21,420 21,485 20,9753 3
Nonmetallic mineral products ………………………………………………………………………...……………………………………………………………………………………………………………………26,803 33,390 29,164 +9 -13
Primary metals ……………………………………………………………………………………………...………………………………………………………………………………………………57,651 65,951 63,820 +113
Iron, steel, and ferroalloys 2
……………………………………………………………………………...………………………………………………………………………………………………………………29,658 34,124 32,656 +10 -4
Nonferrous metals 2
…………………………………………………………………………………...…………………………………………………………………………………………………………22,106 24,797 24,040 +93
Foundries 2
…………………………………………………………………………………………...…………………………………………………………………………………………………5,886 7,030 7,125 +213
Fabricated metal products …………………………………………………………………...…………………………………………………………………………………………………………………………70,392 78,376 78,188 +113
Machinery ……………………………………………………………………………………...………………………………………………………………………………………………………108,898 111,036 112,099 +33
Computer and electronic products ………………………………………………………………………...……………………………………………………………………………………………161,686 155,668 168,306 +4 +8
Computer and peripheral equipment 2
………………………………………………………………………...……………………………………………………………………………………………55,766 49,727 60,031 +8 +21
Communications equipment 2
……………………………………………………………………...………………………………………………………………………………………………………………………32,519 31,328 31,800 -23
All other electronic products 2
…………………………………………………………………………………...…………………………………………………………………………………………………………73,402 74,614 76,475 +43
Electrical equipment, appliances, and components …………………………………………………………………...………………………………………………………………………………………………46,656 47,097 48,835 +53
Transportation equipment ………………………………………………………………………………...……………………………………………………………………………………………………………265,509 273,631 281,777 +6 +3
Motor vehicles and parts 2
…………………………………………………………………………...…………………………………………………………………………………………………………………176,034 185,461 189,106 +7 +2
Aerospace products and parts 2
……………………………………………………………………...………………………………………………………………………………………………………………………72,604 71,473 74,674 +3 +4
Furniture and related products …………………………………………………………………………...…………………………………………………………………………………………………………………18,019 19,968 18,6333
-7
Miscellaneous manufacturing ……………………………………………………………………...………………………………………………………………………………………………………………………43,128 45,946 46,302 +73
All mining 1………………………………………………………………………………………...………………………………………………………...…………………………………………………………………………………………………………………87,736 99,575 91,558 +4 -8
All wholesale trade 1………………………………………………………………………………………...………………………………………………………...…………………………………………………………………………………………………………………609,134 631,293 652,215 +7 +3
All retail trade 1
………………………………………………………………………...……………………………………………………………………………………………………………………675,573 654,407 697,568 +3 +7
All information 1
………………………………………………………………………...……………………………………………………………………………………………………………………263,497 261,932 279,263 +6 +7
All professional and technical services 1 4
………………………………………………………………………………...……………………………………………………………………………………………………………119,329 119,110 123,436 +3 +4
Table A -- Rates of Change in Sales
For Corporations in NAICS Manufacturing, Mining, Wholesale Trade, Retail Trade, Information, and Professional
and Technical Services (except Legal Services), By Sector, Select Subsectors, and Select Industry Groups
Sales
Rate of change
(million dollars) (percent)
1 Mining, wholesale trade, retail trade, information, and professional and technical services data represent the quarterly results of companies with total assets of $50 million and over at
the time of sample selection. Data for manufacturing corporations represent the quarterly results of companies with total assets of $250 thousand and over at the time of sample selection.
2 Included in subsector above.
3 Sampling variability precludes characterizing change.
4 Except legal services.
xxvU.S. Census Bureau, Quarterly Financial Report, 2014 Quarter 4
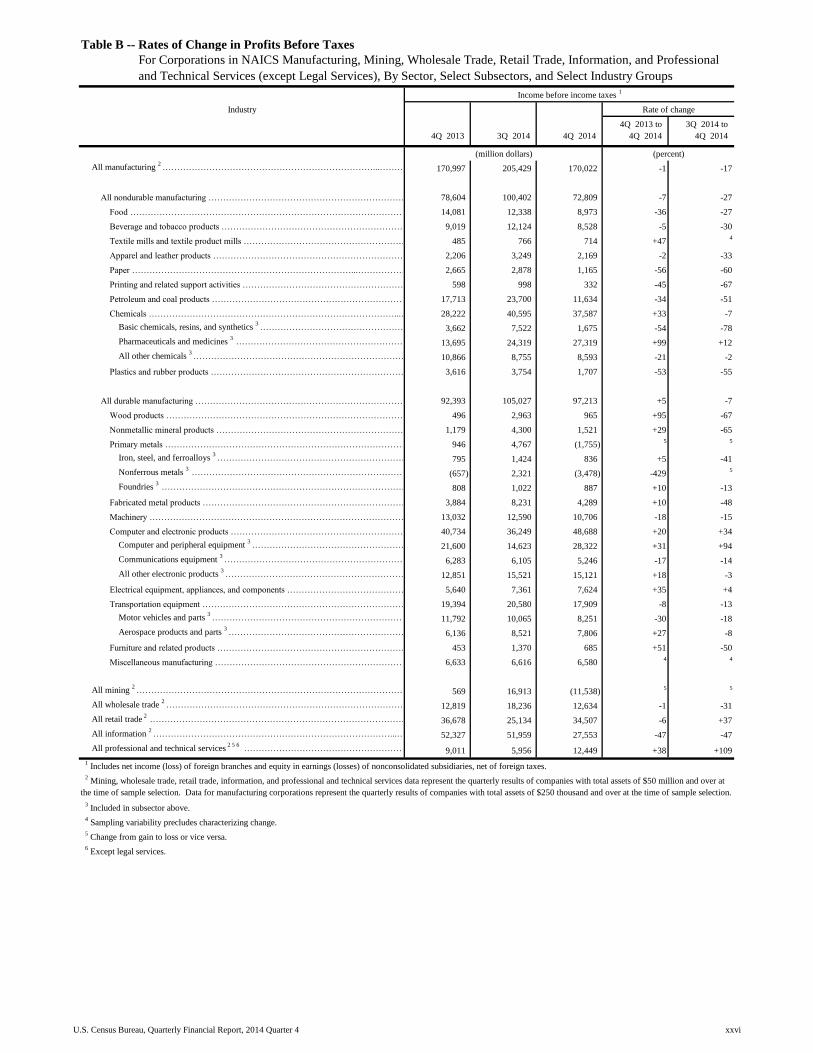
Table with row headers in column A with column headers in rows 4, 5, and 6
Industry
4Q 2013_ 3Q 2014_ 4Q 2014_
4Q 2013 to_
4Q 2014_
3Q 2014 to_
4Q 2014_
All manufacturing 2
………………………………………………………………...……………………………………………………………...………………………………………………………………………170,997 205,429 170,022 -1 -17
All nondurable manufacturing ……………………………………………………………...……………………………………………...……………………………………………………………78,604 100,402 72,809 -7 -27
Food …………………………………………………………………………………………………...…………………………………………………………………………………………………………………………14,081 12,338 8,973 -36 -27
Beverage and tobacco products ………………………………………………………………………...…………………………………………………………………………………9,019 12,124 8,528 -5 -30
Textile mills and textile product mills ……………………………………………………………………...………………………………………………………………………………………………485 766 714 +474
Apparel and leather products ………………………………………………………………………...……………………………………………………………………………………………………2,206 3,249 2,169 -2 -33
Paper …………………………………………………………………...…………………………………………………………………………...………………………………………………………………………………………2,665 2,878 1,165 -56 -60
Printing and related support activities …………………………………………………………………...……………………………………………………………………………………………598 998 332 -45 -67
Petroleum and coal products ……………………………………………………………………...…………………………………………………………………………………………………………17,713 23,700 11,634 -34 -51
Chemicals …………………………………………………………………………...……………………………………………………………………………...…………………………………………………………………………………………28,222 40,595 37,587 +33 -7
Basic chemicals, resins, and synthetics 3
……………………………………………………………………...…………………………………………………………………3,662 7,522 1,675 -54 -78
Pharmaceuticals and medicines 3
…………………………………………………………………...………………………………………………………………………………………………………13,695 24,319 27,319 +99 +12
All other chemicals 3
…………………………………………………………………………………...…………………………………………………………………………………………………………………………10,866 8,755 8,593 -21 -2
Plastics and rubber products ………………………………………………………………………...………………………………………………………………………………………………………………3,616 3,754 1,707 -53 -55
All durable manufacturing ………………………………………………………………………...………………………………………………………………………………………92,393 105,027 97,213 +5 -7
Wood products ………………………………………………………………………………………...……………………………………………………………………………………………………496 2,963 965 +95 -67
Nonmetallic mineral products ………………………………………………………………………...……………………………………………………………………………………………………………………1,179 4,300 1,521 +29 -65
Primary metals ……………………………………………………………………………………………...………………………………………………………………………………………………946 4,767 (1,755)5 5
Iron, steel, and ferroalloys 3
……………………………………………………………………………...………………………………………………………………………………………………………………795 1,424 836 +5 -41
Nonferrous metals 3
…………………………………………………………………………………...…………………………………………………………………………………………………………(657) 2,321 (3,478) -4295
Foundries 3
…………………………………………………………………………………………...…………………………………………………………………………………………………808 1,022 887 +10 -13
Fabricated metal products …………………………………………………………………...…………………………………………………………………………………………………………………………3,884 8,231 4,289 +10 -48
Machinery ……………………………………………………………………………………...………………………………………………………………………………………………………13,032 12,590 10,706 -18 -15
Computer and electronic products ………………………………………………………………………...……………………………………………………………………………………………40,734 36,249 48,688 +20 +34
Computer and peripheral equipment 3
………………………………………………………………………...……………………………………………………………………………………………21,600 14,623 28,322 +31 +94
Communications equipment 3
……………………………………………………………………...………………………………………………………………………………………………………………………6,283 6,105 5,246 -17 -14
All other electronic products 3
…………………………………………………………………………………...…………………………………………………………………………………………………………12,851 15,521 15,121 +18 -3
Electrical equipment, appliances, and components …………………………………………………………………...………………………………………………………………………………………………5,640 7,361 7,624 +35 +4
Transportation equipment ………………………………………………………………………………...……………………………………………………………………………………………………………19,394 20,580 17,909 -8 -13
Motor vehicles and parts 3
…………………………………………………………………………...…………………………………………………………………………………………………………………11,792 10,065 8,251 -30 -18
Aerospace products and parts 3
……………………………………………………………………...………………………………………………………………………………………………………………………6,136 8,521 7,806 +27 -8
Furniture and related products …………………………………………………………………………...…………………………………………………………………………………………………………………453 1,370 685 +51 -50
Miscellaneous manufacturing ……………………………………………………………………...………………………………………………………………………………………………………………………6,633 6,616 6,5804 4
All mining 2
………………………………………………………………………………………...………………………………………………………...…………………………………………………………………………………………………………………569 16,913 (11,538)5 5
All wholesale trade 2
………………………………………………………………………...……………………………………………………………………………………………………………………12,819 18,236 12,634 -1 -31
All retail trade 2
………………………………………………………………………………………...………………………………………………………...…………………………………………………………………………………………………………………36,678 25,134 34,507 -6 +37
All information 2
………………………………………………………………………...……………………………………………………………………………………………………………………52,327 51,959 27,553 -47 -47
All professional and technical services 2 5 6
………………………………………………………………………………...……………………………………………………………………………………………………………9,011 5,956 12,449 +38 +109
1 Includes net income (loss) of foreign branches and equity in earnings (losses) of nonconsolidated subsidiaries, net of foreign taxes.
2 Mining, wholesale trade, retail trade, information, and professional and technical services data represent the quarterly results of companies with total assets of $50 million and over at
the time of sample selection. Data for manufacturing corporations represent the quarterly results of companies with total assets of $250 thousand and over at the time of sample selection.
3 Included in subsector above.
4 Sampling variability precludes characterizing change.
5 Change from gain to loss or vice versa.
6 Except legal services.
Table B -- Rates of Change in Profits Before Taxes
For Corporations in NAICS Manufacturing, Mining, Wholesale Trade, Retail Trade, Information, and Professional
and Technical Services (except Legal Services), By Sector, Select Subsectors, and Select Industry Groups
Income before income taxes 1
Rate of change
(million dollars) (percent)
xxviU.S. Census Bureau, Quarterly Financial Report, 2014 Quarter 4

Table with row headers in column A with column headers in rows 4, 5, and 6
Industry
4Q 2013_ 3Q 2014_ 4Q 2014_
4Q 2013 to_
4Q 2014_
3Q 2014 to_
4Q 2014_
All manufacturing 2
………………………………………………………………...……………………………………………………………...………………………………………………………………………146,682 167,685 142,557 -3 -15
All nondurable manufacturing ……………………………………………………………...……………………………………………...……………………………………………………………70,761 81,526 62,828 -11 -23
Food …………………………………………………………………………………………………...…………………………………………………………………………………………………………………………12,166 9,575 6,793 -44 -29
Beverage and tobacco products ………………………………………………………………………...…………………………………………………………………………………7,670 9,549 6,413 -16 -33
Textile mills and textile product mills ……………………………………………………………………...………………………………………………………………………………………………457 693 638 +394
Apparel and leather products ………………………………………………………………………...……………………………………………………………………………………………………1,697 2,542 1,760 +4 -31
Paper …………………………………………………………………...…………………………………………………………………………...………………………………………………………………………………………3,183 2,312 945 -70 -59
Printing and related support activities …………………………………………………………………...……………………………………………………………………………………………577 907 423 -27 -53
Petroleum and coal products ……………………………………………………………………...…………………………………………………………………………………………………………18,458 21,073 13,018 -29 -38
Chemicals …………………………………………………………………………...……………………………………………………………………………...…………………………………………………………………………………………23,745 31,860 28,835 +21 -9
Basic chemicals, resins, and synthetics 3
……………………………………………………………………...…………………………………………………………………2,331 5,735 1,480 -37 -74
Pharmaceuticals and medicines 3
…………………………………………………………………...………………………………………………………………………………………………………13,021 19,413 20,971 +61 +8
All other chemicals 3
…………………………………………………………………………………...…………………………………………………………………………………………………………………………8,393 6,712 6,383 -24 -5
Plastics and rubber products ………………………………………………………………………...………………………………………………………………………………………………………………2,809 3,015 4,004 +43 +33
All durable manufacturing ………………………………………………………………………...………………………………………………………………………………………75,921 86,158 79,730 +5 -7
Wood products ………………………………………………………………………………………...……………………………………………………………………………………………………454 2,673 707 +56 -74
Nonmetallic mineral products ………………………………………………………………………...……………………………………………………………………………………………………………………1,085 3,652 1,0874
-70
Primary metals ……………………………………………………………………………………………...………………………………………………………………………………………………306 3,815 (1,057)5 5
Iron, steel, and ferroalloys 3
……………………………………………………………………………...………………………………………………………………………………………………………………634 1,121 648 +2 -42
Nonferrous metals 3
…………………………………………………………………………………...…………………………………………………………………………………………………………(930) 1,922 (2,347) -1525
Foundries 3
…………………………………………………………………………………………...…………………………………………………………………………………………………602 772 642 +7 -17
Fabricated metal products …………………………………………………………………...…………………………………………………………………………………………………………………………2,659 7,182 3,373 +27 -53
Machinery ……………………………………………………………………………………...………………………………………………………………………………………………………11,042 9,862 8,551 -23 -13
Computer and electronic products ………………………………………………………………………...……………………………………………………………………………………………32,244 29,150 39,140 +21 +34
Computer and peripheral equipment 3
………………………………………………………………………...……………………………………………………………………………………………16,861 10,803 21,083 +25 +95
Communications equipment 3
……………………………………………………………………...………………………………………………………………………………………………………………………4,919 5,233 4,688 -5 -10
All other electronic products 3
…………………………………………………………………………………...…………………………………………………………………………………………………………10,465 13,115 13,368 +28 +2
Electrical equipment, appliances, and components …………………………………………………………………...………………………………………………………………………………………………5,290 6,285 6,993 +32 +11
Transportation equipment ………………………………………………………………………………...……………………………………………………………………………………………………………17,112 16,216 14,947 -13 -8
Motor vehicles and parts 3
…………………………………………………………………………...…………………………………………………………………………………………………………………11,404 8,392 7,516 -34 -10
Aerospace products and parts 3
……………………………………………………………………...………………………………………………………………………………………………………………………4,725 6,395 6,101 +29 -5
Furniture and related products …………………………………………………………………………...…………………………………………………………………………………………………………………372 1,609 531 +43 -67
Miscellaneous manufacturing ……………………………………………………………………...………………………………………………………………………………………………………………………5,358 5,714 5,460 +24
All mining 2
………………………………………………………………………………………...………………………………………………………...…………………………………………………………………………………………………………………345 10,408 (12,710)5 5
All wholesale trade 2
………………………………………………………………………...……………………………………………………………………………………………………………………9,489 13,989 7,809 -18 -44
All retail trade 2
………………………………………………………………………………………...………………………………………………………...…………………………………………………………………………………………………………………25,544 16,338 23,751 -7 +45
All information 2
………………………………………………………………………...……………………………………………………………………………………………………………………37,025 38,314 23,706 -36 -38
All professional and technical services 2 5 6
………………………………………………………………………………...……………………………………………………………………………………………………………7,826 3,330 10,467 +34 +214
1 Includes net income (loss) of foreign branches and equity in earnings (losses) of nonconsolidated subsidiaries, net of foreign taxes.
2 Mining, wholesale trade, retail trade, information, and professional and technical services data represent the quarterly results of companies with total assets of $50 million and over at
the time of sample selection. Data for manufacturing corporations represent the quarterly results of companies with total assets of $250 thousand and over at the time of sample selection.
3 Included in subsector above.
4 Sampling variability precludes characterizing change.
5 Change from gain to loss or vice versa.
6 Except legal services.
Table C -- Rates of Change in Profits After Taxes
For Corporations in NAICS Manufacturing, Mining, Wholesale Trade, Retail Trade, Information, and Professional
and Technical Services (except Legal Services), By Sector, Select Subsectors, and Select Industry Groups
Income after income taxes 1
Rate of change
(million dollars) (percent)
xxviiU.S. Census Bureau, Quarterly Financial Report, 2014 Quarter 4
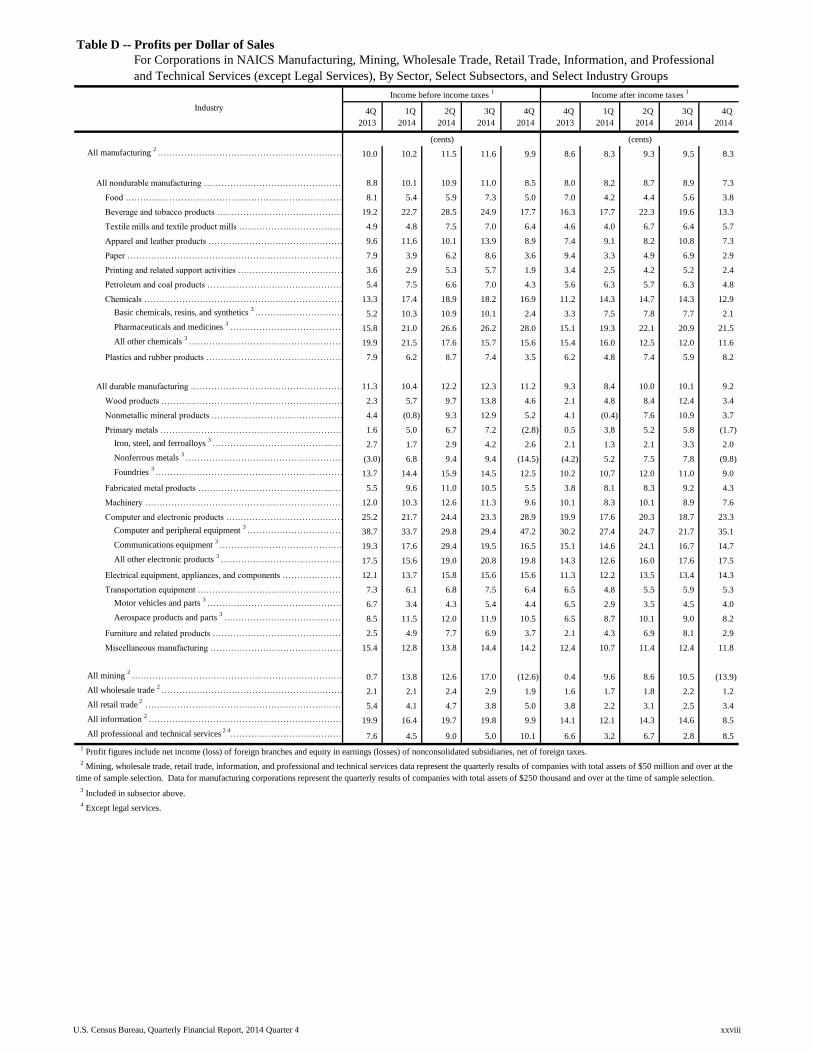
Table with row headers in column A with column headers in rows 4 and 5
Industry 4Q_
2013_
1Q_
2014_
2Q_
2014_
3Q_
2014_
4Q_
2014_
4Q_
2013_
1Q_
2014_
2Q_
2014_
3Q_
2014_
4Q_
2014_
All manufacturing 2
………………………………………………………………...……………………………………………………………...………………………………………………………………………10.0 10.2 11.5 11.6 9.9 8.6 8.3 9.3 9.5 8.3
All nondurable manufacturing ……………………………………………………………...……………………………………………...……………………………………………………………8.8 10.1 10.9 11.0 8.5 8.0 8.2 8.7 8.9 7.3
Food …………………………………………………………………………………………………...…………………………………………………………………………………………………………………………8.1 5.4 5.9 7.3 5.0 7.0 4.2 4.4 5.6 3.8
Beverage and tobacco products ………………………………………………………………………...…………………………………………………………………………………19.2 22.7 28.5 24.9 17.7 16.3 17.7 22.3 19.6 13.3
Textile mills and textile product mills ……………………………………………………………………...………………………………………………………………………………………………4.9 4.8 7.5 7.0 6.4 4.6 4.0 6.7 6.4 5.7
Apparel and leather products ………………………………………………………………………...……………………………………………………………………………………………………9.6 11.6 10.1 13.9 8.9 7.4 9.1 8.2 10.8 7.3
Paper …………………………………………………………………...…………………………………………………………………………...………………………………………………………………………………………7.9 3.9 6.2 8.6 3.6 9.4 3.3 4.9 6.9 2.9
Printing and related support activities …………………………………………………………………...……………………………………………………………………………………………3.6 2.9 5.3 5.7 1.9 3.4 2.5 4.2 5.2 2.4
Petroleum and coal products ……………………………………………………………………...…………………………………………………………………………………………………………5.4 7.5 6.6 7.0 4.3 5.6 6.3 5.7 6.3 4.8
Chemicals …………………………………………………………………………...……………………………………………………………………………...…………………………………………………………………………………………13.3 17.4 18.9 18.2 16.9 11.2 14.3 14.7 14.3 12.9
Basic chemicals, resins, and synthetics 3
……………………………………………………………………...…………………………………………………………………5.2 10.3 10.9 10.1 2.4 3.3 7.5 7.8 7.7 2.1
Pharmaceuticals and medicines 3
…………………………………………………………………...………………………………………………………………………………………………………15.8 21.0 26.6 26.2 28.0 15.1 19.3 22.1 20.9 21.5
All other chemicals 3
…………………………………………………………………………………...…………………………………………………………………………………………………………………………19.9 21.5 17.6 15.7 15.6 15.4 16.0 12.5 12.0 11.6
Plastics and rubber products ………………………………………………………………………...………………………………………………………………………………………………………………7.9 6.2 8.7 7.4 3.5 6.2 4.8 7.4 5.9 8.2
All durable manufacturing ………………………………………………………………………...………………………………………………………………………………………11.3 10.4 12.2 12.3 11.2 9.3 8.4 10.0 10.1 9.2
Wood products ………………………………………………………………………………………...……………………………………………………………………………………………………2.3 5.7 9.7 13.8 4.6 2.1 4.8 8.4 12.4 3.4
Nonmetallic mineral products ………………………………………………………………………...……………………………………………………………………………………………………………………4.4 (0.8) 9.3 12.9 5.2 4.1 (0.4) 7.6 10.9 3.7
Primary metals ……………………………………………………………………………………………...………………………………………………………………………………………………1.6 5.0 6.7 7.2 (2.8) 0.5 3.8 5.2 5.8 (1.7)
Iron, steel, and ferroalloys 3
……………………………………………………………………………...………………………………………………………………………………………………………………2.7 1.7 2.9 4.2 2.6 2.1 1.3 2.1 3.3 2.0
Nonferrous metals 3
…………………………………………………………………………………...…………………………………………………………………………………………………………(3.0) 6.8 9.4 9.4 (14.5) (4.2) 5.2 7.5 7.8 (9.8)
Foundries 3
…………………………………………………………………………………………...…………………………………………………………………………………………………13.7 14.4 15.9 14.5 12.5 10.2 10.7 12.0 11.0 9.0
Fabricated metal products …………………………………………………………………...…………………………………………………………………………………………………………………………5.5 9.6 11.0 10.5 5.5 3.8 8.1 8.3 9.2 4.3
Machinery ……………………………………………………………………………………...………………………………………………………………………………………………………12.0 10.3 12.6 11.3 9.6 10.1 8.3 10.1 8.9 7.6
Computer and electronic products ………………………………………………………………………...……………………………………………………………………………………………25.2 21.7 24.4 23.3 28.9 19.9 17.6 20.3 18.7 23.3
Computer and peripheral equipment 3
………………………………………………………………………...……………………………………………………………………………………………38.7 33.7 29.8 29.4 47.2 30.2 27.4 24.7 21.7 35.1
Communications equipment 3
……………………………………………………………………...………………………………………………………………………………………………………………………19.3 17.6 29.4 19.5 16.5 15.1 14.6 24.1 16.7 14.7
All other electronic products 3
…………………………………………………………………………………...…………………………………………………………………………………………………………17.5 15.6 19.0 20.8 19.8 14.3 12.6 16.0 17.6 17.5
Electrical equipment, appliances, and components …………………………………………………………………...………………………………………………………………………………………………12.1 13.7 15.8 15.6 15.6 11.3 12.2 13.5 13.4 14.3
Transportation equipment ………………………………………………………………………………...……………………………………………………………………………………………………………7.3 6.1 6.8 7.5 6.4 6.5 4.8 5.5 5.9 5.3
Motor vehicles and parts 3
…………………………………………………………………………...…………………………………………………………………………………………………………………6.7 3.4 4.3 5.4 4.4 6.5 2.9 3.5 4.5 4.0
Aerospace products and parts 3
……………………………………………………………………...………………………………………………………………………………………………………………………8.5 11.5 12.0 11.9 10.5 6.5 8.7 10.1 9.0 8.2
Furniture and related products …………………………………………………………………………...…………………………………………………………………………………………………………………2.5 4.9 7.7 6.9 3.7 2.1 4.3 6.9 8.1 2.9
Miscellaneous manufacturing ……………………………………………………………………...………………………………………………………………………………………………………………………15.4 12.8 13.8 14.4 14.2 12.4 10.7 11.4 12.4 11.8
All mining 2
………………………………………………………………………………………...………………………………………………………...…………………………………………………………………………………………………………………0.7 13.8 12.6 17.0 (12.6) 0.4 9.6 8.6 10.5 (13.9)
All wholesale trade 2
………………………………………………………………………...……………………………………………………………………………………………………………………2.1 2.1 2.4 2.9 1.9 1.6 1.7 1.8 2.2 1.2
All retail trade 2
………………………………………………………………………………………...………………………………………………………...…………………………………………………………………………………………………………………5.4 4.1 4.7 3.8 5.0 3.8 2.2 3.1 2.5 3.4
All information 2
………………………………………………………………………...……………………………………………………………………………………………………………………19.9 16.4 19.7 19.8 9.9 14.1 12.1 14.3 14.6 8.5
All professional and technical services 2 4
………………………………………………………………………………...……………………………………………………………………………………………………………7.6 4.5 9.0 5.0 10.1 6.6 3.2 6.7 2.8 8.5
Table D -- Profits per Dollar of Sales
For Corporations in NAICS Manufacturing, Mining, Wholesale Trade, Retail Trade, Information, and Professional
and Technical Services (except Legal Services), By Sector, Select Subsectors, and Select Industry Groups
Income before income taxes 1
Income after income taxes 1
(cents) (cents)
1 Profit figures include net income (loss) of foreign branches and equity in earnings (losses) of nonconsolidated subsidiaries, net of foreign taxes.
2 Mining, wholesale trade, retail trade, information, and professional and technical services data represent the quarterly results of companies with total assets of $50 million and over at the
time of sample selection. Data for manufacturing corporations represent the quarterly results of companies with total assets of $250 thousand and over at the time of sample selection.
3 Included in subsector above.
4 Except legal services.
xxviiiU.S. Census Bureau, Quarterly Financial Report, 2014 Quarter 4
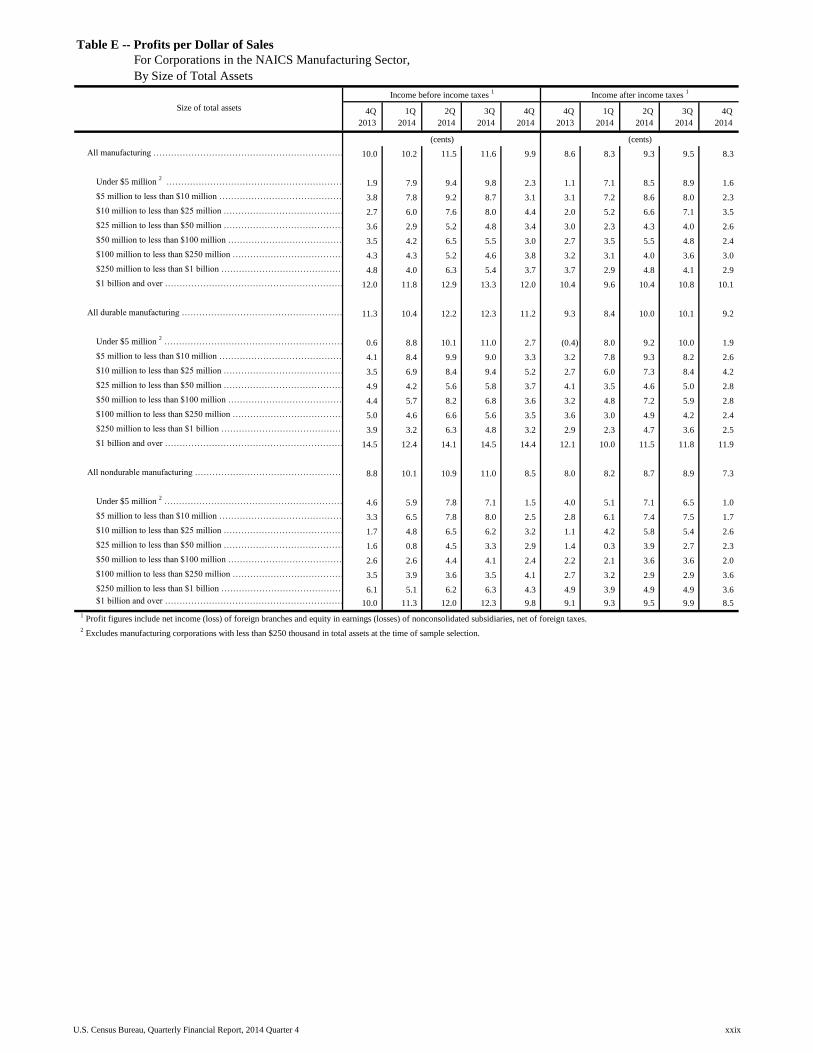
Table with row headers in column A with column headers in rows 4 and 5
Size of total assets 4Q_
2013_
1Q_
2014_
2Q_
2014_
3Q_
2014_
4Q_
2014_
4Q_
2013_
1Q_
2014_
2Q_
2014_
3Q_
2014_
4Q_
2014_
All manufacturing ………………………………………………………………………………………………...……………………………………………………………………………………………………………………10.0 10.2 11.5 11.6 9.9 8.6 8.3 9.3 9.5 8.3
Under $5 million 2 ………………………………………………………………………………………………...………………………………………………………………………………………………………………………1.9 7.9 9.4 9.8 2.3 1.1 7.1 8.5 8.9 1.6
$5 million to less than $10 million ………………………………………………………………………………………………...………………………………………………………………………………………………………………………3.8 7.8 9.2 8.7 3.1 3.1 7.2 8.6 8.0 2.3
$10 million to less than $25 million ………………………………………………………………………………………………...………………………………………………………………………………………………………………………2.7 6.0 7.6 8.0 4.4 2.0 5.2 6.6 7.1 3.5
$25 million to less than $50 million ………………………………………………………………………………………………...………………………………………………………………………………………………………………………3.6 2.9 5.2 4.8 3.4 3.0 2.3 4.3 4.0 2.6
$50 million to less than $100 million ………………………………………………………………………………………………...………………………………………………………………………………………………………………………3.5 4.2 6.5 5.5 3.0 2.7 3.5 5.5 4.8 2.4
$100 million to less than $250 million ………………………………………………………………………………………………...………………………………………………………………………………………………………………………4.3 4.3 5.2 4.6 3.8 3.2 3.1 4.0 3.6 3.0
$250 million to less than $1 billion ………………………………………………………………………………………………...………………………………………………………………………………………………………………………4.8 4.0 6.3 5.4 3.7 3.7 2.9 4.8 4.1 2.9
$1 billion and over ………………………………………………………………………………………………...………………………………………………………………………………………………………………………12.0 11.8 12.9 13.3 12.0 10.4 9.6 10.4 10.8 10.1
All durable manufacturing ………………………………………………………………………………………………...……………………………………………………………………………………………………………………11.3 10.4 12.2 12.3 11.2 9.3 8.4 10.0 10.1 9.2
Under $5 million 2 ………………………………………………………………………………………………...………………………………………………………………………………………………………………………0.6 8.8 10.1 11.0 2.7 (0.4) 8.0 9.2 10.0 1.9
$5 million to less than $10 million ………………………………………………………………………………………………...………………………………………………………………………………………………………………………4.1 8.4 9.9 9.0 3.3 3.2 7.8 9.3 8.2 2.6
$10 million to less than $25 million ………………………………………………………………………………………………...………………………………………………………………………………………………………………………3.5 6.9 8.4 9.4 5.2 2.7 6.0 7.3 8.4 4.2
$25 million to less than $50 million ………………………………………………………………………………………………...………………………………………………………………………………………………………………………4.9 4.2 5.6 5.8 3.7 4.1 3.5 4.6 5.0 2.8
$50 million to less than $100 million ………………………………………………………………………………………………...………………………………………………………………………………………………………………………4.4 5.7 8.2 6.8 3.6 3.2 4.8 7.2 5.9 2.8
$100 million to less than $250 million ………………………………………………………………………………………………...………………………………………………………………………………………………………………………5.0 4.6 6.6 5.6 3.5 3.6 3.0 4.9 4.2 2.4
$250 million to less than $1 billion ………………………………………………………………………………………………...………………………………………………………………………………………………………………………3.9 3.2 6.3 4.8 3.2 2.9 2.3 4.7 3.6 2.5
$1 billion and over ………………………………………………………………………………………………...………………………………………………………………………………………………………………………14.5 12.4 14.1 14.5 14.4 12.1 10.0 11.5 11.8 11.9
All nondurable manufacturing ………………………………………………………………………………………………...……………………………………………………………………………………………………………………8.8 10.1 10.9 11.0 8.5 8.0 8.2 8.7 8.9 7.3
Under $5 million 2 ………………………………………………………………………………………………...………………………………………………………………………………………………………………………4.6 5.9 7.8 7.1 1.5 4.0 5.1 7.1 6.5 1.0
$5 million to less than $10 million ………………………………………………………………………………………………...………………………………………………………………………………………………………………………3.3 6.5 7.8 8.0 2.5 2.8 6.1 7.4 7.5 1.7
$10 million to less than $25 million ………………………………………………………………………………………………...………………………………………………………………………………………………………………………1.7 4.8 6.5 6.2 3.2 1.1 4.2 5.8 5.4 2.6
$25 million to less than $50 million ………………………………………………………………………………………………...………………………………………………………………………………………………………………………1.6 0.8 4.5 3.3 2.9 1.4 0.3 3.9 2.7 2.3
$50 million to less than $100 million ………………………………………………………………………………………………...………………………………………………………………………………………………………………………2.6 2.6 4.4 4.1 2.4 2.2 2.1 3.6 3.6 2.0
$100 million to less than $250 million ………………………………………………………………………………………………...………………………………………………………………………………………………………………………3.5 3.9 3.6 3.5 4.1 2.7 3.2 2.9 2.9 3.6
$250 million to less than $1 billion ………………………………………………………………………………………………...………………………………………………………………………………………………………………………6.1 5.1 6.2 6.3 4.3 4.9 3.9 4.9 4.9 3.6
$1 billion and over ………………………………………………………………………………………………...………………………………………………………………………………………………………………………10.0 11.3 12.0 12.3 9.8 9.1 9.3 9.5 9.9 8.5
1 Profit figures include net income (loss) of foreign branches and equity in earnings (losses) of nonconsolidated subsidiaries, net of foreign taxes.
2 Excludes manufacturing corporations with less than $250 thousand in total assets at the time of sample selection.
Table E -- Profits per Dollar of Sales
For Corporations in the NAICS Manufacturing Sector,
By Size of Total Assets
Income before income taxes 1
Income after income taxes 1
(cents) (cents)
xxixU.S. Census Bureau, Quarterly Financial Report, 2014 Quarter 4
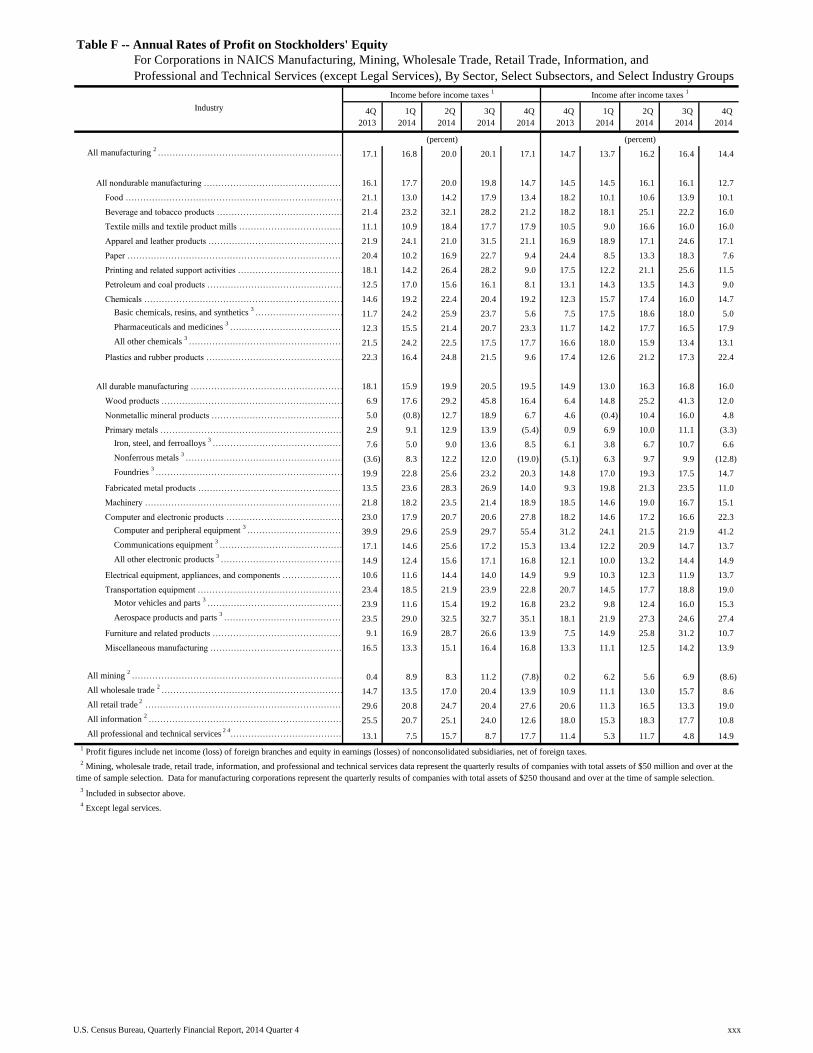
Table with row headers in column A with column headers in rows 4 and 5
Industry 4Q_
2013_
1Q_
2014_
2Q_
2014_
3Q_
2014_
4Q_
2014_
4Q_
2013_
1Q_
2014_
2Q_
2014_
3Q_
2014_
4Q_
2014_
All manufacturing 2
………………………………………………………………...……………………………………………………………...………………………………………………………………………17.1 16.8 20.0 20.1 17.1 14.7 13.7 16.2 16.4 14.4
All nondurable manufacturing ……………………………………………………………...……………………………………………...……………………………………………………………16.1 17.7 20.0 19.8 14.7 14.5 14.5 16.1 16.1 12.7
Food …………………………………………………………………………………………………...…………………………………………………………………………………………………………………………21.1 13.0 14.2 17.9 13.4 18.2 10.1 10.6 13.9 10.1
Beverage and tobacco products ………………………………………………………………………...…………………………………………………………………………………21.4 23.2 32.1 28.2 21.2 18.2 18.1 25.1 22.2 16.0
Textile mills and textile product mills ……………………………………………………………………...………………………………………………………………………………………………11.1 10.9 18.4 17.7 17.9 10.5 9.0 16.6 16.0 16.0
Apparel and leather products ………………………………………………………………………...……………………………………………………………………………………………………21.9 24.1 21.0 31.5 21.1 16.9 18.9 17.1 24.6 17.1
Paper …………………………………………………………………...…………………………………………………………………………...………………………………………………………………………………………20.4 10.2 16.9 22.7 9.4 24.4 8.5 13.3 18.3 7.6
Printing and related support activities …………………………………………………………………...……………………………………………………………………………………………18.1 14.2 26.4 28.2 9.0 17.5 12.2 21.1 25.6 11.5
Petroleum and coal products ……………………………………………………………………...…………………………………………………………………………………………………………12.5 17.0 15.6 16.1 8.1 13.1 14.3 13.5 14.3 9.0
Chemicals …………………………………………………………………………...……………………………………………………………………………...…………………………………………………………………………………………14.6 19.2 22.4 20.4 19.2 12.3 15.7 17.4 16.0 14.7
Basic chemicals, resins, and synthetics 3
……………………………………………………………………...…………………………………………………………………11.7 24.2 25.9 23.7 5.6 7.5 17.5 18.6 18.0 5.0
Pharmaceuticals and medicines 3
…………………………………………………………………...………………………………………………………………………………………………………12.3 15.5 21.4 20.7 23.3 11.7 14.2 17.7 16.5 17.9
All other chemicals 3
…………………………………………………………………………………...…………………………………………………………………………………………………………………………21.5 24.2 22.5 17.5 17.7 16.6 18.0 15.9 13.4 13.1
Plastics and rubber products ………………………………………………………………………...………………………………………………………………………………………………………………22.3 16.4 24.8 21.5 9.6 17.4 12.6 21.2 17.3 22.4
All durable manufacturing ………………………………………………………………………...………………………………………………………………………………………18.1 15.9 19.9 20.5 19.5 14.9 13.0 16.3 16.8 16.0
Wood products ………………………………………………………………………………………...……………………………………………………………………………………………………6.9 17.6 29.2 45.8 16.4 6.4 14.8 25.2 41.3 12.0
Nonmetallic mineral products ………………………………………………………………………...……………………………………………………………………………………………………………………5.0 (0.8) 12.7 18.9 6.7 4.6 (0.4) 10.4 16.0 4.8
Primary metals ……………………………………………………………………………………………...………………………………………………………………………………………………2.9 9.1 12.9 13.9 (5.4) 0.9 6.9 10.0 11.1 (3.3)
Iron, steel, and ferroalloys 3
……………………………………………………………………………...………………………………………………………………………………………………………………7.6 5.0 9.0 13.6 8.5 6.1 3.8 6.7 10.7 6.6
Nonferrous metals 3
…………………………………………………………………………………...…………………………………………………………………………………………………………(3.6) 8.3 12.2 12.0 (19.0) (5.1) 6.3 9.7 9.9 (12.8)
Foundries 3
…………………………………………………………………………………………...…………………………………………………………………………………………………19.9 22.8 25.6 23.2 20.3 14.8 17.0 19.3 17.5 14.7
Fabricated metal products …………………………………………………………………...…………………………………………………………………………………………………………………………13.5 23.6 28.3 26.9 14.0 9.3 19.8 21.3 23.5 11.0
Machinery ……………………………………………………………………………………...………………………………………………………………………………………………………21.8 18.2 23.5 21.4 18.9 18.5 14.6 19.0 16.7 15.1
Computer and electronic products ………………………………………………………………………...……………………………………………………………………………………………23.0 17.9 20.7 20.6 27.8 18.2 14.6 17.2 16.6 22.3
Computer and peripheral equipment 3
………………………………………………………………………...……………………………………………………………………………………………39.9 29.6 25.9 29.7 55.4 31.2 24.1 21.5 21.9 41.2
Communications equipment 3
……………………………………………………………………...………………………………………………………………………………………………………………………17.1 14.6 25.6 17.2 15.3 13.4 12.2 20.9 14.7 13.7
All other electronic products 3
…………………………………………………………………………………...…………………………………………………………………………………………………………14.9 12.4 15.6 17.1 16.8 12.1 10.0 13.2 14.4 14.9
Electrical equipment, appliances, and components …………………………………………………………………...………………………………………………………………………………………………10.6 11.6 14.4 14.0 14.9 9.9 10.3 12.3 11.9 13.7
Transportation equipment ………………………………………………………………………………...……………………………………………………………………………………………………………23.4 18.5 21.9 23.9 22.8 20.7 14.5 17.7 18.8 19.0
Motor vehicles and parts 3
…………………………………………………………………………...…………………………………………………………………………………………………………………23.9 11.6 15.4 19.2 16.8 23.2 9.8 12.4 16.0 15.3
Aerospace products and parts 3
……………………………………………………………………...………………………………………………………………………………………………………………………23.5 29.0 32.5 32.7 35.1 18.1 21.9 27.3 24.6 27.4
Furniture and related products …………………………………………………………………………...…………………………………………………………………………………………………………………9.1 16.9 28.7 26.6 13.9 7.5 14.9 25.8 31.2 10.7
Miscellaneous manufacturing ……………………………………………………………………...………………………………………………………………………………………………………………………16.5 13.3 15.1 16.4 16.8 13.3 11.1 12.5 14.2 13.9
All mining 2
………………………………………………………………………………………...………………………………………………………...…………………………………………………………………………………………………………………0.4 8.9 8.3 11.2 (7.8) 0.2 6.2 5.6 6.9 (8.6)
All wholesale trade 2
………………………………………………………………………...……………………………………………………………………………………………………………………14.7 13.5 17.0 20.4 13.9 10.9 11.1 13.0 15.7 8.6
All retail trade 2
………………………………………………………………………………………...………………………………………………………...…………………………………………………………………………………………………………………29.6 20.8 24.7 20.4 27.6 20.6 11.3 16.5 13.3 19.0
All information 2
………………………………………………………………………...……………………………………………………………………………………………………………………25.5 20.7 25.1 24.0 12.6 18.0 15.3 18.3 17.7 10.8
All professional and technical services 2 4
………………………………………………………………………………...……………………………………………………………………………………………………………13.1 7.5 15.7 8.7 17.7 11.4 5.3 11.7 4.8 14.9
Table F -- Annual Rates of Profit on Stockholders' Equity
For Corporations in NAICS Manufacturing, Mining, Wholesale Trade, Retail Trade, Information, and
Professional and Technical Services (except Legal Services), By Sector, Select Subsectors, and Select Industry Groups
Income before income taxes 1
Income after income taxes 1
(percent) (percent)
1 Profit figures include net income (loss) of foreign branches and equity in earnings (losses) of nonconsolidated subsidiaries, net of foreign taxes.
2 Mining, wholesale trade, retail trade, information, and professional and technical services data represent the quarterly results of companies with total assets of $50 million and over at the
time of sample selection. Data for manufacturing corporations represent the quarterly results of companies with total assets of $250 thousand and over at the time of sample selection.
3 Included in subsector above.
4 Except legal services.
xxxU.S. Census Bureau, Quarterly Financial Report, 2014 Quarter 4
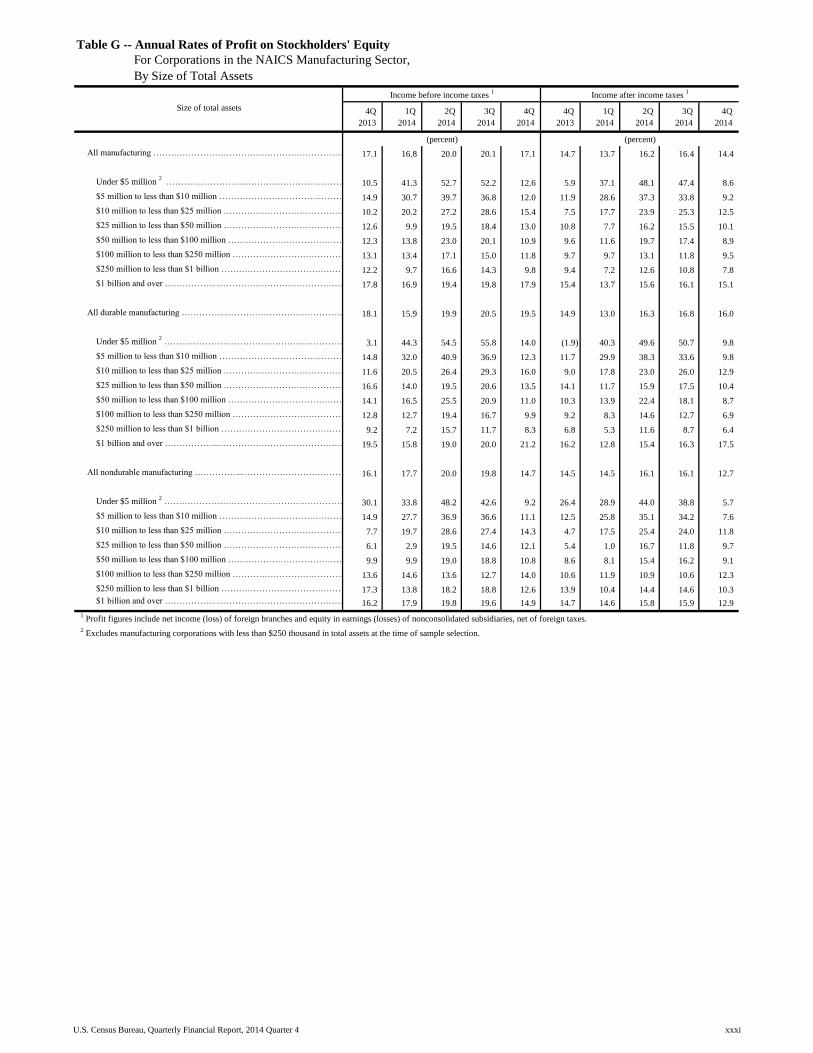
Table with row headers in column A with column headers in rows 4 and 5
Size of total assets 4Q_
2013_
1Q_
2014_
2Q_
2014_
3Q_
2014_
4Q_
2014_
4Q_
2013_
1Q_
2014_
2Q_
2014_
3Q_
2014_
4Q_
2014_
All manufacturing ………………………………………………………………………………………………...……………………………………………………………………………………………………………………17.1 16.8 20.0 20.1 17.1 14.7 13.7 16.2 16.4 14.4
Under $5 million 2 ………………………………………………………………………………………………...………………………………………………………………………………………………………………………10.5 41.3 52.7 52.2 12.6 5.9 37.1 48.1 47.4 8.6
$5 million to less than $10 million ………………………………………………………………………………………………...………………………………………………………………………………………………………………………14.9 30.7 39.7 36.8 12.0 11.9 28.6 37.3 33.8 9.2
$10 million to less than $25 million ………………………………………………………………………………………………...………………………………………………………………………………………………………………………10.2 20.2 27.2 28.6 15.4 7.5 17.7 23.9 25.3 12.5
$25 million to less than $50 million ………………………………………………………………………………………………...………………………………………………………………………………………………………………………12.6 9.9 19.5 18.4 13.0 10.8 7.7 16.2 15.5 10.1
$50 million to less than $100 million ………………………………………………………………………………………………...………………………………………………………………………………………………………………………12.3 13.8 23.0 20.1 10.9 9.6 11.6 19.7 17.4 8.9
$100 million to less than $250 million ………………………………………………………………………………………………...………………………………………………………………………………………………………………………13.1 13.4 17.1 15.0 11.8 9.7 9.7 13.1 11.8 9.5
$250 million to less than $1 billion ………………………………………………………………………………………………...………………………………………………………………………………………………………………………12.2 9.7 16.6 14.3 9.8 9.4 7.2 12.6 10.8 7.8
$1 billion and over ………………………………………………………………………………………………...………………………………………………………………………………………………………………………17.8 16.9 19.4 19.8 17.9 15.4 13.7 15.6 16.1 15.1
All durable manufacturing ………………………………………………………………………………………………...……………………………………………………………………………………………………………………18.1 15.9 19.9 20.5 19.5 14.9 13.0 16.3 16.8 16.0
Under $5 million 2 ………………………………………………………………………………………………...………………………………………………………………………………………………………………………3.1 44.3 54.5 55.8 14.0 (1.9) 40.3 49.6 50.7 9.8
$5 million to less than $10 million ………………………………………………………………………………………………...………………………………………………………………………………………………………………………14.8 32.0 40.9 36.9 12.3 11.7 29.9 38.3 33.6 9.8
$10 million to less than $25 million ………………………………………………………………………………………………...………………………………………………………………………………………………………………………11.6 20.5 26.4 29.3 16.0 9.0 17.8 23.0 26.0 12.9
$25 million to less than $50 million ………………………………………………………………………………………………...………………………………………………………………………………………………………………………16.6 14.0 19.5 20.6 13.5 14.1 11.7 15.9 17.5 10.4
$50 million to less than $100 million ………………………………………………………………………………………………...………………………………………………………………………………………………………………………14.1 16.5 25.5 20.9 11.0 10.3 13.9 22.4 18.1 8.7
$100 million to less than $250 million ………………………………………………………………………………………………...………………………………………………………………………………………………………………………12.8 12.7 19.4 16.7 9.9 9.2 8.3 14.6 12.7 6.9
$250 million to less than $1 billion ………………………………………………………………………………………………...………………………………………………………………………………………………………………………9.2 7.2 15.7 11.7 8.3 6.8 5.3 11.6 8.7 6.4
$1 billion and over ………………………………………………………………………………………………...………………………………………………………………………………………………………………………19.5 15.8 19.0 20.0 21.2 16.2 12.8 15.4 16.3 17.5
All nondurable manufacturing ………………………………………………………………………………………………...……………………………………………………………………………………………………………………16.1 17.7 20.0 19.8 14.7 14.5 14.5 16.1 16.1 12.7
Under $5 million 2 ………………………………………………………………………………………………...………………………………………………………………………………………………………………………30.1 33.8 48.2 42.6 9.2 26.4 28.9 44.0 38.8 5.7
$5 million to less than $10 million ………………………………………………………………………………………………...………………………………………………………………………………………………………………………14.9 27.7 36.9 36.6 11.1 12.5 25.8 35.1 34.2 7.6
$10 million to less than $25 million ………………………………………………………………………………………………...………………………………………………………………………………………………………………………7.7 19.7 28.6 27.4 14.3 4.7 17.5 25.4 24.0 11.8
$25 million to less than $50 million ………………………………………………………………………………………………...………………………………………………………………………………………………………………………6.1 2.9 19.5 14.6 12.1 5.4 1.0 16.7 11.8 9.7
$50 million to less than $100 million ………………………………………………………………………………………………...………………………………………………………………………………………………………………………9.9 9.9 19.0 18.8 10.8 8.6 8.1 15.4 16.2 9.1
$100 million to less than $250 million ………………………………………………………………………………………………...………………………………………………………………………………………………………………………13.6 14.6 13.6 12.7 14.0 10.6 11.9 10.9 10.6 12.3
$250 million to less than $1 billion ………………………………………………………………………………………………...………………………………………………………………………………………………………………………17.3 13.8 18.2 18.8 12.6 13.9 10.4 14.4 14.6 10.3
$1 billion and over ………………………………………………………………………………………………...………………………………………………………………………………………………………………………16.2 17.9 19.8 19.6 14.9 14.7 14.6 15.8 15.9 12.9
1 Profit figures include net income (loss) of foreign branches and equity in earnings (losses) of nonconsolidated subsidiaries, net of foreign taxes.
2 Excludes manufacturing corporations with less than $250 thousand in total assets at the time of sample selection.
Table G -- Annual Rates of Profit on Stockholders' Equity
For Corporations in the NAICS Manufacturing Sector,
By Size of Total Assets
Income before income taxes 1
Income after income taxes 1
(percent) (percent)
xxxiU.S. Census Bureau, Quarterly Financial Report, 2014 Quarter 4
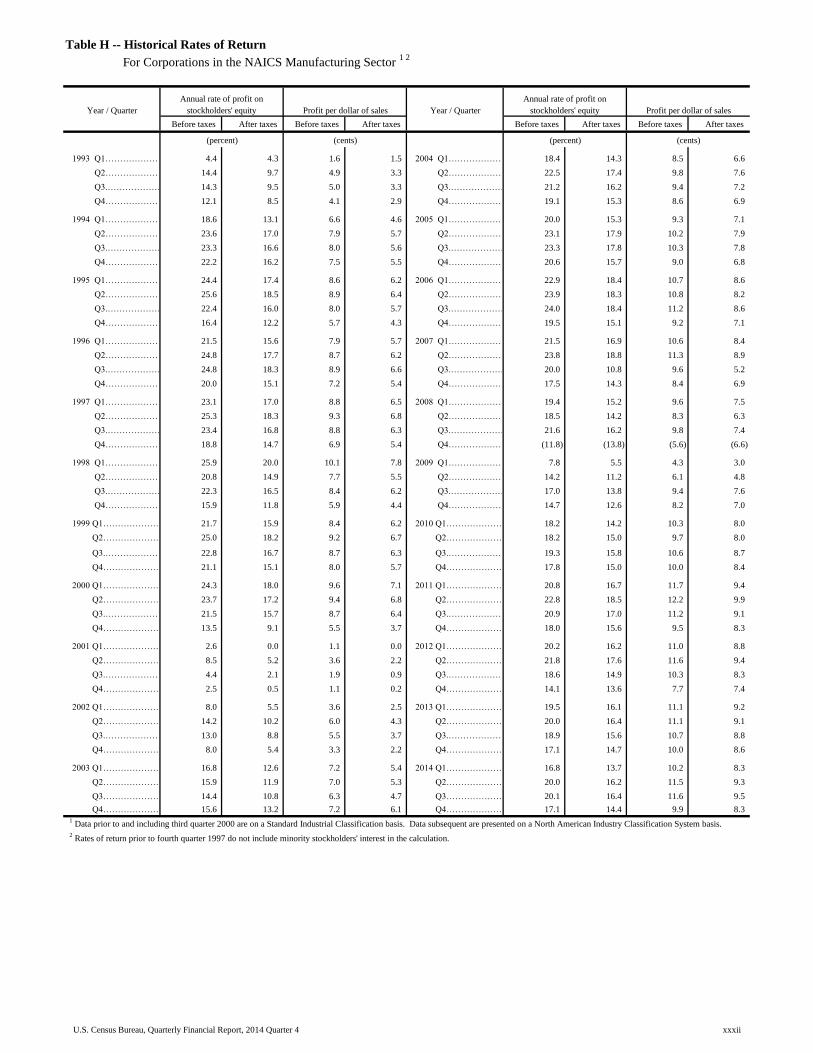
Table with row headers in column A and F with column headers in rows 4 and 5
Year / Quarter Year / Quarter
Before taxes_ After taxes_ Before taxes_ After taxes_ Before taxes_ After taxes_ Before taxes_ After taxes_
1993 Q1……………………………………………………………………………………………………………………………………………………………………………………………………………………………4.4 4.3 1.6 1.5 2004 Q1……………………………………………………………………………………………………………………………………………………………………………………………………………………………18.4 14.3 8.5 6.6
Q2…………………………………………………………………………………………………………………………………………………………………………………………………………………14.4 9.7 4.9 3.3 Q2…………………………………………………………………………………………………………………………………………………………………………………………………………………22.5 17.4 9.8 7.6
Q3.……………………………………………………………………………………………………………………………………………………………………………………………………………………………………………14.3 9.5 5.0 3.3 Q3.……………………………………………………………………………………………………………………………………………………………………………………………………………………………………………21.2 16.2 9.4 7.2
Q4……………………………………………………………………………………………………………………………………………………………………………………………………………………………12.1 8.5 4.1 2.9 Q4……………………………………………………………………………………………………………………………………………………………………………………………………………………………19.1 15.3 8.6 6.9
1994 Q1……………………………………………………………………………………………………………………………………………………………………………………………………………………………18.6 13.1 6.6 4.6 2005 Q1……………………………………………………………………………………………………………………………………………………………………………………………………………………………20.0 15.3 9.3 7.1
Q2…………………………………………………………………………………………………………………………………………………………………………………………………………………23.6 17.0 7.9 5.7 Q2…………………………………………………………………………………………………………………………………………………………………………………………………………………23.1 17.9 10.2 7.9
Q3.……………………………………………………………………………………………………………………………………………………………………………………………………………………………………………23.3 16.6 8.0 5.6 Q3.……………………………………………………………………………………………………………………………………………………………………………………………………………………………………………23.3 17.8 10.3 7.8
Q4……………………………………………………………………………………………………………………………………………………………………………………………………………………………22.2 16.2 7.5 5.5 Q4……………………………………………………………………………………………………………………………………………………………………………………………………………………………20.6 15.7 9.0 6.8
1995 Q1……………………………………………………………………………………………………………………………………………………………………………………………………………………………24.4 17.4 8.6 6.2 2006 Q1……………………………………………………………………………………………………………………………………………………………………………………………………………………………22.9 18.4 10.7 8.6
Q2…………………………………………………………………………………………………………………………………………………………………………………………………………………25.6 18.5 8.9 6.4 Q2…………………………………………………………………………………………………………………………………………………………………………………………………………………23.9 18.3 10.8 8.2
Q3.……………………………………………………………………………………………………………………………………………………………………………………………………………………………………………22.4 16.0 8.0 5.7 Q3.……………………………………………………………………………………………………………………………………………………………………………………………………………………………………………24.0 18.4 11.2 8.6
Q4……………………………………………………………………………………………………………………………………………………………………………………………………………………………16.4 12.2 5.7 4.3 Q4……………………………………………………………………………………………………………………………………………………………………………………………………………………………19.5 15.1 9.2 7.1
1996 Q1……………………………………………………………………………………………………………………………………………………………………………………………………………………………21.5 15.6 7.9 5.7 2007 Q1……………………………………………………………………………………………………………………………………………………………………………………………………………………………21.5 16.9 10.6 8.4
Q2…………………………………………………………………………………………………………………………………………………………………………………………………………………24.8 17.7 8.7 6.2 Q2…………………………………………………………………………………………………………………………………………………………………………………………………………………23.8 18.8 11.3 8.9
Q3.……………………………………………………………………………………………………………………………………………………………………………………………………………………………………………24.8 18.3 8.9 6.6 Q3.……………………………………………………………………………………………………………………………………………………………………………………………………………………………………………20.0 10.8 9.6 5.2
Q4……………………………………………………………………………………………………………………………………………………………………………………………………………………………20.0 15.1 7.2 5.4 Q4……………………………………………………………………………………………………………………………………………………………………………………………………………………………17.5 14.3 8.4 6.9
1997 Q1……………………………………………………………………………………………………………………………………………………………………………………………………………………………23.1 17.0 8.8 6.5 2008 Q1……………………………………………………………………………………………………………………………………………………………………………………………………………………………19.4 15.2 9.6 7.5
Q2…………………………………………………………………………………………………………………………………………………………………………………………………………………25.3 18.3 9.3 6.8 Q2…………………………………………………………………………………………………………………………………………………………………………………………………………………18.5 14.2 8.3 6.3
Q3.……………………………………………………………………………………………………………………………………………………………………………………………………………………………………………23.4 16.8 8.8 6.3 Q3.……………………………………………………………………………………………………………………………………………………………………………………………………………………………………………21.6 16.2 9.8 7.4
Q4……………………………………………………………………………………………………………………………………………………………………………………………………………………………18.8 14.7 6.9 5.4 Q4……………………………………………………………………………………………………………………………………………………………………………………………………………………………(11.8) (13.8) (5.6) (6.6)
1998 Q1……………………………………………………………………………………………………………………………………………………………………………………………………………………………25.9 20.0 10.1 7.8 2009 Q1……………………………………………………………………………………………………………………………………………………………………………………………………………………………7.8 5.5 4.3 3.0
Q2…………………………………………………………………………………………………………………………………………………………………………………………………………………20.8 14.9 7.7 5.5 Q2…………………………………………………………………………………………………………………………………………………………………………………………………………………14.2 11.2 6.1 4.8
Q3.……………………………………………………………………………………………………………………………………………………………………………………………………………………………………………22.3 16.5 8.4 6.2 Q3.……………………………………………………………………………………………………………………………………………………………………………………………………………………………………………17.0 13.8 9.4 7.6
Q4……………………………………………………………………………………………………………………………………………………………………………………………………………………………15.9 11.8 5.9 4.4 Q4……………………………………………………………………………………………………………………………………………………………………………………………………………………………14.7 12.6 8.2 7.0
1999 Q1……………………………………………………………………………………………………………………………………………………………………………………………………………………………21.7 15.9 8.4 6.2 2010 Q1……………………………………………………………………………………………………………………………………………………………………………………………………………………………18.2 14.2 10.3 8.0
Q2…………………………………………………………………………………………………………………………………………………………………………………………………………………25.0 18.2 9.2 6.7 Q2…………………………………………………………………………………………………………………………………………………………………………………………………………………18.2 15.0 9.7 8.0
Q3.……………………………………………………………………………………………………………………………………………………………………………………………………………………………………………22.8 16.7 8.7 6.3 Q3.……………………………………………………………………………………………………………………………………………………………………………………………………………………………………………19.3 15.8 10.6 8.7
Q4……………………………………………………………………………………………………………………………………………………………………………………………………………………………21.1 15.1 8.0 5.7 Q4……………………………………………………………………………………………………………………………………………………………………………………………………………………………17.8 15.0 10.0 8.4
2000 Q1……………………………………………………………………………………………………………………………………………………………………………………………………………………………24.3 18.0 9.6 7.1 2011 Q1……………………………………………………………………………………………………………………………………………………………………………………………………………………………20.8 16.7 11.7 9.4
Q2…………………………………………………………………………………………………………………………………………………………………………………………………………………23.7 17.2 9.4 6.8 Q2…………………………………………………………………………………………………………………………………………………………………………………………………………………22.8 18.5 12.2 9.9
Q3.……………………………………………………………………………………………………………………………………………………………………………………………………………………………………………21.5 15.7 8.7 6.4 Q3.……………………………………………………………………………………………………………………………………………………………………………………………………………………………………………20.9 17.0 11.2 9.1
Q4……………………………………………………………………………………………………………………………………………………………………………………………………………………………13.5 9.1 5.5 3.7 Q4……………………………………………………………………………………………………………………………………………………………………………………………………………………………18.0 15.6 9.5 8.3
2001 Q1……………………………………………………………………………………………………………………………………………………………………………………………………………………………2.6 0.0 1.1 0.0 2012 Q1……………………………………………………………………………………………………………………………………………………………………………………………………………………………20.2 16.2 11.0 8.8
Q2…………………………………………………………………………………………………………………………………………………………………………………………………………………8.5 5.2 3.6 2.2 Q2…………………………………………………………………………………………………………………………………………………………………………………………………………………21.8 17.6 11.6 9.4
Q3.……………………………………………………………………………………………………………………………………………………………………………………………………………………………………………4.4 2.1 1.9 0.9 Q3.……………………………………………………………………………………………………………………………………………………………………………………………………………………………………………18.6 14.9 10.3 8.3
Q4……………………………………………………………………………………………………………………………………………………………………………………………………………………………2.5 0.5 1.1 0.2 Q4……………………………………………………………………………………………………………………………………………………………………………………………………………………………14.1 13.6 7.7 7.4
2002 Q1……………………………………………………………………………………………………………………………………………………………………………………………………………………………8.0 5.5 3.6 2.5 2013 Q1……………………………………………………………………………………………………………………………………………………………………………………………………………………………19.5 16.1 11.1 9.2
Q2…………………………………………………………………………………………………………………………………………………………………………………………………………………14.2 10.2 6.0 4.3 Q2…………………………………………………………………………………………………………………………………………………………………………………………………………………20.0 16.4 11.1 9.1
Q3.……………………………………………………………………………………………………………………………………………………………………………………………………………………………………………13.0 8.8 5.5 3.7 Q3.……………………………………………………………………………………………………………………………………………………………………………………………………………………………………………18.9 15.6 10.7 8.8
Q4……………………………………………………………………………………………………………………………………………………………………………………………………………………………8.0 5.4 3.3 2.2 Q4……………………………………………………………………………………………………………………………………………………………………………………………………………………………17.1 14.7 10.0 8.6
2003 Q1…………………………………………………………………………………………………………………………………………………………………………………………16.8 12.6 7.2 5.4 2014 Q1…………………………………………………………………………………………………………………………………………………………………………………………16.8 13.7 10.2 8.3
Q2…………………………………………………………………………………………………………………………………………………………………………………………15.9 11.9 7.0 5.3 Q2…………………………………………………………………………………………………………………………………………………………………………………………20.0 16.2 11.5 9.3
Q3………………………………………………………………………………………………………………………………………...………………………………………………14.4 10.8 6.3 4.7 Q3………………………………………………………………………………………………………………………………………...………………………………………………20.1 16.4 11.6 9.5
Q4……………………………………………………………………………………………………………...…………………………………………………………………………15.6 13.2 7.2 6.1 Q4……………………………………………………………………………………………………………...…………………………………………………………………………17.1 14.4 9.9 8.3
(percent) (cents) (percent) (cents)
1 Data prior to and including third quarter 2000 are on a Standard Industrial Classification basis. Data subsequent are presented on a North American Industry Classification System basis.
2 Rates of return prior to fourth quarter 1997 do not include minority stockholders' interest in the calculation.
Table H -- Historical Rates of Return
For Corporations in the NAICS Manufacturing Sector 1 2
Annual rate of profit on
stockholders' equity Profit per dollar of sales
Annual rate of profit on
stockholders' equity Profit per dollar of sales
xxxiiU.S. Census Bureau, Quarterly Financial Report, 2014 Quarter 4
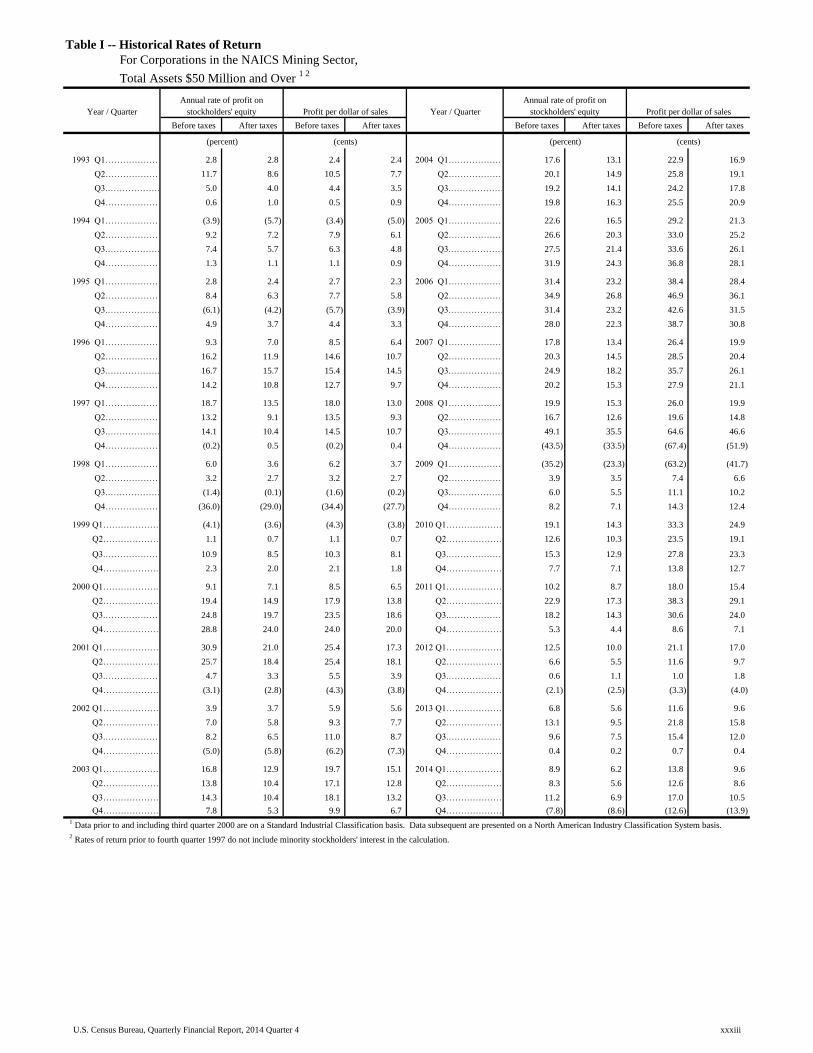
Table with row headers in column A with column headers in rows 4 and 5
Year / Quarter Year / Quarter
Before taxes_ After taxes_ Before taxes_ After taxes_ Before taxes_ After taxes_ Before taxes_ After taxes_
1993 Q1……………………………………………………………………………………………………………………………………………………………………………………………………………………………2.8 2.8 2.4 2.4 2004 Q1……………………………………………………………………………………………………………………………………………………………………………………………………………………………17.6 13.1 22.9 16.9
Q2…………………………………………………………………………………………………………………………………………………………………………………………………………………11.7 8.6 10.5 7.7 Q2…………………………………………………………………………………………………………………………………………………………………………………………………………………20.1 14.9 25.8 19.1
Q3.……………………………………………………………………………………………………………………………………………………………………………………………………………………………………………5.0 4.0 4.4 3.5 Q3.……………………………………………………………………………………………………………………………………………………………………………………………………………………………………………19.2 14.1 24.2 17.8
Q4……………………………………………………………………………………………………………………………………………………………………………………………………………………………0.6 1.0 0.5 0.9 Q4……………………………………………………………………………………………………………………………………………………………………………………………………………………………19.8 16.3 25.5 20.9
1994 Q1……………………………………………………………………………………………………………………………………………………………………………………………………………………………(3.9) (5.7) (3.4) (5.0) 2005 Q1……………………………………………………………………………………………………………………………………………………………………………………………………………………………22.6 16.5 29.2 21.3
Q2…………………………………………………………………………………………………………………………………………………………………………………………………………………9.2 7.2 7.9 6.1 Q2…………………………………………………………………………………………………………………………………………………………………………………………………………………26.6 20.3 33.0 25.2
Q3.……………………………………………………………………………………………………………………………………………………………………………………………………………………………………………7.4 5.7 6.3 4.8 Q3.……………………………………………………………………………………………………………………………………………………………………………………………………………………………………………27.5 21.4 33.6 26.1
Q4……………………………………………………………………………………………………………………………………………………………………………………………………………………………1.3 1.1 1.1 0.9 Q4……………………………………………………………………………………………………………………………………………………………………………………………………………………………31.9 24.3 36.8 28.1
1995 Q1……………………………………………………………………………………………………………………………………………………………………………………………………………………………2.8 2.4 2.7 2.3 2006 Q1……………………………………………………………………………………………………………………………………………………………………………………………………………………………31.4 23.2 38.4 28.4
Q2…………………………………………………………………………………………………………………………………………………………………………………………………………………8.4 6.3 7.7 5.8 Q2…………………………………………………………………………………………………………………………………………………………………………………………………………………34.9 26.8 46.9 36.1
Q3.……………………………………………………………………………………………………………………………………………………………………………………………………………………………………………(6.1) (4.2) (5.7) (3.9) Q3.……………………………………………………………………………………………………………………………………………………………………………………………………………………………………………31.4 23.2 42.6 31.5
Q4……………………………………………………………………………………………………………………………………………………………………………………………………………………………4.9 3.7 4.4 3.3 Q4……………………………………………………………………………………………………………………………………………………………………………………………………………………………28.0 22.3 38.7 30.8
1996 Q1……………………………………………………………………………………………………………………………………………………………………………………………………………………………9.3 7.0 8.5 6.4 2007 Q1……………………………………………………………………………………………………………………………………………………………………………………………………………………………17.8 13.4 26.4 19.9
Q2…………………………………………………………………………………………………………………………………………………………………………………………………………………16.2 11.9 14.6 10.7 Q2…………………………………………………………………………………………………………………………………………………………………………………………………………………20.3 14.5 28.5 20.4
Q3.……………………………………………………………………………………………………………………………………………………………………………………………………………………………………………16.7 15.7 15.4 14.5 Q3.……………………………………………………………………………………………………………………………………………………………………………………………………………………………………………24.9 18.2 35.7 26.1
Q4……………………………………………………………………………………………………………………………………………………………………………………………………………………………14.2 10.8 12.7 9.7 Q4……………………………………………………………………………………………………………………………………………………………………………………………………………………………20.2 15.3 27.9 21.1
1997 Q1……………………………………………………………………………………………………………………………………………………………………………………………………………………………18.7 13.5 18.0 13.0 2008 Q1……………………………………………………………………………………………………………………………………………………………………………………………………………………………19.9 15.3 26.0 19.9
Q2…………………………………………………………………………………………………………………………………………………………………………………………………………………13.2 9.1 13.5 9.3 Q2…………………………………………………………………………………………………………………………………………………………………………………………………………………16.7 12.6 19.6 14.8
Q3.……………………………………………………………………………………………………………………………………………………………………………………………………………………………………………14.1 10.4 14.5 10.7 Q3.……………………………………………………………………………………………………………………………………………………………………………………………………………………………………………49.1 35.5 64.6 46.6
Q4……………………………………………………………………………………………………………………………………………………………………………………………………………………………(0.2) 0.5 (0.2) 0.4 Q4……………………………………………………………………………………………………………………………………………………………………………………………………………………………(43.5) (33.5) (67.4) (51.9)
1998 Q1……………………………………………………………………………………………………………………………………………………………………………………………………………………………6.0 3.6 6.2 3.7 2009 Q1……………………………………………………………………………………………………………………………………………………………………………………………………………………………(35.2) (23.3) (63.2) (41.7)
Q2…………………………………………………………………………………………………………………………………………………………………………………………………………………3.2 2.7 3.2 2.7 Q2…………………………………………………………………………………………………………………………………………………………………………………………………………………3.9 3.5 7.4 6.6
Q3.……………………………………………………………………………………………………………………………………………………………………………………………………………………………………………(1.4) (0.1) (1.6) (0.2) Q3.……………………………………………………………………………………………………………………………………………………………………………………………………………………………………………6.0 5.5 11.1 10.2
Q4……………………………………………………………………………………………………………………………………………………………………………………………………………………………(36.0) (29.0) (34.4) (27.7) Q4……………………………………………………………………………………………………………………………………………………………………………………………………………………………8.2 7.1 14.3 12.4
1999 Q1……………………………………………………………………………………………………………………………………………………………………………………………………………………………(4.1) (3.6) (4.3) (3.8) 2010 Q1……………………………………………………………………………………………………………………………………………………………………………………………………………………………19.1 14.3 33.3 24.9
Q2…………………………………………………………………………………………………………………………………………………………………………………………………………………1.1 0.7 1.1 0.7 Q2…………………………………………………………………………………………………………………………………………………………………………………………………………………12.6 10.3 23.5 19.1
Q3.……………………………………………………………………………………………………………………………………………………………………………………………………………………………………………10.9 8.5 10.3 8.1 Q3.……………………………………………………………………………………………………………………………………………………………………………………………………………………………………………15.3 12.9 27.8 23.3
Q4……………………………………………………………………………………………………………………………………………………………………………………………………………………………2.3 2.0 2.1 1.8 Q4……………………………………………………………………………………………………………………………………………………………………………………………………………………………7.7 7.1 13.8 12.7
2000 Q1……………………………………………………………………………………………………………………………………………………………………………………………………………………………9.1 7.1 8.5 6.5 2011 Q1……………………………………………………………………………………………………………………………………………………………………………………………………………………………10.2 8.7 18.0 15.4
Q2…………………………………………………………………………………………………………………………………………………………………………………………………………………19.4 14.9 17.9 13.8 Q2…………………………………………………………………………………………………………………………………………………………………………………………………………………22.9 17.3 38.3 29.1
Q3.……………………………………………………………………………………………………………………………………………………………………………………………………………………………………………24.8 19.7 23.5 18.6 Q3.……………………………………………………………………………………………………………………………………………………………………………………………………………………………………………18.2 14.3 30.6 24.0
Q4……………………………………………………………………………………………………………………………………………………………………………………………………………………………28.8 24.0 24.0 20.0 Q4……………………………………………………………………………………………………………………………………………………………………………………………………………………………5.3 4.4 8.6 7.1
2001 Q1……………………………………………………………………………………………………………………………………………………………………………………………………………………………30.9 21.0 25.4 17.3 2012 Q1……………………………………………………………………………………………………………………………………………………………………………………………………………………………12.5 10.0 21.1 17.0
Q2…………………………………………………………………………………………………………………………………………………………………………………………………………………25.7 18.4 25.4 18.1 Q2…………………………………………………………………………………………………………………………………………………………………………………………………………………6.6 5.5 11.6 9.7
Q3.……………………………………………………………………………………………………………………………………………………………………………………………………………………………………………4.7 3.3 5.5 3.9 Q3.……………………………………………………………………………………………………………………………………………………………………………………………………………………………………………0.6 1.1 1.0 1.8
Q4……………………………………………………………………………………………………………………………………………………………………………………………………………………………(3.1) (2.8) (4.3) (3.8) Q4……………………………………………………………………………………………………………………………………………………………………………………………………………………………(2.1) (2.5) (3.3) (4.0)
2002 Q1……………………………………………………………………………………………………………………………………………………………………………………………………………………………3.9 3.7 5.9 5.6 2013 Q1……………………………………………………………………………………………………………………………………………………………………………………………………………………………6.8 5.6 11.6 9.6
Q2…………………………………………………………………………………………………………………………………………………………………………………………………………………7.0 5.8 9.3 7.7 Q2…………………………………………………………………………………………………………………………………………………………………………………………………………………13.1 9.5 21.8 15.8
Q3.……………………………………………………………………………………………………………………………………………………………………………………………………………………………………………8.2 6.5 11.0 8.7 Q3.……………………………………………………………………………………………………………………………………………………………………………………………………………………………………………9.6 7.5 15.4 12.0
Q4……………………………………………………………………………………………………………………………………………………………………………………………………………………………(5.0) (5.8) (6.2) (7.3) Q4……………………………………………………………………………………………………………………………………………………………………………………………………………………………0.4 0.2 0.7 0.4
2003 Q1…………………………………………………………………………………………………………………………………………………………………………………………16.8 12.9 19.7 15.1 2014 Q1…………………………………………………………………………………………………………………………………………………………………………………………8.9 6.2 13.8 9.6
Q2…………………………………………………………………………………………………………………………………………………………………………………………13.8 10.4 17.1 12.8 Q2…………………………………………………………………………………………………………………………………………………………………………………………8.3 5.6 12.6 8.6
Q3………………………………………………………………………………………………………………………………………...………………………………………………14.3 10.4 18.1 13.2 Q3………………………………………………………………………………………………………………………………………...………………………………………………11.2 6.9 17.0 10.5
Q4……………………………………………………………………………………………………………...…………………………………………………………………………7.8 5.3 9.9 6.7 Q4……………………………………………………………………………………………………………...…………………………………………………………………………(7.8) (8.6) (12.6) (13.9)
(percent) (cents) (percent) (cents)
1 Data prior to and including third quarter 2000 are on a Standard Industrial Classification basis. Data subsequent are presented on a North American Industry Classification System basis.
2 Rates of return prior to fourth quarter 1997 do not include minority stockholders' interest in the calculation.
Table I -- Historical Rates of Return
For Corporations in the NAICS Mining Sector,
Total Assets $50 Million and Over 1 2
Annual rate of profit on
stockholders' equity Profit per dollar of sales
Annual rate of profit on
stockholders' equity Profit per dollar of sales
xxxiiiU.S. Census Bureau, Quarterly Financial Report, 2014 Quarter 4
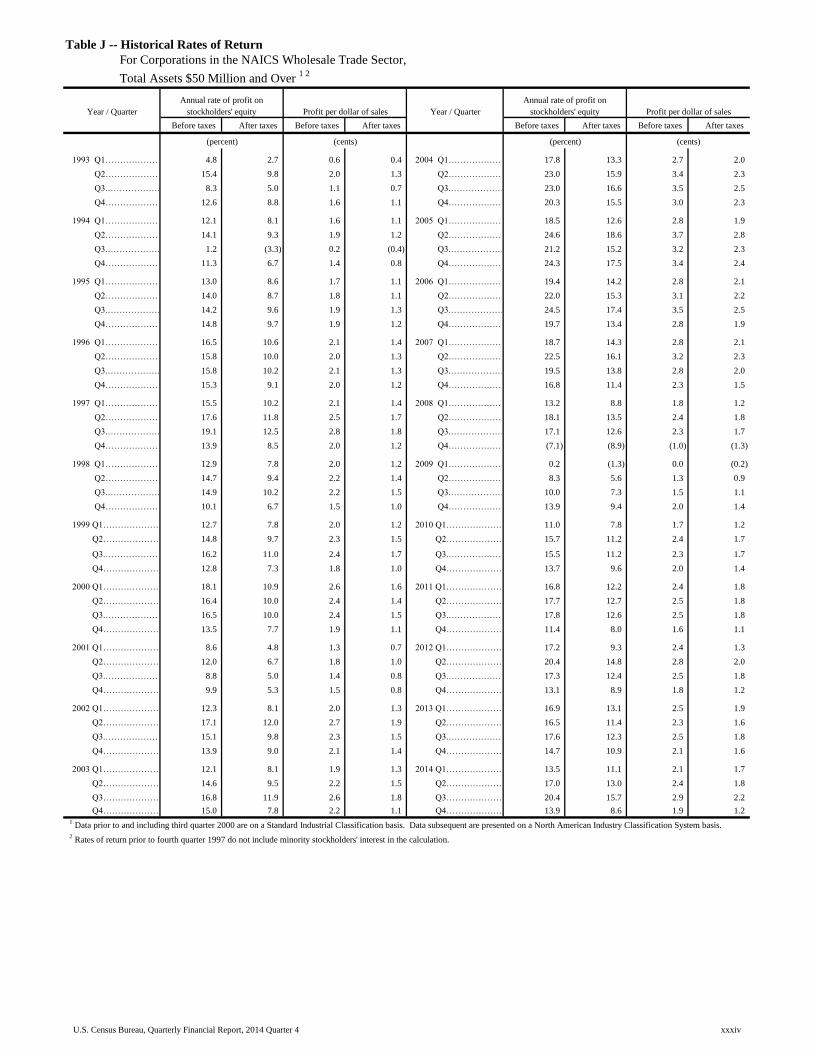
Table with row headers in column A with column headers in rows 4 and 5
Year / Quarter Year / Quarter
Before taxes_ After taxes_ Before taxes_ After taxes_ Before taxes_ After taxes_ Before taxes_ After taxes_
1993 Q1……………………………………………………………………………………………………………………………………………………………………………………………………………………………4.8 2.7 0.6 0.4 2004 Q1……………………………………………………………………………………………………………………………………………………………………………………………………………………………17.8 13.3 2.7 2.0
Q2…………………………………………………………………………………………………………………………………………………………………………………………………………………15.4 9.8 2.0 1.3 Q2…………………………………………………………………………………………………………………………………………………………………………………………………………………23.0 15.9 3.4 2.3
Q3.……………………………………………………………………………………………………………………………………………………………………………………………………………………………………………8.3 5.0 1.1 0.7 Q3.……………………………………………………………………………………………………………………………………………………………………………………………………………………………………………23.0 16.6 3.5 2.5
Q4……………………………………………………………………………………………………………………………………………………………………………………………………………………………12.6 8.8 1.6 1.1 Q4……………………………………………………………………………………………………………………………………………………………………………………………………………………………20.3 15.5 3.0 2.3
1994 Q1……………………………………………………………………………………………………………………………………………………………………………………………………………………………12.1 8.1 1.6 1.1 2005 Q1……………………………………………………………………………………………………………………………………………………………………………………………………………………………18.5 12.6 2.8 1.9
Q2…………………………………………………………………………………………………………………………………………………………………………………………………………………14.1 9.3 1.9 1.2 Q2…………………………………………………………………………………………………………………………………………………………………………………………………………………24.6 18.6 3.7 2.8
Q3.……………………………………………………………………………………………………………………………………………………………………………………………………………………………………………1.2 (3.3) 0.2 (0.4) Q3.……………………………………………………………………………………………………………………………………………………………………………………………………………………………………………21.2 15.2 3.2 2.3
Q4……………………………………………………………………………………………………………………………………………………………………………………………………………………………11.3 6.7 1.4 0.8 Q4……………………………………………………………………………………………………………………………………………………………………………………………………………………………24.3 17.5 3.4 2.4
1995 Q1……………………………………………………………………………………………………………………………………………………………………………………………………………………………13.0 8.6 1.7 1.1 2006 Q1……………………………………………………………………………………………………………………………………………………………………………………………………………………………19.4 14.2 2.8 2.1
Q2…………………………………………………………………………………………………………………………………………………………………………………………………………………14.0 8.7 1.8 1.1 Q2…………………………………………………………………………………………………………………………………………………………………………………………………………………22.0 15.3 3.1 2.2
Q3.……………………………………………………………………………………………………………………………………………………………………………………………………………………………………………14.2 9.6 1.9 1.3 Q3.……………………………………………………………………………………………………………………………………………………………………………………………………………………………………………24.5 17.4 3.5 2.5
Q4……………………………………………………………………………………………………………………………………………………………………………………………………………………………14.8 9.7 1.9 1.2 Q4……………………………………………………………………………………………………………………………………………………………………………………………………………………………19.7 13.4 2.8 1.9
1996 Q1……………………………………………………………………………………………………………………………………………………………………………………………………………………………16.5 10.6 2.1 1.4 2007 Q1……………………………………………………………………………………………………………………………………………………………………………………………………………………………18.7 14.3 2.8 2.1
Q2…………………………………………………………………………………………………………………………………………………………………………………………………………………15.8 10.0 2.0 1.3 Q2…………………………………………………………………………………………………………………………………………………………………………………………………………………22.5 16.1 3.2 2.3
Q3.……………………………………………………………………………………………………………………………………………………………………………………………………………………………………………15.8 10.2 2.1 1.3 Q3.……………………………………………………………………………………………………………………………………………………………………………………………………………………………………………19.5 13.8 2.8 2.0
Q4……………………………………………………………………………………………………………………………………………………………………………………………………………………………15.3 9.1 2.0 1.2 Q4……………………………………………………………………………………………………………………………………………………………………………………………………………………………16.8 11.4 2.3 1.5
1997 Q1……………………………………………………………………………………………………………………………………………………………………………………………………………………………15.5 10.2 2.1 1.4 2008 Q1……………………………………………………………………………………………………………………………………………………………………………………………………………………………13.2 8.8 1.8 1.2
Q2…………………………………………………………………………………………………………………………………………………………………………………………………………………17.6 11.8 2.5 1.7 Q2…………………………………………………………………………………………………………………………………………………………………………………………………………………18.1 13.5 2.4 1.8
Q3.……………………………………………………………………………………………………………………………………………………………………………………………………………………………………………19.1 12.5 2.8 1.8 Q3.……………………………………………………………………………………………………………………………………………………………………………………………………………………………………………17.1 12.6 2.3 1.7
Q4……………………………………………………………………………………………………………………………………………………………………………………………………………………………13.9 8.5 2.0 1.2 Q4……………………………………………………………………………………………………………………………………………………………………………………………………………………………(7.1) (8.9) (1.0) (1.3)
1998 Q1……………………………………………………………………………………………………………………………………………………………………………………………………………………………12.9 7.8 2.0 1.2 2009 Q1……………………………………………………………………………………………………………………………………………………………………………………………………………………………0.2 (1.3) 0.0 (0.2)
Q2…………………………………………………………………………………………………………………………………………………………………………………………………………………14.7 9.4 2.2 1.4 Q2…………………………………………………………………………………………………………………………………………………………………………………………………………………8.3 5.6 1.3 0.9
Q3.……………………………………………………………………………………………………………………………………………………………………………………………………………………………………………14.9 10.2 2.2 1.5 Q3.……………………………………………………………………………………………………………………………………………………………………………………………………………………………………………10.0 7.3 1.5 1.1
Q4……………………………………………………………………………………………………………………………………………………………………………………………………………………………10.1 6.7 1.5 1.0 Q4……………………………………………………………………………………………………………………………………………………………………………………………………………………………13.9 9.4 2.0 1.4
1999 Q1……………………………………………………………………………………………………………………………………………………………………………………………………………………………12.7 7.8 2.0 1.2 2010 Q1……………………………………………………………………………………………………………………………………………………………………………………………………………………………11.0 7.8 1.7 1.2
Q2…………………………………………………………………………………………………………………………………………………………………………………………………………………14.8 9.7 2.3 1.5 Q2…………………………………………………………………………………………………………………………………………………………………………………………………………………15.7 11.2 2.4 1.7
Q3.……………………………………………………………………………………………………………………………………………………………………………………………………………………………………………16.2 11.0 2.4 1.7 Q3.……………………………………………………………………………………………………………………………………………………………………………………………………………………………………………15.5 11.2 2.3 1.7
Q4……………………………………………………………………………………………………………………………………………………………………………………………………………………………12.8 7.3 1.8 1.0 Q4……………………………………………………………………………………………………………………………………………………………………………………………………………………………13.7 9.6 2.0 1.4
2000 Q1……………………………………………………………………………………………………………………………………………………………………………………………………………………………18.1 10.9 2.6 1.6 2011 Q1……………………………………………………………………………………………………………………………………………………………………………………………………………………………16.8 12.2 2.4 1.8
Q2…………………………………………………………………………………………………………………………………………………………………………………………………………………16.4 10.0 2.4 1.4 Q2…………………………………………………………………………………………………………………………………………………………………………………………………………………17.7 12.7 2.5 1.8
Q3.……………………………………………………………………………………………………………………………………………………………………………………………………………………………………………16.5 10.0 2.4 1.5 Q3.……………………………………………………………………………………………………………………………………………………………………………………………………………………………………………17.8 12.6 2.5 1.8
Q4……………………………………………………………………………………………………………………………………………………………………………………………………………………………13.5 7.7 1.9 1.1 Q4……………………………………………………………………………………………………………………………………………………………………………………………………………………………11.4 8.0 1.6 1.1
2001 Q1……………………………………………………………………………………………………………………………………………………………………………………………………………………………8.6 4.8 1.3 0.7 2012 Q1……………………………………………………………………………………………………………………………………………………………………………………………………………………………17.2 9.3 2.4 1.3
Q2…………………………………………………………………………………………………………………………………………………………………………………………………………………12.0 6.7 1.8 1.0 Q2…………………………………………………………………………………………………………………………………………………………………………………………………………………20.4 14.8 2.8 2.0
Q3.……………………………………………………………………………………………………………………………………………………………………………………………………………………………………………8.8 5.0 1.4 0.8 Q3.……………………………………………………………………………………………………………………………………………………………………………………………………………………………………………17.3 12.4 2.5 1.8
Q4……………………………………………………………………………………………………………………………………………………………………………………………………………………………9.9 5.3 1.5 0.8 Q4……………………………………………………………………………………………………………………………………………………………………………………………………………………………13.1 8.9 1.8 1.2
2002 Q1……………………………………………………………………………………………………………………………………………………………………………………………………………………………12.3 8.1 2.0 1.3 2013 Q1……………………………………………………………………………………………………………………………………………………………………………………………………………………………16.9 13.1 2.5 1.9
Q2…………………………………………………………………………………………………………………………………………………………………………………………………………………17.1 12.0 2.7 1.9 Q2…………………………………………………………………………………………………………………………………………………………………………………………………………………16.5 11.4 2.3 1.6
Q3.……………………………………………………………………………………………………………………………………………………………………………………………………………………………………………15.1 9.8 2.3 1.5 Q3.……………………………………………………………………………………………………………………………………………………………………………………………………………………………………………17.6 12.3 2.5 1.8
Q4……………………………………………………………………………………………………………………………………………………………………………………………………………………………13.9 9.0 2.1 1.4 Q4……………………………………………………………………………………………………………………………………………………………………………………………………………………………14.7 10.9 2.1 1.6
2003 Q1…………………………………………………………………………………………………………………………………………………………………………………………12.1 8.1 1.9 1.3 2014 Q1…………………………………………………………………………………………………………………………………………………………………………………………13.5 11.1 2.1 1.7
Q2…………………………………………………………………………………………………………………………………………………………………………………………14.6 9.5 2.2 1.5 Q2…………………………………………………………………………………………………………………………………………………………………………………………17.0 13.0 2.4 1.8
Q3………………………………………………………………………………………………………………………………………...………………………………………………16.8 11.9 2.6 1.8 Q3………………………………………………………………………………………………………………………………………...………………………………………………20.4 15.7 2.9 2.2
Q4……………………………………………………………………………………………………………...…………………………………………………………………………15.0 7.8 2.2 1.1 Q4……………………………………………………………………………………………………………...…………………………………………………………………………13.9 8.6 1.9 1.2
(percent) (cents) (percent) (cents)
1 Data prior to and including third quarter 2000 are on a Standard Industrial Classification basis. Data subsequent are presented on a North American Industry Classification System basis.
2 Rates of return prior to fourth quarter 1997 do not include minority stockholders' interest in the calculation.
Table J -- Historical Rates of Return
For Corporations in the NAICS Wholesale Trade Sector,
Total Assets $50 Million and Over 1 2
Annual rate of profit on
stockholders' equity Profit per dollar of sales
Annual rate of profit on
stockholders' equity Profit per dollar of sales
xxxivU.S. Census Bureau, Quarterly Financial Report, 2014 Quarter 4
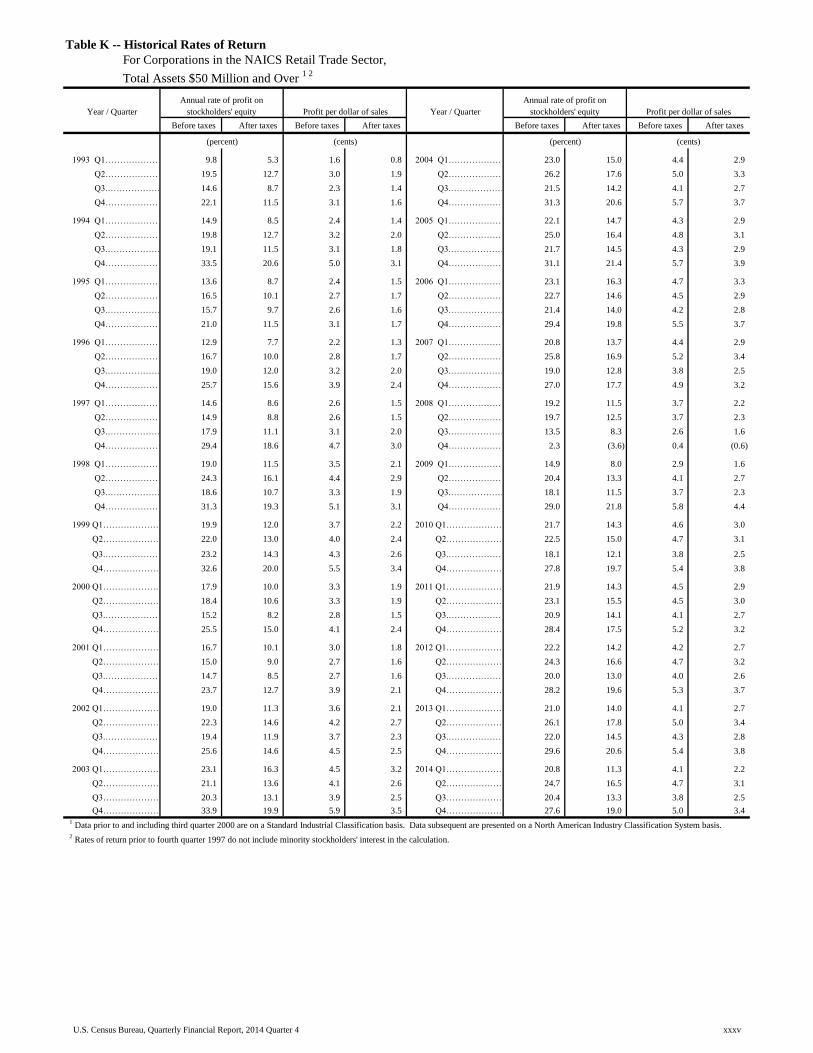
Table with row headers in column A with column headers in rows 4 and 5
Year / Quarter Year / Quarter
Before taxes_ After taxes_ Before taxes_ After taxes_ Before taxes_ After taxes_ Before taxes_ After taxes_
1993 Q1……………………………………………………………………………………………………………………………………………………………………………………………………………………………9.8 5.3 1.6 0.8 2004 Q1……………………………………………………………………………………………………………………………………………………………………………………………………………………………23.0 15.0 4.4 2.9
Q2…………………………………………………………………………………………………………………………………………………………………………………………………………………19.5 12.7 3.0 1.9 Q2…………………………………………………………………………………………………………………………………………………………………………………………………………………26.2 17.6 5.0 3.3
Q3.……………………………………………………………………………………………………………………………………………………………………………………………………………………………………………14.6 8.7 2.3 1.4 Q3.……………………………………………………………………………………………………………………………………………………………………………………………………………………………………………21.5 14.2 4.1 2.7
Q4……………………………………………………………………………………………………………………………………………………………………………………………………………………………22.1 11.5 3.1 1.6 Q4……………………………………………………………………………………………………………………………………………………………………………………………………………………………31.3 20.6 5.7 3.7
1994 Q1……………………………………………………………………………………………………………………………………………………………………………………………………………………………14.9 8.5 2.4 1.4 2005 Q1……………………………………………………………………………………………………………………………………………………………………………………………………………………………22.1 14.7 4.3 2.9
Q2…………………………………………………………………………………………………………………………………………………………………………………………………………………19.8 12.7 3.2 2.0 Q2…………………………………………………………………………………………………………………………………………………………………………………………………………………25.0 16.4 4.8 3.1
Q3.……………………………………………………………………………………………………………………………………………………………………………………………………………………………………………19.1 11.5 3.1 1.8 Q3.……………………………………………………………………………………………………………………………………………………………………………………………………………………………………………21.7 14.5 4.3 2.9
Q4……………………………………………………………………………………………………………………………………………………………………………………………………………………………33.5 20.6 5.0 3.1 Q4……………………………………………………………………………………………………………………………………………………………………………………………………………………………31.1 21.4 5.7 3.9
1995 Q1……………………………………………………………………………………………………………………………………………………………………………………………………………………………13.6 8.7 2.4 1.5 2006 Q1……………………………………………………………………………………………………………………………………………………………………………………………………………………………23.1 16.3 4.7 3.3
Q2…………………………………………………………………………………………………………………………………………………………………………………………………………………16.5 10.1 2.7 1.7 Q2…………………………………………………………………………………………………………………………………………………………………………………………………………………22.7 14.6 4.5 2.9
Q3.……………………………………………………………………………………………………………………………………………………………………………………………………………………………………………15.7 9.7 2.6 1.6 Q3.……………………………………………………………………………………………………………………………………………………………………………………………………………………………………………21.4 14.0 4.2 2.8
Q4……………………………………………………………………………………………………………………………………………………………………………………………………………………………21.0 11.5 3.1 1.7 Q4……………………………………………………………………………………………………………………………………………………………………………………………………………………………29.4 19.8 5.5 3.7
1996 Q1……………………………………………………………………………………………………………………………………………………………………………………………………………………………12.9 7.7 2.2 1.3 2007 Q1……………………………………………………………………………………………………………………………………………………………………………………………………………………………20.8 13.7 4.4 2.9
Q2…………………………………………………………………………………………………………………………………………………………………………………………………………………16.7 10.0 2.8 1.7 Q2…………………………………………………………………………………………………………………………………………………………………………………………………………………25.8 16.9 5.2 3.4
Q3.……………………………………………………………………………………………………………………………………………………………………………………………………………………………………………19.0 12.0 3.2 2.0 Q3.……………………………………………………………………………………………………………………………………………………………………………………………………………………………………………19.0 12.8 3.8 2.5
Q4……………………………………………………………………………………………………………………………………………………………………………………………………………………………25.7 15.6 3.9 2.4 Q4……………………………………………………………………………………………………………………………………………………………………………………………………………………………27.0 17.7 4.9 3.2
1997 Q1……………………………………………………………………………………………………………………………………………………………………………………………………………………………14.6 8.6 2.6 1.5 2008 Q1……………………………………………………………………………………………………………………………………………………………………………………………………………………………19.2 11.5 3.7 2.2
Q2…………………………………………………………………………………………………………………………………………………………………………………………………………………14.9 8.8 2.6 1.5 Q2…………………………………………………………………………………………………………………………………………………………………………………………………………………19.7 12.5 3.7 2.3
Q3.……………………………………………………………………………………………………………………………………………………………………………………………………………………………………………17.9 11.1 3.1 2.0 Q3.……………………………………………………………………………………………………………………………………………………………………………………………………………………………………………13.5 8.3 2.6 1.6
Q4……………………………………………………………………………………………………………………………………………………………………………………………………………………………29.4 18.6 4.7 3.0 Q4……………………………………………………………………………………………………………………………………………………………………………………………………………………………2.3 (3.6) 0.4 (0.6)
1998 Q1……………………………………………………………………………………………………………………………………………………………………………………………………………………………19.0 11.5 3.5 2.1 2009 Q1……………………………………………………………………………………………………………………………………………………………………………………………………………………………14.9 8.0 2.9 1.6
Q2…………………………………………………………………………………………………………………………………………………………………………………………………………………24.3 16.1 4.4 2.9 Q2…………………………………………………………………………………………………………………………………………………………………………………………………………………20.4 13.3 4.1 2.7
Q3.……………………………………………………………………………………………………………………………………………………………………………………………………………………………………………18.6 10.7 3.3 1.9 Q3.……………………………………………………………………………………………………………………………………………………………………………………………………………………………………………18.1 11.5 3.7 2.3
Q4……………………………………………………………………………………………………………………………………………………………………………………………………………………………31.3 19.3 5.1 3.1 Q4……………………………………………………………………………………………………………………………………………………………………………………………………………………………29.0 21.8 5.8 4.4
1999 Q1……………………………………………………………………………………………………………………………………………………………………………………………………………………………19.9 12.0 3.7 2.2 2010 Q1……………………………………………………………………………………………………………………………………………………………………………………………………………………………21.7 14.3 4.6 3.0
Q2…………………………………………………………………………………………………………………………………………………………………………………………………………………22.0 13.0 4.0 2.4 Q2…………………………………………………………………………………………………………………………………………………………………………………………………………………22.5 15.0 4.7 3.1
Q3.……………………………………………………………………………………………………………………………………………………………………………………………………………………………………………23.2 14.3 4.3 2.6 Q3.……………………………………………………………………………………………………………………………………………………………………………………………………………………………………………18.1 12.1 3.8 2.5
Q4……………………………………………………………………………………………………………………………………………………………………………………………………………………………32.6 20.0 5.5 3.4 Q4……………………………………………………………………………………………………………………………………………………………………………………………………………………………27.8 19.7 5.4 3.8
2000 Q1……………………………………………………………………………………………………………………………………………………………………………………………………………………………17.9 10.0 3.3 1.9 2011 Q1……………………………………………………………………………………………………………………………………………………………………………………………………………………………21.9 14.3 4.5 2.9
Q2…………………………………………………………………………………………………………………………………………………………………………………………………………………18.4 10.6 3.3 1.9 Q2…………………………………………………………………………………………………………………………………………………………………………………………………………………23.1 15.5 4.5 3.0
Q3.……………………………………………………………………………………………………………………………………………………………………………………………………………………………………………15.2 8.2 2.8 1.5 Q3.……………………………………………………………………………………………………………………………………………………………………………………………………………………………………………20.9 14.1 4.1 2.7
Q4……………………………………………………………………………………………………………………………………………………………………………………………………………………………25.5 15.0 4.1 2.4 Q4……………………………………………………………………………………………………………………………………………………………………………………………………………………………28.4 17.5 5.2 3.2
2001 Q1……………………………………………………………………………………………………………………………………………………………………………………………………………………………16.7 10.1 3.0 1.8 2012 Q1……………………………………………………………………………………………………………………………………………………………………………………………………………………………22.2 14.2 4.2 2.7
Q2…………………………………………………………………………………………………………………………………………………………………………………………………………………15.0 9.0 2.7 1.6 Q2…………………………………………………………………………………………………………………………………………………………………………………………………………………24.3 16.6 4.7 3.2
Q3.……………………………………………………………………………………………………………………………………………………………………………………………………………………………………………14.7 8.5 2.7 1.6 Q3.……………………………………………………………………………………………………………………………………………………………………………………………………………………………………………20.0 13.0 4.0 2.6
Q4……………………………………………………………………………………………………………………………………………………………………………………………………………………………23.7 12.7 3.9 2.1 Q4……………………………………………………………………………………………………………………………………………………………………………………………………………………………28.2 19.6 5.3 3.7
2002 Q1……………………………………………………………………………………………………………………………………………………………………………………………………………………………19.0 11.3 3.6 2.1 2013 Q1……………………………………………………………………………………………………………………………………………………………………………………………………………………………21.0 14.0 4.1 2.7
Q2…………………………………………………………………………………………………………………………………………………………………………………………………………………22.3 14.6 4.2 2.7 Q2…………………………………………………………………………………………………………………………………………………………………………………………………………………26.1 17.8 5.0 3.4
Q3.……………………………………………………………………………………………………………………………………………………………………………………………………………………………………………19.4 11.9 3.7 2.3 Q3.……………………………………………………………………………………………………………………………………………………………………………………………………………………………………………22.0 14.5 4.3 2.8
Q4……………………………………………………………………………………………………………………………………………………………………………………………………………………………25.6 14.6 4.5 2.5 Q4……………………………………………………………………………………………………………………………………………………………………………………………………………………………29.6 20.6 5.4 3.8
2003 Q1…………………………………………………………………………………………………………………………………………………………………………………………23.1 16.3 4.5 3.2 2014 Q1…………………………………………………………………………………………………………………………………………………………………………………………20.8 11.3 4.1 2.2
Q2…………………………………………………………………………………………………………………………………………………………………………………………21.1 13.6 4.1 2.6 Q2…………………………………………………………………………………………………………………………………………………………………………………………24.7 16.5 4.7 3.1
Q3………………………………………………………………………………………………………………………………………...………………………………………………20.3 13.1 3.9 2.5 Q3………………………………………………………………………………………………………………………………………...………………………………………………20.4 13.3 3.8 2.5
Q4……………………………………………………………………………………………………………...…………………………………………………………………………33.9 19.9 5.9 3.5 Q4……………………………………………………………………………………………………………...…………………………………………………………………………27.6 19.0 5.0 3.4
(percent) (cents) (percent) (cents)
1 Data prior to and including third quarter 2000 are on a Standard Industrial Classification basis. Data subsequent are presented on a North American Industry Classification System basis.
2 Rates of return prior to fourth quarter 1997 do not include minority stockholders' interest in the calculation.
Table K -- Historical Rates of Return
For Corporations in the NAICS Retail Trade Sector,
Total Assets $50 Million and Over 1 2
Annual rate of profit on
stockholders' equity Profit per dollar of sales
Annual rate of profit on
stockholders' equity Profit per dollar of sales
xxxvU.S. Census Bureau, Quarterly Financial Report, 2014 Quarter 4
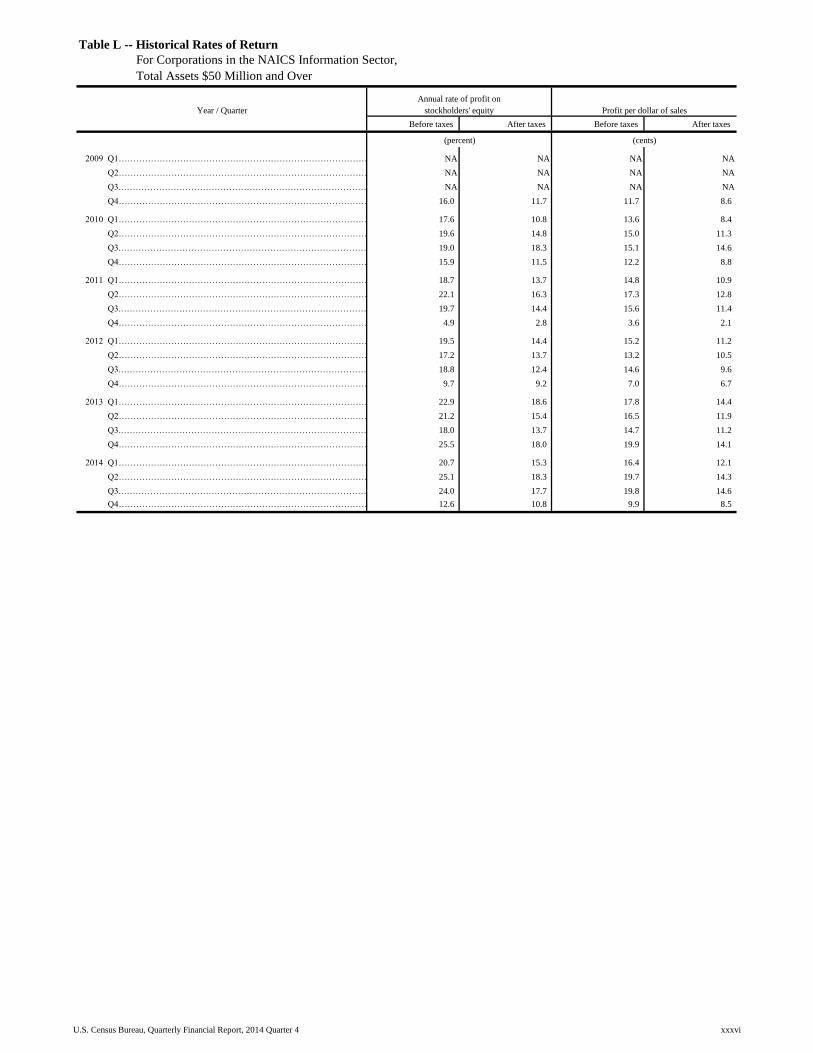
Table with row headers in column A with column headers in rows 4 and 5
Year / Quarter
Before taxes_ After taxes_ Before taxes_ After taxes_
2009 Q1……………………………………………………………………………………………………………………………………………………………………………………………………………………………NA NA NA NA
Q2…………………………………………………………………………………………………………………………………………………………………………………………………………………NA NA NA NA
Q3.……………………………………………………………………………………………………………………………………………………………………………………………………………………………………………NA NA NA NA
Q4……………………………………………………………………………………………………………………………………………………………………………………………………………………………16.0 11.7 11.7 8.6
2010 Q1……………………………………………………………………………………………………………………………………………………………………………………………………………………………17.6 10.8 13.6 8.4
Q2…………………………………………………………………………………………………………………………………………………………………………………………………………………19.6 14.8 15.0 11.3
Q3.……………………………………………………………………………………………………………………………………………………………………………………………………………………………………………19.0 18.3 15.1 14.6
Q4……………………………………………………………………………………………………………………………………………………………………………………………………………………………15.9 11.5 12.2 8.8
2011 Q1……………………………………………………………………………………………………………………………………………………………………………………………………………………………18.7 13.7 14.8 10.9
Q2…………………………………………………………………………………………………………………………………………………………………………………………………………………22.1 16.3 17.3 12.8
Q3.……………………………………………………………………………………………………………………………………………………………………………………………………………………………………………19.7 14.4 15.6 11.4
Q4……………………………………………………………………………………………………………………………………………………………………………………………………………………………4.9 2.8 3.6 2.1
2012 Q1……………………………………………………………………………………………………………………………………………………………………………………………………………………………19.5 14.4 15.2 11.2
Q2…………………………………………………………………………………………………………………………………………………………………………………………………………………17.2 13.7 13.2 10.5
Q3.……………………………………………………………………………………………………………………………………………………………………………………………………………………………………………18.8 12.4 14.6 9.6
Q4……………………………………………………………………………………………………………………………………………………………………………………………………………………………9.7 9.2 7.0 6.7
2013 Q1……………………………………………………………………………………………………………………………………………………………………………………………………………………………22.9 18.6 17.8 14.4
Q2…………………………………………………………………………………………………………………………………………………………………………………………………………………21.2 15.4 16.5 11.9
Q3.……………………………………………………………………………………………………………………………………………………………………………………………………………………………………………18.0 13.7 14.7 11.2
Q4……………………………………………………………………………………………………………………………………………………………………………………………………………………………25.5 18.0 19.9 14.1
2014 Q1……………………………………………………………………………………………………………………………………………………………………………………………………………………………20.7 15.3 16.4 12.1
Q2…………………………………………………………………………………………………………………………………………………………………………………………………………………25.1 18.3 19.7 14.3
Q3.……………………………………………………………………………………………………………………………………………………………………………………………………………………………………………24.0 17.7 19.8 14.6
Q4……………………………………………………………………………………………………………………………………………………………………………………………………………………………12.6 10.8 9.9 8.5
Table L -- Historical Rates of Return
For Corporations in the NAICS Information Sector,
Total Assets $50 Million and Over
Annual rate of profit on
stockholders' equity Profit per dollar of sales
(percent) (cents)
xxxviU.S. Census Bureau, Quarterly Financial Report, 2014 Quarter 4
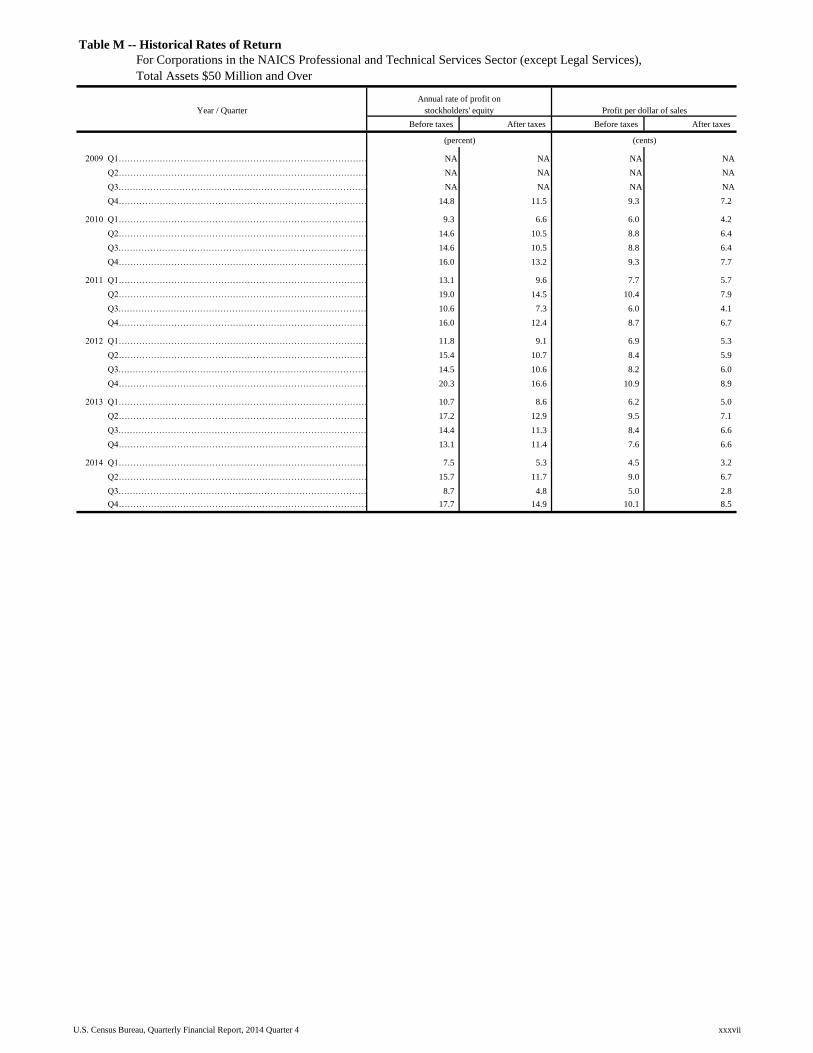
Table with row headers in column A with column headers in rows 4 and 5
Year / Quarter
Before taxes_ After taxes_ Before taxes_ After taxes_
2009 Q1……………………………………………………………………………………………………………………………………………………………………………………………………………………………NA NA NA NA
Q2…………………………………………………………………………………………………………………………………………………………………………………………………………………NA NA NA NA
Q3.……………………………………………………………………………………………………………………………………………………………………………………………………………………………………………NA NA NA NA
Q4……………………………………………………………………………………………………………………………………………………………………………………………………………………………14.8 11.5 9.3 7.2
2010 Q1……………………………………………………………………………………………………………………………………………………………………………………………………………………………9.3 6.6 6.0 4.2
Q2…………………………………………………………………………………………………………………………………………………………………………………………………………………14.6 10.5 8.8 6.4
Q3.……………………………………………………………………………………………………………………………………………………………………………………………………………………………………………14.6 10.5 8.8 6.4
Q4……………………………………………………………………………………………………………………………………………………………………………………………………………………………16.0 13.2 9.3 7.7
2011 Q1……………………………………………………………………………………………………………………………………………………………………………………………………………………………13.1 9.6 7.7 5.7
Q2…………………………………………………………………………………………………………………………………………………………………………………………………………………19.0 14.5 10.4 7.9
Q3.……………………………………………………………………………………………………………………………………………………………………………………………………………………………………………10.6 7.3 6.0 4.1
Q4……………………………………………………………………………………………………………………………………………………………………………………………………………………………16.0 12.4 8.7 6.7
2012 Q1……………………………………………………………………………………………………………………………………………………………………………………………………………………………11.8 9.1 6.9 5.3
Q2…………………………………………………………………………………………………………………………………………………………………………………………………………………15.4 10.7 8.4 5.9
Q3.……………………………………………………………………………………………………………………………………………………………………………………………………………………………………………14.5 10.6 8.2 6.0
Q4……………………………………………………………………………………………………………………………………………………………………………………………………………………………20.3 16.6 10.9 8.9
2013 Q1……………………………………………………………………………………………………………………………………………………………………………………………………………………………10.7 8.6 6.2 5.0
Q2…………………………………………………………………………………………………………………………………………………………………………………………………………………17.2 12.9 9.5 7.1
Q3.……………………………………………………………………………………………………………………………………………………………………………………………………………………………………………14.4 11.3 8.4 6.6
Q4……………………………………………………………………………………………………………………………………………………………………………………………………………………………13.1 11.4 7.6 6.6
2014 Q1……………………………………………………………………………………………………………………………………………………………………………………………………………………………7.5 5.3 4.5 3.2
Q2…………………………………………………………………………………………………………………………………………………………………………………………………………………15.7 11.7 9.0 6.7
Q3.……………………………………………………………………………………………………………………………………………………………………………………………………………………………………………8.7 4.8 5.0 2.8
Q4……………………………………………………………………………………………………………………………………………………………………………………………………………………………17.7 14.9 10.1 8.5
Table M -- Historical Rates of Return
For Corporations in the NAICS Professional and Technical Services Sector (except Legal Services),
Total Assets $50 Million and Over
Annual rate of profit on
stockholders' equity Profit per dollar of sales
(percent) (cents)
xxxviiU.S. Census Bureau, Quarterly Financial Report, 2014 Quarter 4
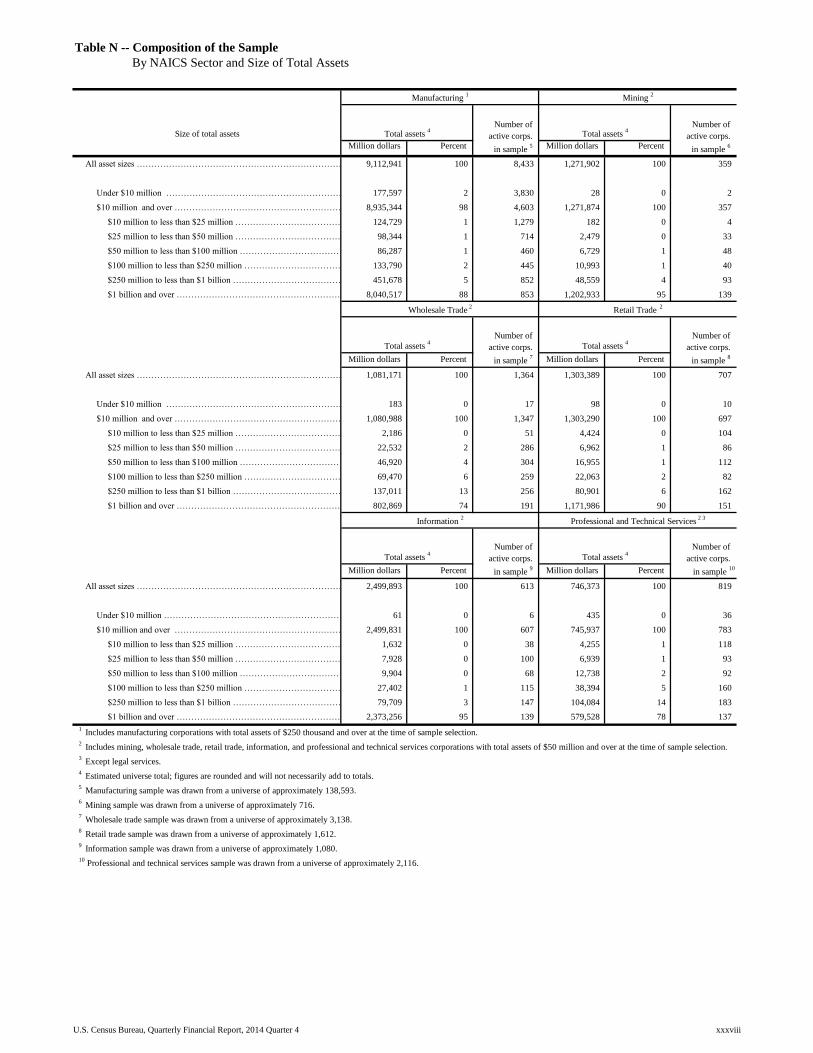
Table with row headers in column A with column headers in rows 4, 5, 6, 17, 18, and 19
Size of total assets
Million dollars_ Percent_ Million dollars_ Percent_
All asset sizes ………………………………………………………………………………………………...……………………………………………………………………………………………………………………9,112,941 100 8,433 1,271,902 100 359
Under $10 million ………………………………………………………………………………………………...……………………………………………………………………………………………………………………… 177,597 2 3,830 28 0 2
$10 million and over ………………………………………………………………………………………………...………………………………………………………………………………………………………………………8,935,344 98 4,603 1,271,874 100 357
$10 million to less than $25 million ………………………………………………………………………………………………...………………………………………………………………………………………………………………………124,729 1 1,279 182 0 4
$25 million to less than $50 million ………………………………………………………………………………………………...………………………………………………………………………………………………………………………98,344 1 714 2,479 0 33
$50 million to less than $100 million ………………………………………………………………………………………………...………………………………………………………………………………………………………………………86,287 1 460 6,729 1 48
$100 million to less than $250 million ………………………………………………………………………………………………...………………………………………………………………………………………………………………………133,790 2 445 10,993 1 40
$250 million to less than $1 billion ………………………………………………………………………………………………...………………………………………………………………………………………………………………………451,678 5 852 48,559 4 93
$1 billion and over ………………………………………………………………………………………………...………………………………………………………………………………………………………………………8,040,517 88 853 1,202,933 95 139
Million dollars_ Percent_ Million dollars_ Percent_
All asset sizes ………………………………………………………………………………………………...……………………………………………………………………………………………………………………1,081,171 100 1,364 1,303,389 100 707
Under $10 million ………………………………………………………………………………………………...……………………………………………………………………………………………………………………… 183 0 17 98 0 10
$10 million and over ………………………………………………………………………………………………...………………………………………………………………………………………………………………………1,080,988 100 1,347 1,303,290 100 697
$10 million to less than $25 million ………………………………………………………………………………………………...………………………………………………………………………………………………………………………2,186 0 51 4,424 0 104
$25 million to less than $50 million ………………………………………………………………………………………………...………………………………………………………………………………………………………………………22,532 2 286 6,962 1 86
$50 million to less than $100 million ………………………………………………………………………………………………...………………………………………………………………………………………………………………………46,920 4 304 16,955 1 112
$100 million to less than $250 million ………………………………………………………………………………………………...………………………………………………………………………………………………………………………69,470 6 259 22,063 2 82
$250 million to less than $1 billion ………………………………………………………………………………………………...………………………………………………………………………………………………………………………137,011 13 256 80,901 6 162
$1 billion and over ………………………………………………………………………………………………...………………………………………………………………………………………………………………………802,869 74 191 1,171,986 90 151
Million dollars_ Percent_ Million dollars_ Percent_
All asset sizes ………………………………………………………………………………………………...……………………………………………………………………………………………………………………2,499,893 100 613 746,373 100 819
Under $10 million ………………………………………………………………………………………………...………………………………………………………………………………………………………………………61 0 6 435 0 36
$10 million and over ………………………………………………………………………………………………...………………………………………………………………………………………………………………………2,499,831 100 607 745,937 100 783
$10 million to less than $25 million ………………………………………………………………………………………………...………………………………………………………………………………………………………………………1,632 0 38 4,255 1 118
$25 million to less than $50 million ………………………………………………………………………………………………...………………………………………………………………………………………………………………………7,928 0 100 6,939 1 93
$50 million to less than $100 million ………………………………………………………………………………………………...………………………………………………………………………………………………………………………9,904 0 68 12,738 2 92
$100 million to less than $250 million ………………………………………………………………………………………………...………………………………………………………………………………………………………………………27,402 1 115 38,394 5 160
$250 million to less than $1 billion ………………………………………………………………………………………………...………………………………………………………………………………………………………………………79,709 3 147 104,084 14 183
$1 billion and over ………………………………………………………………………………………………...………………………………………………………………………………………………………………………2,373,256 95 139 579,528 78 137
7
Wholesale trade sample was drawn from a universe of approximately 3,138.
8
Retail trade sample was drawn from a universe of approximately 1,612.
9
Information sample was drawn from a universe of approximately 1,080.
10
Professional and technical services sample was drawn from a universe of approximately 2,116.
1
Includes manufacturing corporations with total assets of $250 thousand and over at the time of sample selection.
2
Includes mining, wholesale trade, retail trade, information, and professional and technical services corporations with total assets of $50 million and over at the time of sample selection.
3
Except legal services.
4
Estimated universe total; figures are rounded and will not necessarily add to totals.
5
Manufacturing sample was drawn from a universe of approximately 138,593.
6
Mining sample was drawn from a universe of approximately 716.
Information 2
Professional and Technical Services 2 3
Total assets 4
Number of_
active corps._
in sample 9_
Total assets 4
Number of_
active corps._
in sample 10
Wholesale Trade 2
Retail Trade 2
Total assets 4
Number of_
active corps._
in sample 7_
Total assets 4
Number of_
active corps._
in sample 8_
Table N -- Composition of the Sample
By NAICS Sector and Size of Total Assets
Manufacturing 1
Mining 2
Total assets 4
Number of_
active corps._
in sample 5_
Total assets 4
Number of_
active corps._
in sample 6_
xxxviiiU.S. Census Bureau, Quarterly Financial Report, 2014 Quarter 4
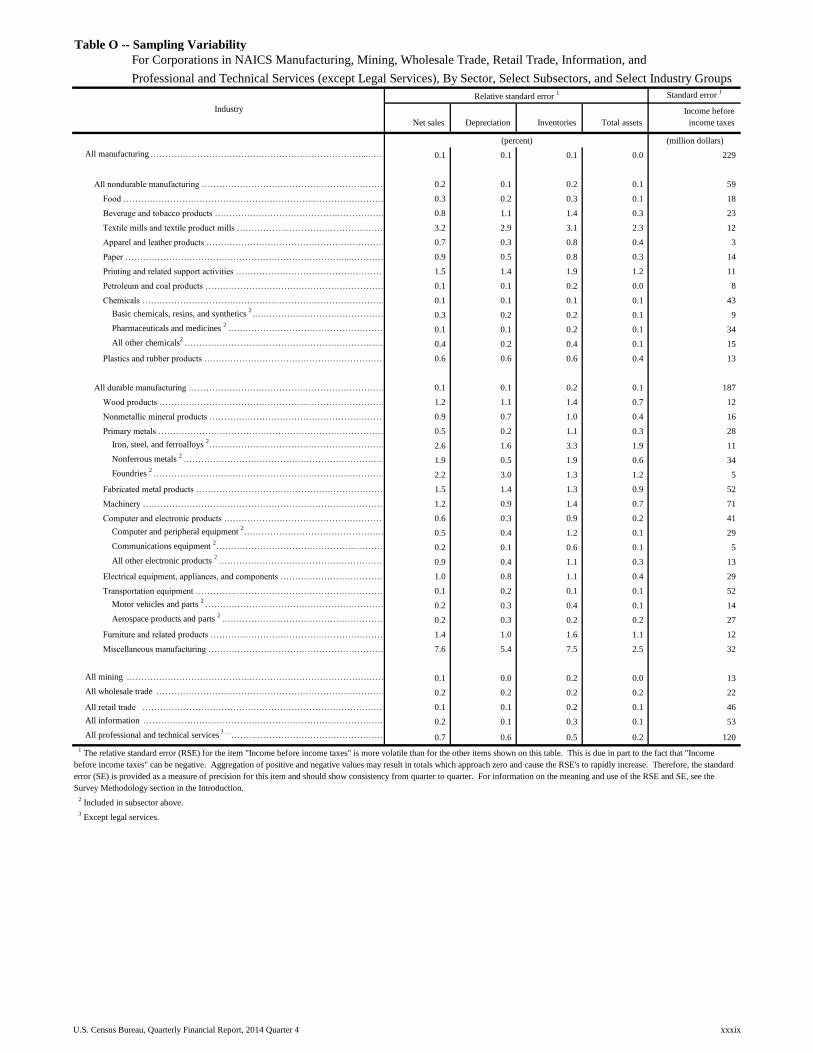
Table with row headers in column A with column headers in rows 4 and 5
Standard error 1
Industry
Net sales_ Depreciation_ Inventories_ Total assets_
Income before_
income taxes_
(million dollars)
All manufacturing ………………………………………………………………...……………………………………………………………...………………………………………………………………………0.1 0.1 0.1 0.0 229
All nondurable manufacturing ……………………………………………………………...……………………………………………...……………………………………………………………0.2 0.1 0.2 0.1 59
Food …………………………………………………………………………………………………...…………………………………………………………………………………………………………………………0.3 0.2 0.3 0.1 18
Beverage and tobacco products ………………………………………………………………………...…………………………………………………………………………………0.8 1.1 1.4 0.3 23
Textile mills and textile product mills ……………………………………………………………………...………………………………………………………………………………………………3.2 2.9 3.1 2.3 12
Apparel and leather products ………………………………………………………………………...……………………………………………………………………………………………………0.7 0.3 0.8 0.4 3
Paper …………………………………………………………………...…………………………………………………………………………...………………………………………………………………………………………0.9 0.5 0.8 0.3 14
Printing and related support activities …………………………………………………………………...……………………………………………………………………………………………1.5 1.4 1.9 1.2 11
Petroleum and coal products ……………………………………………………………………...…………………………………………………………………………………………………………0.1 0.1 0.2 0.0 8
Chemicals …………………………………………………………………………...……………………………………………………………………………...…………………………………………………………………………………………0.1 0.1 0.1 0.1 43
Basic chemicals, resins, and synthetics 2……………………………………………………………………...…………………………………………………………………0.3 0.2 0.2 0.1 9
Pharmaceuticals and medicines 2
…………………………………………………………………...………………………………………………………………………………………………………0.1 0.1 0.2 0.1 34
All other chemicals2
…………………………………………………………………………………...…………………………………………………………………………………………………………………………0.4 0.2 0.4 0.1 15
Plastics and rubber products ………………………………………………………………………...………………………………………………………………………………………………………………0.6 0.6 0.6 0.4 13
All durable manufacturing ………………………………………………………………………...………………………………………………………………………………………0.1 0.1 0.2 0.1 187
Wood products ………………………………………………………………………………………...……………………………………………………………………………………………………1.2 1.1 1.4 0.7 12
Nonmetallic mineral products ………………………………………………………………………...……………………………………………………………………………………………………………………0.9 0.7 1.0 0.4 16
Primary metals ……………………………………………………………………………………………...………………………………………………………………………………………………0.5 0.2 1.1 0.3 28
Iron, steel, and ferroalloys 2……………………………………………………………………………...………………………………………………………………………………………………………………2.6 1.6 3.3 1.9 11
Nonferrous metals 2
…………………………………………………………………………………...…………………………………………………………………………………………………………1.9 0.5 1.9 0.6 34
Foundries 2
…………………………………………………………………………………………...…………………………………………………………………………………………………2.2 3.0 1.3 1.2 5
Fabricated metal products …………………………………………………………………...…………………………………………………………………………………………………………………………1.5 1.4 1.3 0.9 52
Machinery ……………………………………………………………………………………...………………………………………………………………………………………………………1.2 0.9 1.4 0.7 71
Computer and electronic products ………………………………………………………………………...……………………………………………………………………………………………0.6 0.3 0.9 0.2 41
Computer and peripheral equipment 2………………………………………………………………………...……………………………………………………………………………………………0.5 0.4 1.2 0.1 29
Communications equipment 2……………………………………………………………………...………………………………………………………………………………………………………………………0.2 0.1 0.6 0.1 5
All other electronic products 2
…………………………………………………………………………………...…………………………………………………………………………………………………………0.9 0.4 1.1 0.3 13
Electrical equipment, appliances, and components …………………………………………………………………...………………………………………………………………………………………………1.0 0.8 1.1 0.4 29
Transportation equipment ………………………………………………………………………………...……………………………………………………………………………………………………………0.1 0.2 0.1 0.1 52
Motor vehicles and parts 2
…………………………………………………………………………...…………………………………………………………………………………………………………………0.2 0.3 0.4 0.1 14
Aerospace products and parts 2
……………………………………………………………………...………………………………………………………………………………………………………………………0.2 0.3 0.2 0.2 27
Furniture and related products …………………………………………………………………………...…………………………………………………………………………………………………………………1.4 1.0 1.6 1.1 12
Miscellaneous manufacturing ……………………………………………………………………...………………………………………………………………………………………………………………………7.6 5.4 7.5 2.5 32
All mining ………………………………………………………………………………………...………………………………………………………...…………………………………………………………………………………………………………………0.1 0.0 0.2 0.0 13
All wholesale trade ………………………………………………………………………...……………………………………………………………………………………………………………………0.2 0.2 0.2 0.2 22
All retail trade ………………………………………………………………………………………...………………………………………………………...…………………………………………………………………………………………………………………0.1 0.1 0.2 0.1 46
All information ………………………………………………………………………...……………………………………………………………………………………………………………………0.2 0.1 0.3 0.1 53
All professional and technical services 3 …
……………………………………………………………………………...……………………………………………………………………………………………………………0.7 0.6 0.5 0.2 120
3 Except legal services.
Table O -- Sampling Variability
For Corporations in NAICS Manufacturing, Mining, Wholesale Trade, Retail Trade, Information, and
Professional and Technical Services (except Legal Services), By Sector, Select Subsectors, and Select Industry Groups
Relative standard error 1
(percent)
1 The relative standard error (RSE) for the item "Income before income taxes" is more volatile than for the other items shown on this table. This is due in part to the fact that "Income
before income taxes" can be negative. Aggregation of positive and negative values may result in totals which approach zero and cause the RSE's to rapidly increase. Therefore, the standard
error (SE) is provided as a measure of precision for this item and should show consistency from quarter to quarter. For information on the meaning and use of the RSE and SE, see the
Survey Methodology section in the Introduction.
2 Included in subsector above.
xxxixU.S. Census Bureau, Quarterly Financial Report, 2014 Quarter 4
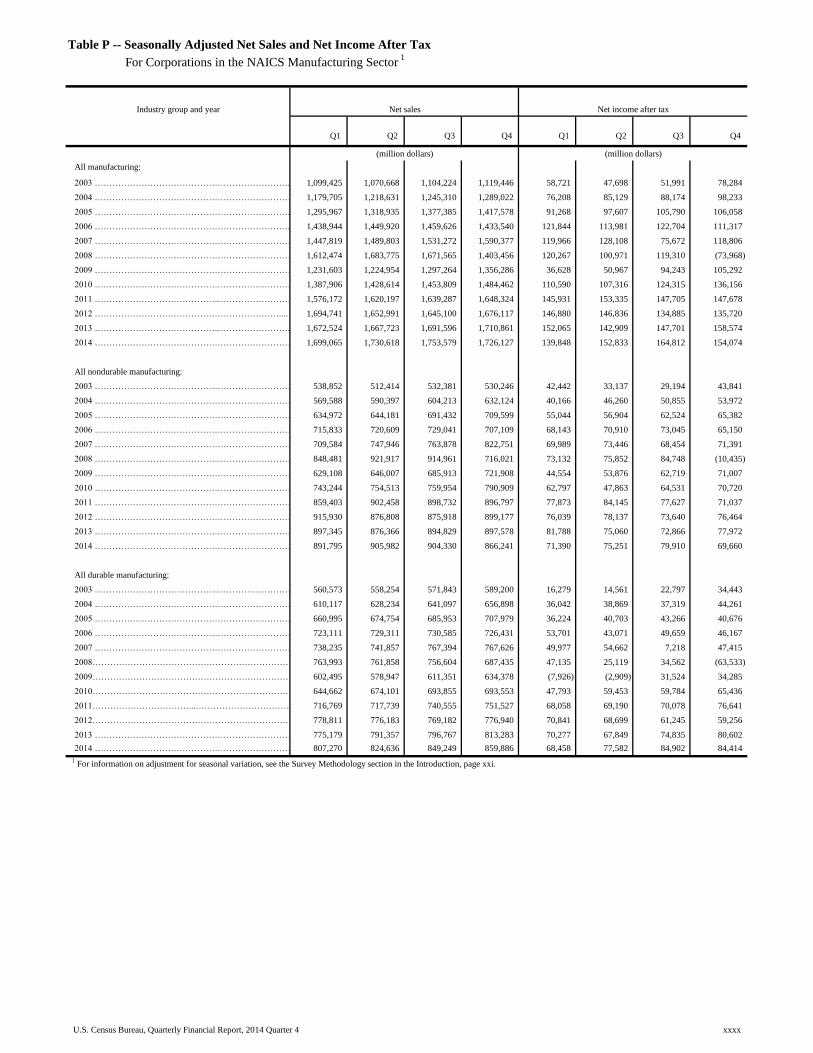
Table with row headers in column A with column headers in rows 4 and 5
Industry group and year
Q1_ Q2_ Q3_ Q4_ Q1_ Q2_ Q3_ Q4_
All manufacturing:
2003 …………………………………………………………...……………………………………………...……………………………………………………...……………………………………………...……………………………………………………………1,099,425 1,070,668 1,104,224 1,119,446 58,721 47,698 51,991 78,284
2004 …………………………………………………………………………………………………...…………………………………………………………………………………………………………………………1,179,705 1,218,631 1,245,310 1,289,022 76,208 85,129 88,174 98,233
2005 …………………………………………………………...……………………………………………...………………………………………………………………...…………………………………………………………………………………1,295,967 1,318,935 1,377,385 1,417,578 91,268 97,607 105,790 106,058
2006 …………………………………………………………...……………………………………………...……………………………………………………………...………………………………………………………………………………………………1,438,944 1,449,920 1,459,626 1,433,540 121,844 113,981 122,704 111,317
2007 ……………………………………………………………………...……………………………………………...……………………………………………………...……………………………………………………………………………………………………1,447,819 1,489,803 1,531,272 1,590,377 119,966 128,108 75,672 118,806
2008 …………………………………………………………………...…………………………………………………………………………...………………………………………………………………………………………1,612,474 1,683,775 1,671,565 1,403,456 120,267 100,971 119,310 (73,968)
2009 ……………………………………………………………………...……………………………………………...………………………………………………...……………………………………………………………………………………………1,231,603 1,224,954 1,297,264 1,356,286 36,628 50,967 94,243 105,292
2010 ………………………………………………………………...……………………………………………...………………………………………………………...…………………………………………………………………………………………………………1,387,906 1,428,614 1,453,809 1,484,462 110,590 107,316 124,315 136,156
2011 …………………………………………………………………………...……………………………………………………………………………...…………………………………………………………………………………………1,576,172 1,620,197 1,639,287 1,648,324 145,931 153,335 147,705 147,678
2012 ………………………………………………………...……………………………………………...………………………………………………………………...…………………………………………………………………1,694,741 1,652,991 1,645,100 1,676,117 146,880 146,836 134,885 135,720
2013 …………………………………………………………...……………………………………………...…………………………………………………………...………………………………………………………………………………………………………1,672,524 1,667,723 1,691,596 1,710,861 152,065 142,909 147,701 158,574
2014 …………………………………………………………………………………...…………………………………………………………………………………………………………………………1,699,065 1,730,618 1,753,579 1,726,127 139,848 152,833 164,812 154,074
All nondurable manufacturing:
2003 …………………………………………………………………...……………………………………………...……………………………………………………………………………...………………………………………………………………………………………………538,852 512,414 532,381 530,246 42,442 33,137 29,194 43,841
2004 ………………………………………………………………………...……………………………………………...…………………………………………………...……………………………………………………………………………………………………………………569,588 590,397 604,213 632,124 40,166 46,260 50,855 53,972
2005 …………………………………………………………………...……………………………………………...……………………………………………………………………………...………………………………………………………………………………………………634,972 644,181 691,432 709,599 55,044 56,904 62,524 65,382
2006 ………………………………………………………………………...……………………………………………...………………………………………………………...………………………………………………………………………………………………………………715,833 720,609 729,041 707,109 68,143 70,910 73,045 65,150
2007 ………………………………………………………………………...……………………………………………...……………………………………………………………...…………………………………………………………………………………………………………709,584 747,946 763,878 822,751 69,989 73,446 68,454 71,391
2008 ………………………………………………………………...……………………………………………...……………………………………………………………………………...…………………………………………………………………………………………………848,481 921,917 914,961 716,021 73,132 75,852 84,748 (10,435)
2009 ………………………………………………………………………...……………………………………………...……………………………………………...…………………………………………………………………………………………………………………………629,108 646,007 685,913 721,908 44,554 53,876 62,719 71,007
2010 ………………………………………………………………………...……………………………………………...………………………………………………………………...………………………………………………………………………………………………………743,244 754,513 759,954 790,909 62,797 47,863 64,531 70,720
2011 ……………………………………………………………………………...……………………………………………...……………………………………………...……………………………………………………………………………………………859,403 902,458 898,732 896,797 77,873 84,145 77,627 71,037
2012 ………………………………………………………………………………...……………………………………………...…………………………………………...……………………………………………………………………………………………915,930 876,808 875,918 899,177 76,039 78,137 73,640 76,464
2013 ……………………………………………………………………………………...……………………………………………...…………………………………...………………………………………………………………………………………………………………………897,345 876,366 894,829 897,578 81,788 75,060 72,866 77,972
2014 ………………………………………………………………………………...……………………………………………...……………………………………………………...…………………………………………………………………………………………………………891,795 905,982 904,330 866,241 71,390 75,251 79,910 69,660
All durable manufacturing:
2003 …………………………………………………………………...……………………………………………...…………………………………………………...………………………………………………………………………………………………560,573 558,254 571,843 589,200 16,279 14,561 22,797 34,443
2004 ………………………………………………………………...……………………………………………...……………………………………………………...………………………………………………………………610,117 628,234 641,097 656,898 36,042 38,869 37,319 44,261
2005 ………………………………………………………………………...……………………………………………...……………………………………………………...…………………………………………………………………………………………………………………660,995 674,754 685,953 707,979 36,224 40,703 43,266 40,676
2006 ………………………………………………………………………...……………………………………………...………………………………………………...………………………………………………………………………………………………………………………723,111 729,311 730,585 726,431 53,701 43,071 49,659 46,167
2007 …………………………………………………………………...……………………………………………...…………………………………………………………...…………………………………………………………………………………………………………………738,235 741,857 767,394 767,626 49,977 54,662 7,218 47,415
2008………………………………………………………………………...……………………………………………...………………………………………………...………………………………………………………………………………………………………………………763,993 761,858 756,604 687,435 47,135 25,119 34,562 (63,533)
2009………………………………………………………………………………...……………………………………………...……………………………………...………………………………………………………………………………………………………………………602,495 578,947 611,351 634,378 (7,926) (2,909) 31,524 34,285
2010……………………………………………………………………………………...……………………………………………...………………………………...………………………………………………………………………………………………………………………644,662 674,101 693,855 693,553 47,793 59,453 59,784 65,436
2011……………………………...……………………………………………………...……………………………………………...……………………………………………………...…………………………………………………………………………………………………………………716,769 717,739 740,555 751,527 68,058 69,190 70,078 76,641
2012…………………………………………………………………………………...……………………………………………...…………………………………...………………………………………………………………………………………………………………………778,811 776,183 769,182 776,940 70,841 68,699 61,245 59,256
2013 ……………………………………………………………………………...……………………………………………...……………………………………………...……………………………………………………………………………………………………………………775,179 791,357 796,767 813,283 70,277 67,849 74,835 80,602
2014 ……………………………………………………………………………...……………………………………………...……………………………………………………...……………………………………………………………………………………………………………807,270 824,636 849,249 859,886 68,458 77,582 84,902 84,414
1 For information on adjustment for seasonal variation, see the Survey Methodology section in the Introduction, page xxi.
Table P -- Seasonally Adjusted Net Sales and Net Income After Tax
For Corporations in the NAICS Manufacturing Sector 1
Net sales Net income after tax
(million dollars) (million dollars)
xxxxU.S. Census Bureau, Quarterly Financial Report, 2014 Quarter 4
This workbook consist of 170 financial tables - 85 income and 85 balance sheets.
FINANCIAL DATA TABLES
Some data in these tables are revised to reflect additional
information and/or corrections submitted by respondents
subsequent to last quarter’s publication.
1U.S. Census Bureau, Quarterly Financial Report, 2014 Quarter 4

Table with row headers in column A with column headers in rows 5 and 6
Item
4Q_
2013_
1Q_
2014_
2Q_
2014_
3Q_
2014_
4Q_
2014_
4Q_
2013_
1Q_
2014_
2Q_
2014_
3Q_
2014_
4Q_
2014_
Net sales, receipts, and operating revenues ………………………………………………………………………………………………………………………………………………………………………1,709,153 1,651,529 1,767,593 1,766,597 1,726,125 154,683 146,991 160,883 163,754 162,326
Depreciation, depletion, and amortization of property,
plant, and equipment …………………………………………………………………………………………………………………………………………………………………………………………45,578 43,939 44,898 45,639 47,258 3,424 2,987 2,990 3,096 3,518
All other operating costs and expenses …………………………………………………………………………………………………………...……………………………………………………………1,547,684 1,489,043 1,572,868 1,572,900 1,555,183 146,332 132,520 142,920 145,160 152,749
Income (loss) from operations …………………………………………………………………………………………………………...……………………………………………………………115,892 118,547 149,827 148,058 123,684 4,928 11,484 14,973 15,499 6,060
Interest expense …………………………………………………………………………………………………………………………………………………………………………………………………………………………………………28,104 27,827 27,733 27,677 28,706 1,134 985 1,016 1,020 1,035
All other nonoperating income (expense) ……………………………………………………………………………………………………………………………………………………………………………………………………83,209 77,796 80,823 85,047 75,044 199 82 47 128 146
Income (loss) before income taxes ………………………………………………………………………………………………………………………………………………………………………………………………170,997 168,516 202,917 205,429 170,022 3,992 10,581 14,004 14,607 5,171
Provision for current and deferred domestic income taxes …………………………………………………………………………………………………………………………………………………………………………………………24,314 31,047 38,665 37,744 27,464 1,209 1,066 1,291 1,422 1,226
Income (loss) after income taxes …………………………………………………………………………………………………………………………………………………………………………………………………………146,682 137,469 164,252 167,685 142,557 2,783 9,515 12,713 13,186 3,945
Cash dividends charged to retained earnings this quarter ……………………………………………………………………………………………………………………………………………………………………………………60,423 58,872 66,178 65,238 71,458 4,425 5,056 5,648 5,336 5,363
Net income retained in business ……………………………………………………………………………………………………………………………………………………………………………………………………86,260 78,596 98,074 102,446 71,100 (1,642) 4,459 7,066 7,849 (1,418)
Retained earnings at beginning of quarter …………………………………………………………………………………………………………………………………………………………………………………………………………2,848,125 2,922,338 2,950,427 3,018,745 3,093,203 89,143 86,188 87,850 96,394 107,454
Other direct credits (charges) to retained earnings (net), including
stock and other non-cash dividends, etc. ……………………………………………………………………………………………………………………………………………………………………………………………………………………………(15,358) (36,548) (20,510) (32,565) (24,769) (1,239) (1,654) (793) (533) (429)
Retained earnings at end of quarter ……………………………………………………………………………………………………………………………………………………………………………………………………2,919,026 2,964,387 3,027,992 3,088,626 3,139,534 86,262 88,993 94,122 103,710 105,607
INCOME STATEMENT IN RATIO FORMAT
Net sales, receipts, and operating revenues ……………………………………………………………………………………………………………………………………………………………………………………………………100.00 100.00 100.00 100.00 100.00 100.00 100.00 100.00 100.00 100.00
Depreciation, depletion, and amortization of property,
plant, and equipment ………………………………………………………………………………………………………………………………………………………………………2.67 2.66 2.54 2.58 2.74 2.21 2.03 1.86 1.89 2.17
All other operating costs and expenses ……………………………………………………………………………………………………………………………………………………………………………………………………90.55 90.16 88.98 89.04 90.10 94.60 90.16 88.83 88.64 94.10
Income (loss) from operations …………………………………………………………………………………………………………………………………………………………………………………………………6.78 7.18 8.48 8.38 7.17 3.19 7.81 9.31 9.46 3.73
Interest expense …………………………………………………………………………………………………………………………………………………………………………………………………………………………………1.64 1.68 1.57 1.57 1.66 0.73 0.67 0.63 0.62 0.64
All other nonoperating income (expense) ……………………………………………………………………………………………………………………………………………………………………………………………4.87 4.71 4.57 4.81 4.35 0.13 0.06 0.03 0.08 0.09
Income (loss) before income taxes ……………………………………………………………………………………………………………………………………………………………………………………………10.00 10.20 11.48 11.63 9.85 2.58 7.20 8.70 8.92 3.19
Provision for current and deferred domestic income taxes ……………………………………………………………………………………………………………………………………………………………………………………1.42 1.88 2.19 2.14 1.59 0.78 0.73 0.80 0.87 0.76
Income (loss) after income taxes ………………………………………………………………………………………………………………………………………………………………………………………………8.58 8.32 9.29 9.49 8.26 1.80 6.47 7.90 8.05 2.43
OPERATING RATIOS
(see explanatory notes)
Annual rate of profit on stockholders' equity at end of period:
Before income taxes ……………………………………………………………………………………………………………………………………………………………………………………………………………………17.09 16.80 19.97 20.14 17.12 11.37 30.02 38.89 38.80 13.64
After income taxes ………………………………………………………………………………………………………………………………………………………………………………………………………………14.66 13.70 16.16 16.44 14.35 7.93 26.99 35.31 35.02 10.41
Annual rate of profit on total assets:
Before income taxes ………………………………………………………………………………………………………………………………………………………………………………………………………………7.74 7.56 8.99 9.03 7.46 5.51 14.56 18.96 19.31 6.84
After income taxes …………………………………………………………………………………………………………………………………………………………………………………………………………………………6.64 6.16 7.27 7.37 6.26 3.84 13.09 17.21 17.43 5.22
BALANCE SHEET RATIOS
(based on succeeding table)
Total current assets to total current liabilities …………………………………………………………………………………………………………………………………………………………………………………………………1.38 1.37 1.39 1.37 1.36 2.20 2.18 2.17 2.23 2.21
Total cash, U.S. Government and other securities, to total current liabilities …………………………………………………………………………………………………………………………………………………………………0.33 0.30 0.30 0.29 0.30 0.53 0.51 0.51 0.53 0.52
Total stockholders' equity to total debt ………………………………………………………………………………………………………………………………………………………………………………………………………1.81 1.75 1.75 1.73 1.67 1.72 1.72 1.76 1.84 1.88
(percent of net sales) (percent of net sales)
(percent) (percent)
Table 1.0 -- Income Statement For Corporations in the NAICS Manufacturing Sector,
All Total Asset Sizes, and Total Assets Under $25 Million
See the Survey Methodology section of the Introduction for information on survey design, estimation, and sampling error.
All Manufacturing
All Total Asset Sizes
All Manufacturing
Total Assets Under $25 Million
(million dollars) (million dollars)
2U.S. Census Bureau, Quarterly Financial Report, 2014 Quarter 4
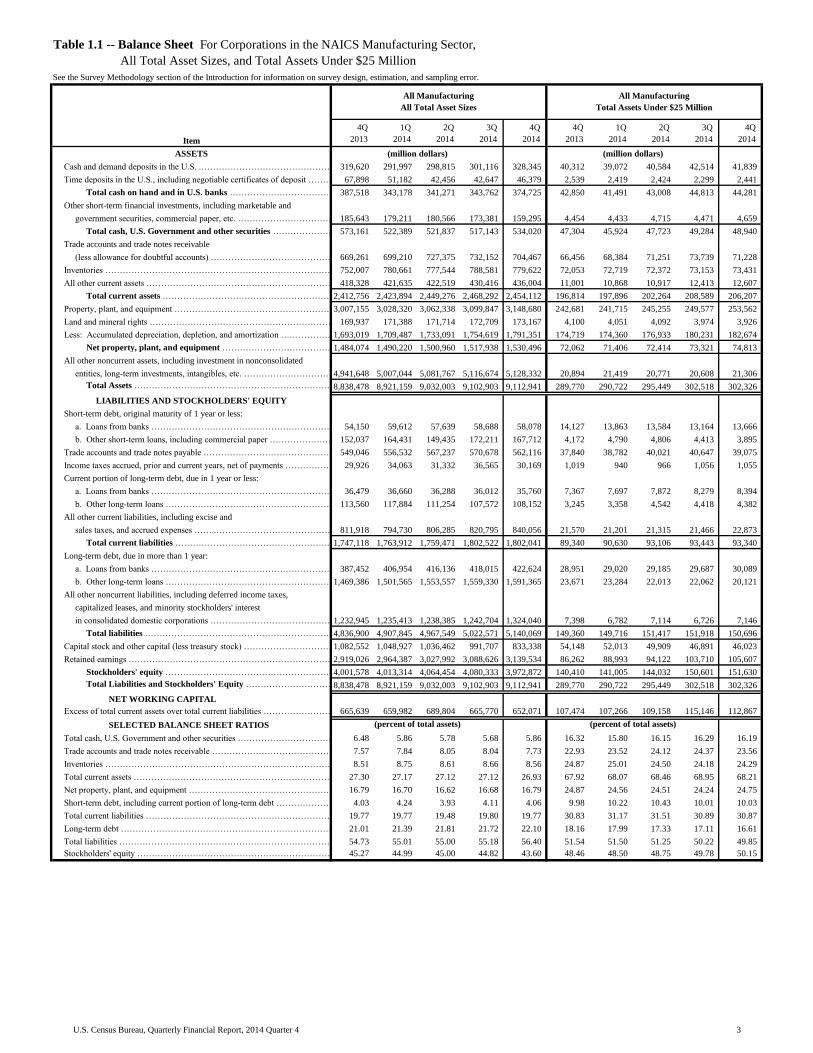
Table with row headers in column A with column headers in rows 5 and 6
Item
4Q_
2013_
1Q_
2014_
2Q_
2014_
3Q_
2014_
4Q_
2014_
4Q_
2013_
1Q_
2014_
2Q_
2014_
3Q_
2014_
4Q_
2014_
ASSETS
Cash and demand deposits in the U.S. .………………………………………………………………………………………………………………………………………………………………………………………………………………………………319,620 291,997 298,815 301,116 328,345 40,312 39,072 40,584 42,514 41,839
Time deposits in the U.S., including negotiable certificates of deposit ……………………………………………………………………………………………………………………………………………………………………………………67,898 51,182 42,456 42,647 46,379 2,539 2,419 2,424 2,299 2,441
Total cash on hand and in U.S. banks ……………………………………………………………………………………………………………………………………………………………………………………387,518 343,178 341,271 343,762 374,725 42,850 41,491 43,008 44,813 44,281
Other short-term financial investments, including marketable and
government securities, commercial paper, etc. ………………………………………………………………………………………………………………………………………………………………………………………………………………………………185,643 179,211 180,566 173,381 159,295 4,454 4,433 4,715 4,471 4,659
Total cash, U.S. Government and other securities ……………………………………………………………………………………………………………………………………………………………………………………573,161 522,389 521,837 517,143 534,020 47,304 45,924 47,723 49,284 48,940
Trade accounts and trade notes receivable
(less allowance for doubtful accounts) …………………………………………………………………………………………………………………………………………669,261 699,210 727,375 732,152 704,467 66,456 68,384 71,251 73,739 71,228
Inventories ………………………………………………………………………………………………………………………………………………………………………………………………………………………………752,007 780,661 777,544 788,581 779,622 72,053 72,719 72,372 73,153 73,431
All other current assets ………………………………………………………………………………………………………………………………………………………………………………………………………………………………418,328 421,635 422,519 430,416 436,004 11,001 10,868 10,917 12,413 12,607
Total current assets ………………………………………………………………………………………………………………………………………………………………………………………………………………………………2,412,756 2,423,894 2,449,276 2,468,292 2,454,112 196,814 197,896 202,264 208,589 206,207
Property, plant, and equipment ………………………………………………………………………………………………………………………………………………………………………………………………………………………………3,007,155 3,028,320 3,062,338 3,099,847 3,148,680 242,681 241,715 245,255 249,577 253,562
Land and mineral rights ………………………………………………………………………………………………………………………………………………………………………………………………………………………………169,937 171,388 171,714 172,709 173,167 4,100 4,051 4,092 3,974 3,926
Less: Accumulated depreciation, depletion, and amortization ……………………………………………………………………………………………………………………………………………………………………………………1,693,019 1,709,487 1,733,091 1,754,619 1,791,351 174,719 174,360 176,933 180,231 182,674
Net property, plant, and equipment ……………………………………………………………………………………………………………………………………………………………………………………1,484,074 1,490,220 1,500,960 1,517,938 1,530,496 72,062 71,406 72,414 73,321 74,813
All other noncurrent assets, including investment in nonconsolidated
entities, long-term investments, intangibles, etc. ………………………………………………………………………………………………………………………………………………………………………………………………………………4,941,648 5,007,044 5,081,767 5,116,674 5,128,332 20,894 21,419 20,771 20,608 21,306
Total Assets …………………………………………………………………………………………………………………………………………………………………………………………………………………………8,838,478 8,921,159 9,032,003 9,102,903 9,112,941 289,770 290,722 295,449 302,518 302,326
LIABILITIES AND STOCKHOLDERS' EQUITY
Short-term debt, original maturity of 1 year or less:
a. Loans from banks ………………………………………………………………………………………………………………………………………………………………………………………………………………………54,150 59,612 57,639 58,688 58,078 14,127 13,863 13,584 13,164 13,666
b. Other short-term loans, including commercial paper ………………………………………………………………………………………………………………………………………………………………………………………152,037 164,431 149,435 172,211 167,712 4,172 4,790 4,806 4,413 3,895
Trade accounts and trade notes payable ……………………………………………………………………………………………………………………………………………………………………………………………………………549,046 556,532 567,237 570,678 562,116 37,840 38,782 40,021 40,647 39,075
Income taxes accrued, prior and current years, net of payments ………………………………………………………………………………………………………………………………………………………………………………29,926 34,063 31,332 36,565 30,169 1,019 940 966 1,056 1,055
Current portion of long-term debt, due in 1 year or less:
a. Loans from banks …………………………………………………………………………………………………………………………………………………………………………………………………………………………………36,479 36,660 36,288 36,012 35,760 7,367 7,697 7,872 8,279 8,394
b. Other long-term loans ……………………………………………………………………………………………………………………………………………………………………………………………………………………113,560 117,884 111,254 107,572 108,152 3,245 3,358 4,542 4,418 4,382
All other current liabilities, including excise and
sales taxes, and accrued expenses ……..……………………………………………………………………………………………………………………………………………………811,918 794,730 806,285 820,795 840,056 21,570 21,201 21,315 21,466 22,873
Total current liabilities ……………………………………………………………………………………………………………………………………………………………………………………………………………………1,747,118 1,763,912 1,759,471 1,802,522 1,802,041 89,340 90,630 93,106 93,443 93,340
Long-term debt, due in more than 1 year:
a. Loans from banks …………………………………………………………………………………………………………………………………………………………………………………………………………………………387,452 406,954 416,136 418,015 422,624 28,951 29,020 29,185 29,687 30,089
b. Other long-term loans ……………………………………………………………………………………………………………………………………………………………………………………………………………………1,469,386 1,501,565 1,553,557 1,559,330 1,591,365 23,671 23,284 22,013 22,062 20,121
All other noncurrent liabilities, including deferred income taxes,
capitalized leases, and minority stockholders' interest
in consolidated domestic corporations ……………………………………………………………………………………………………………………………………………………………………1,232,945 1,235,413 1,238,385 1,242,704 1,324,040 7,398 6,782 7,114 6,726 7,146
Total liabilities ……………………………………………………………………………………………………………………………………………………………………………………………………………………………4,836,900 4,907,845 4,967,549 5,022,571 5,140,069 149,360 149,716 151,417 151,918 150,696
Capital stock and other capital (less treasury stock) …………………………………………………………………………………………………………………………………………………………………………………………1,082,552 1,048,927 1,036,462 991,707 833,338 54,148 52,013 49,909 46,891 46,023
Retained earnings …………………………………………………………………………………………………………………………………………………………………………………………………………………………………2,919,026 2,964,387 3,027,992 3,088,626 3,139,534 86,262 88,993 94,122 103,710 105,607
Stockholders' equity ……………………………………………………………………………………………………………………………………………………………………………………………………………………4,001,578 4,013,314 4,064,454 4,080,333 3,972,872 140,410 141,005 144,032 150,601 151,630
Total Liabilities and Stockholders' Equity ………………………………………………………………………………………………………………………………………………………………………………………………8,838,478 8,921,159 9,032,003 9,102,903 9,112,941 289,770 290,722 295,449 302,518 302,326
NET WORKING CAPITAL
Excess of total current assets over total current liabilities ………………………………………………………………………………………………………………………………………………………………………………………665,639 659,982 689,804 665,770 652,071 107,474 107,266 109,158 115,146 112,867
SELECTED BALANCE SHEET RATIOS
Total cash, U.S. Government and other securities …………………………………………………………………………………………………………………………………………………………………………………………………6.48 5.86 5.78 5.68 5.86 16.32 15.80 16.15 16.29 16.19
Trade accounts and trade notes receivable ……………………………………………………………………………………………………………………………………………………………………………………………………7.57 7.84 8.05 8.04 7.73 22.93 23.52 24.12 24.37 23.56
Inventories ……………………………………………………………………………………………………………………………………………………………………………………………………………………………………8.51 8.75 8.61 8.66 8.56 24.87 25.01 24.50 24.18 24.29
Total current assets …………………………………………………………………………………………………………………………………………………………………………………………………………………………27.30 27.17 27.12 27.12 26.93 67.92 68.07 68.46 68.95 68.21
Net property, plant, and equipment ……………………………………………………………………………………………………………………………………………………………………………………………………………16.79 16.70 16.62 16.68 16.79 24.87 24.56 24.51 24.24 24.75
Short-term debt, including current portion of long-term debt ………………………………………………………………………………………………………………………………………………………………………………………4.03 4.24 3.93 4.11 4.06 9.98 10.22 10.43 10.01 10.03
Total current liabilities …………………………………………………………………………………………………………………………………………………………………………………………………………………………………19.77 19.77 19.48 19.80 19.77 30.83 31.17 31.51 30.89 30.87
Long-term debt …………………………………………………………………………………………………………………………………………………………………………………………………………………………………21.01 21.39 21.81 21.72 22.10 18.16 17.99 17.33 17.11 16.61
Total liabilities …………………………………………………………………………………………………………………………………………………………………………………………………………………………………54.73 55.01 55.00 55.18 56.40 51.54 51.50 51.25 50.22 49.85
Stockholders' equity ………………………………………………………………………………………………………………………………………………………………………………………………………………………………45.27 44.99 45.00 44.82 43.60 48.46 48.50 48.75 49.78 50.15
Table 1.1 -- Balance Sheet For Corporations in the NAICS Manufacturing Sector,
All Total Asset Sizes, and Total Assets Under $25 Million
See the Survey Methodology section of the Introduction for information on survey design, estimation, and sampling error.
(million dollars)
(percent of total assets)
(million dollars)
(percent of total assets)
All Manufacturing
All Total Asset Sizes
All Manufacturing
Total Assets Under $25 Million
3U.S. Census Bureau, Quarterly Financial Report, 2014 Quarter 4

Table with row headers in column A with column headers in rows 5 and 6
Item
4Q_
2013_
1Q_
2014_
2Q_
2014_
3Q_
2014_
4Q_
2014_
4Q_
2013_
1Q_
2014_
2Q_
2014_
3Q_
2014_
4Q_
2014_
Net sales, receipts, and operating revenues ………………………………………………………………………………………………………………………………………………………………………888,992 869,942 927,220 914,048 858,026 57,129 52,989 57,794 58,745 57,633
Depreciation, depletion, and amortization of property,
plant, and equipment …………………………………………………………………………………………………………………………………………………………………………………………23,277 22,659 23,417 24,032 24,829 1,225 1,138 1,126 1,198 1,293
All other operating costs and expenses …………………………………………………………………………………………………………...……………………………………………………………808,265 786,621 828,379 818,608 778,116 53,877 48,616 52,185 53,195 54,650
Income (loss) from operations …………………………………………………………………………………………………………...……………………………………………………………57,450 60,662 75,424 71,409 55,082 2,026 3,235 4,483 4,353 1,690
Interest expense …………………………………………………………………………………………………………………………………………………………………………………………………………………………………………16,102 15,920 15,684 15,668 16,231 348 337 339 374 376
All other nonoperating income (expense) ……………………………………………………………………………………………………………………………………………………………………………………………………37,256 42,892 40,841 44,661 33,959 119 47 48 71 87
Income (loss) before income taxes ………………………………………………………………………………………………………………………………………………………………………………………………78,604 87,634 100,581 100,402 72,809 1,797 2,946 4,192 4,050 1,401
Provision for current and deferred domestic income taxes …………………………………………………………………………………………………………………………………………………………………………………………7,843 16,077 19,975 18,876 9,981 343 338 373 396 357
Income (loss) after income taxes …………………………………………………………………………………………………………………………………………………………………………………………………………70,761 71,557 80,606 81,526 62,828 1,455 2,608 3,820 3,654 1,044
Cash dividends charged to retained earnings this quarter ……………………………………………………………………………………………………………………………………………………………………………………33,619 31,367 34,512 33,016 37,438 1,474 1,449 1,606 1,753 1,300
Net income retained in business ……………………………………………………………………………………………………………………………………………………………………………………………………37,142 40,190 46,094 48,510 25,389 (19) 1,159 2,214 1,900 (256)
Retained earnings at beginning of quarter …………………………………………………………………………………………………………………………………………………………………………………………………………1,682,561 1,718,412 1,746,536 1,776,048 1,815,482 28,011 29,049 30,260 32,186 32,766
Other direct credits (charges) to retained earnings (net), including
stock and other non-cash dividends, etc. ……………………………………………………………………………………………………………………………………………………………………………………………………………………………(3,853) (6,846) (6,383) (5,895) (7,484) (820) (299) (327) (252) (207)
Retained earnings at end of quarter ……………………………………………………………………………………………………………………………………………………………………………………………………1,715,850 1,751,756 1,786,247 1,818,663 1,833,388 27,171 29,909 32,147 33,835 32,304
INCOME STATEMENT IN RATIO FORMAT
Net sales, receipts, and operating revenues ……………………………………………………………………………………………………………………………………………………………………………………………………100.00 100.00 100.00 100.00 100.00 100.00 100.00 100.00 100.00 100.00
Depreciation, depletion, and amortization of property,
plant, and equipment ………………………………………………………………………………………………………………………………………………………………………2.62 2.60 2.53 2.63 2.89 2.14 2.15 1.95 2.04 2.24
All other operating costs and expenses ……………………………………………………………………………………………………………………………………………………………………………………………………90.92 90.42 89.34 89.56 90.69 94.31 91.75 90.30 90.55 94.82
Income (loss) from operations …………………………………………………………………………………………………………………………………………………………………………………………………6.46 6.97 8.13 7.81 6.42 3.55 6.11 7.76 7.41 2.93
Interest expense …………………………………………………………………………………………………………………………………………………………………………………………………………………………………1.81 1.83 1.69 1.71 1.89 0.61 0.64 0.59 0.64 0.65
All other nonoperating income (expense) ……………………………………………………………………………………………………………………………………………………………………………………………4.19 4.93 4.40 4.89 3.96 0.21 0.09 0.08 0.12 0.15
Income (loss) before income taxes ……………………………………………………………………………………………………………………………………………………………………………………………8.84 10.07 10.85 10.98 8.49 3.15 5.56 7.25 6.89 2.43
Provision for current and deferred domestic income taxes ……………………………………………………………………………………………………………………………………………………………………………………0.88 1.85 2.15 2.07 1.16 0.60 0.64 0.64 0.67 0.62
Income (loss) after income taxes ………………………………………………………………………………………………………………………………………………………………………………………………7.96 8.23 8.69 8.92 7.32 2.55 4.92 6.61 6.22 1.81
OPERATING RATIOS
(see explanatory notes)
Annual rate of profit on stockholders' equity at end of period:
Before income taxes ……………………………………………………………………………………………………………………………………………………………………………………………………………………16.05 17.69 20.04 19.80 14.69 16.06 25.83 36.36 34.11 11.99
After income taxes ………………………………………………………………………………………………………………………………………………………………………………………………………………14.45 14.45 16.06 16.08 12.68 13.00 22.87 33.13 30.77 8.94
Annual rate of profit on total assets:
Before income taxes ………………………………………………………………………………………………………………………………………………………………………………………………………………7.05 7.79 8.86 8.73 6.32 7.47 12.20 17.11 16.02 5.74
After income taxes …………………………………………………………………………………………………………………………………………………………………………………………………………………………6.35 6.36 7.10 7.09 5.45 6.05 10.80 15.59 14.45 4.28
BALANCE SHEET RATIOS
(based on succeeding table)
Total current assets to total current liabilities …………………………………………………………………………………………………………………………………………………………………………………………………1.24 1.25 1.28 1.25 1.25 2.11 2.10 2.07 2.06 2.08
Total cash, U.S. Government and other securities, to total current liabilities …………………………………………………………………………………………………………………………………………………………………0.25 0.22 0.22 0.23 0.24 0.46 0.44 0.43 0.43 0.44
Total stockholders' equity to total debt ………………………………………………………………………………………………………………………………………………………………………………………………………1.51 1.48 1.49 1.48 1.43 1.55 1.59 1.61 1.62 1.67
(percent of net sales) (percent of net sales)
(percent) (percent)
Table 2.0 -- Income Statement For Corporations in NAICS Nondurable Manufacturing Subsectors,
All Total Asset Sizes, and Total Assets Under $25 Million
See the Survey Methodology section of the Introduction for information on survey design, estimation, and sampling error.
All Nondurable Manufacturing
All Total Asset Sizes
All Nondurable Manufacturing
Total Assets Under $25 Million
(million dollars) (million dollars)
4U.S. Census Bureau, Quarterly Financial Report, 2014 Quarter 4

Table with row headers in column A with column headers in rows 5 and 6
Item
4Q_
2013_
1Q_
2014_
2Q_
2014_
3Q_
2014_
4Q_
2014_
4Q_
2013_
1Q_
2014_
2Q_
2014_
3Q_
2014_
4Q_
2014_
ASSETS
Cash and demand deposits in the U.S. .………………………………………………………………………………………………………………………………………………………………………………………………………………………………121,062 105,825 109,118 109,626 123,727 11,373 10,927 11,186 11,526 10,960
Time deposits in the U.S., including negotiable certificates of deposit ……………………………………………………………………………………………………………………………………………………………………………………32,548 25,952 19,351 21,379 23,238 498 495 510 515 538
Total cash on hand and in U.S. banks ……………………………………………………………………………………………………………………………………………………………………………………153,610 131,777 128,469 131,006 146,965 11,871 11,422 11,696 12,040 11,498
Other short-term financial investments, including marketable and
government securities, commercial paper, etc. ………………………………………………………………………………………………………………………………………………………………………………………………………………………………46,978 48,558 48,144 55,320 44,340 1,581 1,443 1,269 1,304 1,542
Total cash, U.S. Government and other securities ……………………………………………………………………………………………………………………………………………………………………………………200,588 180,334 176,613 186,326 191,305 13,452 12,865 12,965 13,344 13,039
Trade accounts and trade notes receivable
(less allowance for doubtful accounts) …………………………………………………………………………………………………………………………………………306,959 318,110 332,786 330,205 318,418 21,985 22,643 23,493 24,284 22,758
Inventories ………………………………………………………………………………………………………………………………………………………………………………………………………………………………306,470 317,000 310,892 312,509 308,577 22,456 22,728 22,877 23,315 22,182
All other current assets ………………………………………………………………………………………………………………………………………………………………………………………………………………………………185,700 194,344 192,796 198,591 197,928 3,597 3,369 3,341 3,698 3,622
Total current assets ………………………………………………………………………………………………………………………………………………………………………………………………………………………………999,717 1,009,787 1,013,087 1,027,631 1,016,228 61,489 61,604 62,675 64,641 61,601
Property, plant, and equipment ………………………………………………………………………………………………………………………………………………………………………………………………………………………………1,670,420 1,685,811 1,704,153 1,727,493 1,750,910 87,390 87,576 88,574 91,503 91,003
Land and mineral rights ………………………………………………………………………………………………………………………………………………………………………………………………………………………………104,354 104,712 104,517 105,350 105,839 1,367 1,274 1,377 1,301 1,223
Less: Accumulated depreciation, depletion, and amortization ……………………………………………………………………………………………………………………………………………………………………………………900,145 912,572 925,249 936,826 951,692 61,187 61,195 62,038 63,779 63,528
Net property, plant, and equipment ……………………………………………………………………………………………………………………………………………………………………………………874,628 877,951 883,421 896,017 905,058 27,571 27,654 27,913 29,025 28,698
All other noncurrent assets, including investment in nonconsolidated
entities, long-term investments, intangibles, etc. ………………………………………………………………………………………………………………………………………………………………………………………………………………2,582,816 2,613,646 2,646,535 2,674,298 2,686,160 7,155 7,369 7,400 7,457 7,284
Total Assets …………………………………………………………………………………………………………………………………………………………………………………………………………………………4,457,161 4,501,385 4,543,044 4,597,945 4,607,446 96,215 96,628 97,988 101,122 97,583
LIABILITIES AND STOCKHOLDERS' EQUITY
Short-term debt, original maturity of 1 year or less:
a. Loans from banks ………………………………………………………………………………………………………………………………………………………………………………………………………………………23,015 22,453 21,553 23,091 23,403 4,887 4,850 4,941 4,924 4,894
b. Other short-term loans, including commercial paper ………………………………………………………………………………………………………………………………………………………………………………………114,839 121,928 108,688 128,432 123,272 875 1,027 974 806 570
Trade accounts and trade notes payable ……………………………………………………………………………………………………………………………………………………………………………………………………………267,023 265,057 267,594 264,842 260,463 13,939 14,284 15,046 15,661 14,313
Income taxes accrued, prior and current years, net of payments ………………………………………………………………………………………………………………………………………………………………………………16,012 18,323 16,858 22,144 17,833 329 258 334 290 305
Current portion of long-term debt, due in 1 year or less:
a. Loans from banks …………………………………………………………………………………………………………………………………………………………………………………………………………………………………15,463 16,128 16,756 15,825 16,517 2,516 2,580 2,531 2,723 2,593
b. Other long-term loans ……………………………………………………………………………………………………………………………………………………………………………………………………………………68,138 71,036 70,032 69,910 69,213 1,031 990 1,203 1,097 1,132
All other current liabilities, including excise and
sales taxes, and accrued expenses ……..……………………………………………………………………………………………………………………………………………………302,937 291,203 289,625 294,814 302,328 5,602 5,322 5,256 5,809 5,825
Total current liabilities ……………………………………………………………………………………………………………………………………………………………………………………………………………………807,427 806,127 791,107 819,058 813,029 29,179 29,310 30,285 31,310 29,632
Long-term debt, due in more than 1 year:
a. Loans from banks …………………………………………………………………………………………………………………………………………………………………………………………………………………………197,819 204,940 205,592 205,937 209,486 10,884 11,057 11,239 11,670 11,173
b. Other long-term loans ……………………………………………………………………………………………………………………………………………………………………………………………………………………878,168 898,030 926,008 924,787 947,890 8,740 8,151 7,761 8,108 7,562
All other noncurrent liabilities, including deferred income taxes,
capitalized leases, and minority stockholders' interest
in consolidated domestic corporations ……………………………………………………………………………………………………………………………………………………………………614,377 610,959 612,636 620,315 654,411 2,651 2,490 2,588 2,545 2,494
Total liabilities ……………………………………………………………………………………………………………………………………………………………………………………………………………………………2,497,791 2,520,057 2,535,343 2,570,097 2,624,815 51,455 51,008 51,872 53,634 50,862
Capital stock and other capital (less treasury stock) …………………………………………………………………………………………………………………………………………………………………………………………243,520 229,571 221,454 209,185 149,243 17,588 15,711 13,969 13,653 14,418
Retained earnings …………………………………………………………………………………………………………………………………………………………………………………………………………………………………1,715,850 1,751,756 1,786,247 1,818,663 1,833,388 27,171 29,909 32,147 33,835 32,304
Stockholders' equity ……………………………………………………………………………………………………………………………………………………………………………………………………………………1,959,370 1,981,328 2,007,701 2,027,849 1,982,631 44,760 45,620 46,116 47,488 46,721
Total Liabilities and Stockholders' Equity ………………………………………………………………………………………………………………………………………………………………………………………………4,457,161 4,501,385 4,543,044 4,597,945 4,607,446 96,215 96,628 97,988 101,122 97,583
NET WORKING CAPITAL
Excess of total current assets over total current liabilities ………………………………………………………………………………………………………………………………………………………………………………………192,290 203,660 221,981 208,573 203,199 32,310 32,294 32,391 33,330 31,969
SELECTED BALANCE SHEET RATIOS
Total cash, U.S. Government and other securities …………………………………………………………………………………………………………………………………………………………………………………………………4.50 4.01 3.89 4.05 4.15 13.98 13.31 13.23 13.20 13.36
Trade accounts and trade notes receivable ……………………………………………………………………………………………………………………………………………………………………………………………………6.89 7.07 7.33 7.18 6.91 22.85 23.43 23.98 24.01 23.32
Inventories ……………………………………………………………………………………………………………………………………………………………………………………………………………………………………6.88 7.04 6.84 6.80 6.70 23.34 23.52 23.35 23.06 22.73
Total current assets …………………………………………………………………………………………………………………………………………………………………………………………………………………………22.43 22.43 22.30 22.35 22.06 63.91 63.75 63.96 63.92 63.13
Net property, plant, and equipment ……………………………………………………………………………………………………………………………………………………………………………………………………………19.62 19.50 19.45 19.49 19.64 28.66 28.62 28.49 28.70 29.41
Short-term debt, including current portion of long-term debt ………………………………………………………………………………………………………………………………………………………………………………………4.97 5.14 4.78 5.16 5.04 9.67 9.78 9.85 9.44 9.42
Total current liabilities …………………………………………………………………………………………………………………………………………………………………………………………………………………………………18.12 17.91 17.41 17.81 17.65 30.33 30.33 30.91 30.96 30.37
Long-term debt …………………………………………………………………………………………………………………………………………………………………………………………………………………………………24.14 24.50 24.91 24.59 25.12 20.40 19.88 19.39 19.56 19.20
Total liabilities …………………………………………………………………………………………………………………………………………………………………………………………………………………………………56.04 55.98 55.81 55.90 56.97 53.48 52.79 52.94 53.04 52.12
Stockholders' equity ………………………………………………………………………………………………………………………………………………………………………………………………………………………………43.96 44.02 44.19 44.10 43.03 46.52 47.21 47.06 46.96 47.88
Table 2.1 -- Balance Sheet For Corporations in NAICS Nondurable Manufacturing Subsectors,
All Total Asset Sizes, and Total Assets Under $25 Million
See the Survey Methodology section of the Introduction for information on survey design, estimation, and sampling error.
(million dollars)
(percent of total assets)
(million dollars)
(percent of total assets)
All Nondurable Manufacturing
All Total Asset Sizes
All Nondurable Manufacturing
Total Assets Under $25 Million
5U.S. Census Bureau, Quarterly Financial Report, 2014 Quarter 4

Table with row headers in column A with column headers in rows 5 and 6
Item
4Q_
2013_
1Q_
2014_
2Q_
2014_
3Q_
2014_
4Q_
2014_
4Q_
2013_
1Q_
2014_
2Q_
2014_
3Q_
2014_
4Q_
2014_
Net sales, receipts, and operating revenues ………………………………………………………………………………………………………………………………………………………………………173,505 163,048 167,245 169,634 180,810 17,537 15,014 16,297 17,039 17,802
Depreciation, depletion, and amortization of property,
plant, and equipment …………………………………………………………………………………………………………………………………………………………………………………………3,298 3,311 3,369 3,473 3,432 315 275 259 251 265
All other operating costs and expenses …………………………………………………………………………………………………………...……………………………………………………………158,936 149,868 153,250 154,337 164,017 16,142 13,838 15,006 15,760 16,737
Income (loss) from operations …………………………………………………………………………………………………………...……………………………………………………………11,272 9,869 10,625 11,823 13,362 1,080 901 1,031 1,029 800
Interest expense …………………………………………………………………………………………………………………………………………………………………………………………………………………………………………2,269 2,647 2,099 2,081 2,158 79 70 71 78 81
All other nonoperating income (expense) ……………………………………………………………………………………………………………………………………………………………………………………………………5,078 1,574 1,259 2,596 (2,230) 16 (15) 8 23 24
Income (loss) before income taxes ………………………………………………………………………………………………………………………………………………………………………………………………14,081 8,797 9,785 12,338 8,973 1,017 816 968 974 742
Provision for current and deferred domestic income taxes …………………………………………………………………………………………………………………………………………………………………………………………1,915 1,931 2,469 2,763 2,180 95 86 86 61 92
Income (loss) after income taxes …………………………………………………………………………………………………………………………………………………………………………………………………………12,166 6,866 7,316 9,575 6,793 923 729 882 913 650
Cash dividends charged to retained earnings this quarter ……………………………………………………………………………………………………………………………………………………………………………………3,215 2,656 3,180 3,908 3,765 332 144 196 207 200
Net income retained in business ……………………………………………………………………………………………………………………………………………………………………………………………………8,950 4,210 4,136 5,667 3,029 591 586 686 706 451
Retained earnings at beginning of quarter …………………………………………………………………………………………………………………………………………………………………………………………………………174,083 182,897 185,406 186,753 190,699 8,673 8,276 8,571 7,250 7,609
Other direct credits (charges) to retained earnings (net), including
stock and other non-cash dividends, etc. ……………………………………………………………………………………………………………………………………………………………………………………………………………………………(864) (446) (518) (478) (698) (87) (145) (110) (85) (14)
Retained earnings at end of quarter ……………………………………………………………………………………………………………………………………………………………………………………………………182,170 186,661 189,024 191,942 193,029 9,178 8,717 9,146 7,872 8,046
INCOME STATEMENT IN RATIO FORMAT
Net sales, receipts, and operating revenues ……………………………………………………………………………………………………………………………………………………………………………………………………100.00 100.00 100.00 100.00 100.00 100.00 100.00 100.00 100.00 100.00
Depreciation, depletion, and amortization of property,
plant, and equipment ………………………………………………………………………………………………………………………………………………………………………1.90 2.03 2.01 2.05 1.90 1.79 1.83 1.59 1.47 1.49
All other operating costs and expenses ……………………………………………………………………………………………………………………………………………………………………………………………………91.60 91.92 91.63 90.98 90.71 92.05 92.17 92.08 92.49 94.02
Income (loss) from operations …………………………………………………………………………………………………………………………………………………………………………………………………6.50 6.05 6.35 6.97 7.39 6.16 6.00 6.33 6.04 4.49
Interest expense …………………………………………………………………………………………………………………………………………………………………………………………………………………………………1.31 1.62 1.26 1.23 1.19 0.45 0.47 0.44 0.46 0.46
All other nonoperating income (expense) ……………………………………………………………………………………………………………………………………………………………………………………………2.93 0.97 0.75 1.53 (1.23) 0.09 (0.10) 0.05 0.14 0.13
Income (loss) before income taxes ……………………………………………………………………………………………………………………………………………………………………………………………8.12 5.40 5.85 7.27 4.96 5.80 5.43 5.94 5.72 4.17
Provision for current and deferred domestic income taxes ……………………………………………………………………………………………………………………………………………………………………………………1.10 1.18 1.48 1.63 1.21 0.54 0.57 0.53 0.36 0.52
Income (loss) after income taxes ………………………………………………………………………………………………………………………………………………………………………………………………7.01 4.21 4.37 5.64 3.76 5.26 4.86 5.41 5.36 3.65
OPERATING RATIOS
(see explanatory notes)
Annual rate of profit on stockholders' equity at end of period:
Before income taxes ……………………………………………………………………………………………………………………………………………………………………………………………………………………21.07 12.96 14.23 17.94 13.40 35.41 29.14 34.57 35.88 28.31
After income taxes ………………………………………………………………………………………………………………………………………………………………………………………………………………18.21 10.12 10.64 13.92 10.14 32.11 26.06 31.49 33.63 24.81
Annual rate of profit on total assets:
Before income taxes ………………………………………………………………………………………………………………………………………………………………………………………………………………9.18 5.67 6.25 7.70 5.61 17.42 14.61 16.88 16.58 12.62
After income taxes …………………………………………………………………………………………………………………………………………………………………………………………………………………………7.93 4.43 4.68 5.97 4.24 15.79 13.06 15.37 15.54 11.06
BALANCE SHEET RATIOS
(based on succeeding table)
Total current assets to total current liabilities …………………………………………………………………………………………………………………………………………………………………………………………………1.67 1.68 1.68 1.62 1.62 1.93 2.02 2.02 1.89 1.86
Total cash, U.S. Government and other securities, to total current liabilities …………………………………………………………………………………………………………………………………………………………………0.25 0.24 0.26 0.23 0.23 0.41 0.42 0.42 0.36 0.36
Total stockholders' equity to total debt ………………………………………………………………………………………………………………………………………………………………………………………………………1.36 1.35 1.36 1.31 1.30 1.70 1.73 1.64 1.52 1.42
(percent of net sales) (percent of net sales)
(percent) (percent)
Table 3.0 -- Income Statement For Corporations in NAICS Manufacturing Subsector 311,
All Total Asset Sizes, and Total Assets Under $25 Million
See the Survey Methodology section of the Introduction for information on survey design, estimation, and sampling error.
Food
All Total Asset Sizes
Food
Total Assets Under $25 Million
(million dollars) (million dollars)
6U.S. Census Bureau, Quarterly Financial Report, 2014 Quarter 4

Table with row headers in column A with column headers in rows 5 and 6
Item
4Q_
2013_
1Q_
2014_
2Q_
2014_
3Q_
2014_
4Q_
2014_
4Q_
2013_
1Q_
2014_
2Q_
2014_
3Q_
2014_
4Q_
2014_
ASSETS
Cash and demand deposits in the U.S. .………………………………………………………………………………………………………………………………………………………………………………………………………………………………16,530 15,204 18,321 18,890 19,003 2,502 2,367 2,466 2,416 2,523
Time deposits in the U.S., including negotiable certificates of deposit ……………………………………………………………………………………………………………………………………………………………………………………4,014 3,528 2,939 2,159 2,368 214 169 174 111 88
Total cash on hand and in U.S. banks ……………………………………………………………………………………………………………………………………………………………………………………20,544 18,732 21,260 21,049 21,370 2,716 2,536 2,640 2,526 2,611
Other short-term financial investments, including marketable and
government securities, commercial paper, etc. ………………………………………………………………………………………………………………………………………………………………………………………………………………………………5,835 5,430 4,718 3,693 4,114 234 193 169 153 98
Total cash, U.S. Government and other securities ……………………………………………………………………………………………………………………………………………………………………………………26,379 24,161 25,978 24,742 25,484 2,950 2,730 2,810 2,679 2,709
Trade accounts and trade notes receivable
(less allowance for doubtful accounts) …………………………………………………………………………………………………………………………………………51,841 52,817 50,741 52,976 54,996 4,833 4,593 4,776 5,148 5,150
Inventories ………………………………………………………………………………………………………………………………………………………………………………………………………………………………67,525 66,861 64,082 65,140 68,249 5,052 4,886 5,072 5,287 5,076
All other current assets ………………………………………………………………………………………………………………………………………………………………………………………………………………………………27,663 27,596 29,290 32,493 31,465 930 802 784 891 940
Total current assets ………………………………………………………………………………………………………………………………………………………………………………………………………………………………173,408 171,436 170,091 175,352 180,194 13,766 13,011 13,442 14,005 13,876
Property, plant, and equipment ………………………………………………………………………………………………………………………………………………………………………………………………………………………………227,460 230,045 232,506 233,254 236,412 20,217 20,163 20,881 20,579 21,203
Land and mineral rights ………………………………………………………………………………………………………………………………………………………………………………………………………………………………6,220 6,301 6,308 6,204 6,499 351 315 367 353 357
Less: Accumulated depreciation, depletion, and amortization ……………………………………………………………………………………………………………………………………………………………………………………126,751 128,994 130,210 130,004 131,675 13,055 13,014 13,421 13,179 13,575
Net property, plant, and equipment ……………………………………………………………………………………………………………………………………………………………………………………106,928 107,352 108,604 109,454 111,237 7,513 7,463 7,826 7,752 7,985
All other noncurrent assets, including investment in nonconsolidated
entities, long-term investments, intangibles, etc. ………………………………………………………………………………………………………………………………………………………………………………………………………………333,339 341,618 347,169 356,261 348,924 2,087 1,861 1,672 1,742 1,670
Total Assets …………………………………………………………………………………………………………………………………………………………………………………………………………………………613,675 620,406 625,863 641,067 640,355 23,365 22,335 22,940 23,499 23,531
LIABILITIES AND STOCKHOLDERS' EQUITY
Short-term debt, original maturity of 1 year or less:
a. Loans from banks ………………………………………………………………………………………………………………………………………………………………………………………………………………………7,286 7,179 6,648 7,672 7,718 1,516 1,283 1,389 1,464 1,364
b. Other short-term loans, including commercial paper ………………………………………………………………………………………………………………………………………………………………………………………11,502 13,634 11,391 12,494 11,242 148 135 109 129 77
Trade accounts and trade notes payable ……………………………………………………………………………………………………………………………………………………………………………………………………………43,950 41,352 41,713 43,736 48,196 3,238 3,014 3,264 3,566 3,588
Income taxes accrued, prior and current years, net of payments ………………………………………………………………………………………………………………………………………………………………………………1,625 1,570 1,144 1,554 1,617 86 79 78 85 68
Current portion of long-term debt, due in 1 year or less:
a. Loans from banks …………………………………………………………………………………………………………………………………………………………………………………………………………………………………3,528 3,379 3,445 3,079 3,144 792 751 655 760 804
b. Other long-term loans ……………………………………………………………………………………………………………………………………………………………………………………………………………………7,943 7,038 8,471 9,700 8,023 117 96 109 123 128
All other current liabilities, including excise and
sales taxes, and accrued expenses ……..……………………………………………………………………………………………………………………………………………………28,203 27,773 28,190 29,834 31,216 1,219 1,083 1,053 1,299 1,446
Total current liabilities ……………………………………………………………………………………………………………………………………………………………………………………………………………………104,037 101,924 101,002 108,069 111,156 7,116 6,442 6,657 7,425 7,476
Long-term debt, due in more than 1 year:
a. Loans from banks …………………………………………………………………………………………………………………………………………………………………………………………………………………………51,189 53,406 54,670 54,934 54,326 2,818 2,728 3,092 3,084 3,274
b. Other long-term loans ……………………………………………………………………………………………………………………………………………………………………………………………………………………114,945 116,368 117,012 121,693 121,505 1,357 1,490 1,484 1,583 1,747
All other noncurrent liabilities, including deferred income taxes,
capitalized leases, and minority stockholders' interest
in consolidated domestic corporations ……………………………………………………………………………………………………………………………………………………………………76,204 77,210 78,148 81,275 85,420 584 479 506 548 546
Total liabilities ……………………………………………………………………………………………………………………………………………………………………………………………………………………………346,374 348,908 350,832 365,971 372,406 11,875 11,139 11,739 12,640 13,042
Capital stock and other capital (less treasury stock) …………………………………………………………………………………………………………………………………………………………………………………………85,131 84,837 86,007 83,153 74,919 2,313 2,480 2,055 2,987 2,442
Retained earnings …………………………………………………………………………………………………………………………………………………………………………………………………………………………………182,170 186,661 189,024 191,942 193,029 9,178 8,717 9,146 7,872 8,046
Stockholders' equity ……………………………………………………………………………………………………………………………………………………………………………………………………………………267,301 271,498 275,031 275,096 267,948 11,490 11,197 11,201 10,859 10,489
Total Liabilities and Stockholders' Equity ………………………………………………………………………………………………………………………………………………………………………………………………613,675 620,406 625,863 641,067 640,355 23,365 22,335 22,940 23,499 23,531
NET WORKING CAPITAL
Excess of total current assets over total current liabilities ………………………………………………………………………………………………………………………………………………………………………………………69,371 69,512 69,088 67,283 69,038 6,650 6,569 6,785 6,580 6,400
SELECTED BALANCE SHEET RATIOS
Total cash, U.S. Government and other securities …………………………………………………………………………………………………………………………………………………………………………………………………4.30 3.89 4.15 3.86 3.98 12.63 12.22 12.25 11.40 11.51
Trade accounts and trade notes receivable ……………………………………………………………………………………………………………………………………………………………………………………………………8.45 8.51 8.11 8.26 8.59 20.69 20.56 20.82 21.91 21.89
Inventories ……………………………………………………………………………………………………………………………………………………………………………………………………………………………………11.00 10.78 10.24 10.16 10.66 21.62 21.88 22.11 22.50 21.57
Total current assets …………………………………………………………………………………………………………………………………………………………………………………………………………………………28.26 27.63 27.18 27.35 28.14 58.92 58.25 58.60 59.60 58.97
Net property, plant, and equipment ……………………………………………………………………………………………………………………………………………………………………………………………………………17.42 17.30 17.35 17.07 17.37 32.15 33.41 34.12 32.99 33.93
Short-term debt, including current portion of long-term debt ………………………………………………………………………………………………………………………………………………………………………………………4.93 5.03 4.79 5.14 4.70 11.01 10.14 9.86 10.54 10.08
Total current liabilities …………………………………………………………………………………………………………………………………………………………………………………………………………………………………16.95 16.43 16.14 16.86 17.36 30.45 28.84 29.02 31.60 31.77
Long-term debt …………………………………………………………………………………………………………………………………………………………………………………………………………………………………27.07 27.36 27.43 27.55 27.46 17.87 18.88 19.95 19.86 21.34
Total liabilities …………………………………………………………………………………………………………………………………………………………………………………………………………………………………56.44 56.24 56.06 57.09 58.16 50.82 49.87 51.17 53.79 55.43
Stockholders' equity ………………………………………………………………………………………………………………………………………………………………………………………………………………………………43.56 43.76 43.94 42.91 41.84 49.18 50.13 48.83 46.21 44.57
Table 3.1 -- Balance Sheet For Corporations in NAICS Manufacturing Subsector 311,
All Total Asset Sizes, and Total Assets Under $25 Million
See the Survey Methodology section of the Introduction for information on survey design, estimation, and sampling error.
(million dollars)
(percent of total assets)
(million dollars)
(percent of total assets)
Food
All Total Asset Sizes
Food
Total Assets Under $25 Million
7U.S. Census Bureau, Quarterly Financial Report, 2014 Quarter 4
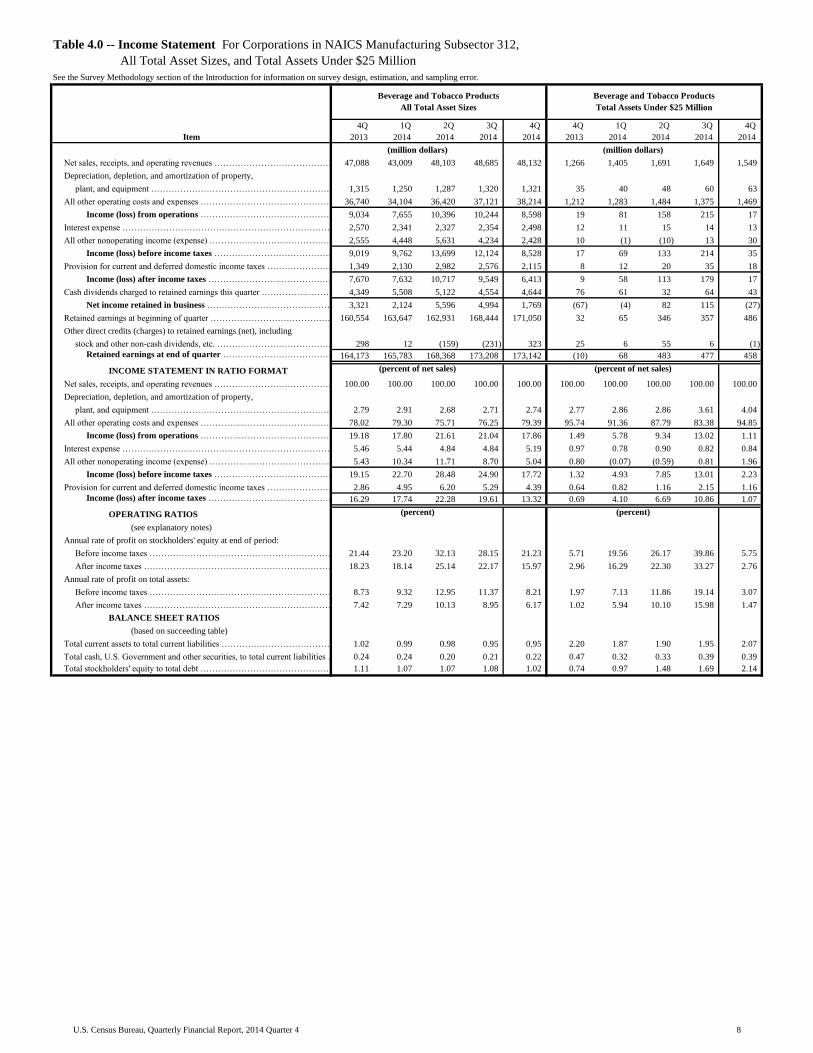
Table with row headers in column A with column headers in rows 5 and 6
Item
4Q_
2013_
1Q_
2014_
2Q_
2014_
3Q_
2014_
4Q_
2014_
4Q_
2013_
1Q_
2014_
2Q_
2014_
3Q_
2014_
4Q_
2014_
Net sales, receipts, and operating revenues ………………………………………………………………………………………………………………………………………………………………………47,088 43,009 48,103 48,685 48,132 1,266 1,405 1,691 1,649 1,549
Depreciation, depletion, and amortization of property,
plant, and equipment …………………………………………………………………………………………………………………………………………………………………………………………1,315 1,250 1,287 1,320 1,321 35 40 48 60 63
All other operating costs and expenses …………………………………………………………………………………………………………...……………………………………………………………36,740 34,104 36,420 37,121 38,214 1,212 1,283 1,484 1,375 1,469
Income (loss) from operations …………………………………………………………………………………………………………...……………………………………………………………9,034 7,655 10,396 10,244 8,598 19 81 158 215 17
Interest expense …………………………………………………………………………………………………………………………………………………………………………………………………………………………………………2,570 2,341 2,327 2,354 2,498 12 11 15 14 13
All other nonoperating income (expense) ……………………………………………………………………………………………………………………………………………………………………………………………………2,555 4,448 5,631 4,234 2,428 10 (1) (10) 13 30
Income (loss) before income taxes ………………………………………………………………………………………………………………………………………………………………………………………………9,019 9,762 13,699 12,124 8,528 17 69 133 214 35
Provision for current and deferred domestic income taxes …………………………………………………………………………………………………………………………………………………………………………………………1,349 2,130 2,982 2,576 2,115 8 12 20 35 18
Income (loss) after income taxes …………………………………………………………………………………………………………………………………………………………………………………………………………7,670 7,632 10,717 9,549 6,413 9 58 113 179 17
Cash dividends charged to retained earnings this quarter ……………………………………………………………………………………………………………………………………………………………………………………4,349 5,508 5,122 4,554 4,644 76 61 32 64 43
Net income retained in business ……………………………………………………………………………………………………………………………………………………………………………………………………3,321 2,124 5,596 4,994 1,769 (67) (4) 82 115 (27)
Retained earnings at beginning of quarter …………………………………………………………………………………………………………………………………………………………………………………………………………160,554 163,647 162,931 168,444 171,050 32 65 346 357 486
Other direct credits (charges) to retained earnings (net), including
stock and other non-cash dividends, etc. ……………………………………………………………………………………………………………………………………………………………………………………………………………………………298 12 (159) (231) 323 25 6 55 6 (1)
Retained earnings at end of quarter ……………………………………………………………………………………………………………………………………………………………………………………………………164,173 165,783 168,368 173,208 173,142 (10) 68 483 477 458
INCOME STATEMENT IN RATIO FORMAT
Net sales, receipts, and operating revenues ……………………………………………………………………………………………………………………………………………………………………………………………………100.00 100.00 100.00 100.00 100.00 100.00 100.00 100.00 100.00 100.00
Depreciation, depletion, and amortization of property,
plant, and equipment ………………………………………………………………………………………………………………………………………………………………………2.79 2.91 2.68 2.71 2.74 2.77 2.86 2.86 3.61 4.04
All other operating costs and expenses ……………………………………………………………………………………………………………………………………………………………………………………………………78.02 79.30 75.71 76.25 79.39 95.74 91.36 87.79 83.38 94.85
Income (loss) from operations …………………………………………………………………………………………………………………………………………………………………………………………………19.18 17.80 21.61 21.04 17.86 1.49 5.78 9.34 13.02 1.11
Interest expense …………………………………………………………………………………………………………………………………………………………………………………………………………………………………5.46 5.44 4.84 4.84 5.19 0.97 0.78 0.90 0.82 0.84
All other nonoperating income (expense) ……………………………………………………………………………………………………………………………………………………………………………………………5.43 10.34 11.71 8.70 5.04 0.80 (0.07) (0.59) 0.81 1.96
Income (loss) before income taxes ……………………………………………………………………………………………………………………………………………………………………………………………19.15 22.70 28.48 24.90 17.72 1.32 4.93 7.85 13.01 2.23
Provision for current and deferred domestic income taxes ……………………………………………………………………………………………………………………………………………………………………………………2.86 4.95 6.20 5.29 4.39 0.64 0.82 1.16 2.15 1.16
Income (loss) after income taxes ………………………………………………………………………………………………………………………………………………………………………………………………16.29 17.74 22.28 19.61 13.32 0.69 4.10 6.69 10.86 1.07
OPERATING RATIOS
(see explanatory notes)
Annual rate of profit on stockholders' equity at end of period:
Before income taxes ……………………………………………………………………………………………………………………………………………………………………………………………………………………21.44 23.20 32.13 28.15 21.23 5.71 19.56 26.17 39.86 5.75
After income taxes ………………………………………………………………………………………………………………………………………………………………………………………………………………18.23 18.14 25.14 22.17 15.97 2.96 16.29 22.30 33.27 2.76
Annual rate of profit on total assets:
Before income taxes ………………………………………………………………………………………………………………………………………………………………………………………………………………8.73 9.32 12.95 11.37 8.21 1.97 7.13 11.86 19.14 3.07
After income taxes …………………………………………………………………………………………………………………………………………………………………………………………………………………………7.42 7.29 10.13 8.95 6.17 1.02 5.94 10.10 15.98 1.47
BALANCE SHEET RATIOS
(based on succeeding table)
Total current assets to total current liabilities …………………………………………………………………………………………………………………………………………………………………………………………………1.02 0.99 0.98 0.95 0.95 2.20 1.87 1.90 1.95 2.07
Total cash, U.S. Government and other securities, to total current liabilities …………………………………………………………………………………………………………………………………………………………………0.24 0.24 0.20 0.21 0.22 0.47 0.32 0.33 0.39 0.39
Total stockholders' equity to total debt ………………………………………………………………………………………………………………………………………………………………………………………………………1.11 1.07 1.07 1.08 1.02 0.74 0.97 1.48 1.69 2.14
(percent of net sales) (percent of net sales)
(percent) (percent)
Table 4.0 -- Income Statement For Corporations in NAICS Manufacturing Subsector 312,
All Total Asset Sizes, and Total Assets Under $25 Million
See the Survey Methodology section of the Introduction for information on survey design, estimation, and sampling error.
Beverage and Tobacco Products
All Total Asset Sizes
Beverage and Tobacco Products
Total Assets Under $25 Million
(million dollars) (million dollars)
8U.S. Census Bureau, Quarterly Financial Report, 2014 Quarter 4

Table with row headers in column A with column headers in rows 5 and 6
Item
4Q_
2013_
1Q_
2014_
2Q_
2014_
3Q_
2014_
4Q_
2014_
4Q_
2013_
1Q_
2014_
2Q_
2014_
3Q_
2014_
4Q_
2014_
ASSETS
Cash and demand deposits in the U.S. .………………………………………………………………………………………………………………………………………………………………………………………………………………………………9,152 11,650 10,191 10,781 10,400 363 361 410 503 448
Time deposits in the U.S., including negotiable certificates of deposit ……………………………………………………………………………………………………………………………………………………………………………………3,275 2,679 911 1,501 2,151 5 8 8 6 6
Total cash on hand and in U.S. banks ……………………………………………………………………………………………………………………………………………………………………………………12,428 14,329 11,102 12,282 12,551 368 369 419 509 455
Other short-term financial investments, including marketable and
government securities, commercial paper, etc. ………………………………………………………………………………………………………………………………………………………………………………………………………………………………2,135 1,670 1,994 2,290 2,774 7 1 1 4 4
Total cash, U.S. Government and other securities ……………………………………………………………………………………………………………………………………………………………………………………14,563 15,999 13,096 14,573 15,325 375 370 420 513 458
Trade accounts and trade notes receivable
(less allowance for doubtful accounts) …………………………………………………………………………………………………………………………………………11,668 12,730 14,128 13,419 11,558 286 454 515 564 540
Inventories ………………………………………………………………………………………………………………………………………………………………………………………………………………………………20,947 21,221 20,881 21,581 22,184 1,010 1,232 1,359 1,370 1,330
All other current assets ………………………………………………………………………………………………………………………………………………………………………………………………………………………………16,065 16,076 15,388 15,646 15,852 94 127 132 86 99
Total current assets ………………………………………………………………………………………………………………………………………………………………………………………………………………………………63,243 66,026 63,493 65,219 64,919 1,765 2,183 2,426 2,534 2,429
Property, plant, and equipment ………………………………………………………………………………………………………………………………………………………………………………………………………………………………84,321 85,654 86,306 87,589 87,474 2,777 3,237 3,494 3,544 3,802
Land and mineral rights ………………………………………………………………………………………………………………………………………………………………………………………………………………………………4,055 4,097 4,139 3,878 3,943 77 76 126 115 119
Less: Accumulated depreciation, depletion, and amortization ……………………………………………………………………………………………………………………………………………………………………………………41,895 43,336 44,155 45,294 45,916 1,547 1,951 2,005 1,999 2,137
Net property, plant, and equipment ……………………………………………………………………………………………………………………………………………………………………………………46,481 46,415 46,290 46,173 45,501 1,308 1,362 1,615 1,659 1,783
All other noncurrent assets, including investment in nonconsolidated
entities, long-term investments, intangibles, etc. ………………………………………………………………………………………………………………………………………………………………………………………………………………303,516 306,568 313,495 315,227 305,018 321 338 439 289 298
Total Assets …………………………………………………………………………………………………………………………………………………………………………………………………………………………413,240 419,009 423,277 426,619 415,438 3,394 3,882 4,480 4,482 4,510
LIABILITIES AND STOCKHOLDERS' EQUITY
Short-term debt, original maturity of 1 year or less:
a. Loans from banks ………………………………………………………………………………………………………………………………………………………………………………………………………………………686 666 630 1,333 1,065 87 83 108 151 157
b. Other short-term loans, including commercial paper ………………………………………………………………………………………………………………………………………………………………………………………20,921 24,975 24,838 24,592 21,643 37 32 31 41 5
Trade accounts and trade notes payable ……………………………………………………………………………………………………………………………………………………………………………………………………………9,405 8,720 9,308 9,812 10,376 298 634 790 806 702
Income taxes accrued, prior and current years, net of payments ………………………………………………………………………………………………………………………………………………………………………………357 313 609 988 1,683 3 5 15 16 12
Current portion of long-term debt, due in 1 year or less:
a. Loans from banks …………………………………………………………………………………………………………………………………………………………………………………………………………………………………1,248 1,257 1,270 1,249 665 68 69 85 92 84
b. Other long-term loans ……………………………………………………………………………………………………………………………………………………………………………………………………………………4,470 5,156 5,183 6,502 8,187 4 27 32 32 40
All other current liabilities, including excise and
sales taxes, and accrued expenses ……..……………………………………………………………………………………………………………………………………………………24,729 25,560 22,839 24,124 24,750 305 318 215 164 174
Total current liabilities ……………………………………………………………………………………………………………………………………………………………………………………………………………………61,816 66,648 64,677 68,602 68,369 802 1,169 1,276 1,303 1,175
Long-term debt, due in more than 1 year:
a. Loans from banks …………………………………………………………………………………………………………………………………………………………………………………………………………………………6,219 6,716 6,328 5,811 6,117 568 610 699 614 587
b. Other long-term loans ……………………………………………………………………………………………………………………………………………………………………………………………………………………117,824 118,464 121,513 120,005 119,875 820 639 419 346 252
All other noncurrent liabilities, including deferred income taxes,
capitalized leases, and minority stockholders' interest
in consolidated domestic corporations ……………………………………………………………………………………………………………………………………………………………………59,134 58,872 60,230 59,895 60,429 33 50 56 67 92
Total liabilities ……………………………………………………………………………………………………………………………………………………………………………………………………………………………244,993 250,701 252,749 254,313 254,789 2,223 2,467 2,450 2,330 2,105
Capital stock and other capital (less treasury stock) …………………………………………………………………………………………………………………………………………………………………………………………4,074 2,525 2,161 (902) (12,494) 1,182 1,348 1,547 1,675 1,947
Retained earnings …………………………………………………………………………………………………………………………………………………………………………………………………………………………………164,173 165,783 168,368 173,208 173,142 (10) 68 483 477 458
Stockholders' equity ……………………………………………………………………………………………………………………………………………………………………………………………………………………168,248 168,308 170,529 172,306 160,649 1,172 1,415 2,029 2,152 2,405
Total Liabilities and Stockholders' Equity ………………………………………………………………………………………………………………………………………………………………………………………………413,240 419,009 423,277 426,619 415,438 3,394 3,882 4,480 4,482 4,510
NET WORKING CAPITAL
Excess of total current assets over total current liabilities ………………………………………………………………………………………………………………………………………………………………………………………1,427 (622) (1,184) (3,383) (3,449) 963 1,014 1,150 1,231 1,254
SELECTED BALANCE SHEET RATIOS
Total cash, U.S. Government and other securities …………………………………………………………………………………………………………………………………………………………………………………………………3.52 3.82 3.09 3.42 3.69 11.05 9.53 9.36 11.45 10.17
Trade accounts and trade notes receivable ……………………………………………………………………………………………………………………………………………………………………………………………………2.82 3.04 3.34 3.15 2.78 8.43 11.70 11.49 12.59 11.98
Inventories ……………………………………………………………………………………………………………………………………………………………………………………………………………………………………5.07 5.06 4.93 5.06 5.34 29.76 31.73 30.34 30.57 29.50
Total current assets …………………………………………………………………………………………………………………………………………………………………………………………………………………………15.30 15.76 15.00 15.29 15.63 52.01 56.22 54.15 56.54 53.85
Net property, plant, and equipment ……………………………………………………………………………………………………………………………………………………………………………………………………………11.25 11.08 10.94 10.82 10.95 38.54 35.08 36.05 37.01 39.54
Short-term debt, including current portion of long-term debt ………………………………………………………………………………………………………………………………………………………………………………………6.61 7.65 7.54 7.89 7.60 5.76 5.44 5.72 7.06 6.37
Total current liabilities …………………………………………………………………………………………………………………………………………………………………………………………………………………………………14.96 15.91 15.28 16.08 16.46 23.62 30.10 28.48 29.06 26.05
Long-term debt …………………………………………………………………………………………………………………………………………………………………………………………………………………………………30.02 29.88 30.20 29.49 30.33 40.90 32.16 24.97 21.43 18.59
Total liabilities …………………………………………………………………………………………………………………………………………………………………………………………………………………………………59.29 59.83 59.71 59.61 61.33 65.48 63.55 54.70 51.99 46.67
Stockholders' equity ………………………………………………………………………………………………………………………………………………………………………………………………………………………………40.71 40.17 40.29 40.39 38.67 34.52 36.45 45.30 48.01 53.33
Table 4.1 -- Balance Sheet For Corporations in NAICS Manufacturing Subsector 312,
All Total Asset Sizes, and Total Assets Under $25 Million
See the Survey Methodology section of the Introduction for information on survey design, estimation, and sampling error.
(million dollars)
(percent of total assets)
(million dollars)
(percent of total assets)
Beverage and Tobacco Products
All Total Asset Sizes
Beverage and Tobacco Products
Total Assets Under $25 Million
9U.S. Census Bureau, Quarterly Financial Report, 2014 Quarter 4
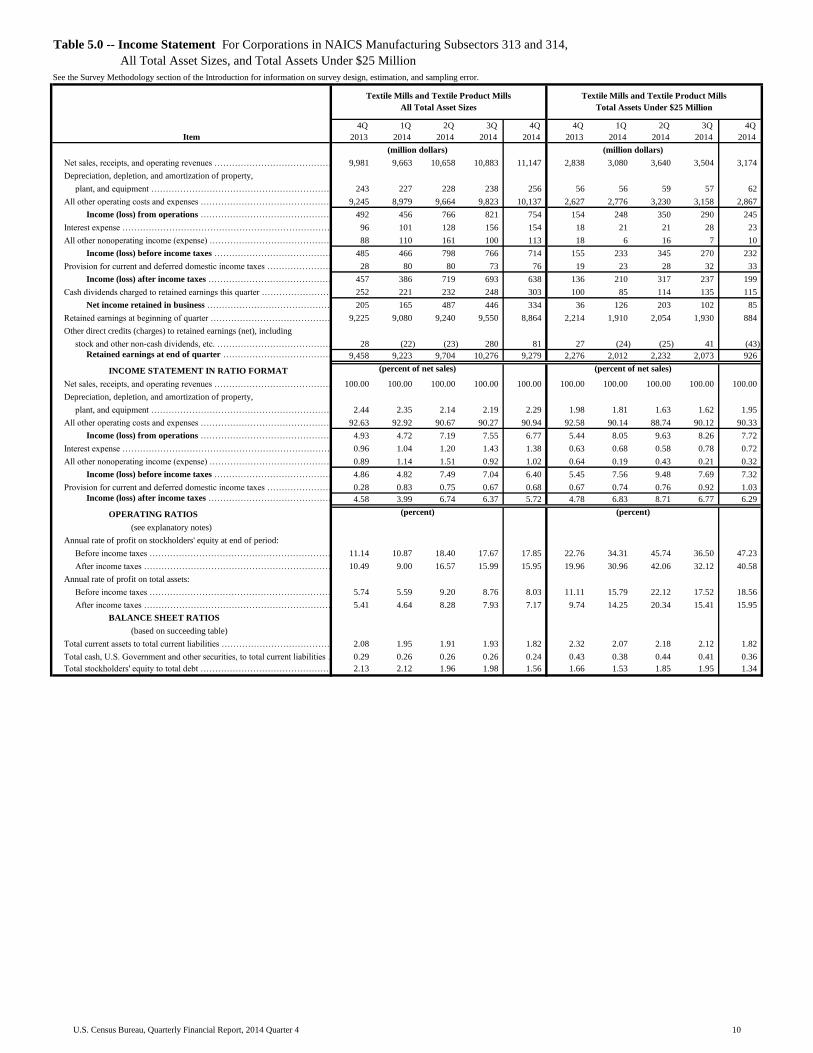
Table with row headers in column A with column headers in rows 5 and 6
Item
4Q_
2013_
1Q_
2014_
2Q_
2014_
3Q_
2014_
4Q_
2014_
4Q_
2013_
1Q_
2014_
2Q_
2014_
3Q_
2014_
4Q_
2014_
Net sales, receipts, and operating revenues ………………………………………………………………………………………………………………………………………………………………………9,981 9,663 10,658 10,883 11,147 2,838 3,080 3,640 3,504 3,174
Depreciation, depletion, and amortization of property,
plant, and equipment …………………………………………………………………………………………………………………………………………………………………………………………243 227 228 238 256 56 56 59 57 62
All other operating costs and expenses …………………………………………………………………………………………………………...……………………………………………………………9,245 8,979 9,664 9,823 10,137 2,627 2,776 3,230 3,158 2,867
Income (loss) from operations …………………………………………………………………………………………………………...……………………………………………………………492 456 766 821 754 154 248 350 290 245
Interest expense …………………………………………………………………………………………………………………………………………………………………………………………………………………………………………96 101 128 156 154 18 21 21 28 23
All other nonoperating income (expense) ……………………………………………………………………………………………………………………………………………………………………………………………………88 110 161 100 113 18 6 16 7 10
Income (loss) before income taxes ………………………………………………………………………………………………………………………………………………………………………………………………485 466 798 766 714 155 233 345 270 232
Provision for current and deferred domestic income taxes …………………………………………………………………………………………………………………………………………………………………………………………28 80 80 73 76 19 23 28 32 33
Income (loss) after income taxes …………………………………………………………………………………………………………………………………………………………………………………………………………457 386 719 693 638 136 210 317 237 199
Cash dividends charged to retained earnings this quarter ……………………………………………………………………………………………………………………………………………………………………………………252 221 232 248 303 100 85 114 135 115
Net income retained in business ……………………………………………………………………………………………………………………………………………………………………………………………………205 165 487 446 334 36 126 203 102 85
Retained earnings at beginning of quarter …………………………………………………………………………………………………………………………………………………………………………………………………………9,225 9,080 9,240 9,550 8,864 2,214 1,910 2,054 1,930 884
Other direct credits (charges) to retained earnings (net), including
stock and other non-cash dividends, etc. ……………………………………………………………………………………………………………………………………………………………………………………………………………………………28 (22) (23) 280 81 27 (24) (25) 41 (43)
Retained earnings at end of quarter ……………………………………………………………………………………………………………………………………………………………………………………………………9,458 9,223 9,704 10,276 9,279 2,276 2,012 2,232 2,073 926
INCOME STATEMENT IN RATIO FORMAT
Net sales, receipts, and operating revenues ……………………………………………………………………………………………………………………………………………………………………………………………………100.00 100.00 100.00 100.00 100.00 100.00 100.00 100.00 100.00 100.00
Depreciation, depletion, and amortization of property,
plant, and equipment ………………………………………………………………………………………………………………………………………………………………………2.44 2.35 2.14 2.19 2.29 1.98 1.81 1.63 1.62 1.95
All other operating costs and expenses ……………………………………………………………………………………………………………………………………………………………………………………………………92.63 92.92 90.67 90.27 90.94 92.58 90.14 88.74 90.12 90.33
Income (loss) from operations …………………………………………………………………………………………………………………………………………………………………………………………………4.93 4.72 7.19 7.55 6.77 5.44 8.05 9.63 8.26 7.72
Interest expense …………………………………………………………………………………………………………………………………………………………………………………………………………………………………0.96 1.04 1.20 1.43 1.38 0.63 0.68 0.58 0.78 0.72
All other nonoperating income (expense) ……………………………………………………………………………………………………………………………………………………………………………………………0.89 1.14 1.51 0.92 1.02 0.64 0.19 0.43 0.21 0.32
Income (loss) before income taxes ……………………………………………………………………………………………………………………………………………………………………………………………4.86 4.82 7.49 7.04 6.40 5.45 7.56 9.48 7.69 7.32
Provision for current and deferred domestic income taxes ……………………………………………………………………………………………………………………………………………………………………………………0.28 0.83 0.75 0.67 0.68 0.67 0.74 0.76 0.92 1.03
Income (loss) after income taxes ………………………………………………………………………………………………………………………………………………………………………………………………4.58 3.99 6.74 6.37 5.72 4.78 6.83 8.71 6.77 6.29
OPERATING RATIOS
(see explanatory notes)
Annual rate of profit on stockholders' equity at end of period:
Before income taxes ……………………………………………………………………………………………………………………………………………………………………………………………………………………11.14 10.87 18.40 17.67 17.85 22.76 34.31 45.74 36.50 47.23
After income taxes ………………………………………………………………………………………………………………………………………………………………………………………………………………10.49 9.00 16.57 15.99 15.95 19.96 30.96 42.06 32.12 40.58
Annual rate of profit on total assets:
Before income taxes ………………………………………………………………………………………………………………………………………………………………………………………………………………5.74 5.59 9.20 8.76 8.03 11.11 15.79 22.12 17.52 18.56
After income taxes …………………………………………………………………………………………………………………………………………………………………………………………………………………………5.41 4.64 8.28 7.93 7.17 9.74 14.25 20.34 15.41 15.95
BALANCE SHEET RATIOS
(based on succeeding table)
Total current assets to total current liabilities …………………………………………………………………………………………………………………………………………………………………………………………………2.08 1.95 1.91 1.93 1.82 2.32 2.07 2.18 2.12 1.82
Total cash, U.S. Government and other securities, to total current liabilities …………………………………………………………………………………………………………………………………………………………………0.29 0.26 0.26 0.26 0.24 0.43 0.38 0.44 0.41 0.36
Total stockholders' equity to total debt ………………………………………………………………………………………………………………………………………………………………………………………………………2.13 2.12 1.96 1.98 1.56 1.66 1.53 1.85 1.95 1.34
(percent of net sales) (percent of net sales)
(percent) (percent)
Table 5.0 -- Income Statement For Corporations in NAICS Manufacturing Subsectors 313 and 314,
All Total Asset Sizes, and Total Assets Under $25 Million
See the Survey Methodology section of the Introduction for information on survey design, estimation, and sampling error.
Textile Mills and Textile Product Mills
All Total Asset Sizes
Textile Mills and Textile Product Mills
Total Assets Under $25 Million
(million dollars) (million dollars)
10U.S. Census Bureau, Quarterly Financial Report, 2014 Quarter 4

Table with row headers in column A with column headers in rows 5 and 6
Item
4Q_
2013_
1Q_
2014_
2Q_
2014_
3Q_
2014_
4Q_
2014_
4Q_
2013_
1Q_
2014_
2Q_
2014_
3Q_
2014_
4Q_
2014_
ASSETS
Cash and demand deposits in the U.S. .………………………………………………………………………………………………………………………………………………………………………………………………………………………………1,190 1,081 1,314 1,383 1,227 606 616 789 794 639
Time deposits in the U.S., including negotiable certificates of deposit ……………………………………………………………………………………………………………………………………………………………………………………47 56 22 15 19 46 52 18 7 8
Total cash on hand and in U.S. banks ……………………………………………………………………………………………………………………………………………………………………………………1,238 1,137 1,336 1,398 1,246 652 667 807 801 646
Other short-term financial investments, including marketable and
government securities, commercial paper, etc. ………………………………………………………………………………………………………………………………………………………………………………………………………………………………937 913 754 763 862 81 112 98 49 49
Total cash, U.S. Government and other securities ……………………………………………………………………………………………………………………………………………………………………………………2,175 2,050 2,090 2,161 2,108 733 779 905 850 696
Trade accounts and trade notes receivable
(less allowance for doubtful accounts) …………………………………………………………………………………………………………………………………………4,642 4,864 4,945 5,037 5,100 1,126 1,379 1,490 1,431 1,129
Inventories ………………………………………………………………………………………………………………………………………………………………………………………………………………………………6,604 6,537 6,464 6,697 6,797 1,893 1,873 1,958 1,939 1,443
All other current assets ………………………………………………………………………………………………………………………………………………………………………………………………………………………………2,128 2,011 1,973 2,030 2,074 176 160 149 200 214
Total current assets ………………………………………………………………………………………………………………………………………………………………………………………………………………………………15,549 15,463 15,471 15,926 16,080 3,928 4,191 4,501 4,420 3,482
Property, plant, and equipment ………………………………………………………………………………………………………………………………………………………………………………………………………………………………23,187 22,644 21,930 22,288 22,232 4,518 4,686 4,838 4,829 3,895
Land and mineral rights ………………………………………………………………………………………………………………………………………………………………………………………………………………………………257 239 227 225 229 83 71 65 57 40
Less: Accumulated depreciation, depletion, and amortization ……………………………………………………………………………………………………………………………………………………………………………………15,552 15,331 15,032 15,147 14,922 3,301 3,425 3,520 3,554 2,857
Net property, plant, and equipment ……………………………………………………………………………………………………………………………………………………………………………………7,892 7,552 7,126 7,367 7,538 1,300 1,332 1,383 1,331 1,077
All other noncurrent assets, including investment in nonconsolidated
entities, long-term investments, intangibles, etc. ………………………………………………………………………………………………………………………………………………………………………………………………………………10,334 10,285 12,126 11,692 11,931 344 379 354 404 444
Total Assets …………………………………………………………………………………………………………………………………………………………………………………………………………………………33,775 33,300 34,722 34,985 35,549 5,572 5,902 6,238 6,155 5,004
LIABILITIES AND STOCKHOLDERS' EQUITY
Short-term debt, original maturity of 1 year or less:
a. Loans from banks ………………………………………………………………………………………………………………………………………………………………………………………………………………………534 479 489 448 625 230 269 295 222 249
b. Other short-term loans, including commercial paper ………………………………………………………………………………………………………………………………………………………………………………………391 488 200 124 165 198 292 66 46 52
Trade accounts and trade notes payable ……………………………………………………………………………………………………………………………………………………………………………………………………………4,052 4,053 4,116 4,321 4,428 840 1,022 1,136 1,206 1,045
Income taxes accrued, prior and current years, net of payments ………………………………………………………………………………………………………………………………………………………………………………(107) (88) (71) (95) (67) 35 15 21 4 19
Current portion of long-term debt, due in 1 year or less:
a. Loans from banks …………………………………………………………………………………………………………………………………………………………………………………………………………………………………513 1,001 1,235 1,209 1,325 108 136 182 186 181
b. Other long-term loans ……………………………………………………………………………………………………………………………………………………………………………………………………………………142 192 237 270 320 51 37 60 85 72
All other current liabilities, including excise and
sales taxes, and accrued expenses ……..……………………………………………………………………………………………………………………………………………………1,946 1,787 1,883 1,984 2,044 232 258 302 335 300
Total current liabilities ……………………………………………………………………………………………………………………………………………………………………………………………………………………7,471 7,911 8,088 8,262 8,840 1,694 2,029 2,062 2,084 1,918
Long-term debt, due in more than 1 year:
a. Loans from banks …………………………………………………………………………………………………………………………………………………………………………………………………………………………4,991 4,538 4,957 5,116 6,313 690 731 709 702 696
b. Other long-term loans ……………………………………………………………………………………………………………………………………………………………………………………………………………………1,602 1,379 1,727 1,584 1,510 361 306 321 276 220
All other noncurrent liabilities, including deferred income taxes,
capitalized leases, and minority stockholders' interest
in consolidated domestic corporations ……………………………………………………………………………………………………………………………………………………………………2,289 2,331 2,599 2,678 2,892 108 120 130 139 203
Total liabilities ……………………………………………………………………………………………………………………………………………………………………………………………………………………………16,352 16,159 17,371 17,639 19,555 2,852 3,187 3,222 3,201 3,038
Capital stock and other capital (less treasury stock) …………………………………………………………………………………………………………………………………………………………………………………………7,965 7,918 7,647 7,070 6,715 443 704 784 881 1,041
Retained earnings …………………………………………………………………………………………………………………………………………………………………………………………………………………………………9,458 9,223 9,704 10,276 9,279 2,276 2,012 2,232 2,073 926
Stockholders' equity ……………………………………………………………………………………………………………………………………………………………………………………………………………………17,423 17,141 17,352 17,346 15,994 2,719 2,716 3,016 2,954 1,966
Total Liabilities and Stockholders' Equity ………………………………………………………………………………………………………………………………………………………………………………………………33,775 33,300 34,722 34,985 35,549 5,572 5,902 6,238 6,155 5,004
NET WORKING CAPITAL
Excess of total current assets over total current liabilities ………………………………………………………………………………………………………………………………………………………………………………………8,078 7,551 7,383 7,664 7,240 2,234 2,162 2,439 2,336 1,564
SELECTED BALANCE SHEET RATIOS
Total cash, U.S. Government and other securities …………………………………………………………………………………………………………………………………………………………………………………………………6.44 6.16 6.02 6.18 5.93 13.16 13.20 14.51 13.80 13.90
Trade accounts and trade notes receivable ……………………………………………………………………………………………………………………………………………………………………………………………………13.74 14.61 14.24 14.40 14.35 20.21 23.37 23.88 23.25 22.57
Inventories ……………………………………………………………………………………………………………………………………………………………………………………………………………………………………19.55 19.63 18.62 19.14 19.12 33.97 31.74 31.38 31.50 28.84
Total current assets …………………………………………………………………………………………………………………………………………………………………………………………………………………………46.04 46.43 44.56 45.52 45.23 70.50 71.01 72.15 71.81 69.59
Net property, plant, and equipment ……………………………………………………………………………………………………………………………………………………………………………………………………………23.37 22.68 20.52 21.06 21.20 23.33 22.56 22.16 21.63 21.53
Short-term debt, including current portion of long-term debt ………………………………………………………………………………………………………………………………………………………………………………………4.68 6.49 6.22 5.86 6.85 10.53 12.44 9.68 8.76 11.07
Total current liabilities …………………………………………………………………………………………………………………………………………………………………………………………………………………………………22.12 23.76 23.29 23.62 24.87 30.41 34.38 33.06 33.86 38.33
Long-term debt …………………………………………………………………………………………………………………………………………………………………………………………………………………………………19.52 17.77 19.25 19.15 22.01 18.85 17.57 16.51 15.89 18.32
Total liabilities …………………………………………………………………………………………………………………………………………………………………………………………………………………………………48.41 48.53 50.03 50.42 55.01 51.19 53.99 51.65 52.01 60.71
Stockholders' equity ………………………………………………………………………………………………………………………………………………………………………………………………………………………………51.59 51.47 49.97 49.58 44.99 48.81 46.01 48.35 47.99 39.29
Table 5.1 -- Balance Sheet For Corporations in NAICS Manufacturing Subsectors 313 and 314,
All Total Asset Sizes, and Total Assets Under $25 Million
See the Survey Methodology section of the Introduction for information on survey design, estimation, and sampling error.
(million dollars)
(percent of total assets)
(million dollars)
(percent of total assets)
Textile Mills and Textile Product Mills
All Total Asset Sizes
Textile Mills and Textile Product Mills
Total Assets Under $25 Million
11U.S. Census Bureau, Quarterly Financial Report, 2014 Quarter 4

Table with row headers in column A with column headers in rows 5 and 6
Item
4Q_
2013_
1Q_
2014_
2Q_
2014_
3Q_
2014_
4Q_
2014_
4Q_
2013_
1Q_
2014_
2Q_
2014_
3Q_
2014_
4Q_
2014_
Net sales, receipts, and operating revenues ………………………………………………………………………………………………………………………………………………………………………23,063 20,815 21,007 23,454 24,261 3,049 2,787 2,653 2,691 3,073
Depreciation, depletion, and amortization of property,
plant, and equipment …………………………………………………………………………………………………………………………………………………………………………………………475 440 463 492 523 31 30 31 32 36
All other operating costs and expenses …………………………………………………………………………………………………………...……………………………………………………………20,764 18,969 18,821 20,468 21,743 3,075 2,560 2,522 2,448 2,983
Income (loss) from operations …………………………………………………………………………………………………………...……………………………………………………………1,824 1,406 1,723 2,494 1,995 (57) 197 100 211 54
Interest expense …………………………………………………………………………………………………………………………………………………………………………………………………………………………………………284 266 273 262 248 25 24 23 22 22
All other nonoperating income (expense) ……………………………………………………………………………………………………………………………………………………………………………………………………665 1,267 663 1,017 421 14 (5) 1 3 9
Income (loss) before income taxes ………………………………………………………………………………………………………………………………………………………………………………………………2,206 2,407 2,114 3,249 2,169 (69) 167 79 192 41
Provision for current and deferred domestic income taxes …………………………………………………………………………………………………………………………………………………………………………………………508 519 397 708 409 18 23 14 27 17
Income (loss) after income taxes …………………………………………………………………………………………………………………………………………………………………………………………………………1,697 1,888 1,717 2,542 1,760 (86) 144 65 165 24
Cash dividends charged to retained earnings this quarter ……………………………………………………………………………………………………………………………………………………………………………………815 937 812 761 1,203 129 152 135 112 102
Net income retained in business ……………………………………………………………………………………………………………………………………………………………………………………………………882 951 905 1,781 557 (216) (8) (70) 53 (78)
Retained earnings at beginning of quarter …………………………………………………………………………………………………………………………………………………………………………………………………………27,893 28,529 27,970 28,369 28,055 1,710 1,589 1,404 1,874 2,134
Other direct credits (charges) to retained earnings (net), including
stock and other non-cash dividends, etc. ……………………………………………………………………………………………………………………………………………………………………………………………………………………………(512) (1,637) (998) (890) (500) 36 (66) 1 4 (57)
Retained earnings at end of quarter ……………………………………………………………………………………………………………………………………………………………………………………………………28,263 27,843 27,876 29,259 28,112 1,531 1,515 1,335 1,930 2,000
INCOME STATEMENT IN RATIO FORMAT
Net sales, receipts, and operating revenues ……………………………………………………………………………………………………………………………………………………………………………………………………100.00 100.00 100.00 100.00 100.00 100.00 100.00 100.00 100.00 100.00
Depreciation, depletion, and amortization of property,
plant, and equipment ………………………………………………………………………………………………………………………………………………………………………2.06 2.11 2.21 2.10 2.16 1.03 1.06 1.16 1.17 1.18
All other operating costs and expenses ……………………………………………………………………………………………………………………………………………………………………………………………………90.03 91.13 89.59 87.27 89.62 100.86 91.88 95.07 90.98 97.08
Income (loss) from operations …………………………………………………………………………………………………………………………………………………………………………………………………7.91 6.75 8.20 10.64 8.23 (1.89) 7.06 3.77 7.85 1.74
Interest expense …………………………………………………………………………………………………………………………………………………………………………………………………………………………………1.23 1.28 1.30 1.12 1.02 0.83 0.87 0.85 0.82 0.70
All other nonoperating income (expense) ……………………………………………………………………………………………………………………………………………………………………………………………2.89 6.09 3.16 4.34 1.74 0.46 (0.19) 0.05 0.10 0.28
Income (loss) before income taxes ……………………………………………………………………………………………………………………………………………………………………………………………9.56 11.56 10.06 13.85 8.94 (2.25) 6.00 2.97 7.12 1.33
Provision for current and deferred domestic income taxes ……………………………………………………………………………………………………………………………………………………………………………………2.20 2.49 1.89 3.02 1.69 0.59 0.83 0.51 1.00 0.55
Income (loss) after income taxes ………………………………………………………………………………………………………………………………………………………………………………………………7.36 9.07 8.17 10.84 7.25 (2.83) 5.17 2.46 6.13 0.78
OPERATING RATIOS
(see explanatory notes)
Annual rate of profit on stockholders' equity at end of period:
Before income taxes ……………………………………………………………………………………………………………………………………………………………………………………………………………………21.94 24.05 21.02 31.47 21.12 (10.21) 26.29 13.28 28.18 5.84
After income taxes ………………………………………………………………………………………………………………………………………………………………………………………………………………16.89 18.87 17.07 24.62 17.13 (12.87) 22.66 10.99 24.24 3.43
Annual rate of profit on total assets:
Before income taxes ………………………………………………………………………………………………………………………………………………………………………………………………………………11.60 12.62 11.01 16.51 11.18 (5.20) 12.30 6.15 14.73 2.95
After income taxes …………………………………………………………………………………………………………………………………………………………………………………………………………………………8.93 9.90 8.94 12.91 9.07 (6.56) 10.60 5.09 12.67 1.74
BALANCE SHEET RATIOS
(based on succeeding table)
Total current assets to total current liabilities …………………………………………………………………………………………………………………………………………………………………………………………………2.56 2.49 2.40 2.37 2.39 2.53 2.23 2.28 2.73 2.44
Total cash, U.S. Government and other securities, to total current liabilities …………………………………………………………………………………………………………………………………………………………………0.36 0.30 0.31 0.28 0.38 0.49 0.38 0.37 0.52 0.54
Total stockholders' equity to total debt ………………………………………………………………………………………………………………………………………………………………………………………………………2.43 2.38 2.39 2.41 2.60 1.86 1.56 1.55 1.94 1.94
(percent of net sales) (percent of net sales)
(percent) (percent)
Table 6.0 -- Income Statement For Corporations in NAICS Manufacturing Subsectors 315 and 316,
All Total Asset Sizes, and Total Assets Under $25 Million
See the Survey Methodology section of the Introduction for information on survey design, estimation, and sampling error.
Apparel and Leather Products
All Total Asset Sizes
Apparel and Leather Products
Total Assets Under $25 Million
(million dollars) (million dollars)
12U.S. Census Bureau, Quarterly Financial Report, 2014 Quarter 4
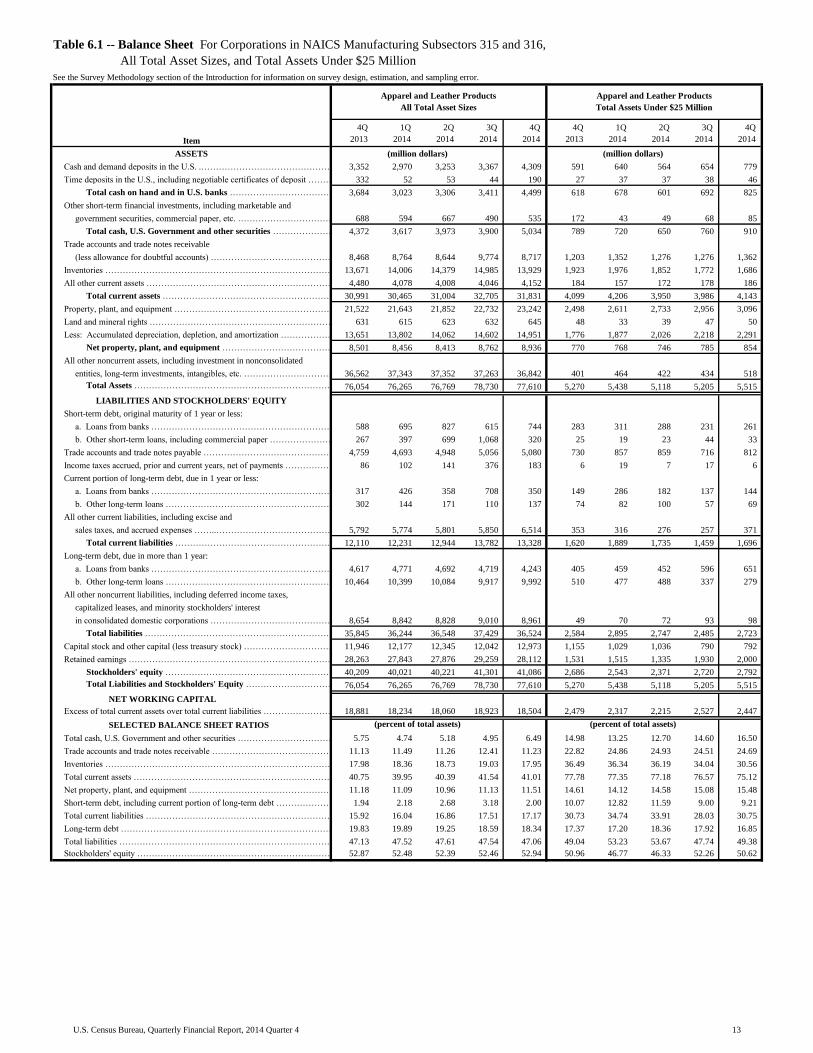
Table with row headers in column A with column headers in rows 5 and 6
Item
4Q_
2013_
1Q_
2014_
2Q_
2014_
3Q_
2014_
4Q_
2014_
4Q_
2013_
1Q_
2014_
2Q_
2014_
3Q_
2014_
4Q_
2014_
ASSETS
Cash and demand deposits in the U.S. .………………………………………………………………………………………………………………………………………………………………………………………………………………………………3,352 2,970 3,253 3,367 4,309 591 640 564 654 779
Time deposits in the U.S., including negotiable certificates of deposit ……………………………………………………………………………………………………………………………………………………………………………………332 52 53 44 190 27 37 37 38 46
Total cash on hand and in U.S. banks ……………………………………………………………………………………………………………………………………………………………………………………3,684 3,023 3,306 3,411 4,499 618 678 601 692 825
Other short-term financial investments, including marketable and
government securities, commercial paper, etc. ………………………………………………………………………………………………………………………………………………………………………………………………………………………………688 594 667 490 535 172 43 49 68 85
Total cash, U.S. Government and other securities ……………………………………………………………………………………………………………………………………………………………………………………4,372 3,617 3,973 3,900 5,034 789 720 650 760 910
Trade accounts and trade notes receivable
(less allowance for doubtful accounts) …………………………………………………………………………………………………………………………………………8,468 8,764 8,644 9,774 8,717 1,203 1,352 1,276 1,276 1,362
Inventories ………………………………………………………………………………………………………………………………………………………………………………………………………………………………13,671 14,006 14,379 14,985 13,929 1,923 1,976 1,852 1,772 1,686
All other current assets ………………………………………………………………………………………………………………………………………………………………………………………………………………………………4,480 4,078 4,008 4,046 4,152 184 157 172 178 186
Total current assets ………………………………………………………………………………………………………………………………………………………………………………………………………………………………30,991 30,465 31,004 32,705 31,831 4,099 4,206 3,950 3,986 4,143
Property, plant, and equipment ………………………………………………………………………………………………………………………………………………………………………………………………………………………………21,522 21,643 21,852 22,732 23,242 2,498 2,611 2,733 2,956 3,096
Land and mineral rights ………………………………………………………………………………………………………………………………………………………………………………………………………………………………631 615 623 632 645 48 33 39 47 50
Less: Accumulated depreciation, depletion, and amortization ……………………………………………………………………………………………………………………………………………………………………………………13,651 13,802 14,062 14,602 14,951 1,776 1,877 2,026 2,218 2,291
Net property, plant, and equipment ……………………………………………………………………………………………………………………………………………………………………………………8,501 8,456 8,413 8,762 8,936 770 768 746 785 854
All other noncurrent assets, including investment in nonconsolidated
entities, long-term investments, intangibles, etc. ………………………………………………………………………………………………………………………………………………………………………………………………………………36,562 37,343 37,352 37,263 36,842 401 464 422 434 518
Total Assets …………………………………………………………………………………………………………………………………………………………………………………………………………………………76,054 76,265 76,769 78,730 77,610 5,270 5,438 5,118 5,205 5,515
LIABILITIES AND STOCKHOLDERS' EQUITY
Short-term debt, original maturity of 1 year or less:
a. Loans from banks ………………………………………………………………………………………………………………………………………………………………………………………………………………………588 695 827 615 744 283 311 288 231 261
b. Other short-term loans, including commercial paper ………………………………………………………………………………………………………………………………………………………………………………………267 397 699 1,068 320 25 19 23 44 33
Trade accounts and trade notes payable ……………………………………………………………………………………………………………………………………………………………………………………………………………4,759 4,693 4,948 5,056 5,080 730 857 859 716 812
Income taxes accrued, prior and current years, net of payments ………………………………………………………………………………………………………………………………………………………………………………86 102 141 376 183 6 19 7 17 6
Current portion of long-term debt, due in 1 year or less:
a. Loans from banks …………………………………………………………………………………………………………………………………………………………………………………………………………………………………317 426 358 708 350 149 286 182 137 144
b. Other long-term loans ……………………………………………………………………………………………………………………………………………………………………………………………………………………302 144 171 110 137 74 82 100 57 69
All other current liabilities, including excise and
sales taxes, and accrued expenses ……..……………………………………………………………………………………………………………………………………………………5,792 5,774 5,801 5,850 6,514 353 316 276 257 371
Total current liabilities ……………………………………………………………………………………………………………………………………………………………………………………………………………………12,110 12,231 12,944 13,782 13,328 1,620 1,889 1,735 1,459 1,696
Long-term debt, due in more than 1 year:
a. Loans from banks …………………………………………………………………………………………………………………………………………………………………………………………………………………………4,617 4,771 4,692 4,719 4,243 405 459 452 596 651
b. Other long-term loans ……………………………………………………………………………………………………………………………………………………………………………………………………………………10,464 10,399 10,084 9,917 9,992 510 477 488 337 279
All other noncurrent liabilities, including deferred income taxes,
capitalized leases, and minority stockholders' interest
in consolidated domestic corporations ……………………………………………………………………………………………………………………………………………………………………8,654 8,842 8,828 9,010 8,961 49 70 72 93 98
Total liabilities ……………………………………………………………………………………………………………………………………………………………………………………………………………………………35,845 36,244 36,548 37,429 36,524 2,584 2,895 2,747 2,485 2,723
Capital stock and other capital (less treasury stock) …………………………………………………………………………………………………………………………………………………………………………………………11,946 12,177 12,345 12,042 12,973 1,155 1,029 1,036 790 792
Retained earnings …………………………………………………………………………………………………………………………………………………………………………………………………………………………………28,263 27,843 27,876 29,259 28,112 1,531 1,515 1,335 1,930 2,000
Stockholders' equity ……………………………………………………………………………………………………………………………………………………………………………………………………………………40,209 40,021 40,221 41,301 41,086 2,686 2,543 2,371 2,720 2,792
Total Liabilities and Stockholders' Equity ………………………………………………………………………………………………………………………………………………………………………………………………76,054 76,265 76,769 78,730 77,610 5,270 5,438 5,118 5,205 5,515
NET WORKING CAPITAL
Excess of total current assets over total current liabilities ………………………………………………………………………………………………………………………………………………………………………………………18,881 18,234 18,060 18,923 18,504 2,479 2,317 2,215 2,527 2,447
SELECTED BALANCE SHEET RATIOS
Total cash, U.S. Government and other securities …………………………………………………………………………………………………………………………………………………………………………………………………5.75 4.74 5.18 4.95 6.49 14.98 13.25 12.70 14.60 16.50
Trade accounts and trade notes receivable ……………………………………………………………………………………………………………………………………………………………………………………………………11.13 11.49 11.26 12.41 11.23 22.82 24.86 24.93 24.51 24.69
Inventories ……………………………………………………………………………………………………………………………………………………………………………………………………………………………………17.98 18.36 18.73 19.03 17.95 36.49 36.34 36.19 34.04 30.56
Total current assets …………………………………………………………………………………………………………………………………………………………………………………………………………………………40.75 39.95 40.39 41.54 41.01 77.78 77.35 77.18 76.57 75.12
Net property, plant, and equipment ……………………………………………………………………………………………………………………………………………………………………………………………………………11.18 11.09 10.96 11.13 11.51 14.61 14.12 14.58 15.08 15.48
Short-term debt, including current portion of long-term debt ………………………………………………………………………………………………………………………………………………………………………………………1.94 2.18 2.68 3.18 2.00 10.07 12.82 11.59 9.00 9.21
Total current liabilities …………………………………………………………………………………………………………………………………………………………………………………………………………………………………15.92 16.04 16.86 17.51 17.17 30.73 34.74 33.91 28.03 30.75
Long-term debt …………………………………………………………………………………………………………………………………………………………………………………………………………………………………19.83 19.89 19.25 18.59 18.34 17.37 17.20 18.36 17.92 16.85
Total liabilities …………………………………………………………………………………………………………………………………………………………………………………………………………………………………47.13 47.52 47.61 47.54 47.06 49.04 53.23 53.67 47.74 49.38
Stockholders' equity ………………………………………………………………………………………………………………………………………………………………………………………………………………………………52.87 52.48 52.39 52.46 52.94 50.96 46.77 46.33 52.26 50.62
Table 6.1 -- Balance Sheet For Corporations in NAICS Manufacturing Subsectors 315 and 316,
All Total Asset Sizes, and Total Assets Under $25 Million
See the Survey Methodology section of the Introduction for information on survey design, estimation, and sampling error.
(million dollars)
(percent of total assets)
(million dollars)
(percent of total assets)
Apparel and Leather Products
All Total Asset Sizes
Apparel and Leather Products
Total Assets Under $25 Million
13U.S. Census Bureau, Quarterly Financial Report, 2014 Quarter 4

Table with row headers in column A with column headers in rows 5 and 6
Item
4Q_
2013_
1Q_
2014_
2Q_
2014_
3Q_
2014_
4Q_
2014_
4Q_
2013_
1Q_
2014_
2Q_
2014_
3Q_
2014_
4Q_
2014_
Net sales, receipts, and operating revenues ………………………………………………………………………………………………………………………………………………………………………33,799 32,775 34,116 33,360 32,723 4,355 4,011 4,326 4,550 4,149
Depreciation, depletion, and amortization of property,
plant, and equipment …………………………………………………………………………………………………………………………………………………………………………………………1,274 1,291 1,422 1,410 1,413 87 88 90 97 101
All other operating costs and expenses …………………………………………………………………………………………………………...……………………………………………………………30,530 30,338 30,604 29,059 29,161 3,867 3,814 4,022 4,182 3,880
Income (loss) from operations …………………………………………………………………………………………………………...……………………………………………………………1,994 1,146 2,090 2,892 2,149 401 109 213 272 168
Interest expense …………………………………………………………………………………………………………………………………………………………………………………………………………………………………………658 695 721 686 663 30 33 32 28 24
All other nonoperating income (expense) ……………………………………………………………………………………………………………………………………………………………………………………………………1,329 832 757 672 (321) 10 7 10 4 8
Income (loss) before income taxes ………………………………………………………………………………………………………………………………………………………………………………………………2,665 1,282 2,126 2,878 1,165 382 84 191 247 152
Provision for current and deferred domestic income taxes …………………………………………………………………………………………………………………………………………………………………………………………(518) 214 459 565 220 31 7 23 22 27
Income (loss) after income taxes …………………………………………………………………………………………………………………………………………………………………………………………………………3,183 1,069 1,667 2,312 945 350 77 168 225 125
Cash dividends charged to retained earnings this quarter ……………………………………………………………………………………………………………………………………………………………………………………988 1,257 1,075 1,249 1,041 58 36 60 184 58
Net income retained in business ……………………………………………………………………………………………………………………………………………………………………………………………………2,195 (188) 592 1,063 (96) 293 41 108 40 67
Retained earnings at beginning of quarter …………………………………………………………………………………………………………………………………………………………………………………………………………27,732 28,969 28,941 30,214 31,208 2,453 2,007 2,269 2,797 2,539
Other direct credits (charges) to retained earnings (net), including
stock and other non-cash dividends, etc. ……………………………………………………………………………………………………………………………………………………………………………………………………………………………(402) (125) 49 (104) (166) (286) (7) (48) (3) (16)
Retained earnings at end of quarter ……………………………………………………………………………………………………………………………………………………………………………………………………29,525 28,656 29,582 31,174 30,945 2,459 2,041 2,328 2,835 2,590
INCOME STATEMENT IN RATIO FORMAT
Net sales, receipts, and operating revenues ……………………………………………………………………………………………………………………………………………………………………………………………………100.00 100.00 100.00 100.00 100.00 100.00 100.00 100.00 100.00 100.00
Depreciation, depletion, and amortization of property,
plant, and equipment ………………………………………………………………………………………………………………………………………………………………………3.77 3.94 4.17 4.23 4.32 2.01 2.19 2.09 2.13 2.42
All other operating costs and expenses ……………………………………………………………………………………………………………………………………………………………………………………………………90.33 92.56 89.71 87.11 89.11 88.78 95.08 92.98 91.90 93.52
Income (loss) from operations …………………………………………………………………………………………………………………………………………………………………………………………………5.90 3.50 6.13 8.67 6.57 9.21 2.73 4.93 5.97 4.05
Interest expense …………………………………………………………………………………………………………………………………………………………………………………………………………………………………1.95 2.12 2.11 2.06 2.03 0.68 0.81 0.74 0.63 0.58
All other nonoperating income (expense) ……………………………………………………………………………………………………………………………………………………………………………………………3.93 2.54 2.22 2.01 (0.98) 0.23 0.17 0.22 0.08 0.19
Income (loss) before income taxes ……………………………………………………………………………………………………………………………………………………………………………………………7.89 3.91 6.23 8.63 3.56 8.76 2.09 4.42 5.42 3.66
Provision for current and deferred domestic income taxes ……………………………………………………………………………………………………………………………………………………………………………………(1.53) 0.65 1.35 1.70 0.67 0.72 0.18 0.54 0.48 0.66
Income (loss) after income taxes ………………………………………………………………………………………………………………………………………………………………………………………………9.42 3.26 4.89 6.93 2.89 8.04 1.91 3.88 4.94 3.00
OPERATING RATIOS
(see explanatory notes)
Annual rate of profit on stockholders' equity at end of period:
Before income taxes ……………………………………………………………………………………………………………………………………………………………………………………………………………………20.41 10.16 16.90 22.74 9.39 43.88 11.98 27.06 30.74 19.36
After income taxes ………………………………………………………………………………………………………………………………………………………………………………………………………………24.38 8.46 13.25 18.27 7.62 40.29 10.97 23.76 27.99 15.88
Annual rate of profit on total assets:
Before income taxes ………………………………………………………………………………………………………………………………………………………………………………………………………………7.44 3.61 5.97 8.07 3.28 22.18 4.69 10.53 12.76 8.69
After income taxes …………………………………………………………………………………………………………………………………………………………………………………………………………………………8.89 3.01 4.68 6.48 2.66 20.36 4.29 9.24 11.62 7.13
BALANCE SHEET RATIOS
(based on succeeding table)
Total current assets to total current liabilities …………………………………………………………………………………………………………………………………………………………………………………………………1.61 1.56 1.52 1.51 1.51 2.11 1.79 1.78 1.91 2.16
Total cash, U.S. Government and other securities, to total current liabilities …………………………………………………………………………………………………………………………………………………………………0.27 0.18 0.18 0.19 0.23 0.38 0.26 0.25 0.27 0.33
Total stockholders' equity to total debt ………………………………………………………………………………………………………………………………………………………………………………………………………1.06 1.01 1.01 1.02 1.00 1.83 1.25 1.37 1.43 1.63
(percent of net sales) (percent of net sales)
(percent) (percent)
Table 7.0 -- Income Statement For Corporations in NAICS Manufacturing Subsector 322,
All Total Asset Sizes, and Total Assets Under $25 Million
See the Survey Methodology section of the Introduction for information on survey design, estimation, and sampling error.
Paper
All Total Asset Sizes
Paper
Total Assets Under $25 Million
(million dollars) (million dollars)
14U.S. Census Bureau, Quarterly Financial Report, 2014 Quarter 4
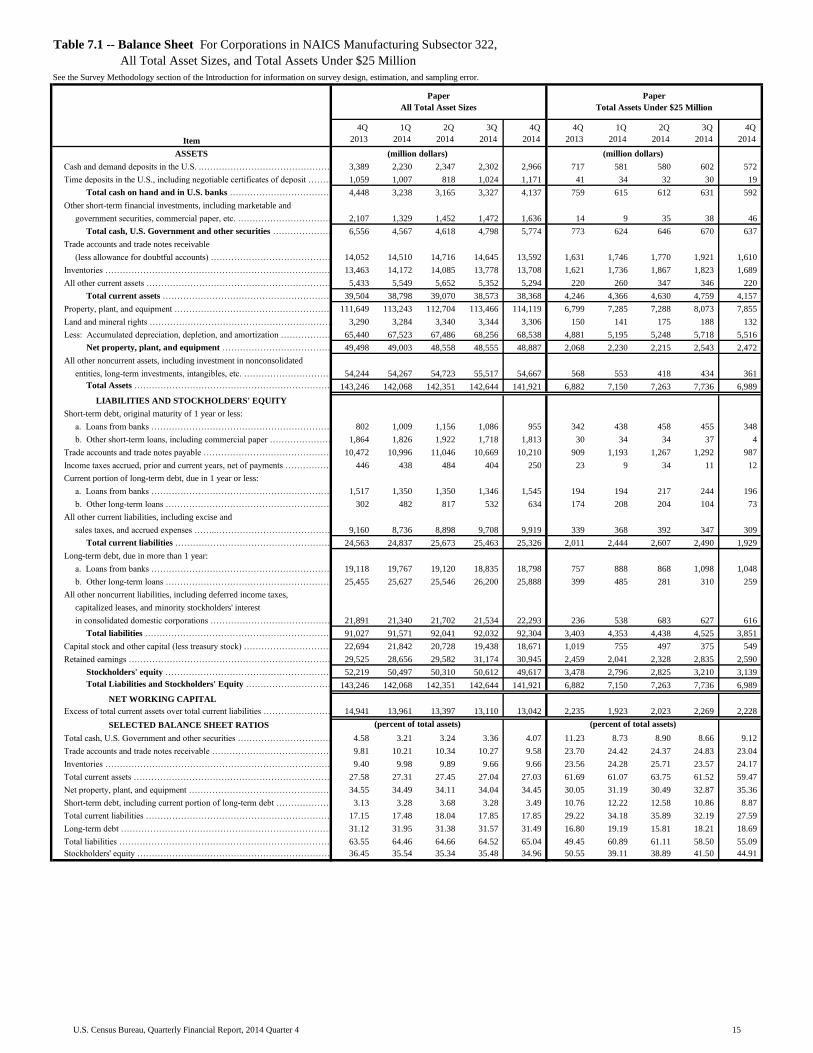
Table with row headers in column A with column headers in rows 5 and 6
Item
4Q_
2013_
1Q_
2014_
2Q_
2014_
3Q_
2014_
4Q_
2014_
4Q_
2013_
1Q_
2014_
2Q_
2014_
3Q_
2014_
4Q_
2014_
ASSETS
Cash and demand deposits in the U.S. .………………………………………………………………………………………………………………………………………………………………………………………………………………………………3,389 2,230 2,347 2,302 2,966 717 581 580 602 572
Time deposits in the U.S., including negotiable certificates of deposit ……………………………………………………………………………………………………………………………………………………………………………………1,059 1,007 818 1,024 1,171 41 34 32 30 19
Total cash on hand and in U.S. banks ……………………………………………………………………………………………………………………………………………………………………………………4,448 3,238 3,165 3,327 4,137 759 615 612 631 592
Other short-term financial investments, including marketable and
government securities, commercial paper, etc. ………………………………………………………………………………………………………………………………………………………………………………………………………………………………2,107 1,329 1,452 1,472 1,636 14 9 35 38 46
Total cash, U.S. Government and other securities ……………………………………………………………………………………………………………………………………………………………………………………6,556 4,567 4,618 4,798 5,774 773 624 646 670 637
Trade accounts and trade notes receivable
(less allowance for doubtful accounts) …………………………………………………………………………………………………………………………………………14,052 14,510 14,716 14,645 13,592 1,631 1,746 1,770 1,921 1,610
Inventories ………………………………………………………………………………………………………………………………………………………………………………………………………………………………13,463 14,172 14,085 13,778 13,708 1,621 1,736 1,867 1,823 1,689
All other current assets ………………………………………………………………………………………………………………………………………………………………………………………………………………………………5,433 5,549 5,652 5,352 5,294 220 260 347 346 220
Total current assets ………………………………………………………………………………………………………………………………………………………………………………………………………………………………39,504 38,798 39,070 38,573 38,368 4,246 4,366 4,630 4,759 4,157
Property, plant, and equipment ………………………………………………………………………………………………………………………………………………………………………………………………………………………………111,649 113,243 112,704 113,466 114,119 6,799 7,285 7,288 8,073 7,855
Land and mineral rights ………………………………………………………………………………………………………………………………………………………………………………………………………………………………3,290 3,284 3,340 3,344 3,306 150 141 175 188 132
Less: Accumulated depreciation, depletion, and amortization ……………………………………………………………………………………………………………………………………………………………………………………65,440 67,523 67,486 68,256 68,538 4,881 5,195 5,248 5,718 5,516
Net property, plant, and equipment ……………………………………………………………………………………………………………………………………………………………………………………49,498 49,003 48,558 48,555 48,887 2,068 2,230 2,215 2,543 2,472
All other noncurrent assets, including investment in nonconsolidated
entities, long-term investments, intangibles, etc. ………………………………………………………………………………………………………………………………………………………………………………………………………………54,244 54,267 54,723 55,517 54,667 568 553 418 434 361
Total Assets …………………………………………………………………………………………………………………………………………………………………………………………………………………………143,246 142,068 142,351 142,644 141,921 6,882 7,150 7,263 7,736 6,989
LIABILITIES AND STOCKHOLDERS' EQUITY
Short-term debt, original maturity of 1 year or less:
a. Loans from banks ………………………………………………………………………………………………………………………………………………………………………………………………………………………802 1,009 1,156 1,086 955 342 438 458 455 348
b. Other short-term loans, including commercial paper ………………………………………………………………………………………………………………………………………………………………………………………1,864 1,826 1,922 1,718 1,813 30 34 34 37 4
Trade accounts and trade notes payable ……………………………………………………………………………………………………………………………………………………………………………………………………………10,472 10,996 11,046 10,669 10,210 909 1,193 1,267 1,292 987
Income taxes accrued, prior and current years, net of payments ………………………………………………………………………………………………………………………………………………………………………………446 438 484 404 250 23 9 34 11 12
Current portion of long-term debt, due in 1 year or less:
a. Loans from banks …………………………………………………………………………………………………………………………………………………………………………………………………………………………………1,517 1,350 1,350 1,346 1,545 194 194 217 244 196
b. Other long-term loans ……………………………………………………………………………………………………………………………………………………………………………………………………………………302 482 817 532 634 174 208 204 104 73
All other current liabilities, including excise and
sales taxes, and accrued expenses ……..……………………………………………………………………………………………………………………………………………………9,160 8,736 8,898 9,708 9,919 339 368 392 347 309
Total current liabilities ……………………………………………………………………………………………………………………………………………………………………………………………………………………24,563 24,837 25,673 25,463 25,326 2,011 2,444 2,607 2,490 1,929
Long-term debt, due in more than 1 year:
a. Loans from banks …………………………………………………………………………………………………………………………………………………………………………………………………………………………19,118 19,767 19,120 18,835 18,798 757 888 868 1,098 1,048
b. Other long-term loans ……………………………………………………………………………………………………………………………………………………………………………………………………………………25,455 25,627 25,546 26,200 25,888 399 485 281 310 259
All other noncurrent liabilities, including deferred income taxes,
capitalized leases, and minority stockholders' interest
in consolidated domestic corporations ……………………………………………………………………………………………………………………………………………………………………21,891 21,340 21,702 21,534 22,293 236 538 683 627 616
Total liabilities ……………………………………………………………………………………………………………………………………………………………………………………………………………………………91,027 91,571 92,041 92,032 92,304 3,403 4,353 4,438 4,525 3,851
Capital stock and other capital (less treasury stock) …………………………………………………………………………………………………………………………………………………………………………………………22,694 21,842 20,728 19,438 18,671 1,019 755 497 375 549
Retained earnings …………………………………………………………………………………………………………………………………………………………………………………………………………………………………29,525 28,656 29,582 31,174 30,945 2,459 2,041 2,328 2,835 2,590
Stockholders' equity ……………………………………………………………………………………………………………………………………………………………………………………………………………………52,219 50,497 50,310 50,612 49,617 3,478 2,796 2,825 3,210 3,139
Total Liabilities and Stockholders' Equity ………………………………………………………………………………………………………………………………………………………………………………………………143,246 142,068 142,351 142,644 141,921 6,882 7,150 7,263 7,736 6,989
NET WORKING CAPITAL
Excess of total current assets over total current liabilities ………………………………………………………………………………………………………………………………………………………………………………………14,941 13,961 13,397 13,110 13,042 2,235 1,923 2,023 2,269 2,228
SELECTED BALANCE SHEET RATIOS
Total cash, U.S. Government and other securities …………………………………………………………………………………………………………………………………………………………………………………………………4.58 3.21 3.24 3.36 4.07 11.23 8.73 8.90 8.66 9.12
Trade accounts and trade notes receivable ……………………………………………………………………………………………………………………………………………………………………………………………………9.81 10.21 10.34 10.27 9.58 23.70 24.42 24.37 24.83 23.04
Inventories ……………………………………………………………………………………………………………………………………………………………………………………………………………………………………9.40 9.98 9.89 9.66 9.66 23.56 24.28 25.71 23.57 24.17
Total current assets …………………………………………………………………………………………………………………………………………………………………………………………………………………………27.58 27.31 27.45 27.04 27.03 61.69 61.07 63.75 61.52 59.47
Net property, plant, and equipment ……………………………………………………………………………………………………………………………………………………………………………………………………………34.55 34.49 34.11 34.04 34.45 30.05 31.19 30.49 32.87 35.36
Short-term debt, including current portion of long-term debt ………………………………………………………………………………………………………………………………………………………………………………………3.13 3.28 3.68 3.28 3.49 10.76 12.22 12.58 10.86 8.87
Total current liabilities …………………………………………………………………………………………………………………………………………………………………………………………………………………………………17.15 17.48 18.04 17.85 17.85 29.22 34.18 35.89 32.19 27.59
Long-term debt …………………………………………………………………………………………………………………………………………………………………………………………………………………………………31.12 31.95 31.38 31.57 31.49 16.80 19.19 15.81 18.21 18.69
Total liabilities …………………………………………………………………………………………………………………………………………………………………………………………………………………………………63.55 64.46 64.66 64.52 65.04 49.45 60.89 61.11 58.50 55.09
Stockholders' equity ………………………………………………………………………………………………………………………………………………………………………………………………………………………………36.45 35.54 35.34 35.48 34.96 50.55 39.11 38.89 41.50 44.91
Table 7.1 -- Balance Sheet For Corporations in NAICS Manufacturing Subsector 322,
All Total Asset Sizes, and Total Assets Under $25 Million
See the Survey Methodology section of the Introduction for information on survey design, estimation, and sampling error.
(million dollars)
(percent of total assets)
(million dollars)
(percent of total assets)
Paper
All Total Asset Sizes
Paper
Total Assets Under $25 Million
15U.S. Census Bureau, Quarterly Financial Report, 2014 Quarter 4
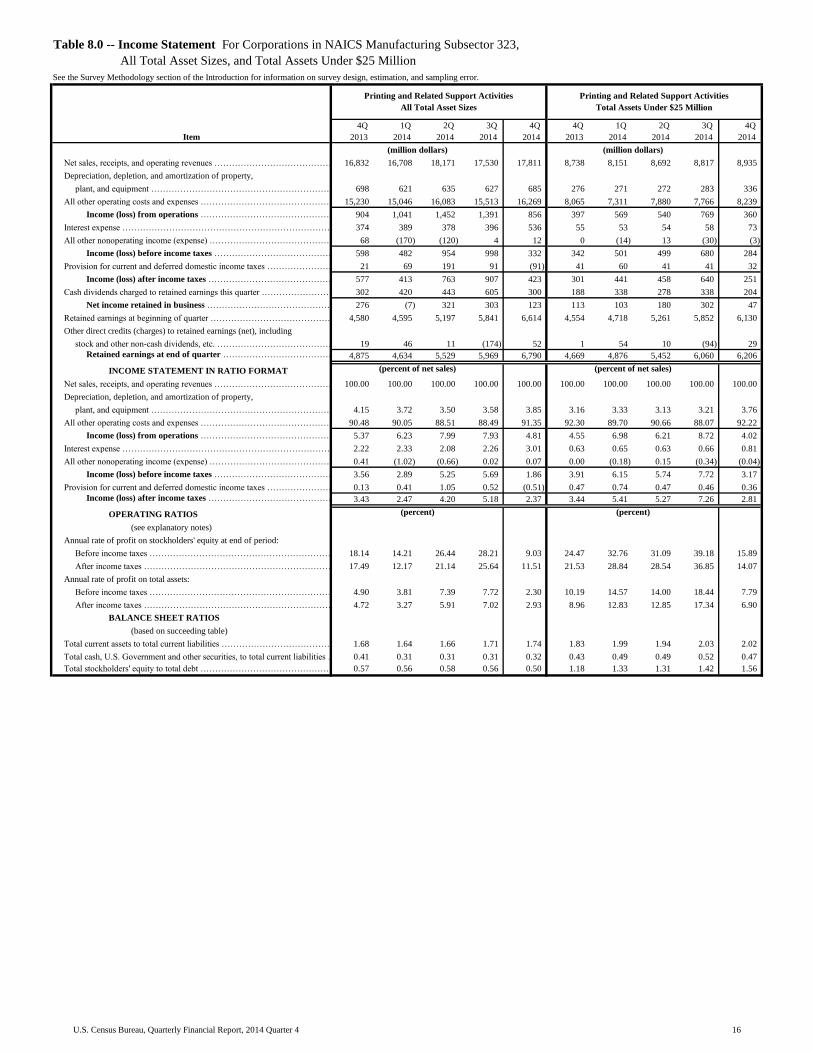
Table with row headers in column A with column headers in rows 5 and 6
Item
4Q_
2013_
1Q_
2014_
2Q_
2014_
3Q_
2014_
4Q_
2014_
4Q_
2013_
1Q_
2014_
2Q_
2014_
3Q_
2014_
4Q_
2014_
Net sales, receipts, and operating revenues ………………………………………………………………………………………………………………………………………………………………………16,832 16,708 18,171 17,530 17,811 8,738 8,151 8,692 8,817 8,935
Depreciation, depletion, and amortization of property,
plant, and equipment …………………………………………………………………………………………………………………………………………………………………………………………698 621 635 627 685 276 271 272 283 336
All other operating costs and expenses …………………………………………………………………………………………………………...……………………………………………………………15,230 15,046 16,083 15,513 16,269 8,065 7,311 7,880 7,766 8,239
Income (loss) from operations …………………………………………………………………………………………………………...……………………………………………………………904 1,041 1,452 1,391 856 397 569 540 769 360
Interest expense …………………………………………………………………………………………………………………………………………………………………………………………………………………………………………374 389 378 396 536 55 53 54 58 73
All other nonoperating income (expense) ……………………………………………………………………………………………………………………………………………………………………………………………………68 (170) (120) 4 12 0 (14) 13 (30) (3)
Income (loss) before income taxes ………………………………………………………………………………………………………………………………………………………………………………………………598 482 954 998 332 342 501 499 680 284
Provision for current and deferred domestic income taxes …………………………………………………………………………………………………………………………………………………………………………………………21 69 191 91 (91) 41 60 41 41 32
Income (loss) after income taxes …………………………………………………………………………………………………………………………………………………………………………………………………………577 413 763 907 423 301 441 458 640 251
Cash dividends charged to retained earnings this quarter ……………………………………………………………………………………………………………………………………………………………………………………302 420 443 605 300 188 338 278 338 204
Net income retained in business ……………………………………………………………………………………………………………………………………………………………………………………………………276 (7) 321 303 123 113 103 180 302 47
Retained earnings at beginning of quarter …………………………………………………………………………………………………………………………………………………………………………………………………………4,580 4,595 5,197 5,841 6,614 4,554 4,718 5,261 5,852 6,130
Other direct credits (charges) to retained earnings (net), including
stock and other non-cash dividends, etc. ……………………………………………………………………………………………………………………………………………………………………………………………………………………………19 46 11 (174) 52 1 54 10 (94) 29
Retained earnings at end of quarter ……………………………………………………………………………………………………………………………………………………………………………………………………4,875 4,634 5,529 5,969 6,790 4,669 4,876 5,452 6,060 6,206
INCOME STATEMENT IN RATIO FORMAT
Net sales, receipts, and operating revenues ……………………………………………………………………………………………………………………………………………………………………………………………………100.00 100.00 100.00 100.00 100.00 100.00 100.00 100.00 100.00 100.00
Depreciation, depletion, and amortization of property,
plant, and equipment ………………………………………………………………………………………………………………………………………………………………………4.15 3.72 3.50 3.58 3.85 3.16 3.33 3.13 3.21 3.76
All other operating costs and expenses ……………………………………………………………………………………………………………………………………………………………………………………………………90.48 90.05 88.51 88.49 91.35 92.30 89.70 90.66 88.07 92.22
Income (loss) from operations …………………………………………………………………………………………………………………………………………………………………………………………………5.37 6.23 7.99 7.93 4.81 4.55 6.98 6.21 8.72 4.02
Interest expense …………………………………………………………………………………………………………………………………………………………………………………………………………………………………2.22 2.33 2.08 2.26 3.01 0.63 0.65 0.63 0.66 0.81
All other nonoperating income (expense) ……………………………………………………………………………………………………………………………………………………………………………………………0.41 (1.02) (0.66) 0.02 0.07 0.00 (0.18) 0.15 (0.34) (0.04)
Income (loss) before income taxes ……………………………………………………………………………………………………………………………………………………………………………………………3.56 2.89 5.25 5.69 1.86 3.91 6.15 5.74 7.72 3.17
Provision for current and deferred domestic income taxes ……………………………………………………………………………………………………………………………………………………………………………………0.13 0.41 1.05 0.52 (0.51) 0.47 0.74 0.47 0.46 0.36
Income (loss) after income taxes ………………………………………………………………………………………………………………………………………………………………………………………………3.43 2.47 4.20 5.18 2.37 3.44 5.41 5.27 7.26 2.81
OPERATING RATIOS
(see explanatory notes)
Annual rate of profit on stockholders' equity at end of period:
Before income taxes ……………………………………………………………………………………………………………………………………………………………………………………………………………………18.14 14.21 26.44 28.21 9.03 24.47 32.76 31.09 39.18 15.89
After income taxes ………………………………………………………………………………………………………………………………………………………………………………………………………………17.49 12.17 21.14 25.64 11.51 21.53 28.84 28.54 36.85 14.07
Annual rate of profit on total assets:
Before income taxes ………………………………………………………………………………………………………………………………………………………………………………………………………………4.90 3.81 7.39 7.72 2.30 10.19 14.57 14.00 18.44 7.79
After income taxes …………………………………………………………………………………………………………………………………………………………………………………………………………………………4.72 3.27 5.91 7.02 2.93 8.96 12.83 12.85 17.34 6.90
BALANCE SHEET RATIOS
(based on succeeding table)
Total current assets to total current liabilities …………………………………………………………………………………………………………………………………………………………………………………………………1.68 1.64 1.66 1.71 1.74 1.83 1.99 1.94 2.03 2.02
Total cash, U.S. Government and other securities, to total current liabilities …………………………………………………………………………………………………………………………………………………………………0.41 0.31 0.31 0.31 0.32 0.43 0.49 0.49 0.52 0.47
Total stockholders' equity to total debt ………………………………………………………………………………………………………………………………………………………………………………………………………0.57 0.56 0.58 0.56 0.50 1.18 1.33 1.31 1.42 1.56
(percent of net sales) (percent of net sales)
(percent) (percent)
Table 8.0 -- Income Statement For Corporations in NAICS Manufacturing Subsector 323,
All Total Asset Sizes, and Total Assets Under $25 Million
See the Survey Methodology section of the Introduction for information on survey design, estimation, and sampling error.
Printing and Related Support Activities
All Total Asset Sizes
Printing and Related Support Activities
Total Assets Under $25 Million
(million dollars) (million dollars)
16U.S. Census Bureau, Quarterly Financial Report, 2014 Quarter 4

Table with row headers in column A with column headers in rows 5 and 6
Item
4Q_
2013_
1Q_
2014_
2Q_
2014_
3Q_
2014_
4Q_
2014_
4Q_
2013_
1Q_
2014_
2Q_
2014_
3Q_
2014_
4Q_
2014_
ASSETS
Cash and demand deposits in the U.S. .………………………………………………………………………………………………………………………………………………………………………………………………………………………………3,943 2,844 3,026 3,005 3,069 1,452 1,570 1,697 1,738 1,662
Time deposits in the U.S., including negotiable certificates of deposit ……………………………………………………………………………………………………………………………………………………………………………………262 159 148 193 237 71 70 65 103 131
Total cash on hand and in U.S. banks ……………………………………………………………………………………………………………………………………………………………………………………4,205 3,003 3,174 3,197 3,306 1,523 1,640 1,762 1,840 1,793
Other short-term financial investments, including marketable and
government securities, commercial paper, etc. ………………………………………………………………………………………………………………………………………………………………………………………………………………………………541 507 414 386 240 338 332 328 344 182
Total cash, U.S. Government and other securities ……………………………………………………………………………………………………………………………………………………………………………………4,746 3,510 3,588 3,583 3,546 1,861 1,971 2,090 2,184 1,975
Trade accounts and trade notes receivable
(less allowance for doubtful accounts) …………………………………………………………………………………………………………………………………………8,779 9,040 9,127 9,681 9,581 3,747 3,753 3,836 3,918 4,008
Inventories ………………………………………………………………………………………………………………………………………………………………………………………………………………………………4,227 4,507 4,669 4,702 4,472 1,622 1,738 1,795 1,832 1,853
All other current assets ………………………………………………………………………………………………………………………………………………………………………………………………………………………………1,557 1,541 1,612 1,453 1,919 643 504 562 552 561
Total current assets ………………………………………………………………………………………………………………………………………………………………………………………………………………………………19,308 18,597 18,996 19,418 19,519 7,873 7,967 8,282 8,487 8,397
Property, plant, and equipment ………………………………………………………………………………………………………………………………………………………………………………………………………………………………39,384 37,662 38,583 39,790 40,920 19,855 19,333 19,951 21,301 20,924
Land and mineral rights ………………………………………………………………………………………………………………………………………………………………………………………………………………………………443 407 383 367 387 131 151 132 119 132
Less: Accumulated depreciation, depletion, and amortization ……………………………………………………………………………………………………………………………………………………………………………………28,100 26,750 27,477 28,269 29,112 15,562 14,929 15,465 16,364 16,243
Net property, plant, and equipment ……………………………………………………………………………………………………………………………………………………………………………………11,727 11,319 11,490 11,888 12,195 4,424 4,555 4,618 5,056 4,814
All other noncurrent assets, including investment in nonconsolidated
entities, long-term investments, intangibles, etc. ………………………………………………………………………………………………………………………………………………………………………………………………………………17,851 20,628 21,193 20,389 26,095 1,124 1,243 1,353 1,214 1,346
Total Assets …………………………………………………………………………………………………………………………………………………………………………………………………………………………48,887 50,545 51,678 51,696 57,809 13,420 13,764 14,254 14,756 14,557
LIABILITIES AND STOCKHOLDERS' EQUITY
Short-term debt, original maturity of 1 year or less:
a. Loans from banks ………………………………………………………………………………………………………………………………………………………………………………………………………………………916 879 867 1,087 1,029 617 553 589 494 595
b. Other short-term loans, including commercial paper ………………………………………………………………………………………………………………………………………………………………………………………124 129 184 136 135 120 111 167 113 114
Trade accounts and trade notes payable ……………………………………………………………………………………………………………………………………………………………………………………………………………4,631 4,782 4,658 4,618 4,370 1,997 1,899 1,826 1,843 1,767
Income taxes accrued, prior and current years, net of payments ………………………………………………………………………………………………………………………………………………………………………………76 47 171 129 96 38 34 57 37 31
Current portion of long-term debt, due in 1 year or less:
a. Loans from banks …………………………………………………………………………………………………………………………………………………………………………………………………………………………………878 800 991 980 925 421 376 531 576 533
b. Other long-term loans ……………………………………………………………………………………………………………………………………………………………………………………………………………………1,215 776 837 871 480 255 170 214 245 254
All other current liabilities, including excise and
sales taxes, and accrued expenses ……..……………………………………………………………………………………………………………………………………………………3,676 3,951 3,701 3,567 4,171 850 857 880 881 865
Total current liabilities ……………………………………………………………………………………………………………………………………………………………………………………………………………………11,517 11,364 11,409 11,389 11,206 4,298 4,001 4,264 4,189 4,161
Long-term debt, due in more than 1 year:
a. Loans from banks …………………………………………………………………………………………………………………………………………………………………………………………………………………………11,078 11,507 11,940 11,344 13,233 2,205 2,338 2,247 2,158 1,922
b. Other long-term loans ……………………………………………………………………………………………………………………………………………………………………………………………………………………9,088 10,048 9,886 10,865 13,631 1,098 1,067 1,135 1,289 1,150
All other noncurrent liabilities, including deferred income taxes,
capitalized leases, and minority stockholders' interest
in consolidated domestic corporations ……………………………………………………………………………………………………………………………………………………………………4,008 4,060 4,003 3,942 5,043 232 236 188 175 189
Total liabilities ……………………………………………………………………………………………………………………………………………………………………………………………………………………………35,690 36,978 37,238 37,541 43,113 7,833 7,643 7,834 7,811 7,421
Capital stock and other capital (less treasury stock) …………………………………………………………………………………………………………………………………………………………………………………………8,322 8,933 8,911 8,186 7,906 919 1,246 968 885 930
Retained earnings …………………………………………………………………………………………………………………………………………………………………………………………………………………………………4,875 4,634 5,529 5,969 6,790 4,669 4,876 5,452 6,060 6,206
Stockholders' equity ……………………………………………………………………………………………………………………………………………………………………………………………………………………13,197 13,567 14,440 14,155 14,696 5,587 6,122 6,420 6,945 7,136
Total Liabilities and Stockholders' Equity ………………………………………………………………………………………………………………………………………………………………………………………………48,887 50,545 51,678 51,696 57,809 13,420 13,764 14,254 14,756 14,557
NET WORKING CAPITAL
Excess of total current assets over total current liabilities ………………………………………………………………………………………………………………………………………………………………………………………7,792 7,234 7,587 8,030 8,313 3,575 3,966 4,018 4,298 4,236
SELECTED BALANCE SHEET RATIOS
Total cash, U.S. Government and other securities …………………………………………………………………………………………………………………………………………………………………………………………………9.71 6.94 6.94 6.93 6.13 13.86 14.32 14.66 14.80 13.56
Trade accounts and trade notes receivable ……………………………………………………………………………………………………………………………………………………………………………………………………17.96 17.88 17.66 18.73 16.57 27.92 27.27 26.91 26.55 27.53
Inventories ……………………………………………………………………………………………………………………………………………………………………………………………………………………………………8.65 8.92 9.03 9.10 7.74 12.08 12.63 12.59 12.41 12.73
Total current assets …………………………………………………………………………………………………………………………………………………………………………………………………………………………39.50 36.79 36.76 37.56 33.76 58.66 57.88 58.11 57.51 57.68
Net property, plant, and equipment ……………………………………………………………………………………………………………………………………………………………………………………………………………23.99 22.39 22.23 23.00 21.10 32.96 33.09 32.40 34.26 33.07
Short-term debt, including current portion of long-term debt ………………………………………………………………………………………………………………………………………………………………………………………6.41 5.11 5.57 5.95 4.44 10.53 8.79 10.53 9.67 10.28
Total current liabilities …………………………………………………………………………………………………………………………………………………………………………………………………………………………………23.56 22.48 22.08 22.03 19.38 32.03 29.07 29.92 28.39 28.58
Long-term debt …………………………………………………………………………………………………………………………………………………………………………………………………………………………………41.25 42.64 42.24 42.96 46.47 24.61 24.74 23.73 23.36 21.10
Total liabilities …………………………………………………………………………………………………………………………………………………………………………………………………………………………………73.01 73.16 72.06 72.62 74.58 58.37 55.53 54.96 52.93 50.98
Stockholders' equity ………………………………………………………………………………………………………………………………………………………………………………………………………………………………26.99 26.84 27.94 27.38 25.42 41.63 44.47 45.04 47.07 49.02
Table 8.1 -- Balance Sheet For Corporations in NAICS Manufacturing Subsector 323,
All Total Asset Sizes, and Total Assets Under $25 Million
See the Survey Methodology section of the Introduction for information on survey design, estimation, and sampling error.
(million dollars)
(percent of total assets)
(million dollars)
(percent of total assets)
Printing and Related Support Activities
All Total Asset Sizes
Printing and Related Support Activities
Total Assets Under $25 Million
17U.S. Census Bureau, Quarterly Financial Report, 2014 Quarter 4

Table with row headers in column A with column headers in rows 5 and 6
Item
4Q_
2013_
1Q_
2014_
2Q_
2014_
3Q_
2014_
4Q_
2014_
4Q_
2013_
1Q_
2014_
2Q_
2014_
3Q_
2014_
4Q_
2014_
Net sales, receipts, and operating revenues ………………………………………………………………………………………………………………………………………………………………………327,506 324,525 345,049 336,410 271,619 1,086 750 1,087 1,343 1,254
Depreciation, depletion, and amortization of property,
plant, and equipment …………………………………………………………………………………………………………………………………………………………………………………………7,752 7,535 7,927 8,182 8,719 24 25 24 29 33
All other operating costs and expenses …………………………………………………………………………………………………………...……………………………………………………………313,047 306,902 326,537 318,258 260,610 1,077 750 944 1,235 1,251
Income (loss) from operations …………………………………………………………………………………………………………...……………………………………………………………6,708 10,088 10,586 9,970 2,290 (15) (25) 119 78 (31)
Interest expense …………………………………………………………………………………………………………………………………………………………………………………………………………………………………………1,769 1,746 1,829 1,690 1,783 4 6 7 10 11
All other nonoperating income (expense) ……………………………………………………………………………………………………………………………………………………………………………………………………12,774 15,942 13,984 15,420 11,128 (4) (2) 1 8 3
Income (loss) before income taxes ………………………………………………………………………………………………………………………………………………………………………………………………17,713 24,284 22,741 23,700 11,634 (23) (32) 113 76 (39)
Provision for current and deferred domestic income taxes …………………………………………………………………………………………………………………………………………………………………………………………(745) 3,807 3,024 2,627 (1,384) 4 8 8 14 14
Income (loss) after income taxes …………………………………………………………………………………………………………………………………………………………………………………………………………18,458 20,477 19,717 21,073 13,018 (27) (41) 106 63 (53)
Cash dividends charged to retained earnings this quarter ……………………………………………………………………………………………………………………………………………………………………………………5,957 6,255 6,274 6,563 6,893 39 59 56 55 97
Net income retained in business ……………………………………………………………………………………………………………………………………………………………………………………………………12,500 14,222 13,442 14,509 6,125 (66) (99) 50 8 (150)
Retained earnings at beginning of quarter …………………………………………………………………………………………………………………………………………………………………………………………………………686,012 699,103 712,621 725,689 741,426 735 797 727 701 978
Other direct credits (charges) to retained earnings (net), including
stock and other non-cash dividends, etc. ……………………………………………………………………………………………………………………………………………………………………………………………………………………………275 (794) (795) (147) (60) (25) 20 (11) (4) 8
Retained earnings at end of quarter ……………………………………………………………………………………………………………………………………………………………………………………………………698,787 712,530 725,268 740,052 747,491 644 718 766 705 837
INCOME STATEMENT IN RATIO FORMAT
Net sales, receipts, and operating revenues ……………………………………………………………………………………………………………………………………………………………………………………………………100.00 100.00 100.00 100.00 100.00 100.00 100.00 100.00 100.00 100.00
Depreciation, depletion, and amortization of property,
plant, and equipment ………………………………………………………………………………………………………………………………………………………………………2.37 2.32 2.30 2.43 3.21 2.20 3.30 2.18 2.19 2.65
All other operating costs and expenses ……………………………………………………………………………………………………………………………………………………………………………………………………95.59 94.57 94.63 94.60 95.95 99.17 100.01 86.85 91.98 99.82
Income (loss) from operations …………………………………………………………………………………………………………………………………………………………………………………………………2.05 3.11 3.07 2.96 0.84 (1.38) (3.31) 10.97 5.83 (2.47)
Interest expense …………………………………………………………………………………………………………………………………………………………………………………………………………………………………0.54 0.54 0.53 0.50 0.66 0.40 0.75 0.65 0.75 0.85
All other nonoperating income (expense) ……………………………………………………………………………………………………………………………………………………………………………………………3.90 4.91 4.05 4.58 4.10 (0.37) (0.26) 0.09 0.59 0.21
Income (loss) before income taxes ……………………………………………………………………………………………………………………………………………………………………………………………5.41 7.48 6.59 7.04 4.28 (2.15) (4.31) 10.40 5.68 (3.12)
Provision for current and deferred domestic income taxes ……………………………………………………………………………………………………………………………………………………………………………………(0.23) 1.17 0.88 0.78 (0.51) 0.37 1.12 0.70 1.02 1.11
Income (loss) after income taxes ………………………………………………………………………………………………………………………………………………………………………………………………5.64 6.31 5.71 6.26 4.79 (2.52) (5.43) 9.71 4.66 (4.23)
OPERATING RATIOS
(see explanatory notes)
Annual rate of profit on stockholders' equity at end of period:
Before income taxes ……………………………………………………………………………………………………………………………………………………………………………………………………………………12.54 16.99 15.60 16.07 8.05 (9.59) (11.59) 46.17 25.96 (13.20)
After income taxes ………………………………………………………………………………………………………………………………………………………………………………………………………………13.06 14.33 13.53 14.29 9.01 (11.23) (14.60) 43.08 21.32 (17.92)
Annual rate of profit on total assets:
Before income taxes ………………………………………………………………………………………………………………………………………………………………………………………………………………6.48 8.77 8.10 8.41 4.17 (4.97) (6.08) 22.42 12.46 (6.22)
After income taxes …………………………………………………………………………………………………………………………………………………………………………………………………………………………6.75 7.39 7.02 7.48 4.67 (5.81) (7.65) 20.92 10.23 (8.45)
BALANCE SHEET RATIOS
(based on succeeding table)
Total current assets to total current liabilities …………………………………………………………………………………………………………………………………………………………………………………………………0.94 0.97 0.99 0.97 0.92 2.02 2.23 1.99 1.98 2.02
Total cash, U.S. Government and other securities, to total current liabilities …………………………………………………………………………………………………………………………………………………………………0.17 0.14 0.14 0.15 0.14 0.40 0.58 0.41 0.38 0.41
Total stockholders' equity to total debt ………………………………………………………………………………………………………………………………………………………………………………………………………2.88 2.87 2.83 2.86 2.64 2.27 1.89 1.82 1.97 1.76
(percent of net sales) (percent of net sales)
(percent) (percent)
Table 9.0 -- Income Statement For Corporations in NAICS Manufacturing Subsector 324,
All Total Asset Sizes, and Total Assets Under $25 Million
See the Survey Methodology section of the Introduction for information on survey design, estimation, and sampling error.
Petroleum and Coal Products
All Total Asset Sizes
Petroleum and Coal Products
Total Assets Under $25 Million
(million dollars) (million dollars)
18U.S. Census Bureau, Quarterly Financial Report, 2014 Quarter 4
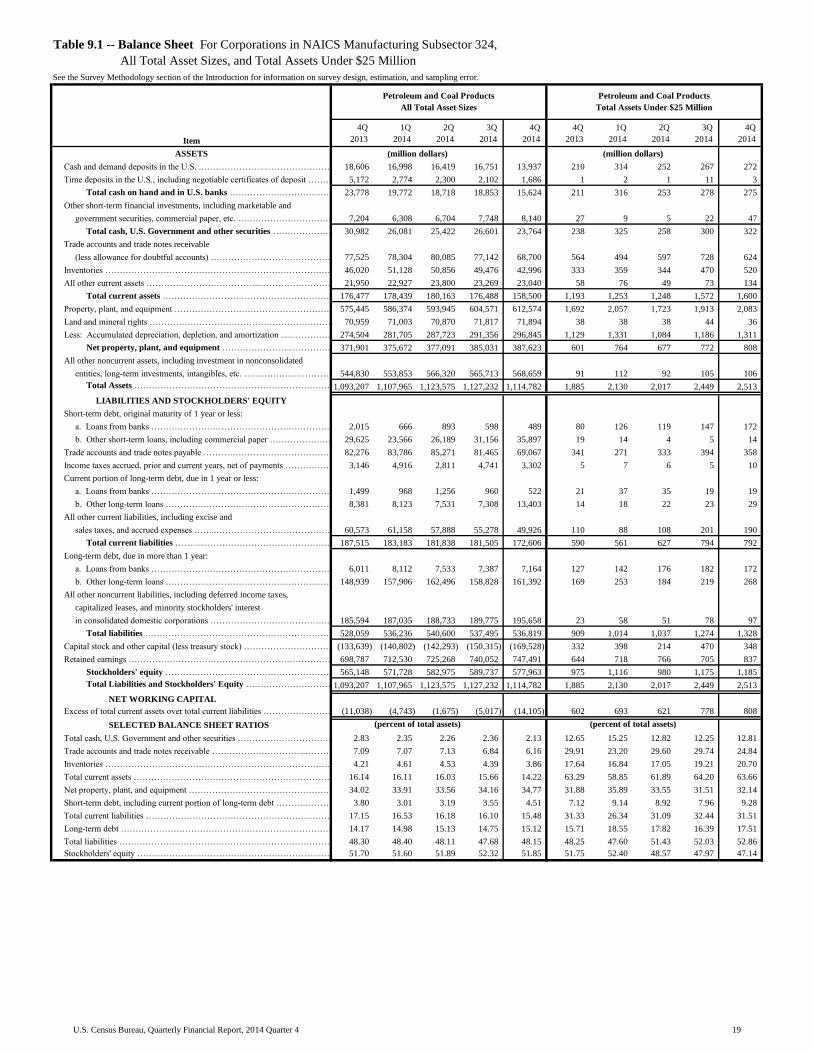
Table with row headers in column A with column headers in rows 5 and 6
Item
4Q_
2013_
1Q_
2014_
2Q_
2014_
3Q_
2014_
4Q_
2014_
4Q_
2013_
1Q_
2014_
2Q_
2014_
3Q_
2014_
4Q_
2014_
ASSETS
Cash and demand deposits in the U.S. .………………………………………………………………………………………………………………………………………………………………………………………………………………………………18,606 16,998 16,419 16,751 13,937 210 314 252 267 272
Time deposits in the U.S., including negotiable certificates of deposit ……………………………………………………………………………………………………………………………………………………………………………………5,172 2,774 2,300 2,102 1,686 1 2 1 11 3
Total cash on hand and in U.S. banks ……………………………………………………………………………………………………………………………………………………………………………………23,778 19,772 18,718 18,853 15,624 211 316 253 278 275
Other short-term financial investments, including marketable and
government securities, commercial paper, etc. ………………………………………………………………………………………………………………………………………………………………………………………………………………………………7,204 6,308 6,704 7,748 8,140 27 9 5 22 47
Total cash, U.S. Government and other securities ……………………………………………………………………………………………………………………………………………………………………………………30,982 26,081 25,422 26,601 23,764 238 325 258 300 322
Trade accounts and trade notes receivable
(less allowance for doubtful accounts) …………………………………………………………………………………………………………………………………………77,525 78,304 80,085 77,142 68,700 564 494 597 728 624
Inventories ………………………………………………………………………………………………………………………………………………………………………………………………………………………………46,020 51,128 50,856 49,476 42,996 333 359 344 470 520
All other current assets ………………………………………………………………………………………………………………………………………………………………………………………………………………………………21,950 22,927 23,800 23,269 23,040 58 76 49 73 134
Total current assets ………………………………………………………………………………………………………………………………………………………………………………………………………………………………176,477 178,439 180,163 176,488 158,500 1,193 1,253 1,248 1,572 1,600
Property, plant, and equipment ………………………………………………………………………………………………………………………………………………………………………………………………………………………………575,445 586,374 593,945 604,571 612,574 1,692 2,057 1,723 1,913 2,083
Land and mineral rights ………………………………………………………………………………………………………………………………………………………………………………………………………………………………70,959 71,003 70,870 71,817 71,894 38 38 38 44 36
Less: Accumulated depreciation, depletion, and amortization ……………………………………………………………………………………………………………………………………………………………………………………274,504 281,705 287,723 291,356 296,845 1,129 1,331 1,084 1,186 1,311
Net property, plant, and equipment ……………………………………………………………………………………………………………………………………………………………………………………371,901 375,672 377,091 385,031 387,623 601 764 677 772 808
All other noncurrent assets, including investment in nonconsolidated
entities, long-term investments, intangibles, etc. ………………………………………………………………………………………………………………………………………………………………………………………………………………544,830 553,853 566,320 565,713 568,659 91 112 92 105 106
Total Assets …………………………………………………………………………………………………………………………………………………………………………………………………………………………1,093,207 1,107,965 1,123,575 1,127,232 1,114,782 1,885 2,130 2,017 2,449 2,513
LIABILITIES AND STOCKHOLDERS' EQUITY
Short-term debt, original maturity of 1 year or less:
a. Loans from banks ………………………………………………………………………………………………………………………………………………………………………………………………………………………2,015 666 893 598 489 80 126 119 147 172
b. Other short-term loans, including commercial paper ………………………………………………………………………………………………………………………………………………………………………………………29,625 23,566 26,189 31,156 35,897 19 14 4 5 14
Trade accounts and trade notes payable ……………………………………………………………………………………………………………………………………………………………………………………………………………82,276 83,786 85,271 81,465 69,067 341 271 333 394 358
Income taxes accrued, prior and current years, net of payments ………………………………………………………………………………………………………………………………………………………………………………3,146 4,916 2,811 4,741 3,302 5 7 6 5 10
Current portion of long-term debt, due in 1 year or less:
a. Loans from banks …………………………………………………………………………………………………………………………………………………………………………………………………………………………………1,499 968 1,256 960 522 21 37 35 19 19
b. Other long-term loans ……………………………………………………………………………………………………………………………………………………………………………………………………………………8,381 8,123 7,531 7,308 13,403 14 18 22 23 29
All other current liabilities, including excise and
sales taxes, and accrued expenses ……..……………………………………………………………………………………………………………………………………………………60,573 61,158 57,888 55,278 49,926 110 88 108 201 190
Total current liabilities ……………………………………………………………………………………………………………………………………………………………………………………………………………………187,515 183,183 181,838 181,505 172,606 590 561 627 794 792
Long-term debt, due in more than 1 year:
a. Loans from banks …………………………………………………………………………………………………………………………………………………………………………………………………………………………6,011 8,112 7,533 7,387 7,164 127 142 176 182 172
b. Other long-term loans ……………………………………………………………………………………………………………………………………………………………………………………………………………………148,939 157,906 162,496 158,828 161,392 169 253 184 219 268
All other noncurrent liabilities, including deferred income taxes,
capitalized leases, and minority stockholders' interest
in consolidated domestic corporations ……………………………………………………………………………………………………………………………………………………………………185,594 187,035 188,733 189,775 195,658 23 58 51 78 97
Total liabilities ……………………………………………………………………………………………………………………………………………………………………………………………………………………………528,059 536,236 540,600 537,495 536,819 909 1,014 1,037 1,274 1,328
Capital stock and other capital (less treasury stock) …………………………………………………………………………………………………………………………………………………………………………………………(133,639) (140,802) (142,293) (150,315) (169,528) 332 398 214 470 348
Retained earnings …………………………………………………………………………………………………………………………………………………………………………………………………………………………………698,787 712,530 725,268 740,052 747,491 644 718 766 705 837
Stockholders' equity ……………………………………………………………………………………………………………………………………………………………………………………………………………………565,148 571,728 582,975 589,737 577,963 975 1,116 980 1,175 1,185
Total Liabilities and Stockholders' Equity ………………………………………………………………………………………………………………………………………………………………………………………………1,093,207 1,107,965 1,123,575 1,127,232 1,114,782 1,885 2,130 2,017 2,449 2,513
NET WORKING CAPITAL
Excess of total current assets over total current liabilities ………………………………………………………………………………………………………………………………………………………………………………………(11,038) (4,743) (1,675) (5,017) (14,105) 602 693 621 778 808
SELECTED BALANCE SHEET RATIOS
Total cash, U.S. Government and other securities …………………………………………………………………………………………………………………………………………………………………………………………………2.83 2.35 2.26 2.36 2.13 12.65 15.25 12.82 12.25 12.81
Trade accounts and trade notes receivable ……………………………………………………………………………………………………………………………………………………………………………………………………7.09 7.07 7.13 6.84 6.16 29.91 23.20 29.60 29.74 24.84
Inventories ……………………………………………………………………………………………………………………………………………………………………………………………………………………………………4.21 4.61 4.53 4.39 3.86 17.64 16.84 17.05 19.21 20.70
Total current assets …………………………………………………………………………………………………………………………………………………………………………………………………………………………16.14 16.11 16.03 15.66 14.22 63.29 58.85 61.89 64.20 63.66
Net property, plant, and equipment ……………………………………………………………………………………………………………………………………………………………………………………………………………34.02 33.91 33.56 34.16 34.77 31.88 35.89 33.55 31.51 32.14
Short-term debt, including current portion of long-term debt ………………………………………………………………………………………………………………………………………………………………………………………3.80 3.01 3.19 3.55 4.51 7.12 9.14 8.92 7.96 9.28
Total current liabilities …………………………………………………………………………………………………………………………………………………………………………………………………………………………………17.15 16.53 16.18 16.10 15.48 31.33 26.34 31.09 32.44 31.51
Long-term debt …………………………………………………………………………………………………………………………………………………………………………………………………………………………………14.17 14.98 15.13 14.75 15.12 15.71 18.55 17.82 16.39 17.51
Total liabilities …………………………………………………………………………………………………………………………………………………………………………………………………………………………………48.30 48.40 48.11 47.68 48.15 48.25 47.60 51.43 52.03 52.86
Stockholders' equity ………………………………………………………………………………………………………………………………………………………………………………………………………………………………51.70 51.60 51.89 52.32 51.85 51.75 52.40 48.57 47.97 47.14
Table 9.1 -- Balance Sheet For Corporations in NAICS Manufacturing Subsector 324,
All Total Asset Sizes, and Total Assets Under $25 Million
See the Survey Methodology section of the Introduction for information on survey design, estimation, and sampling error.
(million dollars)
(percent of total assets)
(million dollars)
(percent of total assets)
Petroleum and Coal Products
All Total Asset Sizes
Petroleum and Coal Products
Total Assets Under $25 Million
19U.S. Census Bureau, Quarterly Financial Report, 2014 Quarter 4
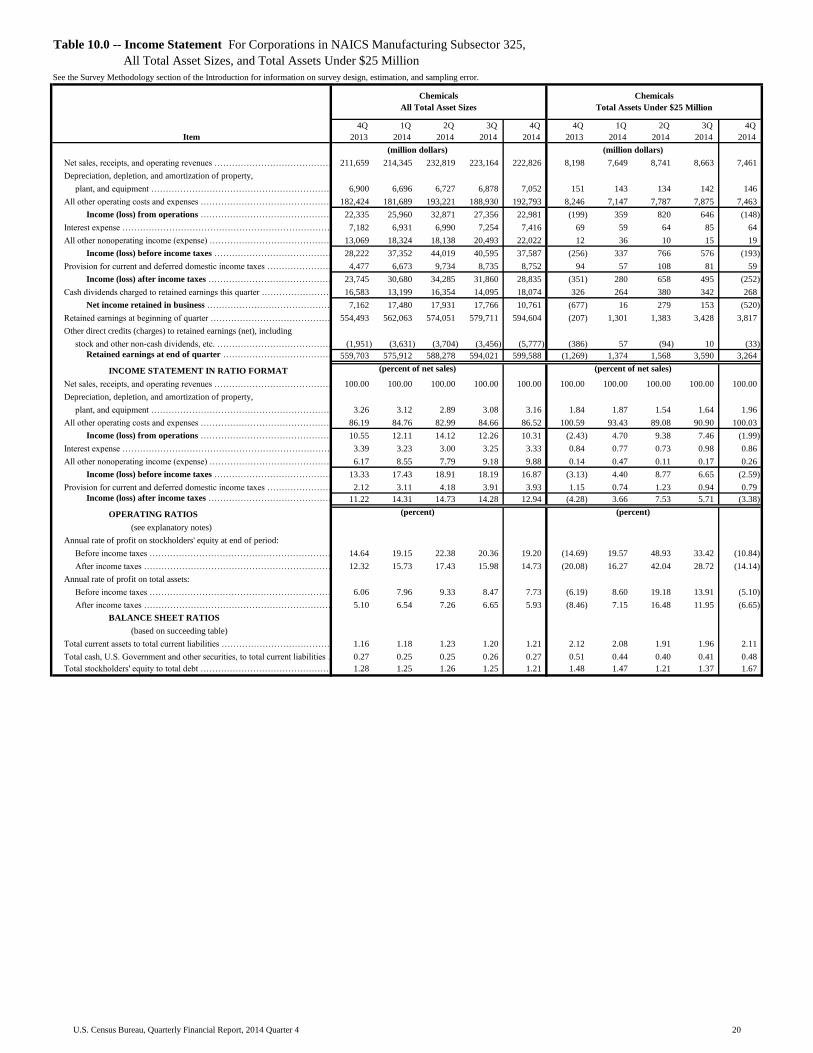
Table with row headers in column A with column headers in rows 5 and 6
Item
4Q_
2013_
1Q_
2014_
2Q_
2014_
3Q_
2014_
4Q_
2014_
4Q_
2013_
1Q_
2014_
2Q_
2014_
3Q_
2014_
4Q_
2014_
Net sales, receipts, and operating revenues ………………………………………………………………………………………………………………………………………………………………………211,659 214,345 232,819 223,164 222,826 8,198 7,649 8,741 8,663 7,461
Depreciation, depletion, and amortization of property,
plant, and equipment …………………………………………………………………………………………………………………………………………………………………………………………6,900 6,696 6,727 6,878 7,052 151 143 134 142 146
All other operating costs and expenses …………………………………………………………………………………………………………...……………………………………………………………182,424 181,689 193,221 188,930 192,793 8,246 7,147 7,787 7,875 7,463
Income (loss) from operations …………………………………………………………………………………………………………...……………………………………………………………22,335 25,960 32,871 27,356 22,981 (199) 359 820 646 (148)
Interest expense …………………………………………………………………………………………………………………………………………………………………………………………………………………………………………7,182 6,931 6,990 7,254 7,416 69 59 64 85 64
All other nonoperating income (expense) ……………………………………………………………………………………………………………………………………………………………………………………………………13,069 18,324 18,138 20,493 22,022 12 36 10 15 19
Income (loss) before income taxes ………………………………………………………………………………………………………………………………………………………………………………………………28,222 37,352 44,019 40,595 37,587 (256) 337 766 576 (193)
Provision for current and deferred domestic income taxes …………………………………………………………………………………………………………………………………………………………………………………………4,477 6,673 9,734 8,735 8,752 94 57 108 81 59
Income (loss) after income taxes …………………………………………………………………………………………………………………………………………………………………………………………………………23,745 30,680 34,285 31,860 28,835 (351) 280 658 495 (252)
Cash dividends charged to retained earnings this quarter ……………………………………………………………………………………………………………………………………………………………………………………16,583 13,199 16,354 14,095 18,074 326 264 380 342 268
Net income retained in business ……………………………………………………………………………………………………………………………………………………………………………………………………7,162 17,480 17,931 17,766 10,761 (677) 16 279 153 (520)
Retained earnings at beginning of quarter …………………………………………………………………………………………………………………………………………………………………………………………………………554,493 562,063 574,051 579,711 594,604 (207) 1,301 1,383 3,428 3,817
Other direct credits (charges) to retained earnings (net), including
stock and other non-cash dividends, etc. ……………………………………………………………………………………………………………………………………………………………………………………………………………………………(1,951) (3,631) (3,704) (3,456) (5,777) (386) 57 (94) 10 (33)
Retained earnings at end of quarter ……………………………………………………………………………………………………………………………………………………………………………………………………559,703 575,912 588,278 594,021 599,588 (1,269) 1,374 1,568 3,590 3,264
INCOME STATEMENT IN RATIO FORMAT
Net sales, receipts, and operating revenues ……………………………………………………………………………………………………………………………………………………………………………………………………100.00 100.00 100.00 100.00 100.00 100.00 100.00 100.00 100.00 100.00
Depreciation, depletion, and amortization of property,
plant, and equipment ………………………………………………………………………………………………………………………………………………………………………3.26 3.12 2.89 3.08 3.16 1.84 1.87 1.54 1.64 1.96
All other operating costs and expenses ……………………………………………………………………………………………………………………………………………………………………………………………………86.19 84.76 82.99 84.66 86.52 100.59 93.43 89.08 90.90 100.03
Income (loss) from operations …………………………………………………………………………………………………………………………………………………………………………………………………10.55 12.11 14.12 12.26 10.31 (2.43) 4.70 9.38 7.46 (1.99)
Interest expense …………………………………………………………………………………………………………………………………………………………………………………………………………………………………3.39 3.23 3.00 3.25 3.33 0.84 0.77 0.73 0.98 0.86
All other nonoperating income (expense) ……………………………………………………………………………………………………………………………………………………………………………………………6.17 8.55 7.79 9.18 9.88 0.14 0.47 0.11 0.17 0.26
Income (loss) before income taxes ……………………………………………………………………………………………………………………………………………………………………………………………13.33 17.43 18.91 18.19 16.87 (3.13) 4.40 8.77 6.65 (2.59)
Provision for current and deferred domestic income taxes ……………………………………………………………………………………………………………………………………………………………………………………2.12 3.11 4.18 3.91 3.93 1.15 0.74 1.23 0.94 0.79
Income (loss) after income taxes ………………………………………………………………………………………………………………………………………………………………………………………………11.22 14.31 14.73 14.28 12.94 (4.28) 3.66 7.53 5.71 (3.38)
OPERATING RATIOS
(see explanatory notes)
Annual rate of profit on stockholders' equity at end of period:
Before income taxes ……………………………………………………………………………………………………………………………………………………………………………………………………………………14.64 19.15 22.38 20.36 19.20 (14.69) 19.57 48.93 33.42 (10.84)
After income taxes ………………………………………………………………………………………………………………………………………………………………………………………………………………12.32 15.73 17.43 15.98 14.73 (20.08) 16.27 42.04 28.72 (14.14)
Annual rate of profit on total assets:
Before income taxes ………………………………………………………………………………………………………………………………………………………………………………………………………………6.06 7.96 9.33 8.47 7.73 (6.19) 8.60 19.18 13.91 (5.10)
After income taxes …………………………………………………………………………………………………………………………………………………………………………………………………………………………5.10 6.54 7.26 6.65 5.93 (8.46) 7.15 16.48 11.95 (6.65)
BALANCE SHEET RATIOS
(based on succeeding table)
Total current assets to total current liabilities …………………………………………………………………………………………………………………………………………………………………………………………………1.16 1.18 1.23 1.20 1.21 2.12 2.08 1.91 1.96 2.11
Total cash, U.S. Government and other securities, to total current liabilities …………………………………………………………………………………………………………………………………………………………………0.27 0.25 0.25 0.26 0.27 0.51 0.44 0.40 0.41 0.48
Total stockholders' equity to total debt ………………………………………………………………………………………………………………………………………………………………………………………………………1.28 1.25 1.26 1.25 1.21 1.48 1.47 1.21 1.37 1.67
(percent of net sales) (percent of net sales)
(percent) (percent)
Table 10.0 -- Income Statement For Corporations in NAICS Manufacturing Subsector 325,
All Total Asset Sizes, and Total Assets Under $25 Million
See the Survey Methodology section of the Introduction for information on survey design, estimation, and sampling error.
Chemicals
All Total Asset Sizes
Chemicals
Total Assets Under $25 Million
(million dollars) (million dollars)
20U.S. Census Bureau, Quarterly Financial Report, 2014 Quarter 4

Table with row headers in column A with column headers in rows 5 and 6
Item
4Q_
2013_
1Q_
2014_
2Q_
2014_
3Q_
2014_
4Q_
2014_
4Q_
2013_
1Q_
2014_
2Q_
2014_
3Q_
2014_
4Q_
2014_
ASSETS
Cash and demand deposits in the U.S. .………………………………………………………………………………………………………………………………………………………………………………………………………………………………56,844 45,981 47,756 46,006 61,284 2,316 1,886 1,906 1,992 1,634
Time deposits in the U.S., including negotiable certificates of deposit ……………………………………………………………………………………………………………………………………………………………………………………17,980 15,267 11,654 13,769 14,808 46 79 101 103 115
Total cash on hand and in U.S. banks ……………………………………………………………………………………………………………………………………………………………………………………74,824 61,247 59,410 59,776 76,092 2,362 1,965 2,008 2,095 1,750
Other short-term financial investments, including marketable and
government securities, commercial paper, etc. ………………………………………………………………………………………………………………………………………………………………………………………………………………………………24,854 29,543 29,270 36,642 24,042 352 311 224 222 579
Total cash, U.S. Government and other securities ……………………………………………………………………………………………………………………………………………………………………………………99,678 90,790 88,680 96,418 100,134 2,714 2,276 2,232 2,318 2,328
Trade accounts and trade notes receivable
(less allowance for doubtful accounts) …………………………………………………………………………………………………………………………………………109,081 114,888 126,218 122,812 123,179 4,020 3,913 4,166 4,193 3,484
Inventories ………………………………………………………………………………………………………………………………………………………………………………………………………………………………111,242 114,498 111,261 111,532 112,414 3,962 3,813 3,644 3,794 3,700
All other current assets ………………………………………………………………………………………………………………………………………………………………………………………………………………………………99,329 107,616 103,757 106,449 105,724 690 664 553 779 661
Total current assets ………………………………………………………………………………………………………………………………………………………………………………………………………………………………419,330 427,790 429,916 437,210 441,451 11,385 10,666 10,595 11,084 10,174
Property, plant, and equipment ………………………………………………………………………………………………………………………………………………………………………………………………………………………………490,109 490,895 497,370 502,756 510,379 10,245 9,547 9,626 9,668 9,389
Land and mineral rights ………………………………………………………………………………………………………………………………………………………………………………………………………………………………16,922 17,314 17,229 17,218 17,167 230 225 229 188 175
Less: Accumulated depreciation, depletion, and amortization ……………………………………………………………………………………………………………………………………………………………………………………272,217 272,977 276,752 279,904 283,873 6,541 6,123 6,113 6,064 5,934
Net property, plant, and equipment ……………………………………………………………………………………………………………………………………………………………………………………234,814 235,232 237,847 240,069 243,672 3,934 3,649 3,742 3,793 3,630
All other noncurrent assets, including investment in nonconsolidated
entities, long-term investments, intangibles, etc. ………………………………………………………………………………………………………………………………………………………………………………………………………………1,209,169 1,214,807 1,220,049 1,239,505 1,258,642 1,259 1,352 1,643 1,687 1,361
Total Assets …………………………………………………………………………………………………………………………………………………………………………………………………………………………1,863,313 1,877,829 1,887,812 1,916,784 1,943,765 16,578 15,667 15,980 16,563 15,166
LIABILITIES AND STOCKHOLDERS' EQUITY
Short-term debt, original maturity of 1 year or less:
a. Loans from banks ………………………………………………………………………………………………………………………………………………………………………………………………………………………7,437 7,674 6,628 6,712 7,182 810 846 843 886 823
b. Other short-term loans, including commercial paper ………………………………………………………………………………………………………………………………………………………………………………………49,622 56,152 42,396 56,460 51,365 153 157 221 127 90
Trade accounts and trade notes payable ……………………………………………………………………………………………………………………………………………………………………………………………………………90,934 90,292 89,672 87,846 91,836 2,758 2,556 2,883 2,723 2,231
Income taxes accrued, prior and current years, net of payments ………………………………………………………………………………………………………………………………………………………………………………10,224 10,646 11,076 13,511 10,573 44 25 45 54 51
Current portion of long-term debt, due in 1 year or less:
a. Loans from banks …………………………………………………………………………………………………………………………………………………………………………………………………………………………………4,053 4,765 4,351 5,044 6,380 316 337 269 258 219
b. Other long-term loans ……………………………………………………………………………………………………………………………………………………………………………………………………………………44,092 47,468 45,736 43,379 37,196 197 198 295 300 273
All other current liabilities, including excise and
sales taxes, and accrued expenses ……..……………………………………………………………………………………………………………………………………………………156,394 145,308 149,089 151,800 160,817 1,082 998 1,002 1,304 1,146
Total current liabilities ……………………………………………………………………………………………………………………………………………………………………………………………………………………362,755 362,305 348,949 364,753 365,349 5,360 5,117 5,559 5,652 4,833
Long-term debt, due in more than 1 year:
a. Loans from banks …………………………………………………………………………………………………………………………………………………………………………………………………………………………77,259 77,485 78,522 79,109 81,565 1,541 1,356 1,454 1,557 1,154
b. Other long-term loans ……………………………………………………………………………………………………………………………………………………………………………………………………………………420,674 430,177 447,965 446,198 463,444 1,709 1,798 2,098 1,919 1,719
All other noncurrent liabilities, including deferred income taxes,
capitalized leases, and minority stockholders' interest
in consolidated domestic corporations ……………………………………………………………………………………………………………………………………………………………………231,726 227,756 225,620 229,345 250,232 984 513 606 542 327
Total liabilities ……………………………………………………………………………………………………………………………………………………………………………………………………………………………1,092,414 1,097,723 1,101,056 1,119,406 1,160,591 9,595 8,784 9,716 9,670 8,033
Capital stock and other capital (less treasury stock) …………………………………………………………………………………………………………………………………………………………………………………………211,196 204,194 198,478 203,357 183,586 8,252 5,509 4,696 3,303 3,869
Retained earnings …………………………………………………………………………………………………………………………………………………………………………………………………………………………………559,703 575,912 588,278 594,021 599,588 (1,269) 1,374 1,568 3,590 3,264
Stockholders' equity ……………………………………………………………………………………………………………………………………………………………………………………………………………………770,899 780,106 786,756 797,378 783,174 6,983 6,883 6,264 6,893 7,132
Total Liabilities and Stockholders' Equity ………………………………………………………………………………………………………………………………………………………………………………………………1,863,313 1,877,829 1,887,812 1,916,784 1,943,765 16,578 15,667 15,980 16,563 15,166
NET WORKING CAPITAL
Excess of total current assets over total current liabilities ………………………………………………………………………………………………………………………………………………………………………………………56,575 65,486 80,967 72,457 76,102 6,025 5,549 5,037 5,432 5,341
SELECTED BALANCE SHEET RATIOS
Total cash, U.S. Government and other securities …………………………………………………………………………………………………………………………………………………………………………………………………5.35 4.83 4.70 5.03 5.15 16.37 14.53 13.97 13.99 15.35
Trade accounts and trade notes receivable ……………………………………………………………………………………………………………………………………………………………………………………………………5.85 6.12 6.69 6.41 6.34 24.25 24.97 26.07 25.32 22.97
Inventories ……………………………………………………………………………………………………………………………………………………………………………………………………………………………………5.97 6.10 5.89 5.82 5.78 23.90 24.34 22.80 22.90 24.40
Total current assets …………………………………………………………………………………………………………………………………………………………………………………………………………………………22.50 22.78 22.77 22.81 22.71 68.67 68.08 66.30 66.92 67.09
Net property, plant, and equipment ……………………………………………………………………………………………………………………………………………………………………………………………………………12.60 12.53 12.60 12.52 12.54 23.73 23.29 23.42 22.90 23.94
Short-term debt, including current portion of long-term debt ………………………………………………………………………………………………………………………………………………………………………………………5.65 6.18 5.25 5.82 5.25 8.90 9.82 10.19 9.48 9.26
Total current liabilities …………………………………………………………………………………………………………………………………………………………………………………………………………………………………19.47 19.29 18.48 19.03 18.80 32.33 32.66 34.78 34.12 31.87
Long-term debt …………………………………………………………………………………………………………………………………………………………………………………………………………………………………26.72 27.03 27.89 27.41 28.04 19.61 20.13 22.22 20.99 18.95
Total liabilities …………………………………………………………………………………………………………………………………………………………………………………………………………………………………58.63 58.46 58.32 58.40 59.71 57.88 56.07 60.80 58.38 52.97
Stockholders' equity ………………………………………………………………………………………………………………………………………………………………………………………………………………………………41.37 41.54 41.68 41.60 40.29 42.12 43.93 39.20 41.62 47.03
Table 10.1 -- Balance Sheet For Corporations in NAICS Manufacturing Subsector 325,
All Total Asset Sizes, and Total Assets Under $25 Million
See the Survey Methodology section of the Introduction for information on survey design, estimation, and sampling error.
(million dollars)
(percent of total assets)
(million dollars)
(percent of total assets)
Chemicals
All Total Asset Sizes
Chemicals
Total Assets Under $25 Million
21U.S. Census Bureau, Quarterly Financial Report, 2014 Quarter 4

Table with row headers in column A with column headers in rows 5 and 6
Item
4Q_
2013_
1Q_
2014_
2Q_
2014_
3Q_
2014_
4Q_
2014_
4Q_
2013_
1Q_
2014_
2Q_
2014_
3Q_
2014_
4Q_
2014_
Net sales, receipts, and operating revenues ………………………………………………………………………………………………………………………………………………………………………70,661 74,373 77,102 74,397 70,147 1,531 1,281 1,916 1,803 1,656
Depreciation, depletion, and amortization of property,
plant, and equipment …………………………………………………………………………………………………………………………………………………………………………………………2,784 2,606 2,620 2,721 2,682 31 29 35 38 40
All other operating costs and expenses …………………………………………………………………………………………………………...……………………………………………………………63,811 65,050 67,391 65,293 63,483 1,523 1,214 1,784 1,684 1,641
Income (loss) from operations …………………………………………………………………………………………………………...……………………………………………………………4,066 6,717 7,090 6,384 3,981 (22) 39 98 81 (25)
Interest expense …………………………………………………………………………………………………………………………………………………………………………………………………………………………………………1,773 1,665 1,677 1,804 1,879 14 12 15 17 16
All other nonoperating income (expense) ……………………………………………………………………………………………………………………………………………………………………………………………………1,369 2,626 2,954 2,942 (428) 4 5 3 5 (1)
Income (loss) before income taxes ………………………………………………………………………………………………………………………………………………………………………………………………3,662 7,678 8,367 7,522 1,675 (32) 32 85 69 (42)
Provision for current and deferred domestic income taxes …………………………………………………………………………………………………………………………………………………………………………………………1,331 2,127 2,340 1,786 195 17 10 11 13 18
Income (loss) after income taxes …………………………………………………………………………………………………………………………………………………………………………………………………………2,331 5,551 6,028 5,735 1,480 (49) 22 75 56 (60)
Cash dividends charged to retained earnings this quarter ……………………………………………………………………………………………………………………………………………………………………………………2,098 1,775 2,217 4,342 2,244 140 33 81 66 56
Net income retained in business ……………………………………………………………………………………………………………………………………………………………………………………………………233 3,776 3,810 1,393 (764) (189) (11) (6) (10) (116)
Retained earnings at beginning of quarter …………………………………………………………………………………………………………………………………………………………………………………………………………72,356 72,783 73,826 78,816 80,743 (306) (1,073) (1,301) 450 1,073
Other direct credits (charges) to retained earnings (net), including
stock and other non-cash dividends, etc. ……………………………………………………………………………………………………………………………………………………………………………………………………………………………236 (1,944) (996) (685) (533) (78) 31 12 7 (4)
Retained earnings at end of quarter ……………………………………………………………………………………………………………………………………………………………………………………………………72,824 74,615 76,640 79,524 79,446 (573) (1,053) (1,295) 447 953
INCOME STATEMENT IN RATIO FORMAT
Net sales, receipts, and operating revenues ……………………………………………………………………………………………………………………………………………………………………………………………………100.00 100.00 100.00 100.00 100.00 100.00 100.00 100.00 100.00 100.00
Depreciation, depletion, and amortization of property,
plant, and equipment ………………………………………………………………………………………………………………………………………………………………………3.94 3.50 3.40 3.66 3.82 1.99 2.23 1.80 2.10 2.43
All other operating costs and expenses ……………………………………………………………………………………………………………………………………………………………………………………………………90.31 87.46 87.41 87.76 90.50 99.44 94.76 93.09 93.42 99.09
Income (loss) from operations …………………………………………………………………………………………………………………………………………………………………………………………………5.75 9.03 9.20 8.58 5.68 (1.44) 3.02 5.11 4.47 (1.53)
Interest expense …………………………………………………………………………………………………………………………………………………………………………………………………………………………………2.51 2.24 2.17 2.43 2.68 0.88 0.91 0.79 0.93 0.97
All other nonoperating income (expense) ……………………………………………………………………………………………………………………………………………………………………………………………1.94 3.53 3.83 3.95 (0.61) 0.23 0.42 0.13 0.27 (0.07)
Income (loss) before income taxes ……………………………………………………………………………………………………………………………………………………………………………………………5.18 10.32 10.85 10.11 2.39 (2.09) 2.52 4.46 3.81 (2.57)
Provision for current and deferred domestic income taxes ……………………………………………………………………………………………………………………………………………………………………………………1.88 2.86 3.03 2.40 0.28 1.11 0.77 0.57 0.69 1.06
Income (loss) after income taxes ………………………………………………………………………………………………………………………………………………………………………………………………3.30 7.46 7.82 7.71 2.11 (3.20) 1.75 3.89 3.12 (3.63)
OPERATING RATIOS
(see explanatory notes)
Annual rate of profit on stockholders' equity at end of period:
Before income taxes ……………………………………………………………………………………………………………………………………………………………………………………………………………………11.71 24.23 25.87 23.65 5.60 (15.87) 14.69 38.04 22.73 (10.33)
After income taxes ………………………………………………………………………………………………………………………………………………………………………………………………………………7.45 17.52 18.64 18.03 4.95 (24.31) 10.18 33.18 18.59 (14.61)
Annual rate of profit on total assets:
Before income taxes ………………………………………………………………………………………………………………………………………………………………………………………………………………3.62 7.59 8.17 7.19 1.58 (4.09) 4.43 9.12 7.36 (4.41)
After income taxes …………………………………………………………………………………………………………………………………………………………………………………………………………………………2.30 5.49 5.89 5.48 1.39 (6.26) 3.07 7.96 6.02 (6.23)
BALANCE SHEET RATIOS
(based on succeeding table)
Total current assets to total current liabilities …………………………………………………………………………………………………………………………………………………………………………………………………1.18 1.18 1.19 1.17 1.12 1.97 2.06 1.75 1.74 1.96
Total cash, U.S. Government and other securities, to total current liabilities …………………………………………………………………………………………………………………………………………………………………0.23 0.17 0.16 0.24 0.20 0.50 0.53 0.37 0.35 0.38
Total stockholders' equity to total debt ………………………………………………………………………………………………………………………………………………………………………………………………………0.83 0.85 0.85 0.78 0.71 0.60 0.69 0.48 0.74 1.19
Table 11.0 -- Income Statement For Corporations in NAICS Manufacturing Industry Groups 3251 and 3252,
All Total Asset Sizes, and Total Assets Under $25 Million
See the Survey Methodology section of the Introduction for information on survey design, estimation, and sampling error.
Basic Chemicals, Resins, and Synthetics
All Total Asset Sizes 1
Basic Chemicals, Resins, and Synthetics
Total Assets Under $25 Million 1
(million dollars) (million dollars)
(percent of net sales) (percent of net sales)
(percent) (percent)
1 Included in Chemicals.
22U.S. Census Bureau, Quarterly Financial Report, 2014 Quarter 4
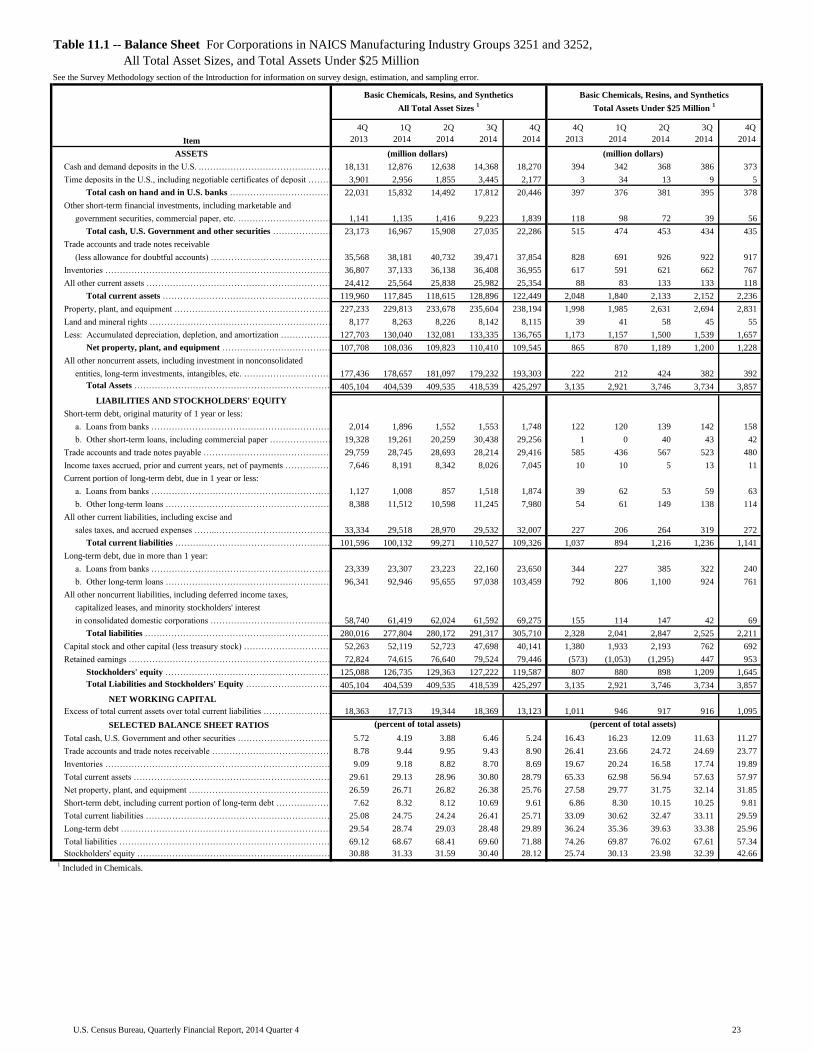
Table with row headers in column A with column headers in rows 5 and 6
Item
4Q_
2013_
1Q_
2014_
2Q_
2014_
3Q_
2014_
4Q_
2014_
4Q_
2013_
1Q_
2014_
2Q_
2014_
3Q_
2014_
4Q_
2014_
ASSETS
Cash and demand deposits in the U.S. .………………………………………………………………………………………………………………………………………………………………………………………………………………………………18,131 12,876 12,638 14,368 18,270 394 342 368 386 373
Time deposits in the U.S., including negotiable certificates of deposit ……………………………………………………………………………………………………………………………………………………………………………………3,901 2,956 1,855 3,445 2,177 3 34 13 9 5
Total cash on hand and in U.S. banks ……………………………………………………………………………………………………………………………………………………………………………………22,031 15,832 14,492 17,812 20,446 397 376 381 395 378
Other short-term financial investments, including marketable and
government securities, commercial paper, etc. ………………………………………………………………………………………………………………………………………………………………………………………………………………………………1,141 1,135 1,416 9,223 1,839 118 98 72 39 56
Total cash, U.S. Government and other securities ……………………………………………………………………………………………………………………………………………………………………………………23,173 16,967 15,908 27,035 22,286 515 474 453 434 435
Trade accounts and trade notes receivable
(less allowance for doubtful accounts) …………………………………………………………………………………………………………………………………………35,568 38,181 40,732 39,471 37,854 828 691 926 922 917
Inventories ………………………………………………………………………………………………………………………………………………………………………………………………………………………………36,807 37,133 36,138 36,408 36,955 617 591 621 662 767
All other current assets ………………………………………………………………………………………………………………………………………………………………………………………………………………………………24,412 25,564 25,838 25,982 25,354 88 83 133 133 118
Total current assets ………………………………………………………………………………………………………………………………………………………………………………………………………………………………119,960 117,845 118,615 128,896 122,449 2,048 1,840 2,133 2,152 2,236
Property, plant, and equipment ………………………………………………………………………………………………………………………………………………………………………………………………………………………………227,233 229,813 233,678 235,604 238,194 1,998 1,985 2,631 2,694 2,831
Land and mineral rights ………………………………………………………………………………………………………………………………………………………………………………………………………………………………8,177 8,263 8,226 8,142 8,115 39 41 58 45 55
Less: Accumulated depreciation, depletion, and amortization ……………………………………………………………………………………………………………………………………………………………………………………127,703 130,040 132,081 133,335 136,765 1,173 1,157 1,500 1,539 1,657
Net property, plant, and equipment ……………………………………………………………………………………………………………………………………………………………………………………107,708 108,036 109,823 110,410 109,545 865 870 1,189 1,200 1,228
All other noncurrent assets, including investment in nonconsolidated
entities, long-term investments, intangibles, etc. ………………………………………………………………………………………………………………………………………………………………………………………………………………177,436 178,657 181,097 179,232 193,303 222 212 424 382 392
Total Assets …………………………………………………………………………………………………………………………………………………………………………………………………………………………405,104 404,539 409,535 418,539 425,297 3,135 2,921 3,746 3,734 3,857
LIABILITIES AND STOCKHOLDERS' EQUITY
Short-term debt, original maturity of 1 year or less:
a. Loans from banks ………………………………………………………………………………………………………………………………………………………………………………………………………………………2,014 1,896 1,552 1,553 1,748 122 120 139 142 158
b. Other short-term loans, including commercial paper ………………………………………………………………………………………………………………………………………………………………………………………19,328 19,261 20,259 30,438 29,256 1 0 40 43 42
Trade accounts and trade notes payable ……………………………………………………………………………………………………………………………………………………………………………………………………………29,759 28,745 28,693 28,214 29,416 585 436 567 523 480
Income taxes accrued, prior and current years, net of payments ………………………………………………………………………………………………………………………………………………………………………………7,646 8,191 8,342 8,026 7,045 10 10 5 13 11
Current portion of long-term debt, due in 1 year or less:
a. Loans from banks …………………………………………………………………………………………………………………………………………………………………………………………………………………………………1,127 1,008 857 1,518 1,874 39 62 53 59 63
b. Other long-term loans ……………………………………………………………………………………………………………………………………………………………………………………………………………………8,388 11,512 10,598 11,245 7,980 54 61 149 138 114
All other current liabilities, including excise and
sales taxes, and accrued expenses ……..……………………………………………………………………………………………………………………………………………………33,334 29,518 28,970 29,532 32,007 227 206 264 319 272
Total current liabilities ……………………………………………………………………………………………………………………………………………………………………………………………………………………101,596 100,132 99,271 110,527 109,326 1,037 894 1,216 1,236 1,141
Long-term debt, due in more than 1 year:
a. Loans from banks …………………………………………………………………………………………………………………………………………………………………………………………………………………………23,339 23,307 23,223 22,160 23,650 344 227 385 322 240
b. Other long-term loans ……………………………………………………………………………………………………………………………………………………………………………………………………………………96,341 92,946 95,655 97,038 103,459 792 806 1,100 924 761
All other noncurrent liabilities, including deferred income taxes,
capitalized leases, and minority stockholders' interest
in consolidated domestic corporations ……………………………………………………………………………………………………………………………………………………………………58,740 61,419 62,024 61,592 69,275 155 114 147 42 69
Total liabilities ……………………………………………………………………………………………………………………………………………………………………………………………………………………………280,016 277,804 280,172 291,317 305,710 2,328 2,041 2,847 2,525 2,211
Capital stock and other capital (less treasury stock) …………………………………………………………………………………………………………………………………………………………………………………………52,263 52,119 52,723 47,698 40,141 1,380 1,933 2,193 762 692
Retained earnings …………………………………………………………………………………………………………………………………………………………………………………………………………………………………72,824 74,615 76,640 79,524 79,446 (573) (1,053) (1,295) 447 953
Stockholders' equity ……………………………………………………………………………………………………………………………………………………………………………………………………………………125,088 126,735 129,363 127,222 119,587 807 880 898 1,209 1,645
Total Liabilities and Stockholders' Equity ………………………………………………………………………………………………………………………………………………………………………………………………405,104 404,539 409,535 418,539 425,297 3,135 2,921 3,746 3,734 3,857
NET WORKING CAPITAL
Excess of total current assets over total current liabilities ………………………………………………………………………………………………………………………………………………………………………………………18,363 17,713 19,344 18,369 13,123 1,011 946 917 916 1,095
SELECTED BALANCE SHEET RATIOS
Total cash, U.S. Government and other securities …………………………………………………………………………………………………………………………………………………………………………………………………5.72 4.19 3.88 6.46 5.24 16.43 16.23 12.09 11.63 11.27
Trade accounts and trade notes receivable ……………………………………………………………………………………………………………………………………………………………………………………………………8.78 9.44 9.95 9.43 8.90 26.41 23.66 24.72 24.69 23.77
Inventories ……………………………………………………………………………………………………………………………………………………………………………………………………………………………………9.09 9.18 8.82 8.70 8.69 19.67 20.24 16.58 17.74 19.89
Total current assets …………………………………………………………………………………………………………………………………………………………………………………………………………………………29.61 29.13 28.96 30.80 28.79 65.33 62.98 56.94 57.63 57.97
Net property, plant, and equipment ……………………………………………………………………………………………………………………………………………………………………………………………………………26.59 26.71 26.82 26.38 25.76 27.58 29.77 31.75 32.14 31.85
Short-term debt, including current portion of long-term debt ………………………………………………………………………………………………………………………………………………………………………………………7.62 8.32 8.12 10.69 9.61 6.86 8.30 10.15 10.25 9.81
Total current liabilities …………………………………………………………………………………………………………………………………………………………………………………………………………………………………25.08 24.75 24.24 26.41 25.71 33.09 30.62 32.47 33.11 29.59
Long-term debt …………………………………………………………………………………………………………………………………………………………………………………………………………………………………29.54 28.74 29.03 28.48 29.89 36.24 35.36 39.63 33.38 25.96
Total liabilities …………………………………………………………………………………………………………………………………………………………………………………………………………………………………69.12 68.67 68.41 69.60 71.88 74.26 69.87 76.02 67.61 57.34
Stockholders' equity ………………………………………………………………………………………………………………………………………………………………………………………………………………………………30.88 31.33 31.59 30.40 28.12 25.74 30.13 23.98 32.39 42.66
1 Included in Chemicals.
Table 11.1 -- Balance Sheet For Corporations in NAICS Manufacturing Industry Groups 3251 and 3252,
All Total Asset Sizes, and Total Assets Under $25 Million
See the Survey Methodology section of the Introduction for information on survey design, estimation, and sampling error.
(million dollars)
(percent of total assets)
(million dollars)
(percent of total assets)
Basic Chemicals, Resins, and Synthetics
All Total Asset Sizes 1
Basic Chemicals, Resins, and Synthetics
Total Assets Under $25 Million 1
23U.S. Census Bureau, Quarterly Financial Report, 2014 Quarter 4

Table with row headers in column A with column headers in rows 5 and 6
Item
4Q_
2013_
1Q_
2014_
2Q_
2014_
3Q_
2014_
4Q_
2014_
4Q_
2013_
1Q_
2014_
2Q_
2014_
3Q_
2014_
4Q_
2014_
Net sales, receipts, and operating revenues ………………………………………………………………………………………………………………………………………………………………………86,470 83,273 92,106 92,883 97,568 1,236 1,138 1,183 1,158 917
Depreciation, depletion, and amortization of property,
plant, and equipment …………………………………………………………………………………………………………………………………………………………………………………………2,360 2,324 2,329 2,362 2,467 29 23 22 19 17
All other operating costs and expenses …………………………………………………………………………………………………………...……………………………………………………………72,485 70,127 73,414 76,003 82,119 1,559 1,165 1,105 1,071 1,094
Income (loss) from operations …………………………………………………………………………………………………………...……………………………………………………………11,625 10,822 16,362 14,518 12,982 (352) (50) 55 68 (194)
Interest expense …………………………………………………………………………………………………………………………………………………………………………………………………………………………………………3,882 3,758 3,984 4,091 4,114 6 7 8 10 12
All other nonoperating income (expense) ……………………………………………………………………………………………………………………………………………………………………………………………………5,951 10,430 12,074 13,892 18,452 2 4 (2) 3 6
Income (loss) before income taxes ………………………………………………………………………………………………………………………………………………………………………………………………13,695 17,495 24,452 24,319 27,319 (355) (53) 46 61 (200)
Provision for current and deferred domestic income taxes …………………………………………………………………………………………………………………………………………………………………………………………673 1,432 4,142 4,906 6,348 16 11 12 22 2
Income (loss) after income taxes …………………………………………………………………………………………………………………………………………………………………………………………………………13,021 16,062 20,311 19,413 20,971 (371) (64) 33 40 (202)
Cash dividends charged to retained earnings this quarter ……………………………………………………………………………………………………………………………………………………………………………………11,255 6,033 10,263 6,203 12,279 29 30 76 27 34
Net income retained in business ……………………………………………………………………………………………………………………………………………………………………………………………………1,766 10,030 10,048 13,210 8,692 (400) (94) (43) 12 (235)
Retained earnings at beginning of quarter …………………………………………………………………………………………………………………………………………………………………………………………………………289,461 290,862 299,030 296,829 307,127 (426) 348 609 492 (254)
Other direct credits (charges) to retained earnings (net), including
stock and other non-cash dividends, etc. ……………………………………………………………………………………………………………………………………………………………………………………………………………………………(682) (1,351) (1,472) (2,749) (3,762) (55) 1 (47) 30 (7)
Retained earnings at end of quarter ……………………………………………………………………………………………………………………………………………………………………………………………………290,545 299,540 307,606 307,289 312,057 (881) 256 520 534 (496)
INCOME STATEMENT IN RATIO FORMAT
Net sales, receipts, and operating revenues ……………………………………………………………………………………………………………………………………………………………………………………………………100.00 100.00 100.00 100.00 100.00 100.00 100.00 100.00 100.00 100.00
Depreciation, depletion, and amortization of property,
plant, and equipment ………………………………………………………………………………………………………………………………………………………………………2.73 2.79 2.53 2.54 2.53 2.31 2.00 1.89 1.65 1.87
All other operating costs and expenses ……………………………………………………………………………………………………………………………………………………………………………………………………83.83 84.21 79.71 81.83 84.17 126.13 102.39 93.46 92.48 119.24
Income (loss) from operations …………………………………………………………………………………………………………………………………………………………………………………………………13.44 13.00 17.76 15.63 13.31 (28.44) (4.39) 4.65 5.87 (21.11)
Interest expense …………………………………………………………………………………………………………………………………………………………………………………………………………………………………4.49 4.51 4.33 4.40 4.22 0.50 0.60 0.64 0.83 1.27
All other nonoperating income (expense) ……………………………………………………………………………………………………………………………………………………………………………………………6.88 12.53 13.11 14.96 18.91 0.19 0.35 (0.17) 0.27 0.62
Income (loss) before income taxes ……………………………………………………………………………………………………………………………………………………………………………………………15.84 21.01 26.55 26.18 28.00 (28.75) (4.64) 3.85 5.30 (21.77)
Provision for current and deferred domestic income taxes ……………………………………………………………………………………………………………………………………………………………………………………0.78 1.72 4.50 5.28 6.51 1.26 0.98 1.04 1.87 0.22
Income (loss) after income taxes ………………………………………………………………………………………………………………………………………………………………………………………………15.06 19.29 22.05 20.90 21.49 (30.01) (5.62) 2.80 3.43 (21.98)
OPERATING RATIOS
(see explanatory notes)
Annual rate of profit on stockholders' equity at end of period:
Before income taxes ……………………………………………………………………………………………………………………………………………………………………………………………………………………12.34 15.49 21.36 20.70 23.29 (84.31) (14.38) 14.25 17.75 (74.67)
After income taxes ………………………………………………………………………………………………………………………………………………………………………………………………………………11.74 14.22 17.74 16.53 17.88 (88.01) (17.42) 10.39 11.48 (75.41)
Annual rate of profit on total assets:
Before income taxes ………………………………………………………………………………………………………………………………………………………………………………………………………………5.32 6.71 9.29 9.08 10.04 (46.24) (7.92) 7.09 9.16 (33.50)
After income taxes …………………………………………………………………………………………………………………………………………………………………………………………………………………………5.06 6.16 7.71 7.25 7.71 (48.26) (9.59) 5.16 5.93 (33.83)
BALANCE SHEET RATIOS
(based on succeeding table)
Total current assets to total current liabilities …………………………………………………………………………………………………………………………………………………………………………………………………1.13 1.18 1.26 1.22 1.27 2.37 2.33 1.96 2.09 1.80
Total cash, U.S. Government and other securities, to total current liabilities …………………………………………………………………………………………………………………………………………………………………0.31 0.31 0.34 0.31 0.35 0.83 0.60 0.55 0.57 0.75
Total stockholders' equity to total debt ………………………………………………………………………………………………………………………………………………………………………………………………………1.34 1.30 1.31 1.35 1.34 3.10 2.65 2.24 2.50 1.82
Table 12.0 -- Income Statement For Corporations in NAICS Manufacturing Industry Group 3254,
All Total Asset Sizes, and Total Assets Under $25 Million
See the Survey Methodology section of the Introduction for information on survey design, estimation, and sampling error.
Pharmaceuticals and Medicines
All Total Asset Sizes 1
Pharmaceuticals and Medicines
Total Assets Under $25 Million 1
(million dollars) (million dollars)
(percent of net sales) (percent of net sales)
(percent) (percent)
1 Included in Chemicals.
24U.S. Census Bureau, Quarterly Financial Report, 2014 Quarter 4
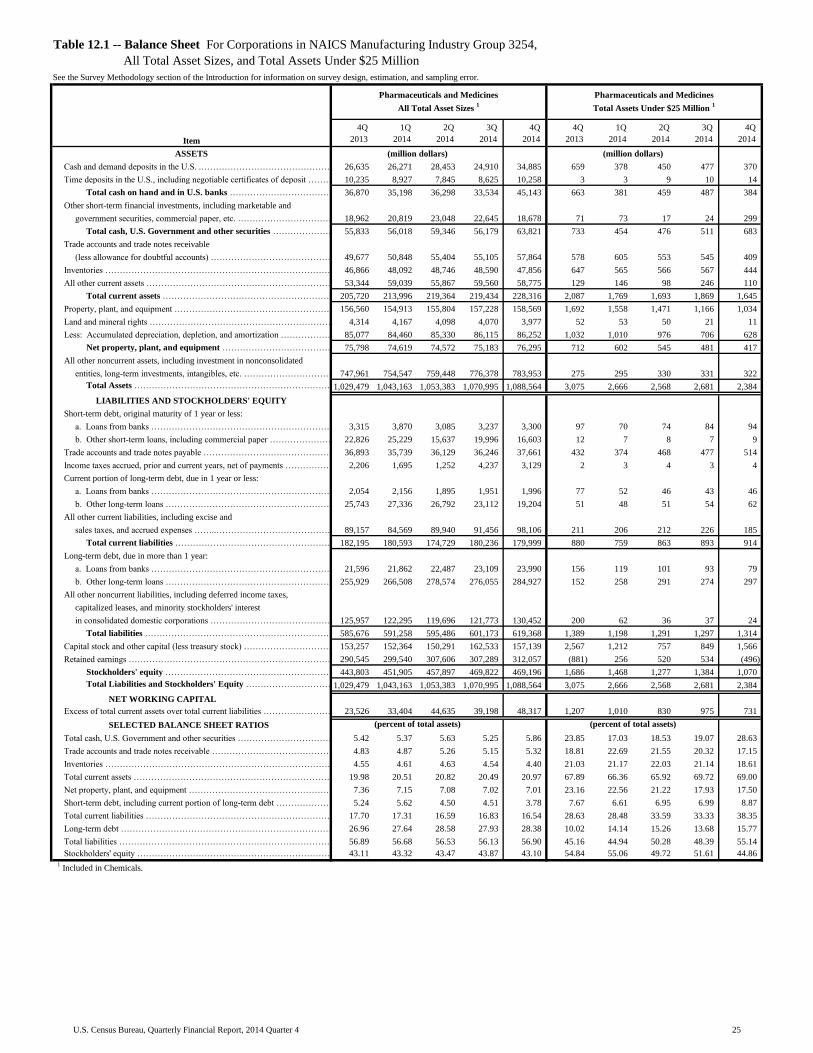
Table with row headers in column A with column headers in rows 5 and 6
Item
4Q_
2013_
1Q_
2014_
2Q_
2014_
3Q_
2014_
4Q_
2014_
4Q_
2013_
1Q_
2014_
2Q_
2014_
3Q_
2014_
4Q_
2014_
ASSETS
Cash and demand deposits in the U.S. .………………………………………………………………………………………………………………………………………………………………………………………………………………………………26,635 26,271 28,453 24,910 34,885 659 378 450 477 370
Time deposits in the U.S., including negotiable certificates of deposit ……………………………………………………………………………………………………………………………………………………………………………………10,235 8,927 7,845 8,625 10,258 3 3 9 10 14
Total cash on hand and in U.S. banks ……………………………………………………………………………………………………………………………………………………………………………………36,870 35,198 36,298 33,534 45,143 663 381 459 487 384
Other short-term financial investments, including marketable and
government securities, commercial paper, etc. ………………………………………………………………………………………………………………………………………………………………………………………………………………………………18,962 20,819 23,048 22,645 18,678 71 73 17 24 299
Total cash, U.S. Government and other securities ……………………………………………………………………………………………………………………………………………………………………………………55,833 56,018 59,346 56,179 63,821 733 454 476 511 683
Trade accounts and trade notes receivable
(less allowance for doubtful accounts) …………………………………………………………………………………………………………………………………………49,677 50,848 55,404 55,105 57,864 578 605 553 545 409
Inventories ………………………………………………………………………………………………………………………………………………………………………………………………………………………………46,866 48,092 48,746 48,590 47,856 647 565 566 567 444
All other current assets ………………………………………………………………………………………………………………………………………………………………………………………………………………………………53,344 59,039 55,867 59,560 58,775 129 146 98 246 110
Total current assets ………………………………………………………………………………………………………………………………………………………………………………………………………………………………205,720 213,996 219,364 219,434 228,316 2,087 1,769 1,693 1,869 1,645
Property, plant, and equipment ………………………………………………………………………………………………………………………………………………………………………………………………………………………………156,560 154,913 155,804 157,228 158,569 1,692 1,558 1,471 1,166 1,034
Land and mineral rights ………………………………………………………………………………………………………………………………………………………………………………………………………………………………4,314 4,167 4,098 4,070 3,977 52 53 50 21 11
Less: Accumulated depreciation, depletion, and amortization ……………………………………………………………………………………………………………………………………………………………………………………85,077 84,460 85,330 86,115 86,252 1,032 1,010 976 706 628
Net property, plant, and equipment ……………………………………………………………………………………………………………………………………………………………………………………75,798 74,619 74,572 75,183 76,295 712 602 545 481 417
All other noncurrent assets, including investment in nonconsolidated
entities, long-term investments, intangibles, etc. ………………………………………………………………………………………………………………………………………………………………………………………………………………747,961 754,547 759,448 776,378 783,953 275 295 330 331 322
Total Assets …………………………………………………………………………………………………………………………………………………………………………………………………………………………1,029,479 1,043,163 1,053,383 1,070,995 1,088,564 3,075 2,666 2,568 2,681 2,384
LIABILITIES AND STOCKHOLDERS' EQUITY
Short-term debt, original maturity of 1 year or less:
a. Loans from banks ………………………………………………………………………………………………………………………………………………………………………………………………………………………3,315 3,870 3,085 3,237 3,300 97 70 74 84 94
b. Other short-term loans, including commercial paper ………………………………………………………………………………………………………………………………………………………………………………………22,826 25,229 15,637 19,996 16,603 12 7 8 7 9
Trade accounts and trade notes payable ……………………………………………………………………………………………………………………………………………………………………………………………………………36,893 35,739 36,129 36,246 37,661 432 374 468 477 514
Income taxes accrued, prior and current years, net of payments ………………………………………………………………………………………………………………………………………………………………………………2,206 1,695 1,252 4,237 3,129 2 3 4 3 4
Current portion of long-term debt, due in 1 year or less:
a. Loans from banks …………………………………………………………………………………………………………………………………………………………………………………………………………………………………2,054 2,156 1,895 1,951 1,996 77 52 46 43 46
b. Other long-term loans ……………………………………………………………………………………………………………………………………………………………………………………………………………………25,743 27,336 26,792 23,112 19,204 51 48 51 54 62
All other current liabilities, including excise and
sales taxes, and accrued expenses ……..……………………………………………………………………………………………………………………………………………………89,157 84,569 89,940 91,456 98,106 211 206 212 226 185
Total current liabilities ……………………………………………………………………………………………………………………………………………………………………………………………………………………182,195 180,593 174,729 180,236 179,999 880 759 863 893 914
Long-term debt, due in more than 1 year:
a. Loans from banks …………………………………………………………………………………………………………………………………………………………………………………………………………………………21,596 21,862 22,487 23,109 23,990 156 119 101 93 79
b. Other long-term loans ……………………………………………………………………………………………………………………………………………………………………………………………………………………255,929 266,508 278,574 276,055 284,927 152 258 291 274 297
All other noncurrent liabilities, including deferred income taxes,
capitalized leases, and minority stockholders' interest
in consolidated domestic corporations ……………………………………………………………………………………………………………………………………………………………………125,957 122,295 119,696 121,773 130,452 200 62 36 37 24
Total liabilities ……………………………………………………………………………………………………………………………………………………………………………………………………………………………585,676 591,258 595,486 601,173 619,368 1,389 1,198 1,291 1,297 1,314
Capital stock and other capital (less treasury stock) …………………………………………………………………………………………………………………………………………………………………………………………153,257 152,364 150,291 162,533 157,139 2,567 1,212 757 849 1,566
Retained earnings …………………………………………………………………………………………………………………………………………………………………………………………………………………………………290,545 299,540 307,606 307,289 312,057 (881) 256 520 534 (496)
Stockholders' equity ……………………………………………………………………………………………………………………………………………………………………………………………………………………443,803 451,905 457,897 469,822 469,196 1,686 1,468 1,277 1,384 1,070
Total Liabilities and Stockholders' Equity ………………………………………………………………………………………………………………………………………………………………………………………………1,029,479 1,043,163 1,053,383 1,070,995 1,088,564 3,075 2,666 2,568 2,681 2,384
NET WORKING CAPITAL
Excess of total current assets over total current liabilities ………………………………………………………………………………………………………………………………………………………………………………………23,526 33,404 44,635 39,198 48,317 1,207 1,010 830 975 731
SELECTED BALANCE SHEET RATIOS
Total cash, U.S. Government and other securities …………………………………………………………………………………………………………………………………………………………………………………………………5.42 5.37 5.63 5.25 5.86 23.85 17.03 18.53 19.07 28.63
Trade accounts and trade notes receivable ……………………………………………………………………………………………………………………………………………………………………………………………………4.83 4.87 5.26 5.15 5.32 18.81 22.69 21.55 20.32 17.15
Inventories ……………………………………………………………………………………………………………………………………………………………………………………………………………………………………4.55 4.61 4.63 4.54 4.40 21.03 21.17 22.03 21.14 18.61
Total current assets …………………………………………………………………………………………………………………………………………………………………………………………………………………………19.98 20.51 20.82 20.49 20.97 67.89 66.36 65.92 69.72 69.00
Net property, plant, and equipment ……………………………………………………………………………………………………………………………………………………………………………………………………………7.36 7.15 7.08 7.02 7.01 23.16 22.56 21.22 17.93 17.50
Short-term debt, including current portion of long-term debt ………………………………………………………………………………………………………………………………………………………………………………………5.24 5.62 4.50 4.51 3.78 7.67 6.61 6.95 6.99 8.87
Total current liabilities …………………………………………………………………………………………………………………………………………………………………………………………………………………………………17.70 17.31 16.59 16.83 16.54 28.63 28.48 33.59 33.33 38.35
Long-term debt …………………………………………………………………………………………………………………………………………………………………………………………………………………………………26.96 27.64 28.58 27.93 28.38 10.02 14.14 15.26 13.68 15.77
Total liabilities …………………………………………………………………………………………………………………………………………………………………………………………………………………………………56.89 56.68 56.53 56.13 56.90 45.16 44.94 50.28 48.39 55.14
Stockholders' equity ………………………………………………………………………………………………………………………………………………………………………………………………………………………………43.11 43.32 43.47 43.87 43.10 54.84 55.06 49.72 51.61 44.86
1 Included in Chemicals.
Table 12.1 -- Balance Sheet For Corporations in NAICS Manufacturing Industry Group 3254,
All Total Asset Sizes, and Total Assets Under $25 Million
See the Survey Methodology section of the Introduction for information on survey design, estimation, and sampling error.
(million dollars)
(percent of total assets)
(million dollars)
(percent of total assets)
Pharmaceuticals and Medicines
All Total Asset Sizes 1
Pharmaceuticals and Medicines
Total Assets Under $25 Million 1
25U.S. Census Bureau, Quarterly Financial Report, 2014 Quarter 4
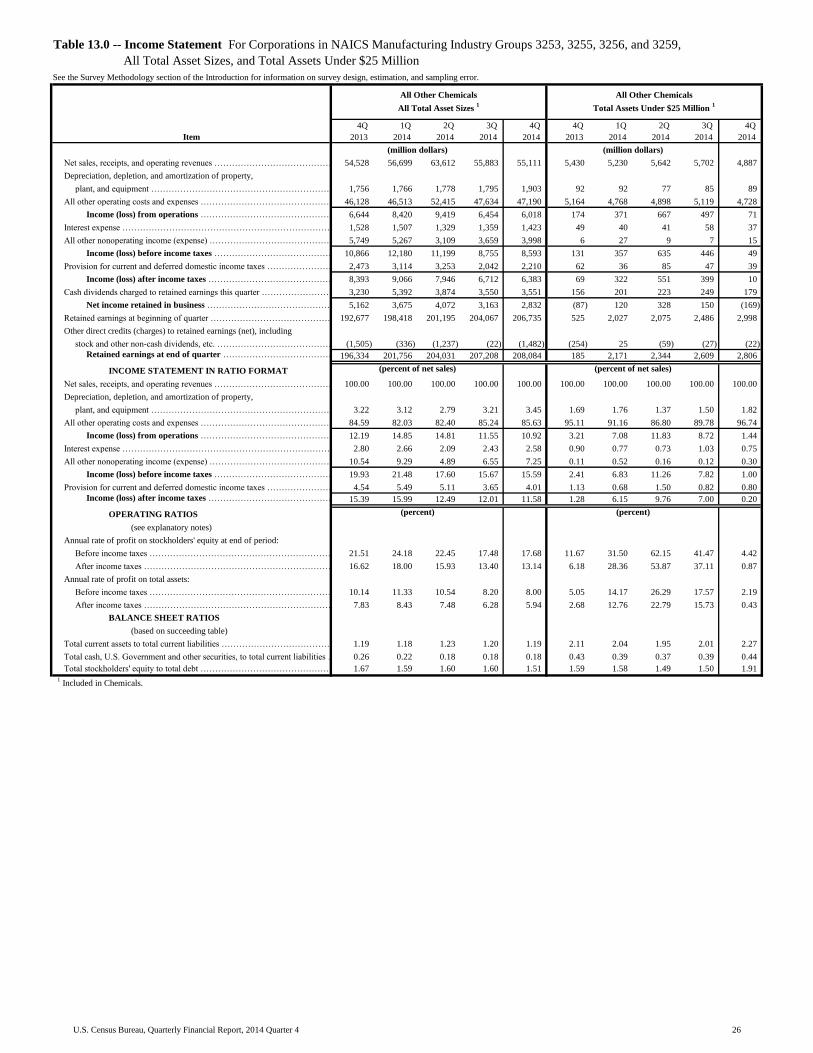
Table with row headers in column A with column headers in rows 5 and 6
Item
4Q_
2013_
1Q_
2014_
2Q_
2014_
3Q_
2014_
4Q_
2014_
4Q_
2013_
1Q_
2014_
2Q_
2014_
3Q_
2014_
4Q_
2014_
Net sales, receipts, and operating revenues ………………………………………………………………………………………………………………………………………………………………………54,528 56,699 63,612 55,883 55,111 5,430 5,230 5,642 5,702 4,887
Depreciation, depletion, and amortization of property,
plant, and equipment …………………………………………………………………………………………………………………………………………………………………………………………1,756 1,766 1,778 1,795 1,903 92 92 77 85 89
All other operating costs and expenses …………………………………………………………………………………………………………...……………………………………………………………46,128 46,513 52,415 47,634 47,190 5,164 4,768 4,898 5,119 4,728
Income (loss) from operations …………………………………………………………………………………………………………...……………………………………………………………6,644 8,420 9,419 6,454 6,018 174 371 667 497 71
Interest expense …………………………………………………………………………………………………………………………………………………………………………………………………………………………………………1,528 1,507 1,329 1,359 1,423 49 40 41 58 37
All other nonoperating income (expense) ……………………………………………………………………………………………………………………………………………………………………………………………………5,749 5,267 3,109 3,659 3,998 6 27 9 7 15
Income (loss) before income taxes ………………………………………………………………………………………………………………………………………………………………………………………………10,866 12,180 11,199 8,755 8,593 131 357 635 446 49
Provision for current and deferred domestic income taxes …………………………………………………………………………………………………………………………………………………………………………………………2,473 3,114 3,253 2,042 2,210 62 36 85 47 39
Income (loss) after income taxes …………………………………………………………………………………………………………………………………………………………………………………………………………8,393 9,066 7,946 6,712 6,383 69 322 551 399 10
Cash dividends charged to retained earnings this quarter ……………………………………………………………………………………………………………………………………………………………………………………3,230 5,392 3,874 3,550 3,551 156 201 223 249 179
Net income retained in business ……………………………………………………………………………………………………………………………………………………………………………………………………5,162 3,675 4,072 3,163 2,832 (87) 120 328 150 (169)
Retained earnings at beginning of quarter …………………………………………………………………………………………………………………………………………………………………………………………………………192,677 198,418 201,195 204,067 206,735 525 2,027 2,075 2,486 2,998
Other direct credits (charges) to retained earnings (net), including
stock and other non-cash dividends, etc. ……………………………………………………………………………………………………………………………………………………………………………………………………………………………(1,505) (336) (1,237) (22) (1,482) (254) 25 (59) (27) (22)
Retained earnings at end of quarter ……………………………………………………………………………………………………………………………………………………………………………………………………196,334 201,756 204,031 207,208 208,084 185 2,171 2,344 2,609 2,806
INCOME STATEMENT IN RATIO FORMAT
Net sales, receipts, and operating revenues ……………………………………………………………………………………………………………………………………………………………………………………………………100.00 100.00 100.00 100.00 100.00 100.00 100.00 100.00 100.00 100.00
Depreciation, depletion, and amortization of property,
plant, and equipment ………………………………………………………………………………………………………………………………………………………………………3.22 3.12 2.79 3.21 3.45 1.69 1.76 1.37 1.50 1.82
All other operating costs and expenses ……………………………………………………………………………………………………………………………………………………………………………………………………84.59 82.03 82.40 85.24 85.63 95.11 91.16 86.80 89.78 96.74
Income (loss) from operations …………………………………………………………………………………………………………………………………………………………………………………………………12.19 14.85 14.81 11.55 10.92 3.21 7.08 11.83 8.72 1.44
Interest expense …………………………………………………………………………………………………………………………………………………………………………………………………………………………………2.80 2.66 2.09 2.43 2.58 0.90 0.77 0.73 1.03 0.75
All other nonoperating income (expense) ……………………………………………………………………………………………………………………………………………………………………………………………10.54 9.29 4.89 6.55 7.25 0.11 0.52 0.16 0.12 0.30
Income (loss) before income taxes ……………………………………………………………………………………………………………………………………………………………………………………………19.93 21.48 17.60 15.67 15.59 2.41 6.83 11.26 7.82 1.00
Provision for current and deferred domestic income taxes ……………………………………………………………………………………………………………………………………………………………………………………4.54 5.49 5.11 3.65 4.01 1.13 0.68 1.50 0.82 0.80
Income (loss) after income taxes ………………………………………………………………………………………………………………………………………………………………………………………………15.39 15.99 12.49 12.01 11.58 1.28 6.15 9.76 7.00 0.20
OPERATING RATIOS
(see explanatory notes)
Annual rate of profit on stockholders' equity at end of period:
Before income taxes ……………………………………………………………………………………………………………………………………………………………………………………………………………………21.51 24.18 22.45 17.48 17.68 11.67 31.50 62.15 41.47 4.42
After income taxes ………………………………………………………………………………………………………………………………………………………………………………………………………………16.62 18.00 15.93 13.40 13.14 6.18 28.36 53.87 37.11 0.87
Annual rate of profit on total assets:
Before income taxes ………………………………………………………………………………………………………………………………………………………………………………………………………………10.14 11.33 10.54 8.20 8.00 5.05 14.17 26.29 17.57 2.19
After income taxes …………………………………………………………………………………………………………………………………………………………………………………………………………………………7.83 8.43 7.48 6.28 5.94 2.68 12.76 22.79 15.73 0.43
BALANCE SHEET RATIOS
(based on succeeding table)
Total current assets to total current liabilities …………………………………………………………………………………………………………………………………………………………………………………………………1.19 1.18 1.23 1.20 1.19 2.11 2.04 1.95 2.01 2.27
Total cash, U.S. Government and other securities, to total current liabilities …………………………………………………………………………………………………………………………………………………………………0.26 0.22 0.18 0.18 0.18 0.43 0.39 0.37 0.39 0.44
Total stockholders' equity to total debt ………………………………………………………………………………………………………………………………………………………………………………………………………1.67 1.59 1.60 1.60 1.51 1.59 1.58 1.49 1.50 1.91
Table 13.0 -- Income Statement For Corporations in NAICS Manufacturing Industry Groups 3253, 3255, 3256, and 3259,
All Total Asset Sizes, and Total Assets Under $25 Million
See the Survey Methodology section of the Introduction for information on survey design, estimation, and sampling error.
All Other Chemicals
All Total Asset Sizes 1
All Other Chemicals
Total Assets Under $25 Million 1
(million dollars) (million dollars)
(percent of net sales) (percent of net sales)
(percent) (percent)
1 Included in Chemicals.
26U.S. Census Bureau, Quarterly Financial Report, 2014 Quarter 4

Table with row headers in column A with column headers in rows 5 and 6
Item
4Q_
2013_
1Q_
2014_
2Q_
2014_
3Q_
2014_
4Q_
2014_
4Q_
2013_
1Q_
2014_
2Q_
2014_
3Q_
2014_
4Q_
2014_
ASSETS
Cash and demand deposits in the U.S. .………………………………………………………………………………………………………………………………………………………………………………………………………………………………12,078 6,833 6,665 6,729 8,129 1,262 1,166 1,088 1,129 891
Time deposits in the U.S., including negotiable certificates of deposit ……………………………………………………………………………………………………………………………………………………………………………………3,844 3,383 1,955 1,700 2,374 40 42 80 84 97
Total cash on hand and in U.S. banks ……………………………………………………………………………………………………………………………………………………………………………………15,923 10,217 8,620 8,429 10,502 1,302 1,208 1,168 1,213 988
Other short-term financial investments, including marketable and
government securities, commercial paper, etc. ………………………………………………………………………………………………………………………………………………………………………………………………………………………………4,751 7,588 4,806 4,775 3,524 163 140 136 159 224
Total cash, U.S. Government and other securities ……………………………………………………………………………………………………………………………………………………………………………………20,673 17,805 13,425 13,204 14,027 1,465 1,348 1,304 1,372 1,211
Trade accounts and trade notes receivable
(less allowance for doubtful accounts) …………………………………………………………………………………………………………………………………………23,836 25,859 30,082 28,236 27,461 2,613 2,617 2,687 2,726 2,158
Inventories ………………………………………………………………………………………………………………………………………………………………………………………………………………………………27,568 29,273 26,377 26,533 27,603 2,698 2,658 2,457 2,564 2,490
All other current assets ………………………………………………………………………………………………………………………………………………………………………………………………………………………………21,572 23,012 22,052 20,906 21,594 472 435 322 400 434
Total current assets ………………………………………………………………………………………………………………………………………………………………………………………………………………………………93,650 95,948 91,937 88,879 90,685 7,249 7,057 6,770 7,063 6,293
Property, plant, and equipment ………………………………………………………………………………………………………………………………………………………………………………………………………………………………106,316 106,170 107,888 109,925 113,615 6,555 6,003 5,524 5,808 5,524
Land and mineral rights ………………………………………………………………………………………………………………………………………………………………………………………………………………………………4,431 4,884 4,905 5,006 5,075 138 131 121 122 110
Less: Accumulated depreciation, depletion, and amortization ……………………………………………………………………………………………………………………………………………………………………………………59,438 58,477 59,340 60,454 60,857 4,337 3,956 3,637 3,818 3,649
Net property, plant, and equipment ……………………………………………………………………………………………………………………………………………………………………………………51,309 52,576 53,452 54,476 57,832 2,357 2,178 2,008 2,112 1,985
All other noncurrent assets, including investment in nonconsolidated
entities, long-term investments, intangibles, etc. ………………………………………………………………………………………………………………………………………………………………………………………………………………283,773 281,603 279,504 283,895 281,386 762 845 889 973 647
Total Assets …………………………………………………………………………………………………………………………………………………………………………………………………………………………428,731 430,127 424,893 427,250 429,903 10,368 10,079 9,666 10,148 8,925
LIABILITIES AND STOCKHOLDERS' EQUITY
Short-term debt, original maturity of 1 year or less:
a. Loans from banks ………………………………………………………………………………………………………………………………………………………………………………………………………………………2,108 1,908 1,991 1,922 2,134 592 656 631 661 571
b. Other short-term loans, including commercial paper ………………………………………………………………………………………………………………………………………………………………………………………7,467 11,662 6,500 6,026 5,507 141 150 173 77 39
Trade accounts and trade notes payable ……………………………………………………………………………………………………………………………………………………………………………………………………………24,282 25,808 24,850 23,385 24,758 1,741 1,746 1,847 1,723 1,238
Income taxes accrued, prior and current years, net of payments ………………………………………………………………………………………………………………………………………………………………………………372 760 1,482 1,247 399 33 12 37 39 36
Current portion of long-term debt, due in 1 year or less:
a. Loans from banks …………………………………………………………………………………………………………………………………………………………………………………………………………………………………871 1,602 1,599 1,575 2,510 200 223 170 155 109
b. Other long-term loans ……………………………………………………………………………………………………………………………………………………………………………………………………………………9,961 8,619 8,346 9,023 10,011 92 90 96 108 97
All other current liabilities, including excise and
sales taxes, and accrued expenses ……..……………………………………………………………………………………………………………………………………………………33,902 31,221 30,179 30,812 30,704 644 586 526 760 689
Total current liabilities ……………………………………………………………………………………………………………………………………………………………………………………………………………………78,964 81,580 74,949 73,990 76,024 3,443 3,463 3,480 3,522 2,778
Long-term debt, due in more than 1 year:
a. Loans from banks …………………………………………………………………………………………………………………………………………………………………………………………………………………………32,325 32,317 32,812 33,840 33,925 1,042 1,010 968 1,141 836
b. Other long-term loans ……………………………………………………………………………………………………………………………………………………………………………………………………………………68,404 70,723 73,737 73,106 75,059 765 734 707 722 660
All other noncurrent liabilities, including deferred income taxes,
capitalized leases, and minority stockholders' interest
in consolidated domestic corporations ……………………………………………………………………………………………………………………………………………………………………47,030 44,041 43,900 45,980 50,505 629 338 423 463 234
Total liabilities ……………………………………………………………………………………………………………………………………………………………………………………………………………………………226,722 228,661 225,397 226,916 235,513 5,878 5,544 5,577 5,848 4,508
Capital stock and other capital (less treasury stock) …………………………………………………………………………………………………………………………………………………………………………………………5,675 (290) (4,535) (6,874) (13,694) 4,305 2,364 1,745 1,691 1,611
Retained earnings …………………………………………………………………………………………………………………………………………………………………………………………………………………………………196,334 201,756 204,031 207,208 208,084 185 2,171 2,344 2,609 2,806
Stockholders' equity ……………………………………………………………………………………………………………………………………………………………………………………………………………………202,009 201,466 199,496 200,334 194,391 4,490 4,535 4,089 4,300 4,417
Total Liabilities and Stockholders' Equity ………………………………………………………………………………………………………………………………………………………………………………………………428,731 430,127 424,893 427,250 429,903 10,368 10,079 9,666 10,148 8,925
NET WORKING CAPITAL
Excess of total current assets over total current liabilities ………………………………………………………………………………………………………………………………………………………………………………………14,685 14,368 16,988 14,889 14,661 3,807 3,593 3,290 3,541 3,516
SELECTED BALANCE SHEET RATIOS
Total cash, U.S. Government and other securities …………………………………………………………………………………………………………………………………………………………………………………………………4.82 4.14 3.16 3.09 3.26 14.13 13.37 13.49 13.52 13.57
Trade accounts and trade notes receivable ……………………………………………………………………………………………………………………………………………………………………………………………………5.56 6.01 7.08 6.61 6.39 25.21 25.96 27.79 26.87 24.18
Inventories ……………………………………………………………………………………………………………………………………………………………………………………………………………………………………6.43 6.81 6.21 6.21 6.42 26.03 26.37 25.42 25.27 27.89
Total current assets …………………………………………………………………………………………………………………………………………………………………………………………………………………………21.84 22.31 21.64 20.80 21.09 69.92 70.01 70.03 69.60 70.51
Net property, plant, and equipment ……………………………………………………………………………………………………………………………………………………………………………………………………………11.97 12.22 12.58 12.75 13.45 22.73 21.61 20.77 20.81 22.24
Short-term debt, including current portion of long-term debt ………………………………………………………………………………………………………………………………………………………………………………………4.76 5.53 4.34 4.34 4.69 9.88 11.11 11.06 9.86 9.14
Total current liabilities …………………………………………………………………………………………………………………………………………………………………………………………………………………………………18.42 18.97 17.64 17.32 17.68 33.20 34.36 36.00 34.71 31.12
Long-term debt …………………………………………………………………………………………………………………………………………………………………………………………………………………………………23.49 23.96 25.08 25.03 25.35 17.43 17.30 17.33 18.36 16.76
Total liabilities …………………………………………………………………………………………………………………………………………………………………………………………………………………………………52.88 53.16 53.05 53.11 54.78 56.70 55.01 57.70 57.63 50.51
Stockholders' equity ………………………………………………………………………………………………………………………………………………………………………………………………………………………………47.12 46.84 46.95 46.89 45.22 43.30 44.99 42.30 42.37 49.49
1 Included in Chemicals.
Table 13.1 -- Balance Sheet For Corporations in NAICS Manufacturing Industry Groups 3253, 3255, 3256, and 3259,
All Total Asset Sizes, and Total Assets Under $25 Million
See the Survey Methodology section of the Introduction for information on survey design, estimation, and sampling error.
(million dollars)
(percent of total assets)
(million dollars)
(percent of total assets)
All Other Chemicals
All Total Asset Sizes 1
All Other Chemicals
Total Assets Under $25 Million 1
27U.S. Census Bureau, Quarterly Financial Report, 2014 Quarter 4
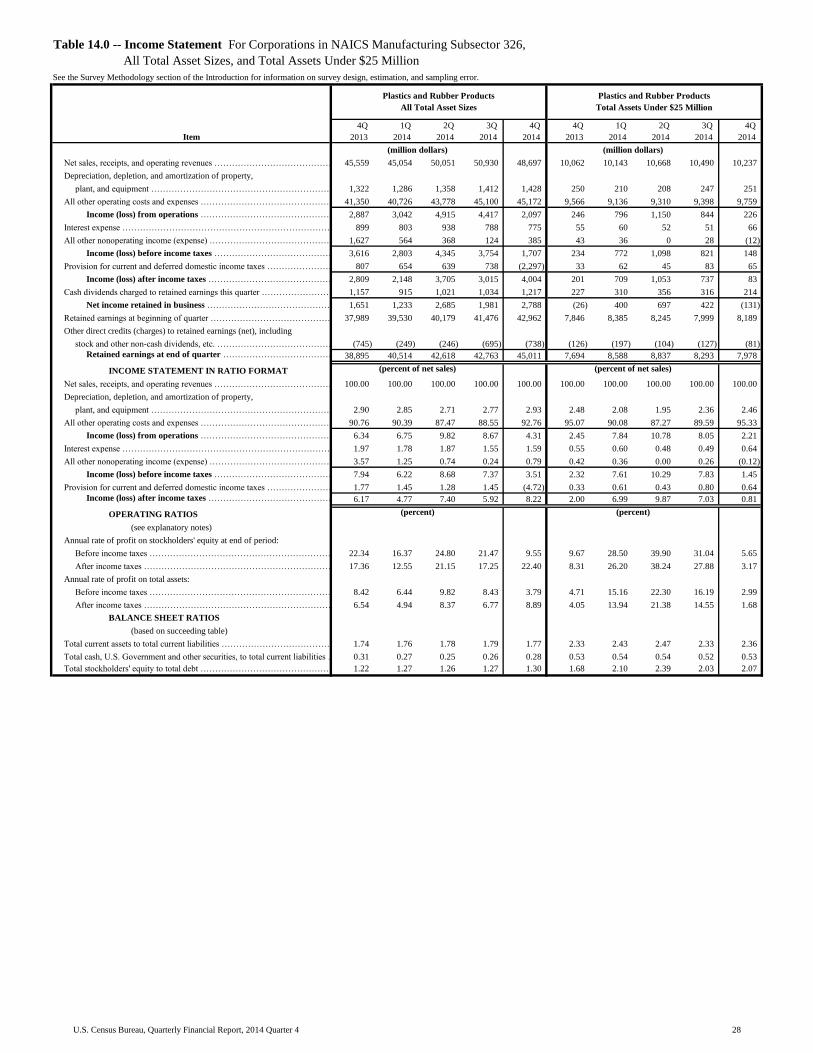
Table with row headers in column A with column headers in rows 5 and 6
Item
4Q_
2013_
1Q_
2014_
2Q_
2014_
3Q_
2014_
4Q_
2014_
4Q_
2013_
1Q_
2014_
2Q_
2014_
3Q_
2014_
4Q_
2014_
Net sales, receipts, and operating revenues ………………………………………………………………………………………………………………………………………………………………………45,559 45,054 50,051 50,930 48,697 10,062 10,143 10,668 10,490 10,237
Depreciation, depletion, and amortization of property,
plant, and equipment …………………………………………………………………………………………………………………………………………………………………………………………1,322 1,286 1,358 1,412 1,428 250 210 208 247 251
All other operating costs and expenses …………………………………………………………………………………………………………...……………………………………………………………41,350 40,726 43,778 45,100 45,172 9,566 9,136 9,310 9,398 9,759
Income (loss) from operations …………………………………………………………………………………………………………...……………………………………………………………2,887 3,042 4,915 4,417 2,097 246 796 1,150 844 226
Interest expense …………………………………………………………………………………………………………………………………………………………………………………………………………………………………………899 803 938 788 775 55 60 52 51 66
All other nonoperating income (expense) ……………………………………………………………………………………………………………………………………………………………………………………………………1,627 564 368 124 385 43 36 0 28 (12)
Income (loss) before income taxes ………………………………………………………………………………………………………………………………………………………………………………………………3,616 2,803 4,345 3,754 1,707 234 772 1,098 821 148
Provision for current and deferred domestic income taxes …………………………………………………………………………………………………………………………………………………………………………………………807 654 639 738 (2,297) 33 62 45 83 65
Income (loss) after income taxes …………………………………………………………………………………………………………………………………………………………………………………………………………2,809 2,148 3,705 3,015 4,004 201 709 1,053 737 83
Cash dividends charged to retained earnings this quarter ……………………………………………………………………………………………………………………………………………………………………………………1,157 915 1,021 1,034 1,217 227 310 356 316 214
Net income retained in business ……………………………………………………………………………………………………………………………………………………………………………………………………1,651 1,233 2,685 1,981 2,788 (26) 400 697 422 (131)
Retained earnings at beginning of quarter …………………………………………………………………………………………………………………………………………………………………………………………………………37,989 39,530 40,179 41,476 42,962 7,846 8,385 8,245 7,999 8,189
Other direct credits (charges) to retained earnings (net), including
stock and other non-cash dividends, etc. ……………………………………………………………………………………………………………………………………………………………………………………………………………………………(745) (249) (246) (695) (738) (126) (197) (104) (127) (81)
Retained earnings at end of quarter ……………………………………………………………………………………………………………………………………………………………………………………………………38,895 40,514 42,618 42,763 45,011 7,694 8,588 8,837 8,293 7,978
INCOME STATEMENT IN RATIO FORMAT
Net sales, receipts, and operating revenues ……………………………………………………………………………………………………………………………………………………………………………………………………100.00 100.00 100.00 100.00 100.00 100.00 100.00 100.00 100.00 100.00
Depreciation, depletion, and amortization of property,
plant, and equipment ………………………………………………………………………………………………………………………………………………………………………2.90 2.85 2.71 2.77 2.93 2.48 2.08 1.95 2.36 2.46
All other operating costs and expenses ……………………………………………………………………………………………………………………………………………………………………………………………………90.76 90.39 87.47 88.55 92.76 95.07 90.08 87.27 89.59 95.33
Income (loss) from operations …………………………………………………………………………………………………………………………………………………………………………………………………6.34 6.75 9.82 8.67 4.31 2.45 7.84 10.78 8.05 2.21
Interest expense …………………………………………………………………………………………………………………………………………………………………………………………………………………………………1.97 1.78 1.87 1.55 1.59 0.55 0.60 0.48 0.49 0.64
All other nonoperating income (expense) ……………………………………………………………………………………………………………………………………………………………………………………………3.57 1.25 0.74 0.24 0.79 0.42 0.36 0.00 0.26 (0.12)
Income (loss) before income taxes ……………………………………………………………………………………………………………………………………………………………………………………………7.94 6.22 8.68 7.37 3.51 2.32 7.61 10.29 7.83 1.45
Provision for current and deferred domestic income taxes ……………………………………………………………………………………………………………………………………………………………………………………1.77 1.45 1.28 1.45 (4.72) 0.33 0.61 0.43 0.80 0.64
Income (loss) after income taxes ………………………………………………………………………………………………………………………………………………………………………………………………6.17 4.77 7.40 5.92 8.22 2.00 6.99 9.87 7.03 0.81
OPERATING RATIOS
(see explanatory notes)
Annual rate of profit on stockholders' equity at end of period:
Before income taxes ……………………………………………………………………………………………………………………………………………………………………………………………………………………22.34 16.37 24.80 21.47 9.55 9.67 28.50 39.90 31.04 5.65
After income taxes ………………………………………………………………………………………………………………………………………………………………………………………………………………17.36 12.55 21.15 17.25 22.40 8.31 26.20 38.24 27.88 3.17
Annual rate of profit on total assets:
Before income taxes ………………………………………………………………………………………………………………………………………………………………………………………………………………8.42 6.44 9.82 8.43 3.79 4.71 15.16 22.30 16.19 2.99
After income taxes …………………………………………………………………………………………………………………………………………………………………………………………………………………………6.54 4.94 8.37 6.77 8.89 4.05 13.94 21.38 14.55 1.68
BALANCE SHEET RATIOS
(based on succeeding table)
Total current assets to total current liabilities …………………………………………………………………………………………………………………………………………………………………………………………………1.74 1.76 1.78 1.79 1.77 2.33 2.43 2.47 2.33 2.36
Total cash, U.S. Government and other securities, to total current liabilities …………………………………………………………………………………………………………………………………………………………………0.31 0.27 0.25 0.26 0.28 0.53 0.54 0.54 0.52 0.53
Total stockholders' equity to total debt ………………………………………………………………………………………………………………………………………………………………………………………………………1.22 1.27 1.26 1.27 1.30 1.68 2.10 2.39 2.03 2.07
(percent of net sales) (percent of net sales)
(percent) (percent)
Table 14.0 -- Income Statement For Corporations in NAICS Manufacturing Subsector 326,
All Total Asset Sizes, and Total Assets Under $25 Million
See the Survey Methodology section of the Introduction for information on survey design, estimation, and sampling error.
Plastics and Rubber Products
All Total Asset Sizes
Plastics and Rubber Products
Total Assets Under $25 Million
(million dollars) (million dollars)
28U.S. Census Bureau, Quarterly Financial Report, 2014 Quarter 4

Table with row headers in column A with column headers in rows 5 and 6
Item
4Q_
2013_
1Q_
2014_
2Q_
2014_
3Q_
2014_
4Q_
2014_
4Q_
2013_
1Q_
2014_
2Q_
2014_
3Q_
2014_
4Q_
2014_
ASSETS
Cash and demand deposits in the U.S. .………………………………………………………………………………………………………………………………………………………………………………………………………………………………8,055 6,867 6,491 7,140 7,532 2,617 2,592 2,522 2,560 2,432
Time deposits in the U.S., including negotiable certificates of deposit ……………………………………………………………………………………………………………………………………………………………………………………405 429 506 572 608 45 45 73 107 121
Total cash on hand and in U.S. banks ……………………………………………………………………………………………………………………………………………………………………………………8,460 7,296 6,997 7,713 8,139 2,662 2,637 2,594 2,667 2,553
Other short-term financial investments, including marketable and
government securities, commercial paper, etc. ………………………………………………………………………………………………………………………………………………………………………………………………………………………………2,676 2,265 2,170 1,837 1,996 357 432 359 404 451
Total cash, U.S. Government and other securities ……………………………………………………………………………………………………………………………………………………………………………………11,137 9,561 9,167 9,550 10,136 3,019 3,069 2,954 3,071 3,004
Trade accounts and trade notes receivable
(less allowance for doubtful accounts) …………………………………………………………………………………………………………………………………………20,902 22,193 24,183 24,721 22,994 4,575 4,958 5,068 5,104 4,849
Inventories ………………………………………………………………………………………………………………………………………………………………………………………………………………………………22,772 24,071 24,217 24,618 23,828 5,040 5,114 4,986 5,028 4,884
All other current assets ………………………………………………………………………………………………………………………………………………………………………………………………………………………………7,096 6,949 7,316 7,853 8,408 602 620 593 592 607
Total current assets ………………………………………………………………………………………………………………………………………………………………………………………………………………………………61,906 62,773 64,883 66,740 65,366 13,236 13,761 13,600 13,794 13,344
Property, plant, and equipment ………………………………………………………………………………………………………………………………………………………………………………………………………………………………97,343 97,650 98,956 101,048 103,558 18,788 18,656 18,042 18,640 18,756
Land and mineral rights ………………………………………………………………………………………………………………………………………………………………………………………………………………………………1,577 1,453 1,398 1,665 1,769 259 224 206 190 182
Less: Accumulated depreciation, depletion, and amortization ……………………………………………………………………………………………………………………………………………………………………………………62,034 62,154 62,352 63,995 65,858 13,394 13,349 13,156 13,495 13,663
Net property, plant, and equipment ……………………………………………………………………………………………………………………………………………………………………………………36,887 36,949 38,002 38,717 39,469 5,653 5,531 5,092 5,335 5,274
All other noncurrent assets, including investment in nonconsolidated
entities, long-term investments, intangibles, etc. ………………………………………………………………………………………………………………………………………………………………………………………………………………72,970 74,276 74,110 72,732 75,383 960 1,068 1,007 1,147 1,180
Total Assets …………………………………………………………………………………………………………………………………………………………………………………………………………………………171,763 173,998 176,995 178,189 180,218 19,849 20,359 19,699 20,277 19,798
LIABILITIES AND STOCKHOLDERS' EQUITY
Short-term debt, original maturity of 1 year or less:
a. Loans from banks ………………………………………………………………………………………………………………………………………………………………………………………………………………………2,750 3,205 3,415 3,539 3,596 922 941 852 873 926
b. Other short-term loans, including commercial paper ………………………………………………………………………………………………………………………………………………………………………………………524 760 870 684 691 143 233 319 265 181
Trade accounts and trade notes payable ……………………………………………………………………………………………………………………………………………………………………………………………………………16,545 16,382 16,863 17,318 16,900 2,829 2,838 2,688 3,116 2,823
Income taxes accrued, prior and current years, net of payments ………………………………………………………………………………………………………………………………………………………………………………158 379 492 536 196 88 64 71 60 96
Current portion of long-term debt, due in 1 year or less:
a. Loans from banks …………………………………………………………………………………………………………………………………………………………………………………………………………………………………1,910 2,183 2,500 1,250 1,662 448 393 374 451 414
b. Other long-term loans ……………………………………………………………………………………………………………………………………………………………………………………………………………………1,291 1,658 1,049 1,236 835 146 153 166 129 192
All other current liabilities, including excise and
sales taxes, and accrued expenses ……..……………………………………………………………………………………………………………………………………………………12,464 11,156 11,336 12,670 12,970 1,112 1,035 1,029 1,021 1,023
Total current liabilities ……………………………………………………………………………………………………………………………………………………………………………………………………………………35,643 35,724 36,525 37,233 36,850 5,688 5,659 5,498 5,914 5,653
Long-term debt, due in more than 1 year:
a. Loans from banks …………………………………………………………………………………………………………………………………………………………………………………………………………………………17,338 18,637 17,831 18,681 17,726 1,774 1,805 1,543 1,679 1,670
b. Other long-term loans ……………………………………………………………………………………………………………………………………………………………………………………………………………………29,178 27,664 29,778 29,496 30,653 2,315 1,638 1,351 1,828 1,669
All other noncurrent liabilities, including deferred income taxes,
capitalized leases, and minority stockholders' interest
in consolidated domestic corporations ……………………………………………………………………………………………………………………………………………………………………24,878 23,512 22,773 22,860 23,484 403 426 297 276 328
Total liabilities ……………………………………………………………………………………………………………………………………………………………………………………………………………………………107,036 105,537 106,907 108,270 108,714 10,180 9,528 8,688 9,697 9,320
Capital stock and other capital (less treasury stock) …………………………………………………………………………………………………………………………………………………………………………………………25,831 27,947 27,470 27,156 26,493 1,974 2,244 2,173 2,286 2,500
Retained earnings …………………………………………………………………………………………………………………………………………………………………………………………………………………………………38,895 40,514 42,618 42,763 45,011 7,694 8,588 8,837 8,293 7,978
Stockholders' equity ……………………………………………………………………………………………………………………………………………………………………………………………………………………64,727 68,461 70,088 69,919 71,504 9,668 10,831 11,010 10,580 10,478
Total Liabilities and Stockholders' Equity ………………………………………………………………………………………………………………………………………………………………………………………………171,763 173,998 176,995 178,189 180,218 19,849 20,359 19,699 20,277 19,798
NET WORKING CAPITAL
Excess of total current assets over total current liabilities ………………………………………………………………………………………………………………………………………………………………………………………26,264 27,049 28,357 29,508 28,516 7,547 8,102 8,102 7,881 7,691
SELECTED BALANCE SHEET RATIOS
Total cash, U.S. Government and other securities …………………………………………………………………………………………………………………………………………………………………………………………………6.48 5.49 5.18 5.36 5.62 15.21 15.07 14.99 15.15 15.17
Trade accounts and trade notes receivable ……………………………………………………………………………………………………………………………………………………………………………………………………12.17 12.75 13.66 13.87 12.76 23.05 24.35 25.73 25.17 24.49
Inventories ……………………………………………………………………………………………………………………………………………………………………………………………………………………………………13.26 13.83 13.68 13.82 13.22 25.39 25.12 25.31 24.80 24.67
Total current assets …………………………………………………………………………………………………………………………………………………………………………………………………………………………36.04 36.08 36.66 37.45 36.27 66.68 67.59 69.04 68.03 67.40
Net property, plant, and equipment ……………………………………………………………………………………………………………………………………………………………………………………………………………21.48 21.24 21.47 21.73 21.90 28.48 27.17 25.85 26.31 26.64
Short-term debt, including current portion of long-term debt ………………………………………………………………………………………………………………………………………………………………………………………3.77 4.49 4.43 3.76 3.76 8.36 8.45 8.68 8.47 8.65
Total current liabilities …………………………………………………………………………………………………………………………………………………………………………………………………………………………………20.75 20.53 20.64 20.90 20.45 28.66 27.80 27.91 29.17 28.55
Long-term debt …………………………………………………………………………………………………………………………………………………………………………………………………………………………………27.08 26.61 26.90 27.04 26.85 20.60 16.91 14.69 17.30 16.87
Total liabilities …………………………………………………………………………………………………………………………………………………………………………………………………………………………………62.32 60.65 60.40 60.76 60.32 51.29 46.80 44.11 47.82 47.07
Stockholders' equity ………………………………………………………………………………………………………………………………………………………………………………………………………………………………37.68 39.35 39.60 39.24 39.68 48.71 53.20 55.89 52.18 52.93
Table 14.1 -- Balance Sheet For Corporations in NAICS Manufacturing Subsector 326,
All Total Asset Sizes, and Total Assets Under $25 Million
See the Survey Methodology section of the Introduction for information on survey design, estimation, and sampling error.
(million dollars)
(percent of total assets)
(million dollars)
(percent of total assets)
Plastics and Rubber Products
All Total Asset Sizes
Plastics and Rubber Products
Total Assets Under $25 Million
29U.S. Census Bureau, Quarterly Financial Report, 2014 Quarter 4
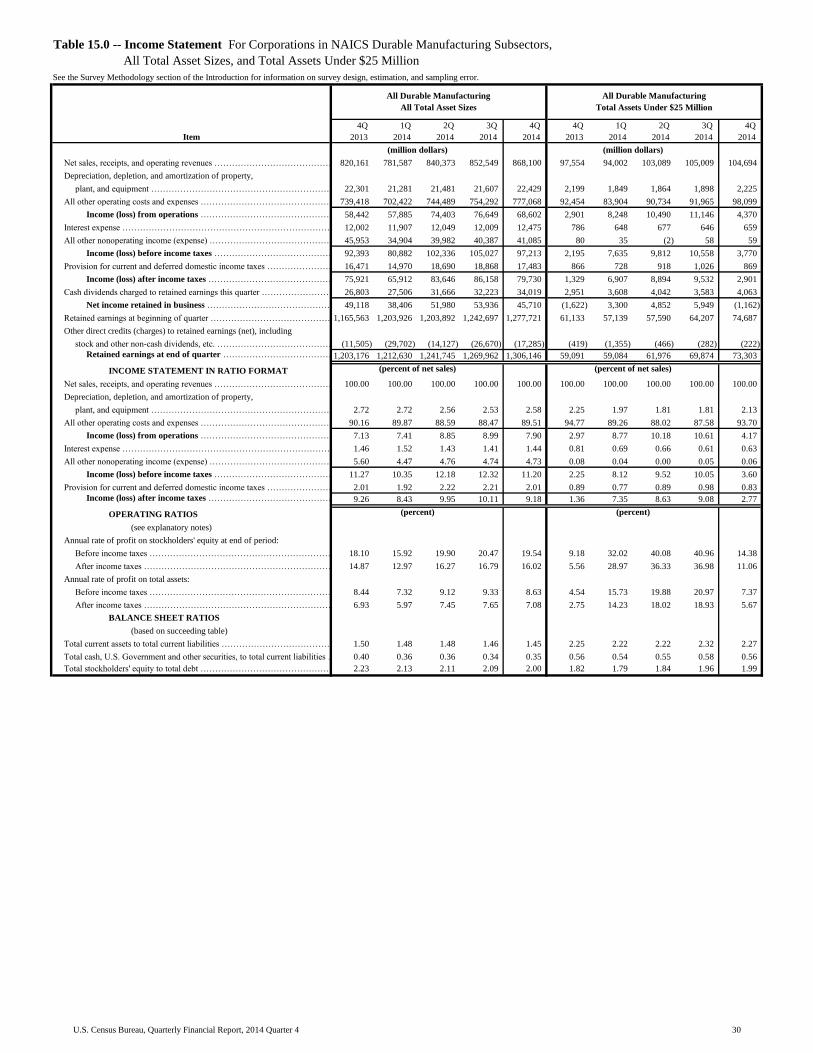
Table with row headers in column A with column headers in rows 5 and 6
Item
4Q_
2013_
1Q_
2014_
2Q_
2014_
3Q_
2014_
4Q_
2014_
4Q_
2013_
1Q_
2014_
2Q_
2014_
3Q_
2014_
4Q_
2014_
Net sales, receipts, and operating revenues ………………………………………………………………………………………………………………………………………………………………………820,161 781,587 840,373 852,549 868,100 97,554 94,002 103,089 105,009 104,694
Depreciation, depletion, and amortization of property,
plant, and equipment …………………………………………………………………………………………………………………………………………………………………………………………22,301 21,281 21,481 21,607 22,429 2,199 1,849 1,864 1,898 2,225
All other operating costs and expenses …………………………………………………………………………………………………………...……………………………………………………………739,418 702,422 744,489 754,292 777,068 92,454 83,904 90,734 91,965 98,099
Income (loss) from operations …………………………………………………………………………………………………………...……………………………………………………………58,442 57,885 74,403 76,649 68,602 2,901 8,248 10,490 11,146 4,370
Interest expense …………………………………………………………………………………………………………………………………………………………………………………………………………………………………………12,002 11,907 12,049 12,009 12,475 786 648 677 646 659
All other nonoperating income (expense) ……………………………………………………………………………………………………………………………………………………………………………………………………45,953 34,904 39,982 40,387 41,085 80 35 (2) 58 59
Income (loss) before income taxes ………………………………………………………………………………………………………………………………………………………………………………………………92,393 80,882 102,336 105,027 97,213 2,195 7,635 9,812 10,558 3,770
Provision for current and deferred domestic income taxes …………………………………………………………………………………………………………………………………………………………………………………………16,471 14,970 18,690 18,868 17,483 866 728 918 1,026 869
Income (loss) after income taxes …………………………………………………………………………………………………………………………………………………………………………………………………………75,921 65,912 83,646 86,158 79,730 1,329 6,907 8,894 9,532 2,901
Cash dividends charged to retained earnings this quarter ……………………………………………………………………………………………………………………………………………………………………………………26,803 27,506 31,666 32,223 34,019 2,951 3,608 4,042 3,583 4,063
Net income retained in business ……………………………………………………………………………………………………………………………………………………………………………………………………49,118 38,406 51,980 53,936 45,710 (1,622) 3,300 4,852 5,949 (1,162)
Retained earnings at beginning of quarter …………………………………………………………………………………………………………………………………………………………………………………………………………1,165,563 1,203,926 1,203,892 1,242,697 1,277,721 61,133 57,139 57,590 64,207 74,687
Other direct credits (charges) to retained earnings (net), including
stock and other non-cash dividends, etc. ……………………………………………………………………………………………………………………………………………………………………………………………………………………………(11,505) (29,702) (14,127) (26,670) (17,285) (419) (1,355) (466) (282) (222)
Retained earnings at end of quarter ……………………………………………………………………………………………………………………………………………………………………………………………………1,203,176 1,212,630 1,241,745 1,269,962 1,306,146 59,091 59,084 61,976 69,874 73,303
INCOME STATEMENT IN RATIO FORMAT
Net sales, receipts, and operating revenues ……………………………………………………………………………………………………………………………………………………………………………………………………100.00 100.00 100.00 100.00 100.00 100.00 100.00 100.00 100.00 100.00
Depreciation, depletion, and amortization of property,
plant, and equipment ………………………………………………………………………………………………………………………………………………………………………2.72 2.72 2.56 2.53 2.58 2.25 1.97 1.81 1.81 2.13
All other operating costs and expenses ……………………………………………………………………………………………………………………………………………………………………………………………………90.16 89.87 88.59 88.47 89.51 94.77 89.26 88.02 87.58 93.70
Income (loss) from operations …………………………………………………………………………………………………………………………………………………………………………………………………7.13 7.41 8.85 8.99 7.90 2.97 8.77 10.18 10.61 4.17
Interest expense …………………………………………………………………………………………………………………………………………………………………………………………………………………………………1.46 1.52 1.43 1.41 1.44 0.81 0.69 0.66 0.61 0.63
All other nonoperating income (expense) ……………………………………………………………………………………………………………………………………………………………………………………………5.60 4.47 4.76 4.74 4.73 0.08 0.04 0.00 0.05 0.06
Income (loss) before income taxes ……………………………………………………………………………………………………………………………………………………………………………………………11.27 10.35 12.18 12.32 11.20 2.25 8.12 9.52 10.05 3.60
Provision for current and deferred domestic income taxes ……………………………………………………………………………………………………………………………………………………………………………………2.01 1.92 2.22 2.21 2.01 0.89 0.77 0.89 0.98 0.83
Income (loss) after income taxes ………………………………………………………………………………………………………………………………………………………………………………………………9.26 8.43 9.95 10.11 9.18 1.36 7.35 8.63 9.08 2.77
OPERATING RATIOS
(see explanatory notes)
Annual rate of profit on stockholders' equity at end of period:
Before income taxes ……………………………………………………………………………………………………………………………………………………………………………………………………………………18.10 15.92 19.90 20.47 19.54 9.18 32.02 40.08 40.96 14.38
After income taxes ………………………………………………………………………………………………………………………………………………………………………………………………………………14.87 12.97 16.27 16.79 16.02 5.56 28.97 36.33 36.98 11.06
Annual rate of profit on total assets:
Before income taxes ………………………………………………………………………………………………………………………………………………………………………………………………………………8.44 7.32 9.12 9.33 8.63 4.54 15.73 19.88 20.97 7.37
After income taxes …………………………………………………………………………………………………………………………………………………………………………………………………………………………6.93 5.97 7.45 7.65 7.08 2.75 14.23 18.02 18.93 5.67
BALANCE SHEET RATIOS
(based on succeeding table)
Total current assets to total current liabilities …………………………………………………………………………………………………………………………………………………………………………………………………1.50 1.48 1.48 1.46 1.45 2.25 2.22 2.22 2.32 2.27
Total cash, U.S. Government and other securities, to total current liabilities …………………………………………………………………………………………………………………………………………………………………0.40 0.36 0.36 0.34 0.35 0.56 0.54 0.55 0.58 0.56
Total stockholders' equity to total debt ………………………………………………………………………………………………………………………………………………………………………………………………………2.23 2.13 2.11 2.09 2.00 1.82 1.79 1.84 1.96 1.99
(percent of net sales) (percent of net sales)
(percent) (percent)
Table 15.0 -- Income Statement For Corporations in NAICS Durable Manufacturing Subsectors,
All Total Asset Sizes, and Total Assets Under $25 Million
See the Survey Methodology section of the Introduction for information on survey design, estimation, and sampling error.
All Durable Manufacturing
All Total Asset Sizes
All Durable Manufacturing
Total Assets Under $25 Million
(million dollars) (million dollars)
30U.S. Census Bureau, Quarterly Financial Report, 2014 Quarter 4

Table with row headers in column A with column headers in rows 5 and 6
Item
4Q_
2013_
1Q_
2014_
2Q_
2014_
3Q_
2014_
4Q_
2014_
4Q_
2013_
1Q_
2014_
2Q_
2014_
3Q_
2014_
4Q_
2014_
ASSETS
Cash and demand deposits in the U.S. .………………………………………………………………………………………………………………………………………………………………………………………………………………………………198,558 186,171 189,697 191,489 204,618 28,939 28,145 29,398 30,988 30,880
Time deposits in the U.S., including negotiable certificates of deposit ……………………………………………………………………………………………………………………………………………………………………………………35,350 25,230 23,105 21,267 23,142 2,041 1,924 1,914 1,785 1,903
Total cash on hand and in U.S. banks ……………………………………………………………………………………………………………………………………………………………………………………233,908 211,402 212,802 212,757 227,760 30,979 30,069 31,313 32,773 32,783
Other short-term financial investments, including marketable and
government securities, commercial paper, etc. ………………………………………………………………………………………………………………………………………………………………………………………………………………………………138,665 130,653 132,423 118,061 114,955 2,873 2,991 3,446 3,167 3,118
Total cash, U.S. Government and other securities ……………………………………………………………………………………………………………………………………………………………………………………372,573 342,055 345,224 330,817 342,715 33,852 33,060 34,759 35,940 35,901
Trade accounts and trade notes receivable
(less allowance for doubtful accounts) …………………………………………………………………………………………………………………………………………362,302 381,100 394,590 401,946 386,048 44,471 45,741 47,758 49,455 48,470
Inventories ………………………………………………………………………………………………………………………………………………………………………………………………………………………………445,536 463,661 466,652 476,072 471,045 49,597 49,991 49,496 49,839 51,249
All other current assets ………………………………………………………………………………………………………………………………………………………………………………………………………………………………232,628 227,291 229,723 231,825 238,076 7,405 7,499 7,577 8,715 8,986
Total current assets ………………………………………………………………………………………………………………………………………………………………………………………………………………………………1,413,039 1,414,107 1,436,188 1,440,661 1,437,885 135,324 136,292 139,589 143,949 144,606
Property, plant, and equipment ………………………………………………………………………………………………………………………………………………………………………………………………………………………………1,336,736 1,342,509 1,358,185 1,372,354 1,397,769 155,291 154,140 156,681 158,074 162,559
Land and mineral rights ………………………………………………………………………………………………………………………………………………………………………………………………………………………………65,584 66,676 67,197 67,360 67,328 2,732 2,777 2,715 2,674 2,703
Less: Accumulated depreciation, depletion, and amortization ……………………………………………………………………………………………………………………………………………………………………………………792,874 796,916 807,843 817,793 839,659 113,532 113,165 114,896 116,452 119,146
Net property, plant, and equipment ……………………………………………………………………………………………………………………………………………………………………………………609,445 612,269 617,539 621,921 625,438 44,492 43,752 44,501 44,296 46,115
All other noncurrent assets, including investment in nonconsolidated
entities, long-term investments, intangibles, etc. ………………………………………………………………………………………………………………………………………………………………………………………………………………2,358,832 2,393,399 2,435,232 2,442,376 2,442,172 13,739 14,050 13,372 13,152 14,022
Total Assets …………………………………………………………………………………………………………………………………………………………………………………………………………………………4,381,317 4,419,774 4,488,959 4,504,958 4,505,495 193,556 194,094 197,461 201,396 204,743
LIABILITIES AND STOCKHOLDERS' EQUITY
Short-term debt, original maturity of 1 year or less:
a. Loans from banks ………………………………………………………………………………………………………………………………………………………………………………………………………………………31,135 37,159 36,086 35,597 34,675 9,240 9,013 8,642 8,241 8,771
b. Other short-term loans, including commercial paper ………………………………………………………………………………………………………………………………………………………………………………………37,198 42,503 40,747 43,779 44,439 3,298 3,763 3,833 3,607 3,325
Trade accounts and trade notes payable ……………………………………………………………………………………………………………………………………………………………………………………………………………282,023 291,475 299,643 305,836 301,653 23,900 24,498 24,975 24,986 24,761
Income taxes accrued, prior and current years, net of payments ………………………………………………………………………………………………………………………………………………………………………………13,915 15,741 14,475 14,421 12,336 690 682 632 766 750
Current portion of long-term debt, due in 1 year or less:
a. Loans from banks …………………………………………………………………………………………………………………………………………………………………………………………………………………………………21,017 20,531 19,532 20,188 19,242 4,851 5,116 5,342 5,555 5,802
b. Other long-term loans ……………………………………………………………………………………………………………………………………………………………………………………………………………………45,422 46,848 41,222 37,662 38,939 2,215 2,368 3,339 3,321 3,250
All other current liabilities, including excise and
sales taxes, and accrued expenses ……..……………………………………………………………………………………………………………………………………………………508,982 503,527 516,660 525,981 537,728 15,968 15,879 16,059 15,657 17,048
Total current liabilities ……………………………………………………………………………………………………………………………………………………………………………………………………………………939,690 957,785 968,365 983,464 989,012 60,161 61,320 62,821 62,133 63,708
Long-term debt, due in more than 1 year:
a. Loans from banks …………………………………………………………………………………………………………………………………………………………………………………………………………………………189,634 202,014 210,544 212,078 213,138 18,067 17,963 17,946 18,016 18,916
b. Other long-term loans ……………………………………………………………………………………………………………………………………………………………………………………………………………………591,217 603,535 627,548 634,543 643,475 14,930 15,133 14,253 13,954 12,559
All other noncurrent liabilities, including deferred income taxes,
capitalized leases, and minority stockholders' interest
in consolidated domestic corporations ……………………………………………………………………………………………………………………………………………………………………618,568 624,455 625,750 622,389 669,629 4,746 4,292 4,525 4,181 4,651
Total liabilities ……………………………………………………………………………………………………………………………………………………………………………………………………………………………2,339,109 2,387,789 2,432,207 2,452,474 2,515,254 97,905 98,708 99,545 98,284 99,834
Capital stock and other capital (less treasury stock) …………………………………………………………………………………………………………………………………………………………………………………………839,032 819,356 815,008 782,522 684,095 36,559 36,302 35,940 33,238 31,606
Retained earnings …………………………………………………………………………………………………………………………………………………………………………………………………………………………………1,203,176 1,212,630 1,241,745 1,269,962 1,306,146 59,091 59,084 61,976 69,874 73,303
Stockholders' equity ……………………………………………………………………………………………………………………………………………………………………………………………………………………2,042,208 2,031,986 2,056,753 2,052,484 1,990,241 95,650 95,386 97,915 103,112 104,909
Total Liabilities and Stockholders' Equity ………………………………………………………………………………………………………………………………………………………………………………………………4,381,317 4,419,774 4,488,959 4,504,958 4,505,495 193,556 194,094 197,461 201,396 204,743
NET WORKING CAPITAL
Excess of total current assets over total current liabilities ………………………………………………………………………………………………………………………………………………………………………………………473,349 456,322 467,824 457,197 448,872 75,163 74,972 76,767 81,816 80,898
SELECTED BALANCE SHEET RATIOS
Total cash, U.S. Government and other securities …………………………………………………………………………………………………………………………………………………………………………………………………8.50 7.74 7.69 7.34 7.61 17.49 17.03 17.60 17.85 17.53
Trade accounts and trade notes receivable ……………………………………………………………………………………………………………………………………………………………………………………………………8.27 8.62 8.79 8.92 8.57 22.98 23.57 24.19 24.56 23.67
Inventories ……………………………………………………………………………………………………………………………………………………………………………………………………………………………………10.17 10.49 10.40 10.57 10.45 25.62 25.76 25.07 24.75 25.03
Total current assets …………………………………………………………………………………………………………………………………………………………………………………………………………………………32.25 31.99 31.99 31.98 31.91 69.92 70.22 70.69 71.48 70.63
Net property, plant, and equipment ……………………………………………………………………………………………………………………………………………………………………………………………………………13.91 13.85 13.76 13.81 13.88 22.99 22.54 22.54 21.99 22.52
Short-term debt, including current portion of long-term debt ………………………………………………………………………………………………………………………………………………………………………………………3.08 3.33 3.07 3.05 3.05 10.13 10.44 10.71 10.29 10.33
Total current liabilities …………………………………………………………………………………………………………………………………………………………………………………………………………………………………21.45 21.67 21.57 21.83 21.95 31.08 31.59 31.81 30.85 31.12
Long-term debt …………………………………………………………………………………………………………………………………………………………………………………………………………………………………17.82 18.23 18.67 18.79 19.01 17.05 17.05 16.31 15.87 15.37
Total liabilities …………………………………………………………………………………………………………………………………………………………………………………………………………………………………53.39 54.03 54.18 54.44 55.83 50.58 50.86 50.41 48.80 48.76
Stockholders' equity ………………………………………………………………………………………………………………………………………………………………………………………………………………………………46.61 45.97 45.82 45.56 44.17 49.42 49.14 49.59 51.20 51.24
Table 15.1 -- Balance Sheet For Corporations in NAICS Durable Manufacturing Subsectors,
All Total Asset Sizes, and Total Assets Under $25 Million
See the Survey Methodology section of the Introduction for information on survey design, estimation, and sampling error.
(million dollars)
(percent of total assets)
(million dollars)
(percent of total assets)
All Durable Manufacturing
All Total Asset Sizes
All Durable Manufacturing
Total Assets Under $25 Million
31U.S. Census Bureau, Quarterly Financial Report, 2014 Quarter 4
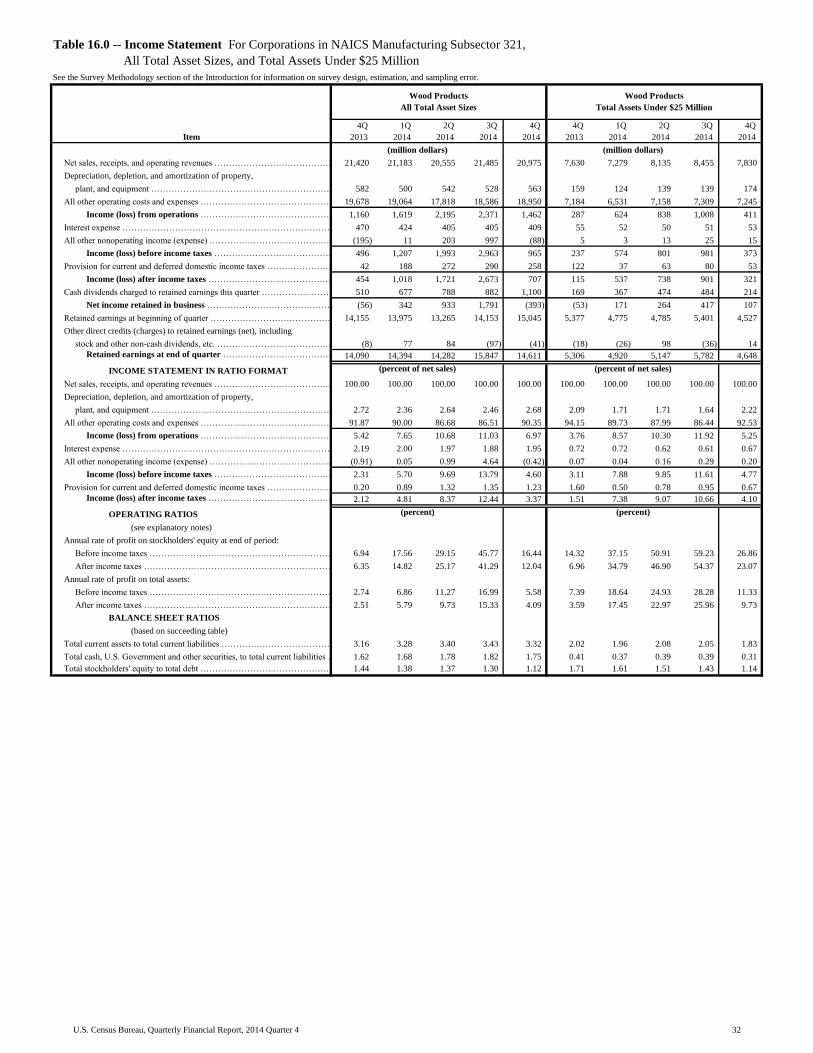
Table with row headers in column A with column headers in rows 5 and 6
Item
4Q_
2013_
1Q_
2014_
2Q_
2014_
3Q_
2014_
4Q_
2014_
4Q_
2013_
1Q_
2014_
2Q_
2014_
3Q_
2014_
4Q_
2014_
Net sales, receipts, and operating revenues ………………………………………………………………………………………………………………………………………………………………………21,420 21,183 20,555 21,485 20,975 7,630 7,279 8,135 8,455 7,830
Depreciation, depletion, and amortization of property,
plant, and equipment …………………………………………………………………………………………………………………………………………………………………………………………582 500 542 528 563 159 124 139 139 174
All other operating costs and expenses …………………………………………………………………………………………………………...……………………………………………………………19,678 19,064 17,818 18,586 18,950 7,184 6,531 7,158 7,309 7,245
Income (loss) from operations …………………………………………………………………………………………………………...……………………………………………………………1,160 1,619 2,195 2,371 1,462 287 624 838 1,008 411
Interest expense …………………………………………………………………………………………………………………………………………………………………………………………………………………………………………470 424 405 405 409 55 52 50 51 53
All other nonoperating income (expense) ……………………………………………………………………………………………………………………………………………………………………………………………………(195) 11 203 997 (88) 5 3 13 25 15
Income (loss) before income taxes ………………………………………………………………………………………………………………………………………………………………………………………………496 1,207 1,993 2,963 965 237 574 801 981 373
Provision for current and deferred domestic income taxes …………………………………………………………………………………………………………………………………………………………………………………………42 188 272 290 258 122 37 63 80 53
Income (loss) after income taxes …………………………………………………………………………………………………………………………………………………………………………………………………………454 1,018 1,721 2,673 707 115 537 738 901 321
Cash dividends charged to retained earnings this quarter ……………………………………………………………………………………………………………………………………………………………………………………510 677 788 882 1,100 169 367 474 484 214
Net income retained in business ……………………………………………………………………………………………………………………………………………………………………………………………………(56) 342 933 1,791 (393) (53) 171 264 417 107
Retained earnings at beginning of quarter …………………………………………………………………………………………………………………………………………………………………………………………………………14,155 13,975 13,265 14,153 15,045 5,377 4,775 4,785 5,401 4,527
Other direct credits (charges) to retained earnings (net), including
stock and other non-cash dividends, etc. ……………………………………………………………………………………………………………………………………………………………………………………………………………………………(8) 77 84 (97) (41) (18) (26) 98 (36) 14
Retained earnings at end of quarter ……………………………………………………………………………………………………………………………………………………………………………………………………14,090 14,394 14,282 15,847 14,611 5,306 4,920 5,147 5,782 4,648
INCOME STATEMENT IN RATIO FORMAT
Net sales, receipts, and operating revenues ……………………………………………………………………………………………………………………………………………………………………………………………………100.00 100.00 100.00 100.00 100.00 100.00 100.00 100.00 100.00 100.00
Depreciation, depletion, and amortization of property,
plant, and equipment ………………………………………………………………………………………………………………………………………………………………………2.72 2.36 2.64 2.46 2.68 2.09 1.71 1.71 1.64 2.22
All other operating costs and expenses ……………………………………………………………………………………………………………………………………………………………………………………………………91.87 90.00 86.68 86.51 90.35 94.15 89.73 87.99 86.44 92.53
Income (loss) from operations …………………………………………………………………………………………………………………………………………………………………………………………………5.42 7.65 10.68 11.03 6.97 3.76 8.57 10.30 11.92 5.25
Interest expense …………………………………………………………………………………………………………………………………………………………………………………………………………………………………2.19 2.00 1.97 1.88 1.95 0.72 0.72 0.62 0.61 0.67
All other nonoperating income (expense) ……………………………………………………………………………………………………………………………………………………………………………………………(0.91) 0.05 0.99 4.64 (0.42) 0.07 0.04 0.16 0.29 0.20
Income (loss) before income taxes ……………………………………………………………………………………………………………………………………………………………………………………………2.31 5.70 9.69 13.79 4.60 3.11 7.88 9.85 11.61 4.77
Provision for current and deferred domestic income taxes ……………………………………………………………………………………………………………………………………………………………………………………0.20 0.89 1.32 1.35 1.23 1.60 0.50 0.78 0.95 0.67
Income (loss) after income taxes ………………………………………………………………………………………………………………………………………………………………………………………………2.12 4.81 8.37 12.44 3.37 1.51 7.38 9.07 10.66 4.10
OPERATING RATIOS
(see explanatory notes)
Annual rate of profit on stockholders' equity at end of period:
Before income taxes ……………………………………………………………………………………………………………………………………………………………………………………………………………………6.94 17.56 29.15 45.77 16.44 14.32 37.15 50.91 59.23 26.86
After income taxes ………………………………………………………………………………………………………………………………………………………………………………………………………………6.35 14.82 25.17 41.29 12.04 6.96 34.79 46.90 54.37 23.07
Annual rate of profit on total assets:
Before income taxes ………………………………………………………………………………………………………………………………………………………………………………………………………………2.74 6.86 11.27 16.99 5.58 7.39 18.64 24.93 28.28 11.33
After income taxes …………………………………………………………………………………………………………………………………………………………………………………………………………………………2.51 5.79 9.73 15.33 4.09 3.59 17.45 22.97 25.96 9.73
BALANCE SHEET RATIOS
(based on succeeding table)
Total current assets to total current liabilities …………………………………………………………………………………………………………………………………………………………………………………………………3.16 3.28 3.40 3.43 3.32 2.02 1.96 2.08 2.05 1.83
Total cash, U.S. Government and other securities, to total current liabilities …………………………………………………………………………………………………………………………………………………………………1.62 1.68 1.78 1.82 1.75 0.41 0.37 0.39 0.39 0.31
Total stockholders' equity to total debt ………………………………………………………………………………………………………………………………………………………………………………………………………1.44 1.38 1.37 1.30 1.12 1.71 1.61 1.51 1.43 1.14
(percent of net sales) (percent of net sales)
(percent) (percent)
Table 16.0 -- Income Statement For Corporations in NAICS Manufacturing Subsector 321,
All Total Asset Sizes, and Total Assets Under $25 Million
See the Survey Methodology section of the Introduction for information on survey design, estimation, and sampling error.
Wood Products
All Total Asset Sizes
Wood Products
Total Assets Under $25 Million
(million dollars) (million dollars)
32U.S. Census Bureau, Quarterly Financial Report, 2014 Quarter 4
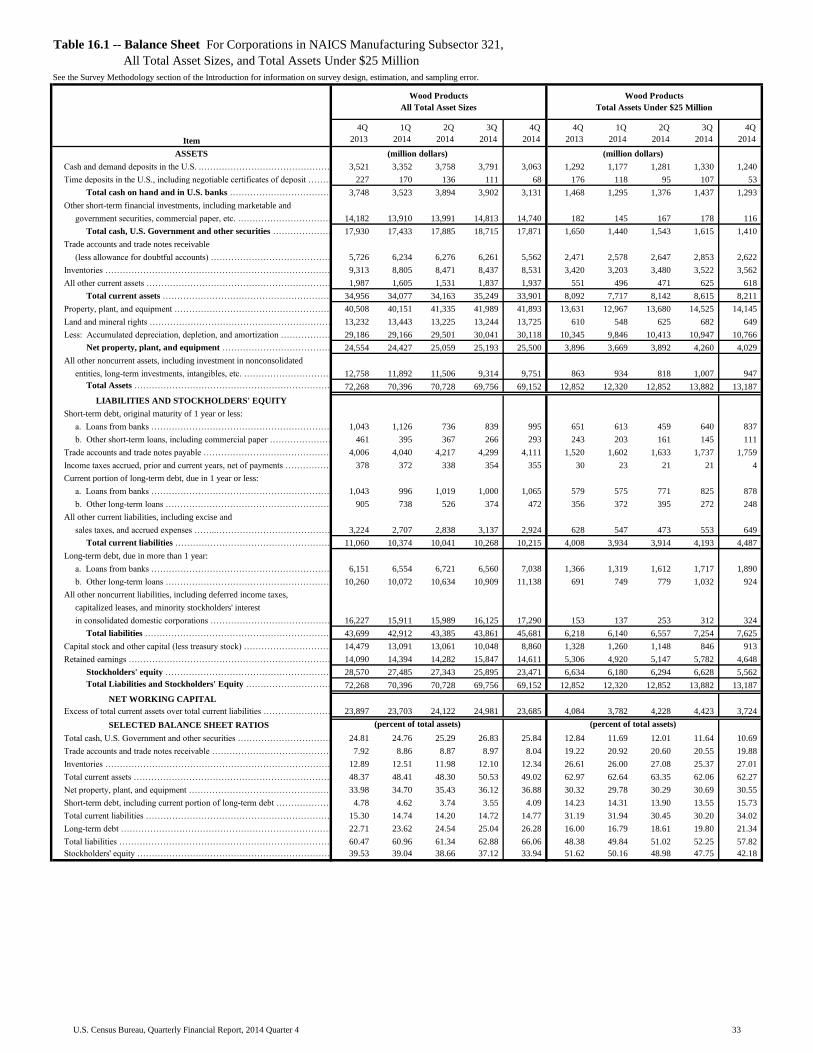
Table with row headers in column A with column headers in rows 5 and 6
Item
4Q_
2013_
1Q_
2014_
2Q_
2014_
3Q_
2014_
4Q_
2014_
4Q_
2013_
1Q_
2014_
2Q_
2014_
3Q_
2014_
4Q_
2014_
ASSETS
Cash and demand deposits in the U.S. .………………………………………………………………………………………………………………………………………………………………………………………………………………………………3,521 3,352 3,758 3,791 3,063 1,292 1,177 1,281 1,330 1,240
Time deposits in the U.S., including negotiable certificates of deposit ……………………………………………………………………………………………………………………………………………………………………………………227 170 136 111 68 176 118 95 107 53
Total cash on hand and in U.S. banks ……………………………………………………………………………………………………………………………………………………………………………………3,748 3,523 3,894 3,902 3,131 1,468 1,295 1,376 1,437 1,293
Other short-term financial investments, including marketable and
government securities, commercial paper, etc. ………………………………………………………………………………………………………………………………………………………………………………………………………………………………14,182 13,910 13,991 14,813 14,740 182 145 167 178 116
Total cash, U.S. Government and other securities ……………………………………………………………………………………………………………………………………………………………………………………17,930 17,433 17,885 18,715 17,871 1,650 1,440 1,543 1,615 1,410
Trade accounts and trade notes receivable
(less allowance for doubtful accounts) …………………………………………………………………………………………………………………………………………5,726 6,234 6,276 6,261 5,562 2,471 2,578 2,647 2,853 2,622
Inventories ………………………………………………………………………………………………………………………………………………………………………………………………………………………………9,313 8,805 8,471 8,437 8,531 3,420 3,203 3,480 3,522 3,562
All other current assets ………………………………………………………………………………………………………………………………………………………………………………………………………………………………1,987 1,605 1,531 1,837 1,937 551 496 471 625 618
Total current assets ………………………………………………………………………………………………………………………………………………………………………………………………………………………………34,956 34,077 34,163 35,249 33,901 8,092 7,717 8,142 8,615 8,211
Property, plant, and equipment ………………………………………………………………………………………………………………………………………………………………………………………………………………………………40,508 40,151 41,335 41,989 41,893 13,631 12,967 13,680 14,525 14,145
Land and mineral rights ………………………………………………………………………………………………………………………………………………………………………………………………………………………………13,232 13,443 13,225 13,244 13,725 610 548 625 682 649
Less: Accumulated depreciation, depletion, and amortization ……………………………………………………………………………………………………………………………………………………………………………………29,186 29,166 29,501 30,041 30,118 10,345 9,846 10,413 10,947 10,766
Net property, plant, and equipment ……………………………………………………………………………………………………………………………………………………………………………………24,554 24,427 25,059 25,193 25,500 3,896 3,669 3,892 4,260 4,029
All other noncurrent assets, including investment in nonconsolidated
entities, long-term investments, intangibles, etc. ………………………………………………………………………………………………………………………………………………………………………………………………………………12,758 11,892 11,506 9,314 9,751 863 934 818 1,007 947
Total Assets …………………………………………………………………………………………………………………………………………………………………………………………………………………………72,268 70,396 70,728 69,756 69,152 12,852 12,320 12,852 13,882 13,187
LIABILITIES AND STOCKHOLDERS' EQUITY
Short-term debt, original maturity of 1 year or less:
a. Loans from banks ………………………………………………………………………………………………………………………………………………………………………………………………………………………1,043 1,126 736 839 995 651 613 459 640 837
b. Other short-term loans, including commercial paper ………………………………………………………………………………………………………………………………………………………………………………………461 395 367 266 293 243 203 161 145 111
Trade accounts and trade notes payable ……………………………………………………………………………………………………………………………………………………………………………………………………………4,006 4,040 4,217 4,299 4,111 1,520 1,602 1,633 1,737 1,759
Income taxes accrued, prior and current years, net of payments ………………………………………………………………………………………………………………………………………………………………………………378 372 338 354 355 30 23 21 21 4
Current portion of long-term debt, due in 1 year or less:
a. Loans from banks …………………………………………………………………………………………………………………………………………………………………………………………………………………………………1,043 996 1,019 1,000 1,065 579 575 771 825 878
b. Other long-term loans ……………………………………………………………………………………………………………………………………………………………………………………………………………………905 738 526 374 472 356 372 395 272 248
All other current liabilities, including excise and
sales taxes, and accrued expenses ……..……………………………………………………………………………………………………………………………………………………3,224 2,707 2,838 3,137 2,924 628 547 473 553 649
Total current liabilities ……………………………………………………………………………………………………………………………………………………………………………………………………………………11,060 10,374 10,041 10,268 10,215 4,008 3,934 3,914 4,193 4,487
Long-term debt, due in more than 1 year:
a. Loans from banks …………………………………………………………………………………………………………………………………………………………………………………………………………………………6,151 6,554 6,721 6,560 7,038 1,366 1,319 1,612 1,717 1,890
b. Other long-term loans ……………………………………………………………………………………………………………………………………………………………………………………………………………………10,260 10,072 10,634 10,909 11,138 691 749 779 1,032 924
All other noncurrent liabilities, including deferred income taxes,
capitalized leases, and minority stockholders' interest
in consolidated domestic corporations ……………………………………………………………………………………………………………………………………………………………………16,227 15,911 15,989 16,125 17,290 153 137 253 312 324
Total liabilities ……………………………………………………………………………………………………………………………………………………………………………………………………………………………43,699 42,912 43,385 43,861 45,681 6,218 6,140 6,557 7,254 7,625
Capital stock and other capital (less treasury stock) …………………………………………………………………………………………………………………………………………………………………………………………14,479 13,091 13,061 10,048 8,860 1,328 1,260 1,148 846 913
Retained earnings …………………………………………………………………………………………………………………………………………………………………………………………………………………………………14,090 14,394 14,282 15,847 14,611 5,306 4,920 5,147 5,782 4,648
Stockholders' equity ……………………………………………………………………………………………………………………………………………………………………………………………………………………28,570 27,485 27,343 25,895 23,471 6,634 6,180 6,294 6,628 5,562
Total Liabilities and Stockholders' Equity ………………………………………………………………………………………………………………………………………………………………………………………………72,268 70,396 70,728 69,756 69,152 12,852 12,320 12,852 13,882 13,187
NET WORKING CAPITAL
Excess of total current assets over total current liabilities ………………………………………………………………………………………………………………………………………………………………………………………23,897 23,703 24,122 24,981 23,685 4,084 3,782 4,228 4,423 3,724
SELECTED BALANCE SHEET RATIOS
Total cash, U.S. Government and other securities …………………………………………………………………………………………………………………………………………………………………………………………………24.81 24.76 25.29 26.83 25.84 12.84 11.69 12.01 11.64 10.69
Trade accounts and trade notes receivable ……………………………………………………………………………………………………………………………………………………………………………………………………7.92 8.86 8.87 8.97 8.04 19.22 20.92 20.60 20.55 19.88
Inventories ……………………………………………………………………………………………………………………………………………………………………………………………………………………………………12.89 12.51 11.98 12.10 12.34 26.61 26.00 27.08 25.37 27.01
Total current assets …………………………………………………………………………………………………………………………………………………………………………………………………………………………48.37 48.41 48.30 50.53 49.02 62.97 62.64 63.35 62.06 62.27
Net property, plant, and equipment ……………………………………………………………………………………………………………………………………………………………………………………………………………33.98 34.70 35.43 36.12 36.88 30.32 29.78 30.29 30.69 30.55
Short-term debt, including current portion of long-term debt ………………………………………………………………………………………………………………………………………………………………………………………4.78 4.62 3.74 3.55 4.09 14.23 14.31 13.90 13.55 15.73
Total current liabilities …………………………………………………………………………………………………………………………………………………………………………………………………………………………………15.30 14.74 14.20 14.72 14.77 31.19 31.94 30.45 30.20 34.02
Long-term debt …………………………………………………………………………………………………………………………………………………………………………………………………………………………………22.71 23.62 24.54 25.04 26.28 16.00 16.79 18.61 19.80 21.34
Total liabilities …………………………………………………………………………………………………………………………………………………………………………………………………………………………………60.47 60.96 61.34 62.88 66.06 48.38 49.84 51.02 52.25 57.82
Stockholders' equity ………………………………………………………………………………………………………………………………………………………………………………………………………………………………39.53 39.04 38.66 37.12 33.94 51.62 50.16 48.98 47.75 42.18
Table 16.1 -- Balance Sheet For Corporations in NAICS Manufacturing Subsector 321,
All Total Asset Sizes, and Total Assets Under $25 Million
See the Survey Methodology section of the Introduction for information on survey design, estimation, and sampling error.
(million dollars)
(percent of total assets)
(million dollars)
(percent of total assets)
Wood Products
All Total Asset Sizes
Wood Products
Total Assets Under $25 Million
33U.S. Census Bureau, Quarterly Financial Report, 2014 Quarter 4
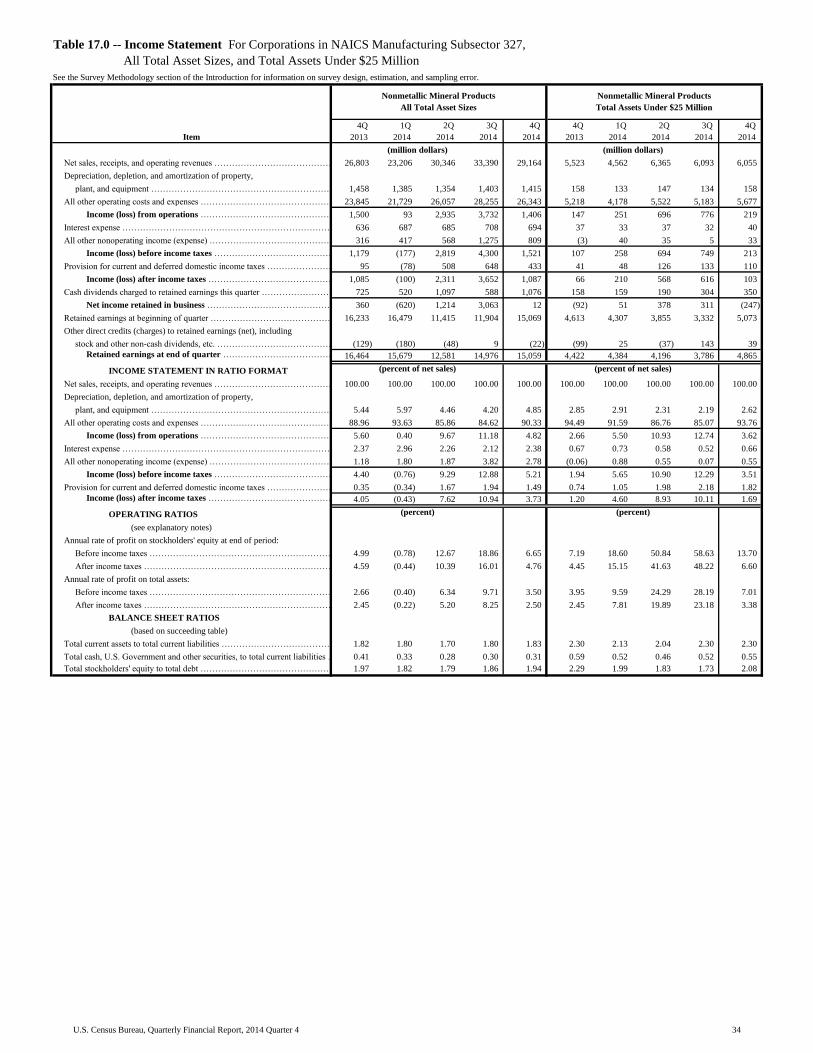
Table with row headers in column A with column headers in rows 5 and 6
Item
4Q_
2013_
1Q_
2014_
2Q_
2014_
3Q_
2014_
4Q_
2014_
4Q_
2013_
1Q_
2014_
2Q_
2014_
3Q_
2014_
4Q_
2014_
Net sales, receipts, and operating revenues ………………………………………………………………………………………………………………………………………………………………………26,803 23,206 30,346 33,390 29,164 5,523 4,562 6,365 6,093 6,055
Depreciation, depletion, and amortization of property,
plant, and equipment …………………………………………………………………………………………………………………………………………………………………………………………1,458 1,385 1,354 1,403 1,415 158 133 147 134 158
All other operating costs and expenses …………………………………………………………………………………………………………...……………………………………………………………23,845 21,729 26,057 28,255 26,343 5,218 4,178 5,522 5,183 5,677
Income (loss) from operations …………………………………………………………………………………………………………...……………………………………………………………1,500 93 2,935 3,732 1,406 147 251 696 776 219
Interest expense …………………………………………………………………………………………………………………………………………………………………………………………………………………………………………636 687 685 708 694 37 33 37 32 40
All other nonoperating income (expense) ……………………………………………………………………………………………………………………………………………………………………………………………………316 417 568 1,275 809 (3) 40 35 5 33
Income (loss) before income taxes ………………………………………………………………………………………………………………………………………………………………………………………………1,179 (177) 2,819 4,300 1,521 107 258 694 749 213
Provision for current and deferred domestic income taxes …………………………………………………………………………………………………………………………………………………………………………………………95 (78) 508 648 433 41 48 126 133 110
Income (loss) after income taxes …………………………………………………………………………………………………………………………………………………………………………………………………………1,085 (100) 2,311 3,652 1,087 66 210 568 616 103
Cash dividends charged to retained earnings this quarter ……………………………………………………………………………………………………………………………………………………………………………………725 520 1,097 588 1,076 158 159 190 304 350
Net income retained in business ……………………………………………………………………………………………………………………………………………………………………………………………………360 (620) 1,214 3,063 12 (92) 51 378 311 (247)
Retained earnings at beginning of quarter …………………………………………………………………………………………………………………………………………………………………………………………………………16,233 16,479 11,415 11,904 15,069 4,613 4,307 3,855 3,332 5,073
Other direct credits (charges) to retained earnings (net), including
stock and other non-cash dividends, etc. ……………………………………………………………………………………………………………………………………………………………………………………………………………………………(129) (180) (48) 9 (22) (99) 25 (37) 143 39
Retained earnings at end of quarter ……………………………………………………………………………………………………………………………………………………………………………………………………16,464 15,679 12,581 14,976 15,059 4,422 4,384 4,196 3,786 4,865
INCOME STATEMENT IN RATIO FORMAT
Net sales, receipts, and operating revenues ……………………………………………………………………………………………………………………………………………………………………………………………………100.00 100.00 100.00 100.00 100.00 100.00 100.00 100.00 100.00 100.00
Depreciation, depletion, and amortization of property,
plant, and equipment ………………………………………………………………………………………………………………………………………………………………………5.44 5.97 4.46 4.20 4.85 2.85 2.91 2.31 2.19 2.62
All other operating costs and expenses ……………………………………………………………………………………………………………………………………………………………………………………………………88.96 93.63 85.86 84.62 90.33 94.49 91.59 86.76 85.07 93.76
Income (loss) from operations …………………………………………………………………………………………………………………………………………………………………………………………………5.60 0.40 9.67 11.18 4.82 2.66 5.50 10.93 12.74 3.62
Interest expense …………………………………………………………………………………………………………………………………………………………………………………………………………………………………2.37 2.96 2.26 2.12 2.38 0.67 0.73 0.58 0.52 0.66
All other nonoperating income (expense) ……………………………………………………………………………………………………………………………………………………………………………………………1.18 1.80 1.87 3.82 2.78 (0.06) 0.88 0.55 0.07 0.55
Income (loss) before income taxes ……………………………………………………………………………………………………………………………………………………………………………………………4.40 (0.76) 9.29 12.88 5.21 1.94 5.65 10.90 12.29 3.51
Provision for current and deferred domestic income taxes ……………………………………………………………………………………………………………………………………………………………………………………0.35 (0.34) 1.67 1.94 1.49 0.74 1.05 1.98 2.18 1.82
Income (loss) after income taxes ………………………………………………………………………………………………………………………………………………………………………………………………4.05 (0.43) 7.62 10.94 3.73 1.20 4.60 8.93 10.11 1.69
OPERATING RATIOS
(see explanatory notes)
Annual rate of profit on stockholders' equity at end of period:
Before income taxes ……………………………………………………………………………………………………………………………………………………………………………………………………………………4.99 (0.78) 12.67 18.86 6.65 7.19 18.60 50.84 58.63 13.70
After income taxes ………………………………………………………………………………………………………………………………………………………………………………………………………………4.59 (0.44) 10.39 16.01 4.76 4.45 15.15 41.63 48.22 6.60
Annual rate of profit on total assets:
Before income taxes ………………………………………………………………………………………………………………………………………………………………………………………………………………2.66 (0.40) 6.34 9.71 3.50 3.95 9.59 24.29 28.19 7.01
After income taxes …………………………………………………………………………………………………………………………………………………………………………………………………………………………2.45 (0.22) 5.20 8.25 2.50 2.45 7.81 19.89 23.18 3.38
BALANCE SHEET RATIOS
(based on succeeding table)
Total current assets to total current liabilities …………………………………………………………………………………………………………………………………………………………………………………………………1.82 1.80 1.70 1.80 1.83 2.30 2.13 2.04 2.30 2.30
Total cash, U.S. Government and other securities, to total current liabilities …………………………………………………………………………………………………………………………………………………………………0.41 0.33 0.28 0.30 0.31 0.59 0.52 0.46 0.52 0.55
Total stockholders' equity to total debt ………………………………………………………………………………………………………………………………………………………………………………………………………1.97 1.82 1.79 1.86 1.94 2.29 1.99 1.83 1.73 2.08
(percent of net sales) (percent of net sales)
(percent) (percent)
Table 17.0 -- Income Statement For Corporations in NAICS Manufacturing Subsector 327,
All Total Asset Sizes, and Total Assets Under $25 Million
See the Survey Methodology section of the Introduction for information on survey design, estimation, and sampling error.
Nonmetallic Mineral Products
All Total Asset Sizes
Nonmetallic Mineral Products
Total Assets Under $25 Million
(million dollars) (million dollars)
34U.S. Census Bureau, Quarterly Financial Report, 2014 Quarter 4

Table with row headers in column A with column headers in rows 5 and 6
Item
4Q_
2013_
1Q_
2014_
2Q_
2014_
3Q_
2014_
4Q_
2014_
4Q_
2013_
1Q_
2014_
2Q_
2014_
3Q_
2014_
4Q_
2014_
ASSETS
Cash and demand deposits in the U.S. .………………………………………………………………………………………………………………………………………………………………………………………………………………………………8,206 6,179 6,203 6,424 6,256 1,487 1,399 1,365 1,396 1,575
Time deposits in the U.S., including negotiable certificates of deposit ……………………………………………………………………………………………………………………………………………………………………………………182 134 162 133 123 73 63 81 95 97
Total cash on hand and in U.S. banks ……………………………………………………………………………………………………………………………………………………………………………………8,388 6,313 6,365 6,558 6,379 1,560 1,462 1,445 1,491 1,672
Other short-term financial investments, including marketable and
government securities, commercial paper, etc. ………………………………………………………………………………………………………………………………………………………………………………………………………………………………671 986 664 755 771 200 156 201 121 169
Total cash, U.S. Government and other securities ……………………………………………………………………………………………………………………………………………………………………………………9,059 7,299 7,029 7,312 7,150 1,760 1,618 1,646 1,612 1,841
Trade accounts and trade notes receivable
(less allowance for doubtful accounts) …………………………………………………………………………………………………………………………………………12,023 12,699 14,826 16,169 14,130 2,580 2,533 3,025 3,046 2,980
Inventories ………………………………………………………………………………………………………………………………………………………………………………………………………………………………13,878 14,365 14,761 14,754 14,983 2,124 2,023 2,100 1,932 2,311
All other current assets ………………………………………………………………………………………………………………………………………………………………………………………………………………………………5,266 5,397 5,448 5,284 5,320 419 480 512 503 577
Total current assets ………………………………………………………………………………………………………………………………………………………………………………………………………………………………40,225 39,760 42,064 43,519 41,583 6,884 6,654 7,283 7,094 7,709
Property, plant, and equipment ………………………………………………………………………………………………………………………………………………………………………………………………………………………………105,201 105,377 107,206 107,989 108,900 11,823 11,788 12,320 10,729 12,694
Land and mineral rights ………………………………………………………………………………………………………………………………………………………………………………………………………………………………17,281 17,202 17,403 17,364 17,302 329 393 318 232 300
Less: Accumulated depreciation, depletion, and amortization ……………………………………………………………………………………………………………………………………………………………………………………63,697 64,308 66,251 67,468 67,743 9,087 9,046 9,447 8,316 9,570
Net property, plant, and equipment ……………………………………………………………………………………………………………………………………………………………………………………58,785 58,270 58,357 57,886 58,459 3,065 3,135 3,191 2,646 3,424
All other noncurrent assets, including investment in nonconsolidated
entities, long-term investments, intangibles, etc. ………………………………………………………………………………………………………………………………………………………………………………………………………………78,444 79,063 77,496 75,717 73,810 889 961 952 886 1,008
Total Assets …………………………………………………………………………………………………………………………………………………………………………………………………………………………177,455 177,093 177,918 177,122 173,852 10,838 10,749 11,426 10,625 12,140
LIABILITIES AND STOCKHOLDERS' EQUITY
Short-term debt, original maturity of 1 year or less:
a. Loans from banks ………………………………………………………………………………………………………………………………………………………………………………………………………………………1,413 1,344 1,442 1,615 1,064 377 373 363 348 390
b. Other short-term loans, including commercial paper ………………………………………………………………………………………………………………………………………………………………………………………1,983 2,112 1,812 1,765 1,531 125 176 127 58 37
Trade accounts and trade notes payable ……………………………………………………………………………………………………………………………………………………………………………………………………………9,302 9,294 11,210 10,710 10,509 1,341 1,454 1,810 1,485 1,509
Income taxes accrued, prior and current years, net of payments ………………………………………………………………………………………………………………………………………………………………………………157 172 252 343 199 39 15 8 26 35
Current portion of long-term debt, due in 1 year or less:
a. Loans from banks …………………………………………………………………………………………………………………………………………………………………………………………………………………………………897 824 701 692 715 295 309 281 245 295
b. Other long-term loans ……………………………………………………………………………………………………………………………………………………………………………………………………………………1,525 1,678 2,452 2,368 2,063 87 69 143 136 166
All other current liabilities, including excise and
sales taxes, and accrued expenses ……..……………………………………………………………………………………………………………………………………………………6,858 6,668 6,830 6,661 6,662 732 735 838 785 919
Total current liabilities ……………………………………………………………………………………………………………………………………………………………………………………………………………………22,135 22,094 24,699 24,155 22,743 2,997 3,131 3,570 3,082 3,352
Long-term debt, due in more than 1 year:
a. Loans from banks …………………………………………………………………………………………………………………………………………………………………………………………………………………………8,942 10,303 10,917 11,249 10,864 1,178 1,156 1,121 1,302 1,494
b. Other long-term loans ……………………………………………………………………………………………………………………………………………………………………………………………………………………33,374 33,782 32,462 31,365 30,877 539 699 954 860 609
All other noncurrent liabilities, including deferred income taxes,
capitalized leases, and minority stockholders' interest
in consolidated domestic corporations ……………………………………………………………………………………………………………………………………………………………………18,393 19,756 20,850 19,141 17,929 172 220 322 272 474
Total liabilities ……………………………………………………………………………………………………………………………………………………………………………………………………………………………82,844 85,935 88,929 85,910 82,413 4,885 5,207 5,966 5,517 5,929
Capital stock and other capital (less treasury stock) …………………………………………………………………………………………………………………………………………………………………………………………78,146 75,480 76,408 76,236 76,381 1,530 1,159 1,263 1,322 1,346
Retained earnings …………………………………………………………………………………………………………………………………………………………………………………………………………………………………16,464 15,679 12,581 14,976 15,059 4,422 4,384 4,196 3,786 4,865
Stockholders' equity ……………………………………………………………………………………………………………………………………………………………………………………………………………………94,610 91,158 88,989 91,212 91,440 5,952 5,543 5,459 5,108 6,211
Total Liabilities and Stockholders' Equity ………………………………………………………………………………………………………………………………………………………………………………………………177,455 177,093 177,918 177,122 173,852 10,838 10,749 11,426 10,625 12,140
NET WORKING CAPITAL
Excess of total current assets over total current liabilities ………………………………………………………………………………………………………………………………………………………………………………………18,091 17,666 17,365 19,364 18,840 3,888 3,523 3,713 4,012 4,357
SELECTED BALANCE SHEET RATIOS
Total cash, U.S. Government and other securities …………………………………………………………………………………………………………………………………………………………………………………………………5.10 4.12 3.95 4.13 4.11 16.24 15.05 14.41 15.17 15.16
Trade accounts and trade notes receivable ……………………………………………………………………………………………………………………………………………………………………………………………………6.78 7.17 8.33 9.13 8.13 23.81 23.56 26.47 28.67 24.55
Inventories ……………………………………………………………………………………………………………………………………………………………………………………………………………………………………7.82 8.11 8.30 8.33 8.62 19.60 18.82 18.38 18.18 19.03
Total current assets …………………………………………………………………………………………………………………………………………………………………………………………………………………………22.67 22.45 23.64 24.57 23.92 63.52 61.90 63.74 66.77 63.50
Net property, plant, and equipment ……………………………………………………………………………………………………………………………………………………………………………………………………………33.13 32.90 32.80 32.68 33.63 28.28 29.16 27.93 24.90 28.20
Short-term debt, including current portion of long-term debt ………………………………………………………………………………………………………………………………………………………………………………………3.28 3.36 3.60 3.64 3.09 8.16 8.62 8.00 7.40 7.32
Total current liabilities …………………………………………………………………………………………………………………………………………………………………………………………………………………………………12.47 12.48 13.88 13.64 13.08 27.65 29.13 31.24 29.01 27.61
Long-term debt …………………………………………………………………………………………………………………………………………………………………………………………………………………………………23.85 24.89 24.38 24.06 24.01 15.84 17.26 18.16 20.35 17.32
Total liabilities …………………………………………………………………………………………………………………………………………………………………………………………………………………………………46.68 48.53 49.98 48.50 47.40 45.08 48.44 52.22 51.92 48.84
Stockholders' equity ………………………………………………………………………………………………………………………………………………………………………………………………………………………………53.32 51.47 50.02 51.50 52.60 54.92 51.56 47.78 48.08 51.16
Table 17.1 -- Balance Sheet For Corporations in NAICS Manufacturing Subsector 327,
All Total Asset Sizes, and Total Assets Under $25 Million
See the Survey Methodology section of the Introduction for information on survey design, estimation, and sampling error.
(million dollars)
(percent of total assets)
(million dollars)
(percent of total assets)
Nonmetallic Mineral Products
All Total Asset Sizes
Nonmetallic Mineral Products
Total Assets Under $25 Million
35U.S. Census Bureau, Quarterly Financial Report, 2014 Quarter 4
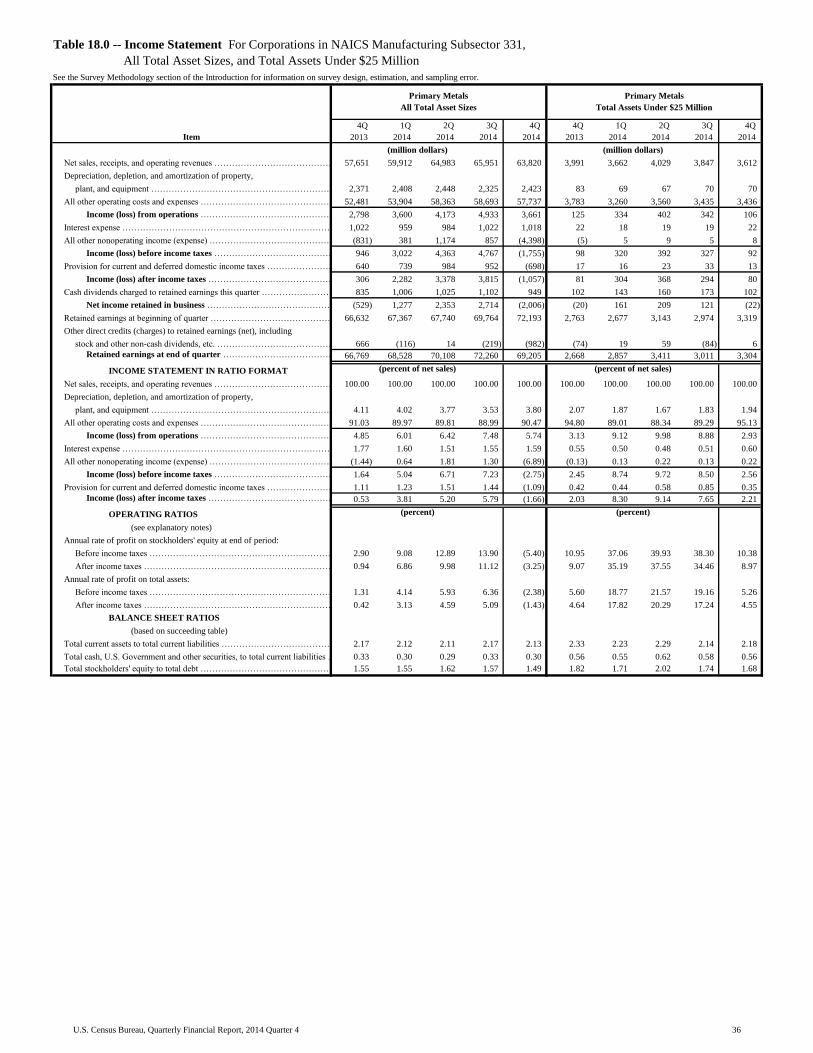
Table with row headers in column A with column headers in rows 5 and 6
Item
4Q_
2013_
1Q_
2014_
2Q_
2014_
3Q_
2014_
4Q_
2014_
4Q_
2013_
1Q_
2014_
2Q_
2014_
3Q_
2014_
4Q_
2014_
Net sales, receipts, and operating revenues ………………………………………………………………………………………………………………………………………………………………………57,651 59,912 64,983 65,951 63,820 3,991 3,662 4,029 3,847 3,612
Depreciation, depletion, and amortization of property,
plant, and equipment …………………………………………………………………………………………………………………………………………………………………………………………2,371 2,408 2,448 2,325 2,423 83 69 67 70 70
All other operating costs and expenses …………………………………………………………………………………………………………...……………………………………………………………52,481 53,904 58,363 58,693 57,737 3,783 3,260 3,560 3,435 3,436
Income (loss) from operations …………………………………………………………………………………………………………...……………………………………………………………2,798 3,600 4,173 4,933 3,661 125 334 402 342 106
Interest expense …………………………………………………………………………………………………………………………………………………………………………………………………………………………………………1,022 959 984 1,022 1,018 22 18 19 19 22
All other nonoperating income (expense) ……………………………………………………………………………………………………………………………………………………………………………………………………(831) 381 1,174 857 (4,398) (5) 5 9 5 8
Income (loss) before income taxes ………………………………………………………………………………………………………………………………………………………………………………………………946 3,022 4,363 4,767 (1,755) 98 320 392 327 92
Provision for current and deferred domestic income taxes …………………………………………………………………………………………………………………………………………………………………………………………640 739 984 952 (698) 17 16 23 33 13
Income (loss) after income taxes …………………………………………………………………………………………………………………………………………………………………………………………………………306 2,282 3,378 3,815 (1,057) 81 304 368 294 80
Cash dividends charged to retained earnings this quarter ……………………………………………………………………………………………………………………………………………………………………………………835 1,006 1,025 1,102 949 102 143 160 173 102
Net income retained in business ……………………………………………………………………………………………………………………………………………………………………………………………………(529) 1,277 2,353 2,714 (2,006) (20) 161 209 121 (22)
Retained earnings at beginning of quarter …………………………………………………………………………………………………………………………………………………………………………………………………………66,632 67,367 67,740 69,764 72,193 2,763 2,677 3,143 2,974 3,319
Other direct credits (charges) to retained earnings (net), including
stock and other non-cash dividends, etc. ……………………………………………………………………………………………………………………………………………………………………………………………………………………………666 (116) 14 (219) (982) (74) 19 59 (84) 6
Retained earnings at end of quarter ……………………………………………………………………………………………………………………………………………………………………………………………………66,769 68,528 70,108 72,260 69,205 2,668 2,857 3,411 3,011 3,304
INCOME STATEMENT IN RATIO FORMAT
Net sales, receipts, and operating revenues ……………………………………………………………………………………………………………………………………………………………………………………………………100.00 100.00 100.00 100.00 100.00 100.00 100.00 100.00 100.00 100.00
Depreciation, depletion, and amortization of property,
plant, and equipment ………………………………………………………………………………………………………………………………………………………………………4.11 4.02 3.77 3.53 3.80 2.07 1.87 1.67 1.83 1.94
All other operating costs and expenses ……………………………………………………………………………………………………………………………………………………………………………………………………91.03 89.97 89.81 88.99 90.47 94.80 89.01 88.34 89.29 95.13
Income (loss) from operations …………………………………………………………………………………………………………………………………………………………………………………………………4.85 6.01 6.42 7.48 5.74 3.13 9.12 9.98 8.88 2.93
Interest expense …………………………………………………………………………………………………………………………………………………………………………………………………………………………………1.77 1.60 1.51 1.55 1.59 0.55 0.50 0.48 0.51 0.60
All other nonoperating income (expense) ……………………………………………………………………………………………………………………………………………………………………………………………(1.44) 0.64 1.81 1.30 (6.89) (0.13) 0.13 0.22 0.13 0.22
Income (loss) before income taxes ……………………………………………………………………………………………………………………………………………………………………………………………1.64 5.04 6.71 7.23 (2.75) 2.45 8.74 9.72 8.50 2.56
Provision for current and deferred domestic income taxes ……………………………………………………………………………………………………………………………………………………………………………………1.11 1.23 1.51 1.44 (1.09) 0.42 0.44 0.58 0.85 0.35
Income (loss) after income taxes ………………………………………………………………………………………………………………………………………………………………………………………………0.53 3.81 5.20 5.79 (1.66) 2.03 8.30 9.14 7.65 2.21
OPERATING RATIOS
(see explanatory notes)
Annual rate of profit on stockholders' equity at end of period:
Before income taxes ……………………………………………………………………………………………………………………………………………………………………………………………………………………2.90 9.08 12.89 13.90 (5.40) 10.95 37.06 39.93 38.30 10.38
After income taxes ………………………………………………………………………………………………………………………………………………………………………………………………………………0.94 6.86 9.98 11.12 (3.25) 9.07 35.19 37.55 34.46 8.97
Annual rate of profit on total assets:
Before income taxes ………………………………………………………………………………………………………………………………………………………………………………………………………………1.31 4.14 5.93 6.36 (2.38) 5.60 18.77 21.57 19.16 5.26
After income taxes …………………………………………………………………………………………………………………………………………………………………………………………………………………………0.42 3.13 4.59 5.09 (1.43) 4.64 17.82 20.29 17.24 4.55
BALANCE SHEET RATIOS
(based on succeeding table)
Total current assets to total current liabilities …………………………………………………………………………………………………………………………………………………………………………………………………2.17 2.12 2.11 2.17 2.13 2.33 2.23 2.29 2.14 2.18
Total cash, U.S. Government and other securities, to total current liabilities …………………………………………………………………………………………………………………………………………………………………0.33 0.30 0.29 0.33 0.30 0.56 0.55 0.62 0.58 0.56
Total stockholders' equity to total debt ………………………………………………………………………………………………………………………………………………………………………………………………………1.55 1.55 1.62 1.57 1.49 1.82 1.71 2.02 1.74 1.68
(percent of net sales) (percent of net sales)
(percent) (percent)
Table 18.0 -- Income Statement For Corporations in NAICS Manufacturing Subsector 331,
All Total Asset Sizes, and Total Assets Under $25 Million
See the Survey Methodology section of the Introduction for information on survey design, estimation, and sampling error.
Primary Metals
All Total Asset Sizes
Primary Metals
Total Assets Under $25 Million
(million dollars) (million dollars)
36U.S. Census Bureau, Quarterly Financial Report, 2014 Quarter 4

Table with row headers in column A with column headers in rows 5 and 6
Item
4Q_
2013_
1Q_
2014_
2Q_
2014_
3Q_
2014_
4Q_
2014_
4Q_
2013_
1Q_
2014_
2Q_
2014_
3Q_
2014_
4Q_
2014_
ASSETS
Cash and demand deposits in the U.S. .………………………………………………………………………………………………………………………………………………………………………………………………………………………………8,991 9,110 8,701 10,467 8,853 956 939 1,033 981 866
Time deposits in the U.S., including negotiable certificates of deposit ……………………………………………………………………………………………………………………………………………………………………………………779 381 394 508 857 54 71 60 61 79
Total cash on hand and in U.S. banks ……………………………………………………………………………………………………………………………………………………………………………………9,770 9,491 9,095 10,974 9,710 1,010 1,011 1,093 1,042 945
Other short-term financial investments, including marketable and
government securities, commercial paper, etc. ………………………………………………………………………………………………………………………………………………………………………………………………………………………………3,909 3,907 4,197 4,145 4,224 120 107 289 263 284
Total cash, U.S. Government and other securities ……………………………………………………………………………………………………………………………………………………………………………………13,679 13,398 13,292 15,119 13,934 1,130 1,118 1,382 1,305 1,228
Trade accounts and trade notes receivable
(less allowance for doubtful accounts) …………………………………………………………………………………………………………………………………………24,865 27,635 28,638 29,385 26,541 1,680 1,657 1,791 1,794 1,645
Inventories ………………………………………………………………………………………………………………………………………………………………………………………………………………………………34,608 35,725 36,528 38,491 39,734 1,675 1,573 1,656 1,535 1,613
All other current assets ………………………………………………………………………………………………………………………………………………………………………………………………………………………………17,762 17,316 17,259 18,076 17,384 252 214 240 222 266
Total current assets ………………………………………………………………………………………………………………………………………………………………………………………………………………………………90,913 94,073 95,717 101,071 97,593 4,737 4,562 5,069 4,855 4,753
Property, plant, and equipment ………………………………………………………………………………………………………………………………………………………………………………………………………………………………168,929 168,670 170,654 172,085 178,331 6,018 5,885 6,084 6,109 6,391
Land and mineral rights ………………………………………………………………………………………………………………………………………………………………………………………………………………………………9,680 9,483 9,409 9,383 9,151 90 98 80 76 79
Less: Accumulated depreciation, depletion, and amortization ……………………………………………………………………………………………………………………………………………………………………………………80,203 78,963 80,676 82,116 90,118 4,328 4,227 4,399 4,442 4,543
Net property, plant, and equipment ……………………………………………………………………………………………………………………………………………………………………………………98,406 99,191 99,387 99,352 97,364 1,780 1,756 1,765 1,743 1,927
All other noncurrent assets, including investment in nonconsolidated
entities, long-term investments, intangibles, etc. ………………………………………………………………………………………………………………………………………………………………………………………………………………98,950 98,408 99,381 99,532 100,097 474 504 428 231 350
Total Assets …………………………………………………………………………………………………………………………………………………………………………………………………………………………288,270 291,672 294,485 299,955 295,054 6,992 6,822 7,262 6,829 7,030
LIABILITIES AND STOCKHOLDERS' EQUITY
Short-term debt, original maturity of 1 year or less:
a. Loans from banks ………………………………………………………………………………………………………………………………………………………………………………………………………………………2,971 2,912 2,207 2,819 2,655 526 385 419 382 413
b. Other short-term loans, including commercial paper ………………………………………………………………………………………………………………………………………………………………………………………3,887 4,180 3,691 3,967 4,902 46 30 40 50 71
Trade accounts and trade notes payable ……………………………………………………………………………………………………………………………………………………………………………………………………………19,678 20,990 21,747 22,550 22,322 861 889 949 967 909
Income taxes accrued, prior and current years, net of payments ………………………………………………………………………………………………………………………………………………………………………………457 761 1,098 668 484 9 28 39 30 18
Current portion of long-term debt, due in 1 year or less:
a. Loans from banks …………………………………………………………………………………………………………………………………………………………………………………………………………………………………893 990 1,086 1,083 1,706 103 271 272 316 305
b. Other long-term loans ……………………………………………………………………………………………………………………………………………………………………………………………………………………3,214 4,247 4,448 3,742 2,719 69 110 173 188 158
All other current liabilities, including excise and
sales taxes, and accrued expenses ……..……………………………………………………………………………………………………………………………………………………10,798 10,365 11,054 11,681 11,030 415 334 324 332 303
Total current liabilities ……………………………………………………………………………………………………………………………………………………………………………………………………………………41,897 44,445 45,331 46,510 45,818 2,029 2,046 2,216 2,265 2,176
Long-term debt, due in more than 1 year:
a. Loans from banks …………………………………………………………………………………………………………………………………………………………………………………………………………………………10,985 11,580 12,454 12,979 12,633 706 847 697 604 644
b. Other long-term loans ……………………………………………………………………………………………………………………………………………………………………………………………………………………62,595 61,766 59,920 63,060 62,895 515 384 339 423 524
All other noncurrent liabilities, including deferred income taxes,
capitalized leases, and minority stockholders' interest
in consolidated domestic corporations ……………………………………………………………………………………………………………………………………………………………………42,132 40,822 41,352 40,214 43,694 166 90 88 121 125
Total liabilities ……………………………………………………………………………………………………………………………………………………………………………………………………………………………157,609 158,613 159,056 162,762 165,040 3,415 3,367 3,339 3,413 3,469
Capital stock and other capital (less treasury stock) …………………………………………………………………………………………………………………………………………………………………………………………63,891 64,531 65,322 64,933 60,809 909 598 512 406 258
Retained earnings …………………………………………………………………………………………………………………………………………………………………………………………………………………………………66,769 68,528 70,108 72,260 69,205 2,668 2,857 3,411 3,011 3,304
Stockholders' equity ……………………………………………………………………………………………………………………………………………………………………………………………………………………130,660 133,059 135,429 137,193 130,014 3,577 3,455 3,923 3,416 3,561
Total Liabilities and Stockholders' Equity ………………………………………………………………………………………………………………………………………………………………………………………………288,270 291,672 294,485 299,955 295,054 6,992 6,822 7,262 6,829 7,030
NET WORKING CAPITAL
Excess of total current assets over total current liabilities ………………………………………………………………………………………………………………………………………………………………………………………49,017 49,628 50,387 54,561 51,775 2,708 2,516 2,854 2,590 2,577
SELECTED BALANCE SHEET RATIOS
Total cash, U.S. Government and other securities …………………………………………………………………………………………………………………………………………………………………………………………………4.75 4.59 4.51 5.04 4.72 16.17 16.38 19.03 19.11 17.47
Trade accounts and trade notes receivable ……………………………………………………………………………………………………………………………………………………………………………………………………8.63 9.47 9.72 9.80 9.00 24.02 24.29 24.66 26.27 23.40
Inventories ……………………………………………………………………………………………………………………………………………………………………………………………………………………………………12.01 12.25 12.40 12.83 13.47 23.96 23.05 22.80 22.47 22.95
Total current assets …………………………………………………………………………………………………………………………………………………………………………………………………………………………31.54 32.25 32.50 33.70 33.08 67.76 66.87 69.80 71.09 67.60
Net property, plant, and equipment ……………………………………………………………………………………………………………………………………………………………………………………………………………34.14 34.01 33.75 33.12 33.00 25.46 25.74 24.31 25.53 27.41
Short-term debt, including current portion of long-term debt ………………………………………………………………………………………………………………………………………………………………………………………3.80 4.23 3.88 3.87 4.06 10.65 11.66 12.45 13.71 13.46
Total current liabilities …………………………………………………………………………………………………………………………………………………………………………………………………………………………………14.53 15.24 15.39 15.51 15.53 29.02 29.99 30.51 33.16 30.95
Long-term debt …………………………………………………………………………………………………………………………………………………………………………………………………………………………………25.52 25.15 24.58 25.35 25.60 17.45 18.04 14.25 15.04 16.61
Total liabilities …………………………………………………………………………………………………………………………………………………………………………………………………………………………………54.67 54.38 54.01 54.26 55.94 48.84 49.35 45.98 49.97 49.34
Stockholders' equity ………………………………………………………………………………………………………………………………………………………………………………………………………………………………45.33 45.62 45.99 45.74 44.06 51.16 50.65 54.02 50.03 50.66
Table 18.1 -- Balance Sheet For Corporations in NAICS Manufacturing Subsector 331,
All Total Asset Sizes, and Total Assets Under $25 Million
See the Survey Methodology section of the Introduction for information on survey design, estimation, and sampling error.
(million dollars)
(percent of total assets)
(million dollars)
(percent of total assets)
Primary Metals
All Total Asset Sizes
Primary Metals
Total Assets Under $25 Million
37U.S. Census Bureau, Quarterly Financial Report, 2014 Quarter 4

Table with row headers in column A with column headers in rows 5 and 6
Item
4Q_
2013_
1Q_
2014_
2Q_
2014_
3Q_
2014_
4Q_
2014_
4Q_
2013_
1Q_
2014_
2Q_
2014_
3Q_
2014_
4Q_
2014_
Net sales, receipts, and operating revenues ………………………………………………………………………………………………………………………………………………………………………29,658 30,720 33,525 34,124 32,656 1,605 1,432 1,485 1,247 1,081
Depreciation, depletion, and amortization of property,
plant, and equipment …………………………………………………………………………………………………………………………………………………………………………………………952 929 926 893 935 42 25 22 19 18
All other operating costs and expenses …………………………………………………………………………………………………………...……………………………………………………………27,799 28,918 31,360 30,879 30,194 1,502 1,230 1,284 1,090 1,069
Income (loss) from operations …………………………………………………………………………………………………………...……………………………………………………………907 873 1,238 2,353 1,526 61 177 179 138 (5)
Interest expense …………………………………………………………………………………………………………………………………………………………………………………………………………………………………………470 439 447 448 469 11 7 7 5 8
All other nonoperating income (expense) ……………………………………………………………………………………………………………………………………………………………………………………………………358 89 163 (480) (221) (4) 2 (2) 2 0
Income (loss) before income taxes ………………………………………………………………………………………………………………………………………………………………………………………………795 523 954 1,424 836 46 172 170 134 (13)
Provision for current and deferred domestic income taxes …………………………………………………………………………………………………………………………………………………………………………………………161 121 247 304 188 7 10 10 13 (2)
Income (loss) after income taxes …………………………………………………………………………………………………………………………………………………………………………………………………………634 402 708 1,121 648 39 162 160 121 (11)
Cash dividends charged to retained earnings this quarter ……………………………………………………………………………………………………………………………………………………………………………………424 406 405 461 367 29 63 54 76 29
Net income retained in business ……………………………………………………………………………………………………………………………………………………………………………………………………209 (4) 303 659 281 10 99 106 45 (40)
Retained earnings at beginning of quarter …………………………………………………………………………………………………………………………………………………………………………………………………………14,872 15,705 15,073 14,606 14,940 1,221 1,201 1,183 1,017 1,022
Other direct credits (charges) to retained earnings (net), including
stock and other non-cash dividends, etc. ……………………………………………………………………………………………………………………………………………………………………………………………………………………………693 (101) (28) (171) (601) (69) (12) 0 (12) 4
Retained earnings at end of quarter ……………………………………………………………………………………………………………………………………………………………………………………………………15,775 15,599 15,348 15,094 14,620 1,162 1,288 1,290 1,051 986
INCOME STATEMENT IN RATIO FORMAT
Net sales, receipts, and operating revenues ……………………………………………………………………………………………………………………………………………………………………………………………………100.00 100.00 100.00 100.00 100.00 100.00 100.00 100.00 100.00 100.00
Depreciation, depletion, and amortization of property,
plant, and equipment ………………………………………………………………………………………………………………………………………………………………………3.21 3.02 2.76 2.62 2.86 2.63 1.77 1.50 1.54 1.62
All other operating costs and expenses ……………………………………………………………………………………………………………………………………………………………………………………………………93.73 94.13 93.54 90.49 92.46 93.59 85.86 86.45 87.43 98.88
Income (loss) from operations …………………………………………………………………………………………………………………………………………………………………………………………………3.06 2.84 3.69 6.90 4.67 3.77 12.37 12.05 11.03 (0.51)
Interest expense …………………………………………………………………………………………………………………………………………………………………………………………………………………………………1.58 1.43 1.33 1.31 1.44 0.67 0.49 0.46 0.41 0.72
All other nonoperating income (expense) ……………………………………………………………………………………………………………………………………………………………………………………………1.21 0.29 0.49 (1.41) (0.68) (0.26) 0.15 (0.15) 0.14 0.02
Income (loss) before income taxes ……………………………………………………………………………………………………………………………………………………………………………………………2.68 1.70 2.85 4.17 2.56 2.84 12.02 11.45 10.77 (1.21)
Provision for current and deferred domestic income taxes ……………………………………………………………………………………………………………………………………………………………………………………0.54 0.40 0.74 0.89 0.58 0.42 0.68 0.65 1.03 (0.20)
Income (loss) after income taxes ………………………………………………………………………………………………………………………………………………………………………………………………2.14 1.31 2.11 3.28 1.98 2.43 11.35 10.79 9.74 (1.01)
OPERATING RATIOS
(see explanatory notes)
Annual rate of profit on stockholders' equity at end of period:
Before income taxes ……………………………………………………………………………………………………………………………………………………………………………………………………………………7.59 4.97 8.98 13.56 8.53 13.29 46.66 48.78 47.89 (4.90)
After income taxes ………………………………………………………………………………………………………………………………………………………………………………………………………………6.05 3.81 6.66 10.67 6.60 11.35 44.02 46.00 43.32 (4.10)
Annual rate of profit on total assets:
Before income taxes ………………………………………………………………………………………………………………………………………………………………………………………………………………2.99 1.96 3.56 5.26 3.10 6.36 24.72 25.21 24.88 (2.35)
After income taxes …………………………………………………………………………………………………………………………………………………………………………………………………………………………2.39 1.50 2.64 4.14 2.40 5.42 23.32 23.77 22.51 (1.97)
BALANCE SHEET RATIOS
(based on succeeding table)
Total current assets to total current liabilities …………………………………………………………………………………………………………………………………………………………………………………………………2.18 2.10 2.19 2.12 2.07 2.10 2.27 2.12 2.17 2.04
Total cash, U.S. Government and other securities, to total current liabilities …………………………………………………………………………………………………………………………………………………………………0.31 0.27 0.27 0.24 0.23 0.50 0.58 0.57 0.58 0.53
Total stockholders' equity to total debt ………………………………………………………………………………………………………………………………………………………………………………………………………1.34 1.34 1.39 1.31 1.20 1.56 2.01 1.88 1.83 1.41
Table 19.0 -- Income Statement For Corporations in NAICS Manufacturing Industry Groups 3311 and 3312,
All Total Asset Sizes, and Total Assets Under $25 Million
See the Survey Methodology section of the Introduction for information on survey design, estimation, and sampling error.
Iron, Steel, and Ferroalloys
All Total Asset Sizes 1
Iron, Steel, and Ferroalloys
Total Assets Under $25 Million 1
(million dollars) (million dollars)
(percent of net sales) (percent of net sales)
(percent) (percent)
1 Included in Primary Metals.
38U.S. Census Bureau, Quarterly Financial Report, 2014 Quarter 4

Table with row headers in column A with column headers in rows 5 and 6
Item
4Q_
2013_
1Q_
2014_
2Q_
2014_
3Q_
2014_
4Q_
2014_
4Q_
2013_
1Q_
2014_
2Q_
2014_
3Q_
2014_
4Q_
2014_
ASSETS
Cash and demand deposits in the U.S. .………………………………………………………………………………………………………………………………………………………………………………………………………………………………4,823 4,368 4,161 3,821 3,745 397 410 392 322 259
Time deposits in the U.S., including negotiable certificates of deposit ……………………………………………………………………………………………………………………………………………………………………………………35 24 13 17 28 2 5 2 4 10
Total cash on hand and in U.S. banks ……………………………………………………………………………………………………………………………………………………………………………………4,858 4,392 4,174 3,838 3,774 399 415 394 326 268
Other short-term financial investments, including marketable and
government securities, commercial paper, etc. ………………………………………………………………………………………………………………………………………………………………………………………………………………………………1,198 1,106 1,227 1,191 1,210 75 91 136 108 142
Total cash, U.S. Government and other securities ……………………………………………………………………………………………………………………………………………………………………………………6,056 5,498 5,401 5,029 4,984 475 506 530 434 410
Trade accounts and trade notes receivable
(less allowance for doubtful accounts) …………………………………………………………………………………………………………………………………………13,295 14,330 14,764 15,333 13,890 723 690 667 558 477
Inventories ………………………………………………………………………………………………………………………………………………………………………………………………………………………………18,907 19,413 19,475 20,793 21,666 712 715 712 549 578
All other current assets ………………………………………………………………………………………………………………………………………………………………………………………………………………………………3,991 3,966 4,170 4,102 3,324 66 60 73 73 100
Total current assets ………………………………………………………………………………………………………………………………………………………………………………………………………………………………42,248 43,207 43,810 45,258 43,863 1,976 1,971 1,982 1,614 1,565
Property, plant, and equipment ………………………………………………………………………………………………………………………………………………………………………………………………………………………………75,664 75,802 76,344 76,363 76,835 2,639 2,385 2,172 1,784 1,845
Land and mineral rights ………………………………………………………………………………………………………………………………………………………………………………………………………………………………1,714 1,645 1,615 1,645 1,629 40 56 39 41 41
Less: Accumulated depreciation, depletion, and amortization ……………………………………………………………………………………………………………………………………………………………………………………41,636 41,963 42,665 42,589 42,722 1,883 1,741 1,621 1,317 1,305
Net property, plant, and equipment ……………………………………………………………………………………………………………………………………………………………………………………35,742 35,484 35,293 35,419 35,742 796 700 590 507 581
All other noncurrent assets, including investment in nonconsolidated
entities, long-term investments, intangibles, etc. ………………………………………………………………………………………………………………………………………………………………………………………………………………28,280 28,142 28,009 27,576 28,431 101 116 125 37 82
Total Assets …………………………………………………………………………………………………………………………………………………………………………………………………………………………106,271 106,833 107,113 108,253 108,037 2,873 2,787 2,697 2,159 2,228
LIABILITIES AND STOCKHOLDERS' EQUITY
Short-term debt, original maturity of 1 year or less:
a. Loans from banks ………………………………………………………………………………………………………………………………………………………………………………………………………………………1,415 1,420 1,107 1,017 934 329 245 264 206 244
b. Other short-term loans, including commercial paper ………………………………………………………………………………………………………………………………………………………………………………………1,538 1,630 1,403 1,433 2,182 17 23 30 14 7
Trade accounts and trade notes payable ……………………………………………………………………………………………………………………………………………………………………………………………………………9,601 10,352 11,017 11,365 11,078 377 389 380 291 278
Income taxes accrued, prior and current years, net of payments ………………………………………………………………………………………………………………………………………………………………………………184 302 266 226 266 (1) 9 7 1 (1)
Current portion of long-term debt, due in 1 year or less:
a. Loans from banks …………………………………………………………………………………………………………………………………………………………………………………………………………………………………236 302 312 372 316 28 53 49 47 59
b. Other long-term loans ……………………………………………………………………………………………………………………………………………………………………………………………………………………1,527 1,759 853 1,222 1,283 34 20 73 86 93
All other current liabilities, including excise and
sales taxes, and accrued expenses ……..……………………………………………………………………………………………………………………………………………………4,922 4,787 5,038 5,726 5,179 155 129 130 99 88
Total current liabilities ……………………………………………………………………………………………………………………………………………………………………………………………………………………19,424 20,553 19,995 21,360 21,239 940 868 933 744 768
Long-term debt, due in more than 1 year:
a. Loans from banks …………………………………………………………………………………………………………………………………………………………………………………………………………………………3,682 3,893 3,754 3,507 3,612 199 288 283 222 293
b. Other long-term loans ……………………………………………………………………………………………………………………………………………………………………………………………………………………22,980 22,461 23,066 24,467 24,279 272 104 43 40 65
All other noncurrent liabilities, including deferred income taxes,
capitalized leases, and minority stockholders' interest
in consolidated domestic corporations ……………………………………………………………………………………………………………………………………………………………………18,262 17,801 17,760 16,894 19,677 89 51 43 31 34
Total liabilities ……………………………………………………………………………………………………………………………………………………………………………………………………………………………64,348 64,709 64,576 66,228 68,806 1,500 1,311 1,303 1,037 1,160
Capital stock and other capital (less treasury stock) …………………………………………………………………………………………………………………………………………………………………………………………26,148 26,525 27,189 26,931 24,610 211 189 104 71 83
Retained earnings …………………………………………………………………………………………………………………………………………………………………………………………………………………………………15,775 15,599 15,348 15,094 14,620 1,162 1,288 1,290 1,051 986
Stockholders' equity ……………………………………………………………………………………………………………………………………………………………………………………………………………………41,923 42,124 42,537 42,025 39,230 1,373 1,476 1,394 1,122 1,069
Total Liabilities and Stockholders' Equity ………………………………………………………………………………………………………………………………………………………………………………………………106,271 106,833 107,113 108,253 108,037 2,873 2,787 2,697 2,159 2,228
NET WORKING CAPITAL
Excess of total current assets over total current liabilities ………………………………………………………………………………………………………………………………………………………………………………………22,825 22,655 23,815 23,898 22,624 1,036 1,104 1,049 871 797
SELECTED BALANCE SHEET RATIOS
Total cash, U.S. Government and other securities …………………………………………………………………………………………………………………………………………………………………………………………………5.70 5.15 5.04 4.65 4.61 16.52 18.15 19.66 20.11 18.42
Trade accounts and trade notes receivable ……………………………………………………………………………………………………………………………………………………………………………………………………12.51 13.41 13.78 14.16 12.86 25.18 24.76 24.73 25.87 21.41
Inventories ……………………………………………………………………………………………………………………………………………………………………………………………………………………………………17.79 18.17 18.18 19.21 20.05 24.78 25.67 26.42 25.42 25.92
Total current assets …………………………………………………………………………………………………………………………………………………………………………………………………………………………39.76 40.44 40.90 41.81 40.60 68.79 70.73 73.49 74.79 70.21
Net property, plant, and equipment ……………………………………………………………………………………………………………………………………………………………………………………………………………33.63 33.21 32.95 32.72 33.08 27.70 25.12 21.88 23.51 26.09
Short-term debt, including current portion of long-term debt ………………………………………………………………………………………………………………………………………………………………………………………4.44 4.78 3.43 3.74 4.36 14.23 12.23 15.43 16.32 18.07
Total current liabilities …………………………………………………………………………………………………………………………………………………………………………………………………………………………………18.28 19.24 18.67 19.73 19.66 32.73 31.13 34.61 34.44 34.45
Long-term debt …………………………………………………………………………………………………………………………………………………………………………………………………………………………………25.09 24.67 25.04 25.84 25.82 16.37 14.07 12.11 12.14 16.06
Total liabilities …………………………………………………………………………………………………………………………………………………………………………………………………………………………………60.55 60.57 60.29 61.18 63.69 52.20 47.03 48.32 48.04 52.04
Stockholders' equity ………………………………………………………………………………………………………………………………………………………………………………………………………………………………39.45 39.43 39.71 38.82 36.31 47.80 52.97 51.68 51.96 47.96
1 Included in Primary Metals.
Table 19.1 -- Balance Sheet For Corporations in NAICS Manufacturing Industry Groups 3311 and 3312,
All Total Asset Sizes, and Total Assets Under $25 Million
See the Survey Methodology section of the Introduction for information on survey design, estimation, and sampling error.
(million dollars)
(percent of total assets)
(million dollars)
(percent of total assets)
Iron, Steel, and Ferroalloys
All Total Asset Sizes 1
Iron, Steel, and Ferroalloys
Total Assets Under $25 Million 1
39U.S. Census Bureau, Quarterly Financial Report, 2014 Quarter 4

Table with row headers in column A with column headers in rows 5 and 6
Item
4Q_
2013_
1Q_
2014_
2Q_
2014_
3Q_
2014_
4Q_
2014_
4Q_
2013_
1Q_
2014_
2Q_
2014_
3Q_
2014_
4Q_
2014_
Net sales, receipts, and operating revenues ………………………………………………………………………………………………………………………………………………………………………22,106 22,528 24,455 24,797 24,040 1,407 1,190 1,353 1,304 1,408
Depreciation, depletion, and amortization of property,
plant, and equipment …………………………………………………………………………………………………………………………………………………………………………………………1,260 1,315 1,360 1,254 1,289 18 16 18 21 22
All other operating costs and expenses …………………………………………………………………………………………………………...……………………………………………………………19,709 19,392 21,232 21,955 21,500 1,354 1,096 1,236 1,188 1,322
Income (loss) from operations …………………………………………………………………………………………………………...……………………………………………………………1,137 1,822 1,864 1,588 1,251 35 78 99 96 64
Interest expense …………………………………………………………………………………………………………………………………………………………………………………………………………………………………………502 471 489 518 490 7 4 4 5 5
All other nonoperating income (expense) ……………………………………………………………………………………………………………………………………………………………………………………………………(1,292) 190 920 1,250 (4,240) 1 1 7 (1) 2
Income (loss) before income taxes ………………………………………………………………………………………………………………………………………………………………………………………………(657) 1,541 2,295 2,321 (3,478) 30 75 102 91 61
Provision for current and deferred domestic income taxes …………………………………………………………………………………………………………………………………………………………………………………………272 375 465 398 (1,132) 6 1 6 13 5
Income (loss) after income taxes …………………………………………………………………………………………………………………………………………………………………………………………………………(930) 1,166 1,831 1,922 (2,347) 23 73 96 78 56
Cash dividends charged to retained earnings this quarter ……………………………………………………………………………………………………………………………………………………………………………………358 528 526 551 531 33 49 43 39 31
Net income retained in business ……………………………………………………………………………………………………………………………………………………………………………………………………(1,287) 638 1,305 1,372 (2,877) (10) 24 53 39 24
Retained earnings at beginning of quarter …………………………………………………………………………………………………………………………………………………………………………………………………………36,267 35,238 35,450 37,239 38,830 674 501 726 831 1,068
Other direct credits (charges) to retained earnings (net), including
stock and other non-cash dividends, etc. ……………………………………………………………………………………………………………………………………………………………………………………………………………………………11 (54) (62) (11) (348) 10 (5) (13) 1 0
Retained earnings at end of quarter ……………………………………………………………………………………………………………………………………………………………………………………………………34,991 35,822 36,693 38,601 35,605 673 520 765 871 1,092
INCOME STATEMENT IN RATIO FORMAT
Net sales, receipts, and operating revenues ……………………………………………………………………………………………………………………………………………………………………………………………………100.00 100.00 100.00 100.00 100.00 100.00 100.00 100.00 100.00 100.00
Depreciation, depletion, and amortization of property,
plant, and equipment ………………………………………………………………………………………………………………………………………………………………………5.70 5.84 5.56 5.06 5.36 1.29 1.34 1.36 1.61 1.55
All other operating costs and expenses ……………………………………………………………………………………………………………………………………………………………………………………………………89.16 86.08 86.82 88.54 89.43 96.21 92.08 91.33 91.05 93.91
Income (loss) from operations …………………………………………………………………………………………………………………………………………………………………………………………………5.14 8.09 7.62 6.41 5.20 2.50 6.57 7.31 7.35 4.54
Interest expense …………………………………………………………………………………………………………………………………………………………………………………………………………………………………2.27 2.09 2.00 2.09 2.04 0.50 0.35 0.31 0.35 0.34
All other nonoperating income (expense) ……………………………………………………………………………………………………………………………………………………………………………………………(5.84) 0.84 3.76 5.04 (17.64) 0.09 0.05 0.50 (0.05) 0.14
Income (loss) before income taxes ……………………………………………………………………………………………………………………………………………………………………………………………(2.97) 6.84 9.38 9.36 (14.47) 2.10 6.27 7.51 6.95 4.34
Provision for current and deferred domestic income taxes ……………………………………………………………………………………………………………………………………………………………………………………1.23 1.66 1.90 1.61 (4.71) 0.45 0.10 0.42 0.98 0.37
Income (loss) after income taxes ………………………………………………………………………………………………………………………………………………………………………………………………(4.20) 5.18 7.49 7.75 (9.76) 1.65 6.16 7.09 5.98 3.97
OPERATING RATIOS
(see explanatory notes)
Annual rate of profit on stockholders' equity at end of period:
Before income taxes ……………………………………………………………………………………………………………………………………………………………………………………………………………………(3.63) 8.31 12.16 11.97 (18.98) 10.15 30.74 33.84 37.21 20.50
After income taxes ………………………………………………………………………………………………………………………………………………………………………………………………………………(5.13) 6.29 9.70 9.91 (12.81) 7.96 30.22 31.96 31.99 18.76
Annual rate of profit on total assets:
Before income taxes ………………………………………………………………………………………………………………………………………………………………………………………………………………(1.70) 3.94 5.82 5.80 (8.97) 5.65 17.17 19.63 18.30 10.97
After income taxes …………………………………………………………………………………………………………………………………………………………………………………………………………………………(2.41) 2.98 4.65 4.80 (6.05) 4.43 16.88 18.54 15.73 10.04
BALANCE SHEET RATIOS
(based on succeeding table)
Total current assets to total current liabilities …………………………………………………………………………………………………………………………………………………………………………………………………2.10 2.05 1.97 2.20 2.22 2.51 2.28 2.38 2.06 2.08
Total cash, U.S. Government and other securities, to total current liabilities …………………………………………………………………………………………………………………………………………………………………0.33 0.32 0.30 0.40 0.38 0.50 0.50 0.57 0.42 0.38
Total stockholders' equity to total debt ………………………………………………………………………………………………………………………………………………………………………………………………………1.54 1.56 1.63 1.62 1.57 2.18 2.23 2.55 1.75 2.08
Table 20.0 -- Income Statement For Corporations in NAICS Manufacturing Industry Groups 3313 and 3314,
All Total Asset Sizes, and Total Assets Under $25 Million
See the Survey Methodology section of the Introduction for information on survey design, estimation, and sampling error.
Nonferrous Metals
All Total Asset Sizes 1
Nonferrous Metals
Total Assets Under $25 Million 1
(million dollars) (million dollars)
(percent of net sales) (percent of net sales)
(percent) (percent)
1 Included in Primary Metals.
40U.S. Census Bureau, Quarterly Financial Report, 2014 Quarter 4
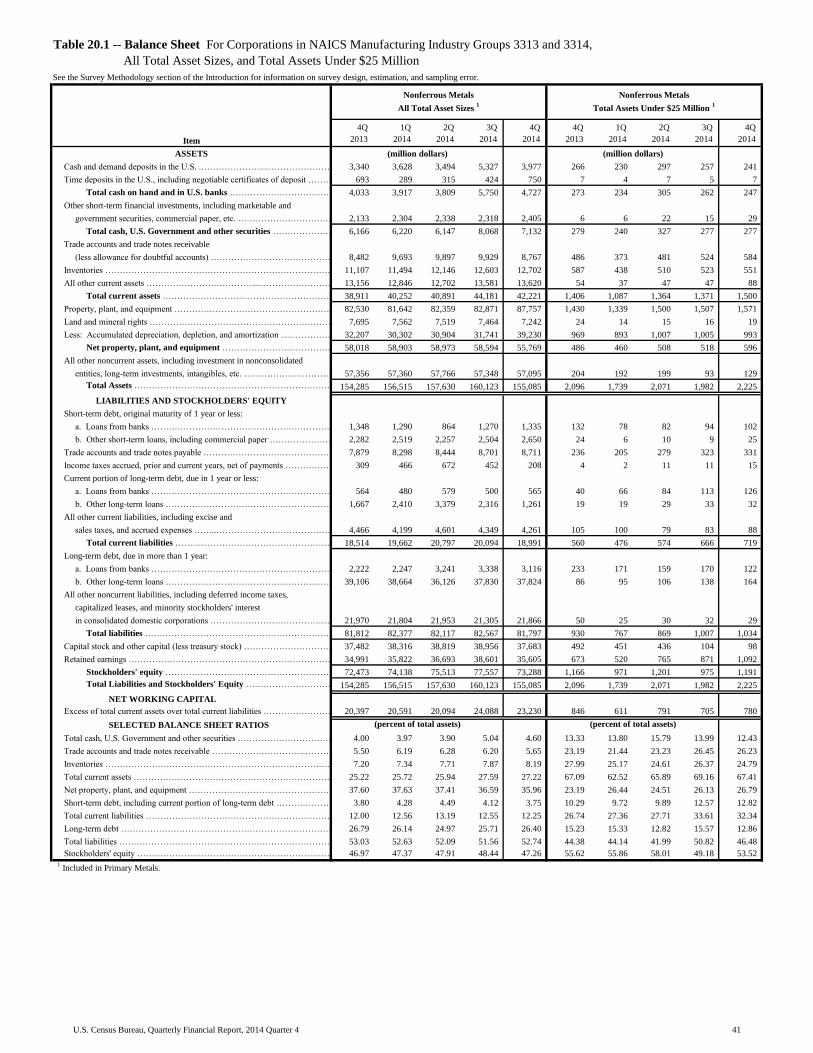
Table with row headers in column A with column headers in rows 5 and 6
Item
4Q_
2013_
1Q_
2014_
2Q_
2014_
3Q_
2014_
4Q_
2014_
4Q_
2013_
1Q_
2014_
2Q_
2014_
3Q_
2014_
4Q_
2014_
ASSETS
Cash and demand deposits in the U.S. .………………………………………………………………………………………………………………………………………………………………………………………………………………………………3,340 3,628 3,494 5,327 3,977 266 230 297 257 241
Time deposits in the U.S., including negotiable certificates of deposit ……………………………………………………………………………………………………………………………………………………………………………………693 289 315 424 750 7 4 7 5 7
Total cash on hand and in U.S. banks ……………………………………………………………………………………………………………………………………………………………………………………4,033 3,917 3,809 5,750 4,727 273 234 305 262 247
Other short-term financial investments, including marketable and
government securities, commercial paper, etc. ………………………………………………………………………………………………………………………………………………………………………………………………………………………………2,133 2,304 2,338 2,318 2,405 6 6 22 15 29
Total cash, U.S. Government and other securities ……………………………………………………………………………………………………………………………………………………………………………………6,166 6,220 6,147 8,068 7,132 279 240 327 277 277
Trade accounts and trade notes receivable
(less allowance for doubtful accounts) …………………………………………………………………………………………………………………………………………8,482 9,693 9,897 9,929 8,767 486 373 481 524 584
Inventories ………………………………………………………………………………………………………………………………………………………………………………………………………………………………11,107 11,494 12,146 12,603 12,702 587 438 510 523 551
All other current assets ………………………………………………………………………………………………………………………………………………………………………………………………………………………………13,156 12,846 12,702 13,581 13,620 54 37 47 47 88
Total current assets ………………………………………………………………………………………………………………………………………………………………………………………………………………………………38,911 40,252 40,891 44,181 42,221 1,406 1,087 1,364 1,371 1,500
Property, plant, and equipment ………………………………………………………………………………………………………………………………………………………………………………………………………………………………82,530 81,642 82,359 82,871 87,757 1,430 1,339 1,500 1,507 1,571
Land and mineral rights ………………………………………………………………………………………………………………………………………………………………………………………………………………………………7,695 7,562 7,519 7,464 7,242 24 14 15 16 19
Less: Accumulated depreciation, depletion, and amortization ……………………………………………………………………………………………………………………………………………………………………………………32,207 30,302 30,904 31,741 39,230 969 893 1,007 1,005 993
Net property, plant, and equipment ……………………………………………………………………………………………………………………………………………………………………………………58,018 58,903 58,973 58,594 55,769 486 460 508 518 596
All other noncurrent assets, including investment in nonconsolidated
entities, long-term investments, intangibles, etc. ………………………………………………………………………………………………………………………………………………………………………………………………………………57,356 57,360 57,766 57,348 57,095 204 192 199 93 129
Total Assets …………………………………………………………………………………………………………………………………………………………………………………………………………………………154,285 156,515 157,630 160,123 155,085 2,096 1,739 2,071 1,982 2,225
LIABILITIES AND STOCKHOLDERS' EQUITY
Short-term debt, original maturity of 1 year or less:
a. Loans from banks ………………………………………………………………………………………………………………………………………………………………………………………………………………………1,348 1,290 864 1,270 1,335 132 78 82 94 102
b. Other short-term loans, including commercial paper ………………………………………………………………………………………………………………………………………………………………………………………2,282 2,519 2,257 2,504 2,650 24 6 10 9 25
Trade accounts and trade notes payable ……………………………………………………………………………………………………………………………………………………………………………………………………………7,879 8,298 8,444 8,701 8,711 236 205 279 323 331
Income taxes accrued, prior and current years, net of payments ………………………………………………………………………………………………………………………………………………………………………………309 466 672 452 208 4 2 11 11 15
Current portion of long-term debt, due in 1 year or less:
a. Loans from banks …………………………………………………………………………………………………………………………………………………………………………………………………………………………………564 480 579 500 565 40 66 84 113 126
b. Other long-term loans ……………………………………………………………………………………………………………………………………………………………………………………………………………………1,667 2,410 3,379 2,316 1,261 19 19 29 33 32
All other current liabilities, including excise and
sales taxes, and accrued expenses ……..……………………………………………………………………………………………………………………………………………………4,466 4,199 4,601 4,349 4,261 105 100 79 83 88
Total current liabilities ……………………………………………………………………………………………………………………………………………………………………………………………………………………18,514 19,662 20,797 20,094 18,991 560 476 574 666 719
Long-term debt, due in more than 1 year:
a. Loans from banks …………………………………………………………………………………………………………………………………………………………………………………………………………………………2,222 2,247 3,241 3,338 3,116 233 171 159 170 122
b. Other long-term loans ……………………………………………………………………………………………………………………………………………………………………………………………………………………39,106 38,664 36,126 37,830 37,824 86 95 106 138 164
All other noncurrent liabilities, including deferred income taxes,
capitalized leases, and minority stockholders' interest
in consolidated domestic corporations ……………………………………………………………………………………………………………………………………………………………………21,970 21,804 21,953 21,305 21,866 50 25 30 32 29
Total liabilities ……………………………………………………………………………………………………………………………………………………………………………………………………………………………81,812 82,377 82,117 82,567 81,797 930 767 869 1,007 1,034
Capital stock and other capital (less treasury stock) …………………………………………………………………………………………………………………………………………………………………………………………37,482 38,316 38,819 38,956 37,683 492 451 436 104 98
Retained earnings …………………………………………………………………………………………………………………………………………………………………………………………………………………………………34,991 35,822 36,693 38,601 35,605 673 520 765 871 1,092
Stockholders' equity ……………………………………………………………………………………………………………………………………………………………………………………………………………………72,473 74,138 75,513 77,557 73,288 1,166 971 1,201 975 1,191
Total Liabilities and Stockholders' Equity ………………………………………………………………………………………………………………………………………………………………………………………………154,285 156,515 157,630 160,123 155,085 2,096 1,739 2,071 1,982 2,225
NET WORKING CAPITAL
Excess of total current assets over total current liabilities ………………………………………………………………………………………………………………………………………………………………………………………20,397 20,591 20,094 24,088 23,230 846 611 791 705 780
SELECTED BALANCE SHEET RATIOS
Total cash, U.S. Government and other securities …………………………………………………………………………………………………………………………………………………………………………………………………4.00 3.97 3.90 5.04 4.60 13.33 13.80 15.79 13.99 12.43
Trade accounts and trade notes receivable ……………………………………………………………………………………………………………………………………………………………………………………………………5.50 6.19 6.28 6.20 5.65 23.19 21.44 23.23 26.45 26.23
Inventories ……………………………………………………………………………………………………………………………………………………………………………………………………………………………………7.20 7.34 7.71 7.87 8.19 27.99 25.17 24.61 26.37 24.79
Total current assets …………………………………………………………………………………………………………………………………………………………………………………………………………………………25.22 25.72 25.94 27.59 27.22 67.09 62.52 65.89 69.16 67.41
Net property, plant, and equipment ……………………………………………………………………………………………………………………………………………………………………………………………………………37.60 37.63 37.41 36.59 35.96 23.19 26.44 24.51 26.13 26.79
Short-term debt, including current portion of long-term debt ………………………………………………………………………………………………………………………………………………………………………………………3.80 4.28 4.49 4.12 3.75 10.29 9.72 9.89 12.57 12.82
Total current liabilities …………………………………………………………………………………………………………………………………………………………………………………………………………………………………12.00 12.56 13.19 12.55 12.25 26.74 27.36 27.71 33.61 32.34
Long-term debt …………………………………………………………………………………………………………………………………………………………………………………………………………………………………26.79 26.14 24.97 25.71 26.40 15.23 15.33 12.82 15.57 12.86
Total liabilities …………………………………………………………………………………………………………………………………………………………………………………………………………………………………53.03 52.63 52.09 51.56 52.74 44.38 44.14 41.99 50.82 46.48
Stockholders' equity ………………………………………………………………………………………………………………………………………………………………………………………………………………………………46.97 47.37 47.91 48.44 47.26 55.62 55.86 58.01 49.18 53.52
1 Included in Primary Metals.
Table 20.1 -- Balance Sheet For Corporations in NAICS Manufacturing Industry Groups 3313 and 3314,
All Total Asset Sizes, and Total Assets Under $25 Million
See the Survey Methodology section of the Introduction for information on survey design, estimation, and sampling error.
(million dollars)
(percent of total assets)
(million dollars)
(percent of total assets)
Nonferrous Metals
All Total Asset Sizes 1
Nonferrous Metals
Total Assets Under $25 Million 1
41U.S. Census Bureau, Quarterly Financial Report, 2014 Quarter 4

Table with row headers in column A with column headers in rows 5 and 6
Item
4Q_
2013_
1Q_
2014_
2Q_
2014_
3Q_
2014_
4Q_
2014_
4Q_
2013_
1Q_
2014_
2Q_
2014_
3Q_
2014_
4Q_
2014_
Net sales, receipts, and operating revenues ………………………………………………………………………………………………………………………………………………………………………5,886 6,663 7,003 7,030 7,125 979 1,040 1,191 1,295 1,124
Depreciation, depletion, and amortization of property,
plant, and equipment …………………………………………………………………………………………………………………………………………………………………………………………158 164 162 179 199 22 27 27 30 31
All other operating costs and expenses …………………………………………………………………………………………………………...……………………………………………………………4,974 5,595 5,771 5,860 6,043 927 934 1,040 1,157 1,045
Income (loss) from operations …………………………………………………………………………………………………………...……………………………………………………………754 904 1,071 992 883 29 79 124 108 48
Interest expense …………………………………………………………………………………………………………………………………………………………………………………………………………………………………………49 49 48 56 59 4 7 8 10 9
All other nonoperating income (expense) ……………………………………………………………………………………………………………………………………………………………………………………………………103 102 90 86 62 (2) 2 4 4 6
Income (loss) before income taxes ………………………………………………………………………………………………………………………………………………………………………………………………808 958 1,113 1,022 887 23 73 120 102 44
Provision for current and deferred domestic income taxes …………………………………………………………………………………………………………………………………………………………………………………………206 243 273 250 245 4 5 8 7 9
Income (loss) after income taxes …………………………………………………………………………………………………………………………………………………………………………………………………………602 715 840 772 642 19 68 112 95 35
Cash dividends charged to retained earnings this quarter ……………………………………………………………………………………………………………………………………………………………………………………53 71 95 90 51 40 30 63 58 41
Net income retained in business ……………………………………………………………………………………………………………………………………………………………………………………………………549 643 745 683 591 (21) 38 49 37 (6)
Retained earnings at beginning of quarter …………………………………………………………………………………………………………………………………………………………………………………………………………15,493 16,424 17,217 17,919 18,422 868 975 1,234 1,125 1,230
Other direct credits (charges) to retained earnings (net), including
stock and other non-cash dividends, etc. ……………………………………………………………………………………………………………………………………………………………………………………………………………………………(38) 39 104 (37) (33) (15) 37 72 (74) 2
Retained earnings at end of quarter ……………………………………………………………………………………………………………………………………………………………………………………………………16,003 17,106 18,066 18,565 18,979 833 1,049 1,356 1,089 1,226
INCOME STATEMENT IN RATIO FORMAT
Net sales, receipts, and operating revenues ……………………………………………………………………………………………………………………………………………………………………………………………………100.00 100.00 100.00 100.00 100.00 100.00 100.00 100.00 100.00 100.00
Depreciation, depletion, and amortization of property,
plant, and equipment ………………………………………………………………………………………………………………………………………………………………………2.69 2.46 2.31 2.54 2.79 2.27 2.61 2.25 2.33 2.73
All other operating costs and expenses ……………………………………………………………………………………………………………………………………………………………………………………………………84.50 83.96 82.40 83.35 84.81 94.74 89.83 87.32 89.32 93.03
Income (loss) from operations …………………………………………………………………………………………………………………………………………………………………………………………………12.81 13.57 15.29 14.11 12.40 2.99 7.56 10.43 8.35 4.24
Interest expense …………………………………………………………………………………………………………………………………………………………………………………………………………………………………0.84 0.73 0.69 0.79 0.82 0.45 0.69 0.70 0.76 0.82
All other nonoperating income (expense) ……………………………………………………………………………………………………………………………………………………………………………………………1.75 1.53 1.29 1.23 0.87 (0.22) 0.19 0.34 0.30 0.53
Income (loss) before income taxes ……………………………………………………………………………………………………………………………………………………………………………………………13.73 14.37 15.89 14.54 12.45 2.32 7.05 10.08 7.88 3.96
Provision for current and deferred domestic income taxes ……………………………………………………………………………………………………………………………………………………………………………………3.51 3.64 3.90 3.55 3.44 0.38 0.50 0.67 0.56 0.84
Income (loss) after income taxes ………………………………………………………………………………………………………………………………………………………………………………………………10.22 10.73 11.99 10.99 9.01 1.94 6.55 9.41 7.33 3.11
OPERATING RATIOS
(see explanatory notes)
Annual rate of profit on stockholders' equity at end of period:
Before income taxes ……………………………………………………………………………………………………………………………………………………………………………………………………………………19.87 22.81 25.62 23.22 20.28 8.75 29.10 36.14 30.95 13.66
After income taxes ………………………………………………………………………………………………………………………………………………………………………………………………………………14.80 17.02 19.33 17.54 14.67 7.30 27.03 33.75 28.76 10.75
Annual rate of profit on total assets:
Before income taxes ………………………………………………………………………………………………………………………………………………………………………………………………………………11.66 13.53 14.97 12.95 11.11 4.49 12.77 19.24 15.19 6.90
After income taxes …………………………………………………………………………………………………………………………………………………………………………………………………………………………8.68 10.10 11.30 9.78 8.04 3.75 11.86 17.97 14.12 5.43
BALANCE SHEET RATIOS
(based on succeeding table)
Total current assets to total current liabilities …………………………………………………………………………………………………………………………………………………………………………………………………2.46 2.51 2.43 2.30 2.06 2.57 2.14 2.43 2.19 2.45
Total cash, U.S. Government and other securities, to total current liabilities …………………………………………………………………………………………………………………………………………………………………0.37 0.40 0.38 0.40 0.33 0.71 0.53 0.74 0.69 0.79
Total stockholders' equity to total debt ………………………………………………………………………………………………………………………………………………………………………………………………………2.72 2.55 2.53 2.24 2.15 1.88 1.17 1.83 1.67 1.66
Table 21.0 -- Income Statement For Corporations in NAICS Manufacturing Industry Group 3315,
All Total Asset Sizes, and Total Assets Under $25 Million
See the Survey Methodology section of the Introduction for information on survey design, estimation, and sampling error.
Foundries
All Total Asset Sizes 1
Foundries
Total Assets Under $25 Million 1
(million dollars) (million dollars)
(percent of net sales) (percent of net sales)
(percent) (percent)
1 Included in Primary Metals.
42U.S. Census Bureau, Quarterly Financial Report, 2014 Quarter 4

Table with row headers in column A with column headers in rows 5 and 6
Item
4Q_
2013_
1Q_
2014_
2Q_
2014_
3Q_
2014_
4Q_
2014_
4Q_
2013_
1Q_
2014_
2Q_
2014_
3Q_
2014_
4Q_
2014_
ASSETS
Cash and demand deposits in the U.S. .………………………………………………………………………………………………………………………………………………………………………………………………………………………………828 1,114 1,046 1,319 1,131 293 299 344 402 366
Time deposits in the U.S., including negotiable certificates of deposit ……………………………………………………………………………………………………………………………………………………………………………………51 68 67 67 78 45 63 51 51 62
Total cash on hand and in U.S. banks ……………………………………………………………………………………………………………………………………………………………………………………879 1,183 1,113 1,386 1,209 338 362 394 453 429
Other short-term financial investments, including marketable and
government securities, commercial paper, etc. ………………………………………………………………………………………………………………………………………………………………………………………………………………………………578 497 631 636 609 38 10 130 140 113
Total cash, U.S. Government and other securities ……………………………………………………………………………………………………………………………………………………………………………………1,457 1,680 1,744 2,021 1,818 376 372 525 593 541
Trade accounts and trade notes receivable
(less allowance for doubtful accounts) …………………………………………………………………………………………………………………………………………3,089 3,612 3,977 4,123 3,884 470 595 643 711 585
Inventories ………………………………………………………………………………………………………………………………………………………………………………………………………………………………4,593 4,818 4,907 5,095 5,366 377 420 434 463 484
All other current assets ………………………………………………………………………………………………………………………………………………………………………………………………………………………………615 504 388 393 440 132 117 121 102 78
Total current assets ………………………………………………………………………………………………………………………………………………………………………………………………………………………………9,754 10,613 11,016 11,632 11,508 1,355 1,504 1,723 1,870 1,688
Property, plant, and equipment ………………………………………………………………………………………………………………………………………………………………………………………………………………………………10,734 11,226 11,951 12,851 13,739 1,949 2,161 2,413 2,819 2,974
Land and mineral rights ………………………………………………………………………………………………………………………………………………………………………………………………………………………………272 276 276 274 280 26 28 26 19 19
Less: Accumulated depreciation, depletion, and amortization ……………………………………………………………………………………………………………………………………………………………………………………6,360 6,698 7,107 7,786 8,166 1,476 1,592 1,771 2,119 2,244
Net property, plant, and equipment ……………………………………………………………………………………………………………………………………………………………………………………4,646 4,804 5,120 5,340 5,853 498 596 667 718 750
All other noncurrent assets, including investment in nonconsolidated
entities, long-term investments, intangibles, etc. ………………………………………………………………………………………………………………………………………………………………………………………………………………13,314 12,906 13,606 14,607 14,570 170 196 105 101 139
Total Assets …………………………………………………………………………………………………………………………………………………………………………………………………………………………27,714 28,323 29,742 31,579 31,932 2,023 2,297 2,495 2,688 2,577
LIABILITIES AND STOCKHOLDERS' EQUITY
Short-term debt, original maturity of 1 year or less:
a. Loans from banks ………………………………………………………………………………………………………………………………………………………………………………………………………………………208 201 236 531 386 65 62 73 81 67
b. Other short-term loans, including commercial paper ………………………………………………………………………………………………………………………………………………………………………………………67 31 30 30 70 4 1 0 28 38
Trade accounts and trade notes payable ……………………………………………………………………………………………………………………………………………………………………………………………………………2,198 2,340 2,286 2,484 2,533 248 294 290 353 301
Income taxes accrued, prior and current years, net of payments ………………………………………………………………………………………………………………………………………………………………………………(36) (6) 160 (11) 11 5 17 21 17 4
Current portion of long-term debt, due in 1 year or less:
a. Loans from banks …………………………………………………………………………………………………………………………………………………………………………………………………………………………………93 209 196 211 825 35 152 139 156 120
b. Other long-term loans ……………………………………………………………………………………………………………………………………………………………………………………………………………………21 78 215 204 174 15 71 71 69 33
All other current liabilities, including excise and
sales taxes, and accrued expenses ……..……………………………………………………………………………………………………………………………………………………1,409 1,378 1,415 1,606 1,590 155 105 115 150 126
Total current liabilities ……………………………………………………………………………………………………………………………………………………………………………………………………………………3,959 4,231 4,538 5,056 5,588 528 703 709 855 689
Long-term debt, due in more than 1 year:
a. Loans from banks …………………………………………………………………………………………………………………………………………………………………………………………………………………………5,080 5,439 5,458 6,134 5,904 274 388 254 212 229
b. Other long-term loans ……………………………………………………………………………………………………………………………………………………………………………………………………………………509 640 728 763 792 157 184 189 244 295
All other noncurrent liabilities, including deferred income taxes,
capitalized leases, and minority stockholders' interest
in consolidated domestic corporations ……………………………………………………………………………………………………………………………………………………………………1,901 1,216 1,638 2,015 2,151 26 14 15 57 63
Total liabilities ……………………………………………………………………………………………………………………………………………………………………………………………………………………………11,450 11,527 12,363 13,968 14,436 985 1,289 1,167 1,369 1,275
Capital stock and other capital (less treasury stock) …………………………………………………………………………………………………………………………………………………………………………………………261 (310) (687) (953) (1,484) 205 (41) (27) 231 76
Retained earnings …………………………………………………………………………………………………………………………………………………………………………………………………………………………………16,003 17,106 18,066 18,565 18,979 833 1,049 1,356 1,089 1,226
Stockholders' equity ……………………………………………………………………………………………………………………………………………………………………………………………………………………16,265 16,797 17,379 17,611 17,496 1,038 1,008 1,328 1,320 1,302
Total Liabilities and Stockholders' Equity ………………………………………………………………………………………………………………………………………………………………………………………………27,714 28,323 29,742 31,579 31,932 2,023 2,297 2,495 2,688 2,577
NET WORKING CAPITAL
Excess of total current assets over total current liabilities ………………………………………………………………………………………………………………………………………………………………………………………5,795 6,382 6,478 6,576 5,920 827 801 1,014 1,015 999
SELECTED BALANCE SHEET RATIOS
Total cash, U.S. Government and other securities …………………………………………………………………………………………………………………………………………………………………………………………………5.26 5.93 5.86 6.40 5.69 18.60 16.20 21.04 22.07 21.01
Trade accounts and trade notes receivable ……………………………………………………………………………………………………………………………………………………………………………………………………11.14 12.75 13.37 13.06 12.16 23.24 25.88 25.77 26.46 22.69
Inventories ……………………………………………………………………………………………………………………………………………………………………………………………………………………………………16.57 17.01 16.50 16.13 16.80 18.63 18.29 17.40 17.23 18.79
Total current assets …………………………………………………………………………………………………………………………………………………………………………………………………………………………35.20 37.47 37.04 36.83 36.04 66.97 65.48 69.06 69.55 65.51
Net property, plant, and equipment ……………………………………………………………………………………………………………………………………………………………………………………………………………16.77 16.96 17.22 16.91 18.33 24.63 25.97 26.75 26.70 29.09
Short-term debt, including current portion of long-term debt ………………………………………………………………………………………………………………………………………………………………………………………1.40 1.83 2.28 3.09 4.56 5.93 12.45 11.34 12.44 10.02
Total current liabilities …………………………………………………………………………………………………………………………………………………………………………………………………………………………………14.29 14.94 15.26 16.01 17.50 26.11 30.59 28.40 31.81 26.73
Long-term debt …………………………………………………………………………………………………………………………………………………………………………………………………………………………………20.17 21.47 20.80 21.84 20.97 21.29 24.92 17.76 16.97 20.32
Total liabilities …………………………………………………………………………………………………………………………………………………………………………………………………………………………………41.31 40.70 41.57 44.23 45.21 48.70 56.11 46.76 50.91 49.48
Stockholders' equity ………………………………………………………………………………………………………………………………………………………………………………………………………………………………58.69 59.30 58.43 55.77 54.79 51.30 43.89 53.24 49.09 50.52
1 Included in Primary Metals.
Table 21.1 -- Balance Sheet For Corporations in NAICS Manufacturing Industry Group 3315,
All Total Asset Sizes, and Total Assets Under $25 Million
See the Survey Methodology section of the Introduction for information on survey design, estimation, and sampling error.
(million dollars)
(percent of total assets)
(million dollars)
(percent of total assets)
Foundries
All Total Asset Sizes 1
Foundries
Total Assets Under $25 Million 1
43U.S. Census Bureau, Quarterly Financial Report, 2014 Quarter 4
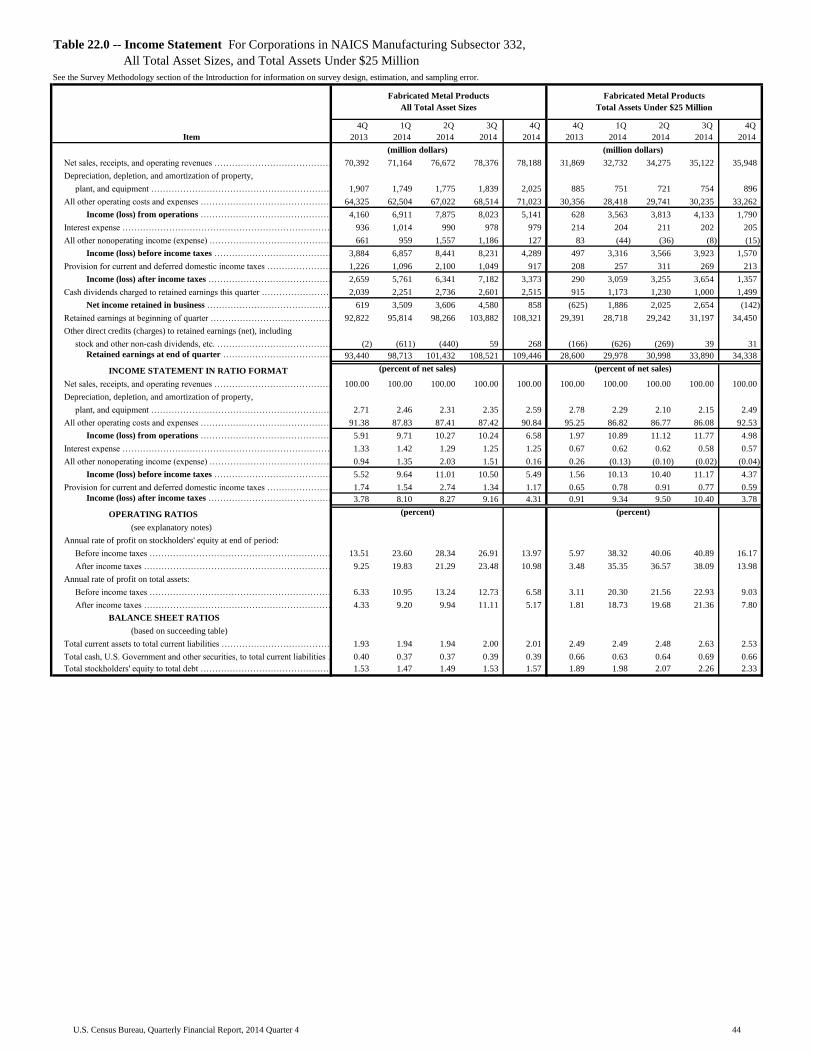
Table with row headers in column A with column headers in rows 5 and 6
Item
4Q_
2013_
1Q_
2014_
2Q_
2014_
3Q_
2014_
4Q_
2014_
4Q_
2013_
1Q_
2014_
2Q_
2014_
3Q_
2014_
4Q_
2014_
Net sales, receipts, and operating revenues ………………………………………………………………………………………………………………………………………………………………………70,392 71,164 76,672 78,376 78,188 31,869 32,732 34,275 35,122 35,948
Depreciation, depletion, and amortization of property,
plant, and equipment …………………………………………………………………………………………………………………………………………………………………………………………1,907 1,749 1,775 1,839 2,025 885 751 721 754 896
All other operating costs and expenses …………………………………………………………………………………………………………...……………………………………………………………64,325 62,504 67,022 68,514 71,023 30,356 28,418 29,741 30,235 33,262
Income (loss) from operations …………………………………………………………………………………………………………...……………………………………………………………4,160 6,911 7,875 8,023 5,141 628 3,563 3,813 4,133 1,790
Interest expense …………………………………………………………………………………………………………………………………………………………………………………………………………………………………………936 1,014 990 978 979 214 204 211 202 205
All other nonoperating income (expense) ……………………………………………………………………………………………………………………………………………………………………………………………………661 959 1,557 1,186 127 83 (44) (36) (8) (15)
Income (loss) before income taxes ………………………………………………………………………………………………………………………………………………………………………………………………3,884 6,857 8,441 8,231 4,289 497 3,316 3,566 3,923 1,570
Provision for current and deferred domestic income taxes …………………………………………………………………………………………………………………………………………………………………………………………1,226 1,096 2,100 1,049 917 208 257 311 269 213
Income (loss) after income taxes …………………………………………………………………………………………………………………………………………………………………………………………………………2,659 5,761 6,341 7,182 3,373 290 3,059 3,255 3,654 1,357
Cash dividends charged to retained earnings this quarter ……………………………………………………………………………………………………………………………………………………………………………………2,039 2,251 2,736 2,601 2,515 915 1,173 1,230 1,000 1,499
Net income retained in business ……………………………………………………………………………………………………………………………………………………………………………………………………619 3,509 3,606 4,580 858 (625) 1,886 2,025 2,654 (142)
Retained earnings at beginning of quarter …………………………………………………………………………………………………………………………………………………………………………………………………………92,822 95,814 98,266 103,882 108,321 29,391 28,718 29,242 31,197 34,450
Other direct credits (charges) to retained earnings (net), including
stock and other non-cash dividends, etc. ……………………………………………………………………………………………………………………………………………………………………………………………………………………………(2) (611) (440) 59 268 (166) (626) (269) 39 31
Retained earnings at end of quarter ……………………………………………………………………………………………………………………………………………………………………………………………………93,440 98,713 101,432 108,521 109,446 28,600 29,978 30,998 33,890 34,338
INCOME STATEMENT IN RATIO FORMAT
Net sales, receipts, and operating revenues ……………………………………………………………………………………………………………………………………………………………………………………………………100.00 100.00 100.00 100.00 100.00 100.00 100.00 100.00 100.00 100.00
Depreciation, depletion, and amortization of property,
plant, and equipment ………………………………………………………………………………………………………………………………………………………………………2.71 2.46 2.31 2.35 2.59 2.78 2.29 2.10 2.15 2.49
All other operating costs and expenses ……………………………………………………………………………………………………………………………………………………………………………………………………91.38 87.83 87.41 87.42 90.84 95.25 86.82 86.77 86.08 92.53
Income (loss) from operations …………………………………………………………………………………………………………………………………………………………………………………………………5.91 9.71 10.27 10.24 6.58 1.97 10.89 11.12 11.77 4.98
Interest expense …………………………………………………………………………………………………………………………………………………………………………………………………………………………………1.33 1.42 1.29 1.25 1.25 0.67 0.62 0.62 0.58 0.57
All other nonoperating income (expense) ……………………………………………………………………………………………………………………………………………………………………………………………0.94 1.35 2.03 1.51 0.16 0.26 (0.13) (0.10) (0.02) (0.04)
Income (loss) before income taxes ……………………………………………………………………………………………………………………………………………………………………………………………5.52 9.64 11.01 10.50 5.49 1.56 10.13 10.40 11.17 4.37
Provision for current and deferred domestic income taxes ……………………………………………………………………………………………………………………………………………………………………………………1.74 1.54 2.74 1.34 1.17 0.65 0.78 0.91 0.77 0.59
Income (loss) after income taxes ………………………………………………………………………………………………………………………………………………………………………………………………3.78 8.10 8.27 9.16 4.31 0.91 9.34 9.50 10.40 3.78
OPERATING RATIOS
(see explanatory notes)
Annual rate of profit on stockholders' equity at end of period:
Before income taxes ……………………………………………………………………………………………………………………………………………………………………………………………………………………13.51 23.60 28.34 26.91 13.97 5.97 38.32 40.06 40.89 16.17
After income taxes ………………………………………………………………………………………………………………………………………………………………………………………………………………9.25 19.83 21.29 23.48 10.98 3.48 35.35 36.57 38.09 13.98
Annual rate of profit on total assets:
Before income taxes ………………………………………………………………………………………………………………………………………………………………………………………………………………6.33 10.95 13.24 12.73 6.58 3.11 20.30 21.56 22.93 9.03
After income taxes …………………………………………………………………………………………………………………………………………………………………………………………………………………………4.33 9.20 9.94 11.11 5.17 1.81 18.73 19.68 21.36 7.80
BALANCE SHEET RATIOS
(based on succeeding table)
Total current assets to total current liabilities …………………………………………………………………………………………………………………………………………………………………………………………………1.93 1.94 1.94 2.00 2.01 2.49 2.49 2.48 2.63 2.53
Total cash, U.S. Government and other securities, to total current liabilities …………………………………………………………………………………………………………………………………………………………………0.40 0.37 0.37 0.39 0.39 0.66 0.63 0.64 0.69 0.66
Total stockholders' equity to total debt ………………………………………………………………………………………………………………………………………………………………………………………………………1.53 1.47 1.49 1.53 1.57 1.89 1.98 2.07 2.26 2.33
(percent of net sales) (percent of net sales)
(percent) (percent)
Table 22.0 -- Income Statement For Corporations in NAICS Manufacturing Subsector 332,
All Total Asset Sizes, and Total Assets Under $25 Million
See the Survey Methodology section of the Introduction for information on survey design, estimation, and sampling error.
Fabricated Metal Products
All Total Asset Sizes
Fabricated Metal Products
Total Assets Under $25 Million
(million dollars) (million dollars)
44U.S. Census Bureau, Quarterly Financial Report, 2014 Quarter 4

Table with row headers in column A with column headers in rows 5 and 6
Item
4Q_
2013_
1Q_
2014_
2Q_
2014_
3Q_
2014_
4Q_
2014_
4Q_
2013_
1Q_
2014_
2Q_
2014_
3Q_
2014_
4Q_
2014_
ASSETS
Cash and demand deposits in the U.S. .………………………………………………………………………………………………………………………………………………………………………………………………………………………………17,859 16,927 17,269 18,132 18,420 9,462 9,592 9,941 10,761 10,697
Time deposits in the U.S., including negotiable certificates of deposit ……………………………………………………………………………………………………………………………………………………………………………………1,248 933 883 894 918 903 721 732 720 769
Total cash on hand and in U.S. banks ……………………………………………………………………………………………………………………………………………………………………………………19,107 17,859 18,153 19,025 19,338 10,365 10,313 10,673 11,481 11,466
Other short-term financial investments, including marketable and
government securities, commercial paper, etc. ………………………………………………………………………………………………………………………………………………………………………………………………………………………………2,314 2,114 2,286 2,610 2,492 894 980 963 984 978
Total cash, U.S. Government and other securities ……………………………………………………………………………………………………………………………………………………………………………………21,422 19,974 20,439 21,635 21,830 11,259 11,293 11,636 12,465 12,444
Trade accounts and trade notes receivable
(less allowance for doubtful accounts) …………………………………………………………………………………………………………………………………………35,365 38,317 39,899 41,133 40,774 15,154 16,329 16,971 17,595 17,309
Inventories ………………………………………………………………………………………………………………………………………………………………………………………………………………………………34,361 36,451 36,742 37,954 38,433 13,735 14,512 14,266 14,719 15,352
All other current assets ………………………………………………………………………………………………………………………………………………………………………………………………………………………………10,937 10,365 10,805 10,997 10,966 2,339 2,194 2,271 2,488 2,559
Total current assets ………………………………………………………………………………………………………………………………………………………………………………………………………………………………102,085 105,107 107,885 111,718 112,004 42,486 44,328 45,144 47,267 47,664
Property, plant, and equipment ………………………………………………………………………………………………………………………………………………………………………………………………………………………………135,722 135,936 138,254 140,441 141,302 64,412 63,757 63,958 65,265 66,390
Land and mineral rights ………………………………………………………………………………………………………………………………………………………………………………………………………………………………2,659 2,583 2,535 2,564 2,501 817 773 723 712 684
Less: Accumulated depreciation, depletion, and amortization ……………………………………………………………………………………………………………………………………………………………………………………91,415 91,811 93,622 95,219 96,082 47,378 47,300 47,452 48,634 49,418
Net property, plant, and equipment ……………………………………………………………………………………………………………………………………………………………………………………46,967 46,708 47,167 47,785 47,720 17,852 17,229 17,229 17,343 17,657
All other noncurrent assets, including investment in nonconsolidated
entities, long-term investments, intangibles, etc. ………………………………………………………………………………………………………………………………………………………………………………………………………………96,425 98,566 100,032 99,175 101,092 3,560 3,765 3,790 3,808 4,236
Total Assets …………………………………………………………………………………………………………………………………………………………………………………………………………………………245,477 250,380 255,083 258,679 260,817 63,898 65,322 66,163 68,418 69,557
LIABILITIES AND STOCKHOLDERS' EQUITY
Short-term debt, original maturity of 1 year or less:
a. Loans from banks ………………………………………………………………………………………………………………………………………………………………………………………………………………………5,229 5,869 6,389 6,260 5,948 2,796 2,978 3,060 2,907 2,954
b. Other short-term loans, including commercial paper ………………………………………………………………………………………………………………………………………………………………………………………3,950 4,048 4,193 4,130 3,901 409 419 522 536 541
Trade accounts and trade notes payable ……………………………………………………………………………………………………………………………………………………………………………………………………………19,661 20,272 20,279 20,594 21,574 7,301 7,505 7,443 7,465 7,679
Income taxes accrued, prior and current years, net of payments ………………………………………………………………………………………………………………………………………………………………………………1,316 1,281 1,342 1,229 1,103 259 285 283 243 221
Current portion of long-term debt, due in 1 year or less:
a. Loans from banks …………………………………………………………………………………………………………………………………………………………………………………………………………………………………4,097 4,436 4,333 4,823 3,392 1,690 1,749 1,734 1,890 1,717
b. Other long-term loans ……………………………………………………………………………………………………………………………………………………………………………………………………………………2,754 2,298 2,305 2,249 2,240 612 706 812 837 911
All other current liabilities, including excise and
sales taxes, and accrued expenses ……..……………………………………………………………………………………………………………………………………………………15,957 16,078 16,796 16,596 17,625 4,028 4,177 4,331 4,085 4,789
Total current liabilities ……………………………………………………………………………………………………………………………………………………………………………………………………………………52,966 54,283 55,638 55,880 55,783 17,095 17,819 18,185 17,964 18,811
Long-term debt, due in more than 1 year:
a. Loans from banks …………………………………………………………………………………………………………………………………………………………………………………………………………………………24,673 25,952 25,367 25,358 26,126 7,281 7,028 6,764 6,782 6,902
b. Other long-term loans ……………………………………………………………………………………………………………………………………………………………………………………………………………………34,352 36,452 37,125 37,311 36,604 4,844 4,624 4,291 4,029 3,658
All other noncurrent liabilities, including deferred income taxes,
capitalized leases, and minority stockholders' interest
in consolidated domestic corporations ……………………………………………………………………………………………………………………………………………………………………18,482 17,471 17,813 17,788 19,458 1,340 1,240 1,321 1,272 1,356
Total liabilities ……………………………………………………………………………………………………………………………………………………………………………………………………………………………130,474 134,158 135,943 136,337 137,971 30,560 30,711 30,562 30,047 30,728
Capital stock and other capital (less treasury stock) …………………………………………………………………………………………………………………………………………………………………………………………21,563 17,509 17,709 13,821 13,399 4,738 4,633 4,603 4,482 4,490
Retained earnings …………………………………………………………………………………………………………………………………………………………………………………………………………………………………93,440 98,713 101,432 108,521 109,446 28,600 29,978 30,998 33,890 34,338
Stockholders' equity ……………………………………………………………………………………………………………………………………………………………………………………………………………………115,003 116,222 119,141 122,342 122,845 33,338 34,612 35,601 38,372 38,828
Total Liabilities and Stockholders' Equity ………………………………………………………………………………………………………………………………………………………………………………………………245,477 250,380 255,083 258,679 260,817 63,898 65,322 66,163 68,418 69,557
NET WORKING CAPITAL
Excess of total current assets over total current liabilities ………………………………………………………………………………………………………………………………………………………………………………………49,119 50,824 52,247 55,838 56,221 25,392 26,508 26,959 29,303 28,853
SELECTED BALANCE SHEET RATIOS
Total cash, U.S. Government and other securities …………………………………………………………………………………………………………………………………………………………………………………………………8.73 7.98 8.01 8.36 8.37 17.62 17.29 17.59 18.22 17.89
Trade accounts and trade notes receivable ……………………………………………………………………………………………………………………………………………………………………………………………………14.41 15.30 15.64 15.90 15.63 23.72 25.00 25.65 25.72 24.89
Inventories ……………………………………………………………………………………………………………………………………………………………………………………………………………………………………14.00 14.56 14.40 14.67 14.74 21.50 22.22 21.56 21.51 22.07
Total current assets …………………………………………………………………………………………………………………………………………………………………………………………………………………………41.59 41.98 42.29 43.19 42.94 66.49 67.86 68.23 69.09 68.53
Net property, plant, and equipment ……………………………………………………………………………………………………………………………………………………………………………………………………………19.13 18.65 18.49 18.47 18.30 27.94 26.38 26.04 25.35 25.38
Short-term debt, including current portion of long-term debt ………………………………………………………………………………………………………………………………………………………………………………………6.53 6.65 6.75 6.75 5.94 8.62 8.96 9.26 9.02 8.80
Total current liabilities …………………………………………………………………………………………………………………………………………………………………………………………………………………………………21.58 21.68 21.81 21.60 21.39 26.75 27.28 27.49 26.26 27.04
Long-term debt …………………………………………………………………………………………………………………………………………………………………………………………………………………………………24.05 24.92 24.50 24.23 24.05 18.98 17.84 16.71 15.80 15.18
Total liabilities …………………………………………………………………………………………………………………………………………………………………………………………………………………………………53.15 53.58 53.29 52.70 52.90 47.83 47.01 46.19 43.92 44.18
Stockholders' equity ………………………………………………………………………………………………………………………………………………………………………………………………………………………………46.85 46.42 46.71 47.30 47.10 52.17 52.99 53.81 56.08 55.82
Table 22.1 -- Balance Sheet For Corporations in NAICS Manufacturing Subsector 332,
All Total Asset Sizes, and Total Assets Under $25 Million
See the Survey Methodology section of the Introduction for information on survey design, estimation, and sampling error.
(million dollars)
(percent of total assets)
(million dollars)
(percent of total assets)
Fabricated Metal Products
All Total Asset Sizes
Fabricated Metal Products
Total Assets Under $25 Million
45U.S. Census Bureau, Quarterly Financial Report, 2014 Quarter 4

Table with row headers in column A with column headers in rows 5 and 6
Item
4Q_
2013_
1Q_
2014_
2Q_
2014_
3Q_
2014_
4Q_
2014_
4Q_
2013_
1Q_
2014_
2Q_
2014_
3Q_
2014_
4Q_
2014_
Net sales, receipts, and operating revenues ………………………………………………………………………………………………………………………………………………………………………108,898 104,127 112,793 111,036 112,099 16,291 15,408 16,558 16,626 16,788
Depreciation, depletion, and amortization of property,
plant, and equipment …………………………………………………………………………………………………………………………………………………………………………………………2,791 2,678 2,647 2,688 2,781 357 296 302 308 338
All other operating costs and expenses …………………………………………………………………………………………………………...……………………………………………………………96,309 93,124 98,553 97,999 100,761 14,626 13,438 14,081 14,213 15,483
Income (loss) from operations …………………………………………………………………………………………………………...……………………………………………………………9,797 8,325 11,593 10,350 8,556 1,309 1,674 2,176 2,105 967
Interest expense …………………………………………………………………………………………………………………………………………………………………………………………………………………………………………1,525 1,470 1,505 1,454 1,501 103 98 95 98 102
All other nonoperating income (expense) ……………………………………………………………………………………………………………………………………………………………………………………………………4,760 3,911 4,071 3,694 3,650 (6) 2 3 27 21
Income (loss) before income taxes ………………………………………………………………………………………………………………………………………………………………………………………………13,032 10,765 14,158 12,590 10,706 1,199 1,577 2,084 2,034 886
Provision for current and deferred domestic income taxes …………………………………………………………………………………………………………………………………………………………………………………………1,990 2,137 2,756 2,727 2,155 228 137 136 200 188
Income (loss) after income taxes …………………………………………………………………………………………………………………………………………………………………………………………………………11,042 8,628 11,402 9,862 8,551 972 1,440 1,948 1,834 697
Cash dividends charged to retained earnings this quarter ……………………………………………………………………………………………………………………………………………………………………………………3,507 2,661 3,612 4,600 3,745 598 688 629 654 653
Net income retained in business ……………………………………………………………………………………………………………………………………………………………………………………………………7,535 5,966 7,790 5,262 4,806 373 752 1,319 1,180 44
Retained earnings at beginning of quarter …………………………………………………………………………………………………………………………………………………………………………………………………………177,501 182,240 188,273 192,870 197,834 10,874 11,419 12,639 12,857 13,691
Other direct credits (charges) to retained earnings (net), including
stock and other non-cash dividends, etc. ……………………………………………………………………………………………………………………………………………………………………………………………………………………………440 (501) (2,902) 27 (53) 223 (354) (203) (107) (127)
Retained earnings at end of quarter ……………………………………………………………………………………………………………………………………………………………………………………………………185,476 187,706 193,162 198,160 202,587 11,470 11,816 13,756 13,929 13,608
INCOME STATEMENT IN RATIO FORMAT
Net sales, receipts, and operating revenues ……………………………………………………………………………………………………………………………………………………………………………………………………100.00 100.00 100.00 100.00 100.00 100.00 100.00 100.00 100.00 100.00
Depreciation, depletion, and amortization of property,
plant, and equipment ………………………………………………………………………………………………………………………………………………………………………2.56 2.57 2.35 2.42 2.48 2.19 1.92 1.82 1.85 2.01
All other operating costs and expenses ……………………………………………………………………………………………………………………………………………………………………………………………………88.44 89.43 87.38 88.26 89.89 89.78 87.21 85.04 85.49 92.23
Income (loss) from operations …………………………………………………………………………………………………………………………………………………………………………………………………9.00 7.99 10.28 9.32 7.63 8.03 10.86 13.14 12.66 5.76
Interest expense …………………………………………………………………………………………………………………………………………………………………………………………………………………………………1.40 1.41 1.33 1.31 1.34 0.63 0.64 0.57 0.59 0.61
All other nonoperating income (expense) ……………………………………………………………………………………………………………………………………………………………………………………………4.37 3.76 3.61 3.33 3.26 (0.04) 0.01 0.02 0.16 0.12
Income (loss) before income taxes ……………………………………………………………………………………………………………………………………………………………………………………………11.97 10.34 12.55 11.34 9.55 7.36 10.24 12.58 12.24 5.28
Provision for current and deferred domestic income taxes ……………………………………………………………………………………………………………………………………………………………………………………1.83 2.05 2.44 2.46 1.92 1.40 0.89 0.82 1.21 1.12
Income (loss) after income taxes ………………………………………………………………………………………………………………………………………………………………………………………………10.14 8.29 10.11 8.88 7.63 5.96 9.35 11.76 11.03 4.15
OPERATING RATIOS
(see explanatory notes)
Annual rate of profit on stockholders' equity at end of period:
Before income taxes ……………………………………………………………………………………………………………………………………………………………………………………………………………………21.83 18.15 23.54 21.36 18.94 28.29 37.01 44.38 42.49 18.72
After income taxes ………………………………………………………………………………………………………………………………………………………………………………………………………………18.49 14.55 18.96 16.74 15.13 22.92 33.79 41.49 38.31 14.74
Annual rate of profit on total assets:
Before income taxes ………………………………………………………………………………………………………………………………………………………………………………………………………………9.44 7.79 10.17 9.08 7.71 13.67 17.36 22.70 22.00 9.62
After income taxes …………………………………………………………………………………………………………………………………………………………………………………………………………………………8.00 6.24 8.19 7.12 6.16 11.08 15.85 21.22 19.83 7.57
BALANCE SHEET RATIOS
(based on succeeding table)
Total current assets to total current liabilities …………………………………………………………………………………………………………………………………………………………………………………………………1.49 1.51 1.55 1.51 1.50 2.23 2.22 2.37 2.44 2.34
Total cash, U.S. Government and other securities, to total current liabilities …………………………………………………………………………………………………………………………………………………………………0.29 0.26 0.28 0.25 0.26 0.55 0.53 0.62 0.60 0.55
Total stockholders' equity to total debt ………………………………………………………………………………………………………………………………………………………………………………………………………2.09 2.01 2.01 1.93 1.81 1.98 1.82 2.19 2.18 2.14
(percent of net sales) (percent of net sales)
(percent) (percent)
Table 23.0 -- Income Statement For Corporations in NAICS Manufacturing Subsector 333,
All Total Asset Sizes, and Total Assets Under $25 Million
See the Survey Methodology section of the Introduction for information on survey design, estimation, and sampling error.
Machinery
All Total Asset Sizes
Machinery
Total Assets Under $25 Million
(million dollars) (million dollars)
46U.S. Census Bureau, Quarterly Financial Report, 2014 Quarter 4
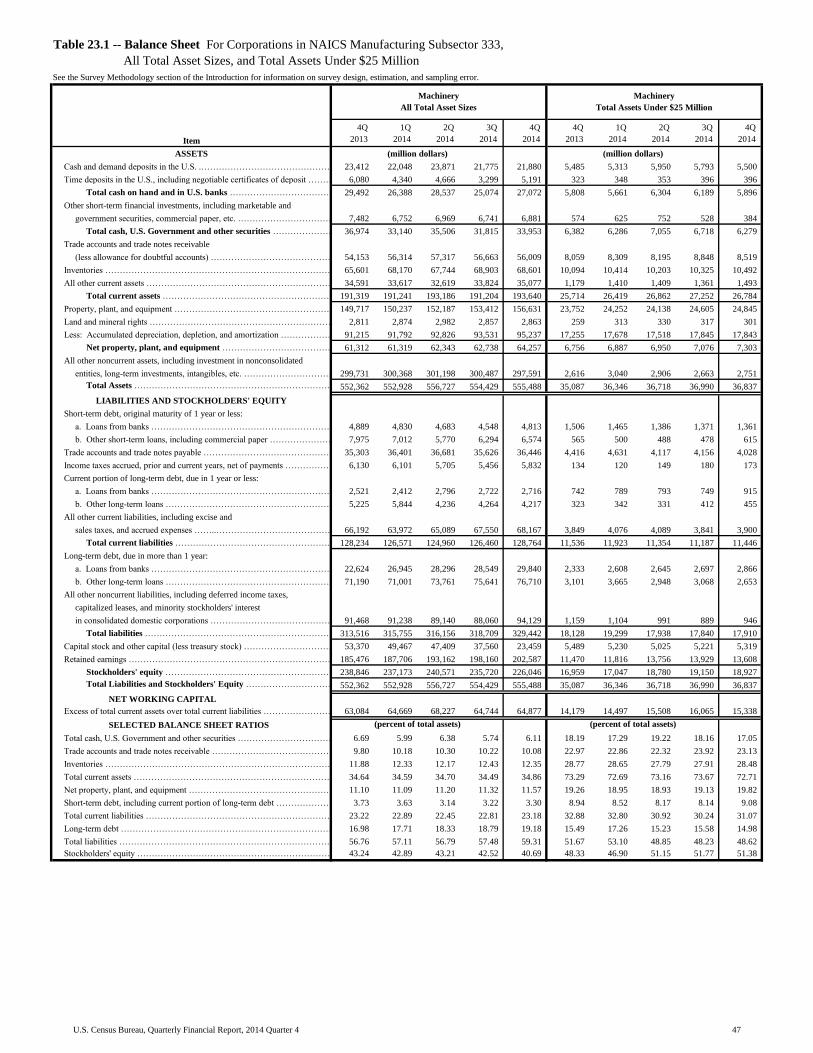
Table with row headers in column A with column headers in rows 5 and 6
Item
4Q_
2013_
1Q_
2014_
2Q_
2014_
3Q_
2014_
4Q_
2014_
4Q_
2013_
1Q_
2014_
2Q_
2014_
3Q_
2014_
4Q_
2014_
ASSETS
Cash and demand deposits in the U.S. .………………………………………………………………………………………………………………………………………………………………………………………………………………………………23,412 22,048 23,871 21,775 21,880 5,485 5,313 5,950 5,793 5,500
Time deposits in the U.S., including negotiable certificates of deposit ……………………………………………………………………………………………………………………………………………………………………………………6,080 4,340 4,666 3,299 5,191 323 348 353 396 396
Total cash on hand and in U.S. banks ……………………………………………………………………………………………………………………………………………………………………………………29,492 26,388 28,537 25,074 27,072 5,808 5,661 6,304 6,189 5,896
Other short-term financial investments, including marketable and
government securities, commercial paper, etc. ………………………………………………………………………………………………………………………………………………………………………………………………………………………………7,482 6,752 6,969 6,741 6,881 574 625 752 528 384
Total cash, U.S. Government and other securities ……………………………………………………………………………………………………………………………………………………………………………………36,974 33,140 35,506 31,815 33,953 6,382 6,286 7,055 6,718 6,279
Trade accounts and trade notes receivable
(less allowance for doubtful accounts) …………………………………………………………………………………………………………………………………………54,153 56,314 57,317 56,663 56,009 8,059 8,309 8,195 8,848 8,519
Inventories ………………………………………………………………………………………………………………………………………………………………………………………………………………………………65,601 68,170 67,744 68,903 68,601 10,094 10,414 10,203 10,325 10,492
All other current assets ………………………………………………………………………………………………………………………………………………………………………………………………………………………………34,591 33,617 32,619 33,824 35,077 1,179 1,410 1,409 1,361 1,493
Total current assets ………………………………………………………………………………………………………………………………………………………………………………………………………………………………191,319 191,241 193,186 191,204 193,640 25,714 26,419 26,862 27,252 26,784
Property, plant, and equipment ………………………………………………………………………………………………………………………………………………………………………………………………………………………………149,717 150,237 152,187 153,412 156,631 23,752 24,252 24,138 24,605 24,845
Land and mineral rights ………………………………………………………………………………………………………………………………………………………………………………………………………………………………2,811 2,874 2,982 2,857 2,863 259 313 330 317 301
Less: Accumulated depreciation, depletion, and amortization ……………………………………………………………………………………………………………………………………………………………………………………91,215 91,792 92,826 93,531 95,237 17,255 17,678 17,518 17,845 17,843
Net property, plant, and equipment ……………………………………………………………………………………………………………………………………………………………………………………61,312 61,319 62,343 62,738 64,257 6,756 6,887 6,950 7,076 7,303
All other noncurrent assets, including investment in nonconsolidated
entities, long-term investments, intangibles, etc. ………………………………………………………………………………………………………………………………………………………………………………………………………………299,731 300,368 301,198 300,487 297,591 2,616 3,040 2,906 2,663 2,751
Total Assets …………………………………………………………………………………………………………………………………………………………………………………………………………………………552,362 552,928 556,727 554,429 555,488 35,087 36,346 36,718 36,990 36,837
LIABILITIES AND STOCKHOLDERS' EQUITY
Short-term debt, original maturity of 1 year or less:
a. Loans from banks ………………………………………………………………………………………………………………………………………………………………………………………………………………………4,889 4,830 4,683 4,548 4,813 1,506 1,465 1,386 1,371 1,361
b. Other short-term loans, including commercial paper ………………………………………………………………………………………………………………………………………………………………………………………7,975 7,012 5,770 6,294 6,574 565 500 488 478 615
Trade accounts and trade notes payable ……………………………………………………………………………………………………………………………………………………………………………………………………………35,303 36,401 36,681 35,626 36,446 4,416 4,631 4,117 4,156 4,028
Income taxes accrued, prior and current years, net of payments ………………………………………………………………………………………………………………………………………………………………………………6,130 6,101 5,705 5,456 5,832 134 120 149 180 173
Current portion of long-term debt, due in 1 year or less:
a. Loans from banks …………………………………………………………………………………………………………………………………………………………………………………………………………………………………2,521 2,412 2,796 2,722 2,716 742 789 793 749 915
b. Other long-term loans ……………………………………………………………………………………………………………………………………………………………………………………………………………………5,225 5,844 4,236 4,264 4,217 323 342 331 412 455
All other current liabilities, including excise and
sales taxes, and accrued expenses ……..……………………………………………………………………………………………………………………………………………………66,192 63,972 65,089 67,550 68,167 3,849 4,076 4,089 3,841 3,900
Total current liabilities ……………………………………………………………………………………………………………………………………………………………………………………………………………………128,234 126,571 124,960 126,460 128,764 11,536 11,923 11,354 11,187 11,446
Long-term debt, due in more than 1 year:
a. Loans from banks …………………………………………………………………………………………………………………………………………………………………………………………………………………………22,624 26,945 28,296 28,549 29,840 2,333 2,608 2,645 2,697 2,866
b. Other long-term loans ……………………………………………………………………………………………………………………………………………………………………………………………………………………71,190 71,001 73,761 75,641 76,710 3,101 3,665 2,948 3,068 2,653
All other noncurrent liabilities, including deferred income taxes,
capitalized leases, and minority stockholders' interest
in consolidated domestic corporations ……………………………………………………………………………………………………………………………………………………………………91,468 91,238 89,140 88,060 94,129 1,159 1,104 991 889 946
Total liabilities ……………………………………………………………………………………………………………………………………………………………………………………………………………………………313,516 315,755 316,156 318,709 329,442 18,128 19,299 17,938 17,840 17,910
Capital stock and other capital (less treasury stock) …………………………………………………………………………………………………………………………………………………………………………………………53,370 49,467 47,409 37,560 23,459 5,489 5,230 5,025 5,221 5,319
Retained earnings …………………………………………………………………………………………………………………………………………………………………………………………………………………………………185,476 187,706 193,162 198,160 202,587 11,470 11,816 13,756 13,929 13,608
Stockholders' equity ……………………………………………………………………………………………………………………………………………………………………………………………………………………238,846 237,173 240,571 235,720 226,046 16,959 17,047 18,780 19,150 18,927
Total Liabilities and Stockholders' Equity ………………………………………………………………………………………………………………………………………………………………………………………………552,362 552,928 556,727 554,429 555,488 35,087 36,346 36,718 36,990 36,837
NET WORKING CAPITAL
Excess of total current assets over total current liabilities ………………………………………………………………………………………………………………………………………………………………………………………63,084 64,669 68,227 64,744 64,877 14,179 14,497 15,508 16,065 15,338
SELECTED BALANCE SHEET RATIOS
Total cash, U.S. Government and other securities …………………………………………………………………………………………………………………………………………………………………………………………………6.69 5.99 6.38 5.74 6.11 18.19 17.29 19.22 18.16 17.05
Trade accounts and trade notes receivable ……………………………………………………………………………………………………………………………………………………………………………………………………9.80 10.18 10.30 10.22 10.08 22.97 22.86 22.32 23.92 23.13
Inventories ……………………………………………………………………………………………………………………………………………………………………………………………………………………………………11.88 12.33 12.17 12.43 12.35 28.77 28.65 27.79 27.91 28.48
Total current assets …………………………………………………………………………………………………………………………………………………………………………………………………………………………34.64 34.59 34.70 34.49 34.86 73.29 72.69 73.16 73.67 72.71
Net property, plant, and equipment ……………………………………………………………………………………………………………………………………………………………………………………………………………11.10 11.09 11.20 11.32 11.57 19.26 18.95 18.93 19.13 19.82
Short-term debt, including current portion of long-term debt ………………………………………………………………………………………………………………………………………………………………………………………3.73 3.63 3.14 3.22 3.30 8.94 8.52 8.17 8.14 9.08
Total current liabilities …………………………………………………………………………………………………………………………………………………………………………………………………………………………………23.22 22.89 22.45 22.81 23.18 32.88 32.80 30.92 30.24 31.07
Long-term debt …………………………………………………………………………………………………………………………………………………………………………………………………………………………………16.98 17.71 18.33 18.79 19.18 15.49 17.26 15.23 15.58 14.98
Total liabilities …………………………………………………………………………………………………………………………………………………………………………………………………………………………………56.76 57.11 56.79 57.48 59.31 51.67 53.10 48.85 48.23 48.62
Stockholders' equity ………………………………………………………………………………………………………………………………………………………………………………………………………………………………43.24 42.89 43.21 42.52 40.69 48.33 46.90 51.15 51.77 51.38
Table 23.1 -- Balance Sheet For Corporations in NAICS Manufacturing Subsector 333,
All Total Asset Sizes, and Total Assets Under $25 Million
See the Survey Methodology section of the Introduction for information on survey design, estimation, and sampling error.
(million dollars)
(percent of total assets)
(million dollars)
(percent of total assets)
Machinery
All Total Asset Sizes
Machinery
Total Assets Under $25 Million
47U.S. Census Bureau, Quarterly Financial Report, 2014 Quarter 4

Table with row headers in column A with column headers in rows 5 and 6
Item
4Q_
2013_
1Q_
2014_
2Q_
2014_
3Q_
2014_
4Q_
2014_
4Q_
2013_
1Q_
2014_
2Q_
2014_
3Q_
2014_
4Q_
2014_
Net sales, receipts, and operating revenues ………………………………………………………………………………………………………………………………………………………………………161,686 145,004 150,792 155,668 168,306 8,305 7,547 8,464 9,074 10,249
Depreciation, depletion, and amortization of property,
plant, and equipment …………………………………………………………………………………………………………………………………………………………………………………………5,282 5,074 5,169 5,082 5,071 154 137 135 135 153
All other operating costs and expenses …………………………………………………………………………………………………………...……………………………………………………………138,994 125,111 128,525 131,915 141,963 8,080 7,362 7,854 8,096 9,564
Income (loss) from operations …………………………………………………………………………………………………………...……………………………………………………………17,410 14,818 17,098 18,671 21,272 71 47 475 843 532
Interest expense …………………………………………………………………………………………………………………………………………………………………………………………………………………………………………2,874 2,950 3,021 2,919 3,128 72 79 77 66 72
All other nonoperating income (expense) ……………………………………………………………………………………………………………………………………………………………………………………………………26,198 19,565 22,738 20,497 30,544 (11) 9 (10) (5) (62)
Income (loss) before income taxes ………………………………………………………………………………………………………………………………………………………………………………………………40,734 31,434 36,815 36,249 48,688 (12) (22) 388 772 398
Provision for current and deferred domestic income taxes …………………………………………………………………………………………………………………………………………………………………………………………8,490 5,871 6,206 7,099 9,549 99 78 86 125 150
Income (loss) after income taxes …………………………………………………………………………………………………………………………………………………………………………………………………………32,244 25,563 30,610 29,150 39,140 (110) (100) 302 647 248
Cash dividends charged to retained earnings this quarter ……………………………………………………………………………………………………………………………………………………………………………………8,363 9,938 8,390 10,991 10,707 373 309 311 209 322
Net income retained in business ……………………………………………………………………………………………………………………………………………………………………………………………………23,881 15,625 22,219 18,160 28,432 (483) (410) (9) 437 (74)
Retained earnings at beginning of quarter …………………………………………………………………………………………………………………………………………………………………………………………………………225,726 237,931 232,206 244,965 243,958 (1,873) (2,420) (623) 1,776 1,897
Other direct credits (charges) to retained earnings (net), including
stock and other non-cash dividends, etc. ……………………………………………………………………………………………………………………………………………………………………………………………………………………………(11,197) (24,051) (8,680) (24,342) (11,745) (132) (99) (207) (213) (68)
Retained earnings at end of quarter ……………………………………………………………………………………………………………………………………………………………………………………………………238,410 229,505 245,746 238,783 260,645 (2,487) (2,928) (838) 2,000 1,756
INCOME STATEMENT IN RATIO FORMAT
Net sales, receipts, and operating revenues ……………………………………………………………………………………………………………………………………………………………………………………………………100.00 100.00 100.00 100.00 100.00 100.00 100.00 100.00 100.00 100.00
Depreciation, depletion, and amortization of property,
plant, and equipment ………………………………………………………………………………………………………………………………………………………………………3.27 3.50 3.43 3.26 3.01 1.86 1.81 1.59 1.49 1.49
All other operating costs and expenses ……………………………………………………………………………………………………………………………………………………………………………………………………85.97 86.28 85.23 84.74 84.35 97.29 97.56 92.79 89.22 93.32
Income (loss) from operations …………………………………………………………………………………………………………………………………………………………………………………………………10.77 10.22 11.34 11.99 12.64 0.85 0.63 5.62 9.29 5.19
Interest expense …………………………………………………………………………………………………………………………………………………………………………………………………………………………………1.78 2.03 2.00 1.88 1.86 0.86 1.05 0.91 0.73 0.70
All other nonoperating income (expense) ……………………………………………………………………………………………………………………………………………………………………………………………16.20 13.49 15.08 13.17 18.15 (0.13) 0.13 (0.12) (0.06) (0.60)
Income (loss) before income taxes ……………………………………………………………………………………………………………………………………………………………………………………………25.19 21.68 24.41 23.29 28.93 (0.14) (0.29) 4.58 8.51 3.88
Provision for current and deferred domestic income taxes ……………………………………………………………………………………………………………………………………………………………………………………5.25 4.05 4.12 4.56 5.67 1.19 1.04 1.01 1.38 1.46
Income (loss) after income taxes ………………………………………………………………………………………………………………………………………………………………………………………………19.94 17.63 20.30 18.73 23.26 (1.33) (1.33) 3.57 7.13 2.42
OPERATING RATIOS
(see explanatory notes)
Annual rate of profit on stockholders' equity at end of period:
Before income taxes ……………………………………………………………………………………………………………………………………………………………………………………………………………………22.99 17.90 20.66 20.64 27.79 (0.52) (1.08) 19.10 32.55 15.88
After income taxes ………………………………………………………………………………………………………………………………………………………………………………………………………………18.20 14.56 17.17 16.60 22.34 (4.92) (4.90) 14.89 27.27 9.90
Annual rate of profit on total assets:
Before income taxes ………………………………………………………………………………………………………………………………………………………………………………………………………………12.72 9.82 11.27 11.04 14.67 (0.26) (0.49) 8.41 15.82 7.40
After income taxes …………………………………………………………………………………………………………………………………………………………………………………………………………………………10.07 7.99 9.37 8.88 11.79 (2.47) (2.24) 6.56 13.26 4.62
BALANCE SHEET RATIOS
(based on succeeding table)
Total current assets to total current liabilities …………………………………………………………………………………………………………………………………………………………………………………………………1.60 1.54 1.56 1.43 1.38 2.33 2.03 2.06 2.10 2.01
Total cash, U.S. Government and other securities, to total current liabilities …………………………………………………………………………………………………………………………………………………………………0.63 0.60 0.59 0.50 0.48 0.67 0.57 0.58 0.61 0.61
Total stockholders' equity to total debt ………………………………………………………………………………………………………………………………………………………………………………………………………2.90 2.74 2.63 2.56 2.54 2.08 1.62 1.46 1.83 1.69
(percent of net sales) (percent of net sales)
(percent) (percent)
Table 24.0 -- Income Statement For Corporations in NAICS Manufacturing Subsector 334,
All Total Asset Sizes, and Total Assets Under $25 Million
See the Survey Methodology section of the Introduction for information on survey design, estimation, and sampling error.
Computer and Electronic Products
All Total Asset Sizes
Computer and Electronic Products
Total Assets Under $25 Million
(million dollars) (million dollars)
48U.S. Census Bureau, Quarterly Financial Report, 2014 Quarter 4

Table with row headers in column A with column headers in rows 5 and 6
Item
4Q_
2013_
1Q_
2014_
2Q_
2014_
3Q_
2014_
4Q_
2014_
4Q_
2013_
1Q_
2014_
2Q_
2014_
3Q_
2014_
4Q_
2014_
ASSETS
Cash and demand deposits in the U.S. .………………………………………………………………………………………………………………………………………………………………………………………………………………………………52,416 52,847 52,743 53,230 53,466 3,523 3,296 3,382 3,773 4,358
Time deposits in the U.S., including negotiable certificates of deposit ……………………………………………………………………………………………………………………………………………………………………………………16,549 11,948 9,657 9,808 8,761 181 286 272 160 202
Total cash on hand and in U.S. banks ……………………………………………………………………………………………………………………………………………………………………………………68,964 64,795 62,400 63,038 62,227 3,704 3,581 3,654 3,933 4,559
Other short-term financial investments, including marketable and
government securities, commercial paper, etc. ………………………………………………………………………………………………………………………………………………………………………………………………………………………………63,375 57,264 57,712 45,617 45,097 318 295 408 501 611
Total cash, U.S. Government and other securities ……………………………………………………………………………………………………………………………………………………………………………………132,339 122,059 120,111 108,654 107,324 4,022 3,877 4,062 4,434 5,170
Trade accounts and trade notes receivable
(less allowance for doubtful accounts) …………………………………………………………………………………………………………………………………………74,462 71,232 75,024 79,674 78,439 4,178 4,080 4,455 4,616 5,167
Inventories ………………………………………………………………………………………………………………………………………………………………………………………………………………………………53,508 53,498 53,856 54,861 54,489 4,825 4,855 4,923 5,082 5,383
All other current assets ………………………………………………………………………………………………………………………………………………………………………………………………………………………………73,229 67,448 67,626 67,167 71,755 866 982 974 1,231 1,297
Total current assets ………………………………………………………………………………………………………………………………………………………………………………………………………………………………333,539 314,237 316,617 310,357 312,007 13,891 13,794 14,414 15,364 17,017
Property, plant, and equipment ………………………………………………………………………………………………………………………………………………………………………………………………………………………………264,735 267,522 270,638 271,993 271,321 8,543 8,786 9,365 9,690 10,226
Land and mineral rights ………………………………………………………………………………………………………………………………………………………………………………………………………………………………8,636 9,171 9,647 10,134 9,930 146 172 185 192 191
Less: Accumulated depreciation, depletion, and amortization ……………………………………………………………………………………………………………………………………………………………………………………166,610 167,751 169,857 171,688 171,727 6,240 6,401 6,851 7,166 7,436
Net property, plant, and equipment ……………………………………………………………………………………………………………………………………………………………………………………106,761 108,943 110,428 110,438 109,525 2,449 2,557 2,699 2,717 2,981
All other noncurrent assets, including investment in nonconsolidated
entities, long-term investments, intangibles, etc. ………………………………………………………………………………………………………………………………………………………………………………………………………………840,214 857,186 879,602 892,866 906,480 1,534 1,530 1,341 1,430 1,498
Total Assets …………………………………………………………………………………………………………………………………………………………………………………………………………………………1,280,515 1,280,366 1,306,647 1,313,662 1,328,011 17,874 17,881 18,454 19,511 21,496
LIABILITIES AND STOCKHOLDERS' EQUITY
Short-term debt, original maturity of 1 year or less:
a. Loans from banks ………………………………………………………………………………………………………………………………………………………………………………………………………………………2,406 6,336 5,813 4,935 3,418 615 685 653 614 724
b. Other short-term loans, including commercial paper ………………………………………………………………………………………………………………………………………………………………………………………6,114 6,288 8,026 12,266 10,421 1,002 1,447 1,174 1,337 1,509
Trade accounts and trade notes payable ……………………………………………………………………………………………………………………………………………………………………………………………………………60,963 54,366 56,210 62,251 66,425 1,950 2,048 2,319 2,548 2,681
Income taxes accrued, prior and current years, net of payments ………………………………………………………………………………………………………………………………………………………………………………2,878 3,273 2,536 2,457 1,763 16 59 (17) 18 57
Current portion of long-term debt, due in 1 year or less:
a. Loans from banks …………………………………………………………………………………………………………………………………………………………………………………………………………………………………3,010 3,793 4,811 4,786 4,383 297 385 406 329 464
b. Other long-term loans ……………………………………………………………………………………………………………………………………………………………………………………………………………………18,074 17,739 12,280 9,149 12,622 268 262 563 533 589
All other current liabilities, including excise and
sales taxes, and accrued expenses ……..……………………………………………………………………………………………………………………………………………………115,375 111,767 112,946 120,818 126,306 1,818 1,924 1,908 1,932 2,437
Total current liabilities ……………………………………………………………………………………………………………………………………………………………………………………………………………………208,819 203,562 202,623 216,663 225,339 5,966 6,810 7,006 7,311 8,462
Long-term debt, due in more than 1 year:
a. Loans from banks …………………………………………………………………………………………………………………………………………………………………………………………………………………………41,893 45,340 45,259 45,010 45,478 1,086 1,180 1,367 1,297 1,570
b. Other long-term loans ……………………………………………………………………………………………………………………………………………………………………………………………………………………173,133 176,771 195,168 197,919 199,974 1,040 1,100 1,398 1,064 1,082
All other noncurrent liabilities, including deferred income taxes,
capitalized leases, and minority stockholders' interest
in consolidated domestic corporations ……………………………………………………………………………………………………………………………………………………………………147,976 152,437 150,700 151,463 156,311 817 603 559 355 359
Total liabilities ……………………………………………………………………………………………………………………………………………………………………………………………………………………………571,821 578,109 593,750 611,054 627,102 8,908 9,693 10,329 10,027 11,472
Capital stock and other capital (less treasury stock) …………………………………………………………………………………………………………………………………………………………………………………………470,284 472,752 467,151 463,824 440,264 11,453 11,116 8,963 7,485 8,268
Retained earnings …………………………………………………………………………………………………………………………………………………………………………………………………………………………………238,410 229,505 245,746 238,783 260,645 (2,487) (2,928) (838) 2,000 1,756
Stockholders' equity ……………………………………………………………………………………………………………………………………………………………………………………………………………………708,694 702,256 712,897 702,607 700,909 8,966 8,188 8,124 9,484 10,024
Total Liabilities and Stockholders' Equity ………………………………………………………………………………………………………………………………………………………………………………………………1,280,515 1,280,366 1,306,647 1,313,662 1,328,011 17,874 17,881 18,454 19,511 21,496
NET WORKING CAPITAL
Excess of total current assets over total current liabilities ………………………………………………………………………………………………………………………………………………………………………………………124,720 110,675 113,994 93,694 86,668 7,925 6,984 7,408 8,052 8,555
SELECTED BALANCE SHEET RATIOS
Total cash, U.S. Government and other securities …………………………………………………………………………………………………………………………………………………………………………………………………10.33 9.53 9.19 8.27 8.08 22.50 21.68 22.01 22.73 24.05
Trade accounts and trade notes receivable ……………………………………………………………………………………………………………………………………………………………………………………………………5.81 5.56 5.74 6.07 5.91 23.38 22.82 24.14 23.66 24.04
Inventories ……………………………………………………………………………………………………………………………………………………………………………………………………………………………………4.18 4.18 4.12 4.18 4.10 26.99 27.15 26.68 26.05 25.04
Total current assets …………………………………………………………………………………………………………………………………………………………………………………………………………………………26.05 24.54 24.23 23.63 23.49 77.72 77.14 78.11 78.74 79.16
Net property, plant, and equipment ……………………………………………………………………………………………………………………………………………………………………………………………………………8.34 8.51 8.45 8.41 8.25 13.70 14.30 14.63 13.93 13.87
Short-term debt, including current portion of long-term debt ………………………………………………………………………………………………………………………………………………………………………………………2.31 2.67 2.37 2.37 2.32 12.21 15.54 15.15 14.42 15.29
Total current liabilities …………………………………………………………………………………………………………………………………………………………………………………………………………………………………16.31 15.90 15.51 16.49 16.97 33.38 38.08 37.96 37.47 39.36
Long-term debt …………………………………………………………………………………………………………………………………………………………………………………………………………………………………16.79 17.35 18.40 18.49 18.48 11.89 12.75 14.98 12.10 12.33
Total liabilities …………………………………………………………………………………………………………………………………………………………………………………………………………………………………44.66 45.15 45.44 46.52 47.22 49.84 54.21 55.97 51.39 53.37
Stockholders' equity ………………………………………………………………………………………………………………………………………………………………………………………………………………………………55.34 54.85 54.56 53.48 52.78 50.16 45.79 44.03 48.61 46.63
Table 24.1 -- Balance Sheet For Corporations in NAICS Manufacturing Subsector 334,
All Total Asset Sizes, and Total Assets Under $25 Million
See the Survey Methodology section of the Introduction for information on survey design, estimation, and sampling error.
(million dollars)
(percent of total assets)
(million dollars)
(percent of total assets)
Computer and Electronic Products
All Total Asset Sizes
Computer and Electronic Products
Total Assets Under $25 Million
49U.S. Census Bureau, Quarterly Financial Report, 2014 Quarter 4

Table with row headers in column A with column headers in rows 5 and 6
Item
4Q_
2013_
1Q_
2014_
2Q_
2014_
3Q_
2014_
4Q_
2014_
4Q_
2013_
1Q_
2014_
2Q_
2014_
3Q_
2014_
4Q_
2014_
Net sales, receipts, and operating revenues ………………………………………………………………………………………………………………………………………………………………………55,766 45,378 45,286 49,727 60,031 729 624 782 806 1,216
Depreciation, depletion, and amortization of property,
plant, and equipment …………………………………………………………………………………………………………………………………………………………………………………………1,383 1,195 1,246 1,144 1,177 12 13 10 11 19
All other operating costs and expenses …………………………………………………………………………………………………………...……………………………………………………………45,481 37,299 37,155 40,914 48,168 664 607 709 682 1,089
Income (loss) from operations …………………………………………………………………………………………………………...……………………………………………………………8,902 6,884 6,885 7,670 10,686 52 4 64 112 108
Interest expense …………………………………………………………………………………………………………………………………………………………………………………………………………………………………………434 592 588 584 621 8 7 4 5 5
All other nonoperating income (expense) ……………………………………………………………………………………………………………………………………………………………………………………………………13,132 8,998 7,192 7,538 18,257 1 4 1 4 (12)
Income (loss) before income taxes ………………………………………………………………………………………………………………………………………………………………………………………………21,600 15,290 13,490 14,623 28,322 45 2 60 112 90
Provision for current and deferred domestic income taxes …………………………………………………………………………………………………………………………………………………………………………………………4,739 2,858 2,325 3,821 7,239 5 2 6 9 16
Income (loss) after income taxes …………………………………………………………………………………………………………………………………………………………………………………………………………16,861 12,432 11,165 10,803 21,083 40 0 55 103 74
Cash dividends charged to retained earnings this quarter ……………………………………………………………………………………………………………………………………………………………………………………3,644 3,374 3,561 3,652 3,309 8 21 23 13 6
Net income retained in business ……………………………………………………………………………………………………………………………………………………………………………………………………13,217 9,058 7,604 7,151 17,774 32 (21) 32 90 68
Retained earnings at beginning of quarter …………………………………………………………………………………………………………………………………………………………………………………………………………157,549 162,731 155,181 156,159 144,865 (1,639) (1,114) 486 369 196
Other direct credits (charges) to retained earnings (net), including
stock and other non-cash dividends, etc. ……………………………………………………………………………………………………………………………………………………………………………………………………………………………(8,239) (18,675) (5,625) (17,645) (6,689) (4) 3 (22) (62) (4)
Retained earnings at end of quarter ……………………………………………………………………………………………………………………………………………………………………………………………………162,527 153,114 157,161 145,665 155,950 (1,611) (1,131) 496 397 260
INCOME STATEMENT IN RATIO FORMAT
Net sales, receipts, and operating revenues ……………………………………………………………………………………………………………………………………………………………………………………………………100.00 100.00 100.00 100.00 100.00 100.00 100.00 100.00 100.00 100.00
Depreciation, depletion, and amortization of property,
plant, and equipment ………………………………………………………………………………………………………………………………………………………………………2.48 2.63 2.75 2.30 1.96 1.69 2.03 1.25 1.38 1.53
All other operating costs and expenses ……………………………………………………………………………………………………………………………………………………………………………………………………81.56 82.20 82.05 82.28 80.24 91.15 97.32 90.62 84.69 89.62
Income (loss) from operations …………………………………………………………………………………………………………………………………………………………………………………………………15.96 15.17 15.20 15.42 17.80 7.16 0.65 8.12 13.93 8.84
Interest expense …………………………………………………………………………………………………………………………………………………………………………………………………………………………………0.78 1.30 1.30 1.18 1.03 1.13 1.05 0.49 0.56 0.43
All other nonoperating income (expense) ……………………………………………………………………………………………………………………………………………………………………………………………23.55 19.83 15.88 15.16 30.41 0.13 0.71 0.09 0.53 (1.00)
Income (loss) before income taxes ……………………………………………………………………………………………………………………………………………………………………………………………38.73 33.69 29.79 29.41 47.18 6.16 0.31 7.73 13.90 7.41
Provision for current and deferred domestic income taxes ……………………………………………………………………………………………………………………………………………………………………………………8.50 6.30 5.13 7.68 12.06 0.63 0.30 0.71 1.15 1.34
Income (loss) after income taxes ………………………………………………………………………………………………………………………………………………………………………………………………30.24 27.40 24.65 21.72 35.12 5.52 0.02 7.02 12.75 6.06
OPERATING RATIOS
(see explanatory notes)
Annual rate of profit on stockholders' equity at end of period:
Before income taxes ……………………………………………………………………………………………………………………………………………………………………………………………………………………39.91 29.63 25.94 29.71 55.38 19.97 1.03 29.35 53.69 32.35
After income taxes ………………………………………………………………………………………………………………………………………………………………………………………………………………31.15 24.09 21.47 21.94 41.23 17.92 0.05 26.66 49.25 26.48
Annual rate of profit on total assets:
Before income taxes ………………………………………………………………………………………………………………………………………………………………………………………………………………21.27 15.75 13.31 14.33 26.26 11.26 0.48 13.55 24.25 15.36
After income taxes …………………………………………………………………………………………………………………………………………………………………………………………………………………………16.61 12.81 11.02 10.58 19.55 10.10 0.02 12.31 22.25 12.57
BALANCE SHEET RATIOS
(based on succeeding table)
Total current assets to total current liabilities …………………………………………………………………………………………………………………………………………………………………………………………………1.16 1.19 1.14 0.93 0.90 2.59 2.09 2.06 2.09 2.08
Total cash, U.S. Government and other securities, to total current liabilities …………………………………………………………………………………………………………………………………………………………………0.38 0.42 0.38 0.22 0.21 0.85 0.56 0.46 0.57 0.65
Total stockholders' equity to total debt ………………………………………………………………………………………………………………………………………………………………………………………………………3.61 3.37 2.80 2.57 2.62 3.53 1.84 2.13 2.08 2.01
Table 25.0 -- Income Statement For Corporations in NAICS Manufacturing Industry Group 3341,
All Total Asset Sizes, and Total Assets Under $25 Million
See the Survey Methodology section of the Introduction for information on survey design, estimation, and sampling error.
Computer and Peripheral Equipment
All Total Asset Sizes 1
Computer and Peripheral Equipment
Total Assets Under $25 Million 1
(million dollars) (million dollars)
(percent of net sales) (percent of net sales)
(percent) (percent)
1 Included in Computer and Electronic Products.
50U.S. Census Bureau, Quarterly Financial Report, 2014 Quarter 4
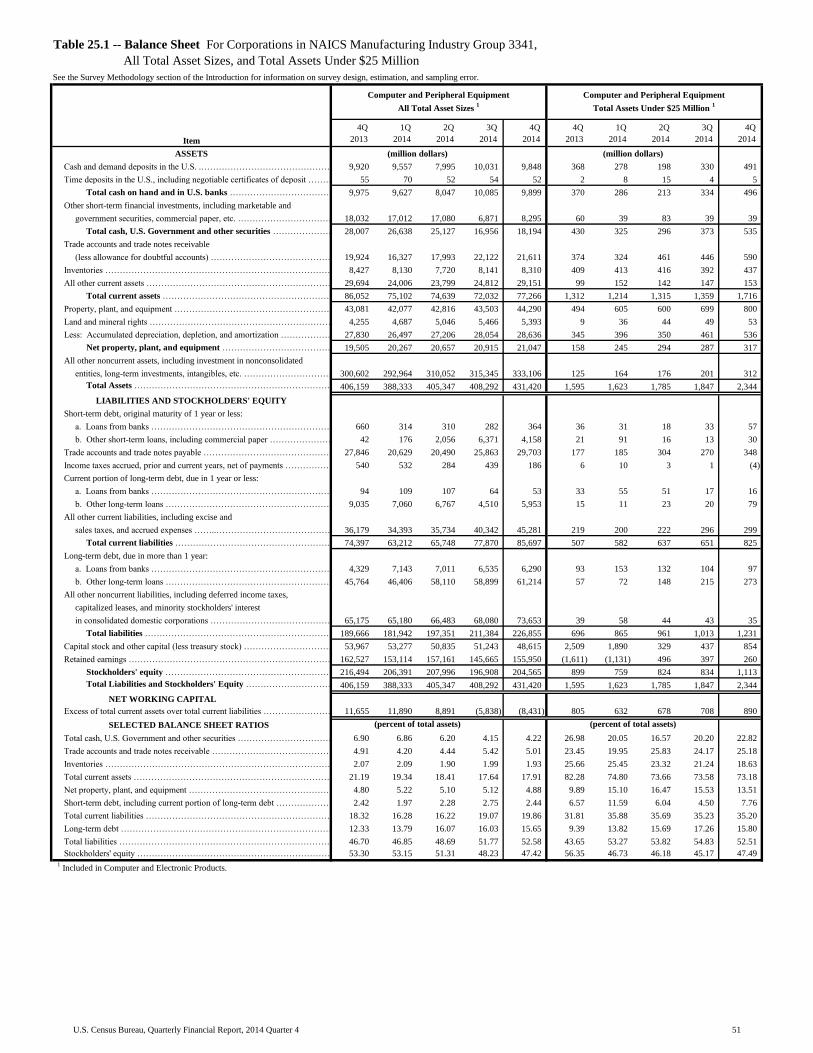
Table with row headers in column A with column headers in rows 5 and 6
Item
4Q_
2013_
1Q_
2014_
2Q_
2014_
3Q_
2014_
4Q_
2014_
4Q_
2013_
1Q_
2014_
2Q_
2014_
3Q_
2014_
4Q_
2014_
ASSETS
Cash and demand deposits in the U.S. .………………………………………………………………………………………………………………………………………………………………………………………………………………………………9,920 9,557 7,995 10,031 9,848 368 278 198 330 491
Time deposits in the U.S., including negotiable certificates of deposit ……………………………………………………………………………………………………………………………………………………………………………………55 70 52 54 52 2 8 15 4 5
Total cash on hand and in U.S. banks ……………………………………………………………………………………………………………………………………………………………………………………9,975 9,627 8,047 10,085 9,899 370 286 213 334 496
Other short-term financial investments, including marketable and
government securities, commercial paper, etc. ………………………………………………………………………………………………………………………………………………………………………………………………………………………………18,032 17,012 17,080 6,871 8,295 60 39 83 39 39
Total cash, U.S. Government and other securities ……………………………………………………………………………………………………………………………………………………………………………………28,007 26,638 25,127 16,956 18,194 430 325 296 373 535
Trade accounts and trade notes receivable
(less allowance for doubtful accounts) …………………………………………………………………………………………………………………………………………19,924 16,327 17,993 22,122 21,611 374 324 461 446 590
Inventories ………………………………………………………………………………………………………………………………………………………………………………………………………………………………8,427 8,130 7,720 8,141 8,310 409 413 416 392 437
All other current assets ………………………………………………………………………………………………………………………………………………………………………………………………………………………………29,694 24,006 23,799 24,812 29,151 99 152 142 147 153
Total current assets ………………………………………………………………………………………………………………………………………………………………………………………………………………………………86,052 75,102 74,639 72,032 77,266 1,312 1,214 1,315 1,359 1,716
Property, plant, and equipment ………………………………………………………………………………………………………………………………………………………………………………………………………………………………43,081 42,077 42,816 43,503 44,290 494 605 600 699 800
Land and mineral rights ………………………………………………………………………………………………………………………………………………………………………………………………………………………………4,255 4,687 5,046 5,466 5,393 9 36 44 49 53
Less: Accumulated depreciation, depletion, and amortization ……………………………………………………………………………………………………………………………………………………………………………………27,830 26,497 27,206 28,054 28,636 345 396 350 461 536
Net property, plant, and equipment ……………………………………………………………………………………………………………………………………………………………………………………19,505 20,267 20,657 20,915 21,047 158 245 294 287 317
All other noncurrent assets, including investment in nonconsolidated
entities, long-term investments, intangibles, etc. ………………………………………………………………………………………………………………………………………………………………………………………………………………300,602 292,964 310,052 315,345 333,106 125 164 176 201 312
Total Assets …………………………………………………………………………………………………………………………………………………………………………………………………………………………406,159 388,333 405,347 408,292 431,420 1,595 1,623 1,785 1,847 2,344
LIABILITIES AND STOCKHOLDERS' EQUITY
Short-term debt, original maturity of 1 year or less:
a. Loans from banks ………………………………………………………………………………………………………………………………………………………………………………………………………………………660 314 310 282 364 36 31 18 33 57
b. Other short-term loans, including commercial paper ………………………………………………………………………………………………………………………………………………………………………………………42 176 2,056 6,371 4,158 21 91 16 13 30
Trade accounts and trade notes payable ……………………………………………………………………………………………………………………………………………………………………………………………………………27,846 20,629 20,490 25,863 29,703 177 185 304 270 348
Income taxes accrued, prior and current years, net of payments ………………………………………………………………………………………………………………………………………………………………………………540 532 284 439 186 6 10 3 1 (4)
Current portion of long-term debt, due in 1 year or less:
a. Loans from banks …………………………………………………………………………………………………………………………………………………………………………………………………………………………………94 109 107 64 53 33 55 51 17 16
b. Other long-term loans ……………………………………………………………………………………………………………………………………………………………………………………………………………………9,035 7,060 6,767 4,510 5,953 15 11 23 20 79
All other current liabilities, including excise and
sales taxes, and accrued expenses ……..……………………………………………………………………………………………………………………………………………………36,179 34,393 35,734 40,342 45,281 219 200 222 296 299
Total current liabilities ……………………………………………………………………………………………………………………………………………………………………………………………………………………74,397 63,212 65,748 77,870 85,697 507 582 637 651 825
Long-term debt, due in more than 1 year:
a. Loans from banks …………………………………………………………………………………………………………………………………………………………………………………………………………………………4,329 7,143 7,011 6,535 6,290 93 153 132 104 97
b. Other long-term loans ……………………………………………………………………………………………………………………………………………………………………………………………………………………45,764 46,406 58,110 58,899 61,214 57 72 148 215 273
All other noncurrent liabilities, including deferred income taxes,
capitalized leases, and minority stockholders' interest
in consolidated domestic corporations ……………………………………………………………………………………………………………………………………………………………………65,175 65,180 66,483 68,080 73,653 39 58 44 43 35
Total liabilities ……………………………………………………………………………………………………………………………………………………………………………………………………………………………189,666 181,942 197,351 211,384 226,855 696 865 961 1,013 1,231
Capital stock and other capital (less treasury stock) …………………………………………………………………………………………………………………………………………………………………………………………53,967 53,277 50,835 51,243 48,615 2,509 1,890 329 437 854
Retained earnings …………………………………………………………………………………………………………………………………………………………………………………………………………………………………162,527 153,114 157,161 145,665 155,950 (1,611) (1,131) 496 397 260
Stockholders' equity ……………………………………………………………………………………………………………………………………………………………………………………………………………………216,494 206,391 207,996 196,908 204,565 899 759 824 834 1,113
Total Liabilities and Stockholders' Equity ………………………………………………………………………………………………………………………………………………………………………………………………406,159 388,333 405,347 408,292 431,420 1,595 1,623 1,785 1,847 2,344
NET WORKING CAPITAL
Excess of total current assets over total current liabilities ………………………………………………………………………………………………………………………………………………………………………………………11,655 11,890 8,891 (5,838) (8,431) 805 632 678 708 890
SELECTED BALANCE SHEET RATIOS
Total cash, U.S. Government and other securities …………………………………………………………………………………………………………………………………………………………………………………………………6.90 6.86 6.20 4.15 4.22 26.98 20.05 16.57 20.20 22.82
Trade accounts and trade notes receivable ……………………………………………………………………………………………………………………………………………………………………………………………………4.91 4.20 4.44 5.42 5.01 23.45 19.95 25.83 24.17 25.18
Inventories ……………………………………………………………………………………………………………………………………………………………………………………………………………………………………2.07 2.09 1.90 1.99 1.93 25.66 25.45 23.32 21.24 18.63
Total current assets …………………………………………………………………………………………………………………………………………………………………………………………………………………………21.19 19.34 18.41 17.64 17.91 82.28 74.80 73.66 73.58 73.18
Net property, plant, and equipment ……………………………………………………………………………………………………………………………………………………………………………………………………………4.80 5.22 5.10 5.12 4.88 9.89 15.10 16.47 15.53 13.51
Short-term debt, including current portion of long-term debt ………………………………………………………………………………………………………………………………………………………………………………………2.42 1.97 2.28 2.75 2.44 6.57 11.59 6.04 4.50 7.76
Total current liabilities …………………………………………………………………………………………………………………………………………………………………………………………………………………………………18.32 16.28 16.22 19.07 19.86 31.81 35.88 35.69 35.23 35.20
Long-term debt …………………………………………………………………………………………………………………………………………………………………………………………………………………………………12.33 13.79 16.07 16.03 15.65 9.39 13.82 15.69 17.26 15.80
Total liabilities …………………………………………………………………………………………………………………………………………………………………………………………………………………………………46.70 46.85 48.69 51.77 52.58 43.65 53.27 53.82 54.83 52.51
Stockholders' equity ………………………………………………………………………………………………………………………………………………………………………………………………………………………………53.30 53.15 51.31 48.23 47.42 56.35 46.73 46.18 45.17 47.49
1 Included in Computer and Electronic Products.
Table 25.1 -- Balance Sheet For Corporations in NAICS Manufacturing Industry Group 3341,
All Total Asset Sizes, and Total Assets Under $25 Million
See the Survey Methodology section of the Introduction for information on survey design, estimation, and sampling error.
(million dollars)
(percent of total assets)
(million dollars)
(percent of total assets)
Computer and Peripheral Equipment
All Total Asset Sizes 1
Computer and Peripheral Equipment
Total Assets Under $25 Million 1
51U.S. Census Bureau, Quarterly Financial Report, 2014 Quarter 4

Table with row headers in column A with column headers in rows 5 and 6
Item
4Q_
2013_
1Q_
2014_
2Q_
2014_
3Q_
2014_
4Q_
2014_
4Q_
2013_
1Q_
2014_
2Q_
2014_
3Q_
2014_
4Q_
2014_
Net sales, receipts, and operating revenues ………………………………………………………………………………………………………………………………………………………………………32,519 29,674 31,442 31,328 31,800 905 747 684 784 1,149
Depreciation, depletion, and amortization of property,
plant, and equipment …………………………………………………………………………………………………………………………………………………………………………………………1,077 1,053 1,020 1,034 1,011 10 9 8 8 9
All other operating costs and expenses …………………………………………………………………………………………………………...……………………………………………………………28,372 25,499 27,288 26,764 27,651 832 735 603 627 995
Income (loss) from operations …………………………………………………………………………………………………………...……………………………………………………………3,070 3,121 3,135 3,529 3,138 63 3 73 150 144
Interest expense …………………………………………………………………………………………………………………………………………………………………………………………………………………………………………680 595 557 634 615 9 9 4 4 5
All other nonoperating income (expense) ……………………………………………………………………………………………………………………………………………………………………………………………………3,893 2,682 6,668 3,209 2,723 3 2 (2) (4) (1)
Income (loss) before income taxes ………………………………………………………………………………………………………………………………………………………………………………………………6,283 5,208 9,246 6,105 5,246 57 (4) 67 141 139
Provision for current and deferred domestic income taxes …………………………………………………………………………………………………………………………………………………………………………………………1,365 877 1,679 872 558 11 9 5 3 21
Income (loss) after income taxes …………………………………………………………………………………………………………………………………………………………………………………………………………4,919 4,331 7,567 5,233 4,688 46 (13) 62 138 118
Cash dividends charged to retained earnings this quarter ……………………………………………………………………………………………………………………………………………………………………………………1,721 1,867 1,934 2,203 2,331 23 48 45 38 31
Net income retained in business ……………………………………………………………………………………………………………………………………………………………………………………………………3,197 2,465 5,633 3,030 2,357 23 (60) 18 100 87
Retained earnings at beginning of quarter …………………………………………………………………………………………………………………………………………………………………………………………………………(55,968) (55,680) (54,540) (50,908) (50,001) (504) (1,166) (73) (186) (2)
Other direct credits (charges) to retained earnings (net), including
stock and other non-cash dividends, etc. ……………………………………………………………………………………………………………………………………………………………………………………………………………………………(1,988) (3,112) (1,698) (1,438) (897) 2 (13) (12) (1) 6
Retained earnings at end of quarter ……………………………………………………………………………………………………………………………………………………………………………………………………(54,758) (56,328) (50,605) (49,316) (48,540) (479) (1,240) (67) (87) 91
INCOME STATEMENT IN RATIO FORMAT
Net sales, receipts, and operating revenues ……………………………………………………………………………………………………………………………………………………………………………………………………100.00 100.00 100.00 100.00 100.00 100.00 100.00 100.00 100.00 100.00
Depreciation, depletion, and amortization of property,
plant, and equipment ………………………………………………………………………………………………………………………………………………………………………3.31 3.55 3.24 3.30 3.18 1.09 1.19 1.16 1.03 0.83
All other operating costs and expenses ……………………………………………………………………………………………………………………………………………………………………………………………………87.25 85.93 86.79 85.43 86.95 91.90 98.35 88.15 79.88 86.62
Income (loss) from operations …………………………………………………………………………………………………………………………………………………………………………………………………9.44 10.52 9.97 11.26 9.87 7.01 0.45 10.69 19.09 12.55
Interest expense …………………………………………………………………………………………………………………………………………………………………………………………………………………………………2.09 2.01 1.77 2.02 1.93 0.97 1.27 0.64 0.52 0.40
All other nonoperating income (expense) ……………………………………………………………………………………………………………………………………………………………………………………………11.97 9.04 21.21 10.24 8.56 0.30 0.32 (0.28) (0.53) (0.05)
Income (loss) before income taxes ……………………………………………………………………………………………………………………………………………………………………………………………19.32 17.55 29.41 19.49 16.50 6.35 (0.50) 9.77 18.03 12.10
Provision for current and deferred domestic income taxes ……………………………………………………………………………………………………………………………………………………………………………………4.20 2.95 5.34 2.78 1.75 1.25 1.21 0.67 0.44 1.83
Income (loss) after income taxes ………………………………………………………………………………………………………………………………………………………………………………………………15.13 14.60 24.07 16.70 14.74 5.10 (1.71) 9.10 17.60 10.28
OPERATING RATIOS
(see explanatory notes)
Annual rate of profit on stockholders' equity at end of period:
Before income taxes ……………………………………………………………………………………………………………………………………………………………………………………………………………………17.13 14.62 25.57 17.16 15.30 36.75 (6.52) 63.94 115.69 69.35
After income taxes ………………………………………………………………………………………………………………………………………………………………………………………………………………13.41 12.16 20.93 14.70 13.68 29.49 (22.49) 59.58 112.88 58.89
Annual rate of profit on total assets:
Before income taxes ………………………………………………………………………………………………………………………………………………………………………………………………………………9.42 7.92 13.85 9.18 8.07 14.69 (1.01) 19.61 40.04 28.38
After income taxes …………………………………………………………………………………………………………………………………………………………………………………………………………………………7.37 6.59 11.33 7.87 7.21 11.79 (3.47) 18.27 39.07 24.10
BALANCE SHEET RATIOS
(based on succeeding table)
Total current assets to total current liabilities …………………………………………………………………………………………………………………………………………………………………………………………………1.65 1.51 1.75 1.61 1.55 2.25 1.37 1.76 1.85 1.99
Total cash, U.S. Government and other securities, to total current liabilities …………………………………………………………………………………………………………………………………………………………………0.69 0.58 0.70 0.65 0.63 0.65 0.38 0.43 0.48 0.59
Total stockholders' equity to total debt ………………………………………………………………………………………………………………………………………………………………………………………………………3.24 3.03 2.80 2.78 2.71 1.56 0.34 0.82 1.10 1.60
Table 26.0 -- Income Statement For Corporations in NAICS Manufacturing Industry Group 3342,
All Total Asset Sizes, and Total Assets Under $25 Million
See the Survey Methodology section of the Introduction for information on survey design, estimation, and sampling error.
Communications Equipment
All Total Asset Sizes 1
Communications Equipment
Total Assets Under $25 Million 1
(million dollars) (million dollars)
(percent of net sales) (percent of net sales)
(percent) (percent)
1 Included in Computer and Electronic Products.
52U.S. Census Bureau, Quarterly Financial Report, 2014 Quarter 4
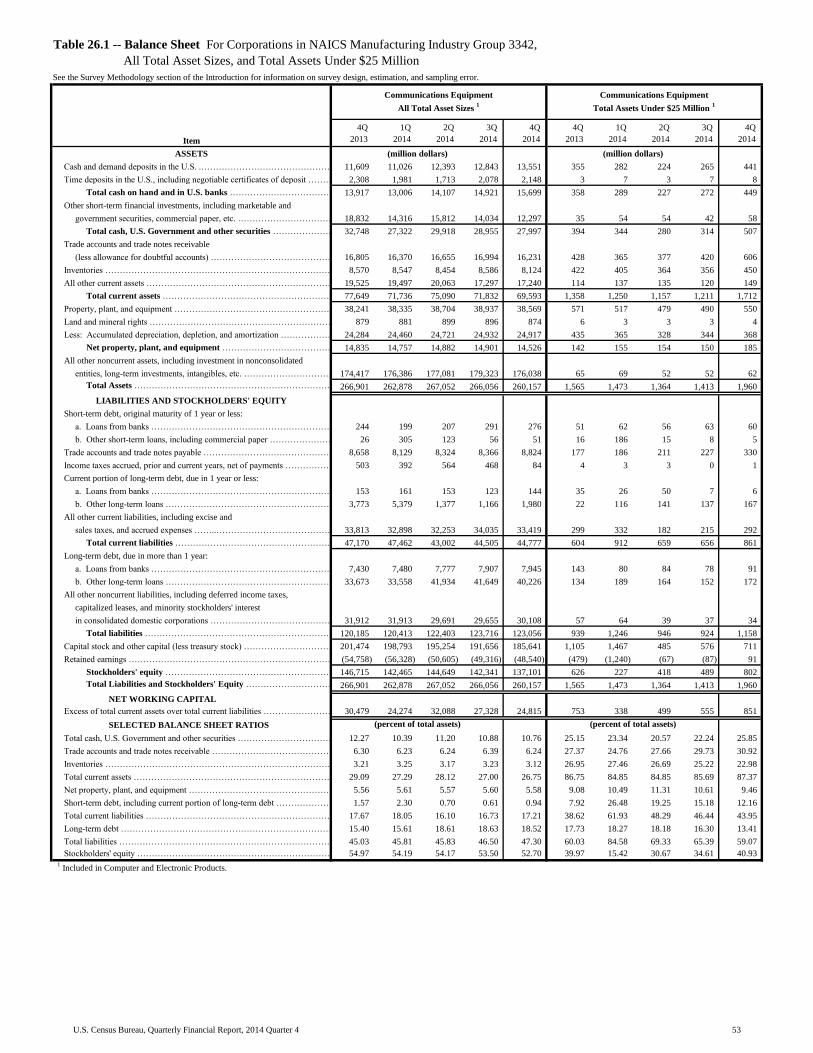
Table with row headers in column A with column headers in rows 5 and 6
Item
4Q_
2013_
1Q_
2014_
2Q_
2014_
3Q_
2014_
4Q_
2014_
4Q_
2013_
1Q_
2014_
2Q_
2014_
3Q_
2014_
4Q_
2014_
ASSETS
Cash and demand deposits in the U.S. .………………………………………………………………………………………………………………………………………………………………………………………………………………………………11,609 11,026 12,393 12,843 13,551 355 282 224 265 441
Time deposits in the U.S., including negotiable certificates of deposit ……………………………………………………………………………………………………………………………………………………………………………………2,308 1,981 1,713 2,078 2,148 3 7 3 7 8
Total cash on hand and in U.S. banks ……………………………………………………………………………………………………………………………………………………………………………………13,917 13,006 14,107 14,921 15,699 358 289 227 272 449
Other short-term financial investments, including marketable and
government securities, commercial paper, etc. ………………………………………………………………………………………………………………………………………………………………………………………………………………………………18,832 14,316 15,812 14,034 12,297 35 54 54 42 58
Total cash, U.S. Government and other securities ……………………………………………………………………………………………………………………………………………………………………………………32,748 27,322 29,918 28,955 27,997 394 344 280 314 507
Trade accounts and trade notes receivable
(less allowance for doubtful accounts) …………………………………………………………………………………………………………………………………………16,805 16,370 16,655 16,994 16,231 428 365 377 420 606
Inventories ………………………………………………………………………………………………………………………………………………………………………………………………………………………………8,570 8,547 8,454 8,586 8,124 422 405 364 356 450
All other current assets ………………………………………………………………………………………………………………………………………………………………………………………………………………………………19,525 19,497 20,063 17,297 17,240 114 137 135 120 149
Total current assets ………………………………………………………………………………………………………………………………………………………………………………………………………………………………77,649 71,736 75,090 71,832 69,593 1,358 1,250 1,157 1,211 1,712
Property, plant, and equipment ………………………………………………………………………………………………………………………………………………………………………………………………………………………………38,241 38,335 38,704 38,937 38,569 571 517 479 490 550
Land and mineral rights ………………………………………………………………………………………………………………………………………………………………………………………………………………………………879 881 899 896 874 6 3 3 3 4
Less: Accumulated depreciation, depletion, and amortization ……………………………………………………………………………………………………………………………………………………………………………………24,284 24,460 24,721 24,932 24,917 435 365 328 344 368
Net property, plant, and equipment ……………………………………………………………………………………………………………………………………………………………………………………14,835 14,757 14,882 14,901 14,526 142 155 154 150 185
All other noncurrent assets, including investment in nonconsolidated
entities, long-term investments, intangibles, etc. ………………………………………………………………………………………………………………………………………………………………………………………………………………174,417 176,386 177,081 179,323 176,038 65 69 52 52 62
Total Assets …………………………………………………………………………………………………………………………………………………………………………………………………………………………266,901 262,878 267,052 266,056 260,157 1,565 1,473 1,364 1,413 1,960
LIABILITIES AND STOCKHOLDERS' EQUITY
Short-term debt, original maturity of 1 year or less:
a. Loans from banks ………………………………………………………………………………………………………………………………………………………………………………………………………………………244 199 207 291 276 51 62 56 63 60
b. Other short-term loans, including commercial paper ………………………………………………………………………………………………………………………………………………………………………………………26 305 123 56 51 16 186 15 8 5
Trade accounts and trade notes payable ……………………………………………………………………………………………………………………………………………………………………………………………………………8,658 8,129 8,324 8,366 8,824 177 186 211 227 330
Income taxes accrued, prior and current years, net of payments ………………………………………………………………………………………………………………………………………………………………………………503 392 564 468 84 4 3 3 0 1
Current portion of long-term debt, due in 1 year or less:
a. Loans from banks …………………………………………………………………………………………………………………………………………………………………………………………………………………………………153 161 153 123 144 35 26 50 7 6
b. Other long-term loans ……………………………………………………………………………………………………………………………………………………………………………………………………………………3,773 5,379 1,377 1,166 1,980 22 116 141 137 167
All other current liabilities, including excise and
sales taxes, and accrued expenses ……..……………………………………………………………………………………………………………………………………………………33,813 32,898 32,253 34,035 33,419 299 332 182 215 292
Total current liabilities ……………………………………………………………………………………………………………………………………………………………………………………………………………………47,170 47,462 43,002 44,505 44,777 604 912 659 656 861
Long-term debt, due in more than 1 year:
a. Loans from banks …………………………………………………………………………………………………………………………………………………………………………………………………………………………7,430 7,480 7,777 7,907 7,945 143 80 84 78 91
b. Other long-term loans ……………………………………………………………………………………………………………………………………………………………………………………………………………………33,673 33,558 41,934 41,649 40,226 134 189 164 152 172
All other noncurrent liabilities, including deferred income taxes,
capitalized leases, and minority stockholders' interest
in consolidated domestic corporations ……………………………………………………………………………………………………………………………………………………………………31,912 31,913 29,691 29,655 30,108 57 64 39 37 34
Total liabilities ……………………………………………………………………………………………………………………………………………………………………………………………………………………………120,185 120,413 122,403 123,716 123,056 939 1,246 946 924 1,158
Capital stock and other capital (less treasury stock) …………………………………………………………………………………………………………………………………………………………………………………………201,474 198,793 195,254 191,656 185,641 1,105 1,467 485 576 711
Retained earnings …………………………………………………………………………………………………………………………………………………………………………………………………………………………………(54,758) (56,328) (50,605) (49,316) (48,540) (479) (1,240) (67) (87) 91
Stockholders' equity ……………………………………………………………………………………………………………………………………………………………………………………………………………………146,715 142,465 144,649 142,341 137,101 626 227 418 489 802
Total Liabilities and Stockholders' Equity ………………………………………………………………………………………………………………………………………………………………………………………………266,901 262,878 267,052 266,056 260,157 1,565 1,473 1,364 1,413 1,960
NET WORKING CAPITAL
Excess of total current assets over total current liabilities ………………………………………………………………………………………………………………………………………………………………………………………30,479 24,274 32,088 27,328 24,815 753 338 499 555 851
SELECTED BALANCE SHEET RATIOS
Total cash, U.S. Government and other securities …………………………………………………………………………………………………………………………………………………………………………………………………12.27 10.39 11.20 10.88 10.76 25.15 23.34 20.57 22.24 25.85
Trade accounts and trade notes receivable ……………………………………………………………………………………………………………………………………………………………………………………………………6.30 6.23 6.24 6.39 6.24 27.37 24.76 27.66 29.73 30.92
Inventories ……………………………………………………………………………………………………………………………………………………………………………………………………………………………………3.21 3.25 3.17 3.23 3.12 26.95 27.46 26.69 25.22 22.98
Total current assets …………………………………………………………………………………………………………………………………………………………………………………………………………………………29.09 27.29 28.12 27.00 26.75 86.75 84.85 84.85 85.69 87.37
Net property, plant, and equipment ……………………………………………………………………………………………………………………………………………………………………………………………………………5.56 5.61 5.57 5.60 5.58 9.08 10.49 11.31 10.61 9.46
Short-term debt, including current portion of long-term debt ………………………………………………………………………………………………………………………………………………………………………………………1.57 2.30 0.70 0.61 0.94 7.92 26.48 19.25 15.18 12.16
Total current liabilities …………………………………………………………………………………………………………………………………………………………………………………………………………………………………17.67 18.05 16.10 16.73 17.21 38.62 61.93 48.29 46.44 43.95
Long-term debt …………………………………………………………………………………………………………………………………………………………………………………………………………………………………15.40 15.61 18.61 18.63 18.52 17.73 18.27 18.18 16.30 13.41
Total liabilities …………………………………………………………………………………………………………………………………………………………………………………………………………………………………45.03 45.81 45.83 46.50 47.30 60.03 84.58 69.33 65.39 59.07
Stockholders' equity ………………………………………………………………………………………………………………………………………………………………………………………………………………………………54.97 54.19 54.17 53.50 52.70 39.97 15.42 30.67 34.61 40.93
1 Included in Computer and Electronic Products.
Table 26.1 -- Balance Sheet For Corporations in NAICS Manufacturing Industry Group 3342,
All Total Asset Sizes, and Total Assets Under $25 Million
See the Survey Methodology section of the Introduction for information on survey design, estimation, and sampling error.
(million dollars)
(percent of total assets)
(million dollars)
(percent of total assets)
Communications Equipment
All Total Asset Sizes 1
Communications Equipment
Total Assets Under $25 Million 1
53U.S. Census Bureau, Quarterly Financial Report, 2014 Quarter 4

Table with row headers in column A with column headers in rows 5 and 6
Item
4Q_
2013_
1Q_
2014_
2Q_
2014_
3Q_
2014_
4Q_
2014_
4Q_
2013_
1Q_
2014_
2Q_
2014_
3Q_
2014_
4Q_
2014_
Net sales, receipts, and operating revenues ………………………………………………………………………………………………………………………………………………………………………73,402 69,952 74,064 74,614 76,475 6,671 6,175 6,997 7,484 7,884
Depreciation, depletion, and amortization of property,
plant, and equipment …………………………………………………………………………………………………………………………………………………………………………………………2,823 2,826 2,904 2,905 2,882 132 115 117 116 125
All other operating costs and expenses …………………………………………………………………………………………………………...……………………………………………………………65,142 62,312 64,082 64,236 66,145 6,584 6,020 6,541 6,787 7,479
Income (loss) from operations …………………………………………………………………………………………………………...……………………………………………………………5,437 4,814 7,078 7,472 7,448 (45) 40 339 581 280
Interest expense …………………………………………………………………………………………………………………………………………………………………………………………………………………………………………1,760 1,763 1,876 1,701 1,892 55 63 69 58 62
All other nonoperating income (expense) ……………………………………………………………………………………………………………………………………………………………………………………………………9,173 7,885 8,878 9,750 9,564 (15) 3 (9) (5) (49)
Income (loss) before income taxes ………………………………………………………………………………………………………………………………………………………………………………………………12,851 10,936 14,080 15,521 15,121 (114) (20) 261 518 169
Provision for current and deferred domestic income taxes …………………………………………………………………………………………………………………………………………………………………………………………2,386 2,137 2,202 2,406 1,753 83 67 76 112 112
Income (loss) after income taxes …………………………………………………………………………………………………………………………………………………………………………………………………………10,465 8,799 11,877 13,115 13,368 (197) (88) 185 406 56
Cash dividends charged to retained earnings this quarter ……………………………………………………………………………………………………………………………………………………………………………………2,998 4,697 2,895 5,136 5,067 341 241 243 159 285
Net income retained in business ……………………………………………………………………………………………………………………………………………………………………………………………………7,467 4,102 8,982 7,979 8,301 (538) (328) (58) 247 (229)
Retained earnings at beginning of quarter …………………………………………………………………………………………………………………………………………………………………………………………………………124,145 130,880 131,565 139,714 149,094 270 (140) (1,036) 1,593 1,703
Other direct credits (charges) to retained earnings (net), including
stock and other non-cash dividends, etc. ……………………………………………………………………………………………………………………………………………………………………………………………………………………………(971) (2,264) (1,356) (5,259) (4,159) (129) (89) (173) (151) (69)
Retained earnings at end of quarter ……………………………………………………………………………………………………………………………………………………………………………………………………130,641 132,718 139,191 142,434 153,236 (397) (557) (1,267) 1,690 1,405
INCOME STATEMENT IN RATIO FORMAT
Net sales, receipts, and operating revenues ……………………………………………………………………………………………………………………………………………………………………………………………………100.00 100.00 100.00 100.00 100.00 100.00 100.00 100.00 100.00 100.00
Depreciation, depletion, and amortization of property,
plant, and equipment ………………………………………………………………………………………………………………………………………………………………………3.85 4.04 3.92 3.89 3.77 1.98 1.87 1.67 1.55 1.58
All other operating costs and expenses ……………………………………………………………………………………………………………………………………………………………………………………………………88.75 89.08 86.52 86.09 86.49 98.69 97.49 93.49 90.68 94.87
Income (loss) from operations …………………………………………………………………………………………………………………………………………………………………………………………………7.41 6.88 9.56 10.01 9.74 (0.67) 0.65 4.84 7.77 3.55
Interest expense …………………………………………………………………………………………………………………………………………………………………………………………………………………………………2.40 2.52 2.53 2.28 2.47 0.82 1.02 0.98 0.77 0.79
All other nonoperating income (expense) ……………………………………………………………………………………………………………………………………………………………………………………………12.50 11.27 11.99 13.07 12.51 (0.22) 0.04 (0.13) (0.07) (0.62)
Income (loss) before income taxes ……………………………………………………………………………………………………………………………………………………………………………………………17.51 15.63 19.01 20.80 19.77 (1.71) (0.33) 3.73 6.93 2.14
Provision for current and deferred domestic income taxes ……………………………………………………………………………………………………………………………………………………………………………………3.25 3.05 2.97 3.22 2.29 1.24 1.09 1.08 1.50 1.43
Income (loss) after income taxes ………………………………………………………………………………………………………………………………………………………………………………………………14.26 12.58 16.04 17.58 17.48 (2.95) (1.42) 2.65 5.42 0.71
OPERATING RATIOS
(see explanatory notes)
Annual rate of profit on stockholders' equity at end of period:
Before income taxes ……………………………………………………………………………………………………………………………………………………………………………………………………………………14.88 12.38 15.63 17.09 16.84 (6.13) (1.13) 15.15 25.41 8.33
After income taxes ………………………………………………………………………………………………………………………………………………………………………………………………………………12.12 9.96 13.19 14.44 14.88 (10.57) (4.87) 10.76 19.90 2.78
Annual rate of profit on total assets:
Before income taxes ………………………………………………………………………………………………………………………………………………………………………………………………………………8.46 6.95 8.88 9.71 9.50 (3.10) (0.55) 6.81 12.76 3.93
After income taxes …………………………………………………………………………………………………………………………………………………………………………………………………………………………6.89 5.59 7.49 8.21 8.40 (5.34) (2.37) 4.84 9.99 1.31
BALANCE SHEET RATIOS
(based on succeeding table)
Total current assets to total current liabilities …………………………………………………………………………………………………………………………………………………………………………………………………1.95 1.80 1.78 1.77 1.74 2.31 2.13 2.09 2.13 2.01
Total cash, U.S. Government and other securities, to total current liabilities …………………………………………………………………………………………………………………………………………………………………0.82 0.73 0.69 0.67 0.64 0.66 0.60 0.61 0.62 0.61
Total stockholders' equity to total debt ………………………………………………………………………………………………………………………………………………………………………………………………………2.48 2.39 2.48 2.49 2.43 2.04 1.81 1.48 1.89 1.66
Table 27.0 -- Income Statement For Corporations in NAICS Manufacturing Industry Groups 3343, 3344, 3345, and 3346,
All Total Asset Sizes, and Total Assets Under $25 Million
See the Survey Methodology section of the Introduction for information on survey design, estimation, and sampling error.
All Other Electronic Products
All Total Asset Sizes 1
All Other Electronic Products
Total Assets Under $25 Million 1
(million dollars) (million dollars)
(percent of net sales) (percent of net sales)
(percent) (percent)
1 Included in Computer and Electronic Products.
54U.S. Census Bureau, Quarterly Financial Report, 2014 Quarter 4
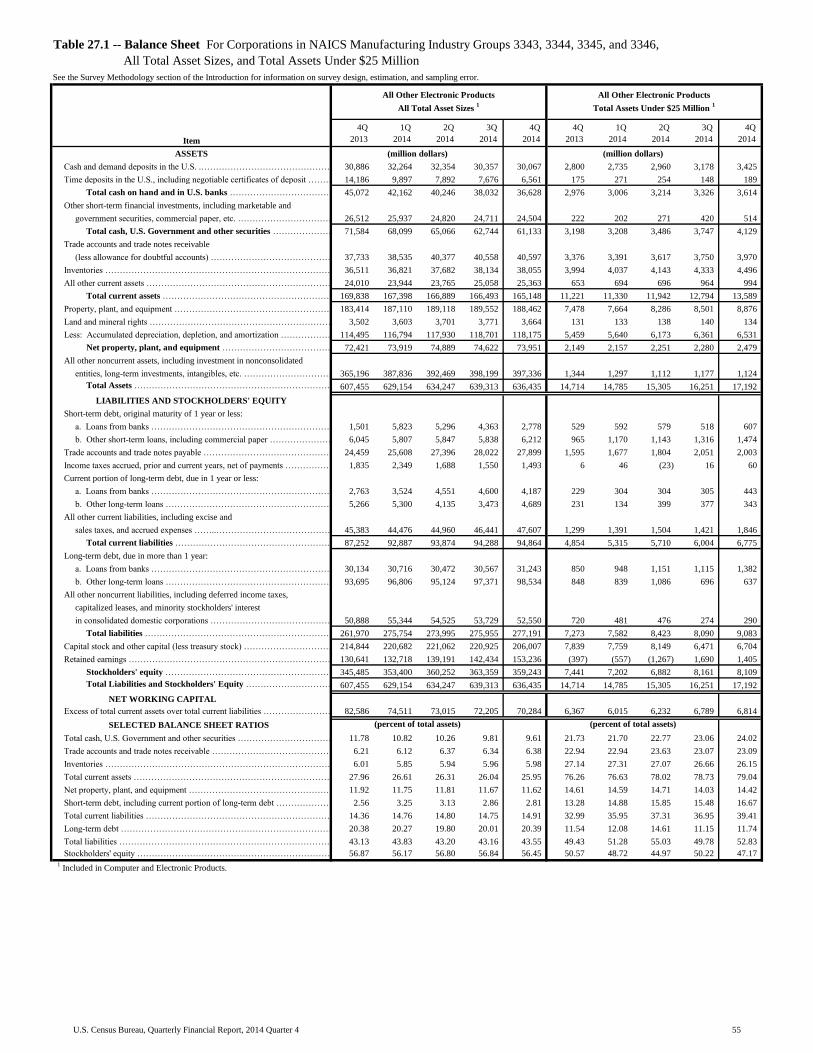
Table with row headers in column A with column headers in rows 5 and 6
Item
4Q_
2013_
1Q_
2014_
2Q_
2014_
3Q_
2014_
4Q_
2014_
4Q_
2013_
1Q_
2014_
2Q_
2014_
3Q_
2014_
4Q_
2014_
ASSETS
Cash and demand deposits in the U.S. .………………………………………………………………………………………………………………………………………………………………………………………………………………………………30,886 32,264 32,354 30,357 30,067 2,800 2,735 2,960 3,178 3,425
Time deposits in the U.S., including negotiable certificates of deposit ……………………………………………………………………………………………………………………………………………………………………………………14,186 9,897 7,892 7,676 6,561 175 271 254 148 189
Total cash on hand and in U.S. banks ……………………………………………………………………………………………………………………………………………………………………………………45,072 42,162 40,246 38,032 36,628 2,976 3,006 3,214 3,326 3,614
Other short-term financial investments, including marketable and
government securities, commercial paper, etc. ………………………………………………………………………………………………………………………………………………………………………………………………………………………………26,512 25,937 24,820 24,711 24,504 222 202 271 420 514
Total cash, U.S. Government and other securities ……………………………………………………………………………………………………………………………………………………………………………………71,584 68,099 65,066 62,744 61,133 3,198 3,208 3,486 3,747 4,129
Trade accounts and trade notes receivable
(less allowance for doubtful accounts) …………………………………………………………………………………………………………………………………………37,733 38,535 40,377 40,558 40,597 3,376 3,391 3,617 3,750 3,970
Inventories ………………………………………………………………………………………………………………………………………………………………………………………………………………………………36,511 36,821 37,682 38,134 38,055 3,994 4,037 4,143 4,333 4,496
All other current assets ………………………………………………………………………………………………………………………………………………………………………………………………………………………………24,010 23,944 23,765 25,058 25,363 653 694 696 964 994
Total current assets ………………………………………………………………………………………………………………………………………………………………………………………………………………………………169,838 167,398 166,889 166,493 165,148 11,221 11,330 11,942 12,794 13,589
Property, plant, and equipment ………………………………………………………………………………………………………………………………………………………………………………………………………………………………183,414 187,110 189,118 189,552 188,462 7,478 7,664 8,286 8,501 8,876
Land and mineral rights ………………………………………………………………………………………………………………………………………………………………………………………………………………………………3,502 3,603 3,701 3,771 3,664 131 133 138 140 134
Less: Accumulated depreciation, depletion, and amortization ……………………………………………………………………………………………………………………………………………………………………………………114,495 116,794 117,930 118,701 118,175 5,459 5,640 6,173 6,361 6,531
Net property, plant, and equipment ……………………………………………………………………………………………………………………………………………………………………………………72,421 73,919 74,889 74,622 73,951 2,149 2,157 2,251 2,280 2,479
All other noncurrent assets, including investment in nonconsolidated
entities, long-term investments, intangibles, etc. ………………………………………………………………………………………………………………………………………………………………………………………………………………365,196 387,836 392,469 398,199 397,336 1,344 1,297 1,112 1,177 1,124
Total Assets …………………………………………………………………………………………………………………………………………………………………………………………………………………………607,455 629,154 634,247 639,313 636,435 14,714 14,785 15,305 16,251 17,192
LIABILITIES AND STOCKHOLDERS' EQUITY
Short-term debt, original maturity of 1 year or less:
a. Loans from banks ………………………………………………………………………………………………………………………………………………………………………………………………………………………1,501 5,823 5,296 4,363 2,778 529 592 579 518 607
b. Other short-term loans, including commercial paper ………………………………………………………………………………………………………………………………………………………………………………………6,045 5,807 5,847 5,838 6,212 965 1,170 1,143 1,316 1,474
Trade accounts and trade notes payable ……………………………………………………………………………………………………………………………………………………………………………………………………………24,459 25,608 27,396 28,022 27,899 1,595 1,677 1,804 2,051 2,003
Income taxes accrued, prior and current years, net of payments ………………………………………………………………………………………………………………………………………………………………………………1,835 2,349 1,688 1,550 1,493 6 46 (23) 16 60
Current portion of long-term debt, due in 1 year or less:
a. Loans from banks …………………………………………………………………………………………………………………………………………………………………………………………………………………………………2,763 3,524 4,551 4,600 4,187 229 304 304 305 443
b. Other long-term loans ……………………………………………………………………………………………………………………………………………………………………………………………………………………5,266 5,300 4,135 3,473 4,689 231 134 399 377 343
All other current liabilities, including excise and
sales taxes, and accrued expenses ……..……………………………………………………………………………………………………………………………………………………45,383 44,476 44,960 46,441 47,607 1,299 1,391 1,504 1,421 1,846
Total current liabilities ……………………………………………………………………………………………………………………………………………………………………………………………………………………87,252 92,887 93,874 94,288 94,864 4,854 5,315 5,710 6,004 6,775
Long-term debt, due in more than 1 year:
a. Loans from banks …………………………………………………………………………………………………………………………………………………………………………………………………………………………30,134 30,716 30,472 30,567 31,243 850 948 1,151 1,115 1,382
b. Other long-term loans ……………………………………………………………………………………………………………………………………………………………………………………………………………………93,695 96,806 95,124 97,371 98,534 848 839 1,086 696 637
All other noncurrent liabilities, including deferred income taxes,
capitalized leases, and minority stockholders' interest
in consolidated domestic corporations ……………………………………………………………………………………………………………………………………………………………………50,888 55,344 54,525 53,729 52,550 720 481 476 274 290
Total liabilities ……………………………………………………………………………………………………………………………………………………………………………………………………………………………261,970 275,754 273,995 275,955 277,191 7,273 7,582 8,423 8,090 9,083
Capital stock and other capital (less treasury stock) …………………………………………………………………………………………………………………………………………………………………………………………214,844 220,682 221,062 220,925 206,007 7,839 7,759 8,149 6,471 6,704
Retained earnings …………………………………………………………………………………………………………………………………………………………………………………………………………………………………130,641 132,718 139,191 142,434 153,236 (397) (557) (1,267) 1,690 1,405
Stockholders' equity ……………………………………………………………………………………………………………………………………………………………………………………………………………………345,485 353,400 360,252 363,359 359,243 7,441 7,202 6,882 8,161 8,109
Total Liabilities and Stockholders' Equity ………………………………………………………………………………………………………………………………………………………………………………………………607,455 629,154 634,247 639,313 636,435 14,714 14,785 15,305 16,251 17,192
NET WORKING CAPITAL
Excess of total current assets over total current liabilities ………………………………………………………………………………………………………………………………………………………………………………………82,586 74,511 73,015 72,205 70,284 6,367 6,015 6,232 6,789 6,814
SELECTED BALANCE SHEET RATIOS
Total cash, U.S. Government and other securities …………………………………………………………………………………………………………………………………………………………………………………………………11.78 10.82 10.26 9.81 9.61 21.73 21.70 22.77 23.06 24.02
Trade accounts and trade notes receivable ……………………………………………………………………………………………………………………………………………………………………………………………………6.21 6.12 6.37 6.34 6.38 22.94 22.94 23.63 23.07 23.09
Inventories ……………………………………………………………………………………………………………………………………………………………………………………………………………………………………6.01 5.85 5.94 5.96 5.98 27.14 27.31 27.07 26.66 26.15
Total current assets …………………………………………………………………………………………………………………………………………………………………………………………………………………………27.96 26.61 26.31 26.04 25.95 76.26 76.63 78.02 78.73 79.04
Net property, plant, and equipment ……………………………………………………………………………………………………………………………………………………………………………………………………………11.92 11.75 11.81 11.67 11.62 14.61 14.59 14.71 14.03 14.42
Short-term debt, including current portion of long-term debt ………………………………………………………………………………………………………………………………………………………………………………………2.56 3.25 3.13 2.86 2.81 13.28 14.88 15.85 15.48 16.67
Total current liabilities …………………………………………………………………………………………………………………………………………………………………………………………………………………………………14.36 14.76 14.80 14.75 14.91 32.99 35.95 37.31 36.95 39.41
Long-term debt …………………………………………………………………………………………………………………………………………………………………………………………………………………………………20.38 20.27 19.80 20.01 20.39 11.54 12.08 14.61 11.15 11.74
Total liabilities …………………………………………………………………………………………………………………………………………………………………………………………………………………………………43.13 43.83 43.20 43.16 43.55 49.43 51.28 55.03 49.78 52.83
Stockholders' equity ………………………………………………………………………………………………………………………………………………………………………………………………………………………………56.87 56.17 56.80 56.84 56.45 50.57 48.72 44.97 50.22 47.17
1 Included in Computer and Electronic Products.
Table 27.1 -- Balance Sheet For Corporations in NAICS Manufacturing Industry Groups 3343, 3344, 3345, and 3346,
All Total Asset Sizes, and Total Assets Under $25 Million
See the Survey Methodology section of the Introduction for information on survey design, estimation, and sampling error.
(million dollars)
(percent of total assets)
(million dollars)
(percent of total assets)
All Other Electronic Products
All Total Asset Sizes 1
All Other Electronic Products
Total Assets Under $25 Million 1
55U.S. Census Bureau, Quarterly Financial Report, 2014 Quarter 4
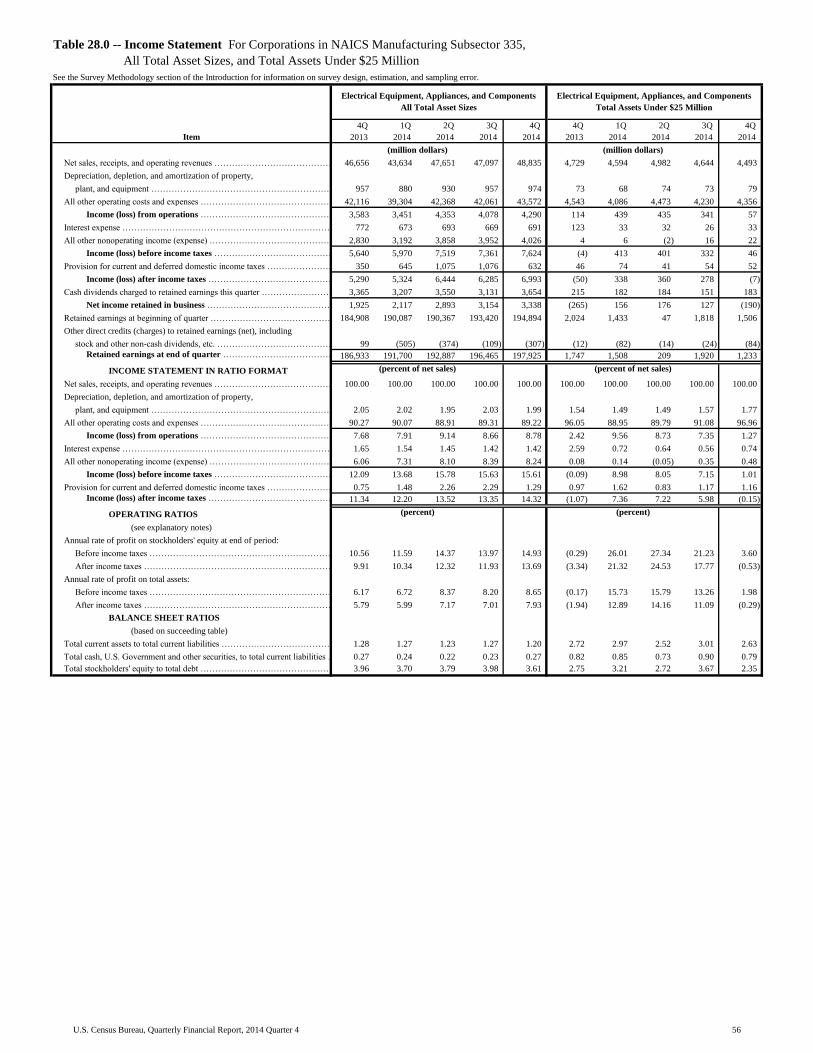
Table with row headers in column A with column headers in rows 5 and 6
Item
4Q_
2013_
1Q_
2014_
2Q_
2014_
3Q_
2014_
4Q_
2014_
4Q_
2013_
1Q_
2014_
2Q_
2014_
3Q_
2014_
4Q_
2014_
Net sales, receipts, and operating revenues ………………………………………………………………………………………………………………………………………………………………………46,656 43,634 47,651 47,097 48,835 4,729 4,594 4,982 4,644 4,493
Depreciation, depletion, and amortization of property,
plant, and equipment …………………………………………………………………………………………………………………………………………………………………………………………957 880 930 957 974 73 68 74 73 79
All other operating costs and expenses …………………………………………………………………………………………………………...……………………………………………………………42,116 39,304 42,368 42,061 43,572 4,543 4,086 4,473 4,230 4,356
Income (loss) from operations …………………………………………………………………………………………………………...……………………………………………………………3,583 3,451 4,353 4,078 4,290 114 439 435 341 57
Interest expense …………………………………………………………………………………………………………………………………………………………………………………………………………………………………………772 673 693 669 691 123 33 32 26 33
All other nonoperating income (expense) ……………………………………………………………………………………………………………………………………………………………………………………………………2,830 3,192 3,858 3,952 4,026 4 6 (2) 16 22
Income (loss) before income taxes ………………………………………………………………………………………………………………………………………………………………………………………………5,640 5,970 7,519 7,361 7,624 (4) 413 401 332 46
Provision for current and deferred domestic income taxes …………………………………………………………………………………………………………………………………………………………………………………………350 645 1,075 1,076 632 46 74 41 54 52
Income (loss) after income taxes …………………………………………………………………………………………………………………………………………………………………………………………………………5,290 5,324 6,444 6,285 6,993 (50) 338 360 278 (7)
Cash dividends charged to retained earnings this quarter ……………………………………………………………………………………………………………………………………………………………………………………3,365 3,207 3,550 3,131 3,654 215 182 184 151 183
Net income retained in business ……………………………………………………………………………………………………………………………………………………………………………………………………1,925 2,117 2,893 3,154 3,338 (265) 156 176 127 (190)
Retained earnings at beginning of quarter …………………………………………………………………………………………………………………………………………………………………………………………………………184,908 190,087 190,367 193,420 194,894 2,024 1,433 47 1,818 1,506
Other direct credits (charges) to retained earnings (net), including
stock and other non-cash dividends, etc. ……………………………………………………………………………………………………………………………………………………………………………………………………………………………99 (505) (374) (109) (307) (12) (82) (14) (24) (84)
Retained earnings at end of quarter ……………………………………………………………………………………………………………………………………………………………………………………………………186,933 191,700 192,887 196,465 197,925 1,747 1,508 209 1,920 1,233
INCOME STATEMENT IN RATIO FORMAT
Net sales, receipts, and operating revenues ……………………………………………………………………………………………………………………………………………………………………………………………………100.00 100.00 100.00 100.00 100.00 100.00 100.00 100.00 100.00 100.00
Depreciation, depletion, and amortization of property,
plant, and equipment ………………………………………………………………………………………………………………………………………………………………………2.05 2.02 1.95 2.03 1.99 1.54 1.49 1.49 1.57 1.77
All other operating costs and expenses ……………………………………………………………………………………………………………………………………………………………………………………………………90.27 90.07 88.91 89.31 89.22 96.05 88.95 89.79 91.08 96.96
Income (loss) from operations …………………………………………………………………………………………………………………………………………………………………………………………………7.68 7.91 9.14 8.66 8.78 2.42 9.56 8.73 7.35 1.27
Interest expense …………………………………………………………………………………………………………………………………………………………………………………………………………………………………1.65 1.54 1.45 1.42 1.42 2.59 0.72 0.64 0.56 0.74
All other nonoperating income (expense) ……………………………………………………………………………………………………………………………………………………………………………………………6.06 7.31 8.10 8.39 8.24 0.08 0.14 (0.05) 0.35 0.48
Income (loss) before income taxes ……………………………………………………………………………………………………………………………………………………………………………………………12.09 13.68 15.78 15.63 15.61 (0.09) 8.98 8.05 7.15 1.01
Provision for current and deferred domestic income taxes ……………………………………………………………………………………………………………………………………………………………………………………0.75 1.48 2.26 2.29 1.29 0.97 1.62 0.83 1.17 1.16
Income (loss) after income taxes ………………………………………………………………………………………………………………………………………………………………………………………………11.34 12.20 13.52 13.35 14.32 (1.07) 7.36 7.22 5.98 (0.15)
OPERATING RATIOS
(see explanatory notes)
Annual rate of profit on stockholders' equity at end of period:
Before income taxes ……………………………………………………………………………………………………………………………………………………………………………………………………………………10.56 11.59 14.37 13.97 14.93 (0.29) 26.01 27.34 21.23 3.60
After income taxes ………………………………………………………………………………………………………………………………………………………………………………………………………………9.91 10.34 12.32 11.93 13.69 (3.34) 21.32 24.53 17.77 (0.53)
Annual rate of profit on total assets:
Before income taxes ………………………………………………………………………………………………………………………………………………………………………………………………………………6.17 6.72 8.37 8.20 8.65 (0.17) 15.73 15.79 13.26 1.98
After income taxes …………………………………………………………………………………………………………………………………………………………………………………………………………………………5.79 5.99 7.17 7.01 7.93 (1.94) 12.89 14.16 11.09 (0.29)
BALANCE SHEET RATIOS
(based on succeeding table)
Total current assets to total current liabilities …………………………………………………………………………………………………………………………………………………………………………………………………1.28 1.27 1.23 1.27 1.20 2.72 2.97 2.52 3.01 2.63
Total cash, U.S. Government and other securities, to total current liabilities …………………………………………………………………………………………………………………………………………………………………0.27 0.24 0.22 0.23 0.27 0.82 0.85 0.73 0.90 0.79
Total stockholders' equity to total debt ………………………………………………………………………………………………………………………………………………………………………………………………………3.96 3.70 3.79 3.98 3.61 2.75 3.21 2.72 3.67 2.35
(percent of net sales) (percent of net sales)
(percent) (percent)
Table 28.0 -- Income Statement For Corporations in NAICS Manufacturing Subsector 335,
All Total Asset Sizes, and Total Assets Under $25 Million
See the Survey Methodology section of the Introduction for information on survey design, estimation, and sampling error.
Electrical Equipment, Appliances, and Components
All Total Asset Sizes
Electrical Equipment, Appliances, and Components
Total Assets Under $25 Million
(million dollars) (million dollars)
56U.S. Census Bureau, Quarterly Financial Report, 2014 Quarter 4
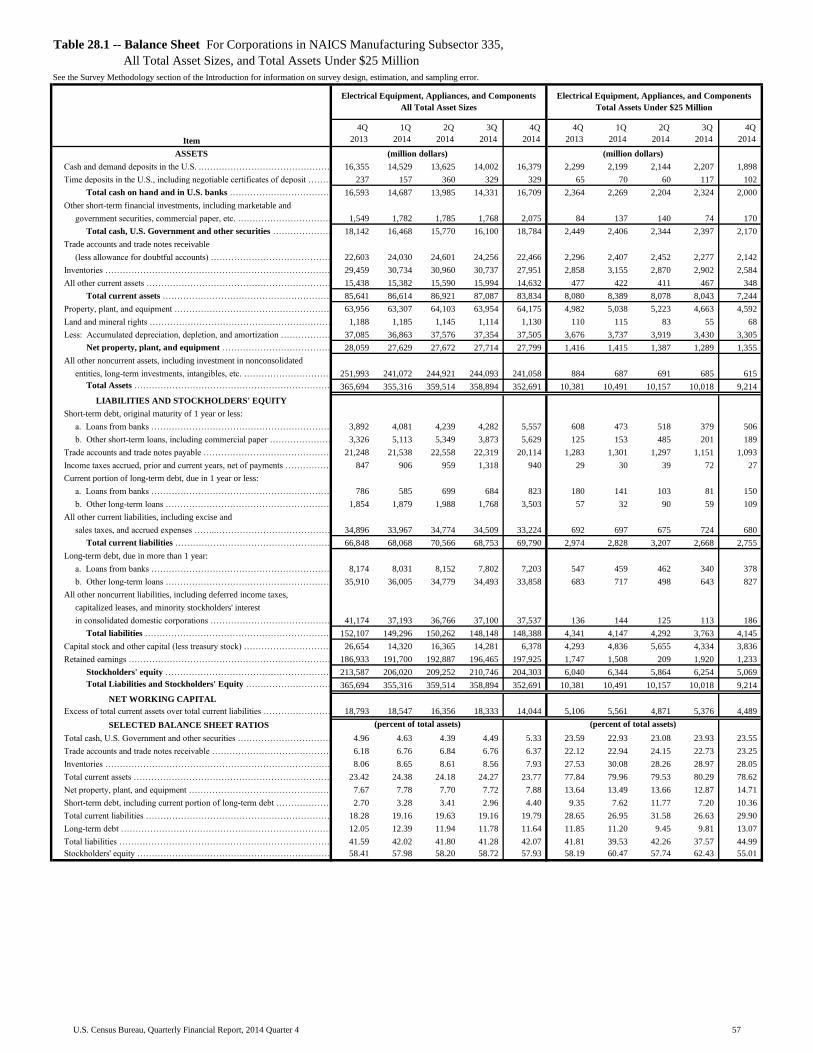
Table with row headers in column A with column headers in rows 5 and 6
Item
4Q_
2013_
1Q_
2014_
2Q_
2014_
3Q_
2014_
4Q_
2014_
4Q_
2013_
1Q_
2014_
2Q_
2014_
3Q_
2014_
4Q_
2014_
ASSETS
Cash and demand deposits in the U.S. .………………………………………………………………………………………………………………………………………………………………………………………………………………………………16,355 14,529 13,625 14,002 16,379 2,299 2,199 2,144 2,207 1,898
Time deposits in the U.S., including negotiable certificates of deposit ……………………………………………………………………………………………………………………………………………………………………………………237 157 360 329 329 65 70 60 117 102
Total cash on hand and in U.S. banks ……………………………………………………………………………………………………………………………………………………………………………………16,593 14,687 13,985 14,331 16,709 2,364 2,269 2,204 2,324 2,000
Other short-term financial investments, including marketable and
government securities, commercial paper, etc. ………………………………………………………………………………………………………………………………………………………………………………………………………………………………1,549 1,782 1,785 1,768 2,075 84 137 140 74 170
Total cash, U.S. Government and other securities ……………………………………………………………………………………………………………………………………………………………………………………18,142 16,468 15,770 16,100 18,784 2,449 2,406 2,344 2,397 2,170
Trade accounts and trade notes receivable
(less allowance for doubtful accounts) …………………………………………………………………………………………………………………………………………22,603 24,030 24,601 24,256 22,466 2,296 2,407 2,452 2,277 2,142
Inventories ………………………………………………………………………………………………………………………………………………………………………………………………………………………………29,459 30,734 30,960 30,737 27,951 2,858 3,155 2,870 2,902 2,584
All other current assets ………………………………………………………………………………………………………………………………………………………………………………………………………………………………15,438 15,382 15,590 15,994 14,632 477 422 411 467 348
Total current assets ………………………………………………………………………………………………………………………………………………………………………………………………………………………………85,641 86,614 86,921 87,087 83,834 8,080 8,389 8,078 8,043 7,244
Property, plant, and equipment ………………………………………………………………………………………………………………………………………………………………………………………………………………………………63,956 63,307 64,103 63,954 64,175 4,982 5,038 5,223 4,663 4,592
Land and mineral rights ………………………………………………………………………………………………………………………………………………………………………………………………………………………………1,188 1,185 1,145 1,114 1,130 110 115 83 55 68
Less: Accumulated depreciation, depletion, and amortization ……………………………………………………………………………………………………………………………………………………………………………………37,085 36,863 37,576 37,354 37,505 3,676 3,737 3,919 3,430 3,305
Net property, plant, and equipment ……………………………………………………………………………………………………………………………………………………………………………………28,059 27,629 27,672 27,714 27,799 1,416 1,415 1,387 1,289 1,355
All other noncurrent assets, including investment in nonconsolidated
entities, long-term investments, intangibles, etc. ………………………………………………………………………………………………………………………………………………………………………………………………………………251,993 241,072 244,921 244,093 241,058 884 687 691 685 615
Total Assets …………………………………………………………………………………………………………………………………………………………………………………………………………………………365,694 355,316 359,514 358,894 352,691 10,381 10,491 10,157 10,018 9,214
LIABILITIES AND STOCKHOLDERS' EQUITY
Short-term debt, original maturity of 1 year or less:
a. Loans from banks ………………………………………………………………………………………………………………………………………………………………………………………………………………………3,892 4,081 4,239 4,282 5,557 608 473 518 379 506
b. Other short-term loans, including commercial paper ………………………………………………………………………………………………………………………………………………………………………………………3,326 5,113 5,349 3,873 5,629 125 153 485 201 189
Trade accounts and trade notes payable ……………………………………………………………………………………………………………………………………………………………………………………………………………21,248 21,538 22,558 22,319 20,114 1,283 1,301 1,297 1,151 1,093
Income taxes accrued, prior and current years, net of payments ………………………………………………………………………………………………………………………………………………………………………………847 906 959 1,318 940 29 30 39 72 27
Current portion of long-term debt, due in 1 year or less:
a. Loans from banks …………………………………………………………………………………………………………………………………………………………………………………………………………………………………786 585 699 684 823 180 141 103 81 150
b. Other long-term loans ……………………………………………………………………………………………………………………………………………………………………………………………………………………1,854 1,879 1,988 1,768 3,503 57 32 90 59 109
All other current liabilities, including excise and
sales taxes, and accrued expenses ……..……………………………………………………………………………………………………………………………………………………34,896 33,967 34,774 34,509 33,224 692 697 675 724 680
Total current liabilities ……………………………………………………………………………………………………………………………………………………………………………………………………………………66,848 68,068 70,566 68,753 69,790 2,974 2,828 3,207 2,668 2,755
Long-term debt, due in more than 1 year:
a. Loans from banks …………………………………………………………………………………………………………………………………………………………………………………………………………………………8,174 8,031 8,152 7,802 7,203 547 459 462 340 378
b. Other long-term loans ……………………………………………………………………………………………………………………………………………………………………………………………………………………35,910 36,005 34,779 34,493 33,858 683 717 498 643 827
All other noncurrent liabilities, including deferred income taxes,
capitalized leases, and minority stockholders' interest
in consolidated domestic corporations ……………………………………………………………………………………………………………………………………………………………………41,174 37,193 36,766 37,100 37,537 136 144 125 113 186
Total liabilities ……………………………………………………………………………………………………………………………………………………………………………………………………………………………152,107 149,296 150,262 148,148 148,388 4,341 4,147 4,292 3,763 4,145
Capital stock and other capital (less treasury stock) …………………………………………………………………………………………………………………………………………………………………………………………26,654 14,320 16,365 14,281 6,378 4,293 4,836 5,655 4,334 3,836
Retained earnings …………………………………………………………………………………………………………………………………………………………………………………………………………………………………186,933 191,700 192,887 196,465 197,925 1,747 1,508 209 1,920 1,233
Stockholders' equity ……………………………………………………………………………………………………………………………………………………………………………………………………………………213,587 206,020 209,252 210,746 204,303 6,040 6,344 5,864 6,254 5,069
Total Liabilities and Stockholders' Equity ………………………………………………………………………………………………………………………………………………………………………………………………365,694 355,316 359,514 358,894 352,691 10,381 10,491 10,157 10,018 9,214
NET WORKING CAPITAL
Excess of total current assets over total current liabilities ………………………………………………………………………………………………………………………………………………………………………………………18,793 18,547 16,356 18,333 14,044 5,106 5,561 4,871 5,376 4,489
SELECTED BALANCE SHEET RATIOS
Total cash, U.S. Government and other securities …………………………………………………………………………………………………………………………………………………………………………………………………4.96 4.63 4.39 4.49 5.33 23.59 22.93 23.08 23.93 23.55
Trade accounts and trade notes receivable ……………………………………………………………………………………………………………………………………………………………………………………………………6.18 6.76 6.84 6.76 6.37 22.12 22.94 24.15 22.73 23.25
Inventories ……………………………………………………………………………………………………………………………………………………………………………………………………………………………………8.06 8.65 8.61 8.56 7.93 27.53 30.08 28.26 28.97 28.05
Total current assets …………………………………………………………………………………………………………………………………………………………………………………………………………………………23.42 24.38 24.18 24.27 23.77 77.84 79.96 79.53 80.29 78.62
Net property, plant, and equipment ……………………………………………………………………………………………………………………………………………………………………………………………………………7.67 7.78 7.70 7.72 7.88 13.64 13.49 13.66 12.87 14.71
Short-term debt, including current portion of long-term debt ………………………………………………………………………………………………………………………………………………………………………………………2.70 3.28 3.41 2.96 4.40 9.35 7.62 11.77 7.20 10.36
Total current liabilities …………………………………………………………………………………………………………………………………………………………………………………………………………………………………18.28 19.16 19.63 19.16 19.79 28.65 26.95 31.58 26.63 29.90
Long-term debt …………………………………………………………………………………………………………………………………………………………………………………………………………………………………12.05 12.39 11.94 11.78 11.64 11.85 11.20 9.45 9.81 13.07
Total liabilities …………………………………………………………………………………………………………………………………………………………………………………………………………………………………41.59 42.02 41.80 41.28 42.07 41.81 39.53 42.26 37.57 44.99
Stockholders' equity ………………………………………………………………………………………………………………………………………………………………………………………………………………………………58.41 57.98 58.20 58.72 57.93 58.19 60.47 57.74 62.43 55.01
Table 28.1 -- Balance Sheet For Corporations in NAICS Manufacturing Subsector 335,
All Total Asset Sizes, and Total Assets Under $25 Million
See the Survey Methodology section of the Introduction for information on survey design, estimation, and sampling error.
(million dollars)
(percent of total assets)
(million dollars)
(percent of total assets)
Electrical Equipment, Appliances, and Components
All Total Asset Sizes
Electrical Equipment, Appliances, and Components
Total Assets Under $25 Million
57U.S. Census Bureau, Quarterly Financial Report, 2014 Quarter 4

Table with row headers in column A with column headers in rows 5 and 6
Item
4Q_
2013_
1Q_
2014_
2Q_
2014_
3Q_
2014_
4Q_
2014_
4Q_
2013_
1Q_
2014_
2Q_
2014_
3Q_
2014_
4Q_
2014_
Net sales, receipts, and operating revenues ………………………………………………………………………………………………………………………………………………………………………265,509 254,540 273,910 273,631 281,777 6,836 6,059 6,810 6,736 6,326
Depreciation, depletion, and amortization of property,
plant, and equipment …………………………………………………………………………………………………………………………………………………………………………………………5,210 4,887 4,830 4,914 5,324 135 108 108 104 126
All other operating costs and expenses …………………………………………………………………………………………………………...……………………………………………………………246,915 235,069 250,897 250,554 258,206 6,443 5,356 6,187 6,305 6,075
Income (loss) from operations …………………………………………………………………………………………………………...……………………………………………………………13,384 14,584 18,184 18,163 18,247 259 596 515 328 126
Interest expense …………………………………………………………………………………………………………………………………………………………………………………………………………………………………………2,495 2,501 2,487 2,554 2,758 53 34 37 39 41
All other nonoperating income (expense) ……………………………………………………………………………………………………………………………………………………………………………………………………8,506 3,533 3,016 4,971 2,420 12 (29) 5 28 8
Income (loss) before income taxes ………………………………………………………………………………………………………………………………………………………………………………………………19,394 15,617 18,713 20,580 17,909 217 533 484 317 93
Provision for current and deferred domestic income taxes …………………………………………………………………………………………………………………………………………………………………………………………2,282 3,386 3,576 4,364 2,962 57 47 67 56 25
Income (loss) after income taxes …………………………………………………………………………………………………………………………………………………………………………………………………………17,112 12,231 15,137 16,216 14,947 161 486 417 261 69
Cash dividends charged to retained earnings this quarter ……………………………………………………………………………………………………………………………………………………………………………………4,561 5,118 7,565 5,137 6,834 107 222 323 206 114
Net income retained in business ……………………………………………………………………………………………………………………………………………………………………………………………………12,551 7,113 7,572 11,080 8,113 54 264 94 55 (45)
Retained earnings at beginning of quarter …………………………………………………………………………………………………………………………………………………………………………………………………………258,778 268,334 273,479 281,103 292,769 4,245 2,630 2,374 3,282 4,594
Other direct credits (charges) to retained earnings (net), including
stock and other non-cash dividends, etc. ……………………………………………………………………………………………………………………………………………………………………………………………………………………………(999) (1,080) (639) (1,581) (3,932) (49) (155) 4 19 (42)
Retained earnings at end of quarter ……………………………………………………………………………………………………………………………………………………………………………………………………270,329 274,366 280,412 290,602 296,950 4,250 2,739 2,472 3,355 4,506
INCOME STATEMENT IN RATIO FORMAT
Net sales, receipts, and operating revenues ……………………………………………………………………………………………………………………………………………………………………………………………………100.00 100.00 100.00 100.00 100.00 100.00 100.00 100.00 100.00 100.00
Depreciation, depletion, and amortization of property,
plant, and equipment ………………………………………………………………………………………………………………………………………………………………………1.96 1.92 1.76 1.80 1.89 1.97 1.78 1.58 1.54 1.99
All other operating costs and expenses ……………………………………………………………………………………………………………………………………………………………………………………………………93.00 92.35 91.60 91.57 91.63 94.24 88.40 90.85 93.59 96.02
Income (loss) from operations …………………………………………………………………………………………………………………………………………………………………………………………………5.04 5.73 6.64 6.64 6.48 3.79 9.83 7.56 4.87 1.99
Interest expense …………………………………………………………………………………………………………………………………………………………………………………………………………………………………0.94 0.98 0.91 0.93 0.98 0.78 0.56 0.54 0.57 0.65
All other nonoperating income (expense) ……………………………………………………………………………………………………………………………………………………………………………………………3.20 1.39 1.10 1.82 0.86 0.17 (0.48) 0.08 0.41 0.13
Income (loss) before income taxes ……………………………………………………………………………………………………………………………………………………………………………………………7.30 6.14 6.83 7.52 6.36 3.18 8.79 7.10 4.70 1.48
Provision for current and deferred domestic income taxes ……………………………………………………………………………………………………………………………………………………………………………………0.86 1.33 1.31 1.59 1.05 0.83 0.77 0.98 0.83 0.39
Income (loss) after income taxes ………………………………………………………………………………………………………………………………………………………………………………………………6.45 4.81 5.53 5.93 5.30 2.35 8.02 6.12 3.87 1.09
OPERATING RATIOS
(see explanatory notes)
Annual rate of profit on stockholders' equity at end of period:
Before income taxes ……………………………………………………………………………………………………………………………………………………………………………………………………………………23.42 18.51 21.87 23.88 22.76 14.29 41.59 38.72 24.76 5.94
After income taxes ………………………………………………………………………………………………………………………………………………………………………………………………………………20.67 14.50 17.69 18.82 19.00 10.57 37.94 33.40 20.39 4.37
Annual rate of profit on total assets:
Before income taxes ………………………………………………………………………………………………………………………………………………………………………………………………………………7.55 5.84 6.86 7.53 6.57 6.42 17.88 16.23 10.66 3.05
After income taxes …………………………………………………………………………………………………………………………………………………………………………………………………………………………6.66 4.57 5.55 5.93 5.48 4.74 16.31 14.00 8.78 2.24
BALANCE SHEET RATIOS
(based on succeeding table)
Total current assets to total current liabilities …………………………………………………………………………………………………………………………………………………………………………………………………1.23 1.21 1.21 1.22 1.22 1.92 1.93 1.85 1.91 2.10
Total cash, U.S. Government and other securities, to total current liabilities …………………………………………………………………………………………………………………………………………………………………0.29 0.25 0.26 0.25 0.26 0.39 0.37 0.35 0.37 0.42
Total stockholders' equity to total debt ………………………………………………………………………………………………………………………………………………………………………………………………………1.87 1.81 1.79 1.79 1.62 1.62 1.48 1.55 1.61 2.36
(percent of net sales) (percent of net sales)
(percent) (percent)
Table 29.0 -- Income Statement For Corporations in NAICS Manufacturing Subsector 336,
All Total Asset Sizes, and Total Assets Under $25 Million
See the Survey Methodology section of the Introduction for information on survey design, estimation, and sampling error.
Transportation Equipment
All Total Asset Sizes
Transportation Equipment
Total Assets Under $25 Million
(million dollars) (million dollars)
58U.S. Census Bureau, Quarterly Financial Report, 2014 Quarter 4
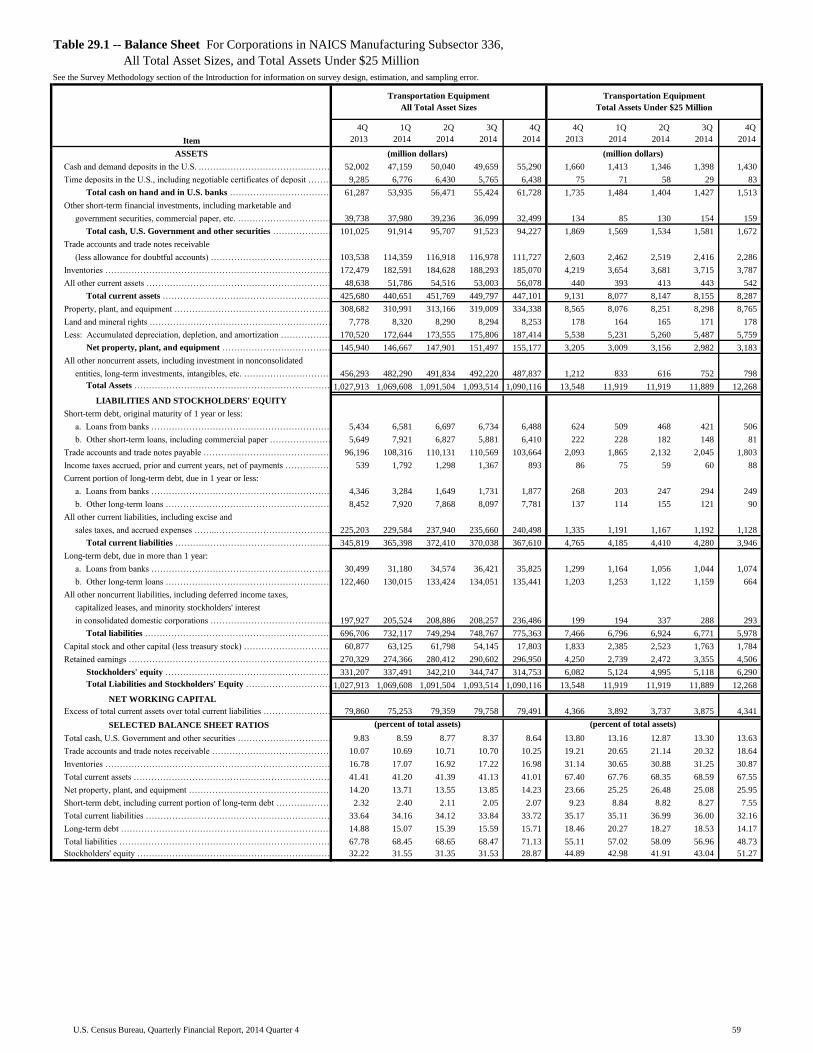
Table with row headers in column A with column headers in rows 5 and 6
Item
4Q_
2013_
1Q_
2014_
2Q_
2014_
3Q_
2014_
4Q_
2014_
4Q_
2013_
1Q_
2014_
2Q_
2014_
3Q_
2014_
4Q_
2014_
ASSETS
Cash and demand deposits in the U.S. .………………………………………………………………………………………………………………………………………………………………………………………………………………………………52,002 47,159 50,040 49,659 55,290 1,660 1,413 1,346 1,398 1,430
Time deposits in the U.S., including negotiable certificates of deposit ……………………………………………………………………………………………………………………………………………………………………………………9,285 6,776 6,430 5,765 6,438 75 71 58 29 83
Total cash on hand and in U.S. banks ……………………………………………………………………………………………………………………………………………………………………………………61,287 53,935 56,471 55,424 61,728 1,735 1,484 1,404 1,427 1,513
Other short-term financial investments, including marketable and
government securities, commercial paper, etc. ………………………………………………………………………………………………………………………………………………………………………………………………………………………………39,738 37,980 39,236 36,099 32,499 134 85 130 154 159
Total cash, U.S. Government and other securities ……………………………………………………………………………………………………………………………………………………………………………………101,025 91,914 95,707 91,523 94,227 1,869 1,569 1,534 1,581 1,672
Trade accounts and trade notes receivable
(less allowance for doubtful accounts) …………………………………………………………………………………………………………………………………………103,538 114,359 116,918 116,978 111,727 2,603 2,462 2,519 2,416 2,286
Inventories ………………………………………………………………………………………………………………………………………………………………………………………………………………………………172,479 182,591 184,628 188,293 185,070 4,219 3,654 3,681 3,715 3,787
All other current assets ………………………………………………………………………………………………………………………………………………………………………………………………………………………………48,638 51,786 54,516 53,003 56,078 440 393 413 443 542
Total current assets ………………………………………………………………………………………………………………………………………………………………………………………………………………………………425,680 440,651 451,769 449,797 447,101 9,131 8,077 8,147 8,155 8,287
Property, plant, and equipment ………………………………………………………………………………………………………………………………………………………………………………………………………………………………308,682 310,991 313,166 319,009 334,338 8,565 8,076 8,251 8,298 8,765
Land and mineral rights ………………………………………………………………………………………………………………………………………………………………………………………………………………………………7,778 8,320 8,290 8,294 8,253 178 164 165 171 178
Less: Accumulated depreciation, depletion, and amortization ……………………………………………………………………………………………………………………………………………………………………………………170,520 172,644 173,555 175,806 187,414 5,538 5,231 5,260 5,487 5,759
Net property, plant, and equipment ……………………………………………………………………………………………………………………………………………………………………………………145,940 146,667 147,901 151,497 155,177 3,205 3,009 3,156 2,982 3,183
All other noncurrent assets, including investment in nonconsolidated
entities, long-term investments, intangibles, etc. ………………………………………………………………………………………………………………………………………………………………………………………………………………456,293 482,290 491,834 492,220 487,837 1,212 833 616 752 798
Total Assets …………………………………………………………………………………………………………………………………………………………………………………………………………………………1,027,913 1,069,608 1,091,504 1,093,514 1,090,116 13,548 11,919 11,919 11,889 12,268
LIABILITIES AND STOCKHOLDERS' EQUITY
Short-term debt, original maturity of 1 year or less:
a. Loans from banks ………………………………………………………………………………………………………………………………………………………………………………………………………………………5,434 6,581 6,697 6,734 6,488 624 509 468 421 506
b. Other short-term loans, including commercial paper ………………………………………………………………………………………………………………………………………………………………………………………5,649 7,921 6,827 5,881 6,410 222 228 182 148 81
Trade accounts and trade notes payable ……………………………………………………………………………………………………………………………………………………………………………………………………………96,196 108,316 110,131 110,569 103,664 2,093 1,865 2,132 2,045 1,803
Income taxes accrued, prior and current years, net of payments ………………………………………………………………………………………………………………………………………………………………………………539 1,792 1,298 1,367 893 86 75 59 60 88
Current portion of long-term debt, due in 1 year or less:
a. Loans from banks …………………………………………………………………………………………………………………………………………………………………………………………………………………………………4,346 3,284 1,649 1,731 1,877 268 203 247 294 249
b. Other long-term loans ……………………………………………………………………………………………………………………………………………………………………………………………………………………8,452 7,920 7,868 8,097 7,781 137 114 155 121 90
All other current liabilities, including excise and
sales taxes, and accrued expenses ……..……………………………………………………………………………………………………………………………………………………225,203 229,584 237,940 235,660 240,498 1,335 1,191 1,167 1,192 1,128
Total current liabilities ……………………………………………………………………………………………………………………………………………………………………………………………………………………345,819 365,398 372,410 370,038 367,610 4,765 4,185 4,410 4,280 3,946
Long-term debt, due in more than 1 year:
a. Loans from banks …………………………………………………………………………………………………………………………………………………………………………………………………………………………30,499 31,180 34,574 36,421 35,825 1,299 1,164 1,056 1,044 1,074
b. Other long-term loans ……………………………………………………………………………………………………………………………………………………………………………………………………………………122,460 130,015 133,424 134,051 135,441 1,203 1,253 1,122 1,159 664
All other noncurrent liabilities, including deferred income taxes,
capitalized leases, and minority stockholders' interest
in consolidated domestic corporations ……………………………………………………………………………………………………………………………………………………………………197,927 205,524 208,886 208,257 236,486 199 194 337 288 293
Total liabilities ……………………………………………………………………………………………………………………………………………………………………………………………………………………………696,706 732,117 749,294 748,767 775,363 7,466 6,796 6,924 6,771 5,978
Capital stock and other capital (less treasury stock) …………………………………………………………………………………………………………………………………………………………………………………………60,877 63,125 61,798 54,145 17,803 1,833 2,385 2,523 1,763 1,784
Retained earnings …………………………………………………………………………………………………………………………………………………………………………………………………………………………………270,329 274,366 280,412 290,602 296,950 4,250 2,739 2,472 3,355 4,506
Stockholders' equity ……………………………………………………………………………………………………………………………………………………………………………………………………………………331,207 337,491 342,210 344,747 314,753 6,082 5,124 4,995 5,118 6,290
Total Liabilities and Stockholders' Equity ………………………………………………………………………………………………………………………………………………………………………………………………1,027,913 1,069,608 1,091,504 1,093,514 1,090,116 13,548 11,919 11,919 11,889 12,268
NET WORKING CAPITAL
Excess of total current assets over total current liabilities ………………………………………………………………………………………………………………………………………………………………………………………79,860 75,253 79,359 79,758 79,491 4,366 3,892 3,737 3,875 4,341
SELECTED BALANCE SHEET RATIOS
Total cash, U.S. Government and other securities …………………………………………………………………………………………………………………………………………………………………………………………………9.83 8.59 8.77 8.37 8.64 13.80 13.16 12.87 13.30 13.63
Trade accounts and trade notes receivable ……………………………………………………………………………………………………………………………………………………………………………………………………10.07 10.69 10.71 10.70 10.25 19.21 20.65 21.14 20.32 18.64
Inventories ……………………………………………………………………………………………………………………………………………………………………………………………………………………………………16.78 17.07 16.92 17.22 16.98 31.14 30.65 30.88 31.25 30.87
Total current assets …………………………………………………………………………………………………………………………………………………………………………………………………………………………41.41 41.20 41.39 41.13 41.01 67.40 67.76 68.35 68.59 67.55
Net property, plant, and equipment ……………………………………………………………………………………………………………………………………………………………………………………………………………14.20 13.71 13.55 13.85 14.23 23.66 25.25 26.48 25.08 25.95
Short-term debt, including current portion of long-term debt ………………………………………………………………………………………………………………………………………………………………………………………2.32 2.40 2.11 2.05 2.07 9.23 8.84 8.82 8.27 7.55
Total current liabilities …………………………………………………………………………………………………………………………………………………………………………………………………………………………………33.64 34.16 34.12 33.84 33.72 35.17 35.11 36.99 36.00 32.16
Long-term debt …………………………………………………………………………………………………………………………………………………………………………………………………………………………………14.88 15.07 15.39 15.59 15.71 18.46 20.27 18.27 18.53 14.17
Total liabilities …………………………………………………………………………………………………………………………………………………………………………………………………………………………………67.78 68.45 68.65 68.47 71.13 55.11 57.02 58.09 56.96 48.73
Stockholders' equity ………………………………………………………………………………………………………………………………………………………………………………………………………………………………32.22 31.55 31.35 31.53 28.87 44.89 42.98 41.91 43.04 51.27
Table 29.1 -- Balance Sheet For Corporations in NAICS Manufacturing Subsector 336,
All Total Asset Sizes, and Total Assets Under $25 Million
See the Survey Methodology section of the Introduction for information on survey design, estimation, and sampling error.
(million dollars)
(percent of total assets)
(million dollars)
(percent of total assets)
Transportation Equipment
All Total Asset Sizes
Transportation Equipment
Total Assets Under $25 Million
59U.S. Census Bureau, Quarterly Financial Report, 2014 Quarter 4

Table with row headers in column A with column headers in rows 5 and 6
Item
4Q_
2013_
1Q_
2014_
2Q_
2014_
3Q_
2014_
4Q_
2014_
4Q_
2013_
1Q_
2014_
2Q_
2014_
3Q_
2014_
4Q_
2014_
Net sales, receipts, and operating revenues ………………………………………………………………………………………………………………………………………………………………………176,034 173,218 186,545 185,461 189,106 4,107 3,467 4,128 3,943 3,800
Depreciation, depletion, and amortization of property,
plant, and equipment …………………………………………………………………………………………………………………………………………………………………………………………3,266 3,256 3,206 3,252 3,524 75 55 55 51 65
All other operating costs and expenses …………………………………………………………………………………………………………...……………………………………………………………166,245 164,311 175,018 174,048 176,468 3,926 3,068 3,763 3,705 3,633
Income (loss) from operations …………………………………………………………………………………………………………...……………………………………………………………6,522 5,651 8,320 8,161 9,114 106 345 309 188 103
Interest expense …………………………………………………………………………………………………………………………………………………………………………………………………………………………………………1,502 1,549 1,530 1,620 1,714 34 16 20 20 23
All other nonoperating income (expense) ……………………………………………………………………………………………………………………………………………………………………………………………………6,771 1,815 1,235 3,524 851 13 (15) 6 1 13
Income (loss) before income taxes ………………………………………………………………………………………………………………………………………………………………………………………………11,792 5,917 8,026 10,065 8,251 85 313 295 169 94
Provision for current and deferred domestic income taxes …………………………………………………………………………………………………………………………………………………………………………………………388 935 1,567 1,673 736 33 29 30 19 16
Income (loss) after income taxes …………………………………………………………………………………………………………………………………………………………………………………………………………11,404 4,982 6,459 8,392 7,516 52 284 265 150 78
Cash dividends charged to retained earnings this quarter ……………………………………………………………………………………………………………………………………………………………………………………2,054 2,911 2,643 2,719 3,632 48 115 136 76 52
Net income retained in business ……………………………………………………………………………………………………………………………………………………………………………………………………9,350 2,071 3,816 5,674 3,884 4 169 129 74 26
Retained earnings at beginning of quarter …………………………………………………………………………………………………………………………………………………………………………………………………………95,671 101,988 103,965 108,465 115,088 2,003 1,506 1,712 2,146 3,084
Other direct credits (charges) to retained earnings (net), including
stock and other non-cash dividends, etc. ……………………………………………………………………………………………………………………………………………………………………………………………………………………………(824) (185) 143 (552) (3,304) 47 (81) 41 10 (57)
Retained earnings at end of quarter ……………………………………………………………………………………………………………………………………………………………………………………………………104,198 103,873 107,924 113,586 115,668 2,054 1,595 1,882 2,230 3,054
INCOME STATEMENT IN RATIO FORMAT
Net sales, receipts, and operating revenues ……………………………………………………………………………………………………………………………………………………………………………………………………100.00 100.00 100.00 100.00 100.00 100.00 100.00 100.00 100.00 100.00
Depreciation, depletion, and amortization of property,
plant, and equipment ………………………………………………………………………………………………………………………………………………………………………1.86 1.88 1.72 1.75 1.86 1.83 1.58 1.34 1.28 1.70
All other operating costs and expenses ……………………………………………………………………………………………………………………………………………………………………………………………………94.44 94.86 93.82 93.85 93.32 95.58 88.48 91.16 93.94 95.58
Income (loss) from operations …………………………………………………………………………………………………………………………………………………………………………………………………3.71 3.26 4.46 4.40 4.82 2.59 9.94 7.50 4.77 2.71
Interest expense …………………………………………………………………………………………………………………………………………………………………………………………………………………………………0.85 0.89 0.82 0.87 0.91 0.83 0.48 0.48 0.50 0.60
All other nonoperating income (expense) ……………………………………………………………………………………………………………………………………………………………………………………………3.85 1.05 0.66 1.90 0.45 0.32 (0.44) 0.14 0.02 0.35
Income (loss) before income taxes ……………………………………………………………………………………………………………………………………………………………………………………………6.70 3.42 4.30 5.43 4.36 2.08 9.03 7.16 4.29 2.46
Provision for current and deferred domestic income taxes ……………………………………………………………………………………………………………………………………………………………………………………0.22 0.54 0.84 0.90 0.39 0.81 0.84 0.73 0.49 0.41
Income (loss) after income taxes ………………………………………………………………………………………………………………………………………………………………………………………………6.48 2.88 3.46 4.53 3.97 1.27 8.19 6.43 3.80 2.05
OPERATING RATIOS
(see explanatory notes)
Annual rate of profit on stockholders' equity at end of period:
Before income taxes ……………………………………………………………………………………………………………………………………………………………………………………………………………………23.94 11.64 15.39 19.18 16.84 11.24 47.74 40.46 25.89 10.64
After income taxes ………………………………………………………………………………………………………………………………………………………………………………………………………………23.16 9.80 12.39 15.99 15.34 6.88 43.32 36.34 22.94 8.87
Annual rate of profit on total assets:
Before income taxes ………………………………………………………………………………………………………………………………………………………………………………………………………………8.32 3.93 5.19 6.47 5.41 4.51 20.62 18.96 11.12 5.65
After income taxes …………………………………………………………………………………………………………………………………………………………………………………………………………………………8.05 3.31 4.18 5.39 4.93 2.76 18.71 17.03 9.85 4.71
BALANCE SHEET RATIOS
(based on succeeding table)
Total current assets to total current liabilities …………………………………………………………………………………………………………………………………………………………………………………………………1.18 1.15 1.18 1.18 1.20 1.65 1.85 1.85 1.78 2.03
Total cash, U.S. Government and other securities, to total current liabilities …………………………………………………………………………………………………………………………………………………………………0.41 0.35 0.37 0.36 0.37 0.32 0.35 0.32 0.29 0.38
Total stockholders' equity to total debt ………………………………………………………………………………………………………………………………………………………………………………………………………2.07 1.96 1.96 1.94 1.80 1.49 1.70 2.19 1.83 3.01
Table 30.0 -- Income Statement For Corporations in NAICS Manufacturing Industry Groups 3361, 3362, and 3363,
All Total Asset Sizes, and Total Assets Under $25 Million
See the Survey Methodology section of the Introduction for information on survey design, estimation, and sampling error.
Motor Vehicles and Parts
All Total Asset Sizes 1
Motor Vehicles and Parts
Total Assets Under $25 Million 1
(million dollars) (million dollars)
(percent of net sales) (percent of net sales)
(percent) (percent)
1 Included in Transportation Equipment.
60U.S. Census Bureau, Quarterly Financial Report, 2014 Quarter 4
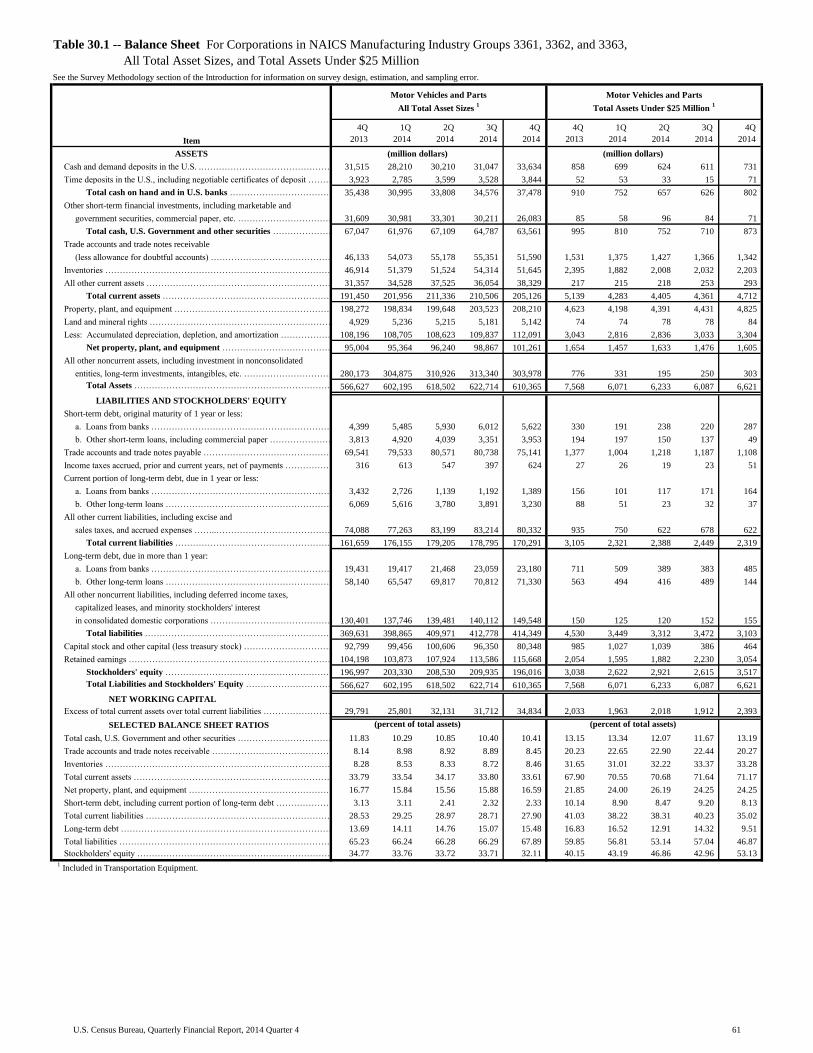
Table with row headers in column A with column headers in rows 5 and 6
Item
4Q_
2013_
1Q_
2014_
2Q_
2014_
3Q_
2014_
4Q_
2014_
4Q_
2013_
1Q_
2014_
2Q_
2014_
3Q_
2014_
4Q_
2014_
ASSETS
Cash and demand deposits in the U.S. .………………………………………………………………………………………………………………………………………………………………………………………………………………………………31,515 28,210 30,210 31,047 33,634 858 699 624 611 731
Time deposits in the U.S., including negotiable certificates of deposit ……………………………………………………………………………………………………………………………………………………………………………………3,923 2,785 3,599 3,528 3,844 52 53 33 15 71
Total cash on hand and in U.S. banks ……………………………………………………………………………………………………………………………………………………………………………………35,438 30,995 33,808 34,576 37,478 910 752 657 626 802
Other short-term financial investments, including marketable and
government securities, commercial paper, etc. ………………………………………………………………………………………………………………………………………………………………………………………………………………………………31,609 30,981 33,301 30,211 26,083 85 58 96 84 71
Total cash, U.S. Government and other securities ……………………………………………………………………………………………………………………………………………………………………………………67,047 61,976 67,109 64,787 63,561 995 810 752 710 873
Trade accounts and trade notes receivable
(less allowance for doubtful accounts) …………………………………………………………………………………………………………………………………………46,133 54,073 55,178 55,351 51,590 1,531 1,375 1,427 1,366 1,342
Inventories ………………………………………………………………………………………………………………………………………………………………………………………………………………………………46,914 51,379 51,524 54,314 51,645 2,395 1,882 2,008 2,032 2,203
All other current assets ………………………………………………………………………………………………………………………………………………………………………………………………………………………………31,357 34,528 37,525 36,054 38,329 217 215 218 253 293
Total current assets ………………………………………………………………………………………………………………………………………………………………………………………………………………………………191,450 201,956 211,336 210,506 205,126 5,139 4,283 4,405 4,361 4,712
Property, plant, and equipment ………………………………………………………………………………………………………………………………………………………………………………………………………………………………198,272 198,834 199,648 203,523 208,210 4,623 4,198 4,391 4,431 4,825
Land and mineral rights ………………………………………………………………………………………………………………………………………………………………………………………………………………………………4,929 5,236 5,215 5,181 5,142 74 74 78 78 84
Less: Accumulated depreciation, depletion, and amortization ……………………………………………………………………………………………………………………………………………………………………………………108,196 108,705 108,623 109,837 112,091 3,043 2,816 2,836 3,033 3,304
Net property, plant, and equipment ……………………………………………………………………………………………………………………………………………………………………………………95,004 95,364 96,240 98,867 101,261 1,654 1,457 1,633 1,476 1,605
All other noncurrent assets, including investment in nonconsolidated
entities, long-term investments, intangibles, etc. ………………………………………………………………………………………………………………………………………………………………………………………………………………280,173 304,875 310,926 313,340 303,978 776 331 195 250 303
Total Assets …………………………………………………………………………………………………………………………………………………………………………………………………………………………566,627 602,195 618,502 622,714 610,365 7,568 6,071 6,233 6,087 6,621
LIABILITIES AND STOCKHOLDERS' EQUITY
Short-term debt, original maturity of 1 year or less:
a. Loans from banks ………………………………………………………………………………………………………………………………………………………………………………………………………………………4,399 5,485 5,930 6,012 5,622 330 191 238 220 287
b. Other short-term loans, including commercial paper ………………………………………………………………………………………………………………………………………………………………………………………3,813 4,920 4,039 3,351 3,953 194 197 150 137 49
Trade accounts and trade notes payable ……………………………………………………………………………………………………………………………………………………………………………………………………………69,541 79,533 80,571 80,738 75,141 1,377 1,004 1,218 1,187 1,108
Income taxes accrued, prior and current years, net of payments ………………………………………………………………………………………………………………………………………………………………………………316 613 547 397 624 27 26 19 23 51
Current portion of long-term debt, due in 1 year or less:
a. Loans from banks …………………………………………………………………………………………………………………………………………………………………………………………………………………………………3,432 2,726 1,139 1,192 1,389 156 101 117 171 164
b. Other long-term loans ……………………………………………………………………………………………………………………………………………………………………………………………………………………6,069 5,616 3,780 3,891 3,230 88 51 23 32 37
All other current liabilities, including excise and
sales taxes, and accrued expenses ……..……………………………………………………………………………………………………………………………………………………74,088 77,263 83,199 83,214 80,332 935 750 622 678 622
Total current liabilities ……………………………………………………………………………………………………………………………………………………………………………………………………………………161,659 176,155 179,205 178,795 170,291 3,105 2,321 2,388 2,449 2,319
Long-term debt, due in more than 1 year:
a. Loans from banks …………………………………………………………………………………………………………………………………………………………………………………………………………………………19,431 19,417 21,468 23,059 23,180 711 509 389 383 485
b. Other long-term loans ……………………………………………………………………………………………………………………………………………………………………………………………………………………58,140 65,547 69,817 70,812 71,330 563 494 416 489 144
All other noncurrent liabilities, including deferred income taxes,
capitalized leases, and minority stockholders' interest
in consolidated domestic corporations ……………………………………………………………………………………………………………………………………………………………………130,401 137,746 139,481 140,112 149,548 150 125 120 152 155
Total liabilities ……………………………………………………………………………………………………………………………………………………………………………………………………………………………369,631 398,865 409,971 412,778 414,349 4,530 3,449 3,312 3,472 3,103
Capital stock and other capital (less treasury stock) …………………………………………………………………………………………………………………………………………………………………………………………92,799 99,456 100,606 96,350 80,348 985 1,027 1,039 386 464
Retained earnings …………………………………………………………………………………………………………………………………………………………………………………………………………………………………104,198 103,873 107,924 113,586 115,668 2,054 1,595 1,882 2,230 3,054
Stockholders' equity ……………………………………………………………………………………………………………………………………………………………………………………………………………………196,997 203,330 208,530 209,935 196,016 3,038 2,622 2,921 2,615 3,517
Total Liabilities and Stockholders' Equity ………………………………………………………………………………………………………………………………………………………………………………………………566,627 602,195 618,502 622,714 610,365 7,568 6,071 6,233 6,087 6,621
NET WORKING CAPITAL
Excess of total current assets over total current liabilities ………………………………………………………………………………………………………………………………………………………………………………………29,791 25,801 32,131 31,712 34,834 2,033 1,963 2,018 1,912 2,393
SELECTED BALANCE SHEET RATIOS
Total cash, U.S. Government and other securities …………………………………………………………………………………………………………………………………………………………………………………………………11.83 10.29 10.85 10.40 10.41 13.15 13.34 12.07 11.67 13.19
Trade accounts and trade notes receivable ……………………………………………………………………………………………………………………………………………………………………………………………………8.14 8.98 8.92 8.89 8.45 20.23 22.65 22.90 22.44 20.27
Inventories ……………………………………………………………………………………………………………………………………………………………………………………………………………………………………8.28 8.53 8.33 8.72 8.46 31.65 31.01 32.22 33.37 33.28
Total current assets …………………………………………………………………………………………………………………………………………………………………………………………………………………………33.79 33.54 34.17 33.80 33.61 67.90 70.55 70.68 71.64 71.17
Net property, plant, and equipment ……………………………………………………………………………………………………………………………………………………………………………………………………………16.77 15.84 15.56 15.88 16.59 21.85 24.00 26.19 24.25 24.25
Short-term debt, including current portion of long-term debt ………………………………………………………………………………………………………………………………………………………………………………………3.13 3.11 2.41 2.32 2.33 10.14 8.90 8.47 9.20 8.13
Total current liabilities …………………………………………………………………………………………………………………………………………………………………………………………………………………………………28.53 29.25 28.97 28.71 27.90 41.03 38.22 38.31 40.23 35.02
Long-term debt …………………………………………………………………………………………………………………………………………………………………………………………………………………………………13.69 14.11 14.76 15.07 15.48 16.83 16.52 12.91 14.32 9.51
Total liabilities …………………………………………………………………………………………………………………………………………………………………………………………………………………………………65.23 66.24 66.28 66.29 67.89 59.85 56.81 53.14 57.04 46.87
Stockholders' equity ………………………………………………………………………………………………………………………………………………………………………………………………………………………………34.77 33.76 33.72 33.71 32.11 40.15 43.19 46.86 42.96 53.13
1 Included in Transportation Equipment.
Table 30.1 -- Balance Sheet For Corporations in NAICS Manufacturing Industry Groups 3361, 3362, and 3363,
All Total Asset Sizes, and Total Assets Under $25 Million
See the Survey Methodology section of the Introduction for information on survey design, estimation, and sampling error.
(million dollars)
(percent of total assets)
(million dollars)
(percent of total assets)
Motor Vehicles and Parts
All Total Asset Sizes 1
Motor Vehicles and Parts
Total Assets Under $25 Million 1
61U.S. Census Bureau, Quarterly Financial Report, 2014 Quarter 4

Table with row headers in column A with column headers in rows 5 and 6
Item
4Q_
2013_
1Q_
2014_
2Q_
2014_
3Q_
2014_
4Q_
2014_
4Q_
2013_
1Q_
2014_
2Q_
2014_
3Q_
2014_
4Q_
2014_
Net sales, receipts, and operating revenues ………………………………………………………………………………………………………………………………………………………………………72,604 64,963 70,293 71,473 74,674 1,035 1,027 1,119 1,082 1,101
Depreciation, depletion, and amortization of property,
plant, and equipment …………………………………………………………………………………………………………………………………………………………………………………………1,483 1,254 1,257 1,279 1,396 26 26 26 24 28
All other operating costs and expenses …………………………………………………………………………………………………………...……………………………………………………………65,873 56,983 61,417 62,143 65,942 931 887 971 1,009 1,046
Income (loss) from operations …………………………………………………………………………………………………………...……………………………………………………………5,248 6,727 7,619 8,051 7,337 78 115 122 48 27
Interest expense …………………………………………………………………………………………………………………………………………………………………………………………………………………………………………800 807 812 791 856 8 8 8 8 7
All other nonoperating income (expense) ……………………………………………………………………………………………………………………………………………………………………………………………………1,688 1,574 1,623 1,261 1,326 (4) (7) 3 22 (4)
Income (loss) before income taxes ………………………………………………………………………………………………………………………………………………………………………………………………6,136 7,494 8,429 8,521 7,806 66 100 117 63 16
Provision for current and deferred domestic income taxes …………………………………………………………………………………………………………………………………………………………………………………………1,412 1,836 1,332 2,126 1,705 10 5 14 7 6
Income (loss) after income taxes …………………………………………………………………………………………………………………………………………………………………………………………………………4,725 5,658 7,097 6,395 6,101 57 95 103 56 10
Cash dividends charged to retained earnings this quarter ……………………………………………………………………………………………………………………………………………………………………………………2,172 1,751 4,376 2,016 2,806 33 35 47 69 39
Net income retained in business ……………………………………………………………………………………………………………………………………………………………………………………………………2,552 3,907 2,721 4,380 3,295 24 60 56 (14) (29)
Retained earnings at beginning of quarter …………………………………………………………………………………………………………………………………………………………………………………………………………130,074 132,325 135,213 137,070 140,858 994 726 534 902 1,331
Other direct credits (charges) to retained earnings (net), including
stock and other non-cash dividends, etc. ……………………………………………………………………………………………………………………………………………………………………………………………………………………………(161) (868) (770) (1,069) (651) (98) (33) (15) (1) (7)
Retained earnings at end of quarter ……………………………………………………………………………………………………………………………………………………………………………………………………132,466 135,364 137,163 140,380 143,501 920 753 576 888 1,295
INCOME STATEMENT IN RATIO FORMAT
Net sales, receipts, and operating revenues ……………………………………………………………………………………………………………………………………………………………………………………………………100.00 100.00 100.00 100.00 100.00 100.00 100.00 100.00 100.00 100.00
Depreciation, depletion, and amortization of property,
plant, and equipment ………………………………………………………………………………………………………………………………………………………………………2.04 1.93 1.79 1.79 1.87 2.48 2.49 2.33 2.26 2.53
All other operating costs and expenses ……………………………………………………………………………………………………………………………………………………………………………………………………90.73 87.72 87.37 86.95 88.31 89.94 86.32 86.75 93.27 95.01
Income (loss) from operations …………………………………………………………………………………………………………………………………………………………………………………………………7.23 10.35 10.84 11.26 9.83 7.58 11.19 10.91 4.47 2.46
Interest expense …………………………………………………………………………………………………………………………………………………………………………………………………………………………………1.10 1.24 1.16 1.11 1.15 0.82 0.79 0.74 0.71 0.68
All other nonoperating income (expense) ……………………………………………………………………………………………………………………………………………………………………………………………2.33 2.42 2.31 1.76 1.78 (0.36) (0.68) 0.30 2.03 (0.34)
Income (loss) before income taxes ……………………………………………………………………………………………………………………………………………………………………………………………8.45 11.54 11.99 11.92 10.45 6.40 9.72 10.48 5.78 1.44
Provision for current and deferred domestic income taxes ……………………………………………………………………………………………………………………………………………………………………………………1.94 2.83 1.90 2.97 2.28 0.94 0.45 1.27 0.63 0.55
Income (loss) after income taxes ………………………………………………………………………………………………………………………………………………………………………………………………6.51 8.71 10.10 8.95 8.17 5.46 9.26 9.21 5.15 0.89
OPERATING RATIOS
(see explanatory notes)
Annual rate of profit on stockholders' equity at end of period:
Before income taxes ……………………………………………………………………………………………………………………………………………………………………………………………………………………23.49 28.97 32.46 32.71 35.06 19.62 33.75 41.74 19.27 3.90
After income taxes ………………………………………………………………………………………………………………………………………………………………………………………………………………18.08 21.88 27.33 24.55 27.40 16.74 32.18 36.67 17.15 2.42
Annual rate of profit on total assets:
Before income taxes ………………………………………………………………………………………………………………………………………………………………………………………………………………6.70 8.04 8.91 9.09 8.15 10.49 15.59 18.14 9.64 2.43
After income taxes …………………………………………………………………………………………………………………………………………………………………………………………………………………………5.16 6.07 7.50 6.82 6.37 8.94 14.86 15.94 8.58 1.51
BALANCE SHEET RATIOS
(based on succeeding table)
Total current assets to total current liabilities …………………………………………………………………………………………………………………………………………………………………………………………………1.27 1.26 1.24 1.25 1.22 3.06 2.56 2.25 2.65 2.97
Total cash, U.S. Government and other securities, to total current liabilities …………………………………………………………………………………………………………………………………………………………………0.19 0.15 0.14 0.13 0.15 0.48 0.35 0.30 0.39 0.51
Total stockholders' equity to total debt ………………………………………………………………………………………………………………………………………………………………………………………………………1.53 1.47 1.44 1.46 1.25 1.76 1.29 1.22 1.61 2.94
Table 31.0 -- Income Statement For Corporations in NAICS Manufacturing Industry Group 3364,
All Total Asset Sizes, and Total Assets Under $25 Million
See the Survey Methodology section of the Introduction for information on survey design, estimation, and sampling error.
Aerospace Products and Parts
All Total Asset Sizes 1
Aerospace Products and Parts
Total Assets Under $25 Million 1
(million dollars) (million dollars)
(percent of net sales) (percent of net sales)
(percent) (percent)
1 Included in Transportation Equipment.
62U.S. Census Bureau, Quarterly Financial Report, 2014 Quarter 4
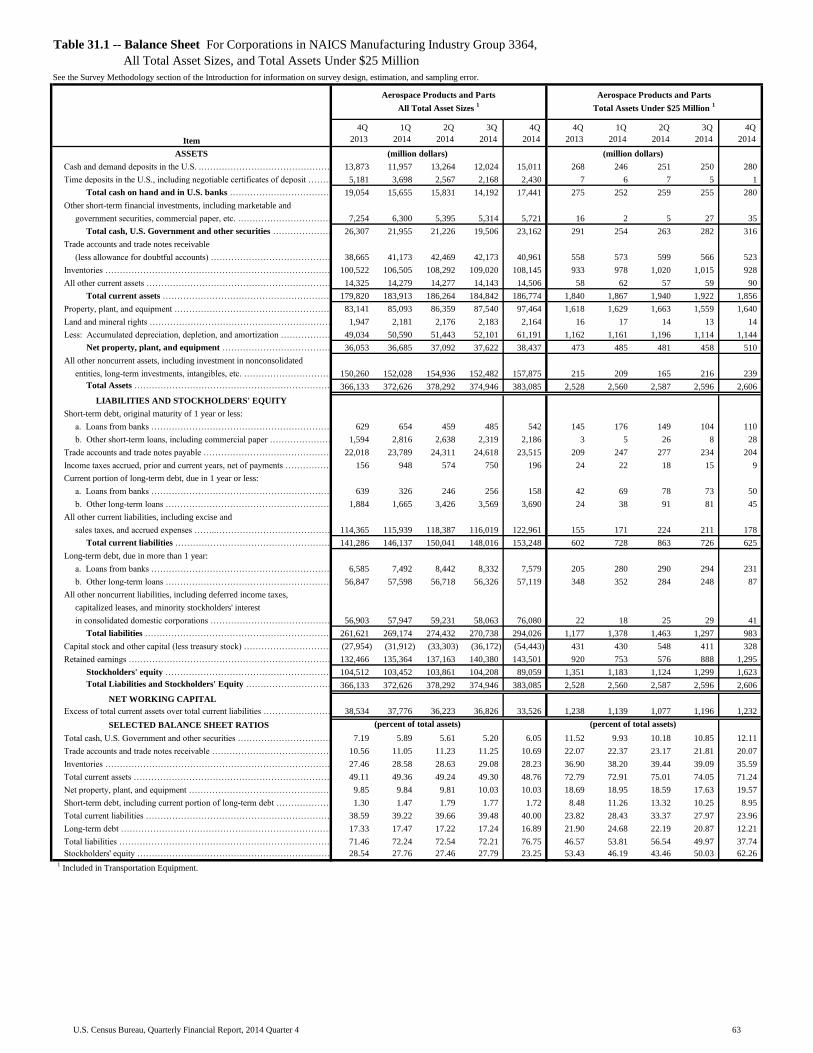
Table with row headers in column A with column headers in rows 5 and 6
Item
4Q_
2013_
1Q_
2014_
2Q_
2014_
3Q_
2014_
4Q_
2014_
4Q_
2013_
1Q_
2014_
2Q_
2014_
3Q_
2014_
4Q_
2014_
ASSETS
Cash and demand deposits in the U.S. .………………………………………………………………………………………………………………………………………………………………………………………………………………………………13,873 11,957 13,264 12,024 15,011 268 246 251 250 280
Time deposits in the U.S., including negotiable certificates of deposit ……………………………………………………………………………………………………………………………………………………………………………………5,181 3,698 2,567 2,168 2,430 7 6 7 5 1
Total cash on hand and in U.S. banks ……………………………………………………………………………………………………………………………………………………………………………………19,054 15,655 15,831 14,192 17,441 275 252 259 255 280
Other short-term financial investments, including marketable and
government securities, commercial paper, etc. ………………………………………………………………………………………………………………………………………………………………………………………………………………………………7,254 6,300 5,395 5,314 5,721 16 2 5 27 35
Total cash, U.S. Government and other securities ……………………………………………………………………………………………………………………………………………………………………………………26,307 21,955 21,226 19,506 23,162 291 254 263 282 316
Trade accounts and trade notes receivable
(less allowance for doubtful accounts) …………………………………………………………………………………………………………………………………………38,665 41,173 42,469 42,173 40,961 558 573 599 566 523
Inventories ………………………………………………………………………………………………………………………………………………………………………………………………………………………………100,522 106,505 108,292 109,020 108,145 933 978 1,020 1,015 928
All other current assets ………………………………………………………………………………………………………………………………………………………………………………………………………………………………14,325 14,279 14,277 14,143 14,506 58 62 57 59 90
Total current assets ………………………………………………………………………………………………………………………………………………………………………………………………………………………………179,820 183,913 186,264 184,842 186,774 1,840 1,867 1,940 1,922 1,856
Property, plant, and equipment ………………………………………………………………………………………………………………………………………………………………………………………………………………………………83,141 85,093 86,359 87,540 97,464 1,618 1,629 1,663 1,559 1,640
Land and mineral rights ………………………………………………………………………………………………………………………………………………………………………………………………………………………………1,947 2,181 2,176 2,183 2,164 16 17 14 13 14
Less: Accumulated depreciation, depletion, and amortization ……………………………………………………………………………………………………………………………………………………………………………………49,034 50,590 51,443 52,101 61,191 1,162 1,161 1,196 1,114 1,144
Net property, plant, and equipment ……………………………………………………………………………………………………………………………………………………………………………………36,053 36,685 37,092 37,622 38,437 473 485 481 458 510
All other noncurrent assets, including investment in nonconsolidated
entities, long-term investments, intangibles, etc. ………………………………………………………………………………………………………………………………………………………………………………………………………………150,260 152,028 154,936 152,482 157,875 215 209 165 216 239
Total Assets …………………………………………………………………………………………………………………………………………………………………………………………………………………………366,133 372,626 378,292 374,946 383,085 2,528 2,560 2,587 2,596 2,606
LIABILITIES AND STOCKHOLDERS' EQUITY
Short-term debt, original maturity of 1 year or less:
a. Loans from banks ………………………………………………………………………………………………………………………………………………………………………………………………………………………629 654 459 485 542 145 176 149 104 110
b. Other short-term loans, including commercial paper ………………………………………………………………………………………………………………………………………………………………………………………1,594 2,816 2,638 2,319 2,186 3 5 26 8 28
Trade accounts and trade notes payable ……………………………………………………………………………………………………………………………………………………………………………………………………………22,018 23,789 24,311 24,618 23,515 209 247 277 234 204
Income taxes accrued, prior and current years, net of payments ………………………………………………………………………………………………………………………………………………………………………………156 948 574 750 196 24 22 18 15 9
Current portion of long-term debt, due in 1 year or less:
a. Loans from banks …………………………………………………………………………………………………………………………………………………………………………………………………………………………………639 326 246 256 158 42 69 78 73 50
b. Other long-term loans ……………………………………………………………………………………………………………………………………………………………………………………………………………………1,884 1,665 3,426 3,569 3,690 24 38 91 81 45
All other current liabilities, including excise and
sales taxes, and accrued expenses ……..……………………………………………………………………………………………………………………………………………………114,365 115,939 118,387 116,019 122,961 155 171 224 211 178
Total current liabilities ……………………………………………………………………………………………………………………………………………………………………………………………………………………141,286 146,137 150,041 148,016 153,248 602 728 863 726 625
Long-term debt, due in more than 1 year:
a. Loans from banks …………………………………………………………………………………………………………………………………………………………………………………………………………………………6,585 7,492 8,442 8,332 7,579 205 280 290 294 231
b. Other long-term loans ……………………………………………………………………………………………………………………………………………………………………………………………………………………56,847 57,598 56,718 56,326 57,119 348 352 284 248 87
All other noncurrent liabilities, including deferred income taxes,
capitalized leases, and minority stockholders' interest
in consolidated domestic corporations ……………………………………………………………………………………………………………………………………………………………………56,903 57,947 59,231 58,063 76,080 22 18 25 29 41
Total liabilities ……………………………………………………………………………………………………………………………………………………………………………………………………………………………261,621 269,174 274,432 270,738 294,026 1,177 1,378 1,463 1,297 983
Capital stock and other capital (less treasury stock) …………………………………………………………………………………………………………………………………………………………………………………………(27,954) (31,912) (33,303) (36,172) (54,443) 431 430 548 411 328
Retained earnings …………………………………………………………………………………………………………………………………………………………………………………………………………………………………132,466 135,364 137,163 140,380 143,501 920 753 576 888 1,295
Stockholders' equity ……………………………………………………………………………………………………………………………………………………………………………………………………………………104,512 103,452 103,861 104,208 89,059 1,351 1,183 1,124 1,299 1,623
Total Liabilities and Stockholders' Equity ………………………………………………………………………………………………………………………………………………………………………………………………366,133 372,626 378,292 374,946 383,085 2,528 2,560 2,587 2,596 2,606
NET WORKING CAPITAL
Excess of total current assets over total current liabilities ………………………………………………………………………………………………………………………………………………………………………………………38,534 37,776 36,223 36,826 33,526 1,238 1,139 1,077 1,196 1,232
SELECTED BALANCE SHEET RATIOS
Total cash, U.S. Government and other securities …………………………………………………………………………………………………………………………………………………………………………………………………7.19 5.89 5.61 5.20 6.05 11.52 9.93 10.18 10.85 12.11
Trade accounts and trade notes receivable ……………………………………………………………………………………………………………………………………………………………………………………………………10.56 11.05 11.23 11.25 10.69 22.07 22.37 23.17 21.81 20.07
Inventories ……………………………………………………………………………………………………………………………………………………………………………………………………………………………………27.46 28.58 28.63 29.08 28.23 36.90 38.20 39.44 39.09 35.59
Total current assets …………………………………………………………………………………………………………………………………………………………………………………………………………………………49.11 49.36 49.24 49.30 48.76 72.79 72.91 75.01 74.05 71.24
Net property, plant, and equipment ……………………………………………………………………………………………………………………………………………………………………………………………………………9.85 9.84 9.81 10.03 10.03 18.69 18.95 18.59 17.63 19.57
Short-term debt, including current portion of long-term debt ………………………………………………………………………………………………………………………………………………………………………………………1.30 1.47 1.79 1.77 1.72 8.48 11.26 13.32 10.25 8.95
Total current liabilities …………………………………………………………………………………………………………………………………………………………………………………………………………………………………38.59 39.22 39.66 39.48 40.00 23.82 28.43 33.37 27.97 23.96
Long-term debt …………………………………………………………………………………………………………………………………………………………………………………………………………………………………17.33 17.47 17.22 17.24 16.89 21.90 24.68 22.19 20.87 12.21
Total liabilities …………………………………………………………………………………………………………………………………………………………………………………………………………………………………71.46 72.24 72.54 72.21 76.75 46.57 53.81 56.54 49.97 37.74
Stockholders' equity ………………………………………………………………………………………………………………………………………………………………………………………………………………………………28.54 27.76 27.46 27.79 23.25 53.43 46.19 43.46 50.03 62.26
1 Included in Transportation Equipment.
Table 31.1 -- Balance Sheet For Corporations in NAICS Manufacturing Industry Group 3364,
All Total Asset Sizes, and Total Assets Under $25 Million
See the Survey Methodology section of the Introduction for information on survey design, estimation, and sampling error.
(million dollars)
(percent of total assets)
(million dollars)
(percent of total assets)
Aerospace Products and Parts
All Total Asset Sizes 1
Aerospace Products and Parts
Total Assets Under $25 Million 1
63U.S. Census Bureau, Quarterly Financial Report, 2014 Quarter 4

Table with row headers in column A with column headers in rows 5 and 6
Item
4Q_
2013_
1Q_
2014_
2Q_
2014_
3Q_
2014_
4Q_
2014_
4Q_
2013_
1Q_
2014_
2Q_
2014_
3Q_
2014_
4Q_
2014_
Net sales, receipts, and operating revenues ………………………………………………………………………………………………………………………………………………………………………18,019 17,091 18,628 19,968 18,633 5,618 5,364 6,167 6,735 6,334
Depreciation, depletion, and amortization of property,
plant, and equipment …………………………………………………………………………………………………………………………………………………………………………………………310 306 363 418 402 78 74 73 74 111
All other operating costs and expenses …………………………………………………………………………………………………………...……………………………………………………………16,859 15,875 16,624 17,948 17,362 5,482 5,071 5,508 6,012 6,089
Income (loss) from operations …………………………………………………………………………………………………………...……………………………………………………………850 909 1,641 1,602 870 58 219 586 649 134
Interest expense …………………………………………………………………………………………………………………………………………………………………………………………………………………………………………211 196 199 212 193 42 33 43 35 32
All other nonoperating income (expense) ……………………………………………………………………………………………………………………………………………………………………………………………………(185) 126 (13) (21) 8 11 62 (12) (45) 20
Income (loss) before income taxes ………………………………………………………………………………………………………………………………………………………………………………………………453 839 1,430 1,370 685 27 248 531 570 122
Provision for current and deferred domestic income taxes …………………………………………………………………………………………………………………………………………………………………………………………81 98 145 (239) 155 24 14 20 20 29
Income (loss) after income taxes …………………………………………………………………………………………………………………………………………………………………………………………………………372 742 1,285 1,609 531 3 234 511 549 93
Cash dividends charged to retained earnings this quarter ……………………………………………………………………………………………………………………………………………………………………………………462 380 548 470 488 139 157 225 198 276
Net income retained in business ……………………………………………………………………………………………………………………………………………………………………………………………………(90) 361 737 1,139 43 (136) 77 287 352 (183)
Retained earnings at beginning of quarter …………………………………………………………………………………………………………………………………………………………………………………………………………13,256 13,389 13,108 13,142 14,895 3,020 2,862 2,806 2,193 3,240
Other direct credits (charges) to retained earnings (net), including
stock and other non-cash dividends, etc. ……………………………………………………………………………………………………………………………………………………………………………………………………………………………(10) (63) 3 (200) (121) 54 (42) 36 (54) 18
Retained earnings at end of quarter ……………………………………………………………………………………………………………………………………………………………………………………………………13,156 13,687 13,849 14,080 14,817 2,939 2,897 3,129 2,490 3,075
INCOME STATEMENT IN RATIO FORMAT
Net sales, receipts, and operating revenues ……………………………………………………………………………………………………………………………………………………………………………………………………100.00 100.00 100.00 100.00 100.00 100.00 100.00 100.00 100.00 100.00
Depreciation, depletion, and amortization of property,
plant, and equipment ………………………………………………………………………………………………………………………………………………………………………1.72 1.79 1.95 2.09 2.16 1.39 1.38 1.18 1.10 1.75
All other operating costs and expenses ……………………………………………………………………………………………………………………………………………………………………………………………………93.56 92.89 89.24 89.88 93.17 97.58 94.54 89.32 89.27 96.12
Income (loss) from operations …………………………………………………………………………………………………………………………………………………………………………………………………4.72 5.32 8.81 8.02 4.67 1.03 4.08 9.51 9.64 2.12
Interest expense …………………………………………………………………………………………………………………………………………………………………………………………………………………………………1.17 1.15 1.07 1.06 1.03 0.75 0.61 0.69 0.51 0.51
All other nonoperating income (expense) ……………………………………………………………………………………………………………………………………………………………………………………………(1.03) 0.74 (0.07) (0.11) 0.04 0.20 1.15 (0.20) (0.66) 0.31
Income (loss) before income taxes ……………………………………………………………………………………………………………………………………………………………………………………………2.51 4.91 7.67 6.86 3.68 0.48 4.62 8.61 8.46 1.92
Provision for current and deferred domestic income taxes ……………………………………………………………………………………………………………………………………………………………………………………0.45 0.57 0.78 (1.20) 0.83 0.42 0.26 0.32 0.30 0.46
Income (loss) after income taxes ………………………………………………………………………………………………………………………………………………………………………………………………2.06 4.34 6.90 8.06 2.85 0.05 4.36 8.29 8.16 1.46
OPERATING RATIOS
(see explanatory notes)
Annual rate of profit on stockholders' equity at end of period:
Before income taxes ……………………………………………………………………………………………………………………………………………………………………………………………………………………9.07 16.85 28.67 26.57 13.87 2.79 26.93 52.99 51.05 11.62
After income taxes ………………………………………………………………………………………………………………………………………………………………………………………………………………7.45 14.89 25.77 31.22 10.74 0.31 25.42 51.02 49.22 8.83
Annual rate of profit on total assets:
Before income taxes ………………………………………………………………………………………………………………………………………………………………………………………………………………3.66 6.76 11.34 10.68 5.49 1.13 10.80 22.19 22.34 4.86
After income taxes …………………………………………………………………………………………………………………………………………………………………………………………………………………………3.00 5.97 10.20 12.55 4.25 0.13 10.19 21.37 21.54 3.69
BALANCE SHEET RATIOS
(based on succeeding table)
Total current assets to total current liabilities …………………………………………………………………………………………………………………………………………………………………………………………………1.84 1.81 1.70 1.66 1.71 1.96 1.83 1.86 1.94 1.87
Total cash, U.S. Government and other securities, to total current liabilities …………………………………………………………………………………………………………………………………………………………………0.42 0.40 0.40 0.37 0.41 0.34 0.34 0.38 0.38 0.35
Total stockholders' equity to total debt ………………………………………………………………………………………………………………………………………………………………………………………………………1.42 1.37 1.33 1.36 1.38 1.25 1.25 1.42 1.58 1.48
(percent of net sales) (percent of net sales)
(percent) (percent)
Table 32.0 -- Income Statement For Corporations in NAICS Manufacturing Subsector 337,
All Total Asset Sizes, and Total Assets Under $25 Million
See the Survey Methodology section of the Introduction for information on survey design, estimation, and sampling error.
Furniture and Related Products
All Total Asset Sizes
Furniture and Related Products
Total Assets Under $25 Million
(million dollars) (million dollars)
64U.S. Census Bureau, Quarterly Financial Report, 2014 Quarter 4
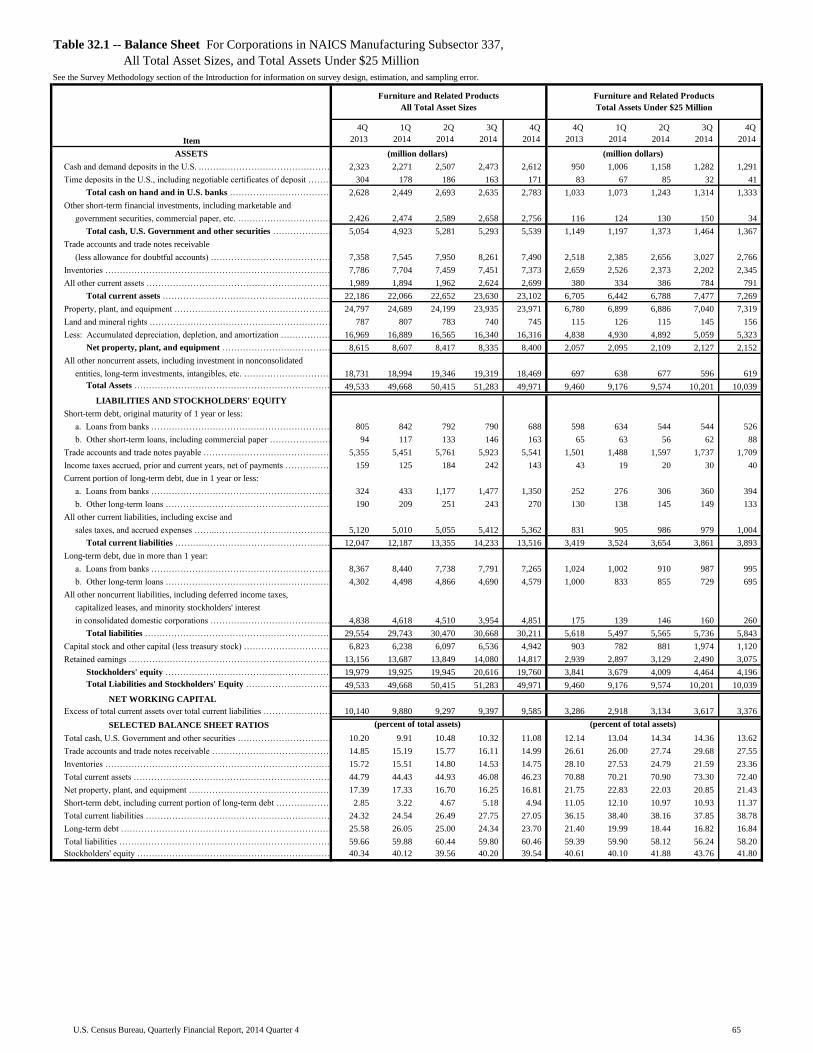
Table with row headers in column A with column headers in rows 5 and 6
Item
4Q_
2013_
1Q_
2014_
2Q_
2014_
3Q_
2014_
4Q_
2014_
4Q_
2013_
1Q_
2014_
2Q_
2014_
3Q_
2014_
4Q_
2014_
ASSETS
Cash and demand deposits in the U.S. .………………………………………………………………………………………………………………………………………………………………………………………………………………………………2,323 2,271 2,507 2,473 2,612 950 1,006 1,158 1,282 1,291
Time deposits in the U.S., including negotiable certificates of deposit ……………………………………………………………………………………………………………………………………………………………………………………304 178 186 163 171 83 67 85 32 41
Total cash on hand and in U.S. banks ……………………………………………………………………………………………………………………………………………………………………………………2,628 2,449 2,693 2,635 2,783 1,033 1,073 1,243 1,314 1,333
Other short-term financial investments, including marketable and
government securities, commercial paper, etc. ………………………………………………………………………………………………………………………………………………………………………………………………………………………………2,426 2,474 2,589 2,658 2,756 116 124 130 150 34
Total cash, U.S. Government and other securities ……………………………………………………………………………………………………………………………………………………………………………………5,054 4,923 5,281 5,293 5,539 1,149 1,197 1,373 1,464 1,367
Trade accounts and trade notes receivable
(less allowance for doubtful accounts) …………………………………………………………………………………………………………………………………………7,358 7,545 7,950 8,261 7,490 2,518 2,385 2,656 3,027 2,766
Inventories ………………………………………………………………………………………………………………………………………………………………………………………………………………………………7,786 7,704 7,459 7,451 7,373 2,659 2,526 2,373 2,202 2,345
All other current assets ………………………………………………………………………………………………………………………………………………………………………………………………………………………………1,989 1,894 1,962 2,624 2,699 380 334 386 784 791
Total current assets ………………………………………………………………………………………………………………………………………………………………………………………………………………………………22,186 22,066 22,652 23,630 23,102 6,705 6,442 6,788 7,477 7,269
Property, plant, and equipment ………………………………………………………………………………………………………………………………………………………………………………………………………………………………24,797 24,689 24,199 23,935 23,971 6,780 6,899 6,886 7,040 7,319
Land and mineral rights ………………………………………………………………………………………………………………………………………………………………………………………………………………………………787 807 783 740 745 115 126 115 145 156
Less: Accumulated depreciation, depletion, and amortization ……………………………………………………………………………………………………………………………………………………………………………………16,969 16,889 16,565 16,340 16,316 4,838 4,930 4,892 5,059 5,323
Net property, plant, and equipment ……………………………………………………………………………………………………………………………………………………………………………………8,615 8,607 8,417 8,335 8,400 2,057 2,095 2,109 2,127 2,152
All other noncurrent assets, including investment in nonconsolidated
entities, long-term investments, intangibles, etc. ………………………………………………………………………………………………………………………………………………………………………………………………………………18,731 18,994 19,346 19,319 18,469 697 638 677 596 619
Total Assets …………………………………………………………………………………………………………………………………………………………………………………………………………………………49,533 49,668 50,415 51,283 49,971 9,460 9,176 9,574 10,201 10,039
LIABILITIES AND STOCKHOLDERS' EQUITY
Short-term debt, original maturity of 1 year or less:
a. Loans from banks ………………………………………………………………………………………………………………………………………………………………………………………………………………………805 842 792 790 688 598 634 544 544 526
b. Other short-term loans, including commercial paper ………………………………………………………………………………………………………………………………………………………………………………………94 117 133 146 163 65 63 56 62 88
Trade accounts and trade notes payable ……………………………………………………………………………………………………………………………………………………………………………………………………………5,355 5,451 5,761 5,923 5,541 1,501 1,488 1,597 1,737 1,709
Income taxes accrued, prior and current years, net of payments ………………………………………………………………………………………………………………………………………………………………………………159 125 184 242 143 43 19 20 30 40
Current portion of long-term debt, due in 1 year or less:
a. Loans from banks …………………………………………………………………………………………………………………………………………………………………………………………………………………………………324 433 1,177 1,477 1,350 252 276 306 360 394
b. Other long-term loans ……………………………………………………………………………………………………………………………………………………………………………………………………………………190 209 251 243 270 130 138 145 149 133
All other current liabilities, including excise and
sales taxes, and accrued expenses ……..……………………………………………………………………………………………………………………………………………………5,120 5,010 5,055 5,412 5,362 831 905 986 979 1,004
Total current liabilities ……………………………………………………………………………………………………………………………………………………………………………………………………………………12,047 12,187 13,355 14,233 13,516 3,419 3,524 3,654 3,861 3,893
Long-term debt, due in more than 1 year:
a. Loans from banks …………………………………………………………………………………………………………………………………………………………………………………………………………………………8,367 8,440 7,738 7,791 7,265 1,024 1,002 910 987 995
b. Other long-term loans ……………………………………………………………………………………………………………………………………………………………………………………………………………………4,302 4,498 4,866 4,690 4,579 1,000 833 855 729 695
All other noncurrent liabilities, including deferred income taxes,
capitalized leases, and minority stockholders' interest
in consolidated domestic corporations ……………………………………………………………………………………………………………………………………………………………………4,838 4,618 4,510 3,954 4,851 175 139 146 160 260
Total liabilities ……………………………………………………………………………………………………………………………………………………………………………………………………………………………29,554 29,743 30,470 30,668 30,211 5,618 5,497 5,565 5,736 5,843
Capital stock and other capital (less treasury stock) …………………………………………………………………………………………………………………………………………………………………………………………6,823 6,238 6,097 6,536 4,942 903 782 881 1,974 1,120
Retained earnings …………………………………………………………………………………………………………………………………………………………………………………………………………………………………13,156 13,687 13,849 14,080 14,817 2,939 2,897 3,129 2,490 3,075
Stockholders' equity ……………………………………………………………………………………………………………………………………………………………………………………………………………………19,979 19,925 19,945 20,616 19,760 3,841 3,679 4,009 4,464 4,196
Total Liabilities and Stockholders' Equity ………………………………………………………………………………………………………………………………………………………………………………………………49,533 49,668 50,415 51,283 49,971 9,460 9,176 9,574 10,201 10,039
NET WORKING CAPITAL
Excess of total current assets over total current liabilities ………………………………………………………………………………………………………………………………………………………………………………………10,140 9,880 9,297 9,397 9,585 3,286 2,918 3,134 3,617 3,376
SELECTED BALANCE SHEET RATIOS
Total cash, U.S. Government and other securities …………………………………………………………………………………………………………………………………………………………………………………………………10.20 9.91 10.48 10.32 11.08 12.14 13.04 14.34 14.36 13.62
Trade accounts and trade notes receivable ……………………………………………………………………………………………………………………………………………………………………………………………………14.85 15.19 15.77 16.11 14.99 26.61 26.00 27.74 29.68 27.55
Inventories ……………………………………………………………………………………………………………………………………………………………………………………………………………………………………15.72 15.51 14.80 14.53 14.75 28.10 27.53 24.79 21.59 23.36
Total current assets …………………………………………………………………………………………………………………………………………………………………………………………………………………………44.79 44.43 44.93 46.08 46.23 70.88 70.21 70.90 73.30 72.40
Net property, plant, and equipment ……………………………………………………………………………………………………………………………………………………………………………………………………………17.39 17.33 16.70 16.25 16.81 21.75 22.83 22.03 20.85 21.43
Short-term debt, including current portion of long-term debt ………………………………………………………………………………………………………………………………………………………………………………………2.85 3.22 4.67 5.18 4.94 11.05 12.10 10.97 10.93 11.37
Total current liabilities …………………………………………………………………………………………………………………………………………………………………………………………………………………………………24.32 24.54 26.49 27.75 27.05 36.15 38.40 38.16 37.85 38.78
Long-term debt …………………………………………………………………………………………………………………………………………………………………………………………………………………………………25.58 26.05 25.00 24.34 23.70 21.40 19.99 18.44 16.82 16.84
Total liabilities …………………………………………………………………………………………………………………………………………………………………………………………………………………………………59.66 59.88 60.44 59.80 60.46 59.39 59.90 58.12 56.24 58.20
Stockholders' equity ………………………………………………………………………………………………………………………………………………………………………………………………………………………………40.34 40.12 39.56 40.20 39.54 40.61 40.10 41.88 43.76 41.80
Table 32.1 -- Balance Sheet For Corporations in NAICS Manufacturing Subsector 337,
All Total Asset Sizes, and Total Assets Under $25 Million
See the Survey Methodology section of the Introduction for information on survey design, estimation, and sampling error.
(million dollars)
(percent of total assets)
(million dollars)
(percent of total assets)
Furniture and Related Products
All Total Asset Sizes
Furniture and Related Products
Total Assets Under $25 Million
65U.S. Census Bureau, Quarterly Financial Report, 2014 Quarter 4
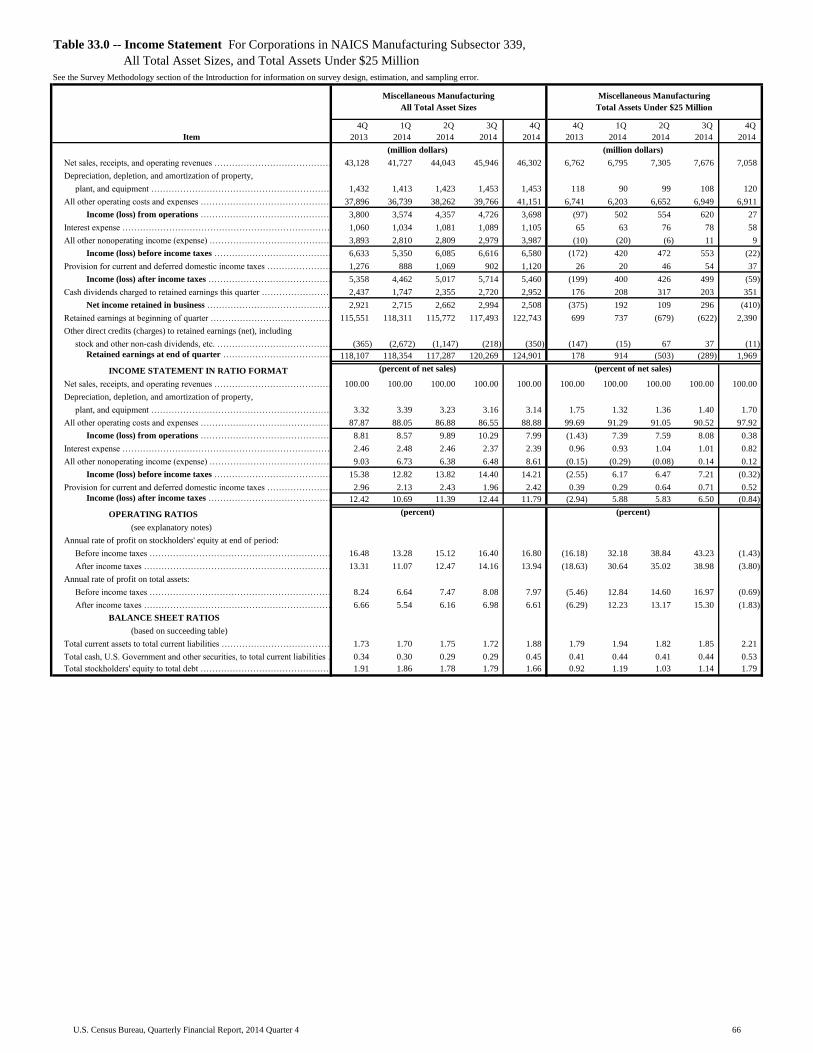
Table with row headers in column A with column headers in rows 5 and 6
Item
4Q_
2013_
1Q_
2014_
2Q_
2014_
3Q_
2014_
4Q_
2014_
4Q_
2013_
1Q_
2014_
2Q_
2014_
3Q_
2014_
4Q_
2014_
Net sales, receipts, and operating revenues ………………………………………………………………………………………………………………………………………………………………………43,128 41,727 44,043 45,946 46,302 6,762 6,795 7,305 7,676 7,058
Depreciation, depletion, and amortization of property,
plant, and equipment …………………………………………………………………………………………………………………………………………………………………………………………1,432 1,413 1,423 1,453 1,453 118 90 99 108 120
All other operating costs and expenses …………………………………………………………………………………………………………...……………………………………………………………37,896 36,739 38,262 39,766 41,151 6,741 6,203 6,652 6,949 6,911
Income (loss) from operations …………………………………………………………………………………………………………...……………………………………………………………3,800 3,574 4,357 4,726 3,698 (97) 502 554 620 27
Interest expense …………………………………………………………………………………………………………………………………………………………………………………………………………………………………………1,060 1,034 1,081 1,089 1,105 65 63 76 78 58
All other nonoperating income (expense) ……………………………………………………………………………………………………………………………………………………………………………………………………3,893 2,810 2,809 2,979 3,987 (10) (20) (6) 11 9
Income (loss) before income taxes ………………………………………………………………………………………………………………………………………………………………………………………………6,633 5,350 6,085 6,616 6,580 (172) 420 472 553 (22)
Provision for current and deferred domestic income taxes …………………………………………………………………………………………………………………………………………………………………………………………1,276 888 1,069 902 1,120 26 20 46 54 37
Income (loss) after income taxes …………………………………………………………………………………………………………………………………………………………………………………………………………5,358 4,462 5,017 5,714 5,460 (199) 400 426 499 (59)
Cash dividends charged to retained earnings this quarter ……………………………………………………………………………………………………………………………………………………………………………………2,437 1,747 2,355 2,720 2,952 176 208 317 203 351
Net income retained in business ……………………………………………………………………………………………………………………………………………………………………………………………………2,921 2,715 2,662 2,994 2,508 (375) 192 109 296 (410)
Retained earnings at beginning of quarter …………………………………………………………………………………………………………………………………………………………………………………………………………115,551 118,311 115,772 117,493 122,743 699 737 (679) (622) 2,390
Other direct credits (charges) to retained earnings (net), including
stock and other non-cash dividends, etc. ……………………………………………………………………………………………………………………………………………………………………………………………………………………………(365) (2,672) (1,147) (218) (350) (147) (15) 67 37 (11)
Retained earnings at end of quarter ……………………………………………………………………………………………………………………………………………………………………………………………………118,107 118,354 117,287 120,269 124,901 178 914 (503) (289) 1,969
INCOME STATEMENT IN RATIO FORMAT
Net sales, receipts, and operating revenues ……………………………………………………………………………………………………………………………………………………………………………………………………100.00 100.00 100.00 100.00 100.00 100.00 100.00 100.00 100.00 100.00
Depreciation, depletion, and amortization of property,
plant, and equipment ………………………………………………………………………………………………………………………………………………………………………3.32 3.39 3.23 3.16 3.14 1.75 1.32 1.36 1.40 1.70
All other operating costs and expenses ……………………………………………………………………………………………………………………………………………………………………………………………………87.87 88.05 86.88 86.55 88.88 99.69 91.29 91.05 90.52 97.92
Income (loss) from operations …………………………………………………………………………………………………………………………………………………………………………………………………8.81 8.57 9.89 10.29 7.99 (1.43) 7.39 7.59 8.08 0.38
Interest expense …………………………………………………………………………………………………………………………………………………………………………………………………………………………………2.46 2.48 2.46 2.37 2.39 0.96 0.93 1.04 1.01 0.82
All other nonoperating income (expense) ……………………………………………………………………………………………………………………………………………………………………………………………9.03 6.73 6.38 6.48 8.61 (0.15) (0.29) (0.08) 0.14 0.12
Income (loss) before income taxes ……………………………………………………………………………………………………………………………………………………………………………………………15.38 12.82 13.82 14.40 14.21 (2.55) 6.17 6.47 7.21 (0.32)
Provision for current and deferred domestic income taxes ……………………………………………………………………………………………………………………………………………………………………………………2.96 2.13 2.43 1.96 2.42 0.39 0.29 0.64 0.71 0.52
Income (loss) after income taxes ………………………………………………………………………………………………………………………………………………………………………………………………12.42 10.69 11.39 12.44 11.79 (2.94) 5.88 5.83 6.50 (0.84)
OPERATING RATIOS
(see explanatory notes)
Annual rate of profit on stockholders' equity at end of period:
Before income taxes ……………………………………………………………………………………………………………………………………………………………………………………………………………………16.48 13.28 15.12 16.40 16.80 (16.18) 32.18 38.84 43.23 (1.43)
After income taxes ………………………………………………………………………………………………………………………………………………………………………………………………………………13.31 11.07 12.47 14.16 13.94 (18.63) 30.64 35.02 38.98 (3.80)
Annual rate of profit on total assets:
Before income taxes ………………………………………………………………………………………………………………………………………………………………………………………………………………8.24 6.64 7.47 8.08 7.97 (5.46) 12.84 14.60 16.97 (0.69)
After income taxes …………………………………………………………………………………………………………………………………………………………………………………………………………………………6.66 5.54 6.16 6.98 6.61 (6.29) 12.23 13.17 15.30 (1.83)
BALANCE SHEET RATIOS
(based on succeeding table)
Total current assets to total current liabilities …………………………………………………………………………………………………………………………………………………………………………………………………1.73 1.70 1.75 1.72 1.88 1.79 1.94 1.82 1.85 2.21
Total cash, U.S. Government and other securities, to total current liabilities …………………………………………………………………………………………………………………………………………………………………0.34 0.30 0.29 0.29 0.45 0.41 0.44 0.41 0.44 0.53
Total stockholders' equity to total debt ………………………………………………………………………………………………………………………………………………………………………………………………………1.91 1.86 1.78 1.79 1.66 0.92 1.19 1.03 1.14 1.79
(percent of net sales) (percent of net sales)
(percent) (percent)
Table 33.0 -- Income Statement For Corporations in NAICS Manufacturing Subsector 339,
All Total Asset Sizes, and Total Assets Under $25 Million
See the Survey Methodology section of the Introduction for information on survey design, estimation, and sampling error.
Miscellaneous Manufacturing
All Total Asset Sizes
Miscellaneous Manufacturing
Total Assets Under $25 Million
(million dollars) (million dollars)
66U.S. Census Bureau, Quarterly Financial Report, 2014 Quarter 4

Table with row headers in column A with column headers in rows 5 and 6
Item
4Q_
2013_
1Q_
2014_
2Q_
2014_
3Q_
2014_
4Q_
2014_
4Q_
2013_
1Q_
2014_
2Q_
2014_
3Q_
2014_
4Q_
2014_
ASSETS
Cash and demand deposits in the U.S. .………………………………………………………………………………………………………………………………………………………………………………………………………………………………13,473 11,749 10,980 11,537 18,399 1,825 1,812 1,798 2,066 2,024
Time deposits in the U.S., including negotiable certificates of deposit ……………………………………………………………………………………………………………………………………………………………………………………459 214 230 258 284 108 109 119 69 82
Total cash on hand and in U.S. banks ……………………………………………………………………………………………………………………………………………………………………………………13,932 11,963 11,209 11,795 18,683 1,932 1,921 1,917 2,135 2,107
Other short-term financial investments, including marketable and
government securities, commercial paper, etc. ………………………………………………………………………………………………………………………………………………………………………………………………………………………………3,018 3,484 2,995 2,857 3,420 249 336 266 213 212
Total cash, U.S. Government and other securities ……………………………………………………………………………………………………………………………………………………………………………………16,951 15,446 14,205 14,652 22,103 2,182 2,257 2,183 2,347 2,319
Trade accounts and trade notes receivable
(less allowance for doubtful accounts) …………………………………………………………………………………………………………………………………………22,209 22,737 23,141 23,166 22,909 2,932 3,002 3,047 2,982 3,033
Inventories ………………………………………………………………………………………………………………………………………………………………………………………………………………………………24,544 25,617 25,500 26,192 25,880 3,988 4,077 3,943 3,905 3,822
All other current assets ………………………………………………………………………………………………………………………………………………………………………………………………………………………………22,790 22,481 22,367 23,020 22,229 502 574 490 591 495
Total current assets ………………………………………………………………………………………………………………………………………………………………………………………………………………………………86,494 86,281 85,213 87,029 93,121 9,603 9,910 9,663 9,826 9,669
Property, plant, and equipment ………………………………………………………………………………………………………………………………………………………………………………………………………………………………74,488 75,628 76,443 77,546 76,907 6,785 6,692 6,777 7,149 7,192
Land and mineral rights ………………………………………………………………………………………………………………………………………………………………………………………………………………………………1,532 1,607 1,779 1,666 1,728 78 75 91 90 97
Less: Accumulated depreciation, depletion, and amortization ……………………………………………………………………………………………………………………………………………………………………………………45,975 46,728 47,413 48,231 47,399 4,847 4,769 4,745 5,126 5,184
Net property, plant, and equipment ……………………………………………………………………………………………………………………………………………………………………………………30,045 30,507 30,809 30,981 31,236 2,015 1,999 2,123 2,113 2,106
All other noncurrent assets, including investment in nonconsolidated
entities, long-term investments, intangibles, etc. ………………………………………………………………………………………………………………………………………………………………………………………………………………205,292 205,560 209,917 209,652 205,986 1,010 1,158 1,152 1,094 1,200
Total Assets …………………………………………………………………………………………………………………………………………………………………………………………………………………………321,831 322,348 325,938 327,663 330,343 12,628 13,067 12,937 13,033 12,975
LIABILITIES AND STOCKHOLDERS' EQUITY
Short-term debt, original maturity of 1 year or less:
a. Loans from banks ………………………………………………………………………………………………………………………………………………………………………………………………………………………3,053 3,239 3,088 2,776 3,051 938 898 772 635 554
b. Other short-term loans, including commercial paper ………………………………………………………………………………………………………………………………………………………………………………………3,760 5,316 4,578 5,191 4,615 497 543 597 593 82
Trade accounts and trade notes payable ……………………………………………………………………………………………………………………………………………………………………………………………………………10,311 10,809 10,848 10,996 10,948 1,634 1,716 1,677 1,694 1,592
Income taxes accrued, prior and current years, net of payments ………………………………………………………………………………………………………………………………………………………………………………1,052 956 763 987 623 45 28 31 86 86
Current portion of long-term debt, due in 1 year or less:
a. Loans from banks …………………………………………………………………………………………………………………………………………………………………………………………………………………………………3,101 2,778 1,259 1,190 1,216 444 419 430 466 434
b. Other long-term loans ……………………………………………………………………………………………………………………………………………………………………………………………………………………3,229 4,296 4,869 5,408 3,052 175 223 532 612 392
All other current liabilities, including excise and
sales taxes, and accrued expenses ……..……………………………………………………………………………………………………………………………………………………25,359 23,408 23,338 23,958 25,930 1,640 1,293 1,268 1,235 1,239
Total current liabilities ……………………………………………………………………………………………………………………………………………………………………………………………………………………49,866 50,804 48,743 50,505 49,435 5,373 5,121 5,307 5,322 4,380
Long-term debt, due in more than 1 year:
a. Loans from banks …………………………………………………………………………………………………………………………………………………………………………………………………………………………27,326 27,688 31,064 30,360 30,864 1,248 1,201 1,312 1,246 1,103
b. Other long-term loans ……………………………………………………………………………………………………………………………………………………………………………………………………………………43,640 43,173 45,410 45,105 51,400 1,316 1,110 1,070 948 923
All other noncurrent liabilities, including deferred income taxes,
capitalized leases, and minority stockholders' interest
in consolidated domestic corporations ……………………………………………………………………………………………………………………………………………………………………39,948 39,486 39,744 40,287 41,944 430 420 384 399 329
Total liabilities ……………………………………………………………………………………………………………………………………………………………………………………………………………………………160,780 161,150 164,961 166,257 173,643 8,367 7,852 8,073 7,916 6,735
Capital stock and other capital (less treasury stock) …………………………………………………………………………………………………………………………………………………………………………………………42,944 42,843 43,690 41,136 31,800 4,084 4,301 5,367 5,407 4,271
Retained earnings …………………………………………………………………………………………………………………………………………………………………………………………………………………………………118,107 118,354 117,287 120,269 124,901 178 914 (503) (289) 1,969
Stockholders' equity ……………………………………………………………………………………………………………………………………………………………………………………………………………………161,052 161,197 160,977 161,406 156,700 4,262 5,215 4,864 5,118 6,240
Total Liabilities and Stockholders' Equity ………………………………………………………………………………………………………………………………………………………………………………………………321,831 322,348 325,938 327,663 330,343 12,628 13,067 12,937 13,033 12,975
NET WORKING CAPITAL
Excess of total current assets over total current liabilities ………………………………………………………………………………………………………………………………………………………………………………………36,629 35,477 36,470 36,525 43,686 4,230 4,789 4,356 4,504 5,289
SELECTED BALANCE SHEET RATIOS
Total cash, U.S. Government and other securities …………………………………………………………………………………………………………………………………………………………………………………………………5.27 4.79 4.36 4.47 6.69 17.28 17.27 16.87 18.01 17.87
Trade accounts and trade notes receivable ……………………………………………………………………………………………………………………………………………………………………………………………………6.90 7.05 7.10 7.07 6.93 23.22 22.97 23.55 22.88 23.37
Inventories ……………………………………………………………………………………………………………………………………………………………………………………………………………………………………7.63 7.95 7.82 7.99 7.83 31.58 31.20 30.48 29.96 29.45
Total current assets …………………………………………………………………………………………………………………………………………………………………………………………………………………………26.88 26.77 26.14 26.56 28.19 76.04 75.84 74.69 75.39 74.52
Net property, plant, and equipment ……………………………………………………………………………………………………………………………………………………………………………………………………………9.34 9.46 9.45 9.46 9.46 15.96 15.30 16.41 16.22 16.23
Short-term debt, including current portion of long-term debt ………………………………………………………………………………………………………………………………………………………………………………………4.08 4.85 4.23 4.45 3.61 16.27 15.95 18.02 17.70 11.27
Total current liabilities …………………………………………………………………………………………………………………………………………………………………………………………………………………………………15.49 15.76 14.95 15.41 14.96 42.55 39.19 41.02 40.84 33.76
Long-term debt …………………………………………………………………………………………………………………………………………………………………………………………………………………………………22.05 21.98 23.46 23.03 24.90 20.30 17.68 18.41 16.84 15.61
Total liabilities …………………………………………………………………………………………………………………………………………………………………………………………………………………………………49.96 49.99 50.61 50.74 52.56 66.25 60.09 62.40 60.73 51.91
Stockholders' equity ………………………………………………………………………………………………………………………………………………………………………………………………………………………………50.04 50.01 49.39 49.26 47.44 33.75 39.91 37.60 39.27 48.09
Table 33.1 -- Balance Sheet For Corporations in NAICS Manufacturing Subsector 339,
All Total Asset Sizes, and Total Assets Under $25 Million
See the Survey Methodology section of the Introduction for information on survey design, estimation, and sampling error.
(million dollars)
(percent of total assets)
(million dollars)
(percent of total assets)
Miscellaneous Manufacturing
All Total Asset Sizes
Miscellaneous Manufacturing
Total Assets Under $25 Million
67U.S. Census Bureau, Quarterly Financial Report, 2014 Quarter 4
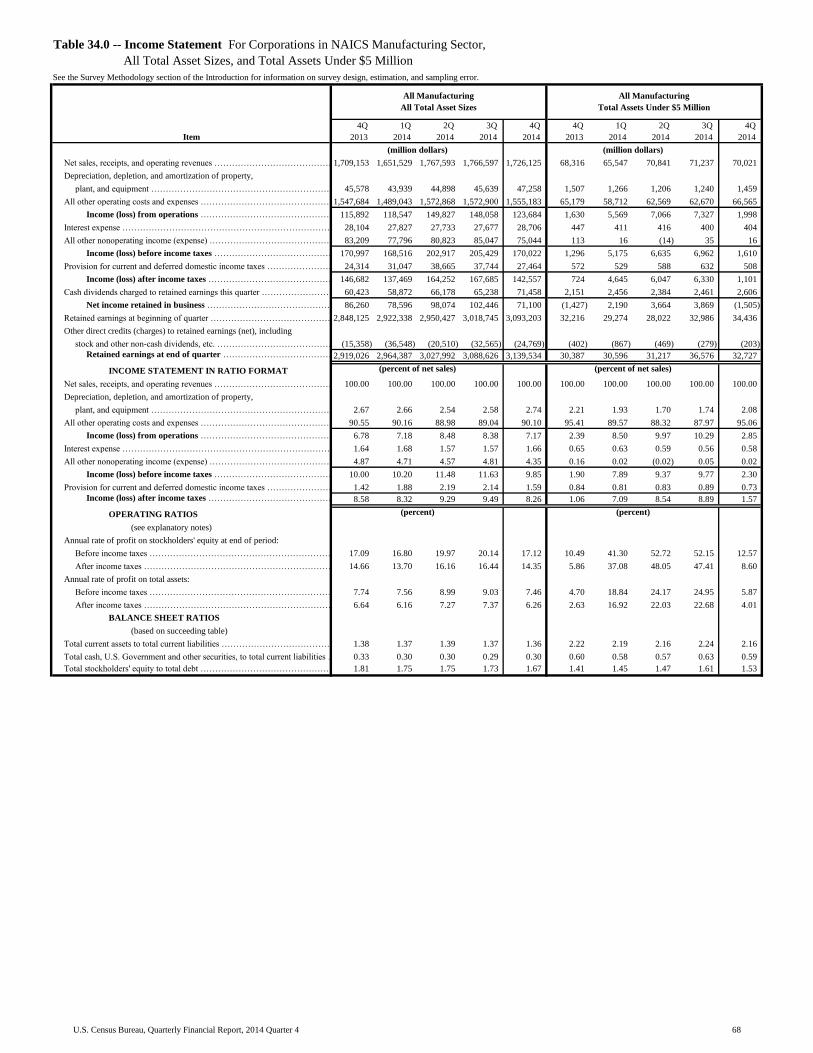
Table with row headers in column A with column headers in rows 5 and 6
Item
4Q_
2013_
1Q_
2014_
2Q_
2014_
3Q_
2014_
4Q_
2014_
4Q_
2013_
1Q_
2014_
2Q_
2014_
3Q_
2014_
4Q_
2014_
Net sales, receipts, and operating revenues ………………………………………………………………………………………………………………………………………………………………………1,709,153 1,651,529 1,767,593 1,766,597 1,726,125 68,316 65,547 70,841 71,237 70,021
Depreciation, depletion, and amortization of property,
plant, and equipment …………………………………………………………………………………………………………………………………………………………………………………………45,578 43,939 44,898 45,639 47,258 1,507 1,266 1,206 1,240 1,459
All other operating costs and expenses …………………………………………………………………………………………………………...……………………………………………………………1,547,684 1,489,043 1,572,868 1,572,900 1,555,183 65,179 58,712 62,569 62,670 66,565
Income (loss) from operations …………………………………………………………………………………………………………...……………………………………………………………115,892 118,547 149,827 148,058 123,684 1,630 5,569 7,066 7,327 1,998
Interest expense …………………………………………………………………………………………………………………………………………………………………………………………………………………………………………28,104 27,827 27,733 27,677 28,706 447 411 416 400 404
All other nonoperating income (expense) ……………………………………………………………………………………………………………………………………………………………………………………………………83,209 77,796 80,823 85,047 75,044 113 16 (14) 35 16
Income (loss) before income taxes ………………………………………………………………………………………………………………………………………………………………………………………………170,997 168,516 202,917 205,429 170,022 1,296 5,175 6,635 6,962 1,610
Provision for current and deferred domestic income taxes …………………………………………………………………………………………………………………………………………………………………………………………24,314 31,047 38,665 37,744 27,464 572 529 588 632 508
Income (loss) after income taxes …………………………………………………………………………………………………………………………………………………………………………………………………………146,682 137,469 164,252 167,685 142,557 724 4,645 6,047 6,330 1,101
Cash dividends charged to retained earnings this quarter ……………………………………………………………………………………………………………………………………………………………………………………60,423 58,872 66,178 65,238 71,458 2,151 2,456 2,384 2,461 2,606
Net income retained in business ……………………………………………………………………………………………………………………………………………………………………………………………………86,260 78,596 98,074 102,446 71,100 (1,427) 2,190 3,664 3,869 (1,505)
Retained earnings at beginning of quarter …………………………………………………………………………………………………………………………………………………………………………………………………………2,848,125 2,922,338 2,950,427 3,018,745 3,093,203 32,216 29,274 28,022 32,986 34,436
Other direct credits (charges) to retained earnings (net), including
stock and other non-cash dividends, etc. ……………………………………………………………………………………………………………………………………………………………………………………………………………………………(15,358) (36,548) (20,510) (32,565) (24,769) (402) (867) (469) (279) (203)
Retained earnings at end of quarter ……………………………………………………………………………………………………………………………………………………………………………………………………2,919,026 2,964,387 3,027,992 3,088,626 3,139,534 30,387 30,596 31,217 36,576 32,727
INCOME STATEMENT IN RATIO FORMAT
Net sales, receipts, and operating revenues ……………………………………………………………………………………………………………………………………………………………………………………………………100.00 100.00 100.00 100.00 100.00 100.00 100.00 100.00 100.00 100.00
Depreciation, depletion, and amortization of property,
plant, and equipment ………………………………………………………………………………………………………………………………………………………………………2.67 2.66 2.54 2.58 2.74 2.21 1.93 1.70 1.74 2.08
All other operating costs and expenses ……………………………………………………………………………………………………………………………………………………………………………………………………90.55 90.16 88.98 89.04 90.10 95.41 89.57 88.32 87.97 95.06
Income (loss) from operations …………………………………………………………………………………………………………………………………………………………………………………………………6.78 7.18 8.48 8.38 7.17 2.39 8.50 9.97 10.29 2.85
Interest expense …………………………………………………………………………………………………………………………………………………………………………………………………………………………………1.64 1.68 1.57 1.57 1.66 0.65 0.63 0.59 0.56 0.58
All other nonoperating income (expense) ……………………………………………………………………………………………………………………………………………………………………………………………4.87 4.71 4.57 4.81 4.35 0.16 0.02 (0.02) 0.05 0.02
Income (loss) before income taxes ……………………………………………………………………………………………………………………………………………………………………………………………10.00 10.20 11.48 11.63 9.85 1.90 7.89 9.37 9.77 2.30
Provision for current and deferred domestic income taxes ……………………………………………………………………………………………………………………………………………………………………………………1.42 1.88 2.19 2.14 1.59 0.84 0.81 0.83 0.89 0.73
Income (loss) after income taxes ………………………………………………………………………………………………………………………………………………………………………………………………8.58 8.32 9.29 9.49 8.26 1.06 7.09 8.54 8.89 1.57
OPERATING RATIOS
(see explanatory notes)
Annual rate of profit on stockholders' equity at end of period:
Before income taxes ……………………………………………………………………………………………………………………………………………………………………………………………………………………17.09 16.80 19.97 20.14 17.12 10.49 41.30 52.72 52.15 12.57
After income taxes ………………………………………………………………………………………………………………………………………………………………………………………………………………14.66 13.70 16.16 16.44 14.35 5.86 37.08 48.05 47.41 8.60
Annual rate of profit on total assets:
Before income taxes ………………………………………………………………………………………………………………………………………………………………………………………………………………7.74 7.56 8.99 9.03 7.46 4.70 18.84 24.17 24.95 5.87
After income taxes …………………………………………………………………………………………………………………………………………………………………………………………………………………………6.64 6.16 7.27 7.37 6.26 2.63 16.92 22.03 22.68 4.01
BALANCE SHEET RATIOS
(based on succeeding table)
Total current assets to total current liabilities …………………………………………………………………………………………………………………………………………………………………………………………………1.38 1.37 1.39 1.37 1.36 2.22 2.19 2.16 2.24 2.16
Total cash, U.S. Government and other securities, to total current liabilities …………………………………………………………………………………………………………………………………………………………………0.33 0.30 0.30 0.29 0.30 0.60 0.58 0.57 0.63 0.59
Total stockholders' equity to total debt ………………………………………………………………………………………………………………………………………………………………………………………………………1.81 1.75 1.75 1.73 1.67 1.41 1.45 1.47 1.61 1.53
(percent of net sales) (percent of net sales)
(percent) (percent)
Table 34.0 -- Income Statement For Corporations in NAICS Manufacturing Sector,
All Total Asset Sizes, and Total Assets Under $5 Million
See the Survey Methodology section of the Introduction for information on survey design, estimation, and sampling error.
All Manufacturing
All Total Asset Sizes
All Manufacturing
Total Assets Under $5 Million
(million dollars) (million dollars)
68U.S. Census Bureau, Quarterly Financial Report, 2014 Quarter 4

Table with row headers in column A with column headers in rows 5 and 6
Item
4Q_
2013_
1Q_
2014_
2Q_
2014_
3Q_
2014_
4Q_
2014_
4Q_
2013_
1Q_
2014_
2Q_
2014_
3Q_
2014_
4Q_
2014_
ASSETS
Cash and demand deposits in the U.S. .………………………………………………………………………………………………………………………………………………………………………………………………………………………………319,620 291,997 298,815 301,116 328,345 18,092 17,995 18,075 19,654 18,819
Time deposits in the U.S., including negotiable certificates of deposit ……………………………………………………………………………………………………………………………………………………………………………………67,898 51,182 42,456 42,647 46,379 1,091 1,072 992 1,034 1,017
Total cash on hand and in U.S. banks ……………………………………………………………………………………………………………………………………………………………………………………387,518 343,178 341,271 343,762 374,725 19,183 19,067 19,067 20,687 19,837
Other short-term financial investments, including marketable and
government securities, commercial paper, etc. ………………………………………………………………………………………………………………………………………………………………………………………………………………………………185,643 179,211 180,566 173,381 159,295 1,411 1,219 1,335 1,352 1,401
Total cash, U.S. Government and other securities ……………………………………………………………………………………………………………………………………………………………………………………573,161 522,389 521,837 517,143 534,020 20,594 20,286 20,402 22,039 21,237
Trade accounts and trade notes receivable
(less allowance for doubtful accounts) …………………………………………………………………………………………………………………………………………669,261 699,210 727,375 732,152 704,467 26,183 26,963 27,665 27,530 26,576
Inventories ………………………………………………………………………………………………………………………………………………………………………………………………………………………………752,007 780,661 777,544 788,581 779,622 25,706 25,613 25,288 25,149 25,353
All other current assets ………………………………………………………………………………………………………………………………………………………………………………………………………………………………418,328 421,635 422,519 430,416 436,004 4,186 3,894 3,893 4,225 4,303
Total current assets ………………………………………………………………………………………………………………………………………………………………………………………………………………………………2,412,756 2,423,894 2,449,276 2,468,292 2,454,112 76,668 76,756 77,247 78,943 77,469
Property, plant, and equipment ………………………………………………………………………………………………………………………………………………………………………………………………………………………………3,007,155 3,028,320 3,062,338 3,099,847 3,148,680 114,599 113,257 113,021 113,134 114,119
Land and mineral rights ………………………………………………………………………………………………………………………………………………………………………………………………………………………………169,937 171,388 171,714 172,709 173,167 1,769 1,726 1,650 1,628 1,534
Less: Accumulated depreciation, depletion, and amortization ……………………………………………………………………………………………………………………………………………………………………………………1,693,019 1,709,487 1,733,091 1,754,619 1,791,351 88,832 88,145 88,298 88,197 89,290
Net property, plant, and equipment ……………………………………………………………………………………………………………………………………………………………………………………1,484,074 1,490,220 1,500,960 1,517,938 1,530,496 27,536 26,839 26,373 26,565 26,363
All other noncurrent assets, including investment in nonconsolidated
entities, long-term investments, intangibles, etc. ………………………………………………………………………………………………………………………………………………………………………………………………………………4,941,648 5,007,044 5,081,767 5,116,674 5,128,332 6,141 6,249 6,174 6,115 5,889
Total Assets …………………………………………………………………………………………………………………………………………………………………………………………………………………………8,838,478 8,921,159 9,032,003 9,102,903 9,112,941 110,345 109,844 109,794 111,623 109,720
LIABILITIES AND STOCKHOLDERS' EQUITY
Short-term debt, original maturity of 1 year or less:
a. Loans from banks ………………………………………………………………………………………………………………………………………………………………………………………………………………………54,150 59,612 57,639 58,688 58,078 4,450 4,545 4,450 4,281 4,618
b. Other short-term loans, including commercial paper ………………………………………………………………………………………………………………………………………………………………………………………152,037 164,431 149,435 172,211 167,712 2,207 2,504 2,532 2,297 2,420
Trade accounts and trade notes payable ……………………………………………………………………………………………………………………………………………………………………………………………………………549,046 556,532 567,237 570,678 562,116 15,304 15,377 15,617 15,353 14,972
Income taxes accrued, prior and current years, net of payments ………………………………………………………………………………………………………………………………………………………………………………29,926 34,063 31,332 36,565 30,169 334 345 325 355 383
Current portion of long-term debt, due in 1 year or less:
a. Loans from banks …………………………………………………………………………………………………………………………………………………………………………………………………………………………………36,479 36,660 36,288 36,012 35,760 2,793 3,183 3,353 3,432 3,493
b. Other long-term loans ……………………………………………………………………………………………………………………………………………………………………………………………………………………113,560 117,884 111,254 107,572 108,152 1,812 1,780 2,299 2,238 2,278
All other current liabilities, including excise and
sales taxes, and accrued expenses ……..……………………………………………………………………………………………………………………………………………………811,918 794,730 806,285 820,795 840,056 7,662 7,263 7,246 7,227 7,678
Total current liabilities ……………………………………………………………………………………………………………………………………………………………………………………………………………………1,747,118 1,763,912 1,759,471 1,802,522 1,802,041 34,562 34,998 35,822 35,184 35,841
Long-term debt, due in more than 1 year:
a. Loans from banks …………………………………………………………………………………………………………………………………………………………………………………………………………………………387,452 406,954 416,136 418,015 422,624 11,467 11,391 10,855 10,956 11,333
b. Other long-term loans ……………………………………………………………………………………………………………………………………………………………………………………………………………………1,469,386 1,501,565 1,553,557 1,559,330 1,591,365 12,424 11,227 10,744 9,989 9,289
All other noncurrent liabilities, including deferred income taxes,
capitalized leases, and minority stockholders' interest
in consolidated domestic corporations ……………………………………………………………………………………………………………………………………………………………………1,232,945 1,235,413 1,238,385 1,242,704 1,324,040 2,460 2,114 2,030 2,090 2,053
Total liabilities ……………………………………………………………………………………………………………………………………………………………………………………………………………………………4,836,900 4,907,845 4,967,549 5,022,571 5,140,069 60,913 59,730 59,452 58,220 58,516
Capital stock and other capital (less treasury stock) …………………………………………………………………………………………………………………………………………………………………………………………1,082,552 1,048,927 1,036,462 991,707 833,338 19,045 19,517 19,126 16,828 18,477
Retained earnings …………………………………………………………………………………………………………………………………………………………………………………………………………………………………2,919,026 2,964,387 3,027,992 3,088,626 3,139,534 30,387 30,596 31,217 36,576 32,727
Stockholders' equity ……………………………………………………………………………………………………………………………………………………………………………………………………………………4,001,578 4,013,314 4,064,454 4,080,333 3,972,872 49,432 50,114 50,343 53,404 51,204
Total Liabilities and Stockholders' Equity ………………………………………………………………………………………………………………………………………………………………………………………………8,838,478 8,921,159 9,032,003 9,102,903 9,112,941 110,345 109,844 109,794 111,623 109,720
NET WORKING CAPITAL
Excess of total current assets over total current liabilities ………………………………………………………………………………………………………………………………………………………………………………………665,639 659,982 689,804 665,770 652,071 42,107 41,758 41,426 43,759 41,628
SELECTED BALANCE SHEET RATIOS
Total cash, U.S. Government and other securities …………………………………………………………………………………………………………………………………………………………………………………………………6.48 5.86 5.78 5.68 5.86 18.66 18.47 18.58 19.74 19.36
Trade accounts and trade notes receivable ……………………………………………………………………………………………………………………………………………………………………………………………………7.57 7.84 8.05 8.04 7.73 23.73 24.55 25.20 24.66 24.22
Inventories ……………………………………………………………………………………………………………………………………………………………………………………………………………………………………8.51 8.75 8.61 8.66 8.56 23.30 23.32 23.03 22.53 23.11
Total current assets …………………………………………………………………………………………………………………………………………………………………………………………………………………………27.30 27.17 27.12 27.12 26.93 69.48 69.88 70.36 70.72 70.61
Net property, plant, and equipment ……………………………………………………………………………………………………………………………………………………………………………………………………………16.79 16.70 16.62 16.68 16.79 24.95 24.43 24.02 23.80 24.03
Short-term debt, including current portion of long-term debt ………………………………………………………………………………………………………………………………………………………………………………………4.03 4.24 3.93 4.11 4.06 10.21 10.94 11.51 10.97 11.67
Total current liabilities …………………………………………………………………………………………………………………………………………………………………………………………………………………………………19.77 19.77 19.48 19.80 19.77 31.32 31.86 32.63 31.52 32.67
Long-term debt …………………………………………………………………………………………………………………………………………………………………………………………………………………………………21.01 21.39 21.81 21.72 22.10 21.65 20.59 19.67 18.76 18.80
Total liabilities …………………………………………………………………………………………………………………………………………………………………………………………………………………………………54.73 55.01 55.00 55.18 56.40 55.20 54.38 54.15 52.16 53.33
Stockholders' equity ………………………………………………………………………………………………………………………………………………………………………………………………………………………………45.27 44.99 45.00 44.82 43.60 44.80 45.62 45.85 47.84 46.67
Table 34.1 -- Balance Sheet For Corporations in NAICS Manufacturing Sector,
All Total Asset Sizes, and Total Assets Under $5 Million
See the Survey Methodology section of the Introduction for information on survey design, estimation, and sampling error.
(million dollars)
(percent of total assets)
(million dollars)
(percent of total assets)
All Manufacturing
All Total Asset Sizes
All Manufacturing
Total Assets Under $5 Million
69U.S. Census Bureau, Quarterly Financial Report, 2014 Quarter 4

Table with row headers in column A with column headers in rows 5 and 6
Item
4Q_
2013_
1Q_
2014_
2Q_
2014_
3Q_
2014_
4Q_
2014_
4Q_
2013_
1Q_
2014_
2Q_
2014_
3Q_
2014_
4Q_
2014_
Net sales, receipts, and operating revenues ………………………………………………………………………………………………………………………………………………………………………31,947 30,777 34,653 35,690 34,805 54,420 50,667 55,389 56,826 57,500
Depreciation, depletion, and amortization of property,
plant, and equipment …………………………………………………………………………………………………………………………………………………………………………………………693 620 631 659 721 1,224 1,102 1,153 1,197 1,338
All other operating costs and expenses …………………………………………………………………………………………………………...……………………………………………………………29,840 27,547 30,641 31,764 32,846 51,313 46,261 49,710 50,726 53,338
Income (loss) from operations …………………………………………………………………………………………………………...……………………………………………………………1,414 2,610 3,381 3,267 1,238 1,883 3,305 4,526 4,904 2,824
Interest expense …………………………………………………………………………………………………………………………………………………………………………………………………………………………………………218 211 221 226 218 469 363 378 394 413
All other nonoperating income (expense) ……………………………………………………………………………………………………………………………………………………………………………………………………21 (6) 18 64 42 65 72 43 30 89
Income (loss) before income taxes ………………………………………………………………………………………………………………………………………………………………………………………………1,217 2,392 3,178 3,105 1,062 1,479 3,015 4,191 4,540 2,500
Provision for current and deferred domestic income taxes …………………………………………………………………………………………………………………………………………………………………………………………241 162 188 259 247 396 374 515 531 471
Income (loss) after income taxes …………………………………………………………………………………………………………………………………………………………………………………………………………976 2,229 2,989 2,846 815 1,083 2,640 3,676 4,009 2,029
Cash dividends charged to retained earnings this quarter ……………………………………………………………………………………………………………………………………………………………………………………957 1,074 1,294 1,071 1,055 1,318 1,526 1,969 1,804 1,702
Net income retained in business ……………………………………………………………………………………………………………………………………………………………………………………………………19 1,155 1,695 1,775 (240) (235) 1,114 1,707 2,205 327
Retained earnings at beginning of quarter …………………………………………………………………………………………………………………………………………………………………………………………………………23,557 19,608 20,248 21,819 27,041 33,371 37,305 39,579 41,589 45,977
Other direct credits (charges) to retained earnings (net), including
stock and other non-cash dividends, etc. ……………………………………………………………………………………………………………………………………………………………………………………………………………………………(320) (386) (189) 115 (31) (517) (401) (135) (369) (195)
Retained earnings at end of quarter ……………………………………………………………………………………………………………………………………………………………………………………………………23,256 20,378 21,755 23,709 26,770 32,619 38,019 41,151 43,425 46,109
INCOME STATEMENT IN RATIO FORMAT
Net sales, receipts, and operating revenues ……………………………………………………………………………………………………………………………………………………………………………………………………100.00 100.00 100.00 100.00 100.00 100.00 100.00 100.00 100.00 100.00
Depreciation, depletion, and amortization of property,
plant, and equipment ………………………………………………………………………………………………………………………………………………………………………2.17 2.01 1.82 1.85 2.07 2.25 2.17 2.08 2.11 2.33
All other operating costs and expenses ……………………………………………………………………………………………………………………………………………………………………………………………………93.40 89.51 88.42 89.00 94.37 94.29 91.30 89.75 89.26 92.76
Income (loss) from operations …………………………………………………………………………………………………………………………………………………………………………………………………4.43 8.48 9.76 9.15 3.56 3.46 6.52 8.17 8.63 4.91
Interest expense …………………………………………………………………………………………………………………………………………………………………………………………………………………………………0.68 0.69 0.64 0.63 0.63 0.86 0.72 0.68 0.69 0.72
All other nonoperating income (expense) ……………………………………………………………………………………………………………………………………………………………………………………………0.07 (0.02) 0.05 0.18 0.12 0.12 0.14 0.08 0.05 0.15
Income (loss) before income taxes ……………………………………………………………………………………………………………………………………………………………………………………………3.81 7.77 9.17 8.70 3.05 2.72 5.95 7.57 7.99 4.35
Provision for current and deferred domestic income taxes ……………………………………………………………………………………………………………………………………………………………………………………0.75 0.53 0.54 0.72 0.71 0.73 0.74 0.93 0.93 0.82
Income (loss) after income taxes ………………………………………………………………………………………………………………………………………………………………………………………………3.06 7.24 8.63 7.98 2.34 1.99 5.21 6.64 7.06 3.53
OPERATING RATIOS
(see explanatory notes)
Annual rate of profit on stockholders' equity at end of period:
Before income taxes ……………………………………………………………………………………………………………………………………………………………………………………………………………………14.85 30.66 39.65 36.82 11.95 10.17 20.20 27.20 28.61 15.41
After income taxes ………………………………………………………………………………………………………………………………………………………………………………………………………………11.90 28.58 37.30 33.76 9.17 7.45 17.70 23.86 25.27 12.51
Annual rate of profit on total assets:
Before income taxes ………………………………………………………………………………………………………………………………………………………………………………………………………………7.70 15.01 19.23 18.24 6.26 5.09 10.30 14.02 14.79 8.02
After income taxes …………………………………………………………………………………………………………………………………………………………………………………………………………………………6.18 13.99 18.09 16.72 4.80 3.73 9.02 12.30 13.06 6.51
BALANCE SHEET RATIOS
(based on succeeding table)
Total current assets to total current liabilities …………………………………………………………………………………………………………………………………………………………………………………………………2.33 2.16 2.11 2.18 2.28 2.12 2.19 2.22 2.25 2.22
Total cash, U.S. Government and other securities, to total current liabilities …………………………………………………………………………………………………………………………………………………………………0.54 0.46 0.46 0.47 0.52 0.46 0.46 0.48 0.47 0.46
Total stockholders' equity to total debt ………………………………………………………………………………………………………………………………………………………………………………………………………1.97 1.75 1.76 1.84 2.06 1.96 2.02 2.08 2.08 2.17
(percent of net sales) (percent of net sales)
(percent) (percent)
Table 35.0 -- Income Statement For Corporations in NAICS Manufacturing Sector,
Total Assets $5 Million to Less Than $10 Million, and Total Assets $10 Million to Less Than $25 Million
See the Survey Methodology section of the Introduction for information on survey design, estimation, and sampling error.
All Manufacturing
Total Assets $5 Million to less than $10 Million
All Manufacturing
Total Assets $10 Million to less than $25 Million
(million dollars) (million dollars)
70U.S. Census Bureau, Quarterly Financial Report, 2014 Quarter 4

Table with row headers in column A with column headers in rows 5 and 6
Item
4Q_
2013_
1Q_
2014_
2Q_
2014_
3Q_
2014_
4Q_
2014_
4Q_
2013_
1Q_
2014_
2Q_
2014_
3Q_
2014_
4Q_
2014_
ASSETS
Cash and demand deposits in the U.S. .………………………………………………………………………………………………………………………………………………………………………………………………………………………………8,332 7,784 8,374 8,837 8,884 13,888 13,293 14,135 14,023 14,136
Time deposits in the U.S., including negotiable certificates of deposit ……………………………………………………………………………………………………………………………………………………………………………………639 497 537 625 621 809 850 895 641 803
Total cash on hand and in U.S. banks ……………………………………………………………………………………………………………………………………………………………………………………8,971 8,281 8,912 9,462 9,505 14,697 14,143 15,030 14,664 14,939
Other short-term financial investments, including marketable and
government securities, commercial paper, etc. ………………………………………………………………………………………………………………………………………………………………………………………………………………………………1,115 996 1,170 944 1,159 1,928 2,219 2,210 2,175 2,099
Total cash, U.S. Government and other securities ……………………………………………………………………………………………………………………………………………………………………………………10,085 9,277 10,081 10,405 10,665 16,625 16,362 17,240 16,840 17,038
Trade accounts and trade notes receivable
(less allowance for doubtful accounts) …………………………………………………………………………………………………………………………………………14,771 15,461 16,131 17,422 15,891 25,502 25,960 27,455 28,786 28,762
Inventories ………………………………………………………………………………………………………………………………………………………………………………………………………………………………16,530 16,727 17,203 17,705 17,611 29,817 30,379 29,881 30,299 30,467
All other current assets ………………………………………………………………………………………………………………………………………………………………………………………………………………………………2,346 2,425 2,448 2,570 2,662 4,470 4,549 4,577 5,618 5,642
Total current assets ………………………………………………………………………………………………………………………………………………………………………………………………………………………………43,733 43,890 45,864 48,103 46,829 76,413 77,249 79,153 81,543 81,909
Property, plant, and equipment ………………………………………………………………………………………………………………………………………………………………………………………………………………………………46,734 48,131 48,608 49,731 50,142 81,348 80,328 83,627 86,711 89,301
Land and mineral rights ………………………………………………………………………………………………………………………………………………………………………………………………………………………………787 776 759 721 732 1,544 1,549 1,683 1,626 1,659
Less: Accumulated depreciation, depletion, and amortization ……………………………………………………………………………………………………………………………………………………………………………………32,246 33,469 33,470 34,499 34,438 53,641 52,746 55,165 57,535 58,946
Net property, plant, and equipment ……………………………………………………………………………………………………………………………………………………………………………………15,275 15,437 15,896 15,953 16,436 29,251 29,131 30,145 30,802 32,014
All other noncurrent assets, including investment in nonconsolidated
entities, long-term investments, intangibles, etc. ………………………………………………………………………………………………………………………………………………………………………………………………………………4,219 4,422 4,336 4,046 4,612 10,535 10,749 10,261 10,448 10,806
Total Assets …………………………………………………………………………………………………………………………………………………………………………………………………………………………63,226 63,749 66,095 68,102 67,877 116,199 117,129 119,559 122,793 124,729
LIABILITIES AND STOCKHOLDERS' EQUITY
Short-term debt, original maturity of 1 year or less:
a. Loans from banks ………………………………………………………………………………………………………………………………………………………………………………………………………………………3,308 3,332 3,262 3,321 3,173 6,369 5,986 5,872 5,562 5,875
b. Other short-term loans, including commercial paper ………………………………………………………………………………………………………………………………………………………………………………………990 1,079 1,232 1,172 661 976 1,207 1,042 943 814
Trade accounts and trade notes payable ……………………………………………………………………………………………………………………………………………………………………………………………………………7,992 8,548 9,341 9,676 8,554 14,544 14,857 15,063 15,619 15,549
Income taxes accrued, prior and current years, net of payments ………………………………………………………………………………………………………………………………………………………………………………198 216 205 264 266 487 379 436 437 406
Current portion of long-term debt, due in 1 year or less:
a. Loans from banks …………………………………………………………………………………………………………………………………………………………………………………………………………………………………1,354 1,590 1,685 1,679 1,745 3,220 2,923 2,834 3,168 3,156
b. Other long-term loans ……………………………………………………………………………………………………………………………………………………………………………………………………………………763 843 1,083 962 1,083 670 735 1,160 1,218 1,021
All other current liabilities, including excise and
sales taxes, and accrued expenses ……..……………………………………………………………………………………………………………………………………………………4,198 4,692 4,879 5,004 5,067 9,710 9,246 9,190 9,235 10,127
Total current liabilities ……………………………………………………………………………………………………………………………………………………………………………………………………………………18,803 20,300 21,687 22,077 20,550 35,975 35,331 35,597 36,182 36,948
Long-term debt, due in more than 1 year:
a. Loans from banks …………………………………………………………………………………………………………………………………………………………………………………………………………………………6,182 6,232 6,839 6,799 6,502 11,302 11,397 11,490 11,932 12,254
b. Other long-term loans ……………………………………………………………………………………………………………………………………………………………………………………………………………………4,091 4,747 4,106 4,405 4,083 7,156 7,310 7,163 7,667 6,749
All other noncurrent liabilities, including deferred income taxes,
capitalized leases, and minority stockholders' interest
in consolidated domestic corporations ……………………………………………………………………………………………………………………………………………………………………1,352 1,263 1,406 1,092 1,196 3,586 3,404 3,678 3,544 3,897
Total liabilities ……………………………………………………………………………………………………………………………………………………………………………………………………………………………30,428 32,543 34,038 34,373 32,331 58,019 57,443 57,927 59,325 59,849
Capital stock and other capital (less treasury stock) …………………………………………………………………………………………………………………………………………………………………………………………9,541 10,828 10,302 10,021 8,775 25,562 21,667 20,481 20,043 18,771
Retained earnings …………………………………………………………………………………………………………………………………………………………………………………………………………………………………23,256 20,378 21,755 23,709 26,770 32,619 38,019 41,151 43,425 46,109
Stockholders' equity ……………………………………………………………………………………………………………………………………………………………………………………………………………………32,798 31,206 32,057 33,729 35,545 58,180 59,686 61,632 63,468 64,880
Total Liabilities and Stockholders' Equity ………………………………………………………………………………………………………………………………………………………………………………………………63,226 63,749 66,095 68,102 67,877 116,199 117,129 119,559 122,793 124,729
NET WORKING CAPITAL
Excess of total current assets over total current liabilities ………………………………………………………………………………………………………………………………………………………………………………………24,929 23,590 24,176 26,026 26,279 40,437 41,917 43,556 45,361 44,961
SELECTED BALANCE SHEET RATIOS
Total cash, U.S. Government and other securities …………………………………………………………………………………………………………………………………………………………………………………………………15.95 14.55 15.25 15.28 15.71 14.31 13.97 14.42 13.71 13.66
Trade accounts and trade notes receivable ……………………………………………………………………………………………………………………………………………………………………………………………………23.36 24.25 24.41 25.58 23.41 21.95 22.16 22.96 23.44 23.06
Inventories ……………………………………………………………………………………………………………………………………………………………………………………………………………………………………26.14 26.24 26.03 26.00 25.95 25.66 25.94 24.99 24.68 24.43
Total current assets …………………………………………………………………………………………………………………………………………………………………………………………………………………………69.17 68.85 69.39 70.63 68.99 65.76 65.95 66.20 66.41 65.67
Net property, plant, and equipment ……………………………………………………………………………………………………………………………………………………………………………………………………………24.16 24.22 24.05 23.43 24.21 25.17 24.87 25.21 25.08 25.67
Short-term debt, including current portion of long-term debt ………………………………………………………………………………………………………………………………………………………………………………………10.15 10.74 10.99 10.47 9.82 9.67 9.26 9.12 8.87 8.71
Total current liabilities …………………………………………………………………………………………………………………………………………………………………………………………………………………………………29.74 31.84 32.81 32.42 30.28 30.96 30.16 29.77 29.47 29.62
Long-term debt …………………………………………………………………………………………………………………………………………………………………………………………………………………………………16.25 17.22 16.56 16.45 15.60 15.88 15.97 15.60 15.96 15.24
Total liabilities …………………………………………………………………………………………………………………………………………………………………………………………………………………………………48.13 51.05 51.50 50.47 47.63 49.93 49.04 48.45 48.31 47.98
Stockholders' equity ………………………………………………………………………………………………………………………………………………………………………………………………………………………………51.87 48.95 48.50 49.53 52.37 50.07 50.96 51.55 51.69 52.02
Table 35.1 -- Balance Sheet For Corporations in NAICS Manufacturing Sector,
Total Assets $5 Million to Less Than $10 Million, and Total Assets $10 Million to Less Than $25 Million
See the Survey Methodology section of the Introduction for information on survey design, estimation, and sampling error.
(million dollars)
(percent of total assets)
(million dollars)
(percent of total assets)
All Manufacturing
Total Assets $5 Million to less than $10 Million
All Manufacturing
Total Assets $10 Million to less than $25 Million
71U.S. Census Bureau, Quarterly Financial Report, 2014 Quarter 4

Table with row headers in column A with column headers in rows 5 and 6
Item
4Q_
2013_
1Q_
2014_
2Q_
2014_
3Q_
2014_
4Q_
2014_
4Q_
2013_
1Q_
2014_
2Q_
2014_
3Q_
2014_
4Q_
2014_
Net sales, receipts, and operating revenues ………………………………………………………………………………………………………………………………………………………………………888,992 869,942 927,220 914,048 858,026 22,138 20,357 21,805 22,164 22,434
Depreciation, depletion, and amortization of property,
plant, and equipment …………………………………………………………………………………………………………………………………………………………………………………………23,277 22,659 23,417 24,032 24,829 478 430 399 444 506
All other operating costs and expenses …………………………………………………………………………………………………………...……………………………………………………………808,265 786,621 828,379 818,608 778,116 20,612 18,620 19,606 20,045 21,464
Income (loss) from operations …………………………………………………………………………………………………………...……………………………………………………………57,450 60,662 75,424 71,409 55,082 1,048 1,307 1,800 1,675 464
Interest expense …………………………………………………………………………………………………………………………………………………………………………………………………………………………………………16,102 15,920 15,684 15,668 16,231 125 120 113 120 127
All other nonoperating income (expense) ……………………………………………………………………………………………………………………………………………………………………………………………………37,256 42,892 40,841 44,661 33,959 95 21 9 25 8
Income (loss) before income taxes ………………………………………………………………………………………………………………………………………………………………………………………………78,604 87,634 100,581 100,402 72,809 1,018 1,208 1,695 1,581 346
Provision for current and deferred domestic income taxes …………………………………………………………………………………………………………………………………………………………………………………………7,843 16,077 19,975 18,876 9,981 124 175 147 141 131
Income (loss) after income taxes …………………………………………………………………………………………………………………………………………………………………………………………………………70,761 71,557 80,606 81,526 62,828 894 1,033 1,548 1,440 215
Cash dividends charged to retained earnings this quarter ……………………………………………………………………………………………………………………………………………………………………………………33,619 31,367 34,512 33,016 37,438 712 640 599 581 630
Net income retained in business ……………………………………………………………………………………………………………………………………………………………………………………………………37,142 40,190 46,094 48,510 25,389 181 393 949 859 (415)
Retained earnings at beginning of quarter …………………………………………………………………………………………………………………………………………………………………………………………………………1,682,561 1,718,412 1,746,536 1,776,048 1,815,482 8,409 7,518 7,447 8,210 8,861
Other direct credits (charges) to retained earnings (net), including
stock and other non-cash dividends, etc. ……………………………………………………………………………………………………………………………………………………………………………………………………………………………(3,853) (6,846) (6,383) (5,895) (7,484) (312) (280) (166) (113) (165)
Retained earnings at end of quarter ……………………………………………………………………………………………………………………………………………………………………………………………………1,715,850 1,751,756 1,786,247 1,818,663 1,833,388 8,279 7,631 8,230 8,956 8,280
INCOME STATEMENT IN RATIO FORMAT
Net sales, receipts, and operating revenues ……………………………………………………………………………………………………………………………………………………………………………………………………100.00 100.00 100.00 100.00 100.00 100.00 100.00 100.00 100.00 100.00
Depreciation, depletion, and amortization of property,
plant, and equipment ………………………………………………………………………………………………………………………………………………………………………2.62 2.60 2.53 2.63 2.89 2.16 2.11 1.83 2.00 2.26
All other operating costs and expenses ……………………………………………………………………………………………………………………………………………………………………………………………………90.92 90.42 89.34 89.56 90.69 93.11 91.47 89.92 90.44 95.67
Income (loss) from operations …………………………………………………………………………………………………………………………………………………………………………………………………6.46 6.97 8.13 7.81 6.42 4.73 6.42 8.25 7.56 2.07
Interest expense …………………………………………………………………………………………………………………………………………………………………………………………………………………………………1.81 1.83 1.69 1.71 1.89 0.56 0.59 0.52 0.54 0.57
All other nonoperating income (expense) ……………………………………………………………………………………………………………………………………………………………………………………………4.19 4.93 4.40 4.89 3.96 0.43 0.10 0.04 0.11 0.04
Income (loss) before income taxes ……………………………………………………………………………………………………………………………………………………………………………………………8.84 10.07 10.85 10.98 8.49 4.60 5.93 7.77 7.13 1.54
Provision for current and deferred domestic income taxes ……………………………………………………………………………………………………………………………………………………………………………………0.88 1.85 2.15 2.07 1.16 0.56 0.86 0.67 0.64 0.58
Income (loss) after income taxes ………………………………………………………………………………………………………………………………………………………………………………………………7.96 8.23 8.69 8.92 7.32 4.04 5.07 7.10 6.50 0.96
OPERATING RATIOS
(see explanatory notes)
Annual rate of profit on stockholders' equity at end of period:
Before income taxes ……………………………………………………………………………………………………………………………………………………………………………………………………………………16.05 17.69 20.04 19.80 14.69 30.06 33.80 48.19 42.61 9.21
After income taxes ………………………………………………………………………………………………………………………………………………………………………………………………………………14.45 14.45 16.06 16.08 12.68 26.40 28.90 44.01 38.82 5.72
Annual rate of profit on total assets:
Before income taxes ………………………………………………………………………………………………………………………………………………………………………………………………………………7.05 7.79 8.86 8.73 6.32 12.79 15.00 21.39 19.31 4.30
After income taxes …………………………………………………………………………………………………………………………………………………………………………………………………………………………6.35 6.36 7.10 7.09 5.45 11.23 12.83 19.53 17.59 2.67
BALANCE SHEET RATIOS
(based on succeeding table)
Total current assets to total current liabilities …………………………………………………………………………………………………………………………………………………………………………………………………1.24 1.25 1.28 1.25 1.25 2.20 2.11 2.05 2.06 2.12
Total cash, U.S. Government and other securities, to total current liabilities …………………………………………………………………………………………………………………………………………………………………0.25 0.22 0.22 0.23 0.24 0.57 0.53 0.51 0.55 0.55
Total stockholders' equity to total debt ………………………………………………………………………………………………………………………………………………………………………………………………………1.51 1.48 1.49 1.48 1.43 1.24 1.35 1.40 1.47 1.54
(percent of net sales) (percent of net sales)
(percent) (percent)
Table 36.0 -- Income Statement For Corporations in NAICS Nondurable Manufacturing Subsectors,
All Total Asset Sizes, and Total Assets Under $5 Million
See the Survey Methodology section of the Introduction for information on survey design, estimation, and sampling error.
All Nondurable Manufacturing
All Total Asset Sizes
All Nondurable Manufacturing
Total Assets Under $5 Million
(million dollars) (million dollars)
72U.S. Census Bureau, Quarterly Financial Report, 2014 Quarter 4
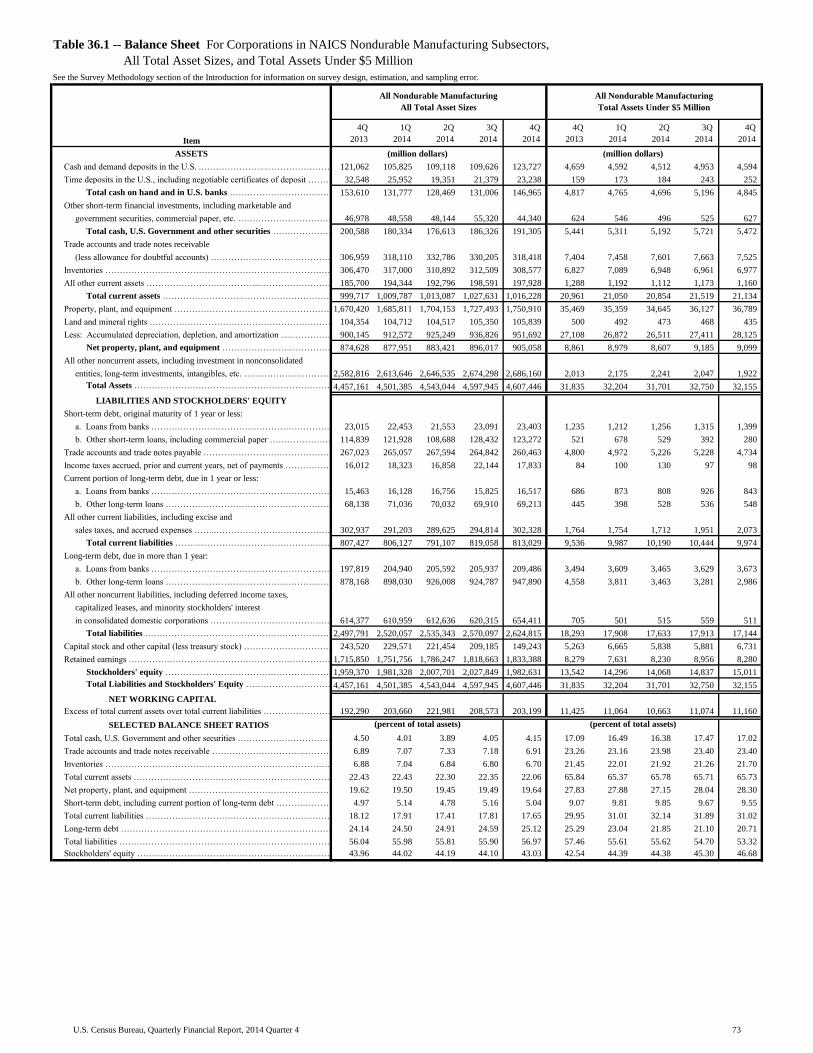
Table with row headers in column A with column headers in rows 5 and 6
Item
4Q_
2013_
1Q_
2014_
2Q_
2014_
3Q_
2014_
4Q_
2014_
4Q_
2013_
1Q_
2014_
2Q_
2014_
3Q_
2014_
4Q_
2014_
ASSETS
Cash and demand deposits in the U.S. .………………………………………………………………………………………………………………………………………………………………………………………………………………………………121,062 105,825 109,118 109,626 123,727 4,659 4,592 4,512 4,953 4,594
Time deposits in the U.S., including negotiable certificates of deposit ……………………………………………………………………………………………………………………………………………………………………………………32,548 25,952 19,351 21,379 23,238 159 173 184 243 252
Total cash on hand and in U.S. banks ……………………………………………………………………………………………………………………………………………………………………………………153,610 131,777 128,469 131,006 146,965 4,817 4,765 4,696 5,196 4,845
Other short-term financial investments, including marketable and
government securities, commercial paper, etc. ………………………………………………………………………………………………………………………………………………………………………………………………………………………………46,978 48,558 48,144 55,320 44,340 624 546 496 525 627
Total cash, U.S. Government and other securities ……………………………………………………………………………………………………………………………………………………………………………………200,588 180,334 176,613 186,326 191,305 5,441 5,311 5,192 5,721 5,472
Trade accounts and trade notes receivable
(less allowance for doubtful accounts) …………………………………………………………………………………………………………………………………………306,959 318,110 332,786 330,205 318,418 7,404 7,458 7,601 7,663 7,525
Inventories ………………………………………………………………………………………………………………………………………………………………………………………………………………………………306,470 317,000 310,892 312,509 308,577 6,827 7,089 6,948 6,961 6,977
All other current assets ………………………………………………………………………………………………………………………………………………………………………………………………………………………………185,700 194,344 192,796 198,591 197,928 1,288 1,192 1,112 1,173 1,160
Total current assets ………………………………………………………………………………………………………………………………………………………………………………………………………………………………999,717 1,009,787 1,013,087 1,027,631 1,016,228 20,961 21,050 20,854 21,519 21,134
Property, plant, and equipment ………………………………………………………………………………………………………………………………………………………………………………………………………………………………1,670,420 1,685,811 1,704,153 1,727,493 1,750,910 35,469 35,359 34,645 36,127 36,789
Land and mineral rights ………………………………………………………………………………………………………………………………………………………………………………………………………………………………104,354 104,712 104,517 105,350 105,839 500 492 473 468 435
Less: Accumulated depreciation, depletion, and amortization ……………………………………………………………………………………………………………………………………………………………………………………900,145 912,572 925,249 936,826 951,692 27,108 26,872 26,511 27,411 28,125
Net property, plant, and equipment ……………………………………………………………………………………………………………………………………………………………………………………874,628 877,951 883,421 896,017 905,058 8,861 8,979 8,607 9,185 9,099
All other noncurrent assets, including investment in nonconsolidated
entities, long-term investments, intangibles, etc. ………………………………………………………………………………………………………………………………………………………………………………………………………………2,582,816 2,613,646 2,646,535 2,674,298 2,686,160 2,013 2,175 2,241 2,047 1,922
Total Assets …………………………………………………………………………………………………………………………………………………………………………………………………………………………4,457,161 4,501,385 4,543,044 4,597,945 4,607,446 31,835 32,204 31,701 32,750 32,155
LIABILITIES AND STOCKHOLDERS' EQUITY
Short-term debt, original maturity of 1 year or less:
a. Loans from banks ………………………………………………………………………………………………………………………………………………………………………………………………………………………23,015 22,453 21,553 23,091 23,403 1,235 1,212 1,256 1,315 1,399
b. Other short-term loans, including commercial paper ………………………………………………………………………………………………………………………………………………………………………………………114,839 121,928 108,688 128,432 123,272 521 678 529 392 280
Trade accounts and trade notes payable ……………………………………………………………………………………………………………………………………………………………………………………………………………267,023 265,057 267,594 264,842 260,463 4,800 4,972 5,226 5,228 4,734
Income taxes accrued, prior and current years, net of payments ………………………………………………………………………………………………………………………………………………………………………………16,012 18,323 16,858 22,144 17,833 84 100 130 97 98
Current portion of long-term debt, due in 1 year or less:
a. Loans from banks …………………………………………………………………………………………………………………………………………………………………………………………………………………………………15,463 16,128 16,756 15,825 16,517 686 873 808 926 843
b. Other long-term loans ……………………………………………………………………………………………………………………………………………………………………………………………………………………68,138 71,036 70,032 69,910 69,213 445 398 528 536 548
All other current liabilities, including excise and
sales taxes, and accrued expenses ……..……………………………………………………………………………………………………………………………………………………302,937 291,203 289,625 294,814 302,328 1,764 1,754 1,712 1,951 2,073
Total current liabilities ……………………………………………………………………………………………………………………………………………………………………………………………………………………807,427 806,127 791,107 819,058 813,029 9,536 9,987 10,190 10,444 9,974
Long-term debt, due in more than 1 year:
a. Loans from banks …………………………………………………………………………………………………………………………………………………………………………………………………………………………197,819 204,940 205,592 205,937 209,486 3,494 3,609 3,465 3,629 3,673
b. Other long-term loans ……………………………………………………………………………………………………………………………………………………………………………………………………………………878,168 898,030 926,008 924,787 947,890 4,558 3,811 3,463 3,281 2,986
All other noncurrent liabilities, including deferred income taxes,
capitalized leases, and minority stockholders' interest
in consolidated domestic corporations ……………………………………………………………………………………………………………………………………………………………………614,377 610,959 612,636 620,315 654,411 705 501 515 559 511
Total liabilities ……………………………………………………………………………………………………………………………………………………………………………………………………………………………2,497,791 2,520,057 2,535,343 2,570,097 2,624,815 18,293 17,908 17,633 17,913 17,144
Capital stock and other capital (less treasury stock) …………………………………………………………………………………………………………………………………………………………………………………………243,520 229,571 221,454 209,185 149,243 5,263 6,665 5,838 5,881 6,731
Retained earnings …………………………………………………………………………………………………………………………………………………………………………………………………………………………………1,715,850 1,751,756 1,786,247 1,818,663 1,833,388 8,279 7,631 8,230 8,956 8,280
Stockholders' equity ……………………………………………………………………………………………………………………………………………………………………………………………………………………1,959,370 1,981,328 2,007,701 2,027,849 1,982,631 13,542 14,296 14,068 14,837 15,011
Total Liabilities and Stockholders' Equity ………………………………………………………………………………………………………………………………………………………………………………………………4,457,161 4,501,385 4,543,044 4,597,945 4,607,446 31,835 32,204 31,701 32,750 32,155
NET WORKING CAPITAL
Excess of total current assets over total current liabilities ………………………………………………………………………………………………………………………………………………………………………………………192,290 203,660 221,981 208,573 203,199 11,425 11,064 10,663 11,074 11,160
SELECTED BALANCE SHEET RATIOS
Total cash, U.S. Government and other securities …………………………………………………………………………………………………………………………………………………………………………………………………4.50 4.01 3.89 4.05 4.15 17.09 16.49 16.38 17.47 17.02
Trade accounts and trade notes receivable ……………………………………………………………………………………………………………………………………………………………………………………………………6.89 7.07 7.33 7.18 6.91 23.26 23.16 23.98 23.40 23.40
Inventories ……………………………………………………………………………………………………………………………………………………………………………………………………………………………………6.88 7.04 6.84 6.80 6.70 21.45 22.01 21.92 21.26 21.70
Total current assets …………………………………………………………………………………………………………………………………………………………………………………………………………………………22.43 22.43 22.30 22.35 22.06 65.84 65.37 65.78 65.71 65.73
Net property, plant, and equipment ……………………………………………………………………………………………………………………………………………………………………………………………………………19.62 19.50 19.45 19.49 19.64 27.83 27.88 27.15 28.04 28.30
Short-term debt, including current portion of long-term debt ………………………………………………………………………………………………………………………………………………………………………………………4.97 5.14 4.78 5.16 5.04 9.07 9.81 9.85 9.67 9.55
Total current liabilities …………………………………………………………………………………………………………………………………………………………………………………………………………………………………18.12 17.91 17.41 17.81 17.65 29.95 31.01 32.14 31.89 31.02
Long-term debt …………………………………………………………………………………………………………………………………………………………………………………………………………………………………24.14 24.50 24.91 24.59 25.12 25.29 23.04 21.85 21.10 20.71
Total liabilities …………………………………………………………………………………………………………………………………………………………………………………………………………………………………56.04 55.98 55.81 55.90 56.97 57.46 55.61 55.62 54.70 53.32
Stockholders' equity ………………………………………………………………………………………………………………………………………………………………………………………………………………………………43.96 44.02 44.19 44.10 43.03 42.54 44.39 44.38 45.30 46.68
Table 36.1 -- Balance Sheet For Corporations in NAICS Nondurable Manufacturing Subsectors,
All Total Asset Sizes, and Total Assets Under $5 Million
See the Survey Methodology section of the Introduction for information on survey design, estimation, and sampling error.
(million dollars)
(percent of total assets)
(million dollars)
(percent of total assets)
All Nondurable Manufacturing
All Total Asset Sizes
All Nondurable Manufacturing
Total Assets Under $5 Million
73U.S. Census Bureau, Quarterly Financial Report, 2014 Quarter 4
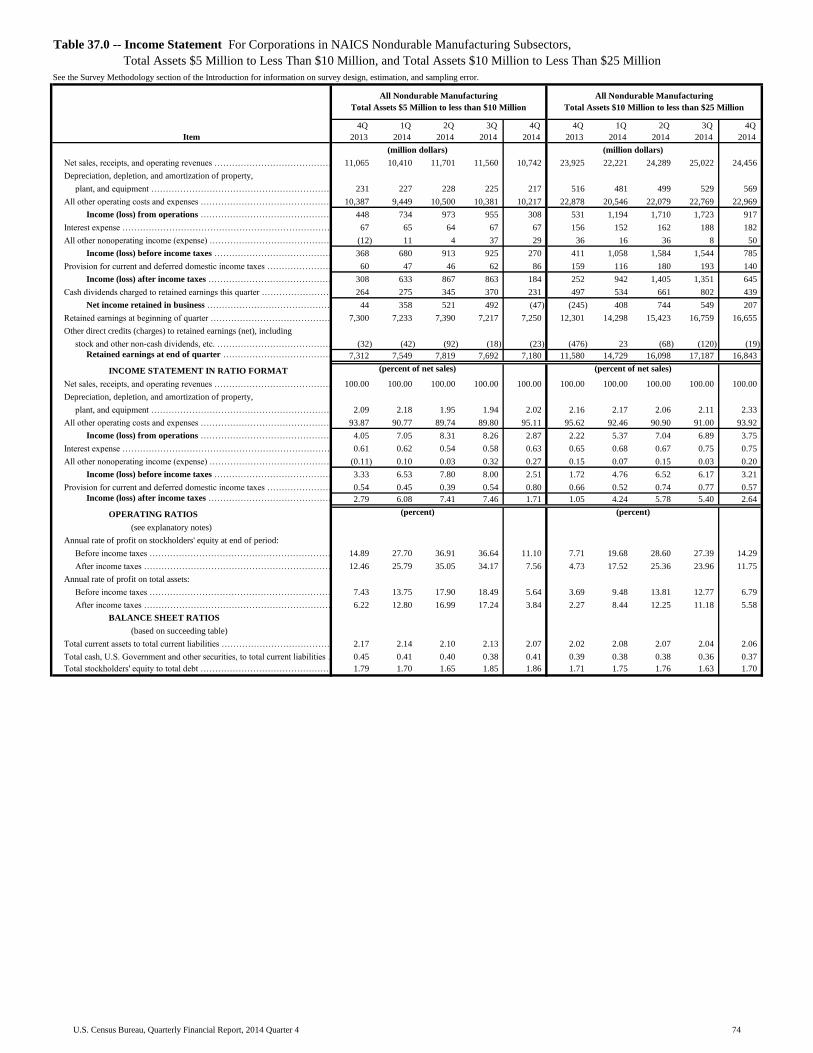
Table with row headers in column A with column headers in rows 5 and 6
Item
4Q_
2013_
1Q_
2014_
2Q_
2014_
3Q_
2014_
4Q_
2014_
4Q_
2013_
1Q_
2014_
2Q_
2014_
3Q_
2014_
4Q_
2014_
Net sales, receipts, and operating revenues ………………………………………………………………………………………………………………………………………………………………………11,065 10,410 11,701 11,560 10,742 23,925 22,221 24,289 25,022 24,456
Depreciation, depletion, and amortization of property,
plant, and equipment …………………………………………………………………………………………………………………………………………………………………………………………231 227 228 225 217 516 481 499 529 569
All other operating costs and expenses …………………………………………………………………………………………………………...……………………………………………………………10,387 9,449 10,500 10,381 10,217 22,878 20,546 22,079 22,769 22,969
Income (loss) from operations …………………………………………………………………………………………………………...……………………………………………………………448 734 973 955 308 531 1,194 1,710 1,723 917
Interest expense …………………………………………………………………………………………………………………………………………………………………………………………………………………………………………67 65 64 67 67 156 152 162 188 182
All other nonoperating income (expense) ……………………………………………………………………………………………………………………………………………………………………………………………………(12) 11 4 37 29 36 16 36 8 50
Income (loss) before income taxes ………………………………………………………………………………………………………………………………………………………………………………………………368 680 913 925 270 411 1,058 1,584 1,544 785
Provision for current and deferred domestic income taxes …………………………………………………………………………………………………………………………………………………………………………………………60 47 46 62 86 159 116 180 193 140
Income (loss) after income taxes …………………………………………………………………………………………………………………………………………………………………………………………………………308 633 867 863 184 252 942 1,405 1,351 645
Cash dividends charged to retained earnings this quarter ……………………………………………………………………………………………………………………………………………………………………………………264 275 345 370 231 497 534 661 802 439
Net income retained in business ……………………………………………………………………………………………………………………………………………………………………………………………………44 358 521 492 (47) (245) 408 744 549 207
Retained earnings at beginning of quarter …………………………………………………………………………………………………………………………………………………………………………………………………………7,300 7,233 7,390 7,217 7,250 12,301 14,298 15,423 16,759 16,655
Other direct credits (charges) to retained earnings (net), including
stock and other non-cash dividends, etc. ……………………………………………………………………………………………………………………………………………………………………………………………………………………………(32) (42) (92) (18) (23) (476) 23 (68) (120) (19)
Retained earnings at end of quarter ……………………………………………………………………………………………………………………………………………………………………………………………………7,312 7,549 7,819 7,692 7,180 11,580 14,729 16,098 17,187 16,843
INCOME STATEMENT IN RATIO FORMAT
Net sales, receipts, and operating revenues ……………………………………………………………………………………………………………………………………………………………………………………………………100.00 100.00 100.00 100.00 100.00 100.00 100.00 100.00 100.00 100.00
Depreciation, depletion, and amortization of property,
plant, and equipment ………………………………………………………………………………………………………………………………………………………………………2.09 2.18 1.95 1.94 2.02 2.16 2.17 2.06 2.11 2.33
All other operating costs and expenses ……………………………………………………………………………………………………………………………………………………………………………………………………93.87 90.77 89.74 89.80 95.11 95.62 92.46 90.90 91.00 93.92
Income (loss) from operations …………………………………………………………………………………………………………………………………………………………………………………………………4.05 7.05 8.31 8.26 2.87 2.22 5.37 7.04 6.89 3.75
Interest expense …………………………………………………………………………………………………………………………………………………………………………………………………………………………………0.61 0.62 0.54 0.58 0.63 0.65 0.68 0.67 0.75 0.75
All other nonoperating income (expense) ……………………………………………………………………………………………………………………………………………………………………………………………(0.11) 0.10 0.03 0.32 0.27 0.15 0.07 0.15 0.03 0.20
Income (loss) before income taxes ……………………………………………………………………………………………………………………………………………………………………………………………3.33 6.53 7.80 8.00 2.51 1.72 4.76 6.52 6.17 3.21
Provision for current and deferred domestic income taxes ……………………………………………………………………………………………………………………………………………………………………………………0.54 0.45 0.39 0.54 0.80 0.66 0.52 0.74 0.77 0.57
Income (loss) after income taxes ………………………………………………………………………………………………………………………………………………………………………………………………2.79 6.08 7.41 7.46 1.71 1.05 4.24 5.78 5.40 2.64
OPERATING RATIOS
(see explanatory notes)
Annual rate of profit on stockholders' equity at end of period:
Before income taxes ……………………………………………………………………………………………………………………………………………………………………………………………………………………14.89 27.70 36.91 36.64 11.10 7.71 19.68 28.60 27.39 14.29
After income taxes ………………………………………………………………………………………………………………………………………………………………………………………………………………12.46 25.79 35.05 34.17 7.56 4.73 17.52 25.36 23.96 11.75
Annual rate of profit on total assets:
Before income taxes ………………………………………………………………………………………………………………………………………………………………………………………………………………7.43 13.75 17.90 18.49 5.64 3.69 9.48 13.81 12.77 6.79
After income taxes …………………………………………………………………………………………………………………………………………………………………………………………………………………………6.22 12.80 16.99 17.24 3.84 2.27 8.44 12.25 11.18 5.58
BALANCE SHEET RATIOS
(based on succeeding table)
Total current assets to total current liabilities …………………………………………………………………………………………………………………………………………………………………………………………………2.17 2.14 2.10 2.13 2.07 2.02 2.08 2.07 2.04 2.06
Total cash, U.S. Government and other securities, to total current liabilities …………………………………………………………………………………………………………………………………………………………………0.45 0.41 0.40 0.38 0.41 0.39 0.38 0.38 0.36 0.37
Total stockholders' equity to total debt ………………………………………………………………………………………………………………………………………………………………………………………………………1.79 1.70 1.65 1.85 1.86 1.71 1.75 1.76 1.63 1.70
(percent of net sales) (percent of net sales)
(percent) (percent)
Table 37.0 -- Income Statement For Corporations in NAICS Nondurable Manufacturing Subsectors,
Total Assets $5 Million to Less Than $10 Million, and Total Assets $10 Million to Less Than $25 Million
See the Survey Methodology section of the Introduction for information on survey design, estimation, and sampling error.
All Nondurable Manufacturing
Total Assets $5 Million to less than $10 Million
All Nondurable Manufacturing
Total Assets $10 Million to less than $25 Million
(million dollars) (million dollars)
74U.S. Census Bureau, Quarterly Financial Report, 2014 Quarter 4

Table with row headers in column A with column headers in rows 5 and 6
Item
4Q_
2013_
1Q_
2014_
2Q_
2014_
3Q_
2014_
4Q_
2014_
4Q_
2013_
1Q_
2014_
2Q_
2014_
3Q_
2014_
4Q_
2014_
ASSETS
Cash and demand deposits in the U.S. .………………………………………………………………………………………………………………………………………………………………………………………………………………………………2,102 2,071 2,243 2,087 1,912 4,612 4,264 4,430 4,485 4,454
Time deposits in the U.S., including negotiable certificates of deposit ……………………………………………………………………………………………………………………………………………………………………………………147 88 140 142 132 192 234 186 129 155
Total cash on hand and in U.S. banks ……………………………………………………………………………………………………………………………………………………………………………………2,249 2,159 2,383 2,230 2,044 4,804 4,498 4,616 4,615 4,609
Other short-term financial investments, including marketable and
government securities, commercial paper, etc. ………………………………………………………………………………………………………………………………………………………………………………………………………………………………374 261 138 118 379 583 636 635 662 535
Total cash, U.S. Government and other securities ……………………………………………………………………………………………………………………………………………………………………………………2,623 2,420 2,522 2,348 2,423 5,387 5,134 5,251 5,276 5,144
Trade accounts and trade notes receivable
(less allowance for doubtful accounts) …………………………………………………………………………………………………………………………………………4,617 4,792 5,047 5,176 4,432 9,963 10,393 10,845 11,445 10,801
Inventories ………………………………………………………………………………………………………………………………………………………………………………………………………………………………4,772 4,751 4,913 4,847 4,380 10,856 10,888 11,016 11,507 10,825
All other current assets ………………………………………………………………………………………………………………………………………………………………………………………………………………………………755 670 695 762 824 1,554 1,507 1,533 1,762 1,638
Total current assets ………………………………………………………………………………………………………………………………………………………………………………………………………………………………12,768 12,633 13,177 13,132 12,060 27,760 27,921 28,645 29,990 28,407
Property, plant, and equipment ………………………………………………………………………………………………………………………………………………………………………………………………………………………………16,997 17,677 17,584 16,893 16,777 34,924 34,540 36,345 38,483 37,436
Land and mineral rights ………………………………………………………………………………………………………………………………………………………………………………………………………………………………274 261 292 253 256 594 521 612 580 533
Less: Accumulated depreciation, depletion, and amortization ……………………………………………………………………………………………………………………………………………………………………………………11,611 12,174 12,030 11,648 11,392 22,468 22,148 23,497 24,720 24,011
Net property, plant, and equipment ……………………………………………………………………………………………………………………………………………………………………………………5,660 5,764 5,846 5,498 5,641 13,050 12,912 13,460 14,342 13,958
All other noncurrent assets, including investment in nonconsolidated
entities, long-term investments, intangibles, etc. ………………………………………………………………………………………………………………………………………………………………………………………………………………1,402 1,387 1,379 1,387 1,444 3,740 3,807 3,779 4,023 3,918
Total Assets …………………………………………………………………………………………………………………………………………………………………………………………………………………………19,830 19,784 20,402 20,017 19,145 44,550 44,640 45,885 48,355 46,283
LIABILITIES AND STOCKHOLDERS' EQUITY
Short-term debt, original maturity of 1 year or less:
a. Loans from banks ………………………………………………………………………………………………………………………………………………………………………………………………………………………1,087 1,110 1,125 1,035 987 2,564 2,528 2,561 2,574 2,508
b. Other short-term loans, including commercial paper ………………………………………………………………………………………………………………………………………………………………………………………159 167 184 201 153 195 182 260 213 138
Trade accounts and trade notes payable ……………………………………………………………………………………………………………………………………………………………………………………………………………2,822 2,728 3,033 3,030 2,764 6,318 6,583 6,787 7,404 6,814
Income taxes accrued, prior and current years, net of payments ………………………………………………………………………………………………………………………………………………………………………………50 49 51 42 83 196 109 153 151 124
Current portion of long-term debt, due in 1 year or less:
a. Loans from banks …………………………………………………………………………………………………………………………………………………………………………………………………………………………………536 629 612 616 636 1,294 1,077 1,110 1,181 1,114
b. Other long-term loans ……………………………………………………………………………………………………………………………………………………………………………………………………………………280 276 285 200 192 306 316 389 361 391
All other current liabilities, including excise and
sales taxes, and accrued expenses ……..……………………………………………………………………………………………………………………………………………………961 955 984 1,055 1,024 2,877 2,613 2,560 2,803 2,728
Total current liabilities ……………………………………………………………………………………………………………………………………………………………………………………………………………………5,894 5,915 6,274 6,179 5,840 13,749 13,408 13,820 14,687 13,818
Long-term debt, due in more than 1 year:
a. Loans from banks …………………………………………………………………………………………………………………………………………………………………………………………………………………………2,206 2,315 2,548 2,306 2,135 5,184 5,133 5,226 5,735 5,366
b. Other long-term loans ……………………………………………………………………………………………………………………………………………………………………………………………………………………1,267 1,283 1,248 1,091 1,134 2,915 3,057 3,049 3,736 3,442
All other noncurrent liabilities, including deferred income taxes,
capitalized leases, and minority stockholders' interest
in consolidated domestic corporations ……………………………………………………………………………………………………………………………………………………………………565 453 439 342 301 1,381 1,536 1,634 1,645 1,682
Total liabilities ……………………………………………………………………………………………………………………………………………………………………………………………………………………………9,933 9,966 10,509 9,919 9,410 23,230 23,135 23,730 25,802 24,307
Capital stock and other capital (less treasury stock) …………………………………………………………………………………………………………………………………………………………………………………………2,585 2,270 2,075 2,406 2,554 9,740 6,776 6,057 5,366 5,133
Retained earnings …………………………………………………………………………………………………………………………………………………………………………………………………………………………………7,312 7,549 7,819 7,692 7,180 11,580 14,729 16,098 17,187 16,843
Stockholders' equity ……………………………………………………………………………………………………………………………………………………………………………………………………………………9,897 9,819 9,893 10,098 9,735 21,320 21,505 22,155 22,553 21,976
Total Liabilities and Stockholders' Equity ………………………………………………………………………………………………………………………………………………………………………………………………19,830 19,784 20,402 20,017 19,145 44,550 44,640 45,885 48,355 46,283
NET WORKING CAPITAL
Excess of total current assets over total current liabilities ………………………………………………………………………………………………………………………………………………………………………………………6,874 6,718 6,903 6,953 6,220 14,011 14,513 14,824 15,303 14,589
SELECTED BALANCE SHEET RATIOS
Total cash, U.S. Government and other securities …………………………………………………………………………………………………………………………………………………………………………………………………13.23 12.23 12.36 11.73 12.66 12.09 11.50 11.44 10.91 11.11
Trade accounts and trade notes receivable ……………………………………………………………………………………………………………………………………………………………………………………………………23.29 24.22 24.74 25.86 23.15 22.36 23.28 23.64 23.67 23.34
Inventories ……………………………………………………………………………………………………………………………………………………………………………………………………………………………………24.07 24.01 24.08 24.21 22.88 24.37 24.39 24.01 23.80 23.39
Total current assets …………………………………………………………………………………………………………………………………………………………………………………………………………………………64.39 63.85 64.58 65.61 62.99 62.31 62.55 62.43 62.02 61.38
Net property, plant, and equipment ……………………………………………………………………………………………………………………………………………………………………………………………………………28.54 29.13 28.65 27.47 29.47 29.29 28.92 29.34 29.66 30.16
Short-term debt, including current portion of long-term debt ………………………………………………………………………………………………………………………………………………………………………………………10.40 11.03 10.81 10.25 10.28 9.78 9.19 9.42 8.95 8.97
Total current liabilities …………………………………………………………………………………………………………………………………………………………………………………………………………………………………29.72 29.90 30.75 30.87 30.50 30.86 30.04 30.12 30.37 29.86
Long-term debt …………………………………………………………………………………………………………………………………………………………………………………………………………………………………17.52 18.19 18.61 16.97 17.08 18.18 18.35 18.03 19.59 19.03
Total liabilities …………………………………………………………………………………………………………………………………………………………………………………………………………………………………50.09 50.37 51.51 49.55 49.15 52.14 51.82 51.72 53.36 52.52
Stockholders' equity ………………………………………………………………………………………………………………………………………………………………………………………………………………………………49.91 49.63 48.49 50.45 50.85 47.86 48.18 48.28 46.64 47.48
Table 37.1 -- Balance Sheet For Corporations in NAICS Nondurable Manufacturing Subsectors,
Total Assets $5 Million to Less Than $10 Million, and Total Assets $10 Million to Less Than $25 Million
See the Survey Methodology section of the Introduction for information on survey design, estimation, and sampling error.
(million dollars)
(percent of total assets)
(million dollars)
(percent of total assets)
All Nondurable Manufacturing
Total Assets $5 Million to less than $10 Million
All Nondurable Manufacturing
Total Assets $10 Million to less than $25 Million
75U.S. Census Bureau, Quarterly Financial Report, 2014 Quarter 4
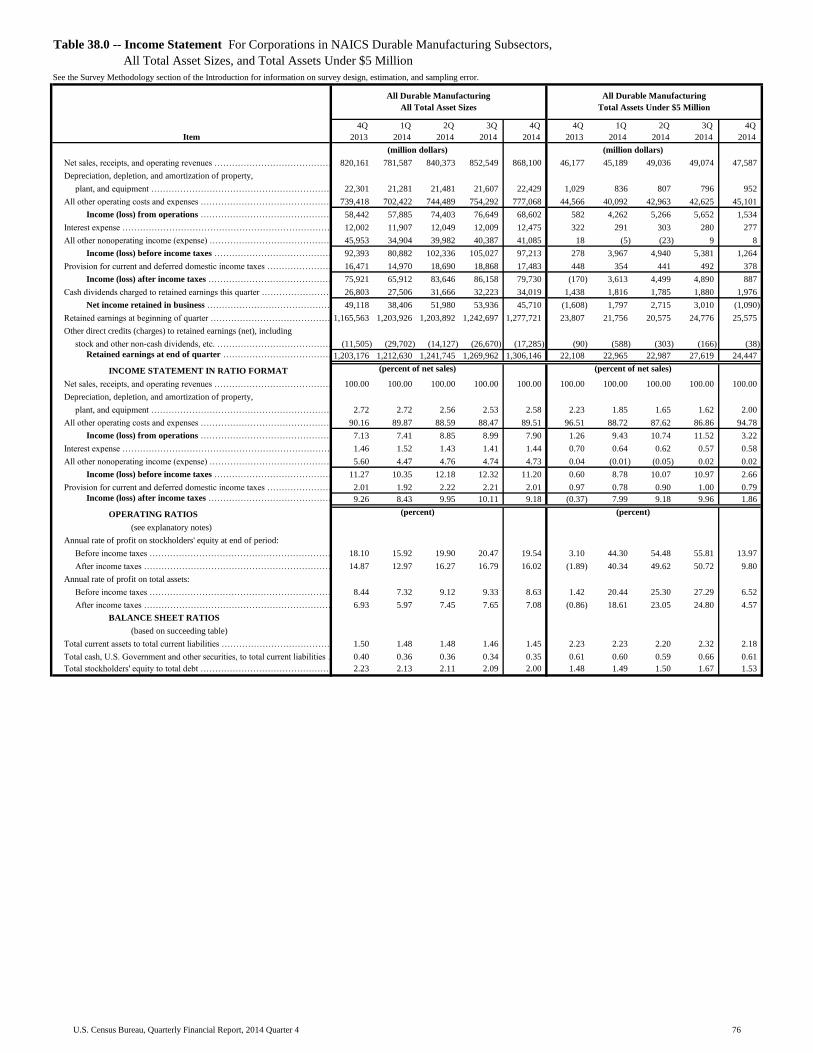
Table with row headers in column A with column headers in rows 5 and 6
Item
4Q_
2013_
1Q_
2014_
2Q_
2014_
3Q_
2014_
4Q_
2014_
4Q_
2013_
1Q_
2014_
2Q_
2014_
3Q_
2014_
4Q_
2014_
Net sales, receipts, and operating revenues ………………………………………………………………………………………………………………………………………………………………………820,161 781,587 840,373 852,549 868,100 46,177 45,189 49,036 49,074 47,587
Depreciation, depletion, and amortization of property,
plant, and equipment …………………………………………………………………………………………………………………………………………………………………………………………22,301 21,281 21,481 21,607 22,429 1,029 836 807 796 952
All other operating costs and expenses …………………………………………………………………………………………………………...……………………………………………………………739,418 702,422 744,489 754,292 777,068 44,566 40,092 42,963 42,625 45,101
Income (loss) from operations …………………………………………………………………………………………………………...……………………………………………………………58,442 57,885 74,403 76,649 68,602 582 4,262 5,266 5,652 1,534
Interest expense …………………………………………………………………………………………………………………………………………………………………………………………………………………………………………12,002 11,907 12,049 12,009 12,475 322 291 303 280 277
All other nonoperating income (expense) ……………………………………………………………………………………………………………………………………………………………………………………………………45,953 34,904 39,982 40,387 41,085 18 (5) (23) 9 8
Income (loss) before income taxes ………………………………………………………………………………………………………………………………………………………………………………………………92,393 80,882 102,336 105,027 97,213 278 3,967 4,940 5,381 1,264
Provision for current and deferred domestic income taxes …………………………………………………………………………………………………………………………………………………………………………………………16,471 14,970 18,690 18,868 17,483 448 354 441 492 378
Income (loss) after income taxes …………………………………………………………………………………………………………………………………………………………………………………………………………75,921 65,912 83,646 86,158 79,730 (170) 3,613 4,499 4,890 887
Cash dividends charged to retained earnings this quarter ……………………………………………………………………………………………………………………………………………………………………………………26,803 27,506 31,666 32,223 34,019 1,438 1,816 1,785 1,880 1,976
Net income retained in business ……………………………………………………………………………………………………………………………………………………………………………………………………49,118 38,406 51,980 53,936 45,710 (1,608) 1,797 2,715 3,010 (1,090)
Retained earnings at beginning of quarter …………………………………………………………………………………………………………………………………………………………………………………………………………1,165,563 1,203,926 1,203,892 1,242,697 1,277,721 23,807 21,756 20,575 24,776 25,575
Other direct credits (charges) to retained earnings (net), including
stock and other non-cash dividends, etc. ……………………………………………………………………………………………………………………………………………………………………………………………………………………………(11,505) (29,702) (14,127) (26,670) (17,285) (90) (588) (303) (166) (38)
Retained earnings at end of quarter ……………………………………………………………………………………………………………………………………………………………………………………………………1,203,176 1,212,630 1,241,745 1,269,962 1,306,146 22,108 22,965 22,987 27,619 24,447
INCOME STATEMENT IN RATIO FORMAT
Net sales, receipts, and operating revenues ……………………………………………………………………………………………………………………………………………………………………………………………………100.00 100.00 100.00 100.00 100.00 100.00 100.00 100.00 100.00 100.00
Depreciation, depletion, and amortization of property,
plant, and equipment ………………………………………………………………………………………………………………………………………………………………………2.72 2.72 2.56 2.53 2.58 2.23 1.85 1.65 1.62 2.00
All other operating costs and expenses ……………………………………………………………………………………………………………………………………………………………………………………………………90.16 89.87 88.59 88.47 89.51 96.51 88.72 87.62 86.86 94.78
Income (loss) from operations …………………………………………………………………………………………………………………………………………………………………………………………………7.13 7.41 8.85 8.99 7.90 1.26 9.43 10.74 11.52 3.22
Interest expense …………………………………………………………………………………………………………………………………………………………………………………………………………………………………1.46 1.52 1.43 1.41 1.44 0.70 0.64 0.62 0.57 0.58
All other nonoperating income (expense) ……………………………………………………………………………………………………………………………………………………………………………………………5.60 4.47 4.76 4.74 4.73 0.04 (0.01) (0.05) 0.02 0.02
Income (loss) before income taxes ……………………………………………………………………………………………………………………………………………………………………………………………11.27 10.35 12.18 12.32 11.20 0.60 8.78 10.07 10.97 2.66
Provision for current and deferred domestic income taxes ……………………………………………………………………………………………………………………………………………………………………………………2.01 1.92 2.22 2.21 2.01 0.97 0.78 0.90 1.00 0.79
Income (loss) after income taxes ………………………………………………………………………………………………………………………………………………………………………………………………9.26 8.43 9.95 10.11 9.18 (0.37) 7.99 9.18 9.96 1.86
OPERATING RATIOS
(see explanatory notes)
Annual rate of profit on stockholders' equity at end of period:
Before income taxes ……………………………………………………………………………………………………………………………………………………………………………………………………………………18.10 15.92 19.90 20.47 19.54 3.10 44.30 54.48 55.81 13.97
After income taxes ………………………………………………………………………………………………………………………………………………………………………………………………………………14.87 12.97 16.27 16.79 16.02 (1.89) 40.34 49.62 50.72 9.80
Annual rate of profit on total assets:
Before income taxes ………………………………………………………………………………………………………………………………………………………………………………………………………………8.44 7.32 9.12 9.33 8.63 1.42 20.44 25.30 27.29 6.52
After income taxes …………………………………………………………………………………………………………………………………………………………………………………………………………………………6.93 5.97 7.45 7.65 7.08 (0.86) 18.61 23.05 24.80 4.57
BALANCE SHEET RATIOS
(based on succeeding table)
Total current assets to total current liabilities …………………………………………………………………………………………………………………………………………………………………………………………………1.50 1.48 1.48 1.46 1.45 2.23 2.23 2.20 2.32 2.18
Total cash, U.S. Government and other securities, to total current liabilities …………………………………………………………………………………………………………………………………………………………………0.40 0.36 0.36 0.34 0.35 0.61 0.60 0.59 0.66 0.61
Total stockholders' equity to total debt ………………………………………………………………………………………………………………………………………………………………………………………………………2.23 2.13 2.11 2.09 2.00 1.48 1.49 1.50 1.67 1.53
(percent of net sales) (percent of net sales)
(percent) (percent)
Table 38.0 -- Income Statement For Corporations in NAICS Durable Manufacturing Subsectors,
All Total Asset Sizes, and Total Assets Under $5 Million
See the Survey Methodology section of the Introduction for information on survey design, estimation, and sampling error.
All Durable Manufacturing
All Total Asset Sizes
All Durable Manufacturing
Total Assets Under $5 Million
(million dollars) (million dollars)
76U.S. Census Bureau, Quarterly Financial Report, 2014 Quarter 4
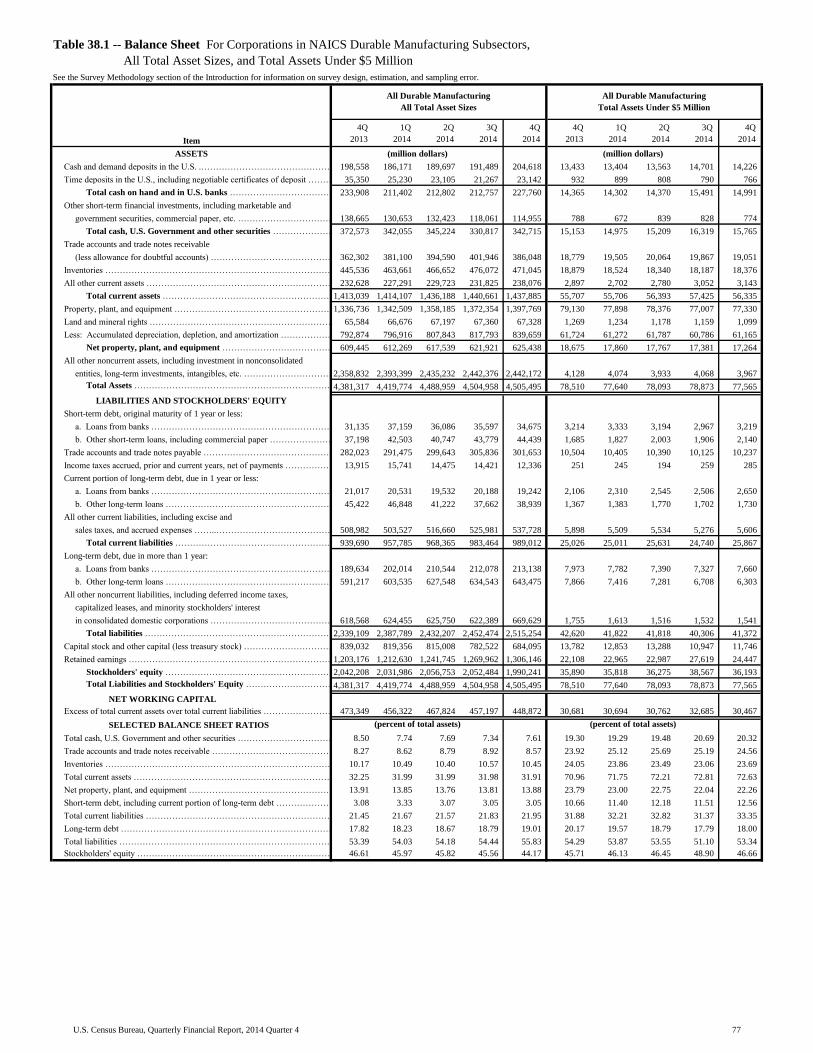
Table with row headers in column A with column headers in rows 5 and 6
Item
4Q_
2013_
1Q_
2014_
2Q_
2014_
3Q_
2014_
4Q_
2014_
4Q_
2013_
1Q_
2014_
2Q_
2014_
3Q_
2014_
4Q_
2014_
ASSETS
Cash and demand deposits in the U.S. .………………………………………………………………………………………………………………………………………………………………………………………………………………………………198,558 186,171 189,697 191,489 204,618 13,433 13,404 13,563 14,701 14,226
Time deposits in the U.S., including negotiable certificates of deposit ……………………………………………………………………………………………………………………………………………………………………………………35,350 25,230 23,105 21,267 23,142 932 899 808 790 766
Total cash on hand and in U.S. banks ……………………………………………………………………………………………………………………………………………………………………………………233,908 211,402 212,802 212,757 227,760 14,365 14,302 14,370 15,491 14,991
Other short-term financial investments, including marketable and
government securities, commercial paper, etc. ………………………………………………………………………………………………………………………………………………………………………………………………………………………………138,665 130,653 132,423 118,061 114,955 788 672 839 828 774
Total cash, U.S. Government and other securities ……………………………………………………………………………………………………………………………………………………………………………………372,573 342,055 345,224 330,817 342,715 15,153 14,975 15,209 16,319 15,765
Trade accounts and trade notes receivable
(less allowance for doubtful accounts) …………………………………………………………………………………………………………………………………………362,302 381,100 394,590 401,946 386,048 18,779 19,505 20,064 19,867 19,051
Inventories ………………………………………………………………………………………………………………………………………………………………………………………………………………………………445,536 463,661 466,652 476,072 471,045 18,879 18,524 18,340 18,187 18,376
All other current assets ………………………………………………………………………………………………………………………………………………………………………………………………………………………………232,628 227,291 229,723 231,825 238,076 2,897 2,702 2,780 3,052 3,143
Total current assets ………………………………………………………………………………………………………………………………………………………………………………………………………………………………1,413,039 1,414,107 1,436,188 1,440,661 1,437,885 55,707 55,706 56,393 57,425 56,335
Property, plant, and equipment ………………………………………………………………………………………………………………………………………………………………………………………………………………………………1,336,736 1,342,509 1,358,185 1,372,354 1,397,769 79,130 77,898 78,376 77,007 77,330
Land and mineral rights ………………………………………………………………………………………………………………………………………………………………………………………………………………………………65,584 66,676 67,197 67,360 67,328 1,269 1,234 1,178 1,159 1,099
Less: Accumulated depreciation, depletion, and amortization ……………………………………………………………………………………………………………………………………………………………………………………792,874 796,916 807,843 817,793 839,659 61,724 61,272 61,787 60,786 61,165
Net property, plant, and equipment ……………………………………………………………………………………………………………………………………………………………………………………609,445 612,269 617,539 621,921 625,438 18,675 17,860 17,767 17,381 17,264
All other noncurrent assets, including investment in nonconsolidated
entities, long-term investments, intangibles, etc. ………………………………………………………………………………………………………………………………………………………………………………………………………………2,358,832 2,393,399 2,435,232 2,442,376 2,442,172 4,128 4,074 3,933 4,068 3,967
Total Assets …………………………………………………………………………………………………………………………………………………………………………………………………………………………4,381,317 4,419,774 4,488,959 4,504,958 4,505,495 78,510 77,640 78,093 78,873 77,565
LIABILITIES AND STOCKHOLDERS' EQUITY
Short-term debt, original maturity of 1 year or less:
a. Loans from banks ………………………………………………………………………………………………………………………………………………………………………………………………………………………31,135 37,159 36,086 35,597 34,675 3,214 3,333 3,194 2,967 3,219
b. Other short-term loans, including commercial paper ………………………………………………………………………………………………………………………………………………………………………………………37,198 42,503 40,747 43,779 44,439 1,685 1,827 2,003 1,906 2,140
Trade accounts and trade notes payable ……………………………………………………………………………………………………………………………………………………………………………………………………………282,023 291,475 299,643 305,836 301,653 10,504 10,405 10,390 10,125 10,237
Income taxes accrued, prior and current years, net of payments ………………………………………………………………………………………………………………………………………………………………………………13,915 15,741 14,475 14,421 12,336 251 245 194 259 285
Current portion of long-term debt, due in 1 year or less:
a. Loans from banks …………………………………………………………………………………………………………………………………………………………………………………………………………………………………21,017 20,531 19,532 20,188 19,242 2,106 2,310 2,545 2,506 2,650
b. Other long-term loans ……………………………………………………………………………………………………………………………………………………………………………………………………………………45,422 46,848 41,222 37,662 38,939 1,367 1,383 1,770 1,702 1,730
All other current liabilities, including excise and
sales taxes, and accrued expenses ……..……………………………………………………………………………………………………………………………………………………508,982 503,527 516,660 525,981 537,728 5,898 5,509 5,534 5,276 5,606
Total current liabilities ……………………………………………………………………………………………………………………………………………………………………………………………………………………939,690 957,785 968,365 983,464 989,012 25,026 25,011 25,631 24,740 25,867
Long-term debt, due in more than 1 year:
a. Loans from banks …………………………………………………………………………………………………………………………………………………………………………………………………………………………189,634 202,014 210,544 212,078 213,138 7,973 7,782 7,390 7,327 7,660
b. Other long-term loans ……………………………………………………………………………………………………………………………………………………………………………………………………………………591,217 603,535 627,548 634,543 643,475 7,866 7,416 7,281 6,708 6,303
All other noncurrent liabilities, including deferred income taxes,
capitalized leases, and minority stockholders' interest
in consolidated domestic corporations ……………………………………………………………………………………………………………………………………………………………………618,568 624,455 625,750 622,389 669,629 1,755 1,613 1,516 1,532 1,541
Total liabilities ……………………………………………………………………………………………………………………………………………………………………………………………………………………………2,339,109 2,387,789 2,432,207 2,452,474 2,515,254 42,620 41,822 41,818 40,306 41,372
Capital stock and other capital (less treasury stock) …………………………………………………………………………………………………………………………………………………………………………………………839,032 819,356 815,008 782,522 684,095 13,782 12,853 13,288 10,947 11,746
Retained earnings …………………………………………………………………………………………………………………………………………………………………………………………………………………………………1,203,176 1,212,630 1,241,745 1,269,962 1,306,146 22,108 22,965 22,987 27,619 24,447
Stockholders' equity ……………………………………………………………………………………………………………………………………………………………………………………………………………………2,042,208 2,031,986 2,056,753 2,052,484 1,990,241 35,890 35,818 36,275 38,567 36,193
Total Liabilities and Stockholders' Equity ………………………………………………………………………………………………………………………………………………………………………………………………4,381,317 4,419,774 4,488,959 4,504,958 4,505,495 78,510 77,640 78,093 78,873 77,565
NET WORKING CAPITAL
Excess of total current assets over total current liabilities ………………………………………………………………………………………………………………………………………………………………………………………473,349 456,322 467,824 457,197 448,872 30,681 30,694 30,762 32,685 30,467
SELECTED BALANCE SHEET RATIOS
Total cash, U.S. Government and other securities …………………………………………………………………………………………………………………………………………………………………………………………………8.50 7.74 7.69 7.34 7.61 19.30 19.29 19.48 20.69 20.32
Trade accounts and trade notes receivable ……………………………………………………………………………………………………………………………………………………………………………………………………8.27 8.62 8.79 8.92 8.57 23.92 25.12 25.69 25.19 24.56
Inventories ……………………………………………………………………………………………………………………………………………………………………………………………………………………………………10.17 10.49 10.40 10.57 10.45 24.05 23.86 23.49 23.06 23.69
Total current assets …………………………………………………………………………………………………………………………………………………………………………………………………………………………32.25 31.99 31.99 31.98 31.91 70.96 71.75 72.21 72.81 72.63
Net property, plant, and equipment ……………………………………………………………………………………………………………………………………………………………………………………………………………13.91 13.85 13.76 13.81 13.88 23.79 23.00 22.75 22.04 22.26
Short-term debt, including current portion of long-term debt ………………………………………………………………………………………………………………………………………………………………………………………3.08 3.33 3.07 3.05 3.05 10.66 11.40 12.18 11.51 12.56
Total current liabilities …………………………………………………………………………………………………………………………………………………………………………………………………………………………………21.45 21.67 21.57 21.83 21.95 31.88 32.21 32.82 31.37 33.35
Long-term debt …………………………………………………………………………………………………………………………………………………………………………………………………………………………………17.82 18.23 18.67 18.79 19.01 20.17 19.57 18.79 17.79 18.00
Total liabilities …………………………………………………………………………………………………………………………………………………………………………………………………………………………………53.39 54.03 54.18 54.44 55.83 54.29 53.87 53.55 51.10 53.34
Stockholders' equity ………………………………………………………………………………………………………………………………………………………………………………………………………………………………46.61 45.97 45.82 45.56 44.17 45.71 46.13 46.45 48.90 46.66
Table 38.1 -- Balance Sheet For Corporations in NAICS Durable Manufacturing Subsectors,
All Total Asset Sizes, and Total Assets Under $5 Million
See the Survey Methodology section of the Introduction for information on survey design, estimation, and sampling error.
(million dollars)
(percent of total assets)
(million dollars)
(percent of total assets)
All Durable Manufacturing
All Total Asset Sizes
All Durable Manufacturing
Total Assets Under $5 Million
77U.S. Census Bureau, Quarterly Financial Report, 2014 Quarter 4
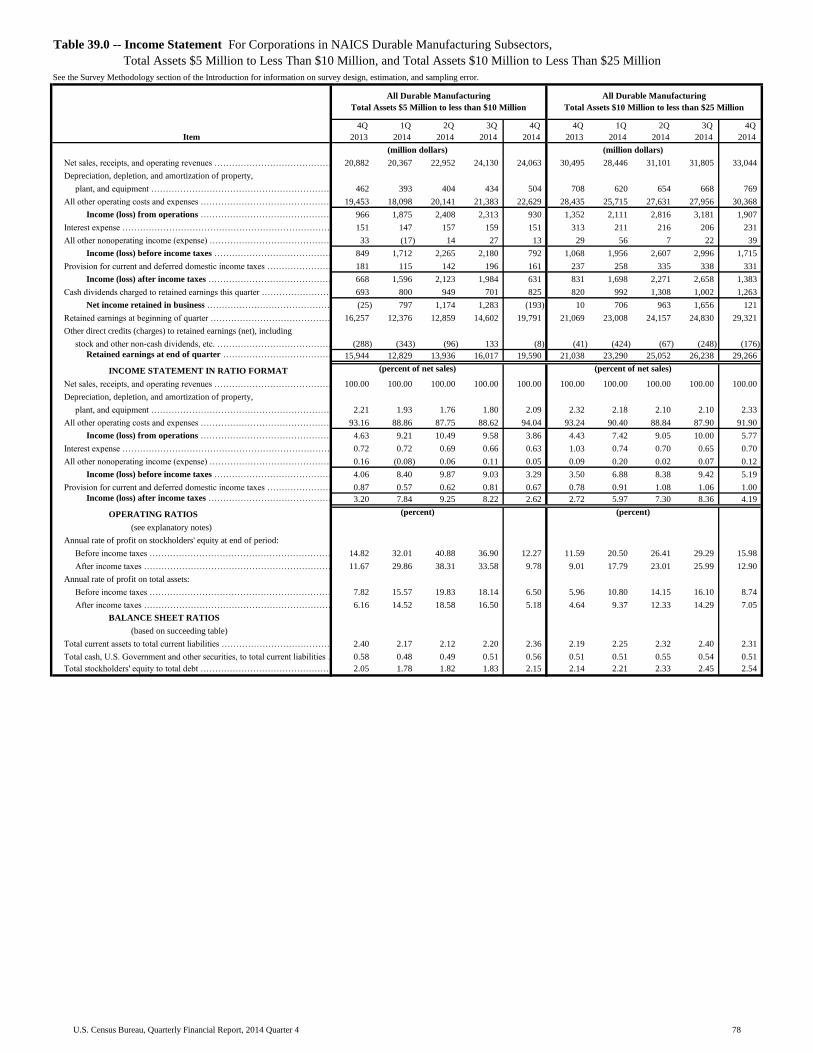
Table with row headers in column A with column headers in rows 5 and 6
Item
4Q_
2013_
1Q_
2014_
2Q_
2014_
3Q_
2014_
4Q_
2014_
4Q_
2013_
1Q_
2014_
2Q_
2014_
3Q_
2014_
4Q_
2014_
Net sales, receipts, and operating revenues ………………………………………………………………………………………………………………………………………………………………………20,882 20,367 22,952 24,130 24,063 30,495 28,446 31,101 31,805 33,044
Depreciation, depletion, and amortization of property,
plant, and equipment …………………………………………………………………………………………………………………………………………………………………………………………462 393 404 434 504 708 620 654 668 769
All other operating costs and expenses …………………………………………………………………………………………………………...……………………………………………………………19,453 18,098 20,141 21,383 22,629 28,435 25,715 27,631 27,956 30,368
Income (loss) from operations …………………………………………………………………………………………………………...……………………………………………………………966 1,875 2,408 2,313 930 1,352 2,111 2,816 3,181 1,907
Interest expense …………………………………………………………………………………………………………………………………………………………………………………………………………………………………………151 147 157 159 151 313 211 216 206 231
All other nonoperating income (expense) ……………………………………………………………………………………………………………………………………………………………………………………………………33 (17) 14 27 13 29 56 7 22 39
Income (loss) before income taxes ………………………………………………………………………………………………………………………………………………………………………………………………849 1,712 2,265 2,180 792 1,068 1,956 2,607 2,996 1,715
Provision for current and deferred domestic income taxes …………………………………………………………………………………………………………………………………………………………………………………………181 115 142 196 161 237 258 335 338 331
Income (loss) after income taxes …………………………………………………………………………………………………………………………………………………………………………………………………………668 1,596 2,123 1,984 631 831 1,698 2,271 2,658 1,383
Cash dividends charged to retained earnings this quarter ……………………………………………………………………………………………………………………………………………………………………………………693 800 949 701 825 820 992 1,308 1,002 1,263
Net income retained in business ……………………………………………………………………………………………………………………………………………………………………………………………………(25) 797 1,174 1,283 (193) 10 706 963 1,656 121
Retained earnings at beginning of quarter …………………………………………………………………………………………………………………………………………………………………………………………………………16,257 12,376 12,859 14,602 19,791 21,069 23,008 24,157 24,830 29,321
Other direct credits (charges) to retained earnings (net), including
stock and other non-cash dividends, etc. ……………………………………………………………………………………………………………………………………………………………………………………………………………………………(288) (343) (96) 133 (8) (41) (424) (67) (248) (176)
Retained earnings at end of quarter ……………………………………………………………………………………………………………………………………………………………………………………………………15,944 12,829 13,936 16,017 19,590 21,038 23,290 25,052 26,238 29,266
INCOME STATEMENT IN RATIO FORMAT
Net sales, receipts, and operating revenues ……………………………………………………………………………………………………………………………………………………………………………………………………100.00 100.00 100.00 100.00 100.00 100.00 100.00 100.00 100.00 100.00
Depreciation, depletion, and amortization of property,
plant, and equipment ………………………………………………………………………………………………………………………………………………………………………2.21 1.93 1.76 1.80 2.09 2.32 2.18 2.10 2.10 2.33
All other operating costs and expenses ……………………………………………………………………………………………………………………………………………………………………………………………………93.16 88.86 87.75 88.62 94.04 93.24 90.40 88.84 87.90 91.90
Income (loss) from operations …………………………………………………………………………………………………………………………………………………………………………………………………4.63 9.21 10.49 9.58 3.86 4.43 7.42 9.05 10.00 5.77
Interest expense …………………………………………………………………………………………………………………………………………………………………………………………………………………………………0.72 0.72 0.69 0.66 0.63 1.03 0.74 0.70 0.65 0.70
All other nonoperating income (expense) ……………………………………………………………………………………………………………………………………………………………………………………………0.16 (0.08) 0.06 0.11 0.05 0.09 0.20 0.02 0.07 0.12
Income (loss) before income taxes ……………………………………………………………………………………………………………………………………………………………………………………………4.06 8.40 9.87 9.03 3.29 3.50 6.88 8.38 9.42 5.19
Provision for current and deferred domestic income taxes ……………………………………………………………………………………………………………………………………………………………………………………0.87 0.57 0.62 0.81 0.67 0.78 0.91 1.08 1.06 1.00
Income (loss) after income taxes ………………………………………………………………………………………………………………………………………………………………………………………………3.20 7.84 9.25 8.22 2.62 2.72 5.97 7.30 8.36 4.19
OPERATING RATIOS
(see explanatory notes)
Annual rate of profit on stockholders' equity at end of period:
Before income taxes ……………………………………………………………………………………………………………………………………………………………………………………………………………………14.82 32.01 40.88 36.90 12.27 11.59 20.50 26.41 29.29 15.98
After income taxes ………………………………………………………………………………………………………………………………………………………………………………………………………………11.67 29.86 38.31 33.58 9.78 9.01 17.79 23.01 25.99 12.90
Annual rate of profit on total assets:
Before income taxes ………………………………………………………………………………………………………………………………………………………………………………………………………………7.82 15.57 19.83 18.14 6.50 5.96 10.80 14.15 16.10 8.74
After income taxes …………………………………………………………………………………………………………………………………………………………………………………………………………………………6.16 14.52 18.58 16.50 5.18 4.64 9.37 12.33 14.29 7.05
BALANCE SHEET RATIOS
(based on succeeding table)
Total current assets to total current liabilities …………………………………………………………………………………………………………………………………………………………………………………………………2.40 2.17 2.12 2.20 2.36 2.19 2.25 2.32 2.40 2.31
Total cash, U.S. Government and other securities, to total current liabilities …………………………………………………………………………………………………………………………………………………………………0.58 0.48 0.49 0.51 0.56 0.51 0.51 0.55 0.54 0.51
Total stockholders' equity to total debt ………………………………………………………………………………………………………………………………………………………………………………………………………2.05 1.78 1.82 1.83 2.15 2.14 2.21 2.33 2.45 2.54
(percent of net sales) (percent of net sales)
(percent) (percent)
Table 39.0 -- Income Statement For Corporations in NAICS Durable Manufacturing Subsectors,
Total Assets $5 Million to Less Than $10 Million, and Total Assets $10 Million to Less Than $25 Million
See the Survey Methodology section of the Introduction for information on survey design, estimation, and sampling error.
All Durable Manufacturing
Total Assets $5 Million to less than $10 Million
All Durable Manufacturing
Total Assets $10 Million to less than $25 Million
(million dollars) (million dollars)
78U.S. Census Bureau, Quarterly Financial Report, 2014 Quarter 4
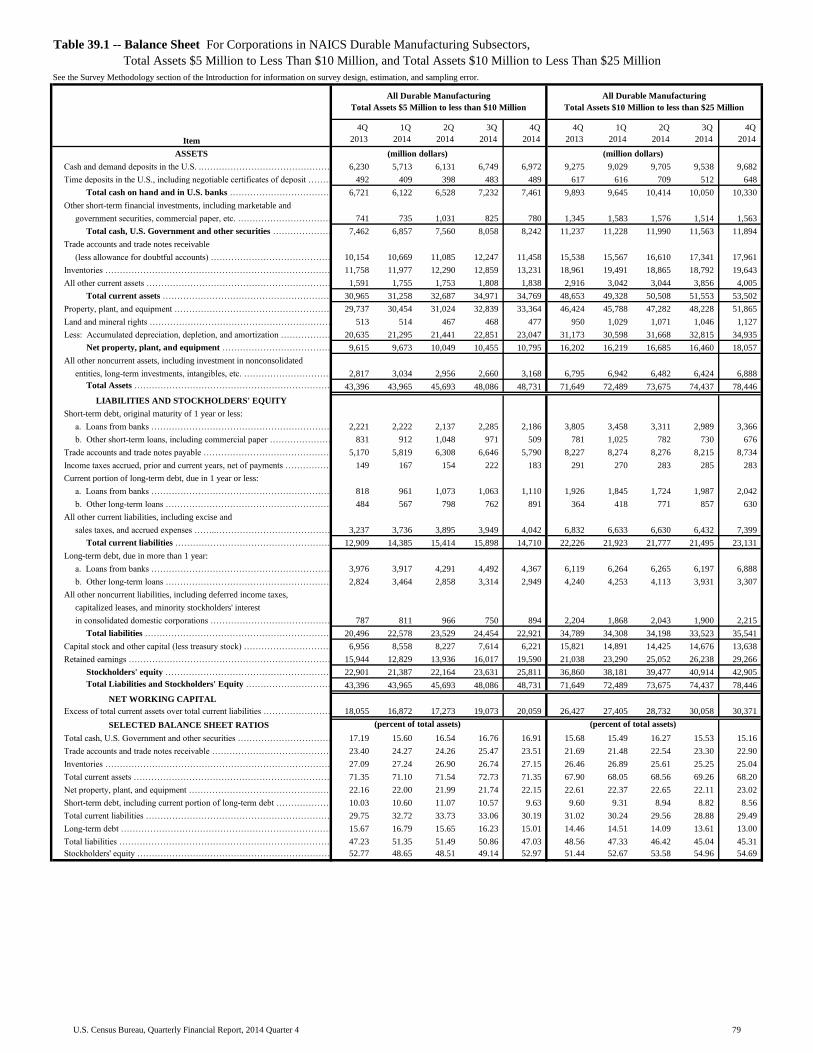
Table with row headers in column A with column headers in rows 5 and 6
Item
4Q_
2013_
1Q_
2014_
2Q_
2014_
3Q_
2014_
4Q_
2014_
4Q_
2013_
1Q_
2014_
2Q_
2014_
3Q_
2014_
4Q_
2014_
ASSETS
Cash and demand deposits in the U.S. .………………………………………………………………………………………………………………………………………………………………………………………………………………………………6,230 5,713 6,131 6,749 6,972 9,275 9,029 9,705 9,538 9,682
Time deposits in the U.S., including negotiable certificates of deposit ……………………………………………………………………………………………………………………………………………………………………………………492 409 398 483 489 617 616 709 512 648
Total cash on hand and in U.S. banks ……………………………………………………………………………………………………………………………………………………………………………………6,721 6,122 6,528 7,232 7,461 9,893 9,645 10,414 10,050 10,330
Other short-term financial investments, including marketable and
government securities, commercial paper, etc. ………………………………………………………………………………………………………………………………………………………………………………………………………………………………741 735 1,031 825 780 1,345 1,583 1,576 1,514 1,563
Total cash, U.S. Government and other securities ……………………………………………………………………………………………………………………………………………………………………………………7,462 6,857 7,560 8,058 8,242 11,237 11,228 11,990 11,563 11,894
Trade accounts and trade notes receivable
(less allowance for doubtful accounts) …………………………………………………………………………………………………………………………………………10,154 10,669 11,085 12,247 11,458 15,538 15,567 16,610 17,341 17,961
Inventories ………………………………………………………………………………………………………………………………………………………………………………………………………………………………11,758 11,977 12,290 12,859 13,231 18,961 19,491 18,865 18,792 19,643
All other current assets ………………………………………………………………………………………………………………………………………………………………………………………………………………………………1,591 1,755 1,753 1,808 1,838 2,916 3,042 3,044 3,856 4,005
Total current assets ………………………………………………………………………………………………………………………………………………………………………………………………………………………………30,965 31,258 32,687 34,971 34,769 48,653 49,328 50,508 51,553 53,502
Property, plant, and equipment ………………………………………………………………………………………………………………………………………………………………………………………………………………………………29,737 30,454 31,024 32,839 33,364 46,424 45,788 47,282 48,228 51,865
Land and mineral rights ………………………………………………………………………………………………………………………………………………………………………………………………………………………………513 514 467 468 477 950 1,029 1,071 1,046 1,127
Less: Accumulated depreciation, depletion, and amortization ……………………………………………………………………………………………………………………………………………………………………………………20,635 21,295 21,441 22,851 23,047 31,173 30,598 31,668 32,815 34,935
Net property, plant, and equipment ……………………………………………………………………………………………………………………………………………………………………………………9,615 9,673 10,049 10,455 10,795 16,202 16,219 16,685 16,460 18,057
All other noncurrent assets, including investment in nonconsolidated
entities, long-term investments, intangibles, etc. ………………………………………………………………………………………………………………………………………………………………………………………………………………2,817 3,034 2,956 2,660 3,168 6,795 6,942 6,482 6,424 6,888
Total Assets …………………………………………………………………………………………………………………………………………………………………………………………………………………………43,396 43,965 45,693 48,086 48,731 71,649 72,489 73,675 74,437 78,446
LIABILITIES AND STOCKHOLDERS' EQUITY
Short-term debt, original maturity of 1 year or less:
a. Loans from banks ………………………………………………………………………………………………………………………………………………………………………………………………………………………2,221 2,222 2,137 2,285 2,186 3,805 3,458 3,311 2,989 3,366
b. Other short-term loans, including commercial paper ………………………………………………………………………………………………………………………………………………………………………………………831 912 1,048 971 509 781 1,025 782 730 676
Trade accounts and trade notes payable ……………………………………………………………………………………………………………………………………………………………………………………………………………5,170 5,819 6,308 6,646 5,790 8,227 8,274 8,276 8,215 8,734
Income taxes accrued, prior and current years, net of payments ………………………………………………………………………………………………………………………………………………………………………………149 167 154 222 183 291 270 283 285 283
Current portion of long-term debt, due in 1 year or less:
a. Loans from banks …………………………………………………………………………………………………………………………………………………………………………………………………………………………………818 961 1,073 1,063 1,110 1,926 1,845 1,724 1,987 2,042
b. Other long-term loans ……………………………………………………………………………………………………………………………………………………………………………………………………………………484 567 798 762 891 364 418 771 857 630
All other current liabilities, including excise and
sales taxes, and accrued expenses ……..……………………………………………………………………………………………………………………………………………………3,237 3,736 3,895 3,949 4,042 6,832 6,633 6,630 6,432 7,399
Total current liabilities ……………………………………………………………………………………………………………………………………………………………………………………………………………………12,909 14,385 15,414 15,898 14,710 22,226 21,923 21,777 21,495 23,131
Long-term debt, due in more than 1 year:
a. Loans from banks …………………………………………………………………………………………………………………………………………………………………………………………………………………………3,976 3,917 4,291 4,492 4,367 6,119 6,264 6,265 6,197 6,888
b. Other long-term loans ……………………………………………………………………………………………………………………………………………………………………………………………………………………2,824 3,464 2,858 3,314 2,949 4,240 4,253 4,113 3,931 3,307
All other noncurrent liabilities, including deferred income taxes,
capitalized leases, and minority stockholders' interest
in consolidated domestic corporations ……………………………………………………………………………………………………………………………………………………………………787 811 966 750 894 2,204 1,868 2,043 1,900 2,215
Total liabilities ……………………………………………………………………………………………………………………………………………………………………………………………………………………………20,496 22,578 23,529 24,454 22,921 34,789 34,308 34,198 33,523 35,541
Capital stock and other capital (less treasury stock) …………………………………………………………………………………………………………………………………………………………………………………………6,956 8,558 8,227 7,614 6,221 15,821 14,891 14,425 14,676 13,638
Retained earnings …………………………………………………………………………………………………………………………………………………………………………………………………………………………………15,944 12,829 13,936 16,017 19,590 21,038 23,290 25,052 26,238 29,266
Stockholders' equity ……………………………………………………………………………………………………………………………………………………………………………………………………………………22,901 21,387 22,164 23,631 25,811 36,860 38,181 39,477 40,914 42,905
Total Liabilities and Stockholders' Equity ………………………………………………………………………………………………………………………………………………………………………………………………43,396 43,965 45,693 48,086 48,731 71,649 72,489 73,675 74,437 78,446
NET WORKING CAPITAL
Excess of total current assets over total current liabilities ………………………………………………………………………………………………………………………………………………………………………………………18,055 16,872 17,273 19,073 20,059 26,427 27,405 28,732 30,058 30,371
SELECTED BALANCE SHEET RATIOS
Total cash, U.S. Government and other securities …………………………………………………………………………………………………………………………………………………………………………………………………17.19 15.60 16.54 16.76 16.91 15.68 15.49 16.27 15.53 15.16
Trade accounts and trade notes receivable ……………………………………………………………………………………………………………………………………………………………………………………………………23.40 24.27 24.26 25.47 23.51 21.69 21.48 22.54 23.30 22.90
Inventories ……………………………………………………………………………………………………………………………………………………………………………………………………………………………………27.09 27.24 26.90 26.74 27.15 26.46 26.89 25.61 25.25 25.04
Total current assets …………………………………………………………………………………………………………………………………………………………………………………………………………………………71.35 71.10 71.54 72.73 71.35 67.90 68.05 68.56 69.26 68.20
Net property, plant, and equipment ……………………………………………………………………………………………………………………………………………………………………………………………………………22.16 22.00 21.99 21.74 22.15 22.61 22.37 22.65 22.11 23.02
Short-term debt, including current portion of long-term debt ………………………………………………………………………………………………………………………………………………………………………………………10.03 10.60 11.07 10.57 9.63 9.60 9.31 8.94 8.82 8.56
Total current liabilities …………………………………………………………………………………………………………………………………………………………………………………………………………………………………29.75 32.72 33.73 33.06 30.19 31.02 30.24 29.56 28.88 29.49
Long-term debt …………………………………………………………………………………………………………………………………………………………………………………………………………………………………15.67 16.79 15.65 16.23 15.01 14.46 14.51 14.09 13.61 13.00
Total liabilities …………………………………………………………………………………………………………………………………………………………………………………………………………………………………47.23 51.35 51.49 50.86 47.03 48.56 47.33 46.42 45.04 45.31
Stockholders' equity ………………………………………………………………………………………………………………………………………………………………………………………………………………………………52.77 48.65 48.51 49.14 52.97 51.44 52.67 53.58 54.96 54.69
Table 39.1 -- Balance Sheet For Corporations in NAICS Durable Manufacturing Subsectors,
Total Assets $5 Million to Less Than $10 Million, and Total Assets $10 Million to Less Than $25 Million
See the Survey Methodology section of the Introduction for information on survey design, estimation, and sampling error.
(million dollars)
(percent of total assets)
(million dollars)
(percent of total assets)
All Durable Manufacturing
Total Assets $5 Million to less than $10 Million
All Durable Manufacturing
Total Assets $10 Million to less than $25 Million
79U.S. Census Bureau, Quarterly Financial Report, 2014 Quarter 4
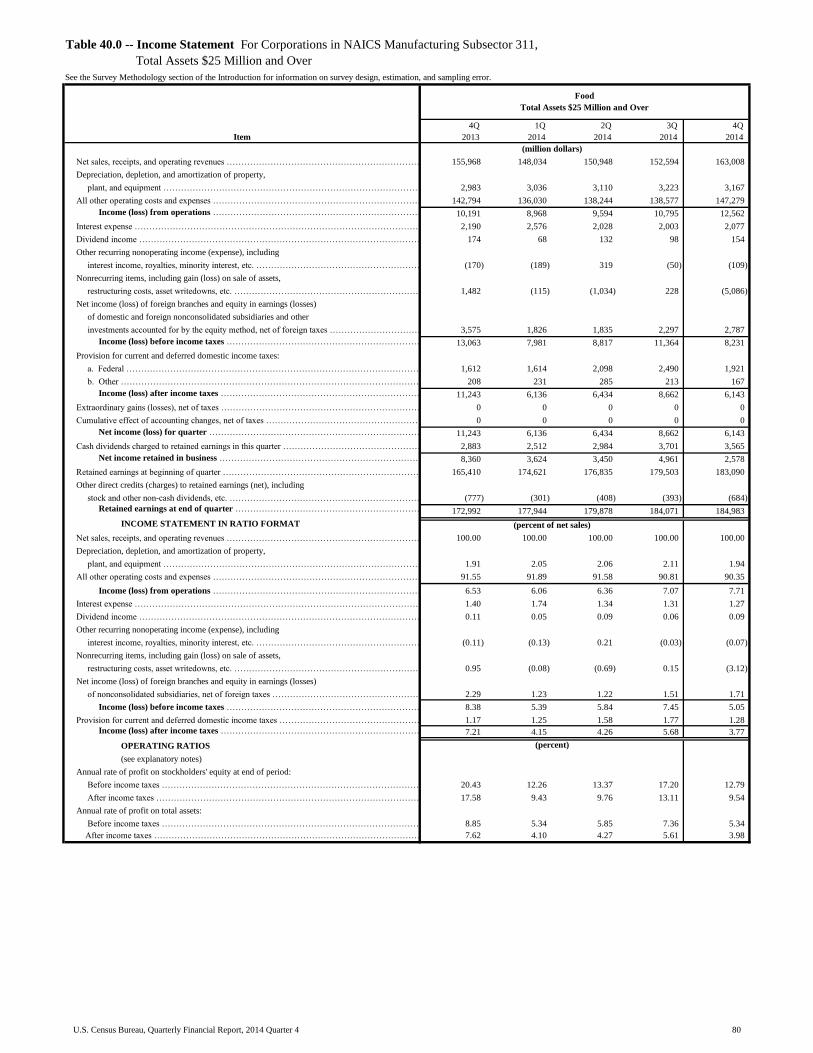
Table with row headers in column A with column headers in rows 5 and 6
Item
4Q_
2013_
1Q_
2014_
2Q_
2014_
3Q_
2014_
4Q_
2014_
Net sales, receipts, and operating revenues ………………………………………………………………………………………………………………………………………………………………………………………………………155,968 148,034 150,948 152,594 163,008
Depreciation, depletion, and amortization of property,
plant, and equipment ……………………………………………………………………………………………………………………………………………………………………2,983 3,036 3,110 3,223 3,167
All other operating costs and expenses …………………………………………………………………………………………………………………………………………………………………………………………………142,794 136,030 138,244 138,577 147,279
Income (loss) from operations …………………………………………………………………………………………………………………………………………...……………………………………………………………10,191 8,968 9,594 10,795 12,562
Interest expense …………………………………………………………………………………………………………………………………………………………………………………………………………………………………………2,190 2,576 2,028 2,003 2,077
Dividend income …………………………………………………………………………………………………………………………………………………………………………………………………………………………………………………174 68 132 98 154
Other recurring nonoperating income (expense), including
interest income, royalties, minority interest, etc. ………………………………………………………………………………………………………………………………………………………………………………………………………………………………………………(170) (189) 319 (50) (109)
Nonrecurring items, including gain (loss) on sale of assets,
restructuring costs, asset writedowns, etc. …………………………………………………………………………………………………………………………………………………………………1,482 (115) (1,034) 228 (5,086)
Net income (loss) of foreign branches and equity in earnings (losses)
of domestic and foreign nonconsolidated subsidiaries and other
investments accounted for by the equity method, net of foreign taxes ………………………………………………………………………………………………………………………………………………………………………………………………………………3,575 1,826 1,835 2,297 2,787
Income (loss) before income taxes ………………………………………………………………………………………………………………………………………………………………………………………………………13,063 7,981 8,817 11,364 8,231
Provision for current and deferred domestic income taxes:
a. Federal …………………………………………………………………………………………………………………………………………………………………………………………………………………………………………………1,612 1,614 2,098 2,490 1,921
b. Other …………………………………………………………………………………………………………………………………………………………………………………………………………………………………………………208 231 285 213 167
Income (loss) after income taxes ……………………………………………………………………………………………………………………………………………………………………………………………………11,243 6,136 6,434 8,662 6,143
Extraordinary gains (losses), net of taxes ……………………………………………………………………………………………………………………………………………………………………………………………………………0 0 0 0 0
Cumulative effect of accounting changes, net of taxes ……………………………………………………………………………………………………………………………………………………………………………………………0 0 0 0 0
Net income (loss) for quarter ………………………………………………………………………………………………………………………………………………………………………………………………………………11,243 6,136 6,434 8,662 6,143
Cash dividends charged to retained earnings in this quarter ………………………………………………………………………………………………………………………………………………………………………………………2,883 2,512 2,984 3,701 3,565
Net income retained in business …………………………………………………………………………………………………………………………………………………………………………………………………………………8,360 3,624 3,450 4,961 2,578
Retained earnings at beginning of quarter ………………………………………………………………………………………………………………………………………………………………………………………………………………………165,410 174,621 176,835 179,503 183,090
Other direct credits (charges) to retained earnings (net), including
stock and other non-cash dividends, etc. ……………………………………………………………………………………………………………………………………………………………………………………………………………………………(777) (301) (408) (393) (684)
Retained earnings at end of quarter ………………………………………………………………………………………………………………………………………………………………………………………………………172,992 177,944 179,878 184,071 184,983
INCOME STATEMENT IN RATIO FORMAT
Net sales, receipts, and operating revenues ……………………………………………………………………………………………………………………………………………………………………………………………………………100.00 100.00 100.00 100.00 100.00
Depreciation, depletion, and amortization of property,
plant, and equipment …………………………………………………………………………………………………………………………………………………………………………………1.91 2.05 2.06 2.11 1.94
All other operating costs and expenses ……………………………………………………………………………………………………………………………………………………………………………………………………………………………91.55 91.89 91.58 90.81 90.35
Income (loss) from operations …………………………………………………………………………………………………………………………………………………………………………………………………………………6.53 6.06 6.36 7.07 7.71
Interest expense ………………………………………………………………………………………………………………………………………………………………………………………………………………………………………………1.40 1.74 1.34 1.31 1.27
Dividend income …………………………………………………………………………………………………………………………………………………………………………………………………………………………………………………0.11 0.05 0.09 0.06 0.09
Other recurring nonoperating income (expense), including
interest income, royalties, minority interest, etc. …………………………………………………………………………………………………………………………………………………………………………………………………………………………………………………(0.11) (0.13) 0.21 (0.03) (0.07)
Nonrecurring items, including gain (loss) on sale of assets,
restructuring costs, asset writedowns, etc. ………………………………………………………………………………………………………………………………………………………………………………………………………………………………………………………………………………………………………0.95 (0.08) (0.69) 0.15 (3.12)
Net income (loss) of foreign branches and equity in earnings (losses)
of nonconsolidated subsidiaries, net of foreign taxes …………………………………………………………………………………………………………………………………………………………………………………………………………2.29 1.23 1.22 1.51 1.71
Income (loss) before income taxes …………………………………………………………………………………………………………………………………………………………………………………………………………………8.38 5.39 5.84 7.45 5.05
Provision for current and deferred domestic income taxes ………………………………………………………………………………………………………………………………………………………………………………………………………1.17 1.25 1.58 1.77 1.28
Income (loss) after income taxes ………………………………………………………………………………………………………………………………………………………………………………………………………………………7.21 4.15 4.26 5.68 3.77
OPERATING RATIOS
(see explanatory notes)
Annual rate of profit on stockholders' equity at end of period:
Before income taxes …………………………………………………………………………………………………………………………………………………………………………………………………………………………………………20.43 12.26 13.37 17.20 12.79
After income taxes …………………………………………………………………………………………………………………………………………………………………………………………………………………………………………17.58 9.43 9.76 13.11 9.54
Annual rate of profit on total assets:
Before income taxes …………………………………………………………………………………………………………………………………………………………………………………………………………………………………………8.85 5.34 5.85 7.36 5.34
After income taxes ……………………………………………………………………………………………………………………………………………………………………………………………………………………………………………7.62 4.10 4.27 5.61 3.98
Table 40.0 -- Income Statement For Corporations in NAICS Manufacturing Subsector 311,
Total Assets $25 Million and Over
See the Survey Methodology section of the Introduction for information on survey design, estimation, and sampling error.
Food
Total Assets $25 Million and Over
(million dollars)
(percent of net sales)
(percent)
80U.S. Census Bureau, Quarterly Financial Report, 2014 Quarter 4

Table with row headers in column A with column headers in rows 5 and 6
Item
4Q_
2013_
1Q_
2014_
2Q_
2014_
3Q_
2014_
4Q_
2014_
ASSETS
Cash and demand deposits in the U.S. ……………………………………………………………………………………………………………………………………………………………………………………………………………………………14,028 12,837 15,855 16,474 16,480
Time deposits in the U.S., including negotiable certificates of deposit …………………………………………………………………………………………………………………………………………………………………………………………3,800 3,359 2,765 2,049 2,280
Cash and deposits outside the U.S. .……………………………………………………………………………………………………………………………………………………………………………………………………………………………………………958 684 668 566 545
Total cash on hand and in banks ……………………………………………………………………………………………………………………………………………………………………………………………………………………………18,786 16,879 19,288 19,089 19,305
U.S. Treasury and Federal agency securities:
a. Subject to agreements to sell …………………………………………………………………………………………………………………………………………………………………………………………………………………………………714 508 544 605 555
b. Other, due in 1 year or less ……………………………………………………………………………………………………………………………………………………………………………………………………………………………………798 598 374 363 661
Commercial and finance company paper of U.S. issuers …………………………………………………………………………………………………………………………………………………………………………………………………………53 98 94 91 145
State and local government securities, due in 1 year or less …………………………………………………………………………………………………………………………………………………………………………………………………………146 148 151 144 148
Foreign securities, due in 1 year or less ………………………………………………………………………………………………………………………………………………………………………………………………………………………………4 12 17 0 0
Other short-term financial investments …………………………………………………………………………………………………………………………………………………………………………………………2,927 3,188 2,701 1,771 1,962
Total cash, U.S. Government and other securities ……………………………………………………………………………………………………………………………………………………………………………………………………23,429 21,432 23,169 22,063 22,776
Trade receivables from the U.S. Government …………………………………………………………………………………………………………………………………………………………………………………………………………………………101 86 111 103 128
Other trade accounts and trade notes receivable
(less allowance for doubtful accounts) ………………………………………………………………………………………………………………………………………………………………………46,907 48,139 45,854 47,725 49,717
Total receivables ………………………………………………………………………………………………………………………………………………………………………………………………………………………………47,008 48,224 45,964 47,828 49,846
Inventories ……………………………………………………………………………………………………………………………………………………………………………………………………………………………………………………62,472 61,974 59,009 59,853 63,173
All other current assets …………………………………………………………………………………………………………………………………………………………………………………………………………………………………………26,733 26,795 28,506 31,602 30,524
Total current assets ……………………………………………………………………………………………………………………………………………………………………………………………………………………………………159,642 158,425 156,649 161,347 166,318
Property, plant, and equipment ……………………………………………………………………………………………………………………………………………………………………………………………………………………………………………207,243 209,883 211,626 212,675 215,209
Land and mineral rights …………………………………………………………………………………………………………………………………………………………………………………………………………………………………………5,869 5,986 5,941 5,851 6,142
Less: Accumulated depreciation, depletion, and amortization ………………………………………………………………………………………………………………………………………………………………………………………………113,696 115,980 116,789 116,824 118,099
Net property, plant, and equipment …………………………………………………………………………………………………………………………………………………………………………………………………………………99,416 99,889 100,778 101,702 103,252
U.S. Treasury and Federal agency securities, due in more than 1 year …………………………………………………………………………………………………………………………………………………………………………………………37 43 37 44 62
All other noncurrent assets, including investment in nonconsolidated
entities, long-term investments, intangibles, etc. .………………………………………………………………………………………………………………………………………………………………………………………………………………………………331,215 339,714 345,460 354,475 347,191
Total Assets …………………………………………………………………………………………………………………………………………………………………………………………………………………………………………………590,310 598,070 602,923 617,568 616,824
LIABILITIES AND STOCKHOLDERS' EQUITY
Short-term debt, original maturity of 1 year or less:
a. Loans from banks ………………………………………………………………………………………………………………………………………………………………………………………………………………………………………5,770 5,895 5,260 6,208 6,354
b. Commercial paper ………………………………………………………………………………………………………………………………………………………………………………………………………………………………………10,365 11,974 9,873 11,230 9,834
c. Other short-term loans ………………………………………………………………………………………………………………………………………………………………………………………………………………………………989 1,524 1,409 1,135 1,332
Advances and prepayments by the U.S. Government …………………………………………………………………………………………………………………………………………………………………………………………………………0 0 0 0 0
Trade accounts and trade notes payable ………………………………………………………………………………………………………………………………………………………………………………………………………………………40,711 38,338 38,449 40,170 44,608
Income taxes accrued, prior and current years, net of payments:
a. Federal ……………………………………………………………………………………………………………………………………………………………………………………………………………………………………………………857 769 366 761 800
b. Other ………………………………………………………………………………………………………………………………………………………………………………………………………………………………………………682 722 700 709 748
Current portion of long-term debt, due in 1 year or less:
a. Loans from banks ……………………………………………………………………………………………………………………………………………………………………………………………………………………………………2,736 2,628 2,790 2,319 2,341
b. Bonds and debentures …………………………………………………………………………………………………………………………………………………………………………………………………………………………………4,257 3,265 4,715 5,260 4,851
c. Other long-term loans ………………………………………………………………………………………………………………………………………………………………………………………………………………………………………3,569 3,676 3,647 4,317 3,044
All other current liabilities, including excise and
sales taxes, and accrued expenses ……………………………………………………………………………………………………………………………………………………………………………26,984 26,690 27,137 28,535 29,770
Total current liabilities ………………………………………………………………………………………………………………………………………………………………………………………………………………………………96,921 95,482 94,345 100,644 103,680
Long-term debt, due in more than 1 year:
a. Loans from banks ………………………………………………………………………………………………………………………………………………………………………………………………………………………………………………48,371 50,678 51,578 51,850 51,052
b. Bonds and debentures ………………………………………………………………………………………………………………………………………………………………………………………………………………………………………67,782 69,323 67,274 71,931 72,349
c. Other long-term loans …………………………………………………………………………………………………………………………………………………………………………………………………………………………………………45,806 45,555 48,254 48,180 47,409
All other noncurrent liabilities, including deferred income taxes,
capitalized leases, and minority stockholders' interest
in consolidated domestic corporations ………………………………………………………………………………………………………………………………………………………………………………75,620 76,731 77,642 80,727 84,874
Total liabilities ……………………………………………………………………………………………………………………………………………………………………………………………………………………………………334,499 337,769 339,094 353,331 359,364
Capital stock and other capital …………………………………………………………………………………………………………………………………………………………………………………………………………………………………125,539 125,768 128,488 129,699 130,017
Retained earnings ……………………………………………………………………………………………………………………………………………………………………………………………………………………………………172,992 177,944 179,878 184,071 184,983
Cumulative foreign currency translation adjustment …………………………………………………………………………………………………………………………………………………………………………………………………………(1,903) (2,410) (1,585) (2,598) (4,181)
Other stockholders' equity items, including unearned
compensation and ESOP debt guarantees ……………………………………………………………………………………………………………………………………………………………………(9,600) (8,515) (9,286) (11,533) (16,519)
Less: Treasury stock at cost ………………………………………………………………………………………………………………………………………………………………………………………………………………………………………31,218 32,485 33,665 35,402 36,841
Stockholders' equity ………………………………………………………………………………………………………………………………………………………………………………………………………………………………255,811 260,302 263,830 264,237 257,460
Total Liabilities and Stockholders' Equity ……………………………………………………………………………………………………………………………………………………590,310 598,070 602,923 617,568 616,824
NET WORKING CAPITAL
Excess of total current assets over total current liabilities ……………………………………………………………………………………………………………………………………………………………………………62,721 62,943 62,303 60,703 62,638
(million dollars)
Food
Total Assets $25 Million and Over
Table 40.1 -- Balance Sheet For Corporations in NAICS Manufacturing Subsector 311,
Total Assets $25 Million and Over
See the Survey Methodology section of the Introduction for information on survey design, estimation, and sampling error.
81U.S. Census Bureau, Quarterly Financial Report, 2014 Quarter 4

Table with row headers in column A with column headers in rows 5 and 6
Item
4Q_
2013_
1Q_
2014_
2Q_
2014_
3Q_
2014_
4Q_
2014_
Net sales, receipts, and operating revenues ………………………………………………………………………………………………………………………………………………………………………………………………………45,822 41,604 46,412 47,036 46,583
Depreciation, depletion, and amortization of property,
plant, and equipment ……………………………………………………………………………………………………………………………………………………………………1,279 1,209 1,238 1,260 1,258
All other operating costs and expenses …………………………………………………………………………………………………………………………………………………………………………………………………35,528 32,821 34,936 35,746 36,745
Income (loss) from operations …………………………………………………………………………………………………………………………………………...……………………………………………………………9,015 7,574 10,238 10,030 8,581
Interest expense …………………………………………………………………………………………………………………………………………………………………………………………………………………………………………2,558 2,330 2,312 2,340 2,484
Dividend income …………………………………………………………………………………………………………………………………………………………………………………………………………………………………………………16 5 6 7 15
Other recurring nonoperating income (expense), including
interest income, royalties, minority interest, etc. ………………………………………………………………………………………………………………………………………………………………………………………………………………………………………………832 816 1,065 513 137
Nonrecurring items, including gain (loss) on sale of assets,
restructuring costs, asset writedowns, etc. …………………………………………………………………………………………………………………………………………………………………(1,179) (179) (123) (1,176) (1,038)
Net income (loss) of foreign branches and equity in earnings (losses)
of domestic and foreign nonconsolidated subsidiaries and other
investments accounted for by the equity method, net of foreign taxes ………………………………………………………………………………………………………………………………………………………………………………………………………………2,877 3,807 4,692 4,877 3,284
Income (loss) before income taxes ………………………………………………………………………………………………………………………………………………………………………………………………………9,002 9,693 13,567 11,910 8,494
Provision for current and deferred domestic income taxes:
a. Federal …………………………………………………………………………………………………………………………………………………………………………………………………………………………………………………850 1,918 2,427 2,157 1,814
b. Other …………………………………………………………………………………………………………………………………………………………………………………………………………………………………………………491 200 535 383 283
Income (loss) after income taxes ……………………………………………………………………………………………………………………………………………………………………………………………………7,661 7,574 10,604 9,370 6,396
Extraordinary gains (losses), net of taxes ……………………………………………………………………………………………………………………………………………………………………………………………………………0 0 0 0 0
Cumulative effect of accounting changes, net of taxes ……………………………………………………………………………………………………………………………………………………………………………………………0 0 0 0 0
Net income (loss) for quarter ………………………………………………………………………………………………………………………………………………………………………………………………………………7,661 7,574 10,604 9,370 6,396
Cash dividends charged to retained earnings in this quarter ………………………………………………………………………………………………………………………………………………………………………………………4,273 5,446 5,090 4,490 4,601
Net income retained in business …………………………………………………………………………………………………………………………………………………………………………………………………………………3,388 2,128 5,514 4,879 1,795
Retained earnings at beginning of quarter ………………………………………………………………………………………………………………………………………………………………………………………………………………………160,522 163,582 162,585 168,087 170,565
Other direct credits (charges) to retained earnings (net), including
stock and other non-cash dividends, etc. ……………………………………………………………………………………………………………………………………………………………………………………………………………………………273 6 (214) (236) 324
Retained earnings at end of quarter ………………………………………………………………………………………………………………………………………………………………………………………………………164,183 165,716 167,885 172,730 172,685
INCOME STATEMENT IN RATIO FORMAT
Net sales, receipts, and operating revenues ……………………………………………………………………………………………………………………………………………………………………………………………………………100.00 100.00 100.00 100.00 100.00
Depreciation, depletion, and amortization of property,
plant, and equipment …………………………………………………………………………………………………………………………………………………………………………………2.79 2.91 2.67 2.68 2.70
All other operating costs and expenses ……………………………………………………………………………………………………………………………………………………………………………………………………………………………77.53 78.89 75.27 76.00 78.88
Income (loss) from operations …………………………………………………………………………………………………………………………………………………………………………………………………………………19.67 18.20 22.06 21.32 18.42
Interest expense ………………………………………………………………………………………………………………………………………………………………………………………………………………………………………………5.58 5.60 4.98 4.98 5.33
Dividend income …………………………………………………………………………………………………………………………………………………………………………………………………………………………………………………0.04 0.01 0.01 0.02 0.03
Other recurring nonoperating income (expense), including
interest income, royalties, minority interest, etc. …………………………………………………………………………………………………………………………………………………………………………………………………………………………………………………1.81 1.96 2.30 1.09 0.29
Nonrecurring items, including gain (loss) on sale of assets,
restructuring costs, asset writedowns, etc. ………………………………………………………………………………………………………………………………………………………………………………………………………………………………………………………………………………………………………(2.57) (0.43) (0.27) (2.50) (2.23)
Net income (loss) of foreign branches and equity in earnings (losses)
of nonconsolidated subsidiaries, net of foreign taxes …………………………………………………………………………………………………………………………………………………………………………………………………………6.28 9.15 10.11 10.37 7.05
Income (loss) before income taxes …………………………………………………………………………………………………………………………………………………………………………………………………………………19.65 23.30 29.23 25.32 18.23
Provision for current and deferred domestic income taxes ………………………………………………………………………………………………………………………………………………………………………………………………………2.93 5.09 6.38 5.40 4.50
Income (loss) after income taxes ………………………………………………………………………………………………………………………………………………………………………………………………………………………16.72 18.21 22.85 19.92 13.73
OPERATING RATIOS
(see explanatory notes)
Annual rate of profit on stockholders' equity at end of period:
Before income taxes …………………………………………………………………………………………………………………………………………………………………………………………………………………………………………21.55 23.23 32.21 28.00 21.47
After income taxes …………………………………………………………………………………………………………………………………………………………………………………………………………………………………………18.34 18.15 25.17 22.03 16.17
Annual rate of profit on total assets:
Before income taxes …………………………………………………………………………………………………………………………………………………………………………………………………………………………………………8.79 9.34 12.96 11.29 8.27
After income taxes ……………………………………………………………………………………………………………………………………………………………………………………………………………………………………………7.48 7.30 10.13 8.88 6.23
Table 41.0 -- Income Statement For Corporations in NAICS Manufacturing Subsector 312,
Total Assets $25 Million and Over
See the Survey Methodology section of the Introduction for information on survey design, estimation, and sampling error.
Beverage and Tobacco Products
Total Assets $25 Million and Over
(million dollars)
(percent of net sales)
(percent)
82U.S. Census Bureau, Quarterly Financial Report, 2014 Quarter 4

Table with row headers in column A with column headers in rows 5 and 6
Item
4Q_
2013_
1Q_
2014_
2Q_
2014_
3Q_
2014_
4Q_
2014_
ASSETS
Cash and demand deposits in the U.S. ……………………………………………………………………………………………………………………………………………………………………………………………………………………………8,790 11,289 9,781 10,278 9,952
Time deposits in the U.S., including negotiable certificates of deposit …………………………………………………………………………………………………………………………………………………………………………………………3,270 2,672 902 1,495 2,145
Cash and deposits outside the U.S. .……………………………………………………………………………………………………………………………………………………………………………………………………………………………………………150 34 151 157 119
Total cash on hand and in banks ……………………………………………………………………………………………………………………………………………………………………………………………………………………………12,210 13,995 10,834 11,931 12,215
U.S. Treasury and Federal agency securities:
a. Subject to agreements to sell …………………………………………………………………………………………………………………………………………………………………………………………………………………………………0 0 11 44 42
b. Other, due in 1 year or less ……………………………………………………………………………………………………………………………………………………………………………………………………………………………………130 135 162 150 160
Commercial and finance company paper of U.S. issuers …………………………………………………………………………………………………………………………………………………………………………………………………………26 16 18 21 18
State and local government securities, due in 1 year or less …………………………………………………………………………………………………………………………………………………………………………………………………………114 115 115 117 122
Foreign securities, due in 1 year or less ………………………………………………………………………………………………………………………………………………………………………………………………………………………………0 0 0 0 0
Other short-term financial investments …………………………………………………………………………………………………………………………………………………………………………………………1,708 1,369 1,537 1,796 2,310
Total cash, U.S. Government and other securities ……………………………………………………………………………………………………………………………………………………………………………………………………14,188 15,629 12,677 14,060 14,867
Trade receivables from the U.S. Government …………………………………………………………………………………………………………………………………………………………………………………………………………………………4 3 3 5 5
Other trade accounts and trade notes receivable
(less allowance for doubtful accounts) ………………………………………………………………………………………………………………………………………………………………………11,378 12,273 13,610 12,849 11,013
Total receivables ………………………………………………………………………………………………………………………………………………………………………………………………………………………………11,382 12,276 13,613 12,854 11,018
Inventories ……………………………………………………………………………………………………………………………………………………………………………………………………………………………………………………19,937 19,989 19,521 20,211 20,854
All other current assets …………………………………………………………………………………………………………………………………………………………………………………………………………………………………………15,971 15,949 15,256 15,559 15,752
Total current assets ……………………………………………………………………………………………………………………………………………………………………………………………………………………………………61,478 63,843 61,067 62,685 62,491
Property, plant, and equipment ……………………………………………………………………………………………………………………………………………………………………………………………………………………………………………81,543 82,417 82,813 84,046 83,672
Land and mineral rights …………………………………………………………………………………………………………………………………………………………………………………………………………………………………………3,978 4,021 4,013 3,763 3,824
Less: Accumulated depreciation, depletion, and amortization ………………………………………………………………………………………………………………………………………………………………………………………………40,348 41,385 42,151 43,294 43,778
Net property, plant, and equipment …………………………………………………………………………………………………………………………………………………………………………………………………………………45,173 45,053 44,675 44,514 43,718
U.S. Treasury and Federal agency securities, due in more than 1 year …………………………………………………………………………………………………………………………………………………………………………………………87 86 58 0 0
All other noncurrent assets, including investment in nonconsolidated
entities, long-term investments, intangibles, etc. .………………………………………………………………………………………………………………………………………………………………………………………………………………………………303,109 306,144 312,998 314,937 304,720
Total Assets …………………………………………………………………………………………………………………………………………………………………………………………………………………………………………………409,846 415,127 418,798 422,136 410,929
LIABILITIES AND STOCKHOLDERS' EQUITY
Short-term debt, original maturity of 1 year or less:
a. Loans from banks ………………………………………………………………………………………………………………………………………………………………………………………………………………………………………599 583 522 1,182 908
b. Commercial paper ………………………………………………………………………………………………………………………………………………………………………………………………………………………………………17,870 19,701 19,430 19,252 20,245
c. Other short-term loans ………………………………………………………………………………………………………………………………………………………………………………………………………………………………3,014 5,242 5,376 5,299 1,393
Advances and prepayments by the U.S. Government …………………………………………………………………………………………………………………………………………………………………………………………………………0 0 0 0 0
Trade accounts and trade notes payable ………………………………………………………………………………………………………………………………………………………………………………………………………………………9,107 8,086 8,518 9,006 9,674
Income taxes accrued, prior and current years, net of payments:
a. Federal ……………………………………………………………………………………………………………………………………………………………………………………………………………………………………………………795 925 564 879 1,570
b. Other ………………………………………………………………………………………………………………………………………………………………………………………………………………………………………………(442) (617) 30 93 102
Current portion of long-term debt, due in 1 year or less:
a. Loans from banks ……………………………………………………………………………………………………………………………………………………………………………………………………………………………………1,180 1,188 1,185 1,157 581
b. Bonds and debentures …………………………………………………………………………………………………………………………………………………………………………………………………………………………………3,343 3,438 3,421 4,735 6,358
c. Other long-term loans ………………………………………………………………………………………………………………………………………………………………………………………………………………………………………1,123 1,691 1,730 1,735 1,788
All other current liabilities, including excise and
sales taxes, and accrued expenses ……………………………………………………………………………………………………………………………………………………………………………24,424 25,242 22,624 23,960 24,576
Total current liabilities ………………………………………………………………………………………………………………………………………………………………………………………………………………………………61,014 65,480 63,401 67,299 67,194
Long-term debt, due in more than 1 year:
a. Loans from banks ………………………………………………………………………………………………………………………………………………………………………………………………………………………………………………5,651 6,107 5,629 5,197 5,531
b. Bonds and debentures ………………………………………………………………………………………………………………………………………………………………………………………………………………………………………93,040 92,738 94,413 92,950 92,734
c. Other long-term loans …………………………………………………………………………………………………………………………………………………………………………………………………………………………………………23,963 25,087 26,681 26,709 26,889
All other noncurrent liabilities, including deferred income taxes,
capitalized leases, and minority stockholders' interest
in consolidated domestic corporations ………………………………………………………………………………………………………………………………………………………………………………59,101 58,822 60,175 59,828 60,337
Total liabilities ……………………………………………………………………………………………………………………………………………………………………………………………………………………………………242,770 248,234 250,299 251,983 252,685
Capital stock and other capital …………………………………………………………………………………………………………………………………………………………………………………………………………………………………112,536 112,220 111,587 110,653 111,936
Retained earnings ……………………………………………………………………………………………………………………………………………………………………………………………………………………………………164,183 165,716 167,885 172,730 172,685
Cumulative foreign currency translation adjustment …………………………………………………………………………………………………………………………………………………………………………………………………………(6,113) (6,406) (6,482) (6,565) (12,728)
Other stockholders' equity items, including unearned
compensation and ESOP debt guarantees ……………………………………………………………………………………………………………………………………………………………………(10,764) (9,914) (7,892) (8,993) (12,329)
Less: Treasury stock at cost ………………………………………………………………………………………………………………………………………………………………………………………………………………………………………92,766 94,722 96,599 97,672 101,319
Stockholders' equity ………………………………………………………………………………………………………………………………………………………………………………………………………………………………167,076 166,893 168,499 170,154 158,244
Total Liabilities and Stockholders' Equity ……………………………………………………………………………………………………………………………………………………409,846 415,127 418,798 422,136 410,929
NET WORKING CAPITAL
Excess of total current assets over total current liabilities ……………………………………………………………………………………………………………………………………………………………………………464 (1,636) (2,334) (4,614) (4,703)
(million dollars)
Beverage and Tobacco Products
Total Assets $25 Million and Over
Table 41.1 -- Balance Sheet For Corporations in NAICS Manufacturing Subsector 312,
Total Assets $25 Million and Over
See the Survey Methodology section of the Introduction for information on survey design, estimation, and sampling error.
83U.S. Census Bureau, Quarterly Financial Report, 2014 Quarter 4
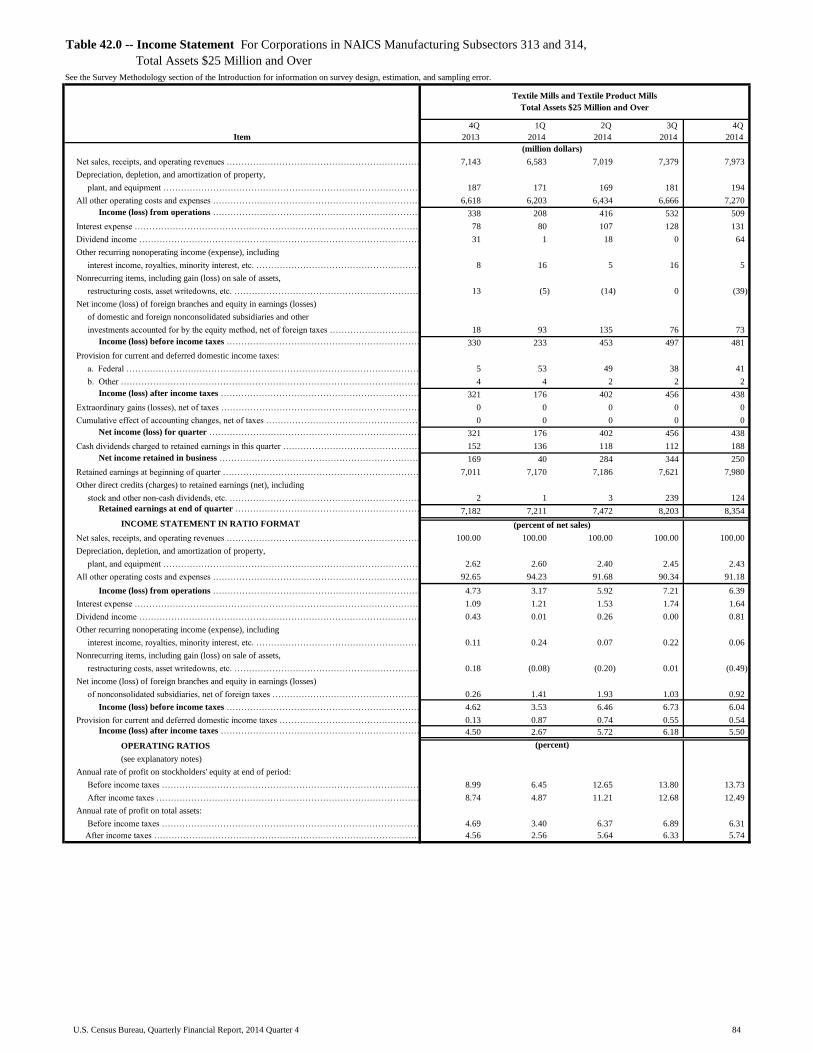
Table with row headers in column A with column headers in rows 5 and 6
Item
4Q_
2013_
1Q_
2014_
2Q_
2014_
3Q_
2014_
4Q_
2014_
Net sales, receipts, and operating revenues ………………………………………………………………………………………………………………………………………………………………………………………………………7,143 6,583 7,019 7,379 7,973
Depreciation, depletion, and amortization of property,
plant, and equipment ……………………………………………………………………………………………………………………………………………………………………187 171 169 181 194
All other operating costs and expenses …………………………………………………………………………………………………………………………………………………………………………………………………6,618 6,203 6,434 6,666 7,270
Income (loss) from operations …………………………………………………………………………………………………………………………………………...……………………………………………………………338 208 416 532 509
Interest expense …………………………………………………………………………………………………………………………………………………………………………………………………………………………………………78 80 107 128 131
Dividend income …………………………………………………………………………………………………………………………………………………………………………………………………………………………………………………31 1 18 0 64
Other recurring nonoperating income (expense), including
interest income, royalties, minority interest, etc. ………………………………………………………………………………………………………………………………………………………………………………………………………………………………………………8 16 5 16 5
Nonrecurring items, including gain (loss) on sale of assets,
restructuring costs, asset writedowns, etc. …………………………………………………………………………………………………………………………………………………………………13 (5) (14) 0 (39)
Net income (loss) of foreign branches and equity in earnings (losses)
of domestic and foreign nonconsolidated subsidiaries and other
investments accounted for by the equity method, net of foreign taxes ………………………………………………………………………………………………………………………………………………………………………………………………………………18 93 135 76 73
Income (loss) before income taxes ………………………………………………………………………………………………………………………………………………………………………………………………………330 233 453 497 481
Provision for current and deferred domestic income taxes:
a. Federal …………………………………………………………………………………………………………………………………………………………………………………………………………………………………………………5 53 49 38 41
b. Other …………………………………………………………………………………………………………………………………………………………………………………………………………………………………………………4 4 2 2 2
Income (loss) after income taxes ……………………………………………………………………………………………………………………………………………………………………………………………………321 176 402 456 438
Extraordinary gains (losses), net of taxes ……………………………………………………………………………………………………………………………………………………………………………………………………………0 0 0 0 0
Cumulative effect of accounting changes, net of taxes ……………………………………………………………………………………………………………………………………………………………………………………………0 0 0 0 0
Net income (loss) for quarter ………………………………………………………………………………………………………………………………………………………………………………………………………………321 176 402 456 438
Cash dividends charged to retained earnings in this quarter ………………………………………………………………………………………………………………………………………………………………………………………152 136 118 112 188
Net income retained in business …………………………………………………………………………………………………………………………………………………………………………………………………………………169 40 284 344 250
Retained earnings at beginning of quarter ………………………………………………………………………………………………………………………………………………………………………………………………………………………7,011 7,170 7,186 7,621 7,980
Other direct credits (charges) to retained earnings (net), including
stock and other non-cash dividends, etc. ……………………………………………………………………………………………………………………………………………………………………………………………………………………………2 1 3 239 124
Retained earnings at end of quarter ………………………………………………………………………………………………………………………………………………………………………………………………………7,182 7,211 7,472 8,203 8,354
INCOME STATEMENT IN RATIO FORMAT
Net sales, receipts, and operating revenues ……………………………………………………………………………………………………………………………………………………………………………………………………………100.00 100.00 100.00 100.00 100.00
Depreciation, depletion, and amortization of property,
plant, and equipment …………………………………………………………………………………………………………………………………………………………………………………2.62 2.60 2.40 2.45 2.43
All other operating costs and expenses ……………………………………………………………………………………………………………………………………………………………………………………………………………………………92.65 94.23 91.68 90.34 91.18
Income (loss) from operations …………………………………………………………………………………………………………………………………………………………………………………………………………………4.73 3.17 5.92 7.21 6.39
Interest expense ………………………………………………………………………………………………………………………………………………………………………………………………………………………………………………1.09 1.21 1.53 1.74 1.64
Dividend income …………………………………………………………………………………………………………………………………………………………………………………………………………………………………………………0.43 0.01 0.26 0.00 0.81
Other recurring nonoperating income (expense), including
interest income, royalties, minority interest, etc. …………………………………………………………………………………………………………………………………………………………………………………………………………………………………………………0.11 0.24 0.07 0.22 0.06
Nonrecurring items, including gain (loss) on sale of assets,
restructuring costs, asset writedowns, etc. ………………………………………………………………………………………………………………………………………………………………………………………………………………………………………………………………………………………………………0.18 (0.08) (0.20) 0.01 (0.49)
Net income (loss) of foreign branches and equity in earnings (losses)
of nonconsolidated subsidiaries, net of foreign taxes …………………………………………………………………………………………………………………………………………………………………………………………………………0.26 1.41 1.93 1.03 0.92
Income (loss) before income taxes …………………………………………………………………………………………………………………………………………………………………………………………………………………4.62 3.53 6.46 6.73 6.04
Provision for current and deferred domestic income taxes ………………………………………………………………………………………………………………………………………………………………………………………………………0.13 0.87 0.74 0.55 0.54
Income (loss) after income taxes ………………………………………………………………………………………………………………………………………………………………………………………………………………………4.50 2.67 5.72 6.18 5.50
OPERATING RATIOS
(see explanatory notes)
Annual rate of profit on stockholders' equity at end of period:
Before income taxes …………………………………………………………………………………………………………………………………………………………………………………………………………………………………………8.99 6.45 12.65 13.80 13.73
After income taxes …………………………………………………………………………………………………………………………………………………………………………………………………………………………………………8.74 4.87 11.21 12.68 12.49
Annual rate of profit on total assets:
Before income taxes …………………………………………………………………………………………………………………………………………………………………………………………………………………………………………4.69 3.40 6.37 6.89 6.31
After income taxes ……………………………………………………………………………………………………………………………………………………………………………………………………………………………………………4.56 2.56 5.64 6.33 5.74
Table 42.0 -- Income Statement For Corporations in NAICS Manufacturing Subsectors 313 and 314,
Total Assets $25 Million and Over
See the Survey Methodology section of the Introduction for information on survey design, estimation, and sampling error.
Textile Mills and Textile Product Mills
Total Assets $25 Million and Over
(million dollars)
(percent of net sales)
(percent)
84U.S. Census Bureau, Quarterly Financial Report, 2014 Quarter 4
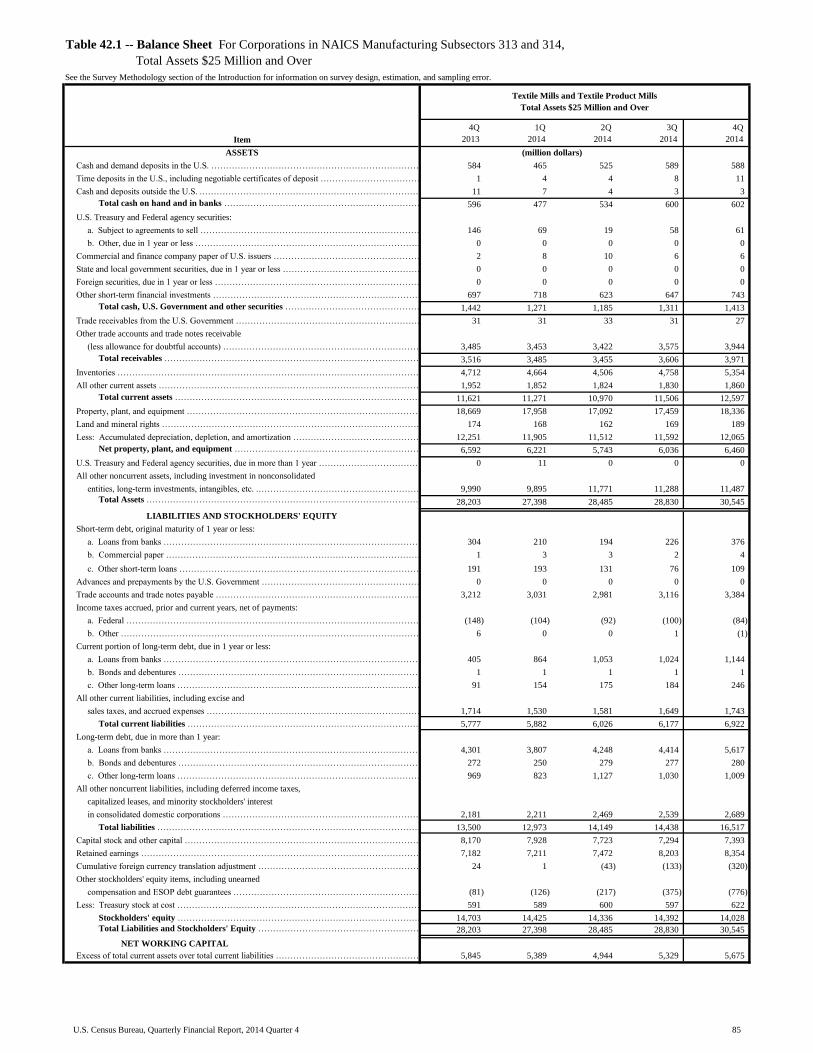
Table with row headers in column A with column headers in rows 5 and 6
Item
4Q_
2013_
1Q_
2014_
2Q_
2014_
3Q_
2014_
4Q_
2014_
ASSETS
Cash and demand deposits in the U.S. ……………………………………………………………………………………………………………………………………………………………………………………………………………………………584 465 525 589 588
Time deposits in the U.S., including negotiable certificates of deposit …………………………………………………………………………………………………………………………………………………………………………………………1 4 4 8 11
Cash and deposits outside the U.S. .……………………………………………………………………………………………………………………………………………………………………………………………………………………………………………11 7 4 3 3
Total cash on hand and in banks ……………………………………………………………………………………………………………………………………………………………………………………………………………………………596 477 534 600 602
U.S. Treasury and Federal agency securities:
a. Subject to agreements to sell …………………………………………………………………………………………………………………………………………………………………………………………………………………………………146 69 19 58 61
b. Other, due in 1 year or less ……………………………………………………………………………………………………………………………………………………………………………………………………………………………………0 0 0 0 0
Commercial and finance company paper of U.S. issuers …………………………………………………………………………………………………………………………………………………………………………………………………………2 8 10 6 6
State and local government securities, due in 1 year or less …………………………………………………………………………………………………………………………………………………………………………………………………………0 0 0 0 0
Foreign securities, due in 1 year or less ………………………………………………………………………………………………………………………………………………………………………………………………………………………………0 0 0 0 0
Other short-term financial investments …………………………………………………………………………………………………………………………………………………………………………………………697 718 623 647 743
Total cash, U.S. Government and other securities ……………………………………………………………………………………………………………………………………………………………………………………………………1,442 1,271 1,185 1,311 1,413
Trade receivables from the U.S. Government …………………………………………………………………………………………………………………………………………………………………………………………………………………………31 31 33 31 27
Other trade accounts and trade notes receivable
(less allowance for doubtful accounts) ………………………………………………………………………………………………………………………………………………………………………3,485 3,453 3,422 3,575 3,944
Total receivables ………………………………………………………………………………………………………………………………………………………………………………………………………………………………3,516 3,485 3,455 3,606 3,971
Inventories ……………………………………………………………………………………………………………………………………………………………………………………………………………………………………………………4,712 4,664 4,506 4,758 5,354
All other current assets …………………………………………………………………………………………………………………………………………………………………………………………………………………………………………1,952 1,852 1,824 1,830 1,860
Total current assets ……………………………………………………………………………………………………………………………………………………………………………………………………………………………………11,621 11,271 10,970 11,506 12,597
Property, plant, and equipment ……………………………………………………………………………………………………………………………………………………………………………………………………………………………………………18,669 17,958 17,092 17,459 18,336
Land and mineral rights …………………………………………………………………………………………………………………………………………………………………………………………………………………………………………174 168 162 169 189
Less: Accumulated depreciation, depletion, and amortization ………………………………………………………………………………………………………………………………………………………………………………………………12,251 11,905 11,512 11,592 12,065
Net property, plant, and equipment …………………………………………………………………………………………………………………………………………………………………………………………………………………6,592 6,221 5,743 6,036 6,460
U.S. Treasury and Federal agency securities, due in more than 1 year …………………………………………………………………………………………………………………………………………………………………………………………0 11 0 0 0
All other noncurrent assets, including investment in nonconsolidated
entities, long-term investments, intangibles, etc. .………………………………………………………………………………………………………………………………………………………………………………………………………………………………9,990 9,895 11,771 11,288 11,487
Total Assets …………………………………………………………………………………………………………………………………………………………………………………………………………………………………………………28,203 27,398 28,485 28,830 30,545
LIABILITIES AND STOCKHOLDERS' EQUITY
Short-term debt, original maturity of 1 year or less:
a. Loans from banks ………………………………………………………………………………………………………………………………………………………………………………………………………………………………………304 210 194 226 376
b. Commercial paper ………………………………………………………………………………………………………………………………………………………………………………………………………………………………………1 3 3 2 4
c. Other short-term loans ………………………………………………………………………………………………………………………………………………………………………………………………………………………………191 193 131 76 109
Advances and prepayments by the U.S. Government …………………………………………………………………………………………………………………………………………………………………………………………………………0 0 0 0 0
Trade accounts and trade notes payable ………………………………………………………………………………………………………………………………………………………………………………………………………………………3,212 3,031 2,981 3,116 3,384
Income taxes accrued, prior and current years, net of payments:
a. Federal ……………………………………………………………………………………………………………………………………………………………………………………………………………………………………………………(148) (104) (92) (100) (84)
b. Other ………………………………………………………………………………………………………………………………………………………………………………………………………………………………………………6 0 0 1 (1)
Current portion of long-term debt, due in 1 year or less:
a. Loans from banks ……………………………………………………………………………………………………………………………………………………………………………………………………………………………………405 864 1,053 1,024 1,144
b. Bonds and debentures …………………………………………………………………………………………………………………………………………………………………………………………………………………………………1 1 1 1 1
c. Other long-term loans ………………………………………………………………………………………………………………………………………………………………………………………………………………………………………91 154 175 184 246
All other current liabilities, including excise and
sales taxes, and accrued expenses ……………………………………………………………………………………………………………………………………………………………………………1,714 1,530 1,581 1,649 1,743
Total current liabilities ………………………………………………………………………………………………………………………………………………………………………………………………………………………………5,777 5,882 6,026 6,177 6,922
Long-term debt, due in more than 1 year:
a. Loans from banks ………………………………………………………………………………………………………………………………………………………………………………………………………………………………………………4,301 3,807 4,248 4,414 5,617
b. Bonds and debentures ………………………………………………………………………………………………………………………………………………………………………………………………………………………………………272 250 279 277 280
c. Other long-term loans …………………………………………………………………………………………………………………………………………………………………………………………………………………………………………969 823 1,127 1,030 1,009
All other noncurrent liabilities, including deferred income taxes,
capitalized leases, and minority stockholders' interest
in consolidated domestic corporations ………………………………………………………………………………………………………………………………………………………………………………2,181 2,211 2,469 2,539 2,689
Total liabilities ……………………………………………………………………………………………………………………………………………………………………………………………………………………………………13,500 12,973 14,149 14,438 16,517
Capital stock and other capital …………………………………………………………………………………………………………………………………………………………………………………………………………………………………8,170 7,928 7,723 7,294 7,393
Retained earnings ……………………………………………………………………………………………………………………………………………………………………………………………………………………………………7,182 7,211 7,472 8,203 8,354
Cumulative foreign currency translation adjustment …………………………………………………………………………………………………………………………………………………………………………………………………………24 1 (43) (133) (320)
Other stockholders' equity items, including unearned
compensation and ESOP debt guarantees ……………………………………………………………………………………………………………………………………………………………………(81) (126) (217) (375) (776)
Less: Treasury stock at cost ………………………………………………………………………………………………………………………………………………………………………………………………………………………………………591 589 600 597 622
Stockholders' equity ………………………………………………………………………………………………………………………………………………………………………………………………………………………………14,703 14,425 14,336 14,392 14,028
Total Liabilities and Stockholders' Equity ……………………………………………………………………………………………………………………………………………………28,203 27,398 28,485 28,830 30,545
NET WORKING CAPITAL
Excess of total current assets over total current liabilities ……………………………………………………………………………………………………………………………………………………………………………5,845 5,389 4,944 5,329 5,675
(million dollars)
Textile Mills and Textile Product Mills
Total Assets $25 Million and Over
Table 42.1 -- Balance Sheet For Corporations in NAICS Manufacturing Subsectors 313 and 314,
Total Assets $25 Million and Over
See the Survey Methodology section of the Introduction for information on survey design, estimation, and sampling error.
85U.S. Census Bureau, Quarterly Financial Report, 2014 Quarter 4

Table with row headers in column A with column headers in rows 5 and 6
Item
4Q_
2013_
1Q_
2014_
2Q_
2014_
3Q_
2014_
4Q_
2014_
Net sales, receipts, and operating revenues ………………………………………………………………………………………………………………………………………………………………………………………………………20,014 18,028 18,355 20,764 21,188
Depreciation, depletion, and amortization of property,
plant, and equipment ……………………………………………………………………………………………………………………………………………………………………444 410 433 461 487
All other operating costs and expenses …………………………………………………………………………………………………………………………………………………………………………………………………17,689 16,409 16,299 18,020 18,760
Income (loss) from operations …………………………………………………………………………………………………………………………………………...……………………………………………………………1,882 1,209 1,623 2,283 1,942
Interest expense …………………………………………………………………………………………………………………………………………………………………………………………………………………………………………259 242 250 240 226
Dividend income …………………………………………………………………………………………………………………………………………………………………………………………………………………………………………………26 9 5 5 43
Other recurring nonoperating income (expense), including
interest income, royalties, minority interest, etc. ………………………………………………………………………………………………………………………………………………………………………………………………………………………………………………(5) 49 82 71 47
Nonrecurring items, including gain (loss) on sale of assets,
restructuring costs, asset writedowns, etc. …………………………………………………………………………………………………………………………………………………………………157 80 (155) (189) (493)
Net income (loss) of foreign branches and equity in earnings (losses)
of domestic and foreign nonconsolidated subsidiaries and other
investments accounted for by the equity method, net of foreign taxes ………………………………………………………………………………………………………………………………………………………………………………………………………………474 1,135 730 1,128 815
Income (loss) before income taxes ………………………………………………………………………………………………………………………………………………………………………………………………………2,274 2,239 2,035 3,058 2,129
Provision for current and deferred domestic income taxes:
a. Federal …………………………………………………………………………………………………………………………………………………………………………………………………………………………………………………412 447 352 605 351
b. Other …………………………………………………………………………………………………………………………………………………………………………………………………………………………………………………79 49 31 76 42
Income (loss) after income taxes ……………………………………………………………………………………………………………………………………………………………………………………………………1,784 1,744 1,651 2,377 1,736
Extraordinary gains (losses), net of taxes ……………………………………………………………………………………………………………………………………………………………………………………………………………0 0 0 0 0
Cumulative effect of accounting changes, net of taxes ……………………………………………………………………………………………………………………………………………………………………………………………0 0 0 0 0
Net income (loss) for quarter ………………………………………………………………………………………………………………………………………………………………………………………………………………1,784 1,744 1,651 2,377 1,736
Cash dividends charged to retained earnings in this quarter ………………………………………………………………………………………………………………………………………………………………………………………686 784 677 649 1,101
Net income retained in business …………………………………………………………………………………………………………………………………………………………………………………………………………………1,098 960 975 1,728 635
Retained earnings at beginning of quarter ………………………………………………………………………………………………………………………………………………………………………………………………………………………26,183 26,940 26,566 26,495 25,921
Other direct credits (charges) to retained earnings (net), including
stock and other non-cash dividends, etc. ……………………………………………………………………………………………………………………………………………………………………………………………………………………………(548) (1,571) (999) (894) (443)
Retained earnings at end of quarter ………………………………………………………………………………………………………………………………………………………………………………………………………26,732 26,329 26,541 27,329 26,113
INCOME STATEMENT IN RATIO FORMAT
Net sales, receipts, and operating revenues ……………………………………………………………………………………………………………………………………………………………………………………………………………100.00 100.00 100.00 100.00 100.00
Depreciation, depletion, and amortization of property,
plant, and equipment …………………………………………………………………………………………………………………………………………………………………………………2.22 2.28 2.36 2.22 2.30
All other operating costs and expenses ……………………………………………………………………………………………………………………………………………………………………………………………………………………………88.38 91.02 88.80 86.79 88.54
Income (loss) from operations …………………………………………………………………………………………………………………………………………………………………………………………………………………9.40 6.71 8.84 11.00 9.17
Interest expense ………………………………………………………………………………………………………………………………………………………………………………………………………………………………………………1.29 1.34 1.36 1.16 1.07
Dividend income …………………………………………………………………………………………………………………………………………………………………………………………………………………………………………………0.13 0.05 0.03 0.02 0.20
Other recurring nonoperating income (expense), including
interest income, royalties, minority interest, etc. …………………………………………………………………………………………………………………………………………………………………………………………………………………………………………………(0.02) 0.27 0.45 0.34 0.22
Nonrecurring items, including gain (loss) on sale of assets,
restructuring costs, asset writedowns, etc. ………………………………………………………………………………………………………………………………………………………………………………………………………………………………………………………………………………………………………0.78 0.44 (0.85) (0.91) (2.33)
Net income (loss) of foreign branches and equity in earnings (losses)
of nonconsolidated subsidiaries, net of foreign taxes …………………………………………………………………………………………………………………………………………………………………………………………………………2.37 6.29 3.98 5.43 3.85
Income (loss) before income taxes …………………………………………………………………………………………………………………………………………………………………………………………………………………11.36 12.42 11.09 14.73 10.05
Provision for current and deferred domestic income taxes ………………………………………………………………………………………………………………………………………………………………………………………………………2.45 2.75 2.09 3.28 1.85
Income (loss) after income taxes ………………………………………………………………………………………………………………………………………………………………………………………………………………………8.91 9.67 9.00 11.45 8.19
OPERATING RATIOS
(see explanatory notes)
Annual rate of profit on stockholders' equity at end of period:
Before income taxes …………………………………………………………………………………………………………………………………………………………………………………………………………………………………………24.24 23.90 21.50 31.70 22.23
After income taxes …………………………………………………………………………………………………………………………………………………………………………………………………………………………………………19.02 18.61 17.45 24.64 18.13
Annual rate of profit on total assets:
Before income taxes …………………………………………………………………………………………………………………………………………………………………………………………………………………………………………12.85 12.65 11.36 16.63 11.81
After income taxes ……………………………………………………………………………………………………………………………………………………………………………………………………………………………………………10.08 9.85 9.22 12.93 9.63
Table 43.0 -- Income Statement For Corporations in NAICS Manufacturing Subsectors 315 and 316,
Total Assets $25 Million and Over
See the Survey Methodology section of the Introduction for information on survey design, estimation, and sampling error.
Apparel and Leather Products
Total Assets $25 Million and Over
(million dollars)
(percent of net sales)
(percent)
86U.S. Census Bureau, Quarterly Financial Report, 2014 Quarter 4

Table with row headers in column A with column headers in rows 5 and 6
Item
4Q_
2013_
1Q_
2014_
2Q_
2014_
3Q_
2014_
4Q_
2014_
ASSETS
Cash and demand deposits in the U.S. ……………………………………………………………………………………………………………………………………………………………………………………………………………………………2,762 2,330 2,689 2,713 3,530
Time deposits in the U.S., including negotiable certificates of deposit …………………………………………………………………………………………………………………………………………………………………………………………305 15 15 6 144
Cash and deposits outside the U.S. .……………………………………………………………………………………………………………………………………………………………………………………………………………………………………………289 362 320 307 279
Total cash on hand and in banks ……………………………………………………………………………………………………………………………………………………………………………………………………………………………3,355 2,708 3,025 3,026 3,953
U.S. Treasury and Federal agency securities:
a. Subject to agreements to sell …………………………………………………………………………………………………………………………………………………………………………………………………………………………………0 0 0 0 0
b. Other, due in 1 year or less ……………………………………………………………………………………………………………………………………………………………………………………………………………………………………0 0 0 0 0
Commercial and finance company paper of U.S. issuers …………………………………………………………………………………………………………………………………………………………………………………………………………25 45 46 4 8
State and local government securities, due in 1 year or less …………………………………………………………………………………………………………………………………………………………………………………………………………5 6 6 6 6
Foreign securities, due in 1 year or less ………………………………………………………………………………………………………………………………………………………………………………………………………………………………0 0 0 0 0
Other short-term financial investments …………………………………………………………………………………………………………………………………………………………………………………………198 138 246 105 158
Total cash, U.S. Government and other securities ……………………………………………………………………………………………………………………………………………………………………………………………………3,583 2,896 3,323 3,140 4,124
Trade receivables from the U.S. Government …………………………………………………………………………………………………………………………………………………………………………………………………………………………3 23 28 33 39
Other trade accounts and trade notes receivable
(less allowance for doubtful accounts) ………………………………………………………………………………………………………………………………………………………………………7,262 7,389 7,339 8,465 7,316
Total receivables ………………………………………………………………………………………………………………………………………………………………………………………………………………………………7,265 7,412 7,368 8,498 7,355
Inventories ……………………………………………………………………………………………………………………………………………………………………………………………………………………………………………………11,748 12,029 12,527 13,214 12,243
All other current assets …………………………………………………………………………………………………………………………………………………………………………………………………………………………………………4,296 3,921 3,836 3,868 3,966
Total current assets ……………………………………………………………………………………………………………………………………………………………………………………………………………………………………26,893 26,259 27,054 28,719 27,688
Property, plant, and equipment ……………………………………………………………………………………………………………………………………………………………………………………………………………………………………………19,023 19,031 19,120 19,776 20,146
Land and mineral rights …………………………………………………………………………………………………………………………………………………………………………………………………………………………………………582 582 584 585 596
Less: Accumulated depreciation, depletion, and amortization ………………………………………………………………………………………………………………………………………………………………………………………………11,875 11,925 12,036 12,384 12,660
Net property, plant, and equipment …………………………………………………………………………………………………………………………………………………………………………………………………………………7,731 7,689 7,667 7,977 8,082
U.S. Treasury and Federal agency securities, due in more than 1 year …………………………………………………………………………………………………………………………………………………………………………………………7 4 4 4 1
All other noncurrent assets, including investment in nonconsolidated
entities, long-term investments, intangibles, etc. .………………………………………………………………………………………………………………………………………………………………………………………………………………………………36,155 36,875 36,927 36,825 36,323
Total Assets …………………………………………………………………………………………………………………………………………………………………………………………………………………………………………………70,784 70,826 71,651 73,525 72,094
LIABILITIES AND STOCKHOLDERS' EQUITY
Short-term debt, original maturity of 1 year or less:
a. Loans from banks ………………………………………………………………………………………………………………………………………………………………………………………………………………………………………305 385 539 384 483
b. Commercial paper ………………………………………………………………………………………………………………………………………………………………………………………………………………………………………21 263 582 866 137
c. Other short-term loans ………………………………………………………………………………………………………………………………………………………………………………………………………………………………221 115 94 158 150
Advances and prepayments by the U.S. Government …………………………………………………………………………………………………………………………………………………………………………………………………………0 0 0 0 0
Trade accounts and trade notes payable ………………………………………………………………………………………………………………………………………………………………………………………………………………………4,029 3,837 4,088 4,339 4,268
Income taxes accrued, prior and current years, net of payments:
a. Federal ……………………………………………………………………………………………………………………………………………………………………………………………………………………………………………………128 151 221 347 212
b. Other ………………………………………………………………………………………………………………………………………………………………………………………………………………………………………………(48) (68) (87) 11 (35)
Current portion of long-term debt, due in 1 year or less:
a. Loans from banks ……………………………………………………………………………………………………………………………………………………………………………………………………………………………………168 140 176 571 206
b. Bonds and debentures …………………………………………………………………………………………………………………………………………………………………………………………………………………………………6 6 9 9 9
c. Other long-term loans ………………………………………………………………………………………………………………………………………………………………………………………………………………………………………222 56 62 45 58
All other current liabilities, including excise and
sales taxes, and accrued expenses ……………………………………………………………………………………………………………………………………………………………………………5,439 5,458 5,525 5,593 6,144
Total current liabilities ………………………………………………………………………………………………………………………………………………………………………………………………………………………………10,491 10,342 11,209 12,323 11,632
Long-term debt, due in more than 1 year:
a. Loans from banks ………………………………………………………………………………………………………………………………………………………………………………………………………………………………………………4,211 4,312 4,240 4,123 3,593
b. Bonds and debentures ………………………………………………………………………………………………………………………………………………………………………………………………………………………………………7,734 7,571 7,430 7,372 7,415
c. Other long-term loans …………………………………………………………………………………………………………………………………………………………………………………………………………………………………………2,220 2,352 2,166 2,209 2,298
All other noncurrent liabilities, including deferred income taxes,
capitalized leases, and minority stockholders' interest
in consolidated domestic corporations ………………………………………………………………………………………………………………………………………………………………………………8,605 8,772 8,756 8,918 8,863
Total liabilities ……………………………………………………………………………………………………………………………………………………………………………………………………………………………………33,261 33,349 33,800 34,945 33,800
Capital stock and other capital …………………………………………………………………………………………………………………………………………………………………………………………………………………………………19,052 19,632 20,035 20,416 21,982
Retained earnings ……………………………………………………………………………………………………………………………………………………………………………………………………………………………………26,732 26,329 26,541 27,329 26,113
Cumulative foreign currency translation adjustment …………………………………………………………………………………………………………………………………………………………………………………………………………108 57 121 (57) (135)
Other stockholders' equity items, including unearned
compensation and ESOP debt guarantees ……………………………………………………………………………………………………………………………………………………………………(1,154) (1,217) (1,108) (1,240) (1,708)
Less: Treasury stock at cost ………………………………………………………………………………………………………………………………………………………………………………………………………………………………………7,215 7,324 7,738 7,867 7,958
Stockholders' equity ………………………………………………………………………………………………………………………………………………………………………………………………………………………………37,523 37,477 37,850 38,580 38,294
Total Liabilities and Stockholders' Equity ……………………………………………………………………………………………………………………………………………………70,784 70,826 71,651 73,525 72,094
NET WORKING CAPITAL
Excess of total current assets over total current liabilities ……………………………………………………………………………………………………………………………………………………………………………16,402 15,916 15,845 16,396 16,056
(million dollars)
Apparel and Leather Products
Total Assets $25 Million and Over
Table 43.1 -- Balance Sheet For Corporations in NAICS Manufacturing Subsectors 315 and 316,
Total Assets $25 Million and Over
See the Survey Methodology section of the Introduction for information on survey design, estimation, and sampling error.
87U.S. Census Bureau, Quarterly Financial Report, 2014 Quarter 4

Table with row headers in column A with column headers in rows 5 and 6
Item
4Q_
2013_
1Q_
2014_
2Q_
2014_
3Q_
2014_
4Q_
2014_
Net sales, receipts, and operating revenues ………………………………………………………………………………………………………………………………………………………………………………………………………29,443 28,764 29,790 28,810 28,574
Depreciation, depletion, and amortization of property,
plant, and equipment ……………………………………………………………………………………………………………………………………………………………………1,187 1,204 1,331 1,313 1,313
All other operating costs and expenses …………………………………………………………………………………………………………………………………………………………………………………………………26,663 26,524 26,582 24,877 25,281
Income (loss) from operations …………………………………………………………………………………………………………………………………………...……………………………………………………………1,593 1,036 1,877 2,620 1,981
Interest expense …………………………………………………………………………………………………………………………………………………………………………………………………………………………………………629 662 689 658 639
Dividend income …………………………………………………………………………………………………………………………………………………………………………………………………………………………………………………27 146 37 84 38
Other recurring nonoperating income (expense), including
interest income, royalties, minority interest, etc. ………………………………………………………………………………………………………………………………………………………………………………………………………………………………………………62 183 146 160 9
Nonrecurring items, including gain (loss) on sale of assets,
restructuring costs, asset writedowns, etc. …………………………………………………………………………………………………………………………………………………………………804 (41) (170) (130) (683)
Net income (loss) of foreign branches and equity in earnings (losses)
of domestic and foreign nonconsolidated subsidiaries and other
investments accounted for by the equity method, net of foreign taxes ………………………………………………………………………………………………………………………………………………………………………………………………………………426 537 735 555 308
Income (loss) before income taxes ………………………………………………………………………………………………………………………………………………………………………………………………………2,284 1,199 1,935 2,631 1,013
Provision for current and deferred domestic income taxes:
a. Federal …………………………………………………………………………………………………………………………………………………………………………………………………………………………………………………(453) 154 399 481 152
b. Other …………………………………………………………………………………………………………………………………………………………………………………………………………………………………………………(96) 52 36 63 41
Income (loss) after income taxes ……………………………………………………………………………………………………………………………………………………………………………………………………2,833 992 1,499 2,087 820
Extraordinary gains (losses), net of taxes ……………………………………………………………………………………………………………………………………………………………………………………………………………0 0 0 0 0
Cumulative effect of accounting changes, net of taxes ……………………………………………………………………………………………………………………………………………………………………………………………0 0 0 0 0
Net income (loss) for quarter ………………………………………………………………………………………………………………………………………………………………………………………………………………2,833 992 1,499 2,087 820
Cash dividends charged to retained earnings in this quarter ………………………………………………………………………………………………………………………………………………………………………………………930 1,221 1,015 1,065 983
Net income retained in business …………………………………………………………………………………………………………………………………………………………………………………………………………………1,902 (229) 484 1,023 (163)
Retained earnings at beginning of quarter ………………………………………………………………………………………………………………………………………………………………………………………………………………………25,279 26,962 26,672 27,417 28,668
Other direct credits (charges) to retained earnings (net), including
stock and other non-cash dividends, etc. ……………………………………………………………………………………………………………………………………………………………………………………………………………………………(116) (118) 97 (101) (150)
Retained earnings at end of quarter ………………………………………………………………………………………………………………………………………………………………………………………………………27,066 26,614 27,254 28,339 28,355
INCOME STATEMENT IN RATIO FORMAT
Net sales, receipts, and operating revenues ……………………………………………………………………………………………………………………………………………………………………………………………………………100.00 100.00 100.00 100.00 100.00
Depreciation, depletion, and amortization of property,
plant, and equipment …………………………………………………………………………………………………………………………………………………………………………………4.03 4.18 4.47 4.56 4.59
All other operating costs and expenses ……………………………………………………………………………………………………………………………………………………………………………………………………………………………90.56 92.21 89.23 86.35 88.47
Income (loss) from operations …………………………………………………………………………………………………………………………………………………………………………………………………………………5.41 3.60 6.30 9.09 6.93
Interest expense ………………………………………………………………………………………………………………………………………………………………………………………………………………………………………………2.13 2.30 2.31 2.28 2.24
Dividend income …………………………………………………………………………………………………………………………………………………………………………………………………………………………………………………0.09 0.51 0.12 0.29 0.13
Other recurring nonoperating income (expense), including
interest income, royalties, minority interest, etc. …………………………………………………………………………………………………………………………………………………………………………………………………………………………………………………0.21 0.64 0.49 0.55 0.03
Nonrecurring items, including gain (loss) on sale of assets,
restructuring costs, asset writedowns, etc. ………………………………………………………………………………………………………………………………………………………………………………………………………………………………………………………………………………………………………2.73 (0.14) (0.57) (0.45) (2.39)
Net income (loss) of foreign branches and equity in earnings (losses)
of nonconsolidated subsidiaries, net of foreign taxes …………………………………………………………………………………………………………………………………………………………………………………………………………1.45 1.87 2.47 1.93 1.08
Income (loss) before income taxes …………………………………………………………………………………………………………………………………………………………………………………………………………………7.76 4.17 6.50 9.13 3.54
Provision for current and deferred domestic income taxes ………………………………………………………………………………………………………………………………………………………………………………………………………(1.87) 0.72 1.46 1.89 0.68
Income (loss) after income taxes ………………………………………………………………………………………………………………………………………………………………………………………………………………………9.62 3.45 5.03 7.25 2.87
OPERATING RATIOS
(see explanatory notes)
Annual rate of profit on stockholders' equity at end of period:
Before income taxes …………………………………………………………………………………………………………………………………………………………………………………………………………………………………………18.74 10.05 16.30 22.20 8.72
After income taxes …………………………………………………………………………………………………………………………………………………………………………………………………………………………………………23.25 8.32 12.63 17.62 7.06
Annual rate of profit on total assets:
Before income taxes …………………………………………………………………………………………………………………………………………………………………………………………………………………………………………6.70 3.55 5.73 7.80 3.00
After income taxes ……………………………………………………………………………………………………………………………………………………………………………………………………………………………………………8.31 2.94 4.44 6.19 2.43
Table 44.0 -- Income Statement For Corporations in NAICS Manufacturing Subsector 322,
Total Assets $25 Million and Over
See the Survey Methodology section of the Introduction for information on survey design, estimation, and sampling error.
Paper
Total Assets $25 Million and Over
(million dollars)
(percent of net sales)
(percent)
88U.S. Census Bureau, Quarterly Financial Report, 2014 Quarter 4

Table with row headers in column A with column headers in rows 5 and 6
Item
4Q_
2013_
1Q_
2014_
2Q_
2014_
3Q_
2014_
4Q_
2014_
ASSETS
Cash and demand deposits in the U.S. ……………………………………………………………………………………………………………………………………………………………………………………………………………………………2,672 1,649 1,767 1,701 2,394
Time deposits in the U.S., including negotiable certificates of deposit …………………………………………………………………………………………………………………………………………………………………………………………1,018 974 786 995 1,152
Cash and deposits outside the U.S. .……………………………………………………………………………………………………………………………………………………………………………………………………………………………………………16 18 18 19 21
Total cash on hand and in banks ……………………………………………………………………………………………………………………………………………………………………………………………………………………………3,706 2,641 2,571 2,715 3,567
U.S. Treasury and Federal agency securities:
a. Subject to agreements to sell …………………………………………………………………………………………………………………………………………………………………………………………………………………………………0 0 0 0 0
b. Other, due in 1 year or less ……………………………………………………………………………………………………………………………………………………………………………………………………………………………………0 0 0 0 0
Commercial and finance company paper of U.S. issuers …………………………………………………………………………………………………………………………………………………………………………………………………………128 134 121 78 75
State and local government securities, due in 1 year or less …………………………………………………………………………………………………………………………………………………………………………………………………………0 0 0 0 0
Foreign securities, due in 1 year or less ………………………………………………………………………………………………………………………………………………………………………………………………………………………………0 0 0 0 0
Other short-term financial investments …………………………………………………………………………………………………………………………………………………………………………………………1,948 1,168 1,279 1,336 1,494
Total cash, U.S. Government and other securities ……………………………………………………………………………………………………………………………………………………………………………………………………5,783 3,942 3,971 4,129 5,136
Trade receivables from the U.S. Government …………………………………………………………………………………………………………………………………………………………………………………………………………………………14 12 14 12 11
Other trade accounts and trade notes receivable
(less allowance for doubtful accounts) ………………………………………………………………………………………………………………………………………………………………………12,407 12,752 12,932 12,712 11,971
Total receivables ………………………………………………………………………………………………………………………………………………………………………………………………………………………………12,422 12,764 12,946 12,724 11,982
Inventories ……………………………………………………………………………………………………………………………………………………………………………………………………………………………………………………11,841 12,436 12,217 11,954 12,019
All other current assets …………………………………………………………………………………………………………………………………………………………………………………………………………………………………………5,213 5,289 5,305 5,007 5,075
Total current assets ……………………………………………………………………………………………………………………………………………………………………………………………………………………………………35,258 34,432 34,440 33,814 34,211
Property, plant, and equipment ……………………………………………………………………………………………………………………………………………………………………………………………………………………………………………104,850 105,958 105,416 105,393 106,263
Land and mineral rights …………………………………………………………………………………………………………………………………………………………………………………………………………………………………………3,140 3,143 3,165 3,156 3,174
Less: Accumulated depreciation, depletion, and amortization ………………………………………………………………………………………………………………………………………………………………………………………………60,560 62,328 62,238 62,537 63,022
Net property, plant, and equipment …………………………………………………………………………………………………………………………………………………………………………………………………………………47,430 46,773 46,343 46,012 46,415
U.S. Treasury and Federal agency securities, due in more than 1 year …………………………………………………………………………………………………………………………………………………………………………………………0 0 0 0 0
All other noncurrent assets, including investment in nonconsolidated
entities, long-term investments, intangibles, etc. .………………………………………………………………………………………………………………………………………………………………………………………………………………………………53,676 53,714 54,305 55,083 54,305
Total Assets …………………………………………………………………………………………………………………………………………………………………………………………………………………………………………………136,364 134,919 135,088 134,909 134,932
LIABILITIES AND STOCKHOLDERS' EQUITY
Short-term debt, original maturity of 1 year or less:
a. Loans from banks ………………………………………………………………………………………………………………………………………………………………………………………………………………………………………460 571 698 631 608
b. Commercial paper ………………………………………………………………………………………………………………………………………………………………………………………………………………………………………375 316 343 214 213
c. Other short-term loans ………………………………………………………………………………………………………………………………………………………………………………………………………………………………1,458 1,476 1,545 1,468 1,595
Advances and prepayments by the U.S. Government …………………………………………………………………………………………………………………………………………………………………………………………………………0 0 0 0 0
Trade accounts and trade notes payable ………………………………………………………………………………………………………………………………………………………………………………………………………………………9,563 9,803 9,779 9,377 9,223
Income taxes accrued, prior and current years, net of payments:
a. Federal ……………………………………………………………………………………………………………………………………………………………………………………………………………………………………………………386 379 380 326 188
b. Other ………………………………………………………………………………………………………………………………………………………………………………………………………………………………………………38 50 70 67 49
Current portion of long-term debt, due in 1 year or less:
a. Loans from banks ……………………………………………………………………………………………………………………………………………………………………………………………………………………………………1,323 1,157 1,133 1,102 1,350
b. Bonds and debentures …………………………………………………………………………………………………………………………………………………………………………………………………………………………………59 157 448 234 380
c. Other long-term loans ………………………………………………………………………………………………………………………………………………………………………………………………………………………………………70 116 165 194 181
All other current liabilities, including excise and
sales taxes, and accrued expenses ……………………………………………………………………………………………………………………………………………………………………………8,821 8,368 8,507 9,361 9,610
Total current liabilities ………………………………………………………………………………………………………………………………………………………………………………………………………………………………22,553 22,393 23,067 22,973 23,398
Long-term debt, due in more than 1 year:
a. Loans from banks ………………………………………………………………………………………………………………………………………………………………………………………………………………………………………………18,361 18,879 18,252 17,737 17,750
b. Bonds and debentures ………………………………………………………………………………………………………………………………………………………………………………………………………………………………………11,366 11,362 11,179 11,324 10,985
c. Other long-term loans …………………………………………………………………………………………………………………………………………………………………………………………………………………………………………13,690 13,780 14,086 14,565 14,644
All other noncurrent liabilities, including deferred income taxes,
capitalized leases, and minority stockholders' interest
in consolidated domestic corporations ………………………………………………………………………………………………………………………………………………………………………………21,654 20,802 21,019 20,908 21,677
Total liabilities ……………………………………………………………………………………………………………………………………………………………………………………………………………………………………87,624 87,218 87,603 87,507 88,454
Capital stock and other capital …………………………………………………………………………………………………………………………………………………………………………………………………………………………………32,028 31,906 31,185 31,635 32,987
Retained earnings ……………………………………………………………………………………………………………………………………………………………………………………………………………………………………27,066 26,614 27,254 28,339 28,355
Cumulative foreign currency translation adjustment …………………………………………………………………………………………………………………………………………………………………………………………………………(445) (541) (521) (1,729) (2,786)
Other stockholders' equity items, including unearned
compensation and ESOP debt guarantees ……………………………………………………………………………………………………………………………………………………………………(3,559) (3,690) (3,406) (3,468) (4,433)
Less: Treasury stock at cost ………………………………………………………………………………………………………………………………………………………………………………………………………………………………………6,350 6,588 7,027 7,375 7,644
Stockholders' equity ………………………………………………………………………………………………………………………………………………………………………………………………………………………………48,741 47,701 47,485 47,402 46,478
Total Liabilities and Stockholders' Equity ……………………………………………………………………………………………………………………………………………………136,364 134,919 135,088 134,909 134,932
NET WORKING CAPITAL
Excess of total current assets over total current liabilities ……………………………………………………………………………………………………………………………………………………………………………12,706 12,038 11,374 10,841 10,814
(million dollars)
Paper
Total Assets $25 Million and Over
Table 44.1 -- Balance Sheet For Corporations in NAICS Manufacturing Subsector 322,
Total Assets $25 Million and Over
See the Survey Methodology section of the Introduction for information on survey design, estimation, and sampling error.
89U.S. Census Bureau, Quarterly Financial Report, 2014 Quarter 4

Table with row headers in column A with column headers in rows 5 and 6
Item
4Q_
2013_
1Q_
2014_
2Q_
2014_
3Q_
2014_
4Q_
2014_
Net sales, receipts, and operating revenues ………………………………………………………………………………………………………………………………………………………………………………………………………8,094 8,557 9,478 8,713 8,876
Depreciation, depletion, and amortization of property,
plant, and equipment ……………………………………………………………………………………………………………………………………………………………………422 350 364 344 350
All other operating costs and expenses …………………………………………………………………………………………………………………………………………………………………………………………………7,165 7,735 8,203 7,747 8,030
Income (loss) from operations …………………………………………………………………………………………………………………………………………...……………………………………………………………507 472 912 622 496
Interest expense …………………………………………………………………………………………………………………………………………………………………………………………………………………………………………319 336 324 338 464
Dividend income …………………………………………………………………………………………………………………………………………………………………………………………………………………………………………………26 0 1 1 13
Other recurring nonoperating income (expense), including
interest income, royalties, minority interest, etc. ………………………………………………………………………………………………………………………………………………………………………………………………………………………………………………(11) 10 6 6 15
Nonrecurring items, including gain (loss) on sale of assets,
restructuring costs, asset writedowns, etc. …………………………………………………………………………………………………………………………………………………………………(58) (167) (160) (6) (73)
Net income (loss) of foreign branches and equity in earnings (losses)
of domestic and foreign nonconsolidated subsidiaries and other
investments accounted for by the equity method, net of foreign taxes ………………………………………………………………………………………………………………………………………………………………………………………………………………111 1 20 32 60
Income (loss) before income taxes ………………………………………………………………………………………………………………………………………………………………………………………………………257 (19) 455 318 48
Provision for current and deferred domestic income taxes:
a. Federal …………………………………………………………………………………………………………………………………………………………………………………………………………………………………………………(23) 3 141 46 (128)
b. Other …………………………………………………………………………………………………………………………………………………………………………………………………………………………………………………3 7 9 5 5
Income (loss) after income taxes ……………………………………………………………………………………………………………………………………………………………………………………………………276 (29) 305 268 172
Extraordinary gains (losses), net of taxes ……………………………………………………………………………………………………………………………………………………………………………………………………………0 0 0 0 0
Cumulative effect of accounting changes, net of taxes ……………………………………………………………………………………………………………………………………………………………………………………………0 0 0 0 0
Net income (loss) for quarter ………………………………………………………………………………………………………………………………………………………………………………………………………………276 (29) 305 268 172
Cash dividends charged to retained earnings in this quarter ………………………………………………………………………………………………………………………………………………………………………………………114 82 165 267 96
Net income retained in business …………………………………………………………………………………………………………………………………………………………………………………………………………………162 (110) 141 1 76
Retained earnings at beginning of quarter ………………………………………………………………………………………………………………………………………………………………………………………………………………………25 (123) (64) (11) 485
Other direct credits (charges) to retained earnings (net), including
stock and other non-cash dividends, etc. ……………………………………………………………………………………………………………………………………………………………………………………………………………………………18 (8) 1 (80) 23
Retained earnings at end of quarter ………………………………………………………………………………………………………………………………………………………………………………………………………206 (242) 77 (91) 584
INCOME STATEMENT IN RATIO FORMAT
Net sales, receipts, and operating revenues ……………………………………………………………………………………………………………………………………………………………………………………………………………100.00 100.00 100.00 100.00 100.00
Depreciation, depletion, and amortization of property,
plant, and equipment …………………………………………………………………………………………………………………………………………………………………………………5.22 4.09 3.84 3.95 3.94
All other operating costs and expenses ……………………………………………………………………………………………………………………………………………………………………………………………………………………………88.52 90.39 86.54 88.92 90.47
Income (loss) from operations …………………………………………………………………………………………………………………………………………………………………………………………………………………6.26 5.52 9.62 7.14 5.59
Interest expense ………………………………………………………………………………………………………………………………………………………………………………………………………………………………………………3.94 3.93 3.42 3.88 5.22
Dividend income …………………………………………………………………………………………………………………………………………………………………………………………………………………………………………………0.32 0.00 0.01 0.01 0.15
Other recurring nonoperating income (expense), including
interest income, royalties, minority interest, etc. …………………………………………………………………………………………………………………………………………………………………………………………………………………………………………………(0.13) 0.12 0.06 0.07 0.17
Nonrecurring items, including gain (loss) on sale of assets,
restructuring costs, asset writedowns, etc. ………………………………………………………………………………………………………………………………………………………………………………………………………………………………………………………………………………………………………(0.72) (1.95) (1.69) (0.07) (0.82)
Net income (loss) of foreign branches and equity in earnings (losses)
of nonconsolidated subsidiaries, net of foreign taxes …………………………………………………………………………………………………………………………………………………………………………………………………………1.38 0.01 0.22 0.37 0.68
Income (loss) before income taxes …………………………………………………………………………………………………………………………………………………………………………………………………………………3.17 (0.23) 4.80 3.65 0.54
Provision for current and deferred domestic income taxes ………………………………………………………………………………………………………………………………………………………………………………………………………(0.24) 0.11 1.58 0.58 (1.39)
Income (loss) after income taxes ………………………………………………………………………………………………………………………………………………………………………………………………………………………3.41 (0.33) 3.22 3.07 1.93
OPERATING RATIOS
(see explanatory notes)
Annual rate of profit on stockholders' equity at end of period:
Before income taxes …………………………………………………………………………………………………………………………………………………………………………………………………………………………………………13.49 (1.04) 22.71 17.63 2.56
After income taxes …………………………………………………………………………………………………………………………………………………………………………………………………………………………………………14.53 (1.54) 15.22 14.84 9.09
Annual rate of profit on total assets:
Before income taxes …………………………………………………………………………………………………………………………………………………………………………………………………………………………………………2.90 (0.21) 4.87 3.44 0.45
After income taxes ……………………………………………………………………………………………………………………………………………………………………………………………………………………………………………3.12 (0.31) 3.26 2.90 1.59
Table 45.0 -- Income Statement For Corporations in NAICS Manufacturing Subsector 323,
Total Assets $25 Million and Over
See the Survey Methodology section of the Introduction for information on survey design, estimation, and sampling error.
Printing and Related Support Activities
Total Assets $25 Million and Over
(million dollars)
(percent of net sales)
(percent)
90U.S. Census Bureau, Quarterly Financial Report, 2014 Quarter 4

Table with row headers in column A with column headers in rows 5 and 6
Item
4Q_
2013_
1Q_
2014_
2Q_
2014_
3Q_
2014_
4Q_
2014_
ASSETS
Cash and demand deposits in the U.S. ……………………………………………………………………………………………………………………………………………………………………………………………………………………………2,491 1,274 1,329 1,267 1,408
Time deposits in the U.S., including negotiable certificates of deposit …………………………………………………………………………………………………………………………………………………………………………………………191 89 83 90 106
Cash and deposits outside the U.S. .……………………………………………………………………………………………………………………………………………………………………………………………………………………………………………26 18 6 6 6
Total cash on hand and in banks ……………………………………………………………………………………………………………………………………………………………………………………………………………………………2,708 1,381 1,418 1,363 1,520
U.S. Treasury and Federal agency securities:
a. Subject to agreements to sell …………………………………………………………………………………………………………………………………………………………………………………………………………………………………0 0 0 0 0
b. Other, due in 1 year or less ……………………………………………………………………………………………………………………………………………………………………………………………………………………………………0 0 0 0 0
Commercial and finance company paper of U.S. issuers …………………………………………………………………………………………………………………………………………………………………………………………………………0 0 0 0 15
State and local government securities, due in 1 year or less …………………………………………………………………………………………………………………………………………………………………………………………………………57 59 0 0 0
Foreign securities, due in 1 year or less ………………………………………………………………………………………………………………………………………………………………………………………………………………………………0 0 0 0 0
Other short-term financial investments …………………………………………………………………………………………………………………………………………………………………………………………120 98 79 35 37
Total cash, U.S. Government and other securities ……………………………………………………………………………………………………………………………………………………………………………………………………2,885 1,538 1,498 1,399 1,571
Trade receivables from the U.S. Government …………………………………………………………………………………………………………………………………………………………………………………………………………………………2 2 2 2 7
Other trade accounts and trade notes receivable
(less allowance for doubtful accounts) ………………………………………………………………………………………………………………………………………………………………………5,030 5,285 5,290 5,761 5,566
Total receivables ………………………………………………………………………………………………………………………………………………………………………………………………………………………………5,032 5,287 5,292 5,763 5,573
Inventories ……………………………………………………………………………………………………………………………………………………………………………………………………………………………………………………2,605 2,769 2,874 2,870 2,619
All other current assets …………………………………………………………………………………………………………………………………………………………………………………………………………………………………………914 1,037 1,050 900 1,358
Total current assets ……………………………………………………………………………………………………………………………………………………………………………………………………………………………………11,436 10,630 10,714 10,932 11,122
Property, plant, and equipment ……………………………………………………………………………………………………………………………………………………………………………………………………………………………………………19,529 18,329 18,633 18,488 19,996
Land and mineral rights …………………………………………………………………………………………………………………………………………………………………………………………………………………………………………312 256 251 248 255
Less: Accumulated depreciation, depletion, and amortization ………………………………………………………………………………………………………………………………………………………………………………………………12,538 11,820 12,012 11,905 12,870
Net property, plant, and equipment …………………………………………………………………………………………………………………………………………………………………………………………………………………7,303 6,765 6,872 6,832 7,381
U.S. Treasury and Federal agency securities, due in more than 1 year …………………………………………………………………………………………………………………………………………………………………………………………0 0 0 0 0
All other noncurrent assets, including investment in nonconsolidated
entities, long-term investments, intangibles, etc. .………………………………………………………………………………………………………………………………………………………………………………………………………………………………16,728 19,386 19,839 19,176 24,749
Total Assets …………………………………………………………………………………………………………………………………………………………………………………………………………………………………………………35,466 36,781 37,425 36,939 43,252
LIABILITIES AND STOCKHOLDERS' EQUITY
Short-term debt, original maturity of 1 year or less:
a. Loans from banks ………………………………………………………………………………………………………………………………………………………………………………………………………………………………………299 325 278 593 433
b. Commercial paper ………………………………………………………………………………………………………………………………………………………………………………………………………………………………………1 1 1 1 0
c. Other short-term loans ………………………………………………………………………………………………………………………………………………………………………………………………………………………………3 17 16 23 21
Advances and prepayments by the U.S. Government …………………………………………………………………………………………………………………………………………………………………………………………………………0 0 0 0 0
Trade accounts and trade notes payable ………………………………………………………………………………………………………………………………………………………………………………………………………………………2,634 2,882 2,832 2,775 2,603
Income taxes accrued, prior and current years, net of payments:
a. Federal ……………………………………………………………………………………………………………………………………………………………………………………………………………………………………………………37 20 121 100 65
b. Other ………………………………………………………………………………………………………………………………………………………………………………………………………………………………………………1 (7) (6) (8) 0
Current portion of long-term debt, due in 1 year or less:
a. Loans from banks ……………………………………………………………………………………………………………………………………………………………………………………………………………………………………457 424 460 404 392
b. Bonds and debentures …………………………………………………………………………………………………………………………………………………………………………………………………………………………………621 262 271 271 21
c. Other long-term loans ………………………………………………………………………………………………………………………………………………………………………………………………………………………………………340 344 353 356 205
All other current liabilities, including excise and
sales taxes, and accrued expenses ……………………………………………………………………………………………………………………………………………………………………………2,826 3,094 2,820 2,685 3,306
Total current liabilities ………………………………………………………………………………………………………………………………………………………………………………………………………………………………7,219 7,363 7,145 7,200 7,046
Long-term debt, due in more than 1 year:
a. Loans from banks ………………………………………………………………………………………………………………………………………………………………………………………………………………………………………………8,873 9,169 9,694 9,186 11,312
b. Bonds and debentures ………………………………………………………………………………………………………………………………………………………………………………………………………………………………………6,556 7,702 7,441 8,034 11,163
c. Other long-term loans …………………………………………………………………………………………………………………………………………………………………………………………………………………………………………1,434 1,279 1,310 1,542 1,317
All other noncurrent liabilities, including deferred income taxes,
capitalized leases, and minority stockholders' interest
in consolidated domestic corporations ………………………………………………………………………………………………………………………………………………………………………………3,776 3,823 3,815 3,767 4,854
Total liabilities ……………………………………………………………………………………………………………………………………………………………………………………………………………………………………27,857 29,335 29,404 29,729 35,692
Capital stock and other capital …………………………………………………………………………………………………………………………………………………………………………………………………………………………………10,890 10,769 10,739 10,275 10,642
Retained earnings ……………………………………………………………………………………………………………………………………………………………………………………………………………………………………206 (242) 77 (91) 584
Cumulative foreign currency translation adjustment …………………………………………………………………………………………………………………………………………………………………………………………………………(79) (145) (54) (96) (174)
Other stockholders' equity items, including unearned
compensation and ESOP debt guarantees ……………………………………………………………………………………………………………………………………………………………………(1,270) (872) (719) (858) (1,371)
Less: Treasury stock at cost ………………………………………………………………………………………………………………………………………………………………………………………………………………………………………2,137 2,065 2,024 2,020 2,122
Stockholders' equity ………………………………………………………………………………………………………………………………………………………………………………………………………………………………7,609 7,446 8,020 7,210 7,561
Total Liabilities and Stockholders' Equity ……………………………………………………………………………………………………………………………………………………35,466 36,781 37,425 36,939 43,252
NET WORKING CAPITAL
Excess of total current assets over total current liabilities ……………………………………………………………………………………………………………………………………………………………………………4,217 3,268 3,569 3,732 4,076
(million dollars)
Printing and Related Support Activities
Total Assets $25 Million and Over
Table 45.1 -- Balance Sheet For Corporations in NAICS Manufacturing Subsector 323,
Total Assets $25 Million and Over
See the Survey Methodology section of the Introduction for information on survey design, estimation, and sampling error.
91U.S. Census Bureau, Quarterly Financial Report, 2014 Quarter 4

Table with row headers in column A with column headers in rows 5 and 6
Item
4Q_
2013_
1Q_
2014_
2Q_
2014_
3Q_
2014_
4Q_
2014_
Net sales, receipts, and operating revenues ………………………………………………………………………………………………………………………………………………………………………………………………………326,421 323,776 343,962 335,067 270,365
Depreciation, depletion, and amortization of property,
plant, and equipment ……………………………………………………………………………………………………………………………………………………………………7,728 7,511 7,903 8,153 8,686
All other operating costs and expenses …………………………………………………………………………………………………………………………………………………………………………………………………311,970 306,152 325,593 317,023 259,359
Income (loss) from operations …………………………………………………………………………………………………………………………………………...……………………………………………………………6,723 10,113 10,466 9,892 2,321
Interest expense …………………………………………………………………………………………………………………………………………………………………………………………………………………………………………1,765 1,741 1,821 1,680 1,773
Dividend income …………………………………………………………………………………………………………………………………………………………………………………………………………………………………………………60 51 21 58 36
Other recurring nonoperating income (expense), including
interest income, royalties, minority interest, etc. ………………………………………………………………………………………………………………………………………………………………………………………………………………………………………………730 1,097 1,014 895 2,120
Nonrecurring items, including gain (loss) on sale of assets,
restructuring costs, asset writedowns, etc. …………………………………………………………………………………………………………………………………………………………………766 (18) (2,540) 983 (730)
Net income (loss) of foreign branches and equity in earnings (losses)
of domestic and foreign nonconsolidated subsidiaries and other
investments accounted for by the equity method, net of foreign taxes ………………………………………………………………………………………………………………………………………………………………………………………………………………11,221 14,814 15,488 13,476 9,698
Income (loss) before income taxes ………………………………………………………………………………………………………………………………………………………………………………………………………17,736 24,316 22,628 23,623 11,673
Provision for current and deferred domestic income taxes:
a. Federal …………………………………………………………………………………………………………………………………………………………………………………………………………………………………………………(1,117) 3,321 2,517 2,006 (331)
b. Other …………………………………………………………………………………………………………………………………………………………………………………………………………………………………………………368 477 500 608 (1,067)
Income (loss) after income taxes ……………………………………………………………………………………………………………………………………………………………………………………………………18,485 20,517 19,611 21,010 13,071
Extraordinary gains (losses), net of taxes ……………………………………………………………………………………………………………………………………………………………………………………………………………0 0 0 0 0
Cumulative effect of accounting changes, net of taxes ……………………………………………………………………………………………………………………………………………………………………………………………0 0 0 0 0
Net income (loss) for quarter ………………………………………………………………………………………………………………………………………………………………………………………………………………18,485 20,517 19,611 21,010 13,071
Cash dividends charged to retained earnings in this quarter ………………………………………………………………………………………………………………………………………………………………………………………5,919 6,196 6,219 6,509 6,796
Net income retained in business …………………………………………………………………………………………………………………………………………………………………………………………………………………12,566 14,321 13,393 14,501 6,275
Retained earnings at beginning of quarter ………………………………………………………………………………………………………………………………………………………………………………………………………………………685,278 698,305 711,893 724,989 740,448
Other direct credits (charges) to retained earnings (net), including
stock and other non-cash dividends, etc. ……………………………………………………………………………………………………………………………………………………………………………………………………………………………300 (814) (784) (143) (69)
Retained earnings at end of quarter ………………………………………………………………………………………………………………………………………………………………………………………………………698,144 711,812 724,502 739,347 746,654
INCOME STATEMENT IN RATIO FORMAT
Net sales, receipts, and operating revenues ……………………………………………………………………………………………………………………………………………………………………………………………………………100.00 100.00 100.00 100.00 100.00
Depreciation, depletion, and amortization of property,
plant, and equipment …………………………………………………………………………………………………………………………………………………………………………………2.37 2.32 2.30 2.43 3.21
All other operating costs and expenses ……………………………………………………………………………………………………………………………………………………………………………………………………………………………95.57 94.56 94.66 94.61 95.93
Income (loss) from operations …………………………………………………………………………………………………………………………………………………………………………………………………………………2.06 3.12 3.04 2.95 0.86
Interest expense ………………………………………………………………………………………………………………………………………………………………………………………………………………………………………………0.54 0.54 0.53 0.50 0.66
Dividend income …………………………………………………………………………………………………………………………………………………………………………………………………………………………………………………0.02 0.02 0.01 0.02 0.01
Other recurring nonoperating income (expense), including
interest income, royalties, minority interest, etc. …………………………………………………………………………………………………………………………………………………………………………………………………………………………………………………0.22 0.34 0.29 0.27 0.78
Nonrecurring items, including gain (loss) on sale of assets,
restructuring costs, asset writedowns, etc. ………………………………………………………………………………………………………………………………………………………………………………………………………………………………………………………………………………………………………0.23 (0.01) (0.74) 0.29 (0.27)
Net income (loss) of foreign branches and equity in earnings (losses)
of nonconsolidated subsidiaries, net of foreign taxes …………………………………………………………………………………………………………………………………………………………………………………………………………3.44 4.58 4.50 4.02 3.59
Income (loss) before income taxes …………………………………………………………………………………………………………………………………………………………………………………………………………………5.43 7.51 6.58 7.05 4.32
Provision for current and deferred domestic income taxes ………………………………………………………………………………………………………………………………………………………………………………………………………(0.23) 1.17 0.88 0.78 (0.52)
Income (loss) after income taxes ………………………………………………………………………………………………………………………………………………………………………………………………………………………5.66 6.34 5.70 6.27 4.83
OPERATING RATIOS
(see explanatory notes)
Annual rate of profit on stockholders' equity at end of period:
Before income taxes …………………………………………………………………………………………………………………………………………………………………………………………………………………………………………12.58 17.05 15.55 16.05 8.10
After income taxes …………………………………………………………………………………………………………………………………………………………………………………………………………………………………………13.11 14.38 13.48 14.28 9.06
Annual rate of profit on total assets:
Before income taxes …………………………………………………………………………………………………………………………………………………………………………………………………………………………………………6.50 8.80 8.07 8.40 4.20
After income taxes ……………………………………………………………………………………………………………………………………………………………………………………………………………………………………………6.78 7.42 6.99 7.47 4.70
Table 46.0 -- Income Statement For Corporations in NAICS Manufacturing Subsector 324,
Total Assets $25 Million and Over
See the Survey Methodology section of the Introduction for information on survey design, estimation, and sampling error.
Petroleum and Coal Products
Total Assets $25 Million and Over
(million dollars)
(percent of net sales)
(percent)
92U.S. Census Bureau, Quarterly Financial Report, 2014 Quarter 4

Table with row headers in column A with column headers in rows 5 and 6
Item
4Q_
2013_
1Q_
2014_
2Q_
2014_
3Q_
2014_
4Q_
2014_
ASSETS
Cash and demand deposits in the U.S. ……………………………………………………………………………………………………………………………………………………………………………………………………………………………18,396 16,684 16,167 16,484 13,666
Time deposits in the U.S., including negotiable certificates of deposit …………………………………………………………………………………………………………………………………………………………………………………………5,171 2,773 2,299 2,091 1,684
Cash and deposits outside the U.S. .……………………………………………………………………………………………………………………………………………………………………………………………………………………………………………3,809 2,613 2,699 3,474 3,969
Total cash on hand and in banks ……………………………………………………………………………………………………………………………………………………………………………………………………………………………27,377 22,069 21,165 22,049 19,318
U.S. Treasury and Federal agency securities:
a. Subject to agreements to sell …………………………………………………………………………………………………………………………………………………………………………………………………………………………………0 0 0 0 0
b. Other, due in 1 year or less ……………………………………………………………………………………………………………………………………………………………………………………………………………………………………38 32 33 102 899
Commercial and finance company paper of U.S. issuers …………………………………………………………………………………………………………………………………………………………………………………………………………59 23 21 21 25
State and local government securities, due in 1 year or less …………………………………………………………………………………………………………………………………………………………………………………………………………2 19 26 38 31
Foreign securities, due in 1 year or less ………………………………………………………………………………………………………………………………………………………………………………………………………………………………176 296 332 189 65
Other short-term financial investments …………………………………………………………………………………………………………………………………………………………………………………………3,092 3,317 3,586 3,901 3,104
Total cash, U.S. Government and other securities ……………………………………………………………………………………………………………………………………………………………………………………………………30,744 25,756 25,164 26,301 23,442
Trade receivables from the U.S. Government …………………………………………………………………………………………………………………………………………………………………………………………………………………………287 287 316 248 236
Other trade accounts and trade notes receivable
(less allowance for doubtful accounts) ………………………………………………………………………………………………………………………………………………………………………76,674 77,522 79,172 76,166 67,840
Total receivables ………………………………………………………………………………………………………………………………………………………………………………………………………………………………76,961 77,810 79,488 76,413 68,076
Inventories ……………………………………………………………………………………………………………………………………………………………………………………………………………………………………………………45,687 50,769 50,512 49,006 42,476
All other current assets …………………………………………………………………………………………………………………………………………………………………………………………………………………………………………21,892 22,851 23,751 23,196 22,907
Total current assets ……………………………………………………………………………………………………………………………………………………………………………………………………………………………………175,284 177,186 178,915 174,916 156,901
Property, plant, and equipment ……………………………………………………………………………………………………………………………………………………………………………………………………………………………………………573,753 584,317 592,222 602,657 610,491
Land and mineral rights …………………………………………………………………………………………………………………………………………………………………………………………………………………………………………70,921 70,965 70,831 71,772 71,858
Less: Accumulated depreciation, depletion, and amortization ………………………………………………………………………………………………………………………………………………………………………………………………273,375 280,374 286,639 290,170 295,534
Net property, plant, and equipment …………………………………………………………………………………………………………………………………………………………………………………………………………………371,300 374,908 376,415 384,260 386,815
U.S. Treasury and Federal agency securities, due in more than 1 year …………………………………………………………………………………………………………………………………………………………………………………………2 3 3 3 3
All other noncurrent assets, including investment in nonconsolidated
entities, long-term investments, intangibles, etc. .………………………………………………………………………………………………………………………………………………………………………………………………………………………………544,737 553,738 566,226 565,605 568,551
Total Assets …………………………………………………………………………………………………………………………………………………………………………………………………………………………………………………1,091,323 1,105,835 1,121,558 1,124,783 1,112,269
LIABILITIES AND STOCKHOLDERS' EQUITY
Short-term debt, original maturity of 1 year or less:
a. Loans from banks ………………………………………………………………………………………………………………………………………………………………………………………………………………………………………1,935 541 774 451 317
b. Commercial paper ………………………………………………………………………………………………………………………………………………………………………………………………………………………………………20,614 14,990 16,721 20,439 24,911
c. Other short-term loans ………………………………………………………………………………………………………………………………………………………………………………………………………………………………8,992 8,563 9,464 10,712 10,973
Advances and prepayments by the U.S. Government …………………………………………………………………………………………………………………………………………………………………………………………………………0 0 0 0 0
Trade accounts and trade notes payable ………………………………………………………………………………………………………………………………………………………………………………………………………………………81,935 83,515 84,937 81,071 68,709
Income taxes accrued, prior and current years, net of payments:
a. Federal ……………………………………………………………………………………………………………………………………………………………………………………………………………………………………………………3,204 4,661 2,709 4,307 3,399
b. Other ………………………………………………………………………………………………………………………………………………………………………………………………………………………………………………(64) 248 96 429 (107)
Current portion of long-term debt, due in 1 year or less:
a. Loans from banks ……………………………………………………………………………………………………………………………………………………………………………………………………………………………………1,478 931 1,221 941 503
b. Bonds and debentures …………………………………………………………………………………………………………………………………………………………………………………………………………………………………1,372 1,258 1,871 1,932 2,316
c. Other long-term loans ………………………………………………………………………………………………………………………………………………………………………………………………………………………………………6,995 6,847 5,638 5,353 11,057
All other current liabilities, including excise and
sales taxes, and accrued expenses ……………………………………………………………………………………………………………………………………………………………………………60,463 61,069 57,780 55,077 49,735
Total current liabilities ………………………………………………………………………………………………………………………………………………………………………………………………………………………………186,925 182,622 181,211 180,711 171,814
Long-term debt, due in more than 1 year:
a. Loans from banks ………………………………………………………………………………………………………………………………………………………………………………………………………………………………………………5,884 7,970 7,357 7,205 6,992
b. Bonds and debentures ………………………………………………………………………………………………………………………………………………………………………………………………………………………………………62,290 68,206 69,230 71,949 80,411
c. Other long-term loans …………………………………………………………………………………………………………………………………………………………………………………………………………………………………………86,480 89,447 93,082 86,660 80,713
All other noncurrent liabilities, including deferred income taxes,
capitalized leases, and minority stockholders' interest
in consolidated domestic corporations ………………………………………………………………………………………………………………………………………………………………………………185,571 186,978 188,682 189,697 195,561
Total liabilities ……………………………………………………………………………………………………………………………………………………………………………………………………………………………………527,150 535,223 539,563 536,221 535,491
Capital stock and other capital …………………………………………………………………………………………………………………………………………………………………………………………………………………………………143,894 144,733 146,036 146,228 147,292
Retained earnings ……………………………………………………………………………………………………………………………………………………………………………………………………………………………………698,144 711,812 724,502 739,347 746,654
Cumulative foreign currency translation adjustment …………………………………………………………………………………………………………………………………………………………………………………………………………(150) (994) 895 (3,575) (7,152)
Other stockholders' equity items, including unearned
compensation and ESOP debt guarantees ……………………………………………………………………………………………………………………………………………………………………(3,844) (2,849) (2,154) (583) (10,610)
Less: Treasury stock at cost ………………………………………………………………………………………………………………………………………………………………………………………………………………………………………273,871 282,089 287,285 292,856 299,404
Stockholders' equity ………………………………………………………………………………………………………………………………………………………………………………………………………………………………564,173 570,612 581,995 588,562 576,778
Total Liabilities and Stockholders' Equity ……………………………………………………………………………………………………………………………………………………1,091,323 1,105,835 1,121,558 1,124,783 1,112,269
NET WORKING CAPITAL
Excess of total current assets over total current liabilities ……………………………………………………………………………………………………………………………………………………………………………(11,641) (5,436) (2,296) (5,795) (14,913)
(million dollars)
Petroleum and Coal Products
Total Assets $25 Million and Over
Table 46.1 -- Balance Sheet For Corporations in NAICS Manufacturing Subsector 324,
Total Assets $25 Million and Over
See the Survey Methodology section of the Introduction for information on survey design, estimation, and sampling error.
93U.S. Census Bureau, Quarterly Financial Report, 2014 Quarter 4

Table with row headers in column A with column headers in rows 5 and 6
Item
4Q_
2013_
1Q_
2014_
2Q_
2014_
3Q_
2014_
4Q_
2014_
Net sales, receipts, and operating revenues ………………………………………………………………………………………………………………………………………………………………………………………………………203,461 206,696 224,078 214,501 215,365
Depreciation, depletion, and amortization of property,
plant, and equipment ……………………………………………………………………………………………………………………………………………………………………6,749 6,553 6,593 6,735 6,905
All other operating costs and expenses …………………………………………………………………………………………………………………………………………………………………………………………………174,177 174,543 185,434 181,055 185,330
Income (loss) from operations …………………………………………………………………………………………………………………………………………...……………………………………………………………22,535 25,600 32,050 26,710 23,130
Interest expense …………………………………………………………………………………………………………………………………………………………………………………………………………………………………………7,113 6,872 6,926 7,170 7,352
Dividend income …………………………………………………………………………………………………………………………………………………………………………………………………………………………………………………1,668 618 1,021 820 1,007
Other recurring nonoperating income (expense), including
interest income, royalties, minority interest, etc. ………………………………………………………………………………………………………………………………………………………………………………………………………………………………………………3,822 3,201 3,592 3,083 2,307
Nonrecurring items, including gain (loss) on sale of assets,
restructuring costs, asset writedowns, etc. …………………………………………………………………………………………………………………………………………………………………(5,133) (161) (2,073) (564) 3,540
Net income (loss) of foreign branches and equity in earnings (losses)
of domestic and foreign nonconsolidated subsidiaries and other
investments accounted for by the equity method, net of foreign taxes ………………………………………………………………………………………………………………………………………………………………………………………………………………12,701 14,630 15,588 17,139 15,148
Income (loss) before income taxes ………………………………………………………………………………………………………………………………………………………………………………………………………28,478 37,016 43,252 40,019 37,780
Provision for current and deferred domestic income taxes:
a. Federal …………………………………………………………………………………………………………………………………………………………………………………………………………………………………………………3,490 6,160 8,649 7,826 7,998
b. Other …………………………………………………………………………………………………………………………………………………………………………………………………………………………………………………893 456 977 828 695
Income (loss) after income taxes ……………………………………………………………………………………………………………………………………………………………………………………………………24,095 30,400 33,627 31,366 29,087
Extraordinary gains (losses), net of taxes ……………………………………………………………………………………………………………………………………………………………………………………………………………0 0 0 0 0
Cumulative effect of accounting changes, net of taxes ……………………………………………………………………………………………………………………………………………………………………………………………0 0 0 0 0
Net income (loss) for quarter ………………………………………………………………………………………………………………………………………………………………………………………………………………24,095 30,400 33,627 31,366 29,087
Cash dividends charged to retained earnings in this quarter ………………………………………………………………………………………………………………………………………………………………………………………16,257 12,935 15,975 13,752 17,806
Net income retained in business …………………………………………………………………………………………………………………………………………………………………………………………………………………7,838 17,464 17,652 17,613 11,281
Retained earnings at beginning of quarter ………………………………………………………………………………………………………………………………………………………………………………………………………………………554,700 560,762 572,668 576,283 590,787
Other direct credits (charges) to retained earnings (net), including
stock and other non-cash dividends, etc. ……………………………………………………………………………………………………………………………………………………………………………………………………………………………(1,566) (3,688) (3,611) (3,466) (5,744)
Retained earnings at end of quarter ………………………………………………………………………………………………………………………………………………………………………………………………………560,973 574,538 586,709 590,431 596,324
INCOME STATEMENT IN RATIO FORMAT
Net sales, receipts, and operating revenues ……………………………………………………………………………………………………………………………………………………………………………………………………………100.00 100.00 100.00 100.00 100.00
Depreciation, depletion, and amortization of property,
plant, and equipment …………………………………………………………………………………………………………………………………………………………………………………3.32 3.17 2.94 3.14 3.21
All other operating costs and expenses ……………………………………………………………………………………………………………………………………………………………………………………………………………………………85.61 84.44 82.75 84.41 86.05
Income (loss) from operations …………………………………………………………………………………………………………………………………………………………………………………………………………………11.08 12.39 14.30 12.45 10.74
Interest expense ………………………………………………………………………………………………………………………………………………………………………………………………………………………………………………3.50 3.32 3.09 3.34 3.41
Dividend income …………………………………………………………………………………………………………………………………………………………………………………………………………………………………………………0.82 0.30 0.46 0.38 0.47
Other recurring nonoperating income (expense), including
interest income, royalties, minority interest, etc. …………………………………………………………………………………………………………………………………………………………………………………………………………………………………………………1.88 1.55 1.60 1.44 1.07
Nonrecurring items, including gain (loss) on sale of assets,
restructuring costs, asset writedowns, etc. ………………………………………………………………………………………………………………………………………………………………………………………………………………………………………………………………………………………………………(2.52) (0.08) (0.93) (0.26) 1.64
Net income (loss) of foreign branches and equity in earnings (losses)
of nonconsolidated subsidiaries, net of foreign taxes …………………………………………………………………………………………………………………………………………………………………………………………………………6.24 7.08 6.96 7.99 7.03
Income (loss) before income taxes …………………………………………………………………………………………………………………………………………………………………………………………………………………14.00 17.91 19.30 18.66 17.54
Provision for current and deferred domestic income taxes ………………………………………………………………………………………………………………………………………………………………………………………………………2.15 3.20 4.30 4.03 4.04
Income (loss) after income taxes ………………………………………………………………………………………………………………………………………………………………………………………………………………………11.84 14.71 15.01 14.62 13.51
OPERATING RATIOS
(see explanatory notes)
Annual rate of profit on stockholders' equity at end of period:
Before income taxes …………………………………………………………………………………………………………………………………………………………………………………………………………………………………………14.91 19.15 22.17 20.25 19.47
After income taxes …………………………………………………………………………………………………………………………………………………………………………………………………………………………………………12.62 15.73 17.23 15.87 14.99
Annual rate of profit on total assets:
Before income taxes …………………………………………………………………………………………………………………………………………………………………………………………………………………………………………6.17 7.95 9.24 8.42 7.84
After income taxes ……………………………………………………………………………………………………………………………………………………………………………………………………………………………………………5.22 6.53 7.19 6.60 6.03
Table 47.0 -- Income Statement For Corporations in NAICS Manufacturing Subsector 325,
Total Assets $25 Million and Over
See the Survey Methodology section of the Introduction for information on survey design, estimation, and sampling error.
Chemicals
Total Assets $25 Million and Over
(million dollars)
(percent of net sales)
(percent)
94U.S. Census Bureau, Quarterly Financial Report, 2014 Quarter 4

Table with row headers in column A with column headers in rows 5 and 6
Item
4Q_
2013_
1Q_
2014_
2Q_
2014_
3Q_
2014_
4Q_
2014_
ASSETS
Cash and demand deposits in the U.S. ……………………………………………………………………………………………………………………………………………………………………………………………………………………………54,528 44,094 45,850 44,014 59,650
Time deposits in the U.S., including negotiable certificates of deposit …………………………………………………………………………………………………………………………………………………………………………………………17,934 15,188 11,553 13,666 14,693
Cash and deposits outside the U.S. .……………………………………………………………………………………………………………………………………………………………………………………………………………………………………………8,404 7,634 9,063 9,388 7,955
Total cash on hand and in banks ……………………………………………………………………………………………………………………………………………………………………………………………………………………………80,866 66,916 66,465 67,069 82,297
U.S. Treasury and Federal agency securities:
a. Subject to agreements to sell …………………………………………………………………………………………………………………………………………………………………………………………………………………………………3,021 3,567 4,473 4,163 4,100
b. Other, due in 1 year or less ……………………………………………………………………………………………………………………………………………………………………………………………………………………………………2,928 4,335 3,174 3,926 2,359
Commercial and finance company paper of U.S. issuers …………………………………………………………………………………………………………………………………………………………………………………………………………1,428 2,205 1,842 1,991 2,252
State and local government securities, due in 1 year or less …………………………………………………………………………………………………………………………………………………………………………………………………………93 94 110 95 93
Foreign securities, due in 1 year or less ………………………………………………………………………………………………………………………………………………………………………………………………………………………………166 306 588 516 85
Other short-term financial investments …………………………………………………………………………………………………………………………………………………………………………………………8,463 11,091 9,796 16,340 6,619
Total cash, U.S. Government and other securities ……………………………………………………………………………………………………………………………………………………………………………………………………96,965 88,514 86,448 94,100 97,805
Trade receivables from the U.S. Government …………………………………………………………………………………………………………………………………………………………………………………………………………………………87 82 279 305 397
Other trade accounts and trade notes receivable
(less allowance for doubtful accounts) ………………………………………………………………………………………………………………………………………………………………………104,975 110,893 121,773 118,313 119,299
Total receivables ………………………………………………………………………………………………………………………………………………………………………………………………………………………………105,061 110,975 122,052 118,618 119,695
Inventories ……………………………………………………………………………………………………………………………………………………………………………………………………………………………………………………107,280 110,684 107,617 107,738 108,713
All other current assets …………………………………………………………………………………………………………………………………………………………………………………………………………………………………………98,639 106,952 103,204 105,669 105,063
Total current assets ……………………………………………………………………………………………………………………………………………………………………………………………………………………………………407,945 417,125 419,321 426,126 431,276
Property, plant, and equipment ……………………………………………………………………………………………………………………………………………………………………………………………………………………………………………479,864 481,348 487,744 493,088 500,990
Land and mineral rights …………………………………………………………………………………………………………………………………………………………………………………………………………………………………………16,693 17,089 17,000 17,030 16,991
Less: Accumulated depreciation, depletion, and amortization ………………………………………………………………………………………………………………………………………………………………………………………………265,676 266,855 270,640 273,841 277,940
Net property, plant, and equipment …………………………………………………………………………………………………………………………………………………………………………………………………………………230,881 231,582 234,105 236,277 240,042
U.S. Treasury and Federal agency securities, due in more than 1 year …………………………………………………………………………………………………………………………………………………………………………………………764 852 1,112 1,205 1,061
All other noncurrent assets, including investment in nonconsolidated
entities, long-term investments, intangibles, etc. .………………………………………………………………………………………………………………………………………………………………………………………………………………………………1,207,146 1,212,603 1,217,294 1,236,613 1,256,220
Total Assets …………………………………………………………………………………………………………………………………………………………………………………………………………………………………………………1,846,736 1,862,162 1,871,832 1,900,221 1,928,599
LIABILITIES AND STOCKHOLDERS' EQUITY
Short-term debt, original maturity of 1 year or less:
a. Loans from banks ………………………………………………………………………………………………………………………………………………………………………………………………………………………………………6,627 6,828 5,785 5,826 6,359
b. Commercial paper ………………………………………………………………………………………………………………………………………………………………………………………………………………………………………21,444 25,572 16,357 22,096 15,969
c. Other short-term loans ………………………………………………………………………………………………………………………………………………………………………………………………………………………………28,024 30,424 25,818 34,238 35,307
Advances and prepayments by the U.S. Government …………………………………………………………………………………………………………………………………………………………………………………………………………0 0 0 0 0
Trade accounts and trade notes payable ………………………………………………………………………………………………………………………………………………………………………………………………………………………88,176 87,737 86,790 85,124 89,604
Income taxes accrued, prior and current years, net of payments:
a. Federal ……………………………………………………………………………………………………………………………………………………………………………………………………………………………………………………8,714 9,316 9,417 11,929 9,316
b. Other ………………………………………………………………………………………………………………………………………………………………………………………………………………………………………………1,466 1,305 1,614 1,527 1,206
Current portion of long-term debt, due in 1 year or less:
a. Loans from banks ……………………………………………………………………………………………………………………………………………………………………………………………………………………………………3,737 4,428 4,082 4,787 6,161
b. Bonds and debentures …………………………………………………………………………………………………………………………………………………………………………………………………………………………………30,759 27,930 27,444 23,988 22,434
c. Other long-term loans ………………………………………………………………………………………………………………………………………………………………………………………………………………………………………13,136 19,340 17,997 19,092 14,489
All other current liabilities, including excise and
sales taxes, and accrued expenses ……………………………………………………………………………………………………………………………………………………………………………155,311 144,310 148,087 150,496 159,671
Total current liabilities ………………………………………………………………………………………………………………………………………………………………………………………………………………………………357,395 357,188 343,390 359,101 360,516
Long-term debt, due in more than 1 year:
a. Loans from banks ………………………………………………………………………………………………………………………………………………………………………………………………………………………………………………75,718 76,129 77,068 77,553 80,411
b. Bonds and debentures ………………………………………………………………………………………………………………………………………………………………………………………………………………………………………263,273 273,676 278,153 277,779 295,664
c. Other long-term loans …………………………………………………………………………………………………………………………………………………………………………………………………………………………………………155,691 154,703 167,714 166,500 166,061
All other noncurrent liabilities, including deferred income taxes,
capitalized leases, and minority stockholders' interest
in consolidated domestic corporations ………………………………………………………………………………………………………………………………………………………………………………230,743 227,243 225,014 228,803 249,905
Total liabilities ……………………………………………………………………………………………………………………………………………………………………………………………………………………………………1,082,820 1,088,939 1,091,340 1,109,736 1,152,557
Capital stock and other capital …………………………………………………………………………………………………………………………………………………………………………………………………………………………………570,006 570,947 576,839 593,503 614,585
Retained earnings ……………………………………………………………………………………………………………………………………………………………………………………………………………………………………560,973 574,538 586,709 590,431 596,324
Cumulative foreign currency translation adjustment …………………………………………………………………………………………………………………………………………………………………………………………………………(11,892) (12,931) (14,389) (23,256) (34,398)
Other stockholders' equity items, including unearned
compensation and ESOP debt guarantees ……………………………………………………………………………………………………………………………………………………………………(41,449) (40,354) (41,911) (39,731) (57,492)
Less: Treasury stock at cost ………………………………………………………………………………………………………………………………………………………………………………………………………………………………………313,720 318,978 326,756 330,461 342,978
Stockholders' equity ………………………………………………………………………………………………………………………………………………………………………………………………………………………………763,916 773,223 780,492 790,485 776,042
Total Liabilities and Stockholders' Equity ……………………………………………………………………………………………………………………………………………………1,846,736 1,862,162 1,871,832 1,900,221 1,928,599
NET WORKING CAPITAL
Excess of total current assets over total current liabilities ……………………………………………………………………………………………………………………………………………………………………………50,550 59,937 75,931 67,024 70,761
(million dollars)
Chemicals
Total Assets $25 Million and Over
Table 47.1 -- Balance Sheet For Corporations in NAICS Manufacturing Subsector 325,
Total Assets $25 Million and Over
See the Survey Methodology section of the Introduction for information on survey design, estimation, and sampling error.
95U.S. Census Bureau, Quarterly Financial Report, 2014 Quarter 4

Table with row headers in column A with column headers in rows 5 and 6
Item
4Q_
2013_
1Q_
2014_
2Q_
2014_
3Q_
2014_
4Q_
2014_
Net sales, receipts, and operating revenues ………………………………………………………………………………………………………………………………………………………………………………………………………69,129 73,091 75,186 72,594 68,490
Depreciation, depletion, and amortization of property,
plant, and equipment ……………………………………………………………………………………………………………………………………………………………………2,753 2,577 2,586 2,683 2,642
All other operating costs and expenses …………………………………………………………………………………………………………………………………………………………………………………………………62,288 63,835 65,608 63,608 61,842
Income (loss) from operations …………………………………………………………………………………………………………………………………………...……………………………………………………………4,088 6,679 6,992 6,303 4,006
Interest expense …………………………………………………………………………………………………………………………………………………………………………………………………………………………………………1,759 1,654 1,662 1,788 1,863
Dividend income …………………………………………………………………………………………………………………………………………………………………………………………………………………………………………………688 204 331 154 373
Other recurring nonoperating income (expense), including
interest income, royalties, minority interest, etc. ………………………………………………………………………………………………………………………………………………………………………………………………………………………………………………179 280 209 181 388
Nonrecurring items, including gain (loss) on sale of assets,
restructuring costs, asset writedowns, etc. …………………………………………………………………………………………………………………………………………………………………(2,557) (211) (521) (311) (3,586)
Net income (loss) of foreign branches and equity in earnings (losses)
of domestic and foreign nonconsolidated subsidiaries and other
investments accounted for by the equity method, net of foreign taxes ………………………………………………………………………………………………………………………………………………………………………………………………………………3,055 2,347 2,932 2,913 2,398
Income (loss) before income taxes ………………………………………………………………………………………………………………………………………………………………………………………………………3,694 7,645 8,282 7,453 1,717
Provision for current and deferred domestic income taxes:
a. Federal …………………………………………………………………………………………………………………………………………………………………………………………………………………………………………………1,225 1,948 2,191 1,684 145
b. Other …………………………………………………………………………………………………………………………………………………………………………………………………………………………………………………89 169 138 90 32
Income (loss) after income taxes ……………………………………………………………………………………………………………………………………………………………………………………………………2,380 5,529 5,953 5,679 1,540
Extraordinary gains (losses), net of taxes ……………………………………………………………………………………………………………………………………………………………………………………………………………0 0 0 0 0
Cumulative effect of accounting changes, net of taxes ……………………………………………………………………………………………………………………………………………………………………………………………0 0 0 0 0
Net income (loss) for quarter ………………………………………………………………………………………………………………………………………………………………………………………………………………2,380 5,529 5,953 5,679 1,540
Cash dividends charged to retained earnings in this quarter ………………………………………………………………………………………………………………………………………………………………………………………1,958 1,742 2,137 4,276 2,188
Net income retained in business …………………………………………………………………………………………………………………………………………………………………………………………………………………422 3,787 3,817 1,403 (648)
Retained earnings at beginning of quarter ………………………………………………………………………………………………………………………………………………………………………………………………………………………72,662 73,856 75,127 78,366 79,669
Other direct credits (charges) to retained earnings (net), including
stock and other non-cash dividends, etc. ……………………………………………………………………………………………………………………………………………………………………………………………………………………………313 (1,975) (1,008) (692) (529)
Retained earnings at end of quarter ………………………………………………………………………………………………………………………………………………………………………………………………………73,398 75,668 77,936 79,077 78,492
INCOME STATEMENT IN RATIO FORMAT
Net sales, receipts, and operating revenues ……………………………………………………………………………………………………………………………………………………………………………………………………………100.00 100.00 100.00 100.00 100.00
Depreciation, depletion, and amortization of property,
plant, and equipment …………………………………………………………………………………………………………………………………………………………………………………3.98 3.53 3.44 3.70 3.86
All other operating costs and expenses ……………………………………………………………………………………………………………………………………………………………………………………………………………………………90.10 87.34 87.26 87.62 90.29
Income (loss) from operations …………………………………………………………………………………………………………………………………………………………………………………………………………………5.91 9.14 9.30 8.68 5.85
Interest expense ………………………………………………………………………………………………………………………………………………………………………………………………………………………………………………2.54 2.26 2.21 2.46 2.72
Dividend income …………………………………………………………………………………………………………………………………………………………………………………………………………………………………………………1.00 0.28 0.44 0.21 0.55
Other recurring nonoperating income (expense), including
interest income, royalties, minority interest, etc. …………………………………………………………………………………………………………………………………………………………………………………………………………………………………………………0.26 0.38 0.28 0.25 0.57
Nonrecurring items, including gain (loss) on sale of assets,
restructuring costs, asset writedowns, etc. ………………………………………………………………………………………………………………………………………………………………………………………………………………………………………………………………………………………………………(3.70) (0.29) (0.69) (0.43) (5.24)
Net income (loss) of foreign branches and equity in earnings (losses)
of nonconsolidated subsidiaries, net of foreign taxes …………………………………………………………………………………………………………………………………………………………………………………………………………4.42 3.21 3.90 4.01 3.50
Income (loss) before income taxes …………………………………………………………………………………………………………………………………………………………………………………………………………………5.34 10.46 11.02 10.27 2.51
Provision for current and deferred domestic income taxes ………………………………………………………………………………………………………………………………………………………………………………………………………1.90 2.90 3.10 2.44 0.26
Income (loss) after income taxes ………………………………………………………………………………………………………………………………………………………………………………………………………………………3.44 7.56 7.92 7.82 2.25
OPERATING RATIOS
(see explanatory notes)
Annual rate of profit on stockholders' equity at end of period:
Before income taxes …………………………………………………………………………………………………………………………………………………………………………………………………………………………………………11.89 24.30 25.79 23.66 5.82
After income taxes …………………………………………………………………………………………………………………………………………………………………………………………………………………………………………7.66 17.57 18.54 18.03 5.22
Annual rate of profit on total assets:
Before income taxes …………………………………………………………………………………………………………………………………………………………………………………………………………………………………………3.68 7.61 8.16 7.19 1.63
After income taxes ……………………………………………………………………………………………………………………………………………………………………………………………………………………………………………2.37 5.51 5.87 5.48 1.46
1 Included in Chemicals.
Table 48.0 -- Income Statement For Corporations in NAICS Manufacturing Industry Groups 3251 and 3252,
Total Assets $25 Million and Over
See the Survey Methodology section of the Introduction for information on survey design, estimation, and sampling error.
Basic Chemicals, Resins, and Synthetics
Total Assets $25 Million and Over 1
(million dollars)
(percent of net sales)
(percent)
96U.S. Census Bureau, Quarterly Financial Report, 2014 Quarter 4

Table with row headers in column A with column headers in rows 5 and 6
Item
4Q_
2013_
1Q_
2014_
2Q_
2014_
3Q_
2014_
4Q_
2014_
ASSETS
Cash and demand deposits in the U.S. ……………………………………………………………………………………………………………………………………………………………………………………………………………………………17,737 12,534 12,270 13,982 17,897
Time deposits in the U.S., including negotiable certificates of deposit …………………………………………………………………………………………………………………………………………………………………………………………3,897 2,922 1,841 3,435 2,171
Cash and deposits outside the U.S. .……………………………………………………………………………………………………………………………………………………………………………………………………………………………………………275 175 202 270 311
Total cash on hand and in banks ……………………………………………………………………………………………………………………………………………………………………………………………………………………………21,909 15,631 14,314 17,687 20,379
U.S. Treasury and Federal agency securities:
a. Subject to agreements to sell …………………………………………………………………………………………………………………………………………………………………………………………………………………………………0 0 0 0 0
b. Other, due in 1 year or less ……………………………………………………………………………………………………………………………………………………………………………………………………………………………………0 0 0 0 0
Commercial and finance company paper of U.S. issuers …………………………………………………………………………………………………………………………………………………………………………………………………………405 447 684 699 860
State and local government securities, due in 1 year or less …………………………………………………………………………………………………………………………………………………………………………………………………………0 0 0 0 0
Foreign securities, due in 1 year or less ………………………………………………………………………………………………………………………………………………………………………………………………………………………………0 0 0 0 0
Other short-term financial investments …………………………………………………………………………………………………………………………………………………………………………………………343 415 458 8,214 611
Total cash, U.S. Government and other securities ……………………………………………………………………………………………………………………………………………………………………………………………………22,658 16,493 15,456 26,601 21,851
Trade receivables from the U.S. Government …………………………………………………………………………………………………………………………………………………………………………………………………………………………51 25 23 28 28
Other trade accounts and trade notes receivable
(less allowance for doubtful accounts) ………………………………………………………………………………………………………………………………………………………………………34,688 37,465 39,783 38,521 36,909
Total receivables ………………………………………………………………………………………………………………………………………………………………………………………………………………………………34,739 37,490 39,806 38,549 36,937
Inventories ……………………………………………………………………………………………………………………………………………………………………………………………………………………………………………………36,191 36,542 35,517 35,746 36,188
All other current assets …………………………………………………………………………………………………………………………………………………………………………………………………………………………………………24,324 25,481 25,704 25,849 25,237
Total current assets ……………………………………………………………………………………………………………………………………………………………………………………………………………………………………117,912 116,005 116,482 126,744 120,213
Property, plant, and equipment ……………………………………………………………………………………………………………………………………………………………………………………………………………………………………………225,235 227,828 231,047 232,910 235,363
Land and mineral rights …………………………………………………………………………………………………………………………………………………………………………………………………………………………………………8,138 8,222 8,168 8,096 8,060
Less: Accumulated depreciation, depletion, and amortization ………………………………………………………………………………………………………………………………………………………………………………………………126,530 128,883 130,581 131,796 135,107
Net property, plant, and equipment …………………………………………………………………………………………………………………………………………………………………………………………………………………106,843 107,167 108,634 109,210 108,316
U.S. Treasury and Federal agency securities, due in more than 1 year …………………………………………………………………………………………………………………………………………………………………………………………0 0 0 0 0
All other noncurrent assets, including investment in nonconsolidated
entities, long-term investments, intangibles, etc. .………………………………………………………………………………………………………………………………………………………………………………………………………………………………177,214 178,446 180,674 178,850 192,910
Total Assets …………………………………………………………………………………………………………………………………………………………………………………………………………………………………………………401,969 401,618 405,790 414,805 421,440
LIABILITIES AND STOCKHOLDERS' EQUITY
Short-term debt, original maturity of 1 year or less:
a. Loans from banks ………………………………………………………………………………………………………………………………………………………………………………………………………………………………………1,893 1,777 1,413 1,411 1,590
b. Commercial paper ………………………………………………………………………………………………………………………………………………………………………………………………………………………………………1,735 1,565 2,533 3,879 1,418
c. Other short-term loans ………………………………………………………………………………………………………………………………………………………………………………………………………………………………17,592 17,697 17,687 26,516 27,795
Advances and prepayments by the U.S. Government …………………………………………………………………………………………………………………………………………………………………………………………………………0 0 0 0 0
Trade accounts and trade notes payable ………………………………………………………………………………………………………………………………………………………………………………………………………………………29,174 28,310 28,126 27,692 28,937
Income taxes accrued, prior and current years, net of payments:
a. Federal ……………………………………………………………………………………………………………………………………………………………………………………………………………………………………………………7,340 7,857 8,034 7,662 6,766
b. Other ………………………………………………………………………………………………………………………………………………………………………………………………………………………………………………296 324 303 352 268
Current portion of long-term debt, due in 1 year or less:
a. Loans from banks ……………………………………………………………………………………………………………………………………………………………………………………………………………………………………1,089 946 804 1,458 1,810
b. Bonds and debentures …………………………………………………………………………………………………………………………………………………………………………………………………………………………………728 735 598 512 624
c. Other long-term loans ………………………………………………………………………………………………………………………………………………………………………………………………………………………………………7,606 10,717 9,852 10,594 7,242
All other current liabilities, including excise and
sales taxes, and accrued expenses ……………………………………………………………………………………………………………………………………………………………………………33,107 29,312 28,706 29,213 31,735
Total current liabilities ………………………………………………………………………………………………………………………………………………………………………………………………………………………………100,559 99,238 98,055 109,291 108,185
Long-term debt, due in more than 1 year:
a. Loans from banks ………………………………………………………………………………………………………………………………………………………………………………………………………………………………………………22,995 23,079 22,838 21,838 23,410
b. Bonds and debentures ………………………………………………………………………………………………………………………………………………………………………………………………………………………………………54,130 53,397 53,496 55,035 64,291
c. Other long-term loans …………………………………………………………………………………………………………………………………………………………………………………………………………………………………………41,419 38,743 41,058 41,079 38,407
All other noncurrent liabilities, including deferred income taxes,
capitalized leases, and minority stockholders' interest
in consolidated domestic corporations ………………………………………………………………………………………………………………………………………………………………………………58,585 61,306 61,877 61,550 69,206
Total liabilities ……………………………………………………………………………………………………………………………………………………………………………………………………………………………………277,688 275,763 277,325 288,792 303,499
Capital stock and other capital …………………………………………………………………………………………………………………………………………………………………………………………………………………………………93,992 95,544 97,429 97,147 97,040
Retained earnings ……………………………………………………………………………………………………………………………………………………………………………………………………………………………………73,398 75,668 77,936 79,077 78,492
Cumulative foreign currency translation adjustment …………………………………………………………………………………………………………………………………………………………………………………………………………(1,521) (1,886) (2,363) (4,347) (5,309)
Other stockholders' equity items, including unearned
compensation and ESOP debt guarantees ……………………………………………………………………………………………………………………………………………………………………(17,415) (17,446) (17,219) (17,475) (22,432)
Less: Treasury stock at cost ………………………………………………………………………………………………………………………………………………………………………………………………………………………………………24,173 26,026 27,318 28,389 29,850
Stockholders' equity ………………………………………………………………………………………………………………………………………………………………………………………………………………………………124,281 125,855 128,465 126,013 117,941
Total Liabilities and Stockholders' Equity ……………………………………………………………………………………………………………………………………………………401,969 401,618 405,790 414,805 421,440
NET WORKING CAPITAL
Excess of total current assets over total current liabilities ……………………………………………………………………………………………………………………………………………………………………………17,353 16,768 18,428 17,454 12,029
(million dollars)
Basic Chemicals, Resins, and Synthetics
Total Assets $25 Million and Over 1
1 Included in Chemicals.
Table 48.1 -- Balance Sheet For Corporations in NAICS Manufacturing Industry Groups 3251 and 3252,
Total Assets $25 Million and Over
See the Survey Methodology section of the Introduction for information on survey design, estimation, and sampling error.
97U.S. Census Bureau, Quarterly Financial Report, 2014 Quarter 4

Table with row headers in column A with column headers in rows 5 and 6
Item
4Q_
2013_
1Q_
2014_
2Q_
2014_
3Q_
2014_
4Q_
2014_
Net sales, receipts, and operating revenues ………………………………………………………………………………………………………………………………………………………………………………………………………85,233 82,136 90,923 91,725 96,651
Depreciation, depletion, and amortization of property,
plant, and equipment ……………………………………………………………………………………………………………………………………………………………………2,331 2,302 2,307 2,343 2,450
All other operating costs and expenses …………………………………………………………………………………………………………………………………………………………………………………………………70,926 68,962 72,309 74,932 81,026
Income (loss) from operations …………………………………………………………………………………………………………………………………………...……………………………………………………………11,977 10,872 16,307 14,450 13,175
Interest expense …………………………………………………………………………………………………………………………………………………………………………………………………………………………………………3,876 3,751 3,976 4,081 4,102
Dividend income …………………………………………………………………………………………………………………………………………………………………………………………………………………………………………………72 1 1 195 4
Other recurring nonoperating income (expense), including
interest income, royalties, minority interest, etc. ………………………………………………………………………………………………………………………………………………………………………………………………………………………………………………3,521 2,729 3,351 3,099 2,742
Nonrecurring items, including gain (loss) on sale of assets,
restructuring costs, asset writedowns, etc. …………………………………………………………………………………………………………………………………………………………………(3,374) (1,452) (1,168) (100) 6,508
Net income (loss) of foreign branches and equity in earnings (losses)
of domestic and foreign nonconsolidated subsidiaries and other
investments accounted for by the equity method, net of foreign taxes ………………………………………………………………………………………………………………………………………………………………………………………………………………5,729 9,149 9,892 10,695 9,192
Income (loss) before income taxes ………………………………………………………………………………………………………………………………………………………………………………………………………14,050 17,547 24,407 24,258 27,519
Provision for current and deferred domestic income taxes:
a. Federal …………………………………………………………………………………………………………………………………………………………………………………………………………………………………………………147 1,527 3,740 4,370 6,005
b. Other …………………………………………………………………………………………………………………………………………………………………………………………………………………………………………………511 (106) 390 514 340
Income (loss) after income taxes ……………………………………………………………………………………………………………………………………………………………………………………………………13,392 16,126 20,278 19,373 21,173
Extraordinary gains (losses), net of taxes ……………………………………………………………………………………………………………………………………………………………………………………………………………0 0 0 0 0
Cumulative effect of accounting changes, net of taxes ……………………………………………………………………………………………………………………………………………………………………………………………0 0 0 0 0
Net income (loss) for quarter ………………………………………………………………………………………………………………………………………………………………………………………………………………13,392 16,126 20,278 19,373 21,173
Cash dividends charged to retained earnings in this quarter ………………………………………………………………………………………………………………………………………………………………………………………11,226 6,003 10,187 6,175 12,245
Net income retained in business …………………………………………………………………………………………………………………………………………………………………………………………………………………2,166 10,123 10,091 13,197 8,928
Retained earnings at beginning of quarter ………………………………………………………………………………………………………………………………………………………………………………………………………………………289,887 290,514 298,421 296,336 307,381
Other direct credits (charges) to retained earnings (net), including
stock and other non-cash dividends, etc. ……………………………………………………………………………………………………………………………………………………………………………………………………………………………(627) (1,353) (1,425) (2,779) (3,755)
Retained earnings at end of quarter ………………………………………………………………………………………………………………………………………………………………………………………………………291,426 299,284 307,086 306,755 312,553
INCOME STATEMENT IN RATIO FORMAT
Net sales, receipts, and operating revenues ……………………………………………………………………………………………………………………………………………………………………………………………………………100.00 100.00 100.00 100.00 100.00
Depreciation, depletion, and amortization of property,
plant, and equipment …………………………………………………………………………………………………………………………………………………………………………………2.73 2.80 2.54 2.55 2.53
All other operating costs and expenses ……………………………………………………………………………………………………………………………………………………………………………………………………………………………83.21 83.96 79.53 81.69 83.83
Income (loss) from operations …………………………………………………………………………………………………………………………………………………………………………………………………………………14.05 13.24 17.93 15.75 13.63
Interest expense ………………………………………………………………………………………………………………………………………………………………………………………………………………………………………………4.55 4.57 4.37 4.45 4.24
Dividend income …………………………………………………………………………………………………………………………………………………………………………………………………………………………………………………0.08 0.00 0.00 0.21 0.00
Other recurring nonoperating income (expense), including
interest income, royalties, minority interest, etc. …………………………………………………………………………………………………………………………………………………………………………………………………………………………………………………4.13 3.32 3.69 3.38 2.84
Nonrecurring items, including gain (loss) on sale of assets,
restructuring costs, asset writedowns, etc. ………………………………………………………………………………………………………………………………………………………………………………………………………………………………………………………………………………………………………(3.96) (1.77) (1.28) (0.11) 6.73
Net income (loss) of foreign branches and equity in earnings (losses)
of nonconsolidated subsidiaries, net of foreign taxes …………………………………………………………………………………………………………………………………………………………………………………………………………6.72 11.14 10.88 11.66 9.51
Income (loss) before income taxes …………………………………………………………………………………………………………………………………………………………………………………………………………………16.48 21.36 26.84 26.45 28.47
Provision for current and deferred domestic income taxes ………………………………………………………………………………………………………………………………………………………………………………………………………0.77 1.73 4.54 5.33 6.57
Income (loss) after income taxes ………………………………………………………………………………………………………………………………………………………………………………………………………………………15.71 19.63 22.30 21.12 21.91
OPERATING RATIOS
(see explanatory notes)
Annual rate of profit on stockholders' equity at end of period:
Before income taxes …………………………………………………………………………………………………………………………………………………………………………………………………………………………………………12.71 15.58 21.38 20.71 23.51
After income taxes …………………………………………………………………………………………………………………………………………………………………………………………………………………………………………12.12 14.32 17.76 16.54 18.09
Annual rate of profit on total assets:
Before income taxes …………………………………………………………………………………………………………………………………………………………………………………………………………………………………………5.48 6.75 9.29 9.08 10.13
After income taxes ……………………………………………………………………………………………………………………………………………………………………………………………………………………………………………5.22 6.20 7.72 7.25 7.80
1 Included in Chemicals.
Table 49.0 -- Income Statement For Corporations in NAICS Manufacturing Industry Group 3254,
Total Assets $25 Million and Over
See the Survey Methodology section of the Introduction for information on survey design, estimation, and sampling error.
Pharmaceuticals and Medicines
Total Assets $25 Million and Over 1
(million dollars)
(percent of net sales)
(percent)
98U.S. Census Bureau, Quarterly Financial Report, 2014 Quarter 4

Table with row headers in column A with column headers in rows 5 and 6
Item
4Q_
2013_
1Q_
2014_
2Q_
2014_
3Q_
2014_
4Q_
2014_
ASSETS
Cash and demand deposits in the U.S. ……………………………………………………………………………………………………………………………………………………………………………………………………………………………25,976 25,893 28,003 24,433 34,515
Time deposits in the U.S., including negotiable certificates of deposit …………………………………………………………………………………………………………………………………………………………………………………………10,232 8,924 7,836 8,615 10,244
Cash and deposits outside the U.S. .……………………………………………………………………………………………………………………………………………………………………………………………………………………………………………8,021 7,353 8,703 8,933 7,409
Total cash on hand and in banks ……………………………………………………………………………………………………………………………………………………………………………………………………………………………44,229 42,170 44,542 41,981 52,169
U.S. Treasury and Federal agency securities:
a. Subject to agreements to sell …………………………………………………………………………………………………………………………………………………………………………………………………………………………………3,021 3,567 4,472 4,163 4,100
b. Other, due in 1 year or less ……………………………………………………………………………………………………………………………………………………………………………………………………………………………………1,320 1,122 1,318 1,631 739
Commercial and finance company paper of U.S. issuers …………………………………………………………………………………………………………………………………………………………………………………………………………521 1,307 692 748 692
State and local government securities, due in 1 year or less …………………………………………………………………………………………………………………………………………………………………………………………………………61 62 79 63 63
Foreign securities, due in 1 year or less ………………………………………………………………………………………………………………………………………………………………………………………………………………………………166 306 588 516 85
Other short-term financial investments …………………………………………………………………………………………………………………………………………………………………………………………5,781 7,031 7,180 6,567 5,292
Total cash, U.S. Government and other securities ……………………………………………………………………………………………………………………………………………………………………………………………………55,099 55,564 58,870 55,668 63,139
Trade receivables from the U.S. Government …………………………………………………………………………………………………………………………………………………………………………………………………………………………6 37 36 36 41
Other trade accounts and trade notes receivable
(less allowance for doubtful accounts) ………………………………………………………………………………………………………………………………………………………………………49,093 50,206 54,815 54,524 57,414
Total receivables ………………………………………………………………………………………………………………………………………………………………………………………………………………………………49,099 50,243 54,851 54,560 57,455
Inventories ……………………………………………………………………………………………………………………………………………………………………………………………………………………………………………………46,220 47,527 48,180 48,023 47,412
All other current assets …………………………………………………………………………………………………………………………………………………………………………………………………………………………………………53,215 58,893 55,769 59,314 58,665
Total current assets ……………………………………………………………………………………………………………………………………………………………………………………………………………………………………203,633 212,227 217,671 217,565 226,671
Property, plant, and equipment ……………………………………………………………………………………………………………………………………………………………………………………………………………………………………………154,868 153,354 154,333 156,061 157,535
Land and mineral rights …………………………………………………………………………………………………………………………………………………………………………………………………………………………………………4,262 4,114 4,049 4,050 3,966
Less: Accumulated depreciation, depletion, and amortization ………………………………………………………………………………………………………………………………………………………………………………………………84,045 83,450 84,355 85,409 85,624
Net property, plant, and equipment …………………………………………………………………………………………………………………………………………………………………………………………………………………75,086 74,018 74,027 74,702 75,878
U.S. Treasury and Federal agency securities, due in more than 1 year …………………………………………………………………………………………………………………………………………………………………………………………764 852 1,112 1,205 1,048
All other noncurrent assets, including investment in nonconsolidated
entities, long-term investments, intangibles, etc. .………………………………………………………………………………………………………………………………………………………………………………………………………………………………746,921 753,400 758,005 774,841 782,584
Total Assets …………………………………………………………………………………………………………………………………………………………………………………………………………………………………………………1,026,404 1,040,497 1,050,815 1,068,314 1,086,180
LIABILITIES AND STOCKHOLDERS' EQUITY
Short-term debt, original maturity of 1 year or less:
a. Loans from banks ………………………………………………………………………………………………………………………………………………………………………………………………………………………………………3,219 3,799 3,011 3,154 3,205
b. Commercial paper ………………………………………………………………………………………………………………………………………………………………………………………………………………………………………17,321 19,877 10,693 15,592 11,990
c. Other short-term loans ………………………………………………………………………………………………………………………………………………………………………………………………………………………………5,493 5,345 4,935 4,397 4,604
Advances and prepayments by the U.S. Government …………………………………………………………………………………………………………………………………………………………………………………………………………0 0 0 0 0
Trade accounts and trade notes payable ………………………………………………………………………………………………………………………………………………………………………………………………………………………36,462 35,364 35,661 35,769 37,147
Income taxes accrued, prior and current years, net of payments:
a. Federal ……………………………………………………………………………………………………………………………………………………………………………………………………………………………………………………1,688 1,379 712 3,757 2,623
b. Other ………………………………………………………………………………………………………………………………………………………………………………………………………………………………………………516 313 536 478 502
Current portion of long-term debt, due in 1 year or less:
a. Loans from banks ……………………………………………………………………………………………………………………………………………………………………………………………………………………………………1,978 2,104 1,849 1,908 1,950
b. Bonds and debentures …………………………………………………………………………………………………………………………………………………………………………………………………………………………………21,000 19,544 19,380 15,660 12,666
c. Other long-term loans ………………………………………………………………………………………………………………………………………………………………………………………………………………………………………4,692 7,745 7,361 7,398 6,477
All other current liabilities, including excise and
sales taxes, and accrued expenses ……………………………………………………………………………………………………………………………………………………………………………88,946 84,363 89,728 91,230 97,920
Total current liabilities ………………………………………………………………………………………………………………………………………………………………………………………………………………………………181,314 179,833 173,866 179,342 179,085
Long-term debt, due in more than 1 year:
a. Loans from banks ………………………………………………………………………………………………………………………………………………………………………………………………………………………………………………21,440 21,743 22,386 23,016 23,911
b. Bonds and debentures ………………………………………………………………………………………………………………………………………………………………………………………………………………………………………160,581 170,349 175,204 173,357 181,171
c. Other long-term loans …………………………………………………………………………………………………………………………………………………………………………………………………………………………………………95,196 95,901 103,079 102,424 103,458
All other noncurrent liabilities, including deferred income taxes,
capitalized leases, and minority stockholders' interest
in consolidated domestic corporations ………………………………………………………………………………………………………………………………………………………………………………125,757 122,234 119,660 121,736 130,428
Total liabilities ……………………………………………………………………………………………………………………………………………………………………………………………………………………………………584,288 590,060 594,195 599,876 618,053
Capital stock and other capital …………………………………………………………………………………………………………………………………………………………………………………………………………………………………336,615 335,552 340,491 356,653 374,219
Retained earnings ……………………………………………………………………………………………………………………………………………………………………………………………………………………………………291,426 299,284 307,086 306,755 312,553
Cumulative foreign currency translation adjustment …………………………………………………………………………………………………………………………………………………………………………………………………………(2,734) (2,625) (3,054) (9,222) (14,445)
Other stockholders' equity items, including unearned
compensation and ESOP debt guarantees ……………………………………………………………………………………………………………………………………………………………………(15,474) (14,707) (15,976) (13,097) (24,467)
Less: Treasury stock at cost ………………………………………………………………………………………………………………………………………………………………………………………………………………………………………167,716 167,066 171,926 172,650 179,733
Stockholders' equity ………………………………………………………………………………………………………………………………………………………………………………………………………………………………442,116 450,437 456,620 468,439 468,127
Total Liabilities and Stockholders' Equity ……………………………………………………………………………………………………………………………………………………1,026,404 1,040,497 1,050,815 1,068,314 1,086,180
NET WORKING CAPITAL
Excess of total current assets over total current liabilities ……………………………………………………………………………………………………………………………………………………………………………22,318 32,394 43,805 38,223 47,586
(million dollars)
Pharmaceuticals and Medicines
Total Assets $25 Million and Over 1
1 Included in Chemicals.
Table 49.1 -- Balance Sheet For Corporations in NAICS Manufacturing Industry Group 3254,
Total Assets $25 Million and Over
See the Survey Methodology section of the Introduction for information on survey design, estimation, and sampling error.
99U.S. Census Bureau, Quarterly Financial Report, 2014 Quarter 4
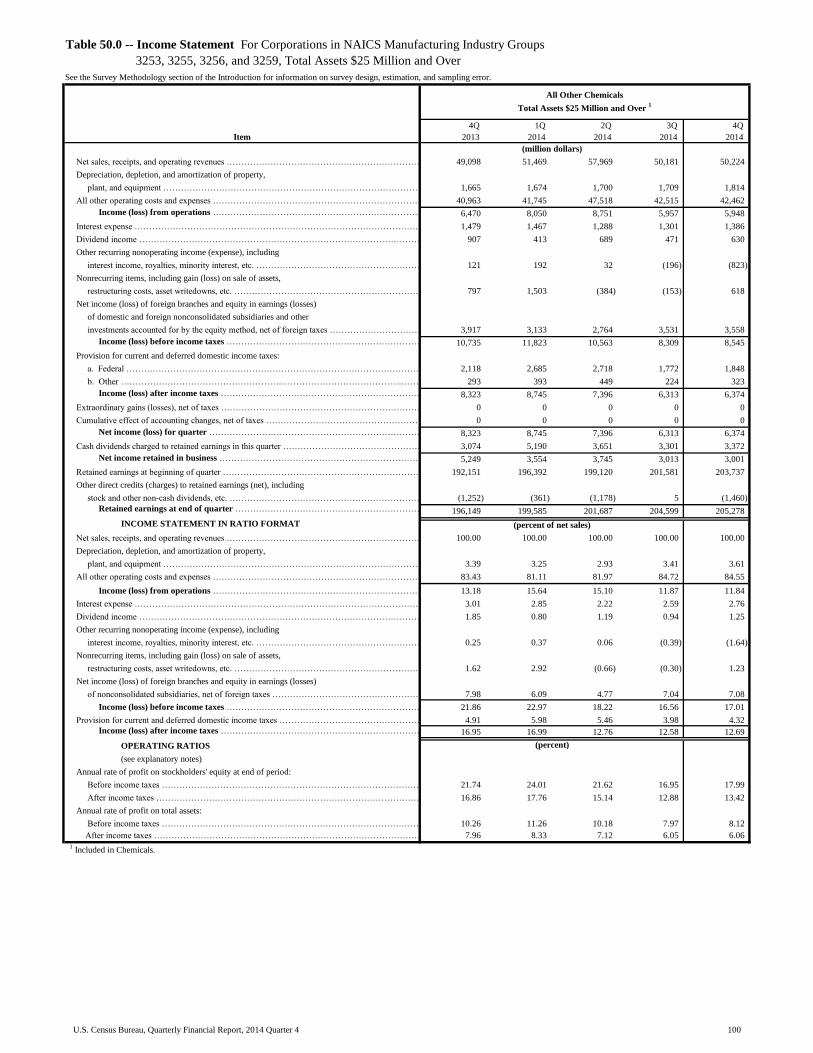
Table with row headers in column A with column headers in rows 5 and 6
Item
4Q_
2013_
1Q_
2014_
2Q_
2014_
3Q_
2014_
4Q_
2014_
Net sales, receipts, and operating revenues ………………………………………………………………………………………………………………………………………………………………………………………………………49,098 51,469 57,969 50,181 50,224
Depreciation, depletion, and amortization of property,
plant, and equipment ……………………………………………………………………………………………………………………………………………………………………1,665 1,674 1,700 1,709 1,814
All other operating costs and expenses …………………………………………………………………………………………………………………………………………………………………………………………………40,963 41,745 47,518 42,515 42,462
Income (loss) from operations …………………………………………………………………………………………………………………………………………...……………………………………………………………6,470 8,050 8,751 5,957 5,948
Interest expense …………………………………………………………………………………………………………………………………………………………………………………………………………………………………………1,479 1,467 1,288 1,301 1,386
Dividend income …………………………………………………………………………………………………………………………………………………………………………………………………………………………………………………907 413 689 471 630
Other recurring nonoperating income (expense), including
interest income, royalties, minority interest, etc. ………………………………………………………………………………………………………………………………………………………………………………………………………………………………………………121 192 32 (196) (823)
Nonrecurring items, including gain (loss) on sale of assets,
restructuring costs, asset writedowns, etc. …………………………………………………………………………………………………………………………………………………………………797 1,503 (384) (153) 618
Net income (loss) of foreign branches and equity in earnings (losses)
of domestic and foreign nonconsolidated subsidiaries and other
investments accounted for by the equity method, net of foreign taxes ………………………………………………………………………………………………………………………………………………………………………………………………………………3,917 3,133 2,764 3,531 3,558
Income (loss) before income taxes ………………………………………………………………………………………………………………………………………………………………………………………………………10,735 11,823 10,563 8,309 8,545
Provision for current and deferred domestic income taxes:
a. Federal …………………………………………………………………………………………………………………………………………………………………………………………………………………………………………………2,118 2,685 2,718 1,772 1,848
b. Other …………………………………………………………………………………………………………………………………………………………………………………………………………………………………………………293 393 449 224 323
Income (loss) after income taxes ……………………………………………………………………………………………………………………………………………………………………………………………………8,323 8,745 7,396 6,313 6,374
Extraordinary gains (losses), net of taxes ……………………………………………………………………………………………………………………………………………………………………………………………………………0 0 0 0 0
Cumulative effect of accounting changes, net of taxes ……………………………………………………………………………………………………………………………………………………………………………………………0 0 0 0 0
Net income (loss) for quarter ………………………………………………………………………………………………………………………………………………………………………………………………………………8,323 8,745 7,396 6,313 6,374
Cash dividends charged to retained earnings in this quarter ………………………………………………………………………………………………………………………………………………………………………………………3,074 5,190 3,651 3,301 3,372
Net income retained in business …………………………………………………………………………………………………………………………………………………………………………………………………………………5,249 3,554 3,745 3,013 3,001
Retained earnings at beginning of quarter ………………………………………………………………………………………………………………………………………………………………………………………………………………………192,151 196,392 199,120 201,581 203,737
Other direct credits (charges) to retained earnings (net), including
stock and other non-cash dividends, etc. ……………………………………………………………………………………………………………………………………………………………………………………………………………………………(1,252) (361) (1,178) 5 (1,460)
Retained earnings at end of quarter ………………………………………………………………………………………………………………………………………………………………………………………………………196,149 199,585 201,687 204,599 205,278
INCOME STATEMENT IN RATIO FORMAT
Net sales, receipts, and operating revenues ……………………………………………………………………………………………………………………………………………………………………………………………………………100.00 100.00 100.00 100.00 100.00
Depreciation, depletion, and amortization of property,
plant, and equipment …………………………………………………………………………………………………………………………………………………………………………………3.39 3.25 2.93 3.41 3.61
All other operating costs and expenses ……………………………………………………………………………………………………………………………………………………………………………………………………………………………83.43 81.11 81.97 84.72 84.55
Income (loss) from operations …………………………………………………………………………………………………………………………………………………………………………………………………………………13.18 15.64 15.10 11.87 11.84
Interest expense ………………………………………………………………………………………………………………………………………………………………………………………………………………………………………………3.01 2.85 2.22 2.59 2.76
Dividend income …………………………………………………………………………………………………………………………………………………………………………………………………………………………………………………1.85 0.80 1.19 0.94 1.25
Other recurring nonoperating income (expense), including
interest income, royalties, minority interest, etc. …………………………………………………………………………………………………………………………………………………………………………………………………………………………………………………0.25 0.37 0.06 (0.39) (1.64)
Nonrecurring items, including gain (loss) on sale of assets,
restructuring costs, asset writedowns, etc. ………………………………………………………………………………………………………………………………………………………………………………………………………………………………………………………………………………………………………1.62 2.92 (0.66) (0.30) 1.23
Net income (loss) of foreign branches and equity in earnings (losses)
of nonconsolidated subsidiaries, net of foreign taxes …………………………………………………………………………………………………………………………………………………………………………………………………………7.98 6.09 4.77 7.04 7.08
Income (loss) before income taxes …………………………………………………………………………………………………………………………………………………………………………………………………………………21.86 22.97 18.22 16.56 17.01
Provision for current and deferred domestic income taxes ………………………………………………………………………………………………………………………………………………………………………………………………………4.91 5.98 5.46 3.98 4.32
Income (loss) after income taxes ………………………………………………………………………………………………………………………………………………………………………………………………………………………16.95 16.99 12.76 12.58 12.69
OPERATING RATIOS
(see explanatory notes)
Annual rate of profit on stockholders' equity at end of period:
Before income taxes …………………………………………………………………………………………………………………………………………………………………………………………………………………………………………21.74 24.01 21.62 16.95 17.99
After income taxes …………………………………………………………………………………………………………………………………………………………………………………………………………………………………………16.86 17.76 15.14 12.88 13.42
Annual rate of profit on total assets:
Before income taxes …………………………………………………………………………………………………………………………………………………………………………………………………………………………………………10.26 11.26 10.18 7.97 8.12
After income taxes ……………………………………………………………………………………………………………………………………………………………………………………………………………………………………………7.96 8.33 7.12 6.05 6.06
1 Included in Chemicals.
Table 50.0 -- Income Statement For Corporations in NAICS Manufacturing Industry Groups
3253, 3255, 3256, and 3259, Total Assets $25 Million and Over
See the Survey Methodology section of the Introduction for information on survey design, estimation, and sampling error.
All Other Chemicals
Total Assets $25 Million and Over 1
(million dollars)
(percent of net sales)
(percent)
100U.S. Census Bureau, Quarterly Financial Report, 2014 Quarter 4

Table with row headers in column A with column headers in rows 5 and 6
Item
4Q_
2013_
1Q_
2014_
2Q_
2014_
3Q_
2014_
4Q_
2014_
ASSETS
Cash and demand deposits in the U.S. ……………………………………………………………………………………………………………………………………………………………………………………………………………………………10,816 5,668 5,577 5,600 7,238
Time deposits in the U.S., including negotiable certificates of deposit …………………………………………………………………………………………………………………………………………………………………………………………3,804 3,341 1,875 1,616 2,277
Cash and deposits outside the U.S. .……………………………………………………………………………………………………………………………………………………………………………………………………………………………………………107 105 158 185 235
Total cash on hand and in banks ……………………………………………………………………………………………………………………………………………………………………………………………………………………………14,728 9,114 7,610 7,401 9,750
U.S. Treasury and Federal agency securities:
a. Subject to agreements to sell …………………………………………………………………………………………………………………………………………………………………………………………………………………………………0 0 0 0 0
b. Other, due in 1 year or less ……………………………………………………………………………………………………………………………………………………………………………………………………………………………………1,608 3,213 1,856 2,295 1,619
Commercial and finance company paper of U.S. issuers …………………………………………………………………………………………………………………………………………………………………………………………………………502 451 466 544 700
State and local government securities, due in 1 year or less …………………………………………………………………………………………………………………………………………………………………………………………………………32 33 32 32 30
Foreign securities, due in 1 year or less ………………………………………………………………………………………………………………………………………………………………………………………………………………………………0 0 0 0 0
Other short-term financial investments …………………………………………………………………………………………………………………………………………………………………………………………2,339 3,645 2,158 1,559 716
Total cash, U.S. Government and other securities ……………………………………………………………………………………………………………………………………………………………………………………………………19,208 16,457 12,122 11,832 12,815
Trade receivables from the U.S. Government …………………………………………………………………………………………………………………………………………………………………………………………………………………………29 21 220 241 328
Other trade accounts and trade notes receivable
(less allowance for doubtful accounts) ………………………………………………………………………………………………………………………………………………………………………21,194 23,222 27,175 25,268 24,975
Total receivables ………………………………………………………………………………………………………………………………………………………………………………………………………………………………21,223 23,242 27,395 25,509 25,303
Inventories ……………………………………………………………………………………………………………………………………………………………………………………………………………………………………………………24,870 26,615 23,920 23,969 25,113
All other current assets …………………………………………………………………………………………………………………………………………………………………………………………………………………………………………21,100 22,577 21,730 20,506 21,160
Total current assets ……………………………………………………………………………………………………………………………………………………………………………………………………………………………………86,400 88,892 85,167 81,816 84,392
Property, plant, and equipment ……………………………………………………………………………………………………………………………………………………………………………………………………………………………………………99,761 100,166 102,364 104,117 108,091
Land and mineral rights …………………………………………………………………………………………………………………………………………………………………………………………………………………………………………4,292 4,753 4,784 4,884 4,965
Less: Accumulated depreciation, depletion, and amortization ………………………………………………………………………………………………………………………………………………………………………………………………55,101 54,522 55,703 56,636 57,209
Net property, plant, and equipment …………………………………………………………………………………………………………………………………………………………………………………………………………………48,952 50,398 51,444 52,364 55,847
U.S. Treasury and Federal agency securities, due in more than 1 year …………………………………………………………………………………………………………………………………………………………………………………………0 0 0 0 13
All other noncurrent assets, including investment in nonconsolidated
entities, long-term investments, intangibles, etc. .………………………………………………………………………………………………………………………………………………………………………………………………………………………………283,010 280,758 278,615 282,922 280,726
Total Assets …………………………………………………………………………………………………………………………………………………………………………………………………………………………………………………418,363 420,048 415,227 417,102 420,978
LIABILITIES AND STOCKHOLDERS' EQUITY
Short-term debt, original maturity of 1 year or less:
a. Loans from banks ………………………………………………………………………………………………………………………………………………………………………………………………………………………………………1,516 1,252 1,361 1,261 1,564
b. Commercial paper ………………………………………………………………………………………………………………………………………………………………………………………………………………………………………2,389 4,130 3,131 2,625 2,560
c. Other short-term loans ………………………………………………………………………………………………………………………………………………………………………………………………………………………………4,938 7,382 3,196 3,325 2,908
Advances and prepayments by the U.S. Government …………………………………………………………………………………………………………………………………………………………………………………………………………0 0 0 0 0
Trade accounts and trade notes payable ………………………………………………………………………………………………………………………………………………………………………………………………………………………22,541 24,063 23,003 21,663 23,521
Income taxes accrued, prior and current years, net of payments:
a. Federal ……………………………………………………………………………………………………………………………………………………………………………………………………………………………………………………(315) 80 670 510 (73)
b. Other ………………………………………………………………………………………………………………………………………………………………………………………………………………………………………………654 667 775 698 436
Current portion of long-term debt, due in 1 year or less:
a. Loans from banks ……………………………………………………………………………………………………………………………………………………………………………………………………………………………………671 1,378 1,430 1,420 2,401
b. Bonds and debentures …………………………………………………………………………………………………………………………………………………………………………………………………………………………………9,031 7,651 7,466 7,815 9,144
c. Other long-term loans ………………………………………………………………………………………………………………………………………………………………………………………………………………………………………839 878 784 1,100 770
All other current liabilities, including excise and
sales taxes, and accrued expenses ……………………………………………………………………………………………………………………………………………………………………………33,259 30,636 29,653 30,053 30,016
Total current liabilities ………………………………………………………………………………………………………………………………………………………………………………………………………………………………75,521 78,117 71,469 70,468 73,246
Long-term debt, due in more than 1 year:
a. Loans from banks ………………………………………………………………………………………………………………………………………………………………………………………………………………………………………………31,283 31,307 31,844 32,698 33,090
b. Bonds and debentures ………………………………………………………………………………………………………………………………………………………………………………………………………………………………………48,562 49,930 49,453 49,387 50,202
c. Other long-term loans …………………………………………………………………………………………………………………………………………………………………………………………………………………………………………19,076 20,059 23,577 22,997 24,196
All other noncurrent liabilities, including deferred income taxes,
capitalized leases, and minority stockholders' interest
in consolidated domestic corporations ………………………………………………………………………………………………………………………………………………………………………………46,401 43,703 43,477 45,517 50,271
Total liabilities ……………………………………………………………………………………………………………………………………………………………………………………………………………………………………220,844 223,116 219,820 221,068 231,005
Capital stock and other capital …………………………………………………………………………………………………………………………………………………………………………………………………………………………………139,399 139,852 138,919 139,703 143,327
Retained earnings ……………………………………………………………………………………………………………………………………………………………………………………………………………………………………196,149 199,585 201,687 204,599 205,278
Cumulative foreign currency translation adjustment …………………………………………………………………………………………………………………………………………………………………………………………………………(7,637) (8,420) (8,972) (9,686) (14,643)
Other stockholders' equity items, including unearned
compensation and ESOP debt guarantees ……………………………………………………………………………………………………………………………………………………………………(8,561) (8,200) (8,716) (9,159) (10,593)
Less: Treasury stock at cost ………………………………………………………………………………………………………………………………………………………………………………………………………………………………………121,831 125,885 127,512 129,422 133,395
Stockholders' equity ………………………………………………………………………………………………………………………………………………………………………………………………………………………………197,519 196,931 195,407 196,034 189,974
Total Liabilities and Stockholders' Equity ……………………………………………………………………………………………………………………………………………………418,363 420,048 415,227 417,102 420,978
NET WORKING CAPITAL
Excess of total current assets over total current liabilities ……………………………………………………………………………………………………………………………………………………………………………10,879 10,775 13,698 11,348 11,146
(million dollars)
All Other Chemicals
Total Assets $25 Million and Over 1
1 Included in Chemicals.
Table 50.1 -- Balance Sheet For Corporations in NAICS Manufacturing Industry Groups
3253, 3255, 3256, and 3259, Total Assets $25 Million and Over
See the Survey Methodology section of the Introduction for information on survey design, estimation, and sampling error.
101U.S. Census Bureau, Quarterly Financial Report, 2014 Quarter 4

Table with row headers in column A with column headers in rows 5 and 6
Item
4Q_
2013_
1Q_
2014_
2Q_
2014_
3Q_
2014_
4Q_
2014_
Net sales, receipts, and operating revenues ………………………………………………………………………………………………………………………………………………………………………………………………………35,497 34,911 39,384 40,440 38,460
Depreciation, depletion, and amortization of property,
plant, and equipment ……………………………………………………………………………………………………………………………………………………………………1,072 1,075 1,150 1,165 1,177
All other operating costs and expenses …………………………………………………………………………………………………………………………………………………………………………………………………31,784 31,590 34,468 35,703 35,413
Income (loss) from operations …………………………………………………………………………………………………………………………………………...……………………………………………………………2,641 2,246 3,765 3,573 1,871
Interest expense …………………………………………………………………………………………………………………………………………………………………………………………………………………………………………844 743 887 737 709
Dividend income …………………………………………………………………………………………………………………………………………………………………………………………………………………………………………………107 31 55 17 43
Other recurring nonoperating income (expense), including
interest income, royalties, minority interest, etc. ………………………………………………………………………………………………………………………………………………………………………………………………………………………………………………878 73 41 (28) (32)
Nonrecurring items, including gain (loss) on sale of assets,
restructuring costs, asset writedowns, etc. …………………………………………………………………………………………………………………………………………………………………(44) (37) (89) (401) (197)
Net income (loss) of foreign branches and equity in earnings (losses)
of domestic and foreign nonconsolidated subsidiaries and other
investments accounted for by the equity method, net of foreign taxes ………………………………………………………………………………………………………………………………………………………………………………………………………………644 460 361 509 584
Income (loss) before income taxes ………………………………………………………………………………………………………………………………………………………………………………………………………3,382 2,031 3,247 2,933 1,559
Provision for current and deferred domestic income taxes:
a. Federal …………………………………………………………………………………………………………………………………………………………………………………………………………………………………………………719 546 528 589 (2,404)
b. Other …………………………………………………………………………………………………………………………………………………………………………………………………………………………………………………55 46 66 66 41
Income (loss) after income taxes ……………………………………………………………………………………………………………………………………………………………………………………………………2,608 1,439 2,653 2,278 3,921
Extraordinary gains (losses), net of taxes ……………………………………………………………………………………………………………………………………………………………………………………………………………0 0 0 0 0
Cumulative effect of accounting changes, net of taxes ……………………………………………………………………………………………………………………………………………………………………………………………0 0 0 0 0
Net income (loss) for quarter ………………………………………………………………………………………………………………………………………………………………………………………………………………2,608 1,439 2,653 2,278 3,921
Cash dividends charged to retained earnings in this quarter ………………………………………………………………………………………………………………………………………………………………………………………930 605 665 718 1,003
Net income retained in business …………………………………………………………………………………………………………………………………………………………………………………………………………………1,678 834 1,988 1,560 2,918
Retained earnings at beginning of quarter ………………………………………………………………………………………………………………………………………………………………………………………………………………………30,143 31,145 31,934 33,478 34,772
Other direct credits (charges) to retained earnings (net), including
stock and other non-cash dividends, etc. ……………………………………………………………………………………………………………………………………………………………………………………………………………………………(619) (52) (141) (568) (657)
Retained earnings at end of quarter ………………………………………………………………………………………………………………………………………………………………………………………………………31,201 31,926 33,781 34,469 37,033
INCOME STATEMENT IN RATIO FORMAT
Net sales, receipts, and operating revenues ……………………………………………………………………………………………………………………………………………………………………………………………………………100.00 100.00 100.00 100.00 100.00
Depreciation, depletion, and amortization of property,
plant, and equipment …………………………………………………………………………………………………………………………………………………………………………………3.02 3.08 2.92 2.88 3.06
All other operating costs and expenses ……………………………………………………………………………………………………………………………………………………………………………………………………………………………89.54 90.49 87.52 88.28 92.08
Income (loss) from operations …………………………………………………………………………………………………………………………………………………………………………………………………………………7.44 6.43 9.56 8.84 4.86
Interest expense ………………………………………………………………………………………………………………………………………………………………………………………………………………………………………………2.38 2.13 2.25 1.82 1.84
Dividend income …………………………………………………………………………………………………………………………………………………………………………………………………………………………………………………0.30 0.09 0.14 0.04 0.11
Other recurring nonoperating income (expense), including
interest income, royalties, minority interest, etc. …………………………………………………………………………………………………………………………………………………………………………………………………………………………………………………2.47 0.21 0.10 (0.07) (0.08)
Nonrecurring items, including gain (loss) on sale of assets,
restructuring costs, asset writedowns, etc. ………………………………………………………………………………………………………………………………………………………………………………………………………………………………………………………………………………………………………(0.12) (0.11) (0.23) (0.99) (0.51)
Net income (loss) of foreign branches and equity in earnings (losses)
of nonconsolidated subsidiaries, net of foreign taxes …………………………………………………………………………………………………………………………………………………………………………………………………………1.81 1.32 0.92 1.26 1.52
Income (loss) before income taxes …………………………………………………………………………………………………………………………………………………………………………………………………………………9.53 5.82 8.24 7.25 4.05
Provision for current and deferred domestic income taxes ………………………………………………………………………………………………………………………………………………………………………………………………………2.18 1.70 1.51 1.62 (6.14)
Income (loss) after income taxes ………………………………………………………………………………………………………………………………………………………………………………………………………………………7.35 4.12 6.74 5.63 10.20
OPERATING RATIOS
(see explanatory notes)
Annual rate of profit on stockholders' equity at end of period:
Before income taxes …………………………………………………………………………………………………………………………………………………………………………………………………………………………………………24.57 14.10 21.98 19.77 10.22
After income taxes …………………………………………………………………………………………………………………………………………………………………………………………………………………………………………18.95 9.99 17.96 15.35 25.70
Annual rate of profit on total assets:
Before income taxes …………………………………………………………………………………………………………………………………………………………………………………………………………………………………………8.90 5.29 8.26 7.43 3.89
After income taxes ……………………………………………………………………………………………………………………………………………………………………………………………………………………………………………6.87 3.75 6.75 5.77 9.78
Table 51.0 -- Income Statement For Corporations in NAICS Manufacturing Subsector 326,
Total Assets $25 Million and Over
See the Survey Methodology section of the Introduction for information on survey design, estimation, and sampling error.
Plastics and Rubber Products
Total Assets $25 Million and Over
(million dollars)
(percent of net sales)
(percent)
102U.S. Census Bureau, Quarterly Financial Report, 2014 Quarter 4

Table with row headers in column A with column headers in rows 5 and 6
Item
4Q_
2013_
1Q_
2014_
2Q_
2014_
3Q_
2014_
4Q_
2014_
ASSETS
Cash and demand deposits in the U.S. ……………………………………………………………………………………………………………………………………………………………………………………………………………………………5,438 4,275 3,969 4,581 5,100
Time deposits in the U.S., including negotiable certificates of deposit …………………………………………………………………………………………………………………………………………………………………………………………360 384 433 465 486
Cash and deposits outside the U.S. .……………………………………………………………………………………………………………………………………………………………………………………………………………………………………………131 134 219 355 365
Total cash on hand and in banks ……………………………………………………………………………………………………………………………………………………………………………………………………………………………5,930 4,793 4,622 5,401 5,951
U.S. Treasury and Federal agency securities:
a. Subject to agreements to sell …………………………………………………………………………………………………………………………………………………………………………………………………………………………………0 0 0 9 14
b. Other, due in 1 year or less ……………………………………………………………………………………………………………………………………………………………………………………………………………………………………65 46 95 136 142
Commercial and finance company paper of U.S. issuers …………………………………………………………………………………………………………………………………………………………………………………………………………724 407 336 310 270
State and local government securities, due in 1 year or less …………………………………………………………………………………………………………………………………………………………………………………………………………200 176 219 255 215
Foreign securities, due in 1 year or less ………………………………………………………………………………………………………………………………………………………………………………………………………………………………0 0 0 0 0
Other short-term financial investments …………………………………………………………………………………………………………………………………………………………………………………………1,199 1,069 941 368 540
Total cash, U.S. Government and other securities ……………………………………………………………………………………………………………………………………………………………………………………………………8,118 6,491 6,213 6,479 7,132
Trade receivables from the U.S. Government …………………………………………………………………………………………………………………………………………………………………………………………………………………………27 38 36 31 20
Other trade accounts and trade notes receivable
(less allowance for doubtful accounts) ………………………………………………………………………………………………………………………………………………………………………16,300 17,197 19,079 19,587 18,124
Total receivables ………………………………………………………………………………………………………………………………………………………………………………………………………………………………16,327 17,234 19,115 19,617 18,145
Inventories ……………………………………………………………………………………………………………………………………………………………………………………………………………………………………………………17,732 18,957 19,231 19,589 18,944
All other current assets …………………………………………………………………………………………………………………………………………………………………………………………………………………………………………6,494 6,330 6,723 7,261 7,801
Total current assets ……………………………………………………………………………………………………………………………………………………………………………………………………………………………………48,671 49,013 51,283 52,946 52,022
Property, plant, and equipment ……………………………………………………………………………………………………………………………………………………………………………………………………………………………………………78,555 78,994 80,914 82,407 84,802
Land and mineral rights …………………………………………………………………………………………………………………………………………………………………………………………………………………………………………1,318 1,229 1,192 1,474 1,587
Less: Accumulated depreciation, depletion, and amortization ………………………………………………………………………………………………………………………………………………………………………………………………48,640 48,804 49,196 50,500 52,195
Net property, plant, and equipment …………………………………………………………………………………………………………………………………………………………………………………………………………………31,233 31,419 32,911 33,382 34,195
U.S. Treasury and Federal agency securities, due in more than 1 year …………………………………………………………………………………………………………………………………………………………………………………………0 0 73 81 94
All other noncurrent assets, including investment in nonconsolidated
entities, long-term investments, intangibles, etc. .………………………………………………………………………………………………………………………………………………………………………………………………………………………………72,010 73,208 73,030 71,503 74,109
Total Assets …………………………………………………………………………………………………………………………………………………………………………………………………………………………………………………151,914 153,639 157,297 157,912 160,419
LIABILITIES AND STOCKHOLDERS' EQUITY
Short-term debt, original maturity of 1 year or less:
a. Loans from banks ………………………………………………………………………………………………………………………………………………………………………………………………………………………………………1,828 2,264 2,563 2,666 2,670
b. Commercial paper ………………………………………………………………………………………………………………………………………………………………………………………………………………………………………103 140 135 161 28
c. Other short-term loans ………………………………………………………………………………………………………………………………………………………………………………………………………………………………278 387 416 258 482
Advances and prepayments by the U.S. Government …………………………………………………………………………………………………………………………………………………………………………………………………………16 18 0 17 16
Trade accounts and trade notes payable ………………………………………………………………………………………………………………………………………………………………………………………………………………………13,716 13,545 14,175 14,202 14,078
Income taxes accrued, prior and current years, net of payments:
a. Federal ……………………………………………………………………………………………………………………………………………………………………………………………………………………………………………………57 278 392 427 107
b. Other ………………………………………………………………………………………………………………………………………………………………………………………………………………………………………………13 37 29 49 (6)
Current portion of long-term debt, due in 1 year or less:
a. Loans from banks ……………………………………………………………………………………………………………………………………………………………………………………………………………………………………1,462 1,789 2,126 799 1,248
b. Bonds and debentures …………………………………………………………………………………………………………………………………………………………………………………………………………………………………253 482 442 364 106
c. Other long-term loans ………………………………………………………………………………………………………………………………………………………………………………………………………………………………………892 1,022 441 743 537
All other current liabilities, including excise and
sales taxes, and accrued expenses ……………………………………………………………………………………………………………………………………………………………………………11,336 10,103 10,308 11,632 11,931
Total current liabilities ………………………………………………………………………………………………………………………………………………………………………………………………………………………………29,954 30,065 31,028 31,319 31,197
Long-term debt, due in more than 1 year:
a. Loans from banks ………………………………………………………………………………………………………………………………………………………………………………………………………………………………………………15,565 16,832 16,289 17,002 16,056
b. Bonds and debentures ………………………………………………………………………………………………………………………………………………………………………………………………………………………………………15,755 15,464 16,713 16,625 16,620
c. Other long-term loans …………………………………………………………………………………………………………………………………………………………………………………………………………………………………………11,107 10,562 11,714 11,043 12,364
All other noncurrent liabilities, including deferred income taxes,
capitalized leases, and minority stockholders' interest
in consolidated domestic corporations ………………………………………………………………………………………………………………………………………………………………………………24,475 23,086 22,476 22,585 23,157
Total liabilities ……………………………………………………………………………………………………………………………………………………………………………………………………………………………………96,856 96,009 98,219 98,573 99,394
Capital stock and other capital …………………………………………………………………………………………………………………………………………………………………………………………………………………………………38,247 39,735 39,003 38,858 40,078
Retained earnings ……………………………………………………………………………………………………………………………………………………………………………………………………………………………………31,201 31,926 33,781 34,469 37,033
Cumulative foreign currency translation adjustment …………………………………………………………………………………………………………………………………………………………………………………………………………(2,450) (2,506) (1,852) (1,889) (2,793)
Other stockholders' equity items, including unearned
compensation and ESOP debt guarantees ……………………………………………………………………………………………………………………………………………………………………(6,628) (6,048) (5,789) (5,872) (6,428)
Less: Treasury stock at cost ………………………………………………………………………………………………………………………………………………………………………………………………………………………………………5,313 5,478 6,065 6,227 6,865
Stockholders' equity ………………………………………………………………………………………………………………………………………………………………………………………………………………………………55,058 57,630 59,078 59,339 61,026
Total Liabilities and Stockholders' Equity ……………………………………………………………………………………………………………………………………………………151,914 153,639 157,297 157,912 160,419
NET WORKING CAPITAL
Excess of total current assets over total current liabilities ……………………………………………………………………………………………………………………………………………………………………………18,716 18,947 20,255 21,627 20,825
(million dollars)
Plastics and Rubber Products
Total Assets $25 Million and Over
Table 51.1 -- Balance Sheet For Corporations in NAICS Manufacturing Subsector 326,
Total Assets $25 Million and Over
See the Survey Methodology section of the Introduction for information on survey design, estimation, and sampling error.
103U.S. Census Bureau, Quarterly Financial Report, 2014 Quarter 4
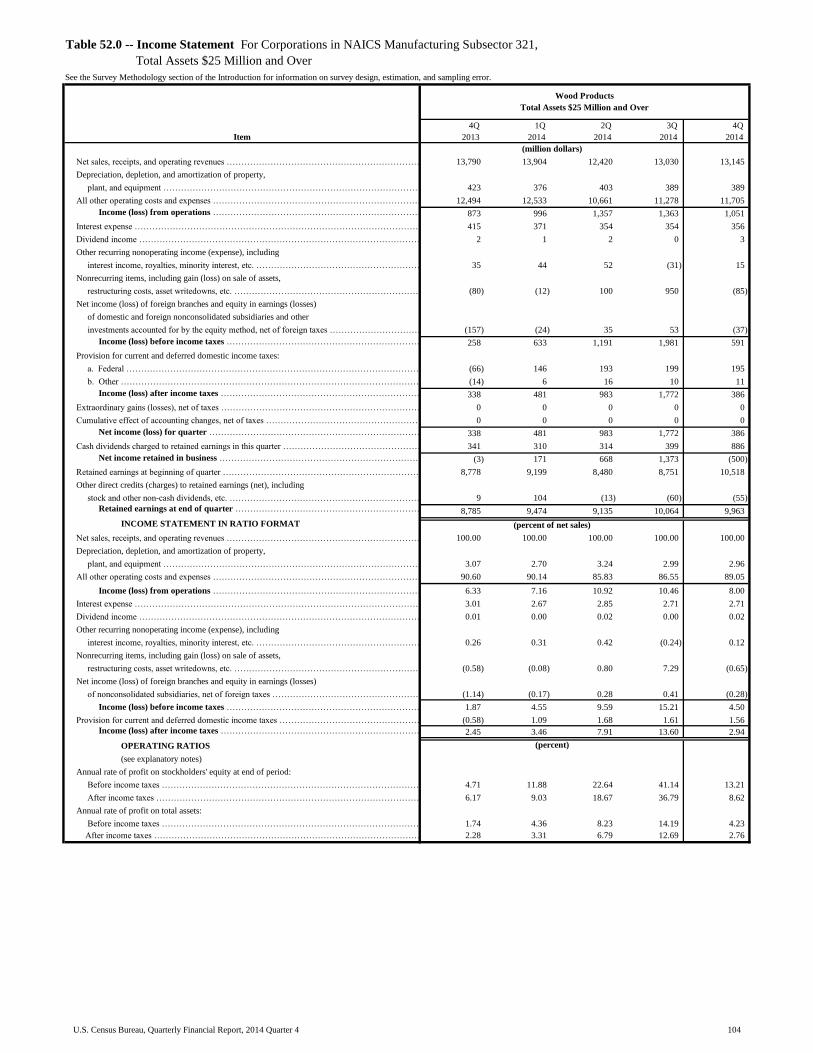
Table with row headers in column A with column headers in rows 5 and 6
Item
4Q_
2013_
1Q_
2014_
2Q_
2014_
3Q_
2014_
4Q_
2014_
Net sales, receipts, and operating revenues ………………………………………………………………………………………………………………………………………………………………………………………………………13,790 13,904 12,420 13,030 13,145
Depreciation, depletion, and amortization of property,
plant, and equipment ……………………………………………………………………………………………………………………………………………………………………423 376 403 389 389
All other operating costs and expenses …………………………………………………………………………………………………………………………………………………………………………………………………12,494 12,533 10,661 11,278 11,705
Income (loss) from operations …………………………………………………………………………………………………………………………………………...……………………………………………………………873 996 1,357 1,363 1,051
Interest expense …………………………………………………………………………………………………………………………………………………………………………………………………………………………………………415 371 354 354 356
Dividend income …………………………………………………………………………………………………………………………………………………………………………………………………………………………………………………2 1 2 0 3
Other recurring nonoperating income (expense), including
interest income, royalties, minority interest, etc. ………………………………………………………………………………………………………………………………………………………………………………………………………………………………………………35 44 52 (31) 15
Nonrecurring items, including gain (loss) on sale of assets,
restructuring costs, asset writedowns, etc. …………………………………………………………………………………………………………………………………………………………………(80) (12) 100 950 (85)
Net income (loss) of foreign branches and equity in earnings (losses)
of domestic and foreign nonconsolidated subsidiaries and other
investments accounted for by the equity method, net of foreign taxes ………………………………………………………………………………………………………………………………………………………………………………………………………………(157) (24) 35 53 (37)
Income (loss) before income taxes ………………………………………………………………………………………………………………………………………………………………………………………………………258 633 1,191 1,981 591
Provision for current and deferred domestic income taxes:
a. Federal …………………………………………………………………………………………………………………………………………………………………………………………………………………………………………………(66) 146 193 199 195
b. Other …………………………………………………………………………………………………………………………………………………………………………………………………………………………………………………(14) 6 16 10 11
Income (loss) after income taxes ……………………………………………………………………………………………………………………………………………………………………………………………………338 481 983 1,772 386
Extraordinary gains (losses), net of taxes ……………………………………………………………………………………………………………………………………………………………………………………………………………0 0 0 0 0
Cumulative effect of accounting changes, net of taxes ……………………………………………………………………………………………………………………………………………………………………………………………0 0 0 0 0
Net income (loss) for quarter ………………………………………………………………………………………………………………………………………………………………………………………………………………338 481 983 1,772 386
Cash dividends charged to retained earnings in this quarter ………………………………………………………………………………………………………………………………………………………………………………………341 310 314 399 886
Net income retained in business …………………………………………………………………………………………………………………………………………………………………………………………………………………(3) 171 668 1,373 (500)
Retained earnings at beginning of quarter ………………………………………………………………………………………………………………………………………………………………………………………………………………………8,778 9,199 8,480 8,751 10,518
Other direct credits (charges) to retained earnings (net), including
stock and other non-cash dividends, etc. ……………………………………………………………………………………………………………………………………………………………………………………………………………………………9 104 (13) (60) (55)
Retained earnings at end of quarter ………………………………………………………………………………………………………………………………………………………………………………………………………8,785 9,474 9,135 10,064 9,963
INCOME STATEMENT IN RATIO FORMAT
Net sales, receipts, and operating revenues ……………………………………………………………………………………………………………………………………………………………………………………………………………100.00 100.00 100.00 100.00 100.00
Depreciation, depletion, and amortization of property,
plant, and equipment …………………………………………………………………………………………………………………………………………………………………………………3.07 2.70 3.24 2.99 2.96
All other operating costs and expenses ……………………………………………………………………………………………………………………………………………………………………………………………………………………………90.60 90.14 85.83 86.55 89.05
Income (loss) from operations …………………………………………………………………………………………………………………………………………………………………………………………………………………6.33 7.16 10.92 10.46 8.00
Interest expense ………………………………………………………………………………………………………………………………………………………………………………………………………………………………………………3.01 2.67 2.85 2.71 2.71
Dividend income …………………………………………………………………………………………………………………………………………………………………………………………………………………………………………………0.01 0.00 0.02 0.00 0.02
Other recurring nonoperating income (expense), including
interest income, royalties, minority interest, etc. …………………………………………………………………………………………………………………………………………………………………………………………………………………………………………………0.26 0.31 0.42 (0.24) 0.12
Nonrecurring items, including gain (loss) on sale of assets,
restructuring costs, asset writedowns, etc. ………………………………………………………………………………………………………………………………………………………………………………………………………………………………………………………………………………………………………(0.58) (0.08) 0.80 7.29 (0.65)
Net income (loss) of foreign branches and equity in earnings (losses)
of nonconsolidated subsidiaries, net of foreign taxes …………………………………………………………………………………………………………………………………………………………………………………………………………(1.14) (0.17) 0.28 0.41 (0.28)
Income (loss) before income taxes …………………………………………………………………………………………………………………………………………………………………………………………………………………1.87 4.55 9.59 15.21 4.50
Provision for current and deferred domestic income taxes ………………………………………………………………………………………………………………………………………………………………………………………………………(0.58) 1.09 1.68 1.61 1.56
Income (loss) after income taxes ………………………………………………………………………………………………………………………………………………………………………………………………………………………2.45 3.46 7.91 13.60 2.94
OPERATING RATIOS
(see explanatory notes)
Annual rate of profit on stockholders' equity at end of period:
Before income taxes …………………………………………………………………………………………………………………………………………………………………………………………………………………………………………4.71 11.88 22.64 41.14 13.21
After income taxes …………………………………………………………………………………………………………………………………………………………………………………………………………………………………………6.17 9.03 18.67 36.79 8.62
Annual rate of profit on total assets:
Before income taxes …………………………………………………………………………………………………………………………………………………………………………………………………………………………………………1.74 4.36 8.23 14.19 4.23
After income taxes ……………………………………………………………………………………………………………………………………………………………………………………………………………………………………………2.28 3.31 6.79 12.69 2.76
Table 52.0 -- Income Statement For Corporations in NAICS Manufacturing Subsector 321,
Total Assets $25 Million and Over
See the Survey Methodology section of the Introduction for information on survey design, estimation, and sampling error.
Wood Products
Total Assets $25 Million and Over
(million dollars)
(percent of net sales)
(percent)
104U.S. Census Bureau, Quarterly Financial Report, 2014 Quarter 4

Table with row headers in column A with column headers in rows 5 and 6
Item
4Q_
2013_
1Q_
2014_
2Q_
2014_
3Q_
2014_
4Q_
2014_
ASSETS
Cash and demand deposits in the U.S. ……………………………………………………………………………………………………………………………………………………………………………………………………………………………2,229 2,175 2,477 2,461 1,823
Time deposits in the U.S., including negotiable certificates of deposit …………………………………………………………………………………………………………………………………………………………………………………………51 53 41 4 15
Cash and deposits outside the U.S. .……………………………………………………………………………………………………………………………………………………………………………………………………………………………………………32 30 30 15 1
Total cash on hand and in banks ……………………………………………………………………………………………………………………………………………………………………………………………………………………………2,312 2,258 2,548 2,480 1,839
U.S. Treasury and Federal agency securities:
a. Subject to agreements to sell …………………………………………………………………………………………………………………………………………………………………………………………………………………………………0 0 0 0 0
b. Other, due in 1 year or less ……………………………………………………………………………………………………………………………………………………………………………………………………………………………………20 23 23 24 23
Commercial and finance company paper of U.S. issuers …………………………………………………………………………………………………………………………………………………………………………………………………………13,637 13,437 13,563 14,401 14,424
State and local government securities, due in 1 year or less …………………………………………………………………………………………………………………………………………………………………………………………………………4 1 3 0 1
Foreign securities, due in 1 year or less ………………………………………………………………………………………………………………………………………………………………………………………………………………………………0 0 0 0 0
Other short-term financial investments …………………………………………………………………………………………………………………………………………………………………………………………306 275 204 194 175
Total cash, U.S. Government and other securities ……………………………………………………………………………………………………………………………………………………………………………………………………16,280 15,993 16,341 17,099 16,461
Trade receivables from the U.S. Government …………………………………………………………………………………………………………………………………………………………………………………………………………………………1 1 3 3 2
Other trade accounts and trade notes receivable
(less allowance for doubtful accounts) ………………………………………………………………………………………………………………………………………………………………………3,254 3,655 3,626 3,405 2,938
Total receivables ………………………………………………………………………………………………………………………………………………………………………………………………………………………………3,256 3,657 3,629 3,408 2,940
Inventories ……………………………………………………………………………………………………………………………………………………………………………………………………………………………………………………5,893 5,602 4,991 4,915 4,969
All other current assets …………………………………………………………………………………………………………………………………………………………………………………………………………………………………………1,435 1,109 1,060 1,212 1,319
Total current assets ……………………………………………………………………………………………………………………………………………………………………………………………………………………………………26,864 26,361 26,022 26,633 25,690
Property, plant, and equipment ……………………………………………………………………………………………………………………………………………………………………………………………………………………………………………26,877 27,183 27,655 27,464 27,748
Land and mineral rights …………………………………………………………………………………………………………………………………………………………………………………………………………………………………………12,622 12,895 12,599 12,562 13,076
Less: Accumulated depreciation, depletion, and amortization ………………………………………………………………………………………………………………………………………………………………………………………………18,840 19,320 19,088 19,093 19,352
Net property, plant, and equipment …………………………………………………………………………………………………………………………………………………………………………………………………………………20,658 20,758 21,167 20,933 21,471
U.S. Treasury and Federal agency securities, due in more than 1 year …………………………………………………………………………………………………………………………………………………………………………………………0 0 0 0 0
All other noncurrent assets, including investment in nonconsolidated
entities, long-term investments, intangibles, etc. .………………………………………………………………………………………………………………………………………………………………………………………………………………………………11,894 10,958 10,688 8,308 8,804
Total Assets …………………………………………………………………………………………………………………………………………………………………………………………………………………………………………………59,417 58,077 57,876 55,874 55,965
LIABILITIES AND STOCKHOLDERS' EQUITY
Short-term debt, original maturity of 1 year or less:
a. Loans from banks ………………………………………………………………………………………………………………………………………………………………………………………………………………………………………392 513 276 200 158
b. Commercial paper ………………………………………………………………………………………………………………………………………………………………………………………………………………………………………17 33 35 26 30
c. Other short-term loans ………………………………………………………………………………………………………………………………………………………………………………………………………………………………201 158 171 95 152
Advances and prepayments by the U.S. Government …………………………………………………………………………………………………………………………………………………………………………………………………………0 0 0 0 0
Trade accounts and trade notes payable ………………………………………………………………………………………………………………………………………………………………………………………………………………………2,486 2,438 2,584 2,561 2,352
Income taxes accrued, prior and current years, net of payments:
a. Federal ……………………………………………………………………………………………………………………………………………………………………………………………………………………………………………………291 293 270 293 323
b. Other ………………………………………………………………………………………………………………………………………………………………………………………………………………………………………………57 56 47 40 28
Current portion of long-term debt, due in 1 year or less:
a. Loans from banks ……………………………………………………………………………………………………………………………………………………………………………………………………………………………………464 421 248 175 187
b. Bonds and debentures …………………………………………………………………………………………………………………………………………………………………………………………………………………………………2 2 2 2 45
c. Other long-term loans ………………………………………………………………………………………………………………………………………………………………………………………………………………………………………547 364 129 100 179
All other current liabilities, including excise and
sales taxes, and accrued expenses ……………………………………………………………………………………………………………………………………………………………………………2,595 2,161 2,366 2,584 2,275
Total current liabilities ………………………………………………………………………………………………………………………………………………………………………………………………………………………………7,052 6,440 6,128 6,076 5,729
Long-term debt, due in more than 1 year:
a. Loans from banks ………………………………………………………………………………………………………………………………………………………………………………………………………………………………………………4,785 5,236 5,109 4,843 5,148
b. Bonds and debentures ………………………………………………………………………………………………………………………………………………………………………………………………………………………………………5,181 5,200 5,614 5,648 6,053
c. Other long-term loans …………………………………………………………………………………………………………………………………………………………………………………………………………………………………………4,388 4,122 4,241 4,229 4,161
All other noncurrent liabilities, including deferred income taxes,
capitalized leases, and minority stockholders' interest
in consolidated domestic corporations ………………………………………………………………………………………………………………………………………………………………………………16,074 15,774 15,736 15,812 16,966
Total liabilities ……………………………………………………………………………………………………………………………………………………………………………………………………………………………………37,481 36,772 36,828 36,607 38,056
Capital stock and other capital …………………………………………………………………………………………………………………………………………………………………………………………………………………………………15,063 13,869 14,175 11,715 11,541
Retained earnings ……………………………………………………………………………………………………………………………………………………………………………………………………………………………………8,785 9,474 9,135 10,064 9,963
Cumulative foreign currency translation adjustment …………………………………………………………………………………………………………………………………………………………………………………………………………419 370 409 356 250
Other stockholders' equity items, including unearned
compensation and ESOP debt guarantees ……………………………………………………………………………………………………………………………………………………………………(1,645) (1,715) (1,913) (2,165) (3,010)
Less: Treasury stock at cost ………………………………………………………………………………………………………………………………………………………………………………………………………………………………………685 693 759 703 834
Stockholders' equity ………………………………………………………………………………………………………………………………………………………………………………………………………………………………21,936 21,305 21,048 19,267 17,909
Total Liabilities and Stockholders' Equity ……………………………………………………………………………………………………………………………………………………59,417 58,077 57,876 55,874 55,965
NET WORKING CAPITAL
Excess of total current assets over total current liabilities ……………………………………………………………………………………………………………………………………………………………………………19,812 19,921 19,894 20,558 19,961
(million dollars)
Wood Products
Total Assets $25 Million and Over
Table 52.1 -- Balance Sheet For Corporations in NAICS Manufacturing Subsector 321,
Total Assets $25 Million and Over
See the Survey Methodology section of the Introduction for information on survey design, estimation, and sampling error.
105U.S. Census Bureau, Quarterly Financial Report, 2014 Quarter 4

Table with row headers in column A with column headers in rows 5 and 6
Item
4Q_
2013_
1Q_
2014_
2Q_
2014_
3Q_
2014_
4Q_
2014_
Net sales, receipts, and operating revenues ………………………………………………………………………………………………………………………………………………………………………………………………………21,280 18,644 23,982 27,297 23,110
Depreciation, depletion, and amortization of property,
plant, and equipment ……………………………………………………………………………………………………………………………………………………………………1,301 1,252 1,208 1,269 1,257
All other operating costs and expenses …………………………………………………………………………………………………………………………………………………………………………………………………18,627 17,550 20,534 23,072 20,667
Income (loss) from operations …………………………………………………………………………………………………………………………………………...……………………………………………………………1,353 (158) 2,240 2,956 1,186
Interest expense …………………………………………………………………………………………………………………………………………………………………………………………………………………………………………599 653 648 676 654
Dividend income …………………………………………………………………………………………………………………………………………………………………………………………………………………………………………………4 17 26 5 17
Other recurring nonoperating income (expense), including
interest income, royalties, minority interest, etc. ………………………………………………………………………………………………………………………………………………………………………………………………………………………………………………314 264 95 830 996
Nonrecurring items, including gain (loss) on sale of assets,
restructuring costs, asset writedowns, etc. …………………………………………………………………………………………………………………………………………………………………(152) 3 (50) 17 (432)
Net income (loss) of foreign branches and equity in earnings (losses)
of domestic and foreign nonconsolidated subsidiaries and other
investments accounted for by the equity method, net of foreign taxes ………………………………………………………………………………………………………………………………………………………………………………………………………………153 92 463 419 195
Income (loss) before income taxes ………………………………………………………………………………………………………………………………………………………………………………………………………1,072 (435) 2,125 3,551 1,308
Provision for current and deferred domestic income taxes:
a. Federal …………………………………………………………………………………………………………………………………………………………………………………………………………………………………………………22 (130) 370 700 336
b. Other …………………………………………………………………………………………………………………………………………………………………………………………………………………………………………………32 4 12 (185) (12)
Income (loss) after income taxes ……………………………………………………………………………………………………………………………………………………………………………………………………1,019 (310) 1,743 3,036 985
Extraordinary gains (losses), net of taxes ……………………………………………………………………………………………………………………………………………………………………………………………………………0 0 0 0 0
Cumulative effect of accounting changes, net of taxes ……………………………………………………………………………………………………………………………………………………………………………………………0 0 0 0 0
Net income (loss) for quarter ………………………………………………………………………………………………………………………………………………………………………………………………………………1,019 (310) 1,743 3,036 985
Cash dividends charged to retained earnings in this quarter ………………………………………………………………………………………………………………………………………………………………………………………567 361 907 284 726
Net income retained in business …………………………………………………………………………………………………………………………………………………………………………………………………………………452 (671) 836 2,752 259
Retained earnings at beginning of quarter ………………………………………………………………………………………………………………………………………………………………………………………………………………………11,621 12,172 7,560 8,572 9,996
Other direct credits (charges) to retained earnings (net), including
stock and other non-cash dividends, etc. ……………………………………………………………………………………………………………………………………………………………………………………………………………………………(30) (206) (10) (134) (61)
Retained earnings at end of quarter ………………………………………………………………………………………………………………………………………………………………………………………………………12,042 11,295 8,386 11,189 10,194
INCOME STATEMENT IN RATIO FORMAT
Net sales, receipts, and operating revenues ……………………………………………………………………………………………………………………………………………………………………………………………………………100.00 100.00 100.00 100.00 100.00
Depreciation, depletion, and amortization of property,
plant, and equipment …………………………………………………………………………………………………………………………………………………………………………………6.11 6.72 5.04 4.65 5.44
All other operating costs and expenses ……………………………………………………………………………………………………………………………………………………………………………………………………………………………87.53 94.13 85.63 84.52 89.43
Income (loss) from operations …………………………………………………………………………………………………………………………………………………………………………………………………………………6.36 (0.85) 9.34 10.83 5.13
Interest expense ………………………………………………………………………………………………………………………………………………………………………………………………………………………………………………2.82 3.51 2.70 2.48 2.83
Dividend income …………………………………………………………………………………………………………………………………………………………………………………………………………………………………………………0.02 0.09 0.11 0.02 0.07
Other recurring nonoperating income (expense), including
interest income, royalties, minority interest, etc. …………………………………………………………………………………………………………………………………………………………………………………………………………………………………………………1.47 1.42 0.40 3.04 4.31
Nonrecurring items, including gain (loss) on sale of assets,
restructuring costs, asset writedowns, etc. ………………………………………………………………………………………………………………………………………………………………………………………………………………………………………………………………………………………………………(0.72) 0.02 (0.21) 0.06 (1.87)
Net income (loss) of foreign branches and equity in earnings (losses)
of nonconsolidated subsidiaries, net of foreign taxes …………………………………………………………………………………………………………………………………………………………………………………………………………0.72 0.50 1.93 1.54 0.84
Income (loss) before income taxes …………………………………………………………………………………………………………………………………………………………………………………………………………………5.04 (2.33) 8.86 13.01 5.66
Provision for current and deferred domestic income taxes ………………………………………………………………………………………………………………………………………………………………………………………………………0.25 (0.67) 1.59 1.89 1.40
Income (loss) after income taxes ………………………………………………………………………………………………………………………………………………………………………………………………………………………4.79 (1.66) 7.27 11.12 4.26
OPERATING RATIOS
(see explanatory notes)
Annual rate of profit on stockholders' equity at end of period:
Before income taxes …………………………………………………………………………………………………………………………………………………………………………………………………………………………………………4.84 (2.03) 10.18 16.50 6.14
After income taxes …………………………………………………………………………………………………………………………………………………………………………………………………………………………………………4.60 (1.45) 8.35 14.10 4.62
Annual rate of profit on total assets:
Before income taxes …………………………………………………………………………………………………………………………………………………………………………………………………………………………………………2.57 (1.05) 5.11 8.53 3.24
After income taxes ……………………………………………………………………………………………………………………………………………………………………………………………………………………………………………2.45 (0.74) 4.19 7.29 2.44
Table 53.0 -- Income Statement For Corporations in NAICS Manufacturing Subsector 327,
Total Assets $25 Million and Over
See the Survey Methodology section of the Introduction for information on survey design, estimation, and sampling error.
Nonmetallic Mineral Products
Total Assets $25 Million and Over
(million dollars)
(percent of net sales)
(percent)
106U.S. Census Bureau, Quarterly Financial Report, 2014 Quarter 4

Table with row headers in column A with column headers in rows 5 and 6
Item
4Q_
2013_
1Q_
2014_
2Q_
2014_
3Q_
2014_
4Q_
2014_
ASSETS
Cash and demand deposits in the U.S. ……………………………………………………………………………………………………………………………………………………………………………………………………………………………6,719 4,780 4,838 5,028 4,681
Time deposits in the U.S., including negotiable certificates of deposit …………………………………………………………………………………………………………………………………………………………………………………………109 71 82 39 26
Cash and deposits outside the U.S. .……………………………………………………………………………………………………………………………………………………………………………………………………………………………………………177 260 249 317 213
Total cash on hand and in banks ……………………………………………………………………………………………………………………………………………………………………………………………………………………………7,005 5,111 5,169 5,383 4,920
U.S. Treasury and Federal agency securities:
a. Subject to agreements to sell …………………………………………………………………………………………………………………………………………………………………………………………………………………………………0 0 0 0 0
b. Other, due in 1 year or less ……………………………………………………………………………………………………………………………………………………………………………………………………………………………………3 3 12 10 8
Commercial and finance company paper of U.S. issuers …………………………………………………………………………………………………………………………………………………………………………………………………………114 398 62 117 185
State and local government securities, due in 1 year or less …………………………………………………………………………………………………………………………………………………………………………………………………………2 2 2 2 2
Foreign securities, due in 1 year or less ………………………………………………………………………………………………………………………………………………………………………………………………………………………………0 0 0 0 0
Other short-term financial investments …………………………………………………………………………………………………………………………………………………………………………………………175 168 138 188 194
Total cash, U.S. Government and other securities ……………………………………………………………………………………………………………………………………………………………………………………………………7,298 5,681 5,382 5,700 5,309
Trade receivables from the U.S. Government …………………………………………………………………………………………………………………………………………………………………………………………………………………………242 209 102 118 98
Other trade accounts and trade notes receivable
(less allowance for doubtful accounts) ………………………………………………………………………………………………………………………………………………………………………9,200 9,957 11,699 13,005 11,052
Total receivables ………………………………………………………………………………………………………………………………………………………………………………………………………………………………9,442 10,166 11,802 13,123 11,150
Inventories ……………………………………………………………………………………………………………………………………………………………………………………………………………………………………………………11,753 12,343 12,661 12,822 12,672
All other current assets …………………………………………………………………………………………………………………………………………………………………………………………………………………………………………4,847 4,916 4,936 4,780 4,743
Total current assets ……………………………………………………………………………………………………………………………………………………………………………………………………………………………………33,341 33,106 34,781 36,425 33,874
Property, plant, and equipment ……………………………………………………………………………………………………………………………………………………………………………………………………………………………………………93,378 93,589 94,886 97,260 96,206
Land and mineral rights …………………………………………………………………………………………………………………………………………………………………………………………………………………………………………16,952 16,809 17,085 17,132 17,003
Less: Accumulated depreciation, depletion, and amortization ………………………………………………………………………………………………………………………………………………………………………………………………54,610 55,262 56,804 59,151 58,174
Net property, plant, and equipment …………………………………………………………………………………………………………………………………………………………………………………………………………………55,720 55,136 55,167 55,241 55,035
U.S. Treasury and Federal agency securities, due in more than 1 year …………………………………………………………………………………………………………………………………………………………………………………………4 4 3 0 5
All other noncurrent assets, including investment in nonconsolidated
entities, long-term investments, intangibles, etc. .………………………………………………………………………………………………………………………………………………………………………………………………………………………………77,552 78,098 76,540 74,831 72,798
Total Assets …………………………………………………………………………………………………………………………………………………………………………………………………………………………………………………166,617 166,344 166,492 166,497 161,712
LIABILITIES AND STOCKHOLDERS' EQUITY
Short-term debt, original maturity of 1 year or less:
a. Loans from banks ………………………………………………………………………………………………………………………………………………………………………………………………………………………………………1,035 972 1,079 1,267 674
b. Commercial paper ………………………………………………………………………………………………………………………………………………………………………………………………………………………………………69 89 174 125 110
c. Other short-term loans ………………………………………………………………………………………………………………………………………………………………………………………………………………………………1,789 1,847 1,512 1,583 1,383
Advances and prepayments by the U.S. Government …………………………………………………………………………………………………………………………………………………………………………………………………………0 0 0 0 0
Trade accounts and trade notes payable ………………………………………………………………………………………………………………………………………………………………………………………………………………………7,960 7,841 9,400 9,224 8,999
Income taxes accrued, prior and current years, net of payments:
a. Federal ……………………………………………………………………………………………………………………………………………………………………………………………………………………………………………………80 101 208 266 104
b. Other ………………………………………………………………………………………………………………………………………………………………………………………………………………………………………………38 56 36 52 60
Current portion of long-term debt, due in 1 year or less:
a. Loans from banks ……………………………………………………………………………………………………………………………………………………………………………………………………………………………………601 516 420 447 420
b. Bonds and debentures …………………………………………………………………………………………………………………………………………………………………………………………………………………………………164 59 716 810 572
c. Other long-term loans ………………………………………………………………………………………………………………………………………………………………………………………………………………………………………1,274 1,550 1,593 1,422 1,324
All other current liabilities, including excise and
sales taxes, and accrued expenses ……………………………………………………………………………………………………………………………………………………………………………6,126 5,933 5,992 5,877 5,743
Total current liabilities ………………………………………………………………………………………………………………………………………………………………………………………………………………………………19,138 18,963 21,129 21,073 19,391
Long-term debt, due in more than 1 year:
a. Loans from banks ………………………………………………………………………………………………………………………………………………………………………………………………………………………………………………7,765 9,146 9,796 9,946 9,370
b. Bonds and debentures ………………………………………………………………………………………………………………………………………………………………………………………………………………………………………13,912 13,929 12,756 11,745 11,689
c. Other long-term loans …………………………………………………………………………………………………………………………………………………………………………………………………………………………………………18,923 19,154 18,753 18,761 18,579
All other noncurrent liabilities, including deferred income taxes,
capitalized leases, and minority stockholders' interest
in consolidated domestic corporations ………………………………………………………………………………………………………………………………………………………………………………18,221 19,536 20,528 18,869 17,455
Total liabilities ……………………………………………………………………………………………………………………………………………………………………………………………………………………………………77,959 80,728 82,962 80,393 76,483
Capital stock and other capital …………………………………………………………………………………………………………………………………………………………………………………………………………………………………82,003 82,302 83,242 82,179 84,407
Retained earnings ……………………………………………………………………………………………………………………………………………………………………………………………………………………………………12,042 11,295 8,386 11,189 10,194
Cumulative foreign currency translation adjustment …………………………………………………………………………………………………………………………………………………………………………………………………………(23) (218) 381 5,865 4,906
Other stockholders' equity items, including unearned
compensation and ESOP debt guarantees ……………………………………………………………………………………………………………………………………………………………………574 153 5 (4,357) (5,538)
Less: Treasury stock at cost ………………………………………………………………………………………………………………………………………………………………………………………………………………………………………5,938 7,917 8,485 8,771 8,740
Stockholders' equity ………………………………………………………………………………………………………………………………………………………………………………………………………………………………88,658 85,616 83,530 86,104 85,228
Total Liabilities and Stockholders' Equity ……………………………………………………………………………………………………………………………………………………166,617 166,344 166,492 166,497 161,712
NET WORKING CAPITAL
Excess of total current assets over total current liabilities ……………………………………………………………………………………………………………………………………………………………………………14,203 14,144 13,652 15,353 14,483
(million dollars)
Nonmetallic Mineral Products
Total Assets $25 Million and Over
Table 53.1 -- Balance Sheet For Corporations in NAICS Manufacturing Subsector 327,
Total Assets $25 Million and Over
See the Survey Methodology section of the Introduction for information on survey design, estimation, and sampling error.
107U.S. Census Bureau, Quarterly Financial Report, 2014 Quarter 4
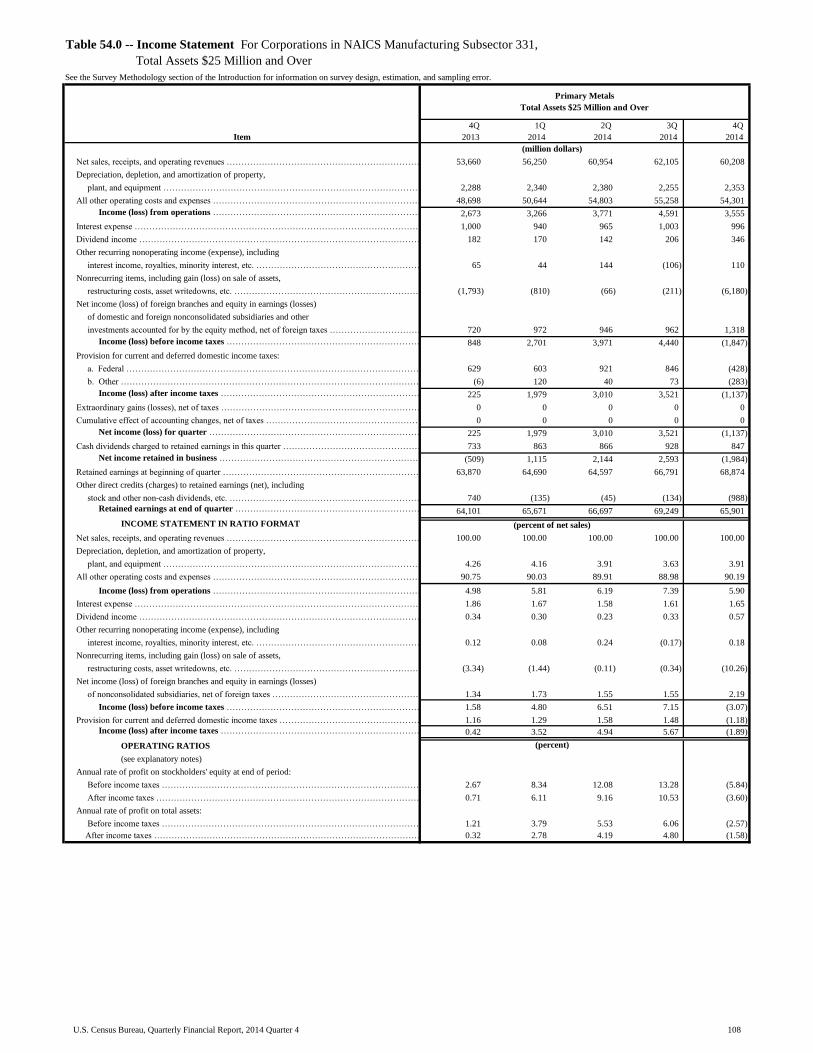
Table with row headers in column A with column headers in rows 5 and 6
Item
4Q_
2013_
1Q_
2014_
2Q_
2014_
3Q_
2014_
4Q_
2014_
Net sales, receipts, and operating revenues ………………………………………………………………………………………………………………………………………………………………………………………………………53,660 56,250 60,954 62,105 60,208
Depreciation, depletion, and amortization of property,
plant, and equipment ……………………………………………………………………………………………………………………………………………………………………2,288 2,340 2,380 2,255 2,353
All other operating costs and expenses …………………………………………………………………………………………………………………………………………………………………………………………………48,698 50,644 54,803 55,258 54,301
Income (loss) from operations …………………………………………………………………………………………………………………………………………...……………………………………………………………2,673 3,266 3,771 4,591 3,555
Interest expense …………………………………………………………………………………………………………………………………………………………………………………………………………………………………………1,000 940 965 1,003 996
Dividend income …………………………………………………………………………………………………………………………………………………………………………………………………………………………………………………182 170 142 206 346
Other recurring nonoperating income (expense), including
interest income, royalties, minority interest, etc. ………………………………………………………………………………………………………………………………………………………………………………………………………………………………………………65 44 144 (106) 110
Nonrecurring items, including gain (loss) on sale of assets,
restructuring costs, asset writedowns, etc. …………………………………………………………………………………………………………………………………………………………………(1,793) (810) (66) (211) (6,180)
Net income (loss) of foreign branches and equity in earnings (losses)
of domestic and foreign nonconsolidated subsidiaries and other
investments accounted for by the equity method, net of foreign taxes ………………………………………………………………………………………………………………………………………………………………………………………………………………720 972 946 962 1,318
Income (loss) before income taxes ………………………………………………………………………………………………………………………………………………………………………………………………………848 2,701 3,971 4,440 (1,847)
Provision for current and deferred domestic income taxes:
a. Federal …………………………………………………………………………………………………………………………………………………………………………………………………………………………………………………629 603 921 846 (428)
b. Other …………………………………………………………………………………………………………………………………………………………………………………………………………………………………………………(6) 120 40 73 (283)
Income (loss) after income taxes ……………………………………………………………………………………………………………………………………………………………………………………………………225 1,979 3,010 3,521 (1,137)
Extraordinary gains (losses), net of taxes ……………………………………………………………………………………………………………………………………………………………………………………………………………0 0 0 0 0
Cumulative effect of accounting changes, net of taxes ……………………………………………………………………………………………………………………………………………………………………………………………0 0 0 0 0
Net income (loss) for quarter ………………………………………………………………………………………………………………………………………………………………………………………………………………225 1,979 3,010 3,521 (1,137)
Cash dividends charged to retained earnings in this quarter ………………………………………………………………………………………………………………………………………………………………………………………733 863 866 928 847
Net income retained in business …………………………………………………………………………………………………………………………………………………………………………………………………………………(509) 1,115 2,144 2,593 (1,984)
Retained earnings at beginning of quarter ………………………………………………………………………………………………………………………………………………………………………………………………………………………63,870 64,690 64,597 66,791 68,874
Other direct credits (charges) to retained earnings (net), including
stock and other non-cash dividends, etc. ……………………………………………………………………………………………………………………………………………………………………………………………………………………………740 (135) (45) (134) (988)
Retained earnings at end of quarter ………………………………………………………………………………………………………………………………………………………………………………………………………64,101 65,671 66,697 69,249 65,901
INCOME STATEMENT IN RATIO FORMAT
Net sales, receipts, and operating revenues ……………………………………………………………………………………………………………………………………………………………………………………………………………100.00 100.00 100.00 100.00 100.00
Depreciation, depletion, and amortization of property,
plant, and equipment …………………………………………………………………………………………………………………………………………………………………………………4.26 4.16 3.91 3.63 3.91
All other operating costs and expenses ……………………………………………………………………………………………………………………………………………………………………………………………………………………………90.75 90.03 89.91 88.98 90.19
Income (loss) from operations …………………………………………………………………………………………………………………………………………………………………………………………………………………4.98 5.81 6.19 7.39 5.90
Interest expense ………………………………………………………………………………………………………………………………………………………………………………………………………………………………………………1.86 1.67 1.58 1.61 1.65
Dividend income …………………………………………………………………………………………………………………………………………………………………………………………………………………………………………………0.34 0.30 0.23 0.33 0.57
Other recurring nonoperating income (expense), including
interest income, royalties, minority interest, etc. …………………………………………………………………………………………………………………………………………………………………………………………………………………………………………………0.12 0.08 0.24 (0.17) 0.18
Nonrecurring items, including gain (loss) on sale of assets,
restructuring costs, asset writedowns, etc. ………………………………………………………………………………………………………………………………………………………………………………………………………………………………………………………………………………………………………(3.34) (1.44) (0.11) (0.34) (10.26)
Net income (loss) of foreign branches and equity in earnings (losses)
of nonconsolidated subsidiaries, net of foreign taxes …………………………………………………………………………………………………………………………………………………………………………………………………………1.34 1.73 1.55 1.55 2.19
Income (loss) before income taxes …………………………………………………………………………………………………………………………………………………………………………………………………………………1.58 4.80 6.51 7.15 (3.07)
Provision for current and deferred domestic income taxes ………………………………………………………………………………………………………………………………………………………………………………………………………1.16 1.29 1.58 1.48 (1.18)
Income (loss) after income taxes ………………………………………………………………………………………………………………………………………………………………………………………………………………………0.42 3.52 4.94 5.67 (1.89)
OPERATING RATIOS
(see explanatory notes)
Annual rate of profit on stockholders' equity at end of period:
Before income taxes …………………………………………………………………………………………………………………………………………………………………………………………………………………………………………2.67 8.34 12.08 13.28 (5.84)
After income taxes …………………………………………………………………………………………………………………………………………………………………………………………………………………………………………0.71 6.11 9.16 10.53 (3.60)
Annual rate of profit on total assets:
Before income taxes …………………………………………………………………………………………………………………………………………………………………………………………………………………………………………1.21 3.79 5.53 6.06 (2.57)
After income taxes ……………………………………………………………………………………………………………………………………………………………………………………………………………………………………………0.32 2.78 4.19 4.80 (1.58)
Table 54.0 -- Income Statement For Corporations in NAICS Manufacturing Subsector 331,
Total Assets $25 Million and Over
See the Survey Methodology section of the Introduction for information on survey design, estimation, and sampling error.
Primary Metals
Total Assets $25 Million and Over
(million dollars)
(percent of net sales)
(percent)
108U.S. Census Bureau, Quarterly Financial Report, 2014 Quarter 4

Table with row headers in column A with column headers in rows 5 and 6
Item
4Q_
2013_
1Q_
2014_
2Q_
2014_
3Q_
2014_
4Q_
2014_
ASSETS
Cash and demand deposits in the U.S. ……………………………………………………………………………………………………………………………………………………………………………………………………………………………8,035 8,171 7,668 9,486 7,987
Time deposits in the U.S., including negotiable certificates of deposit …………………………………………………………………………………………………………………………………………………………………………………………725 309 335 446 778
Cash and deposits outside the U.S. .……………………………………………………………………………………………………………………………………………………………………………………………………………………………………………247 274 360 305 362
Total cash on hand and in banks ……………………………………………………………………………………………………………………………………………………………………………………………………………………………9,006 8,755 8,363 10,238 9,128
U.S. Treasury and Federal agency securities:
a. Subject to agreements to sell …………………………………………………………………………………………………………………………………………………………………………………………………………………………………30 102 102 103 103
b. Other, due in 1 year or less ……………………………………………………………………………………………………………………………………………………………………………………………………………………………………1,547 1,922 1,899 1,885 1,930
Commercial and finance company paper of U.S. issuers …………………………………………………………………………………………………………………………………………………………………………………………………………326 309 484 514 501
State and local government securities, due in 1 year or less …………………………………………………………………………………………………………………………………………………………………………………………………………6 11 10 9 6
Foreign securities, due in 1 year or less ………………………………………………………………………………………………………………………………………………………………………………………………………………………………2 2 2 2 2
Other short-term financial investments …………………………………………………………………………………………………………………………………………………………………………………………1,631 1,181 1,049 1,064 1,036
Total cash, U.S. Government and other securities ……………………………………………………………………………………………………………………………………………………………………………………………………12,548 12,280 11,910 13,814 12,705
Trade receivables from the U.S. Government …………………………………………………………………………………………………………………………………………………………………………………………………………………………3 29 45 31 26
Other trade accounts and trade notes receivable
(less allowance for doubtful accounts) ………………………………………………………………………………………………………………………………………………………………………23,182 25,949 26,802 27,560 24,870
Total receivables ………………………………………………………………………………………………………………………………………………………………………………………………………………………………23,185 25,977 26,847 27,591 24,896
Inventories ……………………………………………………………………………………………………………………………………………………………………………………………………………………………………………………32,933 34,152 34,872 36,956 38,121
All other current assets …………………………………………………………………………………………………………………………………………………………………………………………………………………………………………17,510 17,101 17,018 17,855 17,118
Total current assets ……………………………………………………………………………………………………………………………………………………………………………………………………………………………………86,176 89,511 90,648 96,216 92,840
Property, plant, and equipment ……………………………………………………………………………………………………………………………………………………………………………………………………………………………………………162,910 162,785 164,570 165,976 171,940
Land and mineral rights …………………………………………………………………………………………………………………………………………………………………………………………………………………………………………9,590 9,386 9,329 9,307 9,072
Less: Accumulated depreciation, depletion, and amortization ………………………………………………………………………………………………………………………………………………………………………………………………75,875 74,736 76,278 77,674 85,575
Net property, plant, and equipment …………………………………………………………………………………………………………………………………………………………………………………………………………………96,626 97,434 97,622 97,609 95,437
U.S. Treasury and Federal agency securities, due in more than 1 year …………………………………………………………………………………………………………………………………………………………………………………………20 25 29 27 23
All other noncurrent assets, including investment in nonconsolidated
entities, long-term investments, intangibles, etc. .………………………………………………………………………………………………………………………………………………………………………………………………………………………………98,456 97,879 98,924 99,275 99,724
Total Assets …………………………………………………………………………………………………………………………………………………………………………………………………………………………………………………281,278 284,849 287,223 293,127 288,024
LIABILITIES AND STOCKHOLDERS' EQUITY
Short-term debt, original maturity of 1 year or less:
a. Loans from banks ………………………………………………………………………………………………………………………………………………………………………………………………………………………………………2,445 2,527 1,788 2,437 2,242
b. Commercial paper ………………………………………………………………………………………………………………………………………………………………………………………………………………………………………0 4 40 140 34
c. Other short-term loans ………………………………………………………………………………………………………………………………………………………………………………………………………………………………3,841 4,146 3,611 3,778 4,797
Advances and prepayments by the U.S. Government …………………………………………………………………………………………………………………………………………………………………………………………………………0 0 0 0 0
Trade accounts and trade notes payable ………………………………………………………………………………………………………………………………………………………………………………………………………………………18,817 20,102 20,798 21,583 21,413
Income taxes accrued, prior and current years, net of payments:
a. Federal ……………………………………………………………………………………………………………………………………………………………………………………………………………………………………………………290 579 893 493 325
b. Other ………………………………………………………………………………………………………………………………………………………………………………………………………………………………………………158 155 166 145 141
Current portion of long-term debt, due in 1 year or less:
a. Loans from banks ……………………………………………………………………………………………………………………………………………………………………………………………………………………………………790 719 814 767 1,402
b. Bonds and debentures …………………………………………………………………………………………………………………………………………………………………………………………………………………………………2,031 2,871 3,438 2,699 1,695
c. Other long-term loans ………………………………………………………………………………………………………………………………………………………………………………………………………………………………………1,114 1,266 837 855 866
All other current liabilities, including excise and
sales taxes, and accrued expenses ……………………………………………………………………………………………………………………………………………………………………………10,383 10,031 10,730 11,349 10,727
Total current liabilities ………………………………………………………………………………………………………………………………………………………………………………………………………………………………39,868 42,399 43,115 44,245 43,642
Long-term debt, due in more than 1 year:
a. Loans from banks ………………………………………………………………………………………………………………………………………………………………………………………………………………………………………………10,279 10,733 11,757 12,375 11,989
b. Bonds and debentures ………………………………………………………………………………………………………………………………………………………………………………………………………………………………………48,069 47,232 45,129 48,172 48,177
c. Other long-term loans …………………………………………………………………………………………………………………………………………………………………………………………………………………………………………14,011 14,150 14,452 14,465 14,195
All other noncurrent liabilities, including deferred income taxes,
capitalized leases, and minority stockholders' interest
in consolidated domestic corporations ………………………………………………………………………………………………………………………………………………………………………………41,967 40,731 41,264 40,093 43,569
Total liabilities ……………………………………………………………………………………………………………………………………………………………………………………………………………………………………154,194 155,246 155,717 159,350 161,571
Capital stock and other capital …………………………………………………………………………………………………………………………………………………………………………………………………………………………………88,766 88,606 88,612 87,994 89,603
Retained earnings ……………………………………………………………………………………………………………………………………………………………………………………………………………………………………64,101 65,671 66,697 69,249 65,901
Cumulative foreign currency translation adjustment …………………………………………………………………………………………………………………………………………………………………………………………………………475 782 1,099 712 (1,958)
Other stockholders' equity items, including unearned
compensation and ESOP debt guarantees ……………………………………………………………………………………………………………………………………………………………………(10,842) (10,808) (10,517) (9,741) (12,503)
Less: Treasury stock at cost ………………………………………………………………………………………………………………………………………………………………………………………………………………………………………15,417 14,647 14,384 14,437 14,590
Stockholders' equity ………………………………………………………………………………………………………………………………………………………………………………………………………………………………127,084 129,603 131,506 133,777 126,453
Total Liabilities and Stockholders' Equity ……………………………………………………………………………………………………………………………………………………281,278 284,849 287,223 293,127 288,024
NET WORKING CAPITAL
Excess of total current assets over total current liabilities ……………………………………………………………………………………………………………………………………………………………………………46,308 47,112 47,533 51,971 49,198
(million dollars)
Primary Metals
Total Assets $25 Million and Over
Table 54.1 -- Balance Sheet For Corporations in NAICS Manufacturing Subsector 331,
Total Assets $25 Million and Over
See the Survey Methodology section of the Introduction for information on survey design, estimation, and sampling error.
109U.S. Census Bureau, Quarterly Financial Report, 2014 Quarter 4

Table with row headers in column A with column headers in rows 5 and 6
Item
4Q_
2013_
1Q_
2014_
2Q_
2014_
3Q_
2014_
4Q_
2014_
Net sales, receipts, and operating revenues ………………………………………………………………………………………………………………………………………………………………………………………………………28,054 29,288 32,040 32,877 31,574
Depreciation, depletion, and amortization of property,
plant, and equipment ……………………………………………………………………………………………………………………………………………………………………910 904 904 873 917
All other operating costs and expenses …………………………………………………………………………………………………………………………………………………………………………………………………26,297 27,688 30,077 29,788 29,125
Income (loss) from operations …………………………………………………………………………………………………………………………………………...……………………………………………………………847 696 1,059 2,215 1,532
Interest expense …………………………………………………………………………………………………………………………………………………………………………………………………………………………………………459 432 440 443 462
Dividend income …………………………………………………………………………………………………………………………………………………………………………………………………………………………………………………19 37 29 21 44
Other recurring nonoperating income (expense), including
interest income, royalties, minority interest, etc. ………………………………………………………………………………………………………………………………………………………………………………………………………………………………………………(35) (30) (7) (101) 26
Nonrecurring items, including gain (loss) on sale of assets,
restructuring costs, asset writedowns, etc. …………………………………………………………………………………………………………………………………………………………………271 (21) (55) (363) (487)
Net income (loss) of foreign branches and equity in earnings (losses)
of domestic and foreign nonconsolidated subsidiaries and other
investments accounted for by the equity method, net of foreign taxes ………………………………………………………………………………………………………………………………………………………………………………………………………………106 102 198 (39) 196
Income (loss) before income taxes ………………………………………………………………………………………………………………………………………………………………………………………………………749 351 784 1,290 849
Provision for current and deferred domestic income taxes:
a. Federal …………………………………………………………………………………………………………………………………………………………………………………………………………………………………………………141 99 222 270 229
b. Other …………………………………………………………………………………………………………………………………………………………………………………………………………………………………………………14 12 15 21 (39)
Income (loss) after income taxes ……………………………………………………………………………………………………………………………………………………………………………………………………595 239 548 999 659
Extraordinary gains (losses), net of taxes ……………………………………………………………………………………………………………………………………………………………………………………………………………0 0 0 0 0
Cumulative effect of accounting changes, net of taxes ……………………………………………………………………………………………………………………………………………………………………………………………0 0 0 0 0
Net income (loss) for quarter ………………………………………………………………………………………………………………………………………………………………………………………………………………595 239 548 999 659
Cash dividends charged to retained earnings in this quarter ………………………………………………………………………………………………………………………………………………………………………………………396 343 351 385 338
Net income retained in business …………………………………………………………………………………………………………………………………………………………………………………………………………………199 (104) 197 614 320
Retained earnings at beginning of quarter ………………………………………………………………………………………………………………………………………………………………………………………………………………………13,652 14,504 13,889 13,589 13,919
Other direct credits (charges) to retained earnings (net), including
stock and other non-cash dividends, etc. ……………………………………………………………………………………………………………………………………………………………………………………………………………………………762 (89) (28) (159) (605)
Retained earnings at end of quarter ………………………………………………………………………………………………………………………………………………………………………………………………………14,613 14,311 14,058 14,044 13,635
INCOME STATEMENT IN RATIO FORMAT
Net sales, receipts, and operating revenues ……………………………………………………………………………………………………………………………………………………………………………………………………………100.00 100.00 100.00 100.00 100.00
Depreciation, depletion, and amortization of property,
plant, and equipment …………………………………………………………………………………………………………………………………………………………………………………3.24 3.09 2.82 2.66 2.91
All other operating costs and expenses ……………………………………………………………………………………………………………………………………………………………………………………………………………………………93.74 94.54 93.87 90.61 92.24
Income (loss) from operations …………………………………………………………………………………………………………………………………………………………………………………………………………………3.02 2.38 3.31 6.74 4.85
Interest expense ………………………………………………………………………………………………………………………………………………………………………………………………………………………………………………1.64 1.48 1.37 1.35 1.46
Dividend income …………………………………………………………………………………………………………………………………………………………………………………………………………………………………………………0.07 0.12 0.09 0.06 0.14
Other recurring nonoperating income (expense), including
interest income, royalties, minority interest, etc. …………………………………………………………………………………………………………………………………………………………………………………………………………………………………………………(0.12) (0.10) (0.02) (0.31) 0.08
Nonrecurring items, including gain (loss) on sale of assets,
restructuring costs, asset writedowns, etc. ………………………………………………………………………………………………………………………………………………………………………………………………………………………………………………………………………………………………………0.97 (0.07) (0.17) (1.10) (1.54)
Net income (loss) of foreign branches and equity in earnings (losses)
of nonconsolidated subsidiaries, net of foreign taxes …………………………………………………………………………………………………………………………………………………………………………………………………………0.38 0.35 0.62 (0.12) 0.62
Income (loss) before income taxes …………………………………………………………………………………………………………………………………………………………………………………………………………………2.67 1.20 2.45 3.92 2.69
Provision for current and deferred domestic income taxes ………………………………………………………………………………………………………………………………………………………………………………………………………0.55 0.38 0.74 0.89 0.60
Income (loss) after income taxes ………………………………………………………………………………………………………………………………………………………………………………………………………………………2.12 0.82 1.71 3.04 2.09
OPERATING RATIOS
(see explanatory notes)
Annual rate of profit on stockholders' equity at end of period:
Before income taxes …………………………………………………………………………………………………………………………………………………………………………………………………………………………………………7.39 3.45 7.63 12.62 8.90
After income taxes …………………………………………………………………………………………………………………………………………………………………………………………………………………………………………5.87 2.35 5.32 9.77 6.90
Annual rate of profit on total assets:
Before income taxes …………………………………………………………………………………………………………………………………………………………………………………………………………………………………………2.90 1.35 3.01 4.86 3.21
After income taxes ……………………………………………………………………………………………………………………………………………………………………………………………………………………………………………2.30 0.92 2.10 3.77 2.49
1 Included in Primary Metals.
Table 55.0 -- Income Statement For Corporations in NAICS Manufacturing Industry Groups 3311 and 3312,
Total Assets $25 Million and Over
See the Survey Methodology section of the Introduction for information on survey design, estimation, and sampling error.
Iron, Steel, and Ferroalloys
Total Assets $25 Million and Over 1
(million dollars)
(percent of net sales)
(percent)
110U.S. Census Bureau, Quarterly Financial Report, 2014 Quarter 4

Table with row headers in column A with column headers in rows 5 and 6
Item
4Q_
2013_
1Q_
2014_
2Q_
2014_
3Q_
2014_
4Q_
2014_
ASSETS
Cash and demand deposits in the U.S. ……………………………………………………………………………………………………………………………………………………………………………………………………………………………4,426 3,958 3,769 3,499 3,487
Time deposits in the U.S., including negotiable certificates of deposit …………………………………………………………………………………………………………………………………………………………………………………………33 19 11 13 19
Cash and deposits outside the U.S. .……………………………………………………………………………………………………………………………………………………………………………………………………………………………………………214 244 337 290 337
Total cash on hand and in banks ……………………………………………………………………………………………………………………………………………………………………………………………………………………………4,673 4,221 4,117 3,802 3,842
U.S. Treasury and Federal agency securities:
a. Subject to agreements to sell …………………………………………………………………………………………………………………………………………………………………………………………………………………………………28 100 100 100 100
b. Other, due in 1 year or less ……………………………………………………………………………………………………………………………………………………………………………………………………………………………………1 1 1 1 1
Commercial and finance company paper of U.S. issuers …………………………………………………………………………………………………………………………………………………………………………………………………………1 1 1 1 8
State and local government securities, due in 1 year or less …………………………………………………………………………………………………………………………………………………………………………………………………………4 6 5 5 2
Foreign securities, due in 1 year or less ………………………………………………………………………………………………………………………………………………………………………………………………………………………………2 2 2 2 2
Other short-term financial investments …………………………………………………………………………………………………………………………………………………………………………………………872 662 645 684 618
Total cash, U.S. Government and other securities ……………………………………………………………………………………………………………………………………………………………………………………………………5,581 4,992 4,871 4,595 4,573
Trade receivables from the U.S. Government …………………………………………………………………………………………………………………………………………………………………………………………………………………………0 0 5 5 5
Other trade accounts and trade notes receivable
(less allowance for doubtful accounts) ………………………………………………………………………………………………………………………………………………………………………12,571 13,640 14,092 14,770 13,408
Total receivables ………………………………………………………………………………………………………………………………………………………………………………………………………………………………12,571 13,640 14,097 14,775 13,413
Inventories ……………………………………………………………………………………………………………………………………………………………………………………………………………………………………………………18,195 18,698 18,763 20,244 21,088
All other current assets …………………………………………………………………………………………………………………………………………………………………………………………………………………………………………3,925 3,906 4,097 4,029 3,224
Total current assets ……………………………………………………………………………………………………………………………………………………………………………………………………………………………………40,272 41,236 41,828 43,643 42,299
Property, plant, and equipment ……………………………………………………………………………………………………………………………………………………………………………………………………………………………………………73,025 73,416 74,172 74,579 74,990
Land and mineral rights …………………………………………………………………………………………………………………………………………………………………………………………………………………………………………1,674 1,589 1,576 1,604 1,588
Less: Accumulated depreciation, depletion, and amortization ………………………………………………………………………………………………………………………………………………………………………………………………39,753 40,222 41,044 41,271 41,416
Net property, plant, and equipment …………………………………………………………………………………………………………………………………………………………………………………………………………………34,946 34,784 34,703 34,912 35,161
U.S. Treasury and Federal agency securities, due in more than 1 year …………………………………………………………………………………………………………………………………………………………………………………………7 8 8 8 4
All other noncurrent assets, including investment in nonconsolidated
entities, long-term investments, intangibles, etc. .………………………………………………………………………………………………………………………………………………………………………………………………………………………………28,173 28,018 27,877 27,531 28,345
Total Assets …………………………………………………………………………………………………………………………………………………………………………………………………………………………………………………103,398 104,047 104,416 106,094 105,808
LIABILITIES AND STOCKHOLDERS' EQUITY
Short-term debt, original maturity of 1 year or less:
a. Loans from banks ………………………………………………………………………………………………………………………………………………………………………………………………………………………………………1,086 1,175 843 811 690
b. Commercial paper ………………………………………………………………………………………………………………………………………………………………………………………………………………………………………0 4 40 41 34
c. Other short-term loans ………………………………………………………………………………………………………………………………………………………………………………………………………………………………1,521 1,603 1,333 1,378 2,141
Advances and prepayments by the U.S. Government …………………………………………………………………………………………………………………………………………………………………………………………………………0 0 0 0 0
Trade accounts and trade notes payable ………………………………………………………………………………………………………………………………………………………………………………………………………………………9,224 9,963 10,637 11,074 10,801
Income taxes accrued, prior and current years, net of payments:
a. Federal ……………………………………………………………………………………………………………………………………………………………………………………………………………………………………………………47 165 132 107 141
b. Other ………………………………………………………………………………………………………………………………………………………………………………………………………………………………………………137 128 127 118 126
Current portion of long-term debt, due in 1 year or less:
a. Loans from banks ……………………………………………………………………………………………………………………………………………………………………………………………………………………………………208 249 263 325 257
b. Bonds and debentures …………………………………………………………………………………………………………………………………………………………………………………………………………………………………737 834 252 600 640
c. Other long-term loans ………………………………………………………………………………………………………………………………………………………………………………………………………………………………………756 905 529 535 551
All other current liabilities, including excise and
sales taxes, and accrued expenses ……………………………………………………………………………………………………………………………………………………………………………4,767 4,658 4,907 5,626 5,091
Total current liabilities ………………………………………………………………………………………………………………………………………………………………………………………………………………………………18,483 19,685 19,062 20,616 20,471
Long-term debt, due in more than 1 year:
a. Loans from banks ………………………………………………………………………………………………………………………………………………………………………………………………………………………………………………3,484 3,605 3,471 3,285 3,319
b. Bonds and debentures ………………………………………………………………………………………………………………………………………………………………………………………………………………………………………14,268 13,917 14,431 15,760 15,749
c. Other long-term loans …………………………………………………………………………………………………………………………………………………………………………………………………………………………………………8,440 8,440 8,592 8,667 8,465
All other noncurrent liabilities, including deferred income taxes,
capitalized leases, and minority stockholders' interest
in consolidated domestic corporations ………………………………………………………………………………………………………………………………………………………………………………18,173 17,750 17,717 16,862 19,643
Total liabilities ……………………………………………………………………………………………………………………………………………………………………………………………………………………………………62,848 63,398 63,273 65,191 67,647
Capital stock and other capital …………………………………………………………………………………………………………………………………………………………………………………………………………………………………33,479 33,205 33,250 32,465 32,655
Retained earnings ……………………………………………………………………………………………………………………………………………………………………………………………………………………………………14,613 14,311 14,058 14,044 13,635
Cumulative foreign currency translation adjustment …………………………………………………………………………………………………………………………………………………………………………………………………………(44) 9 71 (60) (1,126)
Other stockholders' equity items, including unearned
compensation and ESOP debt guarantees ……………………………………………………………………………………………………………………………………………………………………(3,247) (3,322) (2,977) (2,266) (3,722)
Less: Treasury stock at cost ………………………………………………………………………………………………………………………………………………………………………………………………………………………………………4,252 3,554 3,259 3,279 3,280
Stockholders' equity ………………………………………………………………………………………………………………………………………………………………………………………………………………………………40,550 40,648 41,143 40,903 38,162
Total Liabilities and Stockholders' Equity ……………………………………………………………………………………………………………………………………………………103,398 104,047 104,416 106,094 105,808
NET WORKING CAPITAL
Excess of total current assets over total current liabilities ……………………………………………………………………………………………………………………………………………………………………………21,789 21,551 22,766 23,027 21,828
(million dollars)
Iron, Steel, and Ferroalloys
Total Assets $25 Million and Over 1
1 Included in Primary Metals.
Table 55.1 -- Balance Sheet For Corporations in NAICS Manufacturing Industry Groups 3311 and 3312,
Total Assets $25 Million and Over
See the Survey Methodology section of the Introduction for information on survey design, estimation, and sampling error.
111U.S. Census Bureau, Quarterly Financial Report, 2014 Quarter 4
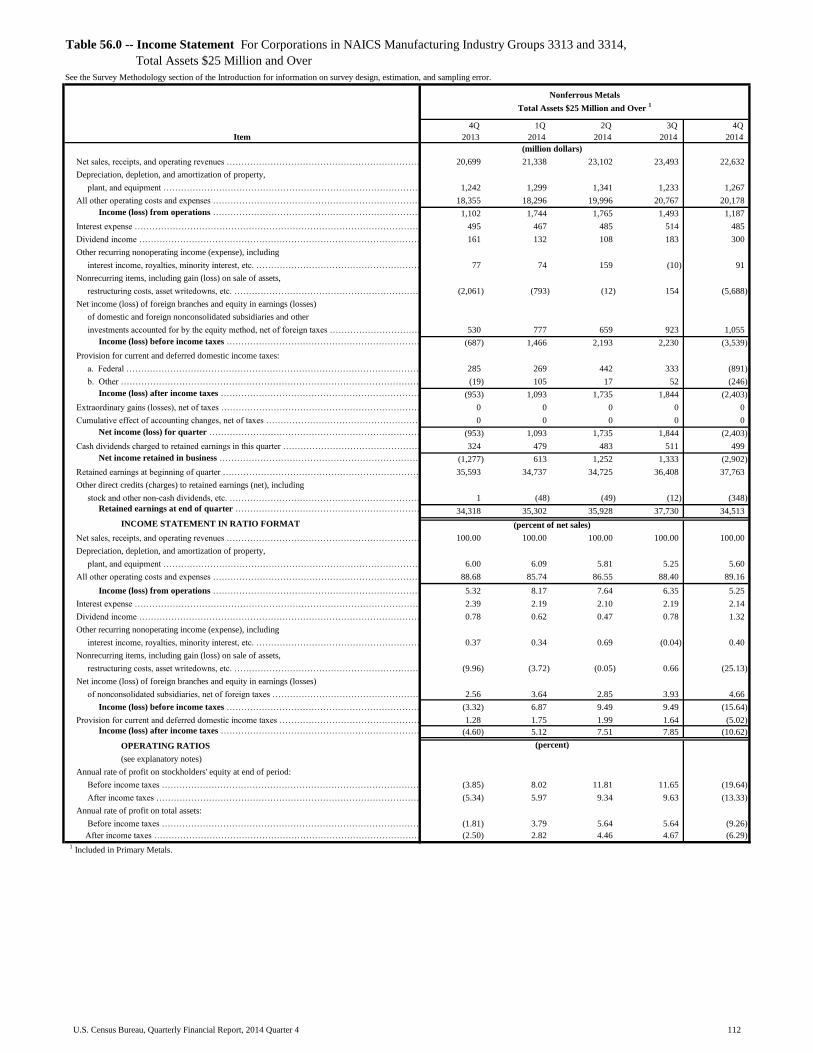
Table with row headers in column A with column headers in rows 5 and 6
Item
4Q_
2013_
1Q_
2014_
2Q_
2014_
3Q_
2014_
4Q_
2014_
Net sales, receipts, and operating revenues ………………………………………………………………………………………………………………………………………………………………………………………………………20,699 21,338 23,102 23,493 22,632
Depreciation, depletion, and amortization of property,
plant, and equipment ……………………………………………………………………………………………………………………………………………………………………1,242 1,299 1,341 1,233 1,267
All other operating costs and expenses …………………………………………………………………………………………………………………………………………………………………………………………………18,355 18,296 19,996 20,767 20,178
Income (loss) from operations …………………………………………………………………………………………………………………………………………...……………………………………………………………1,102 1,744 1,765 1,493 1,187
Interest expense …………………………………………………………………………………………………………………………………………………………………………………………………………………………………………495 467 485 514 485
Dividend income …………………………………………………………………………………………………………………………………………………………………………………………………………………………………………………161 132 108 183 300
Other recurring nonoperating income (expense), including
interest income, royalties, minority interest, etc. ………………………………………………………………………………………………………………………………………………………………………………………………………………………………………………77 74 159 (10) 91
Nonrecurring items, including gain (loss) on sale of assets,
restructuring costs, asset writedowns, etc. …………………………………………………………………………………………………………………………………………………………………(2,061) (793) (12) 154 (5,688)
Net income (loss) of foreign branches and equity in earnings (losses)
of domestic and foreign nonconsolidated subsidiaries and other
investments accounted for by the equity method, net of foreign taxes ………………………………………………………………………………………………………………………………………………………………………………………………………………530 777 659 923 1,055
Income (loss) before income taxes ………………………………………………………………………………………………………………………………………………………………………………………………………(687) 1,466 2,193 2,230 (3,539)
Provision for current and deferred domestic income taxes:
a. Federal …………………………………………………………………………………………………………………………………………………………………………………………………………………………………………………285 269 442 333 (891)
b. Other …………………………………………………………………………………………………………………………………………………………………………………………………………………………………………………(19) 105 17 52 (246)
Income (loss) after income taxes ……………………………………………………………………………………………………………………………………………………………………………………………………(953) 1,093 1,735 1,844 (2,403)
Extraordinary gains (losses), net of taxes ……………………………………………………………………………………………………………………………………………………………………………………………………………0 0 0 0 0
Cumulative effect of accounting changes, net of taxes ……………………………………………………………………………………………………………………………………………………………………………………………0 0 0 0 0
Net income (loss) for quarter ………………………………………………………………………………………………………………………………………………………………………………………………………………(953) 1,093 1,735 1,844 (2,403)
Cash dividends charged to retained earnings in this quarter ………………………………………………………………………………………………………………………………………………………………………………………324 479 483 511 499
Net income retained in business …………………………………………………………………………………………………………………………………………………………………………………………………………………(1,277) 613 1,252 1,333 (2,902)
Retained earnings at beginning of quarter ………………………………………………………………………………………………………………………………………………………………………………………………………………………35,593 34,737 34,725 36,408 37,763
Other direct credits (charges) to retained earnings (net), including
stock and other non-cash dividends, etc. ……………………………………………………………………………………………………………………………………………………………………………………………………………………………1 (48) (49) (12) (348)
Retained earnings at end of quarter ………………………………………………………………………………………………………………………………………………………………………………………………………34,318 35,302 35,928 37,730 34,513
INCOME STATEMENT IN RATIO FORMAT
Net sales, receipts, and operating revenues ……………………………………………………………………………………………………………………………………………………………………………………………………………100.00 100.00 100.00 100.00 100.00
Depreciation, depletion, and amortization of property,
plant, and equipment …………………………………………………………………………………………………………………………………………………………………………………6.00 6.09 5.81 5.25 5.60
All other operating costs and expenses ……………………………………………………………………………………………………………………………………………………………………………………………………………………………88.68 85.74 86.55 88.40 89.16
Income (loss) from operations …………………………………………………………………………………………………………………………………………………………………………………………………………………5.32 8.17 7.64 6.35 5.25
Interest expense ………………………………………………………………………………………………………………………………………………………………………………………………………………………………………………2.39 2.19 2.10 2.19 2.14
Dividend income …………………………………………………………………………………………………………………………………………………………………………………………………………………………………………………0.78 0.62 0.47 0.78 1.32
Other recurring nonoperating income (expense), including
interest income, royalties, minority interest, etc. …………………………………………………………………………………………………………………………………………………………………………………………………………………………………………………0.37 0.34 0.69 (0.04) 0.40
Nonrecurring items, including gain (loss) on sale of assets,
restructuring costs, asset writedowns, etc. ………………………………………………………………………………………………………………………………………………………………………………………………………………………………………………………………………………………………………(9.96) (3.72) (0.05) 0.66 (25.13)
Net income (loss) of foreign branches and equity in earnings (losses)
of nonconsolidated subsidiaries, net of foreign taxes …………………………………………………………………………………………………………………………………………………………………………………………………………2.56 3.64 2.85 3.93 4.66
Income (loss) before income taxes …………………………………………………………………………………………………………………………………………………………………………………………………………………(3.32) 6.87 9.49 9.49 (15.64)
Provision for current and deferred domestic income taxes ………………………………………………………………………………………………………………………………………………………………………………………………………1.28 1.75 1.99 1.64 (5.02)
Income (loss) after income taxes ………………………………………………………………………………………………………………………………………………………………………………………………………………………(4.60) 5.12 7.51 7.85 (10.62)
OPERATING RATIOS
(see explanatory notes)
Annual rate of profit on stockholders' equity at end of period:
Before income taxes …………………………………………………………………………………………………………………………………………………………………………………………………………………………………………(3.85) 8.02 11.81 11.65 (19.64)
After income taxes …………………………………………………………………………………………………………………………………………………………………………………………………………………………………………(5.34) 5.97 9.34 9.63 (13.33)
Annual rate of profit on total assets:
Before income taxes …………………………………………………………………………………………………………………………………………………………………………………………………………………………………………(1.81) 3.79 5.64 5.64 (9.26)
After income taxes ……………………………………………………………………………………………………………………………………………………………………………………………………………………………………………(2.50) 2.82 4.46 4.67 (6.29)
1 Included in Primary Metals.
Table 56.0 -- Income Statement For Corporations in NAICS Manufacturing Industry Groups 3313 and 3314,
Total Assets $25 Million and Over
See the Survey Methodology section of the Introduction for information on survey design, estimation, and sampling error.
Nonferrous Metals
Total Assets $25 Million and Over 1
(million dollars)
(percent of net sales)
(percent)
112U.S. Census Bureau, Quarterly Financial Report, 2014 Quarter 4

Table with row headers in column A with column headers in rows 5 and 6
Item
4Q_
2013_
1Q_
2014_
2Q_
2014_
3Q_
2014_
4Q_
2014_
ASSETS
Cash and demand deposits in the U.S. ……………………………………………………………………………………………………………………………………………………………………………………………………………………………3,074 3,398 3,197 5,070 3,736
Time deposits in the U.S., including negotiable certificates of deposit …………………………………………………………………………………………………………………………………………………………………………………………686 285 307 418 744
Cash and deposits outside the U.S. .……………………………………………………………………………………………………………………………………………………………………………………………………………………………………………32 29 21 14 21
Total cash on hand and in banks ……………………………………………………………………………………………………………………………………………………………………………………………………………………………3,792 3,711 3,526 5,502 4,501
U.S. Treasury and Federal agency securities:
a. Subject to agreements to sell …………………………………………………………………………………………………………………………………………………………………………………………………………………………………0 0 0 0 0
b. Other, due in 1 year or less ……………………………………………………………………………………………………………………………………………………………………………………………………………………………………1,489 1,870 1,855 1,839 1,884
Commercial and finance company paper of U.S. issuers …………………………………………………………………………………………………………………………………………………………………………………………………………242 223 366 410 393
State and local government securities, due in 1 year or less …………………………………………………………………………………………………………………………………………………………………………………………………………0 0 0 0 0
Foreign securities, due in 1 year or less ………………………………………………………………………………………………………………………………………………………………………………………………………………………………0 0 0 0 0
Other short-term financial investments …………………………………………………………………………………………………………………………………………………………………………………………363 176 73 40 77
Total cash, U.S. Government and other securities ……………………………………………………………………………………………………………………………………………………………………………………………………5,887 5,980 5,820 7,791 6,856
Trade receivables from the U.S. Government …………………………………………………………………………………………………………………………………………………………………………………………………………………………3 29 40 26 21
Other trade accounts and trade notes receivable
(less allowance for doubtful accounts) ………………………………………………………………………………………………………………………………………………………………………7,992 9,291 9,376 9,379 8,162
Total receivables ………………………………………………………………………………………………………………………………………………………………………………………………………………………………7,996 9,320 9,416 9,405 8,184
Inventories ……………………………………………………………………………………………………………………………………………………………………………………………………………………………………………………10,521 11,056 11,636 12,081 12,150
All other current assets …………………………………………………………………………………………………………………………………………………………………………………………………………………………………………13,102 12,809 12,655 13,534 13,532
Total current assets ……………………………………………………………………………………………………………………………………………………………………………………………………………………………………37,505 39,165 39,526 42,811 40,721
Property, plant, and equipment ……………………………………………………………………………………………………………………………………………………………………………………………………………………………………………81,100 80,303 80,859 81,364 86,186
Land and mineral rights …………………………………………………………………………………………………………………………………………………………………………………………………………………………………………7,670 7,548 7,504 7,448 7,223
Less: Accumulated depreciation, depletion, and amortization ………………………………………………………………………………………………………………………………………………………………………………………………31,239 29,408 29,897 30,736 38,237
Net property, plant, and equipment …………………………………………………………………………………………………………………………………………………………………………………………………………………57,532 58,443 58,466 58,076 55,173
U.S. Treasury and Federal agency securities, due in more than 1 year …………………………………………………………………………………………………………………………………………………………………………………………4 4 7 3 4
All other noncurrent assets, including investment in nonconsolidated
entities, long-term investments, intangibles, etc. .………………………………………………………………………………………………………………………………………………………………………………………………………………………………57,149 57,164 57,560 57,252 56,962
Total Assets …………………………………………………………………………………………………………………………………………………………………………………………………………………………………………………152,189 154,776 155,559 158,142 152,860
LIABILITIES AND STOCKHOLDERS' EQUITY
Short-term debt, original maturity of 1 year or less:
a. Loans from banks ………………………………………………………………………………………………………………………………………………………………………………………………………………………………………1,215 1,212 782 1,176 1,234
b. Commercial paper ………………………………………………………………………………………………………………………………………………………………………………………………………………………………………0 0 0 99 0
c. Other short-term loans ………………………………………………………………………………………………………………………………………………………………………………………………………………………………2,257 2,513 2,248 2,397 2,625
Advances and prepayments by the U.S. Government …………………………………………………………………………………………………………………………………………………………………………………………………………0 0 0 0 0
Trade accounts and trade notes payable ………………………………………………………………………………………………………………………………………………………………………………………………………………………7,643 8,093 8,165 8,378 8,380
Income taxes accrued, prior and current years, net of payments:
a. Federal ……………………………………………………………………………………………………………………………………………………………………………………………………………………………………………………278 439 635 412 172
b. Other ………………………………………………………………………………………………………………………………………………………………………………………………………………………………………………27 25 26 30 20
Current portion of long-term debt, due in 1 year or less:
a. Loans from banks ……………………………………………………………………………………………………………………………………………………………………………………………………………………………………524 414 494 386 439
b. Bonds and debentures …………………………………………………………………………………………………………………………………………………………………………………………………………………………………1,294 2,036 3,186 2,098 1,047
c. Other long-term loans ………………………………………………………………………………………………………………………………………………………………………………………………………………………………………353 354 164 185 183
All other current liabilities, including excise and
sales taxes, and accrued expenses ……………………………………………………………………………………………………………………………………………………………………………4,361 4,099 4,523 4,267 4,172
Total current liabilities ………………………………………………………………………………………………………………………………………………………………………………………………………………………………17,953 19,186 20,223 19,428 18,271
Long-term debt, due in more than 1 year:
a. Loans from banks ………………………………………………………………………………………………………………………………………………………………………………………………………………………………………………1,989 2,076 3,082 3,168 2,994
b. Bonds and debentures ………………………………………………………………………………………………………………………………………………………………………………………………………………………………………33,639 33,144 30,551 32,281 32,273
c. Other long-term loans …………………………………………………………………………………………………………………………………………………………………………………………………………………………………………5,381 5,425 5,469 5,410 5,388
All other noncurrent liabilities, including deferred income taxes,
capitalized leases, and minority stockholders' interest
in consolidated domestic corporations ………………………………………………………………………………………………………………………………………………………………………………21,919 21,779 21,923 21,273 21,837
Total liabilities ……………………………………………………………………………………………………………………………………………………………………………………………………………………………………80,882 81,610 81,248 81,560 80,763
Capital stock and other capital …………………………………………………………………………………………………………………………………………………………………………………………………………………………………52,210 52,486 52,677 53,089 54,720
Retained earnings ……………………………………………………………………………………………………………………………………………………………………………………………………………………………………34,318 35,302 35,928 37,730 34,513
Cumulative foreign currency translation adjustment …………………………………………………………………………………………………………………………………………………………………………………………………………450 690 905 760 (722)
Other stockholders' equity items, including unearned
compensation and ESOP debt guarantees ……………………………………………………………………………………………………………………………………………………………………(6,886) (6,831) (6,796) (6,695) (8,102)
Less: Treasury stock at cost ………………………………………………………………………………………………………………………………………………………………………………………………………………………………………8,785 8,480 8,403 8,301 8,311
Stockholders' equity ………………………………………………………………………………………………………………………………………………………………………………………………………………………………71,307 73,167 74,311 76,582 72,097
Total Liabilities and Stockholders' Equity ……………………………………………………………………………………………………………………………………………………152,189 154,776 155,559 158,142 152,860
NET WORKING CAPITAL
Excess of total current assets over total current liabilities ……………………………………………………………………………………………………………………………………………………………………………19,552 19,979 19,303 23,383 22,450
(million dollars)
Nonferrous Metals
Total Assets $25 Million and Over 1
1 Included in Primary Metals.
Table 56.1 -- Balance Sheet For Corporations in NAICS Manufacturing Industry Groups 3313 and 3314,
Total Assets $25 Million and Over
See the Survey Methodology section of the Introduction for information on survey design, estimation, and sampling error.
113U.S. Census Bureau, Quarterly Financial Report, 2014 Quarter 4

Table with row headers in column A with column headers in rows 5 and 6
Item
4Q_
2013_
1Q_
2014_
2Q_
2014_
3Q_
2014_
4Q_
2014_
Net sales, receipts, and operating revenues ………………………………………………………………………………………………………………………………………………………………………………………………………4,908 5,624 5,812 5,735 6,002
Depreciation, depletion, and amortization of property,
plant, and equipment ……………………………………………………………………………………………………………………………………………………………………136 137 135 149 168
All other operating costs and expenses …………………………………………………………………………………………………………………………………………………………………………………………………4,047 4,661 4,731 4,703 4,998
Income (loss) from operations …………………………………………………………………………………………………………………………………………...……………………………………………………………725 826 946 884 836
Interest expense …………………………………………………………………………………………………………………………………………………………………………………………………………………………………………45 41 40 46 49
Dividend income …………………………………………………………………………………………………………………………………………………………………………………………………………………………………………………2 1 5 2 2
Other recurring nonoperating income (expense), including
interest income, royalties, minority interest, etc. ………………………………………………………………………………………………………………………………………………………………………………………………………………………………………………23 1 (9) 5 (8)
Nonrecurring items, including gain (loss) on sale of assets,
restructuring costs, asset writedowns, etc. …………………………………………………………………………………………………………………………………………………………………(4) 4 1 (2) (5)
Net income (loss) of foreign branches and equity in earnings (losses)
of domestic and foreign nonconsolidated subsidiaries and other
investments accounted for by the equity method, net of foreign taxes ………………………………………………………………………………………………………………………………………………………………………………………………………………85 93 89 78 67
Income (loss) before income taxes ………………………………………………………………………………………………………………………………………………………………………………………………………785 884 993 920 843
Provision for current and deferred domestic income taxes:
a. Federal …………………………………………………………………………………………………………………………………………………………………………………………………………………………………………………204 235 257 243 234
b. Other …………………………………………………………………………………………………………………………………………………………………………………………………………………………………………………(1) 3 8 (1) 2
Income (loss) after income taxes ……………………………………………………………………………………………………………………………………………………………………………………………………583 647 728 678 607
Extraordinary gains (losses), net of taxes ……………………………………………………………………………………………………………………………………………………………………………………………………………0 0 0 0 0
Cumulative effect of accounting changes, net of taxes ……………………………………………………………………………………………………………………………………………………………………………………………0 0 0 0 0
Net income (loss) for quarter ………………………………………………………………………………………………………………………………………………………………………………………………………………583 647 728 678 607
Cash dividends charged to retained earnings in this quarter ………………………………………………………………………………………………………………………………………………………………………………………13 41 32 32 10
Net income retained in business …………………………………………………………………………………………………………………………………………………………………………………………………………………569 606 696 646 597
Retained earnings at beginning of quarter ………………………………………………………………………………………………………………………………………………………………………………………………………………………14,625 15,449 15,983 16,793 17,192
Other direct credits (charges) to retained earnings (net), including
stock and other non-cash dividends, etc. ……………………………………………………………………………………………………………………………………………………………………………………………………………………………(24) 2 32 37 (35)
Retained earnings at end of quarter ………………………………………………………………………………………………………………………………………………………………………………………………………15,171 16,057 16,710 17,476 17,754
INCOME STATEMENT IN RATIO FORMAT
Net sales, receipts, and operating revenues ……………………………………………………………………………………………………………………………………………………………………………………………………………100.00 100.00 100.00 100.00 100.00
Depreciation, depletion, and amortization of property,
plant, and equipment …………………………………………………………………………………………………………………………………………………………………………………2.77 2.44 2.33 2.59 2.80
All other operating costs and expenses ……………………………………………………………………………………………………………………………………………………………………………………………………………………………82.46 82.88 81.39 82.00 83.27
Income (loss) from operations …………………………………………………………………………………………………………………………………………………………………………………………………………………14.77 14.69 16.28 15.41 13.92
Interest expense ………………………………………………………………………………………………………………………………………………………………………………………………………………………………………………0.92 0.73 0.68 0.80 0.82
Dividend income …………………………………………………………………………………………………………………………………………………………………………………………………………………………………………………0.03 0.03 0.09 0.03 0.04
Other recurring nonoperating income (expense), including
interest income, royalties, minority interest, etc. …………………………………………………………………………………………………………………………………………………………………………………………………………………………………………………0.46 0.02 (0.15) 0.08 (0.13)
Nonrecurring items, including gain (loss) on sale of assets,
restructuring costs, asset writedowns, etc. ………………………………………………………………………………………………………………………………………………………………………………………………………………………………………………………………………………………………………(0.07) 0.07 0.02 (0.03) (0.09)
Net income (loss) of foreign branches and equity in earnings (losses)
of nonconsolidated subsidiaries, net of foreign taxes …………………………………………………………………………………………………………………………………………………………………………………………………………1.73 1.65 1.52 1.36 1.11
Income (loss) before income taxes …………………………………………………………………………………………………………………………………………………………………………………………………………………16.00 15.73 17.09 16.04 14.04
Provision for current and deferred domestic income taxes ………………………………………………………………………………………………………………………………………………………………………………………………………4.13 4.23 4.56 4.23 3.93
Income (loss) after income taxes ………………………………………………………………………………………………………………………………………………………………………………………………………………………11.87 11.50 12.52 11.81 10.11
OPERATING RATIOS
(see explanatory notes)
Annual rate of profit on stockholders' equity at end of period:
Before income taxes …………………………………………………………………………………………………………………………………………………………………………………………………………………………………………20.63 22.40 24.75 22.59 20.81
After income taxes …………………………………………………………………………………………………………………………………………………………………………………………………………………………………………15.31 16.38 18.14 16.64 14.99
Annual rate of profit on total assets:
Before income taxes …………………………………………………………………………………………………………………………………………………………………………………………………………………………………………12.23 13.59 14.58 12.74 11.48
After income taxes ……………………………………………………………………………………………………………………………………………………………………………………………………………………………………………9.07 9.94 10.69 9.38 8.27
1 Included in Primary Metals.
Table 57.0 -- Income Statement For Corporations in NAICS Manufacturing Industry Group 3315,
Total Assets $25 Million and Over
See the Survey Methodology section of the Introduction for information on survey design, estimation, and sampling error.
Foundries
Total Assets $25 Million and Over 1
(million dollars)
(percent of net sales)
(percent)
114U.S. Census Bureau, Quarterly Financial Report, 2014 Quarter 4

Table with row headers in column A with column headers in rows 5 and 6
Item
4Q_
2013_
1Q_
2014_
2Q_
2014_
3Q_
2014_
4Q_
2014_
ASSETS
Cash and demand deposits in the U.S. ……………………………………………………………………………………………………………………………………………………………………………………………………………………………535 815 702 917 765
Time deposits in the U.S., including negotiable certificates of deposit …………………………………………………………………………………………………………………………………………………………………………………………6 5 16 15 16
Cash and deposits outside the U.S. .……………………………………………………………………………………………………………………………………………………………………………………………………………………………………………1 2 2 1 4
Total cash on hand and in banks ……………………………………………………………………………………………………………………………………………………………………………………………………………………………542 822 720 934 784
U.S. Treasury and Federal agency securities:
a. Subject to agreements to sell …………………………………………………………………………………………………………………………………………………………………………………………………………………………………2 2 2 3 3
b. Other, due in 1 year or less ……………………………………………………………………………………………………………………………………………………………………………………………………………………………………57 51 43 45 44
Commercial and finance company paper of U.S. issuers …………………………………………………………………………………………………………………………………………………………………………………………………………83 85 117 103 100
State and local government securities, due in 1 year or less …………………………………………………………………………………………………………………………………………………………………………………………………………1 5 5 4 4
Foreign securities, due in 1 year or less ………………………………………………………………………………………………………………………………………………………………………………………………………………………………0 0 0 0 0
Other short-term financial investments …………………………………………………………………………………………………………………………………………………………………………………………396 342 331 340 340
Total cash, U.S. Government and other securities ……………………………………………………………………………………………………………………………………………………………………………………………………1,081 1,308 1,219 1,428 1,276
Trade receivables from the U.S. Government …………………………………………………………………………………………………………………………………………………………………………………………………………………………0 0 0 0 0
Other trade accounts and trade notes receivable
(less allowance for doubtful accounts) ………………………………………………………………………………………………………………………………………………………………………2,618 3,017 3,334 3,412 3,299
Total receivables ………………………………………………………………………………………………………………………………………………………………………………………………………………………………2,618 3,017 3,334 3,412 3,299
Inventories ……………………………………………………………………………………………………………………………………………………………………………………………………………………………………………………4,217 4,398 4,473 4,631 4,882
All other current assets …………………………………………………………………………………………………………………………………………………………………………………………………………………………………………484 386 267 291 362
Total current assets ……………………………………………………………………………………………………………………………………………………………………………………………………………………………………8,399 9,109 9,293 9,762 9,820
Property, plant, and equipment ……………………………………………………………………………………………………………………………………………………………………………………………………………………………………………8,786 9,065 9,539 10,033 10,764
Land and mineral rights …………………………………………………………………………………………………………………………………………………………………………………………………………………………………………246 249 250 255 261
Less: Accumulated depreciation, depletion, and amortization ………………………………………………………………………………………………………………………………………………………………………………………………4,883 5,106 5,336 5,666 5,922
Net property, plant, and equipment …………………………………………………………………………………………………………………………………………………………………………………………………………………4,148 4,208 4,453 4,622 5,103
U.S. Treasury and Federal agency securities, due in more than 1 year …………………………………………………………………………………………………………………………………………………………………………………………9 12 14 15 15
All other noncurrent assets, including investment in nonconsolidated
entities, long-term investments, intangibles, etc. .………………………………………………………………………………………………………………………………………………………………………………………………………………………………13,135 12,697 13,487 14,492 14,416
Total Assets …………………………………………………………………………………………………………………………………………………………………………………………………………………………………………………25,691 26,026 27,247 28,891 29,355
LIABILITIES AND STOCKHOLDERS' EQUITY
Short-term debt, original maturity of 1 year or less:
a. Loans from banks ………………………………………………………………………………………………………………………………………………………………………………………………………………………………………143 139 163 450 319
b. Commercial paper ………………………………………………………………………………………………………………………………………………………………………………………………………………………………………0 0 0 0 0
c. Other short-term loans ………………………………………………………………………………………………………………………………………………………………………………………………………………………………63 30 30 3 32
Advances and prepayments by the U.S. Government …………………………………………………………………………………………………………………………………………………………………………………………………………0 0 0 0 0
Trade accounts and trade notes payable ………………………………………………………………………………………………………………………………………………………………………………………………………………………1,950 2,045 1,996 2,131 2,232
Income taxes accrued, prior and current years, net of payments:
a. Federal ……………………………………………………………………………………………………………………………………………………………………………………………………………………………………………………(36) (26) 126 (25) 12
b. Other ………………………………………………………………………………………………………………………………………………………………………………………………………………………………………………(6) 2 13 (3) (5)
Current portion of long-term debt, due in 1 year or less:
a. Loans from banks ……………………………………………………………………………………………………………………………………………………………………………………………………………………………………58 57 57 55 706
b. Bonds and debentures …………………………………………………………………………………………………………………………………………………………………………………………………………………………………0 0 0 0 8
c. Other long-term loans ………………………………………………………………………………………………………………………………………………………………………………………………………………………………………5 7 144 135 133
All other current liabilities, including excise and
sales taxes, and accrued expenses ……………………………………………………………………………………………………………………………………………………………………………1,254 1,273 1,300 1,456 1,464
Total current liabilities ………………………………………………………………………………………………………………………………………………………………………………………………………………………………3,431 3,528 3,830 4,201 4,900
Long-term debt, due in more than 1 year:
a. Loans from banks ………………………………………………………………………………………………………………………………………………………………………………………………………………………………………………4,806 5,051 5,205 5,922 5,676
b. Bonds and debentures ………………………………………………………………………………………………………………………………………………………………………………………………………………………………………162 172 147 131 155
c. Other long-term loans …………………………………………………………………………………………………………………………………………………………………………………………………………………………………………190 284 391 388 342
All other noncurrent liabilities, including deferred income taxes,
capitalized leases, and minority stockholders' interest
in consolidated domestic corporations ………………………………………………………………………………………………………………………………………………………………………………1,874 1,202 1,624 1,958 2,089
Total liabilities ……………………………………………………………………………………………………………………………………………………………………………………………………………………………………10,464 10,238 11,197 12,600 13,161
Capital stock and other capital …………………………………………………………………………………………………………………………………………………………………………………………………………………………………3,076 2,916 2,685 2,440 2,227
Retained earnings ……………………………………………………………………………………………………………………………………………………………………………………………………………………………………15,171 16,057 16,710 17,476 17,754
Cumulative foreign currency translation adjustment …………………………………………………………………………………………………………………………………………………………………………………………………………69 84 123 12 (109)
Other stockholders' equity items, including unearned
compensation and ESOP debt guarantees ……………………………………………………………………………………………………………………………………………………………………(708) (655) (745) (780) (679)
Less: Treasury stock at cost ………………………………………………………………………………………………………………………………………………………………………………………………………………………………………2,381 2,613 2,723 2,856 2,999
Stockholders' equity ………………………………………………………………………………………………………………………………………………………………………………………………………………………………15,227 15,789 16,051 16,291 16,194
Total Liabilities and Stockholders' Equity ……………………………………………………………………………………………………………………………………………………25,691 26,026 27,247 28,891 29,355
NET WORKING CAPITAL
Excess of total current assets over total current liabilities ……………………………………………………………………………………………………………………………………………………………………………4,968 5,581 5,464 5,561 4,921
(million dollars)
Foundries
Total Assets $25 Million and Over 1
1 Included in Primary Metals.
Table 57.1 -- Balance Sheet For Corporations in NAICS Manufacturing Industry Group 3315,
Total Assets $25 Million and Over
See the Survey Methodology section of the Introduction for information on survey design, estimation, and sampling error.
115U.S. Census Bureau, Quarterly Financial Report, 2014 Quarter 4

Table with row headers in column A with column headers in rows 5 and 6
Item
4Q_
2013_
1Q_
2014_
2Q_
2014_
3Q_
2014_
4Q_
2014_
Net sales, receipts, and operating revenues ………………………………………………………………………………………………………………………………………………………………………………………………………38,523 38,432 42,397 43,253 42,240
Depreciation, depletion, and amortization of property,
plant, and equipment ……………………………………………………………………………………………………………………………………………………………………1,022 998 1,054 1,084 1,129
All other operating costs and expenses …………………………………………………………………………………………………………………………………………………………………………………………………33,968 34,086 37,282 38,279 37,761
Income (loss) from operations …………………………………………………………………………………………………………………………………………...……………………………………………………………3,532 3,348 4,062 3,890 3,351
Interest expense …………………………………………………………………………………………………………………………………………………………………………………………………………………………………………723 810 779 775 773
Dividend income …………………………………………………………………………………………………………………………………………………………………………………………………………………………………………………13 31 179 151 38
Other recurring nonoperating income (expense), including
interest income, royalties, minority interest, etc. ………………………………………………………………………………………………………………………………………………………………………………………………………………………………………………66 282 51 4 (100)
Nonrecurring items, including gain (loss) on sale of assets,
restructuring costs, asset writedowns, etc. …………………………………………………………………………………………………………………………………………………………………32 (33) 398 (128) (546)
Net income (loss) of foreign branches and equity in earnings (losses)
of domestic and foreign nonconsolidated subsidiaries and other
investments accounted for by the equity method, net of foreign taxes ………………………………………………………………………………………………………………………………………………………………………………………………………………467 723 964 1,167 750
Income (loss) before income taxes ………………………………………………………………………………………………………………………………………………………………………………………………………3,387 3,541 4,876 4,308 2,719
Provision for current and deferred domestic income taxes:
a. Federal …………………………………………………………………………………………………………………………………………………………………………………………………………………………………………………941 786 1,706 741 649
b. Other …………………………………………………………………………………………………………………………………………………………………………………………………………………………………………………78 53 83 40 55
Income (loss) after income taxes ……………………………………………………………………………………………………………………………………………………………………………………………………2,369 2,702 3,086 3,528 2,016
Extraordinary gains (losses), net of taxes ……………………………………………………………………………………………………………………………………………………………………………………………………………0 0 0 0 0
Cumulative effect of accounting changes, net of taxes ……………………………………………………………………………………………………………………………………………………………………………………………0 0 0 0 0
Net income (loss) for quarter ………………………………………………………………………………………………………………………………………………………………………………………………………………2,369 2,702 3,086 3,528 2,016
Cash dividends charged to retained earnings in this quarter ………………………………………………………………………………………………………………………………………………………………………………………1,124 1,078 1,506 1,601 1,016
Net income retained in business …………………………………………………………………………………………………………………………………………………………………………………………………………………1,245 1,624 1,581 1,927 1,000
Retained earnings at beginning of quarter ………………………………………………………………………………………………………………………………………………………………………………………………………………………63,431 67,096 69,024 72,684 73,871
Other direct credits (charges) to retained earnings (net), including
stock and other non-cash dividends, etc. ……………………………………………………………………………………………………………………………………………………………………………………………………………………………164 15 (171) 20 236
Retained earnings at end of quarter ………………………………………………………………………………………………………………………………………………………………………………………………………64,840 68,734 70,434 74,631 75,108
INCOME STATEMENT IN RATIO FORMAT
Net sales, receipts, and operating revenues ……………………………………………………………………………………………………………………………………………………………………………………………………………100.00 100.00 100.00 100.00 100.00
Depreciation, depletion, and amortization of property,
plant, and equipment …………………………………………………………………………………………………………………………………………………………………………………2.65 2.60 2.49 2.51 2.67
All other operating costs and expenses ……………………………………………………………………………………………………………………………………………………………………………………………………………………………88.18 88.69 87.93 88.50 89.39
Income (loss) from operations …………………………………………………………………………………………………………………………………………………………………………………………………………………9.17 8.71 9.58 8.99 7.93
Interest expense ………………………………………………………………………………………………………………………………………………………………………………………………………………………………………………1.88 2.11 1.84 1.79 1.83
Dividend income …………………………………………………………………………………………………………………………………………………………………………………………………………………………………………………0.03 0.08 0.42 0.35 0.09
Other recurring nonoperating income (expense), including
interest income, royalties, minority interest, etc. …………………………………………………………………………………………………………………………………………………………………………………………………………………………………………………0.17 0.73 0.12 0.01 (0.24)
Nonrecurring items, including gain (loss) on sale of assets,
restructuring costs, asset writedowns, etc. ………………………………………………………………………………………………………………………………………………………………………………………………………………………………………………………………………………………………………0.08 (0.09) 0.94 (0.30) (1.29)
Net income (loss) of foreign branches and equity in earnings (losses)
of nonconsolidated subsidiaries, net of foreign taxes …………………………………………………………………………………………………………………………………………………………………………………………………………1.21 1.88 2.27 2.70 1.77
Income (loss) before income taxes …………………………………………………………………………………………………………………………………………………………………………………………………………………8.79 9.21 11.50 9.96 6.44
Provision for current and deferred domestic income taxes ………………………………………………………………………………………………………………………………………………………………………………………………………2.64 2.18 4.22 1.80 1.67
Income (loss) after income taxes ………………………………………………………………………………………………………………………………………………………………………………………………………………………6.15 7.03 7.28 8.16 4.77
OPERATING RATIOS
(see explanatory notes)
Annual rate of profit on stockholders' equity at end of period:
Before income taxes …………………………………………………………………………………………………………………………………………………………………………………………………………………………………………16.59 17.36 23.34 20.52 12.95
After income taxes …………………………………………………………………………………………………………………………………………………………………………………………………………………………………………11.60 13.24 14.78 16.81 9.60
Annual rate of profit on total assets:
Before income taxes …………………………………………………………………………………………………………………………………………………………………………………………………………………………………………7.46 7.65 10.32 9.06 5.69
After income taxes ……………………………………………………………………………………………………………………………………………………………………………………………………………………………………………5.22 5.84 6.53 7.42 4.22
Table 58.0 -- Income Statement For Corporations in NAICS Manufacturing Subsector 332,
Total Assets $25 Million and Over
See the Survey Methodology section of the Introduction for information on survey design, estimation, and sampling error.
Fabricated Metal Products
Total Assets $25 Million and Over
(million dollars)
(percent of net sales)
(percent)
116U.S. Census Bureau, Quarterly Financial Report, 2014 Quarter 4

Table with row headers in column A with column headers in rows 5 and 6
Item
4Q_
2013_
1Q_
2014_
2Q_
2014_
3Q_
2014_
4Q_
2014_
ASSETS
Cash and demand deposits in the U.S. ……………………………………………………………………………………………………………………………………………………………………………………………………………………………8,397 7,335 7,328 7,371 7,723
Time deposits in the U.S., including negotiable certificates of deposit …………………………………………………………………………………………………………………………………………………………………………………………345 211 152 174 150
Cash and deposits outside the U.S. .……………………………………………………………………………………………………………………………………………………………………………………………………………………………………………89 67 89 96 72
Total cash on hand and in banks ……………………………………………………………………………………………………………………………………………………………………………………………………………………………8,832 7,613 7,569 7,640 7,945
U.S. Treasury and Federal agency securities:
a. Subject to agreements to sell …………………………………………………………………………………………………………………………………………………………………………………………………………………………………9 25 20 20 22
b. Other, due in 1 year or less ……………………………………………………………………………………………………………………………………………………………………………………………………………………………………180 169 169 175 179
Commercial and finance company paper of U.S. issuers …………………………………………………………………………………………………………………………………………………………………………………………………………216 170 177 199 214
State and local government securities, due in 1 year or less …………………………………………………………………………………………………………………………………………………………………………………………………………201 108 147 148 92
Foreign securities, due in 1 year or less ………………………………………………………………………………………………………………………………………………………………………………………………………………………………1 1 2 2 2
Other short-term financial investments …………………………………………………………………………………………………………………………………………………………………………………………725 595 719 986 935
Total cash, U.S. Government and other securities ……………………………………………………………………………………………………………………………………………………………………………………………………10,163 8,680 8,803 9,170 9,387
Trade receivables from the U.S. Government …………………………………………………………………………………………………………………………………………………………………………………………………………………………868 883 991 985 1,020
Other trade accounts and trade notes receivable
(less allowance for doubtful accounts) ………………………………………………………………………………………………………………………………………………………………………19,343 21,105 21,938 22,552 22,445
Total receivables ………………………………………………………………………………………………………………………………………………………………………………………………………………………………20,211 21,988 22,928 23,537 23,464
Inventories ……………………………………………………………………………………………………………………………………………………………………………………………………………………………………………………20,626 21,939 22,476 23,235 23,082
All other current assets …………………………………………………………………………………………………………………………………………………………………………………………………………………………………………8,598 8,172 8,533 8,509 8,407
Total current assets ……………………………………………………………………………………………………………………………………………………………………………………………………………………………………59,599 60,779 62,740 64,451 64,340
Property, plant, and equipment ……………………………………………………………………………………………………………………………………………………………………………………………………………………………………………71,310 72,180 74,296 75,176 74,912
Land and mineral rights …………………………………………………………………………………………………………………………………………………………………………………………………………………………………………1,842 1,810 1,812 1,851 1,816
Less: Accumulated depreciation, depletion, and amortization ………………………………………………………………………………………………………………………………………………………………………………………………44,037 44,511 46,169 46,585 46,665
Net property, plant, and equipment …………………………………………………………………………………………………………………………………………………………………………………………………………………29,115 29,479 29,938 30,442 30,063
U.S. Treasury and Federal agency securities, due in more than 1 year …………………………………………………………………………………………………………………………………………………………………………………………30 3 19 18 19
All other noncurrent assets, including investment in nonconsolidated
entities, long-term investments, intangibles, etc. .………………………………………………………………………………………………………………………………………………………………………………………………………………………………92,835 94,797 96,223 95,349 96,838
Total Assets …………………………………………………………………………………………………………………………………………………………………………………………………………………………………………………181,579 185,058 188,921 190,261 191,260
LIABILITIES AND STOCKHOLDERS' EQUITY
Short-term debt, original maturity of 1 year or less:
a. Loans from banks ………………………………………………………………………………………………………………………………………………………………………………………………………………………………………2,433 2,891 3,329 3,353 2,993
b. Commercial paper ………………………………………………………………………………………………………………………………………………………………………………………………………………………………………3,070 3,033 3,076 2,989 2,984
c. Other short-term loans ………………………………………………………………………………………………………………………………………………………………………………………………………………………………471 596 595 605 376
Advances and prepayments by the U.S. Government …………………………………………………………………………………………………………………………………………………………………………………………………………608 633 634 606 677
Trade accounts and trade notes payable ………………………………………………………………………………………………………………………………………………………………………………………………………………………12,360 12,767 12,836 13,128 13,896
Income taxes accrued, prior and current years, net of payments:
a. Federal ……………………………………………………………………………………………………………………………………………………………………………………………………………………………………………………884 994 1,085 1,011 739
b. Other ………………………………………………………………………………………………………………………………………………………………………………………………………………………………………………173 3 (27) (25) 143
Current portion of long-term debt, due in 1 year or less:
a. Loans from banks ……………………………………………………………………………………………………………………………………………………………………………………………………………………………………2,408 2,687 2,600 2,932 1,675
b. Bonds and debentures …………………………………………………………………………………………………………………………………………………………………………………………………………………………………483 420 340 252 201
c. Other long-term loans ………………………………………………………………………………………………………………………………………………………………………………………………………………………………………1,659 1,173 1,153 1,160 1,129
All other current liabilities, including excise and
sales taxes, and accrued expenses ……………………………………………………………………………………………………………………………………………………………………………11,321 11,268 11,831 11,905 12,159
Total current liabilities ………………………………………………………………………………………………………………………………………………………………………………………………………………………………35,871 36,464 37,452 37,916 36,972
Long-term debt, due in more than 1 year:
a. Loans from banks ………………………………………………………………………………………………………………………………………………………………………………………………………………………………………………17,392 18,924 18,603 18,575 19,224
b. Bonds and debentures ………………………………………………………………………………………………………………………………………………………………………………………………………………………………………9,299 9,416 9,449 9,581 9,643
c. Other long-term loans …………………………………………………………………………………………………………………………………………………………………………………………………………………………………………20,210 22,412 23,384 23,701 23,304
All other noncurrent liabilities, including deferred income taxes,
capitalized leases, and minority stockholders' interest
in consolidated domestic corporations ………………………………………………………………………………………………………………………………………………………………………………17,142 16,231 16,491 16,517 18,101
Total liabilities ……………………………………………………………………………………………………………………………………………………………………………………………………………………………………99,914 103,447 105,381 106,290 107,243
Capital stock and other capital …………………………………………………………………………………………………………………………………………………………………………………………………………………………………41,244 40,294 40,876 39,410 39,916
Retained earnings ……………………………………………………………………………………………………………………………………………………………………………………………………………………………………64,840 68,734 70,434 74,631 75,108
Cumulative foreign currency translation adjustment …………………………………………………………………………………………………………………………………………………………………………………………………………(1,033) (1,211) (1,241) (2,210) (2,508)
Other stockholders' equity items, including unearned
compensation and ESOP debt guarantees ……………………………………………………………………………………………………………………………………………………………………(4,135) (3,874) (3,920) (4,562) (4,429)
Less: Treasury stock at cost ………………………………………………………………………………………………………………………………………………………………………………………………………………………………………19,252 22,333 22,609 23,299 24,069
Stockholders' equity ………………………………………………………………………………………………………………………………………………………………………………………………………………………………81,665 81,611 83,540 83,971 84,017
Total Liabilities and Stockholders' Equity ……………………………………………………………………………………………………………………………………………………181,579 185,058 188,921 190,261 191,260
NET WORKING CAPITAL
Excess of total current assets over total current liabilities ……………………………………………………………………………………………………………………………………………………………………………23,728 24,315 25,288 26,535 27,368
(million dollars)
Fabricated Metal Products
Total Assets $25 Million and Over
Table 58.1 -- Balance Sheet For Corporations in NAICS Manufacturing Subsector 332,
Total Assets $25 Million and Over
See the Survey Methodology section of the Introduction for information on survey design, estimation, and sampling error.
117U.S. Census Bureau, Quarterly Financial Report, 2014 Quarter 4

Table with row headers in column A with column headers in rows 5 and 6
Item
4Q_
2013_
1Q_
2014_
2Q_
2014_
3Q_
2014_
4Q_
2014_
Net sales, receipts, and operating revenues ………………………………………………………………………………………………………………………………………………………………………………………………………92,607 88,718 96,235 94,410 95,310
Depreciation, depletion, and amortization of property,
plant, and equipment ……………………………………………………………………………………………………………………………………………………………………2,435 2,382 2,345 2,380 2,443
All other operating costs and expenses …………………………………………………………………………………………………………………………………………………………………………………………………81,684 79,686 84,472 83,786 85,278
Income (loss) from operations …………………………………………………………………………………………………………………………………………...……………………………………………………………8,489 6,651 9,417 8,244 7,589
Interest expense …………………………………………………………………………………………………………………………………………………………………………………………………………………………………………1,422 1,372 1,411 1,356 1,398
Dividend income …………………………………………………………………………………………………………………………………………………………………………………………………………………………………………………199 140 228 95 140
Other recurring nonoperating income (expense), including
interest income, royalties, minority interest, etc. ………………………………………………………………………………………………………………………………………………………………………………………………………………………………………………826 550 532 458 555
Nonrecurring items, including gain (loss) on sale of assets,
restructuring costs, asset writedowns, etc. …………………………………………………………………………………………………………………………………………………………………(212) 464 (109) (662) (1,054)
Net income (loss) of foreign branches and equity in earnings (losses)
of domestic and foreign nonconsolidated subsidiaries and other
investments accounted for by the equity method, net of foreign taxes ………………………………………………………………………………………………………………………………………………………………………………………………………………3,953 2,755 3,417 3,775 3,989
Income (loss) before income taxes ………………………………………………………………………………………………………………………………………………………………………………………………………11,833 9,188 12,075 10,555 9,820
Provision for current and deferred domestic income taxes:
a. Federal …………………………………………………………………………………………………………………………………………………………………………………………………………………………………………………1,729 1,842 2,416 2,224 1,850
b. Other …………………………………………………………………………………………………………………………………………………………………………………………………………………………………………………33 157 205 303 117
Income (loss) after income taxes ……………………………………………………………………………………………………………………………………………………………………………………………………10,071 7,188 9,454 8,028 7,853
Extraordinary gains (losses), net of taxes ……………………………………………………………………………………………………………………………………………………………………………………………………………0 0 0 0 0
Cumulative effect of accounting changes, net of taxes ……………………………………………………………………………………………………………………………………………………………………………………………0 0 0 0 0
Net income (loss) for quarter ………………………………………………………………………………………………………………………………………………………………………………………………………………10,071 7,188 9,454 8,028 7,853
Cash dividends charged to retained earnings in this quarter ………………………………………………………………………………………………………………………………………………………………………………………2,909 1,973 2,983 3,946 3,092
Net income retained in business …………………………………………………………………………………………………………………………………………………………………………………………………………………7,162 5,215 6,471 4,083 4,761
Retained earnings at beginning of quarter ………………………………………………………………………………………………………………………………………………………………………………………………………………………166,627 170,821 175,634 180,013 184,143
Other direct credits (charges) to retained earnings (net), including
stock and other non-cash dividends, etc. ……………………………………………………………………………………………………………………………………………………………………………………………………………………………217 (146) (2,699) 134 74
Retained earnings at end of quarter ………………………………………………………………………………………………………………………………………………………………………………………………………174,007 175,890 179,406 184,230 188,978
INCOME STATEMENT IN RATIO FORMAT
Net sales, receipts, and operating revenues ……………………………………………………………………………………………………………………………………………………………………………………………………………100.00 100.00 100.00 100.00 100.00
Depreciation, depletion, and amortization of property,
plant, and equipment …………………………………………………………………………………………………………………………………………………………………………………2.63 2.68 2.44 2.52 2.56
All other operating costs and expenses ……………………………………………………………………………………………………………………………………………………………………………………………………………………………88.20 89.82 87.78 88.75 89.47
Income (loss) from operations …………………………………………………………………………………………………………………………………………………………………………………………………………………9.17 7.50 9.79 8.73 7.96
Interest expense ………………………………………………………………………………………………………………………………………………………………………………………………………………………………………………1.54 1.55 1.47 1.44 1.47
Dividend income …………………………………………………………………………………………………………………………………………………………………………………………………………………………………………………0.22 0.16 0.24 0.10 0.15
Other recurring nonoperating income (expense), including
interest income, royalties, minority interest, etc. …………………………………………………………………………………………………………………………………………………………………………………………………………………………………………………0.89 0.62 0.55 0.48 0.58
Nonrecurring items, including gain (loss) on sale of assets,
restructuring costs, asset writedowns, etc. ………………………………………………………………………………………………………………………………………………………………………………………………………………………………………………………………………………………………………(0.23) 0.52 (0.11) (0.70) (1.11)
Net income (loss) of foreign branches and equity in earnings (losses)
of nonconsolidated subsidiaries, net of foreign taxes …………………………………………………………………………………………………………………………………………………………………………………………………………4.27 3.11 3.55 4.00 4.19
Income (loss) before income taxes …………………………………………………………………………………………………………………………………………………………………………………………………………………12.78 10.36 12.55 11.18 10.30
Provision for current and deferred domestic income taxes ………………………………………………………………………………………………………………………………………………………………………………………………………1.90 2.25 2.72 2.68 2.06
Income (loss) after income taxes ………………………………………………………………………………………………………………………………………………………………………………………………………………………10.87 8.10 9.82 8.50 8.24
OPERATING RATIOS
(see explanatory notes)
Annual rate of profit on stockholders' equity at end of period:
Before income taxes …………………………………………………………………………………………………………………………………………………………………………………………………………………………………………21.33 16.69 21.78 19.50 18.97
After income taxes …………………………………………………………………………………………………………………………………………………………………………………………………………………………………………18.15 13.06 17.05 14.83 15.17
Annual rate of profit on total assets:
Before income taxes …………………………………………………………………………………………………………………………………………………………………………………………………………………………………………9.15 7.11 9.29 8.16 7.57
After income taxes ……………………………………………………………………………………………………………………………………………………………………………………………………………………………………………7.79 5.57 7.27 6.21 6.06
Table 59.0 -- Income Statement For Corporations in NAICS Manufacturing Subsector 333,
Total Assets $25 Million and Over
See the Survey Methodology section of the Introduction for information on survey design, estimation, and sampling error.
Machinery
Total Assets $25 Million and Over
(million dollars)
(percent of net sales)
(percent)
118U.S. Census Bureau, Quarterly Financial Report, 2014 Quarter 4

Table with row headers in column A with column headers in rows 5 and 6
Item
4Q_
2013_
1Q_
2014_
2Q_
2014_
3Q_
2014_
4Q_
2014_
ASSETS
Cash and demand deposits in the U.S. ……………………………………………………………………………………………………………………………………………………………………………………………………………………………17,927 16,735 17,921 15,982 16,380
Time deposits in the U.S., including negotiable certificates of deposit …………………………………………………………………………………………………………………………………………………………………………………………5,757 3,991 4,312 2,903 4,796
Cash and deposits outside the U.S. .……………………………………………………………………………………………………………………………………………………………………………………………………………………………………………1,529 1,516 1,588 1,984 1,812
Total cash on hand and in banks ……………………………………………………………………………………………………………………………………………………………………………………………………………………………25,212 22,243 23,821 20,868 22,988
U.S. Treasury and Federal agency securities:
a. Subject to agreements to sell …………………………………………………………………………………………………………………………………………………………………………………………………………………………………403 392 659 511 615
b. Other, due in 1 year or less ……………………………………………………………………………………………………………………………………………………………………………………………………………………………………29 20 16 18 32
Commercial and finance company paper of U.S. issuers …………………………………………………………………………………………………………………………………………………………………………………………………………637 515 743 989 882
State and local government securities, due in 1 year or less …………………………………………………………………………………………………………………………………………………………………………………………………………119 146 119 121 134
Foreign securities, due in 1 year or less ………………………………………………………………………………………………………………………………………………………………………………………………………………………………0 0 0 0 9
Other short-term financial investments …………………………………………………………………………………………………………………………………………………………………………………………4,191 3,538 3,093 2,589 3,015
Total cash, U.S. Government and other securities ……………………………………………………………………………………………………………………………………………………………………………………………………30,591 26,854 28,451 25,097 27,674
Trade receivables from the U.S. Government …………………………………………………………………………………………………………………………………………………………………………………………………………………………203 217 247 190 175
Other trade accounts and trade notes receivable
(less allowance for doubtful accounts) ………………………………………………………………………………………………………………………………………………………………………45,890 47,788 48,875 47,625 47,315
Total receivables ………………………………………………………………………………………………………………………………………………………………………………………………………………………………46,094 48,005 49,122 47,815 47,490
Inventories ……………………………………………………………………………………………………………………………………………………………………………………………………………………………………………………55,507 57,756 57,541 58,578 58,110
All other current assets …………………………………………………………………………………………………………………………………………………………………………………………………………………………………………33,412 32,207 31,210 32,463 33,583
Total current assets ……………………………………………………………………………………………………………………………………………………………………………………………………………………………………165,605 164,821 166,324 163,952 166,857
Property, plant, and equipment ……………………………………………………………………………………………………………………………………………………………………………………………………………………………………………125,965 125,985 128,049 128,807 131,786
Land and mineral rights …………………………………………………………………………………………………………………………………………………………………………………………………………………………………………2,551 2,561 2,652 2,541 2,562
Less: Accumulated depreciation, depletion, and amortization ………………………………………………………………………………………………………………………………………………………………………………………………73,960 74,114 75,308 75,686 77,394
Net property, plant, and equipment …………………………………………………………………………………………………………………………………………………………………………………………………………………54,556 54,433 55,393 55,662 56,954
U.S. Treasury and Federal agency securities, due in more than 1 year …………………………………………………………………………………………………………………………………………………………………………………………302 210 228 230 218
All other noncurrent assets, including investment in nonconsolidated
entities, long-term investments, intangibles, etc. .………………………………………………………………………………………………………………………………………………………………………………………………………………………………296,813 297,118 298,064 297,594 294,622
Total Assets …………………………………………………………………………………………………………………………………………………………………………………………………………………………………………………517,276 516,582 520,009 517,439 518,651
LIABILITIES AND STOCKHOLDERS' EQUITY
Short-term debt, original maturity of 1 year or less:
a. Loans from banks ………………………………………………………………………………………………………………………………………………………………………………………………………………………………………3,383 3,365 3,297 3,176 3,452
b. Commercial paper ………………………………………………………………………………………………………………………………………………………………………………………………………………………………………3,873 3,873 3,193 3,104 4,074
c. Other short-term loans ………………………………………………………………………………………………………………………………………………………………………………………………………………………………3,537 2,638 2,090 2,712 1,885
Advances and prepayments by the U.S. Government …………………………………………………………………………………………………………………………………………………………………………………………………………0 0 0 0 0
Trade accounts and trade notes payable ………………………………………………………………………………………………………………………………………………………………………………………………………………………30,887 31,770 32,563 31,470 32,418
Income taxes accrued, prior and current years, net of payments:
a. Federal ……………………………………………………………………………………………………………………………………………………………………………………………………………………………………………………5,807 5,826 5,456 5,138 5,480
b. Other ………………………………………………………………………………………………………………………………………………………………………………………………………………………………………………189 156 100 138 179
Current portion of long-term debt, due in 1 year or less:
a. Loans from banks ……………………………………………………………………………………………………………………………………………………………………………………………………………………………………1,778 1,623 2,003 1,973 1,801
b. Bonds and debentures …………………………………………………………………………………………………………………………………………………………………………………………………………………………………2,235 2,089 1,172 1,145 1,113
c. Other long-term loans ………………………………………………………………………………………………………………………………………………………………………………………………………………………………………2,667 3,412 2,732 2,707 2,649
All other current liabilities, including excise and
sales taxes, and accrued expenses ……………………………………………………………………………………………………………………………………………………………………………62,343 59,896 61,000 63,710 64,267
Total current liabilities ………………………………………………………………………………………………………………………………………………………………………………………………………………………………116,699 114,649 113,606 115,273 117,318
Long-term debt, due in more than 1 year:
a. Loans from banks ………………………………………………………………………………………………………………………………………………………………………………………………………………………………………………20,291 24,337 25,651 25,852 26,975
b. Bonds and debentures ………………………………………………………………………………………………………………………………………………………………………………………………………………………………………37,224 36,418 38,093 38,088 38,749
c. Other long-term loans …………………………………………………………………………………………………………………………………………………………………………………………………………………………………………30,865 30,918 32,720 34,485 35,307
All other noncurrent liabilities, including deferred income taxes,
capitalized leases, and minority stockholders' interest
in consolidated domestic corporations ………………………………………………………………………………………………………………………………………………………………………………90,310 90,134 88,149 87,171 93,183
Total liabilities ……………………………………………………………………………………………………………………………………………………………………………………………………………………………………295,388 296,456 298,219 300,868 311,532
Capital stock and other capital …………………………………………………………………………………………………………………………………………………………………………………………………………………………………130,373 131,243 131,634 130,011 128,683
Retained earnings ……………………………………………………………………………………………………………………………………………………………………………………………………………………………………174,007 175,890 179,406 184,230 188,978
Cumulative foreign currency translation adjustment …………………………………………………………………………………………………………………………………………………………………………………………………………(2,288) (2,487) (2,132) (4,099) (7,063)
Other stockholders' equity items, including unearned
compensation and ESOP debt guarantees ……………………………………………………………………………………………………………………………………………………………………(11,091) (10,948) (11,852) (13,285) (19,893)
Less: Treasury stock at cost ………………………………………………………………………………………………………………………………………………………………………………………………………………………………………69,113 73,571 75,265 80,288 83,587
Stockholders' equity ………………………………………………………………………………………………………………………………………………………………………………………………………………………………221,887 220,126 221,790 216,570 207,119
Total Liabilities and Stockholders' Equity ……………………………………………………………………………………………………………………………………………………517,276 516,582 520,009 517,439 518,651
NET WORKING CAPITAL
Excess of total current assets over total current liabilities ……………………………………………………………………………………………………………………………………………………………………………48,906 50,172 52,718 48,679 49,539
(million dollars)
Machinery
Total Assets $25 Million and Over
Table 59.1 -- Balance Sheet For Corporations in NAICS Manufacturing Subsector 333,
Total Assets $25 Million and Over
See the Survey Methodology section of the Introduction for information on survey design, estimation, and sampling error.
119U.S. Census Bureau, Quarterly Financial Report, 2014 Quarter 4
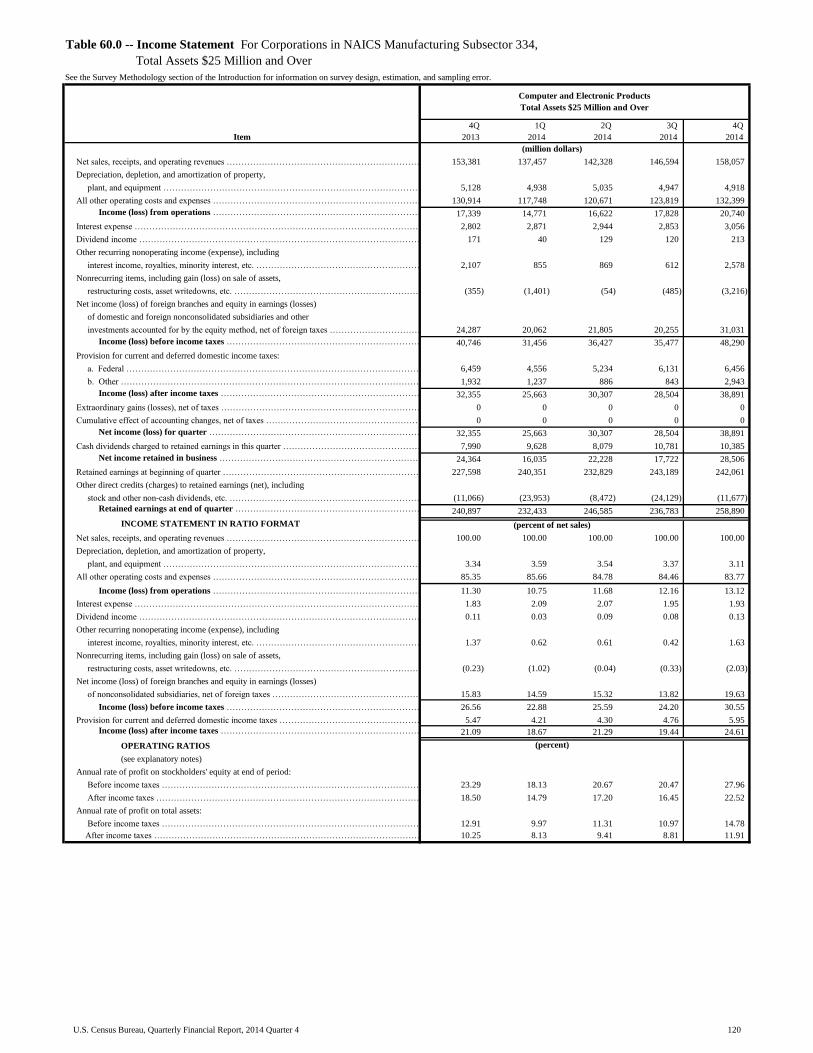
Table with row headers in column A with column headers in rows 5 and 6
Item
4Q_
2013_
1Q_
2014_
2Q_
2014_
3Q_
2014_
4Q_
2014_
Net sales, receipts, and operating revenues ………………………………………………………………………………………………………………………………………………………………………………………………………153,381 137,457 142,328 146,594 158,057
Depreciation, depletion, and amortization of property,
plant, and equipment ……………………………………………………………………………………………………………………………………………………………………5,128 4,938 5,035 4,947 4,918
All other operating costs and expenses …………………………………………………………………………………………………………………………………………………………………………………………………130,914 117,748 120,671 123,819 132,399
Income (loss) from operations …………………………………………………………………………………………………………………………………………...……………………………………………………………17,339 14,771 16,622 17,828 20,740
Interest expense …………………………………………………………………………………………………………………………………………………………………………………………………………………………………………2,802 2,871 2,944 2,853 3,056
Dividend income …………………………………………………………………………………………………………………………………………………………………………………………………………………………………………………171 40 129 120 213
Other recurring nonoperating income (expense), including
interest income, royalties, minority interest, etc. ………………………………………………………………………………………………………………………………………………………………………………………………………………………………………………2,107 855 869 612 2,578
Nonrecurring items, including gain (loss) on sale of assets,
restructuring costs, asset writedowns, etc. …………………………………………………………………………………………………………………………………………………………………(355) (1,401) (54) (485) (3,216)
Net income (loss) of foreign branches and equity in earnings (losses)
of domestic and foreign nonconsolidated subsidiaries and other
investments accounted for by the equity method, net of foreign taxes ………………………………………………………………………………………………………………………………………………………………………………………………………………24,287 20,062 21,805 20,255 31,031
Income (loss) before income taxes ………………………………………………………………………………………………………………………………………………………………………………………………………40,746 31,456 36,427 35,477 48,290
Provision for current and deferred domestic income taxes:
a. Federal …………………………………………………………………………………………………………………………………………………………………………………………………………………………………………………6,459 4,556 5,234 6,131 6,456
b. Other …………………………………………………………………………………………………………………………………………………………………………………………………………………………………………………1,932 1,237 886 843 2,943
Income (loss) after income taxes ……………………………………………………………………………………………………………………………………………………………………………………………………32,355 25,663 30,307 28,504 38,891
Extraordinary gains (losses), net of taxes ……………………………………………………………………………………………………………………………………………………………………………………………………………0 0 0 0 0
Cumulative effect of accounting changes, net of taxes ……………………………………………………………………………………………………………………………………………………………………………………………0 0 0 0 0
Net income (loss) for quarter ………………………………………………………………………………………………………………………………………………………………………………………………………………32,355 25,663 30,307 28,504 38,891
Cash dividends charged to retained earnings in this quarter ………………………………………………………………………………………………………………………………………………………………………………………7,990 9,628 8,079 10,781 10,385
Net income retained in business …………………………………………………………………………………………………………………………………………………………………………………………………………………24,364 16,035 22,228 17,722 28,506
Retained earnings at beginning of quarter ………………………………………………………………………………………………………………………………………………………………………………………………………………………227,598 240,351 232,829 243,189 242,061
Other direct credits (charges) to retained earnings (net), including
stock and other non-cash dividends, etc. ……………………………………………………………………………………………………………………………………………………………………………………………………………………………(11,066) (23,953) (8,472) (24,129) (11,677)
Retained earnings at end of quarter ………………………………………………………………………………………………………………………………………………………………………………………………………240,897 232,433 246,585 236,783 258,890
INCOME STATEMENT IN RATIO FORMAT
Net sales, receipts, and operating revenues ……………………………………………………………………………………………………………………………………………………………………………………………………………100.00 100.00 100.00 100.00 100.00
Depreciation, depletion, and amortization of property,
plant, and equipment …………………………………………………………………………………………………………………………………………………………………………………3.34 3.59 3.54 3.37 3.11
All other operating costs and expenses ……………………………………………………………………………………………………………………………………………………………………………………………………………………………85.35 85.66 84.78 84.46 83.77
Income (loss) from operations …………………………………………………………………………………………………………………………………………………………………………………………………………………11.30 10.75 11.68 12.16 13.12
Interest expense ………………………………………………………………………………………………………………………………………………………………………………………………………………………………………………1.83 2.09 2.07 1.95 1.93
Dividend income …………………………………………………………………………………………………………………………………………………………………………………………………………………………………………………0.11 0.03 0.09 0.08 0.13
Other recurring nonoperating income (expense), including
interest income, royalties, minority interest, etc. …………………………………………………………………………………………………………………………………………………………………………………………………………………………………………………1.37 0.62 0.61 0.42 1.63
Nonrecurring items, including gain (loss) on sale of assets,
restructuring costs, asset writedowns, etc. ………………………………………………………………………………………………………………………………………………………………………………………………………………………………………………………………………………………………………(0.23) (1.02) (0.04) (0.33) (2.03)
Net income (loss) of foreign branches and equity in earnings (losses)
of nonconsolidated subsidiaries, net of foreign taxes …………………………………………………………………………………………………………………………………………………………………………………………………………15.83 14.59 15.32 13.82 19.63
Income (loss) before income taxes …………………………………………………………………………………………………………………………………………………………………………………………………………………26.56 22.88 25.59 24.20 30.55
Provision for current and deferred domestic income taxes ………………………………………………………………………………………………………………………………………………………………………………………………………5.47 4.21 4.30 4.76 5.95
Income (loss) after income taxes ………………………………………………………………………………………………………………………………………………………………………………………………………………………21.09 18.67 21.29 19.44 24.61
OPERATING RATIOS
(see explanatory notes)
Annual rate of profit on stockholders' equity at end of period:
Before income taxes …………………………………………………………………………………………………………………………………………………………………………………………………………………………………………23.29 18.13 20.67 20.47 27.96
After income taxes …………………………………………………………………………………………………………………………………………………………………………………………………………………………………………18.50 14.79 17.20 16.45 22.52
Annual rate of profit on total assets:
Before income taxes …………………………………………………………………………………………………………………………………………………………………………………………………………………………………………12.91 9.97 11.31 10.97 14.78
After income taxes ……………………………………………………………………………………………………………………………………………………………………………………………………………………………………………10.25 8.13 9.41 8.81 11.91
Table 60.0 -- Income Statement For Corporations in NAICS Manufacturing Subsector 334,
Total Assets $25 Million and Over
See the Survey Methodology section of the Introduction for information on survey design, estimation, and sampling error.
Computer and Electronic Products
Total Assets $25 Million and Over
(million dollars)
(percent of net sales)
(percent)
120U.S. Census Bureau, Quarterly Financial Report, 2014 Quarter 4
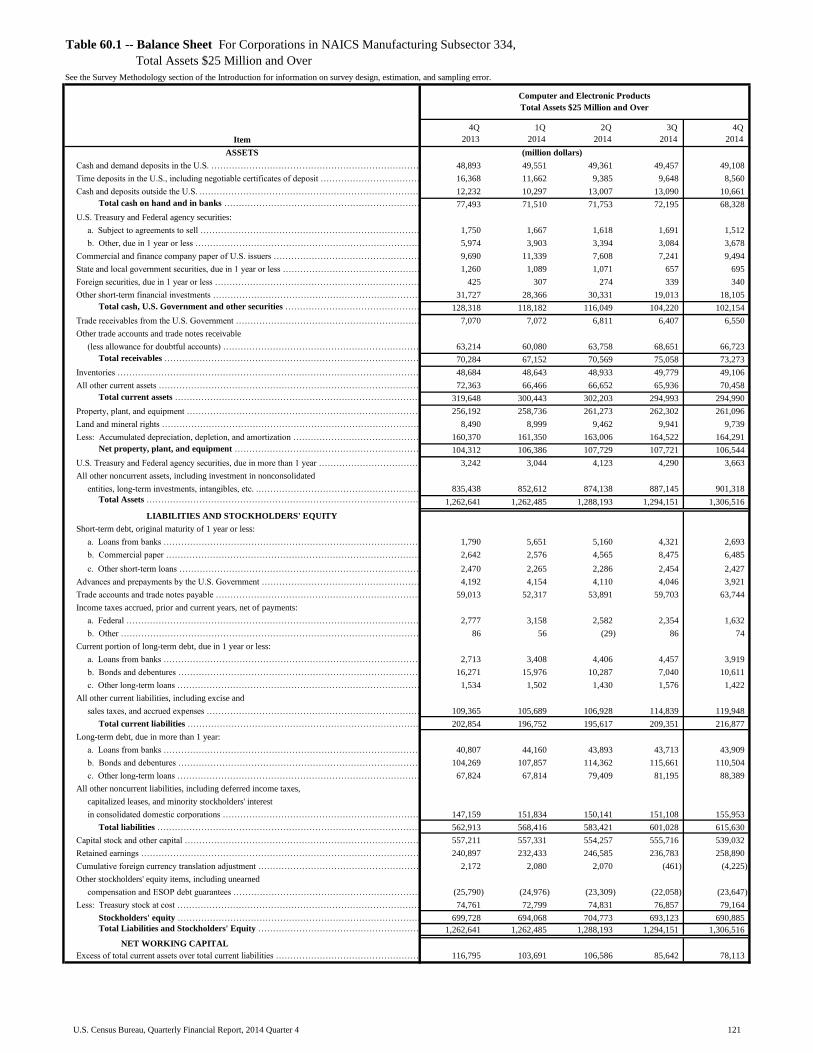
Table with row headers in column A with column headers in rows 5 and 6
Item
4Q_
2013_
1Q_
2014_
2Q_
2014_
3Q_
2014_
4Q_
2014_
ASSETS
Cash and demand deposits in the U.S. ……………………………………………………………………………………………………………………………………………………………………………………………………………………………48,893 49,551 49,361 49,457 49,108
Time deposits in the U.S., including negotiable certificates of deposit …………………………………………………………………………………………………………………………………………………………………………………………16,368 11,662 9,385 9,648 8,560
Cash and deposits outside the U.S. .……………………………………………………………………………………………………………………………………………………………………………………………………………………………………………12,232 10,297 13,007 13,090 10,661
Total cash on hand and in banks ……………………………………………………………………………………………………………………………………………………………………………………………………………………………77,493 71,510 71,753 72,195 68,328
U.S. Treasury and Federal agency securities:
a. Subject to agreements to sell …………………………………………………………………………………………………………………………………………………………………………………………………………………………………1,750 1,667 1,618 1,691 1,512
b. Other, due in 1 year or less ……………………………………………………………………………………………………………………………………………………………………………………………………………………………………5,974 3,903 3,394 3,084 3,678
Commercial and finance company paper of U.S. issuers …………………………………………………………………………………………………………………………………………………………………………………………………………9,690 11,339 7,608 7,241 9,494
State and local government securities, due in 1 year or less …………………………………………………………………………………………………………………………………………………………………………………………………………1,260 1,089 1,071 657 695
Foreign securities, due in 1 year or less ………………………………………………………………………………………………………………………………………………………………………………………………………………………………425 307 274 339 340
Other short-term financial investments …………………………………………………………………………………………………………………………………………………………………………………………31,727 28,366 30,331 19,013 18,105
Total cash, U.S. Government and other securities ……………………………………………………………………………………………………………………………………………………………………………………………………128,318 118,182 116,049 104,220 102,154
Trade receivables from the U.S. Government …………………………………………………………………………………………………………………………………………………………………………………………………………………………7,070 7,072 6,811 6,407 6,550
Other trade accounts and trade notes receivable
(less allowance for doubtful accounts) ………………………………………………………………………………………………………………………………………………………………………63,214 60,080 63,758 68,651 66,723
Total receivables ………………………………………………………………………………………………………………………………………………………………………………………………………………………………70,284 67,152 70,569 75,058 73,273
Inventories ……………………………………………………………………………………………………………………………………………………………………………………………………………………………………………………48,684 48,643 48,933 49,779 49,106
All other current assets …………………………………………………………………………………………………………………………………………………………………………………………………………………………………………72,363 66,466 66,652 65,936 70,458
Total current assets ……………………………………………………………………………………………………………………………………………………………………………………………………………………………………319,648 300,443 302,203 294,993 294,990
Property, plant, and equipment ……………………………………………………………………………………………………………………………………………………………………………………………………………………………………………256,192 258,736 261,273 262,302 261,096
Land and mineral rights …………………………………………………………………………………………………………………………………………………………………………………………………………………………………………8,490 8,999 9,462 9,941 9,739
Less: Accumulated depreciation, depletion, and amortization ………………………………………………………………………………………………………………………………………………………………………………………………160,370 161,350 163,006 164,522 164,291
Net property, plant, and equipment …………………………………………………………………………………………………………………………………………………………………………………………………………………104,312 106,386 107,729 107,721 106,544
U.S. Treasury and Federal agency securities, due in more than 1 year …………………………………………………………………………………………………………………………………………………………………………………………3,242 3,044 4,123 4,290 3,663
All other noncurrent assets, including investment in nonconsolidated
entities, long-term investments, intangibles, etc. .………………………………………………………………………………………………………………………………………………………………………………………………………………………………835,438 852,612 874,138 887,145 901,318
Total Assets …………………………………………………………………………………………………………………………………………………………………………………………………………………………………………………1,262,641 1,262,485 1,288,193 1,294,151 1,306,516
LIABILITIES AND STOCKHOLDERS' EQUITY
Short-term debt, original maturity of 1 year or less:
a. Loans from banks ………………………………………………………………………………………………………………………………………………………………………………………………………………………………………1,790 5,651 5,160 4,321 2,693
b. Commercial paper ………………………………………………………………………………………………………………………………………………………………………………………………………………………………………2,642 2,576 4,565 8,475 6,485
c. Other short-term loans ………………………………………………………………………………………………………………………………………………………………………………………………………………………………2,470 2,265 2,286 2,454 2,427
Advances and prepayments by the U.S. Government …………………………………………………………………………………………………………………………………………………………………………………………………………4,192 4,154 4,110 4,046 3,921
Trade accounts and trade notes payable ………………………………………………………………………………………………………………………………………………………………………………………………………………………59,013 52,317 53,891 59,703 63,744
Income taxes accrued, prior and current years, net of payments:
a. Federal ……………………………………………………………………………………………………………………………………………………………………………………………………………………………………………………2,777 3,158 2,582 2,354 1,632
b. Other ………………………………………………………………………………………………………………………………………………………………………………………………………………………………………………86 56 (29) 86 74
Current portion of long-term debt, due in 1 year or less:
a. Loans from banks ……………………………………………………………………………………………………………………………………………………………………………………………………………………………………2,713 3,408 4,406 4,457 3,919
b. Bonds and debentures …………………………………………………………………………………………………………………………………………………………………………………………………………………………………16,271 15,976 10,287 7,040 10,611
c. Other long-term loans ………………………………………………………………………………………………………………………………………………………………………………………………………………………………………1,534 1,502 1,430 1,576 1,422
All other current liabilities, including excise and
sales taxes, and accrued expenses ……………………………………………………………………………………………………………………………………………………………………………109,365 105,689 106,928 114,839 119,948
Total current liabilities ………………………………………………………………………………………………………………………………………………………………………………………………………………………………202,854 196,752 195,617 209,351 216,877
Long-term debt, due in more than 1 year:
a. Loans from banks ………………………………………………………………………………………………………………………………………………………………………………………………………………………………………………40,807 44,160 43,893 43,713 43,909
b. Bonds and debentures ………………………………………………………………………………………………………………………………………………………………………………………………………………………………………104,269 107,857 114,362 115,661 110,504
c. Other long-term loans …………………………………………………………………………………………………………………………………………………………………………………………………………………………………………67,824 67,814 79,409 81,195 88,389
All other noncurrent liabilities, including deferred income taxes,
capitalized leases, and minority stockholders' interest
in consolidated domestic corporations ………………………………………………………………………………………………………………………………………………………………………………147,159 151,834 150,141 151,108 155,953
Total liabilities ……………………………………………………………………………………………………………………………………………………………………………………………………………………………………562,913 568,416 583,421 601,028 615,630
Capital stock and other capital …………………………………………………………………………………………………………………………………………………………………………………………………………………………………557,211 557,331 554,257 555,716 539,032
Retained earnings ……………………………………………………………………………………………………………………………………………………………………………………………………………………………………240,897 232,433 246,585 236,783 258,890
Cumulative foreign currency translation adjustment …………………………………………………………………………………………………………………………………………………………………………………………………………2,172 2,080 2,070 (461) (4,225)
Other stockholders' equity items, including unearned
compensation and ESOP debt guarantees ……………………………………………………………………………………………………………………………………………………………………(25,790) (24,976) (23,309) (22,058) (23,647)
Less: Treasury stock at cost ………………………………………………………………………………………………………………………………………………………………………………………………………………………………………74,761 72,799 74,831 76,857 79,164
Stockholders' equity ………………………………………………………………………………………………………………………………………………………………………………………………………………………………699,728 694,068 704,773 693,123 690,885
Total Liabilities and Stockholders' Equity ……………………………………………………………………………………………………………………………………………………1,262,641 1,262,485 1,288,193 1,294,151 1,306,516
NET WORKING CAPITAL
Excess of total current assets over total current liabilities ……………………………………………………………………………………………………………………………………………………………………………116,795 103,691 106,586 85,642 78,113
(million dollars)
Computer and Electronic Products
Total Assets $25 Million and Over
Table 60.1 -- Balance Sheet For Corporations in NAICS Manufacturing Subsector 334,
Total Assets $25 Million and Over
See the Survey Methodology section of the Introduction for information on survey design, estimation, and sampling error.
121U.S. Census Bureau, Quarterly Financial Report, 2014 Quarter 4