Embed Size (px)
Citation preview
Cigna Corporation
Quarterly Financial Supplement September 30, 2014
This document is dated October 30, 2014. The data contained in this document may not be accurate after such date and Cigna does not undertake to update or keep it accurate after such date.
Cigna Corporation September 30, 2014 Quarterly Financial Supplement Table of Contents Financial Highlights .......................................................................................................................................................................................... 1 Reconciliation of Adjusted Income (Loss) from Operations to Shareholders’ Net Income .......................................................................... 2 Consolidated Income Statements .................................................................................................................................................................... 3 Business Segment Analysis: Global Health Care ............................................................................................................................................................................. 4 Global Supplemental Benefits .......................................................................................................................................................... 8 Group Disability and Life .................................................................................................................................................................. 10 Corporate and Other .......................................................................................................................................................................... 11 Consolidated Balance Sheets ........................................................................................................................................................................... 12 Investment Summaries: Summary of Fixed Maturities – Asset Quality / Type – Fair Value .................................................................................................. 13 Summary of Fixed Maturities – Analysis of Amortized Cost vs. Fair Value ................................................................................... 14 Summary of Commercial Mortgage Loans....................................................................................................................................... 15 Condensed Consolidated Statements of Cash Flows ..................................................................................................................................... 17
BASIS OF PRESENTATION: All dollar amounts are in millions, unless otherwise noted. Cigna measures the financial results of its segments using "segment earnings (loss)," defined as shareholders' net income (loss) before net realized investment gains (losses). Adjusted income (loss) from operations is defined as segment earnings excluding special items (identified and quantified on page 2) and results of Cigna's guaranteed minimum income benefits business. Adjusted income (loss) from operations is a measure of profitability used by Cigna's management because it presents the underlying results of operations of Cigna's businesses and permits analysis of trends in underlying revenue, expenses and shareholders’ net income (loss). Operating revenues exclude net realized investment results. This measure is used by Cigna's management because it presents the underlying revenue of Cigna's operating businesses. Adjusted income (loss) from operations and operating revenues are not determined in accordance with accounting principles generally accepted in the United States of America (GAAP) and should not be viewed as substitutes for the most directly comparable GAAP measures, which are shareholders’ net income (loss) and segment revenues. Beginning with the first quarter of 2014, Cigna reports its run-off reinsurance business in Other Operations. In addition, in this Quarterly Financial Supplement, Other Operations and Corporate have been combined under the heading “Corporate and Other.” Prior year information has been conformed to the current presentation. In some of the financial tables in this Quarterly Financial Supplement, we present percentage changes. When those changes are so large as to become not meaningful, we present “N/M” in place of the computed percentage.

1
Cigna Corporation Financial Highlights (unaudited) (Dollars in millions, except per share amounts) Three Months Ended September 30, Nine Months Ended September 30, 2014 2013 % Change 2014 2013 % Change SEGMENT REVENUES Global Health Care $ 6,844 $ 6,316 8 % $ 20,273 $ 18,941 7 % Global Supplemental Benefits 775 663 17 2,248 1,947 15 Group Disability and Life 990 930 6 2,962 2,791 6 Corporate and Other 125 130 (4) 373 358 4 Total operating revenue 8,734 8,039 9 25,856 24,037 8 Net realized investment gains 23 27 (15) 130 192 (32) Total Revenues $ 8,757 $ 8,066 9 % $ 25,986 $ 24,229 7 % ADJUSTED INCOME (LOSS) FROM OPERATIONS Global Health Care $ 434 $ 424 2 % $ 1,275 $ 1,254 2 % Global Supplemental Benefits 83 39 113 197 143 38 Group Disability and Life 55 92 (40) 232 245 (5) Ongoing operations 572 555 3 1,704 1,642 4 Corporate and Other (53) (19) (179) (154) (97) (59) Total $ 519 $ 536 (3) % $ 1,550 $ 1,545 - % Diluted earnings per share - adjusted income from operations $ 1.95 $ 1.89 3 % $ 5.74 $ 5.39 6 % SHAREHOLDERS' NET INCOME Segment Earnings (Loss) Global Health Care $ 434 $ 424 2 % $ 1,275 $ 1,230 4 % Global Supplemental Benefits 83 39 113 197 143 38 Group Disability and Life 55 92 (40) 232 194 20 Ongoing operations 572 555 3 1,704 1,567 9 Corporate and Other (53) (19) (179) (154) (579) 73 Total 519 536 (3) 1,550 988 57 Net realized investment gains, net of taxes 15 17 (12) 85 127 (33) Shareholders' net income 534 553 (3) 1,635 1,115 47 Diluted earnings per share - shareholders' net income $ 2.01 $ 1.95 3 % $ 6.05 $ 3.89 56 % CUSTOMER RELATIONSHIPS As of September 30, As of December 31, (Relationships, lives and policies in thousands) 2014 2013 % Change 2013 % Change Global Health Care Medical Customers: (see page 7) 14,346 14,138 1 % 14,078 2 % Other Customer Relationships: (see page 7) Behavioral care 23,494 22,564 4 22,515 4 Dental 12,837 12,248 5 12,234 5 Pharmacy 7,445 7,000 6 7,095 5 Medicare Part D 1,194 1,195 - 1,190 - Global Supplemental Benefit Policies (see page 9) 12,324 11,823 4 11,869 4 Group Disability and Life covered lives (estimated) 13,600 12,100 12 13,600 - Total customer relationships 85,240 81,068 5 % 82,581 3 %
2
Cigna Corporation Reconciliation of Adjusted Income (Loss) from Operations to Shareholders’ Net Income (Dollars in millions, except per share amounts) Diluted Global Group Corporate Earnings Per Global Supplemental Disability and Share Consolidated Health Care Benefits and Life Other
Three Months Ended September 30, 2014 2013 2014 2013 2014 2013 2014 2013 2014 2013 2014 2013 Adjusted income (loss) from operations $ 1.95 $ 1.89 $ 519 $ 536 $ 434 $ 424 $ 83 $ 39 $ 55 $ 92 $ (53) $ (19)
Segment earnings (loss) 1.95 1.89 519 536 $ 434 $ 424 $ 83 $ 39 $ 55 $ 92 $ (53) $ (19)
Net realized investment gains, net of taxes 0.06 0.06 15 17
Shareholders' net income $ 2.01 $ 1.95 $ 534 $ 553
Weighted average shares (in thousands) 265,891 283,563 Diluted Global Group Corporate Earnings Per Global Supplemental Disability and Share Consolidated Health Care Benefits and Life Other
Nine Months Ended September 30, 2014 2013 2014 2013 2014 2013 2014 2013 2014 2013 2014 2013 Adjusted income (loss) from operations $ 5.74 $ 5.39 $ 1,550 $ 1,545 $ 1,275 $ 1,254 $ 197 $ 143 $ 232 $ 245 $ (154) $ (97)
Results of guaranteed minimum income benefits business - 0.09 - 25 - - - - - - - 25
Special items, after-tax:
Transaction costs associated with PBM services agreement - (0.08) - (24) - (24) - - - - - -
Charge related to reinsurance transaction - (1.77) - (507) - - - - - - - (507)
Charge for disability claims regulatory matter - (0.18) - (51) - - - - - (51) - -
Segment earnings (loss) 5.74 3.45 1,550 988 $ 1,275 $ 1,230 $ 197 $ 143 $ 232 $ 194 $ (154) $ (579)
Net realized investment gains, net of taxes 0.31 0.44 85 127
Shareholders' net income $ 6.05 $ 3.89 $ 1,635 $ 1,115
Weighted average shares (in thousands) 270,061 286,615
Special Items, pre-tax:
Transaction costs associated with PBM services agreement $ - $ (37) $ - $ (37) $ - $ - $ - $ - $ - $ -
Charge related to reinsurance transaction - (781) - - - - - - - (781)
Charge for disability claims regulatory matter - (77) - - - - - (77) - -
Total $ - $ (895) $ - $ (37) $ - $ - $ - $ (77) $ - $ (781)
3
Cigna Corporation Consolidated Income Statements (unaudited) (Dollars in millions) Three Months Ended September 30, Nine Months Ended September 30,
2014 2013 % Change 2014 2013 % Change
Revenues:
Premiums and fees $ 7,793 $ 7,206 8 % $ 23,167 $ 21,692 7 %
Net investment income 292 297 (2) 863 873 (1)
Mail order pharmacy revenues 583 471 24 1,625 1,333 22
Other revenues (1) 66 65 2 201 139 45
Total operating revenues 8,734 8,039 9 25,856 24,037 8
Net realized investment gains 23 27 (15) 130 192 (32)
Total revenues 8,757 8,066 9 25,986 24,229 7
Benefits and Expenses:
Global Health Care medical claims expense 4,153 3,913 6 12,403 11,864 5
Other benefit expenses excluding special items 1,207 1,031 17 3,473 3,088 12
Mail order pharmacy costs 499 390 28 1,382 1,096 26
Guaranteed minimum income benefits fair value (gain) excluding special items - - - - (45) (100)
Operating expenses excluding special items 2,080 1,933 8 6,156 5,691 8
Special items (see details on page 2) - - - - 895 (100)
Total benefits and expenses 7,939 7,267 9 23,414 22,589 4
Income before income taxes 818 799 2 2,572 1,640 57
Income taxes:
Current 289 205 41 928 285 226
Deferred (2) 41 (105) 12 237 (95)
Total taxes 287 246 17 940 522 80
Net income 531 553 (4) 1,632 1,118 46
Less: net income (loss) attributable to noncontrolling interests (3) - N/M (3) 3 (200)
Shareholders' net income $ 534 $ 553 (3) % $ 1,635 $ 1,115 47 % (1) Includes non-risk revenues for direct channel specialty products and revenues for management services provided to independent physician associations and health plans. In addition,
amounts for 2013 include pre-tax losses prior to February 4, 2013 resulting from dynamic hedge programs in Cigna's run-off reinsurance operations. These hedge programs were terminated after February 4, 2013 as a result of the reinsurance transaction with Berkshire.

4
Cigna Corporation Global Health Care Segment Earnings (unaudited)
(Dollars in millions) Three Months Ended September 30, Nine Months Ended September 30, 2014 2013 % Change 2014 2013 % Change
Revenues:
Premiums and fees $ 6,109 $ 5,699 7 % $ 18,222 $ 17,210 6 %
Net investment income 87 86 1 244 243 -
Mail order pharmacy revenues 583 471 24 1,625 1,333 22
Other revenues 65 60 8 182 155 17
Segment revenues 6,844 6,316 8 20,273 18,941 7
Benefits and Expenses:
Global Health Care medical claims expense 4,153 3,913 6 12,403 11,864 5
Mail order pharmacy costs 499 390 28 1,382 1,096 26
Operating expenses excluding special items 1,501 1,375 9 4,411 4,054 9
Special items (see details on page 2) - - - - 37 (100)
Benefits and expenses 6,153 5,678 8 18,196 17,051 7
Income before income taxes 691 638 8 2,077 1,890 10
Income taxes 258 214 21 804 660 22
Loss attributable to noncontrolling interest (1) - N/M (2) - N/M Segment earnings, after-tax 434 424 2 1,275 1,230 4 Less: Special items, after-tax (see details on page 2) - - - - (24) 100 Adjusted income from operations $ 434 $ 424 2 % $ 1,275 $ 1,254 2 %
Net realized investment gains, net of taxes $ 11 $ 14 (21) % $ 40 $ 65 (38) %
5
Cigna Corporation Global Health Care Revenue Analysis (unaudited) (Dollars in millions) Three Months Ended September 30, Nine Months Ended September 30,
2014 2013 % Change 2014 2013 % Change Premiums: Guaranteed cost $ 1,189 $ 1,123 6 % $ 3,422 $ 3,338 3 % Experience-rated (1) 567 570 (1) 1,742 1,710 2 Stop loss 592 479 24 1,708 1,410 21 International health care 461 433 6 1,371 1,315 4 Dental 327 285 15 927 850 9 Medicare 1,392 1,404 (1) 4,263 4,255 - Medicaid 142 81 75 316 235 34 Medicare Part D 304 302 1 1,097 1,089 1 Other 203 185 10 603 549 10 Total Premiums 5,177 4,862 6 15,449 14,751 5 Fees, including international health care 932 837 11 2,773 2,459 13 Premiums and Fees 6,109 5,699 7 18,222 17,210 6 Mail order pharmacy revenues (2) 583 471 24 1,625 1,333 22 Other revenues (3) 65 60 8 182 155 17 Net investment income 87 86 1 244 243 - Segment revenues $ 6,844 $ 6,316 8 % $ 20,273 $ 18,941 7 % (1) Includes minimum premium business that has a risk profile similar to experience-rated funding arrangements. The risk portion of minimum premium revenue is reported in experience-
rated medical premium whereas the self-funding portion of minimum premium revenue is reported in Fees. Also, includes certain non-participating cases for which special customer-level reporting of experience is required.
(2) Reflects revenues for non-risk mail order pharmacy fulfillment services.
(3) Includes non-risk revenues for direct channel specialty products and revenues for management services provided to independent physician associations and health plans.
6
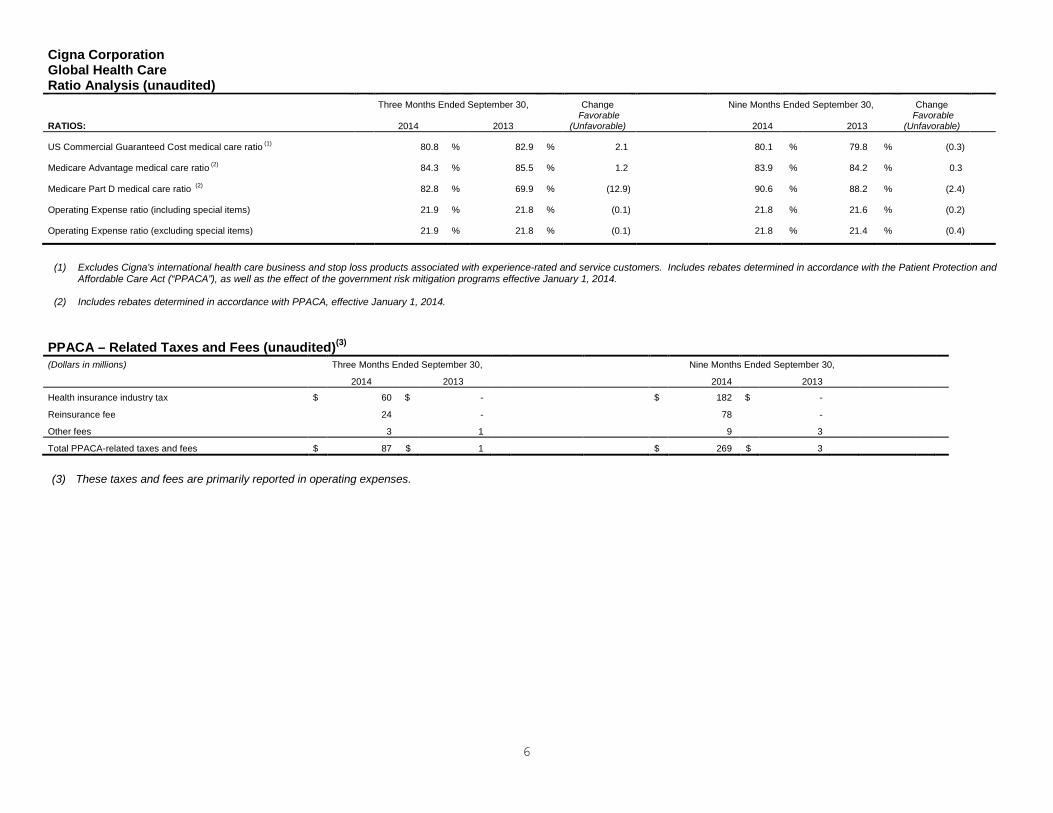
Cigna Corporation Global Health Care Ratio Analysis (unaudited) Three Months Ended September 30, Change Nine Months Ended September 30, Change
RATIOS: 2014 2013 Favorable
(Unfavorable) 2014 2013 Favorable
(Unfavorable) US Commercial Guaranteed Cost medical care ratio (1) 80.8 % 82.9 % 2.1 80.1 % 79.8 % (0.3) Medicare Advantage medical care ratio (2) 84.3 % 85.5 % 1.2 83.9 % 84.2 % 0.3 Medicare Part D medical care ratio (2) 82.8 % 69.9 % (12.9) 90.6 % 88.2 % (2.4) Operating Expense ratio (including special items) 21.9 % 21.8 % (0.1) 21.8 % 21.6 % (0.2) Operating Expense ratio (excluding special items) 21.9 % 21.8 % (0.1) 21.8 % 21.4 % (0.4)
(1) Excludes Cigna's international health care business and stop loss products associated with experience-rated and service customers. Includes rebates determined in accordance with the Patient Protection and Affordable Care Act (“PPACA”), as well as the effect of the government risk mitigation programs effective January 1, 2014.
(2) Includes rebates determined in accordance with PPACA, effective January 1, 2014. PPACA – Related Taxes and Fees (unaudited)(3) (Dollars in millions) Three Months Ended September 30, Nine Months Ended September 30,
2014 2013 2014 2013 Health insurance industry tax $ 60 $ - $ 182 $ - Reinsurance fee 24 - 78 - Other fees 3 1 9 3
Total PPACA-related taxes and fees $ 87 $ 1 $ 269 $ 3 (3) These taxes and fees are primarily reported in operating expenses.
.

7
Cigna Corporation Global Health Care Estimated Covered Lives (unaudited) COVERED LIVES BY As of September 30, As of December 31, COVERED LIVES BY As of September 30, As of December 31,
FUNDING TYPE: 2014 2013 %
Change 2013 % Change MARKET SEGMENT: (6) 2014 2013(7) % Change 2013 (7) % Change
(Lives in thousands) (Lives in thousands) Medical customers: (1) Medical customers: (1)
Commercial risk: U.S. Commercial: U.S. Guaranteed cost (2) 929 957 (3) % 960 (3) % National Accounts (2) 3,788 3,835 (1) % 3,810 (1) %
U.S. Experience-rated (3) 836 789 6 794 5 Middle Market (2)
7,413 7,400 - 7,327 1
International health care - risk 760 773 (2) 742 2 Select (2) 1,065 924 15 952 12 Total commercial risk (2) 2,525 2,519 - 2,496 1 Individual 295 232 27 237 24 Small 2 3 (33) 3 (33)
Medicare 456 463 (2) 467 (2) Total U.S. Commercial 12,563 12,394 1 12,329 2
Medicaid 58 25 132 25 132 International 1,269 1,256 1 1,257 1 Total risk (2) 3,039 3,007 1 2,988 2 Total Commercial 13,832 13,650 1 13,586 2 Medicare 456 463 (2) 467 (2)
Total service, including international health care 11,307 11,131 2 11,090 2 Medicaid 58 25 132 25 132
Total Government 514 488 5 492 4 Medical customers (ex. Limited Benefits) (2) 14,346 14,138 1 % 14,078 2 % Medical customers (ex. Limited Benefits) (2) 14,346 14,138 1 % 14,078 2 %
Limited Benefits - 162 (100) 139 (100) Limited Benefits - 162
(100) 139 (100)
Total medical customers 14,346 14,300 - % 14,217 1 % Total medical customers 14,346 14,300 - % 14,217 1 % Other Customer Relationships:
Behavioral care (4) 23,494 22,564 4 % 22,515 4 %
Dental (4) 12,837 12,248 5 % 12,234 5 %
Pharmacy (4) 7,445 7,000 6 % 7,095 5 %
Medicare Part D (5) 1,194 1,195 - % 1,190 - %
(1) Includes individuals who meet any one of the following criteria: are covered under an insurance policy or service agreement issued by Cigna; have access to Cigna's provider network for covered services under their medical plan; or have medical claims that are administered by Cigna.
(6) Market Segments are defined as follows: ~ the National Accounts market segment includes multi-state employers with more than 5,000 U.S. based, full-time employees in more than one state ~ the Middle Market segment includes employers with more than 250 but fewer than 5,000 U.S. based, full-time employees, single-site employers with more than 5,000 employees, Taft Hartley plans, and other third party payers; ~ the Select market segment includes employers with more than 50 but fewer than 250 eligible employees; ~ the Individual market segment includes individuals in ten states as of December 31, 2013: Arizona, California, Colorado, Connecticut, Florida, Georgia, North Carolina, South Carolina, Tennessee and Texas. ~ the Small market segment includes employers with 2-50 employees. Cigna has made a strategic business decision to exit this Market Segment. ~ the International health care segment is focused on health care products and services to meet the needs of local and multinational companies and organizations and their local and globally mobile employees and dependents. ~ the Government market segment offers Medicare Advantage (both to individuals who are post-65 retirees, as well as employer group sponsored pre- and post-65 retirees), Prescription Drug Program, and Medicaid products as managed care alternatives to publicly funded healthcare programs. (7) Prior year lives have been reclassified to reflect market segment transfers resulting primarily from increased/decreased enrollment at the account level.
(2) In connection with U.S. health care reform legislation, Cigna ceased offering limited medical benefits products effective December 31, 2013. Covered lives presented above for 2013 exclude limited medical benefits customers. (3) Includes minimum premium customers, who have a risk profile similar to experience-rated customers. Also, includes certain non-participating cases for which certain customer-level reporting of experience is required.
(4) Reflects customer relationships with Cigna’s dental, managed pharmacy, or behavioral care programs. These customers may also be medical customers, or they may have stand-alone dental, managed pharmacy, or behavioral care coverage. Behavioral customer relationships exclude certain wellness programs. Behavioral and dental customer relationships exclude international health care business. Prior year dental membership has been revised to conform to current presentation. (5) Reflects customers enrolled in Cigna’s Medicare Part D program, which provides access to prescription medications through a nationwide pharmacy network.
8
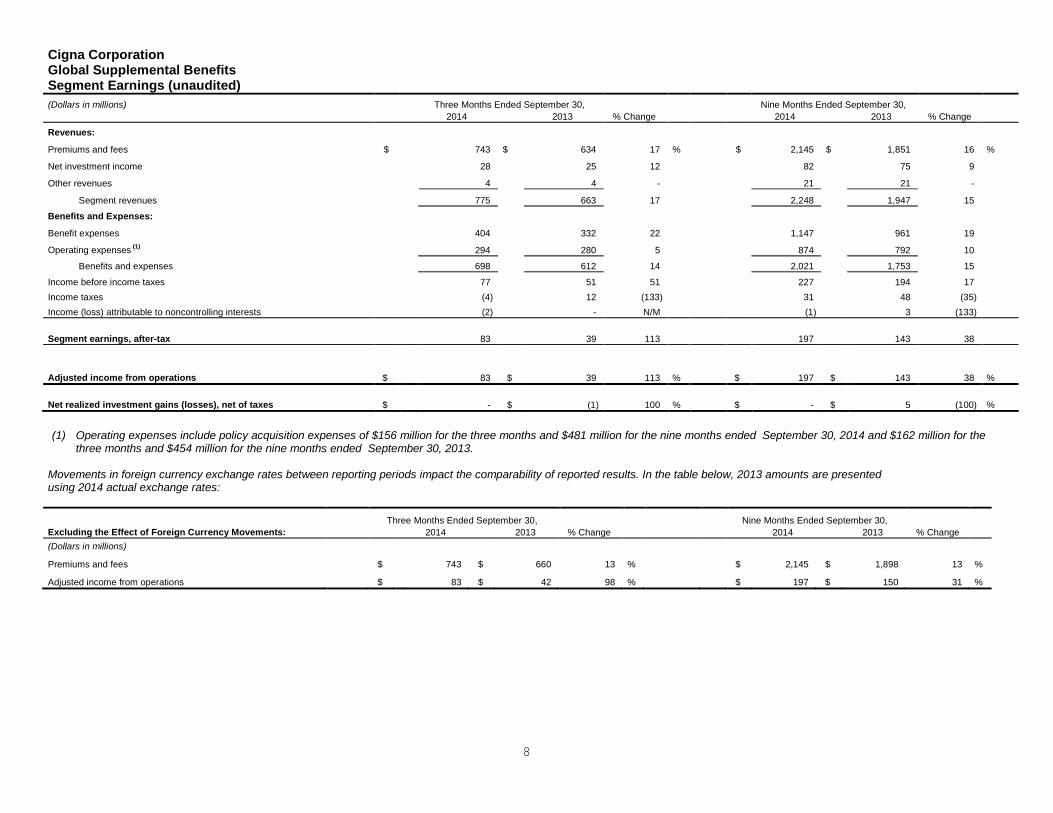
Cigna Corporation Global Supplemental Benefits Segment Earnings (unaudited) (Dollars in millions) Three Months Ended September 30, Nine Months Ended September 30,
2014 2013 % Change 2014 2013 % Change
Revenues:
Premiums and fees $ 743 $ 634 17 % $ 2,145 $ 1,851 16 %
Net investment income 28 25 12 82 75 9
Other revenues 4 4 - 21 21 -
Segment revenues 775 663 17 2,248 1,947 15
Benefits and Expenses:
Benefit expenses 404 332 22 1,147 961 19
Operating expenses (1) 294 280 5 874 792 10
Benefits and expenses 698 612 14 2,021 1,753 15
Income before income taxes 77 51 51 227 194 17 Income taxes (4) 12 (133) 31 48 (35) Income (loss) attributable to noncontrolling interests (2) - N/M (1) 3 (133) Segment earnings, after-tax 83 39 113 197 143 38
Adjusted income from operations $ 83 $ 39 113 % $ 197 $ 143 38 % Net realized investment gains (losses), net of taxes $ - $ (1) 100 % $ - $ 5 (100) % (1) Operating expenses include policy acquisition expenses of $156 million for the three months and $481 million for the nine months ended September 30, 2014 and $162 million for the
three months and $454 million for the nine months ended September 30, 2013.
Movements in foreign currency exchange rates between reporting periods impact the comparability of reported results. In the table below, 2013 amounts are presented using 2014 actual exchange rates: Three Months Ended September 30, Nine Months Ended September 30, Excluding the Effect of Foreign Currency Movements: 2014 2013 % Change 2014 2013 % Change (Dollars in millions) Premiums and fees $ 743 $ 660 13 % $ 2,145 $ 1,898 13 % Adjusted income from operations $ 83 $ 42 98 % $ 197 $ 150 31 %
9
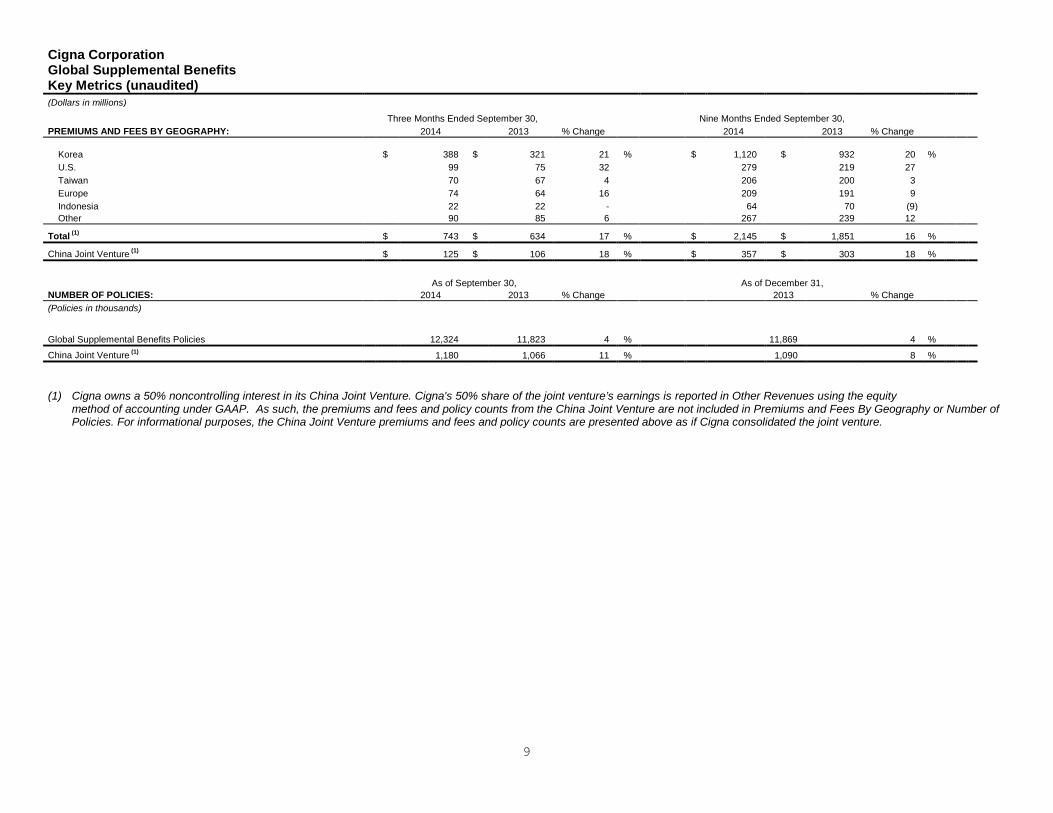
Cigna Corporation Global Supplemental Benefits Key Metrics (unaudited) (Dollars in millions)
PREMIUMS AND FEES BY GEOGRAPHY: Three Months Ended September 30, Nine Months Ended September 30, 2014 2013 % Change 2014 2013 % Change
Korea $ 388 $ 321 21 % $ 1,120 $ 932 20 % U.S. 99 75 32 279 219 27 Taiwan 70 67 4 206 200 3 Europe 74 64 16 209 191 9 Indonesia 22 22 - 64 70 (9) Other 90 85 6 267 239 12 Total (1) $ 743 $ 634 17 % $ 2,145 $ 1,851 16 % China Joint Venture (1) $ 125 $ 106 18 % $ 357 $ 303 18 %
As of September 30, As of December 31, NUMBER OF POLICIES: 2014 2013 % Change 2013 % Change (Policies in thousands)
Global Supplemental Benefits Policies 12,324 11,823 4 %
11,869 4 % China Joint Venture (1) 1,180 1,066 11 % 1,090 8 % (1) Cigna owns a 50% noncontrolling interest in its China Joint Venture. Cigna's 50% share of the joint venture’s earnings is reported in Other Revenues using the equity
method of accounting under GAAP. As such, the premiums and fees and policy counts from the China Joint Venture are not included in Premiums and Fees By Geography or Number of Policies. For informational purposes, the China Joint Venture premiums and fees and policy counts are presented above as if Cigna consolidated the joint venture.

10
Cigna Corporation Group Disability and Life Segment Earnings (unaudited)
(Dollars in millions) Three Months Ended September 30, Nine Months Ended September 30, 2014 2013 % Change 2014 2013 % Change
Revenues:
Premiums and fees:
Life $ 409 $ 383 7 % $ 1,222 $ 1,159 5 %
Disability 440 402 9 1,312 1,200 9
Other 60 63 (5) 181 193 (6)
Total premiums and fees 909 848 7 2,715 2,552 6
Net investment income 80 82 (2) 246 238 3
Other revenues 1 - N/M 1 1 -
Segment revenues 990 930 6 2,962 2,791 6
Benefits and Expenses:
Benefit expenses excluding special items 709 614 15 2,036 1,878 8
Operating expenses excluding special items 201 187 7 590 568 4
Special items (see details on page 2) - - - - 77 (100)
Benefits and expenses 910 801 14 2,626 2,523 4
Income before income taxes 80 129 (38) 336 268 25
Income tax expense 25 37 (32) 104 74 41
Segment earnings, after-tax 55 92 (40) 232 194 20
Less: Special items, after-tax (see details on page 2) - - - - (51) 100
Adjusted income from operations $ 55 $ 92 (40) % $ 232 $ 245 (5) %
Net realized investment gains, net of taxes $ 2 $ 6 (67) % $ 15 $ 36 (58) %
11
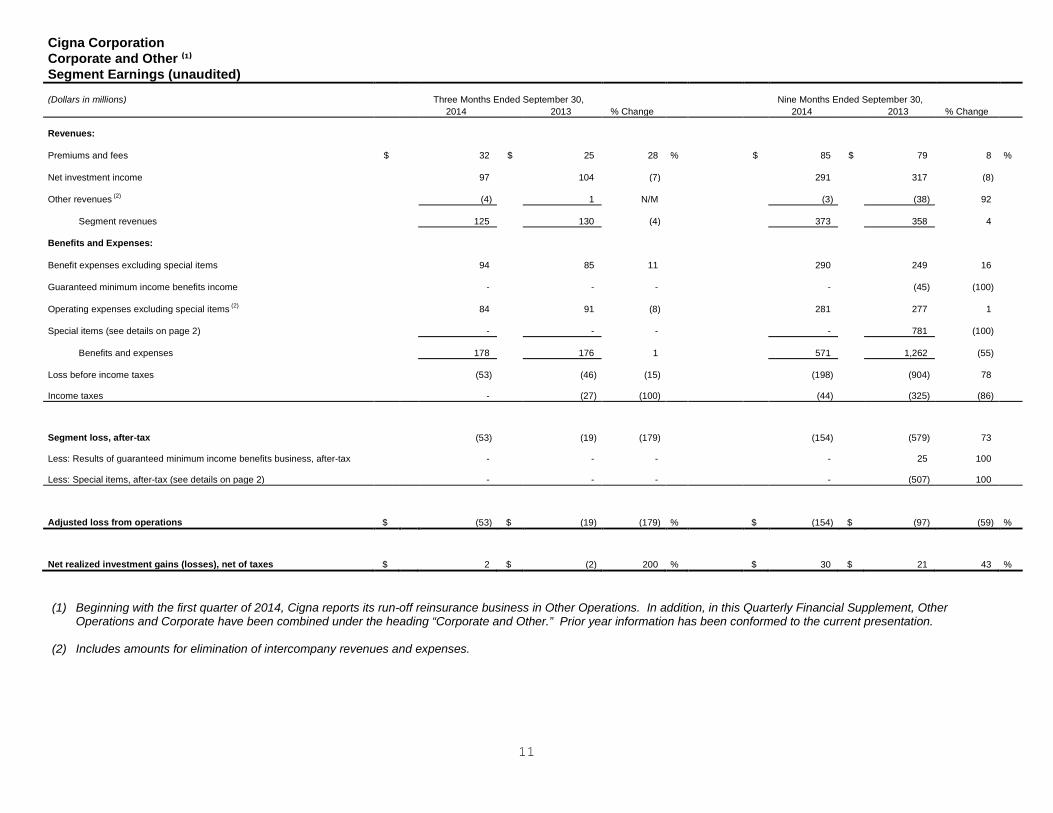
Cigna Corporation Corporate and Other ⁽¹⁾ Segment Earnings (unaudited)
(Dollars in millions) Three Months Ended September 30, Nine Months Ended September 30, 2014 2013 % Change 2014 2013 % Change
Revenues:
Premiums and fees $ 32 $ 25 28 % $ 85 $ 79 8 %
Net investment income 97 104 (7) 291 317 (8)
Other revenues (2) (4) 1 N/M (3) (38) 92
Segment revenues 125 130 (4) 373 358 4
Benefits and Expenses:
Benefit expenses excluding special items 94 85 11 290 249 16
Guaranteed minimum income benefits income - - - - (45) (100)
Operating expenses excluding special items (2) 84 91 (8) 281 277 1
Special items (see details on page 2) - - - - 781 (100)
Benefits and expenses 178 176 1 571 1,262 (55)
Loss before income taxes (53) (46) (15) (198) (904) 78
Income taxes - (27) (100) (44) (325) (86)
Segment loss, after-tax (53) (19) (179) (154) (579) 73
Less: Results of guaranteed minimum income benefits business, after-tax - - - - 25 100
Less: Special items, after-tax (see details on page 2) - - - - (507) 100
Adjusted loss from operations $ (53) $ (19) (179) % $ (154) $ (97) (59) %
Net realized investment gains (losses), net of taxes $ 2 $ (2) 200 % $ 30 $ 21 43 % (1) Beginning with the first quarter of 2014, Cigna reports its run-off reinsurance business in Other Operations. In addition, in this Quarterly Financial Supplement, Other
Operations and Corporate have been combined under the heading “Corporate and Other.” Prior year information has been conformed to the current presentation.
(2) Includes amounts for elimination of intercompany revenues and expenses.
12
Cigna Corporation Consolidated Balance Sheets (Dollars in millions) As of As of As of As of September 30, December 31, September 30, December 31, 2014 2013 2014 2013 (Unaudited) (Unaudited) Assets Investments: Fixed maturities, at fair value (see pages 13 and 14) (amortized cost, $17,171 and $15,273) $ 18,797 $ 16,486 Contractholder deposit funds $ 8,438 $ 8,470 Equity securities, at fair value Future policy benefits 9,573 9,306 (cost, $196 and $146) 190 141 Unpaid claims and claim expenses 4,400 4,298 Commercial mortgage loans (see pages 15 and 16) 2,058 2,252 Global Health Care medical claims payable 2,230 2,050 Policy loans 1,436 1,485 Unearned premiums and fees 602 580 Real estate 62 97 Total insurance and contractholder liabilities 25,243 24,704 Other long-term investments 1,365 1,273 Short-term investments 153 631 Accounts payable, accrued expenses and other liabilities 5,415 5,456 Total investments 24,061 22,365 Short-term debt 121 233 Long-term debt 5,024 5,014 Cash and cash equivalents 1,621 2,795 Separate account liabilities 8,582 8,252 Accrued investment income 272 247 Total liabilities 44,385 43,659 Premiums, accounts and notes receivable, net 2,574 1,991 Reinsurance recoverables (1) 7,086 7,299 Redeemable noncontrolling interest 93 96 Deferred policy acquisition costs 1,501 1,395 Property and equipment 1,494 1,464 Shareholders' Equity Deferred tax assets, net 19 92 Goodwill 6,003 6,029 Common stock 92 92 Other assets, including other intangibles (2) 2,440 2,407 Additional paid-in capital 3,409 3,356 Separate account assets 8,582 8,252 Net unrealized appreciation, fixed maturities $ 614 $ 473 Net unrealized appreciation, equity securities 3 4 Net unrealized depreciation, derivatives (13) (19) Net translation of foreign currencies 4 82 Postretirement benefits liability adjustment (1,027) (1,060) Accumulated other comprehensive loss (419) (520) Retained earnings 15,196 13,676 Less treasury stock, at cost (7,121) (6,037) Total shareholders' equity 11,157 10,567 Noncontrolling interest 18 14 Total equity 11,175 10,581 Total assets $ 55,653 $ 54,336 Total liabilities and equity $ 55,653 $ 54,336 (1) Includes $6.1 billion as of September 30, 2014 and $6.4 billion as of December 31, 2013 related to: 1) the sale of Cigna's Individual Life & Annuity business in 1998 and Cigna's
Retirement Benefits business in 2004, which were primarily in the form of reinsurance arrangements; and 2) the reinsurance transaction with Berkshire in 2013. Corresponding liabilities are primarily reported in Contractholder deposit funds and Future policy benefits.
(2) Includes recoverables of $0.9 billion as of September 30, 2014 and $0.8 billion as of December 31, 2013 related to the GMIB liability.
13
Cigna Corporation Summary of Fixed Maturities (unaudited) Asset Quality / Type Fair Value (Dollars in millions)
As of September 30, 2014 As of December 31, 2013
Sector Public Private Total (1)
% of
Fixed Maturities Public Private Total (1)
% of
Fixed Maturities
United States Government $ 1,242 $ - $ 1,242 7% $ 880 $ - $ 880 5% States and Local Government 1,948 - 1,948 10% 2,144 - 2,144 13% Foreign Government 1,789 68 1,857 10% 1,391 53 1,444 9%
Government 4,979 68 5,047 27% 4,415 53 4,468 27% Basic Industry 1,401 880 2,281 12% 1,057 798 1,855 12% Capital Goods 539 929 1,468 8% 444 890 1,334 8% Communications 693 26 719 4% 575 57 632 4% Consumer 1,671 1,096 2,767 15% 1,353 999 2,352 15% Electric and Utility 779 760 1,539 8% 583 732 1,315 8% Energy and Natural Gas 828 700 1,528 8% 695 615 1,310 8% Financial 1,870 517 2,387 13% 1,568 382 1,950 12% Other 183 77 260 1% 169 64 233 1% Corporate 7,964 4,985 12,949 69% 6,444 4,537 10,981 68% Collateralized Debt Obligations 10 - 10 0% 21 - 21 0% Credit Card 30 - 30 0% 48 1 49 0% Home Equity 1 - 1 0% 1 - 1 0% Foreign Bank Obligations - 405 405 2% - 463 463 3% Other 24 245 269 2% 4 346 350 2%
Asset-Backed Securities 65 650 715 4% 74 810 884 5%
Commercial Mortgage-Backed Securities 74 - 74 0% 76 - 76 0%
Collateralized Mortgage Obligations 11 1 12 0% 76 1 77 0%
Total Fixed Maturities (2) $ 13,093 $ 5,704 $ 18,797 100% $ 11,085 $ 5,401 $ 16,486 100% % of Fixed Maturities 70% 30% 100% 67% 33% 100% (1) 90% and 88% of fixed maturities were investment grade as of September 30, 2014 and December 31, 2013, respectively. The remaining fixed maturities were below investment grade
holdings and invested mainly in corporate debt, split relatively evenly between public and private placements. (2) Problem and potential problem bonds at amortized cost, net of impairments, were $13 million and $21 million as of September 30, 2014 and December 31, 2013, respectively. For more
information, please refer to Cigna's Form 10-Q for the period ended September 30, 2014 expected to be filed on October 30, 2014.
14
Cigna Corporation Summary of Fixed Maturities (unaudited) Analysis of Amortized Cost vs. Fair Value (Dollars in millions)
As of September 30, 2014 As of December 31, 2013
Sector Amortized
Cost Unrealized
Appreciation Unrealized
Depreciation Fair Value Amortized
Cost Unrealized
Appreciation Unrealized
Depreciation Fair Value
United States Government $ 911 $ 331 $ - $ 1,242 $ 640 $ 242 $ 2 $ 880 State and Local Government 1,768 182 2 1,948 1,983 167 6 2,144 Foreign Government 1,759 106 8 1,857 1,392 64 12 1,444
Government 4,438 619 10 5,047 4,015 473 20 4,468
Basic Industry 2,132 159 10 2,281 1,755 119 19 1,855
Capital Goods 1,337 133 2 1,468 1,232 107 5 1,334
Communications 670 50 1 719 591 43 2 632
Consumer 2,587 184 4 2,767 2,211 154 13 2,352
Electric and Utility 1,393 148 2 1,539 1,226 102 13 1,315
Energy and Natural Gas 1,408 122 2 1,528 1,212 105 7 1,310
Financial 2,249 141 3 2,387 1,848 115 13 1,950
Other 253 8 1 260 231 4 2 233
Corporate 12,029 945 25 12,949 10,306 749 74 10,981
Collateralized Debt Obligations 6 4 - 10 17 4 - 21
Credit Card 30 - - 30 49 - - 49
Home Equity 1 - - 1 1 - - 1
Foreign Bank Obligations 330 75 - 405 396 68 1 463
Other 253 16 - 269 336 15 1 350
Asset-Backed Securities 620 95 - 715 799 87 2 884
Commercial Mortgage-Backed Securities 72 3 1 74 75 3 2 76
Collateralized Mortgage Obligations 12 - - 12 78 - 1 77
Total Fixed Maturities $ 17,171 $ 1,662 $ 36 $ 18,797 $ 15,273 $ 1,312 $ 99 $ 16,486
15
Cigna Corporation Summary of Commercial Mortgage Loans (unaudited) As of September 30, 2014 (Dollars in millions)
Property Type Geographic Region Office Buildings Apartment Buildings Industrial Hotels Retail Other Total (1) % of Mortgage Loans
Massachusetts $ 124 $ 57 $ 12 $ 61 $ - $ - $ 254 12% Other (2)
- - 7 - 17 - 24 1%
New England 124 57 19 61 17 - 278 13% New York 135 55 - - - - 190 9% New Jersey 41 - 56 - - - 97 5% Middle Atlantic 176 55 56 - - - 287 14%
Virginia 161 - - 55 21 - 237 12%
Florida - - 106 - - - 106 5% Georgia - 21 65 - - 86 4% North Carolina - 34 31 - - - 65 3% Maryland 37 - - 21 - 6 64 3% Other (2)
- - - - 15 - 15 1%
South Atlantic 198 55 202 76 36 6 573 28% Texas - 19 2 10 33 - 64 3% Other (2)
37 7 100 - 18 - 162 8%
Central 37 26 102 10 51 - 226 11% Other (2)
- - 4 39 - - 43 2%
Mountain - - 4 39 - - 43 2% California 90 50 73 181 132 22 548 27% Oregon 34 - 12 - 18 - 64 3% Other (2)
14 14 - - 11 - 39 2%
Pacific 138 64 85 181 161 22 651 32% Totals $ 673 $ 257 $ 468 $ 367 $ 265 $ 28 $ 2,058 100% % of Mortgage Loans 33% 12% 23% 18% 13% 1% 100% (1) Problem and potential problem commercial mortgage loans carried at amortized cost, net of impairments, were $208 million and $158 million as of September 30, 2014 and December
31, 2013, respectively. For more information, please refer to the Investment Assets section in Management's Discussion and Analysis within Cigna's Form 10-Q for the period ended September 30, 2014, expected to be filed on October 30, 2014.
(2) Represents states in a region with a concentration of less than 3%.
16
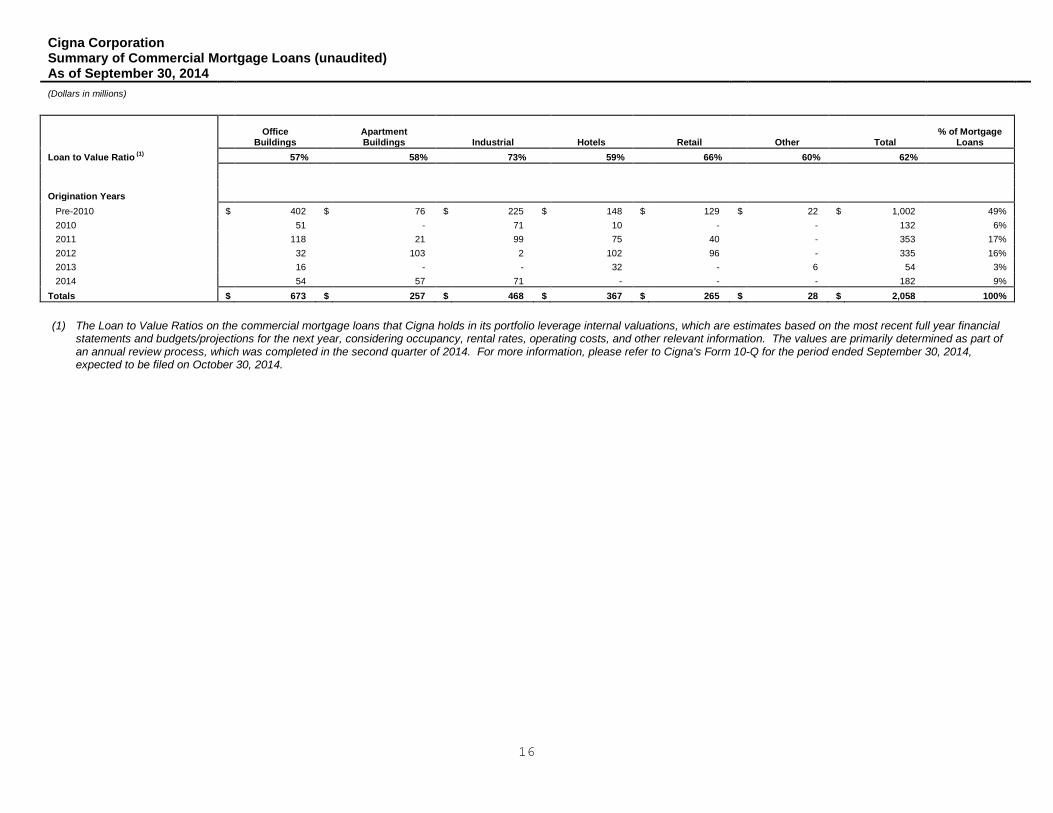
Cigna Corporation Summary of Commercial Mortgage Loans (unaudited) As of September 30, 2014 (Dollars in millions)
Office
Buildings Apartment Buildings Industrial Hotels Retail Other Total
% of Mortgage Loans
Loan to Value Ratio (1)
57% 58% 73% 59% 66% 60% 62% Origination Years Pre-2010 $ 402 $ 76 $ 225 $ 148 $ 129 $ 22 $ 1,002 49% 2010 51 - 71 10 - - 132 6% 2011 118 21 99 75 40 - 353 17% 2012 32 103 2 102 96 - 335 16% 2013 16 - - 32 - 6 54 3% 2014 54 57 71 - - - 182 9% Totals $ 673 $ 257 $ 468 $ 367 $ 265 $ 28 $ 2,058 100% (1) The Loan to Value Ratios on the commercial mortgage loans that Cigna holds in its portfolio leverage internal valuations, which are estimates based on the most recent full year financial
statements and budgets/projections for the next year, considering occupancy, rental rates, operating costs, and other relevant information. The values are primarily determined as part of an annual review process, which was completed in the second quarter of 2014. For more information, please refer to Cigna's Form 10-Q for the period ended September 30, 2014, expected to be filed on October 30, 2014.

17
Cigna Corporation Condensed Consolidated Statements of Cash Flows (unaudited) (Dollars in millions) Nine Months Ended September 30,
2014 2013
CASH FLOWS FROM OPERATING ACTIVITIES
Net income $ 1,632 $ 1,118 Adjustments to reconcile net income to net cash provided by / (used in) operating activities: Depreciation and amortization 435 445 Realized investment gains (130) (192) Deferred income taxes 12 237 Gains on sales of businesses (excluding discontinued operations) (11) (11) Net changes in assets and liabilities, net of non-operating effects: Premiums, accounts and notes receivable (574) (64) Reinsurance recoverables 49 348 Deferred policy acquisition costs (138) (183) Other assets (186) 368 Insurance liabilities (1) 433 870 Accounts payable, accrued expenses and other liabilities (2) (39) (524) Current income taxes 53 (33) Other, net (64) (76)
Subtotal 1,472 2,303 Cash used to effectively exit run-off reinsurance business - (2,196)
Net cash provided by operating activities 1,472 107 Net cash (used in) / provided by investing activities (1,405) 740 Net cash used in financing activities (1,224) (771) Effect of foreign currency rate changes on cash and cash equivalents (17) 1 Net (decrease) increase in cash and cash equivalents (1,174) 77 Cash and cash equivalents, beginning of year 2,795 2,978 Cash and cash equivalents, end of period $ 1,621 $ 3,055 (1) Includes pre-tax cash outflows of $28 million for the period ended September 30, 2013 from the dynamic hedge program to manage equity risks in Cigna's Run-off Reinsurance
operations. This hedge program was terminated after February 4, 2013 as a result of the reinsurance transaction with Berkshire.
(2) Includes pre-tax domestic qualified pension plan contributions of $113 million for the period ended September 30, 2014 and $174 million for the period ended September 30, 2013.