Embed Size (px)
Citation preview
DOMETIC Q1 REPORT ─ SOLNA, APRIL 23, 2021 │ 1
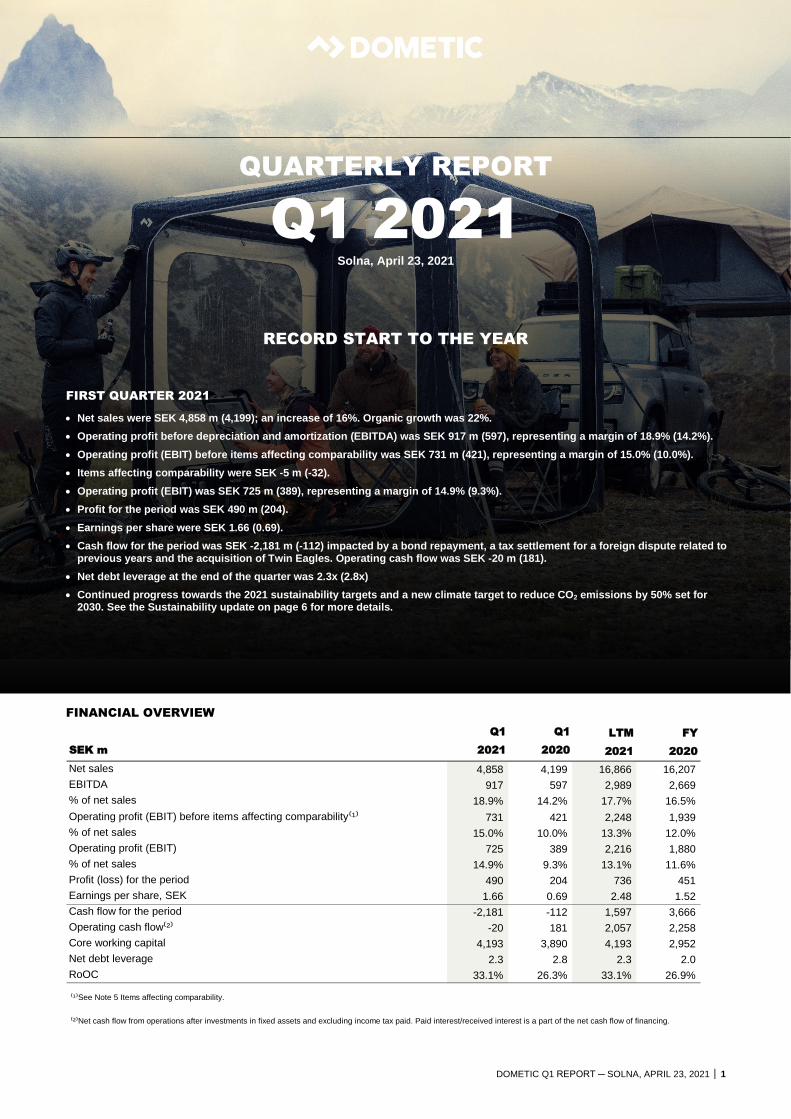
FIRST QUARTER 2021
• Net sales were SEK 4,858 m (4,199); an increase of 16%. Organic growth was 22%.
• Operating profit before depreciation and amortization (EBITDA) was SEK 917 m (597), representing a margin of 18.9% (14.2%).
• Operating profit (EBIT) before items affecting comparability was SEK 731 m (421), representing a margin of 15.0% (10.0%).
• Items affecting comparability were SEK -5 m (-32).
• Operating profit (EBIT) was SEK 725 m (389), representing a margin of 14.9% (9.3%).
• Profit for the period was SEK 490 m (204).
• Earnings per share were SEK 1.66 (0.69).
• Cash flow for the period was SEK -2,181 m (-112) impacted by a bond repayment, a tax settlement for a foreign dispute related to previous years and the acquisition of Twin Eagles. Operating cash flow was SEK -20 m (181).
• Net debt leverage at the end of the quarter was 2.3x (2.8x)
• Continued progress towards the 2021 sustainability targets and a new climate target to reduce CO2 emissions by 50% set for 2030. See the Sustainability update on page 6 for more details.
FINANCIAL OVERVIEW
Q1 Q1 LTM FY
SEK m 2021 2020 2021 2020
Net sales 4,858 4,199 16,866 16,207
EBITDA 917 597 2,989 2,669
% of net sales 18.9% 14.2% 17.7% 16.5%
Operating profit (EBIT) before items affecting comparability⁽¹⁾ 731 421 2,248 1,939
% of net sales 15.0% 10.0% 13.3% 12.0%
Operating profit (EBIT) 725 389 2,216 1,880
% of net sales 14.9% 9.3% 13.1% 11.6%
Profit (loss) for the period 490 204 736 451
Earnings per share, SEK 1.66 0.69 2.48 1.52
Cash flow for the period -2,181 -112 1,597 3,666
Operating cash flow⁽²⁾ -20 181 2,057 2,258
Core working capital 4,193 3,890 4,193 2,952
Net debt leverage 2.3 2.8 2.3 2.0
RoOC 33.1% 26.3% 33.1% 26.9%
⁽¹⁾See Note 5 Items affecting comparability.
⁽²⁾Net cash flow from operations after investments in fixed assets and excluding income tax paid. Paid interest/received interest is a part of the net cash flow of financing.
QUARTERLY REPORT
Q1 2021 Solna, April 23, 2021
RECORD START TO THE YEAR
DOMETIC Q1 REPORT ─ SOLNA, APRIL 23, 2021 │ 2
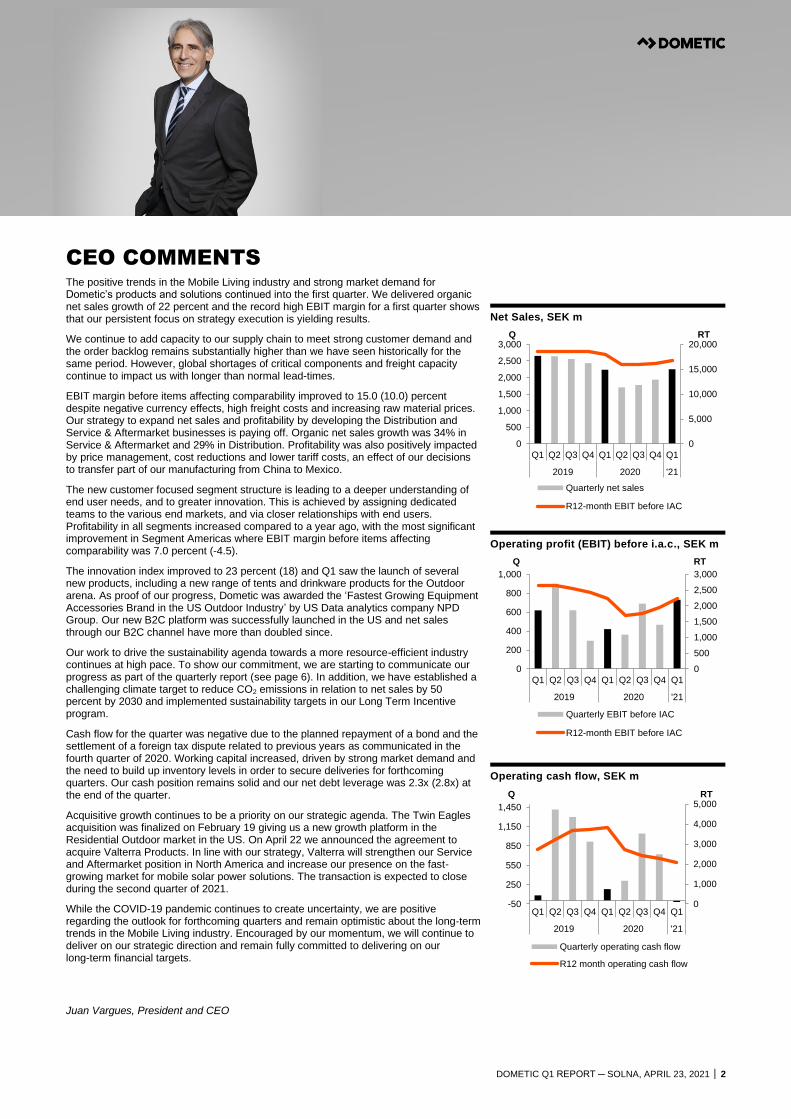
CEO COMMENTS The positive trends in the Mobile Living industry and strong market demand for Dometic’s products and solutions continued into the first quarter. We delivered organic net sales growth of 22 percent and the record high EBIT margin for a first quarter shows that our persistent focus on strategy execution is yielding results.
We continue to add capacity to our supply chain to meet strong customer demand and the order backlog remains substantially higher than we have seen historically for the same period. However, global shortages of critical components and freight capacity continue to impact us with longer than normal lead-times.
EBIT margin before items affecting comparability improved to 15.0 (10.0) percent despite negative currency effects, high freight costs and increasing raw material prices. Our strategy to expand net sales and profitability by developing the Distribution and Service & Aftermarket businesses is paying off. Organic net sales growth was 34% in Service & Aftermarket and 29% in Distribution. Profitability was also positively impacted by price management, cost reductions and lower tariff costs, an effect of our decisions to transfer part of our manufacturing from China to Mexico.
The new customer focused segment structure is leading to a deeper understanding of end user needs, and to greater innovation. This is achieved by assigning dedicated teams to the various end markets, and via closer relationships with end users. Profitability in all segments increased compared to a year ago, with the most significant improvement in Segment Americas where EBIT margin before items affecting comparability was 7.0 percent (-4.5).
The innovation index improved to 23 percent (18) and Q1 saw the launch of several new products, including a new range of tents and drinkware products for the Outdoor arena. As proof of our progress, Dometic was awarded the ‘Fastest Growing Equipment Accessories Brand in the US Outdoor Industry’ by US Data analytics company NPD Group. Our new B2C platform was successfully launched in the US and net sales through our B2C channel have more than doubled since.
Our work to drive the sustainability agenda towards a more resource-efficient industry continues at high pace. To show our commitment, we are starting to communicate our progress as part of the quarterly report (see page 6). In addition, we have established a challenging climate target to reduce CO2 emissions in relation to net sales by 50 percent by 2030 and implemented sustainability targets in our Long Term Incentive program.
Cash flow for the quarter was negative due to the planned repayment of a bond and the settlement of a foreign tax dispute related to previous years as communicated in the fourth quarter of 2020. Working capital increased, driven by strong market demand and the need to build up inventory levels in order to secure deliveries for forthcoming quarters. Our cash position remains solid and our net debt leverage was 2.3x (2.8x) at the end of the quarter.
Acquisitive growth continues to be a priority on our strategic agenda. The Twin Eagles acquisition was finalized on February 19 giving us a new growth platform in the Residential Outdoor market in the US. On April 22 we announced the agreement to acquire Valterra Products. In line with our strategy, Valterra will strengthen our Service and Aftermarket position in North America and increase our presence on the fast-growing market for mobile solar power solutions. The transaction is expected to close during the second quarter of 2021.
While the COVID-19 pandemic continues to create uncertainty, we are positive regarding the outlook for forthcoming quarters and remain optimistic about the long-term trends in the Mobile Living industry. Encouraged by our momentum, we will continue to deliver on our strategic direction and remain fully committed to delivering on our long-term financial targets.
Juan Vargues, President and CEO
Net Sales, SEK m
Operating profit (EBIT) before i.a.c., SEK m
Operating cash flow, SEK m
0
5,000
10,000
15,000
20,000
0
500
1,000
1,500
2,000
2,500
3,000
Q1 Q2 Q3 Q4 Q1 Q2 Q3 Q4 Q1
2019 2020 '21
RTQ
Quarterly net sales
R12-month EBIT before IAC
0
500
1,000
1,500
2,000
2,500
3,000
0
200
400
600
800
1,000
Q1 Q2 Q3 Q4 Q1 Q2 Q3 Q4 Q1
2019 2020 '21
RTQ
Quarterly EBIT before IAC
R12-month EBIT before IAC
0
1,000
2,000
3,000
4,000
5,000
-50
250
550
850
1,150
1,450
Q1 Q2 Q3 Q4 Q1 Q2 Q3 Q4 Q1
2019 2020 '21
RTQ
Quarterly operating cash flow
R12 month operating cash flow
DOMETIC Q1 REPORT ─ SOLNA, APRIL 23, 2021 │ 3
FINANCIAL SUMMARY –
FIRST QUARTER 2021 Net sales were SEK 4,858 m (4,199), an increase of 16% compared with the same quarter last year. This comprised 22% organic growth, -7% currency translation and 1% M&A.
Gross profit was SEK 1,527 m (1,172) corresponding to 31.4% (27.9%) of net sales. As of 2021, logistics costs are included in Cost of goods sold. Both 2019 and 2020 have been restated accordingly.
Sales and administrative expenses totaled SEK -584 m (-612).
Research and development expenses were SEK -102 m (-90). In addition, development expenses of SEK -3 m (-6) were capitalized in the quarter. In total, this corresponds to 2.2% (2.3%) of net sales.
Other operating income and expenses were SEK -41 m (29). The difference is mainly attributable to revaluation of operating items and currency hedges due to currency effects.
Operating profit before depreciation and amortization (EBITDA) was SEK 917 m (597). The EBITDA margin was 18.9% (14.2%).
Operating profit (EBIT) before items affecting comparability was SEK 731 m (421). The EBIT margin before items affecting comparability was 15.0% (10.0%). The gross impact from tariffs was SEK -56 m (-77).
Items affecting comparability net was SEK -5 m (-32) of which restructuring costs for the global restructuring program amounted to SEK -10 m.
Operating profit (EBIT) was SEK 725 m (389). The EBIT margin was 14.9% (9.3%).
Financial items totaled a net amount of SEK -48 m (-98), including SEK -94 m (-110) in interest on external bank loans. Other FX revaluations and other items amounted to SEK 37 m (7) and financial income amounted to SEK 9 m (5).
Taxes totaled SEK -187 m (-86), corresponding to 28% (30%) of profit before tax. Current tax amounted to SEK -177 m (-74) and deferred tax to SEK -10 m (-12). Paid tax was 101% (54%) negatively impacted by a settlement of the foreign tax dispute related to previous years, which was provided for in the fourth quarter of 2020.
Profit (loss) for the quarter was SEK 490 m (204).
Earnings per share for the quarter were SEK 1.66 (0.69).
Operating cash flow for the quarter was SEK -20 m (181). Operating cash flow was impacted by increased working capital, driven by strong market demand and the need to build up inventory levels in order to secure deliveries forthcoming quarters.
Cash flow for the quarter was SEK -2,181 m (-112). Cash flow was impacted by a repayment of a due EMTN bond of SEK -1,000 m and a tax payment for the settlement of a foreign tax dispute related to previous years. Net cash flow from investments was SEK -437 m mainly due to the acquisition of Twin Eagles of SEK -505 m.
Net debt leverage was 2.3x (2.8x) at the end of the quarter.
Return on Operating Capital (RoOC) was 33.1% (26.3%).
Global restructuring program. During the quarter, total costs related to the global restructuring program amounted to SEK -10 m (-23). No new sites or additional employees were affected during the quarter. So far, since the program started, 21 sites and 778 employees have been affected.
Employees. Number of employees in terms of headcount was 6,995 (6,776) at the end of the quarter.
Significant events after the period. At the 2021 Annual Shareholders Meeting held on April 13, Fredrik Cappelen was re-elected as member and Chairman of the Board of Directors. Magnus Yngen, Heléne Vibbleus, Peter Sjölander, Erik Olsson, Jacqueline Hoogerbrugge and Rainer Schmückle were re-elected and Mengmeng Du was elected as a member of the Board of Directors. The proposed dividend of SEK 2.30 per share was approved.
On April 22, Dometic announced the agreement to acquire Valterra Products, a leading North American provider of Service and Aftermarket products, including solar power solutions. Valterra’s sales were approximately USD 94 million in 2020 and the transaction is expected to close during the second quarter of 2021.
There have been no other significant events that have impacted the financial reporting after the balance sheet date.
DOMETIC Q1 REPORT ─ SOLNA, APRIL 23, 2021 │ 4
FINANCIAL PERFORMANCE BY SEGMENT
SEGMENT AMERICAS
FIRST QUARTER 2021 NET SALES AND OPERATING PROFIT (EBIT)
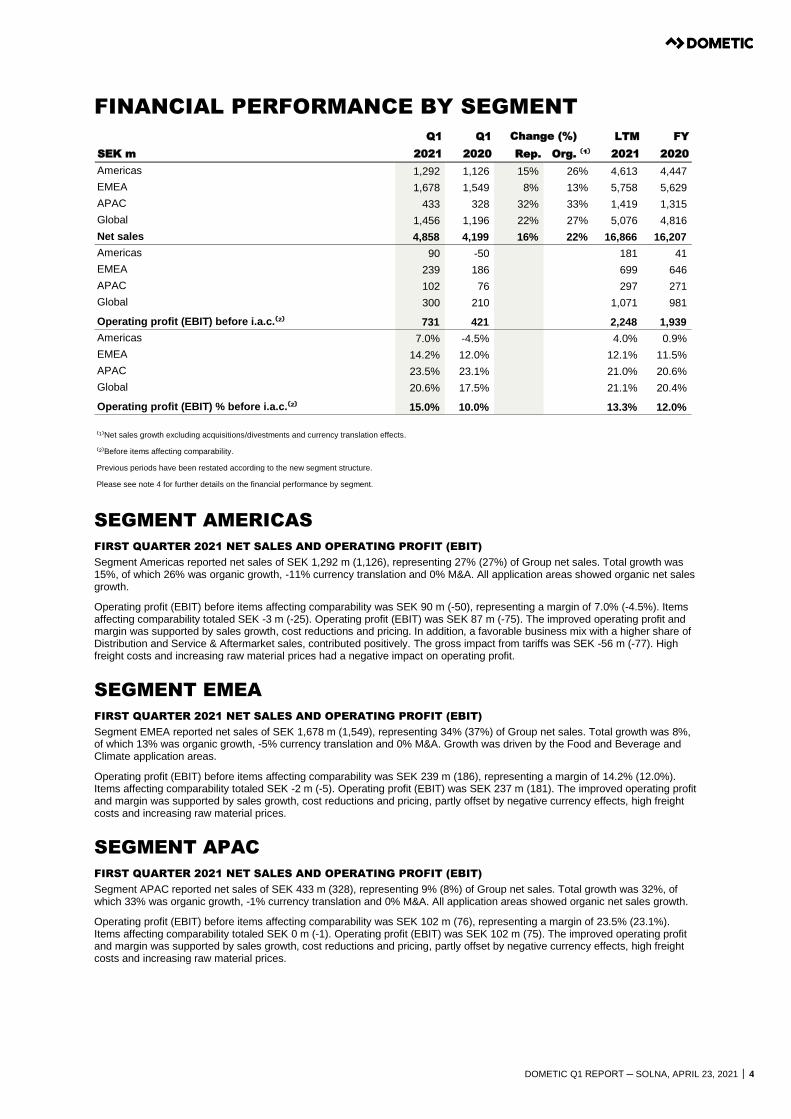
Segment Americas reported net sales of SEK 1,292 m (1,126), representing 27% (27%) of Group net sales. Total growth was 15%, of which 26% was organic growth, -11% currency translation and 0% M&A. All application areas showed organic net sales growth.
Operating profit (EBIT) before items affecting comparability was SEK 90 m (-50), representing a margin of 7.0% (-4.5%). Items affecting comparability totaled SEK -3 m (-25). Operating profit (EBIT) was SEK 87 m (-75). The improved operating profit and margin was supported by sales growth, cost reductions and pricing. In addition, a favorable business mix with a higher share of Distribution and Service & Aftermarket sales, contributed positively. The gross impact from tariffs was SEK -56 m (-77). High freight costs and increasing raw material prices had a negative impact on operating profit.
SEGMENT EMEA
FIRST QUARTER 2021 NET SALES AND OPERATING PROFIT (EBIT)
Segment EMEA reported net sales of SEK 1,678 m (1,549), representing 34% (37%) of Group net sales. Total growth was 8%, of which 13% was organic growth, -5% currency translation and 0% M&A. Growth was driven by the Food and Beverage and Climate application areas.
Operating profit (EBIT) before items affecting comparability was SEK 239 m (186), representing a margin of 14.2% (12.0%). Items affecting comparability totaled SEK -2 m (-5). Operating profit (EBIT) was SEK 237 m (181). The improved operating profit and margin was supported by sales growth, cost reductions and pricing, partly offset by negative currency effects, high freight costs and increasing raw material prices.
SEGMENT APAC
FIRST QUARTER 2021 NET SALES AND OPERATING PROFIT (EBIT)
Segment APAC reported net sales of SEK 433 m (328), representing 9% (8%) of Group net sales. Total growth was 32%, of which 33% was organic growth, -1% currency translation and 0% M&A. All application areas showed organic net sales growth.
Operating profit (EBIT) before items affecting comparability was SEK 102 m (76), representing a margin of 23.5% (23.1%). Items affecting comparability totaled SEK 0 m (-1). Operating profit (EBIT) was SEK 102 m (75). The improved operating profit and margin was supported by sales growth, cost reductions and pricing, partly offset by negative currency effects, high freight costs and increasing raw material prices.
Q1 Q1 LTM FY
SEK m 2021 2020 Rep. Org. ⁽¹⁾ 2021 2020
Americas 1,292 1,126 15% 26% 4,613 4,447
EMEA 1,678 1,549 8% 13% 5,758 5,629
APAC 433 328 32% 33% 1,419 1,315
Global 1,456 1,196 22% 27% 5,076 4,816
Net sales 4,858 4,199 16% 22% 16,866 16,207
Americas 90 -50 181 41
EMEA 239 186 699 646
APAC 102 76 297 271
Global 300 210 1,071 981
Operating profit (EBIT) before i.a.c.⁽²⁾ 731 421 2,248 1,939
Americas 7.0% -4.5% 4.0% 0.9%
EMEA 14.2% 12.0% 12.1% 11.5%
APAC 23.5% 23.1% 21.0% 20.6%
Global 20.6% 17.5% 21.1% 20.4%
Operating profit (EBIT) % before i.a.c.⁽²⁾ 15.0% 10.0% 13.3% 12.0%
Please see note 4 for further details on the financial performance by segment.
Change (%)
⁽¹⁾Net sales growth excluding acquisitions/divestments and currency translation effects.
⁽²⁾Before items affecting comparability.
Previous periods have been restated according to the new segment structure.
DOMETIC Q1 REPORT ─ SOLNA, APRIL 23, 2021 │ 5
SEGMENT GLOBAL
FIRST QUARTER 2021 NET SALES AND OPERATING PROFIT (EBIT)
Segment Global has two sub-segments: Marine and Other global verticals. Sub-segment Other global verticals consist of Residential, Hospitality and Mobile deliveries. The sub-segment Marine currently represents more than 90% of the segment’s net sales.
Segment Global reported net sales of SEK 1,456 m (1,196), representing 30% (28%) of Group net sales. Total growth was 22%, of which 27% was organic growth, -9% currency translation and 3% M&A. All application areas showed organic net sales growth. Growth was driven by sub-segment Marine. The acquisition of Twin Eagles was finalized on February 19, 2021, and the company is consolidated into the Global segment.
Operating profit (EBIT) before items affecting comparability was SEK 300 m (210), representing a margin of 20.6% (17.5%). Items affecting comparability totaled SEK 0 m (-1). Operating profit (EBIT) was SEK 300 m (209). The improved operating profit and margin was supported by sales growth, cost reductions and pricing, partly offset by negative currency effects, high freight costs and increasing raw material prices.
DOMETIC Q1 REPORT ─ SOLNA, APRIL 23, 2021 │ 6
SUSTAINABILITY UPDATE
BACKGROUND AND SIGNIFICANT EVENTS DURING THE FIRST QUARTER 2021
As a pioneer in the Mobile Living area, Dometic is committed to driving sustainability in its market. This means providing smart, reliable, and safe products designed with a life-cycle perspective to reduce the environmental footprint throughout a product’s life cycle. Dometic also provides a safe, healthy, diverse, and inclusive workplace and ensures business practices meet the highest ethical standards. Four focus areas have been defined – Ethics, People, Products and Environment – with strong ownership in Group management and with clear KPIs, targets and activities implemented in daily operations. In addition, and starting from 2021, Dometic has implemented sustainability targets as part of the Long Term Incentive (LTI) program. The targets are on CO2 emission reduction, injury rate and percentage of female managers.
During the first quarter 2021, Dometic defined a long-term climate target to reduce CO2 emissions from operations1) in relation to net sales by 50% by 2030. To achieve this reduction Dometic will continue to implement the manufacturing footprint project and increase energy efficiency in operations. The majority of the reduction will come from transitioning to a renewable electricity supply. A majority of factories in EMEA have already started purchasing renewable electricity in the first quarter of 2021.
Progress on all defined KPIs is reported externally as part of the 2020 Annual and Sustainability Report, but in addition Dometic has chosen to report its progress on a quarterly basis on four of the defined KPIs, including the new Climate KPI.
KPI UPDATE
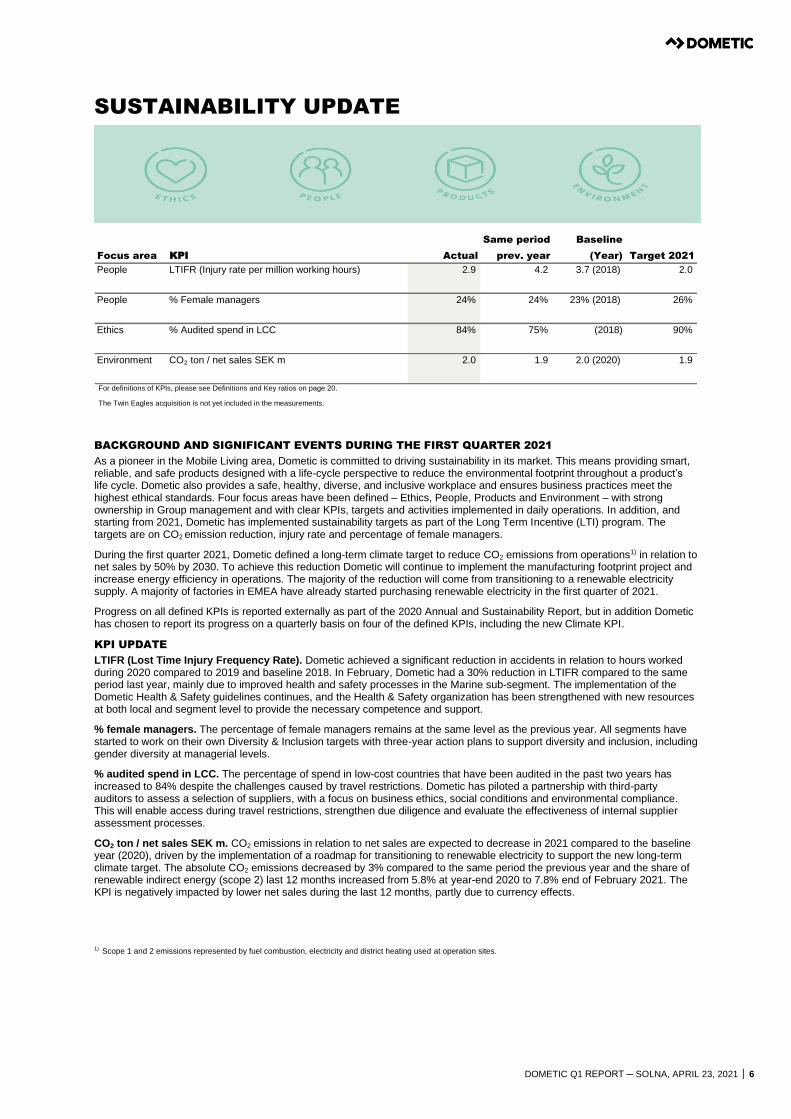
LTIFR (Lost Time Injury Frequency Rate). Dometic achieved a significant reduction in accidents in relation to hours worked during 2020 compared to 2019 and baseline 2018. In February, Dometic had a 30% reduction in LTIFR compared to the same period last year, mainly due to improved health and safety processes in the Marine sub-segment. The implementation of the Dometic Health & Safety guidelines continues, and the Health & Safety organization has been strengthened with new resources at both local and segment level to provide the necessary competence and support.
% female managers. The percentage of female managers remains at the same level as the previous year. All segments have started to work on their own Diversity & Inclusion targets with three-year action plans to support diversity and inclusion, including gender diversity at managerial levels.
% audited spend in LCC. The percentage of spend in low-cost countries that have been audited in the past two years has increased to 84% despite the challenges caused by travel restrictions. Dometic has piloted a partnership with third-party auditors to assess a selection of suppliers, with a focus on business ethics, social conditions and environmental compliance. This will enable access during travel restrictions, strengthen due diligence and evaluate the effectiveness of internal supplier assessment processes.
CO2 ton / net sales SEK m. CO2 emissions in relation to net sales are expected to decrease in 2021 compared to the baseline year (2020), driven by the implementation of a roadmap for transitioning to renewable electricity to support the new long-term climate target. The absolute CO2 emissions decreased by 3% compared to the same period the previous year and the share of renewable indirect energy (scope 2) last 12 months increased from 5.8% at year-end 2020 to 7.8% end of February 2021. The KPI is negatively impacted by lower net sales during the last 12 months, partly due to currency effects.
1) Scope 1 and 2 emissions represented by fuel combustion, electricity and district heating used at operation sites.
Focus area KPI Actual
Same period
prev. year
Baseline
(Year) Target 2021
People LTIFR (Injury rate per million working hours) 2.9 4.2 3.7 (2018) 2.0
People % Female managers 24% 24% 23% (2018) 26%
Ethics % Audited spend in LCC 84% 75% (2018) 90%
Environment CO₂ ton / net sales SEK m 2.0 1.9 2.0 (2020) 1.9
The Twin Eagles acquisition is not yet included in the measurements.
For definitions of KPIs, please see Definitions and Key ratios on page 20.
DOMETIC Q1 REPORT ─ SOLNA, APRIL 23, 2021 │ 7
PARENT COMPANY DOMETIC GROUP AB (PUBL)
First quarter 2021 The Parent Company Dometic Group AB (publ) comprises the functions of the Group’s head office, such as Group management and administration. The Parent Company invoices its costs to subsidiaries.
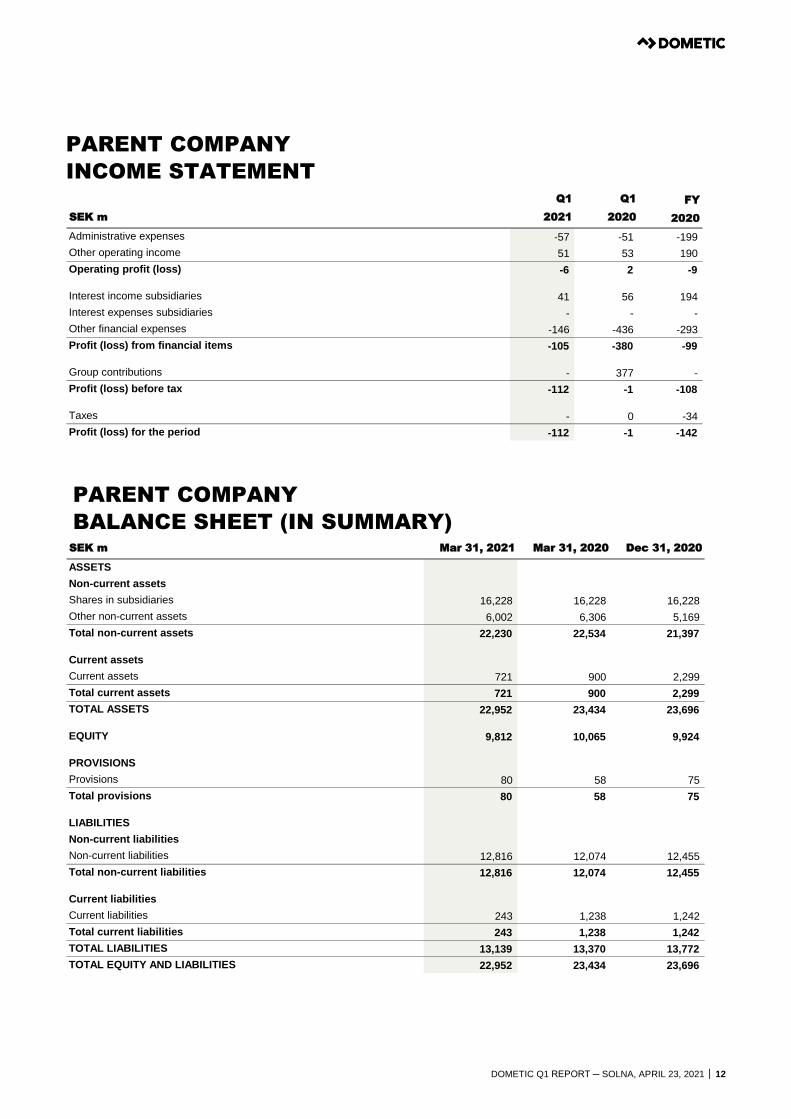
For the quarter, the Parent Company had an operating profit (loss) of SEK -6 m (2), including administrative expenses of SEK -57 m (-51) and other operating income of SEK 51 m (53), of which the full amount relates to income from subsidiaries.
Profit (loss) from financial items totaled SEK -105 m (-380), including interest income from subsidiaries of SEK 41 m (56), interest expenses to subsidiaries of SEK - m (-) and other financial income and expenses of SEK -146 m (-436).
Profit (loss) for the quarter amounted to SEK -112 m (-1).
For further information, please refer to the Parent Company’s condensed financial statements on page 12.
Solna, April 23, 2021
Juan Vargues
President and CEO
REVIEW This interim report has not been subject to review by Dometic Group AB (publ)’s external auditor.
DOMETIC Q1 REPORT ─ SOLNA, APRIL 23, 2021 │ 8
CONSOLIDATED INCOME STATEMENT
CONSOLIDATED STATEMENT
OF COMPREHENSIVE INCOME
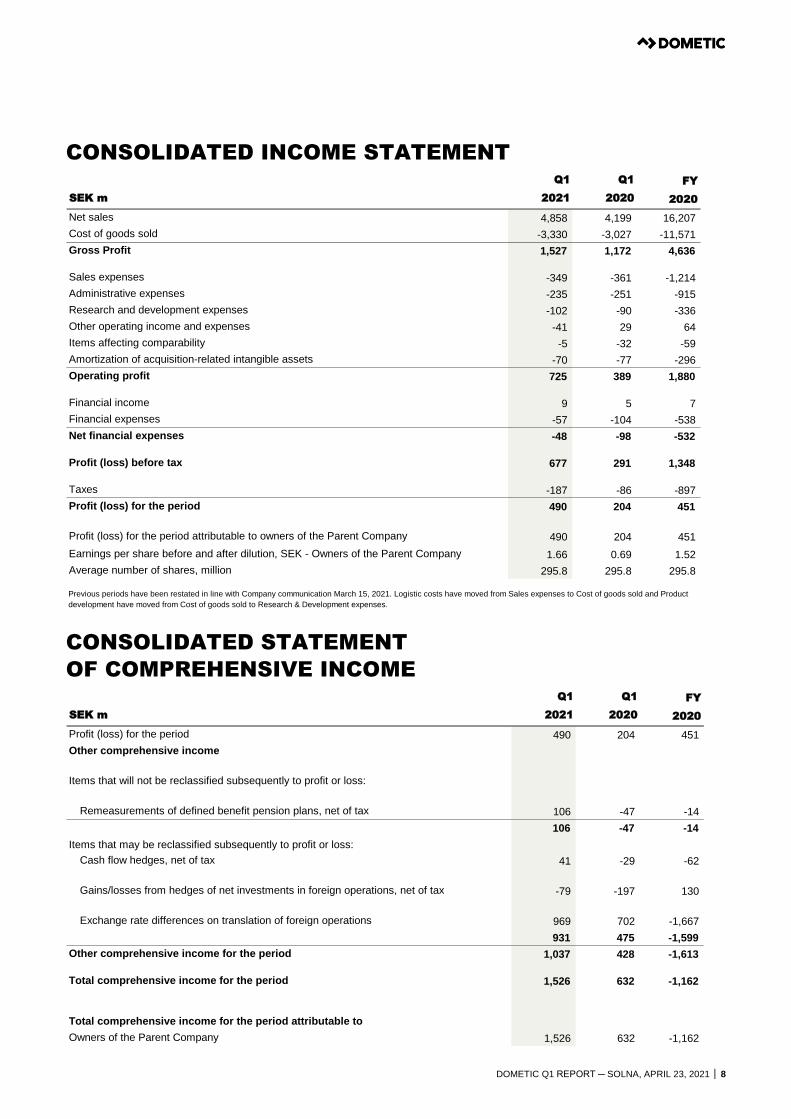
Q1 Q1 FY
SEK m 2021 2020 2020
Net sales 4,858 4,199 16,207
Cost of goods sold -3,330 -3,027 -11,571
Gross Profit 1,527 1,172 4,636
Sales expenses -349 -361 -1,214
Administrative expenses -235 -251 -915
Research and development expenses -102 -90 -336
Other operating income and expenses -41 29 64
Items affecting comparability -5 -32 -59
Amortization of acquisition-related intangible assets -70 -77 -296
Operating profit 725 389 1,880
Financial income 9 5 7
Financial expenses -57 -104 -538
Net financial expenses -48 -98 -532
Profit (loss) before tax 677 291 1,348
Taxes -187 -86 -897
Profit (loss) for the period 490 204 451
Profit (loss) for the period attributable to owners of the Parent Company 490 204 451
Earnings per share before and after dilution, SEK - Owners of the Parent Company 1.66 0.69 1.52
Average number of shares, million 295.8 295.8 295.8
Previous periods have been restated in line with Company communication March 15, 2021. Logistic costs have moved from Sales expenses to Cost of goods sold and Product
development have moved from Cost of goods sold to Research & Development expenses.
Q1 Q1 FY
SEK m 2021 2020 2020
Profit (loss) for the period 490 204 451
Other comprehensive income
Items that will not be reclassified subsequently to profit or loss:
Remeasurements of defined benefit pension plans, net of tax 106 -47 -14
106 -47 -14
Items that may be reclassified subsequently to profit or loss:
Cash flow hedges, net of tax 41 -29 -62
Gains/losses from hedges of net investments in foreign operations, net of tax -79 -197 130
Exchange rate differences on translation of foreign operations 969 702 -1,667
931 475 -1,599
Other comprehensive income for the period 1,037 428 -1,613
Total comprehensive income for the period 1,526 632 -1,162
Total comprehensive income for the period attributable to
Owners of the Parent Company 1,526 632 -1,162
DOMETIC Q1 REPORT ─ SOLNA, APRIL 23, 2021 │ 9
CONSOLIDATED
BALANCE SHEET (IN SUMMARY)
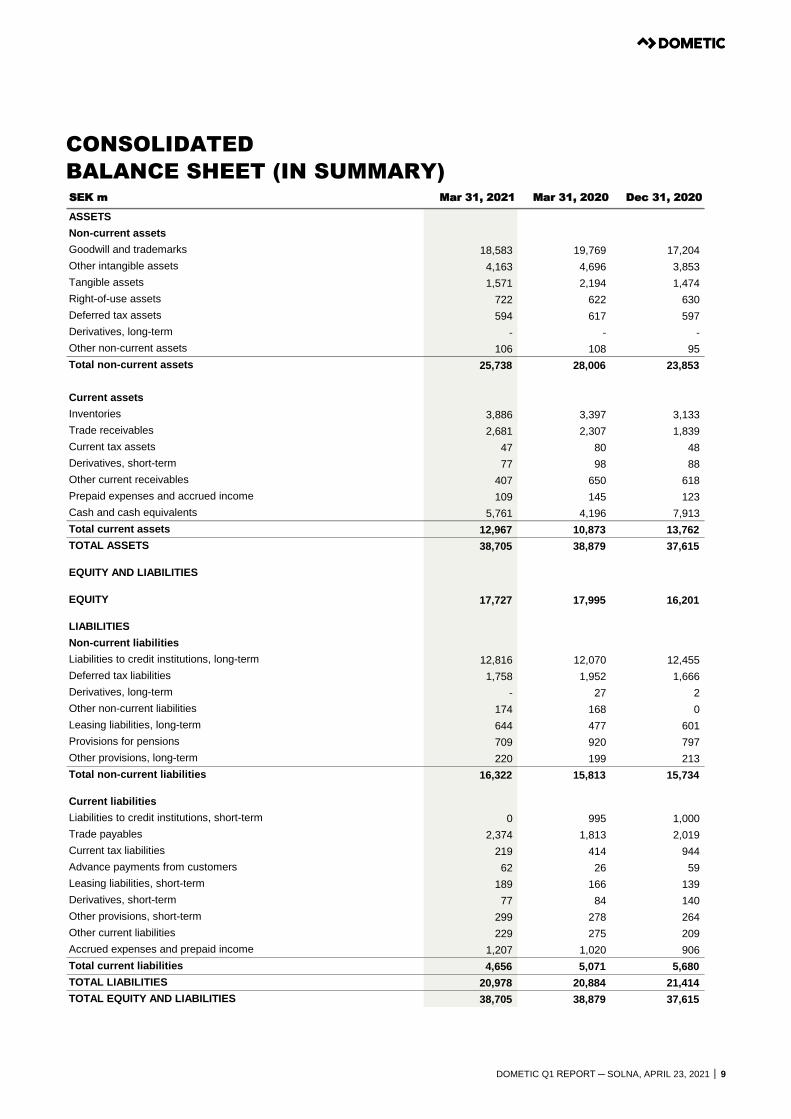
SEK m Mar 31, 2021 Mar 31, 2020 Dec 31, 2020
ASSETS
Non-current assets
Goodwill and trademarks 18,583 19,769 17,204
Other intangible assets 4,163 4,696 3,853
Tangible assets 1,571 2,194 1,474
Right-of-use assets 722 622 630
Deferred tax assets 594 617 597
Derivatives, long-term - - -
Other non-current assets 106 108 95
Total non-current assets 25,738 28,006 23,853
Current assets
Inventories 3,886 3,397 3,133
Trade receivables 2,681 2,307 1,839
Current tax assets 47 80 48
Derivatives, short-term 77 98 88
Other current receivables 407 650 618
Prepaid expenses and accrued income 109 145 123
Cash and cash equivalents 5,761 4,196 7,913
Total current assets 12,967 10,873 13,762
TOTAL ASSETS 38,705 38,879 37,615
EQUITY AND LIABILITIES
EQUITY 17,727 17,995 16,201
LIABILITIES
Non-current liabilities
Liabilities to credit institutions, long-term 12,816 12,070 12,455
Deferred tax liabilities 1,758 1,952 1,666
Derivatives, long-term - 27 2
Other non-current liabilities 174 168 0
Leasing liabilities, long-term 644 477 601
Provisions for pensions 709 920 797
Other provisions, long-term 220 199 213
Total non-current liabilities 16,322 15,813 15,734
Current liabilities
Liabilities to credit institutions, short-term 0 995 1,000
Trade payables 2,374 1,813 2,019
Current tax liabilities 219 414 944
Advance payments from customers 62 26 59
Leasing liabilities, short-term 189 166 139
Derivatives, short-term 77 84 140
Other provisions, short-term 299 278 264
Other current liabilities 229 275 209
Accrued expenses and prepaid income 1,207 1,020 906
Total current liabilities 4,656 5,071 5,680
TOTAL LIABILITIES 20,978 20,884 21,414
TOTAL EQUITY AND LIABILITIES 38,705 38,879 37,615
DOMETIC Q1 REPORT ─ SOLNA, APRIL 23, 2021 │ 10
CONSOLIDATED STATEMENT
OF CHANGES IN EQUITY (IN SUMMARY)
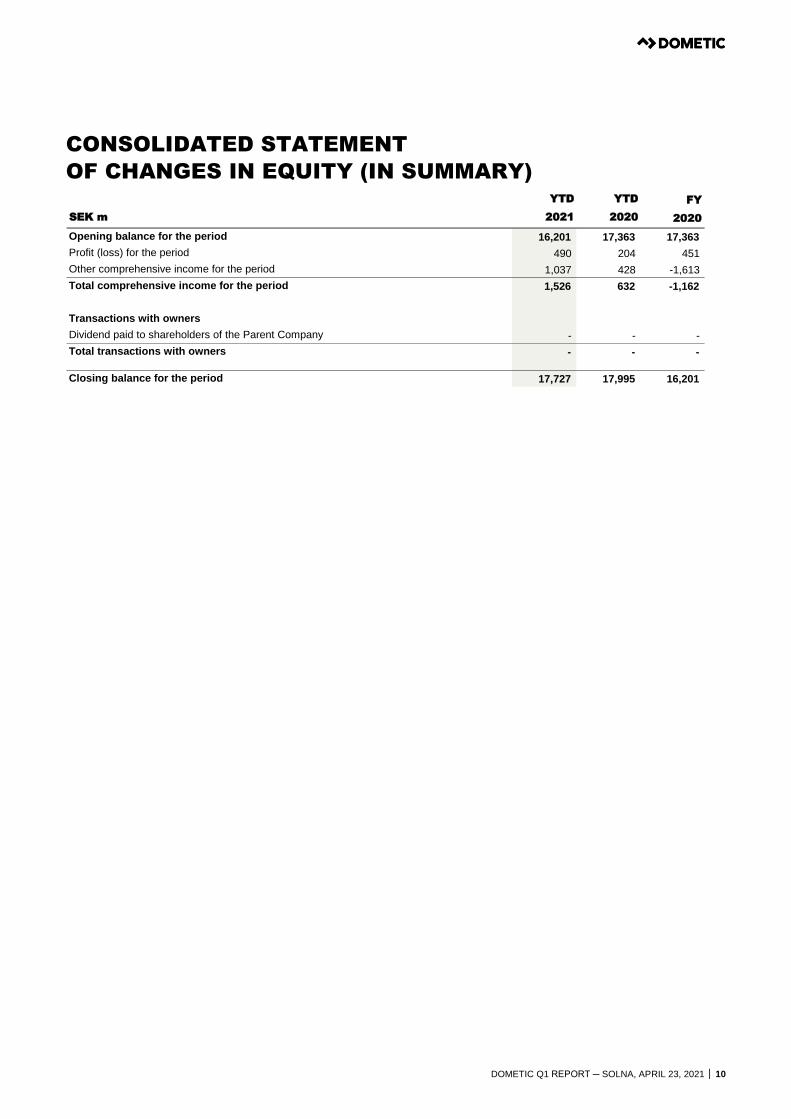
YTD YTD FY
SEK m 2021 2020 2020
Opening balance for the period 16,201 17,363 17,363
Profit (loss) for the period 490 204 451
Other comprehensive income for the period 1,037 428 -1,613
Total comprehensive income for the period 1,526 632 -1,162
Transactions with owners
Dividend paid to shareholders of the Parent Company - - -
Total transactions with owners - - -
Closing balance for the period 17,727 17,995 16,201
DOMETIC Q1 REPORT ─ SOLNA, APRIL 23, 2021 │ 11
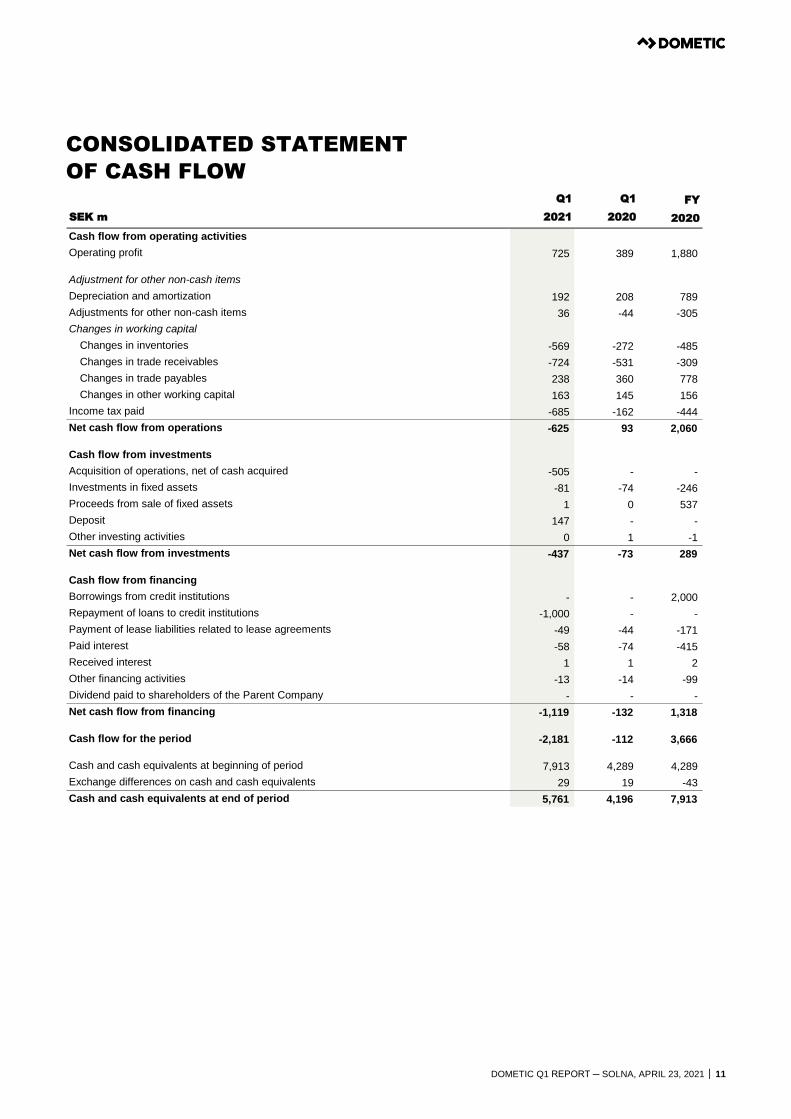
CONSOLIDATED STATEMENT
OF CASH FLOW
Q1 Q1 FY
SEK m 2021 2020 2020
Cash flow from operating activities
Operating profit 725 389 1,880
Adjustment for other non-cash items
Depreciation and amortization 192 208 789
Adjustments for other non-cash items 36 -44 -305
Changes in working capital
Changes in inventories -569 -272 -485
Changes in trade receivables -724 -531 -309
Changes in trade payables 238 360 778
Changes in other working capital 163 145 156
Income tax paid -685 -162 -444
Net cash flow from operations -625 93 2,060
Cash flow from investments
Acquisition of operations, net of cash acquired -505 - -
Investments in fixed assets -81 -74 -246
Proceeds from sale of fixed assets 1 0 537
Deposit 147 - -
Other investing activities 0 1 -1
Net cash flow from investments -437 -73 289
Cash flow from financing
Borrowings from credit institutions - - 2,000
Repayment of loans to credit institutions -1,000 - -
Payment of lease liabilities related to lease agreements -49 -44 -171
Paid interest -58 -74 -415
Received interest 1 1 2
Other financing activities -13 -14 -99
Dividend paid to shareholders of the Parent Company - - -
Net cash flow from financing -1,119 -132 1,318
Cash flow for the period -2,181 -112 3,666
Cash and cash equivalents at beginning of period 7,913 4,289 4,289
Exchange differences on cash and cash equivalents 29 19 -43
Cash and cash equivalents at end of period 5,761 4,196 7,913
DOMETIC Q1 REPORT ─ SOLNA, APRIL 23, 2021 │ 12
PARENT COMPANY
INCOME STATEMENT
PARENT COMPANY
BALANCE SHEET (IN SUMMARY)
Q1 Q1 FY
SEK m 2021 2020 2020
Administrative expenses -57 -51 -199
Other operating income 51 53 190
Operating profit (loss) -6 2 -9
Interest income subsidiaries 41 56 194
Interest expenses subsidiaries - - -
Other financial expenses -146 -436 -293
Profit (loss) from financial items -105 -380 -99
Group contributions - 377 -
Profit (loss) before tax -112 -1 -108
Taxes - 0 -34
Profit (loss) for the period -112 -1 -142
SEK m Mar 31, 2021 Mar 31, 2020 Dec 31, 2020
ASSETS
Non-current assets
Shares in subsidiaries 16,228 16,228 16,228
Other non-current assets 6,002 6,306 5,169
Total non-current assets 22,230 22,534 21,397
Current assets
Current assets 721 900 2,299
Total current assets 721 900 2,299
TOTAL ASSETS 22,952 23,434 23,696
EQUITY 9,812 10,065 9,924
PROVISIONS
Provisions 80 58 75
Total provisions 80 58 75
LIABILITIES
Non-current liabilities
Non-current liabilities 12,816 12,074 12,455
Total non-current liabilities 12,816 12,074 12,455
Current liabilities
Current liabilities 243 1,238 1,242
Total current liabilities 243 1,238 1,242
TOTAL LIABILITIES 13,139 13,370 13,772
TOTAL EQUITY AND LIABILITIES 22,952 23,434 23,696
DOMETIC Q1 REPORT ─ SOLNA, APRIL 23, 2021 │ 13
CONDENSED NOTES NOTE 1 | ACCOUNTING PRINCIPLES
Dometic Group AB (publ) and its subsidiaries (together “the Dometic Group”, “Dometic” or “the Group”) applies International Financial Reporting Standards (IFRS), as endorsed by the European Union. This consolidated Interim Financial Report has been prepared in accordance with IAS 34 ‘Interim Financial Reporting’.
The accounting and valuation principles in this interim report correspond to principles applied by the Group in the 2020 Annual and Sustainability Report and should be read in conjunction with that Annual and Sustainability Report, available at www.dometic.com.
The Swedish Annual Accounts Act and RFR 2 Accounting for Legal Entities, issued by the Swedish Financial Reporting Board, have been applied for the Parent Company. The interim report comprises pages 1–21 and pages 1–12 are thus an integral part of this financial report (IAS 34.16A).
Totals quoted in tables and statements may not always be the exact sum of the individual items because of rounding differences. The aim is for each line item to correspond to its source, and rounding differences may therefore arise.
New or amended accounting policies for 2021 adopted by the
Group
A detailed description of the accounting and valuation principles for new or amended accounting policies for 2021 applied by the Group in this interim report can be found in Note 2.1.1 Changes in accounting policies, New or amended accounting policies for 2021, of the 2020 Annual and Sustainability Report available at www.dometic.com.
NOTE 2 | RISKS AND UNCERTAINTIES
Risks are part of any business and as a global Group with production and distribution all over the world Dometic faces risks that can impact its ability to achieve established strategic and other objectives, including financial targets. Effective risk management of strategic, execution, compliance & regulatory and reporting risks creates opportunities and effective risk mitigation.
The key to effective risk management is identifying known risks and preparing for any unknown risks to which the Group is exposed. While mitigating risks usually comes at a cost, effective risk management adds value by establishing clear risk and process ownership combined with risk identification, assessment, prioritization and risk response i.e. risk mitigating actions as well as effective monitoring.
In line with Dometic’s Three Lines Model, Risk Management as part of the second line of responsibility constitutes an important role by providing and supporting management and the business operations with a risk framework, including a risk management process and a risk universe for identification, assessment, and prioritization of risks, and for providing risk response i.e. risk mitigating actions as well as effective monitoring.
In 2019 the risk framework was updated to increase the focus on strategic risks and to improve alignment with the Group strategic objectives and strategy toolbox for execution. Each defined tool in the strategy toolbox represents both risks and opportunities that, correctly managed, help the Group deliver on its strategy. Risks in the risk framework, and especially strategic risks are connected to the objectives defined for each of the three pillars in the Group strategy.
During 2020, extensive risk assessments were performed on Group and segment level to assess risks and related mitigating actions. Group risk assessments mainly focused on the strategic risks, and the segment risk assessments mainly focused on the execution risks, since the segments execute on the strategy and decisions made by Group Management and the Board of Directors.
The Risk Committee, which from 2019 comprises the members of Group Management, held meetings in connection with Group
Management meetings, during which significant time was dedicated to plan for and present results from risk assessments, as well as review of risk mitigating actions. Strategic risks are assessed top-down by Group Management, while execution, compliance & regulatory and reporting risks are assessed bottom-up by Segment Management and process and risk owners, as well as top-down by Group Management and global process and risk owners, as applicable. The Risk Committee discusses and makes decisions on risk mitigating actions and the members of Group Management act as global process and risk owners as applicable. The work of the Risk Committee is regularly reported to the Audit Committee and annually to the Board of Directors.
With strategic, execution, compliance & regulatory and reporting risks identified and assessed annually, the results thereof in terms of risk registers and risk maps help raise risk awareness and support management and the business operations at different levels of the organization in prioritization of risk mitigating actions. The annual risk assessment, including risk registers and risk maps, also serves as foundation for the Group’s control functions, such as Internal Control and Internal Audit, for their prioritization of focus areas.
The risk framework includes a universe of risks that could impact Dometic’s ability to achieve established strategic and other objectives including financial targets. The risks to which Dometic is exposed are classified into four main categories: strategic risks, execution risks, compliance & regulatory risks and reporting risks. Each main category has subcategories with defined underlying risks. Sustainability risks are integrated in the main categories and subcategories. Risks are mapped to strategic and other objectives including financial targets. Risk ownership is identified for each risk in the risk universe.
Strategic risks can impact Dometic’s ability to achieve strategic objectives including financial targets. Strategic risks are divided into the following subcategories; market and sales risks, product risks, manufacturing, distribution and sourcing risks, organizational risks and externa risk factors. External risk factors could be political such as tariffs, climate change, weather related, hazards such as disease outbreaks and risks related to competition and external crime.
Execution risks are operational, commercial and financial risks associated with business operations.
Compliance & Regulatory risks are both internal compliance with governing documents, as well as external compliance with laws, rules and regulations.
Reporting risks are risks associated with Dometic’s reporting, information and communication, both financial and non-financial.
The COVID-19 pandemic had a negative impact on Dometic’s business and operations, primarily during the first half of 2020. Future development of the pandemic create uncertainty and external as well as internal measures to contain COVID-19 cases may negatively impact the business and operations. While an increase in end-user appetite for staycation and outdoor activities is driving demand for the company’s products across the portfolio, Dometic continues to take proactive actions to protect its employees, other stakeholders and the financial position. Dometic is actively working to balance capacity and resources with demand across the organization.
Dometic’s risk and risk management are described on pages 59-61 and on pages 86-89 in the 2020 Annual and Sustainability Report, available at www.dometic.com.
DOMETIC Q1 REPORT ─ SOLNA, APRIL 23, 2021 │ 14
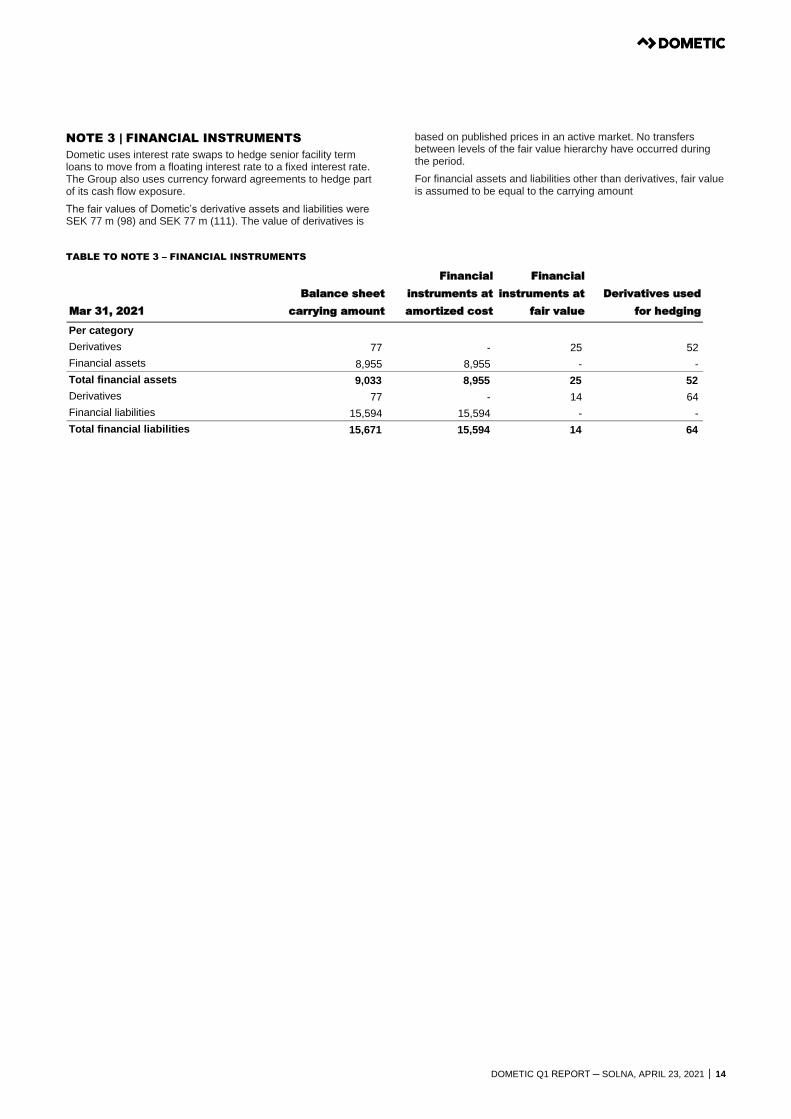
NOTE 3 | FINANCIAL INSTRUMENTS
Dometic uses interest rate swaps to hedge senior facility term loans to move from a floating interest rate to a fixed interest rate. The Group also uses currency forward agreements to hedge part of its cash flow exposure.
The fair values of Dometic’s derivative assets and liabilities were SEK 77 m (98) and SEK 77 m (111). The value of derivatives is
based on published prices in an active market. No transfers between levels of the fair value hierarchy have occurred during the period.
For financial assets and liabilities other than derivatives, fair value is assumed to be equal to the carrying amount
TABLE TO NOTE 3 – FINANCIAL INSTRUMENTS
Mar 31, 2021
Balance sheet
carrying amount
Financial
instruments at
amortized cost
Financial
instruments at
fair value
Derivatives used
for hedging
Per category
Derivatives 77 - 25 52
Financial assets 8,955 8,955 - -
Total financial assets 9,033 8,955 25 52
Derivatives 77 - 14 64
Financial liabilities 15,594 15,594 - -
Total financial liabilities 15,671 15,594 14 64
DOMETIC Q1 REPORT ─ SOLNA, APRIL 23, 2021 │ 15
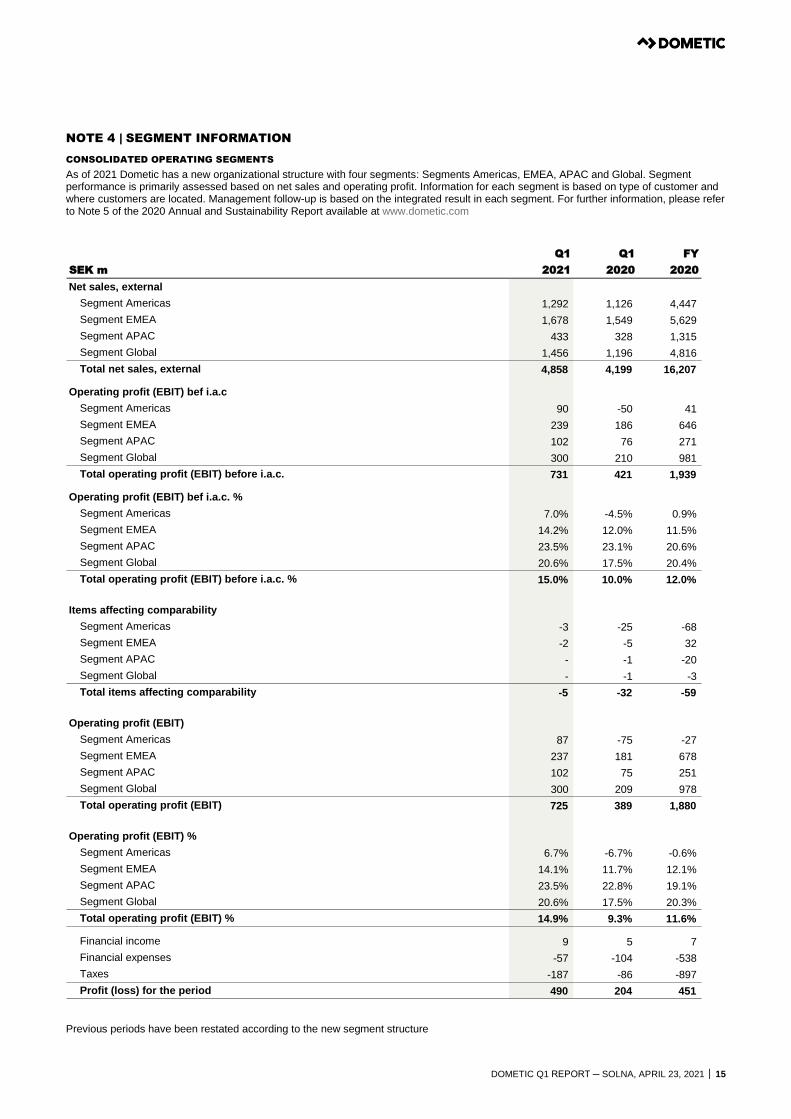
NOTE 4 | SEGMENT INFORMATION
CONSOLIDATED OPERATING SEGMENTS
As of 2021 Dometic has a new organizational structure with four segments: Segments Americas, EMEA, APAC and Global. Segment performance is primarily assessed based on net sales and operating profit. Information for each segment is based on type of customer and where customers are located. Management follow-up is based on the integrated result in each segment. For further information, please refer to Note 5 of the 2020 Annual and Sustainability Report available at www.dometic.com
Previous periods have been restated according to the new segment structure
Q1 Q1 FY
SEK m 2021 2020 2020
Net sales, external
Segment Americas 1,292 1,126 4,447
Segment EMEA 1,678 1,549 5,629
Segment APAC 433 328 1,315
Segment Global 1,456 1,196 4,816
Total net sales, external 4,858 4,199 16,207
Operating profit (EBIT) bef i.a.c
Segment Americas 90 -50 41
Segment EMEA 239 186 646
Segment APAC 102 76 271
Segment Global 300 210 981
Total operating profit (EBIT) before i.a.c. 731 421 1,939
Operating profit (EBIT) bef i.a.c. %
Segment Americas 7.0% -4.5% 0.9%
Segment EMEA 14.2% 12.0% 11.5%
Segment APAC 23.5% 23.1% 20.6%
Segment Global 20.6% 17.5% 20.4%
Total operating profit (EBIT) before i.a.c. % 15.0% 10.0% 12.0%
Items affecting comparability
Segment Americas -3 -25 -68
Segment EMEA -2 -5 32
Segment APAC - -1 -20
Segment Global - -1 -3
Total items affecting comparability -5 -32 -59
Operating profit (EBIT)
Segment Americas 87 -75 -27
Segment EMEA 237 181 678
Segment APAC 102 75 251
Segment Global 300 209 978
Total operating profit (EBIT) 725 389 1,880
Operating profit (EBIT) %
Segment Americas 6.7% -6.7% -0.6%
Segment EMEA 14.1% 11.7% 12.1%
Segment APAC 23.5% 22.8% 19.1%
Segment Global 20.6% 17.5% 20.3%
Total operating profit (EBIT) % 14.9% 9.3% 11.6%
Financial income 9 5 7
Financial expenses -57 -104 -538
Taxes -187 -86 -897
Profit (loss) for the period 490 204 451
DOMETIC Q1 REPORT ─ SOLNA, APRIL 23, 2021 │ 16
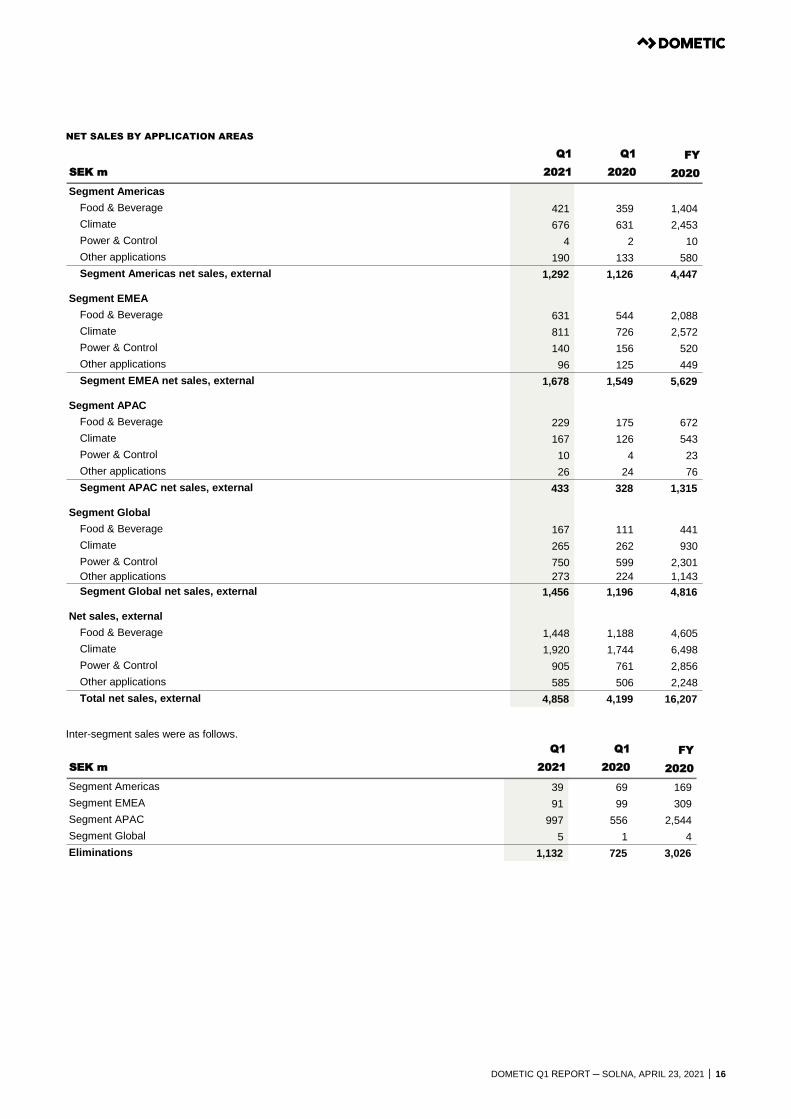
NET SALES BY APPLICATION AREAS
Inter-segment sales were as follows.
Q1 Q1 FY
SEK m 2021 2020 2020
Segment Americas
Food & Beverage 421 359 1,404
Climate 676 631 2,453
Power & Control 4 2 10
Other applications 190 133 580
Segment Americas net sales, external 1,292 1,126 4,447
Segment EMEA
Food & Beverage 631 544 2,088
Climate 811 726 2,572
Power & Control 140 156 520
Other applications 96 125 449
Segment EMEA net sales, external 1,678 1,549 5,629
Segment APAC
Food & Beverage 229 175 672
Climate 167 126 543
Power & Control 10 4 23
Other applications 26 24 76
Segment APAC net sales, external 433 328 1,315
Segment Global
Food & Beverage 167 111 441
Climate 265 262 930
Power & Control 750 599 2,301
Other applications 273 224 1,143
Segment Global net sales, external 1,456 1,196 4,816
Net sales, external
Food & Beverage 1,448 1,188 4,605
Climate 1,920 1,744 6,498
Power & Control 905 761 2,856
Other applications 585 506 2,248
Total net sales, external 4,858 4,199 16,207
Q1 Q1 FY
SEK m 2021 2020 2020
Segment Americas 39 69 169
Segment EMEA 91 99 309
Segment APAC 997 556 2,544
Segment Global 5 1 4
Eliminations 1,132 725 3,026
DOMETIC Q1 REPORT ─ SOLNA, APRIL 23, 2021 │ 17
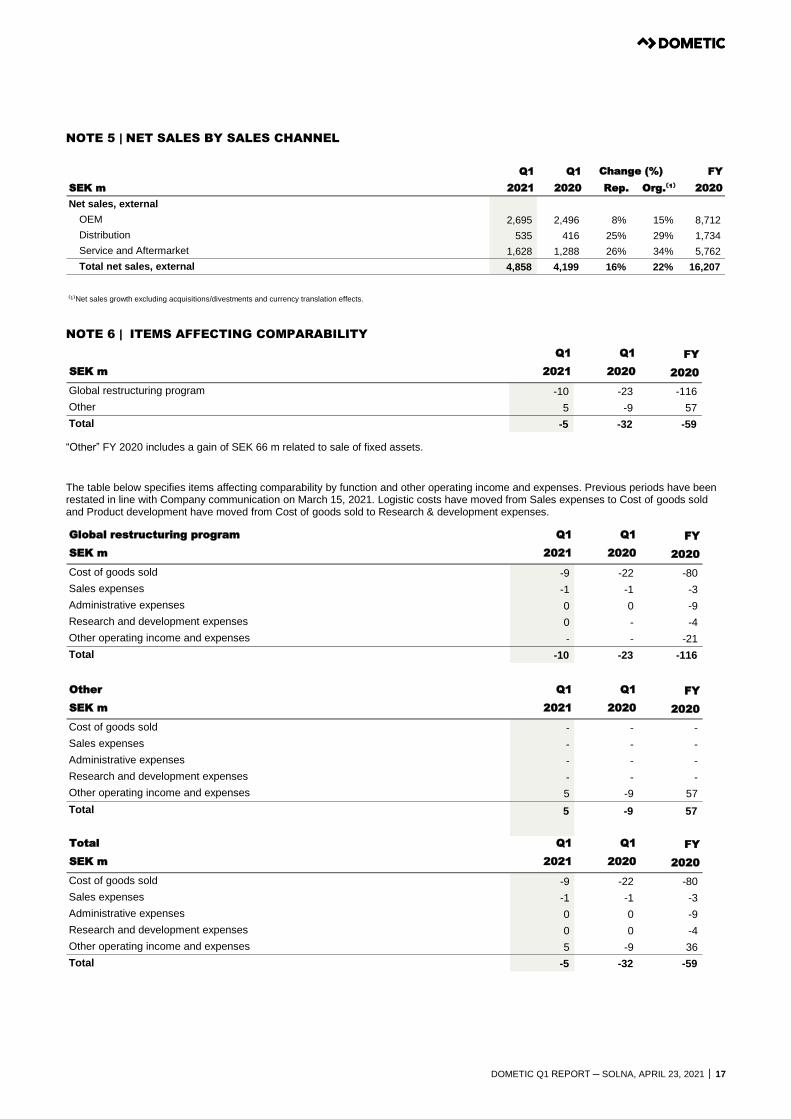
NOTE 5 | NET SALES BY SALES CHANNEL
NOTE 6 | ITEMS AFFECTING COMPARABILITY
“Other” FY 2020 includes a gain of SEK 66 m related to sale of fixed assets.
The table below specifies items affecting comparability by function and other operating income and expenses. Previous periods have been restated in line with Company communication on March 15, 2021. Logistic costs have moved from Sales expenses to Cost of goods sold and Product development have moved from Cost of goods sold to Research & development expenses.
Q1 Q1 FY
SEK m 2021 2020 Rep. Org.⁽¹⁾ 2020
Net sales, external
OEM 2,695 2,496 8% 15% 8,712
Distribution 535 416 25% 29% 1,734
Service and Aftermarket 1,628 1,288 26% 34% 5,762
Total net sales, external 4,858 4,199 16% 22% 16,207
Change (%)
⁽¹⁾Net sales growth excluding acquisitions/divestments and currency translation effects.
Q1 Q1 FY
SEK m 2021 2020 2020
Global restructuring program -10 -23 -116
Other 5 -9 57
Total -5 -32 -59
Global restructuring program Q1 Q1 FY
SEK m 2021 2020 2020
Cost of goods sold -9 -22 -80
Sales expenses -1 -1 -3
Administrative expenses 0 0 -9
Research and development expenses 0 - -4
Other operating income and expenses - - -21
Total -10 -23 -116
Other Q1 Q1 FY
SEK m 2021 2020 2020
Cost of goods sold - - -
Sales expenses - - -
Administrative expenses - - -
Research and development expenses - - -
Other operating income and expenses 5 -9 57
Total 5 -9 57
Total Q1 Q1 FY
SEK m 2021 2020 2020
Cost of goods sold -9 -22 -80
Sales expenses -1 -1 -3
Administrative expenses 0 0 -9
Research and development expenses 0 0 -4
Other operating income and expenses 5 -9 36
Total -5 -32 -59
DOMETIC Q1 REPORT ─ SOLNA, APRIL 23, 2021 │ 18
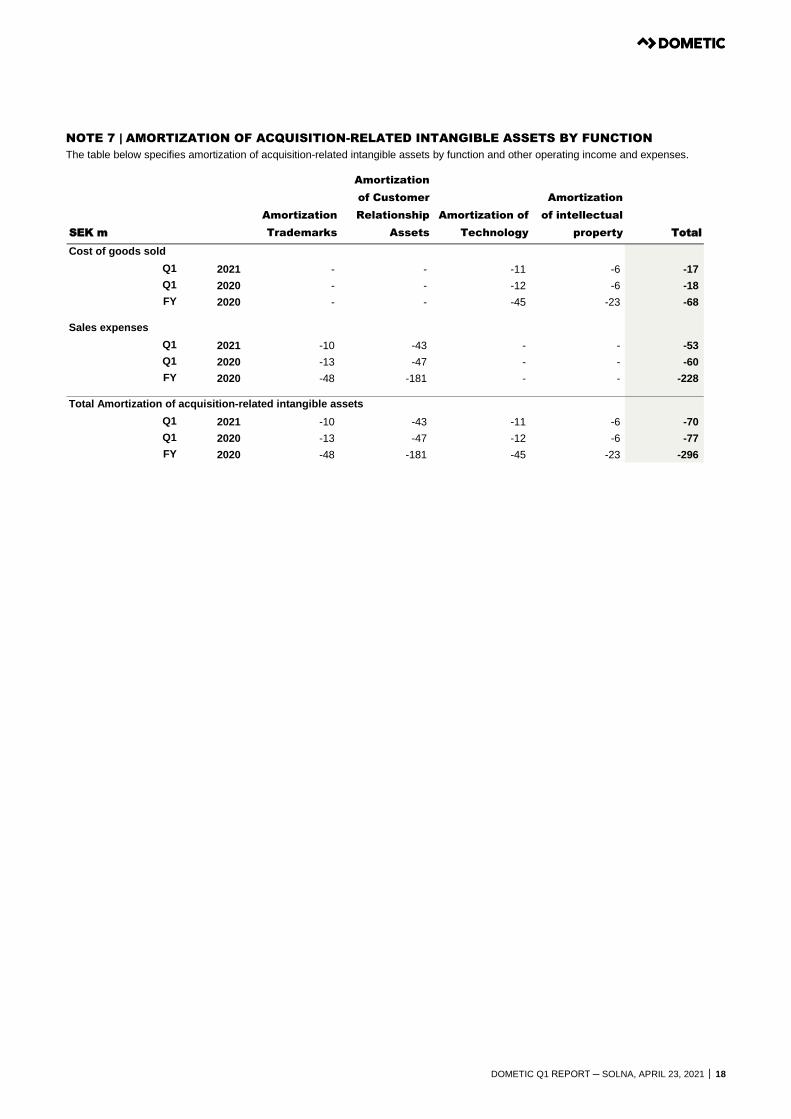
NOTE 7 | AMORTIZATION OF ACQUISITION-RELATED INTANGIBLE ASSETS BY FUNCTION
The table below specifies amortization of acquisition-related intangible assets by function and other operating income and expenses.
SEK m
Amortization
Trademarks
Amortization
of Customer
Relationship
Assets
Amortization of
Technology
Amortization
of intellectual
property Total
Q1 2021 - - -11 -6 -17
Q1 2020 - - -12 -6 -18
FY 2020 - - -45 -23 -68
Q1 2021 -10 -43 - - -53
Q1 2020 -13 -47 - - -60
FY 2020 -48 -181 - - -228
Q1 2021 -10 -43 -11 -6 -70
Q1 2020 -13 -47 -12 -6 -77
FY 2020 -48 -181 -45 -23 -296
Sales expenses
Cost of goods sold
Total Amortization of acquisition-related intangible assets
DOMETIC Q1 REPORT ─ SOLNA, APRIL 23, 2021 │ 19
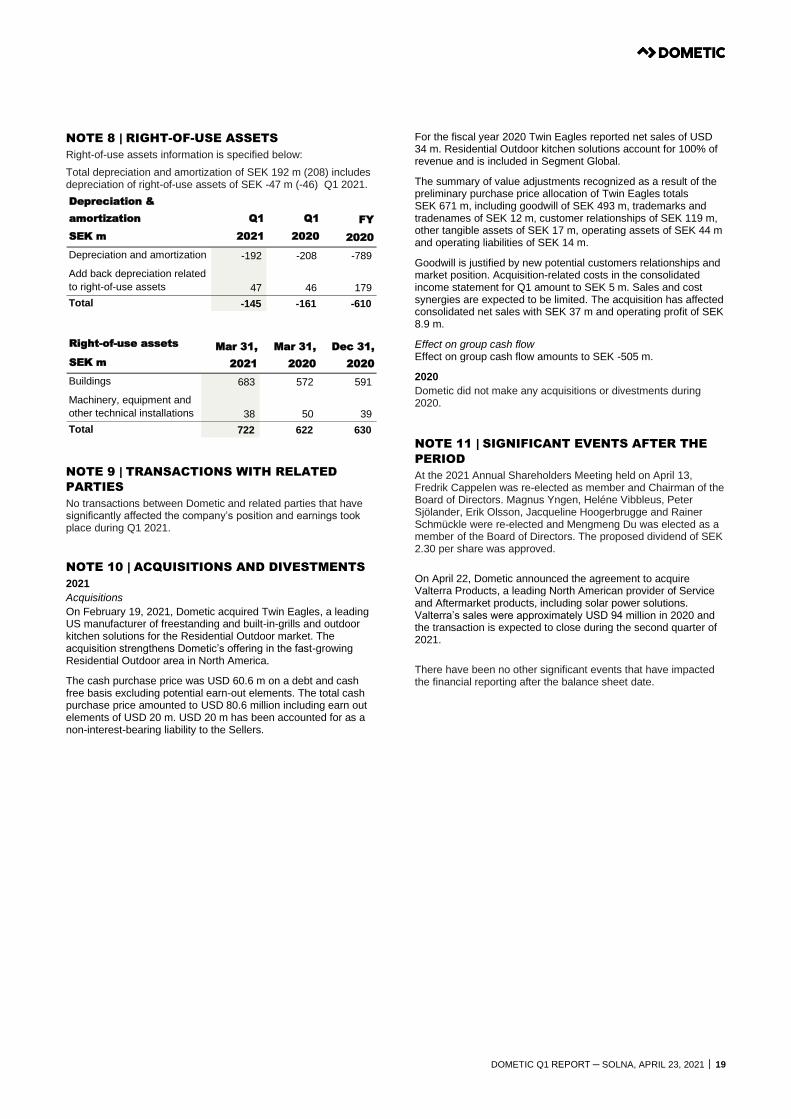
NOTE 8 | RIGHT-OF-USE ASSETS
Right-of-use assets information is specified below:
Total depreciation and amortization of SEK 192 m (208) includes depreciation of right-of-use assets of SEK -47 m (-46) Q1 2021.
NOTE 9 | TRANSACTIONS WITH RELATED
PARTIES
No transactions between Dometic and related parties that have significantly affected the company’s position and earnings took place during Q1 2021.
NOTE 10 | ACQUISITIONS AND DIVESTMENTS
2021
Acquisitions
On February 19, 2021, Dometic acquired Twin Eagles, a leading US manufacturer of freestanding and built-in-grills and outdoor kitchen solutions for the Residential Outdoor market. The acquisition strengthens Dometic’s offering in the fast-growing Residential Outdoor area in North America.
The cash purchase price was USD 60.6 m on a debt and cash free basis excluding potential earn-out elements. The total cash purchase price amounted to USD 80.6 million including earn out elements of USD 20 m. USD 20 m has been accounted for as a non-interest-bearing liability to the Sellers.
For the fiscal year 2020 Twin Eagles reported net sales of USD 34 m. Residential Outdoor kitchen solutions account for 100% of revenue and is included in Segment Global.
The summary of value adjustments recognized as a result of the preliminary purchase price allocation of Twin Eagles totals SEK 671 m, including goodwill of SEK 493 m, trademarks and tradenames of SEK 12 m, customer relationships of SEK 119 m, other tangible assets of SEK 17 m, operating assets of SEK 44 m and operating liabilities of SEK 14 m.
Goodwill is justified by new potential customers relationships and market position. Acquisition-related costs in the consolidated income statement for Q1 amount to SEK 5 m. Sales and cost synergies are expected to be limited. The acquisition has affected consolidated net sales with SEK 37 m and operating profit of SEK 8.9 m.
Effect on group cash flow Effect on group cash flow amounts to SEK -505 m.
2020
Dometic did not make any acquisitions or divestments during 2020.
NOTE 11 | SIGNIFICANT EVENTS AFTER THE
PERIOD
At the 2021 Annual Shareholders Meeting held on April 13, Fredrik Cappelen was re-elected as member and Chairman of the Board of Directors. Magnus Yngen, Heléne Vibbleus, Peter Sjölander, Erik Olsson, Jacqueline Hoogerbrugge and Rainer Schmückle were re-elected and Mengmeng Du was elected as a member of the Board of Directors. The proposed dividend of SEK 2.30 per share was approved.
On April 22, Dometic announced the agreement to acquire Valterra Products, a leading North American provider of Service and Aftermarket products, including solar power solutions. Valterra’s sales were approximately USD 94 million in 2020 and the transaction is expected to close during the second quarter of 2021.
There have been no other significant events that have impacted the financial reporting after the balance sheet date.
Depreciation &
amortization Q1 Q1 FY
SEK m 2021 2020 2020
Depreciation and amortization -192 -208 -789
Add back depreciation related
to right-of-use assets 47 46 179
Total -145 -161 -610
Right-of-use assets
SEK m
Buildings 683 572 591
Machinery, equipment and
other technical installations 38 50 39
Total 722 622 630
Mar 31,
2021
Mar 31,
2020
Dec 31,
2020
DOMETIC Q1 REPORT ─ SOLNA, APRIL 23, 2021 │ 20
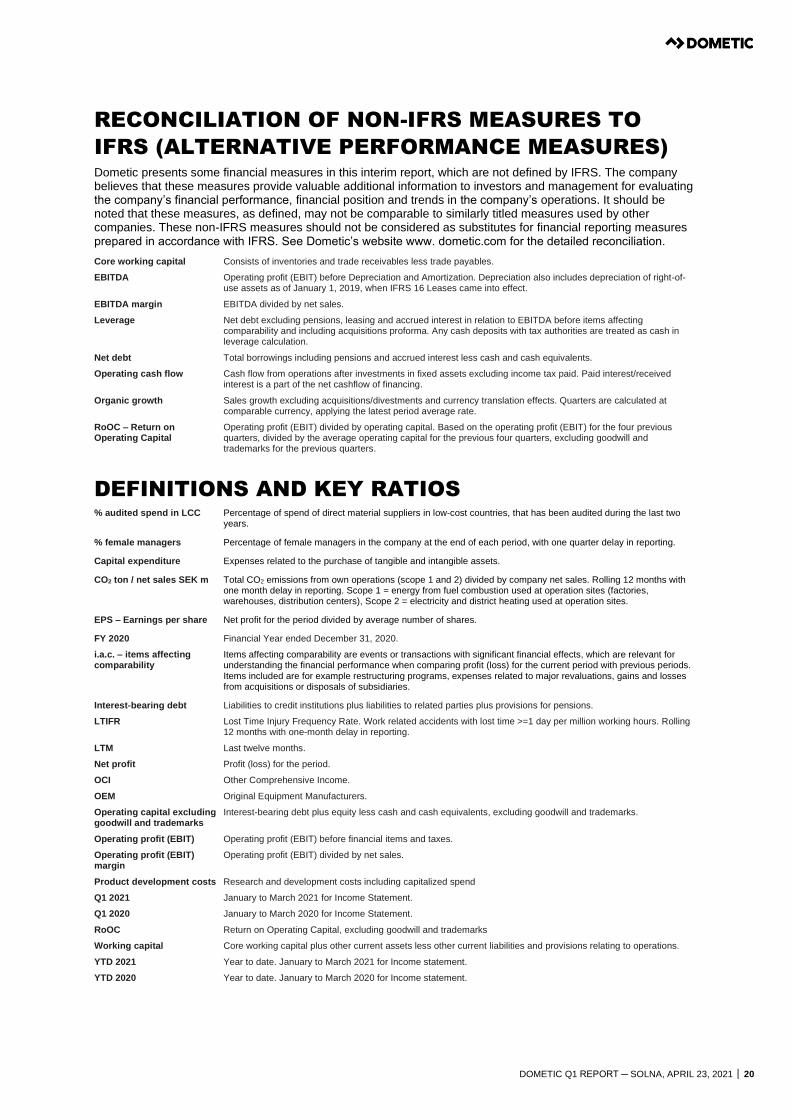
RECONCILIATION OF NON-IFRS MEASURES TO
IFRS (ALTERNATIVE PERFORMANCE MEASURES) Dometic presents some financial measures in this interim report, which are not defined by IFRS. The company believes that these measures provide valuable additional information to investors and management for evaluating the company’s financial performance, financial position and trends in the company’s operations. It should be noted that these measures, as defined, may not be comparable to similarly titled measures used by other companies. These non-IFRS measures should not be considered as substitutes for financial reporting measures prepared in accordance with IFRS. See Dometic’s website www. dometic.com for the detailed reconciliation.
Core working capital Consists of inventories and trade receivables less trade payables.
EBITDA Operating profit (EBIT) before Depreciation and Amortization. Depreciation also includes depreciation of right-of-use assets as of January 1, 2019, when IFRS 16 Leases came into effect.
EBITDA margin EBITDA divided by net sales.
Leverage Net debt excluding pensions, leasing and accrued interest in relation to EBITDA before items affecting comparability and including acquisitions proforma. Any cash deposits with tax authorities are treated as cash in leverage calculation.
Net debt Total borrowings including pensions and accrued interest less cash and cash equivalents.
Operating cash flow Cash flow from operations after investments in fixed assets excluding income tax paid. Paid interest/received interest is a part of the net cashflow of financing.
Organic growth Sales growth excluding acquisitions/divestments and currency translation effects. Quarters are calculated at comparable currency, applying the latest period average rate.
RoOC – Return on Operating Capital
Operating profit (EBIT) divided by operating capital. Based on the operating profit (EBIT) for the four previous quarters, divided by the average operating capital for the previous four quarters, excluding goodwill and trademarks for the previous quarters.
DEFINITIONS AND KEY RATIOS % audited spend in LCC Percentage of spend of direct material suppliers in low-cost countries, that has been audited during the last two
years.
% female managers Percentage of female managers in the company at the end of each period, with one quarter delay in reporting.
Capital expenditure Expenses related to the purchase of tangible and intangible assets.
CO2 ton / net sales SEK m Total CO2 emissions from own operations (scope 1 and 2) divided by company net sales. Rolling 12 months with one month delay in reporting. Scope 1 = energy from fuel combustion used at operation sites (factories, warehouses, distribution centers), Scope 2 = electricity and district heating used at operation sites.
EPS – Earnings per share Net profit for the period divided by average number of shares.
FY 2020 Financial Year ended December 31, 2020.
i.a.c. – items affecting comparability
Items affecting comparability are events or transactions with significant financial effects, which are relevant for understanding the financial performance when comparing profit (loss) for the current period with previous periods. Items included are for example restructuring programs, expenses related to major revaluations, gains and losses from acquisitions or disposals of subsidiaries.
Interest-bearing debt Liabilities to credit institutions plus liabilities to related parties plus provisions for pensions.
LTIFR Lost Time Injury Frequency Rate. Work related accidents with lost time >=1 day per million working hours. Rolling 12 months with one-month delay in reporting.
LTM Last twelve months.
Net profit Profit (loss) for the period.
OCI Other Comprehensive Income.
OEM Original Equipment Manufacturers.
Operating capital excluding goodwill and trademarks
Interest-bearing debt plus equity less cash and cash equivalents, excluding goodwill and trademarks.
Operating profit (EBIT) Operating profit (EBIT) before financial items and taxes.
Operating profit (EBIT) margin
Operating profit (EBIT) divided by net sales.
Product development costs Research and development costs including capitalized spend
Q1 2021 January to March 2021 for Income Statement.
Q1 2020 January to March 2020 for Income Statement.
RoOC Return on Operating Capital, excluding goodwill and trademarks
Working capital Core working capital plus other current assets less other current liabilities and provisions relating to operations.
YTD 2021 Year to date. January to March 2021 for Income statement.
YTD 2020 Year to date. January to March 2020 for Income statement.
DOMETIC Q1 REPORT ─ SOLNA, APRIL 23, 2021 │ 21
PRESENTATION OF THE INTERIM REPORT Analysts and media are invited to participate in a telephone conference at 10.00 (CEST), April 23, 2021, during which President and CEO, Juan Vargues and CFO, Stefan Fristedt, will present the report and answer questions. To participate in the webcast/telephone conference, please dial in five minutes prior to the start of the conference call. The webcast URL and presentation are available at www.dometic.com.
Sweden: +46 8 505 583 73 UK: +44 33 330 092 73 US: + 1 646 722 49 04
FOR FURTHER INFORMATION, PLEASE CONTACT
Rikard Tunedal Head of Investor Relations Phone: +46 730 56 97 35 E-mail: [email protected]
Dometic Group AB (publ) Hemvärnsgatan 15 SE-171 54 Solna, Sweden Phone: +46 8 501 025 00 www.dometic.com Corporate registration number 556829-4390
This information is information that Dometic Group AB (publ) is obliged to make public pursuant to the EU Market Abuse Regulation and the Swedish Securities Markets Act. The information was submitted for publication, through the agency of the contact person set out above, at 08:00 CEST on April 23, 2021.
This document is a translation of the Swedish version of the interim report. In the event of any discrepancy, the Swedish wording shall prevail.
ABOUT DOMETIC
Dometic is a global market leader in branded solutions for mobile living in the areas of Food & Beverage, Climate, Power & Control and Other Applications. Dometic operates in the Americas, EMEA and APAC, providing products for use in recreational vehicles, pleasure and workboats, trucks and premium cars, and for a variety of other uses. Our motivation is to create smart and reliable products with outstanding design. We have a global distribution and dealer network in place to serve the aftermarket. Dometic employs approximately 6,500 people worldwide, had net sales of SEK 16.2 billion in 2020 and is headquartered in Stockholm, Sweden.
DISCLAIMER
Some statements herein are forward-looking and the actual outcome could be materially different. In addition to the factors explicitly commented upon, the actual outcome could be materially affected by other factors, (a) changes in economic, market and competitive conditions, (b) success of business and operating initiatives, (c) changes in the regulatory environment and other government actions, (d) fluctuations in exchange rates and (e) business risk management.
FINANCIAL CALENDAR
JULY 16, 2021: OCTOBER 22, 2021:
Interim report for the second quarter 2021 Interim report for the third quarter 2021