Embed Size (px)
Citation preview
Highlights
Sierra Leone Diamond Project:
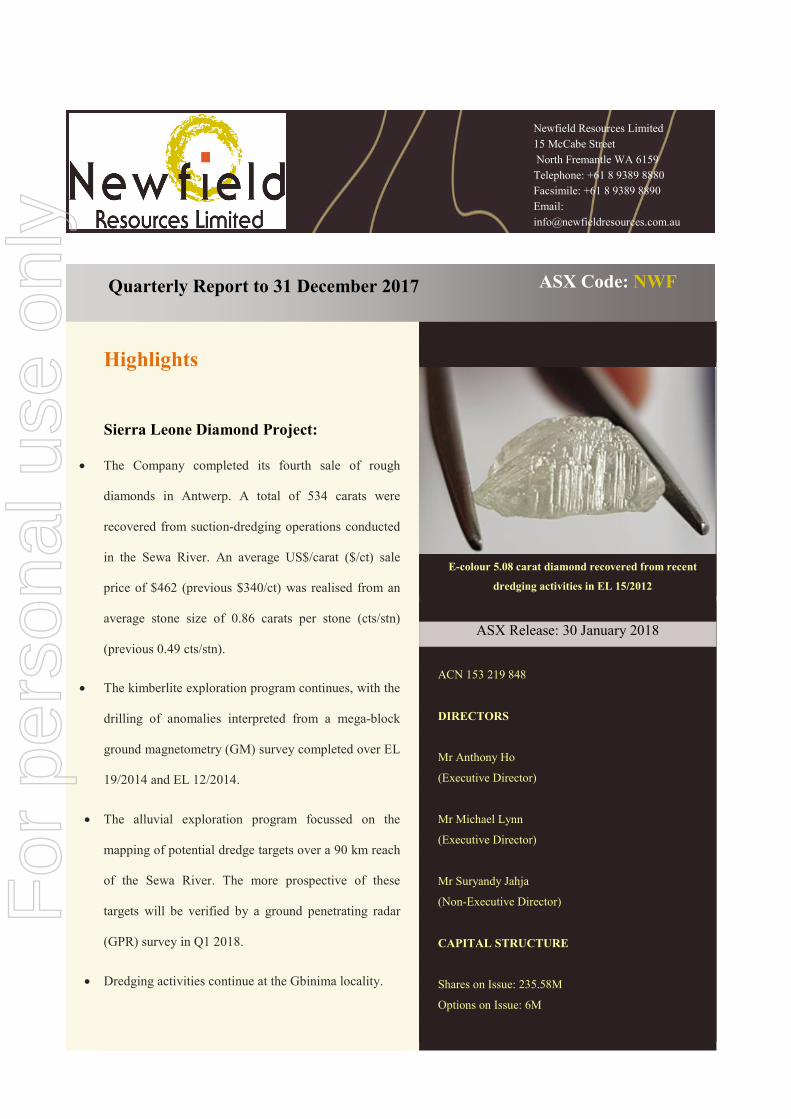
• The Company completed its fourth sale of rough
diamonds in Antwerp. A total of 534 carats were
recovered from suction-dredging operations conducted
in the Sewa River. An average US$/carat ($/ct) sale
price of $462 (previous $340/ct) was realised from an
average stone size of 0.86 carats per stone (cts/stn)
(previous 0.49 cts/stn).
• The kimberlite exploration program continues, with the
drilling of anomalies interpreted from a mega-block
ground magnetometry (GM) survey completed over EL
19/2014 and EL 12/2014.
• The alluvial exploration program focussed on the
mapping of potential dredge targets over a 90 km reach
of the Sewa River. The more prospective of these
targets will be verified by a ground penetrating radar
(GPR) survey in Q1 2018.
• Dredging activities continue at the Gbinima locality.
ASX Release: 30 January 2018
ACN 153 219 848
DIRECTORS
Mr Anthony Ho
(Executive Director)
Mr Michael Lynn
(Executive Director)
Mr Suryandy Jahja
(Non-Executive Director)
CAPITAL STRUCTURE
Shares on Issue: 235.58M
Options on Issue: 6M
Quarterly Report to 31 December 2017 ASX Code: NWF
E-colour 5.08 carat diamond recovered from recent
dredging activities in EL 15/2012
Newfield Resources Limited 15 McCabe Street North Fremantle WA 6159 Telephone: +61 8 9389 8880 Facsimile: +61 8 9389 8890 Email: [email protected]
For
per
sona
l use
onl
y
2
Newfield Quarterly Report to 31 December 2017
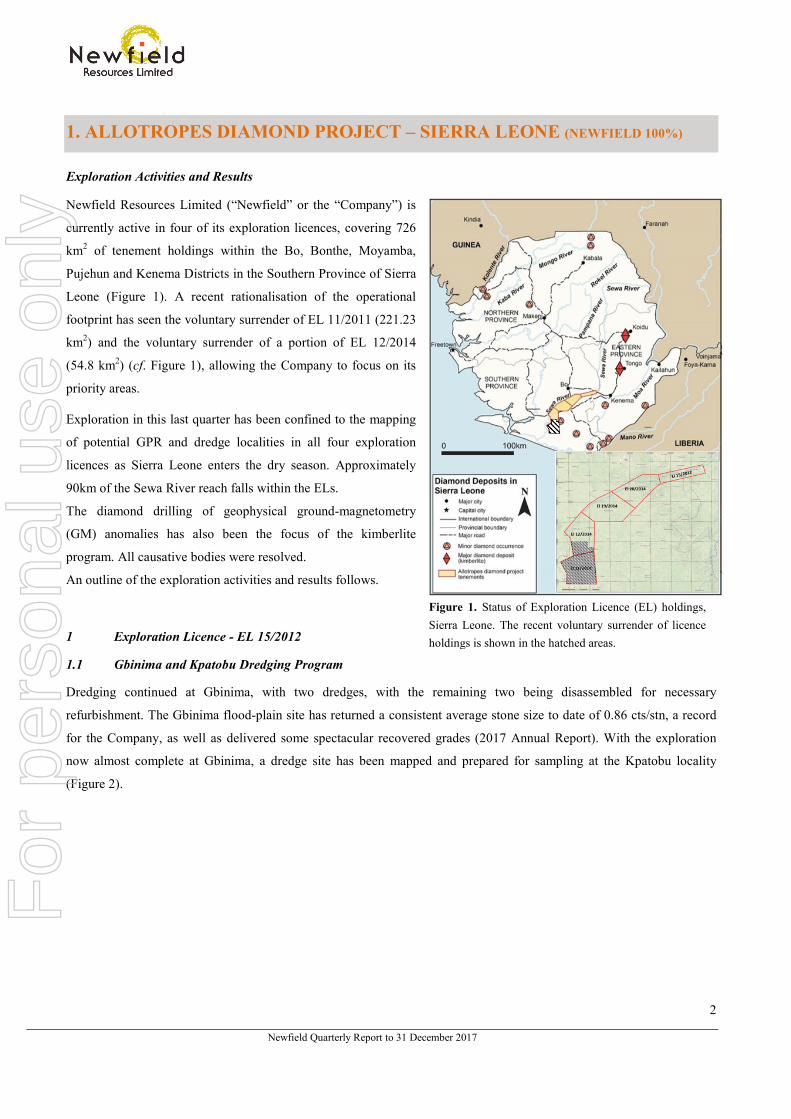
Figure 1. Status of Exploration Licence (EL) holdings, Sierra Leone. The recent voluntary surrender of licence holdings is shown in the hatched areas.
1. ALLOTROPES DIAMOND PROJECT – SIERRA LEONE (NEWFIELD 100%)
Exploration Activities and Results
Newfield Resources Limited (“Newfield” or the “Company”) is
currently active in four of its exploration licences, covering 726
km2 of tenement holdings within the Bo, Bonthe, Moyamba,
Pujehun and Kenema Districts in the Southern Province of Sierra
Leone (Figure 1). A recent rationalisation of the operational
footprint has seen the voluntary surrender of EL 11/2011 (221.23
km2) and the voluntary surrender of a portion of EL 12/2014
(54.8 km2) (cf. Figure 1), allowing the Company to focus on its
priority areas.
Exploration in this last quarter has been confined to the mapping
of potential GPR and dredge localities in all four exploration
licences as Sierra Leone enters the dry season. Approximately
90km of the Sewa River reach falls within the ELs.
The diamond drilling of geophysical ground-magnetometry
(GM) anomalies has also been the focus of the kimberlite
program. All causative bodies were resolved.
An outline of the exploration activities and results follows.
1 Exploration Licence - EL 15/2012
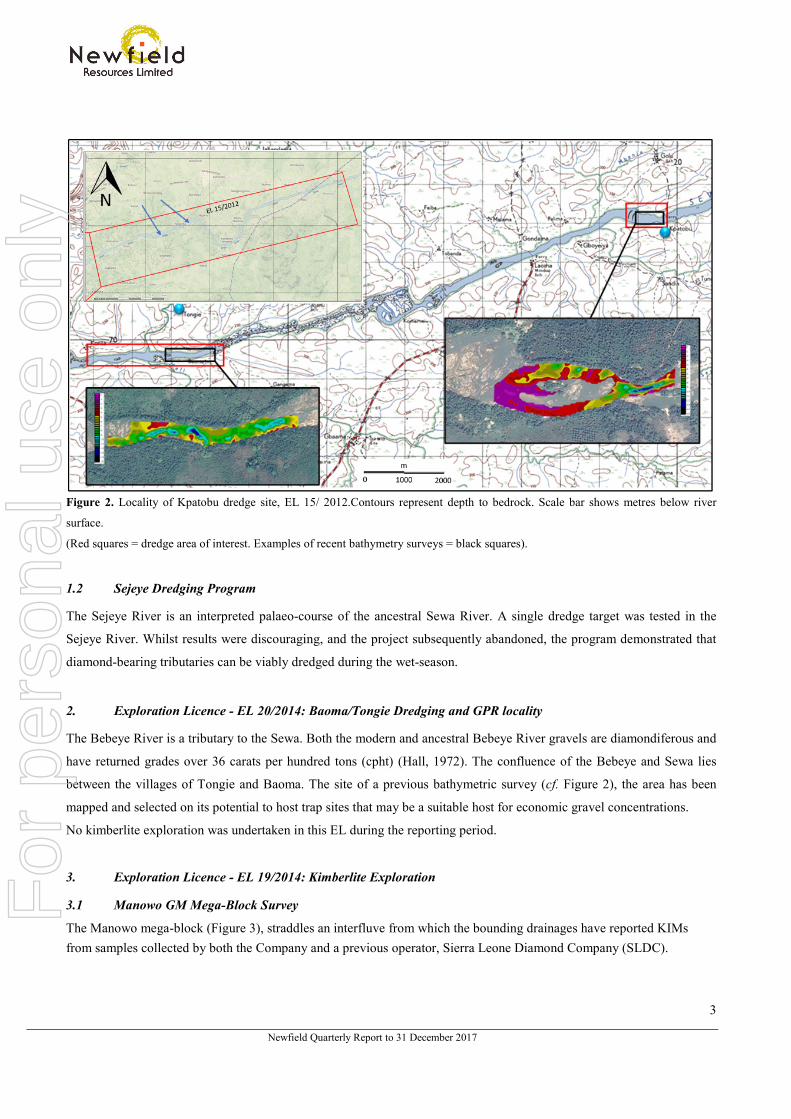
1.1 Gbinima and Kpatobu Dredging Program
Dredging continued at Gbinima, with two dredges, with the remaining two being disassembled for necessary
refurbishment. The Gbinima flood-plain site has returned a consistent average stone size to date of 0.86 cts/stn, a record
for the Company, as well as delivered some spectacular recovered grades (2017 Annual Report). With the exploration
now almost complete at Gbinima, a dredge site has been mapped and prepared for sampling at the Kpatobu locality
(Figure 2).
For
per
sona
l use
onl
y
3
Newfield Quarterly Report to 31 December 2017
Figure 2. Locality of Kpatobu dredge site, EL 15/ 2012.Contours represent depth to bedrock. Scale bar shows metres below river
surface.
(Red squares = dredge area of interest. Examples of recent bathymetry surveys = black squares).
1.2 Sejeye Dredging Program
The Sejeye River is an interpreted palaeo-course of the ancestral Sewa River. A single dredge target was tested in the
Sejeye River. Whilst results were discouraging, and the project subsequently abandoned, the program demonstrated that
diamond-bearing tributaries can be viably dredged during the wet-season.
2. Exploration Licence - EL 20/2014: Baoma/Tongie Dredging and GPR locality
The Bebeye River is a tributary to the Sewa. Both the modern and ancestral Bebeye River gravels are diamondiferous and
have returned grades over 36 carats per hundred tons (cpht) (Hall, 1972). The confluence of the Bebeye and Sewa lies
between the villages of Tongie and Baoma. The site of a previous bathymetric survey (cf. Figure 2), the area has been
mapped and selected on its potential to host trap sites that may be a suitable host for economic gravel concentrations.
No kimberlite exploration was undertaken in this EL during the reporting period.
3. Exploration Licence - EL 19/2014: Kimberlite Exploration
3.1 Manowo GM Mega-Block Survey
The Manowo mega-block (Figure 3), straddles an interfluve from which the bounding drainages have reported KIMs from samples collected by both the Company and a previous operator, Sierra Leone Diamond Company (SLDC).
For
per
sona
l use
onl
y

4
Newfield Quarterly Report to 31 December 2017
Figure 3. Bottom left-Manowo mega GM survey results (TMI), EL 19/2014. Drill hole collars are indicated in light blue diamonds; soils samples are black crosses. Red polygons-individual GM blocks. Background image is TMI from 2016 airborne magnetometry (AM) survey, overlying regional drainage.
Intriguingly, several artisanal diamond diggings in the vicinity do not appear to be associated with significantly
transported alluvial sediments, suggesting a primary source for the diamonds. The GM survey overlaps the common EL
19/2014 and EL 12/2014 licence boundaries (cf. Figure 3). Several follow-up surveys have been conducted over
anomalies which have been targeted for drilling. It is pertinent to note that a total of twenty-eight targets have been
identified for follow-up work, following the interpretation of the GM survey results (i.e. within EL 19/2014 and EL
12/2014).
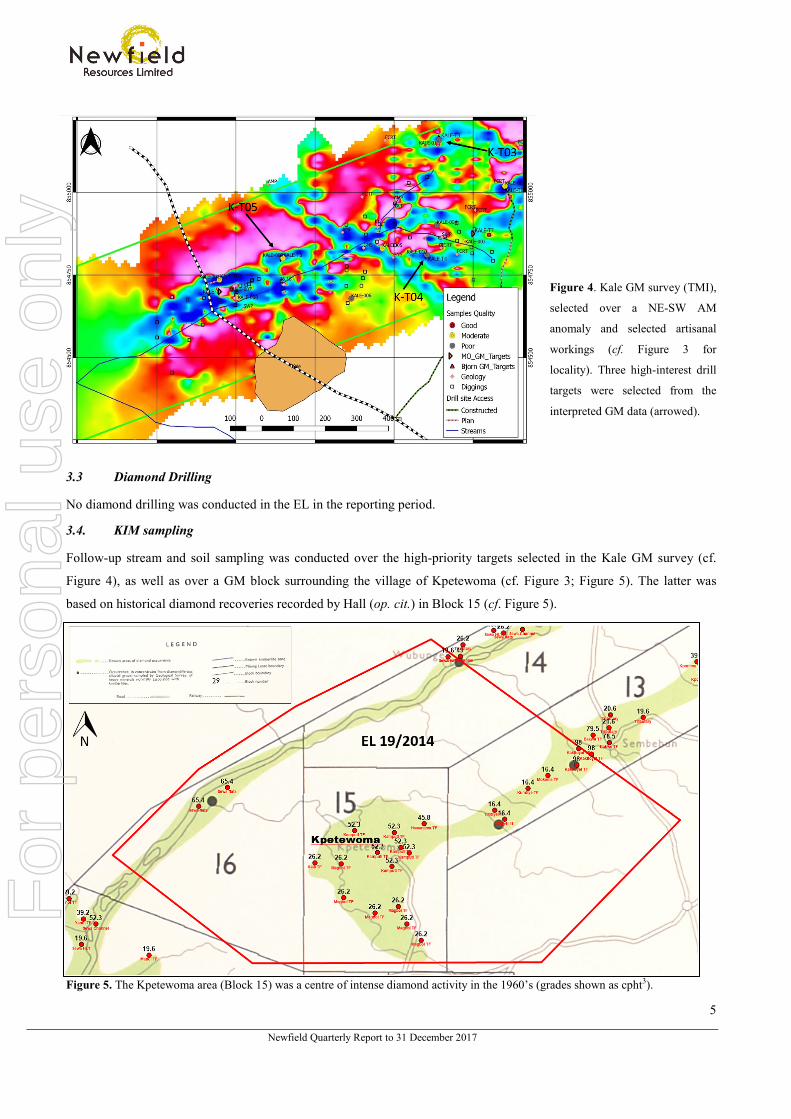
3.2 Kale GM Survey-Target Selection
A GM survey completed around the village of Kale (cf. Figure 3, left of centre), was designed over a linear NE-SW AM
feature associated with old and active artisanal workings. From this, three priority drill targets were selected (Figure 4)
and the drill-sites mapped. The Kale swamp is the only currently known diamondiferous deposit that overlies the Rokel
River Group shale floor-rocks (Hall, 1972).
For
per
sona
l use
onl
y
5
Newfield Quarterly Report to 31 December 2017
Figure 4. Kale GM survey (TMI),
selected over a NE-SW AM
anomaly and selected artisanal
workings (cf. Figure 3 for
locality). Three high-interest drill
targets were selected from the
interpreted GM data (arrowed).
3.3 Diamond Drilling
No diamond drilling was conducted in the EL in the reporting period.
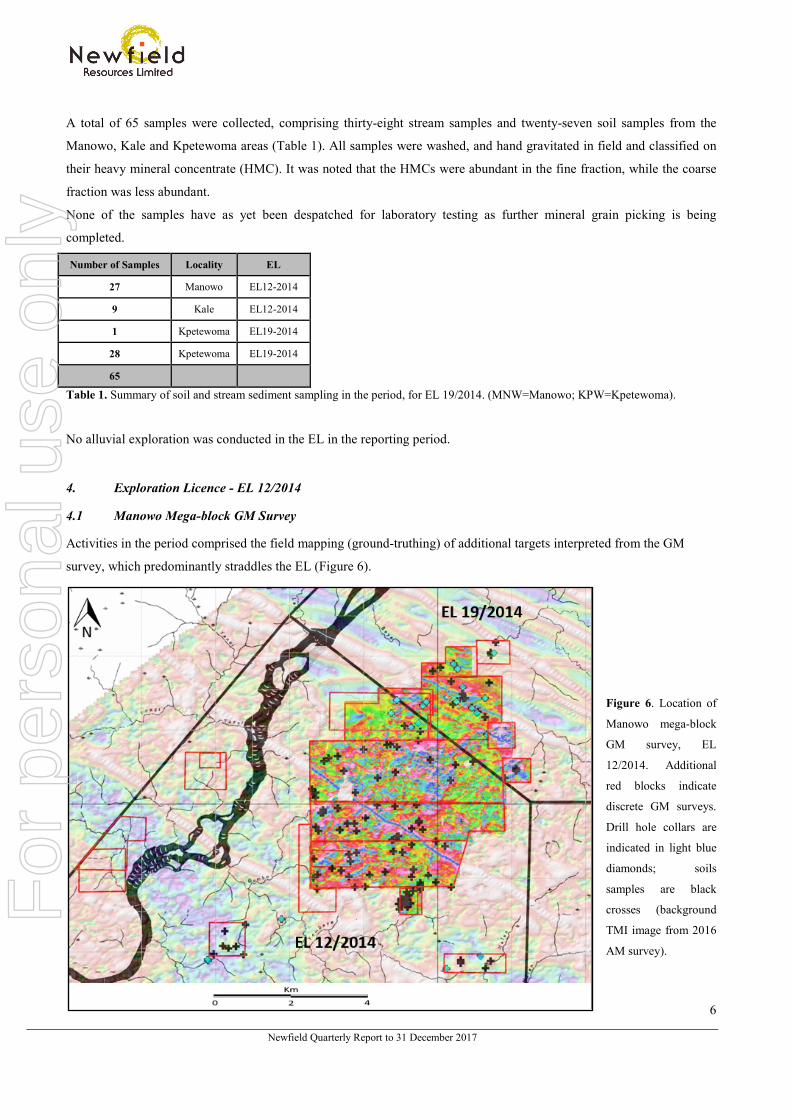
3.4. KIM sampling
Follow-up stream and soil sampling was conducted over the high-priority targets selected in the Kale GM survey (cf.
Figure 4), as well as over a GM block surrounding the village of Kpetewoma (cf. Figure 3; Figure 5). The latter was
based on historical diamond recoveries recorded by Hall (op. cit.) in Block 15 (cf. Figure 5).
Figure 5. The Kpetewoma area (Block 15) was a centre of intense diamond activity in the 1960’s (grades shown as cpht3).
For
per
sona
l use
onl
y
6
Newfield Quarterly Report to 31 December 2017
A total of 65 samples were collected, comprising thirty-eight stream samples and twenty-seven soil samples from the
Manowo, Kale and Kpetewoma areas (Table 1). All samples were washed, and hand gravitated in field and classified on
their heavy mineral concentrate (HMC). It was noted that the HMCs were abundant in the fine fraction, while the coarse
fraction was less abundant.
None of the samples have as yet been despatched for laboratory testing as further mineral grain picking is being
completed.
Number of Samples Locality EL
27 Manowo EL12-2014
9 Kale EL12-2014
1 Kpetewoma EL19-2014
28 Kpetewoma EL19-2014
65
Table 1. Summary of soil and stream sediment sampling in the period, for EL 19/2014. (MNW=Manowo; KPW=Kpetewoma).
No alluvial exploration was conducted in the EL in the reporting period.
4. Exploration Licence - EL 12/2014
4.1 Manowo Mega-block GM Survey
Activities in the period comprised the field mapping (ground-truthing) of additional targets interpreted from the GM
survey, which predominantly straddles the EL (Figure 6).
Figure 6. Location of
Manowo mega-block
GM survey, EL
12/2014. Additional
red blocks indicate
discrete GM surveys.
Drill hole collars are
indicated in light blue
diamonds; soils
samples are black
crosses (background
TMI image from 2016
AM survey).
For
per
sona
l use
onl
y

7
Newfield Quarterly Report to 31 December 2017
4.2 GM Survey-Target Selection
A review of GM anomalies resulted in twenty-eight small targets being selected for follow-up soil sampling and surface
mapping (Figure 7). These field observations and additional sampling is required to locate an accurate geographic
position for any indicator minerals where they overlie a GM target. Where these data overlap, then allows the positioning
of an accurate drill site.
Figure 7. Overview
of priority drilling
targets (red
triangles) generated
from the Manowo
mega-block GM
survey. To date, a
total of 96 samples
have been collected
from the survey.
4.2 Diamond Drilling
A total of two holes were drilled in the period, for a total of 55.6m of core recovered. (Table 2). Drilled under challenging
conditions, both holes successfully resolved the target and the causative lithologies identified and confirmed from the
magnetic susceptibility (mag.sus.) data collected during logging.
Hole ID EOH
MNW-T012-DD-001 10.35
MNW-T025-DD-001
MNW-T025-DD-001
MNW-T025-DD-001
MNW-T025-DD-001 45.25
Total 55.6 Table 2. Summary of drilling conducted on EL 12/2014. No kimberlite has as yet been intersected.
For
per
sona
l use
onl
y
8
Newfield Quarterly Report to 31 December 2017
4.5 Voluntary Partial Surrender of EL 12/2014.
The final report for the voluntary surrender of a portion of EL 12/2014 (refer NWF September Quarterly) was submitted
to the National Minerals Agency in Freetown for formal processing.
5. Exploration Licence - EL 11/2014-Voluntary Surrender of EL
The final report for the voluntary surrender of the whole of EL 11/2014 (refer NWF September Quarterly) was submitted
to the National Minerals Agency in Freetown for formal processing.
REFERENCES
Hall, P.K., (1972). The diamond fields of Sierra Leone. Geol. Surv. Sierra Leone Bull. 5 (1); 133 pp.
COMPETENT PERSON’S STATEMENT- DIAMONDS
The information in this report that relates to Exploration Results, Mineral Resources or Ore Reserves on the Allotropes Diamond’s
Sierra Leone Diamond Project, is based on information compiled by Mr Richard Charles Blake Hall (M.Sc. Geology, Cum Laude) who
is a Fellow of the Australasian Institute of Mining and Metallurgy and a Member of the Geological Society of Australia. Mr Hall
consults for Newfield Resources Ltd, and has sufficient experience which is relevant to the style of mineralisation and type of deposit
under consideration and to the activity which he is undertaking, to qualify as a Competent Person as defined in the 2012 Edition of the
“Australasian Code for Reporting of Exploration Results, Mineral Resources and Ore Reserves”. Mr Hall consents to the inclusion in
this ASX release of this information in the form and context in which it appears.
For
per
sona
l use
onl
y
9
Newfield Quarterly Report to 31 December 2017
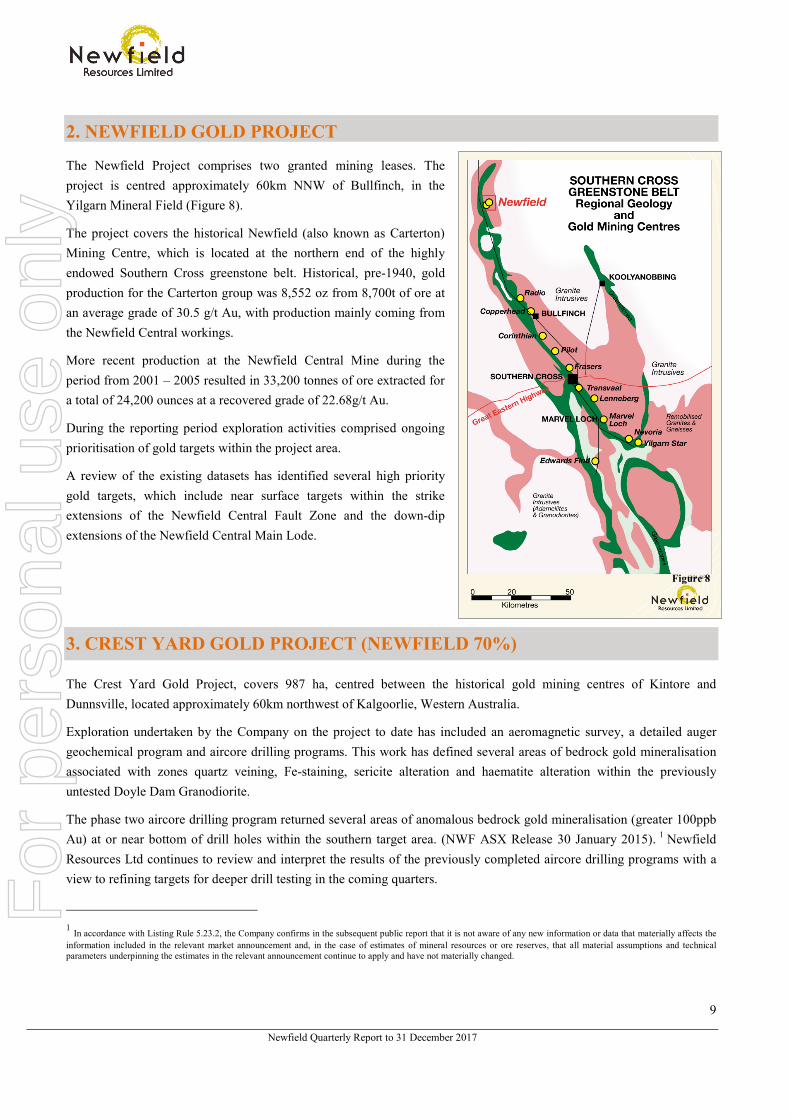
Figure 8
2. NEWFIELD GOLD PROJECT
The Newfield Project comprises two granted mining leases. The project is centred approximately 60km NNW of Bullfinch, in the Yilgarn Mineral Field (Figure 8).
The project covers the historical Newfield (also known as Carterton) Mining Centre, which is located at the northern end of the highly endowed Southern Cross greenstone belt. Historical, pre-1940, gold production for the Carterton group was 8,552 oz from 8,700t of ore at an average grade of 30.5 g/t Au, with production mainly coming from the Newfield Central workings.
More recent production at the Newfield Central Mine during the period from 2001 – 2005 resulted in 33,200 tonnes of ore extracted for a total of 24,200 ounces at a recovered grade of 22.68g/t Au.
During the reporting period exploration activities comprised ongoing prioritisation of gold targets within the project area.
A review of the existing datasets has identified several high priority gold targets, which include near surface targets within the strike extensions of the Newfield Central Fault Zone and the down-dip extensions of the Newfield Central Main Lode.
3. CREST YARD GOLD PROJECT (NEWFIELD 70%)
The Crest Yard Gold Project, covers 987 ha, centred between the historical gold mining centres of Kintore and Dunnsville, located approximately 60km northwest of Kalgoorlie, Western Australia.
Exploration undertaken by the Company on the project to date has included an aeromagnetic survey, a detailed auger geochemical program and aircore drilling programs. This work has defined several areas of bedrock gold mineralisation associated with zones quartz veining, Fe-staining, sericite alteration and haematite alteration within the previously untested Doyle Dam Granodiorite.
The phase two aircore drilling program returned several areas of anomalous bedrock gold mineralisation (greater 100ppb Au) at or near bottom of drill holes within the southern target area. (NWF ASX Release 30 January 2015). 1 Newfield Resources Ltd continues to review and interpret the results of the previously completed aircore drilling programs with a view to refining targets for deeper drill testing in the coming quarters.
1 In accordance with Listing Rule 5.23.2, the Company confirms in the subsequent public report that it is not aware of any new information or data that materially affects the information included in the relevant market announcement and, in the case of estimates of mineral resources or ore reserves, that all material assumptions and technical parameters underpinning the estimates in the relevant announcement continue to apply and have not materially changed.
For
per
sona
l use
onl
y

10
Newfield Quarterly Report to 31 December 2017
COMPETENT PERSON’S STATEMENT-GOLD
The information in this report that relates to Exploration Results, Mineral Resources or Ore Reserves on the Newfield and Crest Yard
Gold Projects is based on information compiled by Mr Bryan Alexander who is a member of the Australasian Institute of Mining and
Metallurgy. Mr Alexander is a director of Archaean Exploration Services Pty Ltd, a company which consults to Newfield Resources
Ltd. Mr Alexander has sufficient experience which is relevant to the style of the mineralisation and type of deposit under consideration
and to the activity which he is undertaking, to qualify as a Competent Person as defined in the 2012 Edition of the “Australasian Code
for Reporting of Exploration Results, Mineral Resources and Ore Reserves”. Mr Alexander consents to the inclusion in this ASX
Release of this information in the form and context in which it appears.
For
per
sona
l use
onl
y
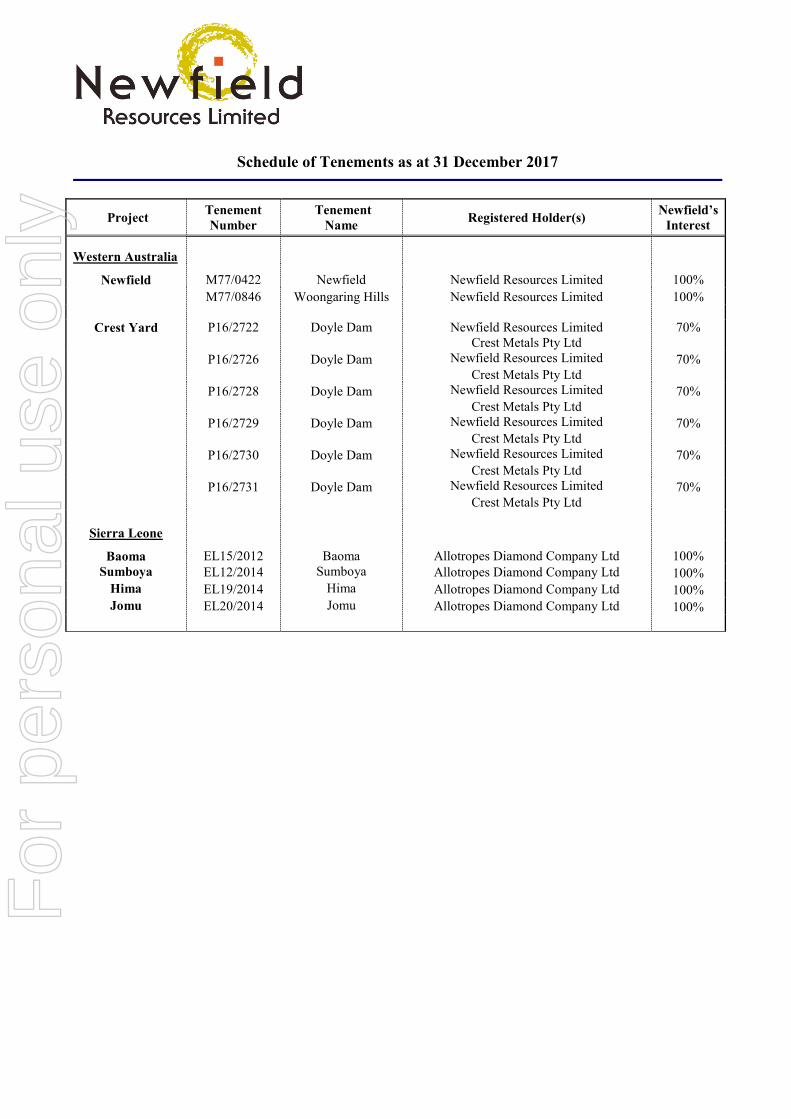
Schedule of Tenements as at 31 December 2017
Project Tenement Number
Tenement Name Registered Holder(s) Newfield’s
Interest
Western Australia
Newfield M77/0422 Newfield Newfield Resources Limited 100% M77/0846 Woongaring Hills Newfield Resources Limited 100%
Crest Yard P16/2722 Doyle Dam Newfield Resources Limited Crest Metals Pty Ltd
70%
P16/2726 Doyle Dam Newfield Resources Limited Crest Metals Pty Ltd
70%
P16/2728 Doyle Dam Newfield Resources Limited Crest Metals Pty Ltd
70%
P16/2729 Doyle Dam Newfield Resources Limited Crest Metals Pty Ltd
70%
P16/2730 Doyle Dam Newfield Resources Limited Crest Metals Pty Ltd
70%
P16/2731 Doyle Dam Newfield Resources Limited Crest Metals Pty Ltd
70%
Sierra Leone
Baoma EL15/2012 Baoma Allotropes Diamond Company Ltd 100% Sumboya EL12/2014 Sumboya Allotropes Diamond Company Ltd 100%
Hima EL19/2014 Hima Allotropes Diamond Company Ltd 100% Jomu EL20/2014 Jomu Allotropes Diamond Company Ltd 100%
For
per
sona
l use
onl
y

Appendix 5B Mining exploration entity and oil and gas exploration entity quarterly report
+ See chapter 19 for defined terms 1 September 2016 Page 1
+Rule 5.5
Appendix 5B
Mining exploration entity and oil and gas exploration entity quarterly report
Introduced 01/07/96 Origin Appendix 8 Amended 01/07/97, 01/07/98, 30/09/01, 01/06/10, 17/12/10, 01/05/13, 01/09/16
Name of entity
Newfield Resources Limited
ABN Quarter ended (“current quarter”)
98 153 219 848 31 December 2017
Consolidated statement of cash flows Current quarter $A’000
Year to date (6 months)
$A’000
1. Cash flows from operating activities 320 619 1.1 Receipts from customers
1.2 Payments for
(475) (1,265) (a) exploration & evaluation
(b) development - -
(c) production - -
(d) staff costs (581) (1,280)
(e) administration and corporate costs (86) (220)
1.3 Dividends received (see note 3) - -
1.4 Interest received - 1
1.5 Interest and other costs of finance paid - (1)
1.6 Income taxes paid - -
1.7 Research and development refunds - -
1.8 Other (provide details if material) - 71
1.9 Net cash from / (used in) operating activities (822) (2,075)
2. Cash flows from investing activities
-
2.1 Payments to acquire:
(a) property, plant and equipment
(b) tenements (see item 10) - -
(c) investments - -
(d) other non-current assets - -
For
per
sona
l use
onl
y
Appendix 5B Mining exploration entity and oil and gas exploration entity quarterly report
+ See chapter 19 for defined terms 1 September 2016 Page 2
Consolidated statement of cash flows Current quarter $A’000
Year to date (6 months)
$A’000
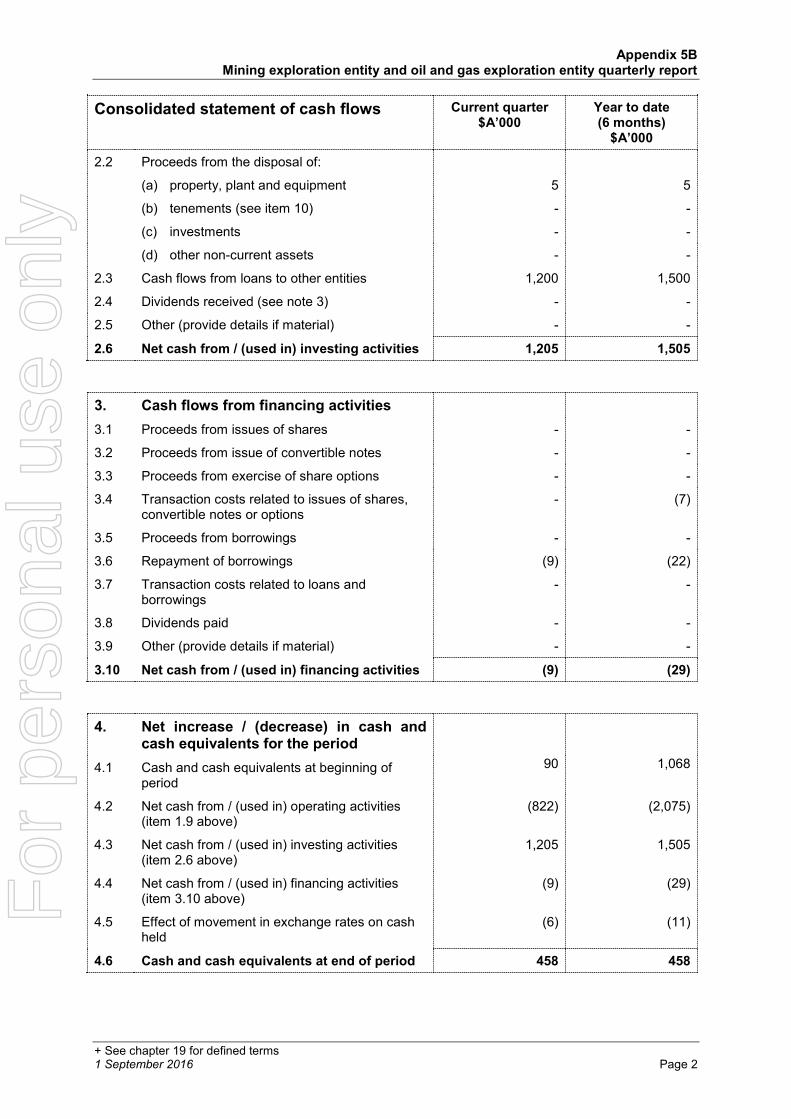
2.2 Proceeds from the disposal of:
5 5 (a) property, plant and equipment
(b) tenements (see item 10) - -
(c) investments - -
(d) other non-current assets - -
2.3 Cash flows from loans to other entities 1,200 1,500
2.4 Dividends received (see note 3) - -
2.5 Other (provide details if material) - -
2.6 Net cash from / (used in) investing activities 1,205 1,505
3. Cash flows from financing activities - - 3.1 Proceeds from issues of shares
3.2 Proceeds from issue of convertible notes - -
3.3 Proceeds from exercise of share options - -
3.4 Transaction costs related to issues of shares, convertible notes or options
- (7)
3.5 Proceeds from borrowings - -
3.6 Repayment of borrowings (9) (22)
3.7 Transaction costs related to loans and borrowings
- -
3.8 Dividends paid - -
3.9 Other (provide details if material) - -
3.10 Net cash from / (used in) financing activities (9) (29)
4. Net increase / (decrease) in cash and cash equivalents for the period
90
1,068
4.1 Cash and cash equivalents at beginning of period
4.2 Net cash from / (used in) operating activities (item 1.9 above)
(822) (2,075)
4.3 Net cash from / (used in) investing activities (item 2.6 above)
1,205 1,505
4.4 Net cash from / (used in) financing activities (item 3.10 above)
(9) (29)
4.5 Effect of movement in exchange rates on cash held
(6) (11)
4.6 Cash and cash equivalents at end of period 458 458
For
per
sona
l use
onl
y

Appendix 5B Mining exploration entity and oil and gas exploration entity quarterly report
+ See chapter 19 for defined terms 1 September 2016 Page 3
5. Reconciliation of cash and cash equivalents at the end of the quarter (as shown in the consolidated statement of cash flows) to the related items in the accounts
Current quarter $A’000
Previous quarter $A’000
5.1 Bank balances 458 90
5.2 Call deposits - -
5.3 Bank overdrafts - -
5.4 Other (provide details) - -
5.5 Cash and cash equivalents at end of quarter (should equal item 4.6 above)
458 90
6. Payments to directors of the entity and their associates Current quarter $A'000
6.1 Aggregate amount of payments to these parties included in item 1.2 (70)
6.2 Aggregate amount of cash flow from loans to these parties included in item 2.3
-
6.3 Include below any explanation necessary to understand the transactions included in items 6.1 and 6.2
Directors’ remuneration (65)
Professional services (5)
7. Payments to related entities of the entity and their associates
Current quarter $A'000
7.1 Aggregate amount of payments to these parties included in item 1.2 -
7.2 Aggregate amount of cash flow from loans to these parties included in item 2.3
-
7.3 Include below any explanation necessary to understand the transactions included in items 7.1 and 7.2
N/A
For
per
sona
l use
onl
y

Appendix 5B Mining exploration entity and oil and gas exploration entity quarterly report
+ See chapter 19 for defined terms 1 September 2016 Page 4
8. Financing facilities available Add notes as necessary for an understanding of the position
Total facility amount at quarter end
$A’000
Amount drawn at quarter end
$A’000
8.1 Loan facilities - -
8.2 Credit standby arrangements - -
8.3 Other (please specify) - -
8.4 Include below a description of each facility above, including the lender, interest rate and whether it is secured or unsecured. If any additional facilities have been entered into or are proposed to be entered into after quarter end, include details of those facilities as well.
N/A
9. Estimated cash outflows for next quarter $A’000
9.1 Exploration and evaluation (950)
9.2 Development -
9.3 Production -
9.4 Staff costs (670)
9.5 Administration and corporate costs (210)
9.6 Other (provide details if material) -
9.7 Total estimated cash outflows (1,830)
10. Changes in tenements (items 2.1(b) and 2.2(b) above)
Tenement reference and location
Nature of interest
Interest at beginning of quarter
Interest at end of quarter
10.1 Interests in mining tenements and petroleum tenements lapsed, relinquished or reduced
N/A
10.2 Interests in mining tenements and petroleum tenements acquired or increased
N/A
For
per
sona
l use
onl
y
Appendix 5B Mining exploration entity and oil and gas exploration entity quarterly report
+ See chapter 19 for defined terms 1 September 2016 Page 5
Compliance statement
1 This statement has been prepared in accordance with accounting standards and policies which comply with Listing Rule 19.11A.
2 This statement gives a true and fair view of the matters disclosed.
Sign here: ............................................................ Date: 30 January 2018 (Company secretary)
Print name: Kim Hogg
Notes
1. The quarterly report provides a basis for informing the market how the entity’s activities have been financed for the past quarter and the effect on its cash position. An entity that wishes to disclose additional information is encouraged to do so, in a note or notes included in or attached to this report.
2. If this quarterly report has been prepared in accordance with Australian Accounting Standards, the definitions in, and provisions of, AASB 6: Exploration for and Evaluation of Mineral Resources and AASB 107: Statement of Cash Flows apply to this report. If this quarterly report has been prepared in accordance with other accounting standards agreed by ASX pursuant to Listing Rule 19.11A, the corresponding equivalent standards apply to this report.
3. Dividends received may be classified either as cash flows from operating activities or cash flows from investing activities, depending on the accounting policy of the entity.
For
per
sona
l use
onl
y