Embed Size (px)
Citation preview

SEATTLE | 206.622.3700 LOS ANGELES | 310.297.1777 www.wurts.com
QUARTERLY RESEARCH REPORT
March 2012
Wurts & Associates
T A B L E O F C O N T E N T S
2
Report Overview Page 3
Macroeconomics Page 8
Capital Markets Page 27
Appendix Page 35

R E P O R T O V E R V I E W
3
R E P O R T O V E R V I E W
4
As the year began, “experts” forecasted real U.S. economic growth of2%, shrinking growth in Europe, and growth of 4% within emergingmarket economies. At that time, expectations for global and USeconomic growth were so subdued that any good news would,undoubtedly, surprise investors and spark a rally in capital markets. As itturns out, this is exactly what happened. Positive news aboutemployment growth in the U.S., short‐term solutions to Europe’ssovereign debt and banking crisis, and action on behalf of world’scentral banks raised hopes that economic recovery would be self‐sustaining. Subsequently, this led to renewed spending by consumersand businesses and increased risk‐taking by investors. The S&P 500Index gained 12.6% while non‐US Developed Market and EmergingMarket equities rallied 11.0% and 14.1% during the first quarter.Investment grade corporate credit also benefited from increasingconfidence with U.S. credit spreads tightening by 60 basis points.
Global equities appear cheap when looking at forecasted earnings, butless so when; (1) the risks to future earnings are considered and (2)against long‐term “normalized” measures of earnings over an entirebusiness cycle. US, European and Emerging Market equities are tradingat 11.8, 10.2 and 9.4 times 2012 forecasted earnings, all well belowtheir 10‐year averages of 14.8, 13.4 and 10.9. But risks abound toearnings. Examining stocks using the long‐term Shiller PE ratio, whichuses normalized earnings rather than forecasted earnings, domesticlarge cap stocks appear slightly rich as its Shiller PE ratio was 22.3compared to its 50 year average of 19.5. Europe and Emerging Marketequities appear more compelling from a valuation perspective, but thesovereign debt crisis is not over and inflation threats in the developingworld could threaten growth.
Domestic credit spreads are trading close to historical averages overtreasuries albeit at a low overall rate. The bottom line is that we remainin a low return environment with valuations that are within reasonable
ranges across asset classes. These valuations exist in a potentiallyvolatile economic environment which could deliver future negativeshocks or reaffirm some of the recent positive economic developments.
Is the party winding down or just getting started?The party in U.S. and global equity markets stretched well into the NewYear, and has only just recently begun to cool. As at every party, atsome point in the evening, the event begins to lose some of its energyand guests begin to tire. Partygoers may look around skeptically andask, is there some life left here, or is it time to leave? So the questionwe have to ask ourselves is, how much life is left in this party?
There is a natural human tendency to believe that what is true today(e.g. rising employment) will be true tomorrow. However, one does nothave to go back very far to see how trends can be short‐lived and themarket’s reaction swift and unkind. In the U.S., both 2010 and 2011began with optimism about growth that led to strong market rallies onlyto be followed by economic disappointment and market sell‐offs. As weenter the second quarter, investors must ask themselves if recentindicators suggest there is still room for economic and earnings growth,and thus a rise in asset prices. Or has economic growth peaked, a factnot yet recognized by the market and not yet reflected in market values.Asked another way, what unanticipated events, issues or marketexcesses might arise to slow growth and hurt asset prices?
Global Growth Dependent on Global Monetary PolicyThe U.S. recovery and Europe’s avoidance of a sovereign debt andbanking meltdown owes credit to the world’s central bankers. The Fed,the Bank of England, the European Central Bank (ECB) and the Bank ofJapan combined, grew assets from $3.5 trillion five years ago, to over $9trillion today. During that period of easing, developed market GDP roseby 2%, on average, while equity markets rose by 10%. It’s clear thatmarkets have come to depend on central bank generosity. When
R E P O R T O V E R V I E W
5
central banks took a breather, developed economy GDP growth turnednegative and equity markets fell by over 5%. Recently, when the Fedannounced that it would undertake additional easing only “if theeconomy lost momentum or if inflation fell below 2%,” the S&P 500Index immediately lost several percent of its value.
At the same time, the Fed committed to low rates through 2014 on thebelief that without an expansionary monetary policy, global growth islikely to be anemic. One Fed policy maker summed it up best: “Whilethe Fed may not move to provide more stimulus, it is nowhere nearclose to beginning to remove it.” This suggests that the Fed sees theglobal economy at an inflection point, where signs of self‐growth areappearing, but too slowly to take away the support that was previouslygiven. We are left to conclude that while there is some evidence of aself‐sustaining recovery, any removal of global monetary stimulus willlikely lead to a substantial slowdown in growth. Moreover, as we havecommented in past Quarterly Research Reports, higher interest rateswould meaningfully harm both private and public fiscal health given therelatively high leverage still within our system.
US Recovery and the Virtuous Deleveraging CycleOptimism about the pace of U.S. growth rests on the strength of recentjob growth, but also on the belief that a virtuous cycle of self‐sustaininggrowth is finally taking hold. We have seen some evidence to supportthis story. Banks, after three years of monetary policy‐supportedrestructuring of their balance sheets, are beginning to relax creditstandards and lend more freely. On the other side of the equation,households and businesses are showing the willingness to borrow more.These households are willing to borrow against future income to financecurrent consumption because of an improving job market and risingwealth. Corporate demand for loans continues to rise due to confidencein orders, as well as having to face the fact that capital investment haslagged capital depreciation since 2008.
What could derail the U.S. recovery? A lot; but more specifically (1)disappointing employment growth, and (2) the drag on demand fromlikely changes to US fiscal policy.
Much of U.S. optimism is based on evidence of rising employment andthat this trend is sustainable. What most fail to recognize is that,historically, employment growth tends to weaken as the year proceeds.In the last recession, employment fell by much more than output, withrising productivity making up the difference. Two years of uncertaintieskept employers on the sidelines and it can be argued that they areplaying catch up in their hiring decisions today. At some point though,hiring decisions will need to be based on demand. The continued needto delever in the developed world and the slower growth the emergingmarkets are experiencing will continue to be a drag on overall demandand thus, employment.
It is apparent that Europe’s need to reduce government spending andraise taxes will drive the EU into recession. Unfortunately, the U.S. mayvery well be in a similar position. On January 1, 2013 absent new law,the pay‐roll tax cut and the Bush‐era tax law expire while the automaticfederal spending sequesters become effective. It is estimated that thedrag on GDP from these three changes alone could be as high as 3.5% in2013! Just like we experienced last year with the debate over the debtceiling, government indecision surrounding our fiscal challenges couldthreaten our weak recovery. Given that 2012 is an election year,inaction coupled with sharper rhetoric could easily harm consumerconfidence and market sentiment. Regardless, we believe the evidenceis clear that strong private sector growth is unlikely to be large enoughin 2013 to overcome a 3.5% fiscal drag. This could well push oureconomy back into a recession.
Europe: Recession appears inevitable; what about another marketcrisis?Europe’s solutions to its sovereign debt and banking crisis led to a rally

R E P O R T O V E R V I E W
6
in its equity and bond markets, and up until now, markets have beencontent to view Europe’s problems as the reason behind it. Thesesolutions included a restructuring of Greek debt, the creation of a largerbailout facility, an agreement by the EU nations to reduce theirborrowing needs, and finally, the ECB’s provision of low cost, long‐termfinancing to European banks which eased funding pressures and assuredthe markets of their liquidity. There was even hope that the banklending program might help Europe stave off a recession by giving banksthe ability to lend to households and businesses.
The euphoria is beginning to wane, as it is realized that the recent policyinitiatives provided only short‐term liquidity fixes and that many fiscalreforms are still needed. Spanish borrowing costs are beginning to riseagain, there is talk of Portugal needing a Greece‐like debt restructuringand many are predicting Greece will need more assistance in the comingyear.
Markets have long anticipated a weak European economy, but thedanger to world growth is the return of market volatility around therenewed possibility of sovereign default or bank failure. There are manyreasons this might occur, but the two most likely are; (1) a failure toenact additional needed reforms, and (2) a failure to bring downsovereign borrowing needs.
The first concern is based on fatigue by the policymakers and citizens ofall impacted nations. As short‐term funding pressures have subsided,concern shifted to the willingness of governments to push throughunpopular reforms, particularly with elections coming up in a number ofcountries. If reforms are not enacted, the time that has been bought willbe wasted, and when the crisis reappears, policymakers will not havethe tools to fight it.
The second concern is that European policymakers appear to be caughtin a “catch‐22” where the austerity measures promised to assure
markets that future debt growth would be under control will in factlead to slower economic growth and lower tax revenues, resulting inlarger than anticipated deficits and borrowing needs. This problem iscompounded by requirements that banks reduce their debt, which willhave the effect of reducing lending and private sector borrowing,thereby further constraining private sector GDP. These events will likelyrattle world markets and the world will look much like it did in the latesummer of 2011 when uncertainty led markets to sell off and economicgrowth softened.
Emerging MarketsThe emerging markets, particularly China, are widely viewed as theengine of global growth, and while they will be in the long‐run, it is notclear if they can be today. While it is the possibility of deflation thatkeeps Bernanke awake at night, in China and other emerging markets, itis inflation that worries policymakers as food and energy are a majorportion of each household’s budget. China began to ease policy as signsof inflation abated, but housing and construction, which make up aquarter of the economy, are likely to be slow to recover. Many analystssuggest an acceleration of Chinese growth is only a matter of time.Others take note of the “inverted” Chinese yield curve where long ratesare lower than short rates, and see it as a sign of weak future growth.
The threat to global growth from China is an unexpected event thatreduces growth below expectations. Last year, “experts” focused on thespeculation in the Chinese housing market as a bubble that mightburst; it appears that Chinese policy makers were successful in takingthe air out of that balloon without taking the entire economy with it.
What issue threatens Chinese growth today? Most notably, it iscorporate profitability ‐ a sharp decline of which would signal a slow‐down in investment. What threatens the profitability of Chinesecompanies? Two possible explanations include (1) structural over‐capacity in the industrial sector and (2) rising commodity prices.
R E P O R T O V E R V I E W
7
Capital investment makes up over 50% of Chinese GDP, andconsumption barely 30%. The result is production capacity grew fasterthan demand and reduced profitability of Chinese companies. China’ssuccess at growing made it the world’s largest importer of commodities;China now spends 7% of its GDP on imported commodities. The upwardpressure on commodities prices from Chinese growth has cut intoChinese profit margins and is a potential threat to its growth.Interestingly, Chinese growth acts as a self‐correcting mechanism; whenit slows, commodity prices fall, raising Chinese corporate profits andstimulating growth.
SummaryIn assessing the evidence, we are left to conclude that, thougheconomic growth seems to be on firmer footing than earlier in therecovery, our views have not substantially changed from last quarter.While global economic growth appears to be accelerating, any removalof global monetary stimulus will lead to a substantial slowdown. Growthis also likely to remain subdued compared to historical growth rates as anumber of headwinds lay unavoidably ahead. Specifically, these includecontinued fiscal tightening in the US, deleveraging, continued financialmarket instability in Europe and rising prices in the emerging markets.

M A C R O E C O N O M I C S
8
M A C R O E C O N O M I C O V E R V I E W
9
Global Developed economies and financial markets have been dependent upon quantitative easing (QE). The Federal Reserve (Fed) and European Central Bank (ECB) target inflation rate is set at 2%; rising inflation will force
policymakers to raise interest rates. Higher oil prices, having pushed inflation above the targets, have been a function of speculation, not increased demand.
US The US economy is no longer on life support, but it is far from strong. The labor market is showing signs of strength, but it is selective by industry and job type. The ability of the US economy to enter into a virtuous cycle is currently dependent upon high income earners whose
unemployment rates and wealth levels have recovered for higher levels of consumption.
Europe The celebration of a debt crisis solution will be short lived. The economic impact of the banking crisis has not been equal among nations; the German economy shows signs of life while
peripheral nations are on life support.
Emerging Markets China’s growth has slowed, but remains fairly strong relative to developed nations. In 2011, Brazilian growth slowed in response to tighter central bank policy, but this policy has turned accommodative and
should lead to balanced growth.
M A C R O E C O N O M I C O V E R V I E W
10
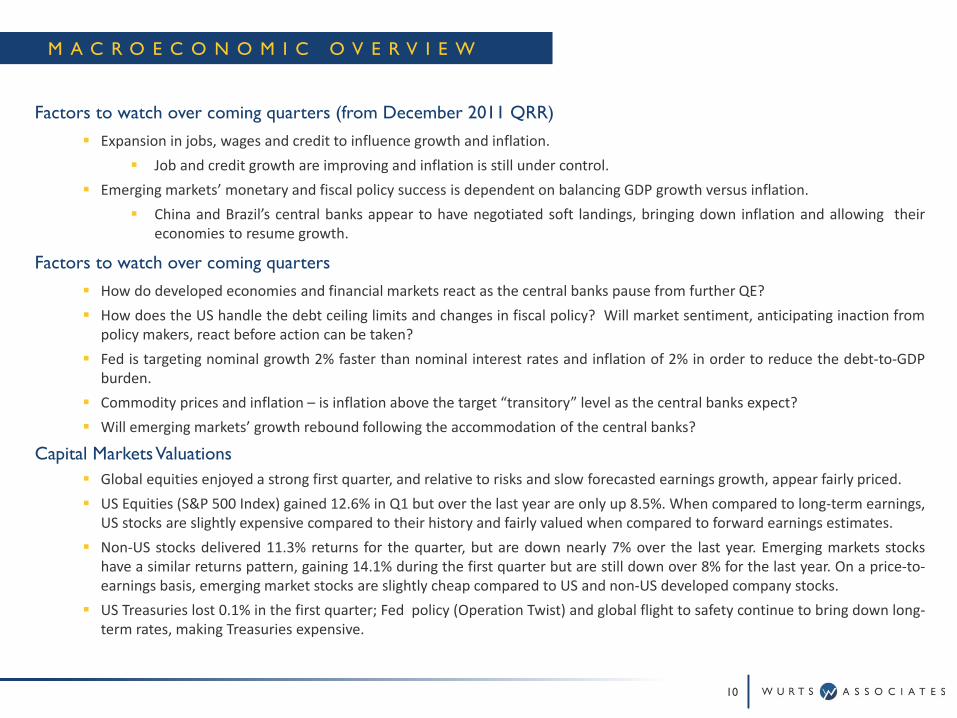
Factors to watch over coming quarters (from December 2011 QRR) Expansion in jobs, wages and credit to influence growth and inflation.
Job and credit growth are improving and inflation is still under control. Emerging markets’ monetary and fiscal policy success is dependent on balancing GDP growth versus inflation.
China and Brazil’s central banks appear to have negotiated soft landings, bringing down inflation and allowing theireconomies to resume growth.
Factors to watch over coming quarters How do developed economies and financial markets react as the central banks pause from further QE? How does the US handle the debt ceiling limits and changes in fiscal policy? Will market sentiment, anticipating inaction from
policy makers, react before action can be taken? Fed is targeting nominal growth 2% faster than nominal interest rates and inflation of 2% in order to reduce the debt‐to‐GDP
burden. Commodity prices and inflation – is inflation above the target “transitory” level as the central banks expect? Will emerging markets’ growth rebound following the accommodation of the central banks?
Capital MarketsValuations Global equities enjoyed a strong first quarter, and relative to risks and slow forecasted earnings growth, appear fairly priced. US Equities (S&P 500 Index) gained 12.6% in Q1 but over the last year are only up 8.5%. When compared to long‐term earnings,
US stocks are slightly expensive compared to their history and fairly valued when compared to forward earnings estimates. Non‐US stocks delivered 11.3% returns for the quarter, but are down nearly 7% over the last year. Emerging markets stocks
have a similar returns pattern, gaining 14.1% during the first quarter but are still down over 8% for the last year. On a price‐to‐earnings basis, emerging market stocks are slightly cheap compared to US and non‐US developed company stocks.
US Treasuries lost 0.1% in the first quarter; Fed policy (Operation Twist) and global flight to safety continue to bring down long‐term rates, making Treasuries expensive.
G L O B A L E C O N O M I C T R E N D S U M M A R Y
11
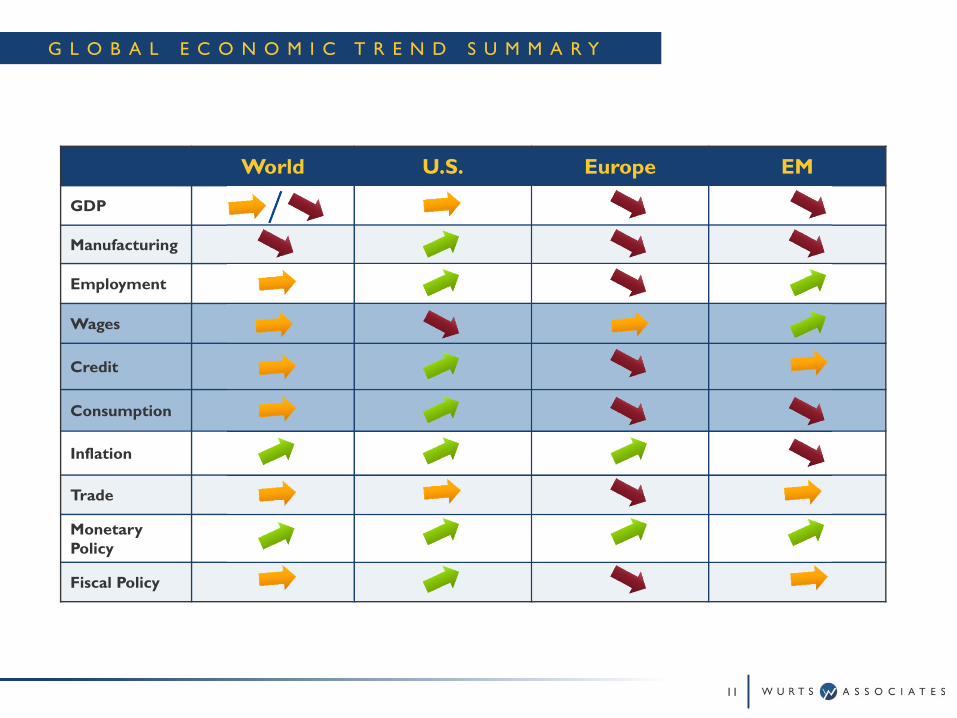
World U.S. Europe EM
GDP
Manufacturing
Employment
Wages
Credit
Consumption
Inflation
Trade
Monetary Policy
Fiscal Policy
G L O B A L E C O N O M I C O V E R V I E W & T R E N D S U M M A R Y
12
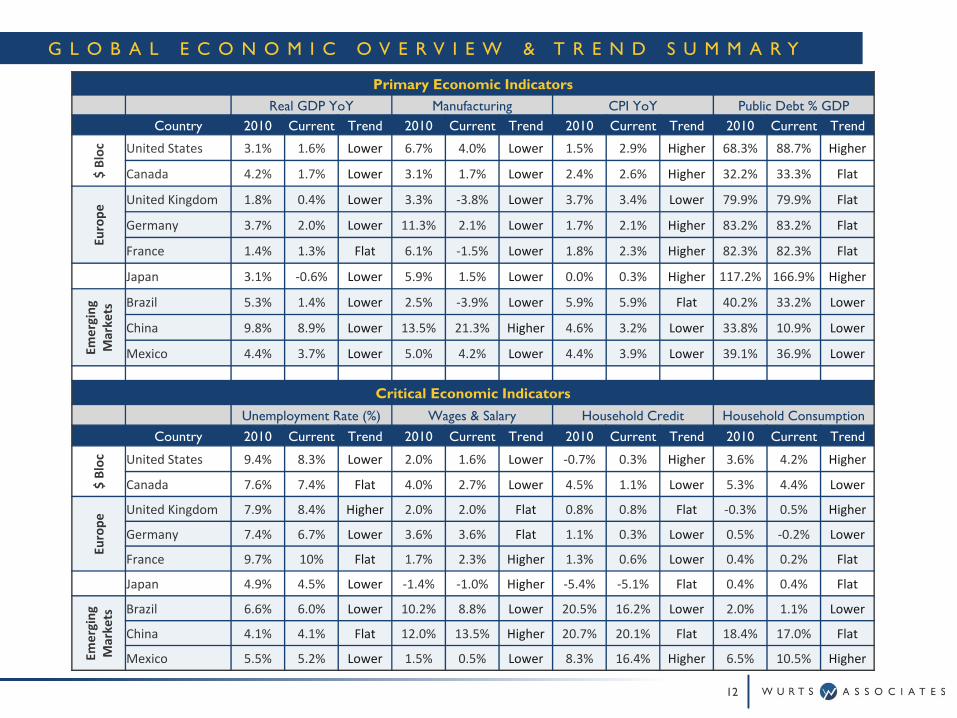
Primary Economic IndicatorsReal GDP YoY Manufacturing CPI YoY Public Debt % GDP
Country 2010 Current Trend 2010 Current Trend 2010 Current Trend 2010 Current Trend
$ Bloc United States 3.1% 1.6% Lower 6.7% 4.0% Lower 1.5% 2.9% Higher 68.3% 88.7% Higher
Canada 4.2% 1.7% Lower 3.1% 1.7% Lower 2.4% 2.6% Higher 32.2% 33.3% Flat
Europe
United Kingdom 1.8% 0.4% Lower 3.3% ‐3.8% Lower 3.7% 3.4% Lower 79.9% 79.9% Flat
Germany 3.7% 2.0% Lower 11.3% 2.1% Lower 1.7% 2.1% Higher 83.2% 83.2% Flat
France 1.4% 1.3% Flat 6.1% ‐1.5% Lower 1.8% 2.3% Higher 82.3% 82.3% Flat
Japan 3.1% ‐0.6% Lower 5.9% 1.5% Lower 0.0% 0.3% Higher 117.2% 166.9% Higher
Emerging
Markets Brazil 5.3% 1.4% Lower 2.5% ‐3.9% Lower 5.9% 5.9% Flat 40.2% 33.2% Lower
China 9.8% 8.9% Lower 13.5% 21.3% Higher 4.6% 3.2% Lower 33.8% 10.9% Lower
Mexico 4.4% 3.7% Lower 5.0% 4.2% Lower 4.4% 3.9% Lower 39.1% 36.9% Lower
Critical Economic IndicatorsUnemployment Rate (%) Wages & Salary Household Credit Household Consumption
Country 2010 Current Trend 2010 Current Trend 2010 Current Trend 2010 Current Trend
$ Bloc United States 9.4% 8.3% Lower 2.0% 1.6% Lower ‐0.7% 0.3% Higher 3.6% 4.2% Higher
Canada 7.6% 7.4% Flat 4.0% 2.7% Lower 4.5% 1.1% Lower 5.3% 4.4% Lower
Europe
United Kingdom 7.9% 8.4% Higher 2.0% 2.0% Flat 0.8% 0.8% Flat ‐0.3% 0.5% Higher
Germany 7.4% 6.7% Lower 3.6% 3.6% Flat 1.1% 0.3% Lower 0.5% ‐0.2% Lower
France 9.7% 10% Flat 1.7% 2.3% Higher 1.3% 0.6% Lower 0.4% 0.2% Flat
Japan 4.9% 4.5% Lower ‐1.4% ‐1.0% Higher ‐5.4% ‐5.1% Flat 0.4% 0.4% Flat
Emerging
Markets Brazil 6.6% 6.0% Lower 10.2% 8.8% Lower 20.5% 16.2% Lower 2.0% 1.1% Lower
China 4.1% 4.1% Flat 12.0% 13.5% Higher 20.7% 20.1% Flat 18.4% 17.0% Flat
Mexico 5.5% 5.2% Lower 1.5% 0.5% Lower 8.3% 16.4% Higher 6.5% 10.5% Higher

M A R K E T S , F U E L E D B Y F E A R A N D O P T I M I S M
13
US & Global Growth fears
End of QE2: US Debt Ceiling DebateGrowing Greek concerns
Euro break‐up fears
LTROEU Agreement on fiscal convergence , bailout facility
US Employment GrowthGreek Debt RestructuringLTRO 2
T H E L A S T Y E A R - A Q E W O R L D
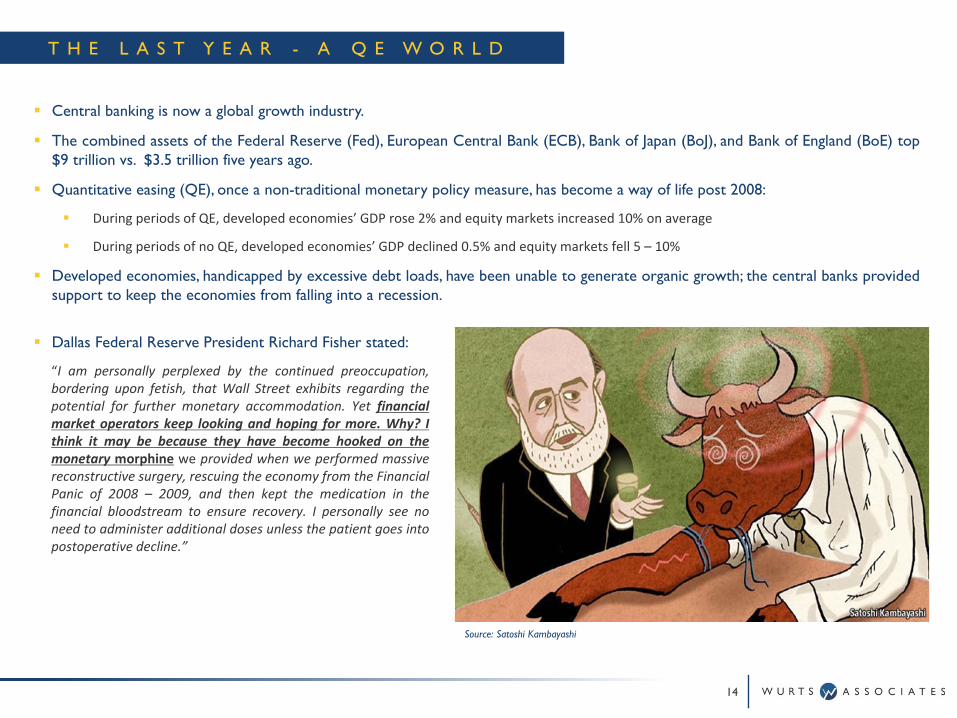
Central banking is now a global growth industry.
The combined assets of the Federal Reserve (Fed), European Central Bank (ECB), Bank of Japan (BoJ), and Bank of England (BoE) top$9 trillion vs. $3.5 trillion five years ago.
Quantitative easing (QE), once a non-traditional monetary policy measure, has become a way of life post 2008:
During periods of QE, developed economies’ GDP rose 2% and equity markets increased 10% on average
During periods of no QE, developed economies’ GDP declined 0.5% and equity markets fell 5 – 10%
Developed economies, handicapped by excessive debt loads, have been unable to generate organic growth; the central banks providedsupport to keep the economies from falling into a recession.
14
Dallas Federal Reserve President Richard Fisher stated:
“I am personally perplexed by the continued preoccupation,bordering upon fetish, that Wall Street exhibits regarding thepotential for further monetary accommodation. Yet financialmarket operators keep looking and hoping for more. Why? Ithink it may be because they have become hooked on themonetary morphine we provided when we performed massivereconstructive surgery, rescuing the economy from the FinancialPanic of 2008 – 2009, and then kept the medication in thefinancial bloodstream to ensure recovery. I personally see noneed to administer additional doses unless the patient goes intopostoperative decline.”
Source: Satoshi Kambayashi
C E N T R A L B A N K I N G – T H E N E W G R O W T H I N D U S T R Y
15
Central Banks Percent of Global GDP
0.0%
1.0%
2.0%
3.0%
4.0%
5.0%
Jan‐05
Jul‐0
5
Jan‐06
Jul‐0
6
Jan‐07
Jul‐0
7
Jan‐08
Jul‐0
8
Jan‐09
Jul‐0
9
Jan‐10
Jul‐1
0
Jan‐11
Jul‐1
1
Jan‐12
Percen
t of G
loba
l GDP
Periods of Monetary Stimulation Federal ReserveECB PBoCBoJ BoE
Sources: Federal Reserve, ECB, Bank of Japan, Bank of England, People’s Bank of China, Bloomberg, Wurts
Phase 1 Phase 2
QE Impact on GDP, Equities, & Spreads
Sources: Bloomberg, Wurts
Russell 3000 & QE Timing
Sources: Federal Reserve, Bloomberg, Wurts
300
400
500
600
700
800
900
Feb‐08
May‐08
Aug‐08
Nov
‐08
Feb‐09
May‐09
Aug‐09
Nov
‐09
Feb‐10
May‐10
Aug‐10
Nov
‐10
Feb‐11
May‐11
Aug‐11
Nov
‐11
Feb‐12
Jackson Hole 2010 (QE2 Proposed)
QE2Approved
QE2 Ended
QE1 Ended
QE1 ProposedQE1 Expanded
QE1 QE2 QE3
‐10%
‐5%
0%
5%
10%
‐30%
‐20%
‐10%
0%
10%
20%
30%
Mar‐05
Jun‐05
Sep‐05
Dec‐05
Mar‐06
Jun‐06
Sep‐06
Dec‐06
Mar‐07
Jun‐07
Sep‐07
Dec‐07
Mar‐08
Jun‐08
Sep‐08
Dec‐08
Mar‐09
Jun‐09
Sep‐09
Dec‐09
Mar‐10
Jun‐10
Sep‐10
Dec‐10
Mar‐11
Jun‐11
Sep‐11
Dec‐11
Quarterly GDP
Quarterly Returns
Periods of Monetary Stimulation Russell 3000 (Left)High Yield (Left) US GDP (Right)
Phase 1 Phase 2
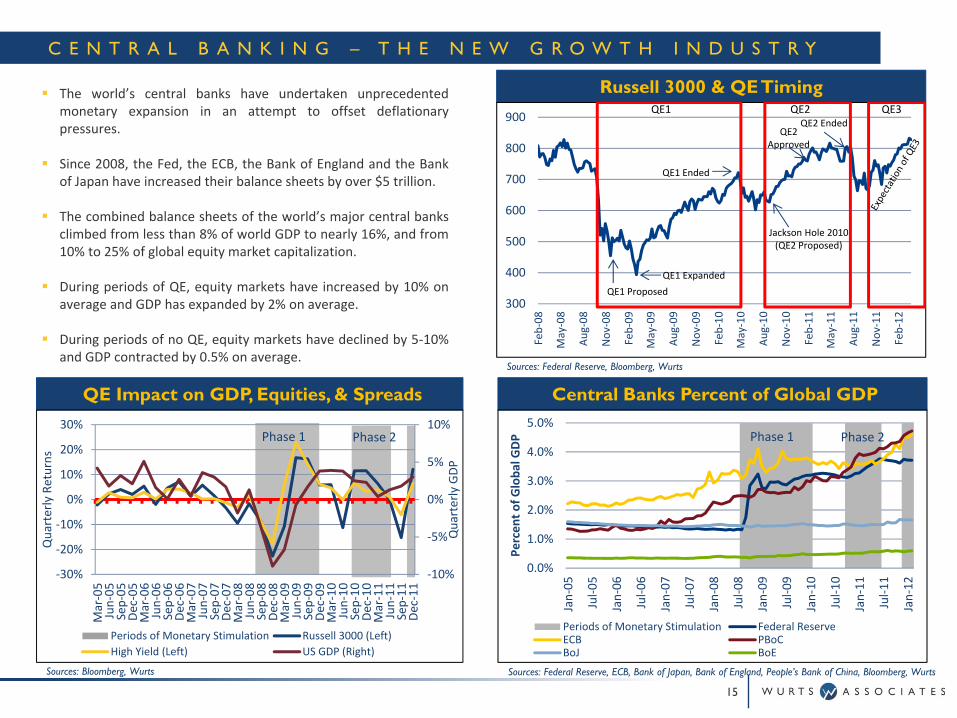
The world’s central banks have undertaken unprecedentedmonetary expansion in an attempt to offset deflationarypressures.
Since 2008, the Fed, the ECB, the Bank of England and the Bankof Japan have increased their balance sheets by over $5 trillion.
The combined balance sheets of the world’s major central banksclimbed from less than 8% of world GDP to nearly 16%, and from10% to 25% of global equity market capitalization.
During periods of QE, equity markets have increased by 10% onaverage and GDP has expanded by 2% on average.
During periods of no QE, equity markets have declined by 5‐10%and GDP contracted by 0.5% on average.
I N F L A T I O N – A L R E A D Y A B O V E T H E S P E E D L I M I T
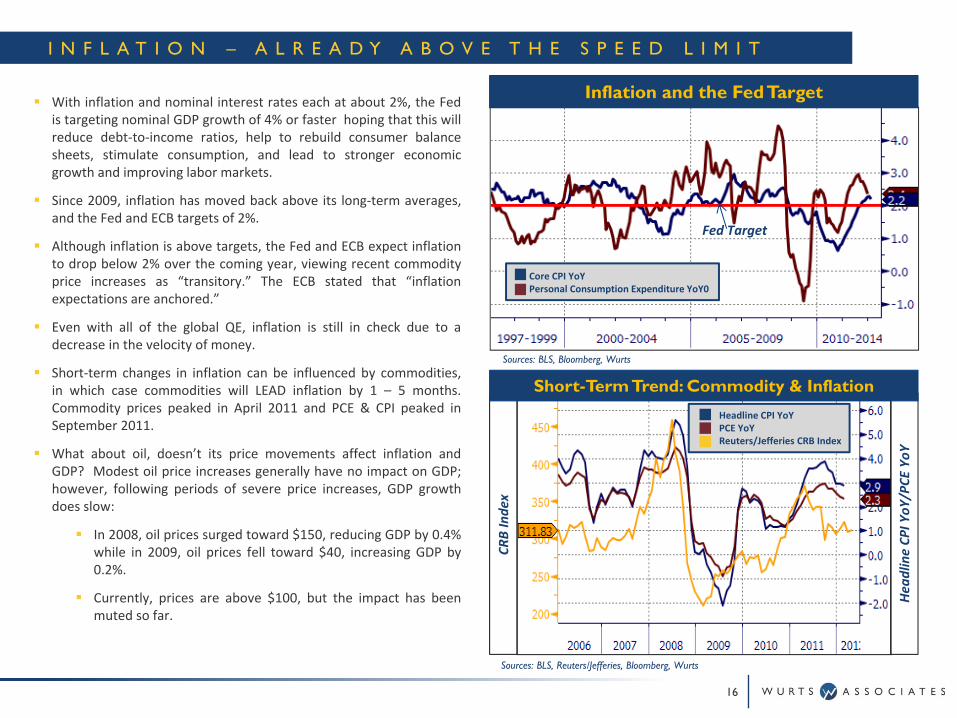
With inflation and nominal interest rates each at about 2%, the Fedis targeting nominal GDP growth of 4% or faster hoping that this willreduce debt‐to‐income ratios, help to rebuild consumer balancesheets, stimulate consumption, and lead to stronger economicgrowth and improving labor markets.
Since 2009, inflation has moved back above its long‐term averages,and the Fed and ECB targets of 2%.
Although inflation is above targets, the Fed and ECB expect inflationto drop below 2% over the coming year, viewing recent commodityprice increases as “transitory.” The ECB stated that “inflationexpectations are anchored.”
Even with all of the global QE, inflation is still in check due to adecrease in the velocity of money.
Short‐term changes in inflation can be influenced by commodities,in which case commodities will LEAD inflation by 1 – 5 months.Commodity prices peaked in April 2011 and PCE & CPI peaked inSeptember 2011.
What about oil, doesn’t its price movements affect inflation andGDP? Modest oil price increases generally have no impact on GDP;however, following periods of severe price increases, GDP growthdoes slow:
In 2008, oil prices surged toward $150, reducing GDP by 0.4%while in 2009, oil prices fell toward $40, increasing GDP by0.2%.
Currently, prices are above $100, but the impact has beenmuted so far.
16
Sources: BLS, Bloomberg, Wurts
Fed Target
Inflation and the Fed Target
Core CPI YoYPersonal Consumption Expenditure YoY0
CRB Inde
x
Hea
dline CP
I YoY
/PCE
YoY
Short-Term Trend: Commodity & InflationHeadline CPI YoYPCE YoYReuters/Jefferies CRB Index
Sources: BLS, Reuters/Jefferies, Bloomberg, Wurts
I N F L A T I O N & O I L – A S P E C U L A T O R ’ S P A R A D I S E
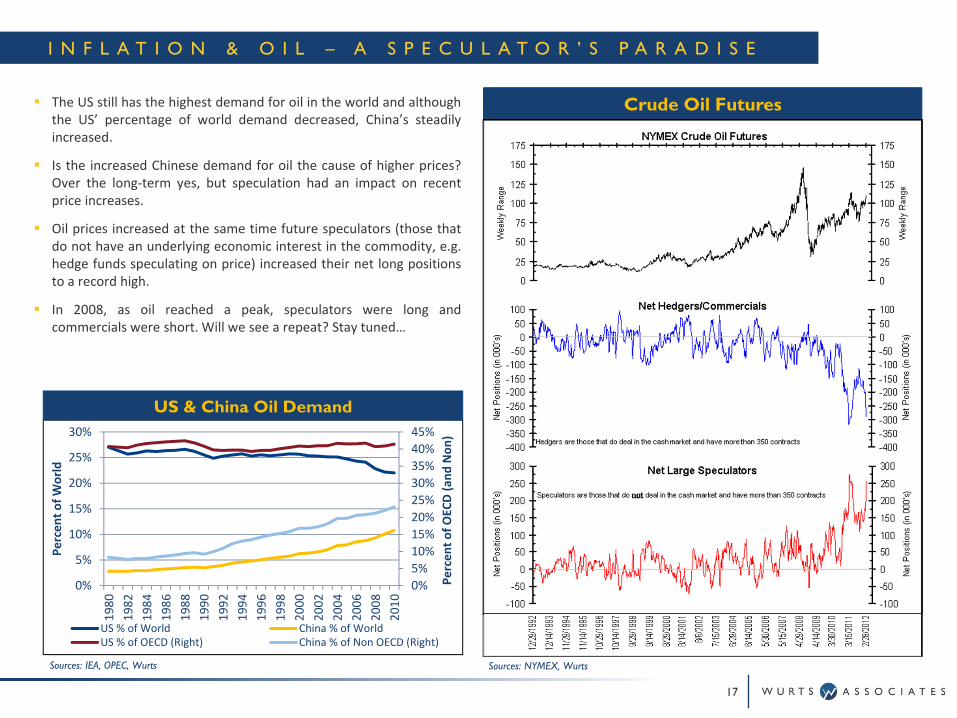
The US still has the highest demand for oil in the world and althoughthe US’ percentage of world demand decreased, China’s steadilyincreased.
Is the increased Chinese demand for oil the cause of higher prices?Over the long‐term yes, but speculation had an impact on recentprice increases.
Oil prices increased at the same time future speculators (those thatdo not have an underlying economic interest in the commodity, e.g.hedge funds speculating on price) increased their net long positionsto a record high.
In 2008, as oil reached a peak, speculators were long andcommercials were short. Will we see a repeat? Stay tuned…
17
Sources: NYMEX, Wurts
Crude Oil Futures
0%5%10%15%20%25%30%35%40%45%
0%
5%
10%
15%
20%
25%
30%
1980
1982
1984
1986
1988
1990
1992
1994
1996
1998
2000
2002
2004
2006
2008
2010
Percen
t of O
ECD (a
nd Non
)
Percen
t of W
orld
US % of World China % of WorldUS % of OECD (Right) China % of Non OECD (Right)
US & China Oil Demand
Sources: IEA, OPEC, Wurts
T H E U S E C O N O M Y , N O L O N G E R O N L I F E S U P P O R T , B U T . . .
18
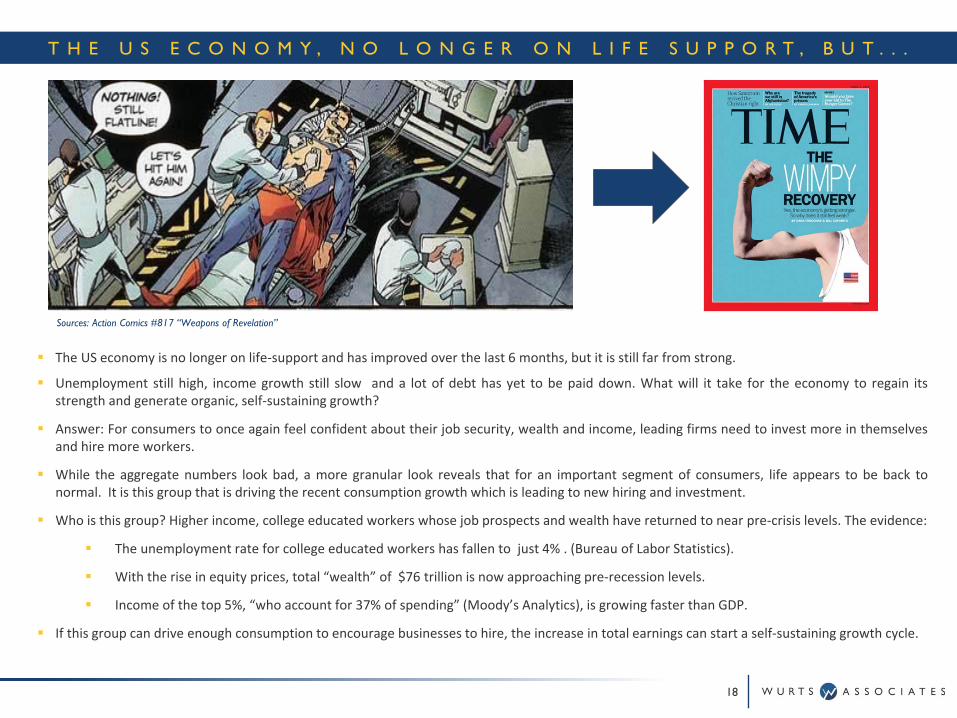
The US economy is no longer on life‐support and has improved over the last 6 months, but it is still far from strong.
Unemployment still high, income growth still slow and a lot of debt has yet to be paid down. What will it take for the economy to regain itsstrength and generate organic, self‐sustaining growth?
Answer: For consumers to once again feel confident about their job security, wealth and income, leading firms need to invest more in themselvesand hire more workers.
While the aggregate numbers look bad, a more granular look reveals that for an important segment of consumers, life appears to be back tonormal. It is this group that is driving the recent consumption growth which is leading to new hiring and investment.
Who is this group? Higher income, college educated workers whose job prospects and wealth have returned to near pre‐crisis levels. The evidence:
The unemployment rate for college educated workers has fallen to just 4% . (Bureau of Labor Statistics).
With the rise in equity prices, total “wealth” of $76 trillion is now approaching pre‐recession levels.
Income of the top 5%, “who account for 37% of spending” (Moody’s Analytics), is growing faster than GDP.
If this group can drive enough consumption to encourage businesses to hire, the increase in total earnings can start a self‐sustaining growth cycle.
Sources: Action Comics #817 “Weapons of Revelation”
U S - T H E R E T U R N O F T H E V I R T U O U S C Y C L E ?
19
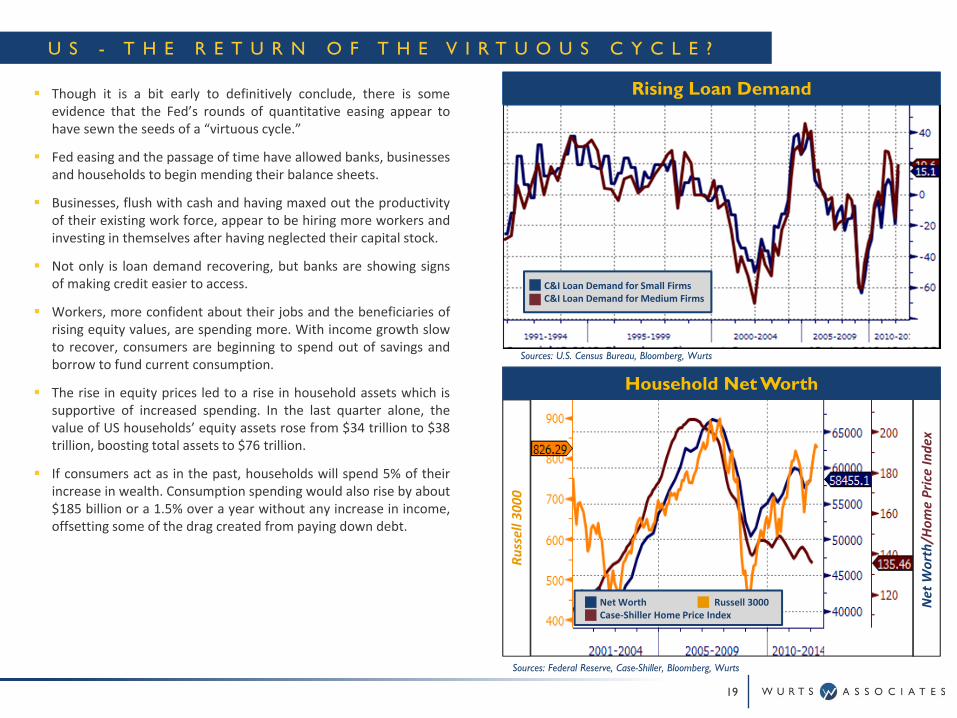
Though it is a bit early to definitively conclude, there is someevidence that the Fed’s rounds of quantitative easing appear tohave sewn the seeds of a “virtuous cycle.”
Fed easing and the passage of time have allowed banks, businessesand households to begin mending their balance sheets.
Businesses, flush with cash and having maxed out the productivityof their existing work force, appear to be hiring more workers andinvesting in themselves after having neglected their capital stock.
Not only is loan demand recovering, but banks are showing signsof making credit easier to access.
Workers, more confident about their jobs and the beneficiaries ofrising equity values, are spending more. With income growth slowto recover, consumers are beginning to spend out of savings andborrow to fund current consumption.
The rise in equity prices led to a rise in household assets which issupportive of increased spending. In the last quarter alone, thevalue of US households’ equity assets rose from $34 trillion to $38trillion, boosting total assets to $76 trillion.
If consumers act as in the past, households will spend 5% of theirincrease in wealth. Consumption spending would also rise by about$185 billion or a 1.5% over a year without any increase in income,offsetting some of the drag created from paying down debt.
Sources: U.S. Census Bureau, Bloomberg, Wurts
Sources: Federal Reserve, Case-Shiller, Bloomberg, Wurts
Russell 300
0
Net W
orth/H
ome Price Inde
x
Net Worth Russell 3000Case‐Shiller Home Price Index
Household Net Worth
Rising Loan Demand
C&I Loan Demand for Small FirmsC&I Loan Demand for Medium Firms
U S – L A B O R M A R K E T , S T I L L I N T H E H O S P I T A L
20
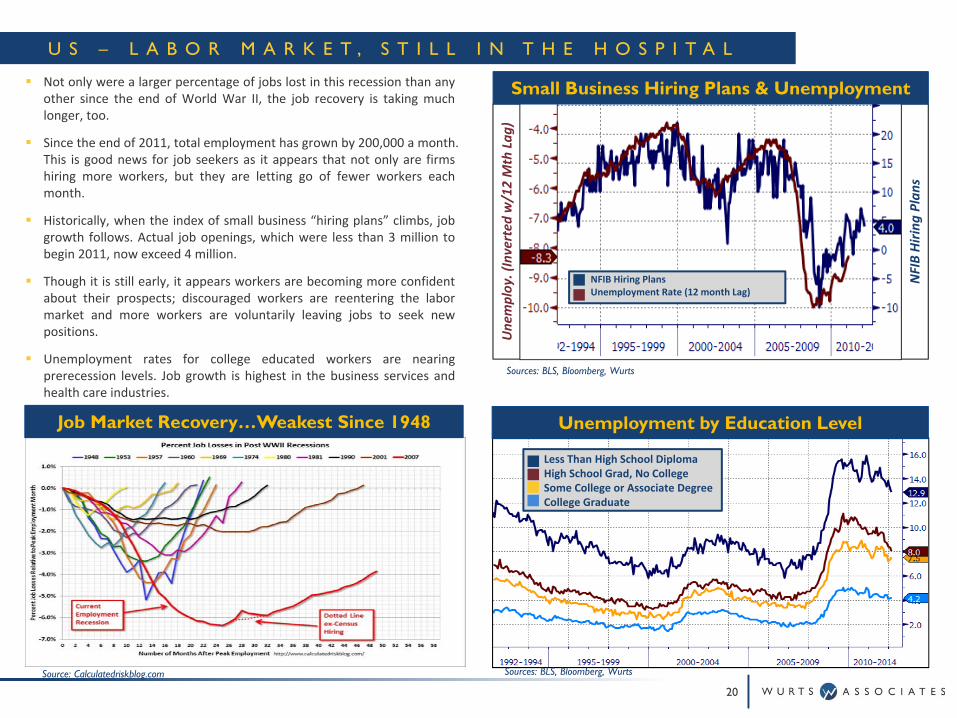
Not only were a larger percentage of jobs lost in this recession than anyother since the end of World War II, the job recovery is taking muchlonger, too.
Since the end of 2011, total employment has grown by 200,000 a month.This is good news for job seekers as it appears that not only are firmshiring more workers, but they are letting go of fewer workers eachmonth.
Historically, when the index of small business “hiring plans” climbs, jobgrowth follows. Actual job openings, which were less than 3 million tobegin 2011, now exceed 4 million.
Though it is still early, it appears workers are becoming more confidentabout their prospects; discouraged workers are reentering the labormarket and more workers are voluntarily leaving jobs to seek newpositions.
Unemployment rates for college educated workers are nearingprerecession levels. Job growth is highest in the business services andhealth care industries.
Sources: BLS, Bloomberg, Wurts
NFIB Hiring
Plans
Une
mploy. (Inverted
w/12 Mth
Lag)
Small Business Hiring Plans & Unemployment
Sources: BLS, Bloomberg, Wurts
NFIB Hiring PlansUnemployment Rate (12 month Lag)
Unemployment by Education Level
Less Than High School DiplomaHigh School Grad, No CollegeSome College or Associate DegreeCollege Graduate
Job Market Recovery…Weakest Since 1948
Source: Calculatedriskblog.com

U S – H O U S I N G , I N S E A R C H O F A B O T T O M ( A G A I N … )
21
Sources: U.S. Census Bureau, Case-Shiller, Bloomberg, Wurts
Case‐ShillerH
ome Price Inde
x
Hou
sing
Starts
Housing StartsCase-Shiller Home Price
”Experts” keep predicting that housing prices have bottomed, but there are estimates of another 5 million in shadow inventory as a result of foreclosures.
Rising housing starts will do little to help put a floor under prices, but any home construction is additive to economic growth.
U S – F U T U R E H E A D W I N D S ? A P O L T I C A L S T O R M B R E W I N G
22
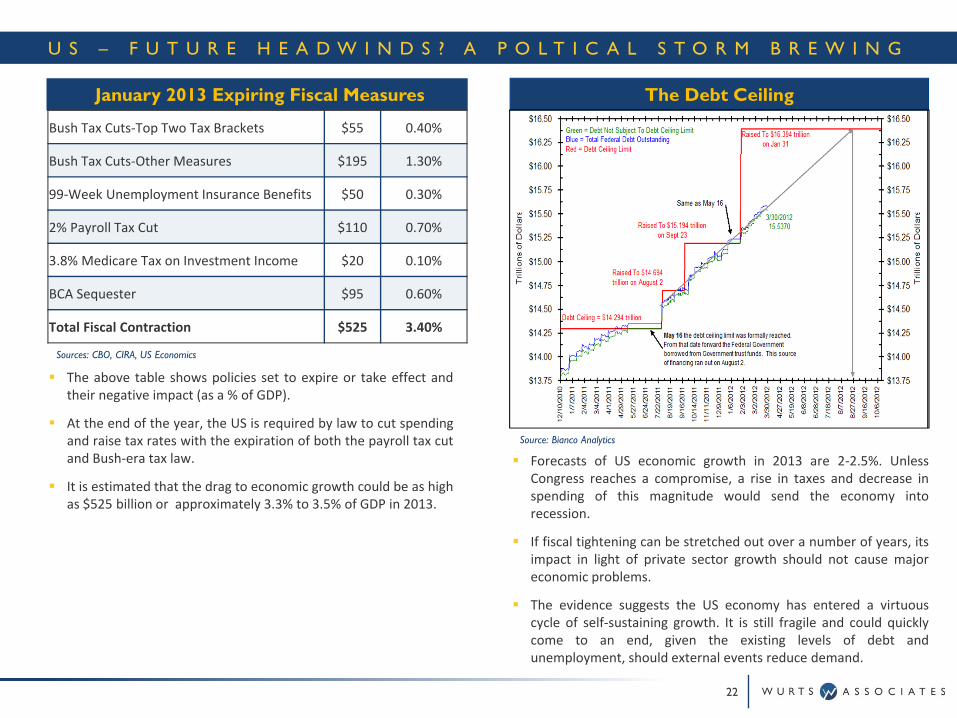
The above table shows policies set to expire or take effect andtheir negative impact (as a % of GDP).
At the end of the year, the US is required by law to cut spendingand raise tax rates with the expiration of both the payroll tax cutand Bush‐era tax law.
It is estimated that the drag to economic growth could be as highas $525 billion or approximately 3.3% to 3.5% of GDP in 2013.
Source: Bianco Analytics
The Debt Ceiling
Forecasts of US economic growth in 2013 are 2‐2.5%. UnlessCongress reaches a compromise, a rise in taxes and decrease inspending of this magnitude would send the economy intorecession.
If fiscal tightening can be stretched out over a number of years, itsimpact in light of private sector growth should not cause majoreconomic problems.
The evidence suggests the US economy has entered a virtuouscycle of self‐sustaining growth. It is still fragile and could quicklycome to an end, given the existing levels of debt andunemployment, should external events reduce demand.
Sources: CBO, CIRA, US Economics
January 2013 Expiring Fiscal Measures
Bush Tax Cuts‐Top Two Tax Brackets $55 0.40%
Bush Tax Cuts‐Other Measures $195 1.30%
99‐Week Unemployment Insurance Benefits $50 0.30%
2% Payroll Tax Cut $110 0.70%
3.8% Medicare Tax on Investment Income $20 0.10%
BCA Sequester $95 0.60%
Total Fiscal Contraction $525 3.40%
E U R O P E – U N S U S T A I N A B L E D E B T –S O V E R E I G N K R Y P T O N I T E
23
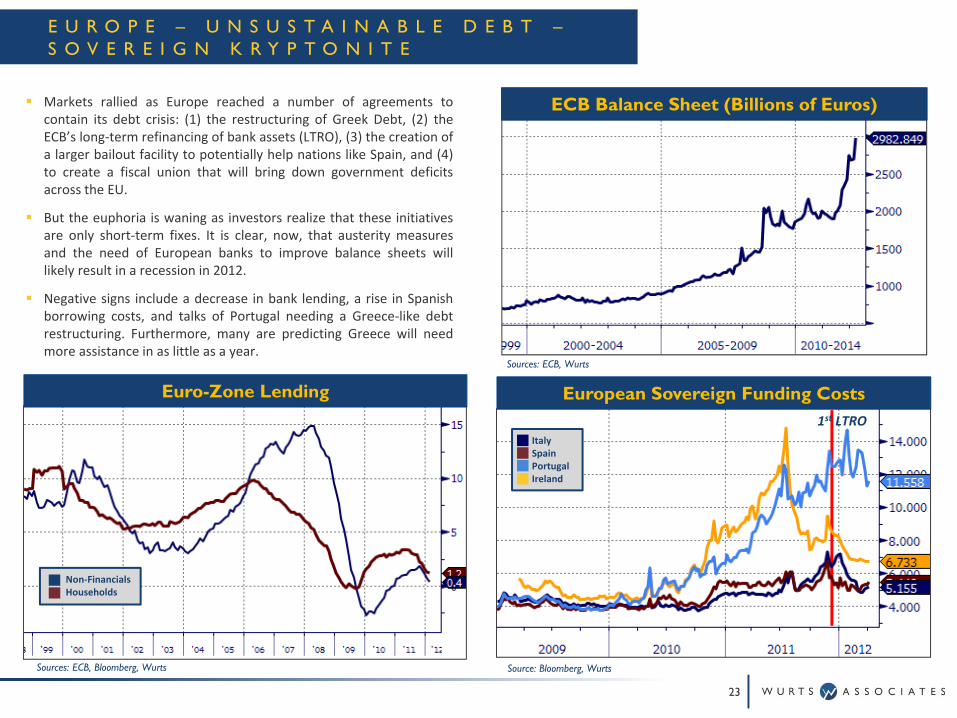
Markets rallied as Europe reached a number of agreements tocontain its debt crisis: (1) the restructuring of Greek Debt, (2) theECB’s long‐term refinancing of bank assets (LTRO), (3) the creation ofa larger bailout facility to potentially help nations like Spain, and (4)to create a fiscal union that will bring down government deficitsacross the EU.
But the euphoria is waning as investors realize that these initiativesare only short‐term fixes. It is clear, now, that austerity measuresand the need of European banks to improve balance sheets willlikely result in a recession in 2012.
Negative signs include a decrease in bank lending, a rise in Spanishborrowing costs, and talks of Portugal needing a Greece‐like debtrestructuring. Furthermore, many are predicting Greece will needmore assistance in as little as a year.
Sources: ECB, Wurts
Source: Bloomberg, Wurts
European Sovereign Funding Costs
ItalySpainPortugalIreland
1st LTRO
Sources: ECB, Bloomberg, Wurts
Non‐FinancialsHouseholds
Euro-Zone Lending
ECB Balance Sheet (Billions of Euros)

E U R O P E – A L L I S N O T E Q U A L
24
The consequences of austerity and decreased business andhousehold borrowing appears immediate; the Euro‐zone PMI index,a measure of economic activity, fell for the third straight month,suggesting a 0.4% percent fall in GDP. European business sentimentand consumer confidence indicators are also declining.
However, It is unfair to lump all of Europe together. Thoughmeasures of consumer confidence, retail sales, industrial production,services output and employment are all trending down, they varydramatically from country to country.
The Northern European countries, including Germany and France,are faring far better than the periphery countries; Italy, Portugal andGreece. The German economy, supported by a weak Euro, isexpected to grow by nearly 2% in 2012.
Sources: ECB, Bloomberg, Wurts
GDP – Core vs. Periphery
Consumer Confidence – Core vs. Periphery
Sources: ECB, Bloomberg, Wurts Source: ECB, Bloomberg, Wurts
Germany (Core)France (Core)Portugal (Periphery)Greece (Periphery)
Germany (Core)France (Core)Portugal (Periphery)Greece (Periphery)
Germany (Core)France (Core)Portugal (Periphery)Greece (Periphery)
Unemployment Rates – Core vs. Periphery
B R A Z I L – T H E P A T I E N T I S R E C O V E R I N G
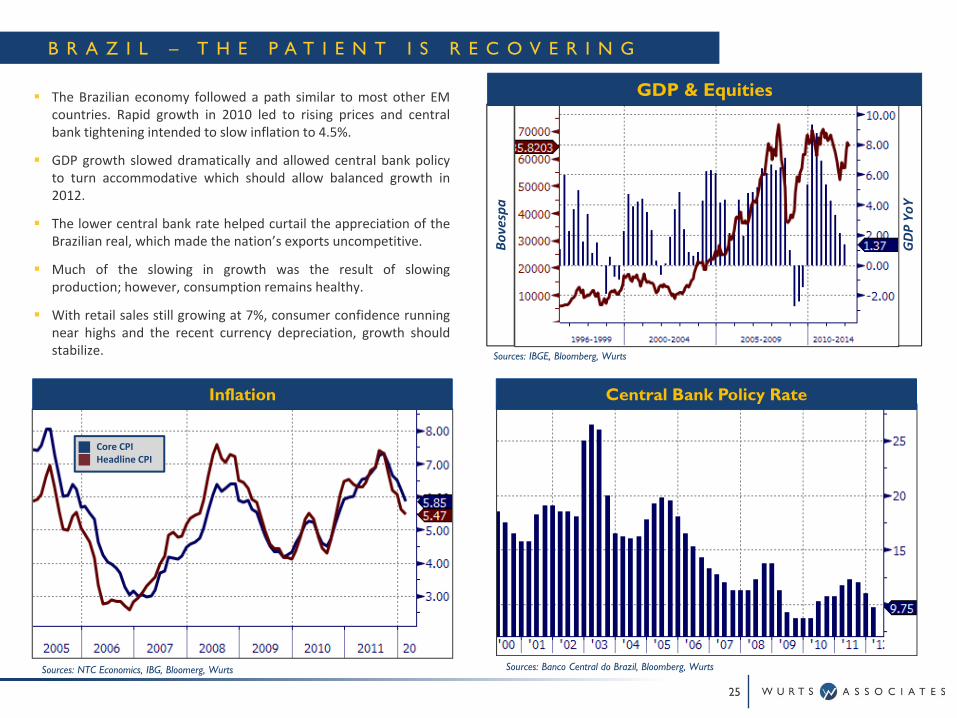
The Brazilian economy followed a path similar to most other EMcountries. Rapid growth in 2010 led to rising prices and centralbank tightening intended to slow inflation to 4.5%.
GDP growth slowed dramatically and allowed central bank policyto turn accommodative which should allow balanced growth in2012.
The lower central bank rate helped curtail the appreciation of theBrazilian real, which made the nation’s exports uncompetitive.
Much of the slowing in growth was the result of slowingproduction; however, consumption remains healthy.
With retail sales still growing at 7%, consumer confidence runningnear highs and the recent currency depreciation, growth shouldstabilize.
25
Retail SalesAuto Sales
Sources: NTC Economics, IBG, Bloomerg, Wurts
Core CPIHeadline CPI
Inflation
Sources: IBGE, Bloomberg, Wurts
GDP Yo
Y
Bovespa
GDP & Equities
Sources: Banco Central do Brazil, Bloomberg, Wurts
Central Bank Policy Rate
C H I N A – A S L O W S I M M E R A N D N O T A R O L L I N G B O I L
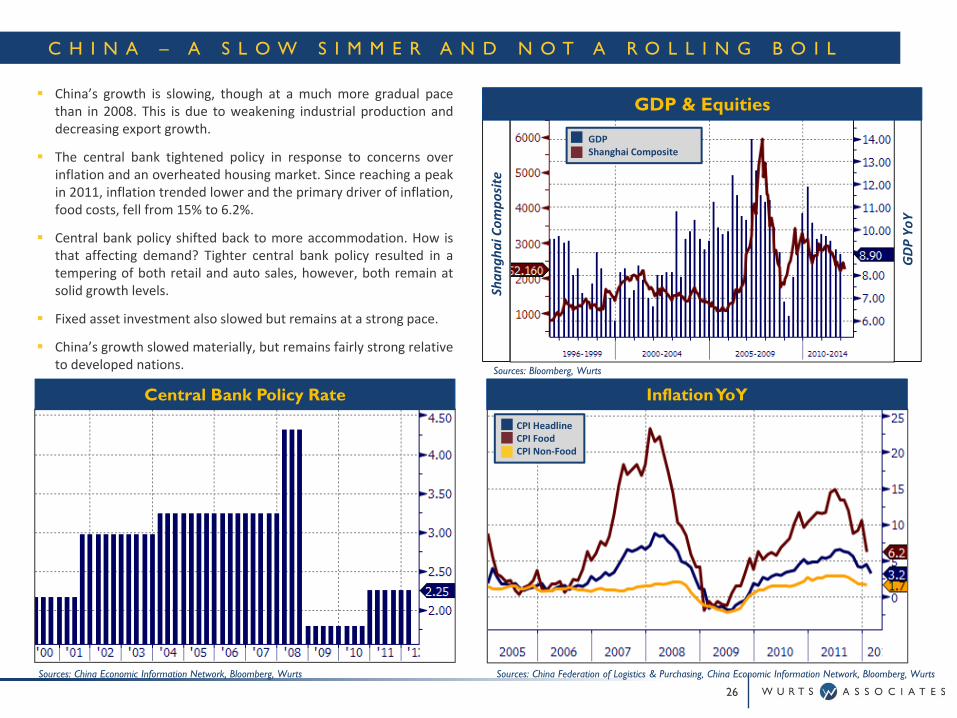
China’s growth is slowing, though at a much more gradual pacethan in 2008. This is due to weakening industrial production anddecreasing export growth.
The central bank tightened policy in response to concerns overinflation and an overheated housing market. Since reaching a peakin 2011, inflation trended lower and the primary driver of inflation,food costs, fell from 15% to 6.2%.
Central bank policy shifted back to more accommodation. How isthat affecting demand? Tighter central bank policy resulted in atempering of both retail and auto sales, however, both remain atsolid growth levels.
Fixed asset investment also slowed but remains at a strong pace.
China’s growth slowed materially, but remains fairly strong relativeto developed nations.
26
GDP Yo
Y
Shan
ghai Com
posite
Sources: China Economic Information Network, Bloomberg, Wurts
Central Bank Policy RateSources: Bloomberg, Wurts
GDPShanghai Composite
GDP & Equities
Sources: China Federation of Logistics & Purchasing, China Economic Information Network, Bloomberg, Wurts
CPI HeadlineCPI FoodCPI Non‐Food
Inflation YoY

C A P I T A L M A R K E T S
27
M A J O R A S S E T C L A S S R E T U R N S
28
Source: Morningstar, Inc., HFR
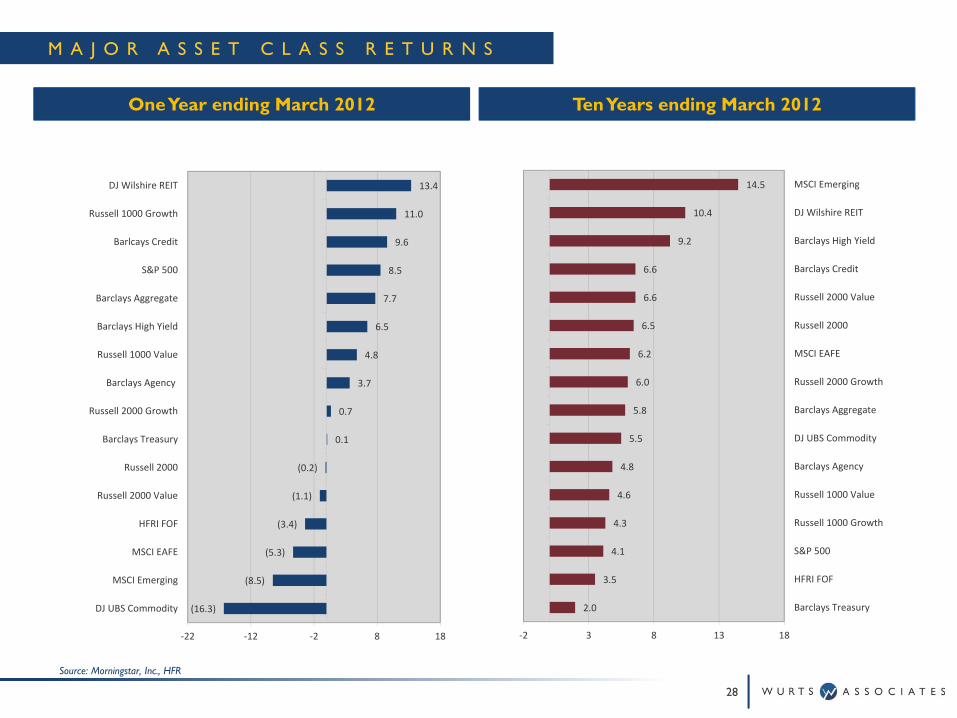
Ten Years ending March 2012One Year ending March 2012
(16.3)
(8.5)
(5.3)
(3.4)
(1.1)
(0.2)
0.1
0.7
3.7
4.8
6.5
7.7
8.5
9.6
11.0
13.4
‐22 ‐12 ‐2 8 18
DJ UBS Commodity
MSCI Emerging
MSCI EAFE
HFRI FOF
Russell 2000 Value
Russell 2000
Barclays Treasury
Russell 2000 Growth
Barclays Agency
Russell 1000 Value
Barclays High Yield
Barclays Aggregate
S&P 500
Barlcays Credit
Russell 1000 Growth
DJ Wilshire REIT
2.0
3.5
4.1
4.3
4.6
4.8
5.5
5.8
6.0
6.2
6.5
6.6
6.6
9.2
10.4
14.5
‐2 3 8 13 18
Barclays Treasury
HFRI FOF
S&P 500
Russell 1000 Growth
Russell 1000 Value
Barclays Agency
DJ UBS Commodity
Barclays Aggregate
Russell 2000 Growth
MSCI EAFE
Russell 2000
Russell 2000 Value
Barclays Credit
Barclays High Yield
DJ Wilshire REIT
MSCI Emerging
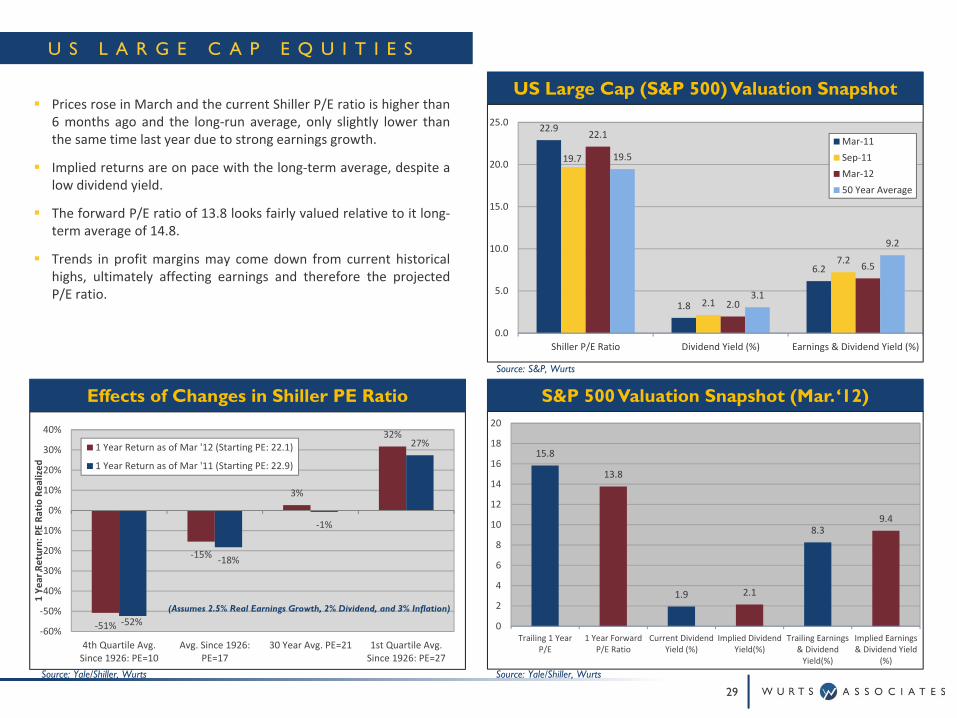
‐51%
‐15%
3%
32%
‐52%
‐18%
‐1%
27%
‐60%
‐50%
‐40%
‐30%
‐20%
‐10%
0%
10%
20%
30%
40%
4th Quartile Avg.Since 1926: PE=10
Avg. Since 1926:PE=17
30 Year Avg. PE=21 1st Quartile Avg.Since 1926: PE=27
1 Ye
ar Return: PE Ra
tio Realized
1 Year Return as of Mar '12 (Starting PE: 22.1)
1 Year Return as of Mar '11 (Starting PE: 22.9)
U S L A R G E C A P E Q U I T I E S
29
Source: Yale/Shiller, Wurts
Source: S&P, Wurts
Source: Yale/Shiller, Wurts
US Large Cap (S&P 500) Valuation Snapshot
(Assumes 2.5% Real Earnings Growth, 2% Dividend, and 3% Inflation)
Effects of Changes in Shiller PE Ratio S&P 500 Valuation Snapshot (Mar. ‘12)
Prices rose in March and the current Shiller P/E ratio is higher than6 months ago and the long‐run average, only slightly lower thanthe same time last year due to strong earnings growth.
Implied returns are on pace with the long‐term average, despite alow dividend yield.
The forward P/E ratio of 13.8 looks fairly valued relative to it long‐term average of 14.8.
Trends in profit margins may come down from current historicalhighs, ultimately affecting earnings and therefore the projectedP/E ratio.
22.9
1.8
6.2
19.7
2.1
7.2
22.1
2.0
6.5
19.5
3.1
9.2
0.0
5.0
10.0
15.0
20.0
25.0
Shiller P/E Ratio Dividend Yield (%) Earnings & Dividend Yield (%)
Mar‐11Sep‐11Mar‐1250 Year Average
15.8
13.8
1.9 2.1
8.39.4
0
2
4
6
8
10
12
14
16
18
20
Trailing 1 YearP/E
1 Year ForwardP/E Ratio
Current DividendYield (%)
Implied DividendYield(%)
Trailing Earnings& DividendYield(%)
Implied Earnings& Dividend Yield
(%)
F I X E D I N C O M E
30
Source: Federal Reserve Source: Barclays, JP Morgan
Source: Federal Reserve, Wurts
US Treasury Yield Curve
Nominal Fixed Income Yield Maturities Inflation Expectations (Nominal less Real)
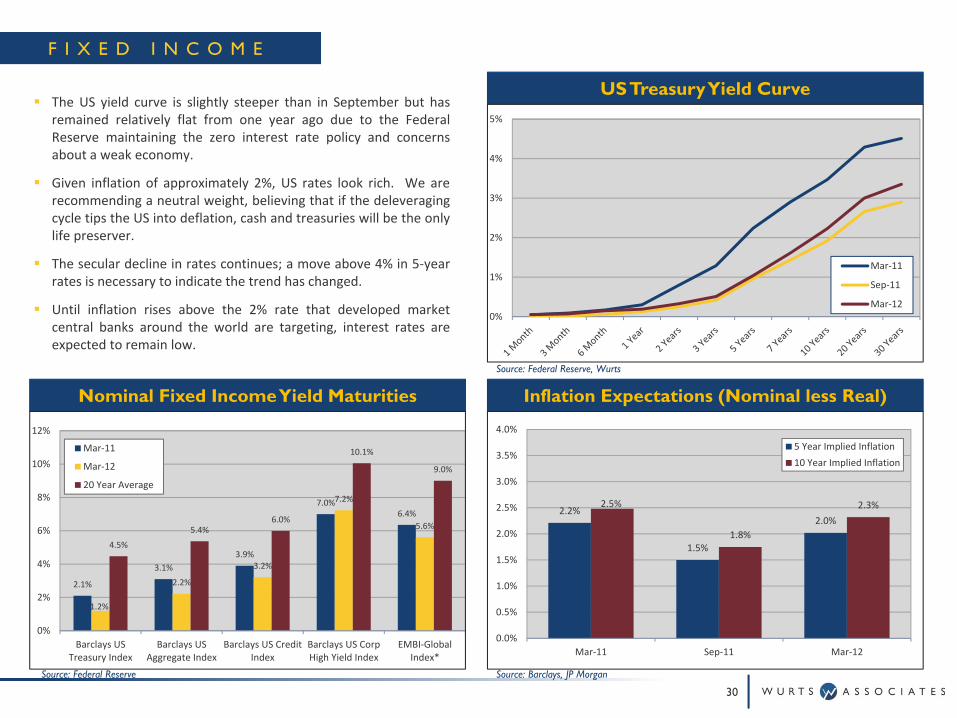
The US yield curve is slightly steeper than in September but hasremained relatively flat from one year ago due to the FederalReserve maintaining the zero interest rate policy and concernsabout a weak economy.
Given inflation of approximately 2%, US rates look rich. We arerecommending a neutral weight, believing that if the deleveragingcycle tips the US into deflation, cash and treasuries will be the onlylife preserver.
The secular decline in rates continues; a move above 4% in 5‐yearrates is necessary to indicate the trend has changed.
Until inflation rises above the 2% rate that developed marketcentral banks around the world are targeting, interest rates areexpected to remain low.
0%
1%
2%
3%
4%
5%
Mar‐11
Sep‐11
Mar‐12
2.1%
3.1%3.9%
7.0%6.4%
1.2%
2.2%
3.2%
7.2%
5.6%
4.5%
5.4%6.0%
10.1%
9.0%
0%
2%
4%
6%
8%
10%
12%
Barclays USTreasury Index
Barclays USAggregate Index
Barclays US CreditIndex
Barclays US CorpHigh Yield Index
EMBI‐GlobalIndex*
Mar‐11
Mar‐12
20 Year Average
2.2%
1.5%
2.0%
2.5%
1.8%
2.3%
0.0%
0.5%
1.0%
1.5%
2.0%
2.5%
3.0%
3.5%
4.0%
Mar‐11 Sep‐11 Mar‐12
5 Year Implied Inflation10 Year Implied Inflation

1.0%
1.8%2.2% 2.1%
2.9%
2.2%
5.1%
3.2%
3.8%
5.6%
0%
1%
2%
3%
4%
5%
6%
Japan Germany UnitedStates
Canada France UK Italy Barclays USCredit
BarclaysGlobalCredit
EMBI‐Global
G L O B A L M A R K E T S
31
Source: MSCI, Wurts & Associates Source: Barclays, JP Morgan
Source: JP Morgan, Western Asset Management
Global Sovereign 10 Year Index Yields (Mar. ‘12)
US Dollar Major Currency Index (Mar. ‘12) Rolling 3 Month MSCI Ratios (Mar. ‘12)
We are recommending a small overweight to both EAFE and EMrelative to US equities based on valuations. Valuations of EAFE andEM equities appear to be discounting a larger decrease in GDPgrowth than the IMF has forecast.
US investors seeking yield may be attracted to slightly highersovereign rates outside of the US. They should be aware however,that a strengthening of the dollar relative to weaker currencies ofslower growing economies could overwhelm the modest returndifferences.
The stronger balance sheets of emerging market sovereign bondscontinue to make them attractive to those of developed nationsdealing with large borrowing needs.
1.4
13.7
7.3
3.7
11.0
2.2
14.9
9.6
2.1
8.8
1.8
11.8
7.6
2.7
11.1
0
5
10
15
20
25
Price/Book Value Price/Earnings Price/CashEarnings
Dividend Yield (%) Earnings +Dividend Yield(%)
MSCI EAFE
United States
Emerging Markets
‐6%
‐4%
‐2%
0%
2%
4%
6%
8%
60
80
100
120
140
160US Major Currency Index (real)Average Currency Index ValueSubsequent 10 Year Return
‐25
0
25
Technical IndicatorSubsequent 7 Year Excess Returns (Value vs. Growth)
‐15
‐10
‐5
0
5
10
15
20
0.0
0.2
0.4
0.6
0.8
1.0
1.2
1.4
Rolling 3 Month Avg PE (Value/Growth)Relative Average ValuationSubsequent 5 Year Rolling Excess Returns (value vs. growth)
1.9
‐1.6
3.0
0.6
‐4.0
‐2.0
0.0
2.0
4.0
Relative PE<Average Relative PE>Average Wurts TechnicalValue Indicator < 0
Wurts TechnicalValue Indicator > 0
Subseq
uent Rollin
g 5 Yr Excess Re
turn
(Value
Vs. Growth)
S T Y L E T I L T S : U S L A R G E V A L U E V S . G R O W T H
32
Source: Ibbotson, Wurts & Associates Source: Russell, Wurts & Associates
Relative PE Ratio of US Value vs. Growth
Fundamental vs. Technical Indicators Technical Indicator for US Value vs. Growth
Sell signal for value
Buy signal for value
Source: Russell, Wurts & Associates
Fundamental Technical
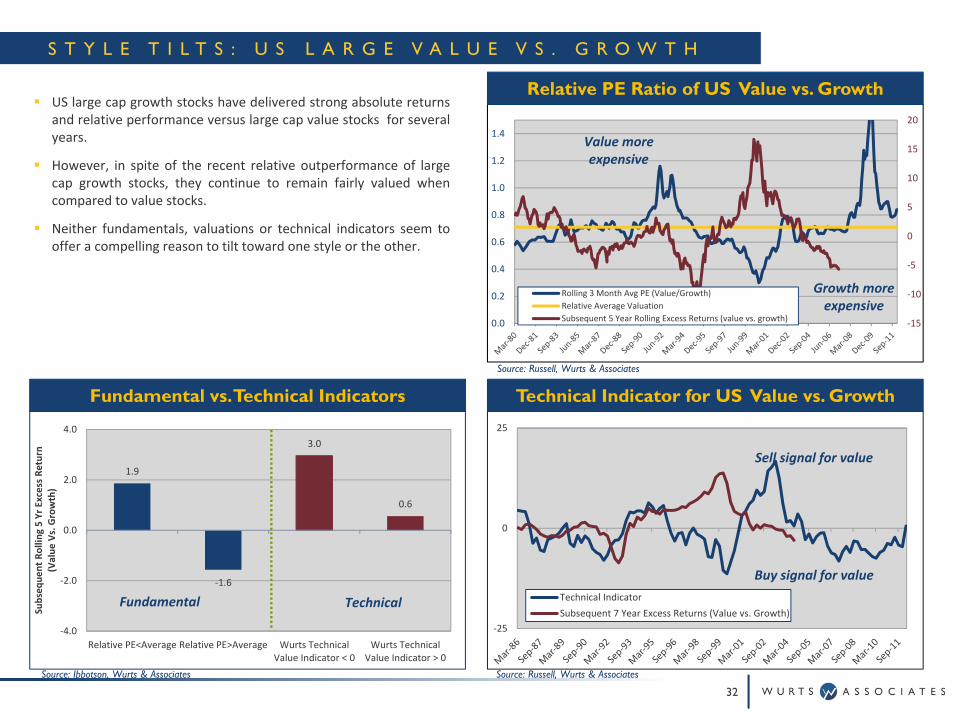
US large cap growth stocks have delivered strong absolute returnsand relative performance versus large cap value stocks for severalyears.
However, in spite of the recent relative outperformance of largecap growth stocks, they continue to remain fairly valued whencompared to value stocks.
Neither fundamentals, valuations or technical indicators seem tooffer a compelling reason to tilt toward one style or the other.
Value more expensive
Growth more expensive
‐15
‐10
‐5
0
5
10
15
0.5
0.7
0.9
1.1
1.3
1.5
1.7
1.9
Rolling 3 Month Avg PE (Small/Large)Relative Valuation AverageSubsequent 5 Year Rolling Excess Returns (Small ‐ Large)
‐25.0
0.0
25.0
Technical IndicatorSubsequent 7 Year Excess Returns (Small vs. Large)
‐0.3
‐1.4
0.3
‐1.3
‐3
‐2
‐1
0
1
Relative PE<Average Relative PE>Average Wurts TechnicalIndicator < 0
Wurts TechnicalIndicator > 0
Subseq
uent Rollin
g 5 Yr Excess Re
turn (S
mall
vs. Large)
S T Y L E T I L T S : U S L A R G E V S . S M A L L
33
Source: Russell, Wurts & Associates
Source: Ibbotson, Wurts & Associates
Source: Russell, Wurts & Associates
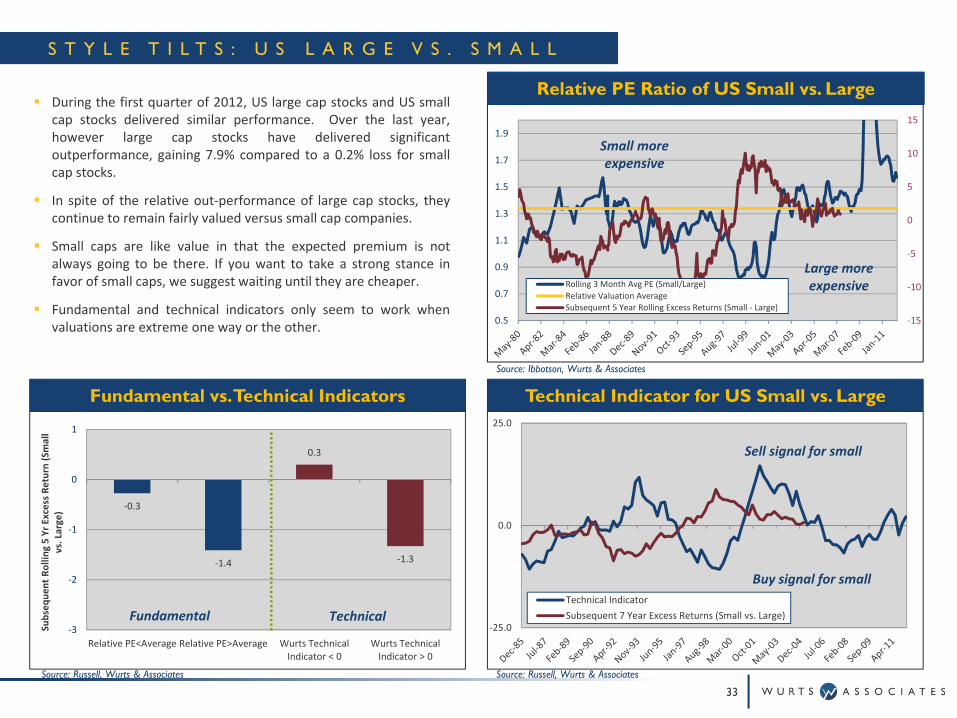
During the first quarter of 2012, US large cap stocks and US smallcap stocks delivered similar performance. Over the last year,however large cap stocks have delivered significantoutperformance, gaining 7.9% compared to a 0.2% loss for smallcap stocks.
In spite of the relative out‐performance of large cap stocks, theycontinue to remain fairly valued versus small cap companies.
Small caps are like value in that the expected premium is notalways going to be there. If you want to take a strong stance infavor of small caps, we suggest waiting until they are cheaper.
Fundamental and technical indicators only seem to work whenvaluations are extreme one way or the other.
Relative PE Ratio of US Small vs. Large
Fundamental vs. Technical Indicators Technical Indicator for US Small vs. Large
Sell signal for small
Buy signal for small
Small more expensive
Large more expensive
Fundamental Technical
R I S K V E R S U S R E T U R N
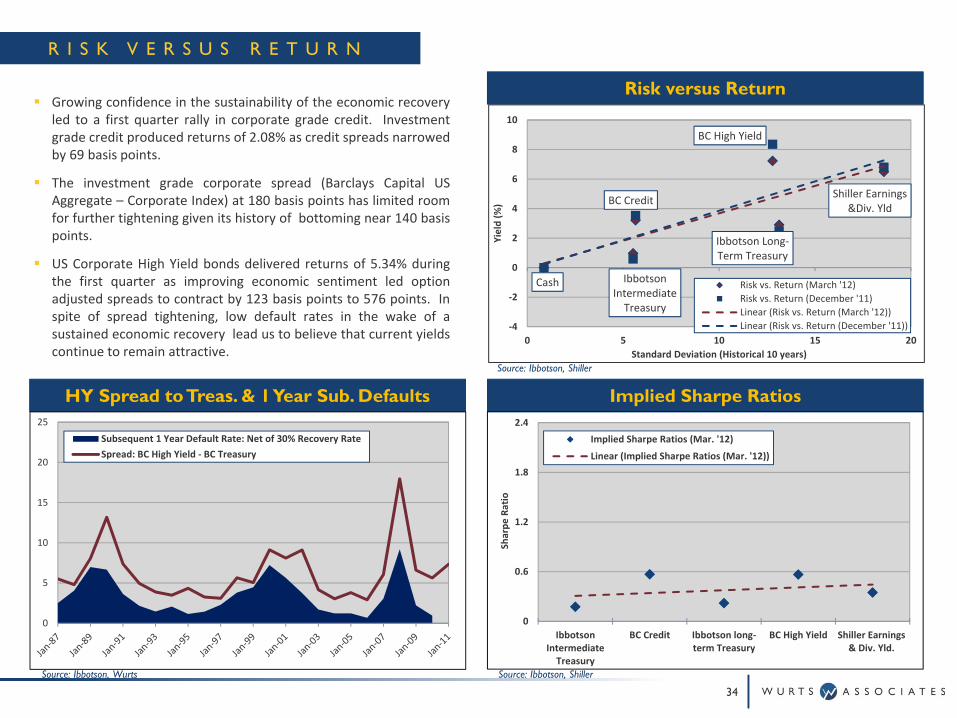
Growing confidence in the sustainability of the economic recoveryled to a first quarter rally in corporate grade credit. Investmentgrade credit produced returns of 2.08% as credit spreads narrowedby 69 basis points.
The investment grade corporate spread (Barclays Capital USAggregate – Corporate Index) at 180 basis points has limited roomfor further tightening given its history of bottoming near 140 basispoints.
US Corporate High Yield bonds delivered returns of 5.34% duringthe first quarter as improving economic sentiment led optionadjusted spreads to contract by 123 basis points to 576 points. Inspite of spread tightening, low default rates in the wake of asustained economic recovery lead us to believe that current yieldscontinue to remain attractive.
Source: Ibbotson, Wurts
HY Spread to Treas. & 1 Year Sub. Defaults Implied Sharpe Ratios
Source: Ibbotson, Shiller
34
Risk versus Return
Source: Ibbotson, Shiller
0
0.6
1.2
1.8
2.4
IbbotsonIntermediateTreasury
BC Credit Ibbotson long‐term Treasury
BC High Yield Shiller Earnings& Div. Yld.
Sharpe
Ratio
Implied Sharpe Ratios (Mar. '12)
Linear (Implied Sharpe Ratios (Mar. '12))
Cash Ibbotson Intermediate Treasury
BC Credit
Ibbotson Long‐Term Treasury
BC High Yield
Shiller Earnings &Div. Yld
‐4
‐2
0
2
4
6
8
10
0 5 10 15 20
Yield (%
)
Standard Deviation (Historical 10 years)
Risk vs. Return (March '12)Risk vs. Return (December '11)Linear (Risk vs. Return (March '12))Linear (Risk vs. Return (December '11))
0
5
10
15
20
25
Subsequent 1 Year Default Rate: Net of 30% Recovery RateSpread: BC High Yield ‐ BC Treasury

A P P E N D I X
35
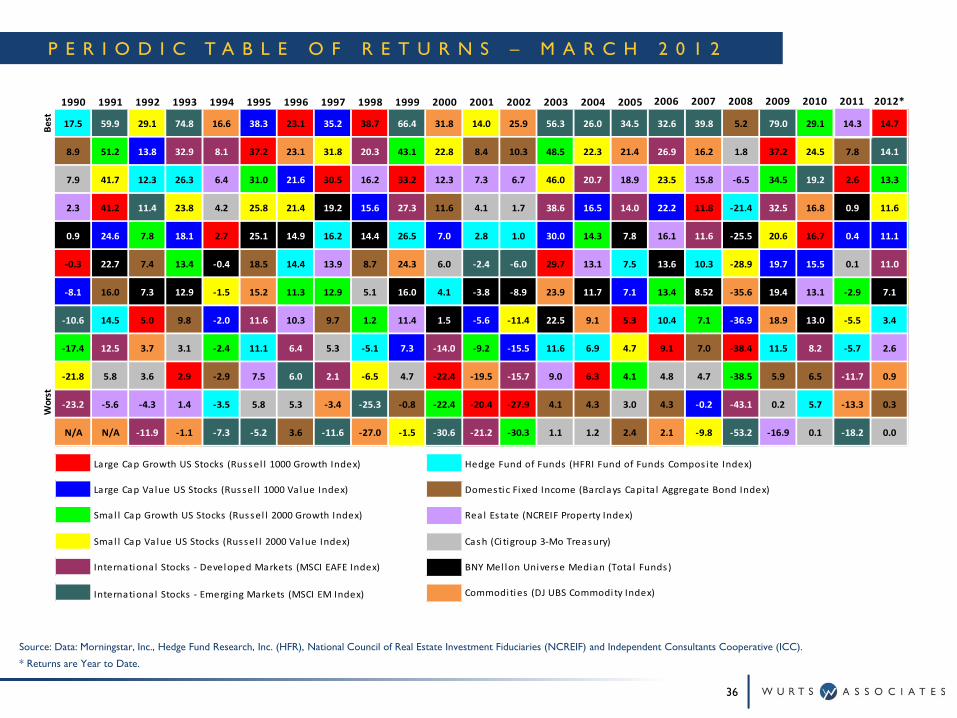
P E R I O D I C T A B L E O F R E T U R N S – M A R C H 2 0 1 2
36
Source: Data: Morningstar, Inc., Hedge Fund Research, Inc. (HFR), National Council of Real Estate Investment Fiduciaries (NCREIF) and Independent Consultants Cooperative (ICC).
* Returns are Year to Date.
1990 1991 1992 1993 1994 1995 1996 1997 1998 1999 2000 2001 2002 2003 2004 2005 2006 2007 2008 2009 2010 2011 2012*
Best 17.5 59.9 29.1 74.8 16.6 38.3 23.1 35.2 38.7 66.4 31.8 14.0 25.9 56.3 26.0 34.5 32.6 39.8 5.2 79.0 29.1 14.3 14.7
8.9 51.2 13.8 32.9 8.1 37.2 23.1 31.8 20.3 43.1 22.8 8.4 10.3 48.5 22.3 21.4 26.9 16.2 1.8 37.2 24.5 7.8 14.1
7.9 41.7 12.3 26.3 6.4 31.0 21.6 30.5 16.2 33.2 12.3 7.3 6.7 46.0 20.7 18.9 23.5 15.8 ‐6.5 34.5 19.2 2.6 13.3
2.3 41.2 11.4 23.8 4.2 25.8 21.4 19.2 15.6 27.3 11.6 4.1 1.7 38.6 16.5 14.0 22.2 11.8 ‐21.4 32.5 16.8 0.9 11.6
0.9 24.6 7.8 18.1 2.7 25.1 14.9 16.2 14.4 26.5 7.0 2.8 1.0 30.0 14.3 7.8 16.1 11.6 ‐25.5 20.6 16.7 0.4 11.1
‐0.3 22.7 7.4 13.4 ‐0.4 18.5 14.4 13.9 8.7 24.3 6.0 ‐2.4 ‐6.0 29.7 13.1 7.5 13.6 10.3 ‐28.9 19.7 15.5 0.1 11.0
‐8.1 16.0 7.3 12.9 ‐1.5 15.2 11.3 12.9 5.1 16.0 4.1 ‐3.8 ‐8.9 23.9 11.7 7.1 13.4 8.52 ‐35.6 19.4 13.1 ‐2.9 7.1
‐10.6 14.5 5.0 9.8 ‐2.0 11.6 10.3 9.7 1.2 11.4 1.5 ‐5.6 ‐11.4 22.5 9.1 5.3 10.4 7.1 ‐36.9 18.9 13.0 ‐5.5 3.4
‐17.4 12.5 3.7 3.1 ‐2.4 11.1 6.4 5.3 ‐5.1 7.3 ‐14.0 ‐9.2 ‐15.5 11.6 6.9 4.7 9.1 7.0 ‐38.4 11.5 8.2 ‐5.7 2.6
‐21.8 5.8 3.6 2.9 ‐2.9 7.5 6.0 2.1 ‐6.5 4.7 ‐22.4 ‐19.5 ‐15.7 9.0 6.3 4.1 4.8 4.7 ‐38.5 5.9 6.5 ‐11.7 0.9
‐23.2 ‐5.6 ‐4.3 1.4 ‐3.5 5.8 5.3 ‐3.4 ‐25.3 ‐0.8 ‐22.4 ‐20.4 ‐27.9 4.1 4.3 3.0 4.3 ‐0.2 ‐43.1 0.2 5.7 ‐13.3 0.3
N/A N/A ‐11.9 ‐1.1 ‐7.3 ‐5.2 3.6 ‐11.6 ‐27.0 ‐1.5 ‐30.6 ‐21.2 ‐30.3 1.1 1.2 2.4 2.1 ‐9.8 ‐53.2 ‐16.9 0.1 ‐18.2 0.0
Large Cap Growth US Stocks (Russel l 1000 Growth Index) Hedge Fund of Funds (HFRI Fund of Funds Compos i te Index)
Large Cap Value US Stocks (Russel l 1000 Value Index) Domestic Fixed Income (Barclays Capita l Aggregate Bond Index)
Smal l Cap Growth US Stocks (Russel l 2000 Growth Index) Rea l Estate (NCREIF Property Index)
Smal l Cap Value US Stocks (Russel l 2000 Value Index) Cash (Ci tigroup 3‐Mo Treasury)
Internationa l Stocks ‐ Developed Markets (MSCI EAFE Index) BNY Mel lon Universe Median (Tota l Funds)
Internationa l Stocks ‐ Emerging Markets (MSCI EM Index) Commodities (DJ UBS Commodity Index)
Worst

S & P 5 0 0 S E C T O R R E T U R N S
37
Source: ICC
One Year Ending March 20123 Month Ending March 2012
‐1.6
2.0
4.0
5.5
9.0
10.9
11.2
16.3
21.5
22.0
(5) 0 5 10 15 20 25
UTILITIES
TELECOMMUNICATION SERVICES
ENERGY
CONSUMER STAPLES
HEALTH CARE
INDUSTRIALS
MATERIALS
CONSUMER DISCRETIONARY
INFORMATION TECHNOLOGY
FINANCIALS
‐6.8
‐3.5
‐1.9
1.2
3.4
14.9
16.3
17.3
17.6
20.8
(10) (5) 0 5 10 15 20 25
ENERGY
MATERIALS
FINANCIALS
INDUSTRIALS
TELECOMMUNICATION SERVICES
UTILITIES
HEALTH CARE
CONSUMER STAPLES
CONSUMER DISCRETIONARY
INFORMATION TECHNOLOGY
Domestic Equity QTD YTD 1‐Year 3‐Year 5‐Year 10‐Year Fixed Income QTD YTD 1‐Year 3‐Year 5‐Year 10‐YearCore Index Performance Index PerformanceS&P 500 12.6 12.6 8.5 23.4 2.0 4.1 BC US Aggregate Bond 0.3 0.3 7.7 6.8 6.2 5.8S&P 500 Equal Weighted 12.6 12.6 4.9 30.5 3.6 7.1 BC US Treasury US TIPS 0.9 0.9 12.2 8.7 7.6 7.5DJ Industrial Average 8.8 8.8 10.2 23.6 4.2 5.0 BC US Treasury Bills 0.0 0.0 0.1 0.2 1.4 2.0Russell Top 200 12.9 12.9 9.9 22.1 1.9 3.3 Maturity EvaluationRussell 1000 12.9 12.9 7.9 24.0 2.2 4.5 BC US Treasury 1‐3 Yr (0.1) (0.1) 1.5 1.5 3.4 3.3Russell 2000 12.4 12.4 (0.2) 26.9 2.1 6.5 BC US Treasury Interm. (0.5) (0.5) 6.1 3.4 5.6 4.8Russell 3000 12.9 12.9 7.2 24.3 2.2 4.7 BC US Treasury Long (5.8) (5.8) 23.6 7.2 9.5 8.5Russell Mid Cap 12.9 12.9 3.3 29.1 3.0 7.9 Issuer PerformanceStyle Index Performance BC US Agency Intermediate 0.2 0.2 3.7 3.3 5.0 4.8Russell 1000 Growth 14.7 14.7 11.0 25.3 5.1 4.3 BC US Credit 2.0 2.0 9.6 12.3 6.9 6.6Russell 1000 Value 11.1 11.1 4.8 22.8 (0.8) 4.6 BC US MBS 0.6 0.6 6.2 5.3 6.3 5.7Russell 2000 Growth 13.3 13.3 0.7 28.4 4.2 6.0 BC US Corporate High Yield 5.3 5.3 6.5 23.9 8.1 9.2Russell 2000 Value 11.6 11.6 (1.1) 25.4 0.0 6.6 BC Emerging Markets 5.5 5.5 11.1 17.7 8.5 11.0
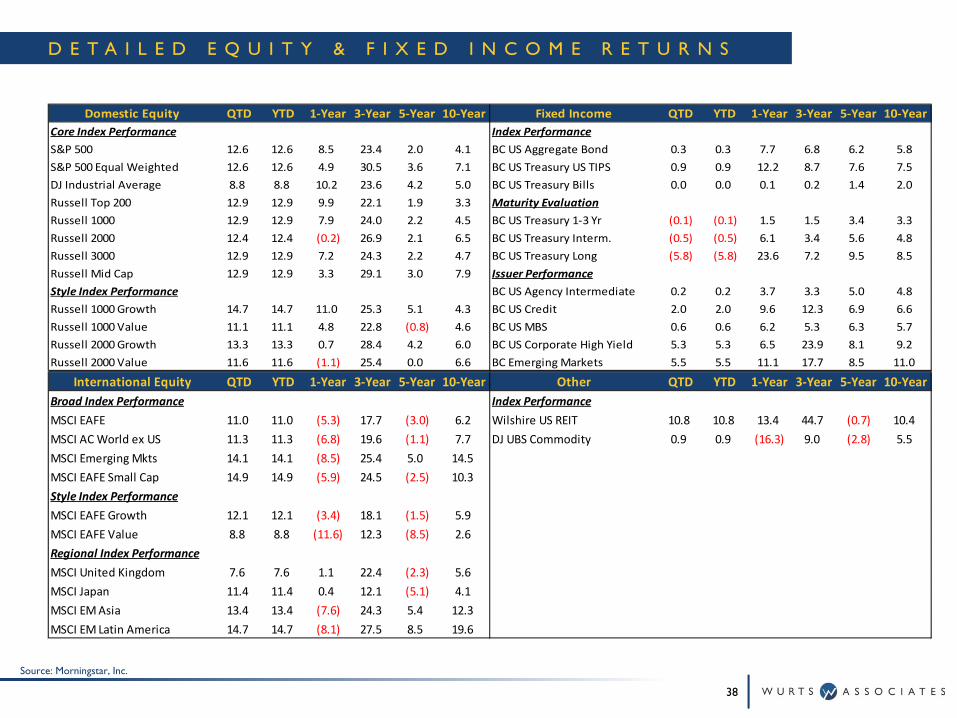
D E T A I L E D E Q U I T Y & F I X E D I N C O M E R E T U R N S
38
Source: Morningstar, Inc.
International Equity QTD YTD 1‐Year 3‐Year 5‐Year 10‐Year Other QTD YTD 1‐Year 3‐Year 5‐Year 10‐YearBroad Index Performance Index PerformanceMSCI EAFE 11.0 11.0 (5.3) 17.7 (3.0) 6.2 Wilshire US REIT 10.8 10.8 13.4 44.7 (0.7) 10.4MSCI AC World ex US 11.3 11.3 (6.8) 19.6 (1.1) 7.7 DJ UBS Commodity 0.9 0.9 (16.3) 9.0 (2.8) 5.5MSCI Emerging Mkts 14.1 14.1 (8.5) 25.4 5.0 14.5MSCI EAFE Small Cap 14.9 14.9 (5.9) 24.5 (2.5) 10.3Style Index PerformanceMSCI EAFE Growth 12.1 12.1 (3.4) 18.1 (1.5) 5.9MSCI EAFE Value 8.8 8.8 (11.6) 12.3 (8.5) 2.6Regional Index PerformanceMSCI United Kingdom 7.6 7.6 1.1 22.4 (2.3) 5.6MSCI Japan 11.4 11.4 0.4 12.1 (5.1) 4.1MSCI EM Asia 13.4 13.4 (7.6) 24.3 5.4 12.3MSCI EM Latin America 14.7 14.7 (8.1) 27.5 8.5 19.6