Embed Size (px)
Citation preview

www.deutsche-boerse.com
Quarterly statementQuarter 3/2018
2 Deutsche Börse Group quarterly statement Q3/2018
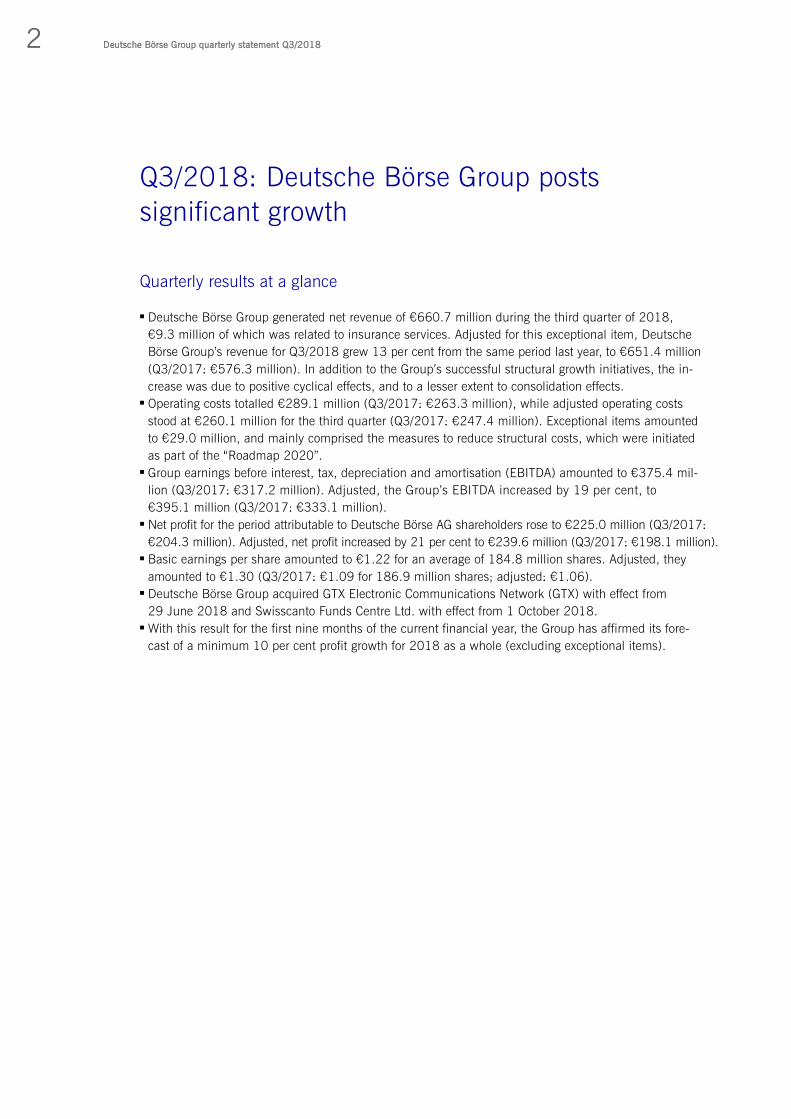
Quarterly results at a glance
Deutsche Börse Group generated net revenue of €660.7 million during the third quarter of 2018,
€9.3 million of which was related to insurance services. Adjusted for this exceptional item, Deutsche
Börse Group’s revenue for Q3/2018 grew 13 per cent from the same period last year, to €651.4 million
(Q3/2017: €576.3 million). In addition to the Group’s successful structural growth initiatives, the in-
crease was due to positive cyclical effects, and to a lesser extent to consolidation effects. Operating costs totalled €289.1 million (Q3/2017: €263.3 million), while adjusted operating costs
stood at €260.1 million for the third quarter (Q3/2017: €247.4 million). Exceptional items amounted
to €29.0 million, and mainly comprised the measures to reduce structural costs, which were initiated
as part of the “Roadmap 2020”. Group earnings before interest, tax, depreciation and amortisation (EBITDA) amounted to €375.4 mil-
lion (Q3/2017: €317.2 million). Adjusted, the Group’s EBITDA increased by 19 per cent, to
€395.1 million (Q3/2017: €333.1 million). Net profit for the period attributable to Deutsche Börse AG shareholders rose to €225.0 million (Q3/2017:
€204.3 million). Adjusted, net profit increased by 21 per cent to €239.6 million (Q3/2017: €198.1 million). Basic earnings per share amounted to €1.22 for an average of 184.8 million shares. Adjusted, they
amounted to €1.30 (Q3/2017: €1.09 for 186.9 million shares; adjusted: €1.06). Deutsche Börse Group acquired GTX Electronic Communications Network (GTX) with effect from
29 June 2018 and Swisscanto Funds Centre Ltd. with effect from 1 October 2018. With this result for the first nine months of the current financial year, the Group has affirmed its fore-
cast of a minimum 10 per cent profit growth for 2018 as a whole (excluding exceptional items).
Q3/2018: Deutsche Börse Group posts
significant growth

3 Earnings releases
Fundamental information about the Group
The fundamental information about the Group described on pages 18 to 31 of the 2017 financial
report is still valid in principle.
Comparability of figures
More detailed segment reporting
Deutsche Börse Group adjusted its internal segment management as at the first quarter of 2018.
The more detailed structure of the reporting segments creates additional transparency and points
out growth areas.
The former Eurex segment was divided into three segments: Eurex (financial derivatives), EEX
(commodities) and 360T (foreign exchange).
The former Clearstream segment was divided into three segments: Clearstream (post-trading),
IFS (investment fund services) and GSF (collateral management). In future, the former Market Data + Services (MD+S) segment was separated into STOXX (index) and
Data. Revenues from the Infrastructure Services area, the third pillar of the former MD+S segment,
have been allocated to the Eurex and Xetra segments. The Group continues to report on business developments in the cash market within the Xetra segment
(cash equities).
Recognising the growing importance of these business lines, the Group reports their net revenue, cost
base, and EBITDA at segment level.
Changes to the basis of consolidation
On 29 June 2018, Deutsche Börse Group acquired GTX Electronic Communications Network (GTX).
Within the scope of the transaction, 360 Treasury Systems AG (a wholly-owned subsidiary of Deutsche
Börse AG), established 360TGTX, Inc., which acquired GTX. Deutsche Börse Group has consolidated
360TGTX, Inc. for the first time as at 29 June 2018. However, due to the balance sheet date 30 June
2018, only the balance sheet was consolidated in the half-yearly finanical report, while profit or loss
have been consolidated as from 1 July 2018. Revenue and costs will be reported in the 360T segment
(Foreign Exchange).
Changes to the balance sheet structure
Since the first quarter of 2018, Deutsche Börse Group has improved the transparency of its balance sheet
structure with the first-time application of IFRS 9. Financial instruments are now recognised in the con-
solidated balance sheet according to different measurement categories; the comparative figures present-
ed for the periods of 2017 are reported according to the new structure. With regard to accounting and
measurement policies for the first half of 2017, IAS 39 has been applied, as before.
Q3/2018 earnings releases

4 Deutsche Börse Group quarterly statement Q3/2018
Results of operations
Results of operations of the Group in the third quarter of 2018
During the third quarter of 2018, the global economy was under pressure, although the German econo-
my still showed little signs of weakness, with consumer confidence remaining at a high level. The trade
dispute between the US and the EU, China and other important trading partners, including punitive
tariffs on the import of raw materials and other goods, remained a hot topic. Furthermore, the decision
of the US administration to cancel the nuclear agreement with Iran had macroeconomic repercussions:
the oil price soared to its highest level since 2014. Since then, oil prices have remained at an elevated
level, potentially dampening overall economic performance. Against this background, several economic
research institutions lowered their growth projections. For instance, Deutsches Institut für Wirtschafts-
forschung (DIW, German Institute for Economic Research) significantly lowered its GDP growth projec-
tion for Germany – published in March – from 2.4 per cent to 1.8 per cent for this year, and from
1.9 per cent to 1.7 per cent for 2019. According to the most recent estimates, the Munich-based ifo
Institute lowered its 2018 economic growth expectation for Germany to 1.9 per cent. One notable effect
is that German equity markets seem to be increasingly insecure given the trade dispute, while US stock
exchanges recently reached new all-time peaks.
During the third quarter of 2018, volatility (measured in terms of the VDAX® index) – which is a key
driver of trading activity on the cash and derivatives markets – remained on average above the third
quarter of 2017, but was shy of the level reached during the first half of 2018.
Central banks started to take action regarding their interest rate policies during the second quarter of
2018. The European Central Bank announced a reduction of its Quantitative Easing (QE) programme
to a monthly volume of €15 billion for the final three months of 2018, and to phase out the entire pro-
gramme during 2019. Key interest rates would remain untouched until at least the summer of 2019.
The US Federal Reserve (Fed), however, tightened its monetary policy again at the end of September,
increasing its key interest rate by 0.25 percentage points to between 2.00 and 2.25 per cent. Against
this background, the Eurex interest rate derivatives business picked up and net interest income from
banking business increased significantly.
Key figures on results of operations of Deutsche Börse Group (reported)
Quarter ended Nine months ended
30 Sep 2018 30 Sep 2017 Change 30 Sep 2018 30 Sep 2017 Change
% %
Net revenue €m 660.7 576.3 15 2,039.3 1,823.3 12
Operating costs €m 289.1 263.3 10 881.3 808.3 9
EBITDA €m 375.4 317.2 18 1,164.2 1,138.4 2
Depreciation and amortisation €m 44.1 40.7 8 143.8 116.2 24
EBIT €m 331.3 276.5 20 1,020.4 1,022.2 0
Net profit for the period attribut-
able to Deutsche Börse AG
shareholders €m 225.0 204.3 10 684.3 660.7 4
Earnings per share (basic) € 1.22 1.09 12 3.69 3.53 5

5 Earnings releases
Against this background, Deutsche Börse Group’s net revenue stood at €660.7 million in the third
quarter of 2018, €9.3 million of which was related to insurance services. Adjusted for these services,
Deutsche Börse Group’s net revenue grew by 13 per cent. The increase was due in particular to struc-
tural growth initiatives. In the third quarter, their contribution was above the projected level of at least
5 per cent. Structural growth was driven by the Eurex (financial derivatives) segment including over-
the-counter (OTC) clearing, as well as by the EEX (commodities), Data, 360T (foreign exchange), and
IFS (investment fund services) segments. Moreover, the stable cyclical environment contributed to the
increase in net revenue. For example, trading in index and interest rate derivatives in the Eurex segment
(financial derivatives) profited from the political uncertainty in Italy and the ongoing international trade
disputes. The increase in US interest rates had positive effects on net interest income from banking
business of the Clearstream segment (post-trading). Business in the Xetra (cash equities) segment stabi-
lised at a high level, given that volatility was slightly higher than in the previous year but no longer
matched the levels seen in the first half of 2018. In addition, consolidation effects contributed to a
minor extent to the increase in net revenue.
Adjusted operating costs rose by 5 per cent year-on-year, to €260.1 million (Q3/2017: €247.4 million).
This was due, on the one hand, to higher staffing levels and higher expenses for share-based remunera-
tion, given that the company’s share price was considerably higher than in Q2/2017. On the other hand,
costs also rose due to inflation, and given the consolidation of GTX in July 2018. Operating costs were
up 10 per cent year-on-year on an unadjusted basis. They included exceptional items of €29.0 million
(Q3/2017: €15.9 million), which were mainly related to the implementation of the corporate strategy
“Roadmap 2020”, designed to streamline management structures and to optimise processes. Further
exceptional items were due to the integration of acquired companies, and to costs in connection with
criminal proceedings in the US.
Depreciation, amortisation and impairment losses rose to €44.1 million during the third quarter of 2018
(Q3/2017: €40.7 million).
Deutsche Börse Group’s adjusted earnings before interest, tax, depreciation and amortisation (EBITDA)
increased by 19 per cent, mainly thanks to markedly higher revenue. Accordingly, net profit for the
period attributable to Deutsche Börse AG shareholders was also clearly higher than in the previous year:
adjusted for exceptional items, it was up by 21 per cent.
Deutsche Börse Group’s financial result amounted to €–15.1 million in the third quarter of 2018 (Q3/2017:
€–19.1 million). As expected, the adjusted tax rate in the third quarter of 2018 was 27.0 per cent
(Q3/2017: 27.0 per cent).
Key figures on results of operations of Deutsche Börse Group (adjusted)
Quarter ended Nine months ended
30 Sep 2018 30 Sep 2017 Change 30 Sep 2018 30 Sep 2017 Change
% %
Net revenue €m 651.4 576.3 13 2,030.0 1,823.3 11
Operating costs €m 260.1 247.4 5 777.5 737.9 5
EBITDA €m 395.1 333.1 19 1,258.7 1,092.8 15
Depreciation and amortisation €m 43.8 40.3 9 126.7 114.7 10
EBIT €m 351.3 292.8 20 1,132.0 978.1 16
Net profit for the period attribut-
able to Deutsche Börse AG
shareholders €m 239.6 198.1 21 772.2
663.1 16
Earnings per share (basic) € 1.30 1.06 23 4.17 3.55 17
6 Deutsche Börse Group quarterly statement Q3/2018
Results of operations by segment in the third quarter of 2018
Eurex (financial derivatives) segment
Eurex (financial derivatives) segment: key indicators
Quarter ended Nine months ended
30 Sep 2018 30 Sep 2017 Change 30 Sep 2018 30 Sep 2017 Change
FINANCIAL KEY FIGURES €m €m % €m €m %
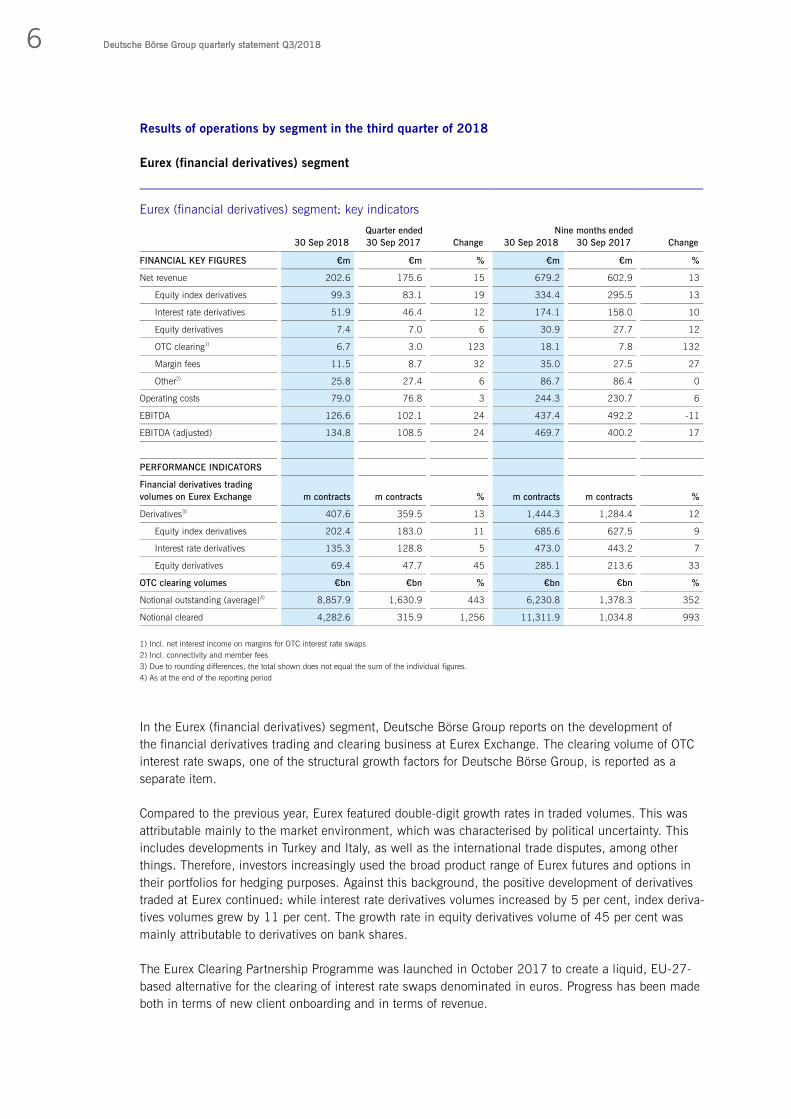
Net revenue 202.6 175.6 15 679.2 602.9 13
Equity index derivatives 99.3 83.1 19 334.4 295.5 13
Interest rate derivatives 51.9 46.4 12 174.1 158.0 10
Equity derivatives 7.4 7.0 6 30.9 27.7 12
OTC clearing1) 6.7 3.0 123 18.1 7.8 132
Margin fees 11.5 8.7 32 35.0 27.5 27
Other2) 25.8 27.4 6 86.7 86.4 0
Operating costs 79.0 76.8 3 244.3 230.7 6
EBITDA 126.6 102.1 24 437.4 492.2 -11
EBITDA (adjusted) 134.8 108.5 24 469.7 400.2 17
PERFORMANCE INDICATORS
Financial derivatives trading
volumes on Eurex Exchange m contracts m contracts % m contracts m contracts %
Derivatives3) 407.6 359.5 13 1,444.3 1,284.4 12
Equity index derivatives 202.4 183.0 11 685.6 627.5 9
Interest rate derivatives 135.3 128.8 5 473.0 443.2 7
Equity derivatives 69.4 47.7 45 285.1 213.6 33
OTC clearing volumes €bn €bn % €bn €bn %
Notional outstanding (average)4) 8,857.9 1,630.9 443 6,230.8 1,378.3 352
Notional cleared 4,282.6 315.9 1,256 11,311.9 1,034.8 993
1) Incl. net interest income on margins for OTC interest rate swaps
2) Incl. connectivity and member fees
3) Due to rounding differences, the total shown does not equal the sum of the individual figures.
4) As at the end of the reporting period
In the Eurex (financial derivatives) segment, Deutsche Börse Group reports on the development of
the financial derivatives trading and clearing business at Eurex Exchange. The clearing volume of OTC
interest rate swaps, one of the structural growth factors for Deutsche Börse Group, is reported as a
separate item.
Compared to the previous year, Eurex featured double-digit growth rates in traded volumes. This was
attributable mainly to the market environment, which was characterised by political uncertainty. This
includes developments in Turkey and Italy, as well as the international trade disputes, among other
things. Therefore, investors increasingly used the broad product range of Eurex futures and options in
their portfolios for hedging purposes. Against this background, the positive development of derivatives
traded at Eurex continued: while interest rate derivatives volumes increased by 5 per cent, index deriva-
tives volumes grew by 11 per cent. The growth rate in equity derivatives volume of 45 per cent was
mainly attributable to derivatives on bank shares.
The Eurex Clearing Partnership Programme was launched in October 2017 to create a liquid, EU-27-
based alternative for the clearing of interest rate swaps denominated in euros. Progress has been made
both in terms of new client onboarding and in terms of revenue.

7 Earnings releases
The increase in revenue from collateral management was due to the removal of the temporary reduc-
tion of processing fees for cash collateral provided by customers (effective 1 April 2018). Since then,
Eurex has reintroduced fees of 20 basis points on cash collateral.
EEX (commodities) segment
EEX (commodities) segment: key indicators
Quarter ended Nine months ended
30 Sep 2018 30 Sep 2017 Change 30 Sep 2018 30 Sep 2017 Change
FINANCIAL KEY FIGURES €m €m % €m €m %
Net revenue 61.6 48.0 28 184.5 153.3 20
Power spot 15.9 14.8 7 49.8 44.9 11
Power derivatives 20.4 12.9 58 57.5 43.0 34
Gas 8.0 6.3 27 26.6 21.9 21
Other 1) 17.3 14.0 24 50.6 43.5 16
Operating costs 35.8 30.1 19 104.3 91.0 15
EBITDA 25.8 17.9 44 80.2 62.3 29
EBITDA (adjusted) 27.1 18.2 49 84.2 64.1 31
PERFORMANCE INDICATORS
Commodities trading volumes
at EEX TWh TWh % TWh TWh %
Power spot 138.0 133.5 3 426.4 403.9 6
Power derivatives2) 1,091.6 733.2 49 3,100.8 2,323.8 33
Gas 460.7 499.6 -8 1,419.9 1,428.7 -1
1) Incl. connectivity, member fees and admission allowance
2) Incl. trading volumes at Nodal Exchange (since May 2017)
In the EEX (commodities) segment, Deutsche Börse Group reports on the EEX group trading platforms
activity, with locations in Europe, Asia and the US. The two most important revenue generators of the
commodities segment are the power and gas markets.
EEX group was able to continue its positive development. During the third quarter of 2018, growth in
the energy spot market was mainly attributable to higher volumes in Belgium. On the German energy
derivatives market, EEX was able to regain market shares (31 per cent in Q3/2018), after the announced
split of the German-Austrian price zone had inflicted great uncertainty on the market last year.
US-based Nodal Exchange, acquired in May 2017, was once more able to expand its market share in
an overall declining market, also characterised by increasing competition. In the fourth quarter of 2018,
Nodal will introduce Deutsche Börse Group’s high-performance trading system T7®, which will permit
additional products to be offered, including emissions trading.
On 12 June 2018, the European Cross-Border Intraday Initiative (XBID) was launched – a power market
platform developed under the initiative of the European Commission. The market liberalisation resulting
from XBID had a positive impact on market competition.

8 Deutsche Börse Group quarterly statement Q3/2018
360T (foreign exchange) segment
360T (foreign exchange) segment: key indicators
Quarter ended Nine months ended
30 Sep 2018 30 Sep 2017 Change 30 Sep 2018 30 Sep 2017 Change
FINANCIAL KEY FIGURES €m €m % €m €m %
Net revenue 20.9 16.6 26 57.0 49.4 15
Trading 17.8 14.2 25 48.7 41.9 16
Other1) 3.1 2.4 29 8.3 7.5 11
Operating costs 9.2 10.7 -14 34.5 34.2 1
EBITDA 11.7 5.9 98 22.5 15.2 48
EBITDA (adjusted) 8.6 7.4 16 24.7 21.9 13
PERFORMANCE INDICATORS
Foreign exchange trading
volumes on 360T® €bn €bn % €bn €bn %
Average daily volume 72.0 58.7 23 67.2 60.3 11
1) Incl. connectivity and member fees
In the 360T (foreign exchange) segment, Deutsche Börse Group reports on the development of the
foreign exchange (FX) trading business executed on the platform of its 360T subsidiary.
The 360T segment generated growth across all product groups given the business expansion with
new customers and increased trading activities of various market participants in the reporting period.
The increase in net revenue was proportionally higher compared to the trading volume – mainly due
to the product mix, which featured larger volumes of products with higher margins.
On 29 June 2018, Deutsche Börse completed the acquisition of GTX. Integration of the new subsidi-
ary is proceeding on schedule.
Besides the central order book for over-the-counter (OTC) transactions, which is still in the introduc-
tion phase and has passed initial proof-of-concept tests, the first liquidity providers were acquired for
FX futures listed at Eurex (Rolling Spot Futures and Classic Futures). Market participants will be able
to use these products for OTC foreign exchange trades as soon as the clearing service trial runs are
completed next year. In close cooperation with the Data segment, 360T launched a product which
delivers spot market data as well as swap market data for currency transactions. The new product is
very positively received by market participants.

9 Earnings releases
Xetra (cash equities) segment
Xetra (cash equities) segment: key indicators
Quarter ended Nine months ended
30 Sep 2018 30 Sep 2017 Change 30 Sep 2018 30 Sep 2017 Change
FINANCIAL KEY FIGURES €m €m % €m €m %
Net revenue 53.3 52.6 1 170.5 159.1 7
Trading and clearing 39.7 39.1 2 128.9 119.0 8
Listing 4.1 3.9 5 11.9 10.4 14
Other1) 9.5 9.6 -1 29.7 29.7 0
Operating costs 25.3 26.1 -3 79.6 78.9 1
EBITDA 29.4 27.5 7 95.3 83.9 14
EBITDA (adjusted) 30.2 28.6 6 101.6 88.7 15
PERFORMANCE INDICATORS
Trading volume2) €bn €bn % €bn €bn %
Equities 350.8 319.8 10 1,164.6 968.7 20
ETF/ETC/ETN 34.1 33.1 3 127.0 110.8 15
1) Incl. connectivity and member fees
2) Single-counted order book turnover at the trading venues Xetra®, Börse Frankfurt and Tradegate
In the Xetra (cash equities) segment, Deutsche Börse Group reports on the development of its cash
market trading venues (Xetra®, Frankfurt Stock Exchange and Tradegate). Besides trading and clearing
services, Deutsche Börse generates revenue from the admission and listing of securities, from connect-
ing clients to their trading venues, and through services for partner exchanges.
The Xetra segment once again generated solid growth rates. Trading volumes increased by 10 per cent
during the third quarter of 2018. Compared to its major European competitors, Xetra is the cash mar-
ket with the highest growth rate.
However, the segment’s revenue did not grow at the same pace. The main reason for this was that the
mix of clients and their activities – in particular, by and after the introduction of the new trading system
T7 and the corresponding adjustments – resulted in different average margins.

10 Deutsche Börse Group quarterly statement Q3/2018
Clearstream (post-trading) segment
Clearstream (post-trading) segment: key indicators
Quarter ended Nine months ended
30 Sep 2018 30 Sep 2017 Change 30 Sep 2018 30 Sep 2017 Change
FINANCIAL KEY FIGURES €m €m % €m €m %
Net revenue 184.0 158.2 16 543.6 487.0 12
Custody 94.5 93.9 1 285.2 282.9 1
Settlement 17.6 17.4 1 57.0 58.8 -3
Net interest income from
banking business 38.0 25.8 47 111.9 75.8 48
Third party services 6.6 7.2 -8 26.0 19.6 33
Other1) 27.3 13.9 96 63.5 49.9 27
Operating costs 78.4 65.9 19 227.7 209.3 9
EBITDA 105.3 92.3 14 315.7 277.7 14
EBITDA (adjusted) 109.9 95.6 15 335.5 297.0 13
PERFORMANCE INDICATORS % %
Assets under custody ICSD and
CSD (average) (€bn) 11,373.3 11,146.9 2 11,294.3 11,238.6 0
Settlement transactions ICSD (m) 11.3 10.7 6 35.7 32.7 10
Cash balances (daily average)
(€bn) 12.6 12.4 2 12.9 13.8 -7
1) Incl. connectivity, account maintenance
In the Clearstream (post-trading) segment, Deutsche Börse Group reports the settlement and custody
businesses as well as net interest income from Clearstream’s banking business.
Net revenue comprise €9.3 million related to insurance services. Adjusted for this exceptional item, net
revenue increased by 10 per cent year-on-year. However, Clearstream’s growth in Q3/2018 was mainly
driven by its net interest income generated with daily cash balances. This was particularly due to rising
interest rate levels in the US given that around 55 per cent of cash deposits are denominated in US
dollar. In Clearstream’s third party services, net revenues in the regulatory reporting services business
offered via REGIS-TR further went up 12 per cent year-on-year. This increase partially compensated a
decrease of net revenues in Clearstream’s managed services business.

11 Earnings releases
IFS (investment fund services) segment
IFS (investment fund services) segment: key indicators
Quarter ended Nine months ended
30 Sep 2018 30 Sep 2017 Change 30 Sep 2018 30 Sep 2017 Change
FINANCIAL KEY FIGURES €m €m % €m €m %
Net revenue 37.3 35.3 6 114.1 102.5 11
Custody 16.8 15.1 11 49.3 45.4 9
Settlement 11.7 11.4 3 37.2 33.7 10
Other1) 8.8 8.8 0 27.6 23.4 18
Operating costs 22.1 19.7 12 69.4 61.0 14
EBITDA 15.2 15.6 -3 44.7 41.3 8
EBITDA (adjusted) 16.7 16.1 4 51.7 43.4 19
PERFORMANCE INDICATORS % %
Assets under custody (average)
(€ billion) 2,401.1 2,225.8 8 2.387.7 2.181,3 9
Settlement transactions (m) 5.8 5.3 9 18.4 16.7 10
1) Incl. connectivity, order routing, reporting fees
In the IFS (investment fund services) segment, Deutsche Börse Group reports settlement activity and
custody volumes of exchange-traded, mutual and hedge funds processed by Clearstream. Customers are
able to settle and manage their entire fund portfolio via Clearstream’s Vestima® fund processing platform.
The value of assets under custody continued its growth trend in the third quarter of 2018 mainly due to
new client wins. In addition, tailwinds from a higher market valuation of assets further boosted net reve-
nue growth in the custody business year-on-year. The increase in settlement transaction volumes was
again due to livelier trading activities compared to the same period of the previous year.

12 Deutsche Börse Group quarterly statement Q3/2018
GSF (collateral management) segment
GSF (collateral management) segment: key indicators
Quarter ended Nine months ended
30 Sep 2018 30 Sep 2017 Change 30 Sep 2018 30 Sep 2017 Change
FINANCIAL KEY FIGURES €m €m % €m €m %
Net revenue 21.4 20.4 5 61.5 61.1 1
Repo 11.2 11.2 0 32.7 32.1 2
Securities lending 10.2 9.2 11 28.8 29.0 -1
Operating costs 10.1 8.9 13 31.6 26.5 19
EBITDA 11.3 11.5 -2 29.9 34.6 -14
EBITDA (adjusted) 11.8 11.9 -1 33.1 35.9 -8
PERFORMANCE INDICATORS €bn €bn % €bn €bn %
Average outstandings from repo 379.9 391.2 -3 376.8 403.5 -7
Average outstandings from
securities lending 50.9 60.0 -15 55.2 60.6 -9
In the GSF (collateral management) segment, Deutsche Börse Group reports business development
at Clearstream’s collateral management.
Average outstandings in the repo market slightly declined once again compared to the same period of the
previous year. Due to positive effects from regulation with regards to initial-margin segregation as well as
slightly increased activity of buy-side customers, net revenue remained stable year-on-year. In the securi-
ties lending business, average outstanding volumes also decreased compared to the same period of the
previous year, whereas net revenue went up due to the product mix.
13 Earnings releases
STOXX (index) segment
STOXX (index) segment: key indicators
Quarter ended Nine months ended
30 Sep 2018 30 Sep 2017 Change 30 Sep 2018 30 Sep 2017 Change
FINANCIAL KEY FIGURES €m €m % €m €m %
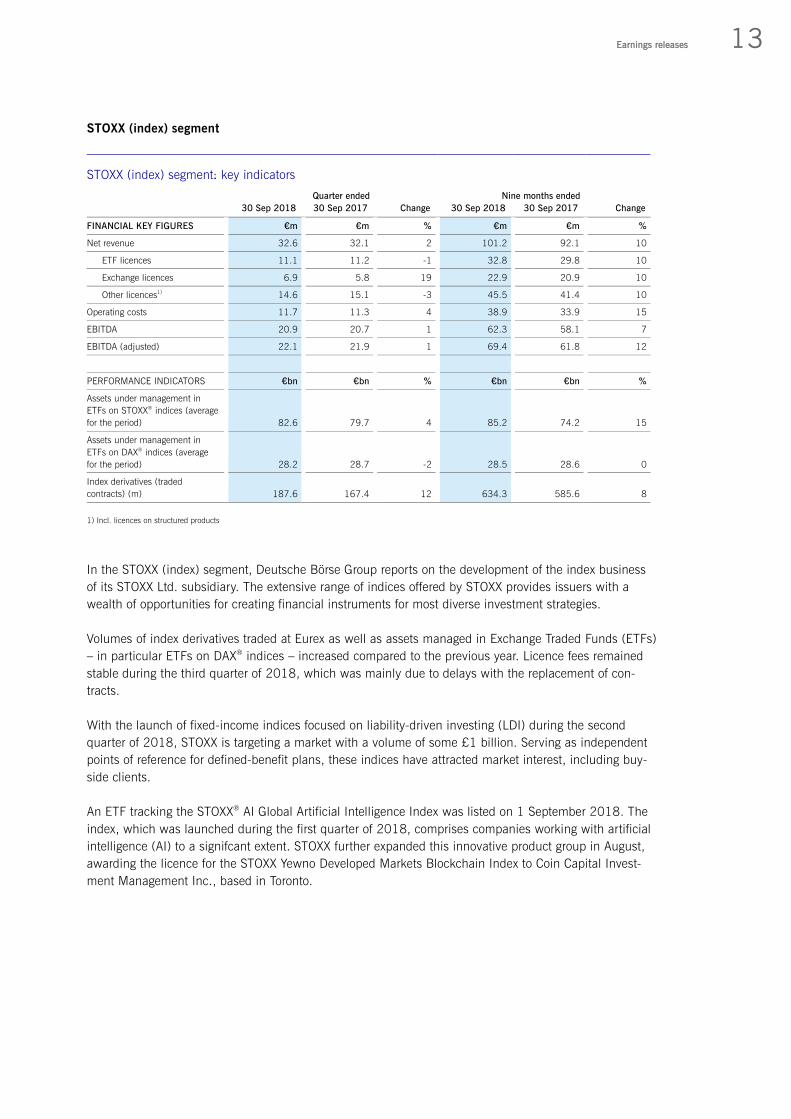
Net revenue 32.6 32.1 2 101.2 92.1 10
ETF licences 11.1 11.2 -1 32.8 29.8 10
Exchange licences 6.9 5.8 19 22.9 20.9 10
Other licences1) 14.6 15.1 -3 45.5 41.4 10
Operating costs 11.7 11.3 4 38.9 33.9 15
EBITDA 20.9 20.7 1 62.3 58.1 7
EBITDA (adjusted) 22.1 21.9 1 69.4 61.8 12
PERFORMANCE INDICATORS €bn €bn % €bn €bn %
Assets under management in
ETFs on STOXX® indices (average
for the period) 82.6 79.7 4 85.2 74.2 15
Assets under management in
ETFs on DAX® indices (average
for the period) 28.2 28.7 -2 28.5 28.6 0
Index derivatives (traded
contracts) (m) 187.6 167.4 12 634.3 585.6 8
1) Incl. licences on structured products
In the STOXX (index) segment, Deutsche Börse Group reports on the development of the index business
of its STOXX Ltd. subsidiary. The extensive range of indices offered by STOXX provides issuers with a
wealth of opportunities for creating financial instruments for most diverse investment strategies.
Volumes of index derivatives traded at Eurex as well as assets managed in Exchange Traded Funds (ETFs)
– in particular ETFs on DAX® indices – increased compared to the previous year. Licence fees remained
stable during the third quarter of 2018, which was mainly due to delays with the replacement of con-
tracts.
With the launch of fixed-income indices focused on liability-driven investing (LDI) during the second
quarter of 2018, STOXX is targeting a market with a volume of some £1 billion. Serving as independent
points of reference for defined-benefit plans, these indices have attracted market interest, including buy-
side clients.
An ETF tracking the STOXX® AI Global Artificial Intelligence Index was listed on 1 September 2018. The
index, which was launched during the first quarter of 2018, comprises companies working with artificial
intelligence (AI) to a signifcant extent. STOXX further expanded this innovative product group in August,
awarding the licence for the STOXX Yewno Developed Markets Blockchain Index to Coin Capital Invest-
ment Management Inc., based in Toronto.

14 Deutsche Börse Group quarterly statement Q3/2018
Data segment
Data segment: key indicators
Quarter ended Nine months ended
30 Sep 2018 30 Sep 2017 Change 30 Sep 2018 30 Sep 2017 Change
FINANCIAL KEY FIGURES €m €m % €m €m %
Net revenue 47.0 37.5 25 127.7 115.9 10
Cash and derivatives data 31.8 26.2 21 86.3 82.0 5
Regulatory services 4.1 2.3 78 12.0 8.2 46
Other1) 11.1 9.0 23 29.4 25.7 14
Operating costs 17.5 13.8 27 51.0 42.8 19
EBITDA 29.2 23.7 23 76.2 73.1 4
EBITDA (adjusted) 33.9 24.9 36 88.8 79.8 11
PERFORMANCE INDICATORS thousand thousand % thousand thousand %
Subscriptions 358.3 433.9 -17 386.4 441.0 -12
1) Incl. CEF® data services
In the Data segment, Deutsche Börse Group reports on the development of its business concerning
licences for real-time trading and market signals, together with the supply of historical data and analytics.
The most important products in this respect are order book data from the cash and derivatives markets,
as well as reference data of Deutsche Börse and its partner exchanges. Revenue from regulatory services
is explicitly disclosed as a secular growth factor.
Net revenue generated by the Data segment increased markedly during the third quarter of 2018,
mainly driven by higher revenue from client audits and the launch of new products. Net revenue from
regulatory services also increased. This growth was partly due to Deutsche Börse’s Regulatory Reporting
Hub which was rolled out at the beginnung of the year and is currently undergoing further technical
development.

15 Earnings releases
Financial position
The company’s clients generally expect it to maintain conservative interest coverage and leverage ratios.
and to achieve good credit ratings. Therefore, the Group targets a minimum consolidated interest cover-
age ratio (defined as the ratio of EBITDA to interest expenses from financing activities) of 16 at Group
level. During the third quarter of 2018. Deutsche Börse Group achieved this target with an interest cov-
erage ratio of 41.4 (Q3/2017: 33.6). This figure is based on relevant interest expenses of €30.4 million
and adjusted EBITDA of €1,258.7 million.
Moreover. Deutsche Börse Group targets a maximum ratio of interest-bearing gross debt to EBITDA of 1.5
at Group level. During the third quarter of 2018, the Group achieved a 1.2 ratio of gross debt to EBITDA.
This figure is based on gross debt of €1,981.8 million, and adjusted EBITDA of €1,258.7 million.
Report on post-balance sheet date events
There have been no material events after the balance sheet date.
Risks and opportunities
Deutsche Börse Group provides detailed information on its operating environment, strategy, principles,
organisation, processes, methods and concepts of its risk management as well as the measures imple-
mented to manage or minimise risks in its 2017 financial report on pages 88 to 112. Detailed infor-
mation about the Group’s opportunities and opportunities management can be found also in the
2017 financial report on pages 113 to 119.
At present, the Executive Board cannot identify any significant change in the Group’s risk and oppor-
tunity profile.

16 Deutsche Börse Group quarterly statement Q3/2018
Outlook
For the remainder of financial year 2018, Deutsche Börse Group does not expect any material devia-
tion from the forecasts for its operating environment made in its 2017 consolidated financial
statements.
For the forecast period, Deutsche Börse Group expects at least a 5 per cent increase in net revenue,
emanating from structural growth opportunities and from successful new products and functionalities.
For the fourth quarter of 2018, the Group expects that the cyclical framework conditions will continue to
produce the positive development observed during the first nine months of the year, contributing to the
further increase in net revenue.
Given the expected increase in net revenue driven by secular factors of at least 5 per cent, and further
given the scalability of the Group’s business model and its efficient cost management, the Group
anticipates a growth rate of at least 10 per cent (excluding exceptional items) for net profit for the period
attributable to Deutsche Börse AG shareholders and thus confirms its forecast for the financial year 2018.
The assumptions on which the forecast is based, together with the reconciliation of net revenue and
operating costs (incl. depreciation and amortisation), are set out on pages 119 to 126 of the 2017
financial report.

17 Shortened financial statements
for the period 1 January to 30 September 2018
Quarter ended Nine months ended
30 Sep 2018 30 Sep 2017 30 Sep 2018 30 Sep 2017
(restated) (restated)
€m €m €m €m
Sales revenue 678.0 629.4 2,130.7 1,961.6
Net interest income from banking business 48.6 32.1 144.5 95.5
Other operating income 18.5 5.1 26.8 18.0
Total revenue 745.1 666.6 2,302.0 2,075.1
Volume-related costs -84.4 -90.3 -262.7 -251.8
Net revenue (total revenue less volume-related costs) 660.7 576.3 2,039.3 1,823.3
Staff costs -173.1 -153.9 -547.1 -470.6
Other operating expenses -116.0 -109.4 -334.2 -337.7
Operating costs1) -289.1 -263.3 -881.3 -808.3
Net income from strategic investments 3.8 4.2 6.2 123.4
Earnings before interest, tax, depreciation and amortisation
(EBITDA) 375.4 317.2 1,164.2 1,138.4
Depreciation, amortisation and impairment losses -44.1 -40.7 -143.8 -116.2
Earnings before interest and tax (EBIT) 331.3 276.5 1,020.4 1,022.2
Financial income 0.6 0.6 6.2 3.5
Financial expense -15.7 -19.7 -54.2 -59.0
Earnings before tax (EBT) 316.2 257.4 972.4 966.7
Other tax -0.1 -0.4 -0.5 -1.1
Income tax expense -85.2 -48.4 -268.4 -290.3
Net profit for the period 230.9 208.6 703.5 675.3
thereof attributable to Deutsche Börse AG shareholders 225.0 204.3 684.3 660.7
thereof attributable to non-controlling interests 5.9 4.3 19.2 14.6
Earnings per share (basic) (€) 1.22 1.09 3.69 3.53
Earnings per share (diluted) (€) 1.22 1.09 3.69 3.53
1) Since the second quarter of 2017, operating costs have contained staff costs and other operating expenses; depreciation, amortisation and impairment losses
are disclosed separately. Prior-year figures have been adjusted accordingly.
Consolidated income statement

18 Deutsche Börse Group quarterly statement Q3/2018
Consolidated balance sheet as at 30 September 2018
Assets
30 Sep 2018 1 Jan 2018 31 Dec 2017 30 Sep 2017
(restated) (restated)
€m €m €m €m
NON-CURRENT ASSETS
Intangible assets
Software 337.3 322.1 322.1 311.5
Goodwill 2,826.7 2,770.9 2,770.9 2,771.9
Payments on account and construction in progress 57.5 86.8 86.8 93.6
Other intangible assets 917.3 911.2 911.2 918.4
4,138.8 4,091.0 4,091.0 4,095.4
Property, plant and equipment
Fixtures and fittings 30.7 34.8 34.8 34.6
Computer hardware, operating and office equipment 73.5 76.4 76.4 74.2
Payments on account and construction in progress 12.4 2.2 2.2 2.3
116.6 113.4 113.4 111.1
Financial assets
Investments in associates and joint ventures 40.2 38.7 38.7 38.6
Equity investments measured at fair value through OCI 103.5 101.6 0 0
Financial assets measured at amortised cost 1,068.9 1,574.1 0 0
Financial assets at fair value through profit or loss (FVPL) 17.8 15.9 0 0
Derivatives 0 0.1 0 0
Available-for-sale equity investments (AFS) 0 0 99.4 168.1
Financial assets available-for-sale (AFS) 0 0 1,592.6 1,591.0
Financial assets at fair value through profit or loss (fair value option) 0 0 1.2 0
Derivatives (held for trading) 0 0 0.1 0.1
Loans and receivables 0 0 4.9 5.9
1,230.4 1,730.4 1,736.9 1,803.7
Financial instruments of the central counterparties 6,729.6 4,837.2 4,837.2 6,143.8
Other non-current assets 4.1 4.1 4.1 4.1
Deferred tax assets 92.4 101.4 101.1 98.5
Total non-current assets 12,311.9 10,877.5 10,883.7 12,256.6
CURRENT ASSETS
Receivables and other current assets
Financial instruments of the central counterparties 93,938.5 79,510.7 79,510.7 97,800.1
Financial assets measured at amortised cost 17,491.1 13,172.6 0 0
Financial assets at fair value through profit or loss (FVPL) 1.0 1.5 0 0
Derivatives 2.0 5.2 5.2 3.1
Financial assets available-for-sale (AFS) 0 0 254.5 260.2
Loans and receivables 0 0 12,922.8 15,253.3
Trade receivables 377.1 330.9 329.4 364.8
Receivables from related parties 1.4 2.5 2.5 1.6
Income tax receivables 99.5 91.3 91.3 112.5
Other current assets 618.4 451.7 451.7 364.0
112,529.0 93,566.4 93,568.1 114,159.6
Restricted bank balances 29,346.4 29,392.0 29,392.0 27,381.1
Other cash and bank balances 999.3 1,297.6 1,297.6 1,447.5
Total current assets 142,874.7 124,256.0 124,257.7 142,988.2
Total assets 155,186.6 135,133.5 135,141.4 155,244.8
19 Shortened financial statements
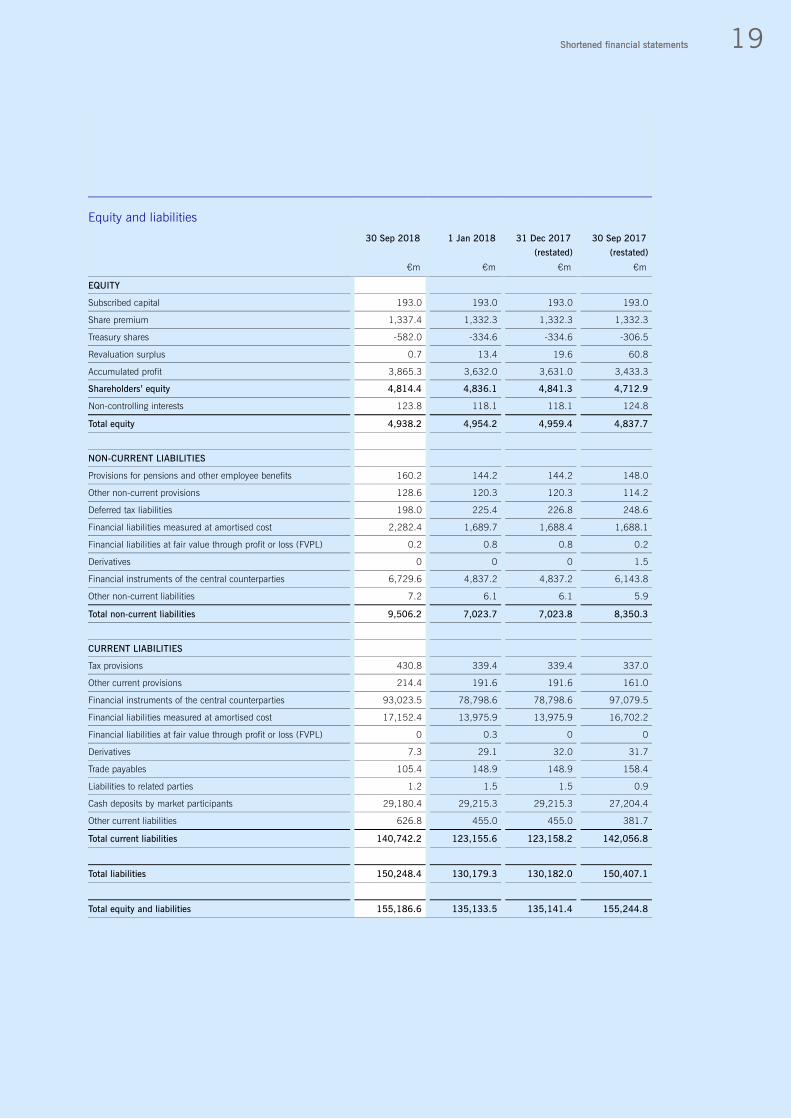
Equity and liabilities
30 Sep 2018 1 Jan 2018 31 Dec 2017 30 Sep 2017
(restated) (restated)
€m €m €m €m
EQUITY
Subscribed capital 193.0 193.0 193.0 193.0
Share premium 1,337.4 1,332.3 1,332.3 1,332.3
Treasury shares -582.0 -334.6 -334.6 -306.5
Revaluation surplus 0.7 13.4 19.6 60.8
Accumulated profit 3,865.3 3,632.0 3,631.0 3,433.3
Shareholders’ equity 4,814.4 4,836.1 4,841.3 4,712.9
Non-controlling interests 123.8 118.1 118.1 124.8
Total equity 4,938.2 4,954.2 4,959.4 4,837.7
NON-CURRENT LIABILITIES
Provisions for pensions and other employee benefits 160.2 144.2 144.2 148.0
Other non-current provisions 128.6 120.3 120.3 114.2
Deferred tax liabilities 198.0 225.4 226.8 248.6
Financial liabilities measured at amortised cost 2,282.4 1,689.7 1,688.4 1,688.1
Financial liabilities at fair value through profit or loss (FVPL) 0.2 0.8 0.8 0.2
Derivatives 0 0 0 1.5
Financial instruments of the central counterparties 6,729.6 4,837.2 4,837.2 6,143.8
Other non-current liabilities 7.2 6.1 6.1 5.9
Total non-current liabilities 9,506.2 7,023.7 7,023.8 8,350.3
CURRENT LIABILITIES
Tax provisions 430.8 339.4 339.4 337.0
Other current provisions 214.4 191.6 191.6 161.0
Financial instruments of the central counterparties 93,023.5 78,798.6 78,798.6 97,079.5
Financial liabilities measured at amortised cost 17,152.4 13,975.9 13,975.9 16,702.2
Financial liabilities at fair value through profit or loss (FVPL) 0 0.3 0 0
Derivatives 7.3 29.1 32.0 31.7
Trade payables 105.4 148.9 148.9 158.4
Liabilities to related parties 1.2 1.5 1.5 0.9
Cash deposits by market participants 29,180.4 29,215.3 29,215.3 27,204.4
Other current liabilities 626.8 455.0 455.0 381.7
Total current liabilities 140,742.2 123,155.6 123,158.2 142,056.8
Total liabilities 150,248.4 130,179.3 130,182.0 150,407.1
Total equity and liabilities 155,186.6 135,133.5 135,141.4 155,244.8

20 Deutsche Börse Group quarterly statement Q3/2018
Contact
Investor Relations
Phone +49-(0) 69- 2 11-1 16 70
Fax +49-(0) 69- 2 11-1 46 08
E-mail [email protected]
www.deutsche-boerse.com/ir_e
Publication date
29 October 2018
Publications service
The 2017 corporate report may be obtained from
the publications service of Deutsche Börse Group.
Phone +49-(0) 69- 2 11-1 15 10
Fax +49-(0) 69- 2 11-1 15 11
Downloads at
www.deutsche-boerse.com/annualreport
Reproduction – in whole or in part – only with
the written permission of the publisher
Registered trademarks
DAX®, Eurex®, T7®, VDAX® and Xetra® are registered
trademarks of Deutsche Börse AG. Vestima® is a
registered trademark of Clearstream International S.A.
STOXX® is a registered trademark of STOXX Ltd. 360T®
is a registered trademark of 360 Treasury Systems AG.
TRADEGATE® is a registered trademark of Tradegate AG.

Published byDeutsche Börse AG60485 Frankfurt /MainGermanywww.deutsche-boerse.com
Order number 1015-4815
Financial calendar29 October 2018Publication Q3 / 2018 results