Embed Size (px)
Citation preview
Quasi-Static Binary Analysis
Hassen Saidi
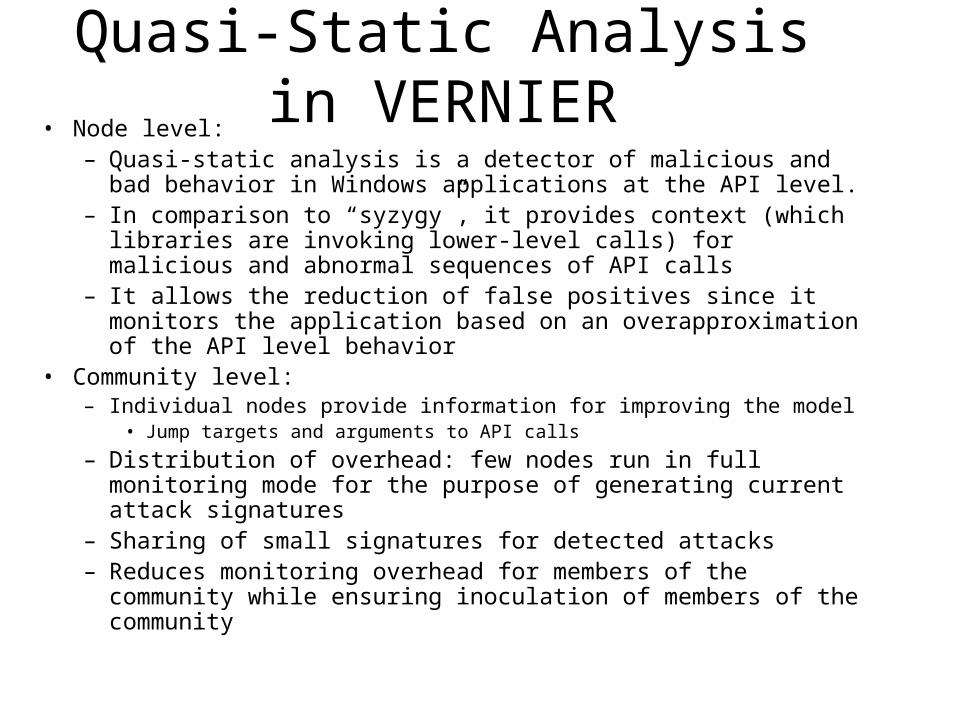
Quasi-Static Analysis in VERNIER
• Node level:– Quasi-static analysis is a detector of malicious and bad
behavior in Windows applications at the API level.– In comparison to “syzygy”, it provides context (which libraries
are invoking lower-level calls) for malicious and abnormal sequences of API calls
– It allows the reduction of false positives since it monitors the application based on an overapproximation of the API level behavior
• Community level:– Individual nodes provide information for improving the model
• Jump targets and arguments to API calls
– Distribution of overhead: few nodes run in full monitoring mode for the purpose of generating current attack signatures
– Sharing of small signatures for detected attacks– Reduces monitoring overhead for members of the community
while ensuring inoculation of members of the community
Approach: Detection Through API Monitoring
• Monitor API Calls initiated by an application:– Monitor user level API calls: provide context
for kernel-level API calls
• Deviations from a conservative model of API calls is bad behavior
Model
• For any Windows executable file:– Capture DLL dependencies: static and
dynamic– Capture API calls order (CFG)– Capture statically determined API calls
arguments
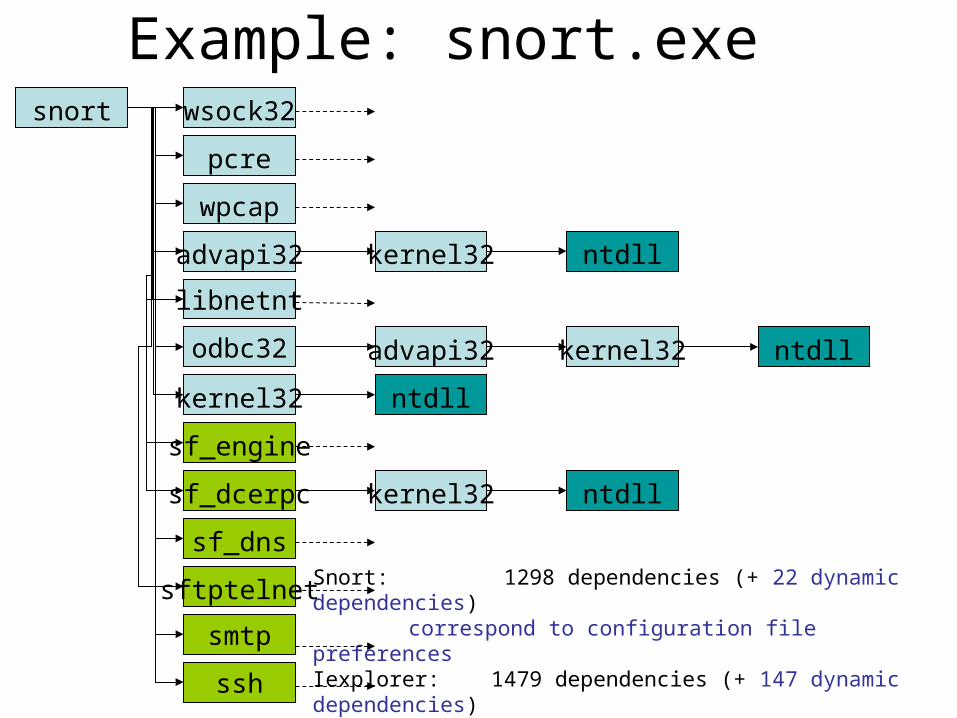
Example: snort.exesnort wsock32
sftptelnet
sf_dns
sf_dcerpc
sf_engine
wpcap
advapi32
libnetnt
odbc32
kernel32
pcre
ssh
smtp
kernel32
kernel32
advapi32
ntdll
ntdll
ntdll
kernel32 ntdll
Snort: 1298 dependencies (+ 22 dynamic dependencies) correspond to configuration file preferencesIexplorer: 1479 dependencies (+ 147 dynamic dependencies)
correspond to initialization of IE
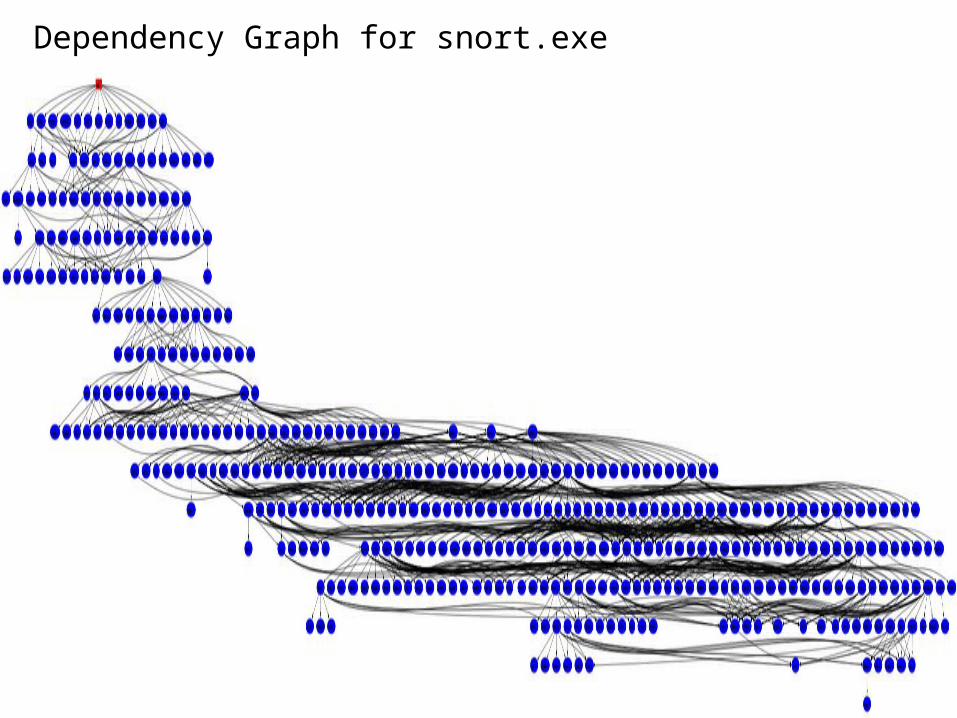
Dependency Graph for snort.exe
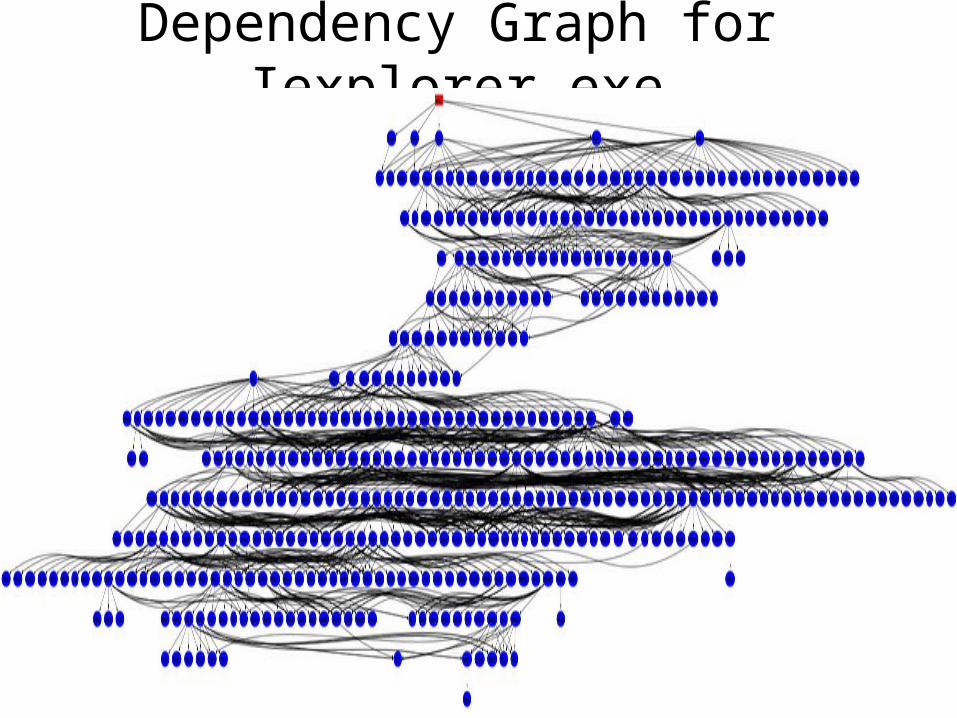
Dependency Graph for Iexplorer.exe
Model (2)
• Dll dependencies:– Calls to APIs from different dlls– Capture the CFG of .exe and .dll files– Capture statically determined arguments of
API calls
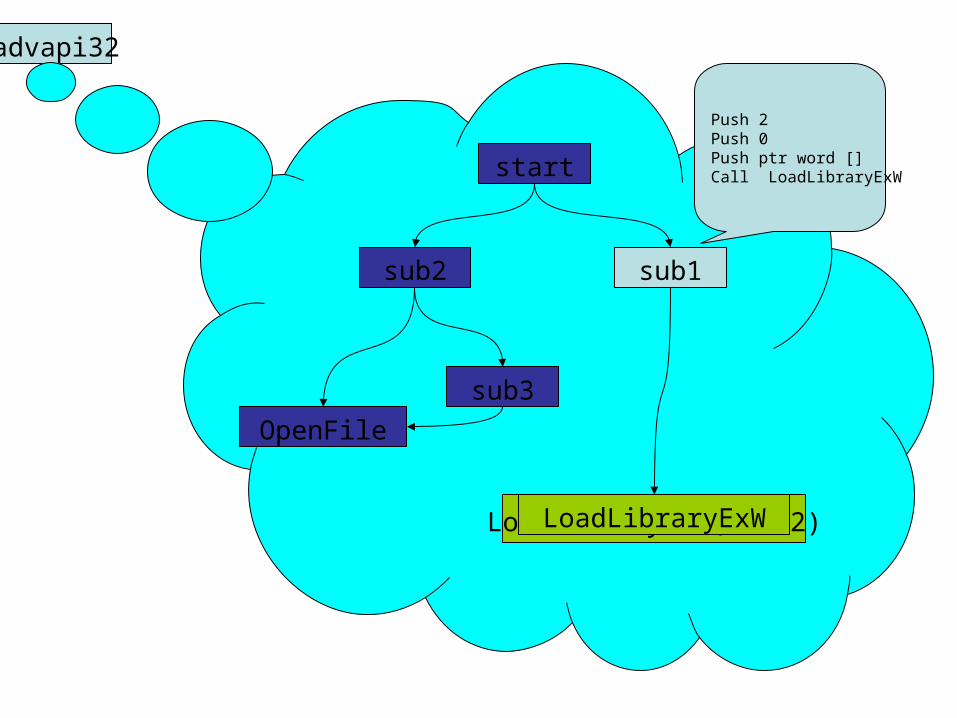
advapi32
start
sub1
LoadLibraryExW(?,0,2)
sub2
OpenFile
sub3
Push 2Push 0Push ptr word []Call LoadLibraryExW
LoadLibraryExW
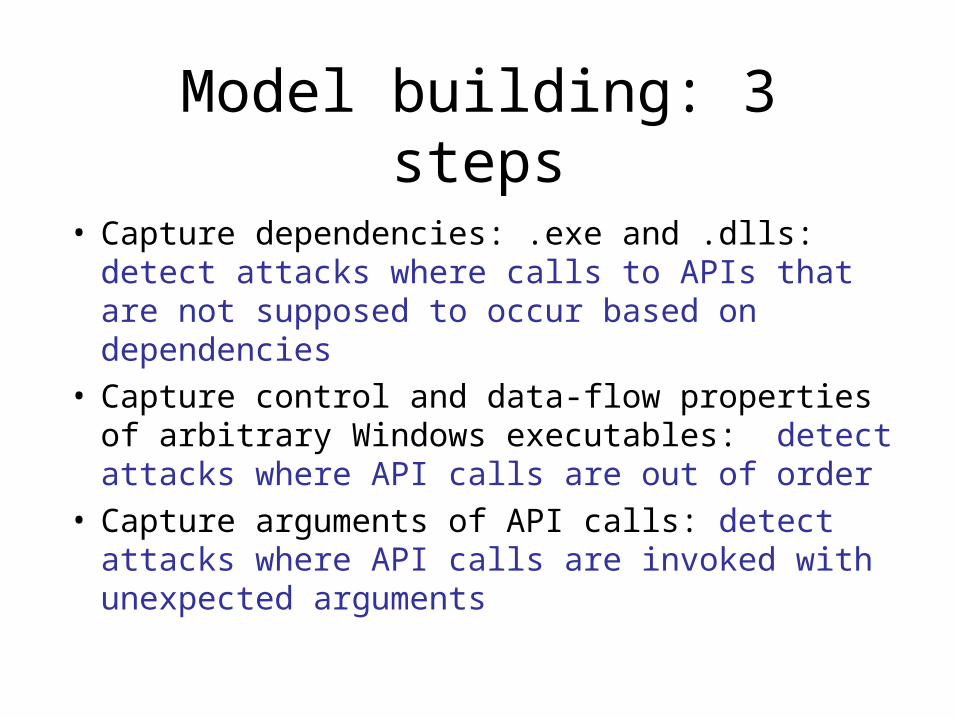
Model building: 3 steps
• Capture dependencies: .exe and .dlls: detect attacks where calls to APIs that are not supposed to occur based on dependencies
• Capture control and data-flow properties of arbitrary Windows executables: detect attacks where API calls are out of order
• Capture arguments of API calls: detect attacks where API calls are invoked with unexpected arguments
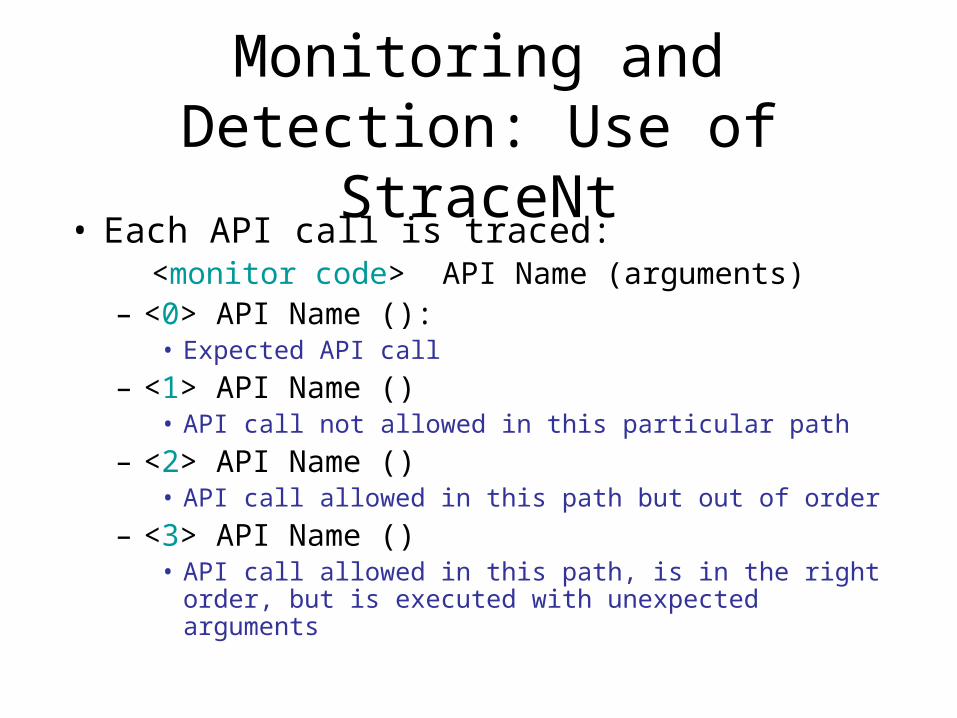
• Each API call is traced: <monitor code> API Name (arguments)– <0> API Name ():
• Expected API call
– <1> API Name ()• API call not allowed in this particular path
– <2> API Name ()• API call allowed in this path but out of order
– <3> API Name ()• API call allowed in this path, is in the right order, but is
executed with unexpected arguments
Monitoring and Detection: Use of StraceNt
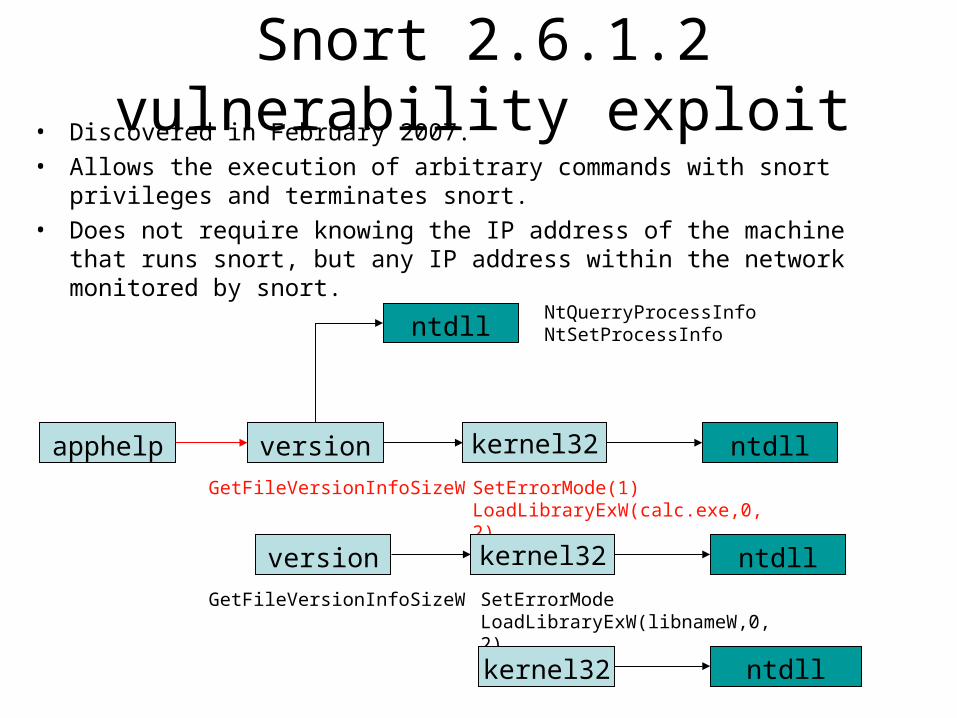
Snort 2.6.1.2 vulnerability exploit• Discovered in February 2007.
• Allows the execution of arbitrary commands with snort privileges and terminates snort.
• Does not require knowing the IP address of the machine that runs snort, but any IP address within the network monitored by snort.
apphelp version kernel32 ntdll
ntdllNtQuerryProcessInfoNtSetProcessInfo
SetErrorMode(1)LoadLibraryExW(calc.exe,0,2)
GetFileVersionInfoSizeW
version kernel32 ntdll
SetErrorModeLoadLibraryExW(libnameW,0,2)
GetFileVersionInfoSizeW
kernel32 ntdll
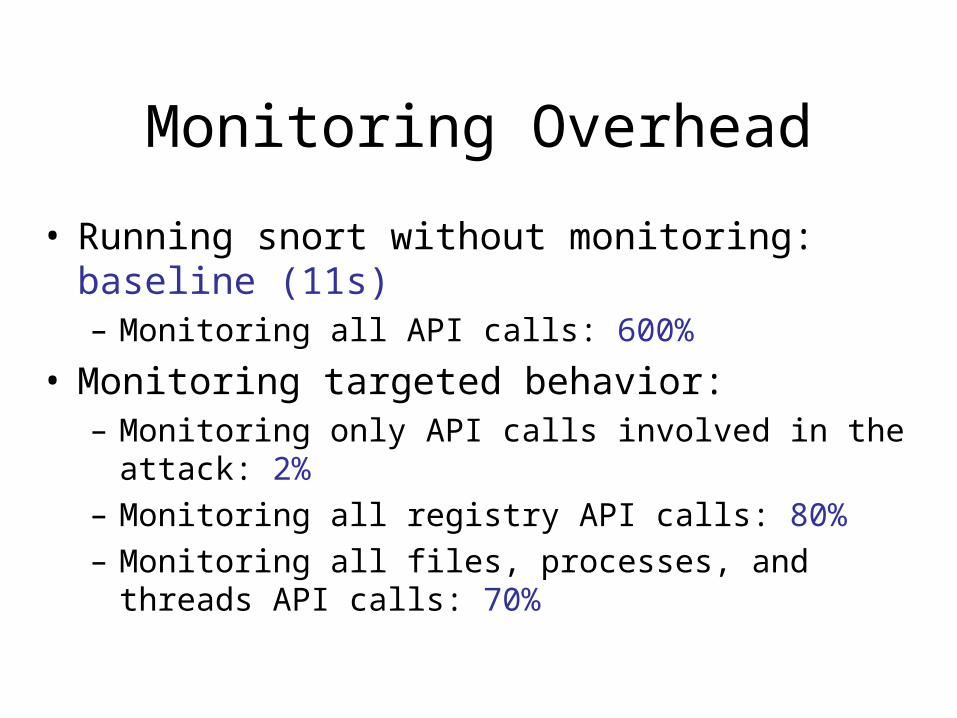
Monitoring Overhead
• Running snort without monitoring: baseline (11s)– Monitoring all API calls: 600%
• Monitoring targeted behavior:– Monitoring only API calls involved in the attack: 2% – Monitoring all registry API calls: 80%– Monitoring all files, processes, and threads API calls:
70%
Signature Generation and Distribution
• The signature of the attack is the set of API calls that are either – 1.unexpected – 2.invoked out of order– Or invoked with the wrong arguments as well as the
dlls in the paths of the attack.
• Nodes in the community are informed of the attack using the signature. Monitoring the applications requires just the signature and not the entire model (2% overhead in monitoring)
Evaluation Plan• Agree on a set of applications, platforms,
configurations…• Unit test for bad behavior• Classes of attacks covered:
– Deviations from call sequence behavior• Unexpected call• Out of order call• Call with unexpected arguments
• Measure the benefits for the community: Reduction of the number of nodes affected by a given attack
Evaluation Plan
• Measure the speed by which attack signatures are shared with the community: unlikely to detect flush worms in time, but we will measure the speed of knowledge sharing for interactive applications (office) and reactive applications (network services)
• Performance Measure: Total overhead at the community level• Measure how much information the dynamic analysis must
provide to support static analysis: how many indirect calls have to be resolved, and how many arguments need to be determined dynamically.
• Measure how many attacks are detected for known exploits and for known services.
Next Steps• Continue experimenting with attacks in the wild:
– all attacks that we experimented with are attacks in the wild
• Use policy-based monitoring based on inputs from the community and other VERNIER sensors:– monitor only network behavior, registry behavior, file
manipulation behavior, etc– Evaluate trade-offs between overhead and attack
detections• Define a set of APIs to monitor all the time with an overall loss
of performance in accordance with the VERNIER metrics