Embed Size (px)
Citation preview
DEPARTMENT OF EDUCATION, TRAINING AND EMPLOYMENT
Queensland State School Reporting – 2011
Roma State College (5666)
Postal address PO Box 623 Roma 4455
Phone (07) 4620 1333
Fax (07) 4620 1300
Email [email protected]
Webpages Additional reporting information pertaining to Queensland state schools is located on the My School website and the Department’s Right to Information site.
Contact Person Anthony Green Principal Roma State College
Principal’s foreword
Introduction
Roma State College is located in Roma, the major provincial centre for government, industry and business in the ‘Maranoa District.
Roma State College is a co-educational Prep to Year 12 College and operates three campuses. Roma State College Junior Campus, at 28 Bowen Street; Middle Campus, at Cottell Street and Senior Campus, at Timbury Street Roma. A Special Education Program embracing a broad range of disabilities operates across all three campuses.
Life and learning at Roma State College encourages students and staff to embrace new positive learning experiences and challenges that engage both mind and body .We have a clear focus on creating learning opportunities for students that allow them to discover their strengths and help them to pursue their goals and aspirations.
Roma State College mission is to value individuals across every age and stage to prepare lifelong learners for a successful and responsible future.
Roma State College has a strong and comprehensive core education program, with strong community ties, including partnerships with numerous local industry /business/government agencies.
Roma State College has developed integrated programs for senior students to access TAFE Certificate and Diploma courses, along with a range of academic and vocational programs.
This annual report outlines the achievements and highlights of the college in 2011.

DEPARTMENT OF EDUCATION, TRAINING AND EMPLOYMENT
Queensland State School Reporting – 2011
Roma State College (5666)
School progress towards its goals in 2011
Throughout 2011, Roma State College continued to comprehensively review and improve all aspects of school operations.
In review focused on
Enrolment trends
School – community relationships
ICT infrastructure and capacity
Curriculum program Prep-Year 10 ( Implementation of Australian Curriculum)
OP potential and performance of Year 12 students
School climate survey( strong focus on staff morale and parent satisfaction survey)
NAPLAN strategies ( student performance in Years 3,5,7 and 9)
Financial management
Student attendance
Future outlook
Roma State College is committed to a continuous improvement agenda,
Quality teaching and Learning, A focus on improved teaching of reading across the college. Further work to embed Australian Curriculum English, Mathematics and Science.
Roma State College has enhanced the learning opportunities of Senior students with the introduction of the 1:1 laptop program that has provided their own personal device. By embracing the digital learning platform our students are able to gain the benefits that technology brings to the school learning environment allowing them to maximise learning in spaces and times that best suit individual learning.
Roma State College is committed to maximising student achievement for all our students.

Our school at a glance
School Profile
Record:
Coeducational or single sex: Coeducational
Year levels offered: Prep - Year 12
Total student enrolments for this school:
Total Enrolment Girls Boys Enrolment Continuity (Feb 2011 – Nov 2011)
881 403 478 87%
Characteristics of the student body:
Roma State College serves the Maranoa regional area. The College has a large number of students who travel to school via bus from the surrounding areas of Mitchell, Surat, Injune and Wallumbilla. There are a number of students who reside at the Roma Student Hostel on a weekly basis.
The College has increasing enrolments of students from Non English speaking backgrounds. The main occupation groups for residents are agriculture and mining development. On leaving school the majority of students go directly into the workforce, moving into apprenticeships or traineeships, mostly as a continuation of their school based apprenticeship or traineeship.
Approximately 25% go on to further study.
Class sizes – Proportion of school classes achieving class size targets in 2011
Phase Average Class Size
Prep – Year 3 23.3
Year 4 – Year 10 20.9
Year 11 – Year 12 13.7
All Classes 17.2
School Disciplinary Absence
Disciplinary Absences Count of Incidents
Short Suspensions - 1 to 5 days 235
Long Suspensions - 6 to 20 days 12
Exclusions 2
Cancellations of Enrolment 0

Our school at a glance
Curriculum offerings
Our distinctive curriculum offerings
Year 10 Pathways program
Rugby League Excellence
Netball Excellence
Head Start Program Year 12
Agricultural Pathway Program
Extra curricula activities
Performing Arts Program
Musical
Music Program
Chess
Community Service Program
Sport (All Sports)
Gifted and Talented programs
How Information and Communication Technologies are used to assist learning
ICT remains one of the key foci of Roma State College as we move towards the development of Roma State College Digital Pedagogy plan. The introduction of 1:1 technology through the National Secondary School Computer Fund (NSSCF) provides the opportunity for Senior students to access the use of a laptop for personal use. This along with a plan to install Interactive Whiteboards and projectors in all College learning facilities will provide an opportunity for the Digital learning platform to be further embedded at Roma State College.
The use of ICT technologies in curriculum delivery continues to progress and we are committed to ensuring our staff have access to the best quality professional development in this area.
Social climate
At Roma State College we believe that students have the right to learn and teachers have the right to teach without disruption.
Students have the right to feel safe and be valued.
These beliefs underpin the expectations of Roma State College to
Be Responsible
Be Respectful
Be Safe
Be committed to learning.
The college welfare structure is headed on each campus by Head of School, but is owned by all staff who provide intervention and support to students. This includes Year Level Coordinators, Guidance Officer, School Based Youth Health Nurse, Speech Pathologist and other professional officers. This team is well equipped and use their knowledge to provide great support to all students.
Parent, student and teacher satisfaction with the school

Our school at a glance
The results of the school opinion surveys in 2011 again highlight some areas that require further focused work.
In response the school continues in collaboration with Parents and Citizens Association to develop a clear strategic and purposeful plan to engage all stakeholders in enhancing the professional learning opportunities for all staff.
Performance measure Result 2011
Percentage of parents/caregivers satisfied that their child is getting a good education at school
71%
Percentage of students satisfied that they are getting a good education at school 70%
Percentage of parents/caregivers satisfied with their child’s school 72%
Percentage of school workforce satisfied with access to professional development opportunities that relate to school and systemic initiatives
41%
Percentage of staff members satisfied with morale in the school 77%
Involving parents in their child’s education
Parents are involved in many areas of the school particularly in the Junior School where classrooms are regularly filled with parent volunteers. The College has a number of programs that train parents in ways to support students in reading and writing. Parents are actively involved in sporting and performing arts programs as helpers and coaches.
Reducing the school’s environmental footprint

Our school at a glance
Data is sourced from school's annual utilities return and is reliant on the accuracy of these returns.
The College has reduced actual usage by adopting the following strategies-
Staff have made a conscious effort to conserve electricity when rooms are not in use
Installation of water tanks
Reduction in Photocopying across the College
Teachers use of Interactive white boards and data projectors
Reduction and use of efficient watering
Environmental footprint indicators, 2010-2011
Electricity KwH
Water KL
2011 323,708 9,735
2010 359,379 29,907
% change 10 - 11 -10% -67%

Our staff profile
Staff composition, including Indigenous staff
The staff figures below are based on Equal Employment Opportunity (EEO) 2011 census. In accordance with the EEO privacy provisions and to ensure confidentiality, the ‘less than 5’ rule has been applied in schools whose Indigenous staff numbers are less than five.
Workforce Composition Teaching Staff Non-teaching Staff Indigenous Staff
Headcounts 87 53 5
Full-time equivalents 78 40 <5
Qualifications of all teachers
Highest level
of attainment
Number of
classroom
teachers and
school leaders
at the school
Doctorate 0
Masters 2
Bachelor degree 77
Diploma 8
Certif icate 0
01020304050607080
0 2
77
80
Doctorate
Masters
Bachelor degree
Diploma
Certificate

Our staff profile
Expenditure on and teacher participation in professional development
The total funds expended on teacher professional development in 2011 was $46 000.
The major professional development initiatives are as follows:
ICT training
Teacher readiness for the student 1:1 laptop program
Promotion of online training through One Channel
Classroom profiling
Code of Conduct
Student Protection
Implementation of Australian curriculum (English, Maths and Science)
Peer Coaching
Numeracy and Literacy Training
Leadership opportunities through focused school initiatives and quality learning events
Sharing of best practice in teaching methods
The proportion of the teaching staff involved in professional development activities during 2011 was 100%.
Average staff attendance
For permanent and temporary staff and school leaders, the staff attendance rate was 97% in 2011.
Proportion of staff retained from the previous school year
From the end of the previous school year, 85% of staff was retained by the school for the entire 2011 school year.
School income broken down by funding source
School income broken down by funding source is available via the My School website at http://www.myschool.edu.au/. (The School information below is available on the My School web site. For parents / caregivers who are provided with a printed School Annual Report, school income broken down by funding source must be attached. Schools may wish to copy the information from the My School web site)
To access our income details, click on the My School link above. You will then be taken to the My School website with the following ‘Find a school’ text box.

Our staff profile
Where it says ‘Search by school name’, type in the name of the school you wish to view, and select <GO>’. Read and follow the instructions on the next screen; you will be asked to accept the Terms of Use and Privacy Policy before being given access to the school’s My School entry web page.
School financial information is available by selecting ‘School finances’ in the menu box in the top left corner of the school’s entry web page. If you are unable to access the internet, please contact the school for a paper copy of income by funding source

Performance of our students
Key student outcomes
e
Student attendance - 2011
The overall attendance rate for the students at this school (shown as a percentage) in 2011 was 86%.
The overall attendance rate for all Queensland state Primary-Secondary Combined schools over the same period was 89%.
Student attendance rate for each year level
Year 1
Year 2
Year 3
Year 4
Year 5
Year 6
Year 7
Year 8
Year 9
Year 10
Year 11
Year 12
90% 89% 90% 87% 91% 88% 89% 87% 82% 80% 83% 80%
Student Attendance Distribution
The proportions of students by attendance range.
Description of how non-attendance is managed by the school
Non-attendance is managed in state schools in line with the DET policies, SMS-PR-029: Managing Student Absences and SMS-PR-036: Roll Marking in State Schools, which outline processes for managing and recording student attendance and absenteeism.
Roma State College uses ID attend to track attendance :
Prep –7
Rolls are marked by the teacher for the AM and PM of each day and are updated using ID attend for all absences and late students
Late arrivals report run for staff to follow up
Telephone messages regarding absences recorded in ID attend
Notes for all absences recorded in ID attend and filed in daily class folder
Medical certificates files in student files
Roll discrepancies reported to Admin
Unexplained Absence report for 3 consecutive days then ID attend is cross checked for possible reasons

Performance of our students
Years 8-12
All rolls marked at form class
Rolls updated using ID attend for all absences and late students
Daily absence reports are posted and sent to all staff
Teachers or Year Co-ordinators instructed to phone parents for 3 or more consecutive days absence
Unexplained absence reports discussed with year level co-ordinators
Report issued to Head of School for approval of TCS letters to be sent
National Assessment Program – Literacy and Numeracy (NAPLAN) results – our reading, writing, spelling, grammar and punctuation, and numeracy results for the Years 3, 5, 7 and 9. (The School
results below are available within OneSchool. For parents / caregivers who are provided with a printed School Annual Report, NAPLAN results must be attached)
Our reading, writing, spelling, grammar and punctuation, and numeracy results for the Years 3, 5, 7 and 9 are available via the My School website at http://www.myschool.edu.au/.
To access our NAPLAN results, click on the My School link above. You will then be taken to the My School website with the following ‘Find a school’ text box.
Where it says ‘Search by school name’, type in the name of the school whose NAPLAN results you wish to view, and select <GO>’.
Read and follow the instructions on the next screen; you will be asked to accept the Terms of Use and Privacy Policy before being able to access NAPLAN data.
If you are unable to access the internet, please contact the school for a paper copy of our school’s NAPLAN results.

Performance of our students
Achievement – Closing the Gap
Roma State College continues to make significant progress in Closing the Gap with an increase in student attainment and attendance during 2011.The employment of a Community Education worker and a positive relationship with our community has seen improvements across the board. Further work is required to close the gap in regards to Reading, Writing and Mathematics. Student attendance continues to improve as we establish positive relations between families and school.
Roma State College is focussed on developing strong programs to retain Indigenous students , this as seen the retention difference decrease over recent years.
.
Attainment and Achievement – Year 12
Apparent retention rates Year 10 to Year 12.
Year 12 student enrolment as a percentage of the Year 10 student cohort. 94%
Outcomes for our Year 12 cohort of 2011
Number of students receiving a Senior Statement. 45
Number of students awarded a Queensland Certificate Individual Achievement. 0
Number of students receiving an Overall Position (OP). 15
Number of students who are completing/continuing a School-based Apprenticeship or Traineeship. 15
Number of students awarded one or more Vocational Educational Training qualifications. 28
Number of students awarded an Australian Qualification Framework (AQF) Certificate II or above. 22
Number of students awarded a Queensland Certificate of Education at the end of Year 12. 35
Number of students awarded an International Baccalaureate Diploma (IBD). 0
Percentage of OP/ IBD eligible students with OP 1-15 or an IBD. 67%
Percentage of Year 12 students who are completing or completed a SAT or were awarded one or more of the following: QCE, IBD, VET qualification.
91%
Percentage of Queensland Tertiary Admissions Centre (QTAC) applicants receiving an offer. 93%
Overall Position Bands (OP)
Number of students in each Band for OP 1 to 25.
OP 1-5 OP 6-10 OP 11-15 OP 16-20 OP 21-25
1 2 7 5 0
Performance of our students
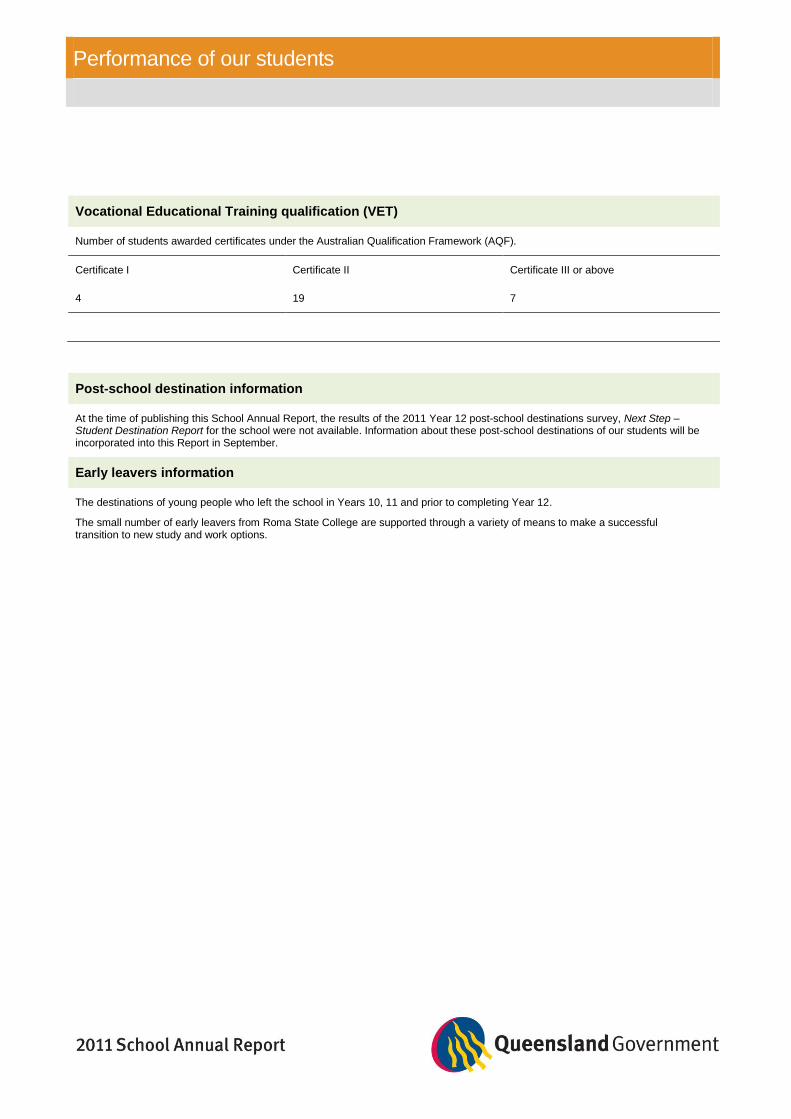
Vocational Educational Training qualification (VET)
Number of students awarded certificates under the Australian Qualification Framework (AQF).
Certificate I Certificate II Certificate III or above
4 19 7
Post-school destination information
At the time of publishing this School Annual Report, the results of the 2011 Year 12 post-school destinations survey, Next Step – Student Destination Report for the school were not available. Information about these post-school destinations of our students will be incorporated into this Report in September.
Early leavers information
The destinations of young people who left the school in Years 10, 11 and prior to completing Year 12.
The small number of early leavers from Roma State College are supported through a variety of means to make a successful transition to new study and work options.