Embed Size (px)
Citation preview

1
Question for the Class:Question for the Class:
When do you use When do you use marketing research?marketing research?
Marketing Research & Marketing Research & Technology Product/Service Technology Product/Service
DevelopmentDevelopment
Dr. Alan L. CarsrudDr. Alan L. CarsrudClinical Professor of ManagementClinical Professor of Management
Professor of Industrial & Systems EngineeringProfessor of Industrial & Systems EngineeringProfessor of Hospitality Management Professor of Hospitality Management
Executive DirectorExecutive DirectorEugenio Eugenio PinoPino & Family Global Entrepreneurship Center & Family Global Entrepreneurship Center
at at Florida International UniversityFlorida International University
&&Docent in EntrepreneurshipDocent in Entrepreneurship
ÅÅbo Akademi Universitybo Akademi University

2
Marketing Research Marketing Research and Detailed Investigationand Detailed Investigation
Adapted from the Stage Gate processby Robert J. Cooper
Stag
e II
: Det
aile
d In
vest
igat
ion
Stag
e I:
Pre
limin
ary
Inve
stig
atio
n
Idea
Gen
erat
ion
Key Activities in Product Key Activities in Product DevelopmentDevelopment
Market Analysis
Competitive Analysis
User Needs & Wants
Study
Customer Wish List:
Product Rqmts
Technical Assessment: Translation
Technically Feasible
Concept(s)
Mfg Costs/ Production
NeedsProject Plan: Development, Test, Marketing & Production
Financial Justification: Financial, Risk, Business Justification
Product Definition: Target Market, Concept, Position & Benefits Requirements & Specs
Expected Sales
Financial Analysis
Concept Test:
Purchase Intent
3
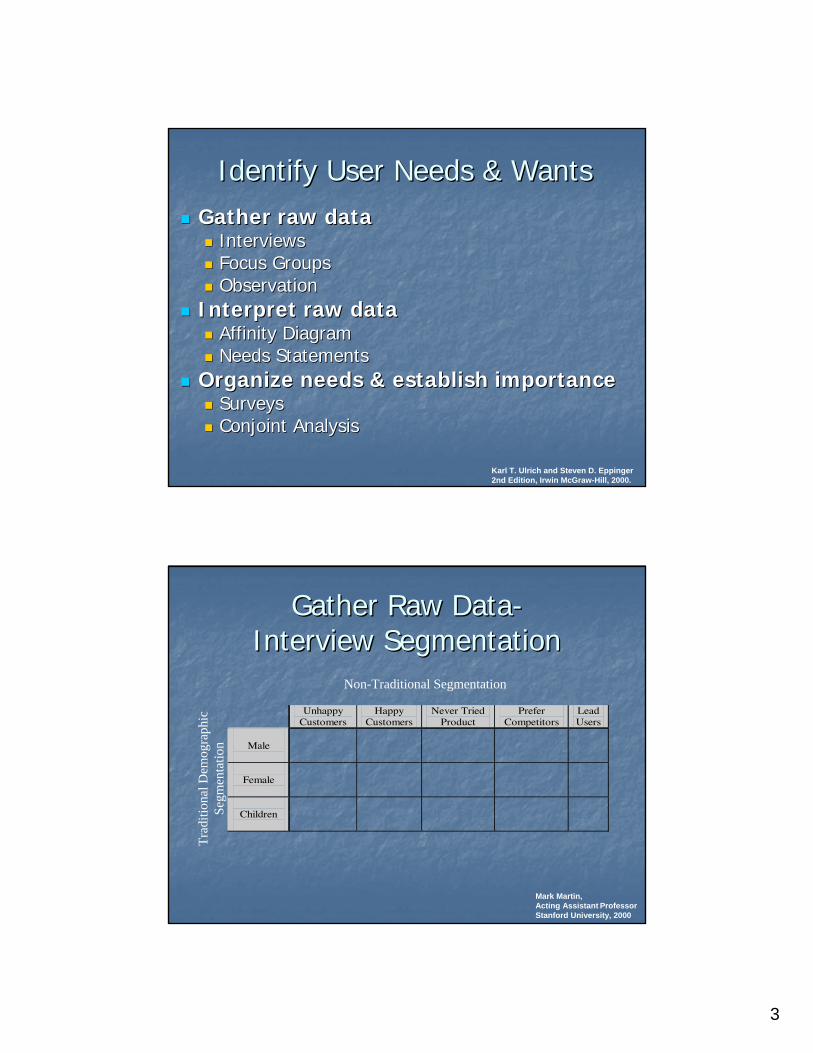
IdentifyIdentify User Needs & Wants User Needs & Wants Gather raw dataGather raw data
InterviewsInterviewsFocus GroupsFocus GroupsObservationObservation
Interpret raw dataInterpret raw dataAffinity DiagramAffinity DiagramNeeds StatementsNeeds Statements
Organize needs & establish importanceOrganize needs & establish importanceSurveysSurveysConjoint AnalysisConjoint Analysis
Karl T. Ulrich and Steven D. Eppinger2nd Edition, Irwin McGraw-Hill, 2000.
Unhappy Customers
Happy Customers
Never Tried Product
Prefer Competitors
Lead Users
Male
Female
Children
Trad
ition
al D
emog
raph
ic
Segm
enta
tion
Non-Traditional Segmentation
Gather Raw DataGather Raw Data--Interview SegmentationInterview Segmentation
Mark Martin,Acting Assistant ProfessorStanford University, 2000

4
Which Marketing Data Which Marketing Data Collection Method To Use?Collection Method To Use?
SurveysSurveys
InterviewsInterviews
Focus GroupsFocus Groups
Interviews vs. Focus GroupsInterviews vs. Focus Groups
From: Griffin, Abbie and John R. Hauser. “The Voice of the Customer”, Marketing Science. vol. 12, no. 1, Winter 1993.
One-on-One Interviews (1 hour)
Focus Groups (2 hours)
0 1 2 3 4 5 6 7 8 9 10
0
20
40
60
80
100
Per
cen
t o
f N
eed
s Id
enti
fied
Number of Respondents or Groups

5
Surveys come later and are Surveys come later and are actually somewhat easier.actually somewhat easier.
Interpret Raw Data :Interpret Raw Data :Screwdrivers ExampleScrewdrivers Example

6
Affinity DiagramAffinity Diagram(a.k.a. KJ diagram) (a.k.a. KJ diagram)
Organizes subjective information Organizes subjective information
Example: Group the following Example: Group the following CRCR’’ss““ease of handlingease of handling”” ““portabilityportability””““number readabilitynumber readability”” ““dose meteringdose metering””““load handlingload handling”” ““ease of useease of use””
Five Guidelines for Five Guidelines for Writing Needs StatementsWriting Needs Statements
G u id e lin e C u s to m e r S ta tem e n t N eed S ta te m en t-W ro n g N eed S ta tem en t-R ig h t
W h at N o tH o w
S p ecific ity
P o s itiveN o t
N eg ative
A ttrib u teo f th e
P ro d u c t
A vo id“M u st”
an d“S h o u ld
“W hy d on ’t yo u pu tp ro te c tive sh ie lds a roundthe b a tte ry con tac ts? ”
“I d ro p m y sc re w drive r a llthe tim e .”
“It do esn ’t m a tte r if it’sra in in g , I s till ne ed tow ork ou ts ide onS a tu rdays .”
“I’d like to cha rge m yba tte ry from m y c iga re tteligh te r.”
“I h a te it w h en I don ’tknow h ow m uch ju ice isle ft in the b a tte ries o f m ycord less too ls .”
T he screw d rive r ba tte rycon tac ts a re cove red bya p las tic s lid in g doo r.
T he screw d rive r ba tte ryis p ro tec ted fromacc iden ta l sho rting .
T he screw d rive r isrugged .
T he screw d rive rope ra tes no rm a lly a fte rrepea ted d ropp ing .
T he screw d rive r is no td isab led by the ra in .
T he screw d rive rope ra tes no rm a lly inth e ra in .
A n au tom ob ile c iga re tteligh te r adap te r cancha rg e th e sc re w drive rba tte ry .
T he screw d rive r ba tte rycan be charged from anau tom ob ile c iga re tteligh te r.
T he screw d rive r shou ldp rov ide an ind ica tion o fth e ene rg y leve l o f theba tte ry .
T he screw d rive rp rov ides an ind ica tiono f the energy leve l o fthe ba tte ry .

7
Things to RememberThings to Remember
Capture Capture ““What, Not HowWhat, Not How””Collect visual, verbal, and textual dataCollect visual, verbal, and textual dataProps will stimulate customer responsesProps will stimulate customer responsesInterviews are more efficient than focus groupsInterviews are more efficient than focus groupsInterview all stakeholders and lead usersInterview all stakeholders and lead usersDevelop an organized list of need statementsDevelop an organized list of need statementsLook for latent needsLook for latent needsSurvey to quantify tradeoffsSurvey to quantify tradeoffs
Translating Translating CRCR’’ss into Technical Specsinto Technical Specs
PHASE I QFD -- Portable Slide ProjectorEngineering Metrics
Customer Requirements Cu
stom
er W
eigh
ts
Brig
htne
ss
Wei
ght
Dim
ensio
ns (g
irth
+ w
idth
)
Tim
e/Ta
sks r
equi
red
to st
art p
rese
ntat
ion
Dist
ortio
n
Dist
ance
from
pre
sent
er (w
ith 3
' x 3
' pro
ject
ion)
Tim
e to
inse
rt/pu
ll-ou
t slid
e
Attr
activ
e pr
oduc
t
Good image 9 9 9Easy to transport 9 9 9Device sets up quickly 9 3 1 9 3 3Works well for short present. 9 1 3 3 3Keeps present. flowing 1 3 3 9Image visible in bad conditions 3 9 3Minimizes unplanned interruptions 1 3 1 9Design makes the product attractive 3 3 3 9
Raw score
108
117
108
114
90 58 72 27
Relative Weight 16
%
17%
16%
16%
13%
8% 10%
4%
Customer Needs •Good image•Easy to transport•Keeps present. flowing•Image visible in bad conditions•Minimizes unplanned interruptions•Design makes the product attractive•Device sets up quickly•Works well for short present.
Engineering Metrics•Brightness•Weight•Dimensions (girth + width)•Time/Tasks required to start present.•Distortion•Distance from presenter •Time to insert/pull-out slide•Attractive product
Example:
Portable Slide Projector
Mark Martin, 2000

8
QFD Matrix ExampleEngineering Metrics
Customer Requirements Cu
stom
er W
eig
hts
Brig
htne
ss
Wei
ght
Dim
ensio
ns (g
irth
+ w
idth
)
Tim
e/Ta
sks r
equi
red
to st
art p
rese
ntat
ion
Dist
ortio
n
Dist
ance
from
pre
sent
er (w
ith 3
' x 3
' pro
ject
ion)
Tim
e to
inse
rt/pu
ll-ou
t slid
e
Attr
activ
e pr
oduc
t
Good image 9 9 9Easy to transport 9 9 9Device sets up quickly 9 3 1 9 3 3Works well for short present. 9 1 3 3 3Keeps present. flowing 1 3 3 9Image visible in bad conditions 3 9Minimizes unplanned interruptions 1 3 1 9Design makes the product attractive 3 3 3 9
Raw score
108
117
108
114
81 58 72 27
Relative Weight 16
%
17%
16%
17%
12%
8% 11%
4%
Phase I -Portable Slide Projector
Part Characteristics
Engineering Metrics Ph
ase
I R
elat
ive
Wei
gh
ts
Top
case
Botto
m c
ase
Lens
Cond
ense
rSt
and
Hea
t sin
kLa
mp
Brightness 16% 9 9 1 9Weight 17% 9 9 1 1 3Dimensions (girth + width) 16% 9 9 3 9 1 3 3Time/Tasks required to start presentation 16% 3 3Distortion 13% 9 9 1 1Distance from presenter (with 3' x 3' projection) 8% 9 9 9Time to insert/pull-out slide 10% 3 1Attractive product 4% 9 9 9
Raw score 3.
6
3.3
4.4
4.9
1.1
1.3
2.7
Rel. Weight 17
%15
%21
%23
%5% 6% 13
%
Rank 3 4 2 1 7 6 5
Phase II -Portable Slide Projector
% Worth of components

9
Clarify the Problem
Generate Product ConceptsGenerate Product Concepts
Select Product Concept
• Concept Screening• Concept Scoring
Search Externally
Search Internally
• Existing Concepts • New Concepts
Reflect on the Process
• Continuous Improvement
Karl T. Ulrich and Steven D. Eppinger2nd Edition, Irwin McGraw-Hill, 2000.
Concept Development FunnelConcept Development Funnel
concept generation
concept screening
concept scoring
concept testing

10
Concept Generation Exercise:Concept Generation Exercise:Vegetable PeelersVegetable Peelers
Vegetable Peeler Exercise:Vegetable Peeler Exercise:Voice of the CustomerVoice of the Customer
"Carrots and potatoes are very different.""Carrots and potatoes are very different.""I cut myself with this one.""I cut myself with this one.""I just leave the skin on.""I just leave the skin on.""I'm left"I'm left--handed. I use a knife."handed. I use a knife.""This one is fast, but it takes a lot off.""This one is fast, but it takes a lot off.""How do you peel a squash?""How do you peel a squash?""Here's a rusty one.""Here's a rusty one."

11
Clarify the Problem:Clarify the Problem:Key Customer NeedsKey Customer Needs
1.1. The peeler can be used for a variety of produce.The peeler can be used for a variety of produce.2.2. The peeler can be used ambidextrously.The peeler can be used ambidextrously.3.3. The peeler creates minimal waste.The peeler creates minimal waste.4.4. The peeler saves time.The peeler saves time.5.5. The peeler is durable.The peeler is durable.6.6. The peeler is easy to clean.The peeler is easy to clean.7.7. The peeler is safe to use and store.The peeler is safe to use and store.8.8. The peeler is comfortable to use.The peeler is comfortable to use.9.9. The peeler stays sharp or can be easily sharpened.The peeler stays sharp or can be easily sharpened.
External SearchExternal SearchLead UsersLead Users
Benefit from improvementBenefit from improvementInnovation sourceInnovation source
BenchmarkingBenchmarkingCompetitive productsCompetitive products
ExpertsExpertsTechnical expertsTechnical expertsExperienced customersExperienced customers
PatentsPatentsSearch related inventionsSearch related inventions
LiteratureLiteratureTechnical journalsTechnical journalsTrade literatureTrade literature

12
Internal SearchInternal SearchSuspend judgmentSuspend judgmentGenerate a lot of ideasGenerate a lot of ideasInfeasible ideas are welcomeInfeasible ideas are welcomeUse graphical and physical mediaUse graphical and physical mediaMake analogiesMake analogiesUse related stimuliUse related stimuliUse unrelated stimuliUse unrelated stimuliSet quantitative goalsSet quantitative goalsTrade ideas in a groupTrade ideas in a group
Concept Selection ProcessConcept Selection ProcessPrepare the MatrixPrepare the Matrix
CriteriaCriteriaReference ConceptReference ConceptWeightingsWeightings
Rate ConceptsRate ConceptsScale (+ Scale (+ –– 0) or (10) or (1––5)5)Compare to Reference Concept or ValuesCompare to Reference Concept or Values
Rank ConceptsRank ConceptsSum Weighted ScoresSum Weighted Scores
Combine and ImproveCombine and ImproveRemove Bad FeaturesRemove Bad FeaturesCombine Good QualitiesCombine Good Qualities
Select Best ConceptSelect Best ConceptMay Be More than One or NoneMay Be More than One or NoneBeware of Average ConceptsBeware of Average Concepts

13
Example: Concept ScreeningExample: Concept Screening
CONCEPT VARIANTS
SELECTIONCRITERIA A B C D E F G REF.
Ease of Handling 0 0 – 0 0 – – 0Ease of Use 0 – – 0 0 + 0 0Number Readability 0 0 + 0 + 0 + 0Dose Metering + + + + + 0 + 0Load Handling 0 0 0 0 0 + 0 0Manufacturing Ease + – – 0 0 – 0 0Portability + + – – 0 – – 0
PLUSES 3 2 2 1 2 2 2SAMES 4 3 1 5 5 2 3
MINUSES 0 2 4 1 0 3 2NET 3 0 –2 0 2 –1 0
RANK 1 3 7 5 2 6 4CONTINUE? Yes Yes No No Yes No Yes
Example: Concept ScoringExample: Concept Scoring
ConceptsA DF E G+
Master Cylinder Lever Stop Swash Ring Dial Screw+
Selection Criteria Weight RatingWeighted
Score RatingWeighted
Score RatingWeighted
Score RatingWeighted
Score
Ease of Handling 5% 3 0.15 3 0.15 4 0.2 4 0.2
Ease of Use 15% 3 0.45 4 0.6 4 0.6 3 0.45
Readability of Settings 10% 2 0.2 3 0.3 5 0.5 5 0.5
Dose Metering Accuracy 25% 3 0.75 3 0.75 2 0.5 3 0.75
Durability 15% 2 0.3 5 0.75 4 0.6 3 0.45
Ease of Manufacture 20% 3 0.6 3 0.6 2 0.4 2 0.4
Portability 10% 3 0.3 3 0.3 3 0.3 3 0.3
Total Score
Rank
Continue? No Develop No No
(reference)
2.75
4
3.45
1
3.10
2
3.05
3

14
Things to RememberThings to Remember
The goal of concept selection is The goal of concept selection is notnot totoSelectSelect the best conceptthe best concept
The goal of concept selection is toThe goal of concept selection is toDevelopDevelop the best conceptthe best concept
So remember to So remember to combine and refinecombine and refine the the concepts to develop better ones!concepts to develop better ones!
•• Beware of the best "average" productBeware of the best "average" product•• Perform concept selection for each different Perform concept selection for each different
customer group and compare resultscustomer group and compare results•• Check sensitivity of selection to the importance Check sensitivity of selection to the importance
weightings and ratingsweightings and ratings•• May want to use all of detailed requirements in May want to use all of detailed requirements in
final stages of selectionfinal stages of selection•• Note features which can be applied to other Note features which can be applied to other
conceptsconcepts
More to RememberMore to Remember

15
Concept Testing: Concept Testing: When & How to Use SurveysWhen & How to Use Surveys
Define the purpose of the testDefine the purpose of the testChoose a survey populationChoose a survey populationChoose a survey formatChoose a survey formatCommunicate the conceptCommunicate the conceptMeasure customer responseMeasure customer responseInterpret the resultsInterpret the resultsReflect on the results and the processReflect on the results and the process
Concept Testing is Used for...Concept Testing is Used for...
Go/noGo/no--go decisionsgo decisionsWhat market to be inWhat market to be inSelecting among alternative conceptsSelecting among alternative conceptsConfirming concept selection decisionConfirming concept selection decisionBenchmarkingBenchmarkingSoliciting improvement ideasSoliciting improvement ideasForecasting demandForecasting demandReady to launch?Ready to launch?

16
When To Use A Survey Format?When To Use A Survey Format?
What would you expect the price of the What would you expect the price of the product or service to be?product or service to be?
What concerns do you have about the What concerns do you have about the product concept?product concept?
Can you make any suggestions for improving Can you make any suggestions for improving the product/service concept?the product/service concept?
Interpreting the Results:Interpreting the Results:Forecasting SalesForecasting Sales
Q = N x A x PQ = N x A x PQQ = sales (annual)= sales (annual)NN = number of (annual) purchases= number of (annual) purchasesAA = awareness x availability (fractions)= awareness x availability (fractions)PP = probability of purchase (surveyed)= probability of purchase (surveyed)
= = CCdefdef x x FFdefdef + + CCprobprob x x FFprobprob
“second box”“top box”

17
Forecasting Example:Forecasting Example:College Student Market for BikesCollege Student Market for Bikes
N = offN = off--campus grad students (200,000)campus grad students (200,000)A = 0.2 (realistic) to 0.8 (every bike shop)A = 0.2 (realistic) to 0.8 (every bike shop)P = 0.4 x P = 0.4 x toptop--boxbox + 0.2 x + 0.2 x secondsecond--boxboxQ = 200,000 x 0.20 x [0.4 x Q = 200,000 x 0.20 x [0.4 x 0.30.3 + 0.2 x + 0.2 x 0.20.2]]
= 6400 units/yr= 6400 units/yrPrice point $795Price point $795Revenue = 5 million dollarsRevenue = 5 million dollars
Forecasting Example:Forecasting Example:Factory Transport MarketFactory Transport Market
N = current bicycle and scooter sales to N = current bicycle and scooter sales to factories (150,000)factories (150,000)A = 0.25 (single distributorA = 0.25 (single distributor’’s share)s share)P = 0.4 x P = 0.4 x toptop--boxbox + 0.2 x + 0.2 x secondsecond--boxboxQ = 150,000 x 0.25 x [0.4 x Q = 150,000 x 0.25 x [0.4 x 0.30.3 + 0.2 x + 0.2 x 0.20.2]]
= 6000 units/yr= 6000 units/yrPrice point $1500Price point $1500Revenue = 9 million dollarsRevenue = 9 million dollars

18
Market Decision: Market Decision: Factory TransportationFactory Transportation
Sources of Sources of Marketing Forecast ErrorMarketing Forecast Error
Quality of Concept DescriptionQuality of Concept DescriptionQuality of Testing MethodQuality of Testing Method
Concept testing v. conjoint analysisConcept testing v. conjoint analysis
PricingPricingLevel of PromotionLevel of PromotionWordWord--ofof--Mouth EffectsMouth EffectsCompetitionCompetition

19
DiscussionDiscussionHow does early (qualitative) concept How does early (qualitative) concept testing differ from later (quantitative) testing differ from later (quantitative) testing?testing?Why do respondents typically overestimate Why do respondents typically overestimate purchase intent? Would they ever purchase intent? Would they ever underestimate intent?underestimate intent?How to use price in surveys?How to use price in surveys?How much does the way the concept is How much does the way the concept is communicated matter?communicated matter?
When shouldnWhen shouldn’’t a prototype model be shown?t a prototype model be shown?
Going to the next stageGoing to the next stage
Does it fit with the corporate strategy?Does it fit with the corporate strategy?Does it offer a competitive advantage?Does it offer a competitive advantage?Is the market attractive?Is the market attractive?Is it technically feasible?Is it technically feasible?Is it financially attractive?Is it financially attractive?Critical evaluation before Stage 3 Critical evaluation before Stage 3 -- the the ““money stagemoney stage””