Embed Size (px)
Citation preview

A Search for MeV Gamma-A Search for MeV Gamma-Ray Emission from the Ray Emission from the
Quiet-Time SunQuiet-Time Sun
M.L. McConnell 1, K. Bennett 3, A. MacKinnon 5
R. Miller 4, G. Rank1, J. Ryan 1, and V. Schönfelder 2
1University of New Hampshire, Durham, NH2Max Planck Institute (MPE), Garching, Germany
3Astrophysics Division, ESTEC, Noordwijk, Netherlands4Los Alamos National Laboratory, Los Alamos, NM
5University of Glasgow, Glasgow, UK
the COMPTEL experimenton the Compton Gamma-Ray observatory

AbstractAbstract
Until now, solar gamma-ray emissions have only been detected during solar flares. However, there are several scenarios (e.g.,
microflares or cosmic-ray albedo emission) in which gamma-rayemission might be detectable when there is no significant solar
activity. These processes might be related to the general problemof solar coronal heating and would likely vary as a function of
solar cycle. We have embarked on a systematic search for quiet-timegamma-ray emissions using the unique imaging capabilities of theCOMPTEL experiment on the Compton Gamma-Ray Observatory .With its large (~1 steradian) FoV, COMPTEL has observed the Sunon several ocassions since its launch in April, 1991. We are using
these data to search for both time-integrated and time-resolved gamma-ray emission, concentrating on those periods when there was negligible solar activity. Our analysis involves a search for
both broad-band and narrow line emissions. Here we report on thelatest results from this effort, with emphasis on the implications
for low-energy proton acceleration.

Scientific MotivationScientific Motivation
Several solar processes have been suggested which might be capable of producing detectable levels of gamma-ray emission even in the
absence of pronounced solar activity. These include:
①processes potentially related to coronal heating (e.g., microflares or some similar low level of non-thermal particle production).
②precipitation of downstream shock-accelerated ions back to the solar surface from coronal mass ejections.
③ interaction of high energy cosmic rays with the solar atmosphere.
④ radiative decay of massive solar neutrinos.
Here we report on preliminary results of an effort to investigate some of these processes using data from the COMPTEL experiment on the
Compton Gamma-Ray Observatory .
COMPton imaging TELescopeCOMPton imaging TELescope
➩ Energy range = 0.75 – 30 MeV
➩ FoV ~ 1 sterdian
➩ Angular resolution ~ 1 ° – 2°
➩ First all-sky survey in MeV range
➩ Each event which scatters from D1 to D2 without triggering the veto domes :
- event location (x,y) in D1- energy deposit in D1- pulse-shape in D1- time-of-flight (ToF) from D1 to D2- event location (x,y) in D2- energy deposit in D2- absolute time (1/8 msec)

COMPTEL DataCOMPTEL Data
➩ COMPTEL has been collecting data in orbit since April, 1991.
➩ With COMPTEL’s large FoV (~1 steradian), serendipitous observations of the Sun are sometimes obtained. (Only in June, 1991 was the Sun purposely targeted by COMPTEL.)
➩ A summary of all available solar observations (Sun within 40 ° of the COMPTEL pointing direction) is shown in the following panel.
➩ The imaging nature of COMPTEL can provide a significant S/N improvement over that from non-imaging experiments (such as the SMM Gamma-Ray Spectrometer).
➩ Emission from the galactic plane and strong point sources which lie near the ecliptic (e.g., the Crab) present an additional source of background which, if present, must be properly modeled in the analysis.
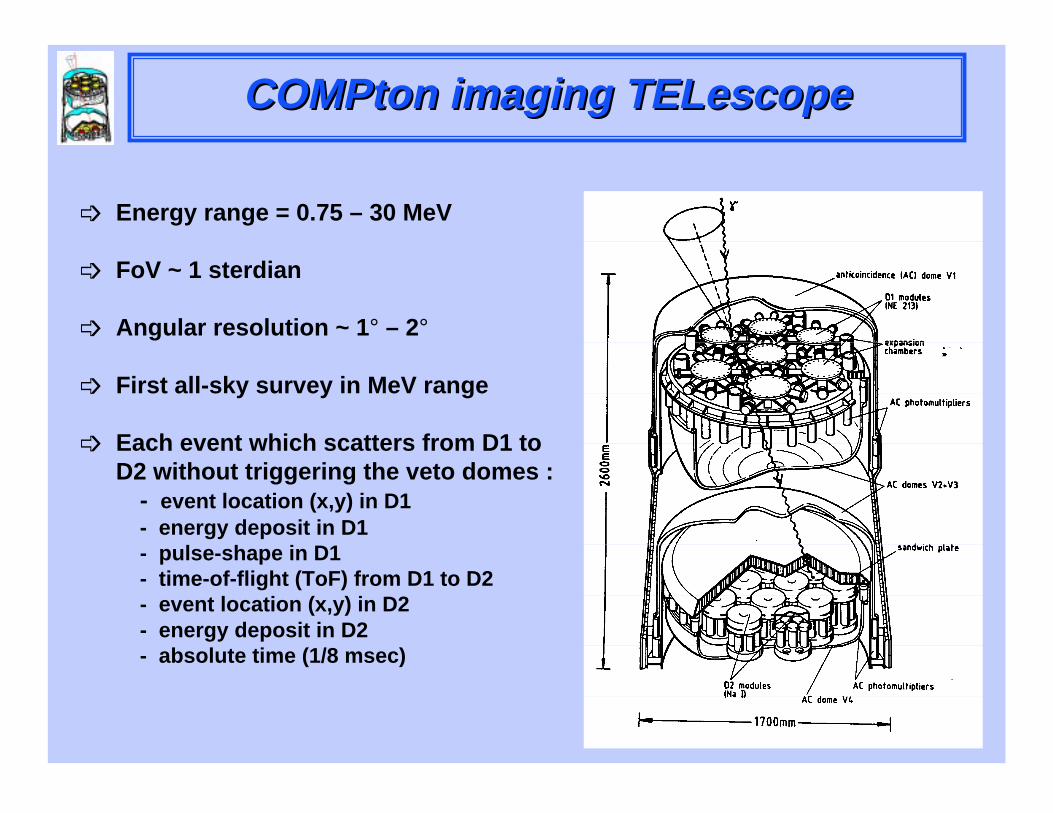
Observation SummaryObservation Summary
Viewing Zenith Angle Galactic
Period Date(s) Min Max Plane? # day s
1.0 21-May-1991 to 30-May-1991 21 ° 29° yes 92.0 08-Jun-1991 to 15-Jun-1991 11 ° 16° yes 711.0 03-Oct-1991 to 17-Oct-1991 4 ° 16° no 1412.0 21-Oct-1991 to 31-Oct-1991 28 ° 29° no 1016.0 12-Dec-1991 to 27-Dec-1991 11 ° 26° yes 1519.0 25-Jan-1992 to 06-Feb-1992 18 ° 30° no 1226.0 23-Apr-1992 to 24-Apr-1992 29 ° 30° no 131.0 11-Jun-1992 to 25-Jun-1992 26 ° 27° yes 14
209.0 09-Feb-1993 30 ° 30° no 1221.0 17-May-1993 to 24-May-1993 23 ° 30° no 7
304.0 19-Oct-1993 to 23-Oct-1993 25 ° 30° no 4320.0 08-Mar-1994 to 15-Mar-1994 13 ° 14° no 7325.0 09-May-1994 to 10-May-1994 29 ° 30° no 2
420.0 23-May-1995 to 06-Jun-1995 19 ° 26° yes 14
508.0 14-Dec-1995 to 20-Dec-1995 2 ° 8° yes 6509.0 20-Dec-1995 to 02-Jan-1996 19 ° 24° yes 13513.0 06-Feb-1996 to 13-Feb-1996 16 ° 17 ° no 7514.0 13-Feb-1996 to 20-Feb-1996 14 ° 21° no 7
TOTAL 150 days

The Imaging DataThe Imaging Data
➩ The data have been compiled on a day-by-day basis so that the Sun is centered within each image.
➩ An image generated from the summation of all the individual datasets yields a Sun-centered composite image.
➩ Composite images are generated from three separate sets of data:
① SET001 All days in which the Sun was within 40 ° of the pointing direction and was well away from the galactic plane. Also excluded active periods of 1991. Viewing periods 19, 26, 209, 304, 305, 320, 410, 513, and 514. A total of 84 days.
② SET002 Subset of SET001 in which solar viewing angle was restricted to less than 30 ° from the pointing direction. Viewing periods 19, 320, 513, and 514. A total of 39 days.
③ SET003 Subset of SET002 in which we eliminate all data from phase 1 of the CGRO mission in order to insure that we are well away from solar maximum. Viewing periods 320, 513, and 514. A total of 24 days.

The AnalysisThe Analysis
➩ The analysis of these data has so far concentrated on four specific energy intervals:
① 1 – 10 MeVA good test for continuum emission and integrated line emission.
② 1.50 – 1.75 MeVProvides a search for 1.63 MeV emission from decay of excited 20Ne. Sensitive to accelerated ions with E > 2 MeV/nucleon.
③ 2.110 – 2.336 MeVCovers the a region around the 2.223 MeV neutron capture line. Sensitive to accelerated ions with E > 10 MeV/nucleon .
④ 7.80 – 8.35 MeVProvides a search for 8.07 MeV emission from proton capture on 13C. Sensitive to accelerated ions with E > 0.555 MeV/nucleon.
➩ For each of these energy intervals, a maximum likelihood map was generated from each of the time intervals defined above.
➩ Flux limits were derived from the maximum likelihood maps. (Likelihood level ~ 9 implies ~ 3 σ significance.)

Results for 1–10 MeV EmissionResults for 1–10 MeV Emission
The following results are for the integrated 1 – 10 MeV emission:➾SET001 (all data within 40 ° after 1991)
1.1 (±0.4) × 10-5 cm-2 s-1 MeV-1 (2.4σ significance)
➾SET002 (all data within 30 ° after 1991)1.2 (±0.5) × 10-5 cm-2 s-1 MeV-1 (2.1σ significance)
➾SET003 (all data within 30 ° well away from solar maximum)< 2.1 × 10⁻⁵ cm-2 s-1 MeV-1 (2σ upper limit)
Maximum Likelihood Maps (✩ = solar position)

Results for 1.63 MeV Line EmissionResults for 1.63 MeV Line Emission
The following results are for 1.63 MeV line emission:➾SET001 (all data within 40 ° after 1991)
< 4.1 × 10⁻⁵ cm-2 s-1 (2σ upper limit)
➾SET002 (all data within 30 ° after 1991)< 4.6 × 10⁻⁵ cm-2 s-1 (2σ upper limit)
➾SET003 (all data within 30 ° well away from solar maximum)< 6.3 × 10⁻⁵ cm-2 s-1 (2σ upper limit)
Maximum Likelihood Maps (✩ = solar position)

Results for 2.223 MeV Line EmissionResults for 2.223 MeV Line Emission
The following results are for 2.223 MeV line emission:➾SET001 (all data within 40 ° after 1991)
< 2.5 × 10⁻⁵ cm-2 s-1 (2σ upper limit)
➾SET002 (all data within 30 ° after 1991)< 3.4 × 10⁻⁵ cm-2 s-1 (2σ upper limit)
➾SET003 (all data within 30 ° well away from solar maximum)< 4.1 × 10⁻⁵ cm-2 s-1 (2σ upper limit)
Maximum Likelihood Maps (✩ = solar position)

Results for 8.07 MeV Line EmissionResults for 8.07 MeV Line Emission
The following results are for 8.07 MeV line emission:➾SET001 (all data within 40 ° after 1991)
< 1.7 × 10⁻⁵ cm-2 s-1 (2σ upper limit)
➾SET002 (all data within 30 ° after 1991)< 2.0 × 10⁻⁵ cm-2 s-1 (2σ upper limit)
➾SET003 (all data within 30 ° well away from solar maximum)< 1.9 × 10⁻⁵ cm-2 s-1 (2σ upper limit)
Maximum Likelihood Maps (✩ = solar position)

Scientific ImplicationsScientific Implications
➩ Assuming a fixed ratio between 2.223 MeV flux and total power input (Harris et al. 1992), the COMPTEL limits on 2.223 MeV flux imply a continuous power input of < 4 × 10²³ ergs s -1 for accelerated nuclei with E > 10 MeV. This is far below the level of ~10 28 ergs s -1 required to heat the solar corona.
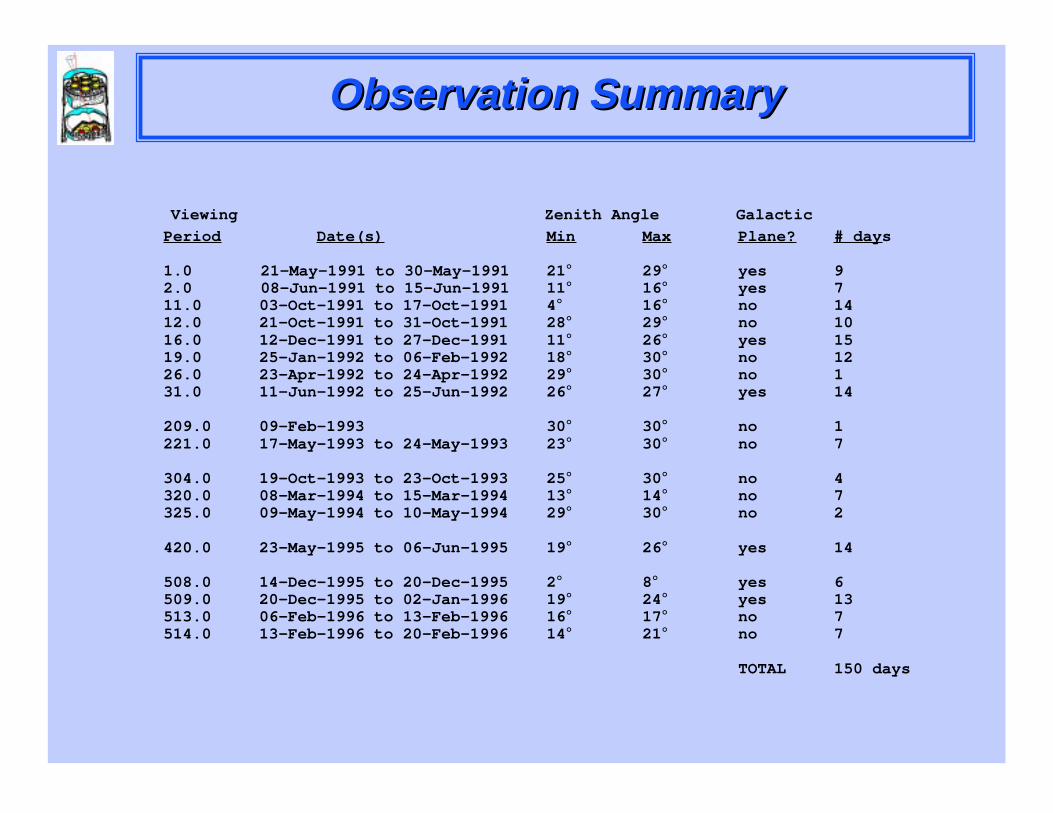
➩ The limits on the 8.07 MeV flux allow us to place constraints on the power input of nonthermal ions down to ~0.5 MeV/nucleon (MacKinnon 1989). The limit on energy input will depend to some extent on the assumed source temperature (see next panel).
➩ The observed upper limit on 8.07 MeV flux implies an energy input rate for low-energy protons of < 2 × 1030 ergs sec -1.
Although the heating of the corona by energetic protons (> 10 MeV) appears unlikely, we cannot rule out the possibility of
coronal heating by low energy (~1 MeV) protons.

Heating Constraints from 8.07 MeV LineHeating Constraints from 8.07 MeV Line
105
2
3
4
56
106
2
3
456
107
2
3
456
108
Sour
ce T
empe
ratu
re (°
K)
1029 1030 1031 1032 1033 1034
Energy Input Rate (ergs sec-1)
2 x 10 -5 cm-2 sec -1
(observed)
region allowed by observations
2 x 10 -2 cm-2 sec -1
Coronal Heating Constraints Based on 8.07 MeV Line Flux

SummarySummary
✔ All available solar observations by COMPTEL (through July, 1996) having the Sun within 40 ° of the z-axis have been assembled.
✔ Analysis excludes periods of solar activity and observations made near the galactic plane.
✔ No convincing evidence for quiescent solar gamma-ray emission.
✔ All measurements are effectively upper limits.
✔ The results serve to place contraints on the level of continuous power input from microflares and other low-level acceleration processes.
✔ Energetic protons (> 10 MeV) appear to be incapable of accounting for the coronal heating.
✔ We cannot rule out the possibility that a continuous injection of low energy protons (~1 MeV) could account for coronal heating.

Work in ProgressWork in Progress
✎ A more detailed background model, based on that used in COMPTEL studies of 1.8 MeV galactic plane emission, will be used to search for line emissions at 1.63 and 8.07 MeV.
✎ A more detailed background model is being developed which will be tailored to a search for 2.223 MeV line emission.
✎ Modeling of galactic plane emission and other strong sources will permit effective use of additional data, perhaps reducing the sensitivity level by a factor of ~2 or more.
✎ A more careful correlation with CME events will be made, although the intial checks show no available COMPTEL observations following major CME events, when gamma-ray emission might be expected.
✎ Other energy bands will be studied which may be more appropriate for studying cosmic ray interactions and massive solar neutrino decay.