Embed Size (px)
Citation preview

Raman spectroscopy XI-1XI. RAMAN SPECTROSCOPYReferences:- D.C. Harris och M.D. Bertolucci, Symmetry and Spectroscopy, Oxford UniversityPress, 1978.- J. M. Hollas, Modern Spectroscopy, Wiley, Chichester, 1987.- Handbook of vibrational spectroscopy, J. M. Chalmers, P. R. Gri�ths, Ed.'s, Wiley,2002.- G. Herzberg, Infrared and Raman Spectra, Van Nostrand, 1945.- K. P. Huber och G. Herzberg, Constants of Diatomic Molecules, Van Nostrand, 1979.- P.W. Atkins, Molecular Quantum Mechanics, Oxford University Press, 1983.- L.A. Woodward, Introduction to the Theory of Molecular Vibrations and VibrationalSpectroscopy, Clarendon Press, 1972.- E.B. Wilson, J.C. Decius och P.C. Cross, Molecular Vibrations, McGraw-Hill, 1955.(En ny upplaga: Dover, 1980).- S. Califano, Vibrational States, Wiley, 1976.- E.F.H. Brittain, W.O. George och C.H.J. Wells, Academic Press, 1970.- M.D. Harmony, Introduction to Molecular Energies and Spectra, Holt & Winston,1972.- CRC Handbook of Spectroscopy.- T. Hase, Spektrometriset taulukot, Otakustantamo, 1984. CRC Press, 1999.- B. Schrader, Raman/infrared atlas of organic compounds, VCH, Weinheim, 1989.- D. A. Long, The Raman e�ect. A uni�ed treatment of the theory of Raman scatteringby molecules, Wiley, Chichester, 2002.

XI-2 Molecular spectroscopyXI.1. The Raman phenomenonThe Raman spectroscopy measures the vibrational motions of a molecule like the infra-red spectroscopy. The physical method of observing the vibrations is, however, di�erentfrom the infrared spectroscopy. In Raman spectroscopy one measures the light scat-tering while the infrared spectroscopy is based on absorption of photons. A summaryof the scattering theory is given in Appendix I. Scattering is also discussed in advancedtextbooks in quantum mechanics.The Raman phenomenon was detected in 1928 by the Indian physicist Sir ChandrasekharaVenkata Raman and KariamanikkamSrinivasa Krishnan.12 Independently of this work, thephenomenon was also reported by Grigory Landsberg and Leonid Mandelstam.3 However,the phenomenen was predicted theoretically even earlier by using the classical model.4After the end of 1920's the method was forgotten for several decades because the signalis very weak. Raman spectrocopy experienced a renaissance in the 1960's when the laserswere invented and started to be used as light sources in spectroscopy.The basics of the Raman scattering can be explained using classical physics but a morecomprehensiv theory requires quantum mechanical treatise. Both the classical and quan-tum mechanical formulations are schetched below.Classical description of the Raman phenomenonConsider a molecule (for the sake simplicity one) without a permanent dipole moment. Thee�ect of a permanent dipole moment can be easily incorporated. An oscillating electric�eld F = F0 cos(�0t) (XI:1)induces a dipole moment � = �F0 cos(�0t): (XI:2)The quantity � is the polarizability of the molecule. The polarizability is not a constantbut varies with every vibrational motion of the molecule. Let the fundamental vibration1 C. V. Raman and K. S. Krishnan, Nature, 121 (1928) 501 - 502, �A new type of secondary radiation�;C. V. Raman and K. S. Krishnan, Indian Journal of Physics 2 (1928) 399 - 419, �A new class ofspectra due to secondary radiation. I.�.2 C. V. Raman was made a knight in 1929 and received the Nobel proce for his invention in 1930.3 G. Landsberg and L. Mandelstam, Naturwiss. 16 (1928) 557 - 558.4 A. Smekal, Naturwiss. 16 (1923) 873.

Raman spectroscopy XI-3frequences of the molecule be �k, k = 1; 2; : : : ;M . Then� = �0 + MXk=1 �k cos(�kt+ �k): (XI:3)A phase factor �k has been included in the formula. The induced dipole moment isp = �0F0 cos(�0t) + MXk=1 �kF0 cos(�0t) cos(�k + �k)= �0F0 cos(�0t)+ MXk=1 �kF0� cos[(�0 + �k)t+ �k] + cos[(�0 � �k)t+ �k]: (XI:4)The classical theory of electromagnetism states that an oscillating dipole emits radiationof the intensity I = �4012��0c3 jpj2: (XI:5)A simple insertion gives the resultI = �4012��0c3�20F20 cos2(�0t) Rayleigh+ 112��0c3 PMk=1 �2kF20 � f(�0 + �k)4 cos2[(�0 + �k)t+ �k] anti� Stokes+(�0 � �k)4 cos2[(�0 � �k)t+ �k]g Stokes+ : : : (XI:6)An oscillating dipole moment emits therefore with the frequency of the incident �eld (Ray-leigh scattering) in phase with the incident �eld. In addition, the molecule radiates withtwo frequencies that are modulated by the frequency of the excited normal vibration andphase shifted (Raman scattering). The Raman scattered light has a lower frequencythan the incident light (Stokes-raman scattering) or a higher frequency (anti-Stokes-Raman scattering).One of the failures of the classical picture is that the ratio of the Stokes and anti-Stokesintensities should theoretically beI(Stokes)I(anti� Stokes) = (�0 � �k)4(�0 + �k)4 ; (XI:7)which is not the case experimentally.

XI-4 Molecular spectroscopyThe quantum mechanical description of the Raman e�ectThe relevant quantum mechanical system is the molecule plus the �eld. Usually the time-dependent Schrödinger equation of the system is solved by using perturbation theory,basically in the same way the Einstein transition rate is calculated, but in this case tosecond order. The intensities are then according to Appendix IInmi = 4e416�2�20c4 (�0 � �k)4j < njmijm > j2 (XI:8)with the matrix elements of the induced dipole moment< njmijm > = �hXj Xr f< nj�̂ijr >< rj�̂iF̂ 0j jm >�rm � �0+ < nj�̂iF̂ 0j jr >< rj�̂ijm >�nr � �0 g: (XI:9)The momentaneous dipole moment �̂i is determined also here by the polarizability. Themeaning of this expression is illustrated in Fig. XI.1. In addition to the free molecule'seigenstates (somewhat perturbed) the system also has (an in�nite number of) virtual statesr. Very schematically one can say that the molecule is excited to a virtual state wherea photon has transferred from the electric �eld to the molecule ("dressed molecule") andthen goes back to one of the initial states. In the �gure it is also shown that the energy ofthe incident photon must not be equal to any of the electronic excitation energies of themolecule because the photon is absorbed in that vase. The uppermost whole line in the�gure indicates an electronically excited state.
Rayleigh scatteringhν = hν0
hν0
hν
UV
vis
abso
rptio
n
Stokes scatteringhν = hν0 - hνk
νk
hν0
hν
Anti-Stokes scatteringhν = hν0 + hνk
hν0
hν
Fig. XI.1. Schematic representation of the Raman e�ect.

Raman spectroscopy XI-5In the quantum mechanical model the intensity depends on the occupation of the initialstate. This is determined by the Boltzmann distribution. Thus the intensity ratio isI(Stokes)I(anti� Stokes) = (�0 � �k)4(�0 + �k)4 ehc~�k=kT : (XI:10)This ratio depends on the temperature T . Therefore one can determine the temperatureof the sample by measuring the intensities of both the Stokes line and the correspondinganti-Stokes line. The temperature is given by the formulaT = �~�k � 1:43879[lnf I(anti�Stokes)I(Stokes) g+ 4 lnf �0��k�0+�k g] : (XI:11)An example of the Raman spectrum is shown in Fig. XI.2.
-800 -400 0 400 800
Raman frequency (cm-1)
Ram
an in
tens
ity -
>
2214
822
176
2247
9
2262
4
2272
0
2293
8
2315
6
2325
2
2339
7
2370
023
728
790 790
762 762
459 459
314 314
218 218
Fig. XI.2. An example of a Raman spectrum. Carbon tetrachloride.Intensity of the scattered lightThe most common process in light scattering is that the photon does not interact at allwith the sample but simply passes through it. Only one photon of 103 or 104 is scatteted.
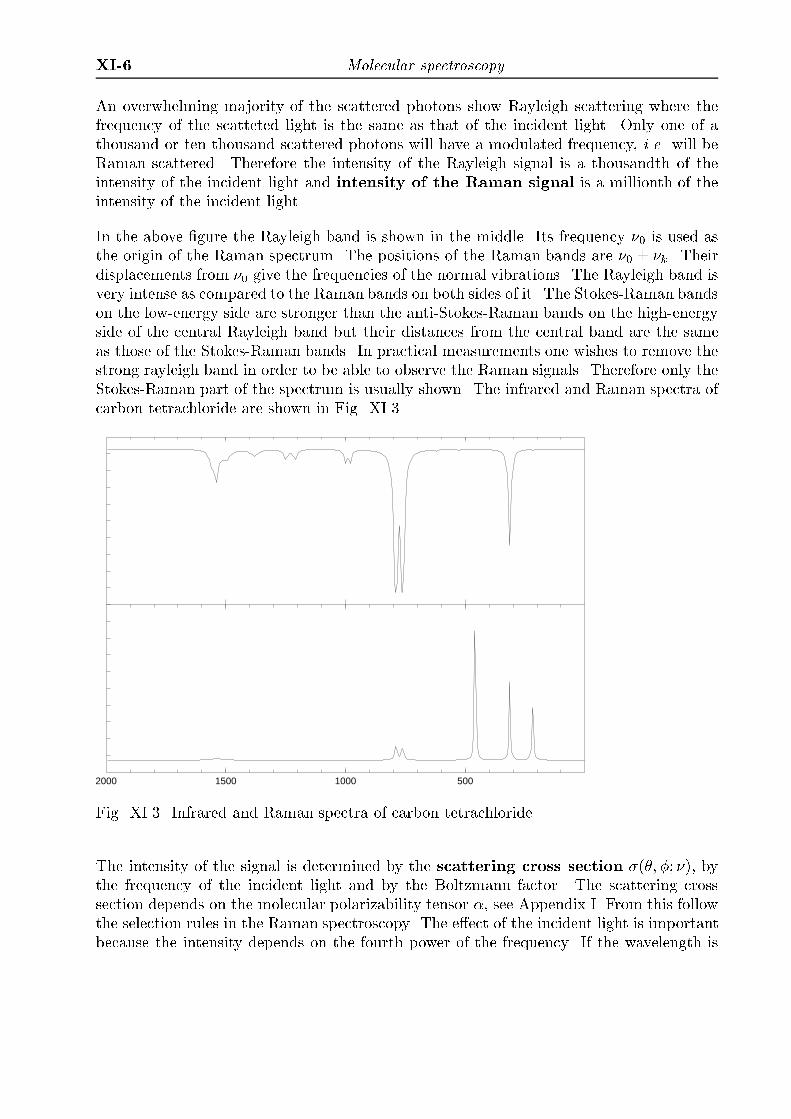
XI-6 Molecular spectroscopyAn overwhelming majority of the scattered photons show Rayleigh scattering where thefrequency of the scatteted light is the same as that of the incident light. Only one of athousand or ten thousand scattered photons will have a modulated frequency, i.e. will beRaman scattered. Therefore the intensity of the Rayleigh signal is a thousandth of theintensity of the incident light and intensity of the Raman signal is a millionth of theintensity of the incident light.In the above �gure the Rayleigh band is shown in the middle. Its frequency �0 is used asthe origin of the Raman spectrum. The positions of the Raman bands are �0 � �k. Theirdisplacements from �0 give the frequencies of the normal vibrations. The Rayleigh band isvery intense as compared to the Raman bands on both sides of it. The Stokes-Raman bandson the low-energy side are stronger than the anti-Stokes-Raman bands on the high-energyside of the central Rayleigh band but their distances from the central band are the sameas those of the Stokes-Raman bands. In practical measurements one wishes to remove thestrong rayleigh band in order to be able to observe the Raman signals. Therefore only theStokes-Raman part of the spectrum is usually shown. The infrared and Raman spectra ofcarbon tetrachloride are shown in Fig. XI.3.
2000 1500 1000 500Fig. XI.3. Infrared and Raman spectra of carbon tetrachloride.The intensity of the signal is determined by the scattering cross section �(�; �; �), bythe frequency of the incident light and by the Boltzmann factor. The scattering crosssection depends on the molecular polarizability tensor �, see Appendix I. From this followthe selection rules in the Raman spectroscopy. The e�ect of the incident light is importantbecause the intensity depends on the fourth power of the frequency. If the wavelength is

Raman spectroscopy XI-7halved (e.g., from 1064 to 532 nm) the intensity of the scattered light will increase by afactor 16.

XI-8 Molecular spectroscopyXI.2. The Raman spectrometerThe light sourceThe light source of a Raman spectrometer must give very intense radiation for the scatteredlight to be strong enough to be observed. In addition, the light should be as monochromaticas possible so that the Raman bands would be as narrow as possible.In the old instruments a mecury vapor lamp is commonly used. It has several strongemission bands (253.7, 365.4, 404.7, 435.8, 546.1 and 578.0 nm). If one does not usea �lter to select one of the bands all of them will generate a spectra that may partlyoverlap. The emission bands also have quite large widths which will be convoluted into theresulting Raman spectrum and result in quite broad Raman bands. The emission bandsof a mercury lamp lie in the range from UV to visible green light. This is very favorable inRaman spectroscopy because the intensity of the scattered light inreases with the fourthpower of the frequency. On the other hand one risks to hit on an electronic absorption bandwhich will result in �uorescence. The �uorescence in Raman spectroscopy is discussed indetail later. In modern spectrometers a laser is used as the light source because it gives ahigh intensity and the light can easily be focused in a small spot in the sample. Laser lightis also polarized and this can be used to determine the depolarization ratio. Gas lasers, inparticular the argon laser that has two stron emission lines at 514 and 488 nm, have beenpopular. In FT-Raman spectrometers Nd:YAG lasers with an emission wavlength of 1064nm are popular. Today, also diode lasers are gaining popularity. Diode lasers can haveone of several emission wavelength, in particular 976, 830 and 785 nm are popular. Theemission power of modern diode lasers is typically several hundred milliwatts.The sampleThe scattered light is distributed in all directions. Two observation geometries areparticularly popular. For liquid samples observation at 90� angle to the incident lightbeam is used most often. This geometry is shown schematically in Fig. XI.4. Ine can alsoobserved light that is scattered in 180� angle (back scattering). This is normally theonly possibility for solid samples. Both geometries have their good points. The opticalarrangement is simpler in the 90� geometry. Also, the portion of Raman scattering of allthe scattered light is larger in 90� geometry than in 180� geometry. For gaseous nitrogen

Raman spectroscopy XI-9the ratios are5 IRaman(90�)IRayleigh(90�) = 1:32� IRaman(180�)IRayleigh(180�) : (XI:12)In the 180� geometry one only needs to have access to one surface of the sample whichmay make the practical experiment easier. The scattering intensity is also highest at 180�.For gaseous nitrogen IRaman(180�)IRaman(90�) = 1:50: (XI:13)
MonochromatorFig. XI.4. Raman experiment at 90� geometry.The estimates above are based on the following scattering probabilities at angle �,PRayleigh(�) = 0:75� (1 + cos2 �)PRaman(�) = � 34 + 8�� �1 + 3�+ (1� �) cos2 �� : (XI:14)Here � is the depolarization ratio. For nitrogen, � = 0.19 when the wavelength of theincident light is 337.1 nm. One can also derive for nitrogen gas the relationIRaman(180�)IRayleigh(180�)) = 4:9� 10�4: (XI:15)The sample cell is often an nmr tube or a capillary tune that is made of suitable glassgrade. The laser light is focused on the sample so that the glass wall of the cell does notdisturb the experiment. The scattered light is collected by using a large condensing lenseand directed to a monochromator or an interferometer and thence to the detector.5 N. M. Reiss, J. Appl. Phys. 43 (1972) 739.

XI-10 Molecular spectroscopyMonochromator and interferometerIn the infrared spectoscopy the interferometric technique has completely replaced the dis-persive technique. In Raman spectroscopy, however, the dispersive spectrometers ha-ve certain advantages over the interferometry. The largest manufacturers of FT-Ramanspectrometers also produce dispersive Raman spectrometers. The dispersive instrumentsare signi�cantly more sensitive (by a factor of ten to hundred) than the FT-Raman spectro-meters. Therefore smaller laser e�ects can be used and thereby sensitive samples are a�ec-ted less. They also have a lower noise level indicating a lower detection limit. In an FT-Raman spectrometer the dominating source of noise is the detector noise while in moderndispersive Raman spectrometers the shot noise (i.e., random �uctuations of the chargecarriers in the electronic circuits) dominates. It is also easier to change the wavelength ofthe incident light in a dispersive spectrometer than in an FT-Raman spectrometer in casethe measurement is disturbed by, e.g., �uorescence. Today CCD detectors are common.They make the measurements fast because the whole spectrum (or a large portion of it)can be measured simultaneously.One of the great challenges in Raman spectroscopy is to remove the Rayleigh signal.This is accomplished in the old spectrometers by using very large double or triplemonochromators with large focal lengths (up to 1 m) and very high resolution. Thisallows the recording of spectra quite close to the central burst without the Rayleigh signalreaching to the detector. The optical arrangement of a typical double monochromator isshown in Fig. XI.5.6 The two gratings must be turned in phase and therefore the structureof the monochromator is such that both gratings are �xed to a common axis.
Gratings
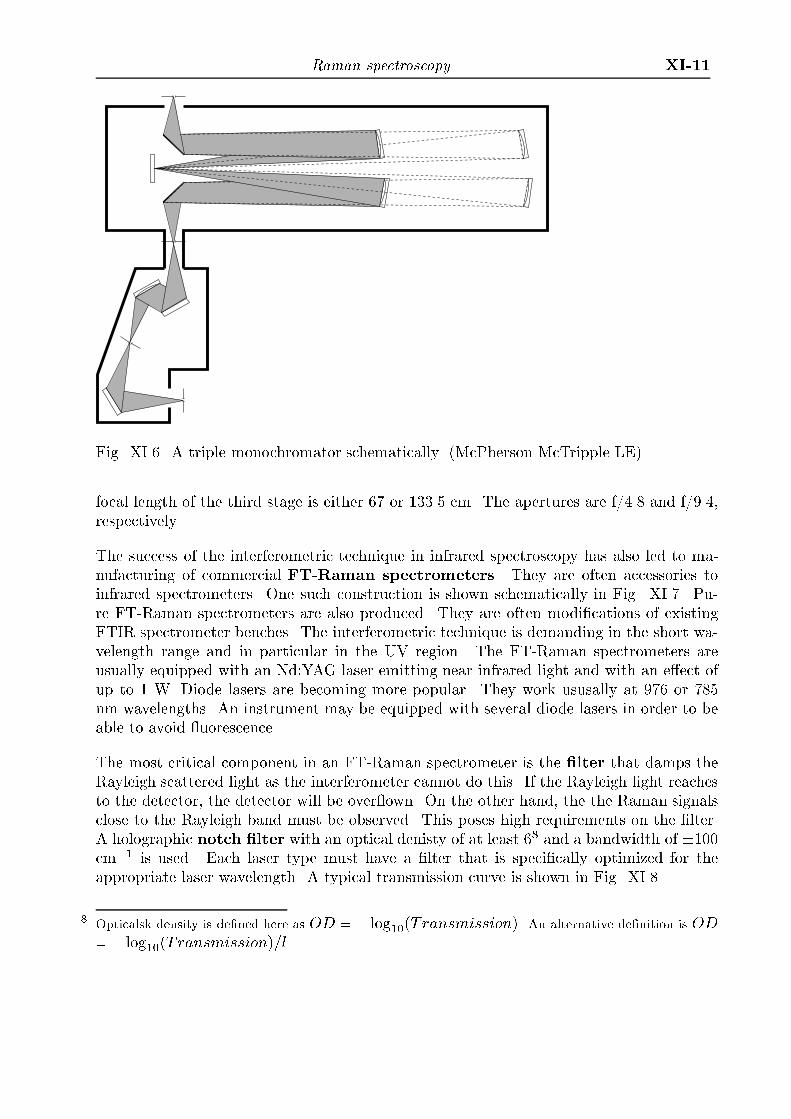
Fig. XI.5. A double monochromator schematically (Solar TII DM160).A traditional triple monochromator is shown in Fig. XI.6. The illustration shows schema-tically McPherson's McTriple LE monochromator,7 the two �rst stages of which are 20 cmononchromators with gratings that are rotated simultaneously by a connecting rod. The6 http://solartii.com/7 http://www.mcphersoninc.com/ramanspectroscopy/McTripleLE.htm
Raman spectroscopy XI-11
Fig. XI.6. A triple monochromator schematically. (McPherson McTripple LE).focal length of the third stage is either 67 or 133.5 cm. The apertures are f/4.8 and f/9.4,respectively.The success of the interferometric technique in infrared spectroscopy has also led to ma-nufacturing of commercial FT-Raman spectrometers. They are often accessories toinfrared spectrometers. One such construction is shown schematically in Fig. XI.7. Pu-re FT-Raman spectrometers are also produced. They are often modi�cations of existingFTIR spectrometer benches. The interferometric technique is demanding in the short wa-velength range and in particular in the UV region. The FT-Raman spectrometers areusually equipped with an Nd:YAG laser emitting near infrared light and with an e�ect ofup to 1 W. Diode lasers are becoming more popular. They work ususally at 976 or 785nm wavelengths. An instrument may be equipped with several diode lasers in order to beable to avoid �uorescence.The most critical component in an FT-Raman spectrometer is the �lter that damps theRayleigh scattered light as the interferometer cannot do this. If the Rayleigh light reachesto the detector, the detector will be over�own. On the other hand, the the Raman signalsclose to the Rayleigh band must be observed. This poses high requirements on the �lter.A holographic notch �lter with an optical denisty of at least 68 and a bandwidth of �100cm�1 is used. Each laser type must have a �lter that is speci�cally optimized for theappropriate laser wavelength. A typical transmission curve is shown in Fig. XI.8.8 Opticalsk density is de�ned here as OD = � log10(Transmission). An alternative de�nition is OD= � log10(Transmission)=l.

XI-12 Molecular spectroscopy
S1
S2
Inputbeam
Interferometer
Mirrorscanner
Exitbeam
Sample
D1
D2
YAGlaser
Raman
sample
Filter
RamandetectorFig. XI.7. FT-Raman module attached to Bruker IFS66.
610 620 630 640 650 660
Wavelength (µm)
8
7
6
5
4
3
2
1
0
Opt
ical
den
sity
Fig. XI.8. Transmission curve of a notch �lter. It is assumed here that the wavelength ofthe laser light is 633.5 nm.The detectors used in the FT-Raman spectroscopy depend on the laser wavelength. TheRaman signal is extremely weak and therefore the detector must be sensitive and its noiselevel low. The most common detector type is the germanium detector the must, however,be cooled down wit liquid nitrogen. It is excellent when used with a Nd:YAG laser.Examples of detector types that can be used in the near infrared region are shown in Fig.

Raman spectroscopy XI-13
1 2 3 4 5108
109
1010
1011
1012
1013
1014D
*
Wavelength (µm)
PbSe (300 K)
PbSe (196 K)
PbS (77 K)
PbS (196 K)
InSb (77 K)InAs (77 K)InGaAs (300 K)
Ge (77 K)
Fig. XI.9. Examples of detectors for the NIR region.XI.9.The modern dispersive spectrometers use �lters similar to those in FT-Raman spectro-meters. Then one can use a rather small monochromator as it does not need to separateaway the Rayleigh band. On the other hand, the �lter is optimized for a particular lasertype. If one wishes to have several lasers to choose among then one also has to implementall the necessary �lters in the spectrometer. The most common detector type is a CCDdetector that allows a fast uptake of the whole spectrum. At low resolution one does thennot need any moving parts in the spectrometer. The whole spectrum is recorded simul-taneously. This technique is also excellent for new measuring methods such as mapping.The principle of such specttrometers is illustrated in Fig. XI.10.CCD detector
Transmission grating
Raman signal
Filter
Raman and Rayleigh signal
Fig. XI.10. Dispersive Raman spectroscopy using a transmission grating.

XI-14 Molecular spectroscopyXI.3. Selection rules in Raman spectroscopyRaman spectroscopy measures molecular vibrations. The actual vibrations are the sameas in infrared spectroscopy and their symmetries can be determined in the same way asin infrared spectroscopy. This procedure has been discussed in chapter VII. The selectionrules can thus be derived from the theory of point groups. The physical interaction me-chanism in infrared spectroscopy is absorption of photons. That process is determined bythe �uctuations of the electric dipole moment of the molecule. In Raman spectroscopy thephotons are scattered. The physical quantity that governs scattering is the polarizability.In all other respects the analysis is similar to that in infrared spectroscopy. The principlesfor both experimental techniques have been discussed in chapter VII. The basic principlesfor interpretation of Raman spectra are discussed below.The intensity of the scattered light depends on the di�erential scattering cross sec-tion �(�; �). Molecules with an easily polarizable electron cloud have a high scatteringcross section. In Raman spectroscopy the vibrations a�ect the polarizability and thereforedi�erent vibrational modes give di�erent band intensities. The intensity of the Ramansignal is strongly a�ected by the frequency of the incident light. Therefore one often usesthe reduced scattering cross section �(�; �)(~�0 � ~�k)�4. The reduced scattering crosssections of a few liquids are shown in the table below. Wavelength of the incident light is488 nm. Molekyl Vibration (cm�1) �(�; �)(~�0 � ~�k)�4 10�48 cm6=srC6H6 992 225C6H5CH3 1002 127C6H5NO2 1345 766CS2 656 280CCl4 459 140CHCl3 666 54762 32C6H12 802 60Molecules with aromatic or conjugated functional groups show a high Raman intensitybecause the delocalized electrons are easily polarizable. Molecules with double bonds orfree electron pairs often show hifh Raman signals. However, water is a notable exception.There the free electron pairs form hydrogen bonds and their polarizability is reduced.Water is a good solvent in Raman spectroscopy. The complexes of transition metal ionsoften give strong Raman signals.
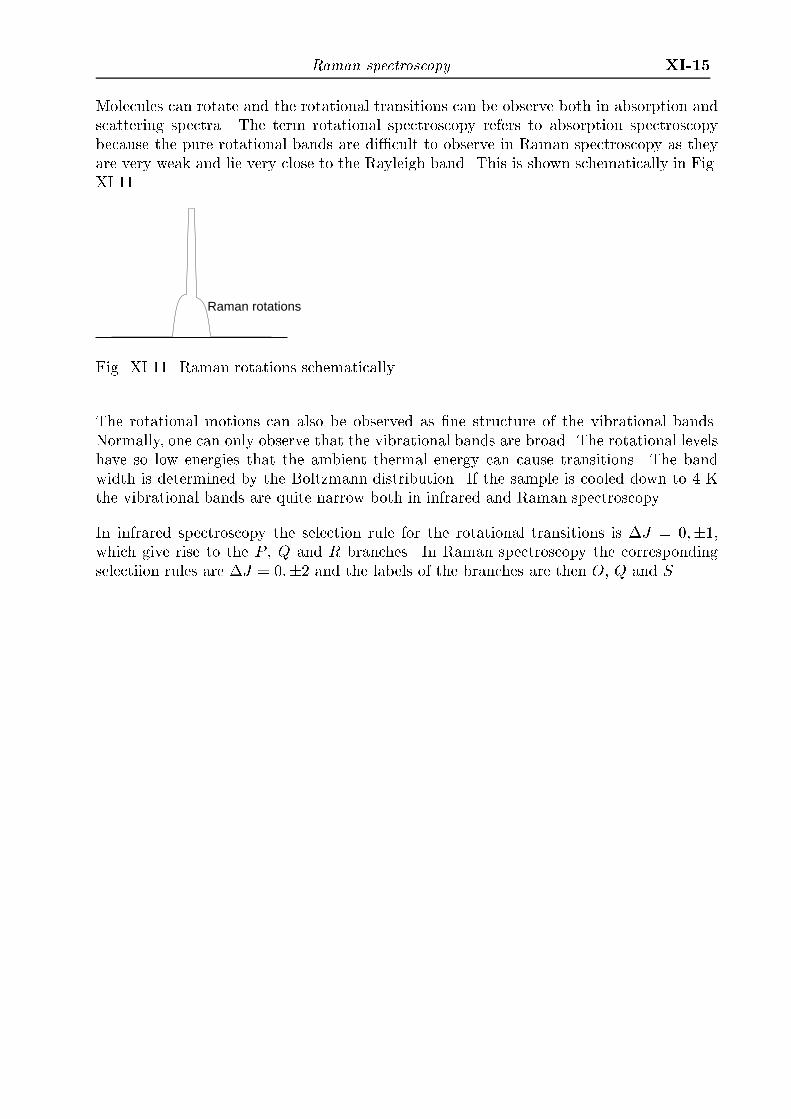
Raman spectroscopy XI-15Molecules can rotate and the rotational transitions can be observe both in absorption andscattering spectra. The term rotational spectroscopy refers to absorption spectroscopybecause the pure rotational bands are di�cult to observe in Raman spectroscopy as theyare very weak and lie very close to the Rayleigh band. This is shown schematically in Fig.XI.11.Raman rotationsFig. XI.11. Raman rotations schematically.The rotational motions can also be observed as �ne structure of the vibrational bands.Normally, one can only observe that the vibrational bands are broad. The rotational levelshave so low energies that the ambient thermal energy can cause transitions. The bandwidth is determined by the Boltzmann distribution. If the sample is cooled down to 4 Kthe vibrational bands are quite narrow both in infrared and Raman spectroscopy.In infrared spectroscopy the selection rule for the rotational transitions is �J = 0;�1,which give rise to the P , Q and R branches. In Raman spectroscopy the correspondingselectiion rules are �J = 0;�2 and the labels of the branches are then O, Q and S.

XI-16 Molecular spectroscopyXI.4. Interpretation of Raman spectraThe selection rules of Raman spectroscopy are di�erent from those of inrared spectroscopybecause the physical processes givin rise to the spectra are di�erent. However, the actualmolecular vibrations are the same. Therefore the basic principles of assignment are thesame in infrared and Raman spectroscopy. If a vibrational motion is active in both infraredand raman spectroscopies the band position is obviously the same in both spectra. Thedi�erence of the selection rules can result in bands that are strong in the infrared spetrumbut weak in the Raman spectrum and vice versa. Therefore the infrared and Ramanspectra di�er and the same correlation tables cannot be used for both. The two methodscomplement each other.The Raman spectra are often simpler than the corresponding infrared spectra. The al-lowed fundamental transitions give very strong signals while the forbidden fundamentaltransitions often give very weak signals in Raman spectroscopy. This is typically not thecase in infrared spectroscopy.Certain functional groups are easily identi�ed from the infrared spectrum and others inthe Raman spectrum. One notable example of the di�erences are the sceleton vibrationsof aromatic hydrocarbons. Some examples are shown in the table below.Molecule Band position Intensitycm�1 Raman IRNaphtalene 1630 - 1595 w m1580 - 1570 vs vw1510 - 1500 vw m1390 - 1350 vs msAnthracene 1630 - 1620 ms ms1560 - 1550 vs s1400 - 1390 vs vwFenantrene 1620 - 1600 m m1520 - 1500 m s1460 - 1440 s m1350 - 1300 vs wOne application where Raman spectroscopy can be particularly useful is identi�cation ofinorganic compounds that often have low vibrational frequencies lying close to or evenbelow 400 cm�1 which is the limit for infrared spectroscopy. Some examples of the Ramanspectra of inorganic three, four and �ve atom ions are shown in the table below. The

Raman spectroscopy XI-17symbol p indicates that the band is polarized.

XI-18 Molecular spectroscopy�1 band, cm�1 �2 band, cm�1Molecule (vibration, symmetry) (vibration, symmetry)(puktgrupp) in H2O powder R IR in H2O powder R IRD1h �s(�+) �(�)NO�3 1350 1380 - 1320 vs 635 660 - 630NO+2 1400 vs 570FHF� 610 - 585 vs 1205 1260 - 1200 m mC1vOCN� 1292, 1205 1215 - 1200 s w 615 640 - 600 mSCN� 745 s w 470 490 - 420 m mC2v �s(A1) �(A2)NO�2 1330 1380 - 1320 s s 815 635 - 825 m sD3h �s(A01) �(A002)BO3�3 910 p 1000 - 925 vs 700 760 - 680 sNO�3 1050 p 1060 - 1020 vs 825 835 - 780 w sCO2�2 1060 p 1090 - 1050 vs 880 890 - 850 mC3v �s(A1) �(A1)SO2�3 965 p 990 - 950 vs s 615 p 650 - 620 w mClO�3 930 p 935 - 915 s 625 p 625 - 600BrO�3 800 p 805 - 770 s 440 p 445 - 420IO�3 780 p 780 - 695 s 390 p 415 - 400OH+3 3380 - 3280 m vs 1180 - 1150Td �s(A1) �(E)NH+4 3040 p s 1680ND+4 2215 p s 1215PO3�4 935 p 975 - 960 vs 565 600 - 540 w mSO2�4 980 p 1010 - 970 vs 615 680 - 610 w mClO�4 930 p 940 - 930 vs 625IO�4 790 p vs 325MnO�4 840 p 860 - 840 vs 430CrO�4 850 p 860 - 840 vs 370AsO3�4 810 p vs 340AlH�4 1740 p 1640 s s 800 900 - 800 w mBF�4 770 p vs s 525 w s

Raman spectroscopy XI-19�1 band, cm�1 �2 band, cm�1Molecule (vibration, symmetry) (vibration, symmetry)(puktgrupp) in H2O powder R IR in H2O powder R IRD1h �as(�+)NO�3 2070 2190 - 2010 vsNO+2 2360 vsFHF� 1535 1700 - 1400 vsC1vOCN� 2190 p 2220 - 2130 s sSCN� 2065 p 2160 - 2040 vs sC2v �as(B1)NO�2 1230 1260 - 1230 m vsD3h �as(E0) �(E0)BO3�3 1460 - 1240 vs 680 - 590 m mNO�3 1400 m vs 720 740 - 710 m wCO2�2 1415 1495 - 1380 w vs 680 740 - 610 w mC3v �as(E) �(E)SO2�3 950 970 - 890 m s 470 520 - 470 s mClO�3 980 990 - 965 m s 480 500 - 460BrO�3 830 830 - 800 m s 350IO�3 825 830 - 760 m s 350OH+3 3380 - 3270 m vs 1700 - 1600 m sTd �as(T2) �(T2)NH+4 3145 s 1400 1430 - 1390 sND+4 2350 s 1065PO3�4 1080 1100 - 1080 s 420 500 - 400SO2�4 1100 1140 - 1080 w vs 450 wClO�4 1130 1140 - 1080 460IO�4 850 255MnO�4 920 940 - 880 355CrO�4 885 915 - 870 350AsO3�4 810 vs 400AlH�4 1740 1785 vs 745 800 - 700 s sBF�4 985 s vs 355 w s

XI-20 Molecular spectroscopyXI.5. Depolarisation ratioA laser light source gives plane polarized light. The polarization plane (or the electricvector of the incident radiation, ~E), lies perpendicular to the optical axis of the spectrome-ter. The Raman scattering may alter the direction of the polarization plane. This is knownas depolarization. By measuring the intensity of the scattered light in two polarizationdirections, parallel with the polarization plane of the incident light, Ik, and perpendicularto it, I?, one can determine the depolarization ratio � as� = I?Ik : (XI:16)The polarization directions are de�ned in Fig. XI.12.
Sample cell
Laser in
E
AnalyserOptical
axis
SpectrometerI||
I⊥
Fig. XI.12. De�nition of the parameters for depolarization ratio.Every band has its characteristic depolarization ratio that depends on the symmetry pro-perties of the vibration. If the vibration belongs to the totally symmetric irreduciblerepresentation it will not modify the polarization plane and � = 0. In that case the vibra-tion is polarized. If the vibration is asymmetric it will turn the polarization plane and thedepolarization ratio is � = 0.75. Such vibrations are depolarized. Thus the symmetry ofthe vibration can be deduced from the depolarization ratio. This will help in assignmentof the spectral bands.The spectral bands of carbon tetrachloride at 218 and 314 cm�1 show a depolarization ratioof 0.75. The vibrations belong to the irreducible representations E and T2, respectively,which means that the shape of the molecule changes during the vibration. The vibrationobserved at 459 cm�1 belongs to the irreducible representation A1 and has a depolarizationratio of 0.006. That vibration does not change the shape of the molecule so the asymmetryof the polarization tensor cannot a�ect the scattering. The parallel and perpendicularspectra are shown in Fig. XI.13.

Raman spectroscopy XI-21
2000 1500 1000 500
I⊥
I||
Fig. XI.13. The parallel and perpendicular spectra of carbon tetrachloride.A more detailed analysis shows that when the incident radiation that propagates in thez direction with ~ni = ez = unit vector in z direction the corresponding electric vectorlies in x or y direction. The electric vectors are denoted as Eix(ki) and Eiy(?i). Let theincident radiation collide with a molecule that is placed at the origin of the coordinatesystem. The light scattered at 90� angle will propagate in the direction ~ns = ex. Themomentaneous electric dipole moment emitted by scattering has components pz(ks) andpy(?s). The scattered electric vector is parallel with or perpendicular to the scatteringplane, in this case xz. The coordinate system is shown in Fig. XI.14. One can write thematrix elements of the transition moment in Placzek's approximation (i.e., assumingthat the polarizability tensor is adiabatic) as(py) = (�yy)Ey(pz) = (�zy)Ey (XI:17)for incident light that is polarized in the y direction.Consider N freely rotationg ideal gas molecules in the vibrational ground state. Intensityof the scattered light is obtrained by taking the mean value of all orientations, i.e., byreplacing (�yy)2 by < (�yy)2 >. The isotropic mean value is expressed by using invariantquantities that can be de�ned in several di�erent ways. We use here the quantities (i)

XI-22 Molecular spectroscopyz
y
x
O
ni = ez
Ey(⊥i)
Ex(||i)
ns = ex
pz(||s)
py(⊥s)
Fig. XI.14. The coordinate system used to de�ne depolarization.mean polarizability9 a = 13(�xx + �yy + �zz); (XI:18)(ii) anisotropy 2 =12 �j�xx � alphayyj2 + j�yy � alphazzj2 + j�zz � alphaxxj2+ 34 �j�xy + �yxj2 + j�xz + �zxj2 + j�yz + �zyj2 ; (XI:19)(iii) antisymmetric anisotropy�2 = 34 �j�xy � �yxj2 + j�yz � �zyj2 + j�zx � �xzj2 : (XI:20)The intensity of an oscillating dipole at the angle � to the axis of the dipole isI = K!!4(p)2 sin2 �: (XI:21)Here only scattering at 90� angle is considered, �.e., � = �=2. ThereforeI(�=2;?s;?i) = K!N!4 < (�yy)2 > E2y : (XI:22)Similarly one can obtain the intensityI(�=2; ks;?i) = K!N!4 < (�zy)2 > E2y : (XI:23)Using the isotropic invariant quantities the intensities can be written asI(�=2;?s;?i) = K!N!4�45a2 + 4 245 �E2y (XI:24)9 For a discussion of the invariant quantities and their relation to the polarizability tensor, see any advancedtext book in electrodynamics, or e.g. Long.

Raman spectroscopy XI-23and I(�=2; ks;?i) = K!N!4� 215�E2y : (XI:25)Using these notations, the depolarization ratio can be written as�(�=2;?i) = I(�=2; ks;?i)I(�=2;?s;?i) = 3 245a2 + 4 2 : (XI:26)
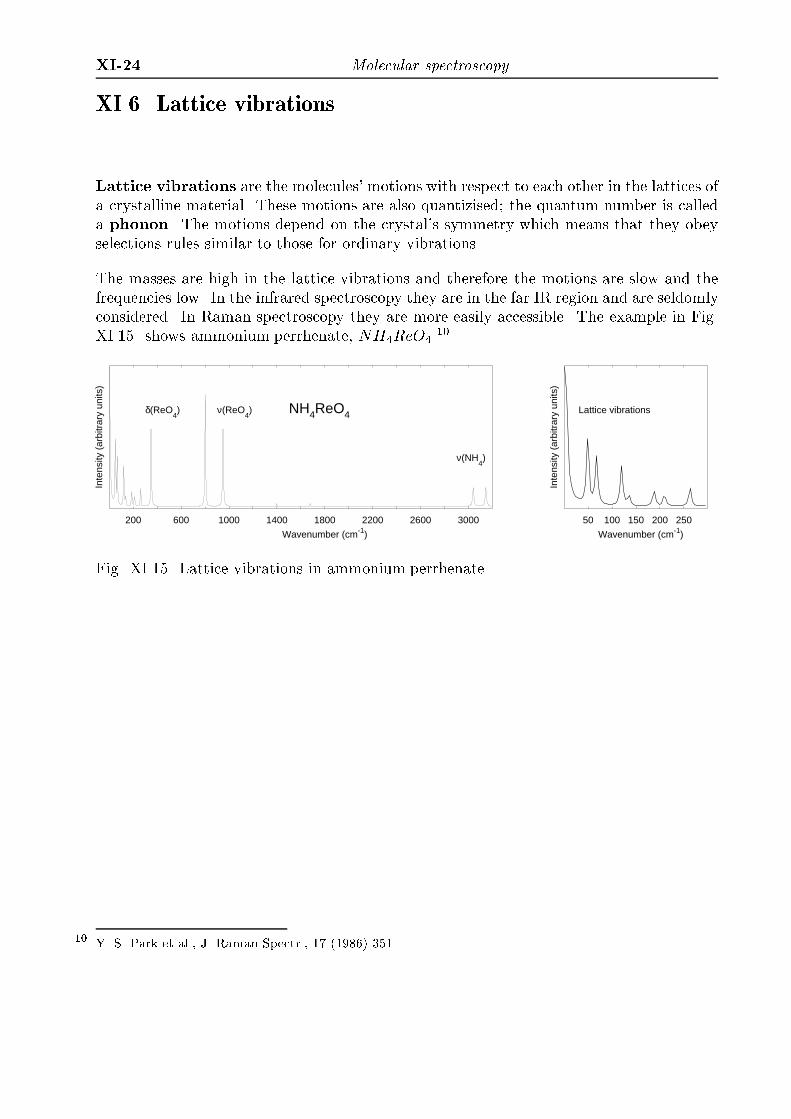
XI-24 Molecular spectroscopyXI.6. Lattice vibrationsLattice vibrations are the molecules' motions with respect to each other in the lattices ofa crystalline material. These motions are also quantizised; the quantum number is calleda phonon. The motions depend on the crystal's symmetry which means that they obeyselections rules similar to those for ordinary vibrations.The masses are high in the lattice vibrations and therefore the motions are slow and thefrequencies low. In the infrared spectroscopy they are in the far IR region and are seldomlyconsidered. In Raman spectroscopy they are more easily accessible. The example in Fig.XI.15. shows ammonium perrhenate, NH4ReO4.10
200 600 1000 1400 1800 2200 2600 3000
Wavenumber (cm-1)
Inte
nsity
(ar
bitr
ary
units
)
NH4ReO4
ν(NH4)
ν(ReO4)δ(ReO
4)
50 100 150 200 250
Wavenumber (cm-1)
Inte
nsity
(ar
bitr
ary
units
)
Lattice vibrations
Fig. XI.15. Lattice vibrations in ammonium perrhenate.
10 Y. S. Park et al., J. Raman Spectr., 17 (1986) 351.

Raman spectroscopy XI-25XI.7. Experimental methodsGas samples are seldomly used in Raman spectroscopy. In thin gases there are normallytoo few molecules in the focal point of the laser beam. This indicates that lasers with veryhigh power and extremely sensitive detectors must be used. On the other hand many gasesabsorb only deep in the UV so that incident radiation with quite short wavelengths canbe used. This increases of course the scattering cross section.The highest possible laser intensities are obtained when the sample is placed in the lasercavity.Liquid samples are easily handeled in the Raman experiment. Raman is a form ofvibrational spectroscopy so similar rules for the sample as in infrared spectroscopy mustbe observed. In particular the sample must be a pure compound. Each component of amixture gives its own set of bands but the interpretation still is quite cumbersome whenthe number of partly overlapping bands is large.The sample cells are often nmr tubes or melting point capillary tubes. The glass wall ofthe cell does not disturb the experiment when the incident light is focused on the sample.The typical incident laser powers range from a few tens to a few hundresd of milliwatts.The measuring method for liquid samples is normally the 90� geometry but back scattringis also used in some cases.powder samples can in most cases be placed in a capillary or in a cavity on a metalplate. It is also easy to construct sample holders for solid samples, �bres and �lms so thatthey can be places in the correct ngle in the spectrometer. The suitable amount of sampledepends on how easily handeled the sample is and on the size of the focal point of theincident laser beam, typically approximately 10 �m.Single crystals can be attached to the xy table of a microscope by using a non-�uorescentglue. By using polarized light and turning the crystal in di�erent orientations it is possibleto determine all nine components of the polarization tensor.Thin �lms can be studied, e.g., by using a sample holder where the light is re�ected onthe �lm. One such sample holder is shown in Fig. XI.16. In this way one can obtainperfectly acceptable Raman spectra of 25 Å thick �lms of long-chained organic molecules,of 75 Å thick phospholipids, of 6 nm thick titanium oxide �lms or of 1 �m thick polymer�lms.Strongly absorbing samples can be problematic because of strong �uorescence or becau-se they are strongly heated. Samples that normally would be combusted by the stronglaser light can be placed in a rotating sample holder. Then one has continuously fresh

XI-26 Molecular spectroscopyGlass
Film
AirPrism
Metal substrate
GlassFilm
Laser in
Fig. XI.16. Sample holder for thin �lms.sample under the laser beam and the sample does not have time to heat so much that itwould be destroyed.Raman microscopy is a popular technique today. The most common method is to placethe sample on a xy table and move it so that the laser beam is focused at a network ofpoints on the sample one point at a time. Then one can store the raman spectrum for eachpoint to form a spectroscopic hypercube. One can also illuminate the whole surface atone time and by di�use light and photograph the surface through a notch �lter to see thedistribution of strongly scattering molecules on the whole surface. However, one cannothave the spectra and identify the scatterers in this case.Raman spectroscopy can be used for quantitative analysis because the intensity ofthe emission lines depends linearly on the concentration. It is in fact often easier than ininfrared spectroscopy because the calibration curve can be linear in a broader concentrationrange than in infrared spectroscopy. On the other hand the experimental conditions a�ectthe intensity of the scattered light. It is therefore customary to add an internal referenceto the sample in order to eliminate such errors. The accuracy of the quantitative analysisand the limit of determination depend on the scattering cross section of the sample. Ithas been reported that benzene, which is a strong scatterer, has been analyzed in carbontetrachloride down to concentrations of ca. 100 ppm. The modern techniques, in particularresonance Raman and SERS, have turned Raman spectroscopy to a sensitive method.

Raman spectroscopy XI-27XI.8. FluorescenceThe purpose of the traditional Raman spectroscopy is that the freauency of the incidentlight does not correspond to any electronic excitation in the molecule. If this happensthe light may be absorbed. The possible relaxation processes are then �uorescence, or anon-radiative process where the incident power is converted to heat whereby the samplemay be destroyed.Fluorescence is usually a phenomenon to be avoided in Raman spectroscopy. The probabi-lity of �uorescence inreases when incident light with a short wavelength is used. ThereforeUV or violet/blue/green light is not preferred even though the intensity of the scatteredlight would be quite high at such frequencies. Instead, infrared light is often used in par-ticular in FT-Raman instruments because of low probability of �uorescence. If �uorescenceis observed, its intensity is several decades higher than that of the scattered light and theRaman bands are drowned.If �uorescence occurs one should, if possible, switch to another laser wavelength. Mostoften the new wavelength does not coincide with any of the molecule's absorption bands.This is illustrated in Fig. XI.17 where the sample is poly (9-vinylcarbazol) and the twolaser wavelengths are 514 and 830 nm.11One common cause of �uorescence is impurities and rest chemicals in the sample. Fluore-scence is also a common phenomenon in biochemical and process chemical samples wherethere are many components. If one can chemically remove the disturbing substances fromthe sample the �uorescence often vanishes. One may also try to illuninate the sample athigh laser power for an extended period of time whereby the disturbing substances areburmed away. This method is called bleaching. If the sample itself emits �uorescent lightone may try to use a high laser power and see the very weak Raman signals on top of thestrong broad �uorescence band.One should also observe that scattering is an immediate process while �uorescence emissionstarts several nanoseconds after the incident pulse. A boxcar integrator can thereforeseparate the raman signal from the �uorescence light.If the sample absorbs and is heated it will be destroyed in a very short time under theintense laser light. The absolutely best method to avoid this is to switch to another laserwavelength that is not absorbed. If this is not possible one should use as low laser poweras possible and a short measuring time in order to reduce the heating. One can alsodefocus the incident laser light in order to reduce the energy density. Various rotatingsample holders have been suggested so that there is constantly fresh sample in the laserfocus whereby the heating is minimized. Examples of such sample holders are shown11 http://www.k-analys.se

XI-28 Molecular spectroscopy
200 400 600 800 1000 1200 1400 1600 1800
Wavenumber (cm-1)
Inte
nsity
(ar
bitr
ary
units
)
830 nm
514 nm
Fig. XI.17. Raman spectrum of poly (9-vinylcarbazol) at two incident laser wavelengthsof which one induces �uorescence. The scales for the �uorescence and Raman light are notthe same.schematically in Fig. XI.18. In the �rst sample holder the powder is pressed to a groove.In the second one the liquid is driven to the edge of the sample holder by the centrifugalforce.

Raman spectroscopy XI-29
Laser in
Slit
Sample
Sample
Laser in
SlitFig. XI.18. Examples of rotating sample holders for Raman spectroscopy. The �rst one isintended for powder samples and the second for liquid samples.XI.9. Resonance Raman spectroscopySometimes one can deliberately choose to use a laser wavelength that will induce �uore-scence. Such a method is known as resonance Raman spectroscopy. In resonanceRaman spectroscopy the intensity of the Raman signal is increased by a factor of 102 -106. This is a particularly useful technique for biochemical or process chemical samplesthat are mixtures of a number of substances. In such samples one can select one particularcomponent that absorbs at the laser wavelength that is used. E.g., the active centre of anenzyme often contains a metal ion that gives the complex a visible color while the rest ofthe organic material does not absorb. In that case one can obtain the Raman spectrum ofjust the active centre and nothing else. At the same time one can obtain information ofthe electronic state of the active complex.The enhancment a�ect exactly those parts of the molecule where the electronic absorptiontakes place. Not all vibrations of the molecule are enhanced equally much. If one uses,e.g., the wavelength of an electronic �� � transition the Raman signal of the stretchingvibration of the � bond will be a�ected most. Similarly, the vibrations of the metal-ligandbonds will be enhanced if the incident wavelength is adjusted to the absorption band ofthe metal complex. The Raman spectrum and resonance Raman spectrum of para-ethylphenols (PEP) in hexane are shown in Fig. XI.19. The Raman spectrum was producedusing laser light with 514 nm wavelength and the resonance Raman spectrum with 244nm. The spectral bands of PEP are marked with strokes. The most important bands

XI-30 Molecular spectroscopyof the solvent are marked with stars. Their intensity is not a�ected very much by theresonance.12
600 800 1000 1200 1400 1600
Wavenumber (cm-1)
Inte
nsity
(ar
bitr
ary
units
)
244 nm
514 nm
**
*
*
*
*
Fig. XI.19. Raman and resonance Raman spectra of para-ethyl phenol.The origin of the enhancement can be read in the �rst term of the Kramers-Heisenbergequation where the energy denominator contains the di�erence of frequencies (see AppendixI). This di�erence becomes small when the laser wavelength lies close to an absorptionband.
12 M. P. Russel et al., Biophys. J., 68 (2995) 1607.

Raman spectroscopy XI-31XI.10. SERSIn surface Enhanced Raman Scattering, SERS) the sample is placed on a metalsurface with an ordered crystal lattice. In this case the intensity of Raman scattering willbe increased by a factor of 103 - 106 as compared to liquid samples. A silver surface givesthe best results even though other metals, gold in particular, can also be used.The phenomenon is explained by the fact that the easily polarizable conduction electronsenhance the electric �eld of the incident light that a molecule in the sample feels. It hasalso been claimed that the molecules or ions on the metal surface can form weakly bondedelectron transfer complexes which have an absorption band at the laser wavelength. Thiswould then lead to a resonance enhancement.As an example consider the surface enhanced Raman spectrum of trans-1,2-bis(4-pyridyl)-ethylene (BPE) that is a relatively strong Raman scatterer. The spectrum is shown in Fig.XI.20. The spectrum has been created by using a frequency doubled Nd:YAG laser beamat 532 nm. The laser e�ect was 1.5 mW and the measuring time 5 s.13
800 1000 1200 1400 1600
Wavenumber (cm-1)
Inte
nsity
(ar
bitr
ary
units
)
Fig. XI.20. The surface enhanced Raman spectrum of BPE on a AgFON silver surface.
13 M. A. Young et al., Can. J. Chem., 82 (2004) 1435.
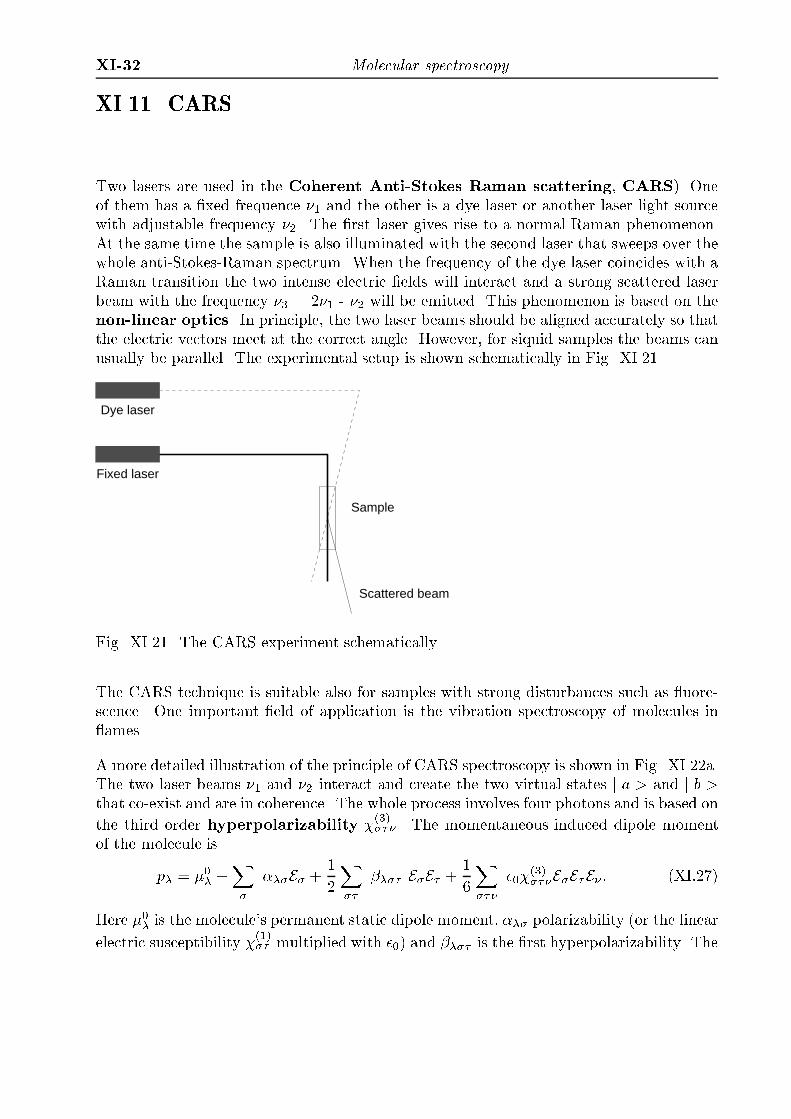
XI-32 Molecular spectroscopyXI.11. CARSTwo lasers are used in the Coherent Anti-Stokes Raman scattering, CARS). Oneof them has a �xed frequence �1 and the other is a dye laser or another laser light sourcewith adjustable frequency �2. The �rst laser gives rise to a normal Raman phenomenon.At the same time the sample is also illuminated with the second laser that sweeps over thewhole anti-Stokes-Raman spectrum. When the frequency of the dye laser coincides with aRaman transition the two intense electric �elds will interact and a strong scattered laserbeam with the frequency �3 = 2�1 - �2 will be emitted. This phenomenon is based on thenon-linear optics. In principle, the two laser beams should be aligned accurately so thatthe electric vectors meet at the correct angle. However, for siquid samples the beams canusually be parallel. The experimental setup is shown schematically in Fig. XI.21.
Sample
Fixed laser
Dye laser
Scattered beamFig. XI.21. The CARS experiment schematically.The CARS technique is suitable also for samples with strong disturbances such as �uore-scence. One important �eld of application is the vibration spectroscopy of molecules in�ames.A more detailed illustration of the principle of CARS spectroscopy is shown in Fig. XI.22a.The two laser beams �1 and �2 interact and create the two virtual states j a > and j b >that co-exist and are in coherence. The whole process involves four photons and is based onthe third order hyperpolarizability �(3)��� . The momentaneous induced dipole momentof the molecule isp� = �0� +X� ���E� + 12X�� ���� E�E� + 16X��� �0�(3)���E�E�E� : (XI:27)Here �0� is the molecule's permanent static dipole moment, ��� polarizability (or the linearelectric susceptibility �(1)�� multiplied with �0) and ���� is the �rst hyperpolarizability. The
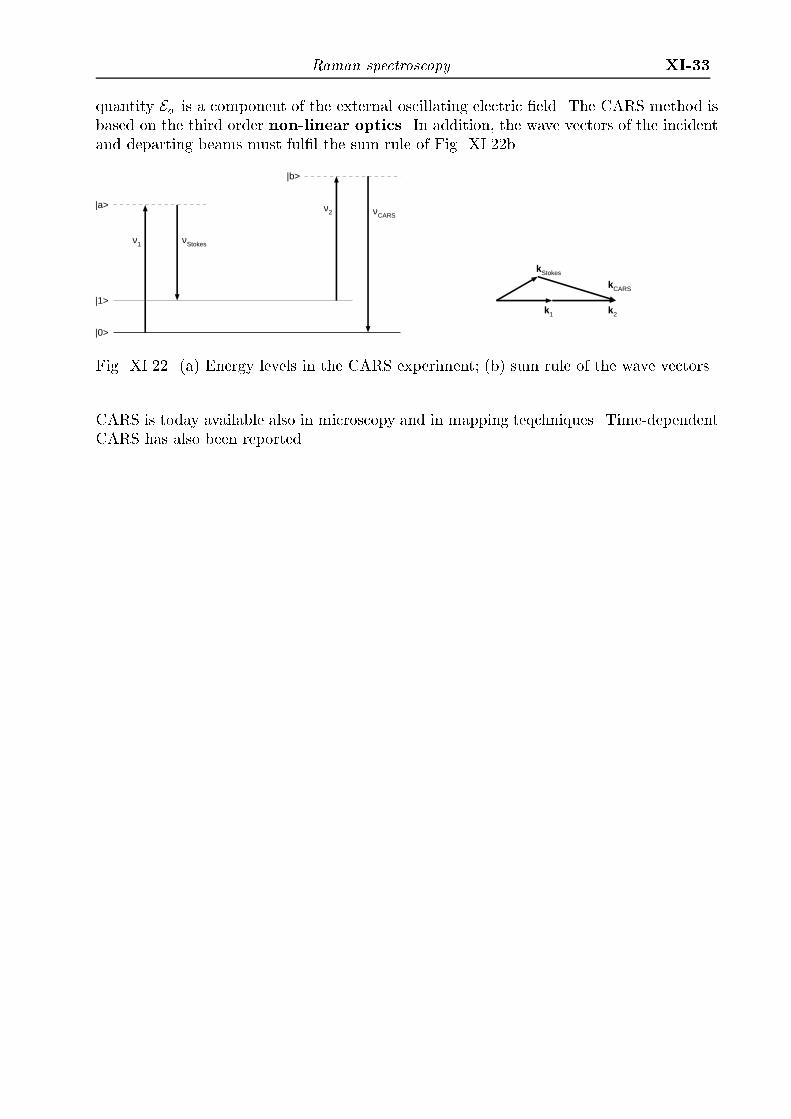
Raman spectroscopy XI-33quantity E� is a component of the external oscillating electric �eld. The CARS method isbased on the third order non-linear optics. In addition, the wave vectors of the incidentand departing beams must ful�l the sum rule of Fig. XI.22b.|0>
|a>
ν1
|1>
νStokes
|b>
ν2 νCARS
k1 k2
kStokes
kCARSFig. XI.22. (a) Energy levels in the CARS experiment; (b) sum rule of the wave vectors.CARS is today available also in microscopy and in mapping teqchniques. Time-dependentCARS has also been reported.

XI-34 Molecular spectroscopyXI.12. Time-resolved Raman spectrooscopyFast phenomena can be observed by sending short laser pulses to the sample. The pulsecharacteristics and the speed of the detcting assembly determine how short-lived processescan be observed. In specialized laboratories one can reach a time scale of femtoseconds.


![users.abo.fiusers.abo.fi/mhotokka/mhotokka/lecturenotes/ms04.d/ms04-optik-eng.pdf · r X u V n V 1 ! hpYZc`SVhZ_ _ #" pY G SV]](https://img.pdfslide.net/doc/110x75/5e4fb5e26acb5935e145e8b9/usersabo-r-x-u-v-n-v-1-hpyzcsvhz-py-g-sv.jpg)