Embed Size (px)
Citation preview
integration with high-speed electronic circuits(1, 20) and the realization of lossless micro-wave links.
References and Notes1. L. R. Dalton et al., J. Mater. Chem. 9, 1905 (1999); B. H.
Robinson et al., Chem. Phys. 245, 35 (1999); W. H.Steier et al., Chem. Phys. 245, 487 (1999); H. S. Nalwaand S. Miyata, Eds., Nonlinear Optics of Organic Mate-rials and Polymers (CRC Press, Boca Raton, FL, 1998); J.Zyss, Ed., Molecular Nonlinear Optics (Academic Press,New York, 1994); D. L. Wise et al., Eds., Electrical andOptical Polymer Systems (Dekker, New York, 1998);P. N. Prasad and D. Williams, Introduction to NonlinearOptical Effects in Molecules and Polymers (Wiley, NewYork, 1991).
2. W. E. Stephens and T. R. Joseph, J. Lightwave Technol.5, 380 (1987); C. H. Cox, G. E. Betts, L. M. Johnson,IEEE Trans. Microwave Theory Tech. 38, 501 (1990).
3. C. C. Teng, Appl Phys. Lett. 60, 1538 (1992); D. Chen etal., Appl Phys. Lett. 70, 3335 (1997); H. Fetterman et al.,in Organic Optics and Optoelectronics (1998 IEEE/LEOSSummer Topical Meeting Digest, Institute of Electricaland Electronic Engineers, New York), pp. 9–10; W.Wang et al., Appl. Phys. Lett. 67, 1806 (1995).
4. K. Naguchi, O. Mitomi, H. Miyazawa, J. LightwaveTechnol. 16, 615 (1998).
5. W. K. Burns et al., IEEE Photon. Technol. Lett. 10, 805(1998).
6. S. R. Marder, D. N. Beratan, L. T. Cheng, Science 252,103 (1991); S. R. Marder and J. W. Perry, Science 263,1706 (1994); S. R. Marder et al., Science 265, 632(1994); D. R. Kanis, M. A. Ratner, T. J. Marks, Chem.Rev. 94, 195 (1994); I. D. L. Albert, T. J. Marks, M. A.Ratner, J. Am. Chem. Soc. 119, 6575 (1997).
7. L. R. Dalton, A. W. Harper, B. H. Robinson, Proc. Natl.Acad. Sci. U.S.A. 94, 4842 (1997).
8. C. Zhang et al., Polym. Prepr. 40, 49 (1999).9. S. Ermer et al., Proc. SPIE, in press.
10. H. Lee et al., Appl. Phys. Lett. 71, 3779 (1997).11. Y. Shi et al., IEEE J. Sel. Top. Quantum Electron. 2, 289
(1996); Y. Shi, W. Wang, D. J. Olson, W. Lin, J. H.Bechtel, Proc. SPIE 3632, 144 (1999).
12. W. Wang et al., IEEE Photon. Technol. Lett. 11, 51(1999); T. A. Tumolillo and P. R. Ashley, IEEE Photon.Technol. Lett. 4, 142 (1992); K. H. Hahn et al., Elec-tron. Lett. 30, 1220 (1994).
13. H. R. Janson, Arch. Elektronik Ubertragungstechn. 32,485 (1978).
14. K. D. Singer, M. G. Kuzyk, J. E. Sohn, J. Opt. Soc. Am.B 4, 968 (1987).
15. C. C. Teng, Appl. Opt. 32, 1051 (1993).16. We have recently realized even lower loss values in
partially halogenated materials (for example, 0.7 dB/cm at 1300 nm and 1.0 dB/cm at 1550 nm).
17. Coupling losses of less than 1 dB have been realizedby means of exploiting mode size matching tech-niques and vertical transition waveguide structures[S. M. Garner et al., IEEE J. Quantum Electron. 35, 1146(1999)]. The total insertion loss of a commercial(Pacific Wave Industries, Los Angeles, CA) EO modu-lator based on the CLD-1 chromophore is comparableto that of the Lucent lithium niobate modulator.
18. D. Chen et al., IEEE Photon. Technol. Lett. 11, 54(1999).
19. H. Park, W. Hwang, J. Kim, Appl. Phys. Lett. 70, 2796(1997); Y. Shi, W. Wang, W. Lin, D. J. Olson, J. H.Bechtel, Appl. Phys. Lett. 71, 2236 (1997).
20. S. Kalluri et al., IEEE Photon. Technol. Lett. 8, 644(1996).
21. As can be seen from Fig. 2, even modest modificationof the structure of CLD-1 can lead to significantimprovement in optical nonlinearity. A particularlyattractive route to increasing conjugation lengthwhile maintaining exceptional thermal and photo-chemical stability is the insertion of dithiopheneunits I. Liakatas et al., Appl. Phys. Lett., 76, 1368(2000); L. R. Dalton et al., U.S. Patent pending.
22. Research supported by Air Force Research Laboratory,Air Force Office for Scientific Research, Ballistic Mis-sile Defense Organizations, National Science Founda-tion, and Office of Naval Research.
15 September 1999; accepted 25 February 2000
Dilational ProcessesAccompanying Earthquakes in
the Long Valley CalderaDouglas S. Dreger,1* Hrvoje Tkalcic,1 Malcolm Johnston2
Regional distance seismic moment tensor determinations and broadband wave-forms of moment magnitude 4.6 to 4.9 earthquakes from a November 1997Long Valley Caldera swarm, during an inflation episode, display evidence ofanomalous seismic radiation characterized by non–double couple (NDC) mo-ment tensors with significant volumetric components. Observed coseismicdilation suggests that hydrothermal or magmatic processes are directly trig-gering some of the seismicity in the region. Similarity in the NDC solutionsimplies a common source process, and the anomalous events may have beentriggered by net fault-normal stress reduction due to high-pressure fluid in-jection or pressurization of fluid-saturated faults due to magmatic heating.
The Long Valley Caldera (LVC) of easternCalifornia (Fig. 1) is tectonically and volcani-cally active. The 15-km-wide and 30-km-longcaldera has produced numerous eruptions sincethe penultimate event 730,000 years ago thatejected 600 km3 of rock and formed the calderathrough subsequent collapse. The current seis-mic unrest in the LVC began in 1980 withepisodic earthquake swarms and the inflation ofa resurgent dome (1) (Fig. 1). As a result of thisactivity the U.S. Geological Survey initiatedextensive seismic, ground deformation, andchemical monitoring in 1982. These surveyshave revealed episodic seismicity swarms thatcorrelate with the inflation of the resurgentdome, but confirmation of direct fluid involve-ment in the seismicity has been elusive.
In May 1980, four magnitude (M) 6 earth-quakes occurred: two south of the LVC in thevicinity of the Hilton Creek fault, and two inthe south moat of the caldera (Fig. 1). Two ofthese events, one located at the caldera mar-gin and the other 12 km to the south, as wellas an earlier event in 1978, were found tohave significant non–double couple (NDC)seismic moment tensors (2).
The latest episode of LVC deformation be-gan in 1997 and first became apparent in two-color laser geodimeter data as increased infla-tion of the resurgent dome in June followed byearthquake swarm activity in the south moat inJuly. Deformation rates and swarm activitycontinued to increase through October to ratesexceeding 2 cm/month and 100 M . 1.2 earth-quakes per day. Swarm activity, strain, and tiltrates increased on 22 November 1997, with theonset of a series of M . 4 earthquakes. A
borehole strain meter recorded a transient signalover the next week. Dome inflation, deforma-tion, and swarm activity returned to backgroundrates in early 1998 (3).
We investigated anomalous radiation char-acteristics of the 1997 earthquake swarm usinga moment tensor methodology. The seismicmoment tensor, Mij, provides a general repre-sentation of the seismic source and can bedetermined by the linear inversion of observedseismic ground motions with appropriately cal-ibrated Green’s functions (4). Mij is commonlydecomposed into double couple (DC), compen-sated-linear-vector-dipole (CLVD), and isotro-pic components (5), where each of the compo-nents of the moment tensor decomposition isrepresented as a percentage of the total (6). TheDC consists of two vector dipoles of equalmagnitude but opposite sign, resolving shearmotion on faults oriented 45° to the principleeigenvectors of Mij. The CLVD consists of amajor vector dipole with twice the strength andopposite sign to two orthogonal, minor vectordipoles and can describe the separation or com-pression of a fault with no net volume change.The isotropic component has three orthogonalvector dipoles of equal magnitude and resolvesvolumetric changes.
NDC seismic moment tensors have beenobserved in a variety of tectonic and volcanicenvironments. Several mechanisms such asmultiplanar rupture (7, 8), nonplanar rupture(9), and tensile failure (10) have been pro-posed to explain observed NDC moment ten-sors. In principle it should be possible todetermine the isotropic components givenbody and surface wave data; however, theyare difficult to resolve (11), and only a fewstudies have reported significant volumetriccomponents (12, 13).
Routine analysis of seismic moment tensorsby the Berkeley Seismological Laboratory re-vealed that a number of events in the November1997 swarm displayed unusual seismic radia-tion patterns (14). Seven events (Table 1) have
1Berkeley Seismological Laboratory, University of Cal-ifornia, Berkeley, CA 94720, USA. 2U.S. GeologicalSurvey, Menlo Park, CA 94025, USA.
*To whom correspondence should be addressed atBerkeley Seismological Laboratory, 281 McCone Hall,University of California, Berkeley, CA 94720, USA.E-mail: [email protected]
R E P O R T S
7 APRIL 2000 VOL 288 SCIENCE www.sciencemag.org122
been reanalyzed with our method, which invertsthree-component, complete seismograms (in-cluding regional P and S body waves and Loveand Rayleigh surface waves), recorded at thefive closest Berkeley Digital Seismic Networkstations (Fig. 1), for the complete seismic mo-ment tensor (4). As an example of the inverseprocedure we compare the deviatoric and fullmoment tensor (FMT, including isotropic com-
ponents) solutions for EVT4 (Fig. 2, A and B).We typically find that CLVD components are#30% for earthquakes in Northern California.The deviatoric inversion (Fig. 2A) yielded ananomalous solution with a 67% CLVD compo-nent, while the FMT solution (Fig. 2B) shows alarge 42% isotropic moment, the sign of whichindicates volumetric expansion. In contrast, thedeviatoric inversion for EVT6 yielded a nearly
pure DC solution and the FMT inversion yield-ed a large DC component (Table 2 and Fig. 2,C and D). Four events, EVT1–4, were found tohave anomalous NDC moment tensors includ-ing large dilatational volumetric components,and three, EVT5– 6 and REF1, resulted innearly pure DC solutions (Table 2). Tests ofinversion sensitivity, forward modeling of thedata, examination of Poisson ratio sensitivity,and three-CLVD decompositions of deviatoricinversion results indicate that there is no trade-off between a vertical-CLVD and the isotropiccomponent that we report.
To estimate the significance of the devia-toric and FMT solutions, we evaluated the im-provement in fit to the data using the F test (15)(Table 2). A grid search algorithm was used todetermine the best pure DC solution for eachevent. The FMT solutions of the anomalousevents (EVT1–4) satisfy the F test for signifi-cance above the 95% level relative to a refer-ence DC solution. The F test using the devia-toric solution as reference indicates .90% sig-nificance for EVT1 and .95% significance forEVT2–4. The FMT solution for these fourevents resulted in isotropic moments that are aconsiderable fraction of the deviatoric moment,and the improvement in fit is statistically sig-nificant whether the DC or the deviatoric NDC
-119 00' -118 54' -118 48' -118 42' -118 36'37 24'
37 30'
37 36'
37 42'
37 48'
PTPT
Long Valley CalderaResurgentDome
LakeCrowley
EVT2EVT3
REF3
EVT4
EVT5EVT6
PT
PT P
T
Hilton C
reek Flt
REF2
CMB
KCC
BKS
PKD
REF1
Inyo Craters
WC
POPA
PT
EVT1ORV
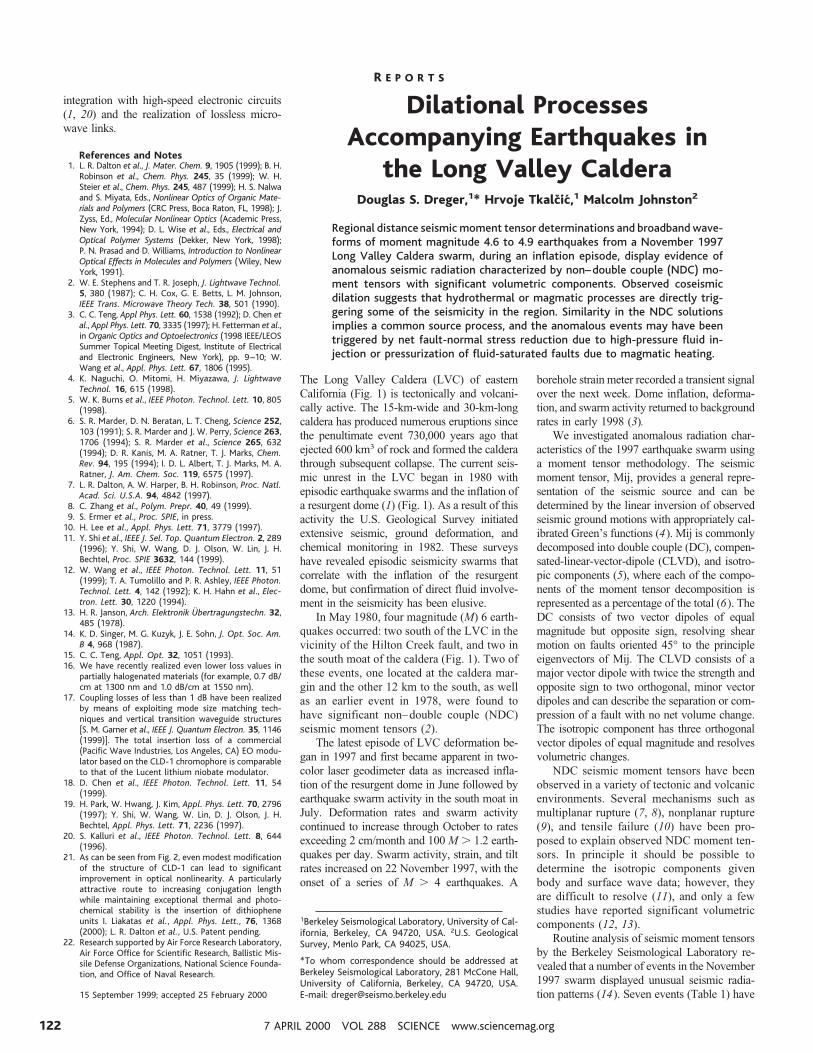
Fig. 1. Location map showing theLong Valley Caldera, resurgentdome, Inyo-Mono craters chain, andearthquakes we investigated. Thedeviatoric part of the full momenttensor solutions (each has a signifi-cant isotropic component) forEVT1–4 is plotted. The deviatoricmoment tensor solutions for REF1(inset) and EVT5 and EVT6 are com-pared, showing that for these eventspredominantly DC solutions are ob-tained. The locations of 1980 LVCearthquakes are shown as stars andthose with significant NDC compo-nents are shown as filled stars. Theevent labeled WC is the 1978Wheeler Crest earthquake that alsohad a large NDC component. TheDevil’s Postpile dilatational strainmeter (POPA) is shown by the filled square. The inset shows the relative location of the BerkeleyDigital Seismic Network stations used in our analysis to the study area.
Fig. 2. Comparison of the deviatoric (A) and full moment tensor (B) inversionresults for EVT4. In both cases, three-component (transverse, radial, andvertical, from left to right) displacement data (solid line) are compared tosynthetic seismograms (dashed line). The station azimuth and maximumtrace amplitudes are (314°, 5.16 3 1024 cm), (290°, 1.23 3 1023 cm),(276°, 1.03 3 1023 cm), (223°, 2.05 3 1023 cm), and (218°, 6.99 3 1024
cm) for ORV, CMB, BKS, KCC, and PKD, respectively. The strike, rake, and dipof the two nodal planes of the best double couple, the scalar seismic
moment (Mo), moment magnitude (Mw), the percent double couple (DC),percent compensated linear vector dipole (CLVD), percent isotropic (ISO),the variance of the data to the model, and lower hemisphere projection ofthe P-wave radiation pattern are provided. The same data are compared forEVT6 in (C) and (D). The station azimuth and maximum trace amplitude forEVT6 are (315°, 3.03 3 1024 cm), (294°, 9.41 3 1024 cm), (279°, 3.93 31024 cm), (245°, 9.49 3 1024 cm), and (222°, 3.90 3 1024 cm) for ORV,CMB, BKS, KCC, and PKD, respectively.
R E P O R T S
www.sciencemag.org SCIENCE VOL 288 7 APRIL 2000 123
solution is used as a reference (Table 2). Themaximum eigenvalue for all of the inversions isextensional, and the corresponding eigenvec-tors are nearly horizontal and oriented to thesouthwest. This orientation is consistent withregional strain and the inflation of the resurgentdome that is observed in the LVC (1). Devia-toric inversions for EVT5 and EVT6 resulted inlarge DC components, and the FMT inversionsresulted in isotropic components of 12% or lessand large DC components. The F tests forEVT5–6 indicate that the reduction in varianceis not statistically significant above 95%, and infact, it is only significant at the 65% level atbest. REF1 located outside of the LVC is an-other event with a small, statistically insignifi-cant, isotropic component.
For additional insight into the significanceof the results, we tested the stability of thesolutions using subsets of the data to explorethe possibility that a given station or combina-tion of stations may be controlling the inver-sion. In our Jackknife test, we performed inver-sions using all combinations of one, two, three,four, and five stations for the LVC events (Fig.3) and found a clear separation between theanomalous events that satisfied the F test andthe reference events that did not. The referenceevents with small isotropic components(;10%) indicate that it is not possible to re-solve isotropic components of 10% or less. Themean value of the isotropic percentage for
EVT1–4 lies between 27 and 45% and is stablefor all of the station subsets. The stability ofone- and two-station inversions indicates thatazimuthally dependent path effects are not afactor in the inversion results of the anomalousevents. The stability of the four-station inver-sions reveals that the isotropic component is notdue to the dominance of any one station.
Broadband P waveforms also show anoma-lous behavior (Fig. 4). REF2 and REF3 aresmall events that have similar P waveforms andfirst-motion focal mechanisms, indicating thatthe observed P-wave complexity may be due topath effects. Although it is possible that thecomplex P waveform of these events is due toan identical source process, this is unlikely, andthe first P pulse is interpreted as direct P, and thetwo that follow are likely reflected arrivals ormode conversions. Assuming a constant stress-drop scaling law and a value of 3 MPa, a sourceduration of 0.2 s is obtained for REF3 and 0.06 sfor REF2 (16). The observed duration of thedirect P pulse is the same for the two events,suggesting that seismic-wave attenuation maybe broadening the pulses. EVT6 resulted in anearly pure DC solution that is similar to thefirst-motion solutions of REF2 and REF3 and isalso seen to have a similar P waveform. Theestimated source duration of 0.46 s, for a stressdrop of 3 MPa, is consistent with the observedduration of 0.5 s, indicating that for the largerevents, the duration of the P waves is a good
representation of the source process time.The P waveforms of EVT1, EVT2, and
EVT4 have unusually long duration. There isa 2- to 2.5-s source phase with superimposedshorter period arrivals. Estimated static stressdrops based on these long source durationsare ,,0.1 MPa and are outside the 1- to10-MPa range observed in most earthquakes(17). For example, assuming a stress drop of3 MPa, a duration of 0.58 s is obtained, whichis less than a third of the observed duration.EVT3 is an anomalous moment tensor eventthat has an emergent onset to the P wave-form, but does not have the long-periodsource component observed in the other threeevents.
The isotropic moment was used to estimatethe change in source volume (DV) through theequation, M0iso 5 [l 1 (2/3)m]DV (18), whereM0iso is the scalar seismic moment of the iso-tropic component, and l and m are the Lameand rigidity elasticity constants. Assuming thatl 5 m 5 3 3 1010 Pascal, the estimated valuesof DV (Table 2) are much less than the 0.02 to0.04 km3/year that can be attributed to theinflation of the resurgent dome (14). For aspherical geometry, the radii of the volumeincrease are 28, 39, 25, and 43 m for EVT1–4.Assuming a static stress drop of 3 Mpa, thefault dimension, L, of each event was deter-mined from the deviatoric seismic moment(16), and the fault separation, UN 5 DV/L2, wasestimated (Table 2). UN is on the order of 5 to10 cm, which is consistent with observed open-ings of exhumed magmatic dikes; however, UN
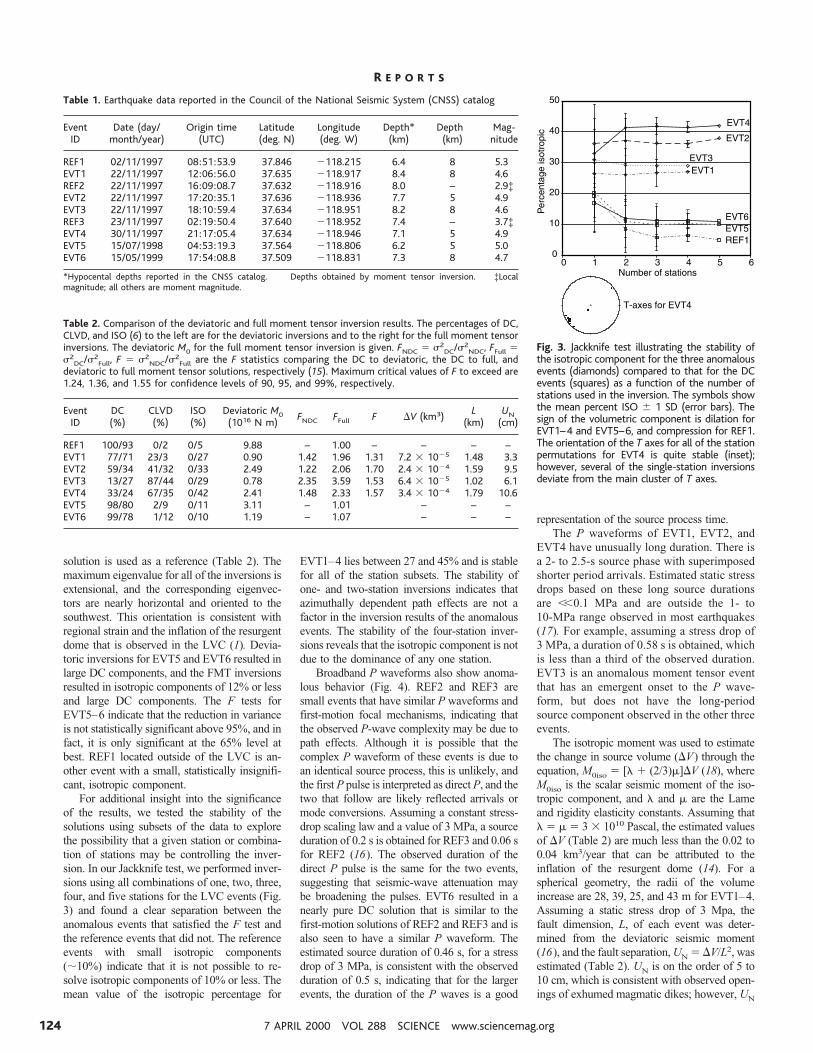
Table 1. Earthquake data reported in the Council of the National Seismic System (CNSS) catalog
EventID
Date (day/month/year)
Origin time(UTC)
Latitude(deg. N)
Longitude(deg. W)
Depth*(km)
Depth†(km)
Mag-nitude
REF1 02/11/1997 08:51:53.9 37.846 2118.215 6.4 8 5.3EVT1 22/11/1997 12:06:56.0 37.635 2118.917 8.4 8 4.6REF2 22/11/1997 16:09:08.7 37.632 2118.916 8.0 – 2.9‡EVT2 22/11/1997 17:20:35.1 37.636 2118.936 7.7 5 4.9EVT3 22/11/1997 18:10:59.4 37.634 2118.951 8.2 8 4.6REF3 23/11/1997 02:19:50.4 37.640 2118.952 7.4 – 3.7‡EVT4 30/11/1997 21:17:05.4 37.634 2118.946 7.1 5 4.9EVT5 15/07/1998 04:53:19.3 37.564 2118.806 6.2 5 5.0EVT6 15/05/1999 17:54:08.8 37.509 2118.831 7.3 8 4.7
*Hypocental depths reported in the CNSS catalog. †Depths obtained by moment tensor inversion. ‡Localmagnitude; all others are moment magnitude.
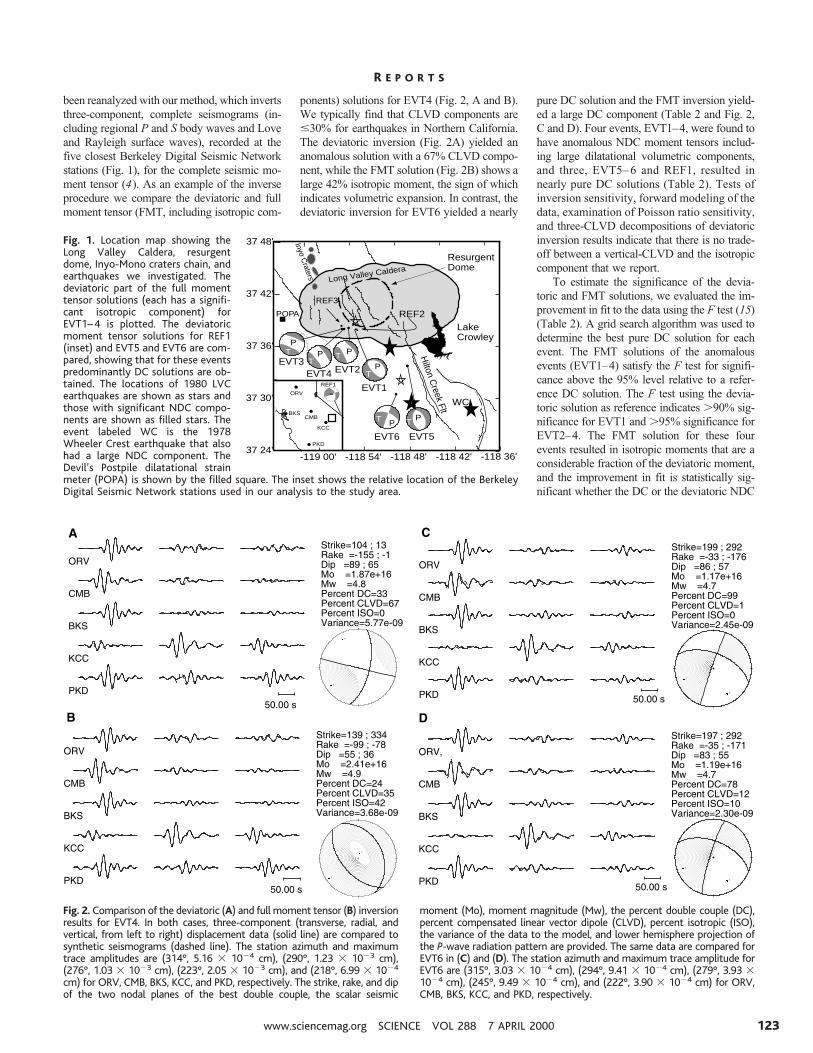
Fig. 3. Jackknife test illustrating the stability ofthe isotropic component for the three anomalousevents (diamonds) compared to that for the DCevents (squares) as a function of the number ofstations used in the inversion. The symbols showthe mean percent ISO 6 1 SD (error bars). Thesign of the volumetric component is dilation forEVT1–4 and EVT5–6, and compression for REF1.The orientation of the T axes for all of the stationpermutations for EVT4 is quite stable (inset);however, several of the single-station inversionsdeviate from the main cluster of T axes.
Table 2. Comparison of the deviatoric and full moment tensor inversion results. The percentages of DC,CLVD, and ISO (6) to the left are for the deviatoric inversions and to the right for the full moment tensorinversions. The deviatoric M0 for the full moment tensor inversion is given. FNDC 5 s2
DC/s2NDC, FFull 5
s2DC/s2
Full, F 5 s2NDC/s2
Full are the F statistics comparing the DC to deviatoric, the DC to full, anddeviatoric to full moment tensor solutions, respectively (15). Maximum critical values of F to exceed are1.24, 1.36, and 1.55 for confidence levels of 90, 95, and 99%, respectively.
EventID
DC(%)
CLVD(%)
ISO(%)
Deviatoric M0(1016 N m)
FNDC FFull F DV (km3)L
(km)UN
(cm)
REF1 100/93 0/2 0/5 9.88 – 1.00 – – – –EVT1 77/71 23/3 0/27 0.90 1.42 1.96 1.31 7.2 3 1025 1.48 3.3EVT2 59/34 41/32 0/33 2.49 1.22 2.06 1.70 2.4 3 1024 1.59 9.5EVT3 13/27 87/44 0/29 0.78 2.35 3.59 1.53 6.4 3 1025 1.02 6.1EVT4 33/24 67/35 0/42 2.41 1.48 2.33 1.57 3.4 3 1024 1.79 10.6EVT5 98/80 2/9 0/11 3.11 – 1.01 – – –EVT6 99/78 1/12 0/10 1.19 – 1.07 – – –
R E P O R T S
7 APRIL 2000 VOL 288 SCIENCE www.sciencemag.org124
is inversely proportional to L2 and is thereforesubject to uncertainty. For example, a stressdrop of 0.1 MPa results in separations of be-tween 0.5 to 1 cm.
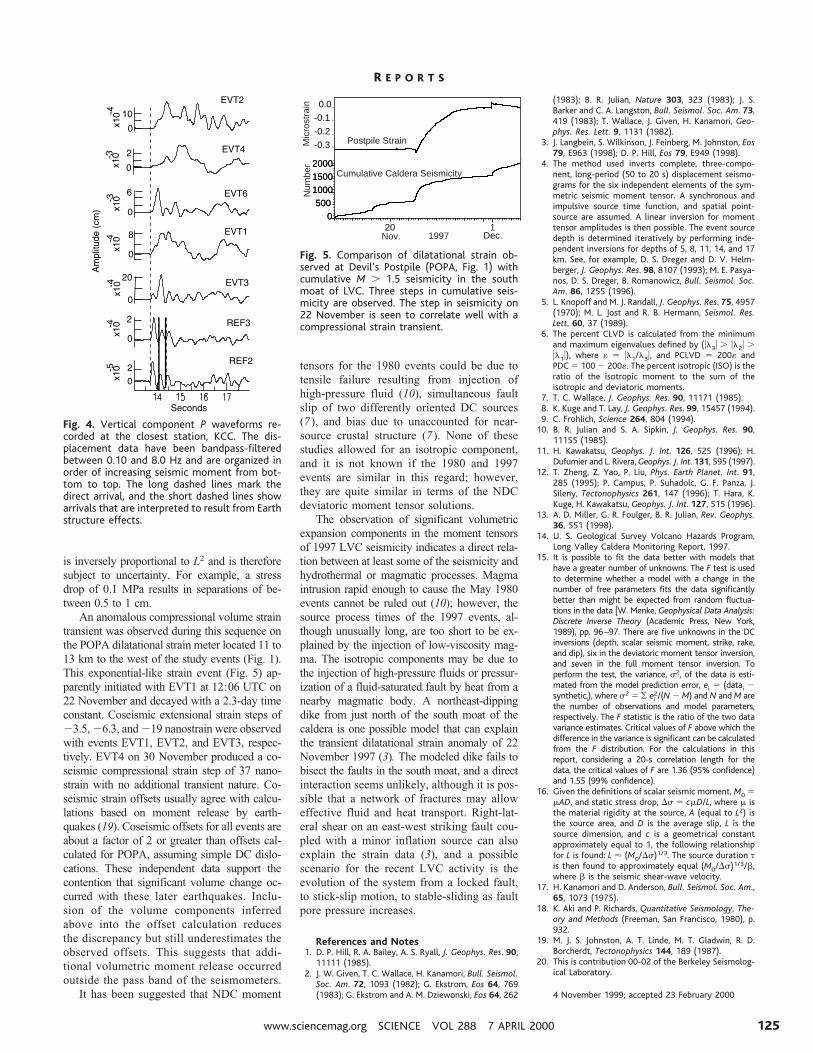
An anomalous compressional volume straintransient was observed during this sequence onthe POPA dilatational strain meter located 11 to13 km to the west of the study events (Fig. 1).This exponential-like strain event (Fig. 5) ap-parently initiated with EVT1 at 12:06 UTC on22 November and decayed with a 2.3-day timeconstant. Coseismic extensional strain steps of23.5, 26.3, and 219 nanostrain were observedwith events EVT1, EVT2, and EVT3, respec-tively. EVT4 on 30 November produced a co-seismic compressional strain step of 37 nano-strain with no additional transient nature. Co-seismic strain offsets usually agree with calcu-lations based on moment release by earth-quakes (19). Coseismic offsets for all events areabout a factor of 2 or greater than offsets cal-culated for POPA, assuming simple DC dislo-cations. These independent data support thecontention that significant volume change oc-curred with these later earthquakes. Inclu-sion of the volume components inferredabove into the offset calculation reducesthe discrepancy but still underestimates theobserved offsets. This suggests that addi-tional volumetric moment release occurredoutside the pass band of the seismometers.
It has been suggested that NDC moment
tensors for the 1980 events could be due totensile failure resulting from injection ofhigh-pressure fluid (10), simultaneous faultslip of two differently oriented DC sources(7), and bias due to unaccounted for near-source crustal structure (7). None of thesestudies allowed for an isotropic component,and it is not known if the 1980 and 1997events are similar in this regard; however,they are quite similar in terms of the NDCdeviatoric moment tensor solutions.
The observation of significant volumetricexpansion components in the moment tensorsof 1997 LVC seismicity indicates a direct rela-tion between at least some of the seismicity andhydrothermal or magmatic processes. Magmaintrusion rapid enough to cause the May 1980events cannot be ruled out (10); however, thesource process times of the 1997 events, al-though unusually long, are too short to be ex-plained by the injection of low-viscosity mag-ma. The isotropic components may be due tothe injection of high-pressure fluids or pressur-ization of a fluid-saturated fault by heat from anearby magmatic body. A northeast-dippingdike from just north of the south moat of thecaldera is one possible model that can explainthe transient dilatational strain anomaly of 22November 1997 (3). The modeled dike fails tobisect the faults in the south moat, and a directinteraction seems unlikely, although it is pos-sible that a network of fractures may alloweffective fluid and heat transport. Right-lat-eral shear on an east-west striking fault cou-pled with a minor inflation source can alsoexplain the strain data (3), and a possiblescenario for the recent LVC activity is theevolution of the system from a locked fault,to stick-slip motion, to stable-sliding as faultpore pressure increases.
References and Notes1. D. P. Hill, R. A. Bailey, A. S. Ryall, J. Geophys. Res. 90,
11111 (1985).2. J. W. Given, T. C. Wallace, H. Kanamori, Bull. Seismol.
Soc. Am. 72, 1093 (1982); G. Ekstrom, Eos 64, 769(1983); G. Ekstrom and A. M. Dziewonski, Eos 64, 262
(1983); B. R. Julian, Nature 303, 323 (1983); J. S.Barker and C. A. Langston, Bull. Seismol. Soc. Am. 73,419 (1983); T. Wallace, J. Given, H. Kanamori, Geo-phys. Res. Lett. 9, 1131 (1982).
3. J. Langbein, S. Wilkinson, J. Feinberg, M. Johnston, Eos79, E963 (1998); D. P. Hill, Eos 79, E949 (1998).
4. The method used inverts complete, three-compo-nent, long-period (50 to 20 s) displacement seismo-grams for the six independent elements of the sym-metric seismic moment tensor. A synchronous andimpulsive source time function, and spatial point-source are assumed. A linear inversion for momenttensor amplitudes is then possible. The event sourcedepth is determined iteratively by performing inde-pendent inversions for depths of 5, 8, 11, 14, and 17km. See, for example, D. S. Dreger and D. V. Helm-berger, J. Geophys. Res. 98, 8107 (1993); M. E. Pasya-nos, D. S. Dreger, B. Romanowicz, Bull. Seismol. Soc.Am. 86, 1255 (1996).
5. L. Knopoff and M. J. Randall, J. Geophys. Res. 75, 4957(1970); M. L. Jost and R. B. Hermann, Seismol. Res.Lett. 60, 37 (1989).
6. The percent CLVD is calculated from the minimumand maximum eigenvalues defined by (ul3u . ul2u .ul1u), where « 5 ul1/l3u, and PCLVD 5 200« andPDC 5 100 2 200«. The percent isotropic (ISO) is theratio of the isotropic moment to the sum of theisotropic and deviatoric moments.
7. T. C. Wallace, J. Geophys. Res. 90, 11171 (1985).8. K. Kuge and T. Lay, J. Geophys. Res. 99, 15457 (1994).9. C. Frohlich, Science 264, 804 (1994).
10. B. R. Julian and S. A. Sipkin, J. Geophys. Res. 90,11155 (1985).
11. H. Kawakatsu, Geophys. J. Int. 126, 525 (1996); H.Dufumier and L. Rivera, Geophys. J. Int. 131, 595 (1997).
12. T. Zheng, Z. Yao, P. Liu, Phys. Earth Planet. Int. 91,285 (1995); P. Campus, P. Suhadolc, G. F. Panza, J.Sileny, Tectonophysics 261, 147 (1996); T. Hara, K.Kuge, H. Kawakatsu, Geophys. J. Int. 127, 515 (1996).
13. A. D. Miller, G. R. Foulger, B. R. Julian, Rev. Geophys.36, 551 (1998).
14. U. S. Geological Survey Volcano Hazards Program,Long Valley Caldera Monitoring Report, 1997.
15. It is possible to fit the data better with models thathave a greater number of unknowns. The F test is usedto determine whether a model with a change in thenumber of free parameters fits the data significantlybetter than might be expected from random fluctua-tions in the data [W. Menke, Geophysical Data Analysis:Discrete Inverse Theory (Academic Press, New York,1989), pp. 96–97. There are five unknowns in the DCinversions (depth, scalar seismic moment, strike, rake,and dip), six in the deviatoric moment tensor inversion,and seven in the full moment tensor inversion. Toperform the test, the variance, s2, of the data is esti-mated from the model prediction error, ei 5 (datai 2synthetici), where s2 5 ( ei
2/(N 2 M) and N and M arethe number of observations and model parameters,respectively. The F statistic is the ratio of the two datavariance estimates. Critical values of F above which thedifference in the variance is significant can be calculatedfrom the F distribution. For the calculations in thisreport, considering a 20-s correlation length for thedata, the critical values of F are 1.36 (95% confidence)and 1.55 (99% confidence).
16. Given the definitions of scalar seismic moment, M0 5mAD, and static stress drop, Ds 5 cmD/L, where m isthe material rigidity at the source, A (equal to L2) isthe source area, and D is the average slip, L is thesource dimension, and c is a geometrical constantapproximately equal to 1, the following relationshipfor L is found: L ' (M0/Ds)1/3. The source duration tis then found to approximately equal (M0/Ds)1/3/b,where b is the seismic shear-wave velocity.
17. H. Kanamori and D. Anderson, Bull. Seismol. Soc. Am.,65, 1073 (1975).
18. K. Aki and P. Richards, Quantitative Seismology, The-ory and Methods (Freeman, San Francisco, 1980), p.932.
19. M. J. S. Johnston, A. T. Linde, M. T. Gladwin, R. D.Borcherdt, Tectonophysics 144, 189 (1987).
20. This is contribution 00-02 of the Berkeley Seismolog-ical Laboratory.
4 November 1999; accepted 23 February 2000
Fig. 4. Vertical component P waveforms re-corded at the closest station, KCC. The dis-placement data have been bandpass-filteredbetween 0.10 and 8.0 Hz and are organized inorder of increasing seismic moment from bot-tom to top. The long dashed lines mark thedirect arrival, and the short dashed lines showarrivals that are interpreted to result from Earthstructure effects.
Dec.20
-0.3
-0.2
-0.1
0.0
0500
100015002000
0500
100015002000
Postpile StrainMic
rost
rain
1997
Cumulative Caldera Seismicity
Nov.1
Num
ber
Fig. 5. Comparison of dilatational strain ob-served at Devil’s Postpile (POPA, Fig. 1) withcumulative M . 1.5 seismicity in the southmoat of LVC. Three steps in cumulative seis-micity are observed. The step in seismicity on22 November is seen to correlate well with acompressional strain transient.
R E P O R T S
www.sciencemag.org SCIENCE VOL 288 7 APRIL 2000 125