Embed Size (px)
Citation preview
ROYAL LEPAGE HOUSE PRICE SURVEY THIRD QUARTER 2011
Your gu ide to hous ing p r i ces in Canada
tytutyu
THIRD QUARTER 2011 ISSUE NO. 57
R O Y A L L E P A G E
H O U S E P R I C E S U R V E Y
ROYAL LEPAGE HOUSE PRICE SURVEY THIRD QUARTER 2011
Copyright© Residential Income Fund L.P. (“Royal LePage”) 2009. The information in this survey is provided for general information. E. & O. E. The information herein is from sources believed reliable, however, no responsibility is assumed for the accuracy of this information. It is not intended to provide professional, financial, real estate, legal or other advice. If you have specific questions, please contact a professional expert in that areas. All rights reserved. The information contained herein is the property of Royal LePage and any copying without written consent is prohibited.
T H E R O Y A L L E P A G E H O U S E
P R I C E S U R V E Y
The Royal LePage House Price Survey is the largest, most comprehensive study of its kind in Canada, with information on seven types of housing in over 250 neighbourhoods from coast to coast. A complete database of past and present surveys is available on the Royal LePage Web site at www.royallepage.ca. Housing values in the Royal LePage House Price Survey are Royal LePage opinions of fair market value in each location, based on local data and market knowledge provided by Royal LePage residential real estate experts.
TABLE OF CONTENTS
Glossary of Housing Types
Atlantic Provinces 4
Québec 11
Ontario 18
Prairie Provinces 32
Alberta 39
British Columbia 46
THE ROYAL LEPAGE HOUSE PRICE SURVEY EXPLAINED
Fair Market Value Housing values in the Royal LePage Survey are Royal LePage opinions of fair market value in each location, based on local data and market knowledge provided by Royal LePage residential real estate experts.
Housing Types Seven categories of housing are surveyed, including four types of detached homes, townhouses and condominium high-rise apartments. Each housing type and its amenities are specifically described, permitting comparison of value across Canada. This includes many regional variances, for which adjustments in value estimates have been applied.
Property Location Location has a major influence on real estate values. The properties in the Survey are considered to be within average commuting distance to the city centre and are typical of other housing in the neighbourhood.
Mortgage Financing For the purposes of this study, mortgage financing has not been taken into account in arriving at published prices and all properties have been considered as being free and clear of debt. However, the type of mortgage debt financing on a property can affect its market value either up or down depending on the amount, term, rates of interest, method of repayment and other factors.
Limitation All material contained herein is for general information purposes only. Royal LePage cannot and does not assume any liability or responsibility for any actions or decisions undertaken by any person as a result of reliance on information, estimates, or opinions contained or expressed herein.
Contact Us Royal LePage Real Estate Services 39 Wynford Drive, Don Mills, Ontario M3C 3K5 Fax: (416) 510-5856 Email: [email protected] Internet: www.royallepage.ca
The more people know about real estate, the more likely they are to choose Royal LePage
when the time comes to buy or sell.
ROYAL LEPAGE HOUSE PRICE SURVEY THIRD QUARTER 2011
6 & 7
2
5
4
3
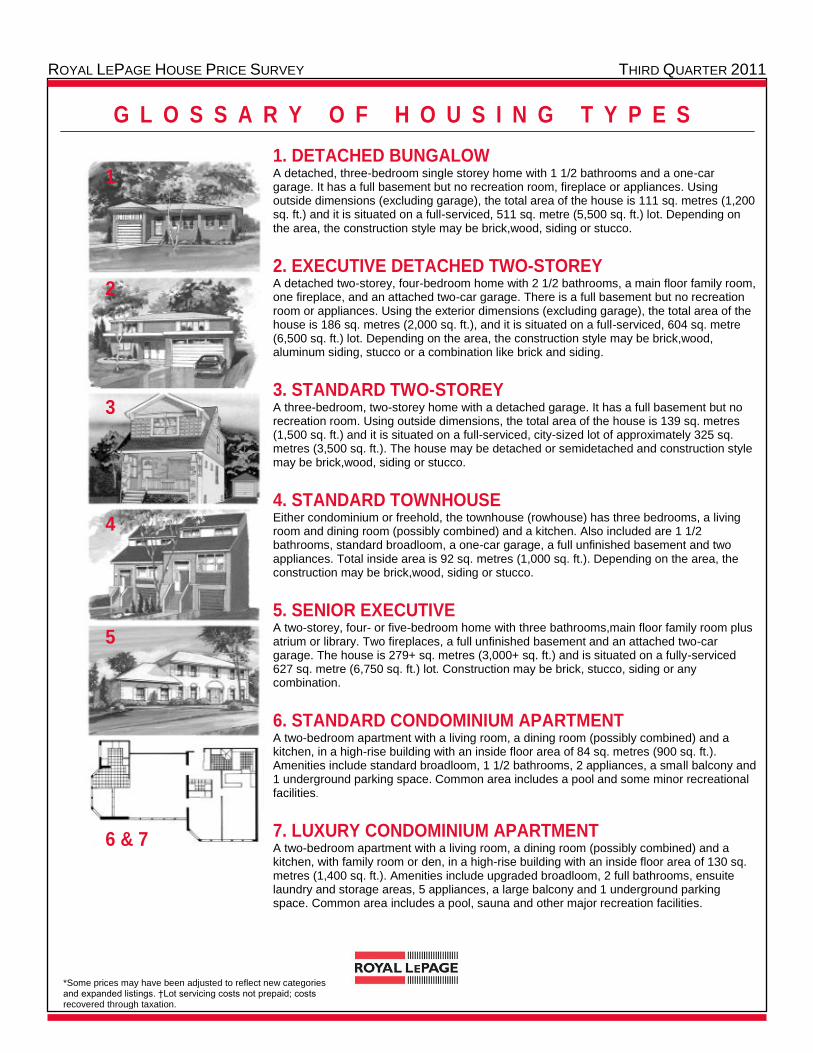
1 1. DETACHED BUNGALOW A detached, three-bedroom single storey home with 1 1/2 bathrooms and a one-car garage. It has a full basement but no recreation room, fireplace or appliances. Using outside dimensions (excluding garage), the total area of the house is 111 sq. metres (1,200 sq. ft.) and it is situated on a full-serviced, 511 sq. metre (5,500 sq. ft.) lot. Depending on the area, the construction style may be brick,wood, siding or stucco.
2. EXECUTIVE DETACHED TWO-STOREY A detached two-storey, four-bedroom home with 2 1/2 bathrooms, a main floor family room, one fireplace, and an attached two-car garage. There is a full basement but no recreation room or appliances. Using the exterior dimensions (excluding garage), the total area of the house is 186 sq. metres (2,000 sq. ft.), and it is situated on a full-serviced, 604 sq. metre (6,500 sq. ft.) lot. Depending on the area, the construction style may be brick,wood, aluminum siding, stucco or a combination like brick and siding.
3. STANDARD TWO-STOREY A three-bedroom, two-storey home with a detached garage. It has a full basement but no recreation room. Using outside dimensions, the total area of the house is 139 sq. metres (1,500 sq. ft.) and it is situated on a full-serviced, city-sized lot of approximately 325 sq. metres (3,500 sq. ft.). The house may be detached or semidetached and construction style may be brick,wood, siding or stucco.
4. STANDARD TOWNHOUSE Either condominium or freehold, the townhouse (rowhouse) has three bedrooms, a living room and dining room (possibly combined) and a kitchen. Also included are 1 1/2 bathrooms, standard broadloom, a one-car garage, a full unfinished basement and two appliances. Total inside area is 92 sq. metres (1,000 sq. ft.). Depending on the area, the construction may be brick,wood, siding or stucco.
5. SENIOR EXECUTIVE A two-storey, four- or five-bedroom home with three bathrooms,main floor family room plus atrium or library. Two fireplaces, a full unfinished basement and an attached two-car garage. The house is 279+ sq. metres (3,000+ sq. ft.) and is situated on a fully-serviced 627 sq. metre (6,750 sq. ft.) lot. Construction may be brick, stucco, siding or any combination.
6. STANDARD CONDOMINIUM APARTMENT A two-bedroom apartment with a living room, a dining room (possibly combined) and a kitchen, in a high-rise building with an inside floor area of 84 sq. metres (900 sq. ft.). Amenities include standard broadloom, 1 1/2 bathrooms, 2 appliances, a small balcony and 1 underground parking space. Common area includes a pool and some minor recreational facilities.
7. LUXURY CONDOMINIUM APARTMENT A two-bedroom apartment with a living room, a dining room (possibly combined) and a kitchen, with family room or den, in a high-rise building with an inside floor area of 130 sq. metres (1,400 sq. ft.). Amenities include upgraded broadloom, 2 full bathrooms, ensuite laundry and storage areas, 5 appliances, a large balcony and 1 underground parking space. Common area includes a pool, sauna and other major recreation facilities.
G L O S S A R Y O F H O U S I N G T Y P E S
*Some prices may have been adjusted to reflect new categories and expanded listings. †Lot servicing costs not prepaid; costs recovered through taxation.
ROYAL LEPAGE HOUSE PRICE SURVEY THIRD QUARTER 2011
- 4 -
A T L A N T I C P R O V I N C E S
*Some prices may have been adjusted to reflect new categories and expanded listings. †Lot servicing costs not prepaid; costs recovered through taxation.
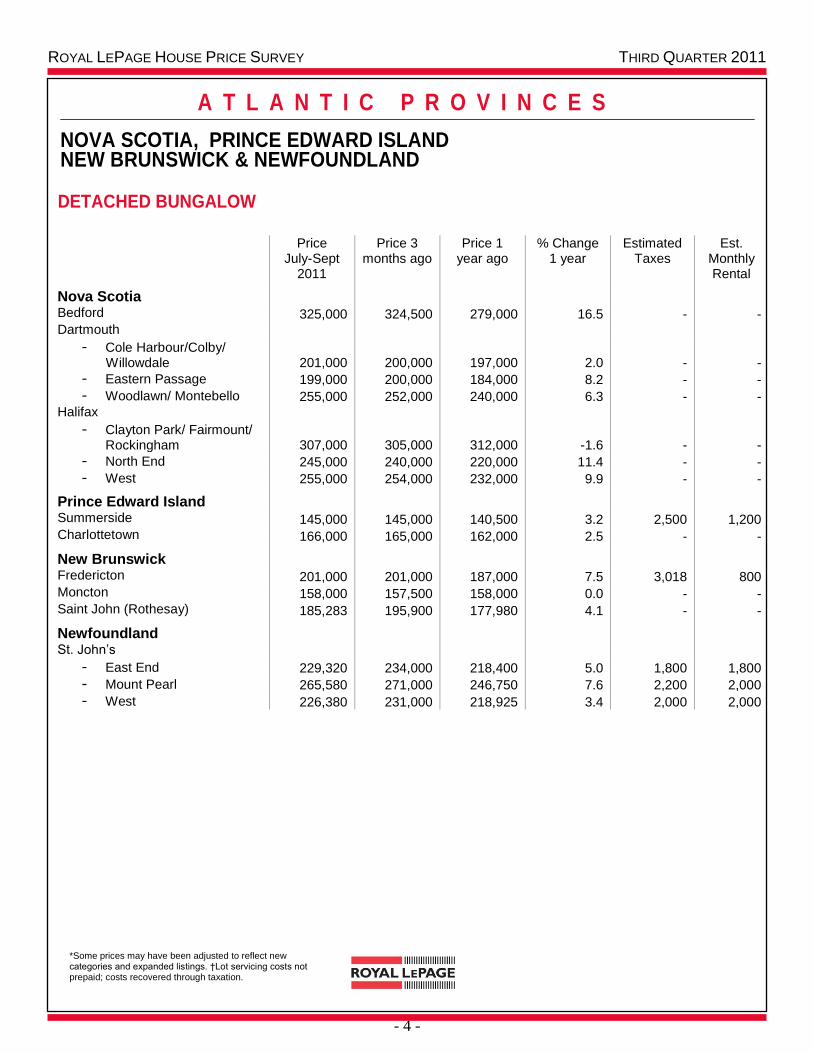
NOVA SCOTIA, PRINCE EDWARD ISLAND NEW BRUNSWICK & NEWFOUNDLAND
DETACHED BUNGALOW
Price
July-Sept 2011
Price 3 months ago
Price 1 year ago
% Change 1 year
Estimated Taxes
Est. Monthly Rental
Nova Scotia
Bedford 325,000 324,500 279,000 16.5 - - Dartmouth
- Cole Harbour/Colby/ Willowdale 201,000 200,000 197,000 2.0 - -
- Eastern Passage 199,000 200,000 184,000 8.2 - -
- Woodlawn/ Montebello 255,000 252,000 240,000 6.3 - - Halifax
- Clayton Park/ Fairmount/ Rockingham 307,000 305,000 312,000 -1.6 - -
- North End 245,000 240,000 220,000 11.4 - -
- West 255,000 254,000 232,000 9.9 - -
Prince Edward Island
Summerside 145,000 145,000 140,500 3.2 2,500 1,200 Charlottetown 166,000 165,000 162,000 2.5 - -
New Brunswick
Fredericton 201,000 201,000 187,000 7.5 3,018 800 Moncton 158,000 157,500 158,000 0.0 - - Saint John (Rothesay) 185,283 195,900 177,980 4.1 - -
Newfoundland
St. John’s
- East End 229,320 234,000 218,400 5.0 1,800 1,800
- Mount Pearl 265,580 271,000 246,750 7.6 2,200 2,000
- West 226,380 231,000 218,925 3.4 2,000 2,000
ROYAL LEPAGE HOUSE PRICE SURVEY THIRD QUARTER 2011
- 5 -
A T L A N T I C P R O V I N C E S
*Some prices may have been adjusted to reflect new categories and expanded listings. †Lot servicing costs not prepaid; costs recovered through taxation.
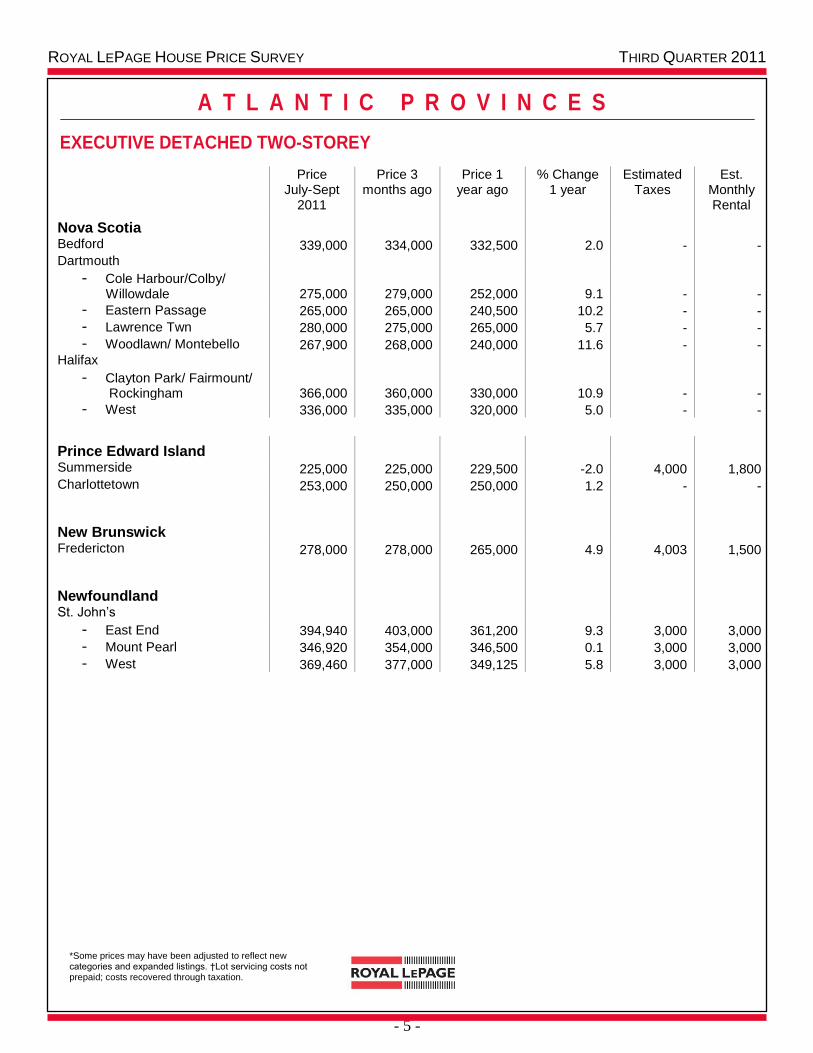
EXECUTIVE DETACHED TWO-STOREY
Price July-Sept
2011
Price 3 months ago
Price 1 year ago
% Change 1 year
Estimated Taxes
Est. Monthly Rental
Nova Scotia
Bedford 339,000 334,000 332,500 2.0 - - Dartmouth
- Cole Harbour/Colby/ Willowdale 275,000 279,000 252,000 9.1 - -
- Eastern Passage 265,000 265,000 240,500 10.2 - -
- Lawrence Twn 280,000 275,000 265,000 5.7 - -
- Woodlawn/ Montebello 267,900 268,000 240,000 11.6 - - Halifax
- Clayton Park/ Fairmount/ Rockingham 366,000 360,000 330,000 10.9 - -
- West 336,000 335,000 320,000 5.0 - -
Prince Edward Island
Summerside 225,000 225,000 229,500 -2.0 4,000 1,800 Charlottetown 253,000 250,000 250,000 1.2 - -
New Brunswick
Fredericton 278,000 278,000 265,000 4.9 4,003 1,500
Newfoundland
St. John’s
- East End 394,940 403,000 361,200 9.3 3,000 3,000
- Mount Pearl 346,920 354,000 346,500 0.1 3,000 3,000
- West 369,460 377,000 349,125 5.8 3,000 3,000
ROYAL LEPAGE HOUSE PRICE SURVEY THIRD QUARTER 2011
- 6 -
A T L A N T I C P R O V I N C E S
*Some prices may have been adjusted to reflect new categories and expanded listings. †Lot servicing costs not prepaid; costs recovered through taxation.
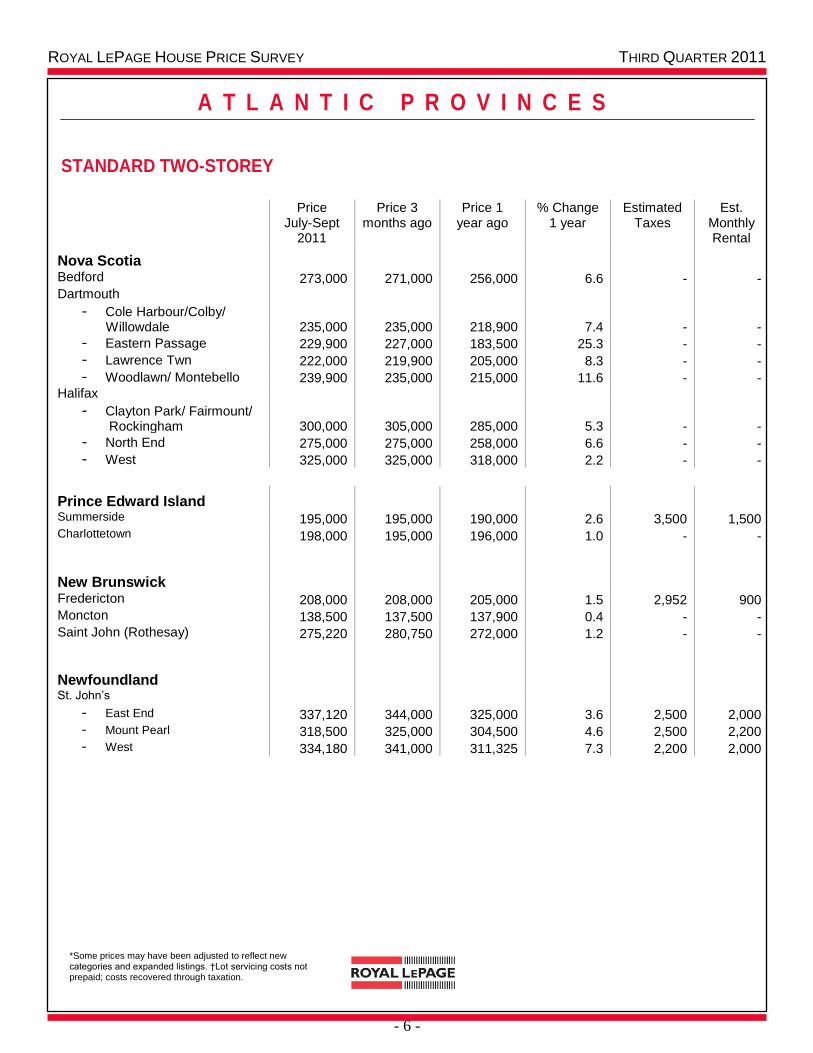
STANDARD TWO-STOREY
Price July-Sept
2011
Price 3 months ago
Price 1 year ago
% Change 1 year
Estimated Taxes
Est. Monthly Rental
Nova Scotia
Bedford 273,000 271,000 256,000 6.6 - - Dartmouth
- Cole Harbour/Colby/ Willowdale 235,000 235,000 218,900 7.4 - -
- Eastern Passage 229,900 227,000 183,500 25.3 - -
- Lawrence Twn 222,000 219,900 205,000 8.3 - -
- Woodlawn/ Montebello 239,900 235,000 215,000 11.6 - - Halifax
- Clayton Park/ Fairmount/ Rockingham 300,000 305,000 285,000 5.3 - -
- North End 275,000 275,000 258,000 6.6 - -
- West 325,000 325,000 318,000 2.2 - -
Prince Edward Island
Summerside 195,000 195,000 190,000 2.6 3,500 1,500 Charlottetown 198,000 195,000 196,000 1.0 - -
New Brunswick
Fredericton 208,000 208,000 205,000 1.5 2,952 900 Moncton 138,500 137,500 137,900 0.4 - - Saint John (Rothesay) 275,220 280,750 272,000 1.2 - -
Newfoundland
St. John’s
- East End 337,120 344,000 325,000 3.6 2,500 2,000 - Mount Pearl 318,500 325,000 304,500 4.6 2,500 2,200 - West 334,180 341,000 311,325 7.3 2,200 2,000
ROYAL LEPAGE HOUSE PRICE SURVEY THIRD QUARTER 2011
- 7 -
A T L A N T I C P R O V I N C E S
*Some prices may have been adjusted to reflect new categories and expanded listings. †Lot servicing costs not prepaid; costs recovered through taxation.
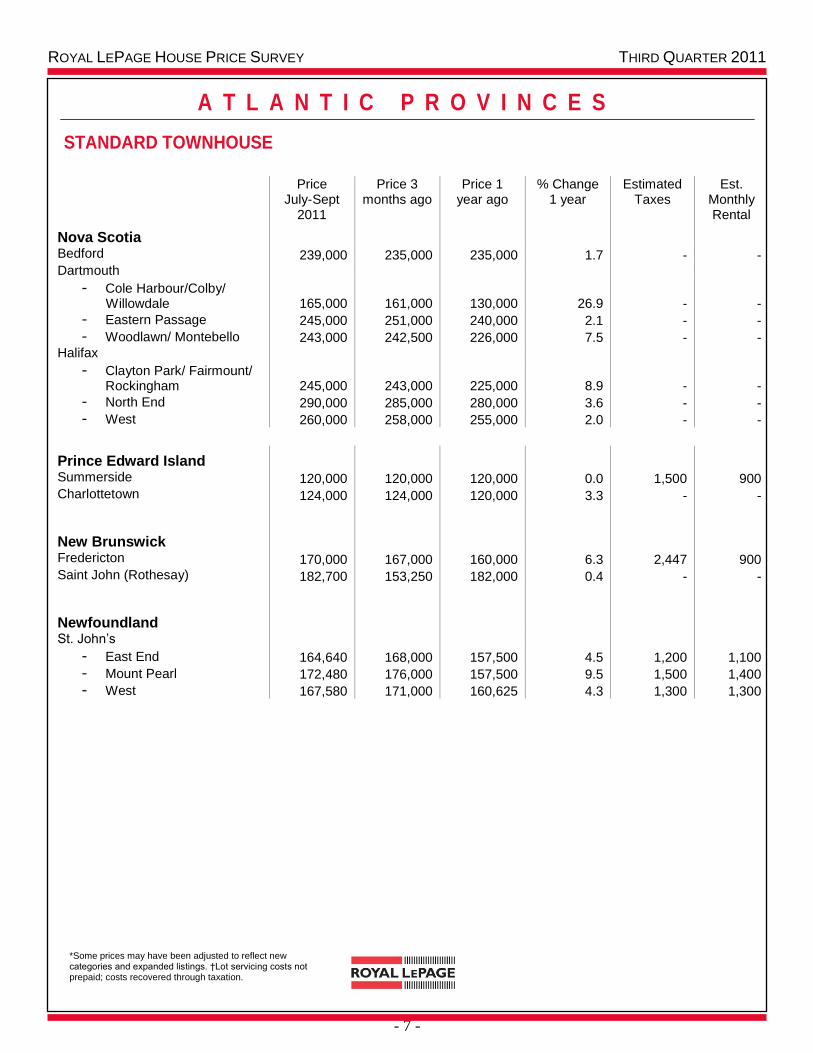
STANDARD TOWNHOUSE
Price
July-Sept 2011
Price 3 months ago
Price 1 year ago
% Change 1 year
Estimated Taxes
Est. Monthly Rental
Nova Scotia
Bedford 239,000 235,000 235,000 1.7 - - Dartmouth
- Cole Harbour/Colby/ Willowdale 165,000 161,000 130,000 26.9 - -
- Eastern Passage 245,000 251,000 240,000 2.1 - -
- Woodlawn/ Montebello 243,000 242,500 226,000 7.5 - - Halifax
- Clayton Park/ Fairmount/ Rockingham 245,000 243,000 225,000 8.9 - -
- North End 290,000 285,000 280,000 3.6 - -
- West 260,000 258,000 255,000 2.0 - -
Prince Edward Island
Summerside 120,000 120,000 120,000 0.0 1,500 900 Charlottetown 124,000 124,000 120,000 3.3 - -
New Brunswick
Fredericton 170,000 167,000 160,000 6.3 2,447 900 Saint John (Rothesay) 182,700 153,250 182,000 0.4 - -
Newfoundland
St. John’s
- East End 164,640 168,000 157,500 4.5 1,200 1,100
- Mount Pearl 172,480 176,000 157,500 9.5 1,500 1,400
- West 167,580 171,000 160,625 4.3 1,300 1,300
ROYAL LEPAGE HOUSE PRICE SURVEY THIRD QUARTER 2011
- 8 -
A T L A N T I C P R O V I N C E S
*Some prices may have been adjusted to reflect new categories and expanded listings. †Lot servicing costs not prepaid; costs recovered through taxation.
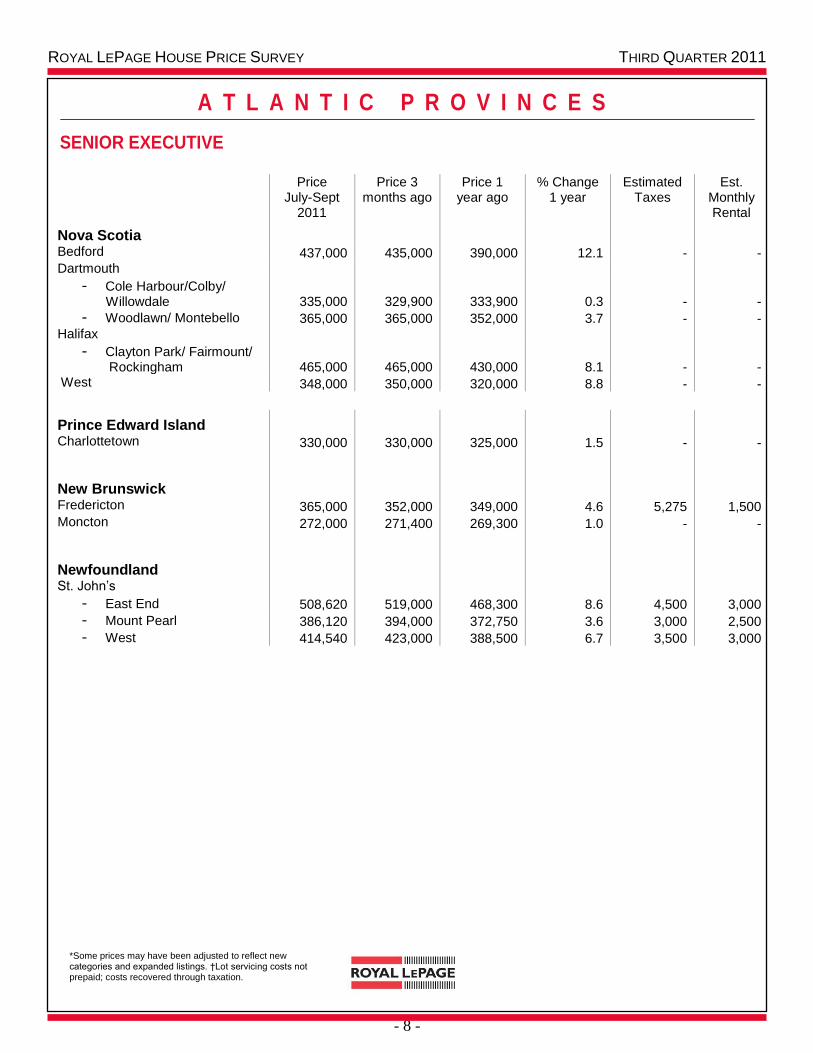
SENIOR EXECUTIVE
Price July-Sept
2011
Price 3 months ago
Price 1 year ago
% Change 1 year
Estimated Taxes
Est. Monthly Rental
Nova Scotia
Bedford 437,000 435,000 390,000 12.1 - - Dartmouth
- Cole Harbour/Colby/ Willowdale 335,000 329,900 333,900 0.3 - -
- Woodlawn/ Montebello 365,000 365,000 352,000 3.7 - - Halifax
- Clayton Park/ Fairmount/ Rockingham 465,000 465,000 430,000 8.1 - - West 348,000 350,000 320,000 8.8 - -
Prince Edward Island
Charlottetown 330,000 330,000 325,000 1.5 - -
New Brunswick
Fredericton 365,000 352,000 349,000 4.6 5,275 1,500 Moncton 272,000 271,400 269,300 1.0 - -
Newfoundland
St. John’s
- East End 508,620 519,000 468,300 8.6 4,500 3,000
- Mount Pearl 386,120 394,000 372,750 3.6 3,000 2,500
- West 414,540 423,000 388,500 6.7 3,500 3,000
ROYAL LEPAGE HOUSE PRICE SURVEY THIRD QUARTER 2011
- 9 -
A T L A N T I C P R O V I N C E S
*Some prices may have been adjusted to reflect new categories and expanded listings. †Lot servicing costs not prepaid; costs recovered through taxation.
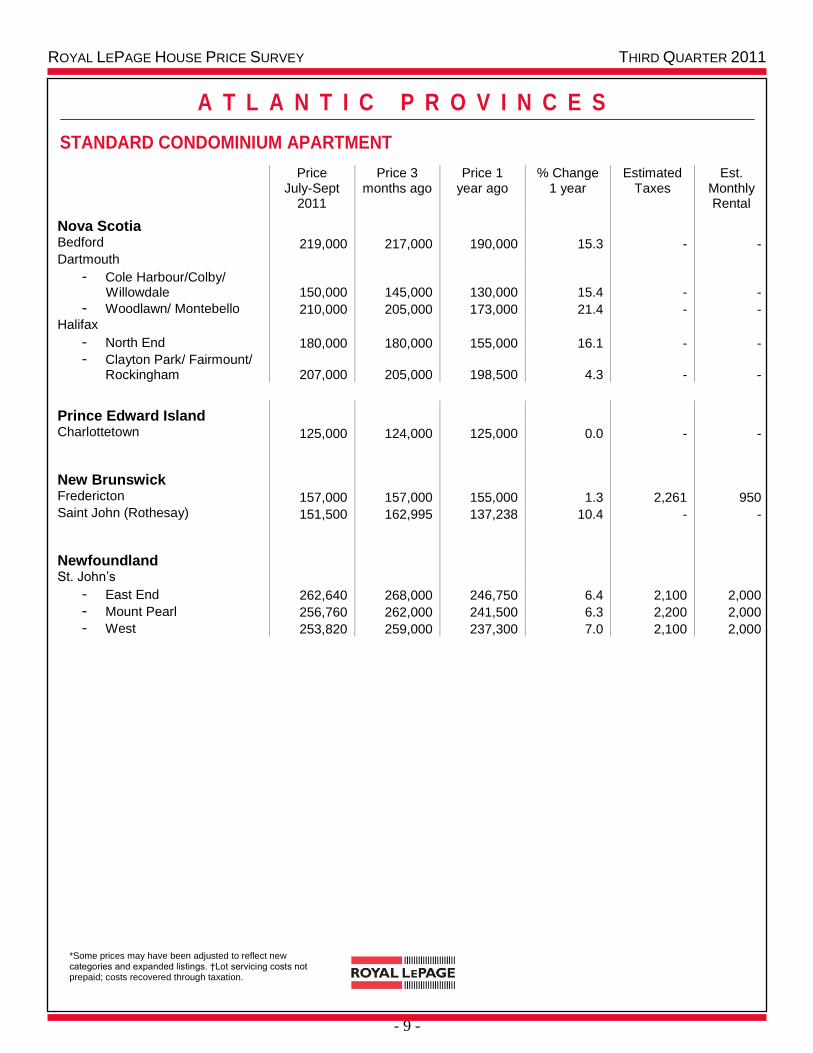
STANDARD CONDOMINIUM APARTMENT
Price July-Sept
2011
Price 3 months ago
Price 1 year ago
% Change 1 year
Estimated Taxes
Est. Monthly Rental
Nova Scotia Bedford 219,000 217,000 190,000 15.3 - - Dartmouth
- Cole Harbour/Colby/ Willowdale 150,000 145,000 130,000 15.4 - -
- Woodlawn/ Montebello 210,000 205,000 173,000 21.4 - - Halifax
- North End 180,000 180,000 155,000 16.1 - -
- Clayton Park/ Fairmount/ Rockingham 207,000 205,000 198,500 4.3 - -
Prince Edward Island
Charlottetown 125,000 124,000 125,000 0.0 - -
New Brunswick
Fredericton 157,000 157,000 155,000 1.3 2,261 950 Saint John (Rothesay) 151,500 162,995 137,238 10.4 - -
Newfoundland
St. John’s
- East End 262,640 268,000 246,750 6.4 2,100 2,000
- Mount Pearl 256,760 262,000 241,500 6.3 2,200 2,000
- West 253,820 259,000 237,300 7.0 2,100 2,000
ROYAL LEPAGE HOUSE PRICE SURVEY THIRD QUARTER 2011
- 10 -
A T L A N T I C P R O V I N C E S
*Some prices may have been adjusted to reflect new categories and expanded listings. †Lot servicing costs not prepaid; costs recovered through taxation.
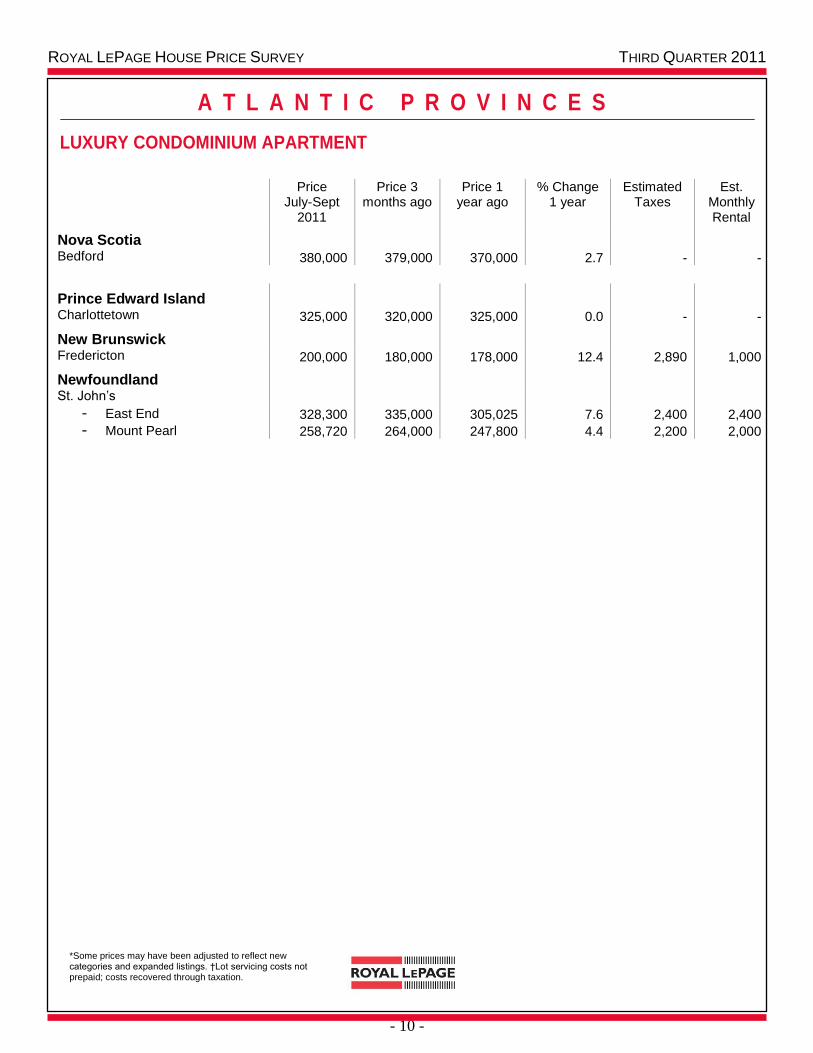
LUXURY CONDOMINIUM APARTMENT
Price
July-Sept 2011
Price 3 months ago
Price 1 year ago
% Change 1 year
Estimated Taxes
Est. Monthly Rental
Nova Scotia
Bedford 380,000 379,000 370,000 2.7 - -
Prince Edward Island
Charlottetown 325,000 320,000 325,000 0.0 - -
New Brunswick
Fredericton 200,000 180,000 178,000 12.4 2,890 1,000
Newfoundland
St. John’s
- East End 328,300 335,000 305,025 7.6 2,400 2,400
- Mount Pearl 258,720 264,000 247,800 4.4 2,200 2,000
ROYAL LEPAGE HOUSE PRICE SURVEY THIRD QUARTER 2011
- 11 -
Q U É B E C
*Some prices may have been adjusted to reflect new categories and expanded listings. †Lot servicing costs not prepaid; costs recovered through taxation.
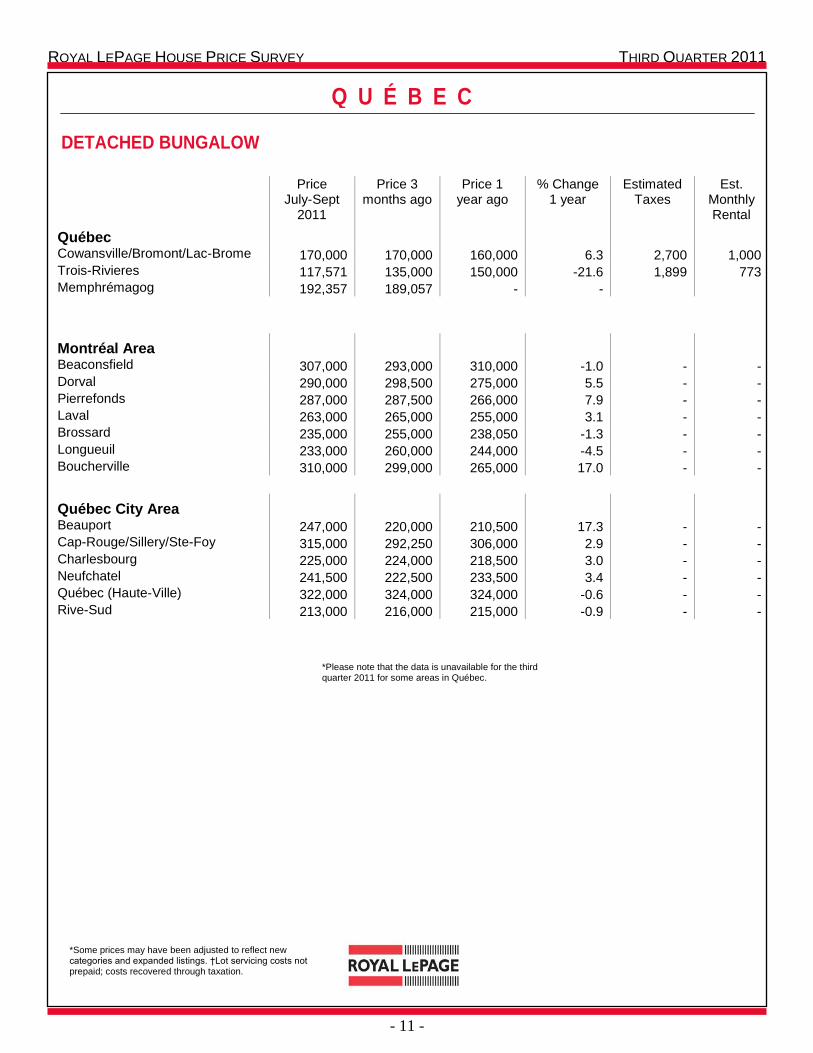
DETACHED BUNGALOW
Price
July-Sept 2011
Price 3 months ago
Price 1 year ago
% Change 1 year
Estimated Taxes
Est. Monthly Rental
Québec
Cowansville/Bromont/Lac-Brome 170,000 170,000 160,000 6.3 2,700 1,000 Trois-Rivieres 117,571 135,000 150,000 -21.6 1,899 773 Memphrémagog 192,357 189,057 - -
Montréal Area
Beaconsfield 307,000 293,000 310,000 -1.0 - - Dorval 290,000 298,500 275,000 5.5 - - Pierrefonds 287,000 287,500 266,000 7.9 - - Laval 263,000 265,000 255,000 3.1 - - Brossard 235,000 255,000 238,050 -1.3 - - Longueuil 233,000 260,000 244,000 -4.5 - - Boucherville 310,000 299,000 265,000 17.0 - -
Québec City Area
Beauport 247,000 220,000 210,500 17.3 - - Cap-Rouge/Sillery/Ste-Foy 315,000 292,250 306,000 2.9 - - Charlesbourg 225,000 224,000 218,500 3.0 - - Neufchatel 241,500 222,500 233,500 3.4 - - Québec (Haute-Ville) 322,000 324,000 324,000 -0.6 - - Rive-Sud 213,000 216,000 215,000 -0.9 - -
*Please note that the data is unavailable for the third quarter 2011 for some areas in Québec.
ROYAL LEPAGE HOUSE PRICE SURVEY THIRD QUARTER 2011
- 12 -
Q U É B E C
*Some prices may have been adjusted to reflect new categories and expanded listings. †Lot servicing costs not prepaid; costs recovered through taxation.
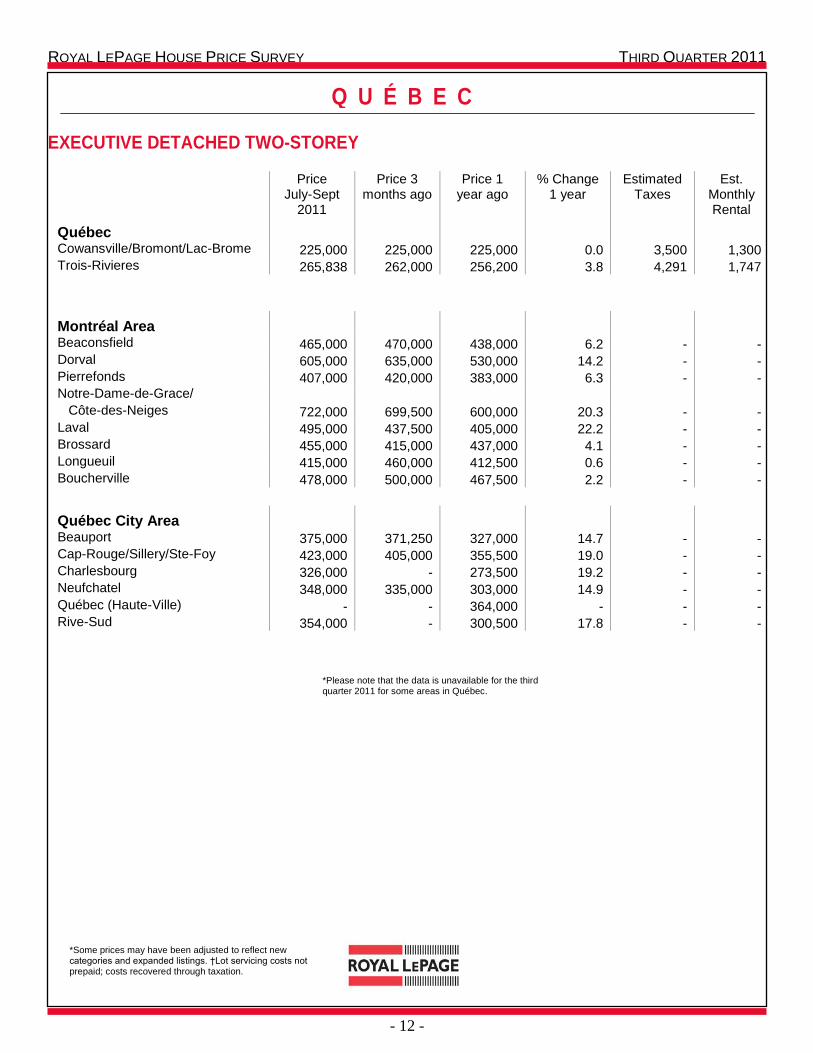
EXECUTIVE DETACHED TWO-STOREY
Price July-Sept
2011
Price 3 months ago
Price 1 year ago
% Change 1 year
Estimated Taxes
Est. Monthly Rental
Québec
Cowansville/Bromont/Lac-Brome 225,000 225,000 225,000 0.0 3,500 1,300 Trois-Rivieres 265,838 262,000 256,200 3.8 4,291 1,747
Montréal Area
Beaconsfield 465,000 470,000 438,000 6.2 - - Dorval 605,000 635,000 530,000 14.2 - - Pierrefonds 407,000 420,000 383,000 6.3 - - Notre-Dame-de-Grace/ Côte-des-Neiges 722,000 699,500 600,000 20.3 - - Laval 495,000 437,500 405,000 22.2 - - Brossard 455,000 415,000 437,000 4.1 - - Longueuil 415,000 460,000 412,500 0.6 - - Boucherville 478,000 500,000 467,500 2.2 - -
Québec City Area
Beauport 375,000 371,250 327,000 14.7 - - Cap-Rouge/Sillery/Ste-Foy 423,000 405,000 355,500 19.0 - - Charlesbourg 326,000 - 273,500 19.2 - - Neufchatel 348,000 335,000 303,000 14.9 - - Québec (Haute-Ville) - - 364,000 - - - Rive-Sud 354,000 - 300,500 17.8 - -
*Please note that the data is unavailable for the third quarter 2011 for some areas in Québec.

ROYAL LEPAGE HOUSE PRICE SURVEY THIRD QUARTER 2011
- 13 -
Q U É B E C
*Some prices may have been adjusted to reflect new categories and expanded listings. †Lot servicing costs not prepaid; costs recovered through taxation.
STANDARD TWO-STOREY
Price July-Sept
2011
Price 3 months ago
Price 1 year ago
% Change 1 year
Estimated Taxes
Est. Monthly Rental
Québec
Cowansville/Bromont/Lac-Brome 200,000 195,000 190,000 5.3 3,000 1,100 Trois-Rivieres 186,722 165,000 158,000 18.2 2,793 1,227
Montréal Area
Dorval 268,000 294,500 278,000 -3.6 - - Pierrefonds 385,000 372,000 337,000 14.2 - - Notre-Dame-de-Grace/ Côte-des-Neiges 488,000 528,000 400,000 22.0 - - Laval 335,000 338,000 320,500 4.5 - - Brossard 369,000 395,000 376,500 -2.0 - - Longueuil 335,000 330,000 315,000 6.3 - - Boucherville 392,500 399,200 326,500 20.2 - -
Québec City Area
Beauport 261,000 - 220,500 18.4 - - Cap-Rouge/Sillery/Ste-Foy 327,000 - 300,600 8.8 - - Neufchatel 277,000 240,000 233,000 18.9 - - Charlesbourg - - - - Québec (Haute-Ville) 325,000 - 308,000 5.5 - - Rive-Sud 255,000 275,000 200,000 27.5 - -
*Please note that the data is unavailable for the third quarter 2011 for some areas in Québec.

ROYAL LEPAGE HOUSE PRICE SURVEY THIRD QUARTER 2011
- 14 -
Q U É B E C
*Some prices may have been adjusted to reflect new categories and expanded listings. †Lot servicing costs not prepaid; costs recovered through taxation.
STANDARD TOWNHOUSE
Price July-Sept
2011
Price 3 months ago
Price 1 year ago
% Change 1 year
Estimated Taxes
Est. Monthly Rental
Québec
Cowansville/Bromont/Lac-Brome 150,000 150,000 150,000 0 2,500 800 Trois-Rivieres 138,000 - - 1,978 621
Montréal Area
Pierrefonds 280,000 279,000 260,000 7.7 - - Notre-Dame-de-Grace/ Côte-des-Neiges 471,000 525,000 473,500 -0.5 - - Ville-Marie 460,000 524,000 473,000 -2.7 - - Rosemont/La Petit Patrie 342,000 359,000 375,000 -8.8 - - Laval 240,500 235,000 220,000 9.3 - - Brossard 265,000 230,000 225,000 17.8 - - Longueuil 223,500 229,500 210,000 6.4 - - Boucherville 263,000 247,500 243,200 8.1 - -
Québec City Area
Beauport 202,500 194,150 176,500 14.7 - - Cap-Rouge/Sillery/Ste-Foy 240,000 253,500 237,000 1.3 - - Charlesbourg 196,000 195,000 201,500 -2.7 - - Neufchatel 199,000 206,000 186,000 7.0 - - Québec (Haute-Ville) 295,000 - 285,000 3.5 - - Rive-Sud 215,000 205,000 242,500 -11.3 - -
*Please note that the data is unavailable for the third quarter 2011 for some areas in Québec.
ROYAL LEPAGE HOUSE PRICE SURVEY THIRD QUARTER 2011
- 15 -
Q U É B E C
*Some prices may have been adjusted to reflect new categories and expanded listings. †Lot servicing costs not prepaid; costs recovered through taxation.
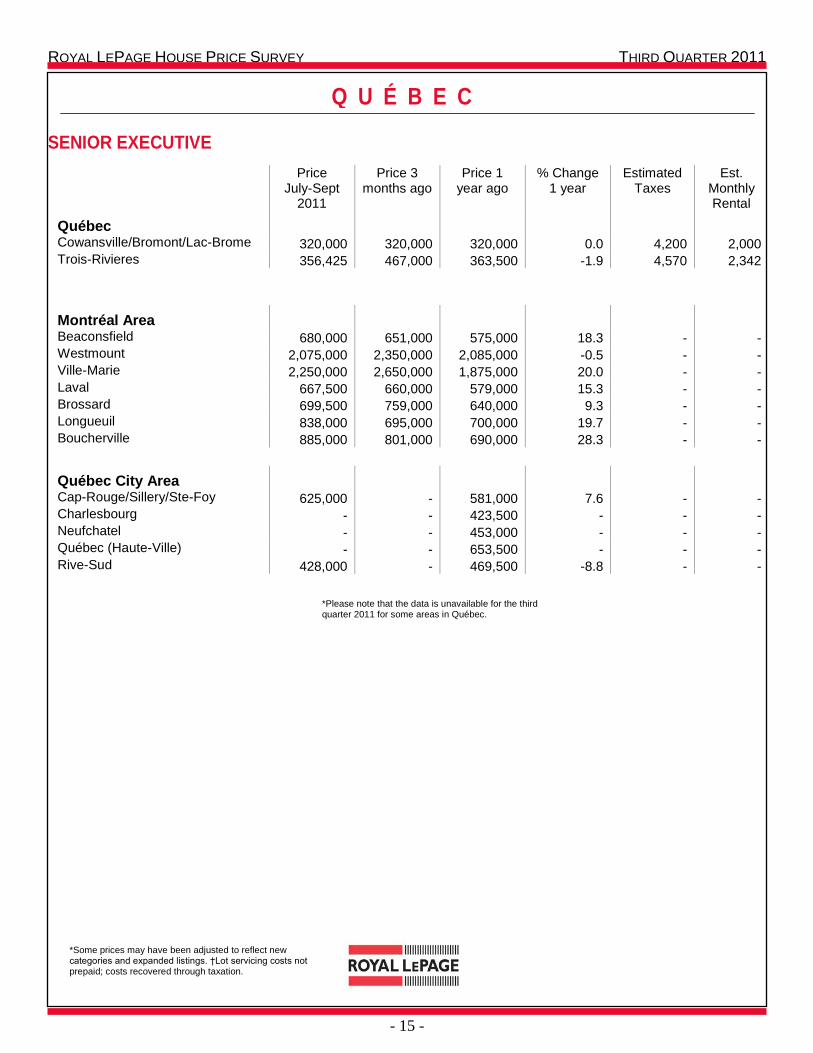
SENIOR EXECUTIVE
Price July-Sept
2011
Price 3 months ago
Price 1 year ago
% Change 1 year
Estimated Taxes
Est. Monthly Rental
Québec
Cowansville/Bromont/Lac-Brome 320,000 320,000 320,000 0.0 4,200 2,000 Trois-Rivieres 356,425 467,000 363,500 -1.9 4,570 2,342
Montréal Area
Beaconsfield 680,000 651,000 575,000 18.3 - - Westmount 2,075,000 2,350,000 2,085,000 -0.5 - - Ville-Marie 2,250,000 2,650,000 1,875,000 20.0 - - Laval 667,500 660,000 579,000 15.3 - - Brossard 699,500 759,000 640,000 9.3 - - Longueuil 838,000 695,000 700,000 19.7 - - Boucherville 885,000 801,000 690,000 28.3 - -
Québec City Area
Cap-Rouge/Sillery/Ste-Foy 625,000 - 581,000 7.6 - - Charlesbourg - - 423,500 - - - Neufchatel - - 453,000 - - - Québec (Haute-Ville) - - 653,500 - - - Rive-Sud 428,000 - 469,500 -8.8 - -
*Please note that the data is unavailable for the third quarter 2011 for some areas in Québec.
ROYAL LEPAGE HOUSE PRICE SURVEY THIRD QUARTER 2011
- 16 -
Q U É B E C
*Some prices may have been adjusted to reflect new categories and expanded listings. †Lot servicing costs not prepaid; costs recovered through taxation.
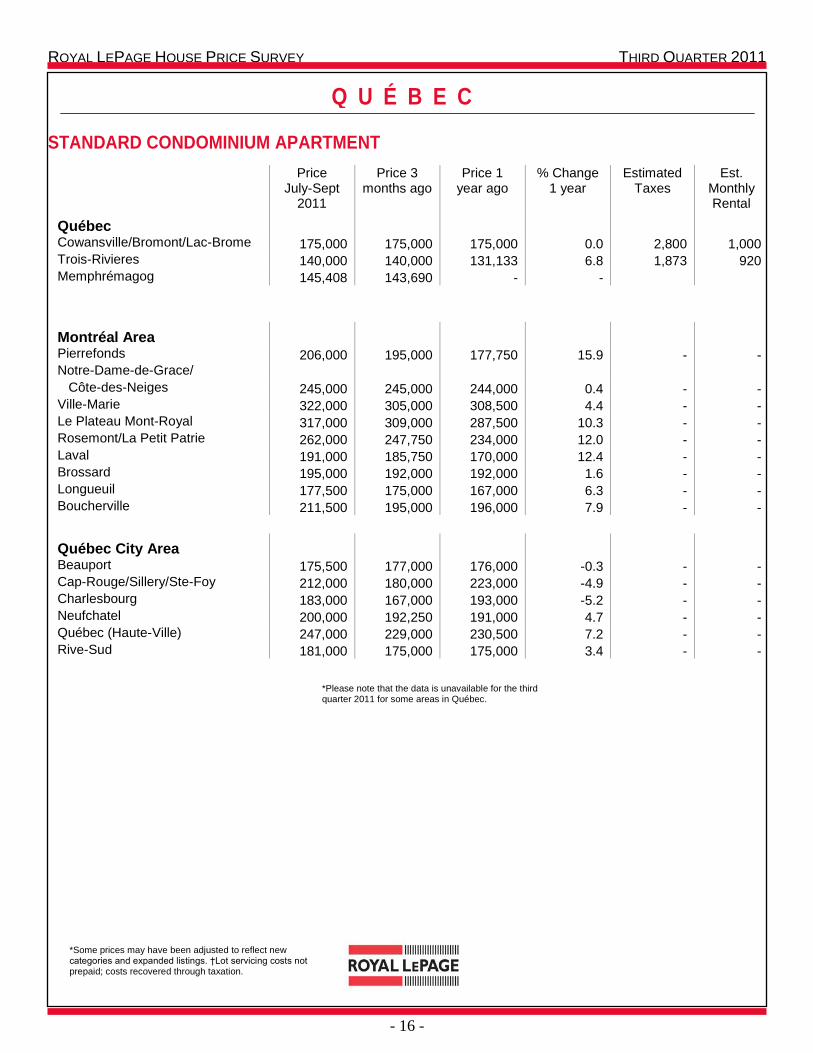
STANDARD CONDOMINIUM APARTMENT
Price July-Sept
2011
Price 3 months ago
Price 1 year ago
% Change 1 year
Estimated Taxes
Est. Monthly Rental
Québec
Cowansville/Bromont/Lac-Brome 175,000 175,000 175,000 0.0 2,800 1,000 Trois-Rivieres 140,000 140,000 131,133 6.8 1,873 920 Memphrémagog 145,408 143,690 - -
Montréal Area
Pierrefonds 206,000 195,000 177,750 15.9 - - Notre-Dame-de-Grace/ Côte-des-Neiges 245,000 245,000 244,000 0.4 - - Ville-Marie 322,000 305,000 308,500 4.4 - - Le Plateau Mont-Royal 317,000 309,000 287,500 10.3 - - Rosemont/La Petit Patrie 262,000 247,750 234,000 12.0 - - Laval 191,000 185,750 170,000 12.4 - - Brossard 195,000 192,000 192,000 1.6 - - Longueuil 177,500 175,000 167,000 6.3 - - Boucherville 211,500 195,000 196,000 7.9 - -
Québec City Area
Beauport 175,500 177,000 176,000 -0.3 - - Cap-Rouge/Sillery/Ste-Foy 212,000 180,000 223,000 -4.9 - - Charlesbourg 183,000 167,000 193,000 -5.2 - - Neufchatel 200,000 192,250 191,000 4.7 - - Québec (Haute-Ville) 247,000 229,000 230,500 7.2 - - Rive-Sud 181,000 175,000 175,000 3.4 - -
*Please note that the data is unavailable for the third quarter 2011 for some areas in Québec.
ROYAL LEPAGE HOUSE PRICE SURVEY THIRD QUARTER 2011
- 17 -
Q U É B E C
*Some prices may have been adjusted to reflect new categories and expanded listings. †Lot servicing costs not prepaid; costs recovered through taxation.
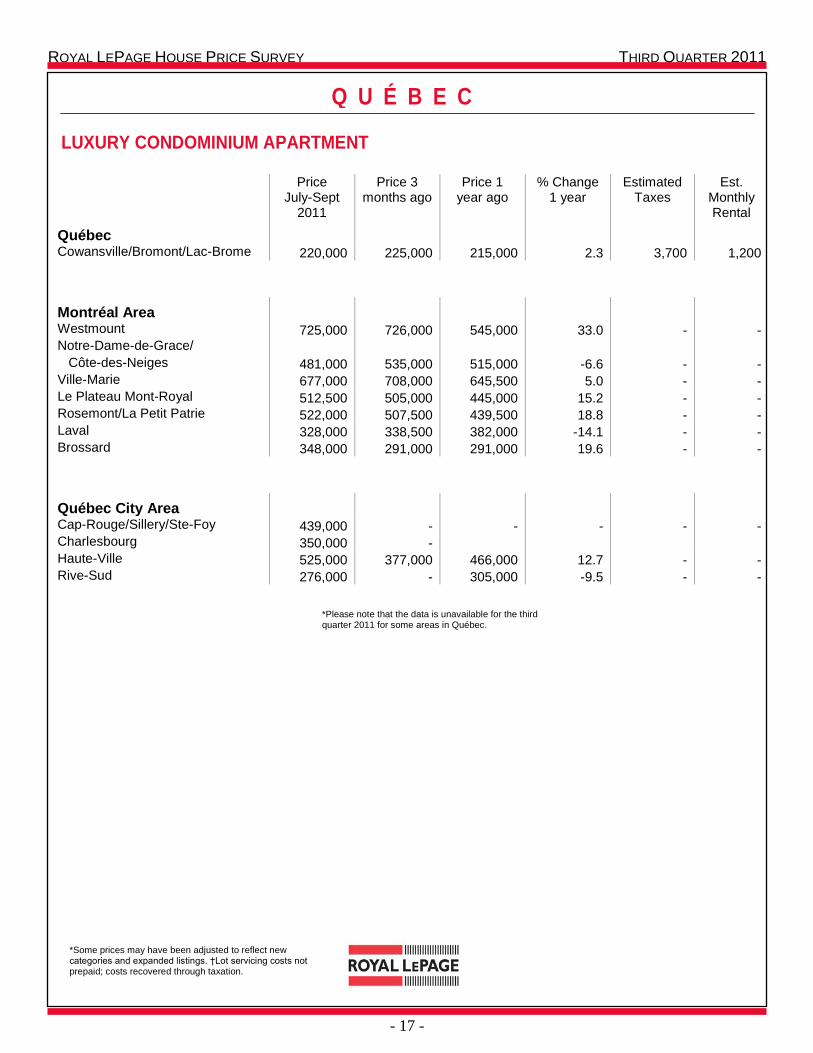
LUXURY CONDOMINIUM APARTMENT
Price July-Sept
2011
Price 3 months ago
Price 1 year ago
% Change 1 year
Estimated Taxes
Est. Monthly Rental
Québec
Cowansville/Bromont/Lac-Brome 220,000 225,000 215,000 2.3 3,700 1,200
Montréal Area
Westmount 725,000 726,000 545,000 33.0 - - Notre-Dame-de-Grace/ Côte-des-Neiges 481,000 535,000 515,000 -6.6 - - Ville-Marie 677,000 708,000 645,500 5.0 - - Le Plateau Mont-Royal 512,500 505,000 445,000 15.2 - - Rosemont/La Petit Patrie 522,000 507,500 439,500 18.8 - - Laval 328,000 338,500 382,000 -14.1 - - Brossard 348,000 291,000 291,000 19.6 - -
Québec City Area
Cap-Rouge/Sillery/Ste-Foy 439,000 - - - - - Charlesbourg 350,000 - Haute-Ville 525,000 377,000 466,000 12.7 - - Rive-Sud 276,000 - 305,000 -9.5 - -
*Please note that the data is unavailable for the third quarter 2011 for some areas in Québec.

ROYAL LEPAGE HOUSE PRICE SURVEY THIRD QUARTER 2011
- 18 -
O N T A R I O
*Some prices may have been adjusted to reflect new categories and expanded listings. †Lot servicing costs not prepaid; costs recovered through taxation.
DETACHED BUNGALOW
Price
July-Sept 2011
Price 3 months ago
Price 1 year ago
% Change 1 year
Estimated Taxes
Est. Monthly Rental
Toronto Area
Burlington 369,000 369,000 330,000 11.8 3,100 2,500 Etobicoke
Islington/ Kingsway 580,000 575,000 544,000 6.6 - - -South Etobicoke 418,000 410,000 398,000 5.0 - - High Park 750,000 730,000 740,000 1.4 - - Lawrence Park 820,000 821,000 745,000 10.1 - - Leaside 685,000 710,000 600,000 14.2 - - Markham 545,000 540,000 500,000 9.0 5,080 2,300 Mississauga GTA
- Meadowvale/ Streetsville 430,000 425,000 355,000 21.1 3,500 1,700 Newmarket 385,000 399,000 355,000 8.5 3,600 1,500 North Toronto 680,000 685,000 600,000 13.3 - - Oakville 389,000 374,000 378,000 2.9 - - Richmond Hill 435,000 415,000 365,000 19.2 - - Scarborough
Agincourt 422,000 410,000 400,000 5.5 2,700 1,450
Central 384,000 380,000 355,000 8.2 2,500 1,600
West Hill 431,500 415,000 400,000 7.9 2,600 1,500 Unionville 665,000 665,000 625,000 6.4 6,170 2,500 Woodbridge 428,000 427,000 427,000 0.2 - -
ROYAL LEPAGE HOUSE PRICE SURVEY THIRD QUARTER 2011
- 19 -
O N T A R I O
*Some prices may have been adjusted to reflect new categories and expanded listings. †Lot servicing costs not prepaid; costs recovered through taxation.
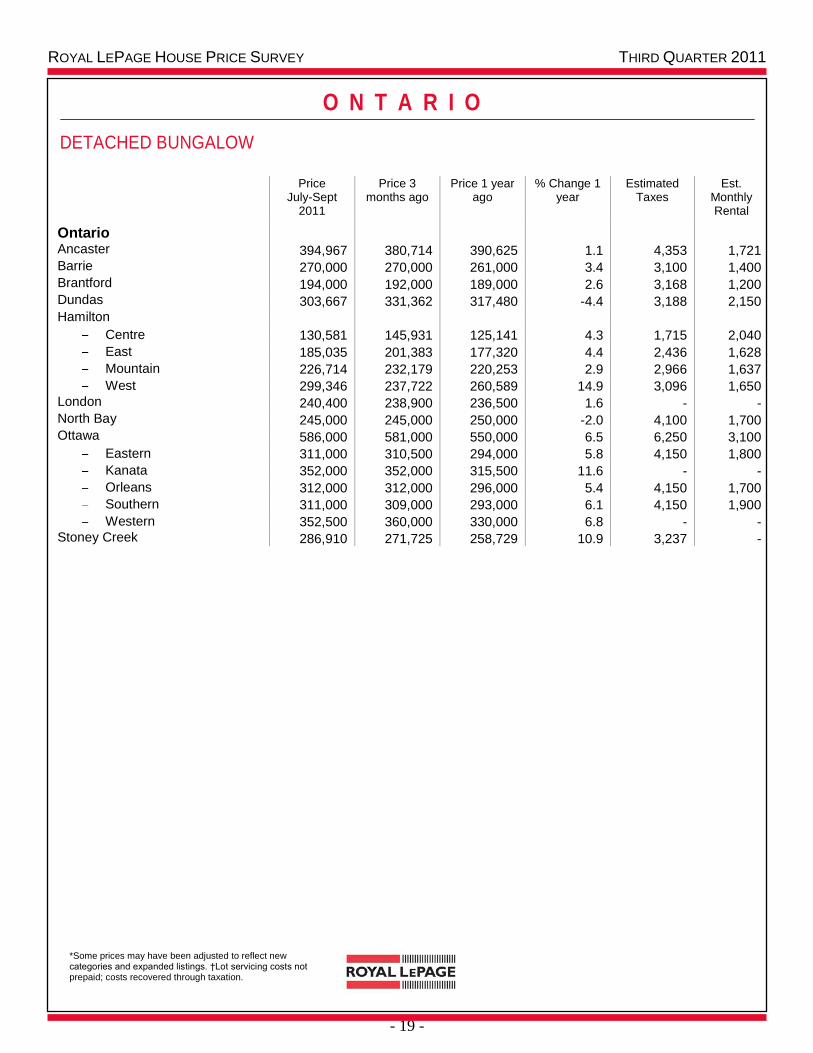
DETACHED BUNGALOW
Price
July-Sept 2011
Price 3 months ago
Price 1 year ago
% Change 1 year
Estimated Taxes
Est. Monthly Rental
Ontario
Ancaster 394,967 380,714 390,625 1.1 4,353 1,721 Barrie 270,000 270,000 261,000 3.4 3,100 1,400 Brantford 194,000 192,000 189,000 2.6 3,168 1,200 Dundas 303,667 331,362 317,480 -4.4 3,188 2,150 Hamilton
Centre 130,581 145,931 125,141 4.3 1,715 2,040
East 185,035 201,383 177,320 4.4 2,436 1,628
Mountain 226,714 232,179 220,253 2.9 2,966 1,637
West 299,346 237,722 260,589 14.9 3,096 1,650 London 240,400 238,900 236,500 1.6 - - North Bay 245,000 245,000 250,000 -2.0 4,100 1,700 Ottawa 586,000 581,000 550,000 6.5 6,250 3,100
Eastern 311,000 310,500 294,000 5.8 4,150 1,800
Kanata 352,000 352,000 315,500 11.6 - -
Orleans 312,000 312,000 296,000 5.4 4,150 1,700
Southern 311,000 309,000 293,000 6.1 4,150 1,900
Western 352,500 360,000 330,000 6.8 - - Stoney Creek 286,910 271,725 258,729 10.9 3,237 -
ROYAL LEPAGE HOUSE PRICE SURVEY THIRD QUARTER 2011
- 20 -
O N T A R I O
*Some prices may have been adjusted to reflect new categories and expanded listings. †Lot servicing costs not prepaid; costs recovered through taxation.
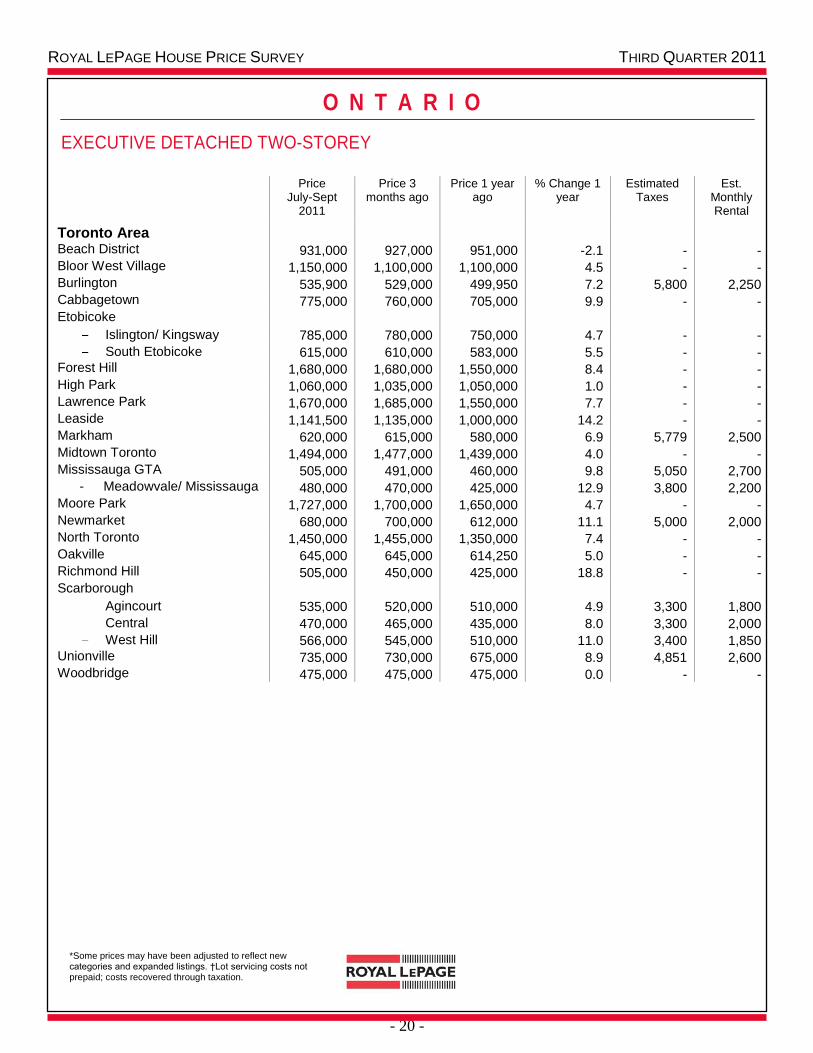
EXECUTIVE DETACHED TWO-STOREY
Price
July-Sept 2011
Price 3 months ago
Price 1 year ago
% Change 1 year
Estimated Taxes
Est. Monthly Rental
Toronto Area
Beach District 931,000 927,000 951,000 -2.1 - - Bloor West Village 1,150,000 1,100,000 1,100,000 4.5 - - Burlington 535,900 529,000 499,950 7.2 5,800 2,250 Cabbagetown 775,000 760,000 705,000 9.9 - - Etobicoke
Islington/ Kingsway 785,000 780,000 750,000 4.7 - -
South Etobicoke 615,000 610,000 583,000 5.5 - - Forest Hill 1,680,000 1,680,000 1,550,000 8.4 - - High Park 1,060,000 1,035,000 1,050,000 1.0 - - Lawrence Park 1,670,000 1,685,000 1,550,000 7.7 - - Leaside 1,141,500 1,135,000 1,000,000 14.2 - - Markham 620,000 615,000 580,000 6.9 5,779 2,500 Midtown Toronto 1,494,000 1,477,000 1,439,000 4.0 - - Mississauga GTA 505,000 491,000 460,000 9.8 5,050 2,700
- Meadowvale/ Mississauga 480,000 470,000 425,000 12.9 3,800 2,200 Moore Park 1,727,000 1,700,000 1,650,000 4.7 - - Newmarket 680,000 700,000 612,000 11.1 5,000 2,000 North Toronto 1,450,000 1,455,000 1,350,000 7.4 - - Oakville 645,000 645,000 614,250 5.0 - - Richmond Hill 505,000 450,000 425,000 18.8 - - Scarborough
Agincourt 535,000 520,000 510,000 4.9 3,300 1,800
Central 470,000 465,000 435,000 8.0 3,300 2,000
West Hill 566,000 545,000 510,000 11.0 3,400 1,850 Unionville 735,000 730,000 675,000 8.9 4,851 2,600 Woodbridge 475,000 475,000 475,000 0.0 - -

ROYAL LEPAGE HOUSE PRICE SURVEY THIRD QUARTER 2011
- 21 -
O N T A R I O
*Some prices may have been adjusted to reflect new categories and expanded listings. †Lot servicing costs not prepaid; costs recovered through taxation.
EXECUTIVE DETACHED TWO-STOREY
Price July-Sept
2011
Price 3 months ago
Price 1 year ago
% Change 1 year
Estimated Taxes
Est. Monthly Rental
Ontario
Barrie 320,000 340,000 308,000 3.9 3,500 1,500 Brantford 305,000 302,000 302,000 1.0 4,960 1,550 London 317,000 316,100 312,100 1.6 - - North Bay 300,000 300,000 305,000 -1.6 4,200 1,800 Ottawa 594,000 592,000 562,000 5.7 6,250 3,100
Eastern 369,000 367,000 348,000 6.0 4,275 1,850
Kanata 424,000 424,000 371,000 14.3 - -
Orleans 400,000 398,000 380,000 5.3 5,160 1,900
Southern 398,000 395,000 376,000 5.9 5,160 1,900
Western 445,000 455,000 415,000 7.2 - -
ROYAL LEPAGE HOUSE PRICE SURVEY THIRD QUARTER 2011
- 22 -
O N T A R I O
*Some prices may have been adjusted to reflect new categories and expanded listings. †Lot servicing costs not prepaid; costs recovered through taxation.
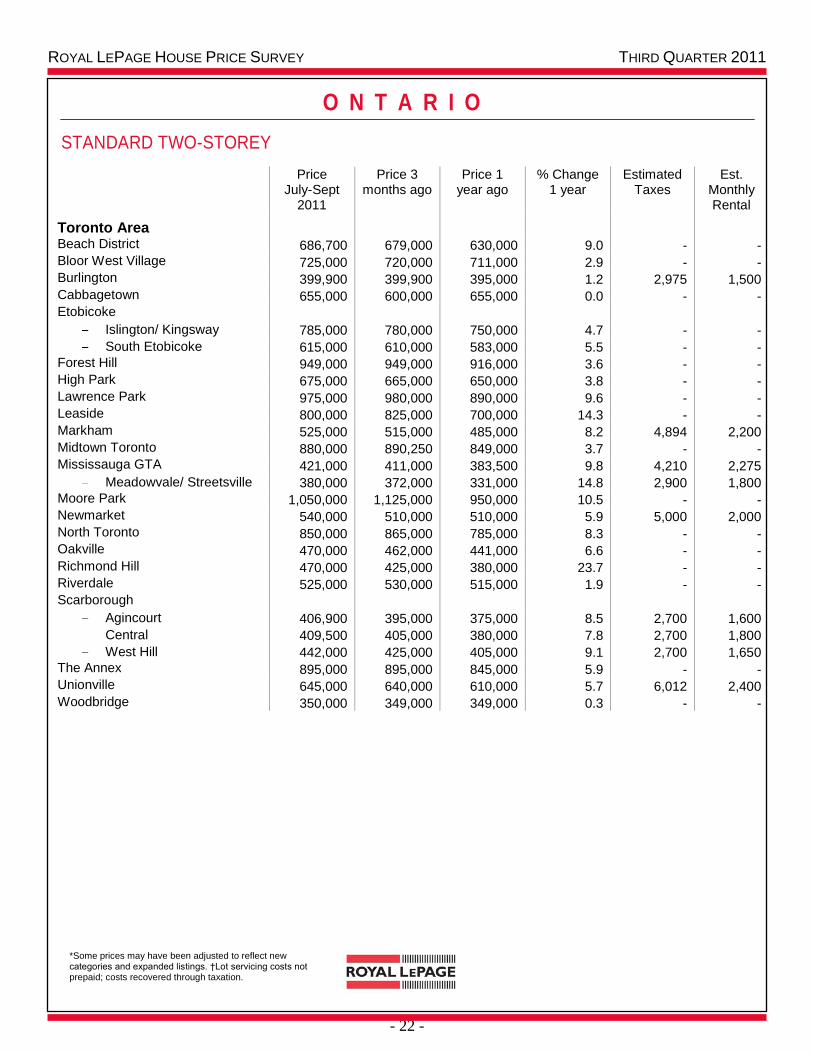
STANDARD TWO-STOREY
Price July-Sept
2011
Price 3 months ago
Price 1 year ago
% Change 1 year
Estimated Taxes
Est. Monthly Rental
Toronto Area
Beach District 686,700 679,000 630,000 9.0 - - Bloor West Village 725,000 720,000 711,000 2.9 - - Burlington 399,900 399,900 395,000 1.2 2,975 1,500 Cabbagetown 655,000 600,000 655,000 0.0 - - Etobicoke
Islington/ Kingsway 785,000 780,000 750,000 4.7 - -
South Etobicoke 615,000 610,000 583,000 5.5 - - Forest Hill 949,000 949,000 916,000 3.6 - - High Park 675,000 665,000 650,000 3.8 - - Lawrence Park 975,000 980,000 890,000 9.6 - - Leaside 800,000 825,000 700,000 14.3 - - Markham 525,000 515,000 485,000 8.2 4,894 2,200 Midtown Toronto 880,000 890,250 849,000 3.7 - - Mississauga GTA 421,000 411,000 383,500 9.8 4,210 2,275
Meadowvale/ Streetsville 380,000 372,000 331,000 14.8 2,900 1,800 Moore Park 1,050,000 1,125,000 950,000 10.5 - - Newmarket 540,000 510,000 510,000 5.9 5,000 2,000 North Toronto 850,000 865,000 785,000 8.3 - - Oakville 470,000 462,000 441,000 6.6 - - Richmond Hill 470,000 425,000 380,000 23.7 - - Riverdale 525,000 530,000 515,000 1.9 - - Scarborough
Agincourt 406,900 395,000 375,000 8.5 2,700 1,600
Central 409,500 405,000 380,000 7.8 2,700 1,800
West Hill 442,000 425,000 405,000 9.1 2,700 1,650 The Annex 895,000 895,000 845,000 5.9 - - Unionville 645,000 640,000 610,000 5.7 6,012 2,400 Woodbridge 350,000 349,000 349,000 0.3 - -
ROYAL LEPAGE HOUSE PRICE SURVEY THIRD QUARTER 2011
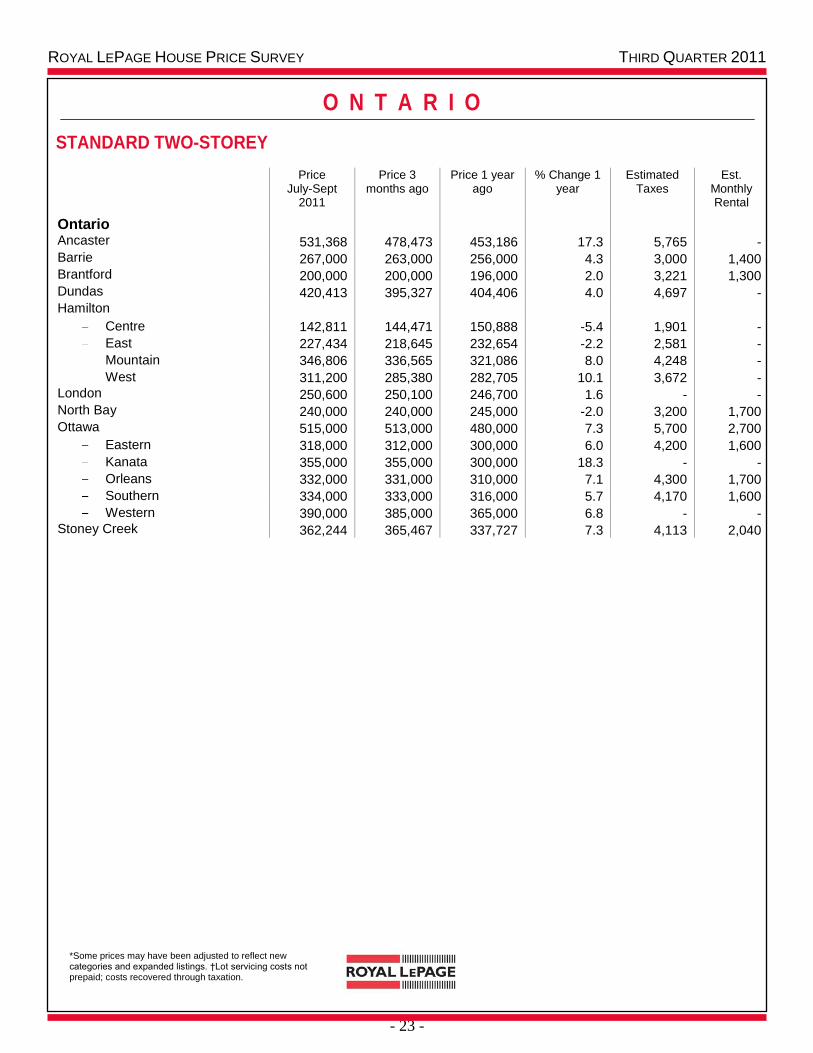
- 23 -
O N T A R I O
*Some prices may have been adjusted to reflect new categories and expanded listings. †Lot servicing costs not prepaid; costs recovered through taxation.
STANDARD TWO-STOREY
Price July-Sept
2011
Price 3 months ago
Price 1 year ago
% Change 1 year
Estimated Taxes
Est. Monthly Rental
Ontario
Ancaster 531,368 478,473 453,186 17.3 5,765 - Barrie 267,000 263,000 256,000 4.3 3,000 1,400 Brantford 200,000 200,000 196,000 2.0 3,221 1,300 Dundas 420,413 395,327 404,406 4.0 4,697 - Hamilton
Centre 142,811 144,471 150,888 -5.4 1,901 -
East 227,434 218,645 232,654 -2.2 2,581 -
Mountain 346,806 336,565 321,086 8.0 4,248 -
West 311,200 285,380 282,705 10.1 3,672 - London 250,600 250,100 246,700 1.6 - - North Bay 240,000 240,000 245,000 -2.0 3,200 1,700 Ottawa 515,000 513,000 480,000 7.3 5,700 2,700
Eastern 318,000 312,000 300,000 6.0 4,200 1,600
Kanata 355,000 355,000 300,000 18.3 - -
Orleans 332,000 331,000 310,000 7.1 4,300 1,700
Southern 334,000 333,000 316,000 5.7 4,170 1,600
Western 390,000 385,000 365,000 6.8 - - Stoney Creek 362,244 365,467 337,727 7.3 4,113 2,040
ROYAL LEPAGE HOUSE PRICE SURVEY THIRD QUARTER 2011
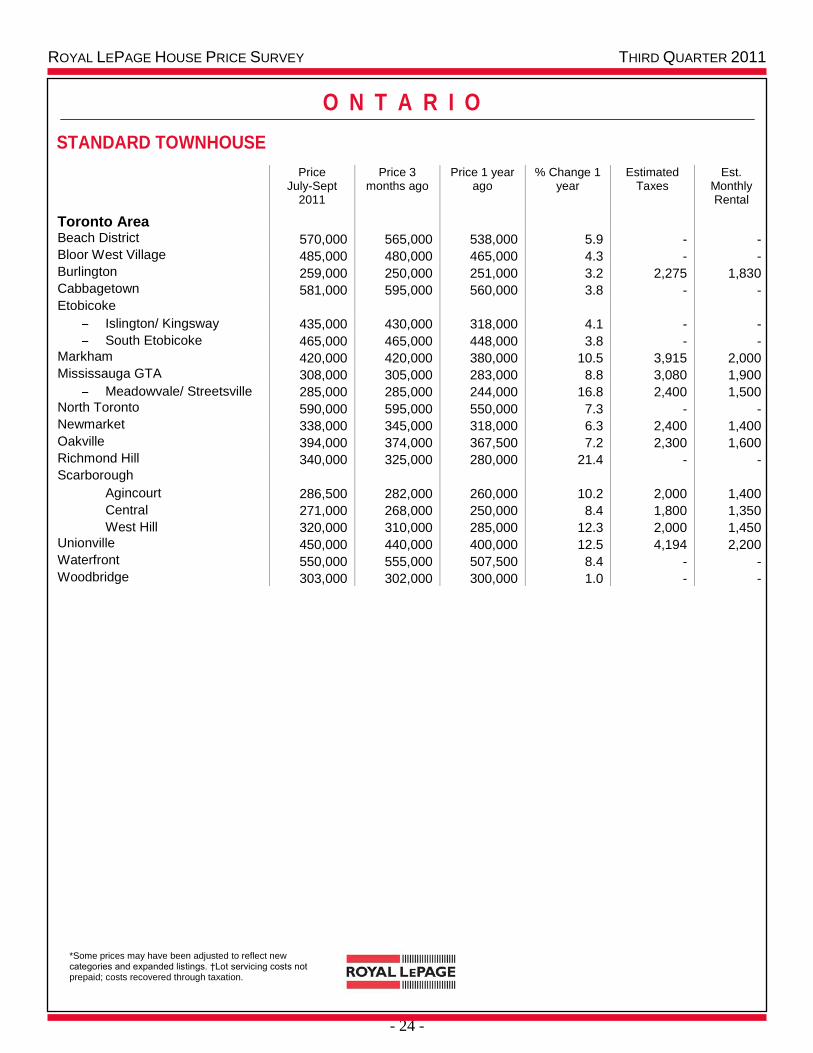
- 24 -
O N T A R I O
*Some prices may have been adjusted to reflect new categories and expanded listings. †Lot servicing costs not prepaid; costs recovered through taxation.
STANDARD TOWNHOUSE
Price July-Sept
2011
Price 3 months ago
Price 1 year ago
% Change 1 year
Estimated Taxes
Est. Monthly Rental
Toronto Area
Beach District 570,000 565,000 538,000 5.9 - - Bloor West Village 485,000 480,000 465,000 4.3 - - Burlington 259,000 250,000 251,000 3.2 2,275 1,830 Cabbagetown 581,000 595,000 560,000 3.8 - - Etobicoke
Islington/ Kingsway 435,000 430,000 318,000 4.1 - -
South Etobicoke 465,000 465,000 448,000 3.8 - - Markham 420,000 420,000 380,000 10.5 3,915 2,000 Mississauga GTA 308,000 305,000 283,000 8.8 3,080 1,900
Meadowvale/ Streetsville 285,000 285,000 244,000 16.8 2,400 1,500 North Toronto 590,000 595,000 550,000 7.3 - - Newmarket 338,000 345,000 318,000 6.3 2,400 1,400 Oakville 394,000 374,000 367,500 7.2 2,300 1,600 Richmond Hill 340,000 325,000 280,000 21.4 - - Scarborough
Agincourt 286,500 282,000 260,000 10.2 2,000 1,400
Central 271,000 268,000 250,000 8.4 1,800 1,350
West Hill 320,000 310,000 285,000 12.3 2,000 1,450 Unionville 450,000 440,000 400,000 12.5 4,194 2,200 Waterfront 550,000 555,000 507,500 8.4 - - Woodbridge 303,000 302,000 300,000 1.0 - -
ROYAL LEPAGE HOUSE PRICE SURVEY THIRD QUARTER 2011
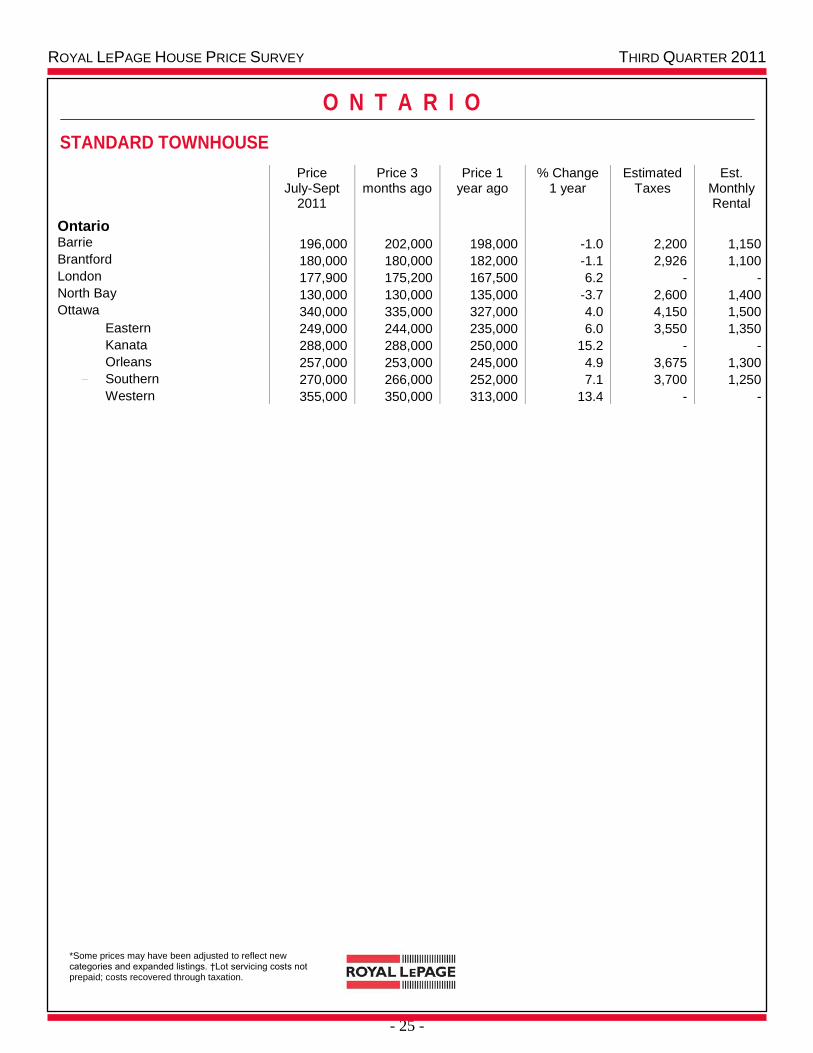
- 25 -
O N T A R I O
*Some prices may have been adjusted to reflect new categories and expanded listings. †Lot servicing costs not prepaid; costs recovered through taxation.
STANDARD TOWNHOUSE
Price July-Sept
2011
Price 3 months ago
Price 1 year ago
% Change 1 year
Estimated Taxes
Est. Monthly Rental
Ontario
Barrie 196,000 202,000 198,000 -1.0 2,200 1,150 Brantford 180,000 180,000 182,000 -1.1 2,926 1,100 London 177,900 175,200 167,500 6.2 - - North Bay 130,000 130,000 135,000 -3.7 2,600 1,400 Ottawa 340,000 335,000 327,000 4.0 4,150 1,500
Eastern 249,000 244,000 235,000 6.0 3,550 1,350
Kanata 288,000 288,000 250,000 15.2 - -
Orleans 257,000 253,000 245,000 4.9 3,675 1,300
Southern 270,000 266,000 252,000 7.1 3,700 1,250
Western 355,000 350,000 313,000 13.4 - -
ROYAL LEPAGE HOUSE PRICE SURVEY THIRD QUARTER 2011
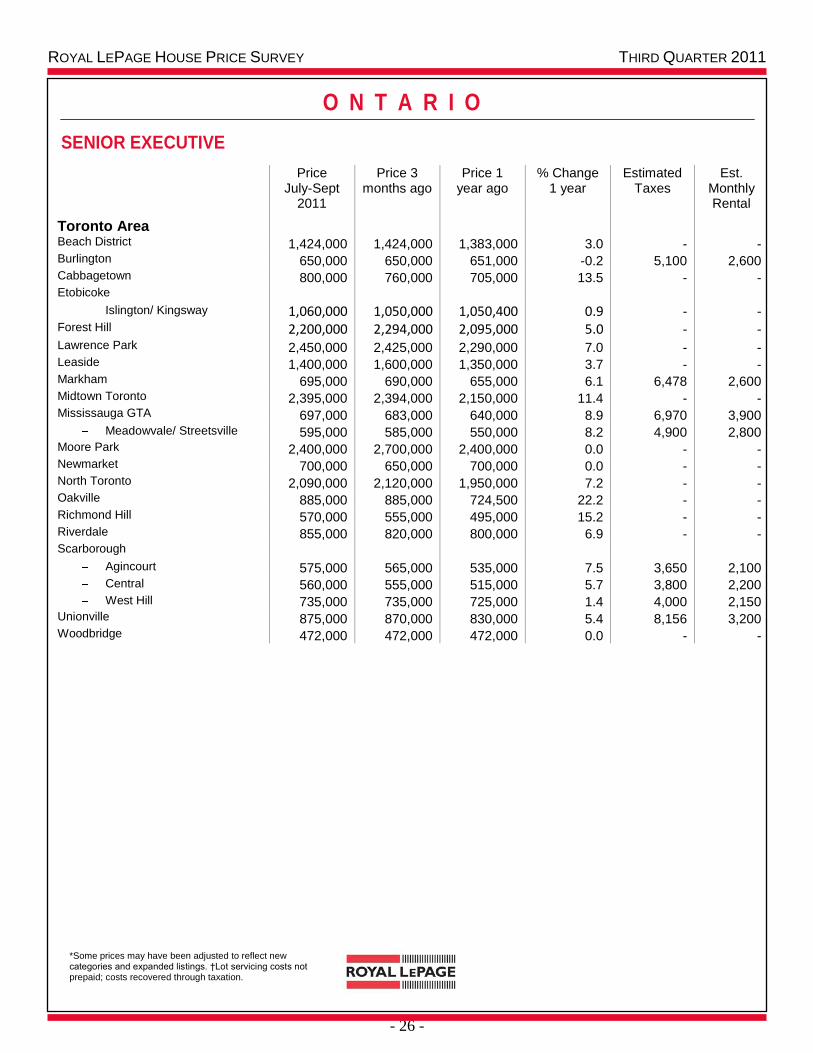
- 26 -
O N T A R I O
*Some prices may have been adjusted to reflect new categories and expanded listings. †Lot servicing costs not prepaid; costs recovered through taxation.
SENIOR EXECUTIVE
Price July-Sept
2011
Price 3 months ago
Price 1 year ago
% Change 1 year
Estimated Taxes
Est. Monthly Rental
Toronto Area
Beach District 1,424,000 1,424,000 1,383,000 3.0 - - Burlington 650,000 650,000 651,000 -0.2 5,100 2,600 Cabbagetown 800,000 760,000 705,000 13.5 - - Etobicoke
Islington/ Kingsway 1,060,000 1,050,000 1,050,400 0.9 - - Forest Hill 2,200,000 2,294,000 2,095,000 5.0 - - Lawrence Park 2,450,000 2,425,000 2,290,000 7.0 - - Leaside 1,400,000 1,600,000 1,350,000 3.7 - - Markham 695,000 690,000 655,000 6.1 6,478 2,600 Midtown Toronto 2,395,000 2,394,000 2,150,000 11.4 - - Mississauga GTA 697,000 683,000 640,000 8.9 6,970 3,900
Meadowvale/ Streetsville 595,000 585,000 550,000 8.2 4,900 2,800 Moore Park 2,400,000 2,700,000 2,400,000 0.0 - - Newmarket 700,000 650,000 700,000 0.0 - - North Toronto 2,090,000 2,120,000 1,950,000 7.2 - - Oakville 885,000 885,000 724,500 22.2 - - Richmond Hill 570,000 555,000 495,000 15.2 - - Riverdale 855,000 820,000 800,000 6.9 - - Scarborough
Agincourt 575,000 565,000 535,000 7.5 3,650 2,100 Central 560,000 555,000 515,000 5.7 3,800 2,200 West Hill 735,000 735,000 725,000 1.4 4,000 2,150
Unionville 875,000 870,000 830,000 5.4 8,156 3,200 Woodbridge 472,000 472,000 472,000 0.0 - -
ROYAL LEPAGE HOUSE PRICE SURVEY THIRD QUARTER 2011
- 27 -
O N T A R I O
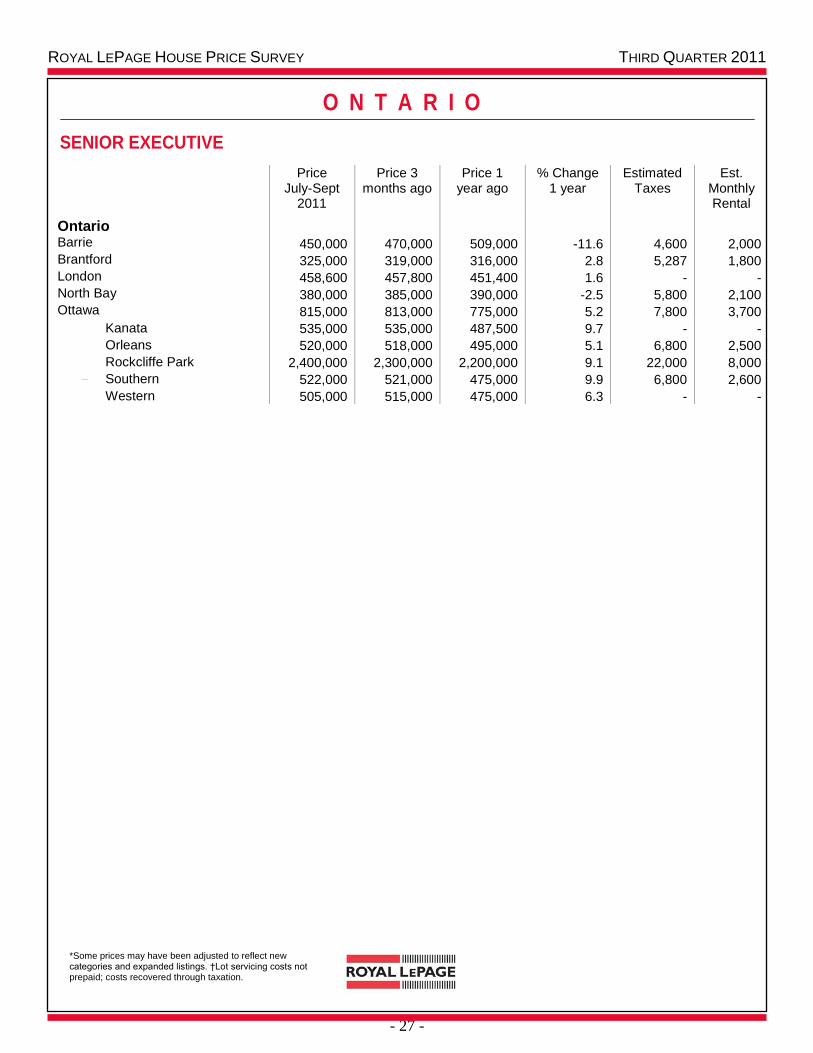
*Some prices may have been adjusted to reflect new categories and expanded listings. †Lot servicing costs not prepaid; costs recovered through taxation.
SENIOR EXECUTIVE
Price July-Sept
2011
Price 3 months ago
Price 1 year ago
% Change 1 year
Estimated Taxes
Est. Monthly Rental
Ontario
Barrie 450,000 470,000 509,000 -11.6 4,600 2,000 Brantford 325,000 319,000 316,000 2.8 5,287 1,800 London 458,600 457,800 451,400 1.6 - - North Bay 380,000 385,000 390,000 -2.5 5,800 2,100 Ottawa 815,000 813,000 775,000 5.2 7,800 3,700
Kanata 535,000 535,000 487,500 9.7 - -
Orleans 520,000 518,000 495,000 5.1 6,800 2,500
Rockcliffe Park 2,400,000 2,300,000 2,200,000 9.1 22,000 8,000
Southern 522,000 521,000 475,000 9.9 6,800 2,600
Western 505,000 515,000 475,000 6.3 - -
ROYAL LEPAGE HOUSE PRICE SURVEY THIRD QUARTER 2011
- 28 -
O N T A R I O
*Some prices may have been adjusted to reflect new categories and expanded listings. †Lot servicing costs not prepaid; costs recovered through taxation.
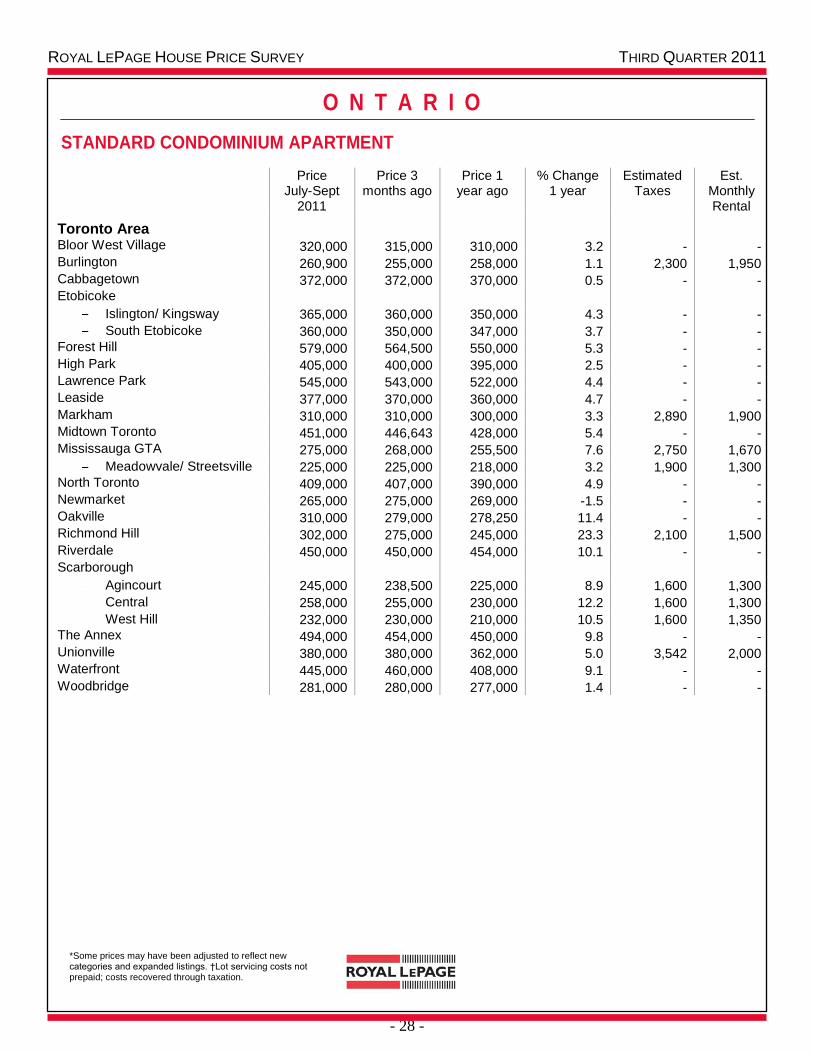
STANDARD CONDOMINIUM APARTMENT
Price July-Sept
2011
Price 3 months ago
Price 1 year ago
% Change 1 year
Estimated Taxes
Est. Monthly Rental
Toronto Area
Bloor West Village 320,000 315,000 310,000 3.2 - - Burlington 260,900 255,000 258,000 1.1 2,300 1,950 Cabbagetown 372,000 372,000 370,000 0.5 - - Etobicoke
Islington/ Kingsway 365,000 360,000 350,000 4.3 - -
South Etobicoke 360,000 350,000 347,000 3.7 - - Forest Hill 579,000 564,500 550,000 5.3 - - High Park 405,000 400,000 395,000 2.5 - - Lawrence Park 545,000 543,000 522,000 4.4 - - Leaside 377,000 370,000 360,000 4.7 - - Markham 310,000 310,000 300,000 3.3 2,890 1,900 Midtown Toronto 451,000 446,643 428,000 5.4 - - Mississauga GTA 275,000 268,000 255,500 7.6 2,750 1,670
Meadowvale/ Streetsville 225,000 225,000 218,000 3.2 1,900 1,300 North Toronto 409,000 407,000 390,000 4.9 - - Newmarket 265,000 275,000 269,000 -1.5 - - Oakville 310,000 279,000 278,250 11.4 - - Richmond Hill 302,000 275,000 245,000 23.3 2,100 1,500 Riverdale 450,000 450,000 454,000 10.1 - - Scarborough
Agincourt 245,000 238,500 225,000 8.9 1,600 1,300
Central 258,000 255,000 230,000 12.2 1,600 1,300
West Hill 232,000 230,000 210,000 10.5 1,600 1,350 The Annex 494,000 454,000 450,000 9.8 - - Unionville 380,000 380,000 362,000 5.0 3,542 2,000 Waterfront 445,000 460,000 408,000 9.1 - - Woodbridge 281,000 280,000 277,000 1.4 - -
ROYAL LEPAGE HOUSE PRICE SURVEY THIRD QUARTER 2011
- 29 -
O N T A R I O
*Some prices may have been adjusted to reflect new categories and expanded listings. †Lot servicing costs not prepaid; costs recovered through taxation.
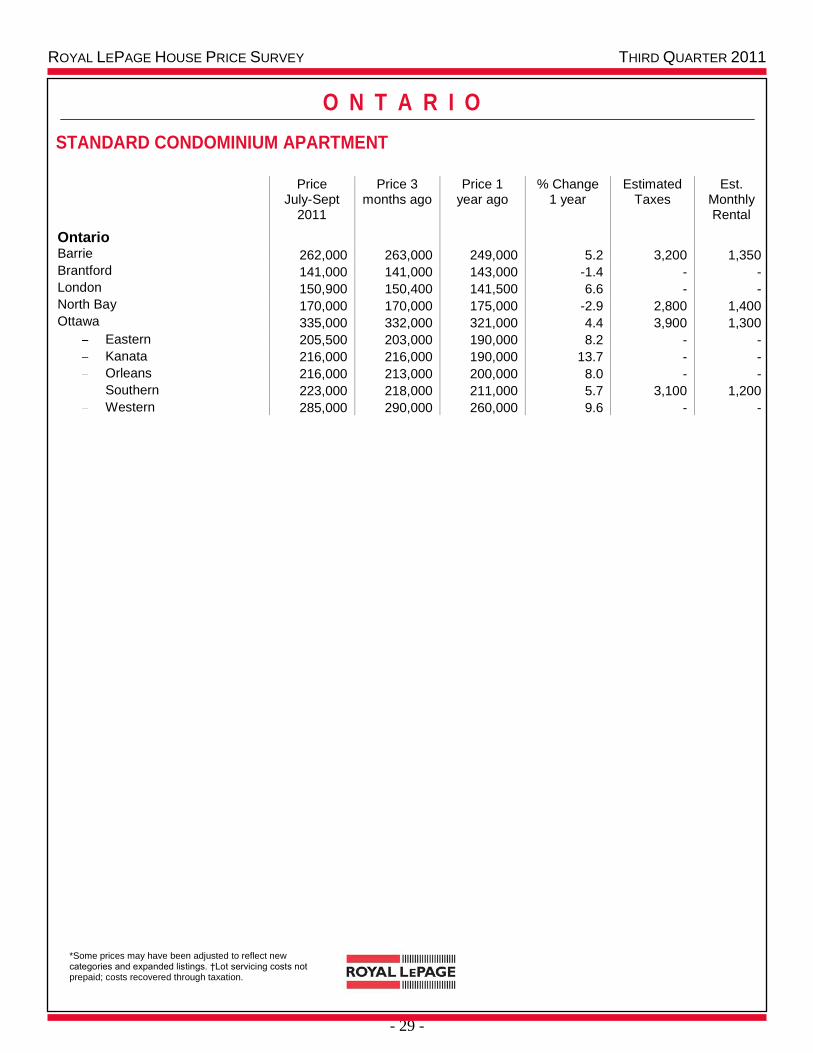
STANDARD CONDOMINIUM APARTMENT
Price
July-Sept 2011
Price 3 months ago
Price 1 year ago
% Change 1 year
Estimated Taxes
Est. Monthly Rental
Ontario
Barrie 262,000 263,000 249,000 5.2 3,200 1,350 Brantford 141,000 141,000 143,000 -1.4 - - London 150,900 150,400 141,500 6.6 - - North Bay 170,000 170,000 175,000 -2.9 2,800 1,400 Ottawa 335,000 332,000 321,000 4.4 3,900 1,300
Eastern 205,500 203,000 190,000 8.2 - -
Kanata 216,000 216,000 190,000 13.7 - -
Orleans 216,000 213,000 200,000 8.0 - -
Southern 223,000 218,000 211,000 5.7 3,100 1,200
Western 285,000 290,000 260,000 9.6 - -
ROYAL LEPAGE HOUSE PRICE SURVEY THIRD QUARTER 2011
- 30 -
O N T A R I O
*Some prices may have been adjusted to reflect new categories and expanded listings. †Lot servicing costs not prepaid; costs recovered through taxation.
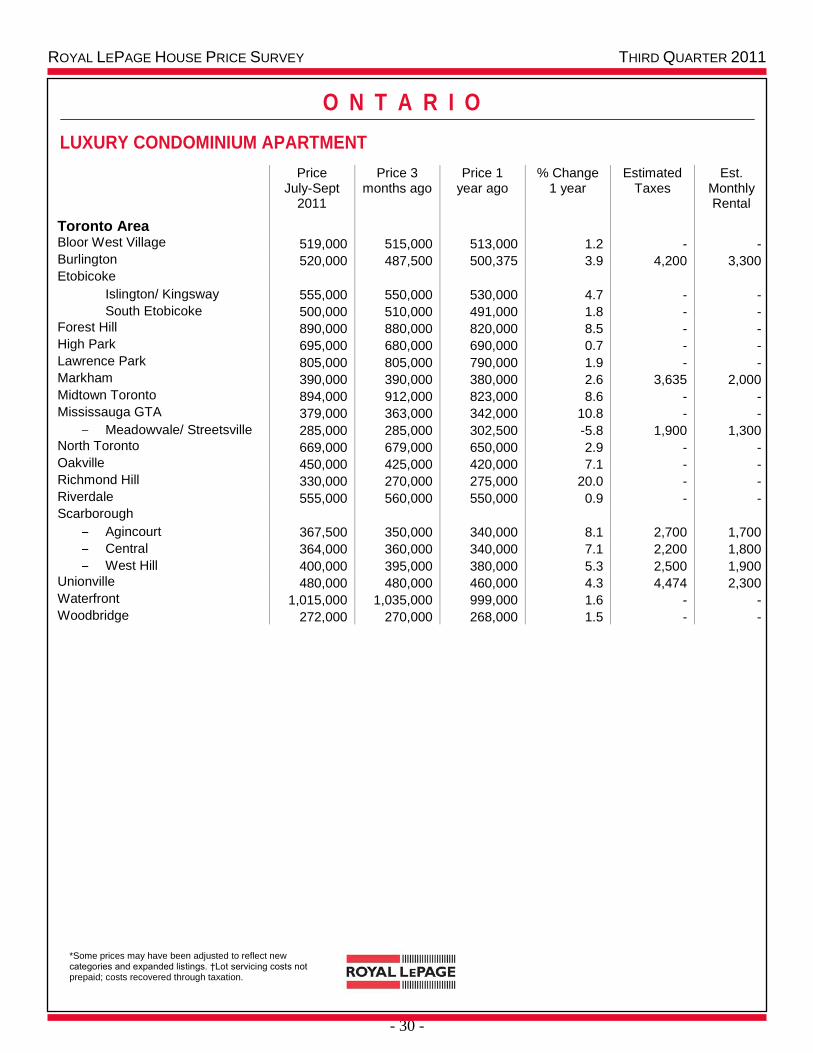
LUXURY CONDOMINIUM APARTMENT
Price July-Sept
2011
Price 3 months ago
Price 1 year ago
% Change 1 year
Estimated Taxes
Est. Monthly Rental
Toronto Area
Bloor West Village 519,000 515,000 513,000 1.2 - - Burlington 520,000 487,500 500,375 3.9 4,200 3,300 Etobicoke
Islington/ Kingsway 555,000 550,000 530,000 4.7 - -
South Etobicoke 500,000 510,000 491,000 1.8 - - Forest Hill 890,000 880,000 820,000 8.5 - - High Park 695,000 680,000 690,000 0.7 - - Lawrence Park 805,000 805,000 790,000 1.9 - - Markham 390,000 390,000 380,000 2.6 3,635 2,000 Midtown Toronto 894,000 912,000 823,000 8.6 - - Mississauga GTA 379,000 363,000 342,000 10.8 - -
Meadowvale/ Streetsville 285,000 285,000 302,500 -5.8 1,900 1,300 North Toronto 669,000 679,000 650,000 2.9 - - Oakville 450,000 425,000 420,000 7.1 - - Richmond Hill 330,000 270,000 275,000 20.0 - - Riverdale 555,000 560,000 550,000 0.9 - - Scarborough
Agincourt 367,500 350,000 340,000 8.1 2,700 1,700
Central 364,000 360,000 340,000 7.1 2,200 1,800
West Hill 400,000 395,000 380,000 5.3 2,500 1,900 Unionville 480,000 480,000 460,000 4.3 4,474 2,300 Waterfront 1,015,000 1,035,000 999,000 1.6 - - Woodbridge 272,000 270,000 268,000 1.5 - -
ROYAL LEPAGE HOUSE PRICE SURVEY THIRD QUARTER 2011
- 31 -
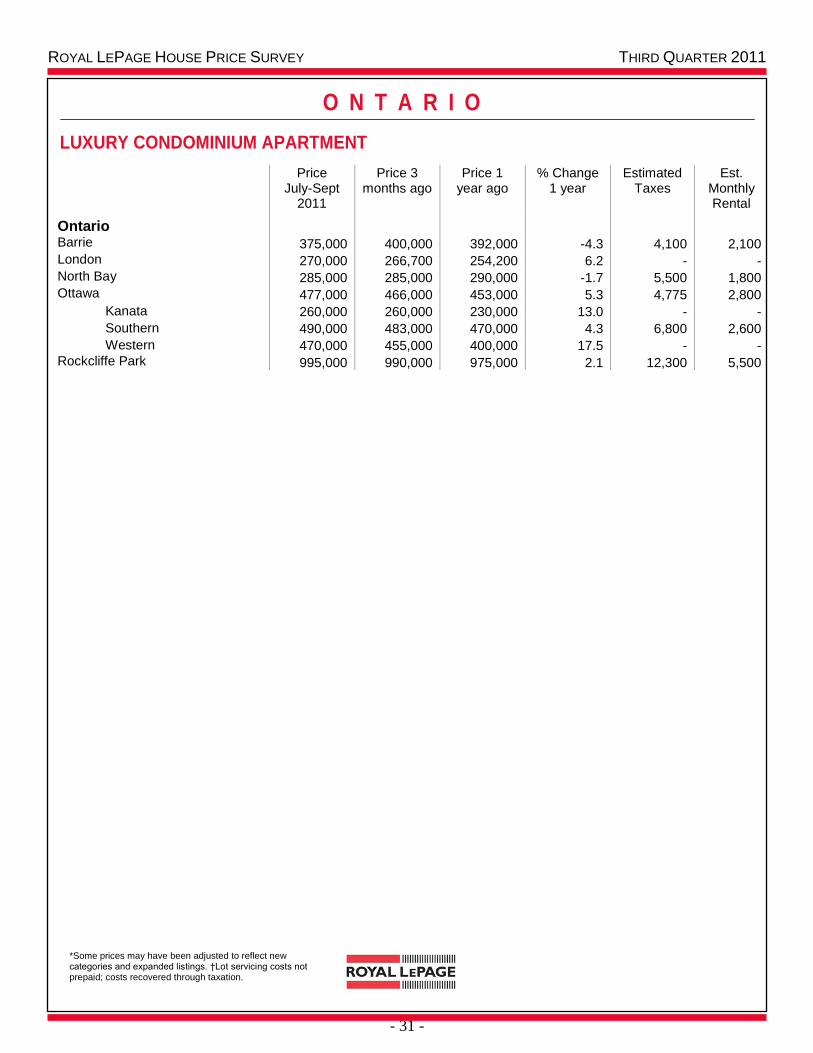
O N T A R I O
*Some prices may have been adjusted to reflect new categories and expanded listings. †Lot servicing costs not prepaid; costs recovered through taxation.
LUXURY CONDOMINIUM APARTMENT
Price July-Sept
2011
Price 3 months ago
Price 1 year ago
% Change 1 year
Estimated Taxes
Est. Monthly Rental
Ontario
Barrie 375,000 400,000 392,000 -4.3 4,100 2,100 London 270,000 266,700 254,200 6.2 - - North Bay 285,000 285,000 290,000 -1.7 5,500 1,800 Ottawa 477,000 466,000 453,000 5.3 4,775 2,800
Kanata 260,000 260,000 230,000 13.0 - -
Southern 490,000 483,000 470,000 4.3 6,800 2,600
Western 470,000 455,000 400,000 17.5 - - Rockcliffe Park 995,000 990,000 975,000 2.1 12,300 5,500
ROYAL LEPAGE HOUSE PRICE SURVEY THIRD QUARTER 2011
- 32 -
P R A I R I E P R O V I N C E S
*Some prices may have been adjusted to reflect new categories and expanded listings. †Lot servicing costs not prepaid; costs recovered through taxation.
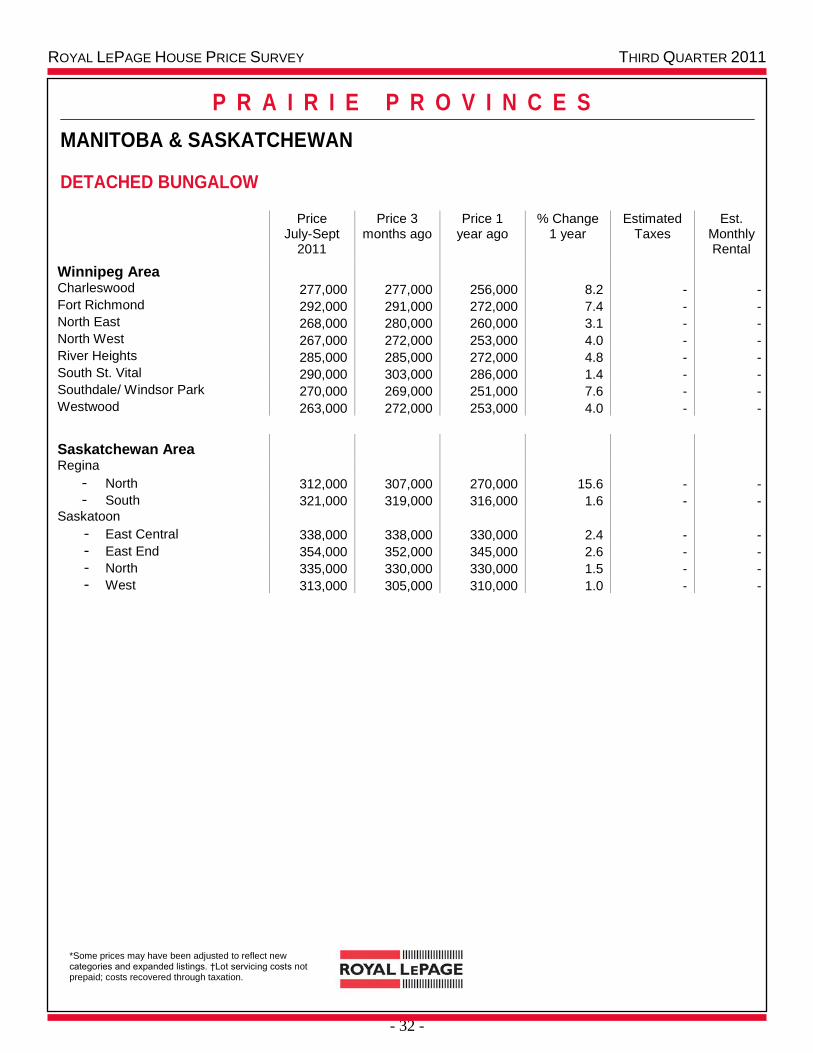
MANITOBA & SASKATCHEWAN
DETACHED BUNGALOW
Price July-Sept
2011
Price 3 months ago
Price 1 year ago
% Change 1 year
Estimated Taxes
Est. Monthly Rental
Winnipeg Area
Charleswood 277,000 277,000 256,000 8.2 - - Fort Richmond 292,000 291,000 272,000 7.4 - - North East 268,000 280,000 260,000 3.1 - - North West 267,000 272,000 253,000 4.0 - - River Heights 285,000 285,000 272,000 4.8 - - South St. Vital 290,000 303,000 286,000 1.4 - - Southdale/ Windsor Park 270,000 269,000 251,000 7.6 - - Westwood 263,000 272,000 253,000 4.0 - -
Saskatchewan Area
Regina
- North 312,000 307,000 270,000 15.6 - -
- South 321,000 319,000 316,000 1.6 - - Saskatoon
- East Central 338,000 338,000 330,000 2.4 - -
- East End 354,000 352,000 345,000 2.6 - -
- North 335,000 330,000 330,000 1.5 - -
- West 313,000 305,000 310,000 1.0 - -
ROYAL LEPAGE HOUSE PRICE SURVEY THIRD QUARTER 2011
- 33 -
P R A I R I E P R O V I N C E S
*Some prices may have been adjusted to reflect new categories and expanded listings. †Lot servicing costs not prepaid; costs recovered through taxation.
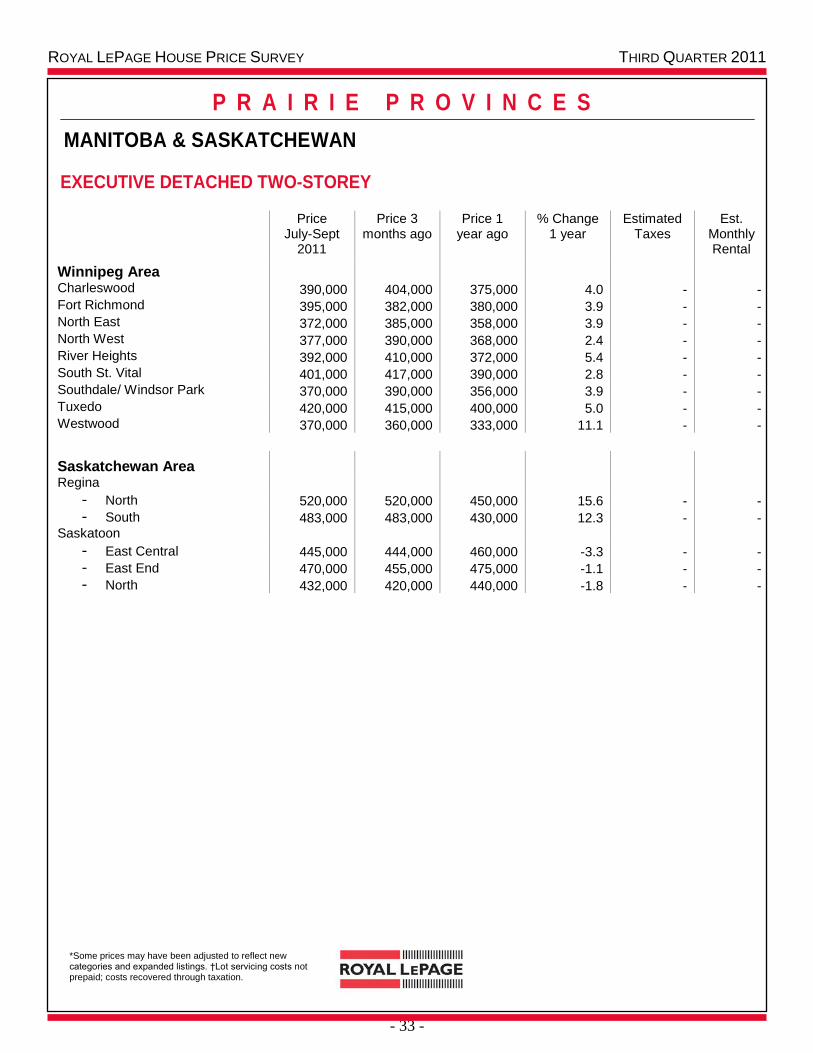
MANITOBA & SASKATCHEWAN
EXECUTIVE DETACHED TWO-STOREY
Price July-Sept
2011
Price 3 months ago
Price 1 year ago
% Change 1 year
Estimated Taxes
Est. Monthly Rental
Winnipeg Area
Charleswood 390,000 404,000 375,000 4.0 - - Fort Richmond 395,000 382,000 380,000 3.9 - - North East 372,000 385,000 358,000 3.9 - - North West 377,000 390,000 368,000 2.4 - - River Heights 392,000 410,000 372,000 5.4 - - South St. Vital 401,000 417,000 390,000 2.8 - - Southdale/ Windsor Park 370,000 390,000 356,000 3.9 - - Tuxedo 420,000 415,000 400,000 5.0 - - Westwood 370,000 360,000 333,000 11.1 - -
Saskatchewan Area
Regina
- North 520,000 520,000 450,000 15.6 - -
- South 483,000 483,000 430,000 12.3 - - Saskatoon
- East Central 445,000 444,000 460,000 -3.3 - -
- East End 470,000 455,000 475,000 -1.1 - -
- North 432,000 420,000 440,000 -1.8 - -

ROYAL LEPAGE HOUSE PRICE SURVEY THIRD QUARTER 2011
- 34 -
P R A I R I E P R O V I N C E S
*Some prices may have been adjusted to reflect new categories and expanded listings. †Lot servicing costs not prepaid; costs recovered through taxation.
MANITOBA & SASKATCHEWAN
STANDARD TWO-STOREY
Price July-Sept
2011
Price 3 months ago
Price 1 year ago
% Change 1 year
Estimated Taxes
Est. Monthly Rental
Winnipeg Area
Charleswood 292,000 300,000 278,500 4.8 - - Fort Richmond 302,000 302,000 295,000 2.4 - - North East 290,000 301,000 275,000 5.5 - - North West 319,000 325,000 290,000 10.0 - - River Heights 307,000 326,000 306,000 0.3 - - South St. Vital 325,000 334,000 310,000 4.8 - - Southdale/ Windsor Park 277,000 285,000 262,000 5.7 - - Westwood 287,000 286,000 281,000 2.1 - -
Saskatchewan Area
Regina
- North 270,000 270,000 238,000 13.4 - -
- South 330,000 330,000 310,000 6.5 - - Saskatoon
- East Central 368,000 360,000 355,000 3.7 - -
- East End 377,000 375,000 370,000 1.9 - -
- North 360,000 350,000 350,000 2.9 - -
- West 330,000 330,000 325,000 1.5 - -
ROYAL LEPAGE HOUSE PRICE SURVEY THIRD QUARTER 2011
- 35 -
P R A I R I E P R O V I N C E S
*Some prices may have been adjusted to reflect new categories and expanded listings. †Lot servicing costs not prepaid; costs recovered through taxation.
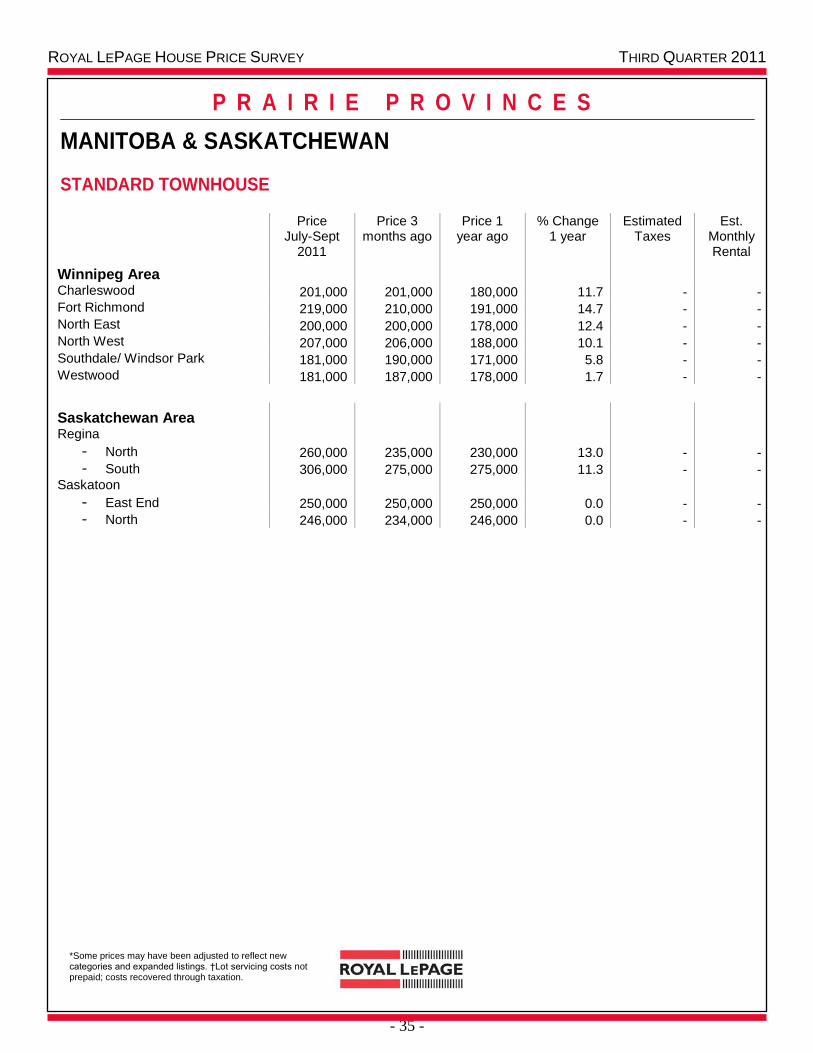
MANITOBA & SASKATCHEWAN
STANDARD TOWNHOUSE
Price July-Sept
2011
Price 3 months ago
Price 1 year ago
% Change 1 year
Estimated Taxes
Est. Monthly Rental
Winnipeg Area
Charleswood 201,000 201,000 180,000 11.7 - - Fort Richmond 219,000 210,000 191,000 14.7 - - North East 200,000 200,000 178,000 12.4 - - North West 207,000 206,000 188,000 10.1 - - Southdale/ Windsor Park 181,000 190,000 171,000 5.8 - - Westwood 181,000 187,000 178,000 1.7 - -
Saskatchewan Area
Regina
- North 260,000 235,000 230,000 13.0 - -
- South 306,000 275,000 275,000 11.3 - - Saskatoon
- East End 250,000 250,000 250,000 0.0 - -
- North 246,000 234,000 246,000 0.0 - -
ROYAL LEPAGE HOUSE PRICE SURVEY THIRD QUARTER 2011
- 36 -
P R A I R I E P R O V I N C E S
*Some prices may have been adjusted to reflect new categories and expanded listings. †Lot servicing costs not prepaid; costs recovered through taxation.
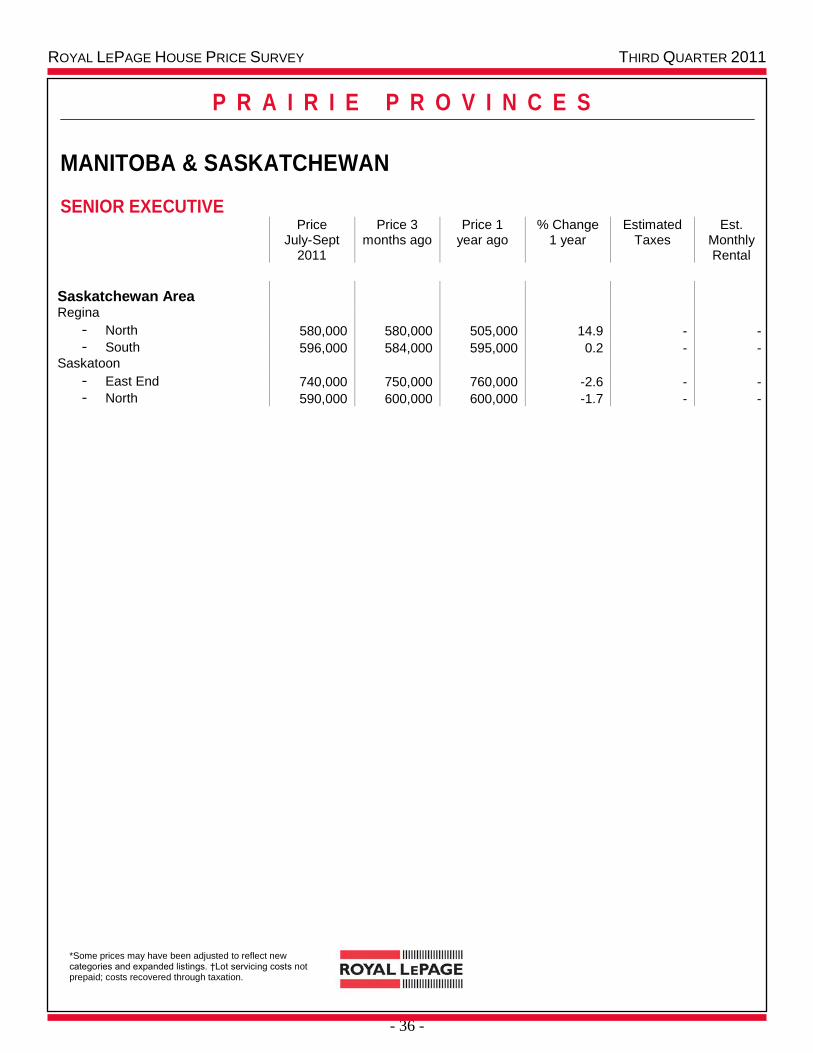
MANITOBA & SASKATCHEWAN
SENIOR EXECUTIVE Price
July-Sept 2011
Price 3 months ago
Price 1 year ago
% Change 1 year
Estimated Taxes
Est. Monthly Rental
Saskatchewan Area
Regina
- North 580,000 580,000 505,000 14.9 - -
- South 596,000 584,000 595,000 0.2 - - Saskatoon
- East End 740,000 750,000 760,000 -2.6 - -
- North 590,000 600,000 600,000 -1.7 - -

ROYAL LEPAGE HOUSE PRICE SURVEY THIRD QUARTER 2011
- 37 -
P R A I R I E P R O V I N C E S
*Some prices may have been adjusted to reflect new categories and expanded listings. †Lot servicing costs not prepaid; costs recovered through taxation.
MANITOBA & SASKATCHEWAN
STANDARD CONDOMINIUM APARTMENT
Price July-Sept
2011
Price 3 months ago
Price 1 year ago
% Change 1 year
Estimated Taxes
Est. Monthly Rental
Winnipeg Area
Charleswood 159,000 165,000 158,000 0.6 - - Fort Richmond 184,000 180,000 163,000 12.9 - - North East 154,000 153,000 138,000 11.6 - - North West 206,000 210,000 205,000 0.5 - - River Heights 164,000 168,000 155,000 5.8 - - South St. Vital 197,000 192,000 186,000 5.9 - - Westwood 156,000 156,000 142,000 9.9 - -
Saskatchewan Area
Regina
- North 170,000 164,000 164,000 3.7 - -
- South 226,000 213,000 205,000 10.2 - - Saskatoon
- East Central 238,000 243,000 230,000 3.5 - -
- East End 237,000 246,000 230,000 3.0 - -
- North 230,000 237,000 230,000 0.0 - -
ROYAL LEPAGE HOUSE PRICE SURVEY THIRD QUARTER 2011
- 38 -
P R A I R I E P R O V I N C E S
*Some prices may have been adjusted to reflect new categories and expanded listings. †Lot servicing costs not prepaid; costs recovered through taxation.
MANITOBA & SASKATCHEWAN
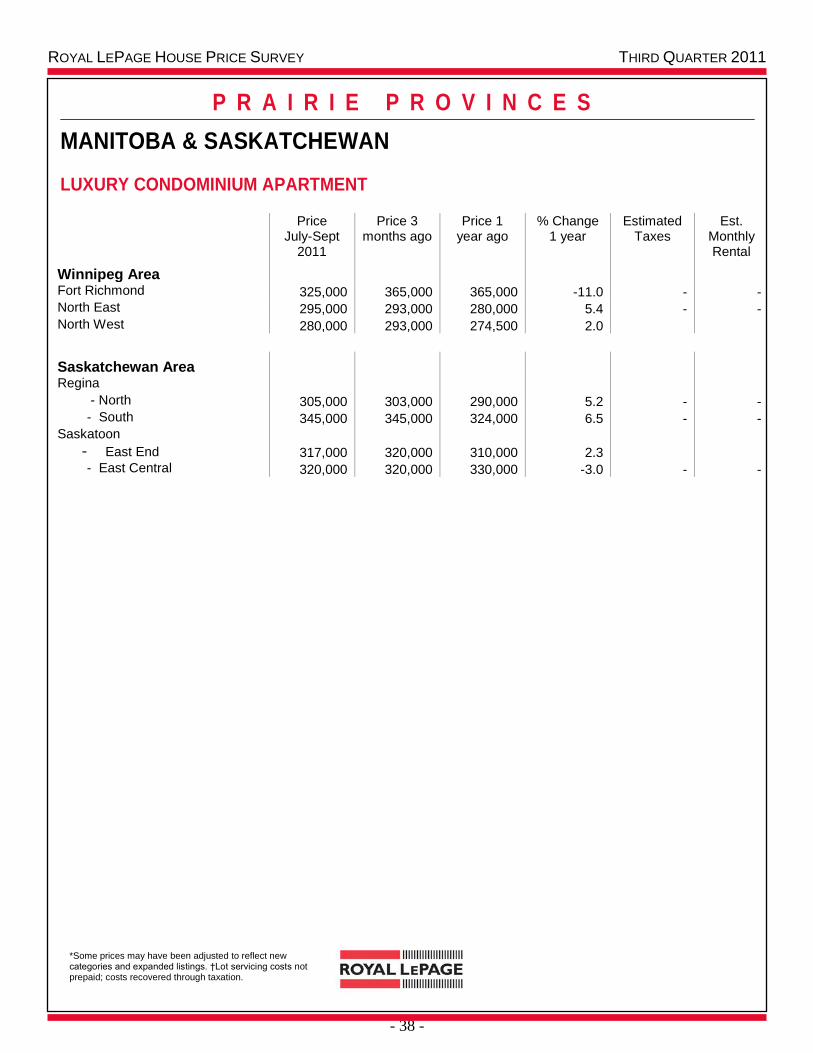
LUXURY CONDOMINIUM APARTMENT
Price July-Sept
2011
Price 3 months ago
Price 1 year ago
% Change 1 year
Estimated Taxes
Est. Monthly Rental
Winnipeg Area
Fort Richmond 325,000 365,000 365,000 -11.0 - - North East 295,000 293,000 280,000 5.4 - - North West 280,000 293,000 274,500 2.0
Saskatchewan Area
Regina
- North 305,000 303,000 290,000 5.2 - - - South 345,000 345,000 324,000 6.5 - - Saskatoon
- East End 317,000 320,000 310,000 2.3 - East Central 320,000 320,000 330,000 -3.0 - -
ROYAL LEPAGE HOUSE PRICE SURVEY THIRD QUARTER 2011
- 39 -
A L B E R T A
*Some prices may have been adjusted to reflect new categories and expanded listings. †Lot servicing costs not prepaid; costs recovered through taxation.
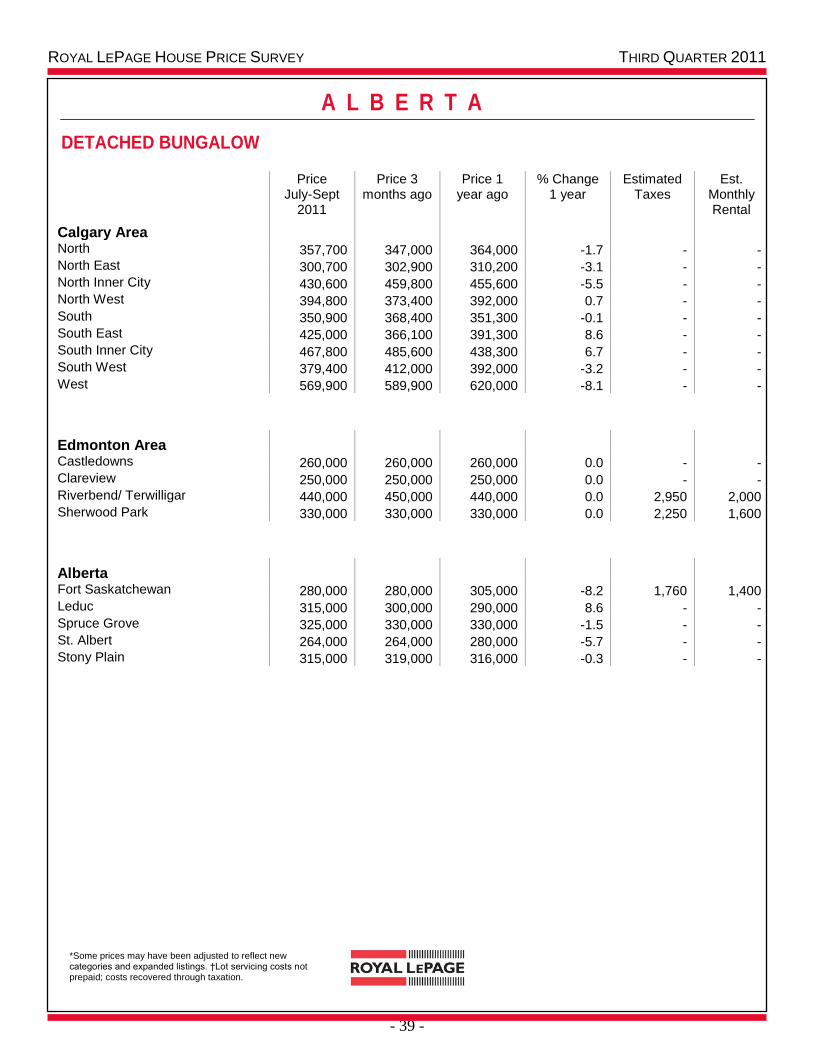
DETACHED BUNGALOW
Price July-Sept
2011
Price 3 months ago
Price 1 year ago
% Change 1 year
Estimated Taxes
Est. Monthly Rental
Calgary Area
North 357,700 347,000 364,000 -1.7 - - North East 300,700 302,900 310,200 -3.1 - - North Inner City 430,600 459,800 455,600 -5.5 - - North West 394,800 373,400 392,000 0.7 - - South 350,900 368,400 351,300 -0.1 - - South East 425,000 366,100 391,300 8.6 - - South Inner City 467,800 485,600 438,300 6.7 - - South West 379,400 412,000 392,000 -3.2 - - West 569,900 589,900 620,000 -8.1 - -
Edmonton Area
Castledowns 260,000 260,000 260,000 0.0 - - Clareview 250,000 250,000 250,000 0.0 - - Riverbend/ Terwilligar 440,000 450,000 440,000 0.0 2,950 2,000 Sherwood Park 330,000 330,000 330,000 0.0 2,250 1,600
Alberta
Fort Saskatchewan 280,000 280,000 305,000 -8.2 1,760 1,400 Leduc 315,000 300,000 290,000 8.6 - - Spruce Grove 325,000 330,000 330,000 -1.5 - - St. Albert 264,000 264,000 280,000 -5.7 - - Stony Plain 315,000 319,000 316,000 -0.3 - -
ROYAL LEPAGE HOUSE PRICE SURVEY THIRD QUARTER 2011
- 40 -
A L B E R T A
*Some prices may have been adjusted to reflect new categories and expanded listings. †Lot servicing costs not prepaid; costs recovered through taxation.
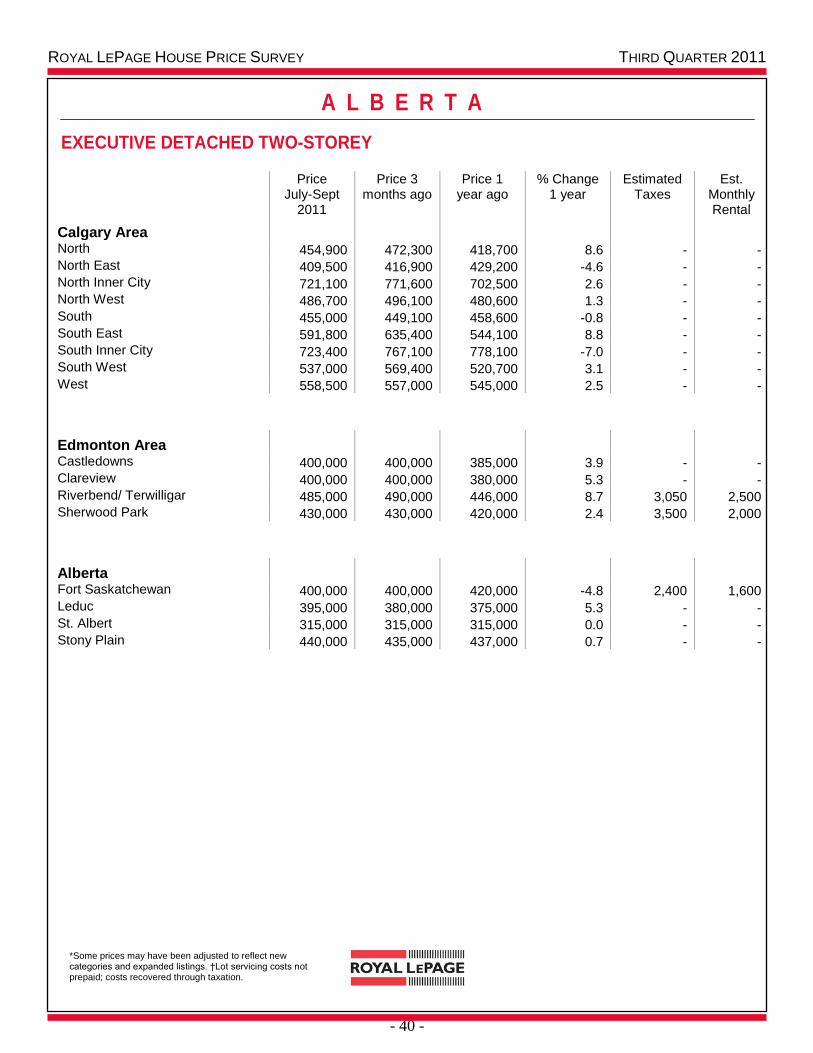
EXECUTIVE DETACHED TWO-STOREY
Price July-Sept
2011
Price 3 months ago
Price 1 year ago
% Change 1 year
Estimated Taxes
Est. Monthly Rental
Calgary Area
North 454,900 472,300 418,700 8.6 - - North East 409,500 416,900 429,200 -4.6 - - North Inner City 721,100 771,600 702,500 2.6 - - North West 486,700 496,100 480,600 1.3 - - South 455,000 449,100 458,600 -0.8 - - South East 591,800 635,400 544,100 8.8 - - South Inner City 723,400 767,100 778,100 -7.0 - - South West 537,000 569,400 520,700 3.1 - - West 558,500 557,000 545,000 2.5 - -
Edmonton Area
Castledowns 400,000 400,000 385,000 3.9 - - Clareview 400,000 400,000 380,000 5.3 - - Riverbend/ Terwilligar 485,000 490,000 446,000 8.7 3,050 2,500 Sherwood Park 430,000 430,000 420,000 2.4 3,500 2,000
Alberta
Fort Saskatchewan 400,000 400,000 420,000 -4.8 2,400 1,600 Leduc 395,000 380,000 375,000 5.3 - - St. Albert 315,000 315,000 315,000 0.0 - - Stony Plain 440,000 435,000 437,000 0.7 - -
ROYAL LEPAGE HOUSE PRICE SURVEY THIRD QUARTER 2011
- 41 -
A L B E R T A
*Some prices may have been adjusted to reflect new categories and expanded listings. †Lot servicing costs not prepaid; costs recovered through taxation.
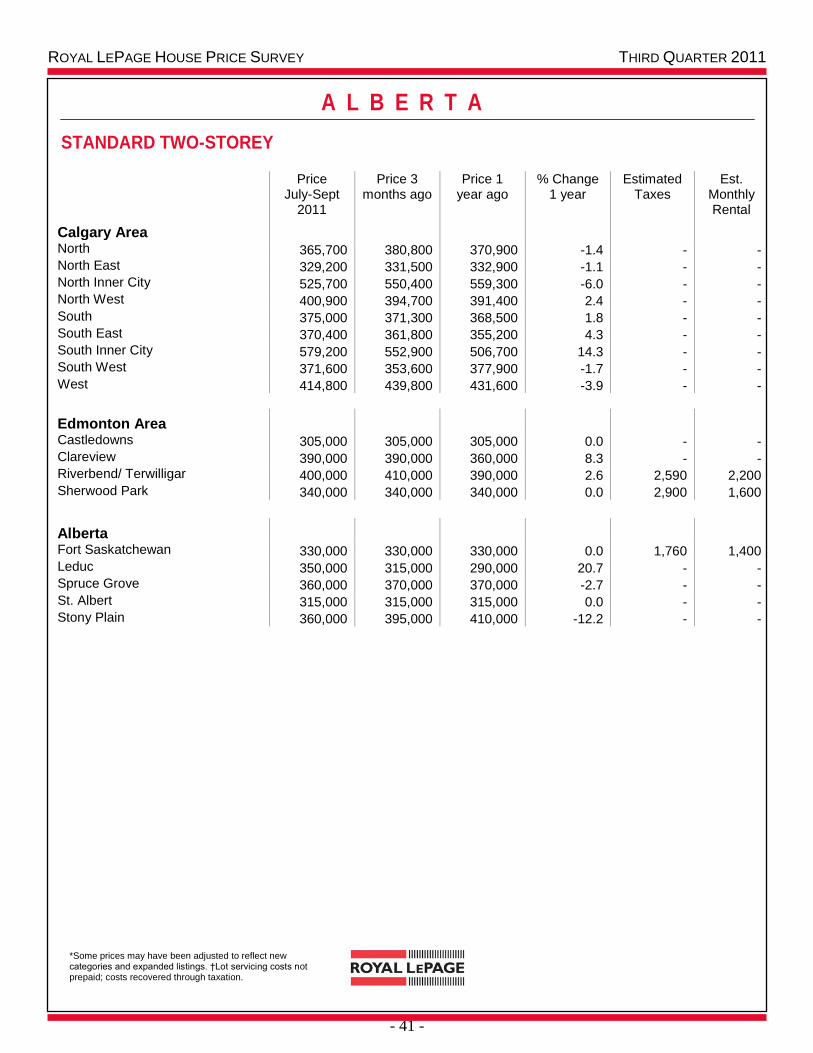
STANDARD TWO-STOREY
Price July-Sept
2011
Price 3 months ago
Price 1 year ago
% Change 1 year
Estimated Taxes
Est. Monthly Rental
Calgary Area
North 365,700 380,800 370,900 -1.4 - - North East 329,200 331,500 332,900 -1.1 - - North Inner City 525,700 550,400 559,300 -6.0 - - North West 400,900 394,700 391,400 2.4 - - South 375,000 371,300 368,500 1.8 - - South East 370,400 361,800 355,200 4.3 - - South Inner City 579,200 552,900 506,700 14.3 - - South West 371,600 353,600 377,900 -1.7 - - West 414,800 439,800 431,600 -3.9 - -
Edmonton Area
Castledowns 305,000 305,000 305,000 0.0 - - Clareview 390,000 390,000 360,000 8.3 - - Riverbend/ Terwilligar 400,000 410,000 390,000 2.6 2,590 2,200 Sherwood Park 340,000 340,000 340,000 0.0 2,900 1,600
Alberta
Fort Saskatchewan 330,000 330,000 330,000 0.0 1,760 1,400 Leduc 350,000 315,000 290,000 20.7 - - Spruce Grove 360,000 370,000 370,000 -2.7 - - St. Albert 315,000 315,000 315,000 0.0 - - Stony Plain 360,000 395,000 410,000 -12.2 - -
ROYAL LEPAGE HOUSE PRICE SURVEY THIRD QUARTER 2011
- 42 -
A L B E R T A
*Some prices may have been adjusted to reflect new categories and expanded listings. †Lot servicing costs not prepaid; costs recovered through taxation.
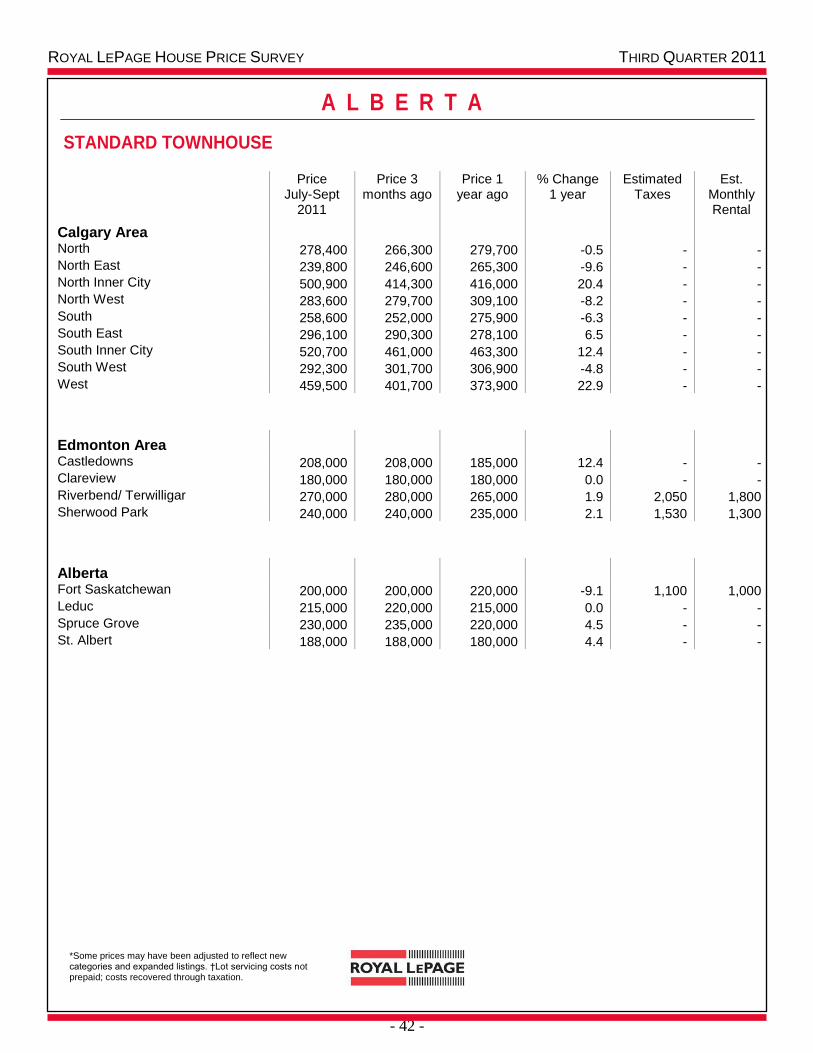
STANDARD TOWNHOUSE
Price July-Sept
2011
Price 3 months ago
Price 1 year ago
% Change 1 year
Estimated Taxes
Est. Monthly Rental
Calgary Area
North 278,400 266,300 279,700 -0.5 - - North East 239,800 246,600 265,300 -9.6 - - North Inner City 500,900 414,300 416,000 20.4 - - North West 283,600 279,700 309,100 -8.2 - - South 258,600 252,000 275,900 -6.3 - - South East 296,100 290,300 278,100 6.5 - - South Inner City 520,700 461,000 463,300 12.4 - - South West 292,300 301,700 306,900 -4.8 - - West 459,500 401,700 373,900 22.9 - -
Edmonton Area
Castledowns 208,000 208,000 185,000 12.4 - - Clareview 180,000 180,000 180,000 0.0 - - Riverbend/ Terwilligar 270,000 280,000 265,000 1.9 2,050 1,800 Sherwood Park 240,000 240,000 235,000 2.1 1,530 1,300
Alberta
Fort Saskatchewan 200,000 200,000 220,000 -9.1 1,100 1,000 Leduc 215,000 220,000 215,000 0.0 - - Spruce Grove 230,000 235,000 220,000 4.5 - - St. Albert 188,000 188,000 180,000 4.4 - -
ROYAL LEPAGE HOUSE PRICE SURVEY THIRD QUARTER 2011
- 43 -
A L B E R T A
*Some prices may have been adjusted to reflect new categories and expanded listings. †Lot servicing costs not prepaid; costs recovered through taxation.
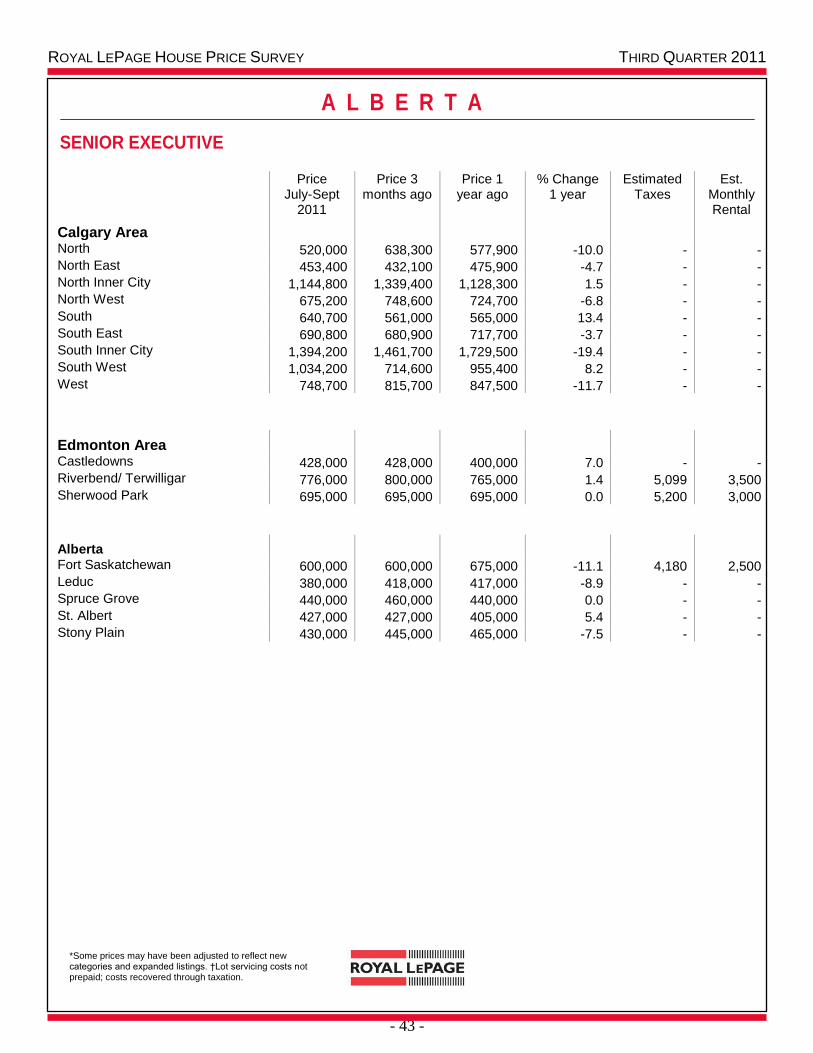
SENIOR EXECUTIVE
Price July-Sept
2011
Price 3 months ago
Price 1 year ago
% Change 1 year
Estimated Taxes
Est. Monthly Rental
Calgary Area
North 520,000 638,300 577,900 -10.0 - - North East 453,400 432,100 475,900 -4.7 - - North Inner City 1,144,800 1,339,400 1,128,300 1.5 - - North West 675,200 748,600 724,700 -6.8 - - South 640,700 561,000 565,000 13.4 - - South East 690,800 680,900 717,700 -3.7 - - South Inner City 1,394,200 1,461,700 1,729,500 -19.4 - - South West 1,034,200 714,600 955,400 8.2 - - West 748,700 815,700 847,500 -11.7 - -
Edmonton Area
Castledowns 428,000 428,000 400,000 7.0 - - Riverbend/ Terwilligar 776,000 800,000 765,000 1.4 5,099 3,500 Sherwood Park 695,000 695,000 695,000 0.0 5,200 3,000
Alberta
Fort Saskatchewan 600,000 600,000 675,000 -11.1 4,180 2,500 Leduc 380,000 418,000 417,000 -8.9 - - Spruce Grove 440,000 460,000 440,000 0.0 - - St. Albert 427,000 427,000 405,000 5.4 - - Stony Plain 430,000 445,000 465,000 -7.5 - -

ROYAL LEPAGE HOUSE PRICE SURVEY THIRD QUARTER 2011
- 44 -
A L B E R T A
*Some prices may have been adjusted to reflect new categories and expanded listings. †Lot servicing costs not prepaid; costs recovered through taxation.
STANDARD CONDOMINIUM APARTMENT
Price July-Sept
2011
Price 3 months ago
Price 1 year ago
% Change 1 year
Estimated Taxes
Est. Monthly Rental
Calgary Area
North 231,400 237,000 227,500 1.7 - - North East 201,400 185,400 197,000 2.2 - - North Inner City 302,300 252,300 265,000 14.1 - - North West 269,300 239,500 226,300 19.0 - - South 228,500 224,900 227,300 0.5 - - South East 236,200 247,200 241,100 -2.0 - - South Inner City 319,900 312,200 313,400 2.1 - - South West 259,900 285,600 243,900 6.6 - - West 241,300 257,100 278,300 -13.3 - -
Edmonton Area
Castledowns 192,000 192,000 170,000 12.9 - - Clareview 165,000 165,000 155,000 6.5 - - Riverbend/ Terwilligar 220,000 225,000 220,000 0.0 1,535 1,500 Sherwood Park 280,000 280,000 275,000 1.8 2,140 1,500
Alberta
Fort Saskatchewan 190,000 190,000 230,000 -17.4 1,000 1,100 Leduc 220,000 205,000 210,000 4.8 - - St. Albert 170,000 170,000 170,000 0.0 - -
ROYAL LEPAGE HOUSE PRICE SURVEY THIRD QUARTER 2011
- 45 -
A L B E R T A
*Some prices may have been adjusted to reflect new categories and expanded listings. †Lot servicing costs not prepaid; costs recovered through taxation.
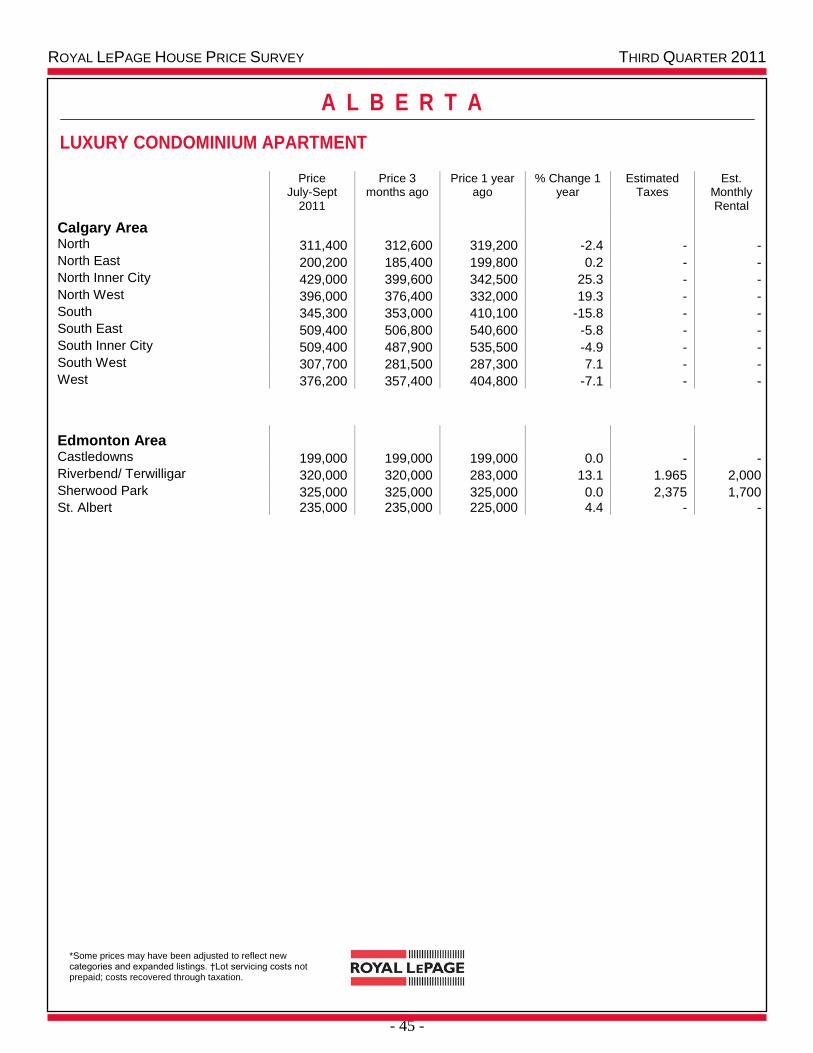
LUXURY CONDOMINIUM APARTMENT
Price July-Sept
2011
Price 3 months ago
Price 1 year ago
% Change 1 year
Estimated Taxes
Est. Monthly Rental
Calgary Area
North 311,400 312,600 319,200 -2.4 - - North East 200,200 185,400 199,800 0.2 - - North Inner City 429,000 399,600 342,500 25.3 - - North West 396,000 376,400 332,000 19.3 - - South 345,300 353,000 410,100 -15.8 - - South East 509,400 506,800 540,600 -5.8 - - South Inner City 509,400 487,900 535,500 -4.9 - - South West 307,700 281,500 287,300 7.1 - - West 376,200 357,400 404,800 -7.1 - -
Edmonton Area
Castledowns 199,000 199,000 199,000 0.0 - - Riverbend/ Terwilligar 320,000 320,000 283,000 13.1 1.965 2,000 Sherwood Park 325,000 325,000 325,000 0.0 2,375 1,700 St. Albert 235,000 235,000 225,000 4.4 - -
ROYAL LEPAGE HOUSE PRICE SURVEY THIRD QUARTER 2011
- 46 -
*Some prices may have been adjusted to reflect new categories and expanded listings. †Lot servicing costs not prepaid; costs recovered through taxation.
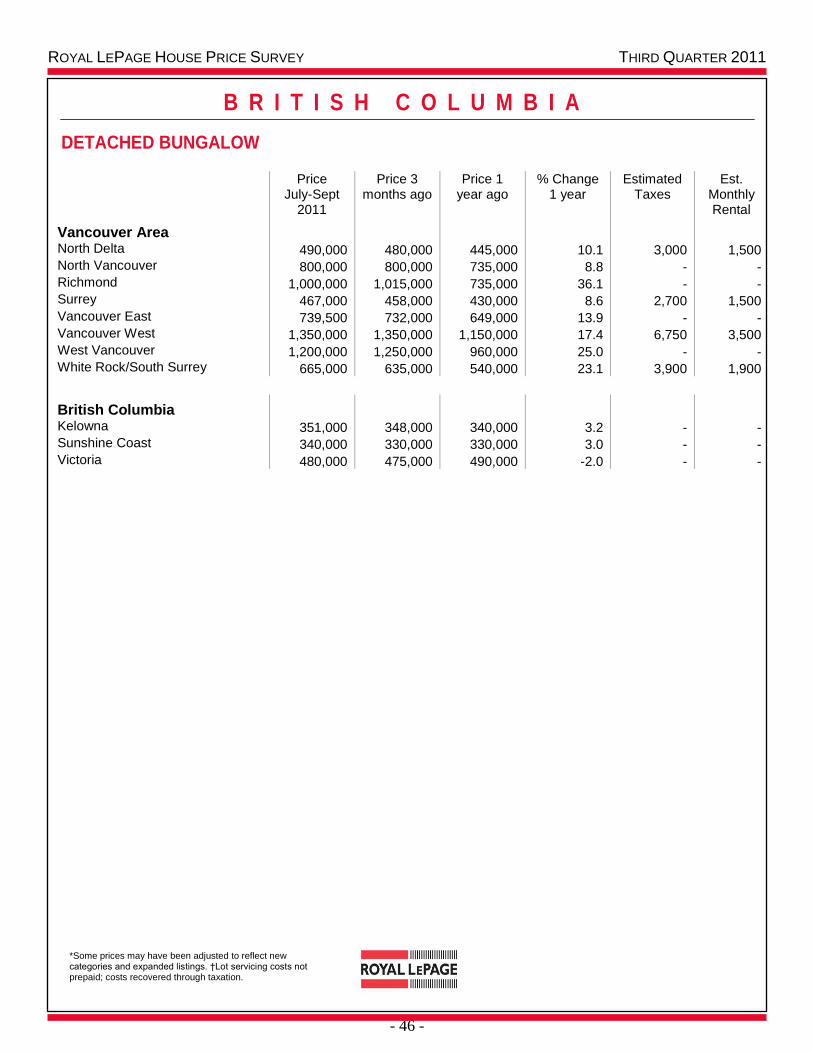
B R I T I S H C O L U M B I A
DETACHED BUNGALOW
Price July-Sept
2011
Price 3 months ago
Price 1 year ago
% Change 1 year
Estimated Taxes
Est. Monthly Rental
Vancouver Area
North Delta 490,000 480,000 445,000 10.1 3,000 1,500 North Vancouver 800,000 800,000 735,000 8.8 - - Richmond 1,000,000 1,015,000 735,000 36.1 - - Surrey 467,000 458,000 430,000 8.6 2,700 1,500 Vancouver East 739,500 732,000 649,000 13.9 - - Vancouver West 1,350,000 1,350,000 1,150,000 17.4 6,750 3,500 West Vancouver 1,200,000 1,250,000 960,000 25.0 - - White Rock/South Surrey 665,000 635,000 540,000 23.1 3,900 1,900
British Columbia
Kelowna 351,000 348,000 340,000 3.2 - - Sunshine Coast 340,000 330,000 330,000 3.0 - - Victoria 480,000 475,000 490,000 -2.0 - -
ROYAL LEPAGE HOUSE PRICE SURVEY THIRD QUARTER 2011
- 47 -
*Some prices may have been adjusted to reflect new categories and expanded listings. †Lot servicing costs not prepaid; costs recovered through taxation.
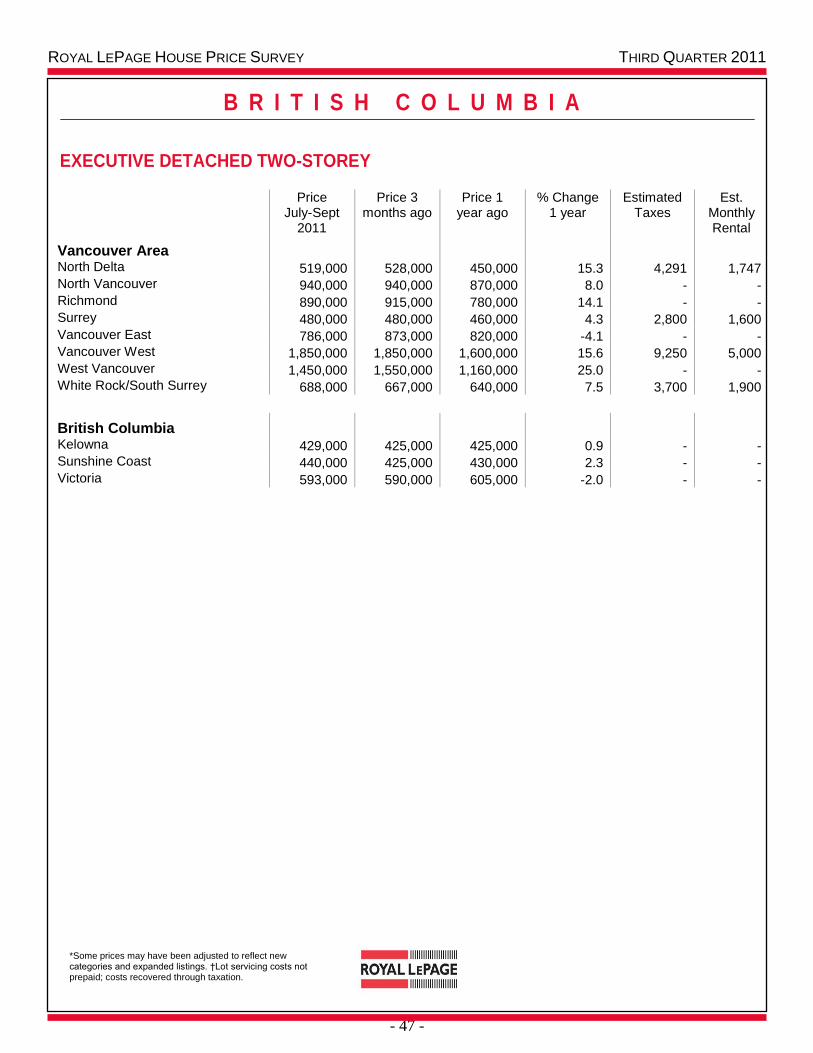
B R I T I S H C O L U M B I A
EXECUTIVE DETACHED TWO-STOREY
Price July-Sept
2011
Price 3 months ago
Price 1 year ago
% Change 1 year
Estimated Taxes
Est. Monthly Rental
Vancouver Area
North Delta 519,000 528,000 450,000 15.3 4,291 1,747 North Vancouver 940,000 940,000 870,000 8.0 - - Richmond 890,000 915,000 780,000 14.1 - - Surrey 480,000 480,000 460,000 4.3 2,800 1,600 Vancouver East 786,000 873,000 820,000 -4.1 - - Vancouver West 1,850,000 1,850,000 1,600,000 15.6 9,250 5,000 West Vancouver 1,450,000 1,550,000 1,160,000 25.0 - - White Rock/South Surrey 688,000 667,000 640,000 7.5 3,700 1,900
British Columbia
Kelowna 429,000 425,000 425,000 0.9 - - Sunshine Coast 440,000 425,000 430,000 2.3 - - Victoria 593,000 590,000 605,000 -2.0 - -
ROYAL LEPAGE HOUSE PRICE SURVEY THIRD QUARTER 2011
- 48 -
*Some prices may have been adjusted to reflect new categories and expanded listings. †Lot servicing costs not prepaid; costs recovered through taxation.
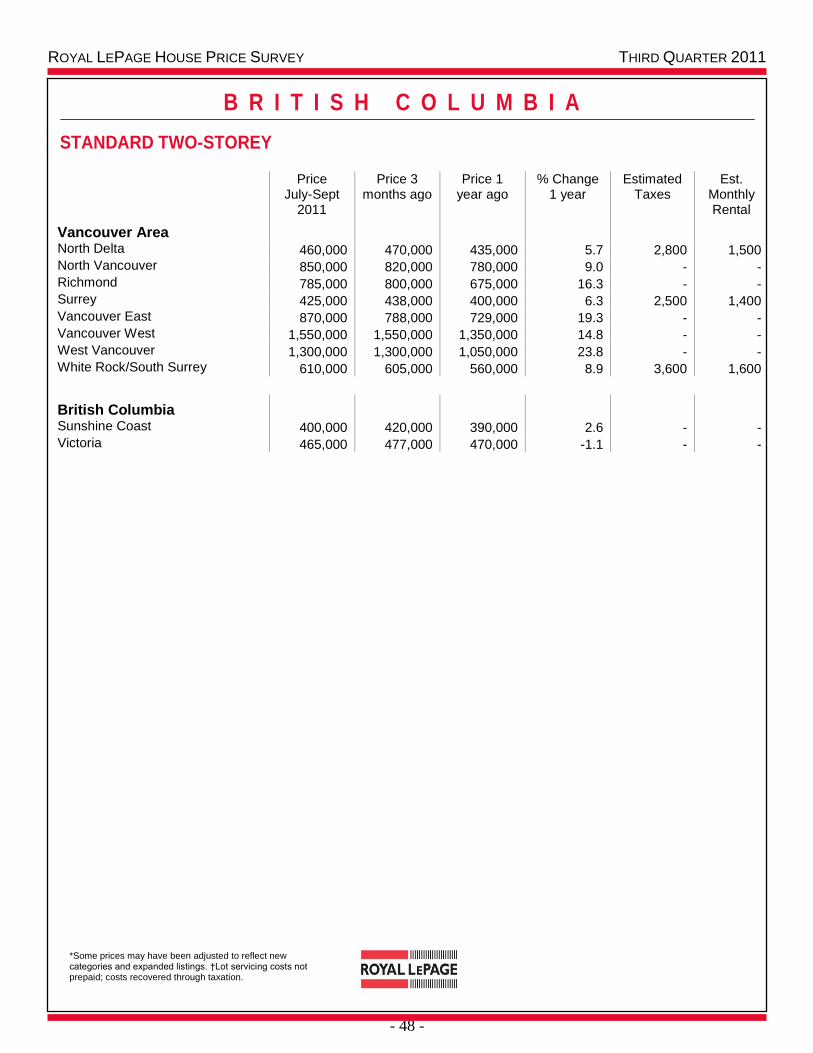
B R I T I S H C O L U M B I A
STANDARD TWO-STOREY
Price July-Sept
2011
Price 3 months ago
Price 1 year ago
% Change 1 year
Estimated Taxes
Est. Monthly Rental
Vancouver Area
North Delta 460,000 470,000 435,000 5.7 2,800 1,500 North Vancouver 850,000 820,000 780,000 9.0 - - Richmond 785,000 800,000 675,000 16.3 - - Surrey 425,000 438,000 400,000 6.3 2,500 1,400 Vancouver East 870,000 788,000 729,000 19.3 - - Vancouver West 1,550,000 1,550,000 1,350,000 14.8 - - West Vancouver 1,300,000 1,300,000 1,050,000 23.8 - - White Rock/South Surrey 610,000 605,000 560,000 8.9 3,600 1,600
British Columbia
Sunshine Coast 400,000 420,000 390,000 2.6 - - Victoria 465,000 477,000 470,000 -1.1 - -
ROYAL LEPAGE HOUSE PRICE SURVEY THIRD QUARTER 2011
- 49 -
*Some prices may have been adjusted to reflect new categories and expanded listings. †Lot servicing costs not prepaid; costs recovered through taxation.
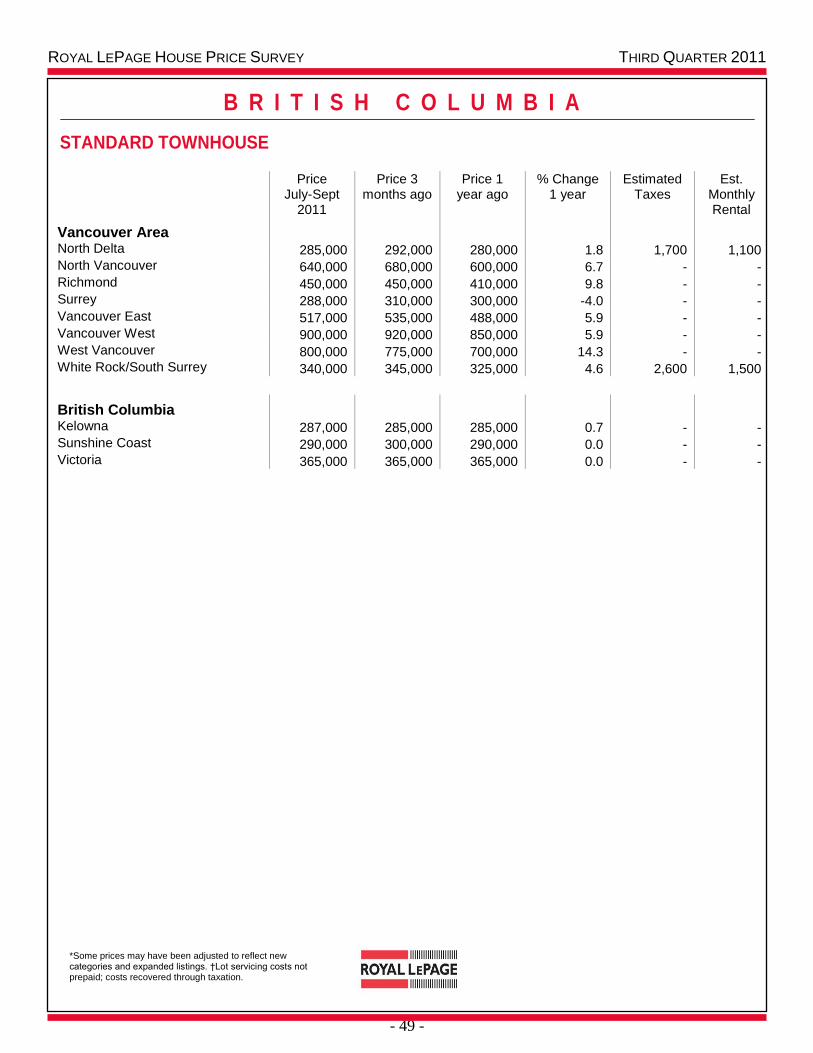
B R I T I S H C O L U M B I A
STANDARD TOWNHOUSE
Price July-Sept
2011
Price 3 months ago
Price 1 year ago
% Change 1 year
Estimated Taxes
Est. Monthly Rental
Vancouver Area
North Delta 285,000 292,000 280,000 1.8 1,700 1,100 North Vancouver 640,000 680,000 600,000 6.7 - - Richmond 450,000 450,000 410,000 9.8 - - Surrey 288,000 310,000 300,000 -4.0 - - Vancouver East 517,000 535,000 488,000 5.9 - - Vancouver West 900,000 920,000 850,000 5.9 - - West Vancouver 800,000 775,000 700,000 14.3 - - White Rock/South Surrey 340,000 345,000 325,000 4.6 2,600 1,500
British Columbia
Kelowna 287,000 285,000 285,000 0.7 - - Sunshine Coast 290,000 300,000 290,000 0.0 - - Victoria 365,000 365,000 365,000 0.0 - -
ROYAL LEPAGE HOUSE PRICE SURVEY THIRD QUARTER 2011
- 50 -
*Some prices may have been adjusted to reflect new categories and expanded listings. †Lot servicing costs not prepaid; costs recovered through taxation.
B R I T I S H C O L U M B I A
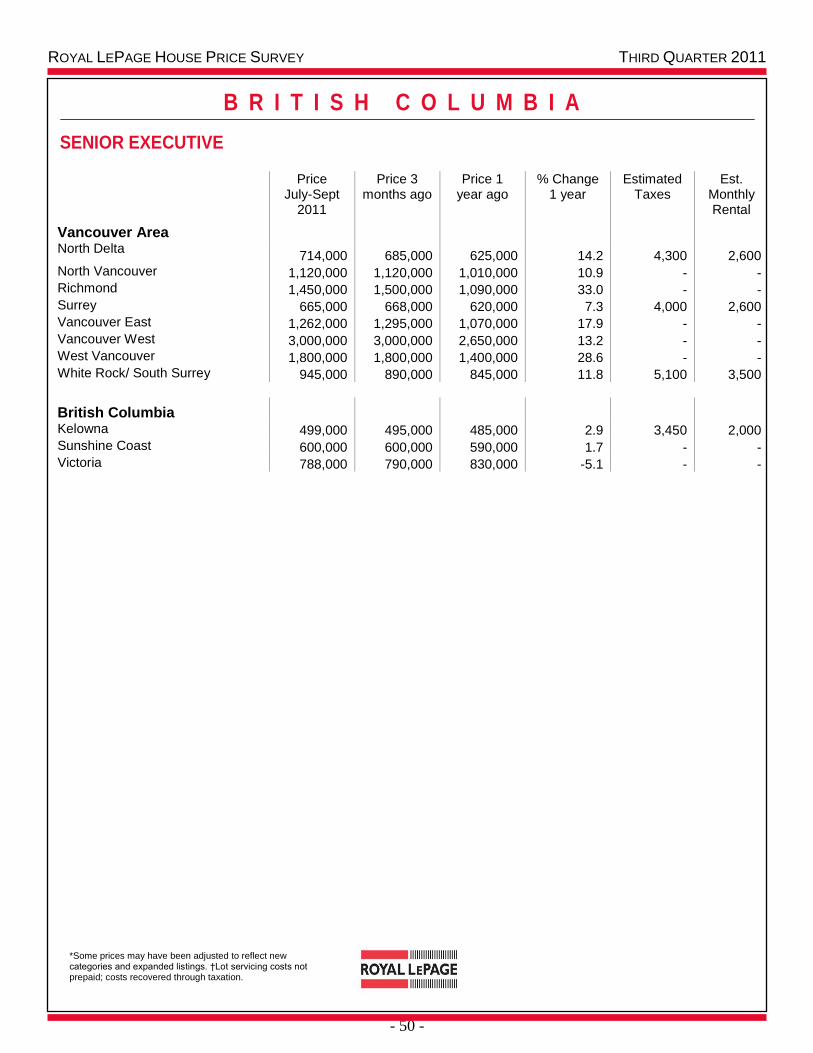
SENIOR EXECUTIVE
Price July-Sept
2011
Price 3 months ago
Price 1 year ago
% Change 1 year
Estimated Taxes
Est. Monthly Rental
Vancouver Area
North Delta 714,000 685,000 625,000 14.2 4,300 2,600
North Vancouver 1,120,000 1,120,000 1,010,000 10.9 - - Richmond 1,450,000 1,500,000 1,090,000 33.0 - - Surrey 665,000 668,000 620,000 7.3 4,000 2,600 Vancouver East 1,262,000 1,295,000 1,070,000 17.9 - - Vancouver West 3,000,000 3,000,000 2,650,000 13.2 - - West Vancouver 1,800,000 1,800,000 1,400,000 28.6 - - White Rock/ South Surrey 945,000 890,000 845,000 11.8 5,100 3,500
British Columbia
Kelowna 499,000 495,000 485,000 2.9 3,450 2,000 Sunshine Coast 600,000 600,000 590,000 1.7 - - Victoria 788,000 790,000 830,000 -5.1 - -
ROYAL LEPAGE HOUSE PRICE SURVEY THIRD QUARTER 2011
- 51 -
*Some prices may have been adjusted to reflect new categories and expanded listings. †Lot servicing costs not prepaid; costs recovered through taxation.
B R I T I S H C O L U M B I A
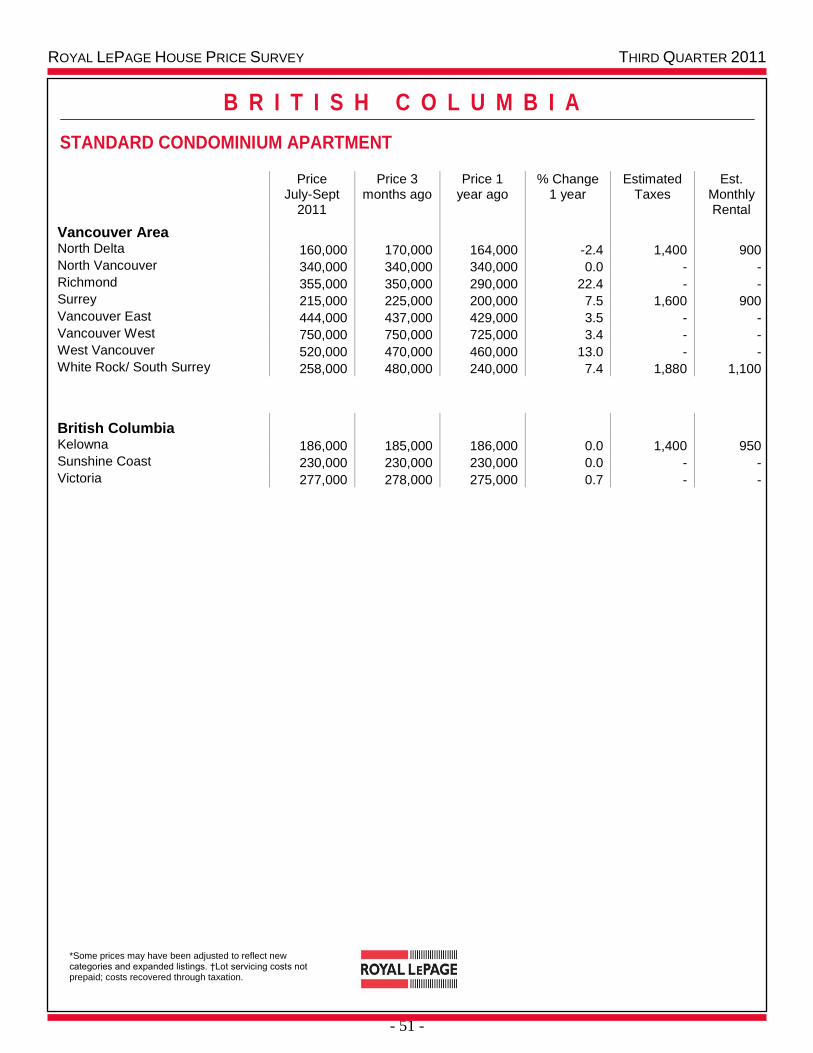
STANDARD CONDOMINIUM APARTMENT
Price July-Sept
2011
Price 3 months ago
Price 1 year ago
% Change 1 year
Estimated Taxes
Est. Monthly Rental
Vancouver Area
North Delta 160,000 170,000 164,000 -2.4 1,400 900 North Vancouver 340,000 340,000 340,000 0.0 - - Richmond 355,000 350,000 290,000 22.4 - - Surrey 215,000 225,000 200,000 7.5 1,600 900 Vancouver East 444,000 437,000 429,000 3.5 - - Vancouver West 750,000 750,000 725,000 3.4 - - West Vancouver 520,000 470,000 460,000 13.0 - - White Rock/ South Surrey 258,000 480,000 240,000 7.4 1,880 1,100
British Columbia
Kelowna 186,000 185,000 186,000 0.0 1,400 950 Sunshine Coast 230,000 230,000 230,000 0.0 - - Victoria 277,000 278,000 275,000 0.7 - -
ROYAL LEPAGE HOUSE PRICE SURVEY THIRD QUARTER 2011
- 52 -
*Some prices may have been adjusted to reflect new categories and expanded listings. †Lot servicing costs not prepaid; costs recovered through taxation.
B R I T I S H C O L U M B I A
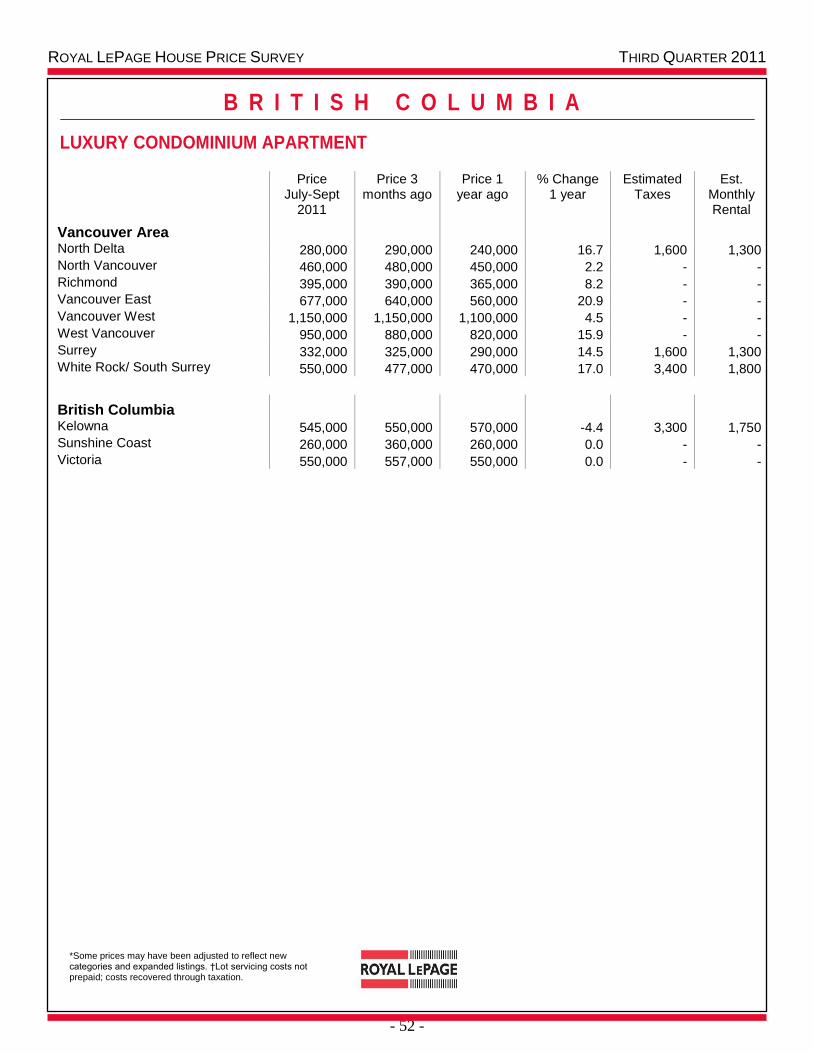
LUXURY CONDOMINIUM APARTMENT
Price July-Sept
2011
Price 3 months ago
Price 1 year ago
% Change 1 year
Estimated Taxes
Est. Monthly Rental
Vancouver Area
North Delta 280,000 290,000 240,000 16.7 1,600 1,300 North Vancouver 460,000 480,000 450,000 2.2 - - Richmond 395,000 390,000 365,000 8.2 - - Vancouver East 677,000 640,000 560,000 20.9 - - Vancouver West 1,150,000 1,150,000 1,100,000 4.5 - - West Vancouver 950,000 880,000 820,000 15.9 - - Surrey 332,000 325,000 290,000 14.5 1,600 1,300 White Rock/ South Surrey 550,000 477,000 470,000 17.0 3,400 1,800
British Columbia
Kelowna 545,000 550,000 570,000 -4.4 3,300 1,750 Sunshine Coast 260,000 360,000 260,000 0.0 - - Victoria 550,000 557,000 550,000 0.0 - -