Embed Size (px)
Citation preview

Phys. Chem. Earth, Vol. 23, No. 9-10, pp. 1053-1068, 1998© 1998 Elsevier Science Ltd
All rights reserved0079-1946/98/$-see front matter
PIL: S0079-1946(98)00145-1
Observations of the Earth's Topography from the Shuttle Laser Altimeter(SLA): Laser-pulse Echo-recovery Measurements of Terrestrial Surfaces
J. Garvinl, J. Buftonl, J. Blairl, D. Harding', S. Luthcke2 , J. Frawley2 and D. Rowlandsl
'Laboratory for Terrestrial Physics, NASA Goddard Space Flight Center (GSFC), Greenbelt, MD 20771, U.S.A.2 Raytheon STX at NASA GSFC
Received 25 October 1997; accepted 24 April 1998
Abstract. Meter-precision topographic measurements of adiverse suite of terrestrial surfaces have been accomplishedfrom Earth orbit using the Shuttle Laser Altimeter (SLA)instrument flown aboard the Space Shuttle Endeavour inJanuary of 1996. Over three million laser pulses weredirected at the Earth by the SLA system during its - 80hours of nadir-pointing operation at an orbital altitude of305 km (+/- 10 km). Approximately 90% of these pulsesresulted in valid range measurements to ocean, land, andcloud features. Of those which were fired at land targets,57% resulted in valid surface ranges, the remainder beingcloud tops, false alarms, or missed shots. The SLAincorporated an electronic echo-recovery system into apulsed, time-of-flight laser altimeter instrument in order tocapture and characterize the vertical structure within each100 m diameter surface footprint. The echoes recorded bySLA demonstrate aspects of the vertical structure of thenearly ubiquitous vegetation cover on the planet, as well assensitivity to local slopes, surface reflectivity, and verticalruggedness. With a vertical resolution of 0.75 m andhorizontal sampling at 0.7 km length scales, SLA provides anew form of high vertical accuracy topographic data forstudying problems related to the dynamics of the Earth's
Correspondence to:
Dr. J. B. GarvinCode 921, Geodynamics, Bldg. 22, Room 132NASA Goddard Space Flight CenterGreenbelt, MD 20771 USATEL: 301-286-6565FAX: 301-286-1616Email: [email protected]
surface. Assessment of the error budget associated with theSLA experiment suggests that -2.8 m (RMS) precision wasachieved for ranging measurements to oceanic surfaces, forwhich there are over 700,000 examples. With theavailability of a precision radial orbit and post-flightShuttleattitude information, a mid-latitude (+ 28.50 to-28.5°), georeferenced database of topographic groundcontrol point elevations has been achieved using SLA data,consisting of - 344,000 land measurements. Each of thesemeasurements is geolocated to within 1-2 SLA footprints(100-200 m) on the Earth's surface, with vertical errors thatapproach the limits of resolution (0.75 m) of the instrumentin topographically benign regions. When compared toavailable Digital Elevation Models (DEM's) with statedvertical accuracies on the order of 10-16 m, SLA'smeasurements differ by no more than 11 m to 46 m RMS inrugged terrain. We have computed a total verticalroughness parameter for all multi-peaked SLA echoes usinga multi-Gaussian decomposition technique and haveobserved a very high degree of correlation of this parameterwith global landcover classes. In some cases (-6%), SLAechoes clearly resolve both the ground surface andvegetation canopy within a single footprint, suggesting thatthe modal height of equatorial vegetation is - 18 m. Theglobal distribution of total vertical roughness varies from -5 m to 60 m, with a mean value of 27 m and a standarddeviation of 12 m. SLA successfully served as a pathfinderfor high vertical resolution orbital topographic remotesensing instrumentation, and demonstrated the first highresolution echo-recovery laser altimeter observations overland surfaces.
C 1998 Elsevier Science Ltd. All rights reserved.
1053
(r Pergamon

J. Garvin et al.: Observations of the Earth's Topography from Shuttle Laser Altimeter
1. Introduction
Direct measurements of the topography and verticalstructure of the surface of the Earth from a spaceborneperspective are in their infancy, and to date, only limitedreal-aperture radar altimeter (RAR) instruments (Zwally etal., 1983; Bindschadler et al., 1989; Wingham et al., 1994)have acquired observations over both land and oceansurfaces. More traditional stereogrammetric methods(Burke and Dixon, 1988; Harding et al., 1994a), as well asinterferometric synthetic aperture radar (ISAR) techniques(Evans et al., 1992; Zebker et al., 1992; Madsen et al.,1993; Zebker et al., 1994), can produce digital elevationmodel (DEM) datasets using pairs of spaceborne images,but such approaches require independent, ground controlpoint information to produce reliable results at verticalaccuracies of 10 m or better. One of the emerging scientificthemes in global Earth System Science involvesmeasurement of seasonal to interannual Earth surfacechanges, and hence requires an initial reference frameworkor baseline; the Earth's land, ocean and ice topography is anoften-mentioned example (Burke and Dixon, 1988;TOPSAT Working Group, 1994). Thus, directmeasurement of global topography in a suitable Earthcenter-of-mass reference frame and with appropriatevertical accuracy and horizontal sampling has been afrustratingly unattainable objective for many problemswithin the context of the U. S. Global Change ResearchProgram (USGCRP). Laser-based (i.e., active optical)techniques have been under development that offercomplementary capabilities to microwave-based approachessuch as ISAR and RAR. This article addresses the firstEarth orbital application of laser technology for the purposeof high precision land topography remote sensing.
There exists a subset of scientific problems in globalEarth Systems Science that require extremely high verticalaccuracy topographic data, as well as sensitivity to thedistribution of vertical structure within each measurementfootprint on the Earth's surface. For example, in areas ofextremely mundane relief, such as is found in many coastalregions, remote sensing measurements of meter-levelsubtleties of local relief at kilometer length scales areneeded in order to assess patterns and rates of erosion oraccretion. Existing knowledge of the 1-10 km scaletopography of many of the Earth's largest river deltasystems, for example, is limited to 100 m vertical precisiondatasets derived from stereogrammetric contour maps(Coleman and Wright, 1975; Wright, 1985; Coleman et al.,1989). In the so-called featureless regions of the greatdeserts of the Earth, local relief may vary by only a few tensof meters across 100's of kilometers, and measurement ofthe time-varying nature of this ephemeral relief is importantin the context of global models of climate change and fordesertification studies (Lancaster, 1995). The existingglobal database of land topography, however, is known tobe woefully inadequate for studies of many coastal anddesert regions (Loughridge, 1986; Burke and Dixon, 1988).
Other issues associated with topographic remote sensingof terrestrial surfaces concern observations of the ground
topography in the presence of vegetation cover. Aside fromthe hyperarid deserts and a narrow strip of coastallandforms, most of the land surface of Earth (i.e., - 85%) iscovered with some form of vegetation, ranging fromcontinuous grass cover to nearly closed canopy woodyplants (i.e., trees) (Harding et al., 1994a). How to measurethe ground topography under the trees remains afundamental problem, especially if the objective is toaccomplish such measurements from a spaceborneperspective (Burke and Dixon, 1988). While ISARmethods show great promise for high spatial resolutiontopographic mapping of the Earth's land surfaces (Evans etal., 1992; Mouginis-Mark and Garbeil, 1993), it remainsunclear how well ISAR measurements can provide reliabletopographic data for sub-canopy ground surfaces. This isbecause microwave penetration of vegetation canopies isdependent upon the water content of the canopy materialsand may vary as a function of location and biome (Evans etal., 1992; Zebker et al., 1992; Madsen et al., 1993; Zebkeret al., 1994). Many regions with active or potentially activevolcanoes would benefit from topographic observations ofthe highly vegetated unstable flanks of these dynamicedifices, yet most existing topographic maps for suchfeatures display large vertical uncertainties in regions withextensive vegetation (Mouginis-Mark and Garbeil, 1993;Garvin, 1996). In addition, measurement of the relativerelief of the vegetation cover offers the means to address animportant problem (i.e. landscape aerodynamic roughness),especially as it relates to global climate models and short-term climate variability (Harding et al., 1994b; Blair et al.,1994). Direct assessment of vegetation heights from aspaceborne perspective would facilitate improved modelpredictions of global ecosystems behavior and biomass.
Finally, direct observation of the relative and absoluterelief of the most rugged mountainous regions of the planet,including the Himalayan frontal ranges and the high Andes,are important goals in the context of geomorphologicalstudies of Earth. The human inaccessibility of such placesmakes precision observations of their quantitative reliefcharacteristics difficult to attain, and snow and ice coveroften make traditional stereogrammetric methods subject tosignificant inaccuracies (Burke and Dixon, 1988; Hardinget al., 1994a). There are documented mountain systems inboth Africa and South America where the vertical precisionof the best available topographic data is on the order of1000 m, averaged on a - 10 km length scale (Burke andDixon, 1988). This is inadequate for any hydrologicstudies, and improved measurements are clearly needed(Burke and Dixon, 1988; TOPSAT Working Group, 1994).
Airborne laser altimeter sensors have been in operationsince the late 1980's for the purpose of scientific studies ofland and ice surfaces (Bufton, 1989; Bufton et al., 1991;Garvin, 1993; Blair et al., 1994; Krabill et al., 1995a;Krabill et al., 1995b; Garvin, 1996). Recent improvementsin airborne systems have culminated in a suite ofexperimental sensors, including relaively wide-swath echo-recovery instruments and low-altitude scanning lidar terrainmapping systems (Blair et al., 1994; Krabill et al., 1995a;Krabill et al., 1995b; Garvin, 1997). Routine airbornetopographic monitoring of volcanoes, ice sheets, glaciers,
1 054

J. Garvin et al. Observations of the Earth's Topography from Shuttle Laser Altimeter
coastal landforms, tectonized landscapes, ecosystems, andother phenomena is an ongoing element of NASA's Officeof Earth Science (OES) Program. Examples of results insome of these subdisciplines can be found in variouspublished articles, including those by Bufton (1989), Buftonet al., (1991), Garvin (1993; 1996; 1997), Harding et al.(1994a; 1994b), Blair et al. (1994), and Krabill et al.(1995a; 1995b). While airborne laser altimeter systemsoffer regional access to important scientific problems atextremely high spatial and vertical resolution, global accesswithin a common, Earth center-of-mass reference frame isrequired to address many critical Earth System Scienceproblems. Global sampling via orbital laser altimetry hasbeen achieved, for the first time, with the Shuttle LaserAltimeter.
2. Spaceborne laser altimetry
Laser altimeter instruments have operated in the spaceenvironment to a very limited extent before 1996. Simple,yet elegant ruby laser altimeter systems were flown aboardthe Apollo 15, 16, and 17 Command Service Modulespacecraft in lunar orbit in order to provide occassionalground control points from which to calibrate metric stereophotographs (Garvin, 1993; Zuber et al., 1994; Smith et al.,1997). These low pulse repetition rate devices recorded afew thousand measurements of the topography of the lunarsurface in a geodetic coordinate frame from which anassessment of the center of mass versus center of figureoffset was successfully performed.
Various Soviet Earth-orbiting spacecraft in the 1980'scarried limited light detection and ranging (lidar)instruments that made measurements of the range to theEarth's surface at modest pulse repetition rates (i.e., I Hz).The electronics associated with these spaceborne lidarinstruments were primarily designed to analyze atmosphericphenomena such as clouds and were not optimized for highpulse repetition rate ground ranging measurements(Matvienko et al., 1994; Balin et al., 1994; Matvienko et al.,1995). The U.S. Space Shuttle flight of the LITEexperiment in September of 1994 on STS-64 also provideda set of lidar observations from Earth orbit (Winker et al.,1996). The Laser-in Space Technology Experiment (LITE)was designed to measure atmospheric phenomena,including boundary layer aerosols and clouds, and inaddition, accomplished successful measurements toterrestrial ocean and land surfaces, albeit at low (>25 m)vertical resolution (Winker et al., 1996).
The U.S. Clementine spaceborne LIDAR experimentincluded a laser rangefinding sensor that successfullymeasured the distance to the lunar surface from ranges asgreat as 640 km during the 1994 lunar orbital phase of theClementine mission (Zuber et al., 1994). This compactdevice acquired measurements with 40 m vertical resolutiononce every 10-20 km along the nadir ground-track of thespacecraft. Data were acquired during a two month lunaroperational period in early 1994, and approximately 70,000"valid" topographic measurements were achieved, which
corresponds to a - 20% measurement success rate (Smith etal., 1997). In spite of this small instrument's extremesensitivity to the ruggedness of the lunar surface, thegeodetic quality of the observations, when available, hasprovided scientifically compelling information regardingthe longer wavelength (i.e., > 100 km) geophysics of theMoon (Zuber et al., 1994; Smith et al., 1997).
The Mars Observer Laser Altimeter (MOLA-1) sensorwas originally designed in 1988-1990, and launched toMars in late 1992 on the U. S. Mars Observer spacecraft.This instrument was intended for long-term, autonomousoperation in a deep-space environment, and incorporated allsolid-state laser transmitter technology with a receiverelectronics package capable of "tracking" the most rugged(at 100 m length scales) landscapes imaginable (Zuber etal., 1992). Although MOLA-I was lost in 1993 when theMars Observer spacecraft failed to regain radio contact withEarth after its orbital insertion manoever, the instrument hasbeen rebuilt (MOLA-2) with improved ranging resolution(i.e., < 0.5 m), and is presently in orbit around Mars as partof the U. S. Mars Global Surveyor mission. MOLA-2 willcommence its global topographic mapping of Mars in early1999, and is expected to produce a dataset consisting ofnearly one billion measurements during its nominal 687-daymission. Initial examples of MOLA-2 data acquired as partof calibration activities indicate sub-meter-quality rangingprecision (i.e., NASA Mars Global Surveyor PressConference, Oct. 1997 and (Zuber et al., 1992)).
The development of the MOLA-class laser altimetersensors served as a pathfinder for the Shuttle LaserAltimeter (SLA) in a variety of ways. SLA was able tocapitalize on the MOLA-I design and developmentexperience, to assemble a spaceworthy 10 Hz lasertransmitter out of MOLA-I spare components, and toembellish the original MOLA design by including awaveform analyzer and larger capacity flight data system(Bufton et al., 1996). By utilizing spare components fromthe MOLA-I sensor, the SLA instrument was developed atvery low cost. Furthermore, SLA was deployed as aHitchhiker experiment aboard an Earth-viewing SpaceShuttle flight in order to maintain a low cost interface to theShuttle while obtaining the required power, command, andtelemetry services.
3. Objectives
The underlying objectives of the SLA-01 experiment wereessentially two-fold: (1) to serve as an engineeringpathfinder for high-resolution orbital laser altimeterobservations of terrestrial surfaces; and (2) to providepathfinding scientific datasets of value in addressing globalEarth System science problems, and in particular thosepertaining to land cover dynamics in arid and coastal areas,as well as in heavily vegetated regions. To fulfill thescience and engineering objectives associated with the firstEarth orbital flight of a high vertical resolution laseraltimeter instrument, the core SLA sensor as derived fromMOLA-I spares was embellished to include a high
1 055
J. Garvin et al.: Observations of the Earth's Topography from Shuttle Laser Altimeter
Fig. 1. SLA Earth Surface Coverage Map (all ground tracks obtained).
temporal resolution echo recovery system in order todigitize the amplitude versus time history of eachbackscattered laser pulse (Zuber et al., 1994; Bufton et al.,1996).
The SLA instrument was successfully first flown in Earthorbit between 11 and 20 January, 1996 aboard the U. S.Space Shuttle Endeavour, as part of the STS-72 mission(Garvin et al., 1996a; 1996b). Approximately 82 hours ofdata were acquired in a nadir-viewing orientation from theEndeavour orbiter. Due to the orbit inclinationrequirements of the STS-72 mission, only that region of theEarth between 28.45° N and 28.45° S latitudes wasobserved with SLA. Hence, the initial SLA dataset isrestricted to mid-latitude studies of Earth surface (i.e., landand oceans) phenomena (Fig. 1).
As SLA was designed as a flexible, modular engineeringpathfinder for heretofore unattainable observations, thescientific objectives were intentionally specified in broadterms. Among the more important goals were for SLA todemonstrate a high pulse repetition rate (i.e., 10 Hz),adequate signal to noise laser altimeter system capable ofreliably ranging off of virtually all types of Earth surfacetargets and some varieties of optically opaque atmosphericphenomena (i.e., clouds). It has required nearly a year tocompletely calibrate and geolocate the majority of the - 3million observations recorded by the SLA sensor while inEarth orbit, and to assess their validity. Examination of thedata quality indicates robust ranging off of steepescarpments, tropical forest canopies, lava-covered summitsof major volcanoes, stony-pavement deserts, snow-clad6800 m mountains, and even complex urbanized surfaces(i.e., buildings in cities). A broad variety of cloud-topranges were also recorded, including those associated withoptically opaque features located less than 1000 m abovethe ocean surface.
The remainder of this article briefly describes the SLAinstrumentation, outlines the data acquired during the
January 1996 mission, and provides a series of examples tohighlight the preliminary scientific findings of thisexperiment.
4. Laser altimeter techniques
The SLA instrument essentially consists of three majorcomponents: (1) an all-solid-state, diode pumped, Q-switched, Nd:YAG laser transmitter capable ofcontinuously operating at up to 10 pulses per second; (2) analtimeter receiver electronics package in which the round-trip travel time of each individual laser pulse is measured at5 nsec resolution using a time-interval unit (TIU): (3) a 250Megasample/sec waveform recorder which digitizes eachreceived pulse into a record of one hundred 8-bit samples,and a Cassegrain telescope 38 cm in diameter with a SiliconAvalanche Photo-Diode (Si APD) detector at the primefocus. A 386SX flight computer and associated datastorage media are also essential sub-systems, as were powerinversion electronics and temperature sensors. All ofSLA'sdata was recorded directly on one of two 270Megabyte hard disk drives, and during specific periods ofhigh bandwidth communications with the Space ShuttleEndeavour from Earth using Ku-band links, data weretransmitted to the SLA Payload Operations Control Centerat NASA's Goddard Space Flight Center. Approximately20% of the total SLA dataset was transmitted in real-time tothe Earth for analysis by the engineering and science teamsduring the flight mission.
SLA was configured in two Hitchhiker Canistersarranged side-by-side on a bridge assembly that wasmounted across the aft part of the Shuttle Orbiter cargo bay.This arrangement allowed the SLA sensor to be operated asa Hitchhiker experiment. Further details of the SLAconfiguration can be found in Bufton et al. (Bufton et al.,1996). Under command from the flight computer, the laser
1 056

J. Garvin et al.: Observations of the Earth's Topography from Shuttle Laser Altimeter
transmitter is instructed to emit a short - 8 nsec full-widthat half maximum (FWHM) pulse of 1064 nm radiation atthe Earth's surface whose divergence (0.35 mrad)corresponds to a surface footprint of - 100 m from a 300km orbital altitude. As the laser pulse is transmitted, a"start" pulse is generated which activates a high temporalresolution digital counter whose least significant bit of 5 nsduration corresponds to 0.75 m in range. The laser pulseintercepts either the Earth's surface or is backscattered by acloud, causing a number of photons to be scattered back tothe SLA telescope in the Space Shuttle where they arefocused by the telescope's primary mirror onto the SiliconAvalanche PhotoDiode (Si APD) detector. If thebackscattered signal is above the noise threshold, itgenerates a "stop" pulse to interrupt the digital counter andrecord the round trip travel time in discrete units of 5 ns. Inthe meantime, the successful detection of a backscatteredpulse also starts the 250 Megasample per second waveformdigitizer, which proceeds to record 100 discrete channels ofpulse amplitude data as an electronic version of the echoreceived, with a total dynamic range of 60m. The digitizedecho, together with the TIU round-trip travel time and timeepoch information are then recorded by the flight computeron one of the ruggedized, internal hard disk drives.Operator control of the 37 parameters that can influencedetection of valid ranges with the SLA instrument ispossible during those times when low-rate radiocommunication (S-band) with the Shuttle Orbiter isenabled. The range gate delay and width can be set by twoof these parameter update commands. For most of the SLAobservation periods, the range gate width was set at 40 km.This was selected in order to account for the typically 10km variations in the radial orbit of the Shuttle (i.e., - 300 to310 km) in combination with the greatest relief relative tomean sea-level observed on Earth (8.85 km at MountEverest), while rejecting noise outside of this interval.
Ancillary data pertaining to the position and attitude ofthe Space Shuttle Endeavour is essential if one is toaccurately geolocate SLA's observations on the surface ofthe Earth and in the proper center-of-mass coordinateframe. Radial orbit data and roll, pitch, and yaw angles areavailable in the Shuttle telemetry stream and from othersources, and we have computed precision orbits andpointing angle corrections to facilitate highly accuratesurface geolocation of the majority of SLA footprints.During part of the SLA observation sequence, theEndeavour orbiter was flown so as to maintain a nadir-orientation to within +/- 0.1° per axis (i.e., a 0.10 pointingcontrol deadband). Even with this level of pointing control,a 0.1° offset in the pointing of SLA results in - 700 m ofpositional offset on the surface of the Earth relative to thenadir ground-track of the Shuttle. Most SLA data wereacquired with a +/- 1.00 per axis pointing control deadband,which produces up to - 7 km of surface offset. Thesesurface offsets are not uncertainties and have beenaccounted for using Shuttle-provided measurements of 3-axis attitude which have a stated precision of 0.03°. Thevertical precision of the SLA surface elevation data is 1 - 10m as a function of local slopes and landcover verticalstructure, with a typical horizontal sampling interval of -
700 m, which is determined on the basis of the spacecraftplatform orbital velocity (-7 km/s) and pulse repetition rateof the laser transmitter (10 Hz). The quality of thepreliminary radial orbit for the Shuttle is on the order of Ikm spatially and - 0. I km in a vertical sense (Rowlands etal., 1997). Precision orbit determination using GPS andTOPEX-TDRS-Shuttle tracking information has achieved -1.5 m vertical (radial) orbits and < 150 m horizontalpositioning (Rowlands et al., 1997).
The value of high-resolution altimetric data is only asgood as the definition of the reference frame in which it ismeasured. For satellite altimetry in general, the positionand orientation of the satellite platform (i.e., the SpaceShuttle Endeavour in this case) provides the basis for thereference frame. The nominal post-flight Shuttle orbitaccuracies are at the 90 m level (radially) and henceoverwhelm the error budget for the SLA instrument.Therefore, an alternative orbit and attitude determinationtechnique has been employed.
The Tracking and Data Relay Satellite System (TDRSS)is the primary tracking data source for the Shuttle and iswhat we used for operational orbit determination. Despitethe quality of the two-way range and range-rate trackingdata between the Shuttle Orbiter and TDRSS, knowledge ofthe position of the TDRS spacecraft is limited to 30-50 mand is thus the dominant error source for Shuttle orbitdetermination. This deficiency can be overcome byexploiting the independent and precise knowledge of theTOPEX/POSEIDON (T/P) satellite trajectory, as outlinedby Marshall et al. (1995a; 1995b) and Rowlands et al.(1995). T/P is a joint U.S.-French satellite which employs areal aperture radar altimeter (RAR) to investigate theEarth's ocean topography (Wingham et al., 1994). A wealthof Satellite Laser Ranging (SLR) and Doppler Orbitographyand Radio Positioning Integrated by Satellite (DORIS)tracking data, coupled with enhanced spacecraft modeling,yield TIP radial orbit errors of less than 3 cm root meansquare (RMS), and less than 10 cm in total position(Marshall et al., 1995a; 1995b; Rowlands et al., 1995). T/Pis also tracked using TDRSS. Therefore, the TIP trajectory,independently determined from SLR and DORIS data, canbe used as a roving ground station for TDRS spacecraftorbit determination. This technique reduces the total TDRSorbit errors to less than 5 m.
The TDRS ephemeris can thus be held fixed and, inconjunction with enhanced spacecraft modeling techniques,the Shuttle's position can be computed. Simultaneously,measured quaternions from the Shuttle's star trackers (i.e.,attitude information) can be ingested into the GoddardSpace Flight Center's state-of-the-art orbit determinationsystem, known as GEODYN (Marshall et al., 1995a; 1995b;Rowlands et al., 1995), to properly orient the Shuttle, andhence the SLA sensor. Given the precise knowledge ofSLA's position and pointing that can be derived using themethod just described (i.e. to better than 0.030 in all 3 axes),the ranging measurements from SLA can be reduced toyield a latitude, longitude, and the derived height of thealtimeter's "bounce point" with an accuracy commensuratewith the instrument's intrinsic vertical resolution (- I n).The error budget associated with this geolocation process is
1057

J. Garvin et al.: Observations of the Earth's Topography from Shuttle Laser Altimeter
summarized in Table 1. As the SLA-01 data is furtheranalyzed and processing techniques are refined, the errorslisted in Table 1 can be expected to decrease. It is
Table 1. Preliminary Error Budget for SLAError Source Radial Error (m)
OrbitAttitudeAltimeter bias
<1.5<3.0-0.2
Horizontal Error at theSurface (m)<5< SLA footprint< .5
instructive, however, to observe that even preliminary SLAaltimetric data provide better than 2 m accuracies, which isof higher quality than all but the most local-scaletopographic maps presently available (Loughridge, 1986;Madsen et al., 1993). Figure 2 graphically illustrates thevertical error budget of the SLA instrument by comparingall ocean surface observations to a Mean Sea Surface oceantopographic model, corrected for Ocean Tides, derived fromTopex/Poseidon measurements. The RMS levels ofdisagreement of - 2.8 m can be explained by a combinationof residual pointing errors, sea surface wave structure, andother biases not accounted for in the analysis of SLA datathus far. What is important to note, however, is that 2.8 mRMS quality topographic data can also be obtained by SLAover land targets.
SSB95+Otides - SLA Ht.SLA-01 All Obs. Periods, SDP V2
14 ' =
12- "a
la -
ei 8 _G1
ST!RM
IBS. . 727886AN =0.26 m
D. DEV. * 2.78 miIS . 2.79 m
6 �
4
2 �I
a-15 -13 -10 .7.5 -5 -2.5 0 2.5 5 7.5 10 12. 1is
METERS
Fig. 2. Statistical comparison of SLA ranges to ocean surfaces withTOPEX-based Mean Sea Surface ocean topography corrected for oceantides. Sea state effects have not been removed and are thus reflected in the2.8 m RMS value.
5. SLA measurements and interpretations
During its almost 82 hours of operation during the January1996 STS-72 Space Shuttle mission, the SLA instrumentacquired - 3 million observations of the Earth's land, ocean,and cloud features. Robust ranging performance appears tobe dependent, in part, upon solar illumination. False alarmswere held at 1%, but the thresholds for triggering wereraised to their maximum values by daytime solar reflectionfrom clouds and thus some ranging data were lost. Late inthe SLA observation sequence, for example, over 60% ofthe over land measurements made by the altimeter in atransect across South America resulted in a failure toachieve adequate detection signal-to-noise statistics (i.e.,
zero range indication). Such high levels of backgroundwere infrequently encountered, however, with the exceptionof localized, highly-vegetated portions of South America,central Africa, and Indonesia.
Data analysis of the 7 flight days of SLA operations (11operational periods largely during crew sleep and restperiods) is complete and has required accurate (i.e., msec)time-merging of the SLA data stream with ancillarypointing and radial orbit information provided by NASA'sJohnson Space Center Mission Evaluation Work Station orMEWS system. This has permitted us to georeference allSLA observations and to organize data acquisitions both bymission elapsed time (or UTC) and geographical position.Figure I illustrates the total ground-track coverage achievedduring the STS-72 mission. Cloud-free land or ocean(water) surface measurements were obtained for -54% ofthe Earth in the mid-latitudes. On the other hand, rangesapparently associated with discrete cloud featuresaccounted for - 40% of the SLA observations, leaving -
5% to be explained by false alarms or missed pulses. Fortypical transcontinental transects in regions such as Africa,Asia, or Australia, as high as 95% of the attempted SLAobservations resulted in reliable surface measurements, withthe remaining few percent apparently associated withdiscrete cloud features. Cloud path lengths in suchcontinental regions are typically less than I km, with cloud-to-cloud spacings of - 20 km. Thus, under favorableconditions, SLA achieved sub-kilometer horizontalsampling of the topography of continental-scale regions upto 5000 km in extent.
We have examined the preliminary ocean, land, andcloud coverage attained by SLA. Over 16.5% of the validSLA observations (i.e., - 475,000) consist of land surfacereturns, while - 38% (i.e., - 1.1 million) represent oceansurface measurements. Figure 3 illustrates the distributionof surface and cloud-top returns achieved by SLA. Wehave separated the distribution of observed cloud-topheights into those measured over oceans versus thoseencountered over land surface targets. This allows us toaddress the vertical distribution of detectable cloud tops as afunction of underlying surface topography. Statistically,cloud tops located 2.5 km above mean sea level occur morefrequently over continental land masses than over oceans.Indeed, we have observed that cloud tops between 2.5 kmand 7 km are two to four times more common over landthan over oceans. However, cloud tops above about 7.5 kmappear equally frequent over continental and ocean targets.Orographic effects appear to have influenced the cloud topheights over land surfaces, at least in terms of those types ofclouds for which SLA reliably achieves valid ranges.
When SLA's - 344,000 precisely georeferenced landsurface elevations are compared against the available globalEarth Digital Elevation Models (DEM's), there is generallygood agreement, although discrepancies are especiallynoticeable in areas with less than 100 m of relief. Thedistribution of ocean surface elevations achieved by SLAare cast in an ellipsoidal reference frame, so that - 100. m ofrelief variability observed in Fig. 3 is caused byvariations in the geoid. Indeed, when SLA's oceansurface observations are compared against mean sea surface
1058
aIF

J. Garvin et al.: Observations of the Earth's Topography from Shuttle Laser Altimeter
Fig. 3. Histograms of SLA measurementsof land surface topography (top), cloud topheights over land, cloud top heights overoceans, and ocean surface elevations(bottom). All histograms are plotted infrequency (solid) and cumulative (dashed)formats.
models, corrected for tidal variations, as derived from thelatest Topex/Poseidon measurements, RMS differences lessthan 2.8 m are observed (Fig. 2), with the suggestion thatoverall differences can be reduced to - 1.5 m with morerefined processing of the SLA data.
Topographic studies of terrestrial land surfaces naturallyfall into categories associated with important surfacesprocesses, including tectonism, erosion, volcanism,anthropogenic influences, ecosystems, and so-called"extremal events" or natural hazards. Furthermore, sincealmost all of the landscapes on Earth display some forms ofvegetation, the dynamics of the vegetation cover associatedwith various classes of landscapes must also be considered.Thus, SLA's most direct contribution to studies of theglobal Earth system fall within the subdiscipline oftenreferred to as "land cover" and its dynamics.
6. Observations of a Hawaiian volcano
In order to illustrate how the SLA system acquired some ofits initial data (13 January 1996), an example is provided inFig. 4. In this case, an SLA transect across the island ofHawaii is featured. The segment of data that is plotted isfrom the first orbit during which SLA was activated, and itextends from WNW to ESE across an expanse of the centralPacific Ocean, during which fortuitously the ShuttleEndeavour's ground track passed over the near-summitregion of a 4000 m composite shield volcano known asMauna Kea, on the island of Hawaii. The cloud-free natureof the topography of the north-central island of Hawaii is
evident in the data, as Mauna Kea looms as a 4000 m highfeature in the SLA elevation dataset. Parasitic cinder coneson the WNW flank of this important volcano are observed(Fig. 4), as well as the classic break in slope thatdiscriminates the lower shield (plinth) from the alkalic andmore-explosive summit region. If one applies the methodsdescribed in Garvin (1996) to mathematically characterizethe topology of Mauna Kea as measured by SLA, incontrast to that which would be modelled from a 90 mspatial resolution DEM (top of Fig. 4), there is agreement atthe 10% level for the volume and surface area of the upper2000 m of the edifice. Ranging reliability was nominal forthe entire Mauna Kea transect. Figure 4 further illustratesthe results of comparing preliminary SLA topographic datawith a 90 m spatial resolution digital elevation model(DEM) for the Mauna Kea volcano (Moore and Mark,1992).
After suitable correction of pointing errors associatedwith the apparent roll of the Shuttle Orbiter, a total errorbudget of 13 m RMS is computed. This cumulative error ismostly likely a consequence of the - 16 m intrinsic verticalprecision of the reference DEM, in combination with theeffects of vegetation cover on the eastern flank of theMauna Kea volcano. Further corrections for the pointingof the Shuttle Orbiter on the basis of analyses of oceanranging biases can be shown to reduce these errors to 11.5m RMS. These results, however, suggest that the SLAsensor is capable of -10 m class precision topographicmeasurements from a spaceborne perspective, even forcomplex, rugged targets such as a 4000 m volcanic edifice.Even before complete calibration by means of echoanalysis, this simple example demonstrates that extremely
1 059
ElevaUio (m)

J. Garvin et al.: Observations of the Earth's Topography from Shuttle Laser Altimeter
high vertical precision topographic observations arepossible with SLA data.
19.0
5000
4000
3000
2000-100
1 000
SLA Sub-orbital track - Mauna Kea
Bose trac'k
A _ - Shift.d t-k.
I..at___.'..',.I .1
-150 --15504 -155. 2-155 -0t-154i8
Lo ngi u rdt
SLA Elevation along sub -orbital track
0 20 40DiAetce (km)
SLA-DTED mean delta=- 000006m rms delta- 13 2m4 40
5 20Z _20 ___ ___ _ _
0 20 40longitude
n0 80
Fig. 4. SLA transect across Mauna Kea volcano illustrating its position ona shaded relief map of the island of Hawaii and the SLA transect achievedbelow. A total RMS difference between SLA's measurements and thosefrom a 90 m spatial resolution DEM of - 13 m is observed, before finalcorrections for Shuttle attitude, which bring the RMS difference down to11.5 m.
total relief. Given that SLA's surface footprint is 100 m indiameter and that the horizontal separation of its surfaceobservations is - 700 m, the frequent detection of theapparent canopy tops of deltaic vegetation, provides newinformation on the spatial structure of vegetated deltaicplains in this region.
As can be observed in Fig. 5, the total dynamic range ofground elevations across the central portion of theIrrawaddy delta is < 20 m, with superimposed trees andhills between 7 m and 30 m in effective height as primaryland cover. In the event of the typical surges of watertriggered by tropical depressions in this region, a 3-4 m risein the water level would essentially flood all of theunvegetated terrain within the entire delta, were it not forthe vegetation. SLA recorded analogous information forother major coastal deltaic plains, including the Mekong,Indus, Ganges-Brahmaputra, and Senegal. In the distalportion of the Ganges delta , the dynamic range of groundrelief is - 3 m across a 130 km wide expanse, with 6 - 20 mtall trees superimposed in isolated places, as in the Mekong.For the more arid Indus deltaic plain, the total dynamicrange of observed topography is only 2-4 m, with noevidence of any superimposed arboreal vegetation. Therelief observed by SLA for the wave-dominated Senegaldelta in West Africa is similar to that measured for theIndus, perhaps on the basis of its aridity. Vegetated, humid
SLA Sub-orbital ti
i . 1 .
90 92 94 9g 9s
7. Observations of coastal deltasLongikude
SLA Elevation along sub-orbital track
SLA observations of coastal deltaic plains have alsocontributed new observations of the often mundane reliefproperties of these important landscapes. Figure 5 illustratesan SLA transect across the Irrawaddy deltaic plain ofBurma. In this figure, the best available DEM for theregion is shown in terms of shaded relief, with the SLAground-track superimposed, and the SLA topographiccross-section is depicted as a profile of relief relative tomean sea level. In this case, the 7 to 35 m dynamic rangeof relative relief across a - 200 km wide region is evidentfrom the SLA profile, while the I km DEM suggests afeatureless plain. In the region between 94.50 E and 96.7°E longitude, the SLA ranging data suggest the intermittentdetection of 7 to 30 m tall hills with superimposed trees,separated by essentially flat regions with less than 10 m of
200
100 _I .
I
940 946 95.0 965 96.0 995Longitud.
Fig. 5. SLA transect across Irrawaddy Delta showing ground track onshaded relief image and SLA topographic profile data below. Note thesmall amount of relief (< 30 m) between 94.50 and 96.8° E longitude.
.. SL&rall 0 1 degree
Ha-\ Righ[ wing up
I/
1060
zoo0
3
I 9
18Vi
'Z.1
17
18
I
t,w
ao
100
80
60
40
20
0
0 5 10 15 20Elevation (m)
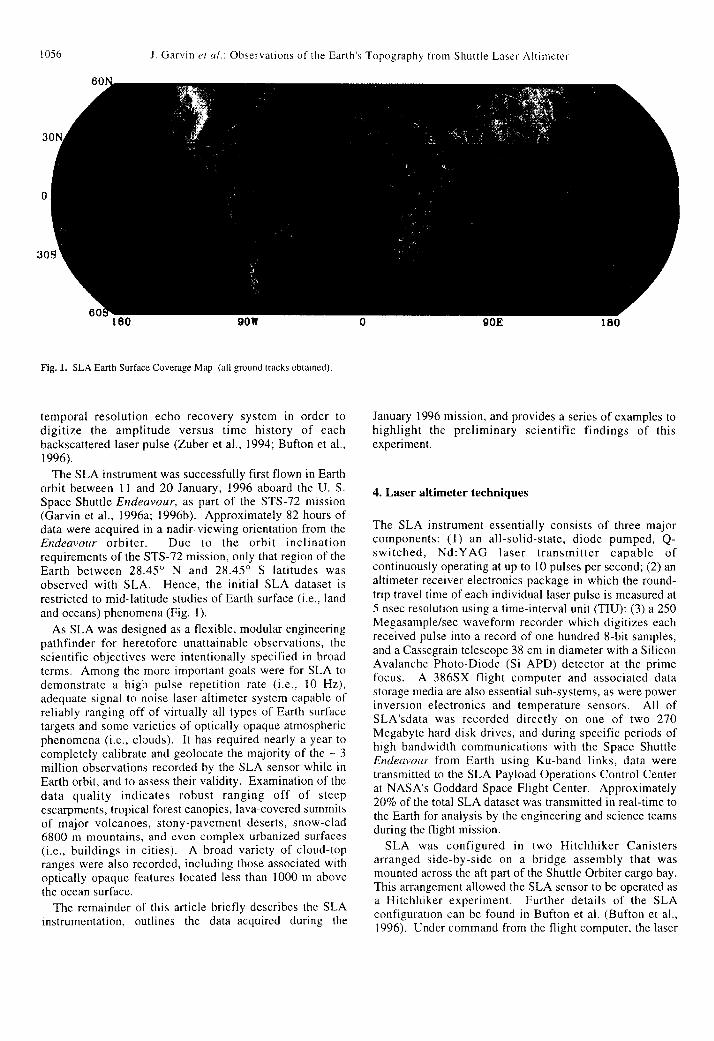
deltas such as the Ganges, Irrawaddy, and Mekong displaydistinctive cumulative distributions relative to arid deltassuch as the Indus and Senegal. Over 90% of the local reliefin the Indus and Senegal coastal deltaic plains is within 5 mof local sea level (Fig. 6). Storm-surge flooding of thesearid deltas would thus be expected to completely inundatethe deltaic surfaces, perhaps on an annual basis. Detectingand measuring the local heights of vegetation in coastaldeltaic regions can be accomplished by context because ofthe extraordinarily benign local ground relief. Trees 9 to 20m in relief are inferred from the SLA transects in theGanges-Brahmaputra region, and such values agree with thebest available published estimates (Coleman et al., 1989).However, direct detection of trees within individual SLAfootprints by means of echo analysis can also be used toinfer vegetation vertical structure under certaincircumstances.
8. SLA echo analysis: background
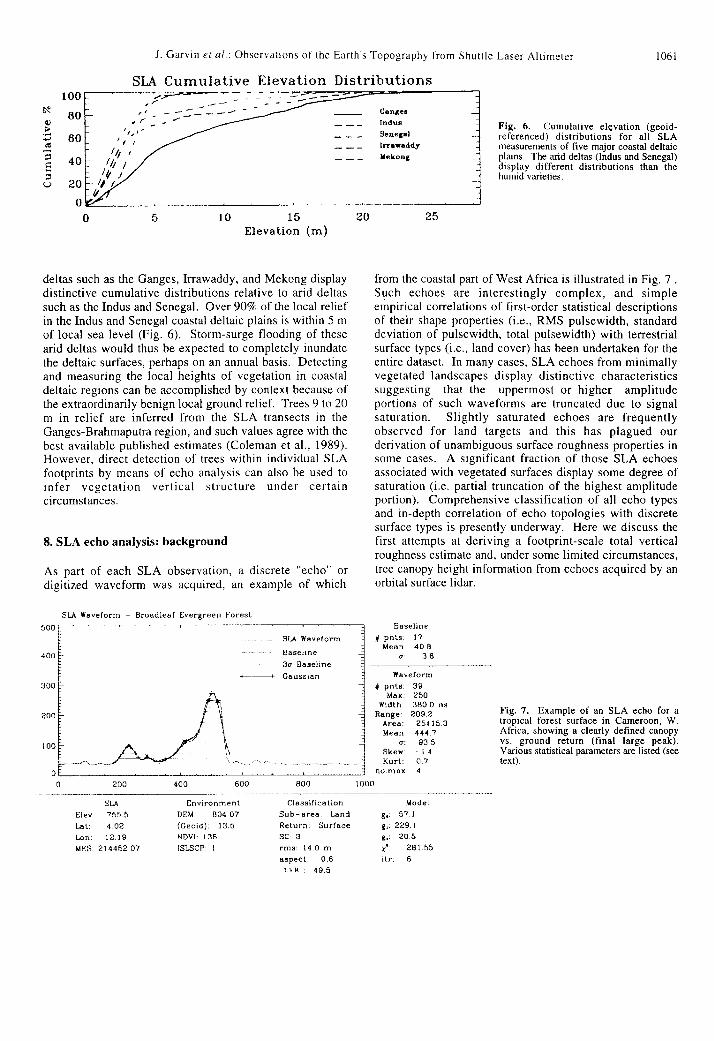
As part of each SLA observation, a discrete "echo" ordigitized waveform was acquired, an example of which
SLA Waveform - Broadleaf Evergreen ForesL500 ,
SLA Waveform
400- -------- Baseline3u Baseline
-.-+ ---- Gaussian300
200
100
ar
1061
nau Fig. 6. Cumulative elevation (geoid-Senegal _ referenced) distributions for all SLAtrrasaddy measurements of five major coastal deltaicMekong _ plains. The arid deltas (Indus and Senegal)
display different distributions than thehumid varieties.
25
from the coastal part of West Africa is illustrated in Fig. 7 .Such echoes are interestingly complex, and simpleempirical correlations of first-order statistical descriptionsof their shape properties (i.e., RMS pulsewidth, standarddeviation of pulsewidth, total pulsewidth) with terrestrialsurface types (i.e., land cover) has been undertaken for theentire dataset. In many cases, SLA echoes from minimallyvegetated landscapes display distinctive characteristicssuggesting that the uppermost or higher amplitudeportions of such waveforms are truncated due to signalsaturation. Slightly saturated echoes are frequentlyobserved for land targets and this has plagued ourderivation of unambiguous surface roughness properties insome cases. A significant fraction of those SLA echoesassociated with vegetated surfaces display some degree ofsaturation (i.e. partial truncation of the highest amplitudeportion). Comprehensive classification of all echo typesand in-depth correlation of echo topologies with discretesurface types is presently underway. Here we discuss thefirst attempts at deriving a footprint-scale total verticalroughness estimate and, under some limited circumstances,tree canopy height information from echoes acquired by anorbital surface lidar.
Baseline# pnts 17
Mean 40.8a 3.6
Waveform# pnts. 39
Max: 250Width: 380 0 ns
Range: 209 2Area: 25415.3Mean 444.7
a: 93 5Skew: - 1 4Kurt 0.7
no max: 4
Fig. 7. Example of an SLA echo for atropical forest surface in Cameroon, W.Africa, showing a clearly defined canopyvs. ground return (final large peak).Various statistical parameters are listed (seetext).
0 200 400 600 800 1000
SLA
Elev 755.5Lat: 4.02Lon 12.19MES: 214452.07
EnvironmentDEM: B04 07(Oeoid): 13.5NDVI: 1536
ISLSCP I
ClassificationSub-area LandReturn: SurfaceSC 3rms: 14.0 maspect: 0.6
TV R 49.5
Modelg.: 57.1
g,: 229.1g.: 20.5X 281 55itr: 6
J. Garvin et at.: Observations of the Earth's Topography from Shuttle Laser Altimeter
SLA Cumulative Elevation Distributions
innges
I _ _ -- - = _
I, == _ - L_, r _ - -
It I
Go
_ _ _.

J. Garvin et al.: Observations of the Earth's Topography from Shuttle Laser Altimeter
For unvegetated, desert surfaces, SLA echoes vary fromimpulse-like, narrow-width varieties to highly dispersedtypes we believe to be associated with local topographicirregularities such as escarpments, gullies, yardangs, anddunes. Indeed, anywhere from 2 m to 60 m of effectivetotal pulse spreading can be observed within 100 mdiameter SLA footprints in unvegetated desert terrain.Complex, multi-modal echoes require special interpretation,but analysis of the total degree of pulse spreading, perhapsrelative to that which is observed over ocean targets,provides a first-order estimate of a total vertical surfaceroughness parameter. Thus, 50 m total vertical roughnessvalues, even within 100 m diameter surface footprints, arenot unknown even in topographically benign parts of NorthAfrica. The total vertical roughness is estimated on thebasis of a multi-Gaussian parameterization of the echo.Bare, unvegetated desert surfaces in North Africa displaytotal vertical roughnesses (5-15 m) that are sometimes littlemore than those most typical for ocean surfaces (i.e., - I -3 m). In contrast, however, are echoes acquired by SLA fortropical forest regions. In many such cases, a bimodal SLAecho is observed in which a strong, Gaussian ground returnis located nearly 100 ns (- 15 m in range) after initialdetection of a "surface" range (i.e., Fig. 7). This sort ofbimodal behaviour has been extensively observed in aircraftlaser altimeter datasets for forested surfaces (Harding et al.,1994b; Blair et al., 1994). Because SLA's footprints aresubstantially larger than the spatial scale of tree crowns, it ismost likely that these sorts of echoes, of which there aremany, provide a measurement of vegetation height for anassemblage of several trees in circumstances where thelocal ground slopes are less than a few degrees. From manyexamples where echoes are polymodal, it is possible to inferthe Effective Canopy assemblage Height (ECH), a specialform of total vertical roughness, as well as the vertical
a0 0 40Total Vertical Roughneaa (m)
roughness of the ground beneath the canopy. However,without detailed ancillary information, perhaps as can beprovided with 100 m or better resolution multispectral landimaging systems, it is difficult to isolate and interpret theindividual vertical elements within SLA echoes, as can beaccomplished with calibrated aircraft surface lidar data.
9. Measurements of vegetation
Empirical experience with remote tree height estimation hasbeen amassed by scientists and engineers at NASA'sGoddard Space Flight Center (Blair et al., 1994), usingairborne surface lidar sensors (Harding et al., 1994b; Blairet al., 1994). However, airborne laser altimeter echorecovery algorithms produce optimal results forsimultaneous estimation of the ground return and that of thecanopy top when the scale of surface footprints matches thespatial pattern of the tree crowns being measured. Fromthe experience gained by Blair, Harding, and colleagues(Harding et al., 1994b; Blair et al., 1994), optimal fooprintsfor robust estimation of tree heights for many vegetationsurface types are typically 10 - 25 m in diameter, andcertainly not as large as 100 m (i.e., the nominal SLAfootprint diameter). Given this important proviso, effectivecanopy assemblage heights (ECH) have been extractedfrom SLA echoes only under those circumstances where theunderlying ground relief is of low total variability andslowly varying (i.e., low local slopes), and where SLAechoes are not saturated.
Using algorithms for retrieval of tree heights from surfacelidar echoes pioneered by Blair and others (Blair et al.,1994), the canopy top and underlying ground topographycan be estimated exclusively using SLA echoes in areas of
Fig. 8. Global map of SLA total verticalroughness (TVR) values superimposed on ashaded relief map of the Earth. The TVR valuesare color coded, and in regions of low slope, suchvalues represent an estimated canopy assemblageheight or ECH. Histograms of total verticalroughness for all vegetated land-cover classesversus that for arid lands are illustrated below.High TVR values in mountainous regions such asthe Andes, Zagros, and in the Tibetan plateau
100 reflect extreme local slopes and may not provideany information about the relief of vegetation,
TVR (ra) even if it is present. See text for details.
340
40
X30
15
50 as 0
1 062
J. Garvin et al.: Observations of the Earth s Topography from Shuttle Laser Altimeter
benign local topography. It appears that SLA's ability toquantify vegetation vertical structure is partially dependenton the local variability of the ground elevation, as well asupon the statistical character of the echoes. Well-behavedechoes associated with highly vegetated landscapes inBrazil, coastal Cameroon, the Congo Basin of Africa, andin Laos have been examined. It is apparent that improvedalgorithms for objectively isolating the ground return fromthat associated with a tree canopy top are needed if SLAechoes are to be used to dramatically extend the existingdatabase of tree height observations. Many unsaturatedSLA echoes have poorly expressed ground returns, perhapsdue to local heterogeneities in vegetation cover (i.e., mixedtarget types). Furthermore, since SLA measurementsconsist of 100 m diameter footprints separated from theirneighbors by at least 600 m, it is important to recognize thatSLA's utility for vegetation parameter estimation is severelylimited. Experience with aircraft echo recovery surfacelidar systems by Blair, Harding, and colleagues (Harding etal., 1994b; Blair et al., 1994), indicate that contiguoussampling along track is required to consistently retrieve treeheights in their proper context, and to reliably estimate sub-canopy ground elevations and local slopes. Given thesecaveats, we have produced a best-efforts global assessmentof effective canopy heights (ECH) using those SLA echoessuitable for this purpose (i.e., unsaturated, polymodal,strong final peak). A global map of the distribution of ECH(total vertical roughness) is presented in Fig. 8. In thosecases where local slopes are high, we have computed a totalvertical roughness (TVR) parameter using the samealgorithm as for ECH, which is a representation of themaximum sensible variation in topography within a 100 mdiameter SLA footprint. These values are plotted on Fig. 8together with the ECH values for the purpose ofdemonstrating the global distribution of 100 m length scalevertical roughness. Thus, high ECH values in Iran and incentral Asia represent steeply sloping, rugged terrain, andcannot be interpreted in terms of vegetation assemblageheights even in cases where trees are present.
10. Global roughness
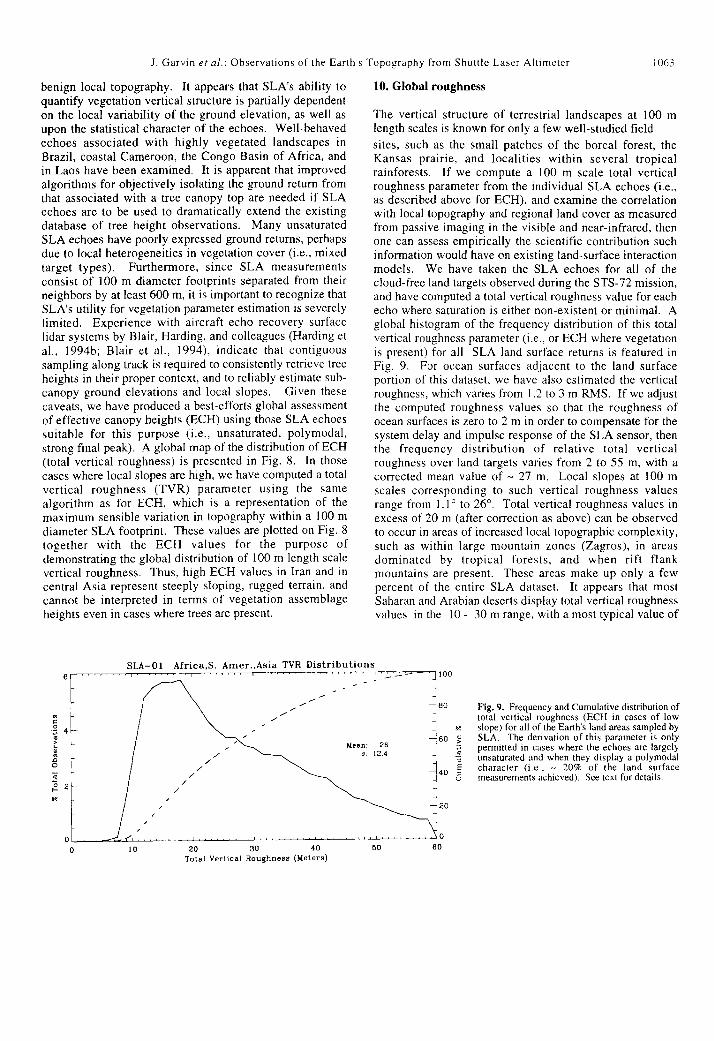
The vertical structure of terrestrial landscapes at 100 mlength scales is known for only a few well-studied field
sites, such as the small patches of the boreal forest, theKansas prairie, and localities within several tropicalrainforests. If we compute a 100 m scale total verticalroughness parameter from the individual SLA echoes (i.e.,as described above for ECH), and examine the correlationwith local topography and regional land cover as measuredfrom passive imaging in the visible and near-infrared, thenone can assess empirically the scientific contribution suchinformation would have on existing land-surface interactionmodels. We have taken the SLA echoes for all of thecloud-free land targets observed during the STS-72 mission,and have computed a total vertical roughness value for eachecho where saturation is either non-existent or minimal. Aglobal histogram of the frequency distribution of this totalvertical roughness parameter (i.e., or ECH where vegetationis present) for all SLA land surface returns is featured inFig. 9. For ocean surfaces adjacent to the land surfaceportion of this dataset, we have also estimated the verticalroughness, which varies from 1.2 to 3 m RMS. If we adjustthe computed roughness values so that the roughness ofocean surfaces is zero to 2 m in order to compensate for thesystem delay and impulse response of the SLA sensor, thenthe frequency distribution of relative total verticalroughness over land targets varies from 2 to 55 m, with acorrected mean value of - 27 m. Local slopes at 100 mscales corresponding to such vertical roughness valuesrange from 1.10 to 26°. Total vertical roughness values inexcess of 20 m (after correction as above) can be observedto occur in areas of increased local topographic complexity,such as within large mountain zones (Zagros), in areasdominated by tropical forests, and when rift flankmountains are present. These areas make up only a fewpercent of the entire SLA dataset. It appears that mostSaharan and Arabian deserts display total vertical roughnessvalues in the 10 - 30 m range, with a most typical value of
Fig. 9. Frequency and Cumulative distribution oftotal vertical roughness (ECH in cases of low
N slope) for all of the Earth's land areas sampled byQ SLA. The derivation of this parameter is only
permitted in cases where the echoes are largelyunsaturated and when they display a polymodal
E character (i.e., - 20% of the land surfacec measurements achieved). See text for details.
t0 20 30 40Total Vertical Roughness (Meters)
rI._C
c
0
1E-Vo
106'.
50

J. Garvin et al.: Observations of the Earth s Topography from Shuttle Laser Altimeter
II- 20 m, corresponding to a within-footprint local slope of- 6.0°. This value is surprisingly similar to the many of theRMS slope values derived from quasispecular microwavescattering measurements for some parts of the expansiverolling plains of Venus, perhaps attesting to the similarlocal roughness of terrestrial deserts, at least at 100 mlength scales. In addition, it appears that the 100-m scaletotal vertical roughness of such terrestrial deserts, asinferred from SLA echoes, is consistently similar to valuesderived from Earth-based radar scattering observations ofNorthern Hemisphere landing site regions on Mars(Harmon, 1997). MOLA-2 observations of RMS opticalpulse width for the martian surface, as available in 1998,facilitate direct comparisons of terrestrial deserts (asmeasured by means of SLA echoes) with martian surfaces.Initial indications suggest that martian northern plainssurfaces are slightly smoother at 100-200 mi length scalesthan the subset of terrestrial deserts sampled by SLA (Smithet al., 1998).
SLA-01 orbit path2-1~ 5 -[_;q I Ur 1- r ,
5)
0
2:
D]_
11. Correlations with land cover classes
One can extend this SLA echo analysis to regionsdominated by more complex land cover patterns, includingwidespread vegetation. We have taken an SLA transect thatcrosses at least six global land cover classes betweentropical forests in West Africa (Cameroon) to the mixedwoodlands and savannahs of Sudan, and including baresandy and stone pavement deserts, grasslands, andshrublands. In this case, we compute total vertical rough-nesses for complex multimodal SLA echoes in all caseswhere only simple forms of saturation are observed; wheremultiple parts of an echo are saturated, it is impossible tounambiguously reconstruct the unsaturated echo shape, andno values are derived in such instances. Figure 10illustrates the SLA transect in question both in terms ofSLA-derived surface elevations and total verticalroughness, plotted as ECH. The frequency distribution oftotal vertical roughness (or ECH) is appreciably different in
ech Distributions
10 20 30 40 50 60 70ECH (m)
SLA-01 Elevation00
00clotuds00 ._
|00 . water00
00 - . - - - .
- . e.-.". . ..--.. . . --
0 10 20 30 40 50Longitude
Waveform ech(n0 --.- . -, -- -
I. J6
t
IA. '17, . .6,41 '
,-i-'; 4 - " " - - -. .'
- junglea woods/grass.* grass .a shrubs r .indesert
~~~~ * woos/gas0 r :
4010 20 30Longitud
50e
Fig. 10. Example of an SLA transect across central Africa illustrating the distribution of total vertical roughness derived from SLA echoes as in Fig. 8. Inthis case, the ECH roughness values corresponding to global land cover classes are plotted separately in the histogram in the upper right. Tropical forestsdisplay the widest range of ECH values, extending from 10 m to - 60 m, relative to ocean values.
30
25
20
15
1 0
5
E1:
0U2
3.
Mu60
- 5040
oc 30
20100
l __
l a
l -
F _I _
To
_
-
1 064

J. Garvin et al.: Observations of the Earth's Topography from Shuttle Laser Altimeter
this case than that for unvegetated North African deserts. Inthis more complex situation, total vertical roughness valuesfor ocean and inland sea (water) surfaces vary from 1.2 to 3in, with a modal value of 1.5 m. If we assume, as before,that the ocean surface vertical roughness includes the effectof the SLA instrument impulse response, and translate thecomputed values so that the modal ocean surface has a 0-Im total vertical roughness, then the frequency distributionof central African land surface vertical roughness variesfrom less than 5 m (deserts) to 60 m (tropical forestlandscapes). Such values correspond to local slopes at 100m length scales that range from 2.80 to 31°, with a modalvalue of 8.50. The important difference here (Fig. 10) isthat we have subdivided the frequency distribution of totalvertical roughness values as a function of the land covertypes to which they belong, using the color conventionsillustrated in the lowermost profile. Tropical forest surfaces("jungle" in the lowermost panel of Fig. 10) displaycorrected total vertical roughness values (ECH) that varyfrom 10 m to 60 m, suggesting that SLA echoes are at leastindirectly recovering some aspects of the vertical structureof the local forest cover. We recognize that a more refinedestimator for vegetation canopy height must be developed,but our experiment with a simple statistical estimate ofwithin-footprint vertical roughness indicates that globalland cover classes have distinctive signatures in terms oftheir SLA-derived roughness values. Tropical forests inwestern Africa (Cameroon) display total vertical roughnessvalues that vary from 7 m to nearly 60 mn, while Sudanesegrasslands display values most similar to those for stonydeserts. Were it not for echo saturation effects whichrestrict the number of valid SLA measurements, thecorrelation of total vertical roughness statistics with landcover classification would allow for discrimination ofglobal land cover classes solely on the basis of SLA echoproperties.
12. Ocean surface observations.
Observations of the global ocean surface with SLA is yetanother element of our investigation of the Earth using theperspective provided by orbital surface lidar. Even beforeincluding high precision radial orbit information andattitude data, SLA ranging data over oceans can be used todemonstrate the reliability of the instrument's rangingperformance. For example, a - 200 km segment ofdetrended SLA data across the Red Sea indicates a totaldynamic range of relief of - 4 m, with a standard deviationof 0.9 m. In a - 1000 km stretch of Pacific Ocean east ofHawaii (i.e., between 1440 and 154° E longitude), a similarstatistical trend was observed, with a standard deviation of0.9 in, and a total dynamic range of - 5 m. Thus, we areconfident that SLA has produced meter-quality elevationmeasurements of both land and oceanic surfaces with anorbital laser altimeter system. When precision orbits andattitude information are utilized (Rowlands et al., 1997), thedifference between SLA's observations of ocean surfacesand those measured by the Topex/Poseidon ocean radar
altimeter in terms of a mean sea surface are smaller than 2.8m RMS. By more fully correcting for additional aspects ofShuttle attitude and platform motion uncertainties, we haveindications that 1.7 m RMS quality data can be achieved forocean surface targets.
13. General land observations
Over land, RMS discrepancies between SLA and the bestavailable 90 m and 1000 m spatial resolution DEM's rangefrom 2-5 in in low-lying coastal regions to 12 m RMS overvolcanoes such as Mauna Kea, and are as high as 50 m incomplex unvegetated regions, such as the ZagrosMountains of Iran. We have intercompared all 32 SLAtransects over Africa for which high precision orbits areavailable against the best available I km spatial resolutionDEM for this region. The standard deviations of thedifferences between SLA's ellipsoidally-referenced surfaceelevation measurements and those reported in the I kmDEM vary from - 40 m in the North African desert regionsto 150 m in the tropical forests of central Africa. SLAechoes for heavily vegetated parts of Africa (i.e., on thebasis of global land cover models) suggest total verticalroughness values over 50 m, which may be correlated withvegetation canopies that are as tall as 40-60 in. Sinceexisting DEM's do not systematically record "bare-earth"surface elevation values, some of the discrepancies betweenSLA measurements and these DEM's may be due tovegetation vertical structure. Within Africa, where thesource of the DEM data is digitized contour maps,discrepancies between SLA and such DEM's are often ashigh as 1 00's of meters, suggesting that many existing maps(and DEM's) are woefully inadequate in such regions as asource of topographic ground control points. We recognize,however, on the basis of SLA echoes, that up to perhaps 30m of bias may exist in SLA's reported observations ofsurface elevations, because we have not yet included range-walk, amplitude, and centroid corrections into ourcomputations of range. In cases where we have comparedSLA to DEM's for coastal deltaic plains, we have convertedSLA ellipsoidally-referenced elevations into orthoinetric(i.e., geoid-corrected) heights so that they locallyapproximate mean sea level. Even in such cases,differences by as much as 10-25 m are observed (i.e., in thedistal Ganges), suggesting that existing DEM's may notaccurately reflect the current character of local reliefvariations in such highly dynamic regions.
SLA's land surface elevation and echoes dataset consistsof almost an order of magnitude more observations(-450,000) than any previous spaceborne laser altimeterdataset (i.e., Clementine for the Moon). Each of SLA's landsurface measurements have an intrinsic meter-level ofvertical uncertainty, and when combined with the highestprecision orbit and attitude data that is presently available,these data can be used to address issues associated withchanging land cover patterns for many of Earth'scontinental regions at sub-kilometer length scales with veryhigh vertical resolution. We have endeavored to make
1065
J Garvin et al.: Observations of the Earth's Topography from Shuttle Laser Altimeter
SLA-02 Waveforms
100 200
Broadleaf Deciduous
300time (no)
400 600
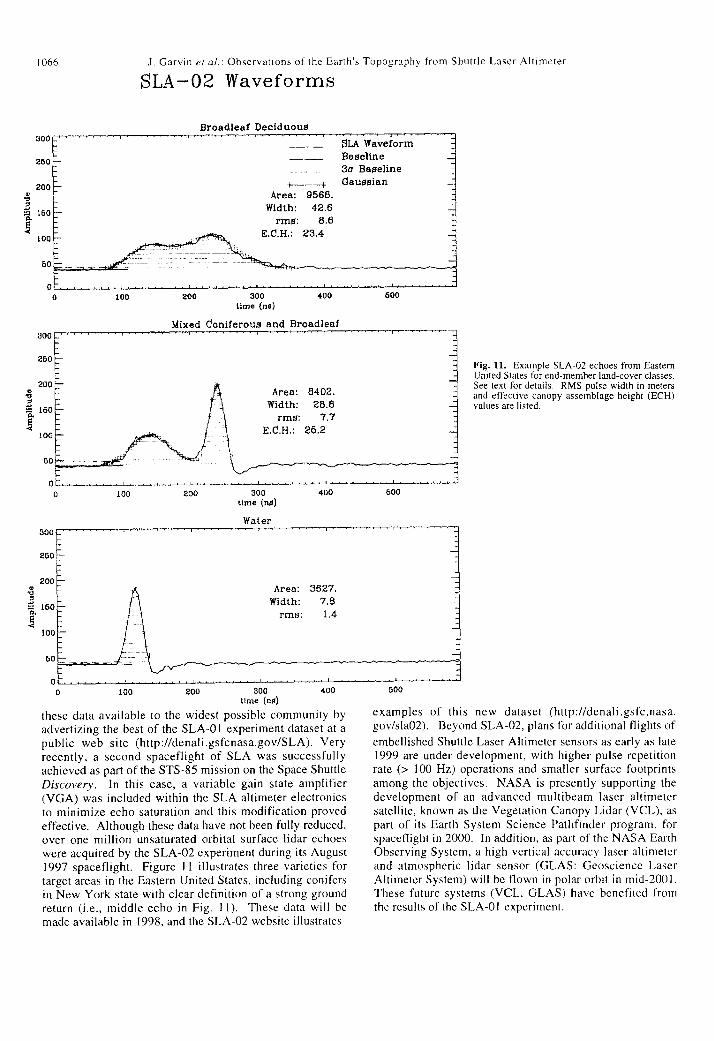
Fig. 11. Example SLA-02 echoes from EasternUnited States for end-member land-cover classes.See text for details. RMS pulse width in metersand effective canopy assemblage height (ECH)values are listed.
0 to0 200 300 400 600time (na)
0 100 200 300 400time (no)
these data available to the widest possible community byadvertizing the best of the SLA-O0 experiment dataset at apublic web site (http://denali.gsfcnasa.gov/SLA). Veryrecently, a second spaceflight of SLA was successfullyachieved as part of the STS-85 mission on the Space ShuttleDiscovery. In this case, a variable gain state amplifier(VGA) was included within the SLA altimeter electronicsto minimize echo saturation and this modification provedeffective. Although these data have not been fully reduced,over one million unsaturated orbital surface lidar echoeswere acquired by the SLA-02 experiment during its August1997 spaceflight. Figure Il illustrates three varieties fortarget areas in the Eastern United States, including conifersin New York state with clear definition of a strong groundreturn (i.e., middle echo in Fig. I1). These data will bemade available in 1998, and the SLA-02 website illustrates
600
examples of' this new dataset (http://denali.gsfc.nasa.gov/slaO2). Beyond SLA-02, plans for additional flights of
embellished Shuttle Laser Altimeter sensors as early as late1999 are under development, with higher pulse repetitionrate (> 100 Hz) operations and smaller surface footprintsamong the objectives. NASA is presently supporting thedevelopment of an advanced multibeam laser altimetersatellite, known as the Vegetation Canopy Lidar (VCL), aspart of its Earth System Science Pathfinder program, forspaceflight in 2000. In addition, as part of the NASA EarthObserving System, a high vertical accuracy laser altimeterand atmospheric lidar sensor (GLAS: Geoscience LaserAltimeter System) will be flown in polar orbit in mid-2001.These future systems (VCL, GLAS) have benefited fromthe results of the SLA-O experiment.
it
tt
OLA Waveform
60 Bageline_ . 3a Baseline
oo~~~~~~~~~_ __ I auasianArea: 956B.
Width: 42.6rms: 8.6
to E.C.H.: 23.4
so -_ ----- ---
a0 .0
1 066
2a

J. Garvin et al.: Observations of the Earth's Topography from Shuttle Laser Altimeter
14. Summary
SLA's maiden spaceflight successfully demonstrated a newclass of technology capable of extremely precisetopographic measurements of landscapes, ocean surfaces,and cloud-tops from a spaceborne perspective. As such,SLA has effectively validated the first generation oftechnologies that are required for long-term orbitalmonitoring of the mass-balance of the great polar ice sheets(Antarctica and Greenland) (Burke and Dixon, 1988;TOPSAT Working Group, 1994; Cohen et al., 1987). Inaddition, SLA observations have demonstrated a new formof topographic remote sensing that permits direct detectionand measurement of the relief characteristics of mundanecoastal landscapes, ephemeral desert landforms, complexmountainous terrain, and heavily forested surfaces.Furthermore, SLA's echoes can be used, under appropriatecircumstances, to measure the heights of forest canopies inareas of low relief and slope, as well as the verticalroughness of desert surfaces (Garvin et al., 1998). Finally,SLA's observations of the spatial and vertical patterns ofclouds within the mid-latitudes of the Earth in northernhemisphere winter conditions indicate that typical cloudcover is intermittent, with mean cloud path lengths of - 4km, and a total percentage of quasi-global cloud cover of40-45 %. This is encouraging in that it validates globalcloud cover prediction models (Harding et al., 1994a)which suggest that on the order of 50% of the Earth'ssurface is cloud obscured during winter conditions. Thevertical character of the Earth's land and ocean surfaces at100 m spatial scales does not appear to inhibit the ability oforbital laser altimeter sensors such as SLA from preciselydetermining local surface elevations. Finally, the largestnumber of ground elevation observations afforded by SLA'sinitial spaceflight are in Africa, where the quality ofexisting DEM's is commonly questionable at levels of 100in to 1000 m in a vertical sense (Burke and Dixon, 1988;Loughridge, 1986). Thus, the - 200,000 valid groundobservations in Africa provided by SLA can be used byothers to refine existing DEM's for this major continent,thereby improving an important foundation dataset for useby Earth scientists and others interested in modelling globalpatterns of surface change.
Acknowledgements. We wish to acknowledge the essential efforts ofDavid Rabine and John Cavanaugh in this work. In addition, theoutstanding support of the entire SLA engineering team is greatlyappreciated. The Hitchhiker payload support staff, under the leadership ofT. Dixon and A. J. Alfonzo, was instrumental to the successful acquisitionof SLA data during STS-72. We are further grateful to the crew of STS-72who kindly supported our observations during their very busy flight.Office of Earth Science Flight director R. Price kindly funded our SLAefforts, after the NASA Goddard Space Flight Center Director'sDiscretionary Fund provided the essential start-up support (courtesy Dr.Rothenberg, Center Director and Gerry Soffen). Special thanks to D. E.Smith (Principal Investigator, MOLA) for providing flight sparecomponents to the SLA team. Additional thanks to Jim Roark, D. BarryCoyle, Dan Hopf, and Nita Walsh, who kindly spent many long hours inthe POCC during the time in which SLA was collecting data. Finally,special thanks to Richard S. Williams Jr. (USGS), Tim Mutch (deceased),and Dr. Noel Hinners (Lockheed Martin) for their motivation of this effortover many years. JBG was strongly supported in his efforts with SLA byhis wife Cindy, son Zack, daughter Danica, and Bouvier Georgie-girl.Many additional engineers at NASA/GSFC assisted with the SLAdevelopment and spaceflight, and we thank them for their much-
appreciated efforts. SLA-02 conducted its spaceflight aboard Discoveryon the STS-85 mission in Aug. 1997 in a 570 orbit. We gratefullyacknowledge ongoing NASA support under RTOPs : 618-90-03, 622-19-15 (JBG), and 334-36-10 (PIDDP).
References
Balin, Y. et al., Joint interpretation of lidar and photometric data in thespaceborne measurements of cloud fields, Proceedings of SPIE, vol.2310, 160 (1994).
Bindschadler, R. A. et al., Surface topography of the Greenland ice sheetfrom satellite radar altimetry, NASA SP-503 (1989).
Blair, J. B., Coyle, D. B., Bufton, J. L., and Harding, D. J., Optimization ofan airborne laser altimeter for remote sensing of vegetation and treecanopies, Proc. Intl. Geosci. and Remote Sensing Symp. 1994, Vol. 11,939-942 (1994).
Bufton, J. L., Proc. IEEE, Vol. 77,463 (1989).Bufton, J. L. et al., Optical Engineering, Vol. 30 (1), 72 (1991).Bufton, J. L, Blair, 1. B., Cavanaugh, J., Garvin, J. B., Harding, D., Hopf,
D., Kirks, K., Rabine, D., and Walsh, N., Proc. 1995 Shuttle SmallPayloads Symposium, NASA CR-3310 (1995), p. 83-91; Bufton, J. L.and Blair, J. B., "Space Laser Altimetry...., The Review of LaserEngineering, Vol. 24 (12), 1285 (1996).
Burke, K. and Dixon, T., NASA Topographic Science Working GroupReportLunar and Planetary Institute, Houston, Texas (1988).
Chao, B. F. and Naito, I., EOS Trans. Amer. Geophys. Union, Vol. 76 (16),164 (1995).
Cohen, S. C. et al., The Geoscience Laser Altimetry/Ranging System,IEEE Trans. Geosci. Rem. Sens., GE-25, 581 (1987).
Coleman, J. M, Roberts, H., and Huh, 0. K., in Geomorphology fromSpace, Short, N., and Blair, R. (eds.), NASA SP-426, Washington, DC(1989), pp. 317-340.
Coleman, J. M and Wright, L. D., "Modem River Deltas: Variability ofProcess and Sand Bodies", in M. L. Broussard (ed.) Deltas: Models forExploration, Houston Geological Society Publication, 1975, pp. 99-149.
Evans, D. L. et al., EOS Trans. Amer. Geophys. Union, Vol. 75 (52), 553(1992).
Gardner, C. S., IEEE Trans. Geosci. Rem. Sens., Vol. 30,1061 (1992).Garvin, J. B., Photonics Spectra, Vol. 37, 67 (1993).Garvin, J. B., Geol. Soc. London Special Public. 110, 137 (1996); in
McGuire, W., Jones, A., and Neuberg, J. (eds) Volcano Instability onthe Earth and Planets, Geol. Soc. Spec. Pub. 110.
Garvin, J. B., Blair, J. B., Bufton, J. L., and Harding, D. J., EOS Trans.AGU, Vol. 77(7),239(1996a)
Garvin, J. B., Harding, D. J., Blair, J. B., Frawley, J. J., EOS Trans. AGU.Vol. 77 (46), F32 (1996b).
Garvin, J. B., "Coastal Hazards Monitoring and TopographicCharacterization by means of Laser Altimetry", in Proceedings ofCoastal Hazards Workshop, Louisiana State University, Coastal StudiesInstitute Publication. editted by Huh, O., LSU Technical Report TR-654, 39 (1997).
Garvin, J. B. et al., Three Dimensional Structure of Terrestrial Landcoverand Landscapes as Determined by Shuttle Laser Altimeter (SLA)Observations, submitted to Nature, 15 pp (1998).
Harding, D. J., Bufton, J. L., and Frawley, J. J., IEEE Trans. Geosci. Rem.Sens., Vol. 32 12), 329 (1994).
Harding, D. J., Blair, J. B., and Garvin, J. B., Laser altimetry waveformmeasurement of vegetation canopy structure, Proc. Intl. Geosci. andRemote Sensing Symp. 1994, Vol. II, 1251-1253 (1994).
Harmon, J. K., J Geophys. Res., Vol. 102 (E2), 4081(1997).Krabill, W. et al., Geophys. Res. Letters, Vol. 22 (17), 2341 (1995).Krabill, W. et al., Int. J. Remote Sensing, Vol. 16 (7), 1211 (1995).Lancaster, N., Geomorphology of Desert Dunes, (Routledge, New York,
1995).Loughridge, M. S., EOS Trans. Amer. Geophys. Union, Vol. 67, 121
(1986).Madsen, S. N., Zebker, H. A., and Martin, J., Topographic Mapping using
Radar Interferometry: Processing Techniques, IEEE Trans. on Geosci.and Rem. Sens., 31(1), 246 (1993).
Marshall, J. A., Lemoine, F. G., Luthcke, S. B., Chan, J. C., Cox, C. M.,Rowton, S. C., Williamson, R. G., Wiser, J. L., Paper IAF-95-A. 1.05 atthe 46th International Astronautical Congress, Oct. 1995, Oslo, Norway(1995a)
Marshall, J. A., Zelensky, N. P., Luthcke, S. B., Rachlin, K. E,Williamson, R. G., J. Geophys. Res. 100 (C12), 25331 (1995b)
Matvienko, G. et al., Spaceborne lidar for cloud monitoring, Proc. SPIE,Vol. 2310, 129 (1994).
Matvienko, G. et al., Space laser rangefinder "LORA" used as a cloudlidar, Optical Review, Vol. 2, 221 (1995).
Moore, J. G. and Mark, R. K., GSA Today, Vol. 2 (12), 257 (1992).
1 067

1068 J. Garvin et al-: Observations of the Earth's Topography from Shuttle Laser Altimeter
Mouginis-Mark, P. J. and Garbeil, H., Bulletin of Volcanology, Vol. 55, Wingham, D. J., Rapley, C., and Morley, J. G., EOS Trans. Amer.566 (1993). Geophys. Union, Vol. 74(10), 113 (1993); Fu, L. L., Christensen, E. J,
Rowlands, D. D., Marshall, J. A., Pavlis, D. E., Moore, D., Rowton, S. C., Yamarone, C. A., Lefebvre, M., Menard, Y., Dorrer, M., Escudier, P., J.Lou, S, McCarthy, J. J., Luthcke, S. B., GEODYN II System Geophys. Res. 99 (C12),24369 (1994).Description, Hughes STX Contractor Report, Greenbelt, MD (1995). Winker, D. M., Couch, R. H., and McCormick, M. P., Proc. IEEE, Vol. 84
Rowlands, D. D. et al., Space Shuttle Precision Orbit Deternination in (2), 164 (1996).Support of SLA-01 using TDRSS and GPS Tracking Data, Journal of Wright, L. D., "River Deltas", in Coastal Sedimentary Environments,Astronautical Sciences, Vol. 46, No. 1, 113 (1997). Davis, R. A. (editor), pp. 1-76 (Springer, New York, 1985).
Smith, D. E. et al., Topography of the Moon from the Clementine LIDAR, Zebker, H. A. et al., IEEE Trans. Geosci. and Rem. Sens., Vol. 30, 933J. Geophys. Research, Vol. 102 (El), 1591 (1997). (1992).
Smith, D. E. et al., Topography of the Northern Hemisphere of Mars from Zebker, H. A. et al., J. Geophys. Res., Vol. 99 (B]O), 19617 (1994).the Mars Orbiter Laser Altimeter, in press in Science (1998) Zwally, H. J. et al., Surface Elevation Contours of Greenland and Antarctic
TOPSAT Working Group, Scientific Requirements of a Future Space Ice Sheets, J Geophys. Res., 88 (C3), 1589(1983).Global Topography Mission, Italian Space Agency (ASI) Report ASI-92- Zuber, M. T. et al., J. Geophys. Res. 97 (E5), 7781 (1992).RS-52, 85 pp. (1994). Zuber, M. T. et al., Science, Vol. 266, 1839 (1994).