Embed Size (px)
Citation preview

R842-05 EIAL REPORT RESUME
EU 010 246 3-01-67 24 (REV)AN EXPLORATORY STUDY OF TIE DEVELOPMENT OF MORE EFFECTIVE TESTINGPROW4AMS FOR STUDENTS IN LIFFERING CULTURAL BACKGROUNDS.CANTWELL, LITA 0.CGF48277 CITY UNIV. OF NEW YORK, BROOKLYN COLL.CRP- 336BR-5-811231-MAY-66ELKS PRICE MF-$U.09 HC $1.36 34P.
*F.4EDICTIVE ABILITY, *PREDICTIVE VALIDITY, *INTELLIGENCE TESTS,*CULTURAL DIFFERENCES, *SCLIOECONOMIC BACKGROUND,HIGH SCHOOL STUDENTS, FEMALES, ETHNIC GROUPS, NEW YORK,NEW YORK CITY, STANDARD PROGRESSIVE MATRICES, D. 48 TEST
THE PREDICTIVE ABILITY OF TWO INTELLIGENCE TESTS ON A GAUSS-CULTURALSAMPLE WAS STUUTED. THE STANDARD PROGRESSIVE MATRICES AND THE D. 48TEST WERE ADMINISTERED TO 1,579 (1RL IN GRADES 9 THROUGH 12. OTHERTEST SCORES WERE OBTAINED FROM STUDENT RECORDS. THE CROSS-CULTURALGROUPS fUNSISTED OF (11 INDO-EUROPEAN, (2) SPANISH-AMERICAN, (3)NEGRO, AND (4) CHINESE. MEASURES WERE MADE OF ACHIEVEMENT,SOCIOECONOMIC LEVEL, INTELLIGENCE, AND ABILITY. CORRELATIONS ANDCOMPARATIVE PROCEDURES WERE EMPLOYED IN ANALYSES. SCORES ON BOTHTESTS EMPHASIZED MATHEMATICS APTITUDE AND ACHIEVEMENT. NEITHER OFTHE TESTS VALIDLY PREDICTED PERFORMANCE LEVELS, NOR DID THEYDIFFERENTIATE AMONG THE ETHNIC GROUPS. FUTURE RESEARCH WAS SUGGESTEDIC SHOW HOW INSTRUMENTS MAY DIFFERENTIATE WITHIN ETHNIC GROUPS ASSOCIOECONOMIC RANK CHANGES. (RS)
1.1, $. DEPARTMENTOF HEALTH, EDUCATION AND WELFARE
Office of Education
This document has been reproduced exactly as received from the
person or organ erigmating it. Points of view or opinions
stated do not riecosv.rity ray esont official Office of EducatloCi
position or policy.
ProSect title
Bureau number
Submitted by
Date transmitted
Final Report
An exploratory study of the development ofmore effective testing programs for studentsof differing cultural backgrounds, I pa_
5-8112-2-12-1. (5 3
Zito M. CantKellDepartment Of EducationBrooklyn C011ege, City University of New YorkBrooklyn, New York
Ifie7 31, 1966

Purpose
The Standard Progressive matrices (1938) snd The D. 48 Test
have been designed to Measure an individual's underlying
intellectual capacity, irrespeotive of specific training. This
study was undertaken to investigate these three questions about
the two tests: (a) How valid are the Standard Progressive
Matrices (1938) and The D. 48 Test as prediotors of academio
pohentealnt in a sample cf higr sohool girls of differing cultural
and ethnic backgrounds? Zo the two tests differentiate between
verbal and mathematics facility when these two characteristics
are expressed in terms of school achievement? (b) Do the Pro-
gressive Matrices (1938) and The D. 48 Test seem to be measuring
the same aspects of intellectual capacity? (o) Do the Standard
Progressive Matrices (1938) and The D. 48 Test successfully dis-
criminate among a sample of testees described by academic level
and ethnic group membership?
Tests and Other ',1uantitative Indices
Scores from the following tests have been used in the inves-
tigation: the Standard Progressive Matrices (1938); The D. 48
Test; Otis quick-Sooring Mental Ability Test, gamma form;
College Entrance Examination Board, Scholastic Aptitude Test,
verbal and mathematics sub-tests; College Entrance Examination
Board, Preliminary Scholastic Aptitude Test, verbal and matkm-
mattes sub - teas; cad the Cooperative Entrance Examination,
verbal and numerical sub-tests.
The Standard Progressive Matrices (1938) is made up of five
sets of twelve incomplete matrix problems--a total of 60 matrices.

2.
Raven (1963, p.1) describes a matrix me an incomplete "meaning-
less figure" designed to represent a system of relations. The
testes in asked to conceive the nature of the relationships
und::rlying each matrix and complete the pattern by selecting one
of Six or eight ar;ernattvos given with each problem. By set
and within set the matr.l.ces be4ome progressively more difficult.
Although the Matriees is generally considered's good "g-
test'* (Raven, 1963; Bune3 1958) with negligible spatial loadinest
Smith (1964) notes that when admitlistered to groups of women it
has a consistent but low space (k) loading.
The D. 48 Test includes 44 lomino problems representing
varied types of idkeational progressions from simple to relatively
complex. The teatle is required to discern the thought pattern
underlying each domino series and comple:e the last domino in the
unit. The domino problems are open-end; no alternatives are
given. The domino test is also considered a good "g-test".
(Pichot, 1949; Gough and Domino, 1963).
Both of the above instruments are non-verbal group tests;
both are designed to measure ability to solve non-verbal problems
of wide range; neither presents major difficulties in adminis-
tration, soaring or inOerpretation and both may be completed by
testees in a relatively short time period. Although the tests
are widely used in European countries where they have extensive
research bibliographies (Raven, 1963; Burke, 1958; Calonghi,
1956; Piohot, 1949), neither has received comprehensive use in the
United States* The D. 48 Test is available in the latter oountry
in an experimental edition only.
The Otis Wick-Scoring Mental Ability Test, gamma form, gives
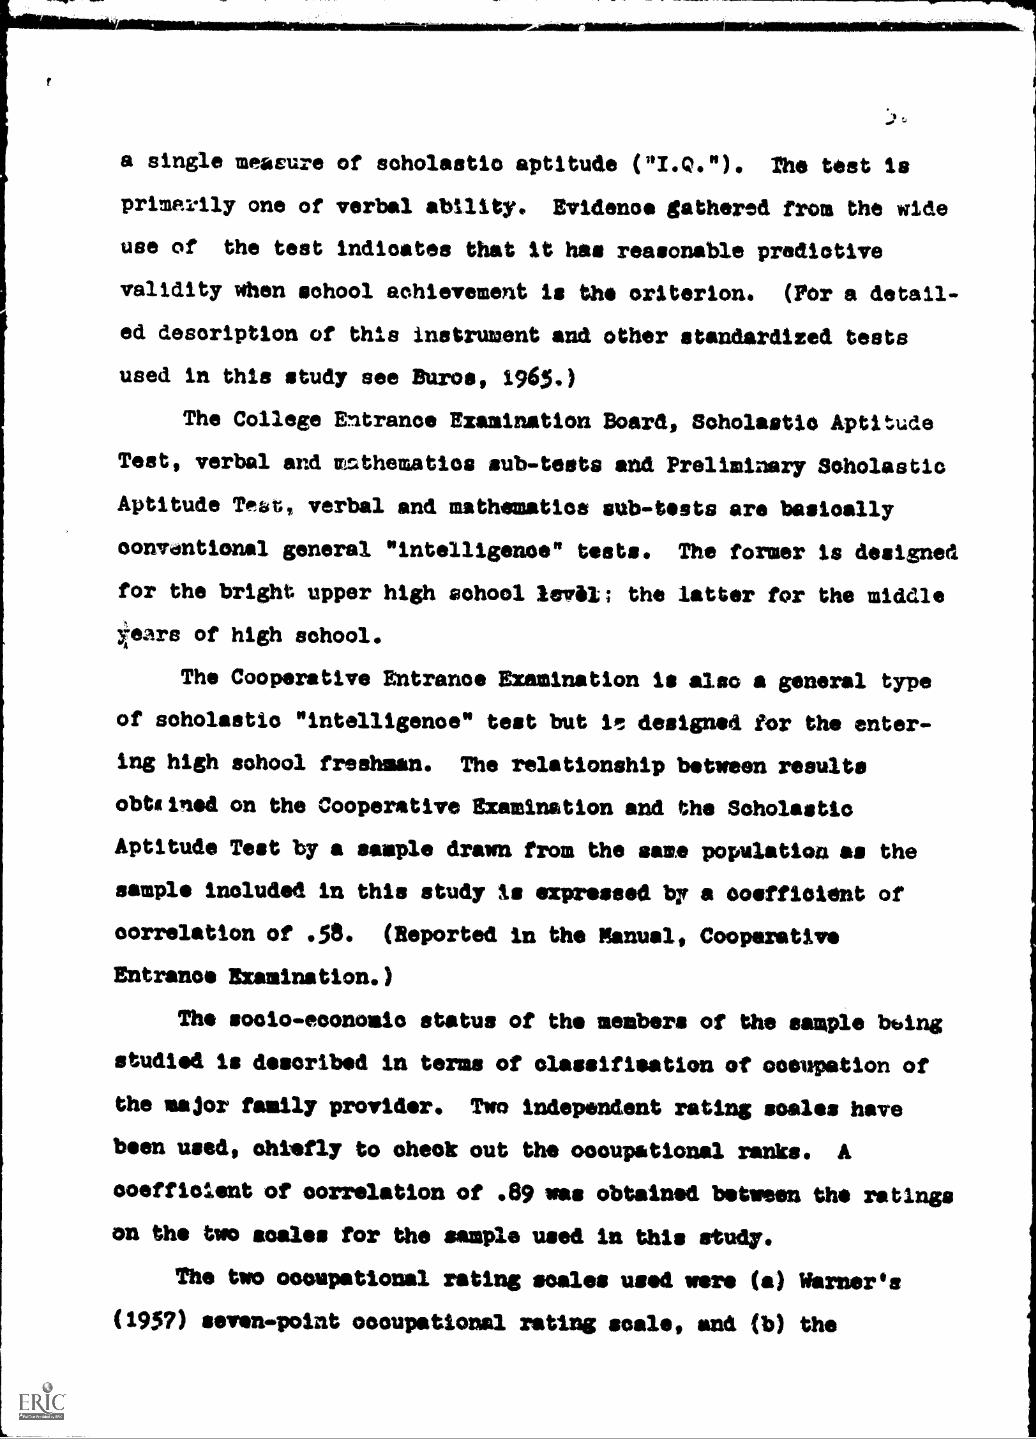
a single measure of scholastic aptitude ("/.0.'1). The test is
primarily one of verbal ability. Evidence gathered from the wide
use of the test indicates that it has reasonable predictive
validity when school achievement is the criterion. (Por a detail-
ed description of this instrument and other standardized tests
used in this study see Maros, 19650
The College Entrance Examination Board, Scholastio Aptitude
Test, verbal and msthematios sub-tests and Preliminary Scholastic
Aptitude Terau verbal and mathematics sub-tests are basically
oonvdntional general "intelligence" tests. The former is designed
for the bright upper high school level; the latter for the middle
years of high school.
The Cooperative Entrance Examination is also a general type
of scholastic "intelligenoe" test but in designed for the enter-
ing high school freshman. The relationship between results
obtained on the Cooperative Examination and the Scholastic
Aptitude Test by a sample drawn from the same population as the
sample included in this study is expressed bar a coefficient of
correlation of .58. (Reported in the Manual, Cooperative
Entrance Examination.)
The socio-economic status of the members of the sample bbing
studied is described in terms of olassifisation of occupation of
the major family provider. Two independent rating scales have
been used, Chiefly to check out the occupational ranks. A
ooefficient of correlation of .89 was obtained between the ratings
on the two males for the sample used in this study.
The two occupational rating scales used were (a) Warner's
(195 ?) seven -point occupational rating scale, and (b) the
Revised Minnesota Occupational. Ratiag Scale (Paterson et al.,
1953).
Warner olassifies jobs in seven occupational categories
(professianals, proprietors and managers, business men, olerioal
and kindred workers, manual workers, protective and service
workers, and farmers) on it seven point scale. The points are
assigned on the baois of the degree of skill and amount of pr?-
tige attached to the job. Warner includes occupation ire one of
four characteristics (the others: source of income, house type
and IM.ling area) needed to derive an individual's index of
Status Characteristics; he notes. that occupation correlates .91
with the total I.S.C. The occupational scale alone is used to
Indio:Ate soolo-eoonomio status in this study. An eighth point
has been added to the scale by the investigator to include wel-
fare recipients, etc.
The Revised Minnesota Occupational Rating Scales describe
occupation in terms of weighted ability patterns. These
patterns indicate the complexity of human abilities reqUired in
various occupations. Abilities are subsumed under seven cate-
gories: academia ability, mechanical ability, social ability,
clerical ability, musical or artistic abilities, and physical
ability. The "prestige" of a job depends upon its weighted
ability pattern score. In general, an occupation which requires
a good degree of skill in a number of abilities will receive a
high ability pattern score.
The following ethnic group classifications were used in this
study.
(1) Indo-European, American. This group formed the largest
5.
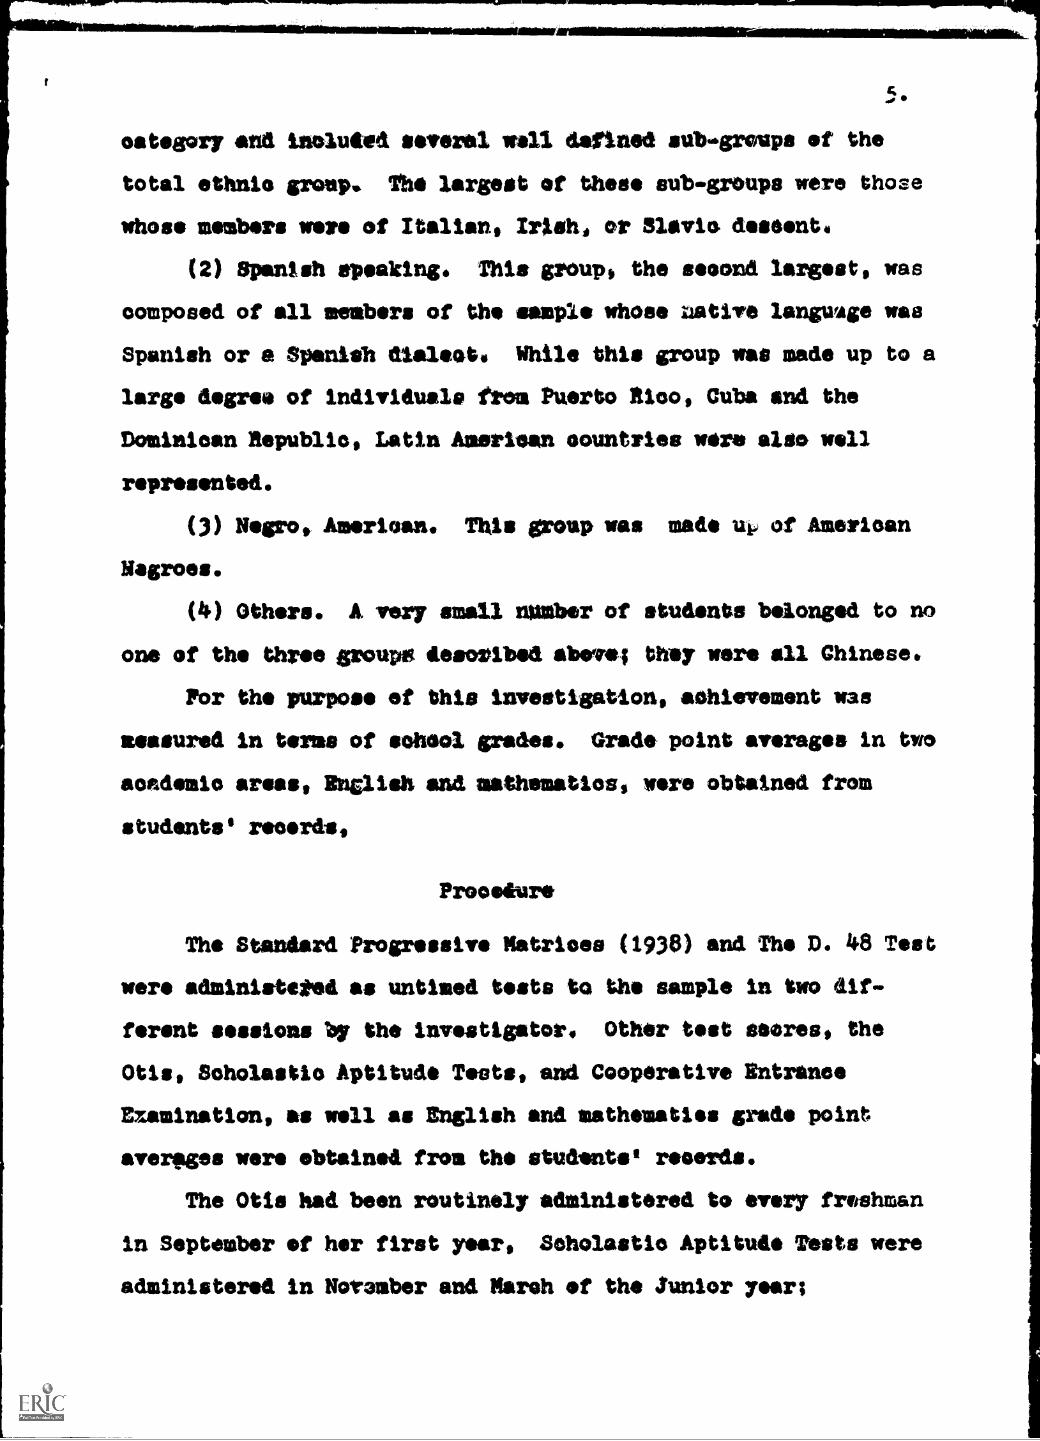
oategory and included several well defined sub- groups of the
total ethnio group. The largest of these sub-groups were those
whose menbers were of Italian, Irishi or Slavic closeout.
(2) Spanish speaking. This group, the second largest, was
composed of all members of the sample whose native langune was
Spanish or a Speniah dialeot. While this group WAS made up to a
large degree of individuals from Puerto Rico, Cuba and the
Dominican Republic, Latin Amrloan countries were also well
represented.
(3) Negro, American. This group was made up of American
Negroes.
(4) Others. A, very small number of students belonged to no
one of the throe groups desoribed above; they were all Chinese.
For the purpose of this investigation, achievement was
measured in terms of school grades. Grade point averages in two
academic areas, Burglish and mathematics, were obtained from
students' records,
Procedure
The Standard Progressive Matrices (1938) and The D. 48 Test
were administeeed as untimed tests to the sample in two dif-
ferent sessions by the investigator. Other test wires, the
Otis, Soholastio Aptitude Tests, and Cooperative Entrance
Examination, as well as English and mathematics grade point
&values were obtained from the students, recerds.
The Otis had been routinely administered to every freshman
in September of her first year, Scholastic Aptitude Tests were
administered in Noramber and March of the Junior year;

6.
Preliminary Scholastic Aptitude Tests in May of the Sophomore
year. The most recent aptitude seers was used for each sophomore,
junior and senior sublet:b. The Cooperative Entrants. Faminstion
was taken by the freshmen in Mai prior to their high school
entrance.
Occupations of parent(s), Ito., and ethnic grout membership
were obtained from the students in the sample.
The Sample
The total sample included in this study is representative of
thd population of girls who attend the large tour -gear metro-
politan high school in which this study was conducted. This
school is associated with two 9-10 year schools; steUdents from the
latter schools who want to complete high school generally trans-
fer to the former for grades 11 and 12. The population of the
four-year high school is therefore split about 60/30% between
the upper and lower halves of the school
For the purposes of this study the sample is desoribed by the
following characteristics: (a) year in school and ethnic group
membership; (b) socio-economic status by occupational olassifio-
ation of source of income of major family pr der; (0) indices
of academic ability and performance: (1) scholastic aptitude
("I.Q."), (2) verbal and mathematics aptitude, and (3) English
and mathematics achievement.
(a) Year_ in ethniomma memberfhiu. The total
sample (N=1579) was distributed in graidee 9 through 12 and in
four ethnic groups (see Table I, following). The ethnic groups
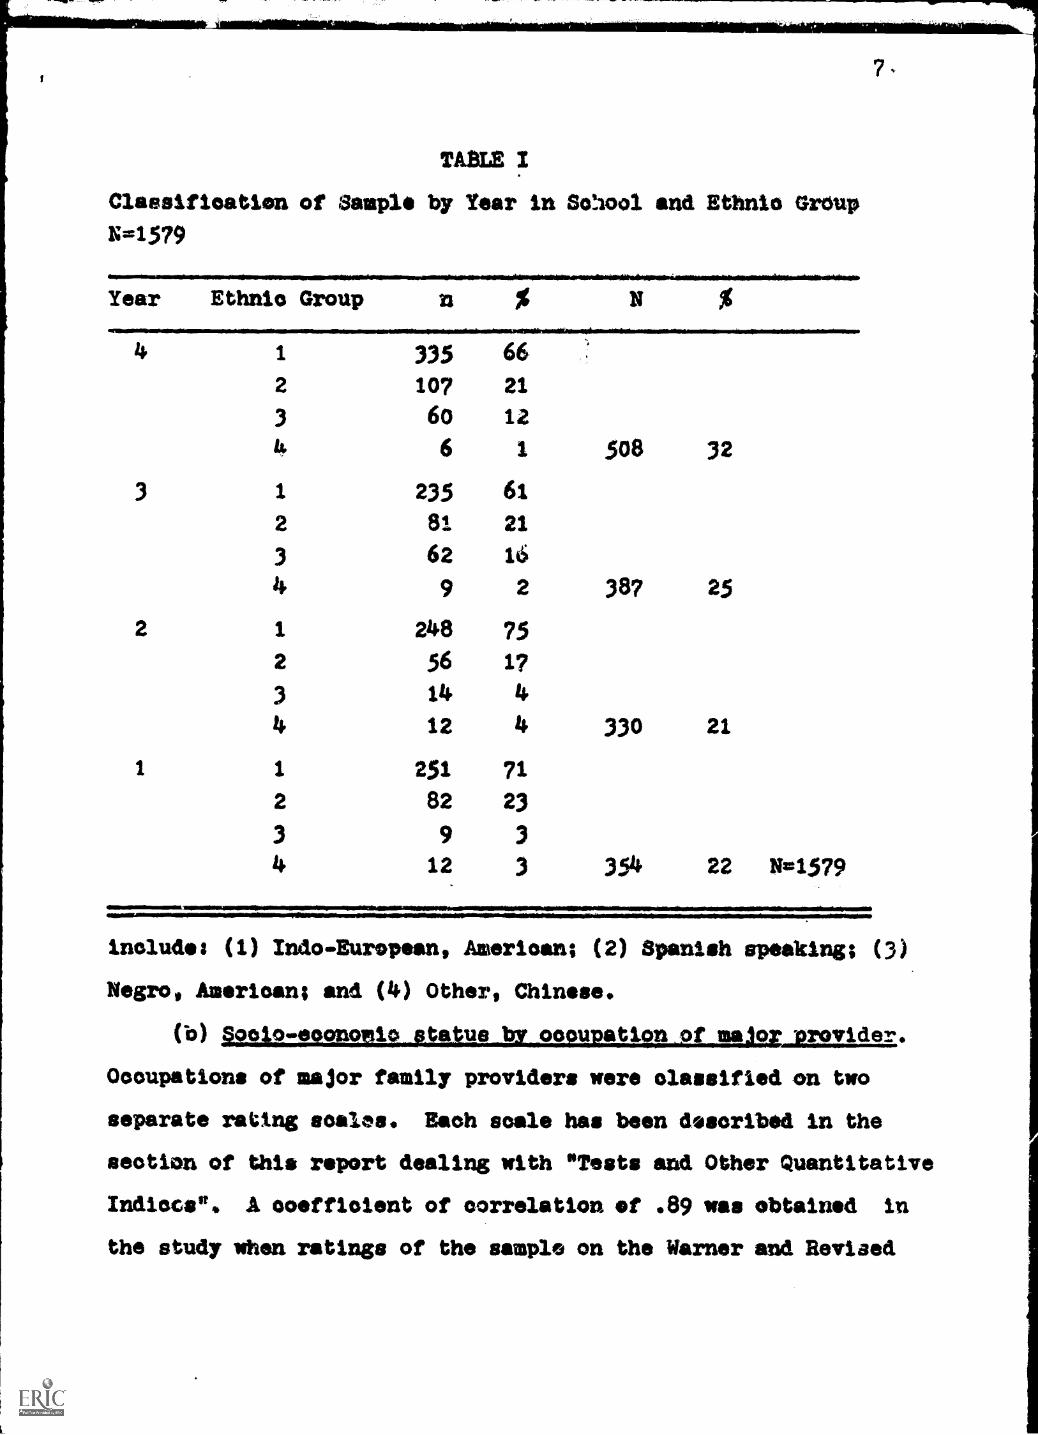
TABLE X
Classification of Sample by Year in School and Ethnio Group
N=1579
Year Ethnic Group n
4
3
2
1
1
2
3
335 66
107 21
60 12
6 1 508 32
1 235 61
2 81 21
3 62 16
4 9 2 387 25
1 248 75
2 56 17
3 14 4
4 12 4 330 21
1
2
3
4
251 71
82 23
9 3
12 3 354 22 N=1579
include: (1) Indo-European, American; (2) Spanish speaking; (3)
Negro, American; and (4) Other, Chinese.
(0) §2112:1220.012.01122k.22.92211/2114MAIRE 'provider*
Occupations of major family providers were classified on two
separate rating scales. Each scale has been described in the
section of this report dealing with "Tests and Other Quantitative
Indiccs", A coefficient of correlation of .89 was obtained in
the study when ratings of the sample on the Warner and Revised

Minnesota Occupational Rating Scales were compared.
001111.1101111111. 411011111111.111117111111111P 41111110111MMIKINS.11101111=11011.00.1111111M
TABIF1 III
Class,fication of Sample by Ethnic Group and Mean Socio-
Economia Status Rank
MIIIMMIIIIM.M11111011111.11111IMINIM10111111111.11111111161!
Ethnic Socio-Economic Status Rank
Group Moan s.d.*
NO.M1..~.0.*NINO.MftIMIMMONIV
5,3686
2 5.7108
3 5.6207
4 5.5385
*=standard deviation
WINIEMOMMIIIIMIIIIII111101MIPAINYAMINI111111611110-11110011111111111140111111r
n N
1.5245
1.5795
1.37995
1.2577
1069
325
145
39 1579
.4111111111.11111111111111101110111111111Nis
8.
Table II above shows the sample distributed by ethnic grow
and soeio-economic status by occupational rank, The scale in-
cluded in this table is Warner's occupational rating scale. All
four ethnic groups can be described by a mean occupational vdtlue
of approximately the same rank, 5.59 and all four ethnic groups
exhibit about the same degree of variability around this mean.
A mean of 5.5 on the 8-point sole would represent a lower-middle
socio-economic status rating.
On a descriptive level several factors are worth considering
about the figures in Table II. (a) Many of the occupations,
especially in ethnic group 1, can be termed "hereditary" in terms
of the sub-ethnic group to which the job holder belongs. For
2,
example, the occupation "longshoreman" is distinctly character
istic of the sub-group of Slavic descent within the larger Indo-
:Eumpean group. (b) The occupations clustering in ethnic group
tone_ to be covered by semi-skilled to skille#1 factory workpr job

9,
descriptions; occupations of the same rank in ethnic group 3, are
generally covered by offiee/worker/oleriqal aid types of desert
ptions. (o) All the ethnic groups share the janitorial-porter
types of occupations. However, among the female members of the
occupational groups considered in this study, the "night office
cleaner" of ethnic group 1, becomes the "domestic" of ethnic
group 3, and is relatively scarce in ethnic group 2.
(o) Indices of academic ability and performance; (1)
scholastic aptitude ("I.Q."), (2) verbal and mathematics aptitude,
and (3) English and mathematics achievement. Tables III through
V, which follow, give a distribution of the means and standard
deviations of scholastic aptitude scores, verbal and mathematics
aptitude scores, and English and mathematics achievement, all
three major divisions by ethnic group.
Scholastic apt17ude scores are expressed in terms of the
standard "I.Q." scores provided for the Otis Quick-Scoring Mentel
Ability Tests. Verbal and mathematics aptitude standard scores
have a potential range of total score from 20 to 80, with
standard score mean of 50, and a standard deviation of 10.
English and mathematics achievement scores are simple averages of
school grades.
The following general inferences about the academic ability
of the sample used in this study can be made on the basis of
the average group performance on the three previously desorlbed
indices.
(1) The scholastic aptitude ("I.^.") is approximately
average for this sample; this is, the mean "I.Q." clusters
around 101. The mean scholastic aptitude score for ethnic

TABLE III
10.
Mean Scholastic Aptitude Scores by Ethnic Group
grades 9 through 12
.......
Ethnic
Group
1
2
3
4
Mean s.d.
1111MOINSIlk
106.2975 9.7807 1069 68
100.3405 9.3653 326 21
101.9448 8.4656 145 9
101.0113 10.0113 39 2 1579
,laadalwEINIMONOIN MIIIIM1111111111.
TABLE IV
Mean Aptitude Scores in Verbal and Mathematics Ability
by Ethnic Group
grades 10 through 12
Ethnic Verbal
Group Mean s.d.
Hathematios
Mean s.d.
41111111111111111111,111/01k
1 37.559 9.845 37.131 8.780 818 67
2 36.672 8.883 35.602 6.735 244 20
3 37.299 8.244 36.097 7.374 136 11
4 37.037 9.632 42.370 9.329 27 2
1225=Nt
grO4 1 Ia alight/sr high61~ but not beyond the:5 average range.
(2) The "average" character of this sample is also evident
in the mean performance levels on measures of verbal and mathe-
matics aptitude. With the exception of the small number of
subjects making up ethnic group 4, who score high for the total
sample in mathematics aptitude, the mean scores in both aptitude
categories approximate 37. This score is roughly 1.3 standard
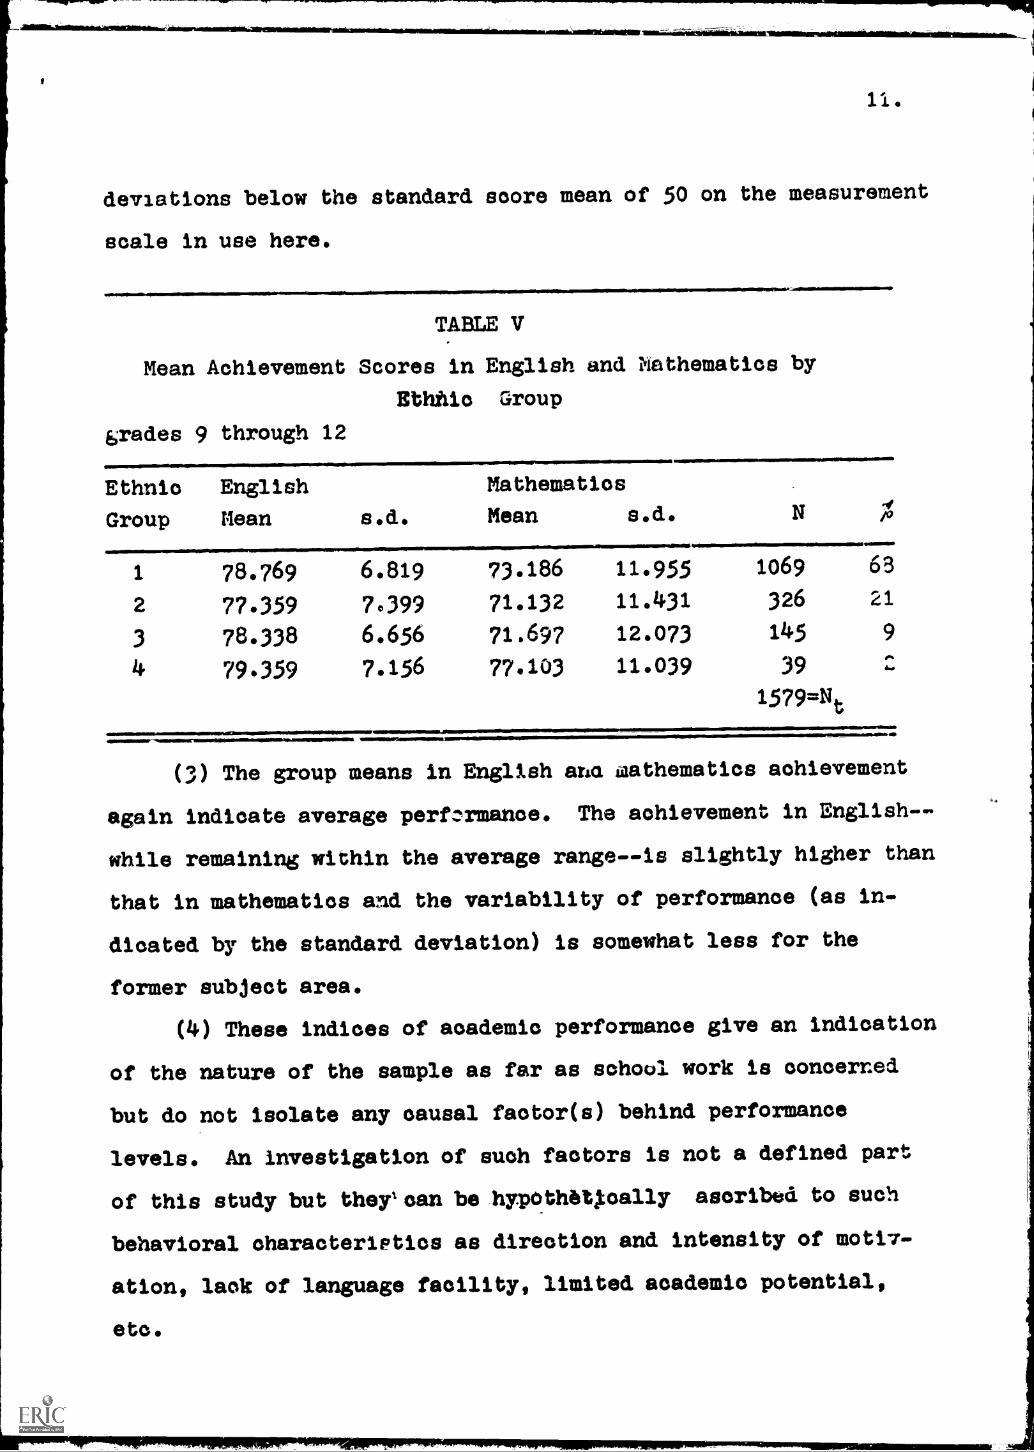
11.
deviations below the standard score mean of 50 on the measurement
scale in use here.
TABLE V
Mean Achievement Scores in English and Mathematics by
Ethnic Group
grades 9 through 12
Ethnic English
Group Mean s.d.
Mathematics
Mean s.d. N
1 78.769
2 77.359
3 78.338
4 79.359
6.819 73.186 11.955 1069 63
7.399 71.132 11.431 326 21
6.656 71.697 12.073 145 9
7.156 77.103 11.039 39
1579=Nt
-.01111111111MIrMOS 411111111MININNIIMIMIL.111111111MMINEIMIlltall=11111.
(3) The group means in English ana mathematics achievement
again indicate average performance. The achievement in English- -
while remaining within the average range--is slightly higher than
that in mathematics and the variability of performance (as in-
dicated by the standard deviation) is somewhat less for the
former subject area.
(4) These indices of academic performance give an indication
of the nature of the sample as far as school work is concerned
but do not isolate any causal factor(s) behind performance
levels. An investigation of such factors is not a defined part
of this study but therean be hypothetically ascribed to such
behavioral characteristics as direction and intensity of motiv-
ation, lack of language facility, limited academic potential,
etc.

(1.)P 4.
Analysis or Bosuns
4.. . 1i`44: 4
lrr0u C lid e d 1 0.
' . * 4 P
b eS,.1111111111
Product-moment coefficients of correlation were computed
between scores obtained by the -simple of students On (a) the
Standard Progressive Matrices (1918) and 13 independent variables
whioh included indices of acadomic potentials and (b) The D. 48
Test and the same independent variables. Tables VI and. VII Show
the inter-correlstions among these variables.
Two multiple regression Onalyeess one from the inter-correl-
ations of the icores on the Standard Progressive Matrices (1938)
and the other tar he D. 48 Test *cores Were completed. The
purpose of the calculotiono was to obtain an indication of the
degree of preective relstionehip Which existed between (a) the
Standard Progressivelletzices (3938) and (b) The D. 46 Test and
academic potentials ethnic group membership, cultural atatua and
years Or high school completed sito measured in terms of the
specific independent varlobles ustld in this investigation.The independent variables (and identifying numbers) were
I.fl. Variable
Tear In lotiool: I through, 4 Viers.
2 " -5 MO* tOloup6 = 7 Scoieweednomio atatua.by ocogpational ra4k: (6) SAIrized
Mtnnesoto Ocouttotional Rating &tali, and 471 Warner'syoupationia rating eoale.
Sbhdlestto aptitude ("Z... "4
9 - 10 Varbal (9) and mathematics (10) mitiAmida.
11 12 wish (11) .anid Sithematios U2) a4hievement.

%.40 0
c0.
AeiN
sC
rcr
1.ai
i9
E4
E4
.4I AP.M
13..4
4I
Ie
.0
ra -44.
44IC0
Oile
IC0
riaSil
b314
co Itin
1-4co
9044
44*4
aGrade
-.o6
-.01,00
.02.05
.06 -.06
-.13 -.17 -.03 -.03
.35
.16
E.G.-1
-.06
-.69 -.52 -.18
.09
.05
.27
.07
.08
.06
.02 -.08
.06
E.G.-2
-.01 -.69
-.20 v.07 -.08 -.02
-.22 -.06 -.07 -.08
-.01 -.06
.01
E.G.-3
.08 -.52 -.20
-.05 -.03 -.06 -.10 -.04
-.07
.00 -.03
.16 -.10
E.G. -4
.02 -.18 -.07-.05
.02
.03 -.03
.02
.10
.02
.06
.07
.04
S.E.S.-
Minn.
.05
.09 -.08 -.03
.02
.89
.19
.12
.10
.02 -.02
.04
.10
S.E.S. -
Warner
.06
,05 -.02 -.06
.03
.89
.16
.09
.08
.01 -.04
.06
.11
n.(4.11
-.06
.2? -.22 -.10 -.03
.19
.16
.62
.58
.51
.30
.14
.35
S.A.T.-V
-.13
.0? -.06 -.04
.02
.12
.09
.62
.61
.59
.30
.16
.21
S.A.T.-R
-.17
.08 -.07
-.07
.10
.10
.08
.58
.61
.38
.41
.21
.34
ish.-Eng.
-.03
.06 -.08
.00
.02
.02
.01
.51
.59
.38
.58
.30
.20
Ach. -M
-.04
.02 -.01 -.03
.06 -.02 -.04
.30
.30
.41
.:8
.38
.27
Yrs.-Math.
.36 -.08 -.06
.16
.0?
.04 -.06
.14
.16
.21
.30
.38
.23
P.R.('38)
.16
.06
.01 -.10
.04
.10
.11
.35
.21
.34
.20
.27
.23

oN0 .4o
00a3
0
co I' E's
I! rd N3 04 al a3 i-i a) 44 440 0 0 ON to 40.44X 0 0X
D. 48 .17 006 -.05 -.04 .03 .08 .07 .21 .18 .33 .24 .38 .25
Grade .17 -.05 -.01 .14 -.06 .06 .08 -.07 -.30 -.37 -.04 .04 .66
E.G.-1 .06 -.05 -.75 -.44 -.25 .12 .09 .03 .12 .11 .09 .04 -.07
E.G.-2 -.05 -.01 -.75 -.15 -.08 -.13 -.09 -.01 -.09 -.09 -.to -.05 -.05
E.G.-3 -.04 .14 -.44 -.15 -.05 -.01 -.03 -.4 -.06 -.10 -.01 -.04 .19
E.G.-4 .03 -.06 -.25 -.09 -.05 -.02 -.01 -.02 -.03 .08 .02 .06 .01
S.E.S.-Minn. .08 .06 .12 -.13 -.01 -,02 .88 .02 .10 .07 .05 .03 .08
S.E.S.-Warner .0? .08 .09 -.09 -.03 -.01 .88 .01 .09 .06 .04 .02 .09
n.Q." .21 -.0? .03 -.01 -.04 -.02 .02 .01 .12 .32 .01 .04 .02
S.A.T.-V .18 -.30 .12 -.09 -.06 -.03 .10 .09 .12 .70 .57 .34 -.07
S.A.T.-N .32 -.37 .11 -.09 -.10 .08 .07 .06 .32 .70 .43 .41 -.14
Aoh.-Eng. .24 -.04 .09 -.10 -.01 .02 .05 .04 .01 .57 .43 .61 .17
Aoh.-N .38 .04 .04 -.05 -.04 .06 .03 -.02 .04 .34 .41 .61 .27
Yrs. -Math. 25 .66 -,07 -.05 .19 .01 .08 ,09 .02 -.07 -.14 .17 .27

13 Years of high school mathematics completeds 1 through4 years.
Data presented in Table VIII gives the coefficient of
multiple correlation (R) between scores on the Standard Progressi7,:
Matrices (1938) and the 13 lAdependent Variables as .4681, In
TABLE VIII
Multiple Correlation Coefficients (adjusted), Coefficients of
Multiple Determination (adjusted), Coefficients of Multiple
Non-Determination, and Standard Errors of Multiple R for the
Standard Progressive Matrices (1938), The D. 48 Test and 13
Independent Variables
Test NoR
0
P.M.(1938) 753
D.48 Test 1265
.4681 5.3514 .2191 .7809
.5121 5.3786 .2622 .7378
1111111111111111111111111011111111111111111111111111111111111111111%.
this case the coefficient of multiple determination (RiZ) in-
dicates that 21.91$ of the variance in the Standard Progressive
Matrices (1938) scores is accounted for by the iraCiance..in scores
on measures of the independent variables; 78.09% of the variance
is not determined. The R between The D. 48 Test scores and the
same 13 independent variables is .5121. The Ra associated with
this multiple correlation coefficient shows that 26.22% of the
variance In The D. 48 Test scores is accounted for by variance
in scores on measures of the independent variables; 73.70 of
the variance is still to be accounted for.
One could jay that for the sample under study they combin-
ation of 13 selected independent variables, for the most part
associated with performance .in school, would be approximately 22%
efficient in predicting Standard Progressive Matrices (1938)

16.
coreei 26X efficient in predieting this group*0 esteres On TheD. ke Test.
The stangsta partial, regreseion. 0,cetfibient* ctietficients)are bated In Table IX* Those taitigeldent iter&Oples inaki44S- Olga-ftcarst cottitribtationis to predietivi of Mores Mn the tr0areateiveMetric** (1958) are matheratice attitude and achievismitt. yearin intheel end scholastic aptitude ( "I1.0*.). 1:14trittergiettt Variables.
making significant contributione to the peetiettelk Of .ticCires on
The D. 49 Test are mathematies eptiltutie achtettementy. /tear inschool, soholastio aptitude (st.Q.,11) and ntuiteX of ye *a et highschool methemmtles oenfletell.
The sigteticasto et the e0Istrititzti a e thii wisdeelCielente
should, be il)Iterpretted in terms of the obtieliied oceffielente ofmultiple ottrwelatteit.% For aerie, vartanikes in "sores on
measures of mathexyltice aptitude and eehievement, sZ Q.*. and
years ot high school comply woull sake signiflotint contrtbu-tiens o predicting 20 of the vat:banes in the scores Obtainedon the Standard Progrese.tve anti-toe (1938).
Portia correlation coefficients between the &Implantvariables and each independent variable are listed it tiblo X.No coefficient Indicates a strong relationship between thevariables. Partial coefficients of correlation between *cores Onthe Standard Progressive Retries. (1938) *ad nethemattosaptitude and achievement and scholastic aptituao (isti.Q.") aresignifieently different from hypothesized ooeffisients of Zero.Partial soeffiolente of correlation between mores en !rho D.48Test and the same three independent veriabtes are signifieent..

TABLE IX
Standard Partial Regression Coefficients ((3) for the Standard
Progressive Matrices (1938), and The D. 48 Test and 13 Independent
Variables.
P.M.(1938), 112153
Variable f3 -ooIffioient
1
2
3
456
7
8
9
10
11
12
13
**t .01*t sig. .05
.1863**
-.0439
:0317
m-.0894
.0064
-.0556
-.0982
.2599**
-.0916
.2661**
-.0515
.1386**
.a647
aumumatimININPrIreii*
D. i8 Test, N=1265
p-ooefficient
.2265**
.0193
-.0023
-.0417
.0413
.0116
.1167**
.3343"
-.0162
.23o1**
X0857*

153.
St001.11 X
Partial Coefficients of Octave lotion botiteen the Standard Pro-gressive Matrices (1938) and The D. 46 ?est and 13 Independent
Variables41111144NNIONMgmeN.P.M.(1938), N=753
Variable parttal coefficient
1
2
3456
78
910
11
1213
**t sig.) .01*t sig. .05
.1866-.00003
.00002-.00008
.00001-.0287-.0507
01972**-.0671
c1750**-00385
.1155*
.0605
D. 48 Test, N=1265partial, coefficient
*1801.00001
-.000001...00004- .00002
.0224
.0063
.1249*-.0485
.2306**-.0128
.1906**
.0695
ANION1111011111111=111011111101111111111MNINIMOSIE

The following genera14,zations can be drawn from the preced-
ing data and stated in terms of the sample stuaed in this in-
vestigation.
(1) The scores on neither the Standard Progressive Matrices
(1938) nor The D. 48 Test give evidence of being validly pre-
dicted from academic performance when such performance is
measured in terms of the variables described above. Approximately
one-fifth of the variance in the scores obtained On the former
instrument is accounted for by variance in scores obtained on
measures of the stated independent variables, including indices
of academic performance, used in this study; about one-fourth of
the variance in scores obtained on the latter instrument is
accounted for by variance in thecindependent variables.
(2) The standard partial regression coefficients (443-coef-
ficients) which contribute significantly to predlotion of scores
on the Standard Progressive Matrices (1938) and The D. 48 Test
are those assosted with mathematics aptitude and achievement,
scholastic achievement ("I..") and years of high school
completedv .
(3) The partial coefficients of correlation between scores
on the Standard Progressive Matrices (1938) and scores on The
D, 48 Test and the scores obtained on measures of the indepen.-
dent variables show a significant relationship between scores
on the two instruments and mathematics aptitude and achievement
and scholastic aptitude ("I.Q.").
(2) TThe relationshi between scores on the Standard Pro essive
matritmaL12221114122201122TblaaLktal
Coefficients of correlation among certain variables were
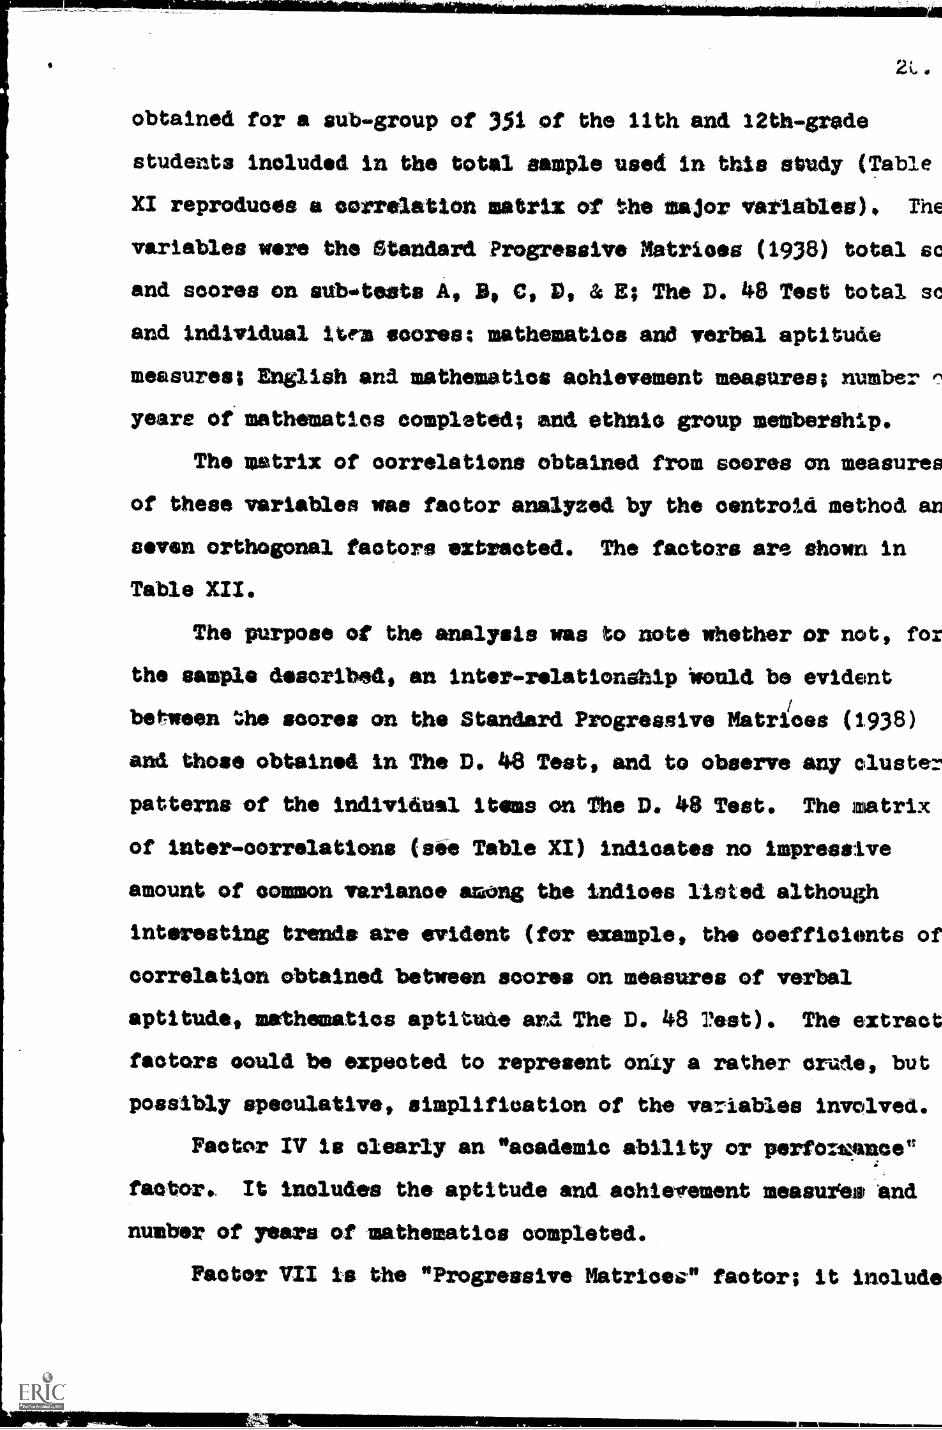
obtained for a sub-group of 351 of the 11th and 12th-grade
students included in the total sample used in this study (Table
XI reproduces a correlation matrix of the major variables). The
variables were the Standard Progressive Matrioes (1938) total sc
and scores on subitests A, C, D, & E; The D. 48 Test total sc
and individual Item scores; mathematios and verbal aptitude
measures; English and mathematics achievement measures; number
yeare of mathematics completed; and ethnic group membership.
The matrix of correlations obtained from scores on measures
of these variables was factor analyzed by the centrold method an
seven orthogonal factors extracted. The factors are shown in
Table XII.
The purpose of the analysis was to note whether or not, for
the sample described, an inter-relationahip Would be evident
between the scores on the Standard Progressive Matrices (1938)
and those obtained in The D. 48 Test, and to observe any lust
patterns of the individual items on The D. 48 Test. The natrix
of inter-oorrelations (see Table XI) indicates no impressive
amount of oommon variance among the indices listed although
interesting trends are evident (for example, the coefficients of
correlation obtained between scores on measures of verbal
aptitude, mathematics aptitude and The D. 48 2est). The extract
factors could be expected to represent only a rather crude, but
possibly speculative, simplification of the variables involved.
Factor IV is clearly an "academic ability or perfotamuce"
factor.. It includes the aptitude and achievement measures And
number of years of mathematics completed.
Factor VII is the "Progressive Matrioegm factor; it include
111111

TABLE XI
Coefficients of COrrelattion Among Scores Obtained on Stated
Variables by 351 11th and 12thograde Girls
a)Apt.IF .60 .69 .40 .25 .29 .19 .15 .24 .32 .20 .31
b)Apt....M .60 .52 .52 .26 .30 .33 .28 .40 .46 .44 .40
e)Aoh.E .69 .52 .60 .19 .26 .17 .09 .17 .24 .21 .29
d)Aoh-M .40 .52 .60 .21 .22 .25 .i5 .30 .33 .35 .39
e)P.M..A* .25 .26 .19 .21 AO .20 .27 .32 .53 .30 .20
OP.M.-B* .29 .30 .26 .22..40 .38 .39 .43 .72 .39 .22
E)P.C.4* .19 .33 *17 *25 .20 .38 037 .42 .6g .43 .10
h)P.m..D* .15 .28 .09 .15 .27 .39 0? .37 .65 .36 .13
i)P.M.-E* .24 AD .17 .30 .32 .43 .42. 37 .83 .49 .15
PP14..1- .32 044 .24 .33 .53 .72 4069 .65 .83 .58 .22k)D.48++ .20 .44 .21 .35 .30 ,39 .43 .39 .49 .58 .191)Yrs-M .31 .40 .29 .39 .20 .22 .10 .13 .15 .22 .19
ramogorrwriuwarigarataftabsommirriworsownsamassosivoirmaiiwinorristrawirseasaysimilsr
21.
b) e) e) g) it) I) 3) k) 1)
*Progressive Matrioes (1938) sub-test.
+Progressive Matrioes (1938) total coore.
++The D. 48 Test total soore.

22.
the total scwree and five sub-test scores of this instrument, and
one D. 48 Test item, #23.
The 43 remaining items and total score on The D. 48 Test
cluster in factors I, II, III, V, and VI as follows:
Factor Item Numbers
I 19, 14, 16, 18, 17, 21, 10, 15, 2! , 24, 1.
II 44, 43, 39, 41, 42, 36, 40, 37, 38.
III 13, 3, 5, 11, 6, 4, 2, 7, 12, 10.
V 30, 29, 27, 28, 32, 33, 31, 25, 26, total score-D.48.
VI 9, 8, 34, 35.
(VII 23.)
The clustering of the individual items on The D. 48 Test
according to the patterns indicated above is based on no simple
causative characteristic pervasive in any one factor group. One
could tentatively consider that the clusters were the result of
events such as the following: (1) the format of the questions,
(2) specific characteristics introduced by the sample used in
this study, (3) the nature of the inter-correlations on which the
analysis was based, (4) solutions for one group of test items
rested more on analytical or verbalized techniques while those
for another group were available to synthetic or intuitive types
of solution, etc.
The analysis does reinforce the lack of relationship between
the scores on the Standard Progressive Matrices (1938) and the
scores on The D. 48 Test evident in the coefficient of correlation
of .57 obtained in this study between the two instruments. 68%
of the variance in the scores on the Standard Progressive Matrices
(1938) is not accounted for by the variance in the scores on The
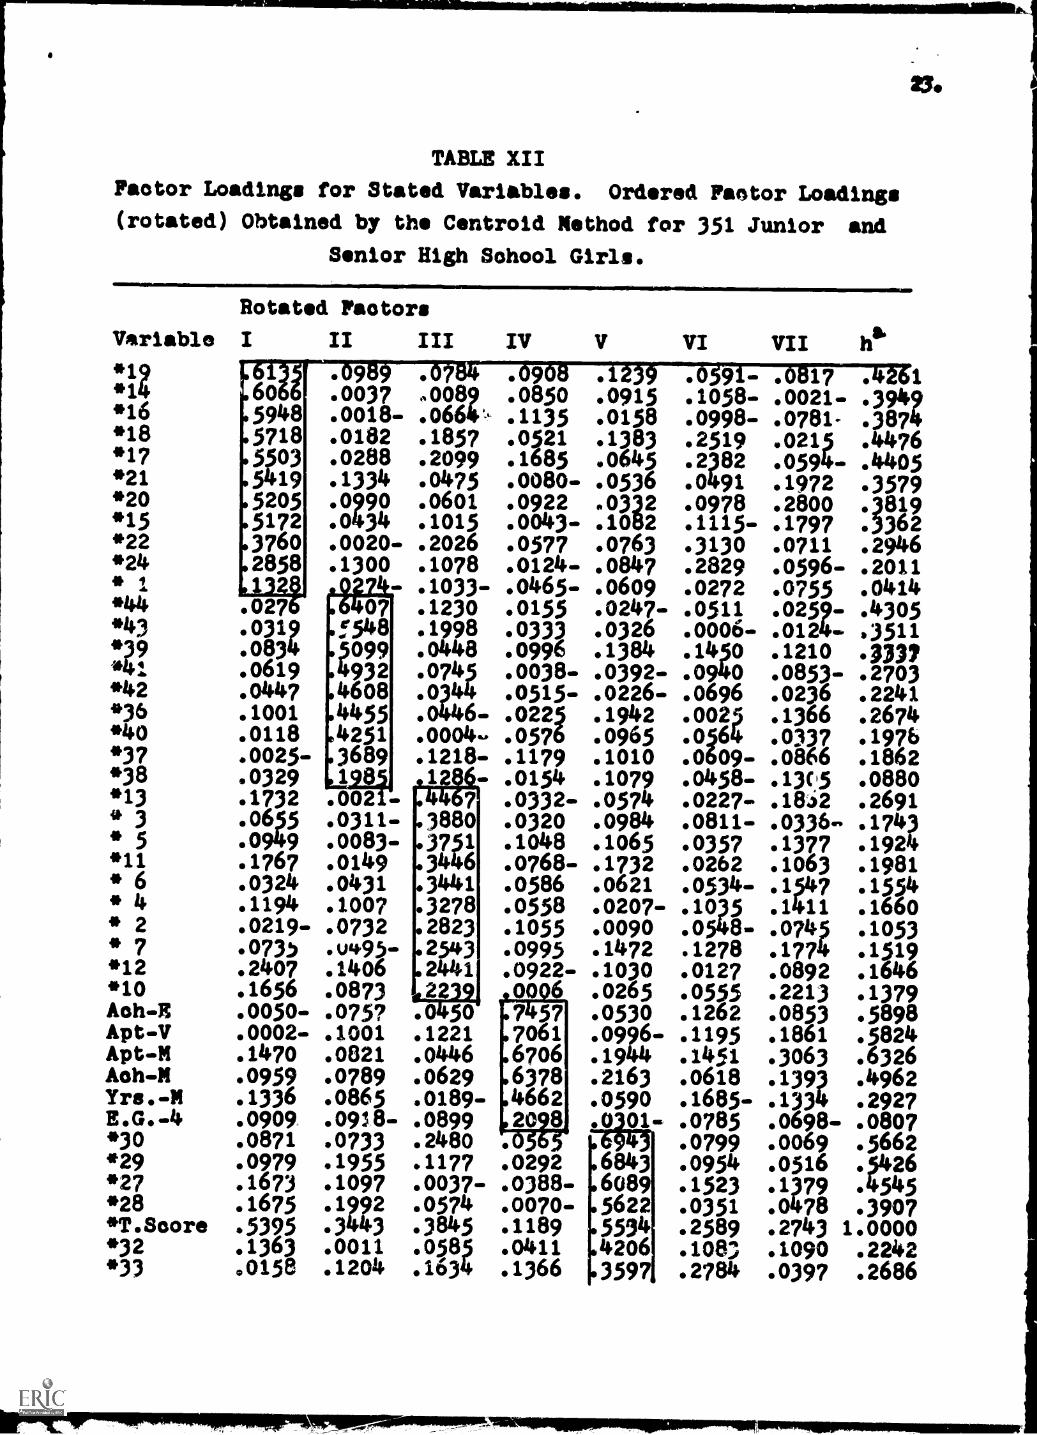
TABLE XII
Factor Loadings for Stated Variables. Ordered Faotor Loadings
(rotated) Obtained by the Centroid Method for 351 Junior and
Senior High School Girls.
Variable
*19*14*16*18*17*21*20*15*22*24* 1'44*43*39*44*42*36*40*37*38*13* 3* 5*11* 6** 2* 7
*12*10Aoh -EApt-VApt-MAoh-MYrs.-ME.G.-4* 0*239
*27*28*T.Soore*32*33
Rotated Factors
I II III IV
9 =9 960 .0037 .0089 .0850 .09155948 .0018- .o664a, .1135 .01585718 .0182 .1857 .0521 .13835303 .0288 .2099 .1685 .06455419 .1334 .0475 .0080- .05365205 .0990 .0601 .0922 ,03325172 .0434 .1015 .0043- .10823760 .0020- .2026 .0577 .07632858 .1300 .1078 .0124- .0847134 .1033- .0465- .0609
.0276 07 .1230 . 0155 .0247-
.0319 .5548 .1998 .0333 .0326
.0834 1.5099 .0448 .0996 .1384
. 0619 .4932 .0745 .0038- .0392-
.0447 1.4608 .0344 .015- .0226-
. 1001 .4455 .046- .o225 .1942
.0118 .4251 .0004- .0576 .0965
.0025- 3689 .1218- .1179 .1010
.0329 1 8 1 .0154 .1079
. 1732 .002 7 .0332- .0574
.0655 .0311- 3880 .0320 .0984
.0949 .0083- 3751 .1048 .1o65
. 1767 .0149 3446 .0768- .1732
.0324 .0431 3441 .0586 .0621
. 1194 .1007 .3278 .0558 .0207-
.0219- .0732 2823 .1055 .0090
.073) .u495- 2543 .0995 .1472
.2407 .1406 2441 .0922- .1030
. 1656 .0873 22 J2991 .0265
.0050- .0757 50 »7457 .0530
.0002- .1001 .1221 7061 .0996-
. 1470 .0821 .0446 .6706 .1944
.0959 .0789 .0629 .6378 .2163
. 1336 .0865 .0189- .4662 .0590
.0909. .0918- .0899 2098 0 01-
.0871 .0733 .2480 .0565
.0979 .1955 .1177 .0292 .6843
. 1673 .1097 .0037- .0388- .6089
. 1675 .1992 .0574 .0070- .5622
.5395 .3443 .3845 1189 5534
. 1363 .0011 .0585 .0411
.0158 .1204 .1634 .1366 3597'F4206
V VI VII ha.
9 17 1. 1058- .0021- .3949.0998- .0781- .3874.2519 .0215 .4476. 2382 .0594- .4405. 0491 .1972 .3579. 0978 .2800 .3819. 1115- .1797 .3362.3130 .0711 .2946.2829 .0596- .2011.0272 .0755 .0414.0511 .0259- .4305.0006- .0124- .3511. 14,0 .1210 337. o 94o .0853- .2703.0696 .0236 .2241.0023 .1366 .2674.0564 .0337 .1976.0609- .066 .1862.0458- .13(5 .0880.0227- .18S2 .2691. 0811- .0336- .1743.0357 .1377 .1924.0262 .1063 .1981.0534- .17 .1554. 1035 .1411 .1660.0548- .0745 .1053. 1278 .1774 .1519.0127 .0892 .1646.0555 .2213 .1379. 1262 .0853 .5898. 1195 .1861 .5824. 1451 .3063 .6326.0618 .1393 .4962. 1685- .1334 .2927.0785 .0698- .0807.0799 .0069 .5662.0954 .o516 .5426. 1523 .1 79 .4545.0351 .0478 .3907.2589 .2743 1.0000. 108; .1090 .2242. 2784 .0397 .2686

Table XII
Variable*31*
*
5
E.G.-1* 9E.G.-2E.G.-3* 8*34*35+T.Soore
+B+D+C+A*23
MIS
(oont'd)
Rotated Factors
I II III IV
7U7g3-7033=0"24 .2 7.0546 .0706- .1216 moo. 1058..0638-. 1349.0440-.0369.0000.0031-. 1147. 1845
.2142
. 1425
. 1666
. 1233
.0798
.0137-
V
312288
.0261- .044o .0968
. 1606 .2259. .0473
. 02012037
.0426. 1367- .1368 .0941-.0259- .0491 .0465-.0402 .2941 .0557-.0134 .0733 .1711.0907 .0937- .0840.0894 .1976 .1142.0826 .1296 .1137.0537 .1895 .17??.0410 .1603 .0842.0451 .2168 .0842. 1110 .1706 .2152.0309 .1539 .0687
1
VI VII ha.
211.
208. 15. 1870. 1848-,0133. 1629. 1818. 2042.1590.21582.015.0876. 1934.0140-. 1011
.09093-ASUAA='.6697
.3775
.3769n
.3638-
.3063
.2688
.211
. 1542
.2020
.06,0
.0263
. 1719
.0325
. 1351-
o 3. 302 .9 =05 3
4.2042 .1300. 1936 .1052.0220 .5573.2120 .2843. 1287 .2468. 1388- .1584.2125 .2567.1823 .17344 .1479
1.0000.54.48912
6
.3596
.3883
.2915
.0864
19.3 77
9290.6368.6018531
.49898
. 4291687
hind: .1891 .1274 .1093 1347 .1618 .1024 .1767
*: individual item or total score on The D. 48 Test.
+: sub-test score or total score on Standard ProgressiveMatrices (1938).

D. 43 Test in spite of the described "good fv-test" quality of
each instrument.
(3) The erformanoe of the = am le of hi_h school students on the
gmugvetiStsndardPivilvlaid.ThsD.... 48 Test.
The means and standard deviations of the scores obtained by
the sample, classified by year in school and ethnic group member-
ship, on the Standard Progressive Matrices (1938) and The D. 48
Test are given in Tables XIII and XIV.
These group scores indicate that the two instruments tend
to discriminate between year in school (grade 9 through 12) but
not between ethnic group, excluding the Chinese group from the
analysis of data. This trend is more noticeable in The D. 48
Test scores than in those obtained on the Standard Progressive
Matrices (1938)--probably because the sample distributes itself
more judiciously among year in school and ethnic group membership
cells in the former case.
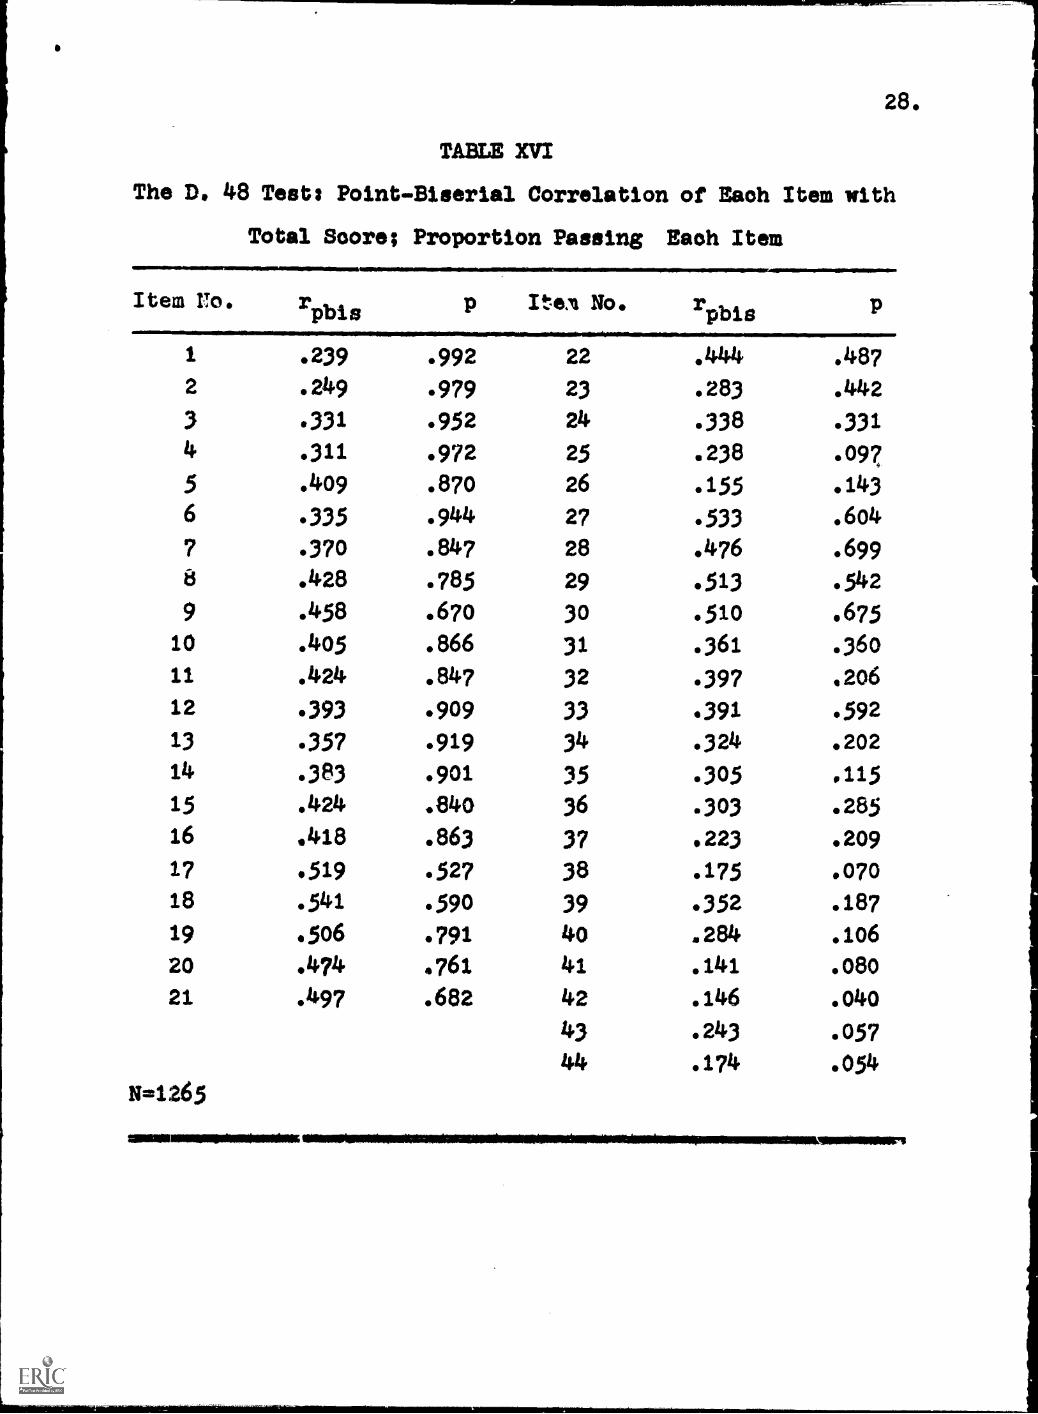
From Tables XV and XVI the following inferences may be made
about the two tests.
(1) Point-biserial correlations of items with total score and
proportion of the sample passing each item indicate that The D. 48
Test has the potential to discriminate among a sample of testees
in terms of increasing level of difficulty. Several of the items
of misplaced difficulty level should be interchanged to maximize
this potential.
(2) The Standard Progressive Matrices (1938) is a cyclic
test; one would expect to note between as well as within sub-
tests an increasing difficulty level. On the basis of scores
obtained for the sample used in this study, the test structure

26.
TABLE XIII
Standard Progressive Matrices (1938) and The D. 48 Test: Mean
Performance by Year in Sehooll
Year in P.M.('38)
School Mean s.d.
D.48 Test
N Mean s.d. N
4 48.18*
3 47.44
2 45.91*
1 4141g!*
5.2585 367 25.33**
5.1991 241 24.34
5.9686 87 23.77
1...,18A66
47,49 5.5682 737 23,94
lEthnio group 4 not included in analysis.
**t sig. > .01; *t sig.> .05
5.3983 361
5.5896 261
5.6784 282
. 80 0
5.6367 1234
TABLE XIV
Standard Progressive Matrices
Performance byIIIIIINIIMMOIDIO41111111111111101111M110111111111111.1111111=
(1938) and The D. 48 Test: Mean
Ethnic Group
Ethnic P.M.('38)
Group Mean s.d.
D.48 Test
N Mean s.d. N
1 47.75 5.1482 486
2 47.36 5.6293 162
wmt 47.49 5.5682 737
24.20
23.41
210423.94
5.9009 869
5.6427 263
1:191.2.12?5.6367 1234

27.
TABLE XV
Standard Progressive Matrices (1938): Point-Biserial Correlations
of Each Item with Total Score and of Sub-Test Scores with Total
Score; Proportion Passing Each Item. N = 753
Item No. rpbisItem No. r
pbis=11111101111011.
A - 1 -.022 .999 C - 1 .001 .9892 .038 .990 2 .252 .95,3 -.010 .999
Z.169 .97
4 .061 .995 .200 .83/1
5 .153 .),96 5 .273 .9526 -.040 .999 6 .228 .837
8 .182 .9Liz 87 .305
.303 .596.9187 .213
e9Y*1
9 .168 .984 9 .150 .85410 .208 .959 10 .3p .58011 .340 .882 11 .245 .58412 .338 .715 12 .186 .101
A-total so. .570 C-total so. .626
B- 1 .088 .993 D- 1 .140 .9992 .161 .989 2 .126 .981
.951 43 .126
.186.997.9314
.118
.240.992
5 .370 .926 5 .129 .9676 .304 .898 6 .206 .9687 .342 .829 7 .257 .8548 .331 .861 8 .337 .8349 .319 .919 9 .263 .80710 .33 .952 10 .360 .85711 .324 .899 11 .129 .319
.12 376 .705 12 .251 .274B-total so. .684 D-total so. .611
E - 1 .2742 .4033 .3774 .5265 .5176 .3647 558 .1+39
9 .32110 .31911 .04412 .020
E-total so. .757
.862
.807
69.738. 7.761.566
.462
.402
. 187
.045
. 106
28.
TABLE XVI
The D. 48 Test: Point-Biserial Correlation of Eaoh Item with
Total &sore; Proportion Passing Eaoh Item
Item Va. rpbis p IteA No. rpbis
1 .239 .992 22 .444 .487
2 .249 .979 23 .283 .442
3 .331 .952 24 .338 .331
4 .311 .972 25 .238 .097
5 .409 .870 26 .155 .143
6 .335 .944 27 .533 .604
7 .370 .847 28 .476 .699
8 .428 .785 29 .513 .542
9 .458 .67o 3o .510 .675
10 .405 .866 31 .361 .36o
11 .424 .847 32 .397 .206
12 .393 .909 33 .391 .592
13 .357 .919 34 .324 .202
14 .383 .901 35 .305 .115
15 .424 .84o 36 .303 .285
16 .418 .863 37 .223 .209
17 .519 .527 38 .175 .070
18 .541 .590 39 .352 .187
19 .506 .791 40 .284 .io6
20 .474 .761 41 .141 .080
21 .497 .682 42 .146 .040
43 .243 .057
44 .174 .054
N=1265
296
appears to implement the pattern of inoreasing sub-test and
test item difficulty. Sub-tests A and B contain too many easy
items to discriminate efficiently among %Nmilz suojects
Conclusions
The following conclusions concerning the Standard Progressive
Matrices (1938) and The D. 48 Test are drawn from analysis of date
gathered for a sample of 1579 high school girls of differing ethni'
and cultural backgrounds.
(1) Scores on the Standard Progressive Matrices (1938) and
The D. 48 Test appear to be related to measures of mathematics
aptitude and achievement. One can hypothesize that this relation-
ship probably has itn base in facility in or preference for
reasoning with symbolic types of material.
(2) Neither the Standard Progressive Matrices (1938) scores
nor those on The D. 48 Test are validly predicted from indices
of academic performance used in this study. Only about one-fifth
of the variance in scores obtained on the former test and one-
fourth of the variance in scores obtained on the latter were
accounted for by variance obtained on measures of the independent
variables used in this analysis.
(3) Scores on the Standard Progressive Matrices (1938) and
The D. 48 Test appear to discriminate successfully between high
school years. The two tests do not appear to differentiate
among ethnic groups used in this study. However, the four ethnic
groups has the same mean occupational status rank, 5.5. The
instruments may differentiate within ethnic groups as one moves
up or down the socio-economio ranks.
(4) The construction of The D. 48 Test is faulty in terms of
increasing difficulty level of tile items. However, it seems to
have a more appropriate ceiling for'use with this group than the
Standard Progressive Matrices (19,8).
(5) Both the Standard Progressive Matrices (1938) and The
D. 48 Test are described as "g0divotestsw. Nevertheless, the
instruments appear to be measuring different aspects of
intellectual capacity. In this study only about 32% of the
variance in the scores obtained on the Standard Progressive
Matrices (1938) tai accounted for by variance in scores obtained
on The D. 48 Test.

)1
Bibliography
Burke, H. R. Raven's Progressive Matrices: A review and critical
evaluation. g.....genet. Payehol., 1958, 93, 199-228.
Buros, 0. K. (Ed.) Sixth Menta4 'measurements Yearbook. Highland
Park: Gryphon Press, 1965.
Calonghi, L. Tests e esuilmti. Turin, Italy: Ponteficio AtenPo
Salesiano, 19:,6.
Gough, H. G., & Domino, G. The L. 48 Test as a measure of general
ability among grade school children. g consult. Ps y21121.,
1963, 27, 244-249.
Paterson, Donald G. et al. Devised Elposolaikmational_gating
Scales. Minneapolis: Univ. Minn. Press, 1953.
Pichot, P. mentaux en Paris: Presses
Universitaires France, 1949.
Raven, J. C. Guide to the Standard Progremlye Matrices. London:
H. K. Lewis, 1963.
Smith, I. M. a abilit Its educational and social
gignIalance. San Diego: Robt. Knapp, 1964.
Warner, W. L. et al. Social class in America. Glouohester, Mass.:
Peter Smith, 1957.


![Al'-t]{Ohemeroteca.ciasc.sc.gov.br/gazetaJoquinense/1909/GAZ1909004.pdf · canal, t-al'a cuja inaugul'ação offiRa::-ebid". 57 c;om 936 palavras eial vieresua Ex;'l: Rl3llrla-162$900](https://img.pdfslide.net/doc/110x75/5ea90ed14c279427554f93da/al-t-canal-t-ala-cuja-inaugulao-offira-ebid-57-com-936-palavras.jpg)