Embed Size (px)
Citation preview
Racial/EthnicDifferencesinThyroidCancerIncidenceintheUS:2007-2014Kristin Weeks, BS1,2; Amanda Kahl, MPH2 ; Charles Lynch, MD, PhD2; Mary Charlton, PhD2
1 Medical Scientist Training Program, Carver College of Medicine, University of Iowa, Grant: 5 T32 GM0073372 Department of Epidemiology, College of Public Health, University of Iowa
BACKGROUND
OBJECTIVE
METHODS
Thyroid cancer incidence rates are projected to increase by 2030 from the 8th
most common cancer currently to the 4th most common cancer.
TC incidence varies by race in an order opposite to all other head and neck, colorectal, prostate, and lung cancer.
Past studies have argued that small tumor diagnostic tools, ultrasound-guided fine-needle aspiration (US-guided FNA) and computed tomography, could be causing rising and racially/ethnically different thyroid cancer incidence rates due to variable overdiagnosis of indolent tumors. Thyroid cancer tumors believed to be overdiagnosed with US-guided FNA have papillary histologies and sizes ≤20mm at diagnosis.
RESULTS
CONCLUSION
To investigate recent age-adjusted incidence rates (AAIRs) by race/ethnicity across tumor and patient characteristics to determine their likely relationship to diagnostic technology.
SEER 18 (Surveillance Epidemiology End Result of the National Cancer Institute Registry) was used to calculate AAIRs from 2007-2014 for five races/ethnicties.
SAS (Statistical Analysis System) was used to develop logistic regression model to examine association between race/ethnicity and tumor size/histology at diagnosis.
Inclusion: microscopically confirmed malignant thyroid cancer with known ages were included (N= 93,224).
Exposure Interest: White, African American, Asian, Native American, Hispanic.
Covariates: gender, age, insurance coverage, histology (ICD-O-3), tumor size at diagnosis (AJCC), tumor stage at diagnosis (AJCC), tumor sequence, county level poverty and education.
Iowa
Seattle/Puget Sound
San Francisco/
San Jose/Monterey
LosAngeles
NewMexico
Utah
Georgia excluding AT/RG
Detroit Connecticut
Surveillance, Epidemiology, and End Results (SEER) Program: SEER 9, 13, & 18 Geographic Areas
National Cancer Institute, USA
http://seer.cancer.gov
Figure 1.1
Alaska Hawaii
Atlanta
Oakland
Louisiana
Kentucky
New Jersey
SF/SJM/LACalifornia excluding
Rural Georgia
San Francisco/Oakland, Connecticut, Detroit, Hawaii, Iowa, New Mexico, Seattle/Puget Sound, Utah, Atlanta. SEER 9 is this group.San Jose-Monterey, Los Angeles, Alaska Native Registry, Rural Georgia. SEER 13 is this group plus SEER 9.California excluding SF/SJM/LA, Georgia excluding AT/RG, Kentucky,Louisiana, New Jersey. SEER 18 is this group plus SEER 13.
AAIRs increased variably by race/ethnicity for tumors that would be (papillary and ≤20mm) and should not be (>20mm and non-papillary) overdiagnosed by US-guided FNA. • This suggests overdiagnosis is not the sole reason for increasing incidence
of thyroid cancer.
Insurance coverage affected stage/histology at diagnosis and AAIR trends. • Within each race, those privately insured have a 5 to 13-fold greater AAIR
than Medicaid, and a 15 to 40-fold greater AAIR then uninsured.• Privately insured, Whites had the highest AAIR and African Americans had
the lowest. Conversely, Medicaid/uninsured, Whites had the lowest AAIR.
Non-White race is associated with more advanced tumors than Whites• May be a difference in health care access or a delay in seeking treatment
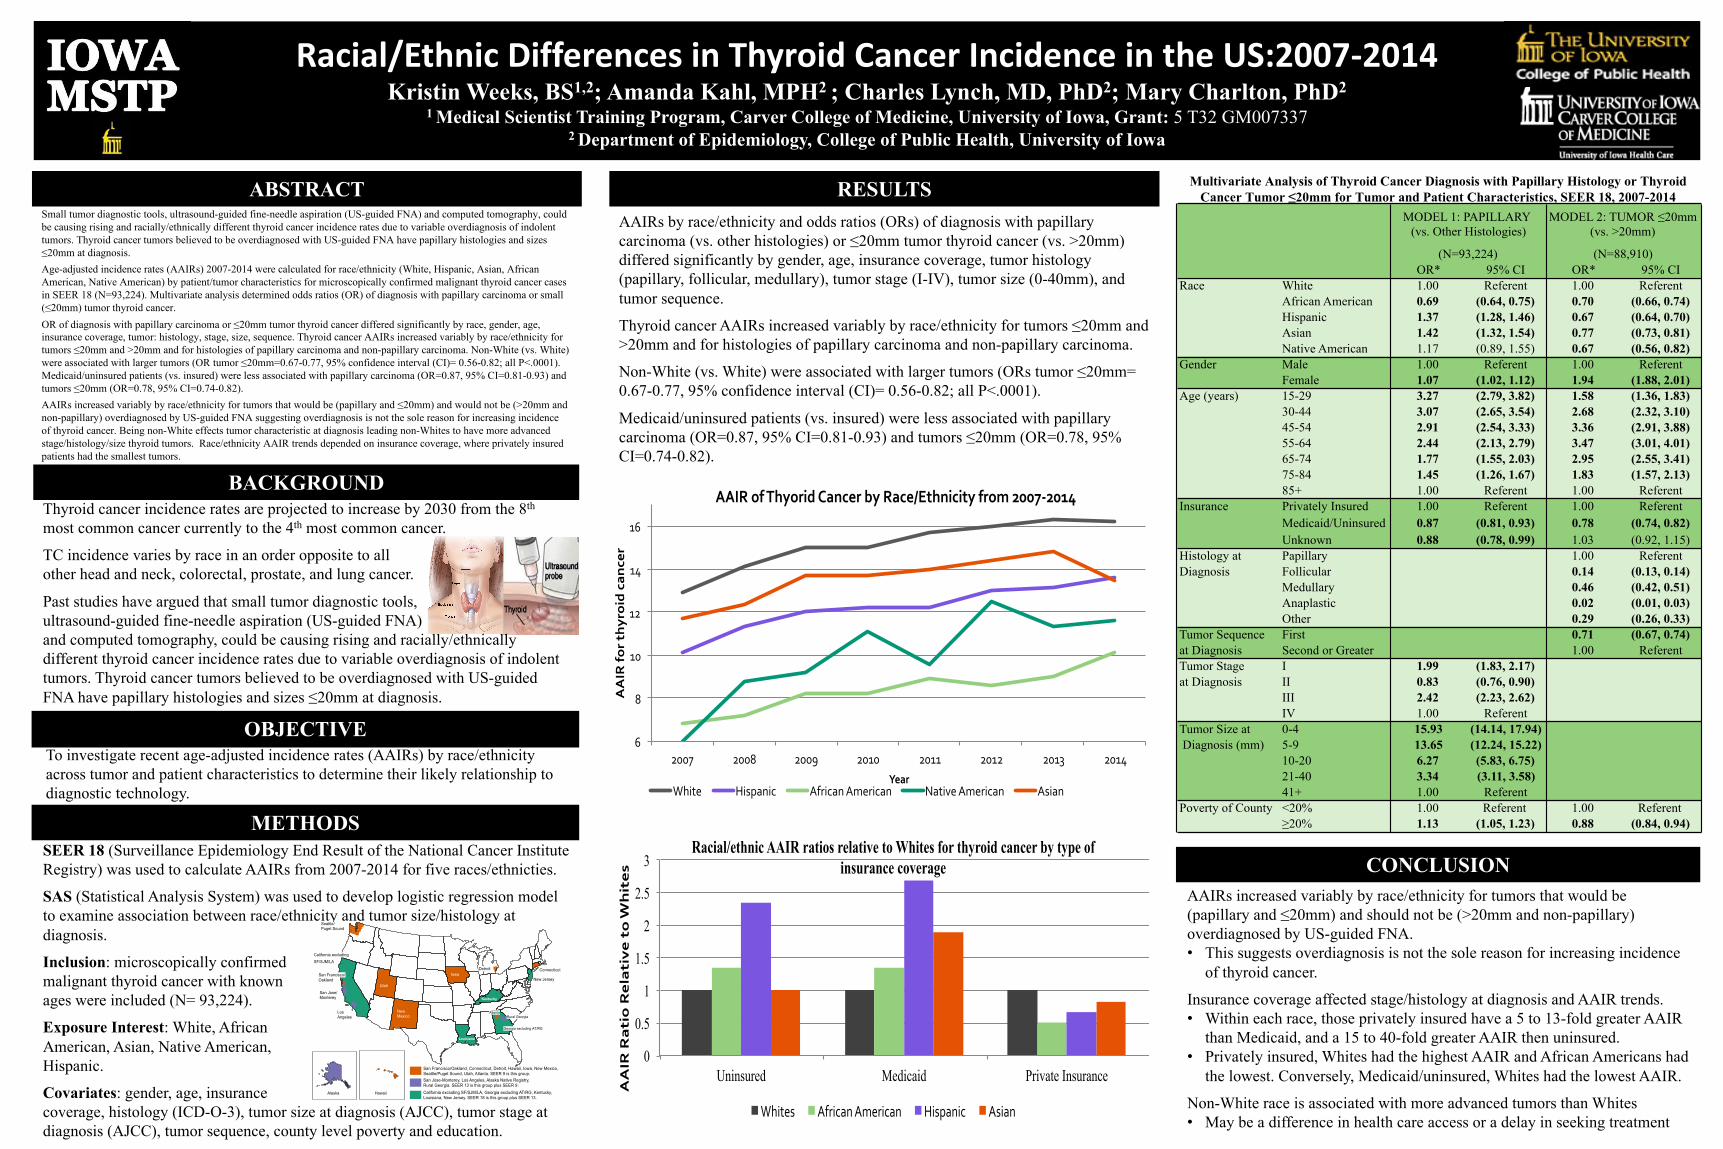
AAIRs by race/ethnicity and odds ratios (ORs) of diagnosis with papillary carcinoma (vs. other histologies) or ≤20mm tumor thyroid cancer (vs. >20mm) differed significantly by gender, age, insurance coverage, tumor histology (papillary, follicular, medullary), tumor stage (I-IV), tumor size (0-40mm), and tumor sequence.
Thyroid cancer AAIRs increased variably by race/ethnicity for tumors ≤20mm and >20mm and for histologies of papillary carcinoma and non-papillary carcinoma.
Non-White (vs. White) were associated with larger tumors (ORs tumor ≤20mm= 0.67-0.77, 95% confidence interval (CI)= 0.56-0.82; all P<.0001).
Medicaid/uninsured patients (vs. insured) were less associated with papillary carcinoma (OR=0.87, 95% CI=0.81-0.93) and tumors ≤20mm (OR=0.78, 95% CI=0.74-0.82).
Multivariate Analysis of Thyroid Cancer Diagnosis with Papillary Histology or Thyroid Cancer Tumor ≤20mm for Tumor and Patient Characteristics, SEER 18, 2007-2014
6
8
10
12
14
16
2007 2008 2009 2010 2011 2012 2013 2014
AAIRforth
yroidcance
r
Year
AAIRofThyoridCancerbyRace/Ethnicityfrom2007-2014
White Hispanic AfricanAmerican NativeAmerican Asian
0
0.5
1
1.5
2
2.5
3
Uninsured Medicaid Private Insurance
AAIRRatioRelativetoW
hites
Racial/ethnic AAIR ratios relative to Whites for thyroid cancer by type of insurance coverage
Whites AfricanAmerican Hispanic Asian
ABSTRACTSmall tumor diagnostic tools, ultrasound-guided fine-needle aspiration (US-guided FNA) and computed tomography, could be causing rising and racially/ethnically different thyroid cancer incidence rates due to variable overdiagnosis of indolent tumors. Thyroid cancer tumors believed to be overdiagnosed with US-guided FNA have papillary histologies and sizes ≤20mm at diagnosis.Age-adjusted incidence rates (AAIRs) 2007-2014 were calculated for race/ethnicity (White, Hispanic, Asian, African American, Native American) by patient/tumor characteristics for microscopically confirmed malignant thyroid cancer cases in SEER 18 (N=93,224). Multivariate analysis determined odds ratios (OR) of diagnosis with papillary carcinoma or small (≤20mm) tumor thyroid cancer.OR of diagnosis with papillary carcinoma or ≤20mm tumor thyroid cancer differed significantly by race, gender, age, insurance coverage, tumor: histology, stage, size, sequence. Thyroid cancer AAIRs increased variably by race/ethnicity for tumors ≤20mm and >20mm and for histologies of papillary carcinoma and non-papillary carcinoma. Non-White (vs. White) were associated with larger tumors (OR tumor ≤20mm=0.67-0.77, 95% confidence interval (CI)= 0.56-0.82; all P<.0001). Medicaid/uninsured patients (vs. insured) were less associated with papillary carcinoma (OR=0.87, 95% CI=0.81-0.93) and tumors ≤20mm (OR=0.78, 95% CI=0.74-0.82).AAIRs increased variably by race/ethnicity for tumors that would be (papillary and ≤20mm) and would not be (>20mm and non-papillary) overdiagnosed by US-guided FNA suggesting overdiagnosis is not the sole reason for increasing incidence of thyroid cancer. Being non-White effects tumor characteristic at diagnosis leading non-Whites to have more advanced stage/histology/size thyroid tumors. Race/ethnicity AAIR trends depended on insurance coverage, where privately insured patients had the smallest tumors.
OR* 95% CI OR* 95% CIRace White 1.00 Referent 1.00 Referent
African American 0.69 (0.64, 0.75) 0.70 (0.66, 0.74)Hispanic 1.37 (1.28, 1.46) 0.67 (0.64, 0.70)Asian 1.42 (1.32, 1.54) 0.77 (0.73, 0.81)Native American 1.17 (0.89, 1.55) 0.67 (0.56, 0.82)
Gender Male 1.00 Referent 1.00 ReferentFemale 1.07 (1.02, 1.12) 1.94 (1.88, 2.01)
Age (years) 15-29 3.27 (2.79, 3.82) 1.58 (1.36, 1.83)30-44 3.07 (2.65, 3.54) 2.68 (2.32, 3.10)45-54 2.91 (2.54, 3.33) 3.36 (2.91, 3.88)55-64 2.44 (2.13, 2.79) 3.47 (3.01, 4.01)65-74 1.77 (1.55, 2.03) 2.95 (2.55, 3.41)75-84 1.45 (1.26, 1.67) 1.83 (1.57, 2.13)85+ 1.00 Referent 1.00 Referent
Insurance Privately Insured 1.00 Referent 1.00 ReferentMedicaid/Uninsured 0.87 (0.81, 0.93) 0.78 (0.74, 0.82)Unknown 0.88 (0.78, 0.99) 1.03 (0.92, 1.15)
Histology at Papillary 1.00 ReferentDiagnosis Follicular 0.14 (0.13, 0.14)
Medullary 0.46 (0.42, 0.51)Anaplastic 0.02 (0.01, 0.03)Other 0.29 (0.26, 0.33)
Tumor Sequence First 0.71 (0.67, 0.74)at Diagnosis Second or Greater 1.00 ReferentTumor Stage I 1.99 (1.83, 2.17)at Diagnosis II 0.83 (0.76, 0.90)
III 2.42 (2.23, 2.62)IV 1.00 Referent
Tumor Size at 0-4 15.93 (14.14, 17.94) Diagnosis (mm) 5-9 13.65 (12.24, 15.22)
10-20 6.27 (5.83, 6.75)21-40 3.34 (3.11, 3.58)41+ 1.00 Referent
Poverty of County <20% 1.00 Referent 1.00 Referent≥20% 1.13 (1.05, 1.23) 0.88 (0.84, 0.94)
MODEL 1: PAPILLARY (vs. Other Histologies)
(N=93,224)
MODEL 2: TUMOR ≤20mm (vs. >20mm)
(N=88,910)