Embed Size (px)
Citation preview

RADIO MARKET SURVEY POPULATION, RANKINGS & INFORMATION
FALL 2017 2017 Radio Market Survey Rankings, Frequency, Type And Population: By Rank .............................. 1
2017 Radio Market Survey Rankings, Frequency, Type And Population: By Market ........................... 8
Total Survey Area Population ................................................................................................................ 15
Television DMA Markets ......................................................................................................................... 21
These population estimates are based upon Census 2010 counts updated and projected to January 1, 2018, by Claritas, LLC.
Additional markets may be added and the survey frequency of some markets may be changed during the year. All information
contained herein reflects Fall 2017 Nielsen Audio market definitions.
Copyright © 2017 The Nielsen Company (US), LLC. All rights reserved. Nielsen and the Nielsen logo are trademarks or registered
trademarks of The Nielsen Company (US), LLC.
COR-17-30094
RADIO MARKET SURVEY POPULATION, RANKINGS & INFORMATION—FALL 2017
Copyright © 2017 The Nielsen Company (US), LLC. All rights reserved.
Nielsen and the Nielsen logo are trademarks or registered trademarks of The Nielsen Company (US), LLC. 1
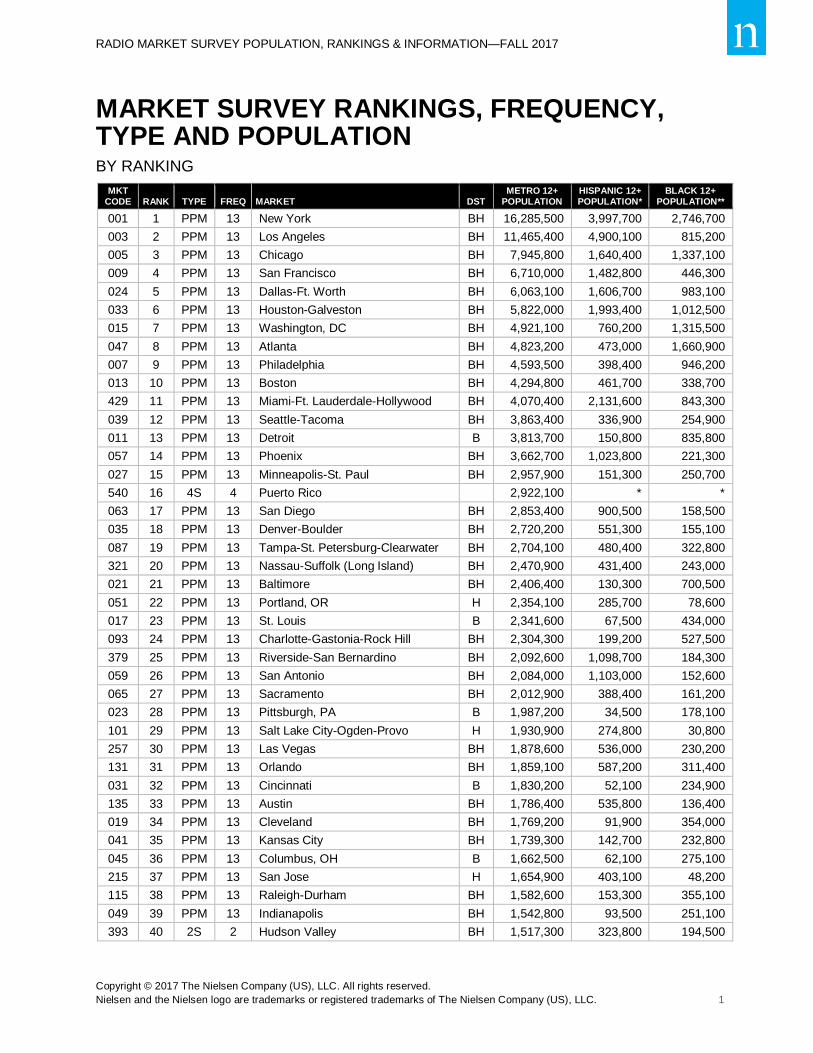
MARKET SURVEY RANKINGS, FREQUENCY, TYPE AND POPULATION BY RANKING
MKT CODE RANK TYPE FREQ MARKET DST
METRO 12+ POPULATION
HISPANIC 12+ POPULATION*
BLACK 12+ POPULATION**
001 1 PPM 13 New York BH 16,285,500 3,997,700 2,746,700
003 2 PPM 13 Los Angeles BH 11,465,400 4,900,100 815,200
005 3 PPM 13 Chicago BH 7,945,800 1,640,400 1,337,100
009 4 PPM 13 San Francisco BH 6,710,000 1,482,800 446,300
024 5 PPM 13 Dallas-Ft. Worth BH 6,063,100 1,606,700 983,100
033 6 PPM 13 Houston-Galveston BH 5,822,000 1,993,400 1,012,500
015 7 PPM 13 Washington, DC BH 4,921,100 760,200 1,315,500
047 8 PPM 13 Atlanta BH 4,823,200 473,000 1,660,900
007 9 PPM 13 Philadelphia BH 4,593,500 398,400 946,200
013 10 PPM 13 Boston BH 4,294,800 461,700 338,700
429 11 PPM 13 Miami-Ft. Lauderdale-Hollywood BH 4,070,400 2,131,600 843,300
039 12 PPM 13 Seattle-Tacoma BH 3,863,400 336,900 254,900
011 13 PPM 13 Detroit B 3,813,700 150,800 835,800
057 14 PPM 13 Phoenix BH 3,662,700 1,023,800 221,300
027 15 PPM 13 Minneapolis-St. Paul BH 2,957,900 151,300 250,700
540 16 4S 4 Puerto Rico 2,922,100 * *
063 17 PPM 13 San Diego BH 2,853,400 900,500 158,500
035 18 PPM 13 Denver-Boulder BH 2,720,200 551,300 155,100
087 19 PPM 13 Tampa-St. Petersburg-Clearwater BH 2,704,100 480,400 322,800
321 20 PPM 13 Nassau-Suffolk (Long Island) BH 2,470,900 431,400 243,000
021 21 PPM 13 Baltimore BH 2,406,400 130,300 700,500
051 22 PPM 13 Portland, OR H 2,354,100 285,700 78,600
017 23 PPM 13 St. Louis B 2,341,600 67,500 434,000
093 24 PPM 13 Charlotte-Gastonia-Rock Hill BH 2,304,300 199,200 527,500
379 25 PPM 13 Riverside-San Bernardino BH 2,092,600 1,098,700 184,300
059 26 PPM 13 San Antonio BH 2,084,000 1,103,000 152,600
065 27 PPM 13 Sacramento BH 2,012,900 388,400 161,200
023 28 PPM 13 Pittsburgh, PA B 1,987,200 34,500 178,100
101 29 PPM 13 Salt Lake City-Ogden-Provo H 1,930,900 274,800 30,800
257 30 PPM 13 Las Vegas BH 1,878,600 536,000 230,200
131 31 PPM 13 Orlando BH 1,859,100 587,200 311,400
031 32 PPM 13 Cincinnati B 1,830,200 52,100 234,900
135 33 PPM 13 Austin BH 1,786,400 535,800 136,400
019 34 PPM 13 Cleveland BH 1,769,200 91,900 354,000
041 35 PPM 13 Kansas City BH 1,739,300 142,700 232,800
045 36 PPM 13 Columbus, OH B 1,662,500 62,100 275,100
215 37 PPM 13 San Jose H 1,654,900 403,100 48,200
115 38 PPM 13 Raleigh-Durham BH 1,582,600 153,300 355,100
049 39 PPM 13 Indianapolis BH 1,542,800 93,500 251,100
393 40 2S 2 Hudson Valley BH 1,517,300 323,800 194,500

RADIO MARKET SURVEY POPULATION, RANKINGS & INFORMATION—FALL 2017
Copyright © 2017 The Nielsen Company (US), LLC. All rights reserved.
Nielsen and the Nielsen logo are trademarks or registered trademarks of The Nielsen Company (US), LLC. 2
MKT CODE RANK TYPE FREQ MARKET DST
METRO 12+ POPULATION
HISPANIC 12+ POPULATION*
BLACK 12+ POPULATION**
043 41 PPM 13 Milwaukee-Racine BH 1,498,300 144,200 232,000
413 42 PPM 13 Middlesex-Somerset-Union BH 1,484,800 333,500 204,400
073 43 PPM 13 Nashville BH 1,465,700 95,900 241,900
077 44 PPM 13 Providence-Warwick-Pawtucket BH 1,412,300 160,100 81,100
109 45 PPM 13 Norfolk-Virginia Beach-Newport News
BH 1,408,300 93,000 440,500
107 46 PPM 13 Jacksonville BH 1,296,100 107,800 272,600
166 47 PPM 13 Greensboro-Winston-Salem-High Point
BH 1,286,200 109,000 295,200
299 48 PPM 13 West Palm Beach-Boca Raton BH 1,285,700 268,800 230,900
053 49 4S 4 New Orleans BH 1,263,000 104,100 397,700
083 50 4S 4 Oklahoma City BH 1,261,000 139,100 138,300
075 51 PPM 13 Memphis B 1,118,500 55,700 518,600
061 52 PPM 13 Hartford-New Britain-Middletown BH 1,076,300 159,100 125,200
105 53 4S 4 Richmond B 1,047,400 60,400 315,500
516 54 2S 2 Monmouth-Ocean H 1,044,100 99,000 57,800
055 55 4S 4 Louisville B 1,041,300 44,300 161,600
269 56 2S 2 McAllen-Brownsville-Harlingen H 1,017,400 910,200 6,100
515 57 4S 4 Ft. Myers-Naples H 984,300 202,600 74,100
037 58 4S 4 Buffalo-Niagara Falls B 983,500 43,900 120,000
191 59 4S 4 Greenville-Spartanburg B 971,300 60,700 171,200
079 60 4S 4 Rochester, NY B 962,700 63,200 107,400
095 61 4S 4 Birmingham B 921,700 35,300 274,400
207 62 4S 4 Tucson H 880,100 300,700 35,600
099 63 4S 4 Honolulu 847,900 78,100 46,500
067 64 4S 4 Dayton B 835,500 20,400 122,600
103 65 4S 4 Tulsa 822,700 70,100 73,200
069 66 4S 4 Albany-Schenectady-Troy 813,000 42,400 66,500
089 67 4S 4 Fresno H 803,600 403,600 41,900
127 68 4S 4 Grand Rapids 785,600 70,000 61,100
141 69 4S 4 Albuquerque H 765,700 356,300 22,000
071 70 4S 4 Des Moines 733,900 40,700 35,000
145 71 4S 4 Allentown-Bethlehem H 728,100 109,900 41,200
121 72 4S 4 Knoxville 724,800 27,900 46,900
373 73 2S 2 Sarasota-Bradenton H 721,800 80,000 46,700
085 74 4S 4 Omaha-Council Bluffs 712,000 69,200 62,600
223 75 4S 4 Baton Rouge B 702,200 27,500 243,200
161 76 4S 4 El Paso H 689,100 549,500 26,900
175 77 4S 4 Wilkes Barre-Scranton 687,900 61,100 39,300
231 78 4S 4 Charleston, SC B 668,300 32,200 171,800
143 79 4S 4 Bakersfield H 649,100 343,300 35,900
139 80 2S 2 Wilmington, DE B 623,200 50,000 133,800
291 81 2S 2 Stockton H 616,400 238,600 49,200
119 82 4S 4 Harrisburg-Lebanon-Carlisle 612,100 41,500 55,000
081 83 4S 4 Akron B 608,700 11,700 77,900
RADIO MARKET SURVEY POPULATION, RANKINGS & INFORMATION—FALL 2017
Copyright © 2017 The Nielsen Company (US), LLC. All rights reserved.
Nielsen and the Nielsen logo are trademarks or registered trademarks of The Nielsen Company (US), LLC. 3
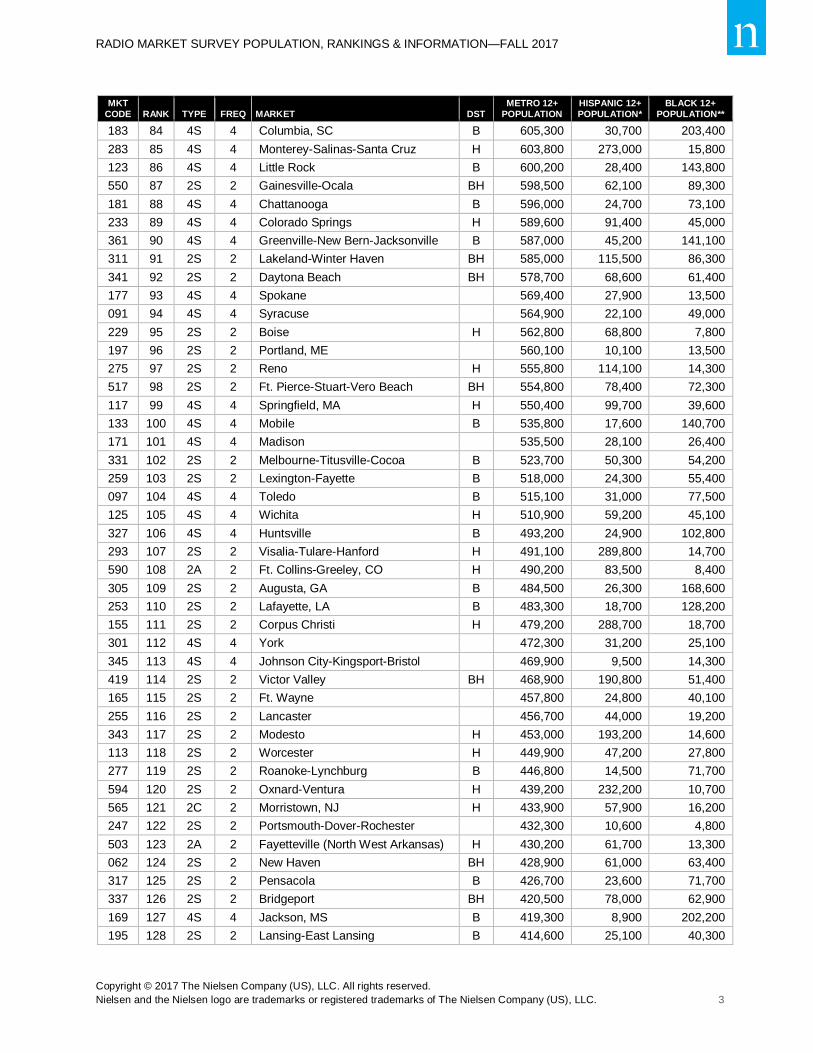
MKT CODE RANK TYPE FREQ MARKET DST
METRO 12+ POPULATION
HISPANIC 12+ POPULATION*
BLACK 12+ POPULATION**
183 84 4S 4 Columbia, SC B 605,300 30,700 203,400
283 85 4S 4 Monterey-Salinas-Santa Cruz H 603,800 273,000 15,800
123 86 4S 4 Little Rock B 600,200 28,400 143,800
550 87 2S 2 Gainesville-Ocala BH 598,500 62,100 89,300
181 88 4S 4 Chattanooga B 596,000 24,700 73,100
233 89 4S 4 Colorado Springs H 589,600 91,400 45,000
361 90 4S 4 Greenville-New Bern-Jacksonville B 587,000 45,200 141,100
311 91 2S 2 Lakeland-Winter Haven BH 585,000 115,500 86,300
341 92 2S 2 Daytona Beach BH 578,700 68,600 61,400
177 93 4S 4 Spokane 569,400 27,900 13,500
091 94 4S 4 Syracuse 564,900 22,100 49,000
229 95 2S 2 Boise H 562,800 68,800 7,800
197 96 2S 2 Portland, ME 560,100 10,100 13,500
275 97 2S 2 Reno H 555,800 114,100 14,300
517 98 2S 2 Ft. Pierce-Stuart-Vero Beach BH 554,800 78,400 72,300
117 99 4S 4 Springfield, MA H 550,400 99,700 39,600
133 100 4S 4 Mobile B 535,800 17,600 140,700
171 101 4S 4 Madison 535,500 28,100 26,400
331 102 2S 2 Melbourne-Titusville-Cocoa B 523,700 50,300 54,200
259 103 2S 2 Lexington-Fayette B 518,000 24,300 55,400
097 104 4S 4 Toledo B 515,100 31,000 77,500
125 105 4S 4 Wichita H 510,900 59,200 45,100
327 106 4S 4 Huntsville B 493,200 24,900 102,800
293 107 2S 2 Visalia-Tulare-Hanford H 491,100 289,800 14,700
590 108 2A 2 Ft. Collins-Greeley, CO H 490,200 83,500 8,400
305 109 2S 2 Augusta, GA B 484,500 26,300 168,600
253 110 2S 2 Lafayette, LA B 483,300 18,700 128,200
155 111 2S 2 Corpus Christi H 479,200 288,700 18,700
301 112 4S 4 York 472,300 31,200 25,100
345 113 4S 4 Johnson City-Kingsport-Bristol 469,900 9,500 14,300
419 114 2S 2 Victor Valley BH 468,900 190,800 51,400
165 115 2S 2 Ft. Wayne 457,800 24,800 40,100
255 116 2S 2 Lancaster 456,700 44,000 19,200
343 117 2S 2 Modesto H 453,000 193,200 14,600
113 118 2S 2 Worcester H 449,900 47,200 27,800
277 119 2S 2 Roanoke-Lynchburg B 446,800 14,500 71,700
594 120 2S 2 Oxnard-Ventura H 439,200 232,200 10,700
565 121 2C 2 Morristown, NJ H 433,900 57,900 16,200
247 122 2S 2 Portsmouth-Dover-Rochester 432,300 10,600 4,800
503 123 2A 2 Fayetteville (North West Arkansas) H 430,200 61,700 13,300
062 124 2S 2 New Haven BH 428,900 61,000 63,400
317 125 2S 2 Pensacola B 426,700 23,600 71,700
337 126 2S 2 Bridgeport BH 420,500 78,000 62,900
169 127 4S 4 Jackson, MS B 419,300 8,900 202,200
195 128 2S 2 Lansing-East Lansing B 414,600 25,100 40,300
RADIO MARKET SURVEY POPULATION, RANKINGS & INFORMATION—FALL 2017
Copyright © 2017 The Nielsen Company (US), LLC. All rights reserved.
Nielsen and the Nielsen logo are trademarks or registered trademarks of The Nielsen Company (US), LLC. 4
MKT CODE RANK TYPE FREQ MARKET DST
METRO 12+ POPULATION
HISPANIC 12+ POPULATION*
BLACK 12+ POPULATION**
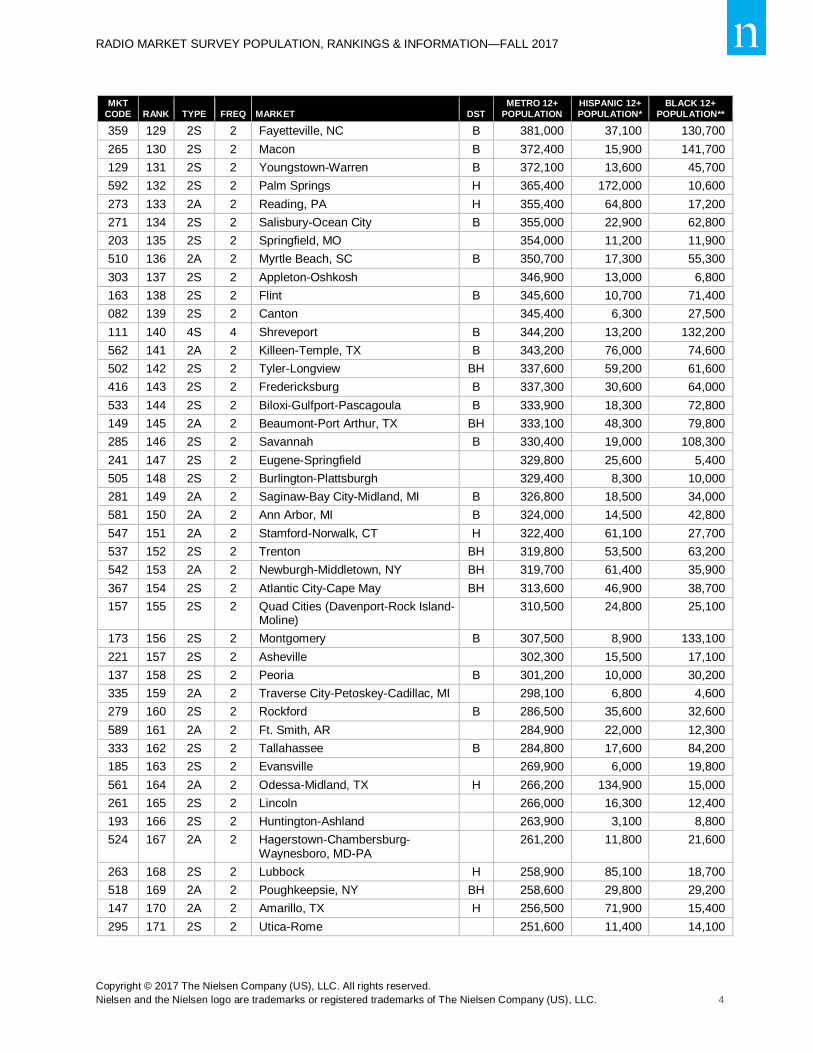
359 129 2S 2 Fayetteville, NC B 381,000 37,100 130,700
265 130 2S 2 Macon B 372,400 15,900 141,700
129 131 2S 2 Youngstown-Warren B 372,100 13,600 45,700
592 132 2S 2 Palm Springs H 365,400 172,000 10,600
273 133 2A 2 Reading, PA H 355,400 64,800 17,200
271 134 2S 2 Salisbury-Ocean City B 355,000 22,900 62,800
203 135 2S 2 Springfield, MO 354,000 11,200 11,900
510 136 2A 2 Myrtle Beach, SC B 350,700 17,300 55,300
303 137 2S 2 Appleton-Oshkosh 346,900 13,000 6,800
163 138 2S 2 Flint B 345,600 10,700 71,400
082 139 2S 2 Canton 345,400 6,300 27,500
111 140 4S 4 Shreveport B 344,200 13,200 132,200
562 141 2A 2 Killeen-Temple, TX B 343,200 76,000 74,600
502 142 2S 2 Tyler-Longview BH 337,600 59,200 61,600
416 143 2S 2 Fredericksburg B 337,300 30,600 64,000
533 144 2S 2 Biloxi-Gulfport-Pascagoula B 333,900 18,300 72,800
149 145 2A 2 Beaumont-Port Arthur, TX BH 333,100 48,300 79,800
285 146 2S 2 Savannah B 330,400 19,000 108,300
241 147 2S 2 Eugene-Springfield 329,800 25,600 5,400
505 148 2S 2 Burlington-Plattsburgh 329,400 8,300 10,000
281 149 2A 2 Saginaw-Bay City-Midland, MI B 326,800 18,500 34,000
581 150 2A 2 Ann Arbor, MI B 324,000 14,500 42,800
547 151 2A 2 Stamford-Norwalk, CT H 322,400 61,100 27,700
537 152 2S 2 Trenton BH 319,800 53,500 63,200
542 153 2A 2 Newburgh-Middletown, NY BH 319,700 61,400 35,900
367 154 2S 2 Atlantic City-Cape May BH 313,600 46,900 38,700
157 155 2S 2 Quad Cities (Davenport-Rock Island-Moline)
310,500 24,800 25,100
173 156 2S 2 Montgomery B 307,500 8,900 133,100
221 157 2S 2 Asheville 302,300 15,500 17,100
137 158 2S 2 Peoria B 301,200 10,000 30,200
335 159 2A 2 Traverse City-Petoskey-Cadillac, MI 298,100 6,800 4,600
279 160 2S 2 Rockford B 286,500 35,600 32,600
589 161 2A 2 Ft. Smith, AR 284,900 22,000 12,300
333 162 2S 2 Tallahassee B 284,800 17,600 84,200
185 163 2S 2 Evansville 269,900 6,000 19,800
561 164 2A 2 Odessa-Midland, TX H 266,200 134,900 15,000
261 165 2S 2 Lincoln 266,000 16,300 12,400
193 166 2S 2 Huntington-Ashland 263,900 3,100 8,800
524 167 2A 2 Hagerstown-Chambersburg-Waynesboro, MD-PA
261,200 11,800 21,600
263 168 2S 2 Lubbock H 258,900 85,100 18,700
518 169 2A 2 Poughkeepsie, NY BH 258,600 29,800 29,200
147 170 2A 2 Amarillo, TX H 256,500 71,900 15,400
295 171 2S 2 Utica-Rome 251,600 11,400 14,100
RADIO MARKET SURVEY POPULATION, RANKINGS & INFORMATION—FALL 2017
Copyright © 2017 The Nielsen Company (US), LLC. All rights reserved.
Nielsen and the Nielsen logo are trademarks or registered trademarks of The Nielsen Company (US), LLC. 5
MKT CODE RANK TYPE FREQ MARKET DST
METRO 12+ POPULATION
HISPANIC 12+ POPULATION*
BLACK 12+ POPULATION**
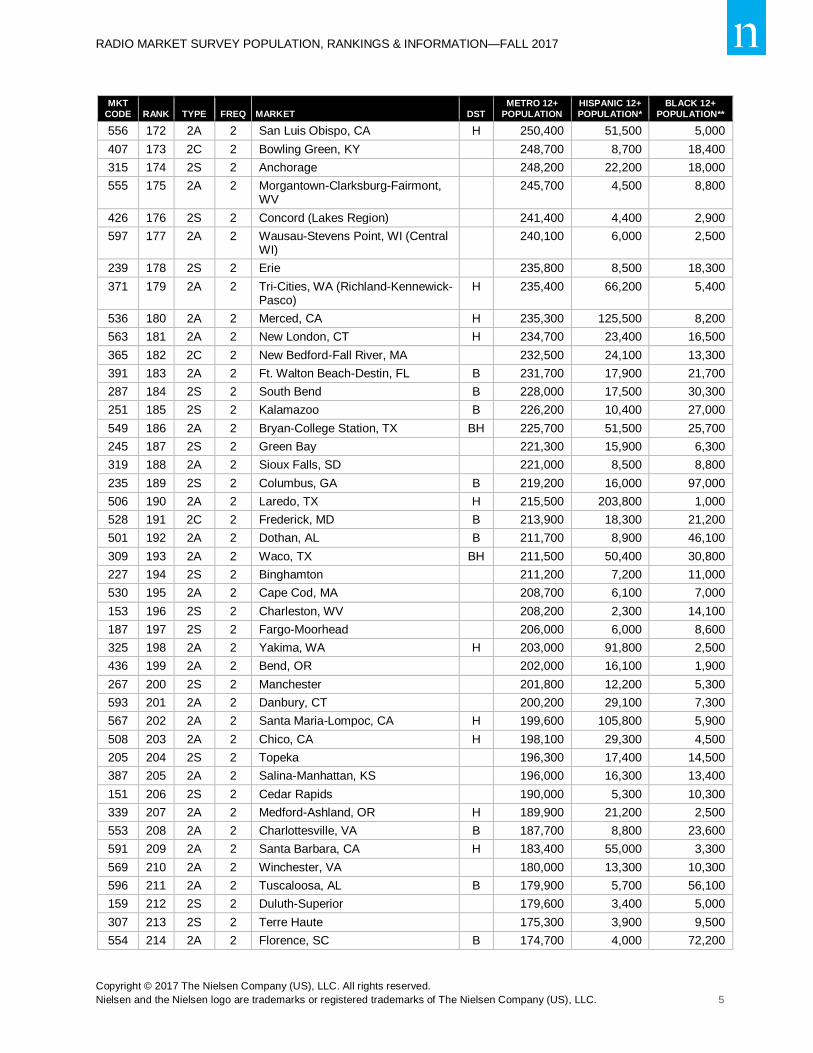
556 172 2A 2 San Luis Obispo, CA H 250,400 51,500 5,000
407 173 2C 2 Bowling Green, KY 248,700 8,700 18,400
315 174 2S 2 Anchorage 248,200 22,200 18,000
555 175 2A 2 Morgantown-Clarksburg-Fairmont, WV
245,700 4,500 8,800
426 176 2S 2 Concord (Lakes Region) 241,400 4,400 2,900
597 177 2A 2 Wausau-Stevens Point, WI (Central WI)
240,100 6,000 2,500
239 178 2S 2 Erie 235,800 8,500 18,300
371 179 2A 2 Tri-Cities, WA (Richland-Kennewick-Pasco)
H 235,400 66,200 5,400
536 180 2A 2 Merced, CA H 235,300 125,500 8,200
563 181 2A 2 New London, CT H 234,700 23,400 16,500
365 182 2C 2 New Bedford-Fall River, MA 232,500 24,100 13,300
391 183 2A 2 Ft. Walton Beach-Destin, FL B 231,700 17,900 21,700
287 184 2S 2 South Bend B 228,000 17,500 30,300
251 185 2S 2 Kalamazoo B 226,200 10,400 27,000
549 186 2A 2 Bryan-College Station, TX BH 225,700 51,500 25,700
245 187 2S 2 Green Bay 221,300 15,900 6,300
319 188 2A 2 Sioux Falls, SD 221,000 8,500 8,800
235 189 2S 2 Columbus, GA B 219,200 16,000 97,000
506 190 2A 2 Laredo, TX H 215,500 203,800 1,000
528 191 2C 2 Frederick, MD B 213,900 18,300 21,200
501 192 2A 2 Dothan, AL B 211,700 8,900 46,100
309 193 2A 2 Waco, TX BH 211,500 50,400 30,800
227 194 2S 2 Binghamton 211,200 7,200 11,000
530 195 2A 2 Cape Cod, MA 208,700 6,100 7,000
153 196 2S 2 Charleston, WV 208,200 2,300 14,100
187 197 2S 2 Fargo-Moorhead 206,000 6,000 8,600
325 198 2A 2 Yakima, WA H 203,000 91,800 2,500
436 199 2A 2 Bend, OR 202,000 16,100 1,900
267 200 2S 2 Manchester 201,800 12,200 5,300
593 201 2A 2 Danbury, CT 200,200 29,100 7,300
567 202 2A 2 Santa Maria-Lompoc, CA H 199,600 105,800 5,900
508 203 2A 2 Chico, CA H 198,100 29,300 4,500
205 204 2S 2 Topeka 196,300 17,400 14,500
387 205 2A 2 Salina-Manhattan, KS 196,000 16,300 13,400
151 206 2S 2 Cedar Rapids 190,000 5,300 10,300
339 207 2A 2 Medford-Ashland, OR H 189,900 21,200 2,500
553 208 2A 2 Charlottesville, VA B 187,700 8,800 23,600
591 209 2A 2 Santa Barbara, CA H 183,400 55,000 3,300
569 210 2A 2 Winchester, VA 180,000 13,300 10,300
596 211 2A 2 Tuscaloosa, AL B 179,900 5,700 56,100
159 212 2S 2 Duluth-Superior 179,600 3,400 5,000
307 213 2S 2 Terre Haute 175,300 3,900 9,500
554 214 2A 2 Florence, SC B 174,700 4,000 72,200

RADIO MARKET SURVEY POPULATION, RANKINGS & INFORMATION—FALL 2017
Copyright © 2017 The Nielsen Company (US), LLC. All rights reserved.
Nielsen and the Nielsen logo are trademarks or registered trademarks of The Nielsen Company (US), LLC. 6
MKT CODE RANK TYPE FREQ MARKET DST
METRO 12+ POPULATION
HISPANIC 12+ POPULATION*
BLACK 12+ POPULATION**
522 215 2A 2 Laurel-Hattiesburg, MS B 171,900 5,100 50,000
434 215 2A 2 Sunbury-Selinsgrove-Lewisburg, PA 171,900 6,300 6,200
584 217 2A 2 Lake Charles, LA B 169,900 5,600 42,400
422 218 2A 2 Muncie-Marion, IN 168,100 4,400 12,400
526 219 2S 2 Bangor 168,000 2,000 2,100
559 220 2A 2 La Crosse, WI 167,000 3,600 3,000
532 221 2A 2 Rochester, MN 164,600 6,800 7,900
595 222 2S 2 Lafayette, IN 164,400 11,600 9,200
423 223 2A 2 Hilton Head, SC BH 163,400 15,500 28,900
573 224 2A 2 Panama City, FL B 159,300 9,400 18,400
431 225 2A 2 Lebanon-Hanover-White River Junction, NH-VT
157,800 3,400 2,600
421 226 2A 2 Olean, NY 157,300 3,100 3,300
557 227 2A 2 Elmira-Corning, NY 156,000 3,500 7,200
576 228 2A 2 Lima, OH 154,900 4,500 12,200
564 229 2A 2 Columbia, MO B 154,500 4,800 15,300
509 230 2A 2 Redding, CA 154,100 13,700 2,400
534 231 2A 2 Joplin, MO 149,600 9,400 4,000
566 232 2A 2 Muskegon, MI B 148,000 7,200 21,600
323 233 2S 2 Bloomington 147,300 6,500 12,000
546 234 2A 2 Abilene, TX H 144,700 31,500 11,500
586 235 2A 2 Eau Claire, WI 144,300 2,900 2,300
353 236 2S 2 Pueblo H 142,400 58,100 3,300
225 237 2A 2 Billings, MT 135,700 6,800 1,700
297 238 2A 2 Waterloo-Cedar Falls, IA 134,800 4,500 10,500
580 239 2A 2 Albany, GA B 131,200 3,900 68,800
585 240 2A 2 Monroe, LA B 131,100 3,000 47,600
511 241 2A 2 Grand Junction, CO H 129,000 17,000 1,700
512 242 2A 2 Texarkana, TX-AR B 128,300 7,700 31,200
425 242 2A 2 LaSalle-Peru, IL 128,300 10,700 3,700
404 244 2A 2 Florence-Muscle Shoals, AL B 127,100 2,900 16,300
539 245 2A 2 Parkersburg-Marietta, WV-OH 126,000 1,600 2,600
179 246 2S 2 Wheeling 124,000 1,400 4,700
579 247 2A 2 Sussex, NJ 123,900 9,300 3,100
462 248 2A 2 Twin Falls-Sun Valley, ID H 123,400 24,200 800
433 249 2A 2 Valdosta, GA B 121,100 7,300 40,600
381 250 2A 2 Grand Island-Kearney-Hastings, NE H 119,700 18,000 2,300
209 251 2A 2 Wichita Falls, TX BH 119,400 20,300 12,400
519 252 2A 2 Harrisonburg, VA 117,700 12,400 5,800
545 253 2A 2 Rapid City, SD 116,800 4,800 2,700
531 254 2A 2 Battle Creek, MI B 114,100 4,900 13,600
582 255 2A 2 Bismarck, ND 108,600 2,700 2,400
432 256 2S 2 Montpelier-Barre-St. Johnsbury 106,500 2,000 1,500
527 257 2A 2 Augusta-Waterville, ME 105,600 1,400 1,100
548 258 2A 2 San Angelo, TX H 101,600 38,100 4,700
RADIO MARKET SURVEY POPULATION, RANKINGS & INFORMATION—FALL 2017
Copyright © 2017 The Nielsen Company (US), LLC. All rights reserved.
Nielsen and the Nielsen logo are trademarks or registered trademarks of The Nielsen Company (US), LLC. 7
MKT CODE RANK TYPE FREQ MARKET DST
METRO 12+ POPULATION
HISPANIC 12+ POPULATION*
BLACK 12+ POPULATION**
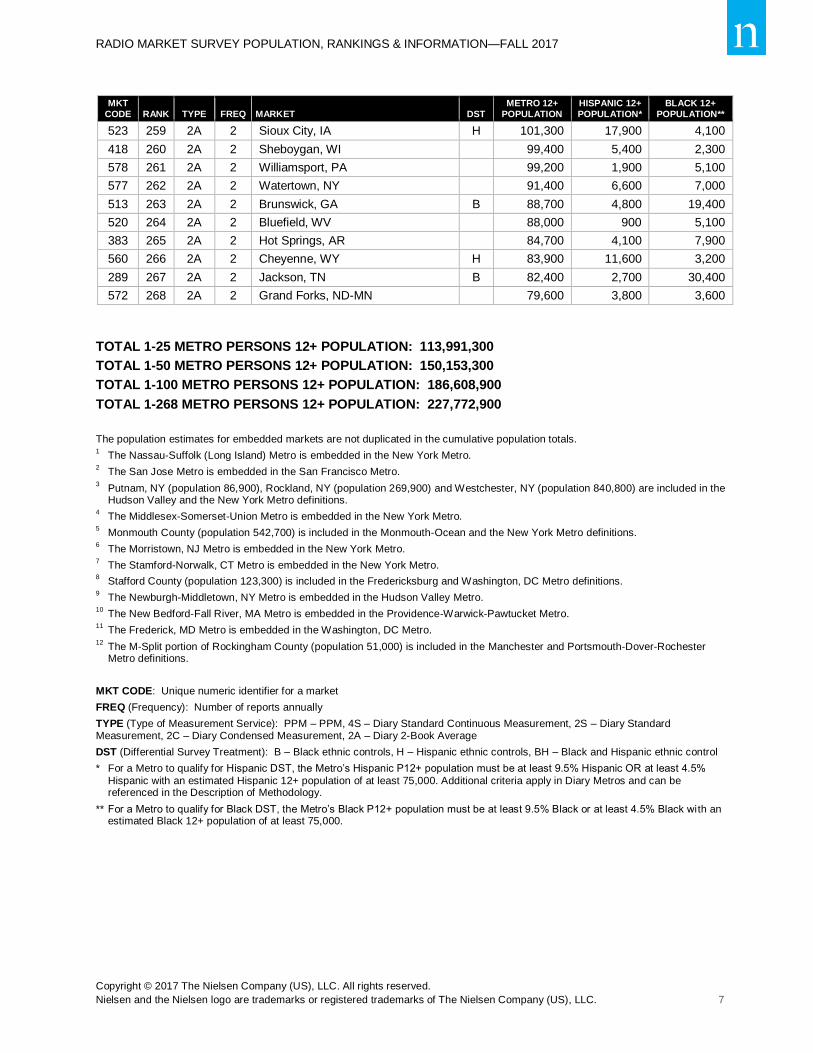
523 259 2A 2 Sioux City, IA H 101,300 17,900 4,100
418 260 2A 2 Sheboygan, WI 99,400 5,400 2,300
578 261 2A 2 Williamsport, PA 99,200 1,900 5,100
577 262 2A 2 Watertown, NY 91,400 6,600 7,000
513 263 2A 2 Brunswick, GA B 88,700 4,800 19,400
520 264 2A 2 Bluefield, WV 88,000 900 5,100
383 265 2A 2 Hot Springs, AR 84,700 4,100 7,900
560 266 2A 2 Cheyenne, WY H 83,900 11,600 3,200
289 267 2A 2 Jackson, TN B 82,400 2,700 30,400
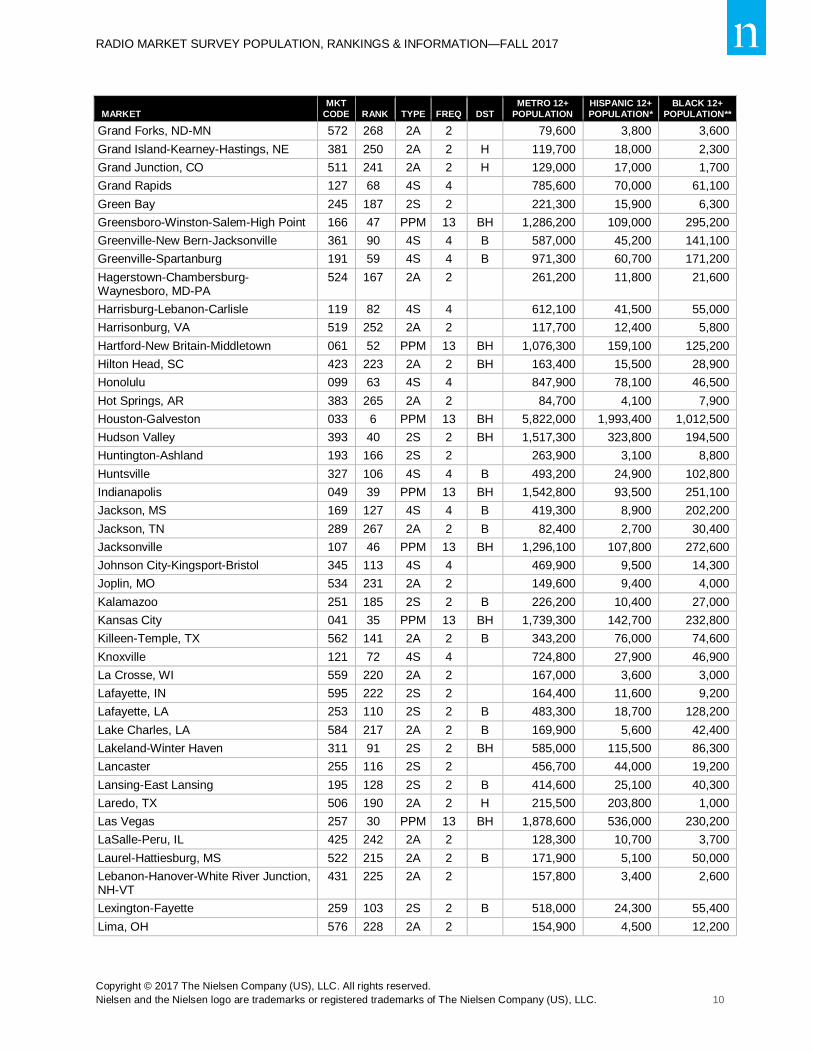
572 268 2A 2 Grand Forks, ND-MN 79,600 3,800 3,600
TOTAL 1-25 METRO PERSONS 12+ POPULATION: 113,991,300
TOTAL 1-50 METRO PERSONS 12+ POPULATION: 150,153,300
TOTAL 1-100 METRO PERSONS 12+ POPULATION: 186,608,900
TOTAL 1-268 METRO PERSONS 12+ POPULATION: 227,772,900
The population estimates for embedded markets are not duplicated in the cumulative population totals. 1 The Nassau-Suffolk (Long Island) Metro is embedded in the New York Metro.
2 The San Jose Metro is embedded in the San Francisco Metro.
3 Putnam, NY (population 86,900), Rockland, NY (population 269,900) and Westchester, NY (population 840,800) are included in the
Hudson Valley and the New York Metro definitions. 4 The Middlesex-Somerset-Union Metro is embedded in the New York Metro.
5 Monmouth County (population 542,700) is included in the Monmouth-Ocean and the New York Metro definitions.
6 The Morristown, NJ Metro is embedded in the New York Metro.
7 The Stamford-Norwalk, CT Metro is embedded in the New York Metro.
8 Stafford County (population 123,300) is included in the Fredericksburg and Washington, DC Metro definitions.
9 The Newburgh-Middletown, NY Metro is embedded in the Hudson Valley Metro.
10 The New Bedford-Fall River, MA Metro is embedded in the Providence-Warwick-Pawtucket Metro.
11 The Frederick, MD Metro is embedded in the Washington, DC Metro.
12 The M-Split portion of Rockingham County (population 51,000) is included in the Manchester and Portsmouth-Dover-Rochester Metro definitions.
MKT CODE: Unique numeric identifier for a market
FREQ (Frequency): Number of reports annually
TYPE (Type of Measurement Service): PPM – PPM, 4S – Diary Standard Continuous Measurement, 2S – Diary Standard Measurement, 2C – Diary Condensed Measurement, 2A – Diary 2-Book Average
DST (Differential Survey Treatment): B – Black ethnic controls, H – Hispanic ethnic controls, BH – Black and Hispanic ethnic control
* For a Metro to qualify for Hispanic DST, the Metro’s Hispanic P12+ population must be at least 9.5% Hispanic OR at least 4.5%
Hispanic with an estimated Hispanic 12+ population of at least 75,000. Additional criteria apply in Diary Metros and can be referenced in the Description of Methodology.
** For a Metro to qualify for Black DST, the Metro’s Black P12+ population must be at least 9.5% Black or at least 4.5% Black with an estimated Black 12+ population of at least 75,000.

RADIO MARKET SURVEY POPULATION, RANKINGS & INFORMATION—FALL 2017
Copyright © 2017 The Nielsen Company (US), LLC. All rights reserved.
Nielsen and the Nielsen logo are trademarks or registered trademarks of The Nielsen Company (US), LLC. 8
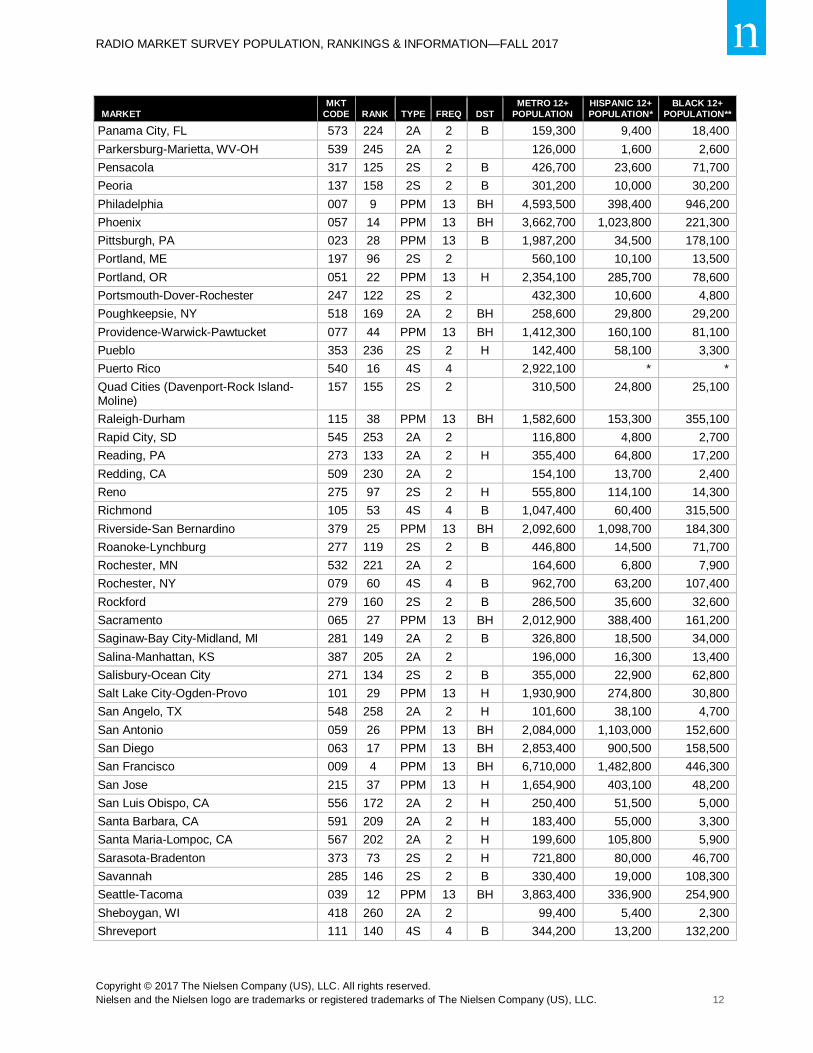
BY MARKET
MARKET MKT
CODE RANK TYPE FREQ DST METRO 12+
POPULATION HISPANIC 12+ POPULATION*
BLACK 12+ POPULATION**
Abilene, TX 546 234 2A 2 H 144,700 31,500 11,500
Akron 081 83 4S 4 B 608,700 11,700 77,900
Albany, GA 580 239 2A 2 B 131,200 3,900 68,800
Albany-Schenectady-Troy 069 66 4S 4 813,000 42,400 66,500
Albuquerque 141 69 4S 4 H 765,700 356,300 22,000
Allentown-Bethlehem 145 71 4S 4 H 728,100 109,900 41,200
Amarillo, TX 147 170 2A 2 H 256,500 71,900 15,400
Anchorage 315 174 2S 2 248,200 22,200 18,000
Ann Arbor, MI 581 150 2A 2 B 324,000 14,500 42,800
Appleton-Oshkosh 303 137 2S 2 346,900 13,000 6,800
Asheville 221 157 2S 2 302,300 15,500 17,100
Atlanta 047 8 PPM 13 BH 4,823,200 473,000 1,660,900
Atlantic City-Cape May 367 154 2S 2 BH 313,600 46,900 38,700
Augusta, GA 305 109 2S 2 B 484,500 26,300 168,600
Augusta-Waterville, ME 527 257 2A 2 105,600 1,400 1,100
Austin 135 33 PPM 13 BH 1,786,400 535,800 136,400
Bakersfield 143 79 4S 4 H 649,100 343,300 35,900
Baltimore 021 21 PPM 13 BH 2,406,400 130,300 700,500
Bangor 526 219 2S 2 168,000 2,000 2,100
Baton Rouge 223 75 4S 4 B 702,200 27,500 243,200
Battle Creek, MI 531 254 2A 2 B 114,100 4,900 13,600
Beaumont-Port Arthur, TX 149 145 2A 2 BH 333,100 48,300 79,800
Bend, OR 436 199 2A 2 202,000 16,100 1,900
Billings, MT 225 237 2A 2 135,700 6,800 1,700
Biloxi-Gulfport-Pascagoula 533 144 2S 2 B 333,900 18,300 72,800
Binghamton 227 194 2S 2 211,200 7,200 11,000
Birmingham 095 61 4S 4 B 921,700 35,300 274,400
Bismarck, ND 582 255 2A 2 108,600 2,700 2,400
Bloomington 323 233 2S 2 147,300 6,500 12,000
Bluefield, WV 520 264 2A 2 88,000 900 5,100
Boise 229 95 2S 2 H 562,800 68,800 7,800
Boston 013 10 PPM 13 BH 4,294,800 461,700 338,700
Bowling Green, KY 407 173 2C 2 248,700 8,700 18,400
Bridgeport 337 126 2S 2 BH 420,500 78,000 62,900
Brunswick, GA 513 263 2A 2 B 88,700 4,800 19,400
Bryan-College Station, TX 549 186 2A 2 BH 225,700 51,500 25,700
Buffalo-Niagara Falls 037 58 4S 4 B 983,500 43,900 120,000
Burlington-Plattsburgh 505 148 2S 2 329,400 8,300 10,000
Canton 082 139 2S 2 345,400 6,300 27,500
Cape Cod, MA 530 195 2A 2 208,700 6,100 7,000
Cedar Rapids 151 206 2S 2 190,000 5,300 10,300
Charleston, SC 231 78 4S 4 B 668,300 32,200 171,800
Charleston, WV 153 196 2S 2 208,200 2,300 14,100
Charlotte-Gastonia-Rock Hill 093 24 PPM 13 BH 2,304,300 199,200 527,500

RADIO MARKET SURVEY POPULATION, RANKINGS & INFORMATION—FALL 2017
Copyright © 2017 The Nielsen Company (US), LLC. All rights reserved.
Nielsen and the Nielsen logo are trademarks or registered trademarks of The Nielsen Company (US), LLC. 9
MARKET MKT
CODE RANK TYPE FREQ DST METRO 12+
POPULATION HISPANIC 12+ POPULATION*
BLACK 12+ POPULATION**
Charlottesville, VA 553 208 2A 2 B 187,700 8,800 23,600
Chattanooga 181 88 4S 4 B 596,000 24,700 73,100
Cheyenne, WY 560 266 2A 2 H 83,900 11,600 3,200
Chicago 005 3 PPM 13 BH 7,945,800 1,640,400 1,337,100
Chico, CA 508 203 2A 2 H 198,100 29,300 4,500
Cincinnati 031 32 PPM 13 B 1,830,200 52,100 234,900
Cleveland 019 34 PPM 13 BH 1,769,200 91,900 354,000
Colorado Springs 233 89 4S 4 H 589,600 91,400 45,000
Columbia, MO 564 229 2A 2 B 154,500 4,800 15,300
Columbia, SC 183 84 4S 4 B 605,300 30,700 203,400
Columbus, GA 235 189 2S 2 B 219,200 16,000 97,000
Columbus, OH 045 36 PPM 13 B 1,662,500 62,100 275,100
Concord (Lakes Region) 426 176 2S 2 241,400 4,400 2,900
Corpus Christi 155 111 2S 2 H 479,200 288,700 18,700
Dallas-Ft. Worth 024 5 PPM 13 BH 6,063,100 1,606,700 983,100
Danbury, CT 593 201 2A 2 200,200 29,100 7,300
Dayton 067 64 4S 4 B 835,500 20,400 122,600
Daytona Beach 341 92 2S 2 BH 578,700 68,600 61,400
Denver-Boulder 035 18 PPM 13 BH 2,720,200 551,300 155,100
Des Moines 071 70 4S 4 733,900 40,700 35,000
Detroit 011 13 PPM 13 B 3,813,700 150,800 835,800
Dothan, AL 501 192 2A 2 B 211,700 8,900 46,100
Duluth-Superior 159 212 2S 2 179,600 3,400 5,000
Eau Claire, WI 586 235 2A 2 144,300 2,900 2,300
El Paso 161 76 4S 4 H 689,100 549,500 26,900
Elmira-Corning, NY 557 227 2A 2 156,000 3,500 7,200
Erie 239 178 2S 2 235,800 8,500 18,300
Eugene-Springfield 241 147 2S 2 329,800 25,600 5,400
Evansville 185 163 2S 2 269,900 6,000 19,800
Fargo-Moorhead 187 197 2S 2 206,000 6,000 8,600
Fayetteville (North West Arkansas) 503 123 2A 2 H 430,200 61,700 13,300
Fayetteville, NC 359 129 2S 2 B 381,000 37,100 130,700
Flint 163 138 2S 2 B 345,600 10,700 71,400
Florence, SC 554 214 2A 2 B 174,700 4,000 72,200
Florence-Muscle Shoals, AL 404 244 2A 2 B 127,100 2,900 16,300
Frederick, MD 528 191 2C 2 B 213,900 18,300 21,200
Fredericksburg 416 143 2S 2 B 337,300 30,600 64,000
Fresno 089 67 4S 4 H 803,600 403,600 41,900
Ft. Collins-Greeley, CO 590 108 2A 2 H 490,200 83,500 8,400
Ft. Myers-Naples 515 57 4S 4 H 984,300 202,600 74,100
Ft. Pierce-Stuart-Vero Beach 517 98 2S 2 BH 554,800 78,400 72,300
Ft. Smith, AR 589 161 2A 2 284,900 22,000 12,300
Ft. Walton Beach-Destin, FL 391 183 2A 2 B 231,700 17,900 21,700
Ft. Wayne 165 115 2S 2 457,800 24,800 40,100
Gainesville-Ocala 550 87 2S 2 BH 598,500 62,100 89,300
RADIO MARKET SURVEY POPULATION, RANKINGS & INFORMATION—FALL 2017
Copyright © 2017 The Nielsen Company (US), LLC. All rights reserved.
Nielsen and the Nielsen logo are trademarks or registered trademarks of The Nielsen Company (US), LLC. 10
MARKET MKT
CODE RANK TYPE FREQ DST METRO 12+
POPULATION HISPANIC 12+ POPULATION*
BLACK 12+ POPULATION**
Grand Forks, ND-MN 572 268 2A 2 79,600 3,800 3,600
Grand Island-Kearney-Hastings, NE 381 250 2A 2 H 119,700 18,000 2,300
Grand Junction, CO 511 241 2A 2 H 129,000 17,000 1,700
Grand Rapids 127 68 4S 4 785,600 70,000 61,100
Green Bay 245 187 2S 2 221,300 15,900 6,300
Greensboro-Winston-Salem-High Point 166 47 PPM 13 BH 1,286,200 109,000 295,200
Greenville-New Bern-Jacksonville 361 90 4S 4 B 587,000 45,200 141,100
Greenville-Spartanburg 191 59 4S 4 B 971,300 60,700 171,200
Hagerstown-Chambersburg-Waynesboro, MD-PA
524 167 2A 2 261,200 11,800 21,600
Harrisburg-Lebanon-Carlisle 119 82 4S 4 612,100 41,500 55,000
Harrisonburg, VA 519 252 2A 2 117,700 12,400 5,800
Hartford-New Britain-Middletown 061 52 PPM 13 BH 1,076,300 159,100 125,200
Hilton Head, SC 423 223 2A 2 BH 163,400 15,500 28,900
Honolulu 099 63 4S 4 847,900 78,100 46,500
Hot Springs, AR 383 265 2A 2 84,700 4,100 7,900
Houston-Galveston 033 6 PPM 13 BH 5,822,000 1,993,400 1,012,500
Hudson Valley 393 40 2S 2 BH 1,517,300 323,800 194,500
Huntington-Ashland 193 166 2S 2 263,900 3,100 8,800
Huntsville 327 106 4S 4 B 493,200 24,900 102,800
Indianapolis 049 39 PPM 13 BH 1,542,800 93,500 251,100
Jackson, MS 169 127 4S 4 B 419,300 8,900 202,200
Jackson, TN 289 267 2A 2 B 82,400 2,700 30,400
Jacksonville 107 46 PPM 13 BH 1,296,100 107,800 272,600
Johnson City-Kingsport-Bristol 345 113 4S 4 469,900 9,500 14,300
Joplin, MO 534 231 2A 2 149,600 9,400 4,000
Kalamazoo 251 185 2S 2 B 226,200 10,400 27,000
Kansas City 041 35 PPM 13 BH 1,739,300 142,700 232,800
Killeen-Temple, TX 562 141 2A 2 B 343,200 76,000 74,600
Knoxville 121 72 4S 4 724,800 27,900 46,900
La Crosse, WI 559 220 2A 2 167,000 3,600 3,000
Lafayette, IN 595 222 2S 2 164,400 11,600 9,200
Lafayette, LA 253 110 2S 2 B 483,300 18,700 128,200
Lake Charles, LA 584 217 2A 2 B 169,900 5,600 42,400
Lakeland-Winter Haven 311 91 2S 2 BH 585,000 115,500 86,300
Lancaster 255 116 2S 2 456,700 44,000 19,200
Lansing-East Lansing 195 128 2S 2 B 414,600 25,100 40,300
Laredo, TX 506 190 2A 2 H 215,500 203,800 1,000
Las Vegas 257 30 PPM 13 BH 1,878,600 536,000 230,200
LaSalle-Peru, IL 425 242 2A 2 128,300 10,700 3,700
Laurel-Hattiesburg, MS 522 215 2A 2 B 171,900 5,100 50,000
Lebanon-Hanover-White River Junction, NH-VT
431 225 2A 2 157,800 3,400 2,600
Lexington-Fayette 259 103 2S 2 B 518,000 24,300 55,400
Lima, OH 576 228 2A 2 154,900 4,500 12,200

RADIO MARKET SURVEY POPULATION, RANKINGS & INFORMATION—FALL 2017
Copyright © 2017 The Nielsen Company (US), LLC. All rights reserved.
Nielsen and the Nielsen logo are trademarks or registered trademarks of The Nielsen Company (US), LLC. 11
MARKET MKT
CODE RANK TYPE FREQ DST METRO 12+
POPULATION HISPANIC 12+ POPULATION*
BLACK 12+ POPULATION**
Lincoln 261 165 2S 2 266,000 16,300 12,400
Little Rock 123 86 4S 4 B 600,200 28,400 143,800
Los Angeles 003 2 PPM 13 BH 11,465,400 4,900,100 815,200
Louisville 055 55 4S 4 B 1,041,300 44,300 161,600
Lubbock 263 168 2S 2 H 258,900 85,100 18,700
Macon 265 130 2S 2 B 372,400 15,900 141,700
Madison 171 101 4S 4 535,500 28,100 26,400
Manchester 267 200 2S 2 201,800 12,200 5,300
McAllen-Brownsville-Harlingen 269 56 2S 2 H 1,017,400 910,200 6,100
Medford-Ashland, OR 339 207 2A 2 H 189,900 21,200 2,500
Melbourne-Titusville-Cocoa 331 102 2S 2 B 523,700 50,300 54,200
Memphis 075 51 PPM 13 B 1,118,500 55,700 518,600
Merced, CA 536 180 2A 2 H 235,300 125,500 8,200
Miami-Ft. Lauderdale-Hollywood 429 11 PPM 13 BH 4,070,400 2,131,600 843,300
Middlesex-Somerset-Union 413 42 PPM 13 BH 1,484,800 333,500 204,400
Milwaukee-Racine 043 41 PPM 13 BH 1,498,300 144,200 232,000
Minneapolis-St. Paul 027 15 PPM 13 BH 2,957,900 151,300 250,700
Mobile 133 100 4S 4 B 535,800 17,600 140,700
Modesto 343 117 2S 2 H 453,000 193,200 14,600
Monmouth-Ocean 516 54 2S 2 H 1,044,100 99,000 57,800
Monroe, LA 585 240 2A 2 B 131,100 3,000 47,600
Monterey-Salinas-Santa Cruz 283 85 4S 4 H 603,800 273,000 15,800
Montgomery 173 156 2S 2 B 307,500 8,900 133,100
Montpelier-Barre-St. Johnsbury 432 256 2S 2 106,500 2,000 1,500
Morgantown-Clarksburg-Fairmont, WV 555 175 2A 2 245,700 4,500 8,800
Morristown, NJ 565 121 2C 2 H 433,900 57,900 16,200
Muncie-Marion, IN 422 218 2A 2 168,100 4,400 12,400
Muskegon, MI 566 232 2A 2 B 148,000 7,200 21,600
Myrtle Beach, SC 510 136 2A 2 B 350,700 17,300 55,300
Nashville 073 43 PPM 13 BH 1,465,700 95,900 241,900
Nassau-Suffolk (Long Island) 321 20 PPM 13 BH 2,470,900 431,400 243,000
New Bedford-Fall River, MA 365 182 2C 2 232,500 24,100 13,300
New Haven 062 124 2S 2 BH 428,900 61,000 63,400
New London, CT 563 181 2A 2 H 234,700 23,400 16,500
New Orleans 053 49 4S 4 BH 1,263,000 104,100 397,700
New York 001 1 PPM 13 BH 16,285,500 3,997,700 2,746,700
Newburgh-Middletown, NY 542 153 2A 2 BH 319,700 61,400 35,900
Norfolk-Virginia Beach-Newport News 109 45 PPM 13 BH 1,408,300 93,000 440,500
Odessa-Midland, TX 561 164 2A 2 H 266,200 134,900 15,000
Oklahoma City 083 50 4S 4 BH 1,261,000 139,100 138,300
Olean, NY 421 226 2A 2 157,300 3,100 3,300
Omaha-Council Bluffs 085 74 4S 4 712,000 69,200 62,600
Orlando 131 31 PPM 13 BH 1,859,100 587,200 311,400
Oxnard-Ventura 594 120 2S 2 H 439,200 232,200 10,700
Palm Springs 592 132 2S 2 H 365,400 172,000 10,600
RADIO MARKET SURVEY POPULATION, RANKINGS & INFORMATION—FALL 2017
Copyright © 2017 The Nielsen Company (US), LLC. All rights reserved.
Nielsen and the Nielsen logo are trademarks or registered trademarks of The Nielsen Company (US), LLC. 12
MARKET MKT
CODE RANK TYPE FREQ DST METRO 12+
POPULATION HISPANIC 12+ POPULATION*
BLACK 12+ POPULATION**
Panama City, FL 573 224 2A 2 B 159,300 9,400 18,400
Parkersburg-Marietta, WV-OH 539 245 2A 2 126,000 1,600 2,600
Pensacola 317 125 2S 2 B 426,700 23,600 71,700
Peoria 137 158 2S 2 B 301,200 10,000 30,200
Philadelphia 007 9 PPM 13 BH 4,593,500 398,400 946,200
Phoenix 057 14 PPM 13 BH 3,662,700 1,023,800 221,300
Pittsburgh, PA 023 28 PPM 13 B 1,987,200 34,500 178,100
Portland, ME 197 96 2S 2 560,100 10,100 13,500
Portland, OR 051 22 PPM 13 H 2,354,100 285,700 78,600
Portsmouth-Dover-Rochester 247 122 2S 2 432,300 10,600 4,800
Poughkeepsie, NY 518 169 2A 2 BH 258,600 29,800 29,200
Providence-Warwick-Pawtucket 077 44 PPM 13 BH 1,412,300 160,100 81,100
Pueblo 353 236 2S 2 H 142,400 58,100 3,300
Puerto Rico 540 16 4S 4 2,922,100 * *
Quad Cities (Davenport-Rock Island-Moline)
157 155 2S 2 310,500 24,800 25,100
Raleigh-Durham 115 38 PPM 13 BH 1,582,600 153,300 355,100
Rapid City, SD 545 253 2A 2 116,800 4,800 2,700
Reading, PA 273 133 2A 2 H 355,400 64,800 17,200
Redding, CA 509 230 2A 2 154,100 13,700 2,400
Reno 275 97 2S 2 H 555,800 114,100 14,300
Richmond 105 53 4S 4 B 1,047,400 60,400 315,500
Riverside-San Bernardino 379 25 PPM 13 BH 2,092,600 1,098,700 184,300
Roanoke-Lynchburg 277 119 2S 2 B 446,800 14,500 71,700
Rochester, MN 532 221 2A 2 164,600 6,800 7,900
Rochester, NY 079 60 4S 4 B 962,700 63,200 107,400
Rockford 279 160 2S 2 B 286,500 35,600 32,600
Sacramento 065 27 PPM 13 BH 2,012,900 388,400 161,200
Saginaw-Bay City-Midland, MI 281 149 2A 2 B 326,800 18,500 34,000
Salina-Manhattan, KS 387 205 2A 2 196,000 16,300 13,400
Salisbury-Ocean City 271 134 2S 2 B 355,000 22,900 62,800
Salt Lake City-Ogden-Provo 101 29 PPM 13 H 1,930,900 274,800 30,800
San Angelo, TX 548 258 2A 2 H 101,600 38,100 4,700
San Antonio 059 26 PPM 13 BH 2,084,000 1,103,000 152,600
San Diego 063 17 PPM 13 BH 2,853,400 900,500 158,500
San Francisco 009 4 PPM 13 BH 6,710,000 1,482,800 446,300
San Jose 215 37 PPM 13 H 1,654,900 403,100 48,200
San Luis Obispo, CA 556 172 2A 2 H 250,400 51,500 5,000
Santa Barbara, CA 591 209 2A 2 H 183,400 55,000 3,300
Santa Maria-Lompoc, CA 567 202 2A 2 H 199,600 105,800 5,900
Sarasota-Bradenton 373 73 2S 2 H 721,800 80,000 46,700
Savannah 285 146 2S 2 B 330,400 19,000 108,300
Seattle-Tacoma 039 12 PPM 13 BH 3,863,400 336,900 254,900
Sheboygan, WI 418 260 2A 2 99,400 5,400 2,300
Shreveport 111 140 4S 4 B 344,200 13,200 132,200

RADIO MARKET SURVEY POPULATION, RANKINGS & INFORMATION—FALL 2017
Copyright © 2017 The Nielsen Company (US), LLC. All rights reserved.
Nielsen and the Nielsen logo are trademarks or registered trademarks of The Nielsen Company (US), LLC. 13
MARKET MKT
CODE RANK TYPE FREQ DST METRO 12+
POPULATION HISPANIC 12+ POPULATION*
BLACK 12+ POPULATION**
Sioux City, IA 523 259 2A 2 H 101,300 17,900 4,100
Sioux Falls, SD 319 188 2A 2 221,000 8,500 8,800
South Bend 287 184 2S 2 B 228,000 17,500 30,300
Spokane 177 93 4S 4 569,400 27,900 13,500
Springfield, MA 117 99 4S 4 H 550,400 99,700 39,600
Springfield, MO 203 135 2S 2 354,000 11,200 11,900
St. Louis 017 23 PPM 13 B 2,341,600 67,500 434,000
Stamford-Norwalk, CT 547 151 2A 2 H 322,400 61,100 27,700
Stockton 291 81 2S 2 H 616,400 238,600 49,200
Sunbury-Selinsgrove-Lewisburg, PA 434 215 2A 2 171,900 6,300 6,200
Sussex, NJ 579 247 2A 2 123,900 9,300 3,100
Syracuse 091 94 4S 4 564,900 22,100 49,000
Tallahassee 333 162 2S 2 B 284,800 17,600 84,200
Tampa-St. Petersburg-Clearwater 087 19 PPM 13 BH 2,704,100 480,400 322,800
Terre Haute 307 213 2S 2 175,300 3,900 9,500
Texarkana, TX-AR 512 242 2A 2 B 128,300 7,700 31,200
Toledo 097 104 4S 4 B 515,100 31,000 77,500
Topeka 205 204 2S 2 196,300 17,400 14,500
Traverse City-Petoskey-Cadillac, MI 335 159 2A 2 298,100 6,800 4,600
Trenton 537 152 2S 2 BH 319,800 53,500 63,200
Tri-Cities, WA (Richland-Kennewick-Pasco)
371 179 2A 2 H 235,400 66,200 5,400
Tucson 207 62 4S 4 H 880,100 300,700 35,600
Tulsa 103 65 4S 4 822,700 70,100 73,200
Tuscaloosa, AL 596 211 2A 2 B 179,900 5,700 56,100
Twin Falls-Sun Valley, ID 462 248 2A 2 H 123,400 24,200 800
Tyler-Longview 502 142 2S 2 BH 337,600 59,200 61,600
Utica-Rome 295 171 2S 2 251,600 11,400 14,100
Valdosta, GA 433 249 2A 2 B 121,100 7,300 40,600
Victor Valley 419 114 2S 2 BH 468,900 190,800 51,400
Visalia-Tulare-Hanford 293 107 2S 2 H 491,100 289,800 14,700
Waco, TX 309 193 2A 2 BH 211,500 50,400 30,800
Washington, DC 015 7 PPM 13 BH 4,921,100 760,200 1,315,500
Waterloo-Cedar Falls, IA 297 238 2A 2 134,800 4,500 10,500
Watertown, NY 577 262 2A 2 91,400 6,600 7,000
Wausau-Stevens Point, WI (Central WI) 597 177 2A 2 240,100 6,000 2,500
West Palm Beach-Boca Raton 299 48 PPM 13 BH 1,285,700 268,800 230,900
Wheeling 179 246 2S 2 124,000 1,400 4,700
Wichita 125 105 4S 4 H 510,900 59,200 45,100
Wichita Falls, TX 209 251 2A 2 BH 119,400 20,300 12,400
Wilkes Barre-Scranton 175 77 4S 4 687,900 61,100 39,300
Williamsport, PA 578 261 2A 2 99,200 1,900 5,100
Wilmington, DE 139 80 2S 2 B 623,200 50,000 133,800
Winchester, VA 569 210 2A 2 180,000 13,300 10,300
Worcester 113 118 2S 2 H 449,900 47,200 27,800

RADIO MARKET SURVEY POPULATION, RANKINGS & INFORMATION—FALL 2017
Copyright © 2017 The Nielsen Company (US), LLC. All rights reserved.
Nielsen and the Nielsen logo are trademarks or registered trademarks of The Nielsen Company (US), LLC. 14
MARKET MKT
CODE RANK TYPE FREQ DST METRO 12+
POPULATION HISPANIC 12+ POPULATION*
BLACK 12+ POPULATION**
Yakima, WA 325 198 2A 2 H 203,000 91,800 2,500
York 301 112 4S 4 472,300 31,200 25,100
Youngstown-Warren 129 131 2S 2 B 372,100 13,600 45,700
TOTAL 1-25 METRO PERSONS 12+ POPULATION: 113,991,300
TOTAL 1-50 METRO PERSONS 12+ POPULATION: 150,153,300
TOTAL 1-100 METRO PERSONS 12+ POPULATION: 186,608,900
TOTAL 1-268 METRO PERSONS 12+ POPULATION: 227,772,900
The population estimates for embedded markets are not duplicated in the cumulative population totals. 1 The Nassau-Suffolk (Long Island) Metro is embedded in the New York Metro.
2 The San Jose Metro is embedded in the San Francisco Metro.
3 Putnam, NY (population 86,900), Rockland, NY (population 269,900) and Westchester, NY (population 840,800) are included in the
Hudson Valley and the New York Metro definitions. 4 The Middlesex-Somerset-Union Metro is embedded in the New York Metro.
5 Monmouth County (population 542,700) is included in the Monmouth-Ocean and the New York Metro definitions.
6 The Morristown, NJ Metro is embedded in the New York Metro.
7 The Stamford-Norwalk, CT Metro is embedded in the New York Metro.
8 Stafford County (population 123,300) is included in the Fredericksburg and Washington, DC Metro definitions.
9 The Newburgh-Middletown, NY Metro is embedded in the Hudson Valley Metro.
10 The New Bedford-Fall River, MA Metro is embedded in the Providence-Warwick-Pawtucket Metro.
11 The Frederick, MD Metro is embedded in the Washington, DC Metro.
12 The M-Split portion of Rockingham County (population 51,000) is included in the Manchester and Portsmouth-Dover-Rochester Metro definitions.
MKT CODE: Unique numeric identifier for a market
FREQ (Frequency): Number of reports annually
TYPE (Type of Measurement Service): PPM – PPM, 4S – Diary Standard Continuous Measurement, 2S – Diary Standard Measurement, 2C – Diary Condensed Measurement, 2A – Diary 2-Book Average
DST (Differential Survey Treatment): B – Black ethnic controls, H – Hispanic ethnic controls, BH – Black and Hispanic ethnic control
* For a Metro to qualify for Hispanic DST, the Metro’s Hispanic P12+ population must be at least 9.5% Hispanic OR at least 4.5% Hispanic with an estimated Hispanic 12+ population of at least 75,000. Additional criteria apply in Diary Metros and can be referenced in the Description of Methodology.
** For a Metro to qualify for Black DST, the Metro’s Black P12+ population must be at least 9.5% Black or at least 4.5% Black with an estimated Black 12+ population of at least 75,000.
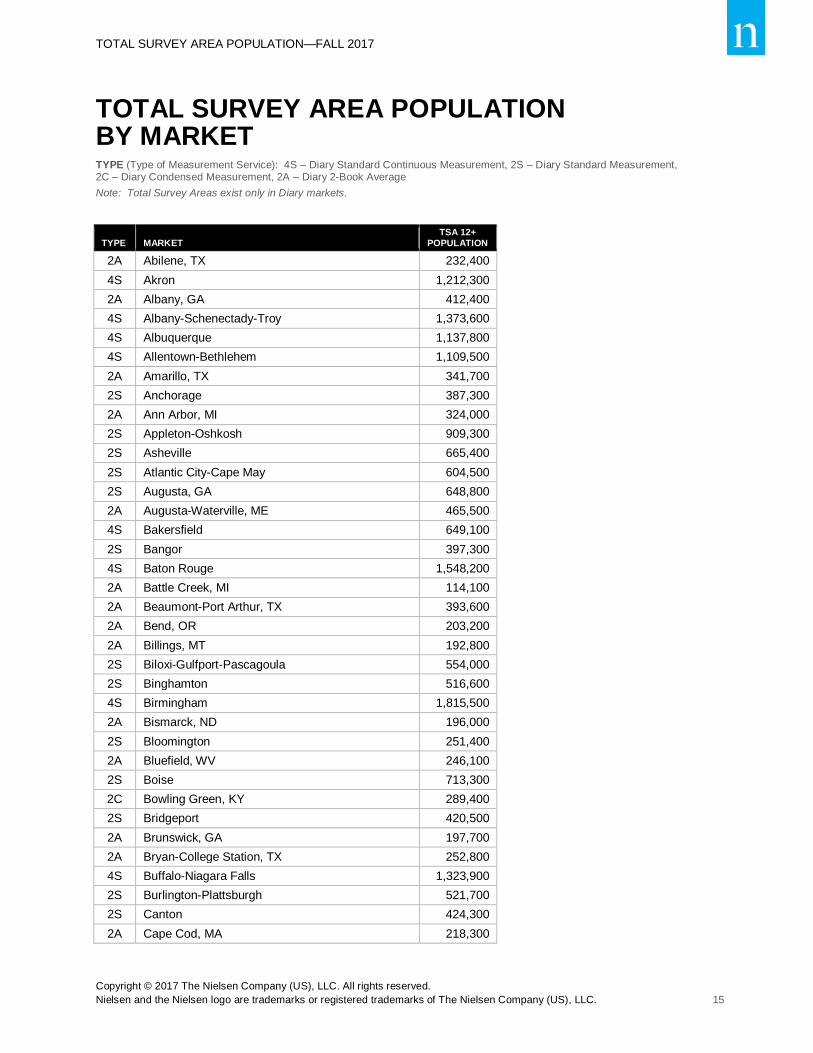
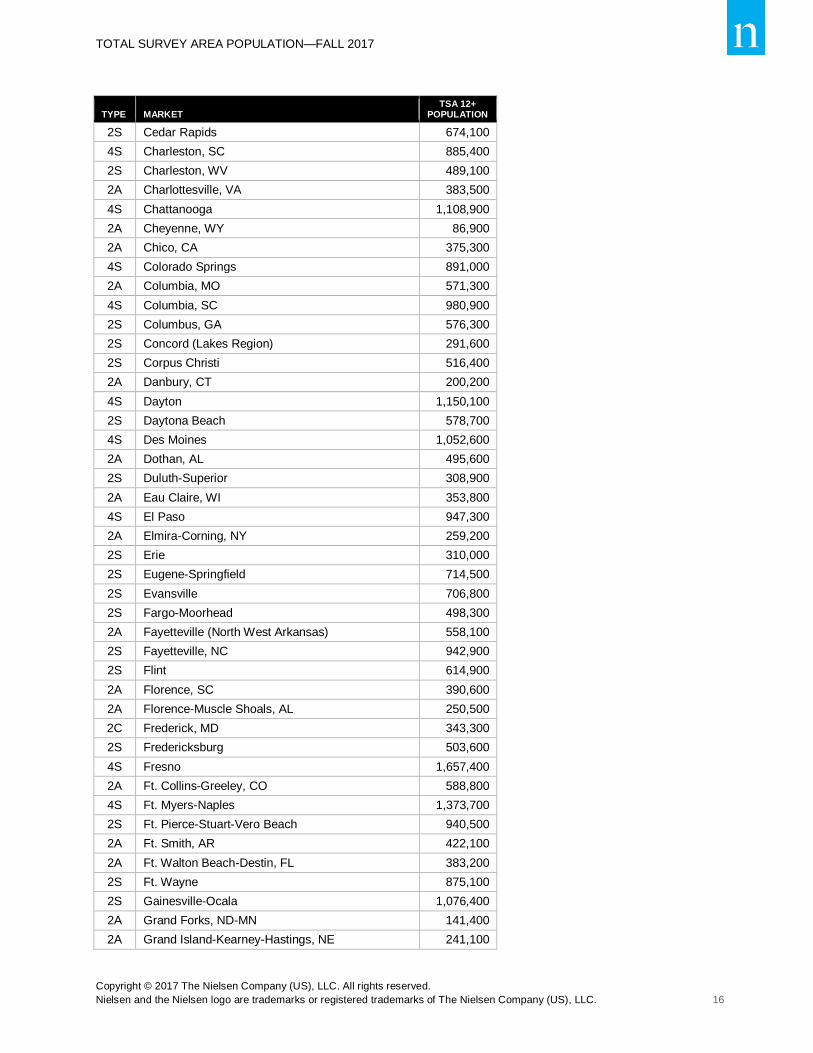
TOTAL SURVEY AREA POPULATION—FALL 2017
Copyright © 2017 The Nielsen Company (US), LLC. All rights reserved.
Nielsen and the Nielsen logo are trademarks or registered trademarks of The Nielsen Company (US), LLC. 15
TOTAL SURVEY AREA POPULATION BY MARKET TYPE (Type of Measurement Service): 4S – Diary Standard Continuous Measurement, 2S – Diary Standard Measurement, 2C – Diary Condensed Measurement, 2A – Diary 2-Book Average
Note: Total Survey Areas exist only in Diary markets.
TYPE MARKET TSA 12+
POPULATION
2A Abilene, TX 232,400
4S Akron 1,212,300
2A Albany, GA 412,400
4S Albany-Schenectady-Troy 1,373,600
4S Albuquerque 1,137,800
4S Allentown-Bethlehem 1,109,500
2A Amarillo, TX 341,700
2S Anchorage 387,300
2A Ann Arbor, MI 324,000
2S Appleton-Oshkosh 909,300
2S Asheville 665,400
2S Atlantic City-Cape May 604,500
2S Augusta, GA 648,800
2A Augusta-Waterville, ME 465,500
4S Bakersfield 649,100
2S Bangor 397,300
4S Baton Rouge 1,548,200
2A Battle Creek, MI 114,100
2A Beaumont-Port Arthur, TX 393,600
2A Bend, OR 203,200
2A Billings, MT 192,800
2S Biloxi-Gulfport-Pascagoula 554,000
2S Binghamton 516,600
4S Birmingham 1,815,500
2A Bismarck, ND 196,000
2S Bloomington 251,400
2A Bluefield, WV 246,100
2S Boise 713,300
2C Bowling Green, KY 289,400
2S Bridgeport 420,500
2A Brunswick, GA 197,700
2A Bryan-College Station, TX 252,800
4S Buffalo-Niagara Falls 1,323,900
2S Burlington-Plattsburgh 521,700
2S Canton 424,300
2A Cape Cod, MA 218,300
TOTAL SURVEY AREA POPULATION—FALL 2017
Copyright © 2017 The Nielsen Company (US), LLC. All rights reserved.
Nielsen and the Nielsen logo are trademarks or registered trademarks of The Nielsen Company (US), LLC. 16
TYPE MARKET TSA 12+
POPULATION
2S Cedar Rapids 674,100
4S Charleston, SC 885,400
2S Charleston, WV 489,100
2A Charlottesville, VA 383,500
4S Chattanooga 1,108,900
2A Cheyenne, WY 86,900
2A Chico, CA 375,300
4S Colorado Springs 891,000
2A Columbia, MO 571,300
4S Columbia, SC 980,900
2S Columbus, GA 576,300
2S Concord (Lakes Region) 291,600
2S Corpus Christi 516,400
2A Danbury, CT 200,200
4S Dayton 1,150,100
2S Daytona Beach 578,700
4S Des Moines 1,052,600
2A Dothan, AL 495,600
2S Duluth-Superior 308,900
2A Eau Claire, WI 353,800
4S El Paso 947,300
2A Elmira-Corning, NY 259,200
2S Erie 310,000
2S Eugene-Springfield 714,500
2S Evansville 706,800
2S Fargo-Moorhead 498,300
2A Fayetteville (North West Arkansas) 558,100
2S Fayetteville, NC 942,900
2S Flint 614,900
2A Florence, SC 390,600
2A Florence-Muscle Shoals, AL 250,500
2C Frederick, MD 343,300
2S Fredericksburg 503,600
4S Fresno 1,657,400
2A Ft. Collins-Greeley, CO 588,800
4S Ft. Myers-Naples 1,373,700
2S Ft. Pierce-Stuart-Vero Beach 940,500
2A Ft. Smith, AR 422,100
2A Ft. Walton Beach-Destin, FL 383,200
2S Ft. Wayne 875,100
2S Gainesville-Ocala 1,076,400
2A Grand Forks, ND-MN 141,400
2A Grand Island-Kearney-Hastings, NE 241,100

TOTAL SURVEY AREA POPULATION—FALL 2017
Copyright © 2017 The Nielsen Company (US), LLC. All rights reserved.
Nielsen and the Nielsen logo are trademarks or registered trademarks of The Nielsen Company (US), LLC. 17
TYPE MARKET TSA 12+
POPULATION
2A Grand Junction, CO 261,700
4S Grand Rapids 1,698,900
2S Green Bay 830,900
4S Greenville-New Bern-Jacksonville 1,045,800
4S Greenville-Spartanburg 1,974,400
2A Hagerstown-Chambersburg-Waynesboro, MD-PA 436,800
4S Harrisburg-Lebanon-Carlisle 1,687,600
2A Harrisonburg, VA 347,500
2A Hilton Head, SC 488,000
4S Honolulu 990,900
2A Hot Springs, AR 294,200
2S Hudson Valley 2,047,500
2S Huntington-Ashland 544,100
4S Huntsville 1,086,200
4S Jackson, MS 890,800
2A Jackson, TN 427,800
4S Johnson City-Kingsport-Bristol 892,700
2A Joplin, MO 414,400
2S Kalamazoo 681,400
2A Killeen-Temple, TX 396,700
4S Knoxville 1,396,100
2A La Crosse, WI 352,100
2S Lafayette, IN 344,000
2S Lafayette, LA 661,400
2A Lake Charles, LA 338,400
2S Lakeland-Winter Haven 607,900
2S Lancaster 958,900
2S Lansing-East Lansing 854,200
2A Laredo, TX 230,700
2A LaSalle-Peru, IL 138,600
2A Laurel-Hattiesburg, MS 331,500
2A Lebanon-Hanover-White River Junction, NH-VT 282,200
2S Lexington-Fayette 930,900
2A Lima, OH 318,800
2S Lincoln 415,400
4S Little Rock 1,174,300
4S Louisville 1,527,500
2S Lubbock 406,900
2S Macon 599,600
4S Madison 1,113,900
2S Manchester 312,100
2S McAllen-Brownsville-Harlingen 1,095,800
2A Medford-Ashland, OR 303,900

TOTAL SURVEY AREA POPULATION—FALL 2017
Copyright © 2017 The Nielsen Company (US), LLC. All rights reserved.
Nielsen and the Nielsen logo are trademarks or registered trademarks of The Nielsen Company (US), LLC. 18
TYPE MARKET TSA 12+
POPULATION
2S Melbourne-Titusville-Cocoa 523,700
2A Merced, CA 362,700
4S Mobile 1,210,400
2S Modesto 1,393,200
2S Monmouth-Ocean 1,044,100
2A Monroe, LA 402,900
4S Monterey-Salinas-Santa Cruz 653,700
2S Montgomery 787,500
2S Montpelier-Barre-St. Johnsbury 297,400
2A Morgantown-Clarksburg-Fairmont, WV 387,800
2C Morristown, NJ 433,900
2A Muncie-Marion, IN 417,900
2A Muskegon, MI 221,500
2A Myrtle Beach, SC 596,300
2C New Bedford-Fall River, MA 232,500
2S New Haven 701,700
2A New London, CT 335,800
4S New Orleans 1,987,500
2A Newburgh-Middletown, NY 800,500
2A Odessa-Midland, TX 402,900
4S Oklahoma City 1,749,600
2A Olean, NY 157,300
4S Omaha-Council Bluffs 1,304,700
2S Oxnard-Ventura 908,800
2S Palm Springs 631,600
2A Panama City, FL 369,400
2A Parkersburg-Marietta, WV-OH 303,300
2S Pensacola 817,000
2S Peoria 576,000
2S Portland, ME 1,028,500
2S Portsmouth-Dover-Rochester 560,100
2A Poughkeepsie, NY 896,400
2S Pueblo 195,400
4S Puerto Rico 2,922,100
2S Quad Cities (Davenport-Rock Island-Moline) 634,600
2A Rapid City, SD 201,400
2A Reading, PA 355,400
2A Redding, CA 265,400
2S Reno 698,400
4S Richmond 1,289,600
2S Roanoke-Lynchburg 1,220,000
2A Rochester, MN 377,500
4S Rochester, NY 1,195,900

TOTAL SURVEY AREA POPULATION—FALL 2017
Copyright © 2017 The Nielsen Company (US), LLC. All rights reserved.
Nielsen and the Nielsen logo are trademarks or registered trademarks of The Nielsen Company (US), LLC. 19
TYPE MARKET TSA 12+
POPULATION
2S Rockford 626,300
2A Saginaw-Bay City-Midland, MI 1,028,300
2A Salina-Manhattan, KS 276,500
2S Salisbury-Ocean City 622,000
2A San Angelo, TX 133,800
2A San Luis Obispo, CA 450,000
2A Santa Barbara, CA 183,400
2A Santa Maria-Lompoc, CA 199,600
2S Sarasota-Bradenton 944,900
2S Savannah 912,100
2A Sheboygan, WI 99,400
4S Shreveport 833,200
2A Sioux City, IA 256,900
2A Sioux Falls, SD 465,500
2S South Bend 900,300
4S Spokane 824,500
4S Springfield, MA 612,700
2S Springfield, MO 710,700
2A Stamford-Norwalk, CT 322,400
2S Stockton 616,400
2A Sunbury-Selinsgrove-Lewisburg, PA 252,200
2A Sussex, NJ 173,300
4S Syracuse 1,094,000
2S Tallahassee 518,400
2S Terre Haute 347,400
2A Texarkana, TX-AR 257,000
4S Toledo 904,800
2S Topeka 526,600
2A Traverse City-Petoskey-Cadillac, MI 474,400
2S Trenton 430,000
2A Tri-Cities, WA (Richland-Kennewick-Pasco) 458,900
4S Tucson 1,390,500
4S Tulsa 1,373,400
2A Tuscaloosa, AL 350,100
2A Twin Falls-Sun Valley, ID 159,800
2S Tyler-Longview 823,600
2S Utica-Rome 390,100
2A Valdosta, GA 264,600
2S Victor Valley 468,900
2S Visalia-Tulare-Hanford 491,100
2A Waco, TX 695,900
2A Waterloo-Cedar Falls, IA 519,500
2A Watertown, NY 114,100

TOTAL SURVEY AREA POPULATION—FALL 2017
Copyright © 2017 The Nielsen Company (US), LLC. All rights reserved.
Nielsen and the Nielsen logo are trademarks or registered trademarks of The Nielsen Company (US), LLC. 20
TYPE MARKET TSA 12+
POPULATION
2A Wausau-Stevens Point, WI (Central WI) 542,900
2S Wheeling 308,200
4S Wichita 702,100
2A Wichita Falls, TX 342,900
4S Wilkes Barre-Scranton 894,600
2A Williamsport, PA 311,100
2S Wilmington, DE 773,600
2A Winchester, VA 402,800
2S Worcester 573,300
2A Yakima, WA 235,000
4S York 929,000
2S Youngstown-Warren 749,500

TELEVISION DMA MARKETS—FALL 2017
Copyright © 2017 The Nielsen Company (US), LLC. All rights reserved.
Nielsen and the Nielsen logo are trademarks or registered trademarks of The Nielsen Company (US), LLC. 21
TELEVISION DMA® MARKETS
MARKET TVHH RANK
DMA PERSONS 12+ TVHH
New York 1 18,454,000 7,074,750
Los Angeles 2 15,691,600 5,318,630
Chicago 3 8,213,800 3,299,720
Philadelphia 4 6,974,900 2,869,580
Dallas-Ft. Worth 5 6,671,000 2,648,490
Washington, DC (Hagrstwn) 6 5,934,900 2,492,170
Houston 7 6,069,600 2,467,140
San Francisco-Oak-San Jose 8 6,593,400 2,451,640
Atlanta 9 5,930,100 2,449,460
Boston (Manchester) 10 5,786,100 2,425,440
Phoenix (Prescott) 11 4,752,700 1,919,930
Seattle-Tacoma 12 4,580,000 1,880,750
Tampa-St. Pete (Sarasota) 13 4,258,100 1,879,760
Detroit 14 4,173,300 1,779,380
Minneapolis-St. Paul 15 4,038,100 1,730,430
Miami-Ft. Lauderdale 16 4,142,100 1,677,850
Denver 17 3,892,700 1,589,560
Orlando-Daytona Bch-Melbrn 18 3,701,800 1,531,130
Cleveland-Akron (Canton) 19 3,283,300 1,447,310
Sacramnto-Stkton-Modesto 20 3,660,800 1,412,940
St. Louis 21 2,734,600 1,189,890
Portland, OR 22 2,938,500 1,180,980
Charlotte 23 2,789,400 1,145,270
Pittsburgh 24 2,464,000 1,141,950
Raleigh-Durham (Fayetvlle) 25 2,723,300 1,133,160
Baltimore 26 2,573,100 1,108,010
Nashville 27 2,466,700 1,030,650
Indianapolis 28 2,566,800 1,026,260
San Diego 29 2,853,400 1,002,770
Salt Lake City 30 2,643,300 948,840
San Antonio 31 2,360,500 924,480
Hartford & New Haven 32 2,290,200 921,500
Kansas City 33 2,142,100 901,020
Columbus, OH 34 2,169,800 896,980
Cincinnati 35 2,017,400 871,970
Milwaukee 36 1,980,800 868,500
West Palm Beach-Ft. Pierce 37 1,875,900 829,110
Greenvll-Spart-Ashevll-And 38 1,997,100 809,190
Austin 39 1,920,900 791,480
Las Vegas 40 1,922,100 757,400
Oklahoma City 41 1,629,600 705,840
Jacksonville 42 1,646,500 700,890
Grand Rapids-Kalmzoo-B.Crk 43 1,748,000 689,950
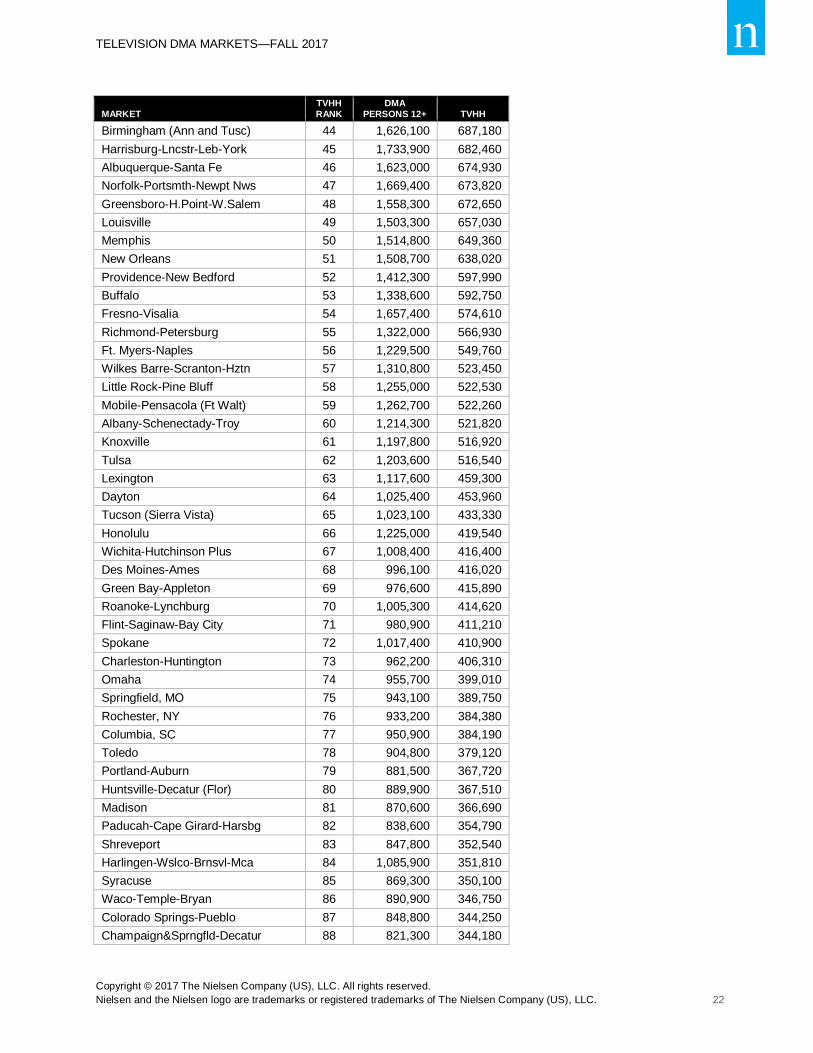
TELEVISION DMA MARKETS—FALL 2017
Copyright © 2017 The Nielsen Company (US), LLC. All rights reserved.
Nielsen and the Nielsen logo are trademarks or registered trademarks of The Nielsen Company (US), LLC. 22
MARKET TVHH RANK
DMA PERSONS 12+ TVHH
Birmingham (Ann and Tusc) 44 1,626,100 687,180
Harrisburg-Lncstr-Leb-York 45 1,733,900 682,460
Albuquerque-Santa Fe 46 1,623,000 674,930
Norfolk-Portsmth-Newpt Nws 47 1,669,400 673,820
Greensboro-H.Point-W.Salem 48 1,558,300 672,650
Louisville 49 1,503,300 657,030
Memphis 50 1,514,800 649,360
New Orleans 51 1,508,700 638,020
Providence-New Bedford 52 1,412,300 597,990
Buffalo 53 1,338,600 592,750
Fresno-Visalia 54 1,657,400 574,610
Richmond-Petersburg 55 1,322,000 566,930
Ft. Myers-Naples 56 1,229,500 549,760
Wilkes Barre-Scranton-Hztn 57 1,310,800 523,450
Little Rock-Pine Bluff 58 1,255,000 522,530
Mobile-Pensacola (Ft Walt) 59 1,262,700 522,260
Albany-Schenectady-Troy 60 1,214,300 521,820
Knoxville 61 1,197,800 516,920
Tulsa 62 1,203,600 516,540
Lexington 63 1,117,600 459,300
Dayton 64 1,025,400 453,960
Tucson (Sierra Vista) 65 1,023,100 433,330
Honolulu 66 1,225,000 419,540
Wichita-Hutchinson Plus 67 1,008,400 416,400
Des Moines-Ames 68 996,100 416,020
Green Bay-Appleton 69 976,600 415,890
Roanoke-Lynchburg 70 1,005,300 414,620
Flint-Saginaw-Bay City 71 980,900 411,210
Spokane 72 1,017,400 410,900
Charleston-Huntington 73 962,200 406,310
Omaha 74 955,700 399,010
Springfield, MO 75 943,100 389,750
Rochester, NY 76 933,200 384,380
Columbia, SC 77 950,900 384,190
Toledo 78 904,800 379,120
Portland-Auburn 79 881,500 367,720
Huntsville-Decatur (Flor) 80 889,900 367,510
Madison 81 870,600 366,690
Paducah-Cape Girard-Harsbg 82 838,600 354,790
Shreveport 83 847,800 352,540
Harlingen-Wslco-Brnsvl-Mca 84 1,085,900 351,810
Syracuse 85 869,300 350,100
Waco-Temple-Bryan 86 890,900 346,750
Colorado Springs-Pueblo 87 848,800 344,250
Champaign&Sprngfld-Decatur 88 821,300 344,180

TELEVISION DMA MARKETS—FALL 2017
Copyright © 2017 The Nielsen Company (US), LLC. All rights reserved.
Nielsen and the Nielsen logo are trademarks or registered trademarks of The Nielsen Company (US), LLC. 23
MARKET TVHH RANK
DMA PERSONS 12+ TVHH
Chattanooga 89 840,600 336,580
Savannah 90 822,300 328,860
Cedar Rapids-Wtrlo-Iwc&Dub 91 774,300 325,780
Charleston, SC 92 782,100 320,980
El Paso (Las Cruces) 93 872,600 318,260
Baton Rouge 94 791,700 314,970
Jackson, MS 95 765,700 306,410
South Bend-Elkhart 96 755,600 297,680
Burlington-Plattsburgh 97 746,100 294,020
Ft. Smith-Fay-Sprngdl-Rgrs 98 732,500 292,160
Tri-Cities, TN-VA 99 691,200 290,530
Greenville-N.Bern-Washngtn 100 693,900 285,650
Myrtle Beach-Florence 101 686,200 281,550
Davenport-R.Island-Moline 102 649,600 277,950
Evansville 103 631,000 264,890
Boise 104 683,100 264,300
Reno 105 653,300 263,990
Lincoln & Hastings-Krny 106 623,000 263,110
Johnstown-Altoona-St Colge 107 657,800 262,020
Tallahassee-Thomasville 108 652,600 257,570
Tyler-Longview(Lfkn&Ncgd) 109 642,300 253,230
Sioux Falls(Mitchell) 110 593,000 252,660
Ft. Wayne 111 612,100 249,130
Augusta-Aiken 112 613,700 249,090
Fargo 113 549,500 240,560
Yakima-Pasco-Rchlnd-Knnwck 114 606,100 239,760
Lansing 115 589,900 238,990
Springfield-Holyoke 116 612,700 237,580
Youngstown 117 559,100 234,120
Traverse City-Cadillac 118 539,300 233,370
Eugene 119 565,100 231,570
Macon 120 567,700 222,970
Lafayette, LA 121 537,500 222,450
Peoria-Bloomington 122 542,000 222,210
SantaBarbra-SanMar-SanLuob 123 633,400 222,190
Montgomery-Selma 124 532,600 218,740
Monterey-Salinas 125 653,700 217,560
Bakersfield 126 649,100 212,180
Columbus, GA (Opelika, AL) 127 500,500 206,520
Corpus Christi 128 509,700 198,820
La Crosse-Eau Claire 129 486,900 196,160
Wilmington 130 447,800 191,440
Amarillo 131 455,300 179,920
Chico-Redding 132 449,000 179,370
Columbus-Tupelo-W Pnt-Hstn 133 419,100 172,520
TELEVISION DMA MARKETS—FALL 2017
Copyright © 2017 The Nielsen Company (US), LLC. All rights reserved.
Nielsen and the Nielsen logo are trademarks or registered trademarks of The Nielsen Company (US), LLC. 24
MARKET TVHH RANK
DMA PERSONS 12+ TVHH
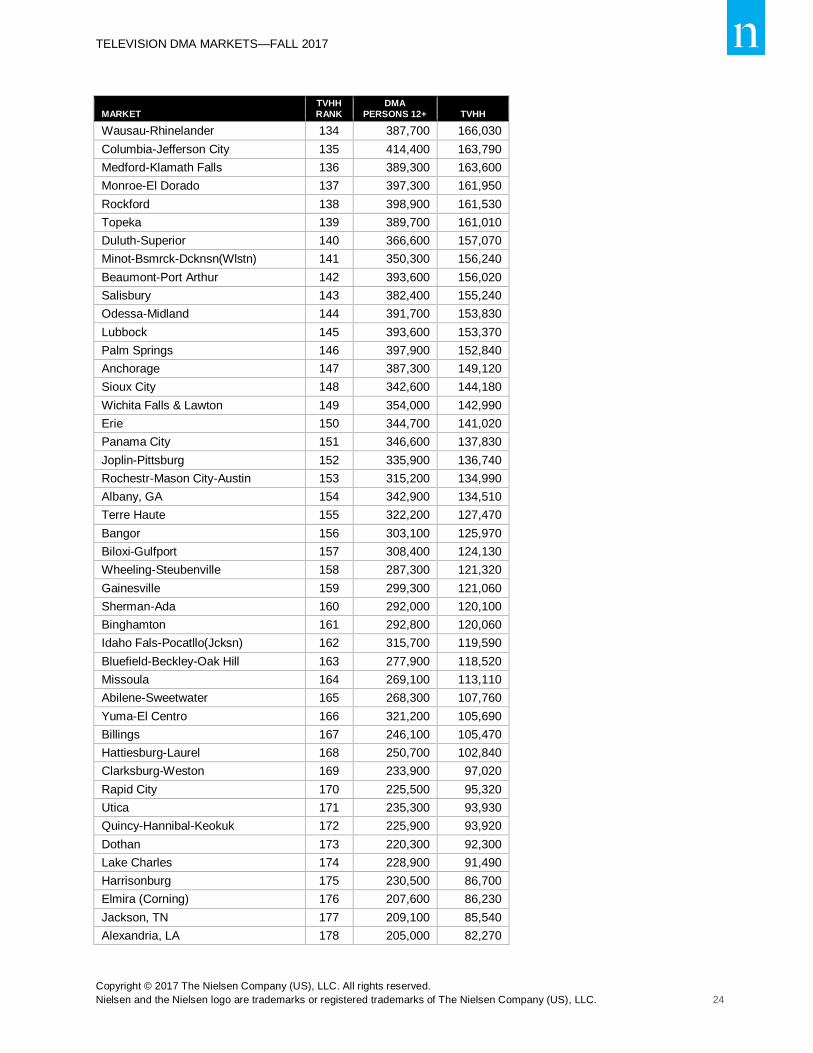
Wausau-Rhinelander 134 387,700 166,030
Columbia-Jefferson City 135 414,400 163,790
Medford-Klamath Falls 136 389,300 163,600
Monroe-El Dorado 137 397,300 161,950
Rockford 138 398,900 161,530
Topeka 139 389,700 161,010
Duluth-Superior 140 366,600 157,070
Minot-Bsmrck-Dcknsn(Wlstn) 141 350,300 156,240
Beaumont-Port Arthur 142 393,600 156,020
Salisbury 143 382,400 155,240
Odessa-Midland 144 391,700 153,830
Lubbock 145 393,600 153,370
Palm Springs 146 397,900 152,840
Anchorage 147 387,300 149,120
Sioux City 148 342,600 144,180
Wichita Falls & Lawton 149 354,000 142,990
Erie 150 344,700 141,020
Panama City 151 346,600 137,830
Joplin-Pittsburg 152 335,900 136,740
Rochestr-Mason City-Austin 153 315,200 134,990
Albany, GA 154 342,900 134,510
Terre Haute 155 322,200 127,470
Bangor 156 303,100 125,970
Biloxi-Gulfport 157 308,400 124,130
Wheeling-Steubenville 158 287,300 121,320
Gainesville 159 299,300 121,060
Sherman-Ada 160 292,000 120,100
Binghamton 161 292,800 120,060
Idaho Fals-Pocatllo(Jcksn) 162 315,700 119,590
Bluefield-Beckley-Oak Hill 163 277,900 118,520
Missoula 164 269,100 113,110
Abilene-Sweetwater 165 268,300 107,760
Yuma-El Centro 166 321,200 105,690
Billings 167 246,100 105,470
Hattiesburg-Laurel 168 250,700 102,840
Clarksburg-Weston 169 233,900 97,020
Rapid City 170 225,500 95,320
Utica 171 235,300 93,930
Quincy-Hannibal-Keokuk 172 225,900 93,920
Dothan 173 220,300 92,300
Lake Charles 174 228,900 91,490
Harrisonburg 175 230,500 86,700
Elmira (Corning) 176 207,600 86,230
Jackson, TN 177 209,100 85,540
Alexandria, LA 178 205,000 82,270
TELEVISION DMA MARKETS—FALL 2017
Copyright © 2017 The Nielsen Company (US), LLC. All rights reserved.
Nielsen and the Nielsen logo are trademarks or registered trademarks of The Nielsen Company (US), LLC. 25
MARKET TVHH RANK
DMA PERSONS 12+ TVHH
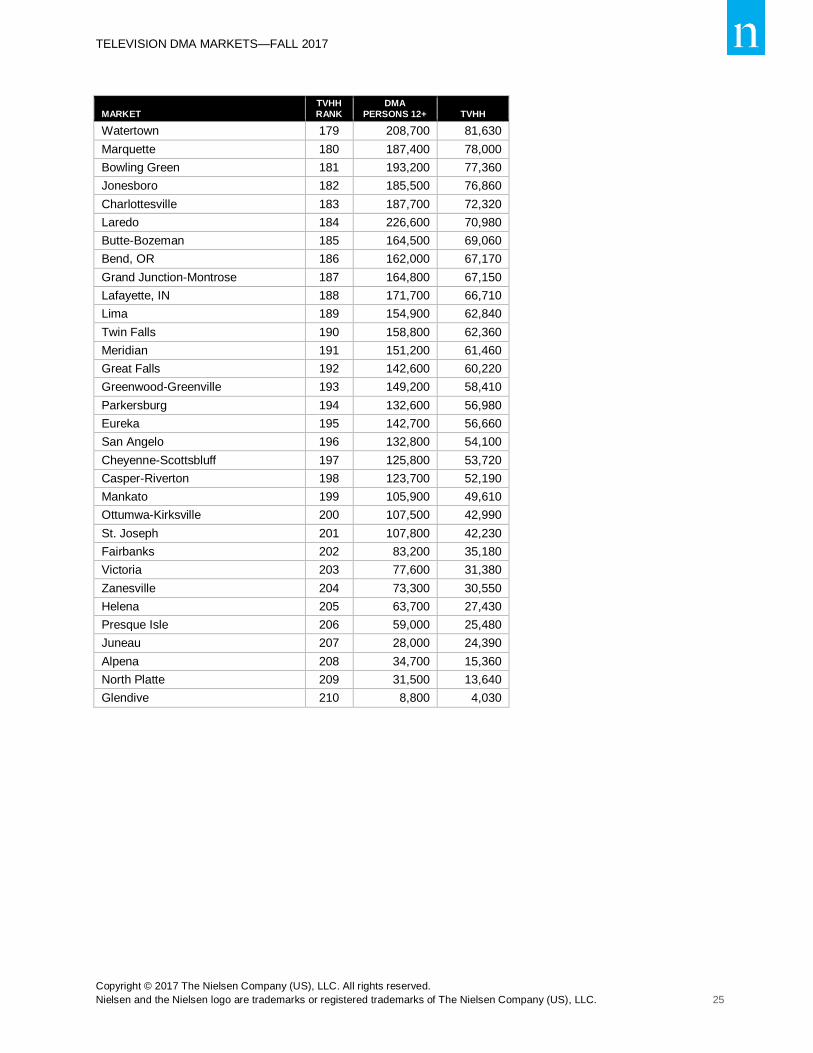
Watertown 179 208,700 81,630
Marquette 180 187,400 78,000
Bowling Green 181 193,200 77,360
Jonesboro 182 185,500 76,860
Charlottesville 183 187,700 72,320
Laredo 184 226,600 70,980
Butte-Bozeman 185 164,500 69,060
Bend, OR 186 162,000 67,170
Grand Junction-Montrose 187 164,800 67,150
Lafayette, IN 188 171,700 66,710
Lima 189 154,900 62,840
Twin Falls 190 158,800 62,360
Meridian 191 151,200 61,460
Great Falls 192 142,600 60,220
Greenwood-Greenville 193 149,200 58,410
Parkersburg 194 132,600 56,980
Eureka 195 142,700 56,660
San Angelo 196 132,800 54,100
Cheyenne-Scottsbluff 197 125,800 53,720
Casper-Riverton 198 123,700 52,190
Mankato 199 105,900 49,610
Ottumwa-Kirksville 200 107,500 42,990
St. Joseph 201 107,800 42,230
Fairbanks 202 83,200 35,180
Victoria 203 77,600 31,380
Zanesville 204 73,300 30,550
Helena 205 63,700 27,430
Presque Isle 206 59,000 25,480
Juneau 207 28,000 24,390
Alpena 208 34,700 15,360
North Platte 209 31,500 13,640
Glendive 210 8,800 4,030