Embed Size (px)
Citation preview
0
Acknowledgements 0
Radiobiological optimization including consideration of secondary cancer risk: A treatment modality
comparison study for pediatric medulloblastoma
Patrik Brodin
Master of Science Thesis
Copenhagen University Hospital (Rigshospitalet), June 15, 2010
Supervisors: Marianne Aznar, Ph.D., Per Munck af Rosenschöld, Ph.D. Per Nilsson, Ph.D., Thomas Björk-Eriksson M.D. Ph.D.
1
0
Acknowledgements
Acknowledgements A very special thank you to:
• Marianne Aznar for all her advice and dedication and for always finding time to help me even where no time was to be found
• Per Munck for being a source of many great ideas and playing a large role in
the shaping of this project
• Per Nilsson for providing his great expertise in the field of radiotherapy research as well as many positive and inspiring conversations
• Thomas Björk-Eriksson for his enormous enthusiasm regarding this project and his continuous inspiration and support
• Anne Kiil Berthelsen and her devotion to this project in spending many hours contributing her great experience to the delineation of patient organs
• Ivan Vogelius for providing great help with MATLAB-programming and his experience in assessing normal tissue complications
Thanks also to everyone at the radiotherapy department at the Copenhagen University Hospital for making it a pleasure to work there. Sincerely, Patrik Brodin
2
Patrik Brodin – Master of Science Thesis
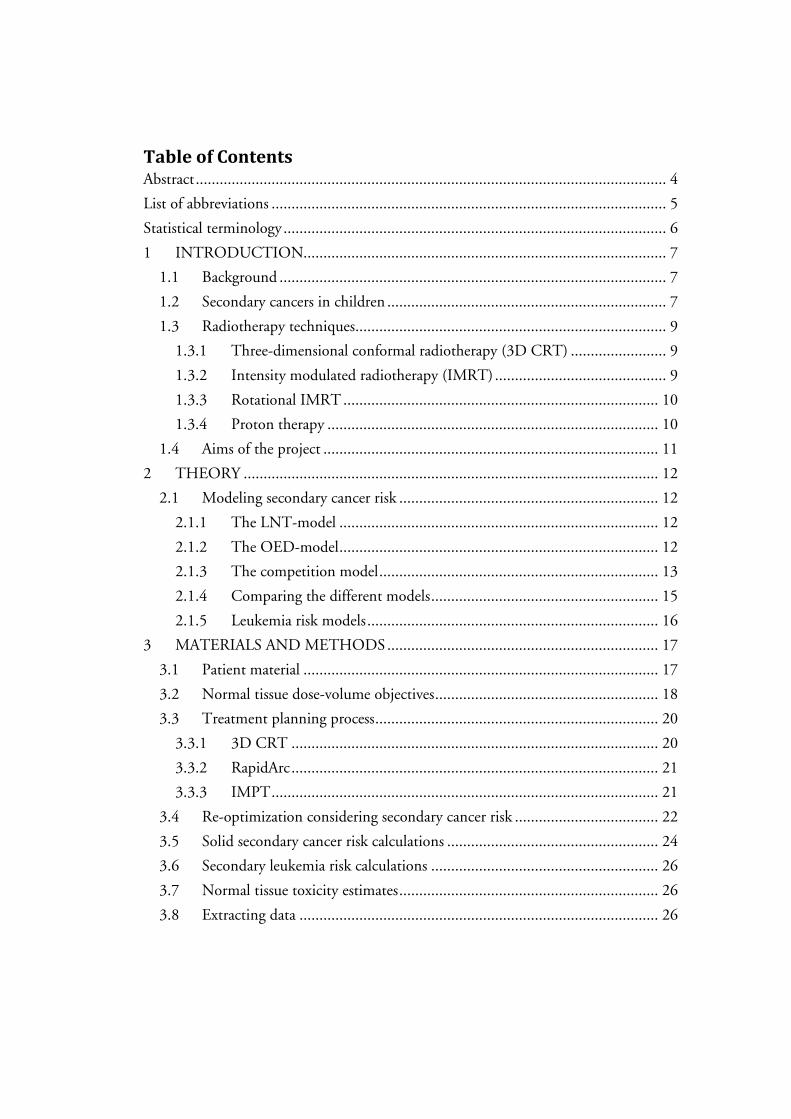
Table of Contents Abstract ...................................................................................................................... 4
List of abbreviations ................................................................................................... 5
Statistical terminology ................................................................................................ 6
1 INTRODUCTION........................................................................................... 7
1.1 Background ................................................................................................. 7
1.2 Secondary cancers in children ...................................................................... 7
1.3 Radiotherapy techniques .............................................................................. 9
1.3.1 Three-dimensional conformal radiotherapy (3D CRT) ........................ 9
1.3.2 Intensity modulated radiotherapy (IMRT) ........................................... 9
1.3.3 Rotational IMRT ............................................................................... 10
1.3.4 Proton therapy ................................................................................... 10
1.4 Aims of the project .................................................................................... 11
2 THEORY ........................................................................................................ 12
2.1 Modeling secondary cancer risk ................................................................. 12
2.1.1 The LNT-model ................................................................................ 12
2.1.2 The OED-model ................................................................................ 12
2.1.3 The competition model ...................................................................... 13
2.1.4 Comparing the different models ......................................................... 15
2.1.5 Leukemia risk models ......................................................................... 16
3 MATERIALS AND METHODS .................................................................... 17
3.1 Patient material ......................................................................................... 17
3.2 Normal tissue dose-volume objectives ........................................................ 18
3.3 Treatment planning process ....................................................................... 20
3.3.1 3D CRT ............................................................................................ 20
3.3.2 RapidArc ............................................................................................ 21
3.3.3 IMPT ................................................................................................. 21
3.4 Re-optimization considering secondary cancer risk .................................... 22
3.5 Solid secondary cancer risk calculations ..................................................... 24
3.6 Secondary leukemia risk calculations ......................................................... 26
3.7 Normal tissue toxicity estimates ................................................................. 26
3.8 Extracting data .......................................................................................... 26
3
0
Acknowledgements
4 RESULTS ........................................................................................................ 27
4.1 Solid secondary cancer risk and the effects of considering it in the optimization process ............................................................................................. 27
4.2 The impact of target volume definition on secondary cancer risk ............... 31
4.3 Normal tissue toxicity estimates ................................................................. 33
4.4 Robustness of the secondary cancer risk optimization ................................. 35
4.5 Estimate of secondary leukemia risk ........................................................... 37
4.6 Target coverage .......................................................................................... 38
5 DISCUSSION ................................................................................................. 39
6 CONCLUSION .............................................................................................. 42
Appendix A ............................................................................................................... 43
NTCP-modeling................................................................................................... 43
The LKB-model ................................................................................................ 43
The relative seriality model ............................................................................... 45
The EUD-model .............................................................................................. 46
Applicability of NTCP-models ......................................................................... 47
Appendix B ............................................................................................................... 48
Estimates of normal tissue complication ............................................................... 48
4
Patrik Brodin – Master of Science Thesis
Abstract Purpose: To estimate and compare normal tissue toxicity and secondary cancer (SC) risks from 3D conformal radiotherapy (3D CRT), arc radiotherapy (ART) and intensity modulated proton therapy (IMPT) for treatment of pediatric medullo-blastoma (MB). The purpose was also to investigate the possibility of optimizing radiotherapy treatment with the aim of reducing normal tissue toxicity as well as the risk of SC. Materials and methods: Treatment plans were generated with 3D CRT, ART as of the RapidArc implementation and spot-scanned IMPT. The patient material consisted of treatment records including CT- and MRI-scans of four males and six females aged 4 to 15 years old. These patients were treated with craniospinal irradiation (CSI) for MB at Copenhagen University Hospital between 2007-2009. The treatment regimen studied was CSI to a prescribed dose of 30.6 Gy followed by a boost to the posterior fossa to 54 Gy. In order to optimize the plans with the aim of reducing normal tissue toxicity a thorough literature review was conducted to find organ specific dose-volume vs. toxicity data relevant to children treated with RT. SC cancer risks were estimated using organ-equivalent dose models based on the combined SC data from the atomic bomb survivors and patients receiving RT for Hodgkin’s disease. Using the site-specific SC incidence provided by the Life Span Study (LSS) the RapidArc plans were re-optimized with the aim of reducing SC risk. A robustness analysis regarding the re-optimization concept was conducted by estimating SC risks with different models. Results: The results show that the risk of developing a solid SC from inversely optimized arc therapy can be reduced to the same level as for 3D CRT. With regards to normal tissue toxicity, the risks for several severe complications were considerably lower with RapidArc than with 3D CRT. As for treatment with 3D CRT it was shown that the choice of spinal field width has a considerable impact on SC risk as well as normal tissue toxicity. The risks of normal tissue toxicity as well as SC were substantially lower for IMPT compared to the photon techniques. Conclusions: This study demonstrates the possibility of reducing SC risk from inversely planned arc therapy by including it in the optimization process. As SC risk calculations are subject to large uncertainty, absolute values should be treated with some reservation. Comparisons between different techniques can however be considered more reliable. The risk of severe complications such as heart failure was shown to be substantially higher for 3D CRT compared to intensity-modulated therapy. The ability to reduce the SC risk related to ART along with the lower risk of normal tissue toxicity favors RapidArc over 3D CRT for treating MB. The potential benefit of treating children with spot-scanned proton therapy compared to photon techniques is clearly illustrated in this study.
5
0
List of abbreviations
List of abbreviations CSI Craniospinal irradiation MB Medulloblastoma RT Radiotherapy 3D CRT Three-dimensional conformal radiotherapy IMRT Intensity-modulated radiotherapy IMPT Intensity-modulated proton therapy CNS Central nervous system CCSS Childhood cancer survivor study CT Computed tomography PET Positron emission tomography MRI Magnetic resonance imaging OAR Organ at risk MLC Multi-Leaf-Collimator VMAT® Volumetric modulated arc therapy RBE Relative biologic effect LNT Linear no-threshold NCRP National Council on Radiation Protection and Measurements OED Organ equivalent dose LSS Life Span Study BED Biologically effective dose PTV Planning target volume LET Linear energy transfer DICOM Digital imaging and communications in medicine DVH Dose-volume histogram NTCP Normal tissue complication probability EUD Equivalent uniform dose
6
Patrik Brodin – Master of Science Thesis
Statistical terminology
Observed/Expected ratio (O/E) The ratio of observed events over expected events in the studied cohort.
Standardized incidence ratio (SIR) Standardized incidence ratios are the number of observed events in a cohort over the number of expected events in that cohort adjusted by classification according to known confounders. Thus, a separate SIR is calculated for each group of the cohort adhering to a certain classification, e.g. age or smoking status. The final SIR is then the weighted mean according to the size of each group.
Relative risk (RR) Relative risks are used to relate the risk of an event occurring to a certain exposure. The RR is the ratio of the probability of an event occurring in the exposed group versus the non-exposed group.
Excess relative risk (ERR) The excess relative risk is the addition to the relative risk relating to the studied exposure. Thus the ERR is not based on the absolute probability of an event occurring but instead the excess probability relating only to the exposure studied.
Excess absolute risk (EAR) As opposed to ERRs, excess absolute risk describes the risk relating to a certain exposure in absolute terms, not as compared to a non-exposed group of controls.
Odds ratio (OR) Odds ratios are calculated as the ratio between different groups of the odds of an event occurring in each group. It is principally similar to RR but with the numerical difference of being based on odds e.g. 1:10 or 10:1, rather than probabilities.
7
1
INTRODUCTION
1 INTRODUCTION
1.1 Background The annual childhood cancer incidence in Sweden, Europe and the United States over the last few decades has been reported to be about 14-16 cases per 100,000 children (ages 0-15 years).1-3 In Europe there has been a relative increase in the number of childhood cancer cases of approximately 1% per year between 1970 and 1990.3 The overall 5-year survival of childhood cancer in Europe has increased from 65% in 1983 to 75% in 1994 and as of 2005 the 10-year overall survival in Sweden was 78%.1 The main reason for the improved outcome is the development of advanced chemo- and radiotherapy over the past decades. The second most common types of childhood cancers (after leukemias and lymphomas) are tumors of the central nervous system (CNS) which account for 20-30% of all childhood cancers.3, 4 The most common type of CNS tumor in children is medulloblastoma (MB) which is a primitive neuroectodermal tumor located in the posterior cranial fossa. MBs are characterized by a relatively high rate of spinal metastases at the time of diagnosis.5, 6 The overall 5-year survival for standard-risk MB (patients with primary tumor in the posterior fossa but without confirmed spinal metastases) is 75-85% for children treated with modern day multimodality regimens.7, 8 The treatment consists of surgery followed by post-operative multi-agent chemo-therapy and craniospinal radiotherapy. Even though survival rates are relatively high there are substantial long-term side effects related to the treatment of MB such as hearing loss, neurocognitive deficits, cardiac dysfunction and endocrine effects.9-12 In recent years the increased survival rates in childhood cancer patients have also led to an increased awareness concerning treatment-induced secondary malignancies.13
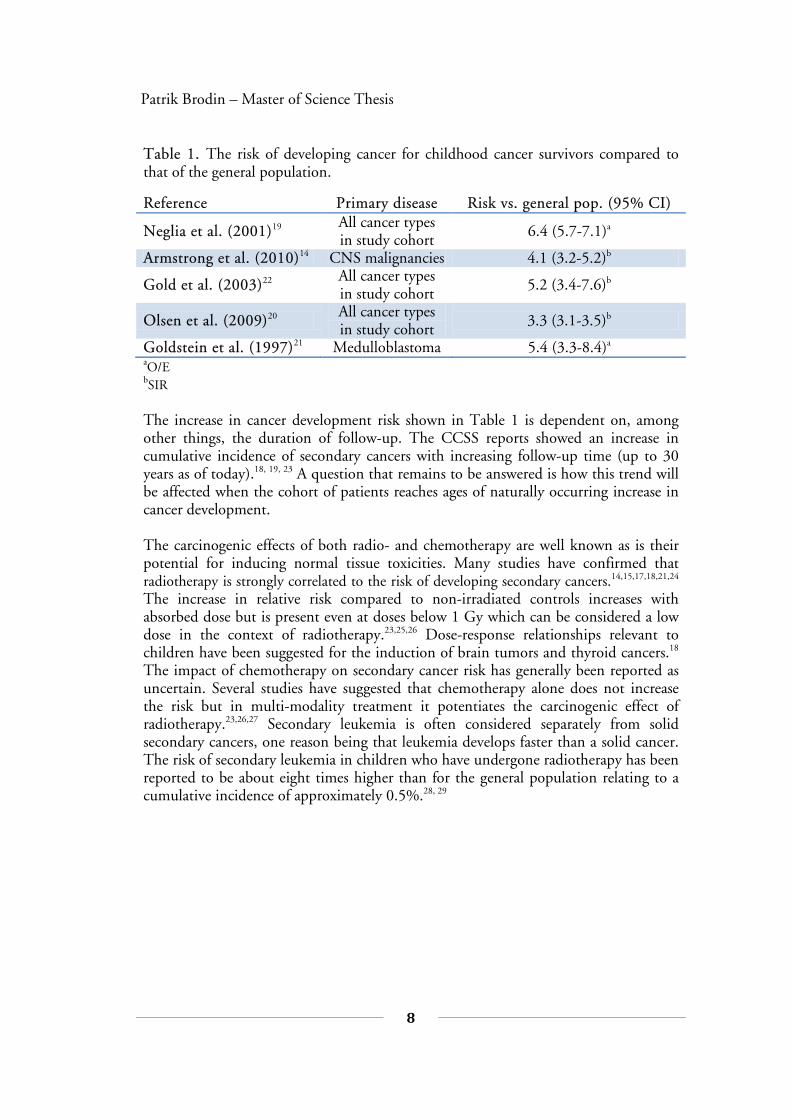
1.2 Secondary cancers in children A treatment-related secondary malignancy is one of the more severe long-term side effects befalling childhood cancer survivors. A large ongoing prospective investigation that has provided a substantial part of the secondary cancer data after treatment in childhood is the Childhood Cancer Survivor Study (CCSS).14-19 The CCSS has followed approximately 14,000 children, treated in the United States, for nearly 30 years as of today. A similar, however retrospective, investigation on children treated in the Nordic countries was conducted and presented by Olsen et al.20 Another study focused specifically on second cancers after treatment of pediatric MB including more than 1,200 patients treated in Sweden and the United States.21 Table 1 shows the increase in risk of developing a malignancy for patients having received cancer treatment in childhood compared to that of the general population.
8
Patrik Brodin – Master of Science Thesis
Table 1. The risk of developing cancer for childhood cancer survivors compared to that of the general population.
Reference Primary disease Risk vs. general pop. (95% CI)
Neglia et al. (2001)19 All cancer types in study cohort 6.4 (5.7-7.1)a
Armstrong et al. (2010)14 CNS malignancies 4.1 (3.2-5.2)b
Gold et al. (2003)22 All cancer types in study cohort 5.2 (3.4-7.6)b
Olsen et al. (2009)20 All cancer types in study cohort 3.3 (3.1-3.5)b
Goldstein et al. (1997)21 Medulloblastoma 5.4 (3.3-8.4)a
aO/E bSIR The increase in cancer development risk shown in Table 1 is dependent on, among other things, the duration of follow-up. The CCSS reports showed an increase in cumulative incidence of secondary cancers with increasing follow-up time (up to 30 years as of today).18, 19, 23 A question that remains to be answered is how this trend will be affected when the cohort of patients reaches ages of naturally occurring increase in cancer development. The carcinogenic effects of both radio- and chemotherapy are well known as is their potential for inducing normal tissue toxicities. Many studies have confirmed that radiotherapy is strongly correlated to the risk of developing secondary cancers.14,15,17,18,21,24 The increase in relative risk compared to non-irradiated controls increases with absorbed dose but is present even at doses below 1 Gy which can be considered a low dose in the context of radiotherapy.23,25,26 Dose-response relationships relevant to children have been suggested for the induction of brain tumors and thyroid cancers.18 The impact of chemotherapy on secondary cancer risk has generally been reported as uncertain. Several studies have suggested that chemotherapy alone does not increase the risk but in multi-modality treatment it potentiates the carcinogenic effect of radiotherapy.23,26,27 Secondary leukemia is often considered separately from solid secondary cancers, one reason being that leukemia develops faster than a solid cancer. The risk of secondary leukemia in children who have undergone radiotherapy has been reported to be about eight times higher than for the general population relating to a cumulative incidence of approximately 0.5%.28, 29
9
1
INTRODUCTION
1.3 Radiotherapy techniques There has been a substantial development in the field of radiotherapy. During the last decade, intensity modulated radiotherapy (IMRT) and the implementation of this technique as rotational therapy has become readily available in many clinics. In addition, proton therapy is available at a few European centers and this number is steadily increasing.30 Common for all modern radiotherapy techniques is the use of computed tomography (CT) to provide a basis for computer based treatment plan-ning. This is sometimes accompanied by information from magnetic resonance ima-ging (MRI) or positron emission tomography (PET) to enhance the quality of the segmentation of target volumes and organs at risk (OARs).
1.3.1 Three-dimensional conformal radiotherapy (3D CRT) 3D CRT, often referred to as “conventional radiotherapy” is presently the most commonly used radiotherapy technique and it has been widely used over the last few decades. The principle consists of megavoltage radiation beams delivered by a linear accelerator from normally 2-5 different gantry angles with radiation fields shaped by a Multi-Leaf-Collimator (MLC) to include the target volume and to reduce unnecessary irradiation of normal tissues.
1.3.2 Intensity modulated radiotherapy (IMRT) As first proposed by Brahme et al. in 198231, IMRT employs the principle of inversely optimizing the dose distribution of incident beams to achieve a predetermined dose distribution within the patient volume. There are mainly two different types of IMRT delivery that are clinically applied; step-and-shoot and the sliding window technique.32 Employing IMRT enables conformal target coverage along with the possibility of complex dose distributions to spare OARs. Characteristic of IMRT treatment is a spread out of the radiation dose in normal tissues so that a large volume receives a low absorbed dose. This is often referred to as a “dose bath” and is of concern since irradiating a larger portion of the body could be associated with increased long-term risks. In order to assess the impact on secondary cancer risk, several authors have performed theoretical modeling studies where the estimated risk of secondary cancers was shown to be higher for IMRT than for 3D CRT.33-36 The IMRT treatment planning process involves defining absorbed dose objectives for the target volume(s) and the relevant OARs. Different penalizing weights can be given to the objectives in order to prioritize target coverage and sparing of specific OARs. The end result is the radiotherapy plan that yields the lowest overall penalty, i.e. the plan best suited for the current objectives with accompanying weights, assuming that the optimization algorithm finds the perfect solution.
10
Patrik Brodin – Master of Science Thesis
1.3.3 Rotational IMRT The currently available rotational IMRT implementations are for instance those of helical TomoTherapy® (TomoTherapy Inc., Madison, USA), RapidArc® (Varian Medical Systems Inc., Palo Alto, USA) and VMAT® (Elekta AB, Stockholm, Sweden). The RapidArc implementation is originally based on the optimization algorithm proposed by Otto in 200837 and radiation is delivered by a linear accelerator while it rotates around the patient. As for fixed angle IMRT the treatment optimization is based on dose-volume objectives and their respective weighting factors but the degrees of freedom in the optimization also includes accelerator rotation speed and adjustable dose rate.
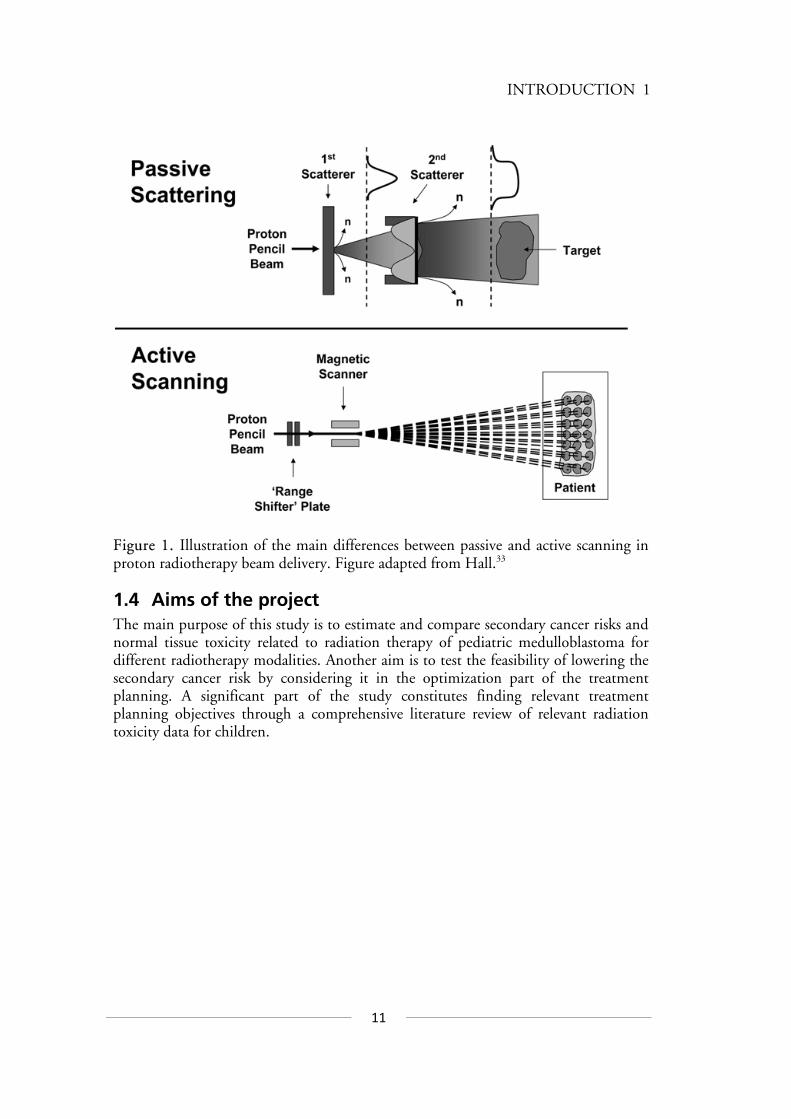
1.3.4 Proton therapy The suggestion of using protons in radiotherapy dates back over 60 years.38 Protons are an appealing option compared to photon therapy because of the physical characteristics of the energy deposition. They deposit most of their energy mainly at a relatively narrow depth interval corresponding to the so called Bragg Peak. The depth of the Bragg peak can be controlled by altering the energy of the incident proton beam. Thus the physical characteristics of protons appear ideal for irradiating a target volume while simultaneously sparing surrounding OARs. Some of the first proton treatments were performed in Uppsala, Sweden, in the mid 1950s.39 The available types of proton therapy to date can be stratified as adhering to either the passive scattering technique or the active scanning technique. The different techniques are illustrated in Figure 1 for comparison. Due to the introduction of scattering material in the beam the passive scattering yields a higher contribution of secondary (unwanted) neutrons than the active scanning technique. It has been reported that passive scattering results in out-of-field absorbed doses that are approximately 10 times higher than for active scanning.40 Secondary neutrons contribute to the risk of treatment-induced secondary cancers but quantifying this risk is difficult due to uncertainties in the relative biological effect (RBE) of neutrons and in the dose-risk relationship of secondary induction.40-42
11
1
INTRODUCTION
Figure 1. Illustration of the main differences between passive and active scanning in proton radiotherapy beam delivery. Figure adapted from Hall.33
1.4 Aims of the project The main purpose of this study is to estimate and compare secondary cancer risks and normal tissue toxicity related to radiation therapy of pediatric medulloblastoma for different radiotherapy modalities. Another aim is to test the feasibility of lowering the secondary cancer risk by considering it in the optimization part of the treatment planning. A significant part of the study constitutes finding relevant treatment planning objectives through a comprehensive literature review of relevant radiation toxicity data for children.
12
Patrik Brodin – Master of Science Thesis
2 THEORY Radiobiological modeling has, in this study, been focused on models regarding radiation-induced secondary cancers. A description of different models estimating normal tissue complications such as pneumonitis or xerostomia and their applicability are given in appendix A.
2.1 Modeling secondary cancer risk Secondary cancer induced by the treatment of the primary cancer has become of great concern in recent years most likely due to the increase in patient survival. As a result there have been several models proposed for estimating the risk of radiation-induced cancer from radiotherapy. They can be stratified into two main categories:
• Phenemenological models – Based on empirical observations. • Mechanistic models – Derived from a theoretical concept.
2.1.1 The LNT-model Based on the data collected from following the atomic bomb survivors, the linear no-threshold (LNT) model suggests that the radiation-induced cancer risk increases linearly with dose. This is based on exposures from 20-50 mSv up to several Sv and extrapolated down to zero dose. For exposures up to about 2.5 Sv this model is often referred to as the gold standard.33 Organ-specific weighting factors provided by the National Council on Radiation Protection and Measurements (NCRP) are used to estimate the cancer induction risk from exposure to different sites in the body yielding a total risk of 5%/Sv equivalent dose received.43 This risk is assumed to be valid for the general population and an increase in risk to 15%/Sv has been proposed when regarding children. For absorbed doses lower than 2 Gy this model is applicable for secondary cancer risk estimation but the organ doses are often substantially higher when considering radiotherapy. In a study by Kry et al. the secondary cancer risk from different radio-therapy modalities was estimated using a LNT-model including equivalent doses up to 5 Sv.34
2.1.2 The OED-model The concept of organ-equivalent dose (OED) was first introduced by Schneider et al. in 2005 as an attempt to provide a model of secondary cancer induction relevant to patients undergoing radiotherapy.44 The principle of OED is that at low doses (below 2 Gy) the secondary cancer risk follows a linear relationship as in the LNT-model and the OED is the average organ dose. At higher absorbed doses, as those relevant to radiotherapy, Schneider et al. proposed that the OED follows a linear-exponential, so called “bell shaped” relationship with the absorbed dose. The idea of a bell shaped risk of cancer induction was first provided by Gray in 1957 proposing that cell killing effects overcome cell mutation at higher absorbed doses.45
13
2
THEORY
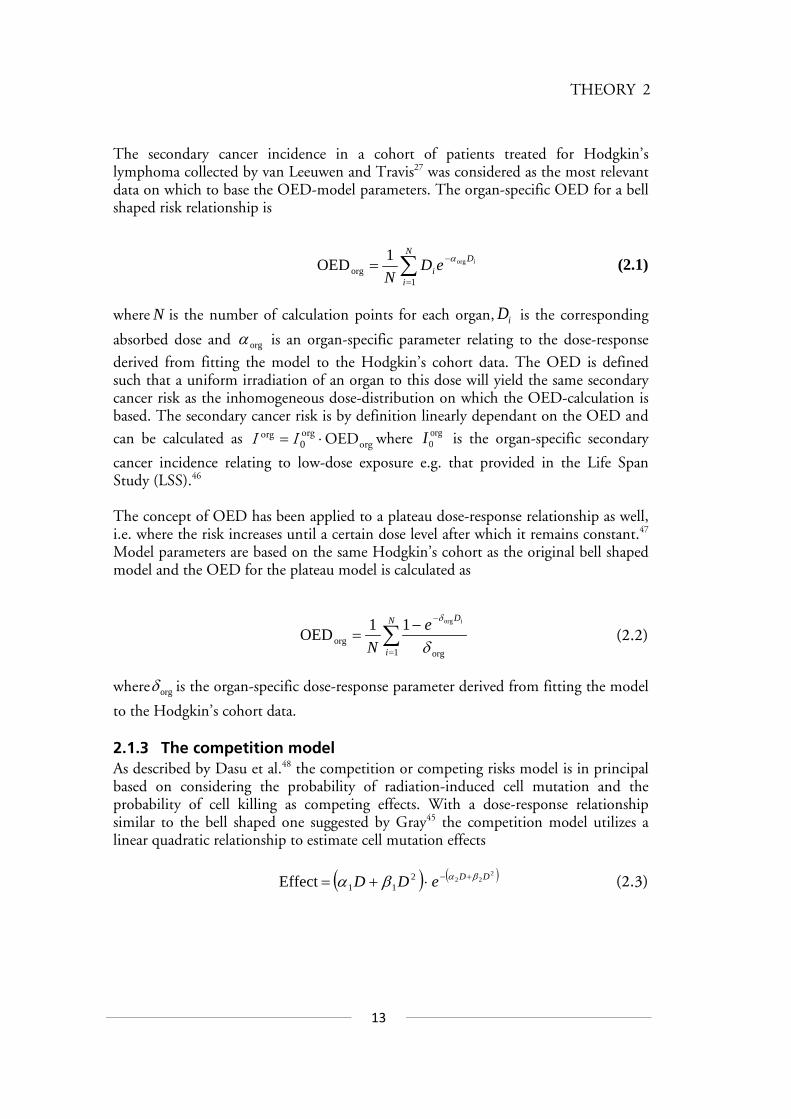
The secondary cancer incidence in a cohort of patients treated for Hodgkin’s lymphoma collected by van Leeuwen and Travis27 was considered as the most relevant data on which to base the OED-model parameters. The organ-specific OED for a bell shaped risk relationship is
∑=
−=N
i
Di
ieDN 1
orgorg1OED α (2.1)
where N is the number of calculation points for each organ, iD is the corresponding
absorbed dose and orgα is an organ-specific parameter relating to the dose-response
derived from fitting the model to the Hodgkin’s cohort data. The OED is defined such that a uniform irradiation of an organ to this dose will yield the same secondary cancer risk as the inhomogeneous dose-distribution on which the OED-calculation is based. The secondary cancer risk is by definition linearly dependant on the OED and
can be calculated as orgorgorg OED⋅= 0II where org
0I is the organ-specific secondary
cancer incidence relating to low-dose exposure e.g. that provided in the Life Span Study (LSS).46 The concept of OED has been applied to a plateau dose-response relationship as well, i.e. where the risk increases until a certain dose level after which it remains constant.47 Model parameters are based on the same Hodgkin’s cohort as the original bell shaped model and the OED for the plateau model is calculated as
∑=
−−=
N
i
DieN 1 org
org
org11OEDδ
δ
(2.2)
where orgδ is the organ-specific dose-response parameter derived from fitting the model
to the Hodgkin’s cohort data.
2.1.3 The competition model As described by Dasu et al.48 the competition or competing risks model is in principal based on considering the probability of radiation-induced cell mutation and the probability of cell killing as competing effects. With a dose-response relationship similar to the bell shaped one suggested by Gray45 the competition model utilizes a linear quadratic relationship to estimate cell mutation effects
( ) ( )2222
11Effect DDeDD βαβα +−⋅+= (2.3)
14
Patrik Brodin – Master of Science Thesis
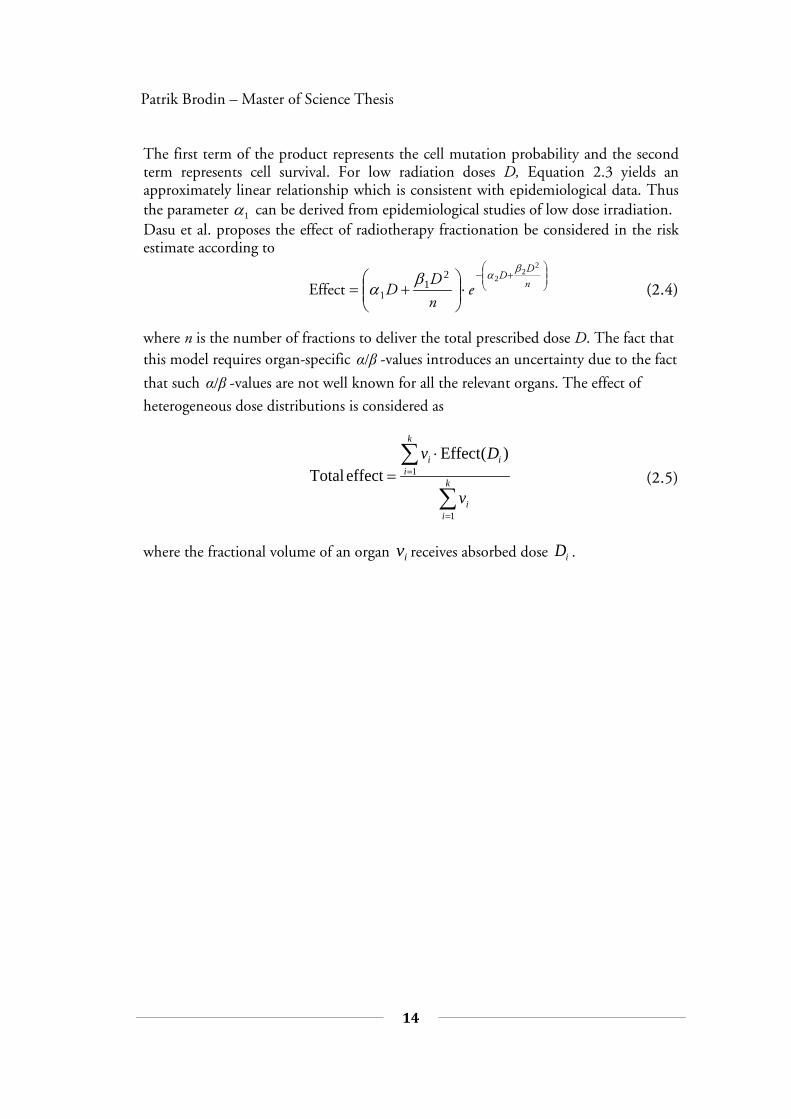
The first term of the product represents the cell mutation probability and the second term represents cell survival. For low radiation doses D, Equation 2.3 yields an approximately linear relationship which is consistent with epidemiological data. Thus the parameter 1α can be derived from epidemiological studies of low dose irradiation. Dasu et al. proposes the effect of radiotherapy fractionation be considered in the risk estimate according to
+−
⋅
+= n
DD
en
DD
22
221
βαβα1Effect (2.4)
where n is the number of fractions to deliver the total prescribed dose D. The fact that this model requires organ-specific βα/ -values introduces an uncertainty due to the fact
that such βα/ -values are not well known for all the relevant organs. The effect of
heterogeneous dose distributions is considered as
∑
∑
=
=
⋅= k
ii
k
iii
v
Dv
1
1)(Effect
effectTotal (2.5)
where the fractional volume of an organ iv receives absorbed dose iD .

15
2
THEORY
2.1.4 Comparing the different models In order to visualize the difference between the models for secondary cancer induction mentioned above, an example of the risk estimation adhering to each of the different models is shown in Figure 2 for the case of lung irradiation.
Figure 2. Illustration of secondary cancer risk estimation due to lung irradiation providing a visual comparison between the different models described in section 2.1. The following model parameters were used for the illustration in Figure 2: OED plateau model - 15.0lung =δ
OED bell shape - 129.0=lungα
Competition model - Gy1 5.4/,25.0,017.0 2 === βααα LNT model - Risk of inducing fatal secondary cancer = 0.85%/Sv
0 5 10 15 20 251%
2%
3%
4%
5%
6%
7%
8%
9%
10%
Homogeneous irradiation dose [Gy]
Sec
onda
ry c
ance
r ris
k
OED - Plateau modelOED - Bell shape modelCompetition modelLNT-model
16
Patrik Brodin – Master of Science Thesis
2.1.5 Leukemia risk models The risk of treatment-induced secondary leukemia can be considered as adhering to an individual category separating it from that of solid secondary cancers. This is due to the substantial difference in radiosensitivity of bone marrow compared to other organs. In the case of e.g. the OED-model mentioned in section 2.1.2 this concept is based solely on the induction of solid secondary cancers. It has been shown in both human and animal studies that the risk of radiation-induced leukemia increases with absorbed dose to a maximum and then decreases with higher dose, relating to a bell shaped risk dependence.49, 50 As opposed to modeling of solid secondary cancer induc-tion, studies have been performed to specifically investigate possible dose-response relationships of secondary leukemia for children undergoing radiotherapy. In the study by Haddy et al. an SIR for leukemia of 7.8 was shown and the radiation dose to the active bone marrow that appeared most potent for leukemia induction was in the interval 3 to 6.6 Gy.28 A recent study by Allard et al. thoroughly investigated the dose-response relationship of radiation-induced leukemia in children who underwent cancer treatment in France between 1980 and 1999.51 The authors were unable to find a significant relation between radiation dose and risk of secondary leukemia. The reason for this is likely due to the relatively frequent administration of epipodophyllotoxin-type chemo-therapy to these patients confounding the results as epipodophyllotoxins have been shown to be highly leukaemogenic.28, 52 The best attempt of modeling secondary leukemia risk suggested by Allard et al. was a linear-exponential model which is in principle agreement with the bell shaped risk dependence evidenced in empirical data.
17
3
MATERIALS AND METHODS
3 MATERIALS AND METHODS
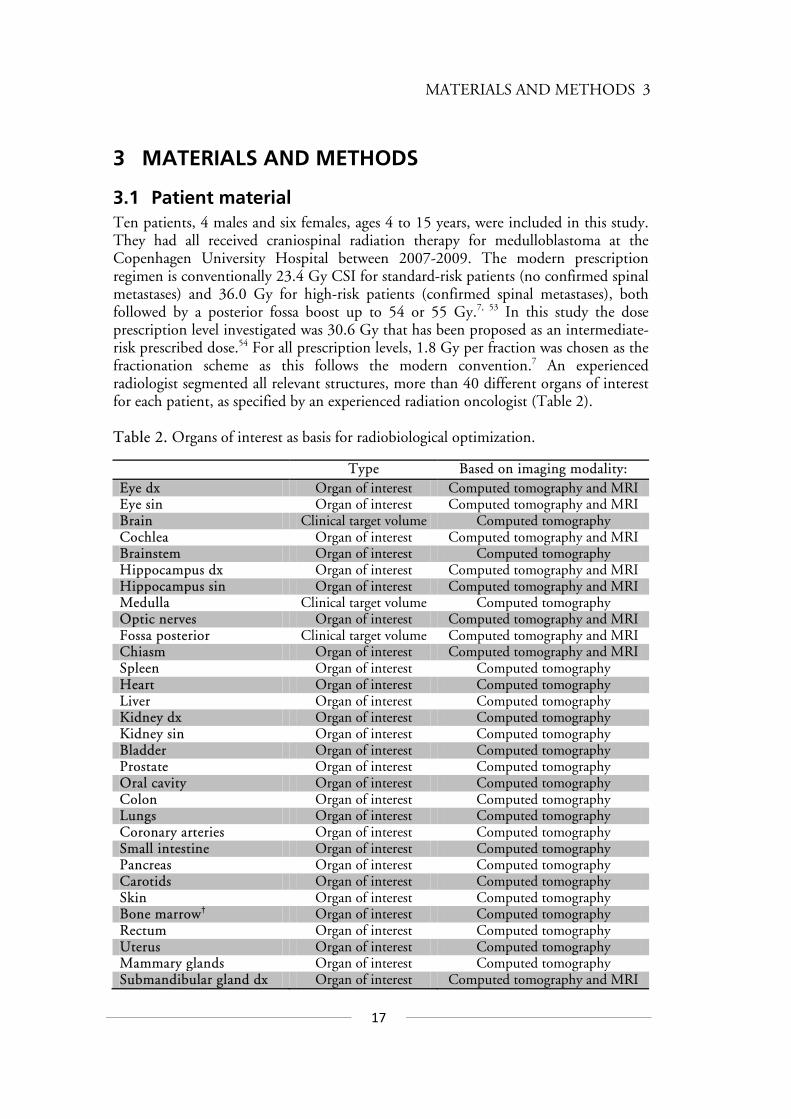
3.1 Patient material Ten patients, 4 males and six females, ages 4 to 15 years, were included in this study. They had all received craniospinal radiation therapy for medulloblastoma at the Copenhagen University Hospital between 2007-2009. The modern prescription regimen is conventionally 23.4 Gy CSI for standard-risk patients (no confirmed spinal metastases) and 36.0 Gy for high-risk patients (confirmed spinal metastases), both followed by a posterior fossa boost up to 54 or 55 Gy.7, 53 In this study the dose prescription level investigated was 30.6 Gy that has been proposed as an intermediate-risk prescribed dose.54 For all prescription levels, 1.8 Gy per fraction was chosen as the fractionation scheme as this follows the modern convention.7 An experienced radiologist segmented all relevant structures, more than 40 different organs of interest for each patient, as specified by an experienced radiation oncologist (Table 2). Table 2. Organs of interest as basis for radiobiological optimization.
Type Based on imaging modality: Eye dx Organ of interest Computed tomography and MRI Eye sin Organ of interest Computed tomography and MRI Brain Clinical target volume Computed tomography Cochlea Organ of interest Computed tomography and MRI Brainstem Organ of interest Computed tomography Hippocampus dx Organ of interest Computed tomography and MRI Hippocampus sin Organ of interest Computed tomography and MRI Medulla Clinical target volume Computed tomography Optic nerves Organ of interest Computed tomography and MRI Fossa posterior Clinical target volume Computed tomography and MRI Chiasm Organ of interest Computed tomography and MRI Spleen Organ of interest Computed tomography Heart Organ of interest Computed tomography Liver Organ of interest Computed tomography Kidney dx Organ of interest Computed tomography Kidney sin Organ of interest Computed tomography Bladder Organ of interest Computed tomography Prostate Organ of interest Computed tomography Oral cavity Organ of interest Computed tomography Colon Organ of interest Computed tomography Lungs Organ of interest Computed tomography Coronary arteries Organ of interest Computed tomography Small intestine Organ of interest Computed tomography Pancreas Organ of interest Computed tomography Carotids Organ of interest Computed tomography Skin Organ of interest Computed tomography Bone marrow† Organ of interest Computed tomography Rectum Organ of interest Computed tomography Uterus Organ of interest Computed tomography Mammary glands Organ of interest Computed tomography Submandibular gland dx Organ of interest Computed tomography and MRI
18
Patrik Brodin – Master of Science Thesis
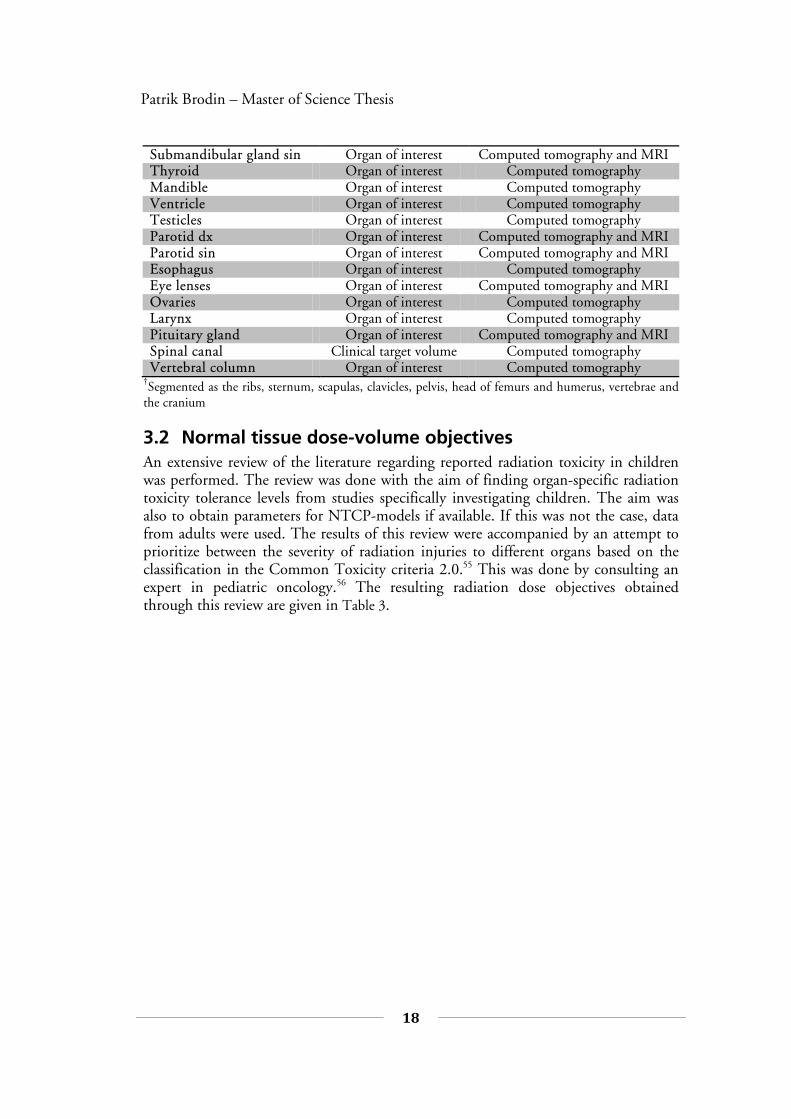
Submandibular gland sin Organ of interest Computed tomography and MRI Thyroid Organ of interest Computed tomography Mandible Organ of interest Computed tomography Ventricle Organ of interest Computed tomography Testicles Organ of interest Computed tomography Parotid dx Organ of interest Computed tomography and MRI Parotid sin Organ of interest Computed tomography and MRI Esophagus Organ of interest Computed tomography Eye lenses Organ of interest Computed tomography and MRI Ovaries Organ of interest Computed tomography Larynx Organ of interest Computed tomography Pituitary gland Organ of interest Computed tomography and MRI Spinal canal Clinical target volume Computed tomography Vertebral column Organ of interest Computed tomography
†Segmented as the ribs, sternum, scapulas, clavicles, pelvis, head of femurs and humerus, vertebrae and the cranium
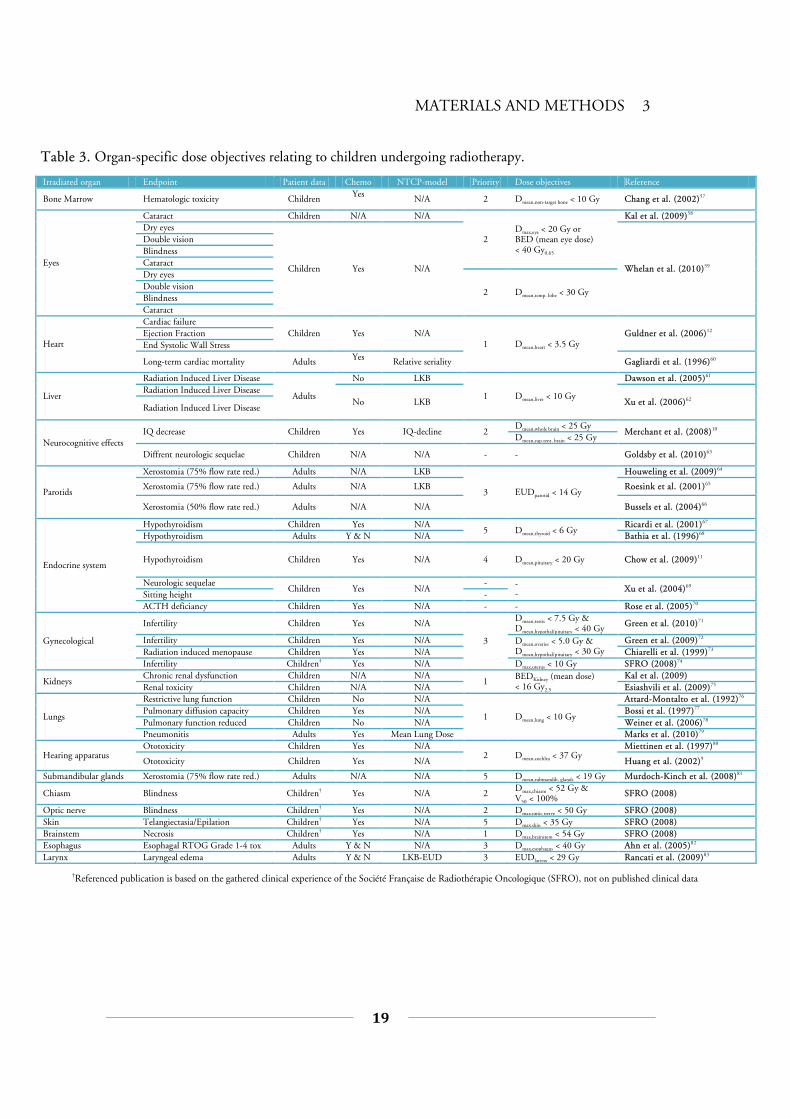
3.2 Normal tissue dose-volume objectives An extensive review of the literature regarding reported radiation toxicity in children was performed. The review was done with the aim of finding organ-specific radiation toxicity tolerance levels from studies specifically investigating children. The aim was also to obtain parameters for NTCP-models if available. If this was not the case, data from adults were used. The results of this review were accompanied by an attempt to prioritize between the severity of radiation injuries to different organs based on the classification in the Common Toxicity criteria 2.0.55 This was done by consulting an expert in pediatric oncology.56 The resulting radiation dose objectives obtained through this review are given in Table 3.
19
MATERIALS AND METHODS 3
Irradiated organ Endpoint Patient data Chemo NTCP-model Priority Dose objectives Reference
Bone Marrow Hematologic toxicity Children Yes N/A 2 Dmean,non-target bone < 10 Gy Chang et al. (2002)57
Eyes
Cataract Children N/A N/A
2 Dmax,eye < 20 Gy or BED (mean eye dose) < 40 Gy0.65
Kal et al. (2009)58 Dry eyes
Children
Yes N/A Whelan et al. (2010)59
Double vision Blindness Cataract Dry eyes
2 Dmean,temp. lobe < 30 Gy Double vision Blindness Cataract
Heart
Cardiac failure Children Yes N/A
1 Dmean,heart < 3.5 Gy Guldner et al. (2006)12 Ejection Fraction
End Systolic Wall Stress
Long-term cardiac mortality Adults Yes Relative seriality Gagliardi et al. (1996)60
Liver
Radiation Induced Liver Disease
Adults
No LKB
1 Dmean,liver < 10 Gy
Dawson et al. (2005)61 Radiation Induced Liver Disease
No LKB Xu et al. (2006)62 Radiation Induced Liver Disease
Neurocognitive effects IQ decrease Children Yes IQ-decline 2
Dmean,whole brain < 25 Gy Merchant et al. (2008)10
Dmean,sup.tent. brain < 25 Gy
Diffrent neurologic sequelae Children N/A N/A - - Goldsby et al. (2010)63
Parotids
Xerostomia (75% flow rate red.) Adults N/A LKB
3 EUDparotid < 14 Gy
Houweling et al. (2009)64
Xerostomia (75% flow rate red.) Adults N/A LKB Roesink et al. (2001)65
Xerostomia (50% flow rate red.) Adults N/A N/A Bussels et al. (2004)66
Endocrine system
Hypothyroidism Children Yes N/A 5 Dmean,thyroid < 6 Gy
Ricardi et al. (2001)67 Hypothyroidism Adults Y & N N/A Bathia et al. (1996)68
Hypothyroidism Children Yes N/A 4 Dmean,pituitary < 20 Gy Chow et al. (2009)11
Neurologic sequelae Children Yes N/A
- - - Xu et al. (2004)69
Sitting height - ACTH deficiancy Children Yes N/A - - Rose et al. (2005)70
Gynecological
Infertility Children Yes N/A
3
Dmean,testis < 7.5 Gy & Dmean,hypothal/pituitary < 40 Gy Green et al. (2010)71
Infertility Children Yes N/A Dmean,ovaries < 5.0 Gy & Dmean,hypothal/pituitary < 30 Gy
Green et al. (2009)72 Radiation induced menopause Children Yes N/A Chiarelli et al. (1999)73 Infertility Children† Yes N/A Dmax,uterus < 10 Gy SFRO (2008)74
Kidneys Chronic renal dysfunction Children N/A N/A
1 BEDKidney (mean dose) < 16 Gy2.5
Kal et al. (2009) Renal toxicity Children N/A N/A Esiashvili et al. (2009)75
Lungs
Restrictive lung function Children No N/A
1 Dmean,lung < 10 Gy
Attard-Montalto et al. (1992)76 Pulmonary diffusion capacity Children Yes N/A Bossi et al. (1997)77 Pulmonary function reduced Children No N/A Weiner et al. (2006)78 Pneumonitis Adults Yes Mean Lung Dose Marks et al. (2010)79
Hearing apparatus Ototoxicity Children Yes N/A
2 Dmean,cochlea < 37 Gy Miettinen et al. (1997)80
Ototoxicity Children Yes N/A Huang et al. (2002)9
Submandibular glands Xerostomia (75% flow rate red.) Adults N/A N/A 5 Dmean,submandib. glands < 19 Gy Murdoch-Kinch et al. (2008)81
Chiasm Blindness Children† Yes N/A 2 Dmax,chiasm < 52 Gy & V50 < 100% SFRO (2008)
Optic nerve Blindness Children† Yes N/A 2 Dmax,optic nerve < 50 Gy SFRO (2008) Skin Telangiectasia/Epilation Children† Yes N/A 5 Dmax,skin < 35 Gy SFRO (2008) Brainstem Necrosis Children† Yes N/A 1 Dmax,brainstem < 54 Gy SFRO (2008) Esophagus Esophagal RTOG Grade 1-4 tox Adults Y & N N/A 3 Dmax,esophagus < 40 Gy Ahn et al. (2005)82 Larynx Laryngeal edema Adults Y & N LKB-EUD 3 EUDlarynx < 29 Gy Rancati et al. (2009)83
Table 3. Organ-specific dose objectives relating to children undergoing radiotherapy.
†Referenced publication is based on the gathered clinical experience of the Société Française de Radiothérapie Oncologique (SFRO), not on published clinical data
20
Patrik Brodin – Master of Science Thesis
3.3 Treatment planning process Radiotherapy plans were generated with three different techniques, 3D CRT, rotational IMRT according to the RapidArc implementation and also with actively scanned intensity-modulated proton therapy (IMPT). All treatment plans were generated using the Eclipse 8.6 dose planning software and were based on computed tomography (CT) scans of the patients. The 3D CRT and RapidArc plans were generated for a Varian 2300 IX accelerator with the Millenium 120 MLC (5mm width of inner leaves, 1cm width of outer leaves). The IMPT plans with beam data for the PT2 Varian proton therapy system. Plans were created with the aim of achieving good conformity with proper target coverage while attempting to spare OARs according to the objectives in Table 3. The convention in craniospinal radiotherapy of children is sometimes to treat the entire vertebral column to 20 Gy as a means of preventing uneven growth leading to future scoliosis.84 The effect of including this as an aim in the planning process was in-vestigated for all three techniques. The craniospinal planning target volume (PTV) was defined as the whole brain with 0.5 cm isotropic margin and the spinal canal including 0.7 cm isotropic margin. The caudal border was set between the sacral vertebras S2 and S3. The boost PTV was chosen as the posterior fossa with a 0.5 cm isotropic margin.
3.3.1 3D CRT These plans were created with two opposed cranial fields incident from the right and left side of the patient, the caudal edge of these fields was positioned just above the cranial edge of the patient’s shoulders. The eyes were shielded by fitting MLC-leaves to cover them but only to the extent that it did not compromise target coverage. This was accompanied by a spinal posterio-anterior field encompassing the spinal part of the PTV. The junction between the cranial and spinal fields was chosen to be moved 1.0 cm caudally after 9 fractions to avoid particularly over or under dosage due to possible treatment set-up variations. In order to assess the importance of what spinal field width to apply, multiple plans were generated with the MLC-leaves fitted to the PTV with a 0.5, 0.75, 1.0 and 1.5 cm margin respectively. The situation best resembling the plans with which the patients were actually treated was the 1.0 cm leaf-to-PTV margin. The plans for the posterior fossa boost were created using four fields, two opposing fields from the right and left sides along with two fields from a slightly more posterior direction, wedged to compensate for the anatomical difference between the neck and the back of the head.
21
3
MATERIALS AND METHODS
3.3.2 RapidArc In order to get a proper coverage of the entire craniospinal PTV the RapidArc plans were generated with a cranial arc covering the whole brain and the cranial part of the spinal canal down to the C2 or C3 vertebra. The rest of the spinal canal was covered by a spinal arc delivering radiation from a posterior 140 degree arc only, this to avoid unnecessary irradiation through the arms and ventral parts of the patient. In the case where the cranio-caudal extent of the spinal canal exceeded the span of a single arc, two spinal arcs were used. The boost plans consisted of a 220 degree arc covering the posterior fossa PTV without entering through the anterior part of the patient’s head. The optimization process in the RapidArc planning was tailored via a trial and error approach to find a suitable balance of dose objectives and corresponding weighting factors to provide OAR sparing based on the objectives in Table 3. Using the predetermined inter-organ priority mentioned in section 3.2 enabled weighting factors to be set harsher for highly prioritized organs like the heart and lungs while allowing slightly looser objectives e.g. for the thyroid and esophagus. The target volume was consequently given the highest priority as the possibility of curing the patient is considered the most vital objective. The best RapidArc plans for the purpose of this study were thus the ones where most of the OARs, especially those of high priority, could be spared to a good extent while not compromising target coverage.
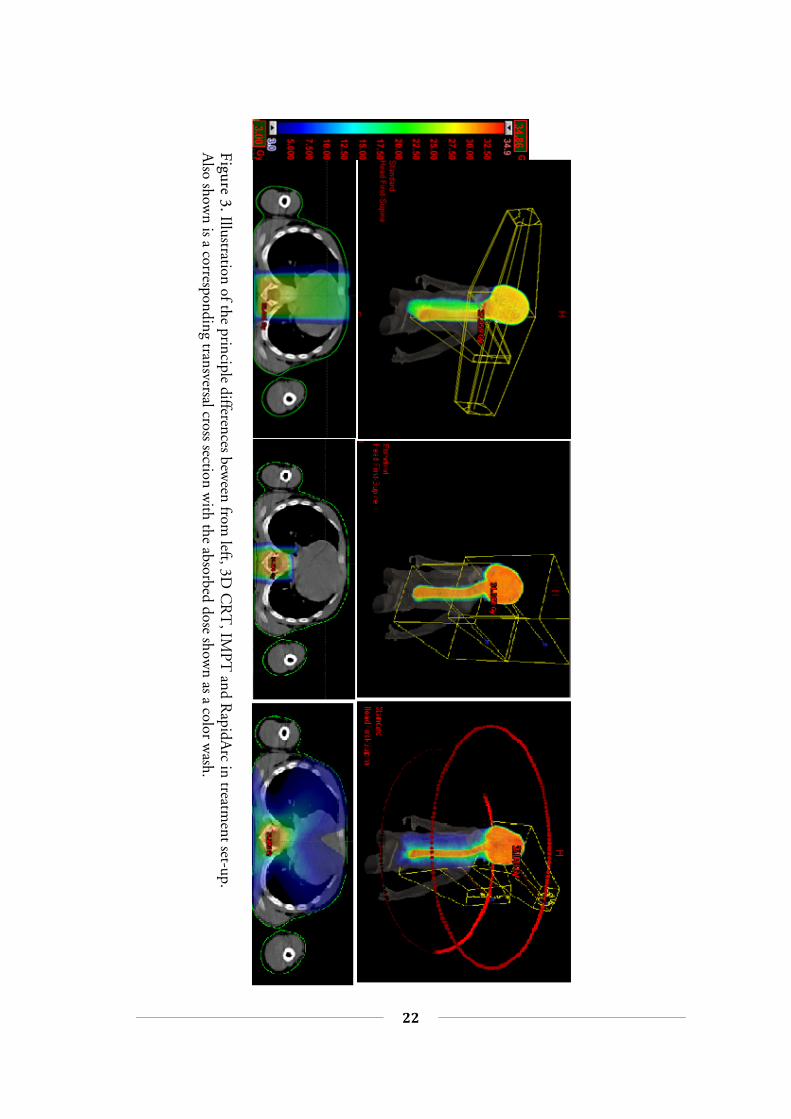
3.3.3 IMPT The proton plans were as mentioned earlier generated with machine data corre-sponding to a PT2 Varian proton therapy system utilizing the spot-scanning tech-nique. The plan optimizations were thus based on varying the weight of the three dimensional distribution of spots to which the dose was calculated. The delivery of such plans is carried out by the scanning magnets steering the proton beam to irradiate each spot to the calculated dose. In order to reach both shallow and deeply placed structures in the body a range shifter can be introduced when necessary, the result of which is similar to lowering the span of the achievable nominal energy and thus decreasing the depth to which the protons reach. The plans were generated with three fields from the posterior direction. They consisted of one field with a range shifter covering most of the spinal canal and two fields, of which one had a range shifter, covering the brain and the cranial part of the spinal canal. Since the optimization process itself is similar to that of IMRT, suitable dose constraints and corresponding weights were found in a similar fashion as for the RapidArc planning. The main difference being the fact that most of the OARs didn’t receive any absorbed dose as the distal edge of the proton fields is very sharp. The boost plans consisted of a single posterior field with a range shifter to ensure full coverage of the posterior fossa. Figure 3 illustrates the different treatment field arran-gements for 3D CRT, IMPT and RapidArc.
22
Patrik Brodin – Master of Science Thesis
Figure 3. Illustration of the principle differences bew
een from left, 3D
CR
T, IM
PT and R
apidArc in treatm
ent set-up. A
lso shown is a corresponding transversal cross section w
ith the absorbed dose shown as a color w
ash.
23
3
MATERIALS AND METHODS
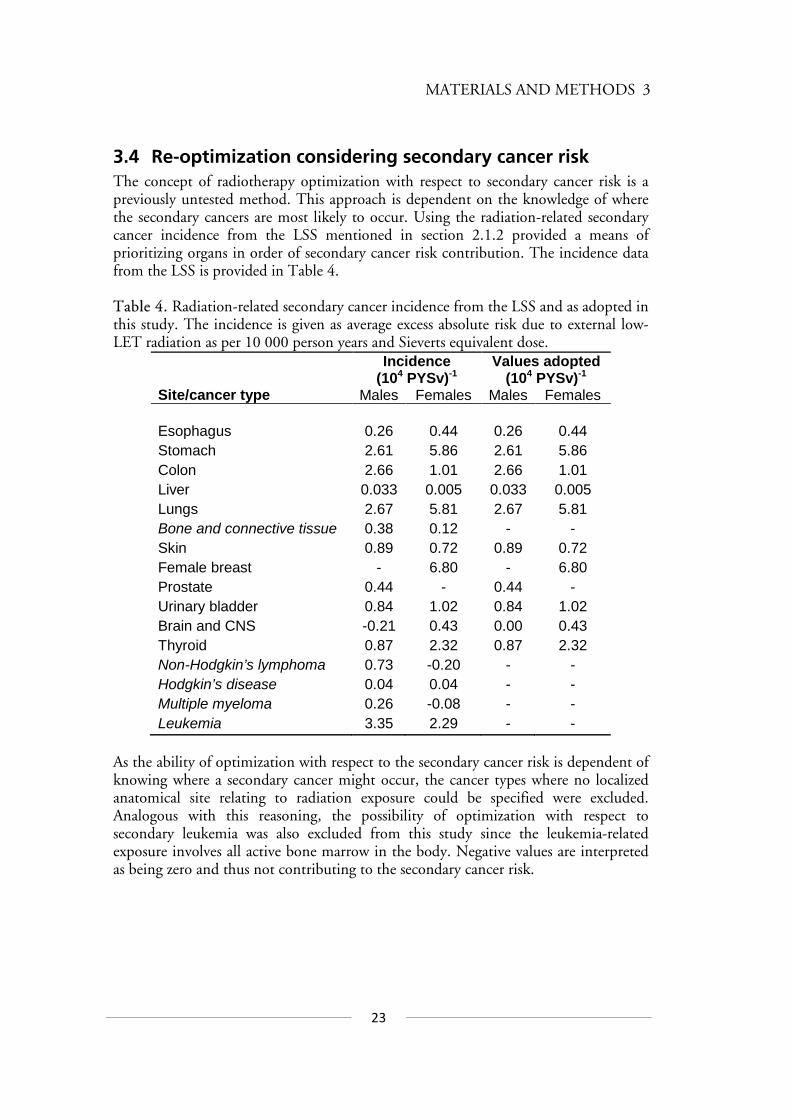
3.4 Re-optimization considering secondary cancer risk The concept of radiotherapy optimization with respect to secondary cancer risk is a previously untested method. This approach is dependent on the knowledge of where the secondary cancers are most likely to occur. Using the radiation-related secondary cancer incidence from the LSS mentioned in section 2.1.2 provided a means of prioritizing organs in order of secondary cancer risk contribution. The incidence data from the LSS is provided in Table 4. Table 4. Radiation-related secondary cancer incidence from the LSS and as adopted in this study. The incidence is given as average excess absolute risk due to external low-LET radiation as per 10 000 person years and Sieverts equivalent dose.
Incidence (104 PYSv)-1
Values adopted (104 PYSv)-1
Site/cancer type Males Females Males Females Esophagus 0.26 0.44 0.26 0.44 Stomach 2.61 5.86 2.61 5.86 Colon 2.66 1.01 2.66 1.01 Liver 0.033 0.005 0.033 0.005 Lungs 2.67 5.81 2.67 5.81 Bone and connective tissue 0.38 0.12 - - Skin 0.89 0.72 0.89 0.72 Female breast - 6.80 - 6.80 Prostate 0.44 - 0.44 - Urinary bladder 0.84 1.02 0.84 1.02 Brain and CNS -0.21 0.43 0.00 0.43 Thyroid 0.87 2.32 0.87 2.32 Non-Hodgkin’s lymphoma 0.73 -0.20 - - Hodgkin’s disease 0.04 0.04 - - Multiple myeloma 0.26 -0.08 - - Leukemia 3.35 2.29 - -
As the ability of optimization with respect to the secondary cancer risk is dependent of knowing where a secondary cancer might occur, the cancer types where no localized anatomical site relating to radiation exposure could be specified were excluded. Analogous with this reasoning, the possibility of optimization with respect to secondary leukemia was also excluded from this study since the leukemia-related exposure involves all active bone marrow in the body. Negative values are interpreted as being zero and thus not contributing to the secondary cancer risk.
24
Patrik Brodin – Master of Science Thesis
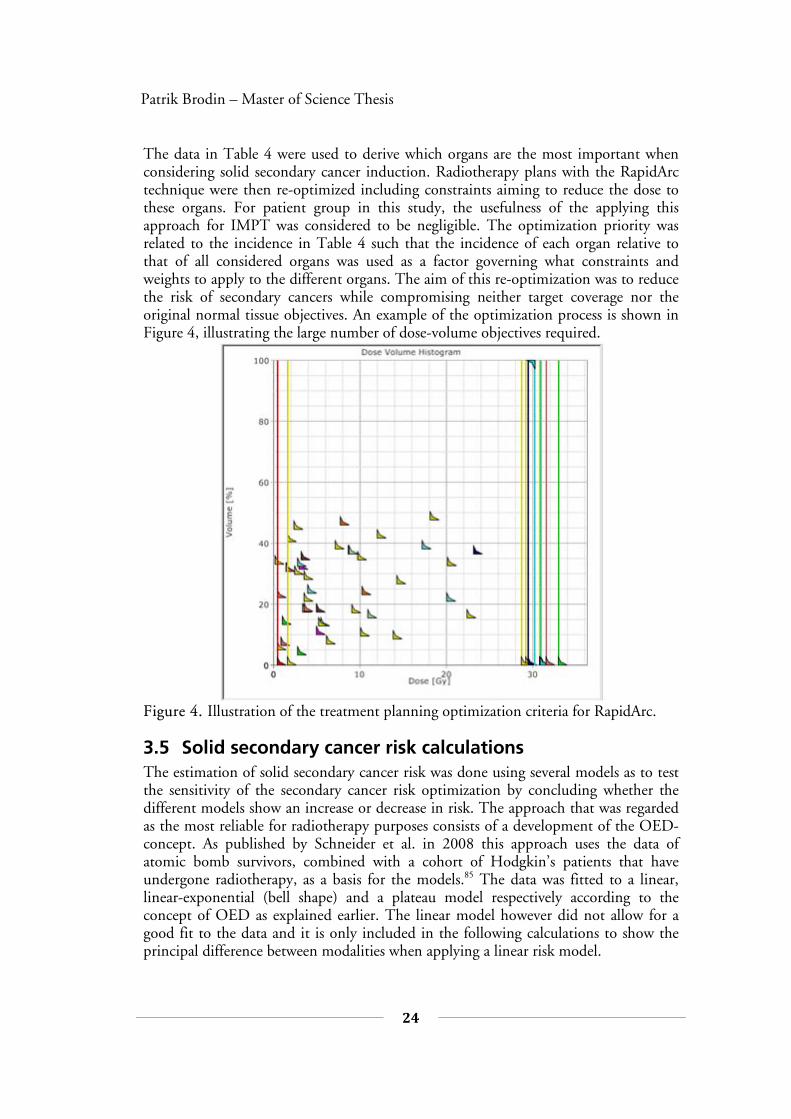
The data in Table 4 were used to derive which organs are the most important when considering solid secondary cancer induction. Radiotherapy plans with the RapidArc technique were then re-optimized including constraints aiming to reduce the dose to these organs. For patient group in this study, the usefulness of the applying this approach for IMPT was considered to be negligible. The optimization priority was related to the incidence in Table 4 such that the incidence of each organ relative to that of all considered organs was used as a factor governing what constraints and weights to apply to the different organs. The aim of this re-optimization was to reduce the risk of secondary cancers while compromising neither target coverage nor the original normal tissue objectives. An example of the optimization process is shown in Figure 4, illustrating the large number of dose-volume objectives required.
Figure 4. Illustration of the treatment planning optimization criteria for RapidArc.
3.5 Solid secondary cancer risk calculations The estimation of solid secondary cancer risk was done using several models as to test the sensitivity of the secondary cancer risk optimization by concluding whether the different models show an increase or decrease in risk. The approach that was regarded as the most reliable for radiotherapy purposes consists of a development of the OED-concept. As published by Schneider et al. in 2008 this approach uses the data of atomic bomb survivors, combined with a cohort of Hodgkin’s patients that have undergone radiotherapy, as a basis for the models.85 The data was fitted to a linear, linear-exponential (bell shape) and a plateau model respectively according to the concept of OED as explained earlier. The linear model however did not allow for a good fit to the data and it is only included in the following calculations to show the principal difference between modalities when applying a linear risk model.
25
3
MATERIALS AND METHODS
Along with fitting the models to the atomic bomb survivor and Hodgkin’s patients data Schneider et al. provided a population dependent modifying function accounting for patient gender, age at exposure and to which attained age the risk is considered. This function is described by the following expression
malesforfemalesfor
saesae ae
−+
±⋅
+−=
,
)1(46
ln)37(exp),,( γγµ (3.1)
where e is the patient’s age at exposure, a is the attained age and s is a variable relating to the gender of the patient. The constants eγ and aγ are related to age at exposure and attained age respectively and were derived from fitting the model to data. The excess absolute risk (EAR) of a secondary solid cancer is then given by
),,(OED),,,(EAR saesaeD µβ= (3.2)
where β describes the initial slope of the dose-response curve. The cumulative EAR to a certain attained age can then be calculated as proposed recently by Schneider et al.86 including gender specific survival functions as
∑+=
⋅=a
ei eSiSsieDaC
1EAR )(
)(),,,(EAR)( (3.3)
The ratio )(/)( eSiS is the gender specific conditional probability of a person alive at age e to reach age, i . In this study the survival functions given by Kellerer et al. were used.87 A limitation of this model is that no organ-specific model parameters were derived in the original publication.85 The dose-response curve for these models relates to the induction of any solid secondary cancer, thus representing the mean dose-response for all secondary cancers studied. In order to calculate the organ-specific risk contribution, this dose-response was assumed to be valid for all studied organs. In order to take into account the risk contribution from each of the relevant organs, a weighted mean OED was calculated for all organs considered in the risk optimization described in section 3.4. This yields a risk estimate weighted on the likelihood of inducing a solid secondary cancer, calculated as
...IncidenceIncidence...IncidenceOEDIncidenceOED
OEDStomachEsophagus
StomachStomachEsophagusEsophagusmean weighted ++
+⋅+⋅=
26
Patrik Brodin – Master of Science Thesis
The risk is then estimated by applying the resulting mean OED in Equation 3.2. As the EAR provided by these calculations is given per 10 000 person years, the cumulative EAR given by Equation 3.3 was converted to percentage risk per individual in order to display a more relevant quantity.
3.6 Secondary leukemia risk calculations An attempt was made to estimate the risk of radiation-induced secondary leukemia according to the model that provided the best fit to data in the study by Allard et al.51 This model proposes to estimate the risk of secondary leukemia as the risk to each of seven major sites of bone marrow in the body according to the age-dependent distribution of active bone marrow proposed by Cristy.88 These bone marrow sites were segmented with the Eclipse 8.6 contouring software and the mean absorbed dose to each of the sites were calculated. The fact that this model is based on mean doses is a major limitation as the effects of inhomogeneous dose distributions are ignored.
3.7 Normal tissue toxicity estimates Based on the literature referenced in Table 3, the dose-dependent incidences of normal tissue complications were estimated for the tissues where such data were available. In the absence of dose-dependent incidence data relevant to children, adult data were used. Details concerning the estimations are provided in appendix B.
3.8 Data extraction Data from the radiotherapy plans were extracted as DICOM-files and imported into the Computational Environment for Radiotherapy Research (CERR) MATLAB-program.89 The plans were then extracted from CERR into files containing differential DVHs for each structure specified in Table 2. MATLAB was then used to compute the estimations for secondary cancer risk as well as for normal tissue toxicities.
27
4
RESULTS
4 RESULTS Presented below are the results from the estimation of secondary cancer risks and normal tissue toxicity relating to CSI for the three studied treatment modalities.
4.1 Solid secondary cancer risk and the effects of considering it in the optimization process
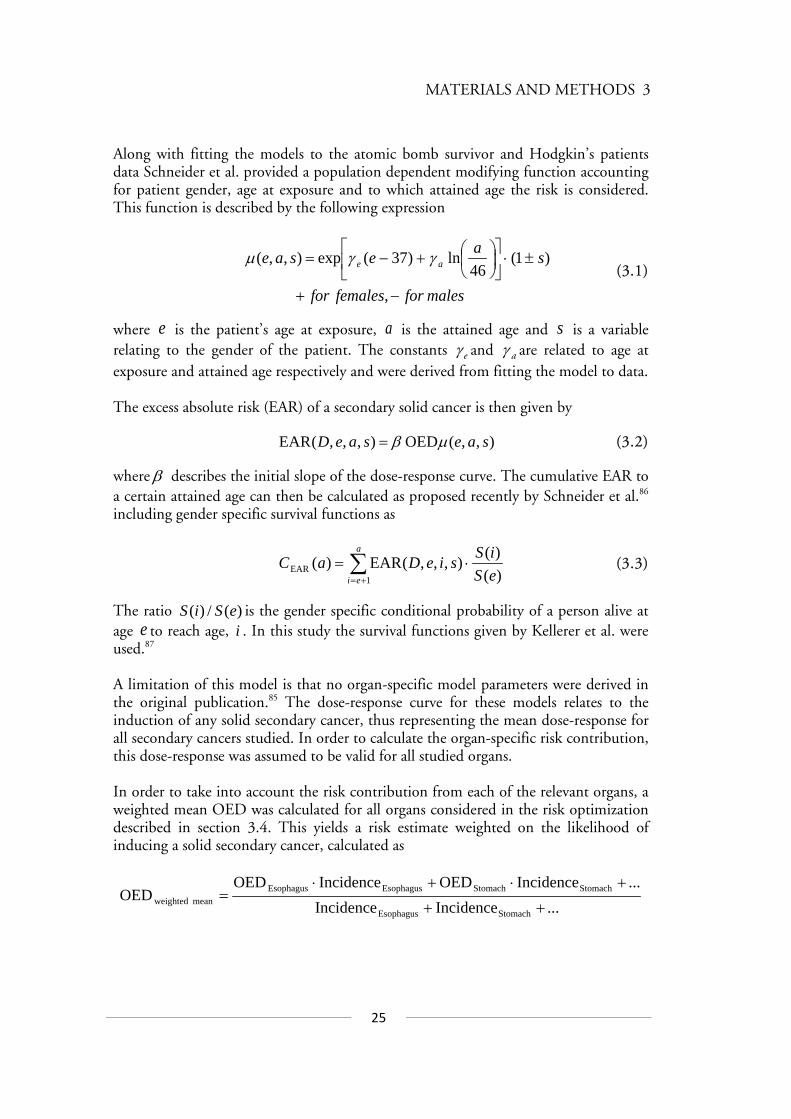
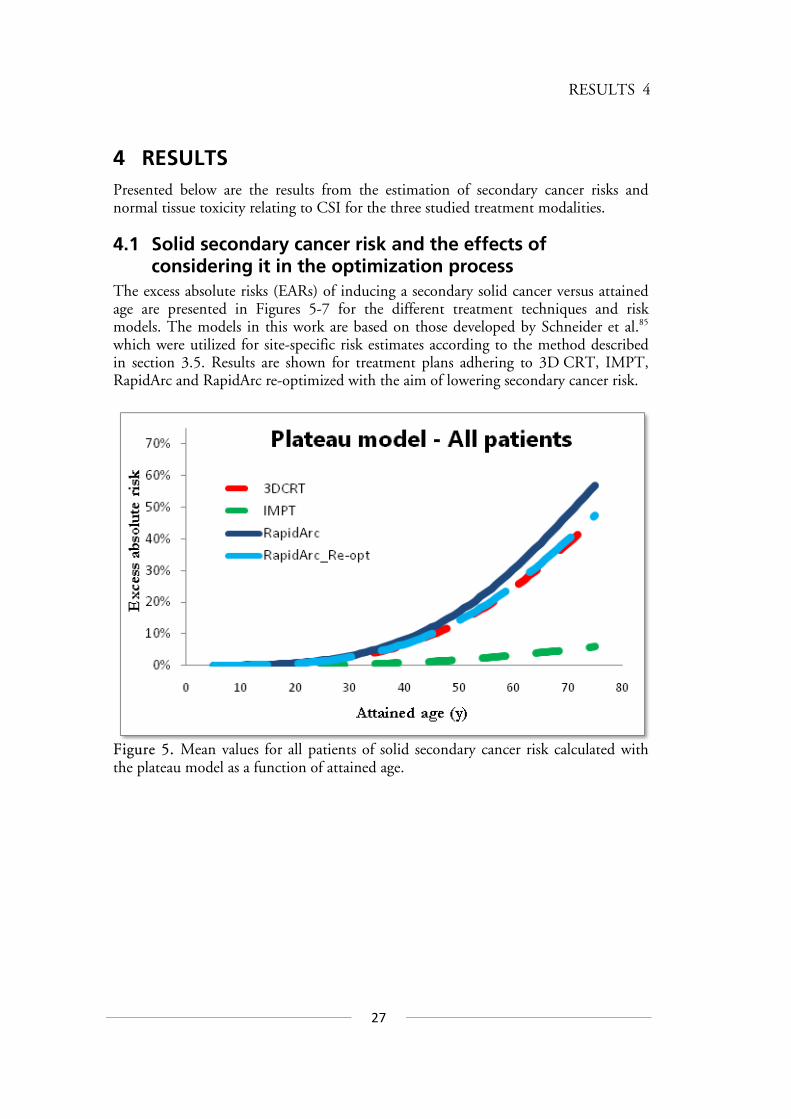
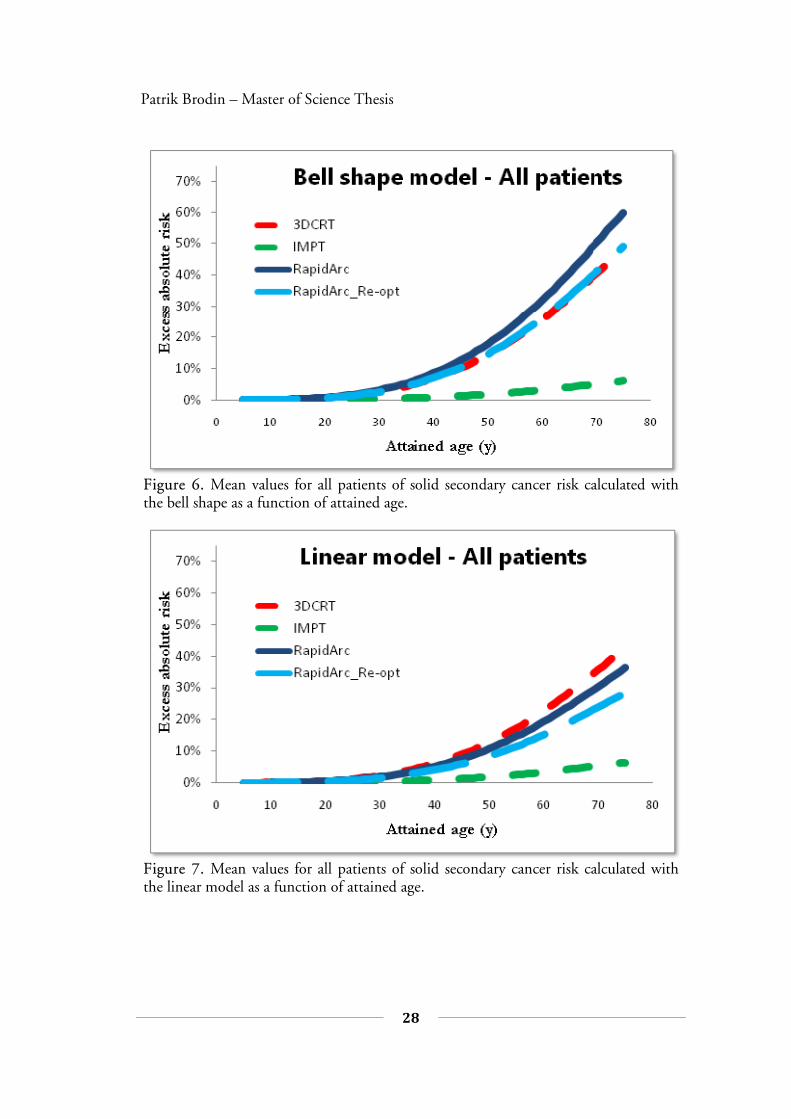
The excess absolute risks (EARs) of inducing a secondary solid cancer versus attained age are presented in Figures 5-7 for the different treatment techniques and risk models. The models in this work are based on those developed by Schneider et al.85 which were utilized for site-specific risk estimates according to the method described in section 3.5. Results are shown for treatment plans adhering to 3D CRT, IMPT, RapidArc and RapidArc re-optimized with the aim of lowering secondary cancer risk.
Figure 5. Mean values for all patients of solid secondary cancer risk calculated with the plateau model as a function of attained age.
28
Patrik Brodin – Master of Science Thesis
Figure 6. Mean values for all patients of solid secondary cancer risk calculated with the bell shape as a function of attained age.
Figure 7. Mean values for all patients of solid secondary cancer risk calculated with the linear model as a function of attained age.
29
4
RESULTS
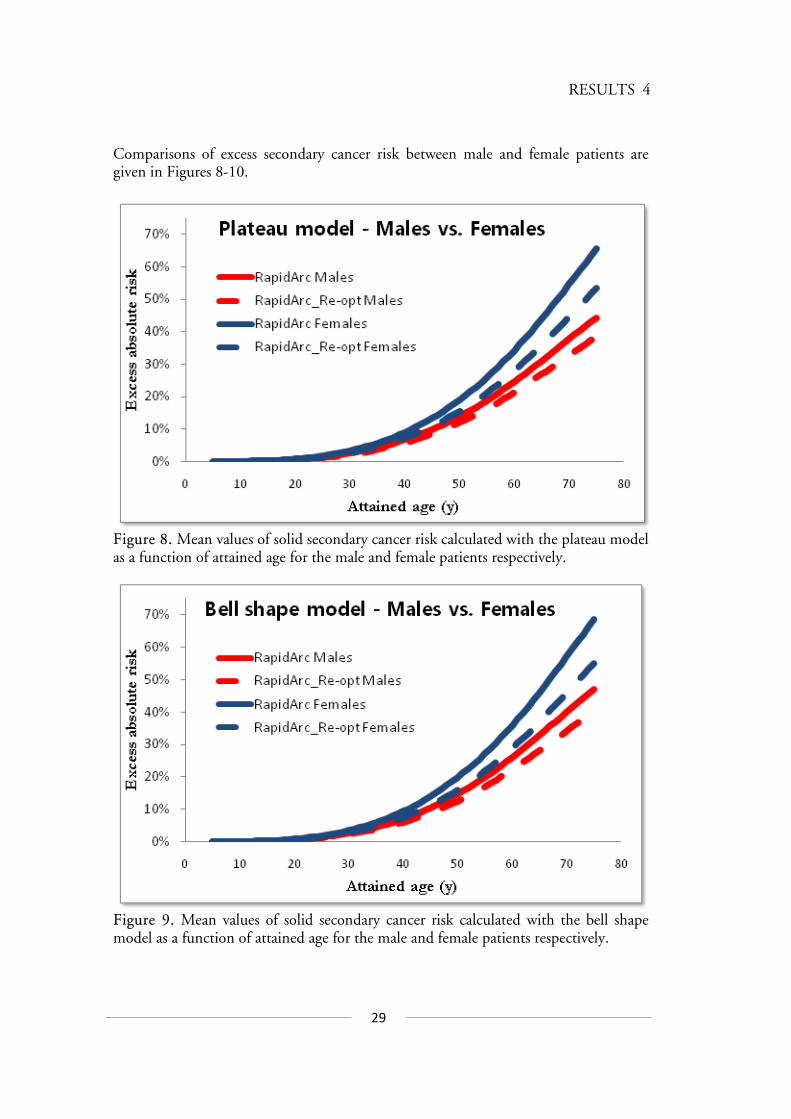
Comparisons of excess secondary cancer risk between male and female patients are given in Figures 8-10.
Figure 8. Mean values of solid secondary cancer risk calculated with the plateau model as a function of attained age for the male and female patients respectively.
Figure 9. Mean values of solid secondary cancer risk calculated with the bell shape model as a function of attained age for the male and female patients respectively.

30
Patrik Brodin – Master of Science Thesis
Figure 10. Mean values of solid secondary cancer risk calculated with the linear model as a function of attained age for the male and female patients respectively.
As demonstrated in Figures 5-10 the risk of developing a radiation-induced solid secondary cancer doesn’t start to increase until an attained age of approximately 30 years. Thus, it is not possible to distinguish between the secondary cancer risks from the different modalities before this age. This corresponds to a latency period of 15-25 years for the patients investigated in this study. It is clearly shown that including the risk of secondary cancer induction in the optimization process of RapidArc treatment reduces it to the same level as that from 3D CRT when using the plateau and bell shape models for risk estimation. The linear model predicts a substantially lower risk from the RapidArc treatments than for 3DCRT. The risk of developing a solid secondary cancer is, for all three models, higher for the female patients than for the males as shown for the RapidArc technique. This is also valid for 3D CRT but the difference is small for IMPT. According to the results in this study, the EAR of developing a solid secondary cancer until the attained age of 70 years is 10-17% higher for female patients when considering the photon treatment techniques. The secondary cancer risk is consequently lower for IMPT compared to the photon techniques, though it should be mentioned that the contribution of secondary neutrons is not included in the risk estimates.
31
4
RESULTS
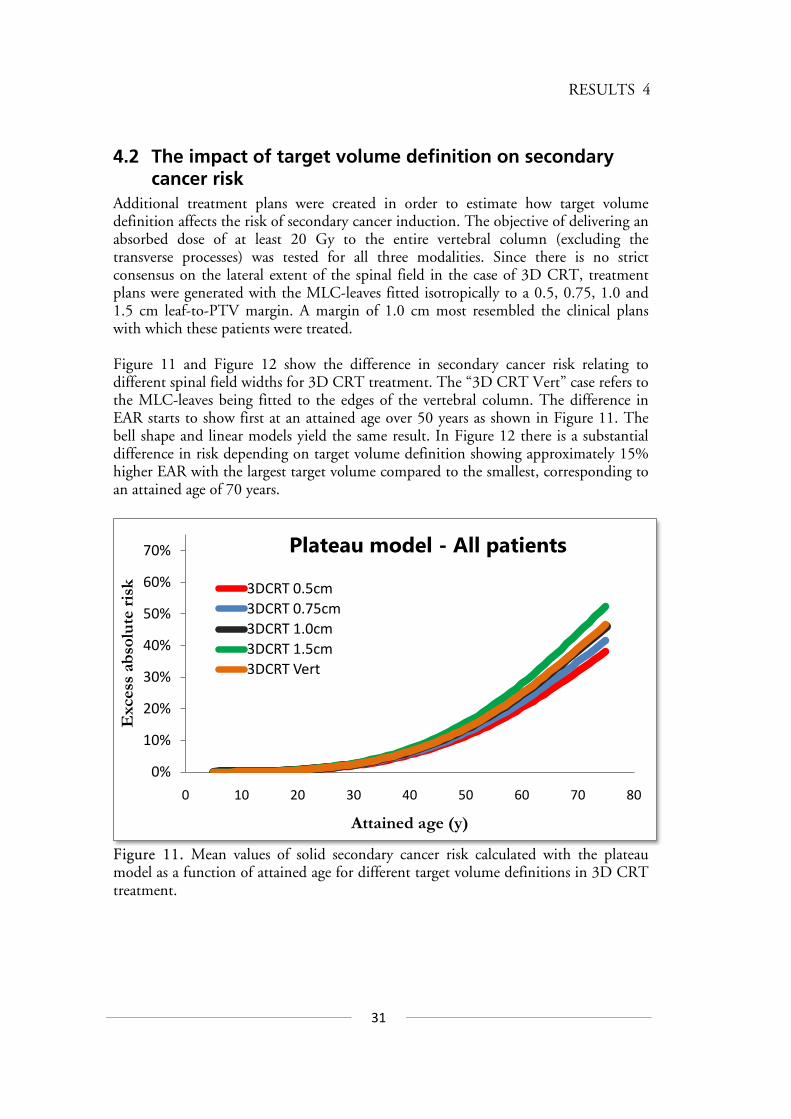
4.2 The impact of target volume definition on secondary cancer risk
Additional treatment plans were created in order to estimate how target volume definition affects the risk of secondary cancer induction. The objective of delivering an absorbed dose of at least 20 Gy to the entire vertebral column (excluding the transverse processes) was tested for all three modalities. Since there is no strict consensus on the lateral extent of the spinal field in the case of 3D CRT, treatment plans were generated with the MLC-leaves fitted isotropically to a 0.5, 0.75, 1.0 and 1.5 cm leaf-to-PTV margin. A margin of 1.0 cm most resembled the clinical plans with which these patients were treated. Figure 11 and Figure 12 show the difference in secondary cancer risk relating to different spinal field widths for 3D CRT treatment. The “3D CRT Vert” case refers to the MLC-leaves being fitted to the edges of the vertebral column. The difference in EAR starts to show first at an attained age over 50 years as shown in Figure 11. The bell shape and linear models yield the same result. In Figure 12 there is a substantial difference in risk depending on target volume definition showing approximately 15% higher EAR with the largest target volume compared to the smallest, corresponding to an attained age of 70 years.
Figure 11. Mean values of solid secondary cancer risk calculated with the plateau model as a function of attained age for different target volume definitions in 3D CRT treatment.
0%
10%
20%
30%
40%
50%
60%
70%
0 10 20 30 40 50 60 70 80
Exc
ess
abso
lute
risk
Attained age (y)
Plateau model - All patients
3DCRT 0.5cm3DCRT 0.75cm3DCRT 1.0cm3DCRT 1.5cm3DCRT Vert
32
Patrik Brodin – Master of Science Thesis
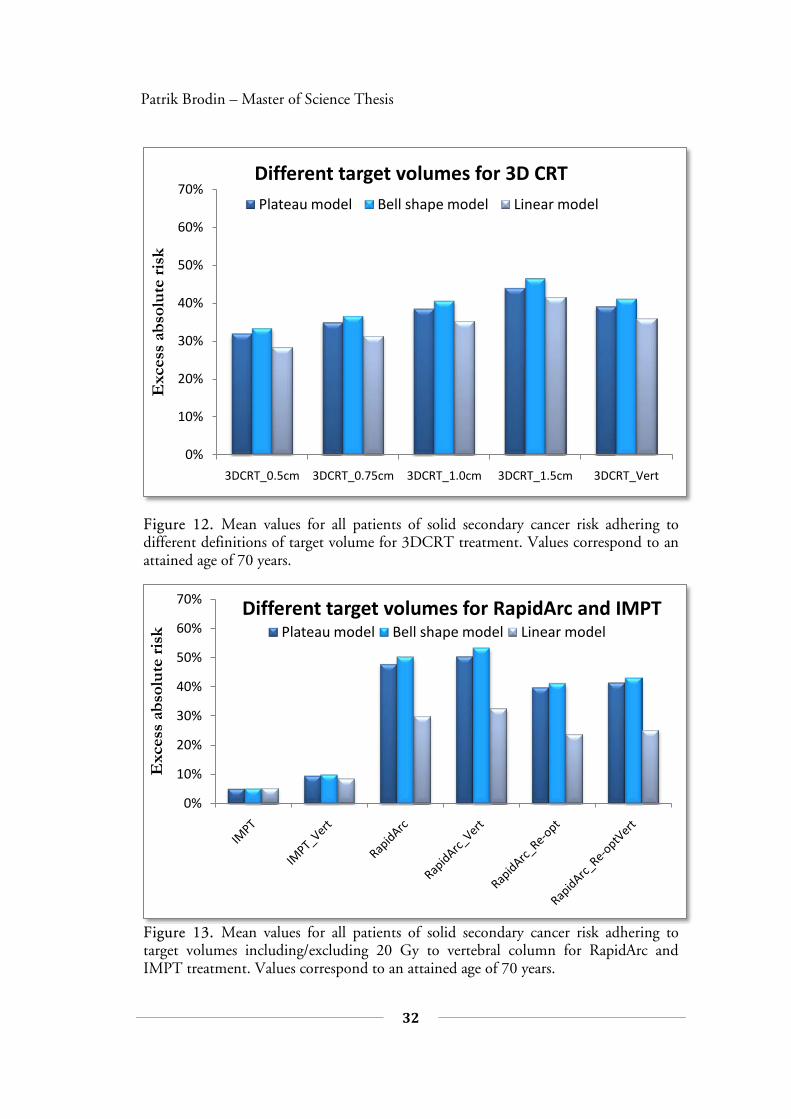
Figure 12. Mean values for all patients of solid secondary cancer risk adhering to different definitions of target volume for 3DCRT treatment. Values correspond to an attained age of 70 years.
Figure 13. Mean values for all patients of solid secondary cancer risk adhering to target volumes including/excluding 20 Gy to vertebral column for RapidArc and IMPT treatment. Values correspond to an attained age of 70 years.
0%
10%
20%
30%
40%
50%
60%
70%
3DCRT_0.5cm 3DCRT_0.75cm 3DCRT_1.0cm 3DCRT_1.5cm 3DCRT_Vert
Exc
ess
abso
lute
risk
Different target volumes for 3D CRT Plateau model Bell shape model Linear model
0%
10%
20%
30%
40%
50%
60%
70%
Exc
ess
abso
lute
risk
Different target volumes for RapidArc and IMPT Plateau model Bell shape model Linear model

33
4
RESULTS
Figure 13 shows that the risk of solid secondary cancer induction is slightly elevated for RapidArc treatment if including 20 Gy to the entire vertebral column as a target condition. The difference between including it and not including it is however almost negligible. For IMPT the risk is almost doubled from an original 5% to about 10% for plans including the 20 Gy to the vertebral column criteria.
4.3 Normal tissue toxicity estimates Normal tissue toxicity was estimated according to the methods detailed in appendix B and the results are presented for each endpoint in Figure 14.
0%1%2%3%4%5%6%7%
Com
plic
atio
n ri
sk
Blindness
0%2%4%6%8%
10%12%
Com
plic
atio
n ri
sk
Heart failure
0%
10%
20%
30%
40%
50%
Com
plic
atio
n ri
sk
Hypothyroidism
0%
1%
2%
3%
4%
5%
Com
plic
atio
n ri
sk
Pneumonitis
a) b)
c) d)
34
Patrik Brodin – Master of Science Thesis
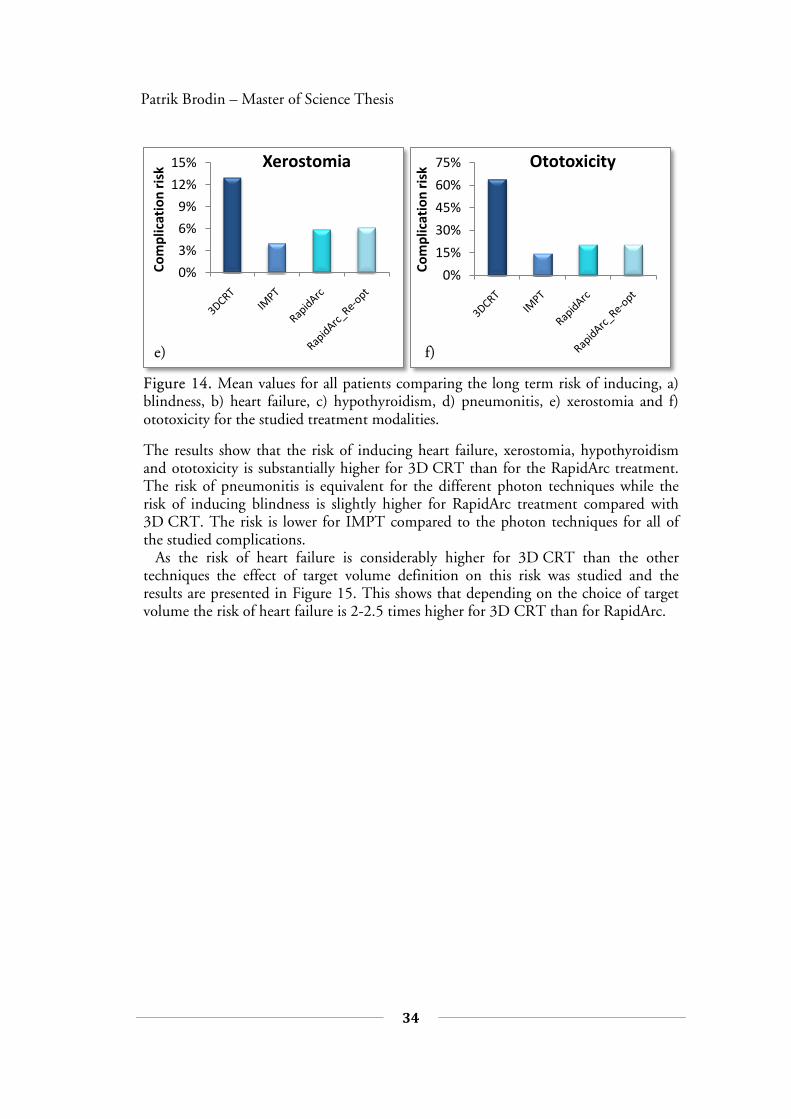
Figure 14. Mean values for all patients comparing the long term risk of inducing, a) blindness, b) heart failure, c) hypothyroidism, d) pneumonitis, e) xerostomia and f) ototoxicity for the studied treatment modalities.
The results show that the risk of inducing heart failure, xerostomia, hypothyroidism and ototoxicity is substantially higher for 3D CRT than for the RapidArc treatment. The risk of pneumonitis is equivalent for the different photon techniques while the risk of inducing blindness is slightly higher for RapidArc treatment compared with 3D CRT. The risk is lower for IMPT compared to the photon techniques for all of the studied complications. As the risk of heart failure is considerably higher for 3D CRT than the other techniques the effect of target volume definition on this risk was studied and the results are presented in Figure 15. This shows that depending on the choice of target volume the risk of heart failure is 2-2.5 times higher for 3D CRT than for RapidArc.
0%
3%
6%
9%
12%
15%Co
mpl
icat
ion
risk
Xerostomia
0%
15%
30%
45%
60%
75%
Com
plic
atio
n ri
sk
Ototoxicity
e) f)
35
4
RESULTS
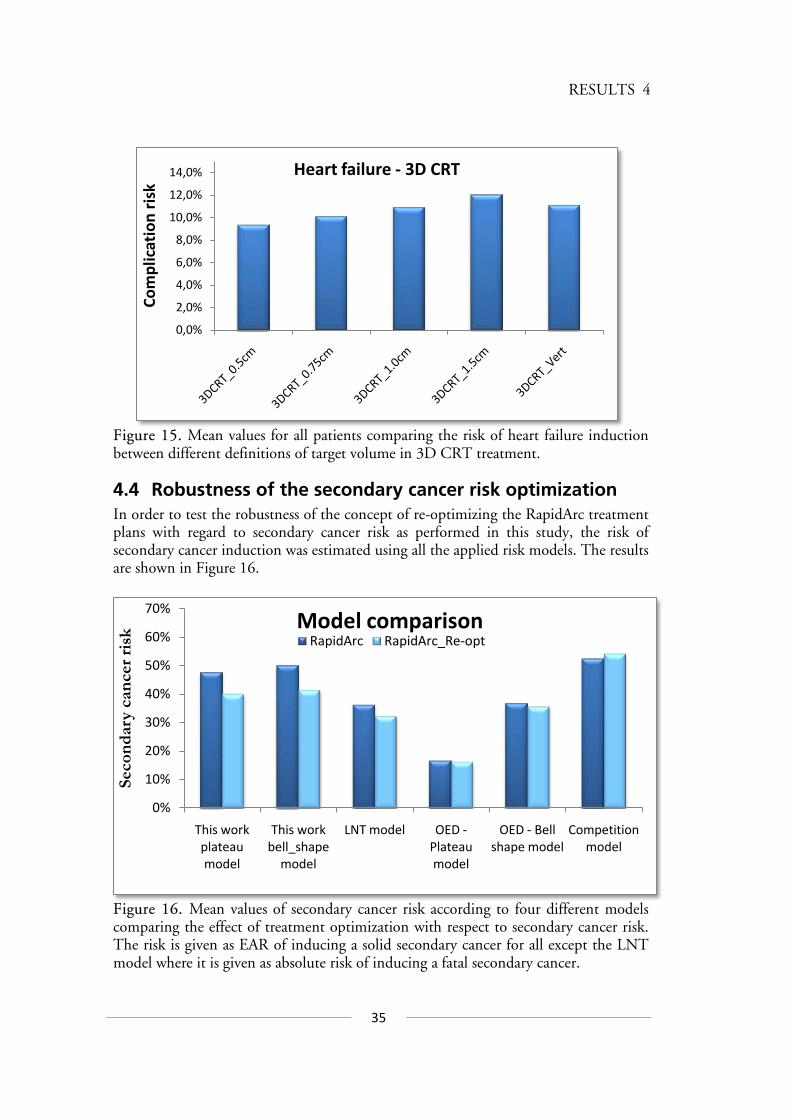
Figure 15. Mean values for all patients comparing the risk of heart failure induction between different definitions of target volume in 3D CRT treatment.
4.4 Robustness of the secondary cancer risk optimization In order to test the robustness of the concept of re-optimizing the RapidArc treatment plans with regard to secondary cancer risk as performed in this study, the risk of secondary cancer induction was estimated using all the applied risk models. The results are shown in Figure 16.
Figure 16. Mean values of secondary cancer risk according to four different models comparing the effect of treatment optimization with respect to secondary cancer risk. The risk is given as EAR of inducing a solid secondary cancer for all except the LNT model where it is given as absolute risk of inducing a fatal secondary cancer.
0,0%
2,0%
4,0%
6,0%
8,0%
10,0%
12,0%
14,0%
Com
plic
atio
n ri
skHeart failure - 3D CRT
0%
10%
20%
30%
40%
50%
60%
70%
This work plateau model
This work bell_shape
model
LNT model OED -Plateau model
OED - Bell shape model
Competition model
Seco
ndar
y ca
ncer
risk
Model comparisonRapidArc RapidArc_Re-opt
36
Patrik Brodin – Master of Science Thesis
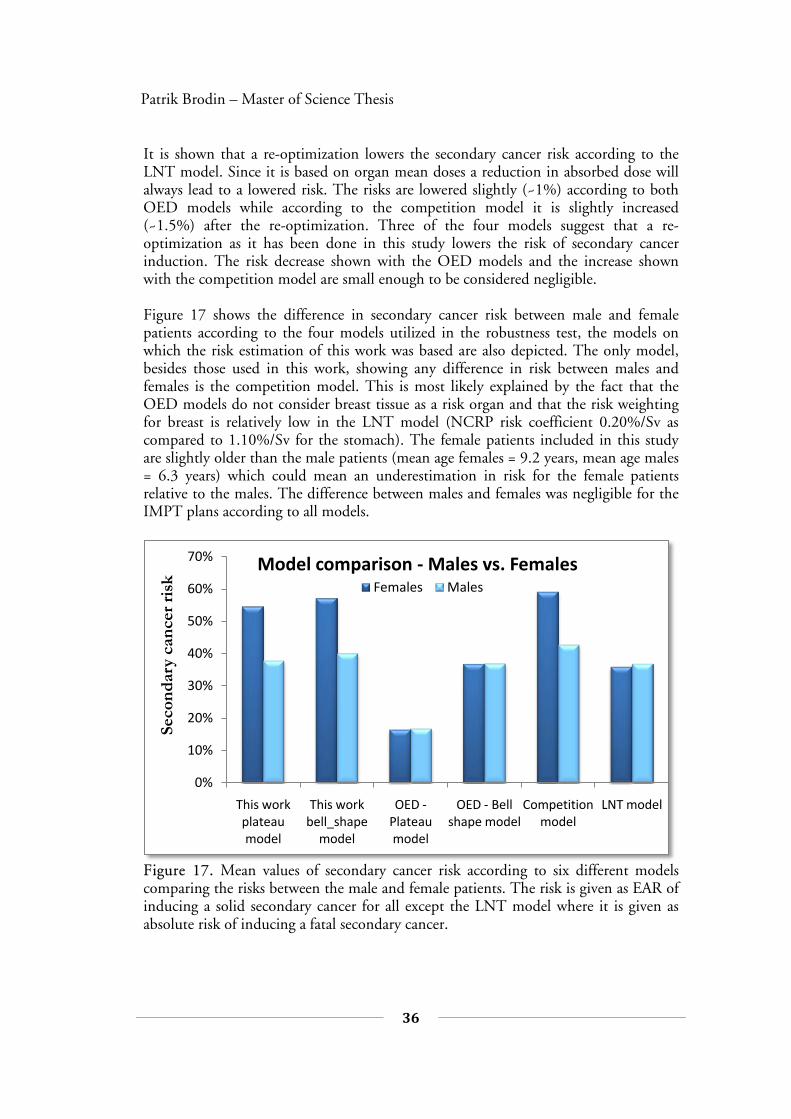
It is shown that a re-optimization lowers the secondary cancer risk according to the LNT model. Since it is based on organ mean doses a reduction in absorbed dose will always lead to a lowered risk. The risks are lowered slightly (~1%) according to both OED models while according to the competition model it is slightly increased (~1.5%) after the re-optimization. Three of the four models suggest that a re-optimization as it has been done in this study lowers the risk of secondary cancer induction. The risk decrease shown with the OED models and the increase shown with the competition model are small enough to be considered negligible. Figure 17 shows the difference in secondary cancer risk between male and female patients according to the four models utilized in the robustness test, the models on which the risk estimation of this work was based are also depicted. The only model, besides those used in this work, showing any difference in risk between males and females is the competition model. This is most likely explained by the fact that the OED models do not consider breast tissue as a risk organ and that the risk weighting for breast is relatively low in the LNT model (NCRP risk coefficient 0.20%/Sv as compared to 1.10%/Sv for the stomach). The female patients included in this study are slightly older than the male patients (mean age females = 9.2 years, mean age males = 6.3 years) which could mean an underestimation in risk for the female patients relative to the males. The difference between males and females was negligible for the IMPT plans according to all models.
Figure 17. Mean values of secondary cancer risk according to six different models comparing the risks between the male and female patients. The risk is given as EAR of inducing a solid secondary cancer for all except the LNT model where it is given as absolute risk of inducing a fatal secondary cancer.
0%
10%
20%
30%
40%
50%
60%
70%
This work plateau model
This work bell_shape
model
OED -Plateau model
OED - Bell shape model
Competition model
LNT model
Seco
ndar
y ca
ncer
risk
Model comparison - Males vs. FemalesFemales Males
37
4
RESULTS
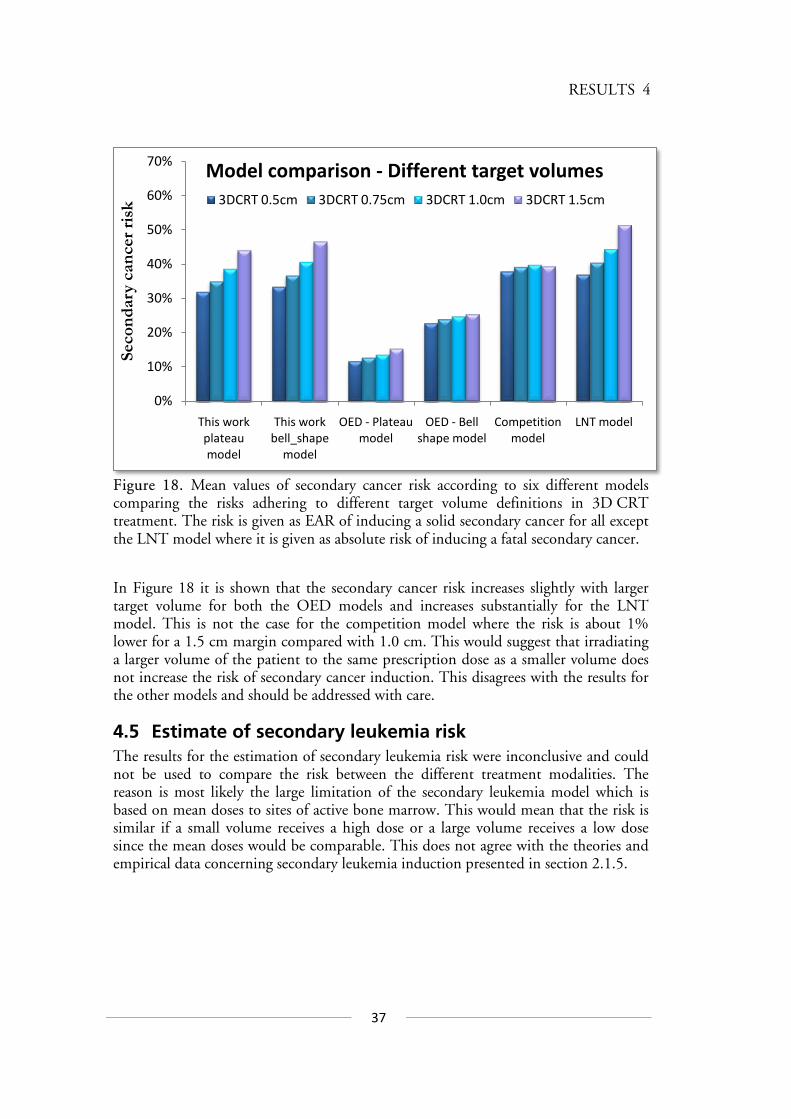
Figure 18. Mean values of secondary cancer risk according to six different models comparing the risks adhering to different target volume definitions in 3D CRT treatment. The risk is given as EAR of inducing a solid secondary cancer for all except the LNT model where it is given as absolute risk of inducing a fatal secondary cancer.
In Figure 18 it is shown that the secondary cancer risk increases slightly with larger target volume for both the OED models and increases substantially for the LNT model. This is not the case for the competition model where the risk is about 1% lower for a 1.5 cm margin compared with 1.0 cm. This would suggest that irradiating a larger volume of the patient to the same prescription dose as a smaller volume does not increase the risk of secondary cancer induction. This disagrees with the results for the other models and should be addressed with care.
4.5 Estimate of secondary leukemia risk The results for the estimation of secondary leukemia risk were inconclusive and could not be used to compare the risk between the different treatment modalities. The reason is most likely the large limitation of the secondary leukemia model which is based on mean doses to sites of active bone marrow. This would mean that the risk is similar if a small volume receives a high dose or a large volume receives a low dose since the mean doses would be comparable. This does not agree with the theories and empirical data concerning secondary leukemia induction presented in section 2.1.5.
0%
10%
20%
30%
40%
50%
60%
70%
This work plateau model
This work bell_shape
model
OED - Plateau model
OED - Bell shape model
Competition model
LNT model
Seco
ndar
y ca
ncer
risk
Model comparison - Different target volumes3DCRT 0.5cm 3DCRT 0.75cm 3DCRT 1.0cm 3DCRT 1.5cm
38
Patrik Brodin – Master of Science Thesis
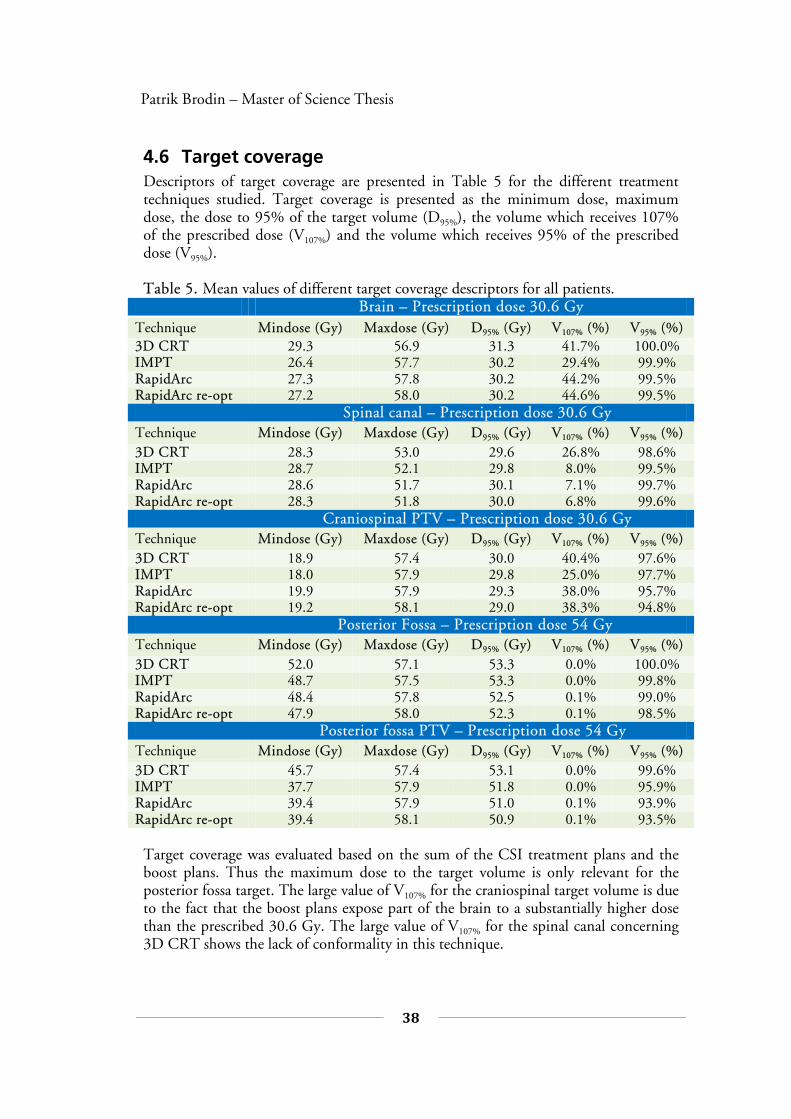
4.6 Target coverage Descriptors of target coverage are presented in Table 5 for the different treatment techniques studied. Target coverage is presented as the minimum dose, maximum dose, the dose to 95% of the target volume (D95%), the volume which receives 107% of the prescribed dose (V107%) and the volume which receives 95% of the prescribed dose (V95%). Table 5. Mean values of different target coverage descriptors for all patients.
Brain – Prescription dose 30.6 Gy Technique Mindose (Gy) Maxdose (Gy) D95% (Gy) V107% (%) V95% (%) 3D CRT 29.3 56.9 31.3 41.7% 100.0% IMPT 26.4 57.7 30.2 29.4% 99.9% RapidArc 27.3 57.8 30.2 44.2% 99.5% RapidArc re-opt 27.2 58.0 30.2 44.6% 99.5%
Spinal canal – Prescription dose 30.6 Gy Technique Mindose (Gy) Maxdose (Gy) D95% (Gy) V107% (%) V95% (%) 3D CRT 28.3 53.0 29.6 26.8% 98.6% IMPT 28.7 52.1 29.8 8.0% 99.5% RapidArc 28.6 51.7 30.1 7.1% 99.7% RapidArc re-opt 28.3 51.8 30.0 6.8% 99.6%
Craniospinal PTV – Prescription dose 30.6 Gy Technique Mindose (Gy) Maxdose (Gy) D95% (Gy) V107% (%) V95% (%) 3D CRT 18.9 57.4 30.0 40.4% 97.6% IMPT 18.0 57.9 29.8 25.0% 97.7% RapidArc 19.9 57.9 29.3 38.0% 95.7% RapidArc re-opt 19.2 58.1 29.0 38.3% 94.8%
Posterior Fossa – Prescription dose 54 Gy Technique Mindose (Gy) Maxdose (Gy) D95% (Gy) V107% (%) V95% (%) 3D CRT 52.0 57.1 53.3 0.0% 100.0% IMPT 48.7 57.5 53.3 0.0% 99.8% RapidArc 48.4 57.8 52.5 0.1% 99.0% RapidArc re-opt 47.9 58.0 52.3 0.1% 98.5%
Posterior fossa PTV – Prescription dose 54 Gy Technique Mindose (Gy) Maxdose (Gy) D95% (Gy) V107% (%) V95% (%) 3D CRT 45.7 57.4 53.1 0.0% 99.6% IMPT 37.7 57.9 51.8 0.0% 95.9% RapidArc 39.4 57.9 51.0 0.1% 93.9% RapidArc re-opt 39.4 58.1 50.9 0.1% 93.5%
Target coverage was evaluated based on the sum of the CSI treatment plans and the boost plans. Thus the maximum dose to the target volume is only relevant for the posterior fossa target. The large value of V107% for the craniospinal target volume is due to the fact that the boost plans expose part of the brain to a substantially higher dose than the prescribed 30.6 Gy. The large value of V107% for the spinal canal concerning 3D CRT shows the lack of conformality in this technique.
39
DISCUSSION 5
5 DISCUSSION The results show that the solid secondary cancer risk of RapidArc treatment can be reduced to the same level as 3D CRT using the concept described in section 3.4 along with the plateau and bell shaped OED models as in section 3.5. This would suggest that the conventional situation of intensity-modulated photon treatment yielding a higher risk of secondary cancer induction than 3D CRT can be avoided. The way to do this would be to consider the risk of secondary cancer in the optimization process. The method used in this work is an example of such an approach and other ways of doing this could make it more applicable. For instance there is the possibility of using radiation-induced secondary cancer data from studies based on children having received radiotherapy treatment instead of the LSS data. Such an approach is appealing since the data would be specifically for children and the possible cancer-prone genetic disposition of childhood cancer patients would be taken into con-sideration. It should be stressed that the linear model did not provide a good fit to the Hodgkin’s patients and atomic bomb survivor data on which the models are based so it should only be considered for relative comparison. Secondary cancer risk calculations in general are subject to large uncertainty so absolute risk values should be treated with some reservation but relative comparisons can be more reliably considered. The optimization based on reducing secondary cancer risk is, as it is implemented in this work, independent of the choice of model used to estimate the risk. Performing such an estimation with several different models in order to analyze the robustness of the approach yielded results that disagree somewhat with the original estimates. The results according to the competition model suggest that the re-optimization actually increases the risk of inducing secondary cancers. It should be mentioned that this model is mechanistic i.e. based on theoretical concepts and relies on the input of organ-specific βα/ -values. These values are not well known for many of the organs included in the risk estimation and an βα/ of 3 was used for those organs. The dose-response according to the competition model suggests that secondary cancer risks are highest at a relatively low absorbed dose (~5 Gy). The risk then decreases with absorbed dose and the risk is negligible at doses higher than approximately 20 Gy. This should be considered with care since large retrospective studies have shown significant increases in secondary cancers in regions irradiated to high doses.90 The risk of developing a radiation-induced solid secondary cancer is shown to be considerably higher for the female patients compared to the males. This is in agree-ment with clinical experience concerning children treated with radiotherapy.74, 91
40
Patrik Brodin – Master of Science Thesis
The secondary cancer incidence, based on the combined atomic bomb survivors and Hodgkin’s patient data, is somewhat higher for females as described by Equation 3.1. Studying the organ-specific OEDs of the male and female patients shows that for males, the thyroid, colon, stomach and lungs are the organs contributing most to secondary cancer risk. For females the corresponding organs are the thyroid, stomach, lungs and to some extent also the breasts. Female breast tissue was surprisingly not one of the largest risk contributing organs although this is explained by the fact that the breasts are located relatively far from the target volume and thus receives a fairly low absorbed dose. The female breast tissue is however the organ contributing most to the difference in risk between 3D CRT and RapidArc. The OED of the breasts is almost twice as high from non-re-optimized RapidArc treatment compared to 3D CRT. The breasts are also the organ which contributes most to the reduction in secondary cancer risk from re-optimization as this lowers the OED of the breasts by about one third. The fact that the female patients in this study are slightly older than the males would actually suggest an underestimation of risk for the female patients relative to that of the males. However it has been shown that the risk of secondary breast cancer after radiation therapy is only increased in females over ten years old.92 This may mitigate the risk underestimation relating to the female patients being slightly older than the males. The secondary cancer risk is not shown to be higher for females according to the OED models included in the robustness analysis. The explanation for this is most likely due to the fact that secondary breast cancer is not considered in these models. It has been shown that breast cancers are the most common secondary cancers after radiotherapy for pediatric Hodgkin’s disease.91 The fact that the breasts are excluded is surprising since these models are based on secondary cancer data of patients treated for Hodgkin’s disease. Including the female breasts as a secondary risk organ in the original OED models would likely enhance the effect of the re-optimization according to these models. As for the estimations of normal tissue toxicity the results suggest that patients treated with 3D CRT are subject to substantially larger risks of serious complications such as heart failure and severe hearing loss than those who would be treated with intensity-modulated therapy. The ERR of heart failure adhering to radiotherapy is about five times higher for 3D CRT compared to RapidArc treatment relating to a substantially higher mean heart dose. It was shown in this study that the risk of developing a secondary cancer becomes noticeable at an attained age over 30 years and then increases. It is difficult to assess whether the risk of secondary cancer or the risk of complications like heart failure and pneumonitis is of greatest importance for these patients. It is however feasible to suggest that a 10% risk of heart failure, which is a serious threat to a patient’s life, before the age of 25 is worse than a 20% risk of con-tracting a secondary cancer before turning 50. It will have to be determined from increasing follow-up of studies like the CCSS whether the incidence of complications like secondary cancers or heart failure will follow the naturally occurring increase with age.
41
5
DISCUSSION
In this work the optimization priority of normal tissue toxicity prevention was based solely on the severity of each complication. The best treatment plans with respect to these risks would most likely include an optimization also considering the incidence of the different complications as not to attempt reducing a risk which might already negligible. Such an approach of fully risk-based optimization is an appealing concept. It proved difficult to estimate the risk of secondary leukemia because of limitations inherent to the currently available models. A possible improvement would be to consider the inhomogeneous dose distribution common to modern radiotherapy rather than basing models on mean doses. Although no comparison between the diffe-rent modalities could be made, the risk of inducing a secondary leukemia has been reported to be relatively low, corresponding to a cumulative incidence of about 0.5% in the first five years after treatment.29 The risk of all long-term complications, secondary cancer as well as normal tissue toxicity, was shown to be considerably lower for IMPT than the photon techniques. This is due to the advantageous physical characteristics of protons compared to photons, considering radiotherapy purposes. A limitation in this study is the fact that the effect of secondary neutrons is not accounted for. The uncertainty in neutron RBE complicates this risk estimation although attempts have been made. Taddei et al. estimated the EAR, attributable to secondary neutrons, of inducing a fatal secondary cancer for a pediatric MB patient treated with passive scattering proton radiotherapy to approximately 3.4%.42 The authors estimated that treatment with active scanning could facilitate a 5-fold reduction in secondary neutron contribution. Other authors have reported secondary neutron contribution as approximately 10 times lower for active scanning techniques like IMPT than for passive scattering.40
42
Patrik Brodin – Master of Science Thesis
6 CONCLUSION This study has shown that reducing the risk of solid secondary cancers by including it in the optimization process is feasible for inversely-planned arc therapy. The uncer-tainties related to secondary cancer risk estimations should be considered but an optimization resulting in risk reduction according to all available models would offer a relatively robust approach. The results in this study showed that treating pediatric medulloblastoma with 3D CRT would subject patients to substantially higher risks of severe normal tissue complications compared to intensity-modulated treatment. The definition of the spinal field width in 3D CRT was also shown to have a considerable impact on secondary cancer risk as well as the risk of heart failure. The risks of severe treatment-induced complications like those presented in this study should always be considered when treating children with medulloblastoma. Treatment with spot-scanned IMPT was shown to reduce the risks of all radiation-induced complications compared to the photon techniques. Although secondary neutrons were not considered in this study, the results suggest that actively-scanned proton therapy can greatly benefit patients with pediatric medulloblastoma.

43
0
Appendix A
Appendix A
NTCP-modeling Models estimating normal tissue complication probability (NTCP) have been used to attempt prediction of organ damage due to radiation since the classical paper by Emami et al.93 and Burman et al. in 1991.94 The main purpose of an NTCP-model is to find the optimal balance where as much absorbed dose as possible can be applied to the tumor volume while keeping the risk of complication in the OARs reasonably low. This section will describe the theory behind three widely used NTCP-models.
The LKB-model The Lyman-Kutcher-Burman or LKB-model is based on the original model described by Lyman in 198595 which estimates NTCP as a function of absorbed dose, D according to
dteu
t
∫ ∞−
−⋅= 2
2
2/1NTCP π (A.1)
where
)()(
50
50
TDmTDD
u⋅−
= . (A.2)
The variable TD50 is the absorbed dose to the whole organ that would yield an NTCP of 50%, m is a dimensionless parameter, describing the slope of the dose-response curve, derived by fitting the model to data. For uniform irradiation of a fractional volume v of an organ Lyman introduced the parameter n as
nvTDvTD −⋅= 5050 )( (A.3)
where n describes the volume dependence of the organ, i.e. whether the organ adheres to a parallel or serial architecture of functional subunits. A parallel structure corresponds to a strong volume dependence while a serial structure yields the same response independent of how much of the organ’s volume is irradiated. The parameter v is derived as refVVv /= where refV is usually taken as the volume of the whole organ. To apply the Lyman model to situations of non-uniform irradiation Kutcher and Burman developed a volume-reduction (also called DVH-reduction) algorithm.96
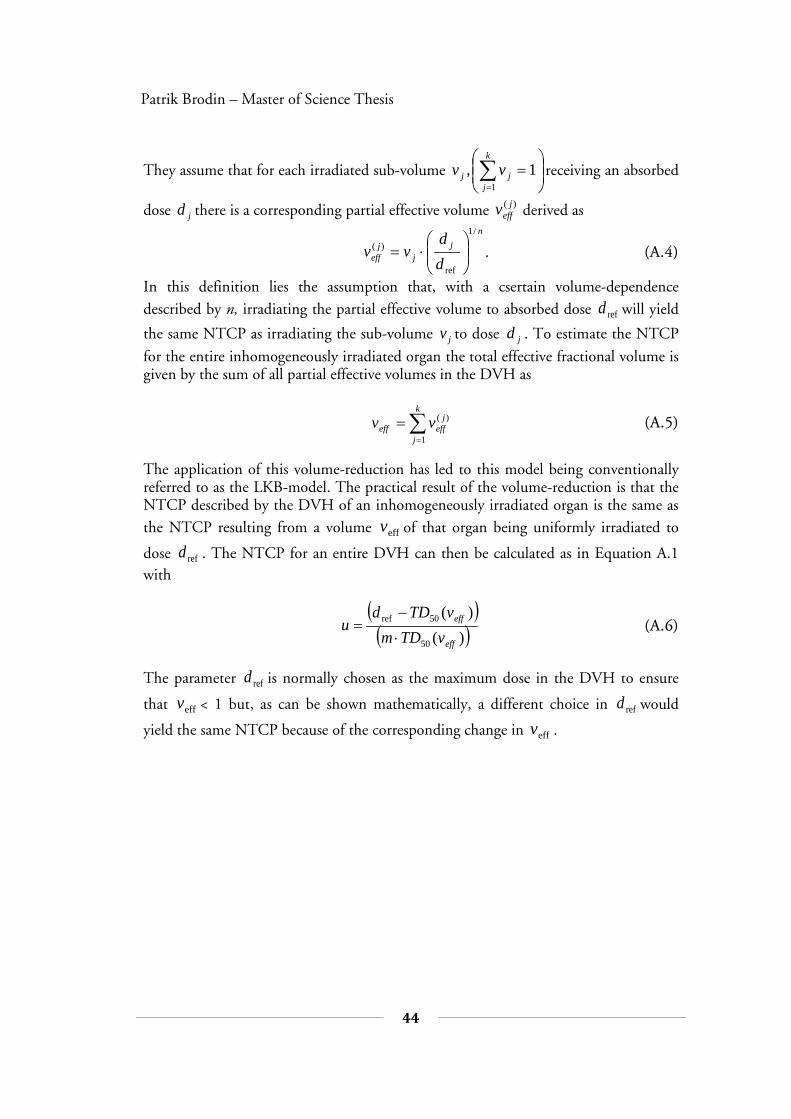
44
Patrik Brodin – Master of Science Thesis
They assume that for each irradiated sub-volume
=∑
=
k
jjj vv
11, receiving an absorbed
dose jd there is a corresponding partial effective volume )( jeffv derived as
nj
jj
eff dd
vv/1
ref
)(
⋅= . (A.4)
In this definition lies the assumption that, with a csertain volume-dependence described by n, irradiating the partial effective volume to absorbed dose refd will yield
the same NTCP as irradiating the sub-volume jv to dose jd . To estimate the NTCP
for the entire inhomogeneously irradiated organ the total effective fractional volume is given by the sum of all partial effective volumes in the DVH as
∑=
=k
j
jeffeff vv
1
)( (A.5)
The application of this volume-reduction has led to this model being conventionally referred to as the LKB-model. The practical result of the volume-reduction is that the NTCP described by the DVH of an inhomogeneously irradiated organ is the same as the NTCP resulting from a volume effv of that organ being uniformly irradiated to
dose refd . The NTCP for an entire DVH can then be calculated as in Equation A.1 with
( )( ))(
)(
50
50ref
eff
eff
vTDmvTDd
u⋅
−= (A.6)
The parameter refd is normally chosen as the maximum dose in the DVH to ensure
that effv < 1 but, as can be shown mathematically, a different choice in refd would
yield the same NTCP because of the corresponding change in effv .
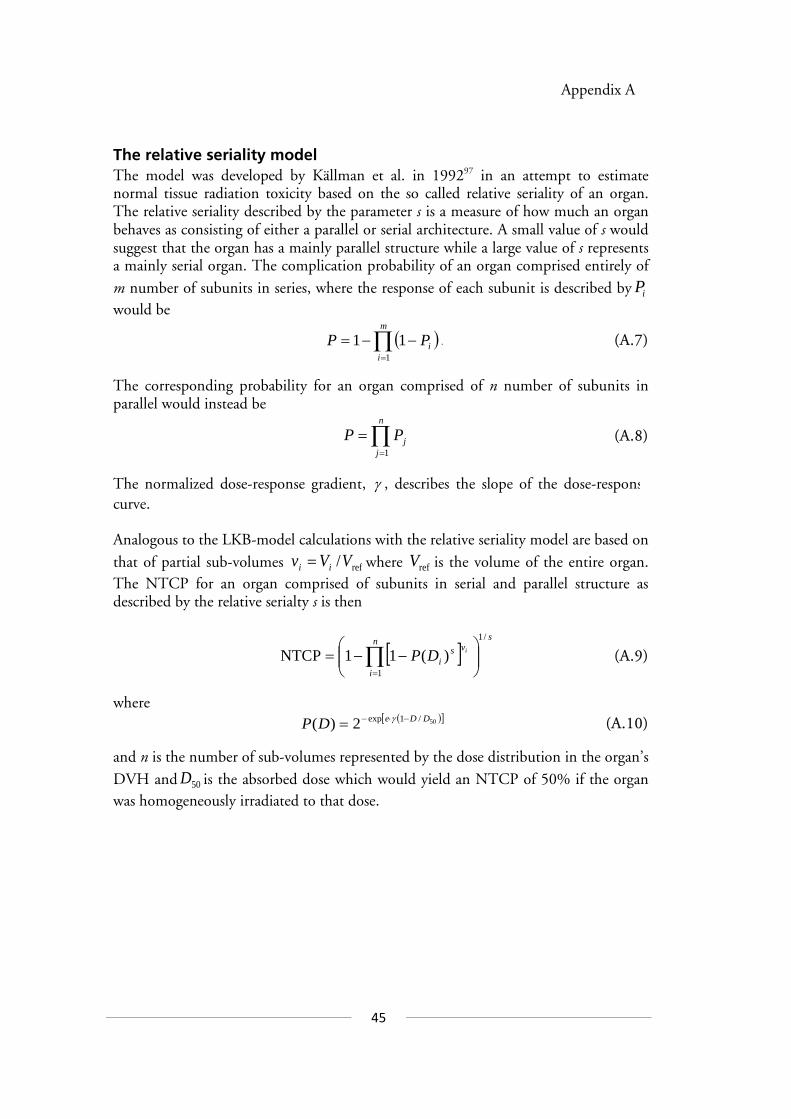
45
0
Appendix A
The relative seriality model The model was developed by Källman et al. in 199297 in an attempt to estimate normal tissue radiation toxicity based on the so called relative seriality of an organ. The relative seriality described by the parameter s is a measure of how much an organ behaves as consisting of either a parallel or serial architecture. A small value of s would suggest that the organ has a mainly parallel structure while a large value of s represents a mainly serial organ. The complication probability of an organ comprised entirely of m number of subunits in series, where the response of each subunit is described by iP would be
( )∏=
−−=m
iiPP
1
11 . (A.7)
The corresponding probability for an organ comprised of n number of subunits in parallel would instead be
∏=
=n
jjPP
1 (A.8)
The normalized dose-response gradient, γ , describes the slope of the dose-response curve. Analogous to the LKB-model calculations with the relative seriality model are based on that of partial sub-volumes ref/VVv ii = where refV is the volume of the entire organ. The NTCP for an organ comprised of subunits in serial and parallel structure as described by the relative serialty s is then
[ ]sn
i
vsi
iDP/1
1
)(11NTCP
−−= ∏
=
(A.9)
where ( )[ ]50/1exp2)( DDeDP −⋅−= γ (A.10)
and n is the number of sub-volumes represented by the dose distribution in the organ’s
DVH and 50D is the absorbed dose which would yield an NTCP of 50% if the organ was homogeneously irradiated to that dose.
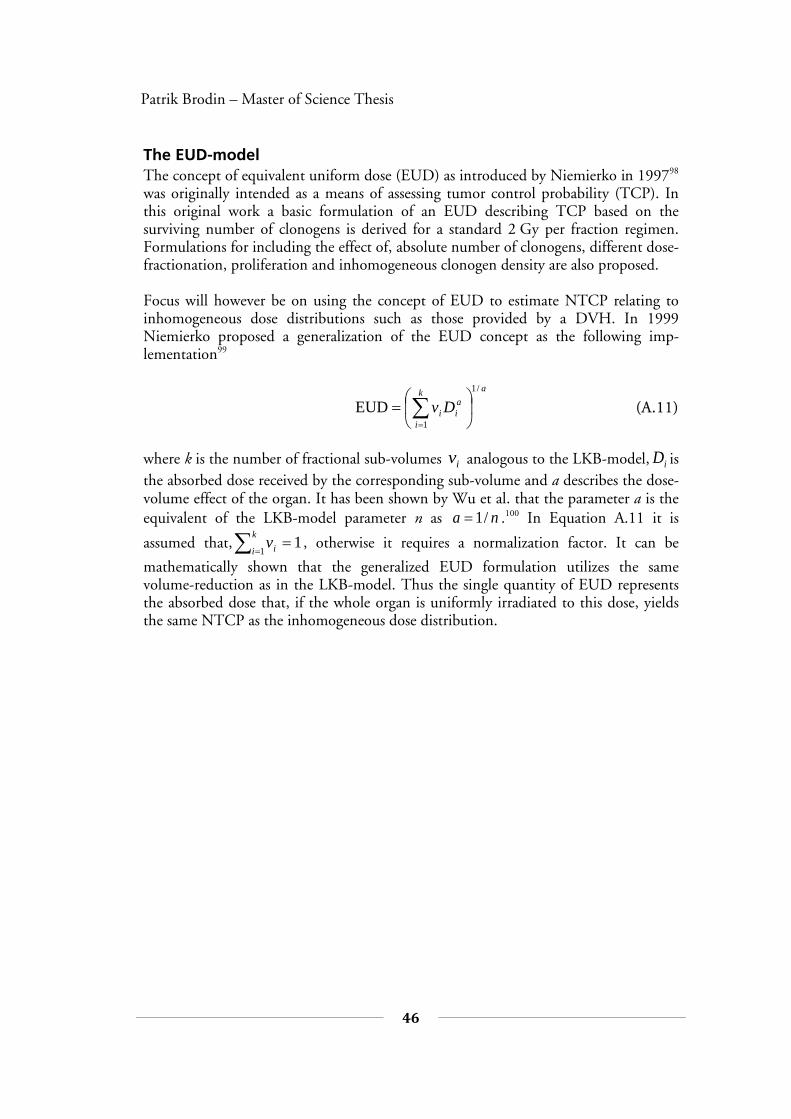
46
Patrik Brodin – Master of Science Thesis
The EUD-model The concept of equivalent uniform dose (EUD) as introduced by Niemierko in 199798 was originally intended as a means of assessing tumor control probability (TCP). In this original work a basic formulation of an EUD describing TCP based on the surviving number of clonogens is derived for a standard 2 Gy per fraction regimen. Formulations for including the effect of, absolute number of clonogens, different dose-fractionation, proliferation and inhomogeneous clonogen density are also proposed. Focus will however be on using the concept of EUD to estimate NTCP relating to inhomogeneous dose distributions such as those provided by a DVH. In 1999 Niemierko proposed a generalization of the EUD concept as the following imp-lementation99
ak
i
aii Dv
/1
1EUD
= ∑
=
(A.11)
where k is the number of fractional sub-volumes iv analogous to the LKB-model, iD is the absorbed dose received by the corresponding sub-volume and a describes the dose-volume effect of the organ. It has been shown by Wu et al. that the parameter a is the equivalent of the LKB-model parameter n as na /1= .100 In Equation A.11 it is
assumed that,∑==
k
i iv1
1 , otherwise it requires a normalization factor. It can be
mathematically shown that the generalized EUD formulation utilizes the same volume-reduction as in the LKB-model. Thus the single quantity of EUD represents the absorbed dose that, if the whole organ is uniformly irradiated to this dose, yields the same NTCP as the inhomogeneous dose distribution.
47
0
Appendix A
There are certain similarities between the EUD- and LKB-models and it has e.g. been shown by Luxton et al. that nvd effrefEUD ⋅= .101 They also showed that it is possible to utilize the EUD concept to reproduce the NTCP-calculations of the LKB-model within 0.3% uncertainty, thus providing an alternative to solving the somewhat inconvenient integral in Equation A.1.
Applicability of NTCP-models The application of NTCP-models in radiotherapy is an appealing concept as this could provide a means of tailoring the treatment regimen of each individual patient, instead of using surrogate information (radiation dose). There is however a need of solid clinical data in order to base patient treatment on such models. Relevant data would be required for each organ and each complication (endpoint) studied. The individual patient characteristics would also have to be considered. Organs and endpoints heavily investigated when it comes to NTCP-modeling are, pneumonitis of the lung, xerostomia of the parotid gland and long-term cardiac mortality due to irradiation of the heart.64, 79, 102 As of today there have been no studies attempting to estimate NTCP specifically in children undergoing radiotherapy. A recent investigation performed by the QUANTEC (Quantitative Analysis of Normal Tissue Effects in the Clinic) group has evaluated the feasibility of using NTCP-models in the clinic.103 Some of the major concerns posted are those of, the uncertainty in applying the linear quadratic (LQ) model to account for different dose fractionation, addressing the organ heterogeneity when basing calculations on DVHs and how to estimate the effect of combined chemo- and radiotherapy.
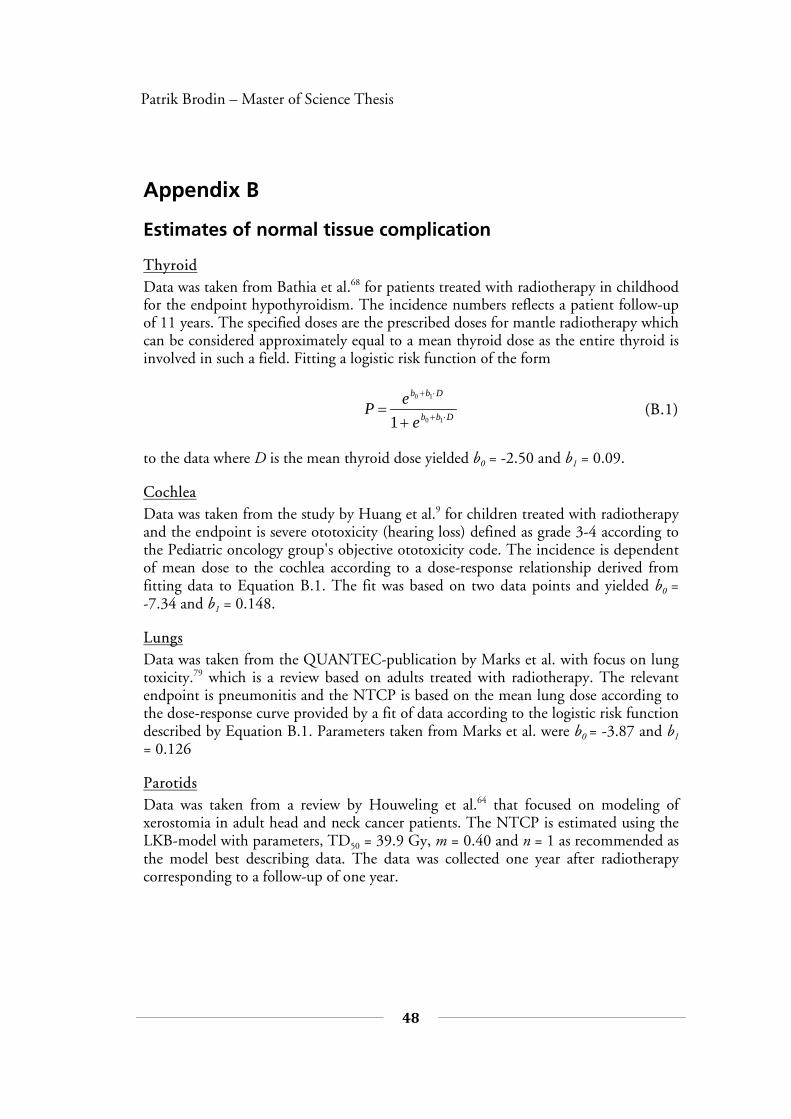
48
Patrik Brodin – Master of Science Thesis
Appendix B
Estimates of normal tissue complication
Thyroid Data was taken from Bathia et al.68 for patients treated with radiotherapy in childhood for the endpoint hypothyroidism. The incidence numbers reflects a patient follow-up of 11 years. The specified doses are the prescribed doses for mantle radiotherapy which can be considered approximately equal to a mean thyroid dose as the entire thyroid is involved in such a field. Fitting a logistic risk function of the form
Dbb
Dbb
eeP
⋅+
⋅+
+=
10
10
1 (B.1)
to the data where D is the mean thyroid dose yielded b0 = -2.50 and b1 = 0.09.
Cochlea Data was taken from the study by Huang et al.9 for children treated with radiotherapy and the endpoint is severe ototoxicity (hearing loss) defined as grade 3-4 according to the Pediatric oncology group's objective ototoxicity code. The incidence is dependent of mean dose to the cochlea according to a dose-response relationship derived from fitting data to Equation B.1. The fit was based on two data points and yielded b0 = -7.34 and b1 = 0.148.
Lungs Data was taken from the QUANTEC-publication by Marks et al. with focus on lung toxicity.79 which is a review based on adults treated with radiotherapy. The relevant endpoint is pneumonitis and the NTCP is based on the mean lung dose according to the dose-response curve provided by a fit of data according to the logistic risk function described by Equation B.1. Parameters taken from Marks et al. were b0 = -3.87 and b1 = 0.126
Parotids Data was taken from a review by Houweling et al.64 that focused on modeling of xerostomia in adult head and neck cancer patients. The NTCP is estimated using the LKB-model with parameters, TD50 = 39.9 Gy, m = 0.40 and n = 1 as recommended as the model best describing data. The data was collected one year after radiotherapy corresponding to a follow-up of one year.
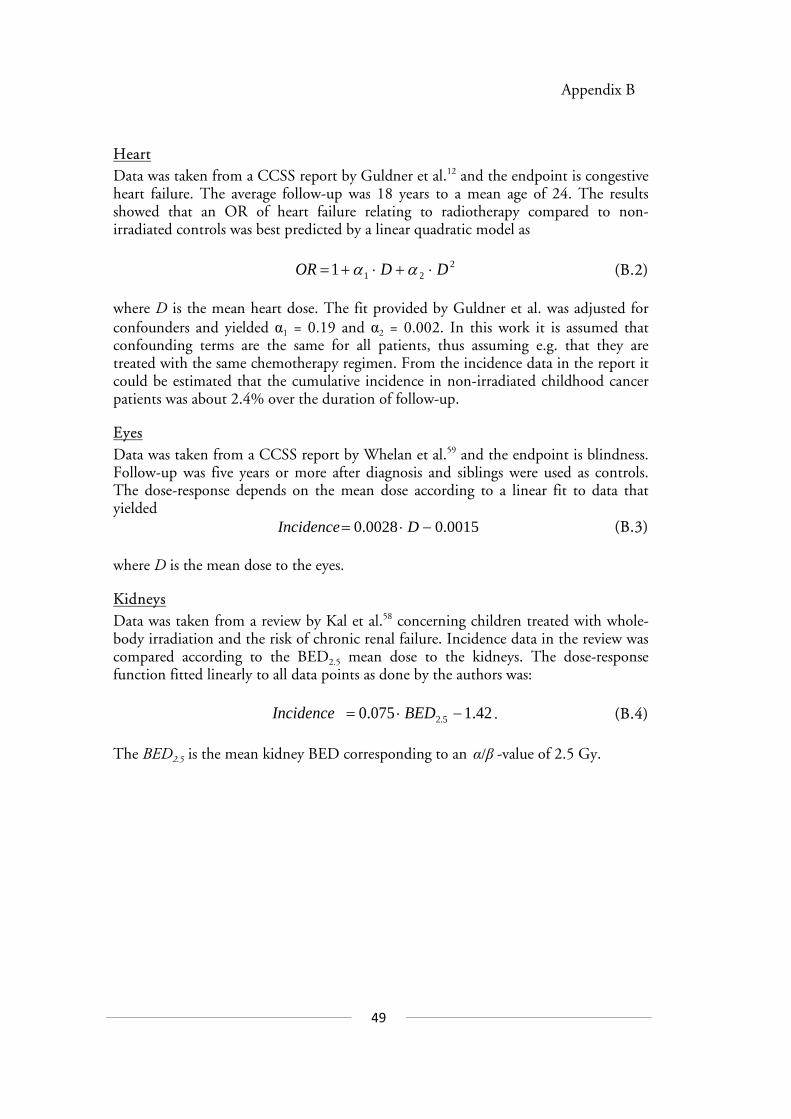
49
0
Appendix B
Heart Data was taken from a CCSS report by Guldner et al.12 and the endpoint is congestive heart failure. The average follow-up was 18 years to a mean age of 24. The results showed that an OR of heart failure relating to radiotherapy compared to non-irradiated controls was best predicted by a linear quadratic model as
2211 DDOR ⋅+⋅+= αα (B.2)
where D is the mean heart dose. The fit provided by Guldner et al. was adjusted for confounders and yielded α1 = 0.19 and α2 = 0.002. In this work it is assumed that confounding terms are the same for all patients, thus assuming e.g. that they are treated with the same chemotherapy regimen. From the incidence data in the report it could be estimated that the cumulative incidence in non-irradiated childhood cancer patients was about 2.4% over the duration of follow-up.
Eyes Data was taken from a CCSS report by Whelan et al.59 and the endpoint is blindness. Follow-up was five years or more after diagnosis and siblings were used as controls. The dose-response depends on the mean dose according to a linear fit to data that yielded
0015.00028.0 −⋅= DIncidence (B.3)
where D is the mean dose to the eyes.
Kidneys Data was taken from a review by Kal et al.58 concerning children treated with whole-body irradiation and the risk of chronic renal failure. Incidence data in the review was compared according to the BED2.5 mean dose to the kidneys. The dose-response function fitted linearly to all data points as done by the authors was:
42.1075.0 5.2 −⋅= BEDIncidence . (B.4) The BED2.5 is the mean kidney BED corresponding to an βα/ -value of 2.5 Gy.
50
Appendix B 0
Reference List
(1) Childhood Cancer Incidence and Survival in Sweden 1984-2005. 2007.
(2) SEER cancer statistics review, 1975-2007, Section 28 Childhood Cancer. 2010.
(3) Steliarova-Foucher E, Stiller C, Kaatsch P, et al. Geographical patterns and time trends of cancer incidence and survival among children and adolescents in Europe since the 1970s (the ACCISproject): an epidemiological study. Lancet 2004 Dec 11;364(9451):2097-105.
(4) Parkin DM, Kramarova E, Draper GJ, et al. International incidence of childhood cancer. Lyon: International Agency for Research on Cancer, 1998.
(5) Kortmann RD, Kuhl J, Timmermann B, et al. Postoperative neoadjuvant chemotherapy before radiotherapy as compared to immediate radiotherapy followed by maintenance chemotherapy in the treatment of medulloblastoma in childhood: results of the German prospective randomized trial HIT '91. Int J Radiat Oncol Biol Phys 2000 Jan 15;46(2):269-79.
(6) Zeltzer PM, Boyett JM, Finlay JL, et al. Metastasis stage, adjuvant treatment, and residual tumor are prognostic factors for medulloblastoma in children: conclusions from the Children's Cancer Group 921 randomized phase III study. J Clin Oncol 1999 Mar;17(3):832-45.
(7) Skowronska-Gardas A. A literature review of the recent radiotherapy clinical trials in pediatric brain tumors. Rev Recent Clin Trials 2009 Jan;4(1):42-55.
(8) Taylor RE, Bailey CC, Robinson K, et al. Results of a randomized study of preradiation chemotherapy versus radiotherapy alone for nonmetastatic medulloblastoma: The International Society of Paediatric Oncology/United Kingdom Children's Cancer Study Group PNET-3 Study. J Clin Oncol 2003 Apr 15;21(8):1581-91.
(9) Huang E, Teh BS, Strother DR, et al. Intensity-modulated radiation therapy for pediatric medulloblastoma: early report on the reduction of ototoxicity. Int J Radiat Oncol Biol Phys 2002 Mar 1;52(3):599-605.
(10) Merchant TE, Hua CH, Shukla H, Ying X, Nill S, Oelfke U. Proton versus photon radiotherapy for common pediatric brain tumors: comparison of models of dose characteristics and their relationship to cognitive function. Pediatr Blood Cancer 2008 Jul;51(1):110-7.
(11) Chow EJ, Friedman DL, Stovall M, et al. Risk of thyroid dysfunction and subsequent thyroid cancer among survivors of acute lymphoblastic leukemia:

51
0
Appendix B
a report from the Childhood Cancer Survivor Study. Pediatr Blood Cancer 2009 Sep;53(3):432-7.
(12) Guldner L, Haddy N, Pein F, et al. Radiation dose and long term risk of cardiac pathology following radiotherapy and anthracyclin for a childhood cancer. Radiother Oncol 2006 Oct;81(1):47-56.
(13) Friedman DL. The Childhood Cancer Survivor Study: an important research initiative for childhood cancer survivors. J Pediatr Oncol Nurs 1999 Jul;16(3):172-5.
(14) Armstrong GT. Long-term survivors of childhood central nervous system malignancies: The experience of the Childhood Cancer Survivor Study. Eur J Paediatr Neurol 2010 Jan 26.
(15) Bassal M, Mertens AC, Taylor L, et al. Risk of selected subsequent carcinomas in survivors of childhood cancer: a report from the Childhood Cancer Survivor Study. J Clin Oncol 2006 Jan 20;24(3):476-83.
(16) Dinu I, Liu Y, Leisenring W, et al. Prediction of second malignant neoplasm incidence in a large cohort of long-term survivors of childhood cancers. Pediatr Blood Cancer 2008 May;50(5):1026-31.
(17) Kenney LB, Yasui Y, Inskip PD, et al. Breast cancer after childhood cancer: a report from the Childhood Cancer Survivor Study. Ann Intern Med 2004 Oct 19;141(8):590-7.
(18) Meadows AT, Friedman DL, Neglia JP, et al. Second neoplasms in survivors of childhood cancer: findings from the Childhood Cancer Survivor Study cohort. J Clin Oncol 2009 May 10;27(14):2356-62.
(19) Neglia JP, Friedman DL, Yasui Y, et al. Second malignant neoplasms in five-year survivors of childhood cancer: childhood cancer survivor study. J Natl Cancer Inst 2001 Apr 18;93(8):618-29.
(20) Olsen JH, Moller T, Anderson H, et al. Lifelong cancer incidence in 47,697 patients treated for childhood cancer in the Nordic countries. J Natl Cancer Inst 2009 Jun 3;101(11):806-13.
(21) Goldstein AM, Yuen J, Tucker MA. Second cancers after medulloblastoma: population-based results from the United States and Sweden. Cancer Causes Control 1997 Nov;8(6):865-71.
(22) Gold DG, Neglia JP, Dusenbery KE. Second neoplasms after megavoltage radiation for pediatric tumors. Cancer 2003 May 15;97(10):2588-96.
(23) Garwicz S, Anderson H, Olsen JH, et al. Second malignant neoplasms after cancer in childhood and adolescence: a population-based case-control study in the 5 Nordic countries. The Nordic Society for Pediatric Hematology and
52
Patrik Brodin – Master of Science Thesis
Oncology. The Association of the Nordic Cancer Registries. Int J Cancer 2000 Nov 15;88(4):672-8.
(24) Travis LB, Hill D, Dores GM, et al. Cumulative absolute breast cancer risk for young women treated for Hodgkin lymphoma. J Natl Cancer Inst 2005 Oct 5;97(19):1428-37.
(25) Fossati P, Ricardi U, Orecchia R. Pediatric medulloblastoma: toxicity of current treatment and potential role of protontherapy. Cancer Treat Rev 2009 Feb;35(1):79-96.
(26) Svahn-Tapper G, Garwicz S, Anderson H, et al. Radiation dose and relapse are predictors for development of second malignant solid tumors after cancer in childhood and adolescence: a population-based case-control study in the five Nordic countries. Acta Oncol 2006;45(4):438-48.
(27) van Leeuwen FE, Travis LB. Second cancers. In: DeVita VT, Hellman S, Rosenberg SA, editors. Cancer: Principles and practice of oncology. 6th ed. Philadelphia: Lippincott Williams & Wilkins; 2001. p. 2939–2964.
(28) Haddy N, Le Deley MC, Samand A, et al. Role of radiotherapy and
chemotherapy in the risk of secondary leukaemia after a solid tumour in childhood. Eur J Cancer 2006 Nov;42(16):2757-64.
(29) Hawkins MM, Wilson LM, Stovall MA, et al. Epipodophyllotoxins, alkylating agents, and radiation and risk of secondary leukaemia after childhood cancer. BMJ 1992 Apr 11;304(6832):951-8.
(30) Particle therapy co-operative group, 2010 March 25 [cited 2010 Jun 6];Available from: URL: http://ptcog.web.psi.ch/ptcentres.html
(31) Brahme A, Roos JE, Lax I. Solution of an integral equation encountered in rotation therapy. Phys Med Biol 1982 Oct;27(10):1221-9.
(32) Chui CS, Chan MF, Yorke E, Spirou S, Ling CC. Delivery of intensity-modulated radiation therapy with a conventional multileaf collimator: comparison of dynamic and segmental methods. Med Phys 2001 Dec;28(12):2441-9.
(33) Hall EJ. Intensity-modulated radiation therapy, protons, and the risk of second cancers. Int J Radiat Oncol Biol Phys 2006 May 1;65(1):1-7.
(34) Kry SF, Salehpour M, Followill DS, et al. The calculated risk of fatal secondary malignancies from intensity-modulated radiation therapy. Int J Radiat Oncol Biol Phys 2005 Jul 15;62(4):1195-203.
(35) Mu X, Bjork-Eriksson T, Nill S, et al. Does electron and proton therapy reduce the risk of radiation induced cancer after spinal irradiation for
53
0
Appendix B
childhood medulloblastoma? A comparative treatment planning study. Acta Oncol 2005;44(6):554-62.
(36) Verellen D, Vanhavere F. Risk assessment of radiation-induced malignancies based on whole-body equivalent dose estimates for IMRT treatment in the head and neck region. Radiother Oncol 1999 Dec;53(3):199-203.
(37) Otto K. Volumetric modulated arc therapy: IMRT in a single gantry arc. Med Phys 2008 Jan;35(1):310-7.
(38) WILSON RR. Radiological use of fast protons. Radiology 1946 Nov;47(5):487-91.
(39) FALKMER S, FORS B, LARSSON B, LINDELL A, NAESLUND J, STENSON S. Pilot study on proton irradiation of human carcinoma. Acta radiol 1962 Feb;58:33-51.
(40) Hall EJ. The impact of protons on the incidence of second malignancies in radiotherapy. Technol Cancer Res Treat 2007 Aug;6(4 Suppl):31-4.
(41) Newhauser WD, Fontenot JD, Mahajan A, et al. The risk of developing a second cancer after receiving craniospinal proton irradiation. Phys Med Biol 2009 Apr 21;54(8):2277-91.
(42) Taddei PJ, Mirkovic D, Fontenot JD, et al. Stray radiation dose and second cancer risk for a pediatric patient receiving craniospinal irradiation with proton beams. Phys Med Biol 2009 Apr 21;54(8):2259-75.
(43) NCRP Report 116. Limitation of exposure to ionizing radiation. Bethesda, MD: National Council on Radiation Protection and Measurements, 1993.
(44) Schneider U, Zwahlen D, Ross D, Kaser-Hotz B. Estimation of radiation-induced cancer from three-dimensional dose distributions: Concept of organ equivalent dose. Int J Radiat Oncol Biol Phys 2005 Apr 1;61(5):1510-5.
(45) Gray LH. In: Cellular radiation biology: A symposium considering radiation effects in the cell and possible implications for cancer therapy. Baltimore: William & Wilkins, 1965. p. 8-25.
(46) UNSCEAR. Report to the General Assembly: Sources and effects of ionizing radiation. Annex I - Epidemiological evaluation of radiation-induced cancer . 2000.
(47) Schneider U, Kaser-Hotz B. Radiation risk estimates after radiotherapy: application of the organ equivalent dose concept to plateau dose-response relationships. Radiat Environ Biophys 2005 Dec;44(3):235-9.
54
Patrik Brodin – Master of Science Thesis
(48) Dasu A, Toma-Dasu I, Olofsson J, Karlsson M. The use of risk estimation models for the induction of secondary cancers following radiotherapy. Acta Oncol 2005;44(4):339-47.
(49) Boice JD, Jr., Blettner M, Kleinerman RA, et al. Radiation dose and leukemia risk in patients treated for cancer of the cervix. J Natl Cancer Inst 1987 Dec;79(6):1295-311.
(50) Mole RH, Papworth DG, Corp MJ. The dose-response for x-ray induction of myeloid leukaemia in male CBA/H mice. Br J Cancer 1983 Feb;47(2):285-91.
(51) Allard A, Haddy N, Le Deley MC, et al. Role of Radiation Dose in the Risk of Secondary Leukemia After a Solid Tumor in Childhood Treated Between 1980 and 1999. Int J Radiat Oncol Biol Phys 2010 Mar 18.
(52) Le Deley MC, Leblanc T, Shamsaldin A, et al. Risk of secondary leukemia after a solid tumor in childhood according to the dose of epipodophyllotoxins and anthracyclines: a case-control study by the Societe Francaise d'Oncologie Pediatrique. J Clin Oncol 2003 Mar 15;21(6):1074-81.
(53) Gajjar A, Chintagumpala M, Ashley D, et al. Risk-adapted craniospinal radiotherapy followed by high-dose chemotherapy and stem-cell rescue in children with newly diagnosed medulloblastoma (St Jude Medulloblastoma-96): long-term results from a prospective, multicentre trial. Lancet Oncol 2006 Oct;7(10):813-20.
(54) Lannering B., Strömberg B., Wesenberg F. Medulloblastoma - 5 year treatment results in a Scandinavian multicentre study. 2004.
(55) Trotti A, Byhardt R, Stetz J, et al. Common toxicity criteria: version 2.0. an improved reference for grading the acute effects of cancer treatment: impact on radiotherapy. Int J Radiat Oncol Biol Phys 2000 Apr 1;47(1):13-47.
(56) Lannering B. Personal Communication. 2010.
(57) Chang EL, Allen P, Wu C, Ater J, Kuttesch J, Maor MH. Acute toxicity and treatment interruption related to electron and photon craniospinal irradiation in pediatric patients treated at the University of Texas M. D. Anderson Cancer Center. 2002 Mar 15;52(4):1008-16.
(58) Kal HB, VAN Kempen-Harteveld ML. Induction of severe cataract and late renal dysfunction following total body irradiation: dose-effect relationships. Anticancer Res 2009 Aug;29(8):3305-9.
55
0
Appendix B
(59) Whelan KF, Stratton K, Kawashima T, et al. Ocular late effects in childhood and adolescent cancer survivors: a report from the childhood cancer survivor study. Pediatr Blood Cancer 2010 Jan;54(1):103-9.
(60) Gagliardi G, Lax I, Ottolenghi A, Rutqvist LE. Long-term cardiac mortality after radiotherapy of breast cancer--application of the relative seriality model. Br J Radiol 1996 Sep;69(825):839-46.
(61) Dawson LA, Ten Haken RK. Partial volume tolerance of the liver to radiation. 2005 Oct;15(4):279-83.
(62) Xu ZY, Liang SX, Zhu J, et al. Prediction of radiation-induced liver disease by Lyman normal-tissue complication probability model in three-dimensional conformal radiation therapy for primary liver carcinoma. 2006 May 1;65(1):189-95.
(63) Goldsby RE, Liu Q, Nathan PC, et al. Late-occurring neurologic sequelae in adult survivors of childhood acute lymphoblastic leukemia: a report from the Childhood Cancer Survivor Study. 2010 Jan 10;28(2):324-31.
(64) Houweling AC, Philippens ME, Dijkema T, et al. A Comparison of Dose-response Models for the Parotid Gland in a Large Group of Head-and-neck Cancer Patients. Int J Radiat Oncol Biol Phys 2009 Dec 10.
(65) Roesink JM, Moerland MA, Battermann JJ, Hordijk GJ, Terhaard CH. Quantitative dose-volume response analysis of changes in parotid gland function after radiotherapy in the head-and-neck region. Int J Radiat Oncol Biol Phys 2001 Nov 15;51(4):938-46.
(66) Bussels B, Maes A, Flamen P, et al. Dose-response relationships within the parotid gland after radiotherapy for head and neck cancer. Radiother Oncol 2004 Dec;73(3):297-306.
(67) Ricardi U, Corrias A, Einaudi S, et al. Thyroid dysfunction as a late effect in childhood medulloblastoma: a comparison of hyperfractionated versus conventionally fractionated craniospinal radiotherapy. Int J Radiat Oncol Biol Phys 2001 Aug 1;50(5):1287-94.
(68) Bhatia S, Ramsay NK, Bantle JP, Mertens A, Robison LL. Thyroid Abnormalities after Therapy for Hodgkin's Disease in Childhood. Oncologist 1996;1(1 & 2):62-7.
(69) Xu W, Janss A, Packer RJ, Phillips P, Goldwein J, Moshang T, Jr. Endocrine outcome in children with medulloblastoma treated with 18 Gy of craniospinal radiation therapy. Neuro Oncol 2004 Apr;6(2):113-8.
(70) Rose SR, Danish RK, Kearney NS, et al. ACTH deficiency in childhood cancer survivors. Pediatr Blood Cancer 2005 Nov;45(6):808-13.
56
Patrik Brodin – Master of Science Thesis
(71) Green DM, Kawashima T, Stovall M, et al. Fertility of male survivors of childhood cancer: a report from the Childhood Cancer Survivor Study. 2010 Jan 10;28(2):332-9.
(72) Green DM, Kawashima T, Stovall M, et al. Fertility of female survivors of childhood cancer: a report from the childhood cancer survivor study. 2009 Jun 1;27(16):2677-85.
(73) Chiarelli AM, Marrett LD, Darlington G. Early menopause and infertility in females after treatment for childhood cancer diagnosed in 1964-1988 in Ontario, Canada. 1999 Aug 1;150(3):245-54.
(74) Société Française de Radiothérapie Oncologique. Guide des procedures de radiotherapie externe 2007. 2008.
(75) Esiashvili N, Chiang KY, Hasselle MD, Bryant C, Riffenburgh RH, Paulino AC. Renal toxicity in children undergoing total body irradiation for bone marrow transplant. 2009 Feb;90(2):242-6.
(76) Attard-Montalto SP, Kingston JE, Eden OB, Plowman PN. Late follow-up of lung function after whole lung irradiation for Wilms' tumour. Br J Radiol 1992 Dec;65(780):1114-8.
(77) Bossi G, Cerveri I, Volpini E, et al. Long-term pulmonary sequelae after treatment of childhood Hodgkin's disease. Ann Oncol 1997;8 Suppl 1:19-24.
(78) Weiner DJ, Maity A, Carlson CA, Ginsberg JP. Pulmonary function abnormalities in children treated with whole lung irradiation. Pediatr Blood Cancer 2006 Feb;46(2):222-7.
(79) Marks LB, Bentzen SM, Deasy JO, et al. Radiation dose-volume effects in the lung. Int J Radiat Oncol Biol Phys 2010 Mar 1;76(3 Suppl):S70-S76.
(80) Miettinen S, Laurikainen E, Johansson R, Minn H, Laurell G, Salmi TT. Radiotherapy enhanced ototoxicity of cisplatin in children. Acta Otolaryngol Suppl 1997;529:90-4.
(81) Murdoch-Kinch CA, Kim HM, Vineberg KA, Ship JA, Eisbruch A. Dose-effect relationships for the submandibular salivary glands and implications for their sparing by intensity modulated radiotherapy. Int J Radiat Oncol Biol Phys 2008 Oct 1;72(2):373-82.
(82) Ahn SJ, Kahn D, Zhou S, et al. Dosimetric and clinical predictors for radiation-induced esophageal injury. 2005 Feb 1;61(2):335-47.
57
0
Appendix B
(83) Rancati T, Fiorino C, Sanguineti G. NTCP modeling of subacute/late laryngeal edema scored by fiberoptic examination. 2009 Nov 1;75(3):915-23.
(84) Eifel PJ, Donaldson SS, Thomas PR. Response of growing bone to irradiation: a proposed late effects scoring system. Int J Radiat Oncol Biol Phys 1995 Mar 30;31(5):1301-7.
(85) Schneider U, Walsh L. Cancer risk estimates from the combined Japanese A-bomb and Hodgkin cohorts for doses relevant to radiotherapy. Radiat Environ Biophys 2008 Apr;47(2):253-63.
(86) Schneider U, Lomax A, Timmermann B. Second cancers in children treated with modern radiotherapy techniques. Radiother Oncol 2008 Nov;89(2):135-40.
(87) Kellerer AM, Nekolla EA, Walsh L. On the conversion of solid cancer excess relative risk into lifetime attributable risk. Radiat Environ Biophys 2001 Dec;40(4):249-57.
(88) Cristy M. Active bone marrow distribution as a function of age in humans. Phys Med Biol 1981 May;26(3):389-400.
(89) Deasy JO, Blanco AI, Clark VH. CERR: a computational environment for radiotherapy research. Med Phys 2003 May;30(5):979-85.
(90) Chaturvedi AK, Engels EA, Gilbert ES, et al. Second cancers among 104,760 survivors of cervical cancer: evaluation of long-term risk. J Natl Cancer Inst 2007 Nov 7;99(21):1634-43.
(91) O'Brien MM, Donaldson SS, Balise RR, Whittemore AS, Link MP. Second malignant neoplasms in survivors of pediatric Hodgkin's lymphoma treated with low-dose radiation and chemotherapy. J Clin Oncol 2010 Mar 1;28(7):1232-9.
(92) Ng AK, Kenney LB, Gilbert ES, Travis LB. Secondary malignancies across the age spectrum. Semin Radiat Oncol 2010 Jan;20(1):67-78.
(93) Emami B, Lyman J, Brown A, et al. Tolerance of normal tissue to therapeutic irradiation. Int J Radiat Oncol Biol Phys 1991 May 15;21(1):109-22.
(94) Burman C, Kutcher GJ, Emami B, Goitein M. Fitting of normal tissue tolerance data to an analytic function. Int J Radiat Oncol Biol Phys 1991 May 15;21(1):123-35.
(95) Lyman JT. Complication probability as assessed from dose-volume histograms. Radiat Res Suppl 1985;8:S13-S19.
58
Patrik Brodin – Master of Science Thesis
(96) Kutcher GJ, Burman C. Calculation of complication probability factors for non-uniform normal tissue irradiation: the effective volume method. Int J Radiat Oncol Biol Phys 1989 Jun;16(6):1623-30.
(97) Kallman P, Agren A, Brahme A. Tumour and normal tissue responses to fractionated non-uniform dose delivery. Int J Radiat Biol 1992 Aug;62(2):249-62.
(98) Niemierko A. Reporting and analyzing dose distributions: a concept of equivalent uniform dose. Med Phys 1997 Jan;24(1):103-10.
(99) Niemierko A. A generalized concept of equivalent uniform dose (EUD). 1999. p. 1100.
(100) Wu Q, Mohan R, Niemierko A, Schmidt-Ullrich R. Optimization of intensity-modulated radiotherapy plans based on the equivalent uniform dose. Int J Radiat Oncol Biol Phys 2002 Jan 1;52(1):224-35.
(101) Luxton G, Keall PJ, King CR. A new formula for normal tissue complication probability (NTCP) as a function of equivalent uniform dose (EUD). Phys Med Biol 2008 Jan 7;53(1):23-36.
(102) Gagliardi G, Constine LS, Moiseenko V, et al. Radiation dose-volume effects in the heart. Int J Radiat Oncol Biol Phys 2010 Mar 1;76(3 Suppl):S77-S85.
(103) Marks LB, Yorke ED, Jackson A, et al. Use of normal tissue complication probability models in the clinic. Int J Radiat Oncol Biol Phys 2010 Mar 1;76(3 Suppl):S10-S19.