Embed Size (px)
Citation preview
1
Track-Structure Based Radiobiological
Modeling for Estimating
Radiation Quality
C-K Chris Wang, Ph.D., P.E.
Professor
Nuclear & Radiological Engineering &
Medical Physics Program
Woodruff School of Mechanical Engineering
Georgia Institute of Technology
April 19, 2013 - Savannah River Chapter of the HPS
2
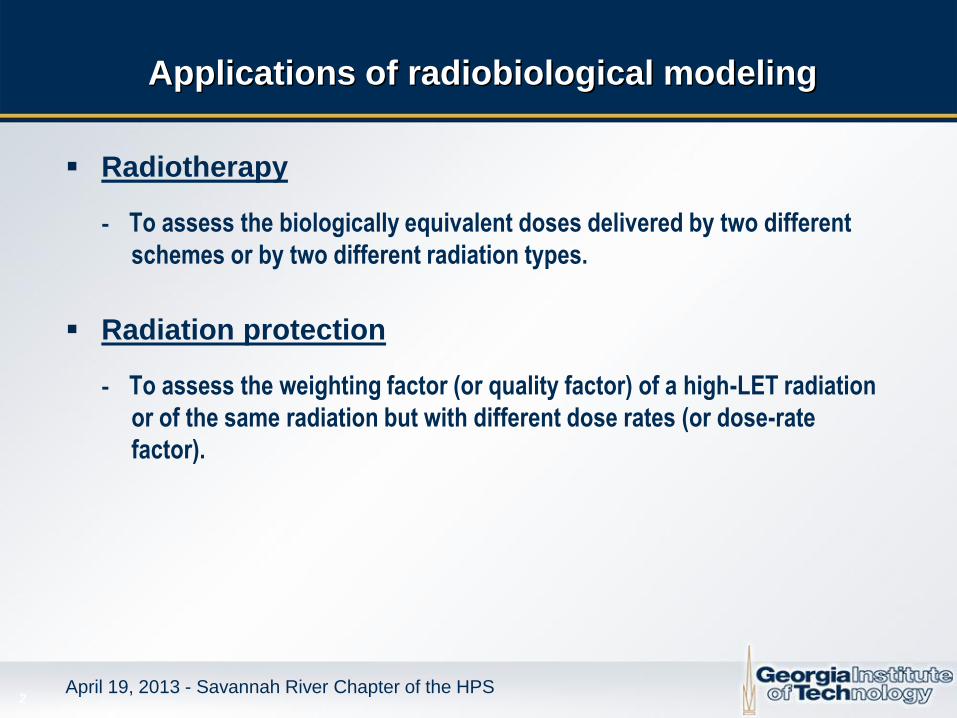
Applications of radiobiological modeling
Radiotherapy
- To assess the biologically equivalent doses delivered by two different
schemes or by two different radiation types.
Radiation protection
- To assess the weighting factor (or quality factor) of a high-LET radiation
or of the same radiation but with different dose rates (or dose-rate
factor).
April 19, 2013 - Savannah River Chapter of the HPS
3
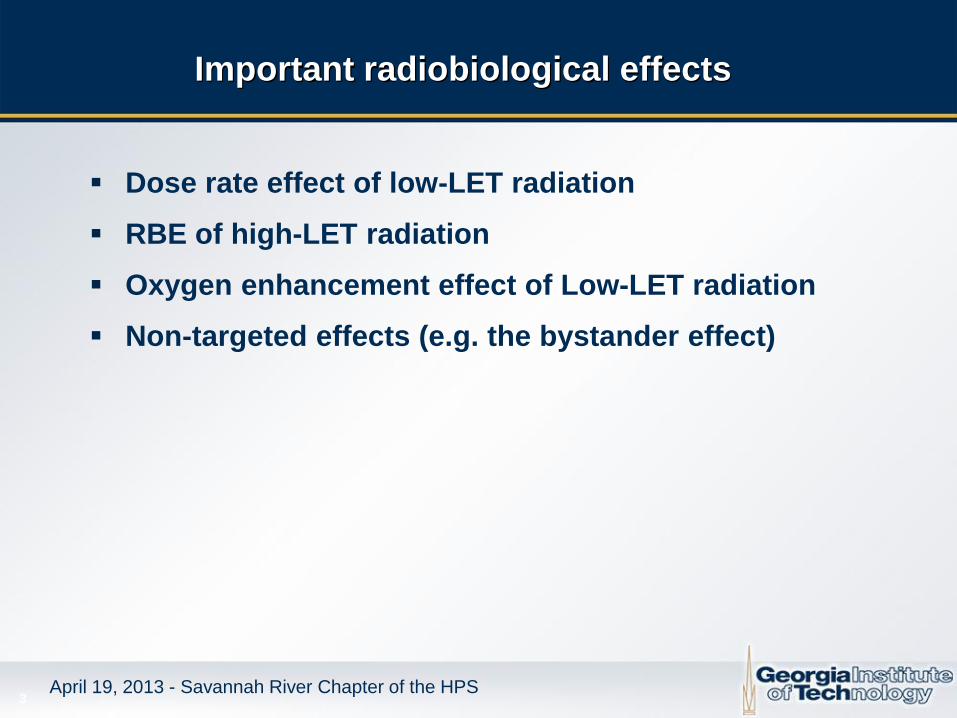
Important radiobiological effects
Dose rate effect of low-LET radiation
RBE of high-LET radiation
Oxygen enhancement effect of Low-LET radiation
Non-targeted effects (e.g. the bystander effect)
April 19, 2013 - Savannah River Chapter of the HPS
4
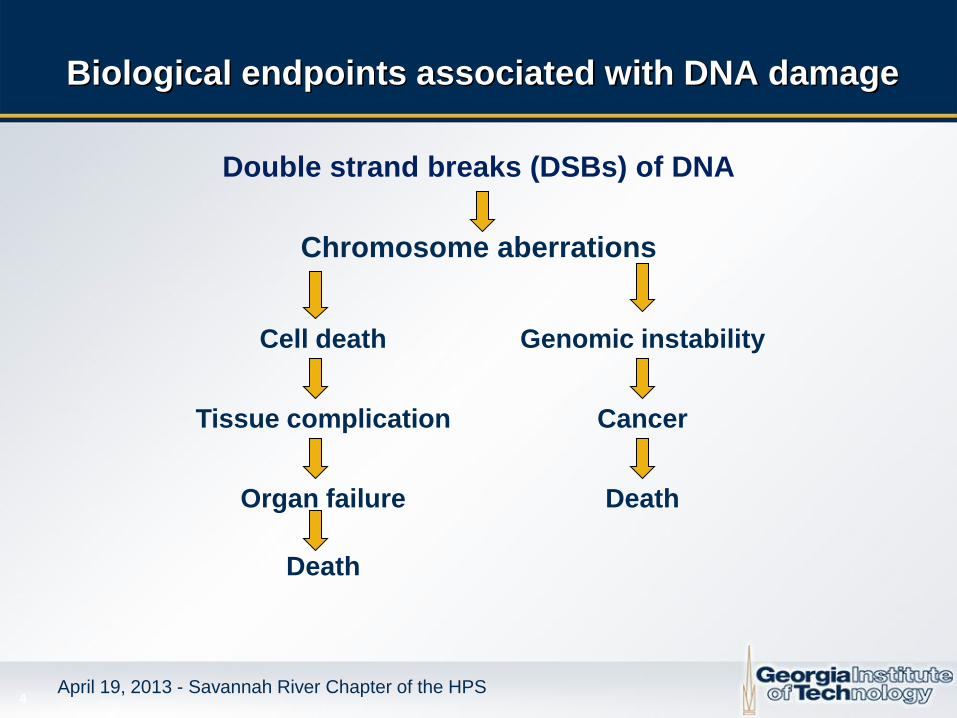
Biological endpoints associated with DNA damage
Double strand breaks (DSBs) of DNA
Chromosome aberrations
Cell death
Tissue complication
Organ failure
Death
Genomic instability
Cancer
Death
April 19, 2013 - Savannah River Chapter of the HPS
5
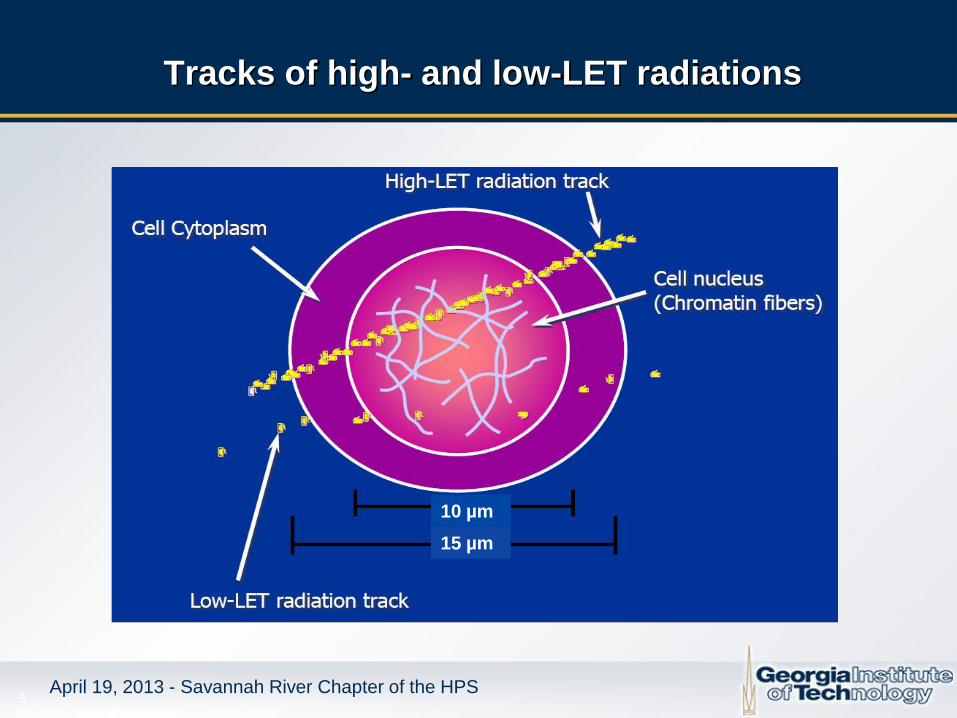
Tracks of high- and low-LET radiations
April 19, 2013 - Savannah River Chapter of the HPS
10 µm
15 µm
6
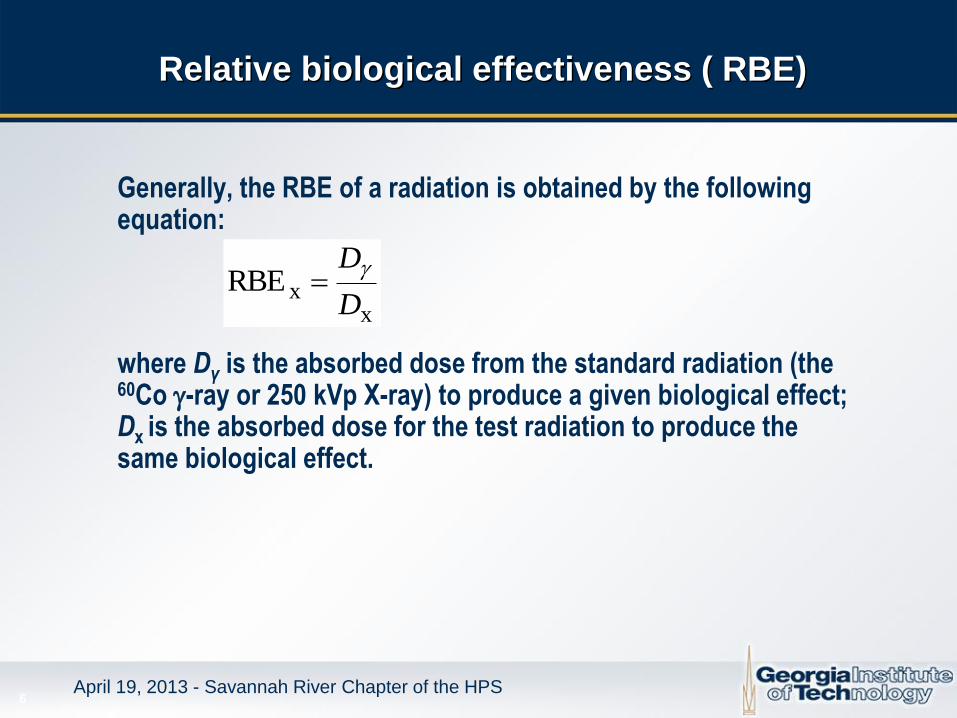
Relative biological effectiveness ( RBE)
Generally, the RBE of a radiation is obtained by the following equation:
where Dγ is the absorbed dose from the standard radiation (the 60Co -ray or 250 kVp X-ray) to produce a given biological effect; Dx is the absorbed dose for the test radiation to produce the same biological effect.
xxRBE
D
D
April 19, 2013 - Savannah River Chapter of the HPS
7
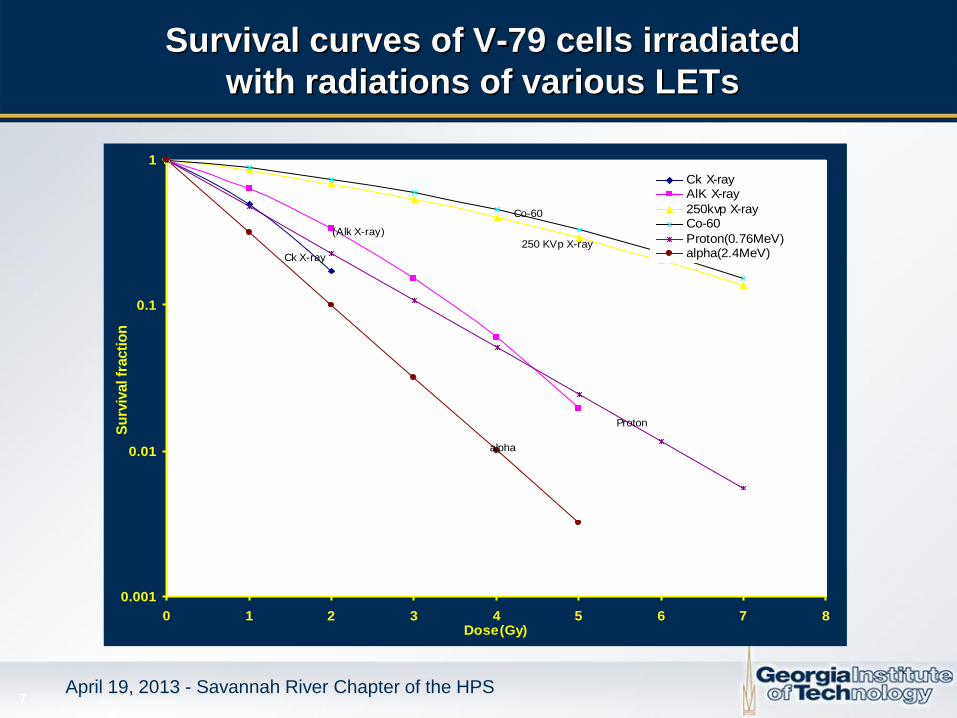
Survival curves of V-79 cells irradiated
with radiations of various LETs
0.001
0.01
0.1
1
0 1 2 3 4 5 6 7 8Dose(Gy)
Su
rviv
al fr
acti
on
Ck X-rayAlK X-ray
250kvp X-rayCo-60
Proton(0.76MeV)alpha(2.4MeV)Ck X-ray
alpha
(Alk X-ray)
Proton
250 KVp X-ray
Co-60
April 19, 2013 - Savannah River Chapter of the HPS
8
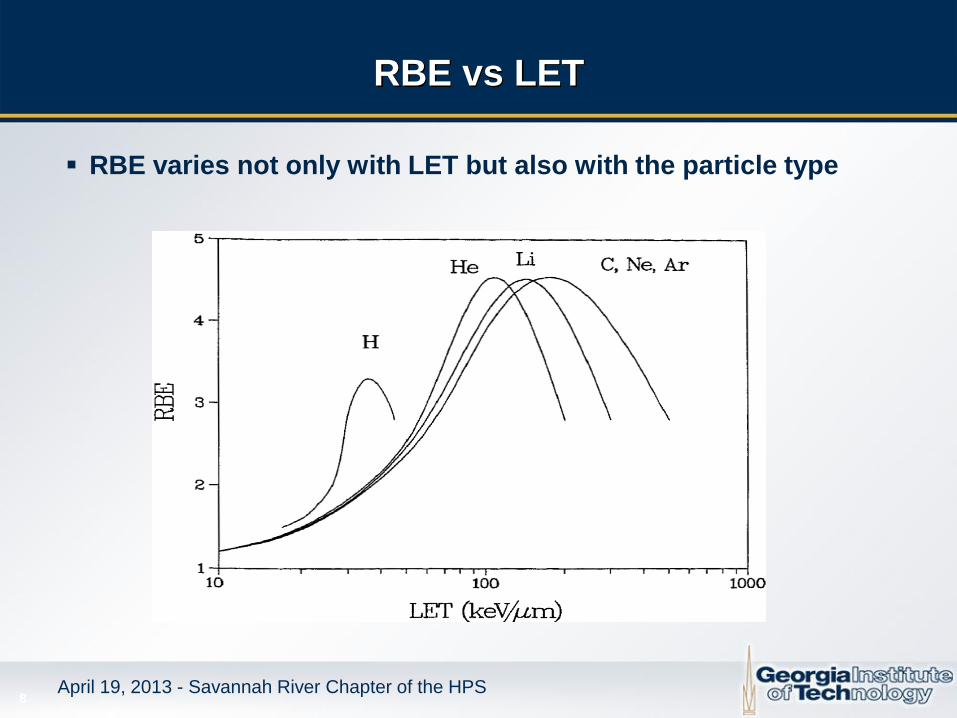
RBE vs LET
April 19, 2013 - Savannah River Chapter of the HPS
RBE varies not only with LET but also with the particle type
9
Models describing the shape of cell survival curves
April 19, 2013 - Savannah River Chapter of the HPS
Single-target model (1940’s)
Multi-target model (1950’s)
Linear-quadratic model (1960’s)
10
The single-target model (used in the early years and is considered obsolete today)
April 19, 2013 - Savannah River Chapter of the HPS
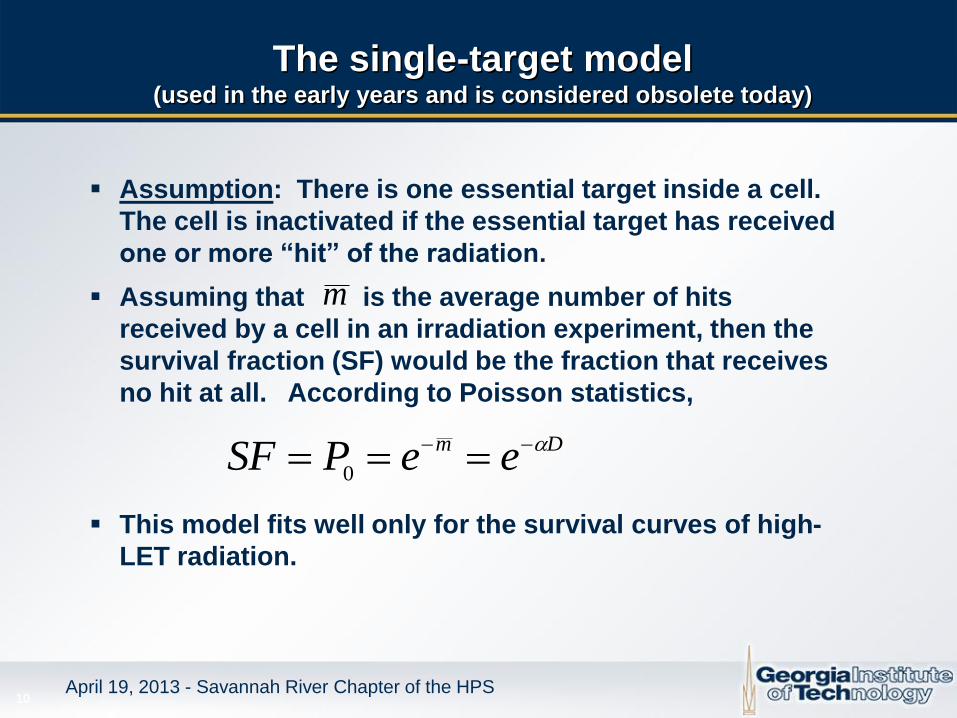
Assumption: There is one essential target inside a cell.
The cell is inactivated if the essential target has received
one or more “hit” of the radiation.
Assuming that is the average number of hits
received by a cell in an irradiation experiment, then the
survival fraction (SF) would be the fraction that receives
no hit at all. According to Poisson statistics,
This model fits well only for the survival curves of high-
LET radiation.
m
Dm eePSF 0
11
The multi-target model (widely used in the early years and still has some merit today)
April 19, 2013 - Savannah River Chapter of the HPS
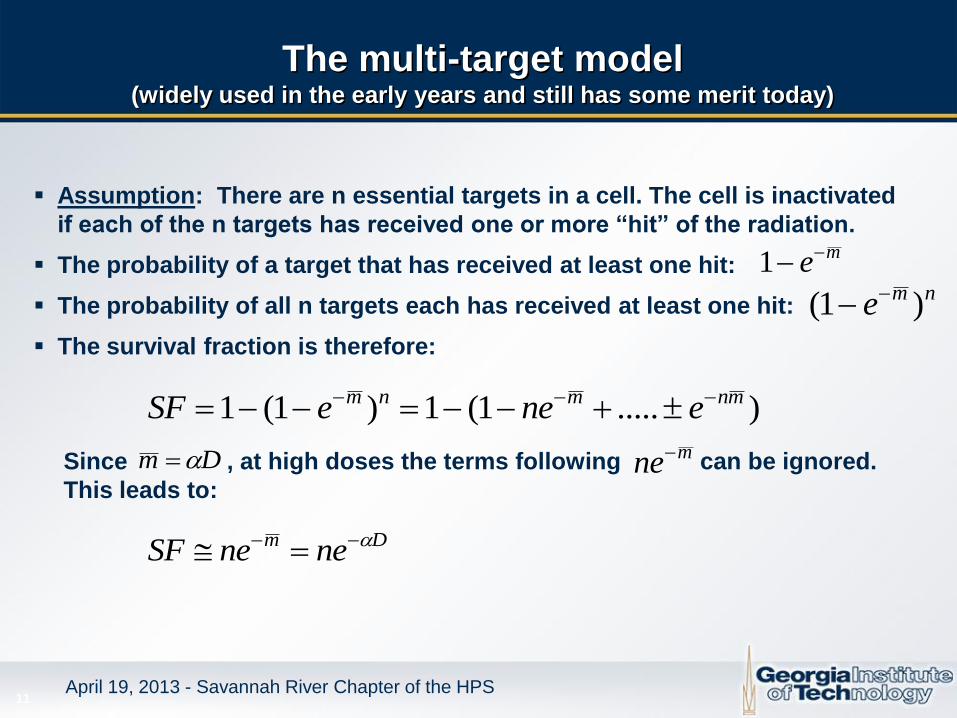
Assumption: There are n essential targets in a cell. The cell is inactivated
if each of the n targets has received one or more “hit” of the radiation.
The probability of a target that has received at least one hit:
The probability of all n targets each has received at least one hit:
The survival fraction is therefore:
Since , at high doses the terms following can be ignored.
This leads to:
me1nme )1(
).....1(1)1(1 mnmnm eneeSF
Dm mne
Dm neneSF
12
The multi-target model (widely used in the early years and still has some merit today)
April 19, 2013 - Savannah River Chapter of the HPS
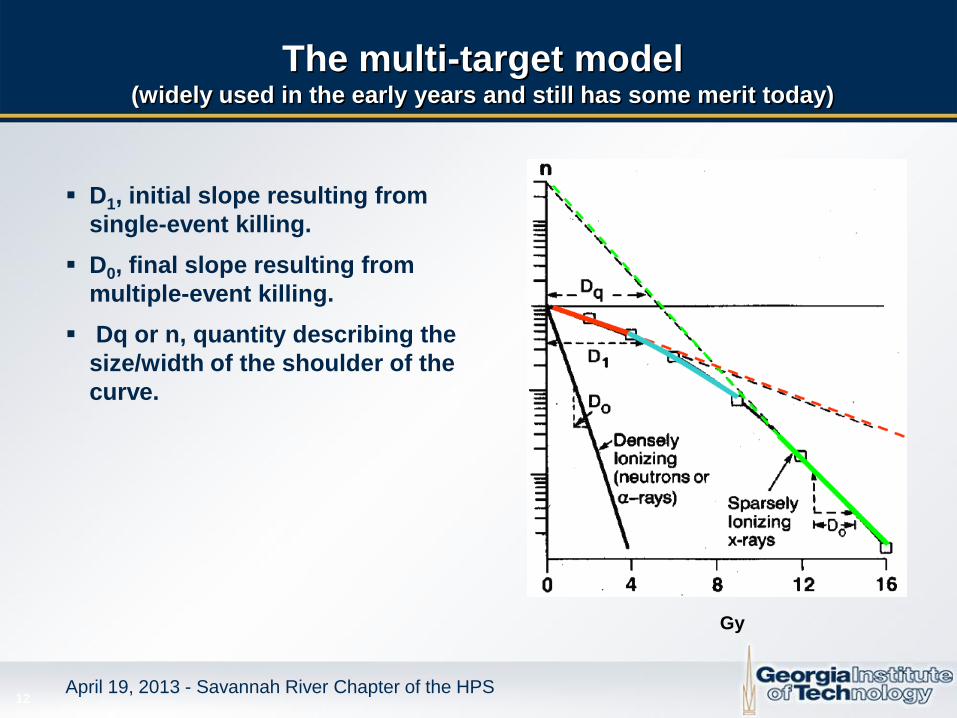
Gy
D1, initial slope resulting from
single-event killing.
D0, final slope resulting from
multiple-event killing.
Dq or n, quantity describing the
size/width of the shoulder of the
curve.
13
The linear-quadratic model (Current model of choice to describe cell survival curves)
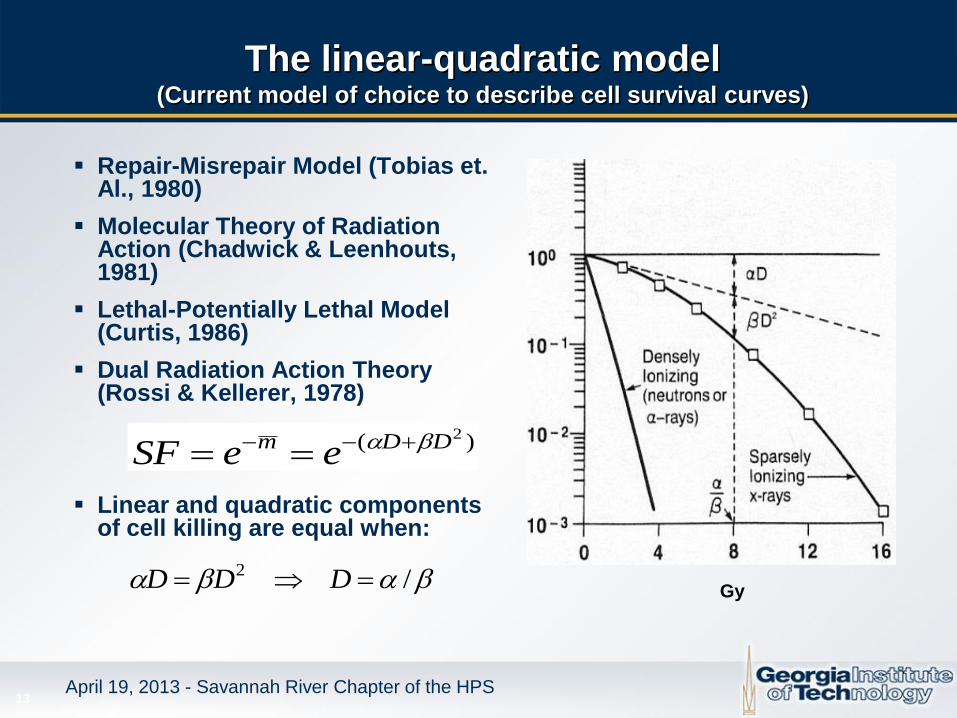
Repair-Misrepair Model (Tobias et. Al., 1980)
Molecular Theory of Radiation Action (Chadwick & Leenhouts, 1981)
Lethal-Potentially Lethal Model (Curtis, 1986)
Dual Radiation Action Theory (Rossi & Kellerer, 1978)
Linear and quadratic components of cell killing are equal when:
)( 2DDm eeSF
April 19, 2013 - Savannah River Chapter of the HPS
Gy / 2 DDD
14
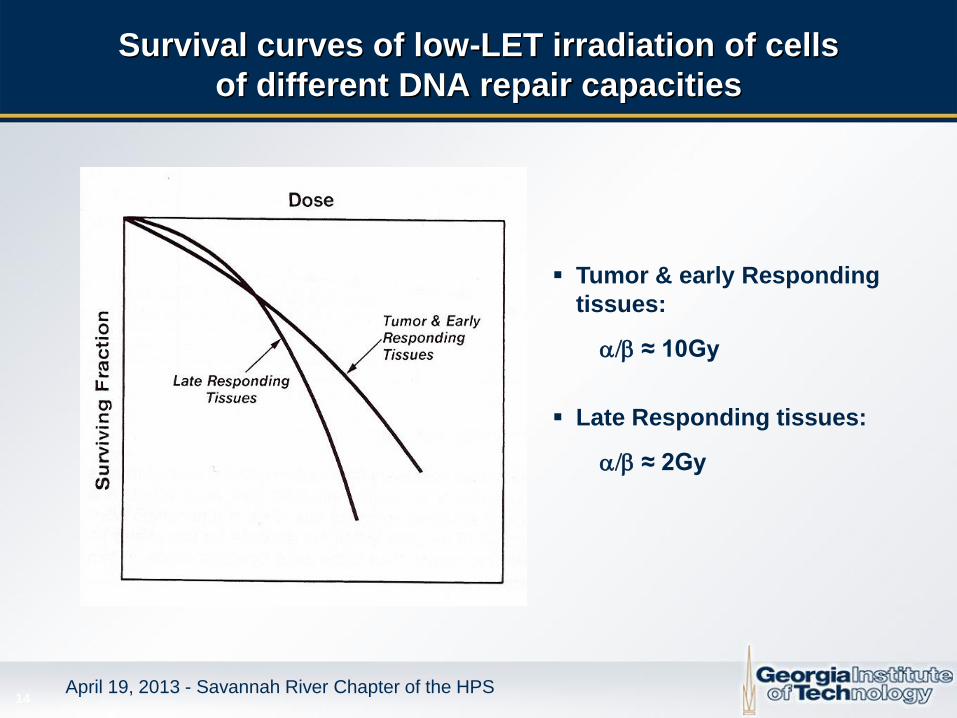
Survival curves of low-LET irradiation of cells
of different DNA repair capacities
April 19, 2013 - Savannah River Chapter of the HPS
Tumor & early Responding
tissues:
/ ≈ 10Gy
Late Responding tissues:
/ ≈ 2Gy
15
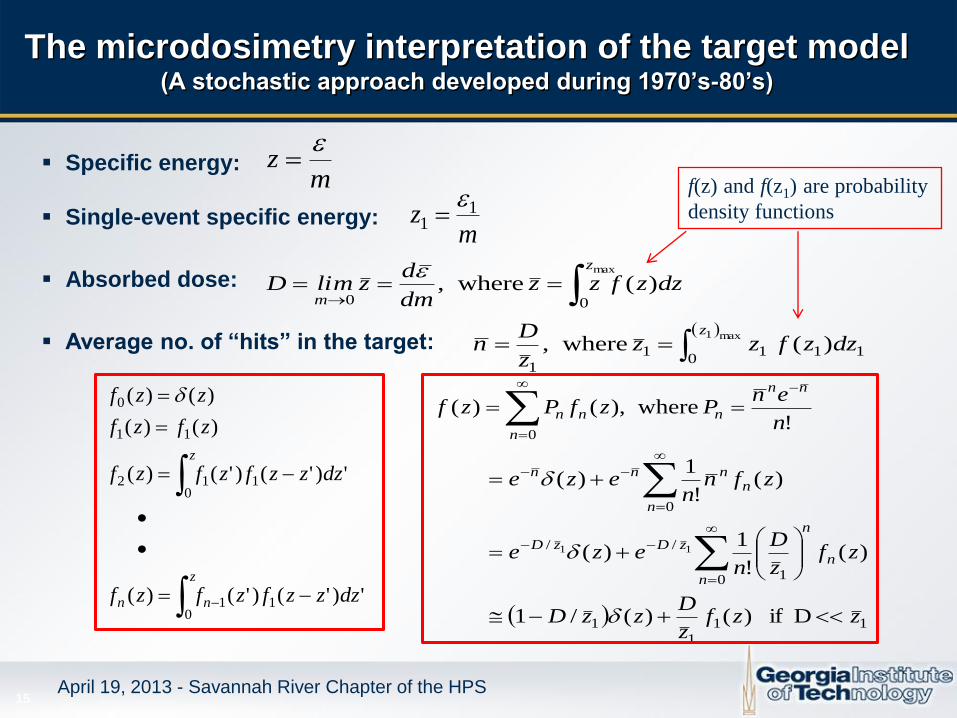
The microdosimetry interpretation of the target model (A stochastic approach developed during 1970’s-80’s)
April 19, 2013 - Savannah River Chapter of the HPS
Specific energy:
Single-event specific energy:
Absorbed dose:
Average no. of “hits” in the target:
mz
mz 1
1
max
00)( where,
z
mdzzfzz
dm
dzlimD
10
111
1
)( where,max1
dzzfzzz
Dn
z
')'()'()(
')'()'()(
)()(
)()(
10
1
10
12
11
0
dzzzfzfzf
dzzzfzfzf
zfzf
zzf
z
nn
z
11
1
1
0 1
//
0
0
Dif )()(/1
)(!
1)(
)(!
1)(
! where,)()(
11
zzfz
DzzD
zfz
D
neze
zfnn
eze
n
enPzfPzf
n
n
n
zDzD
n
nnnn
nn
n
n
nn
f(z) and f(z1) are probability
density functions
16
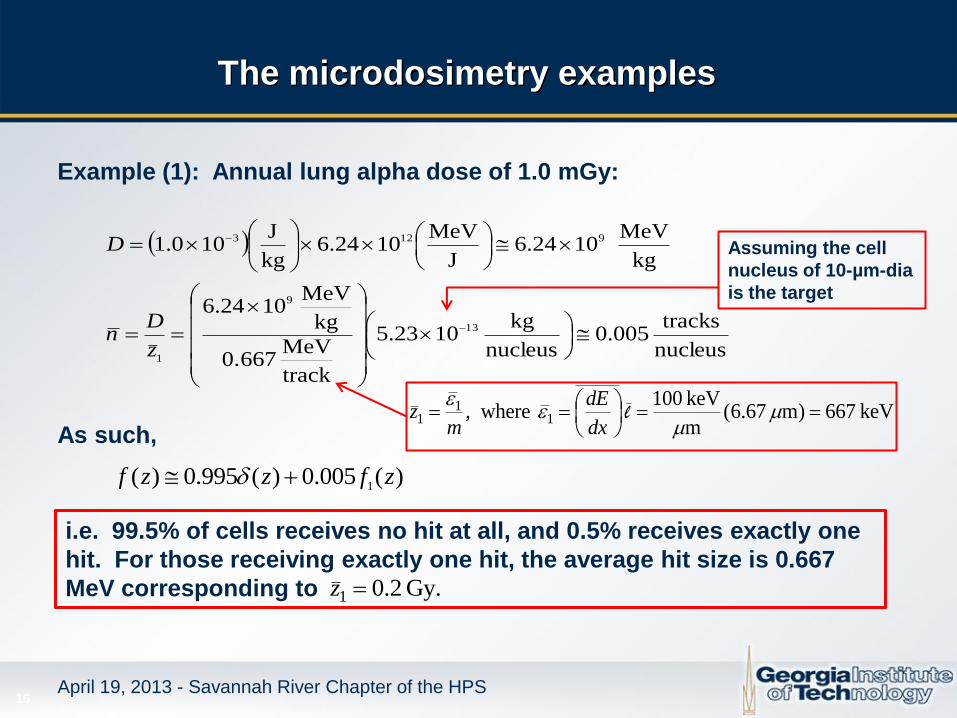
The microdosimetry examples
April 19, 2013 - Savannah River Chapter of the HPS
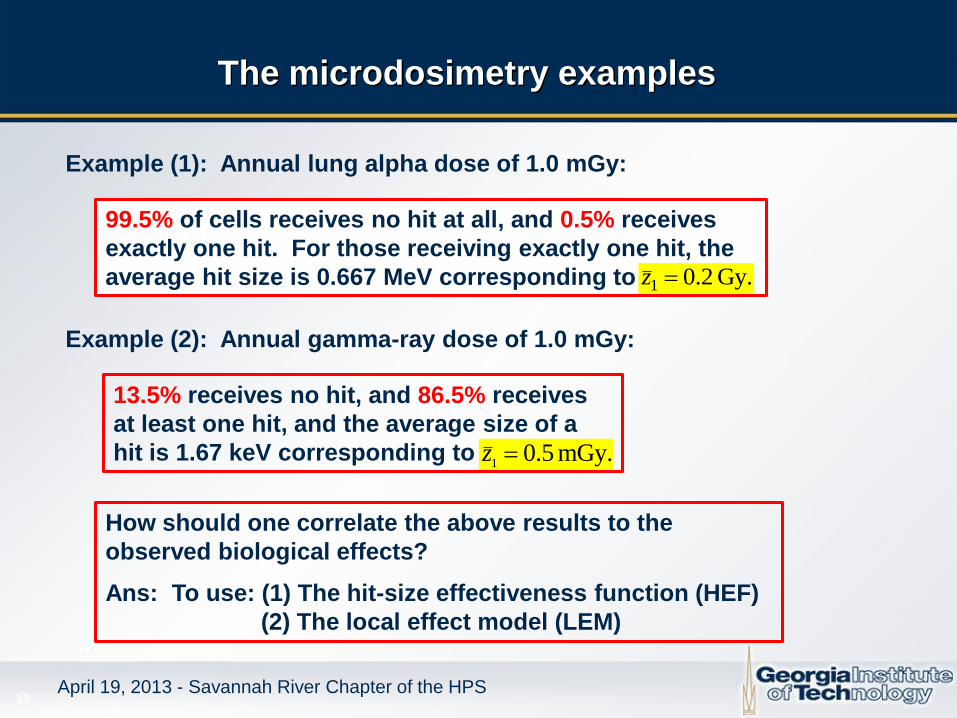
Example (1): Annual lung alpha dose of 1.0 mGy:
nucleus
tracks 005.0
nucleus
kg 1023.5
track
MeV 0.667
kg
MeV 1024.6
kg
MeV 1024.6
J
MeV1024.6
kg
J100.1
13
9
1
9123
z
Dn
D
As such,
)(005.0)(995.0)(1
zfzzf
i.e. 99.5% of cells receives no hit at all, and 0.5% receives exactly one
hit. For those receiving exactly one hit, the average hit size is 0.667
MeV corresponding to Gy. 2.01 z
keV 667)m 67.6(m
keV 100 where, 1
11
l
dx
dE
mz
Assuming the cell
nucleus of 10-µm-dia
is the target
17
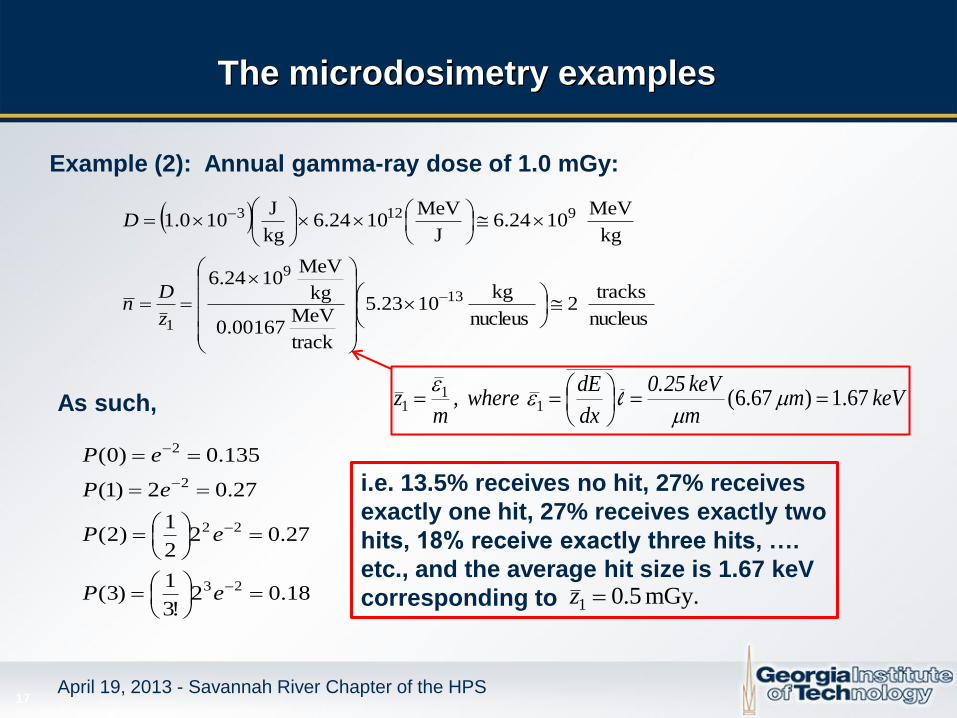
The microdosimetry examples
April 19, 2013 - Savannah River Chapter of the HPS
Example (2): Annual gamma-ray dose of 1.0 mGy:
nucleus
tracks 2
nucleus
kg 1023.5
track
MeV 0.00167
kg
MeV 1024.6
kg
MeV 1024.6
J
MeV1024.6
kg
J100.1
13
9
1
9123
z
Dn
D
As such,
18.02!3
1)3(
27.022
1)2(
27.02)1(
135.0)0(
23
22
2
2
eP
eP
eP
eP
mGy. 5.01 z
i.e. 13.5% receives no hit, 27% receives
exactly one hit, 27% receives exactly two
hits, 18% receive exactly three hits, ….
etc., and the average hit size is 1.67 keV
corresponding to
keV m m
keV 0.25
dx
dE where,
mz 67.1)67.6(1
11
l
18
The microdosimetry examples
April 19, 2013 - Savannah River Chapter of the HPS
Example (1): Annual lung alpha dose of 1.0 mGy:
mGy. 5.01
z
13.5% receives no hit, and 86.5% receives
at least one hit, and the average size of a
hit is 1.67 keV corresponding to
Example (2): Annual gamma-ray dose of 1.0 mGy:
99.5% of cells receives no hit at all, and 0.5% receives
exactly one hit. For those receiving exactly one hit, the
average hit size is 0.667 MeV corresponding to Gy. 2.01 z
How should one correlate the above results to the
observed biological effects?
Ans: To use: (1) The hit-size effectiveness function (HEF)
(2) The local effect model (LEM)
19
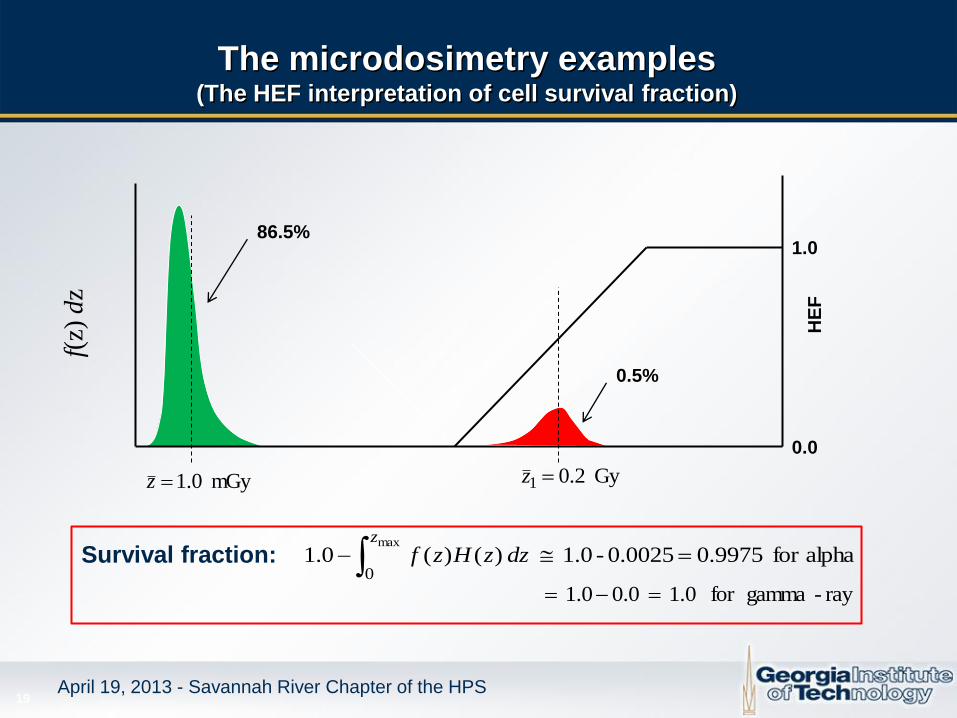
The microdosimetry examples (The HEF interpretation of cell survival fraction)
April 19, 2013 - Savannah River Chapter of the HPS
86.5%
0.5%
f(z)
dz
mGy 0.1z Gy 2.01 z
1.0
0.0
HE
F
alphafor 0.99750.0025-1.0 )()(0.1max
0
z
dzzHzfSurvival fraction:
ray-gammafor 0.1 0.00.1
20
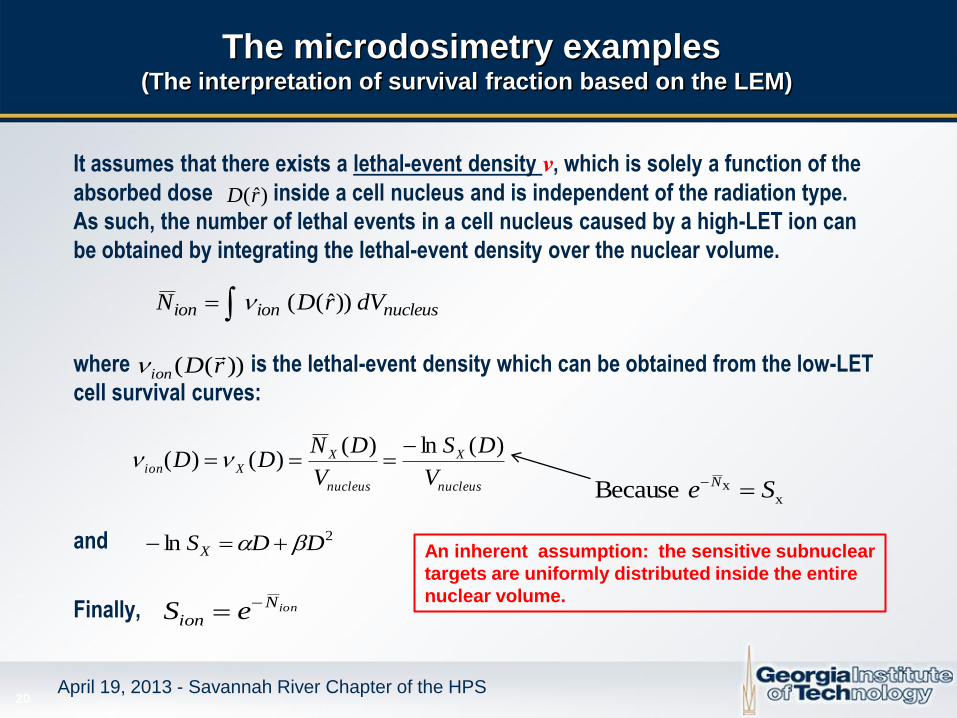
The microdosimetry examples (The interpretation of survival fraction based on the LEM)
It assumes that there exists a lethal-event density ν, which is solely a function of the
absorbed dose inside a cell nucleus and is independent of the radiation type.
As such, the number of lethal events in a cell nucleus caused by a high-LET ion can
be obtained by integrating the lethal-event density over the nuclear volume.
where is the lethal-event density which can be obtained from the low-LET
cell survival curves:
and
Finally,
April 19, 2013 - Savannah River Chapter of the HPS
nucleusionion dVrDN ))ˆ((
nucleus
X
nucleus
XXion
V
DS
V
DNDD
)(ln)()()(
))(( rDion
xx Because Se
N
2ln DDSX
)ˆ(rD
ionNion eS
An inherent assumption: the sensitive subnuclear
targets are uniformly distributed inside the entire
nuclear volume.
21
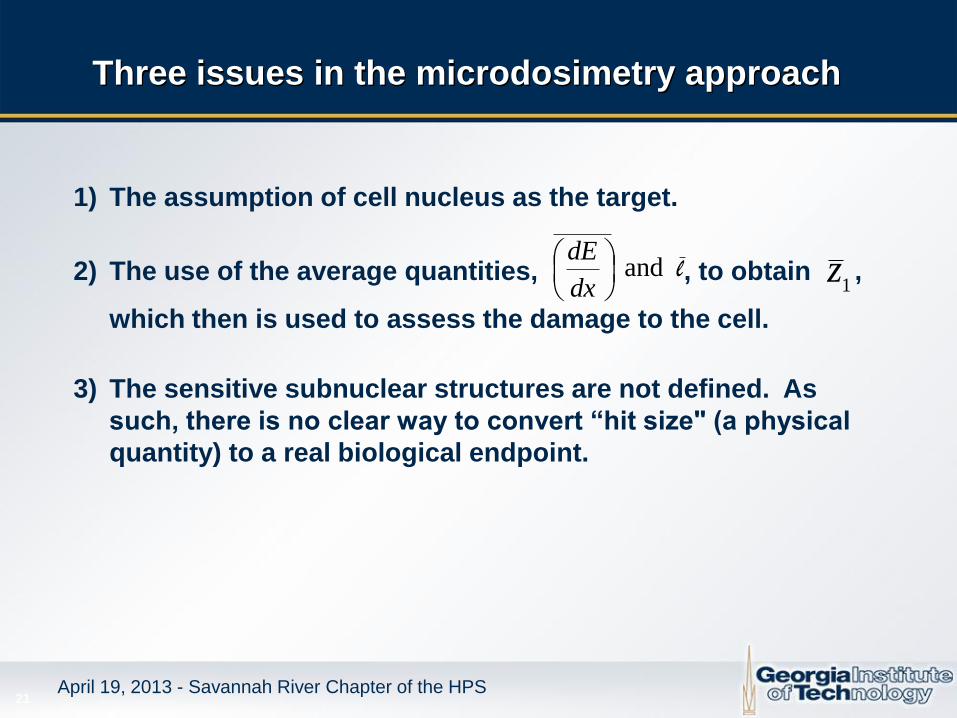
Three issues in the microdosimetry approach
April 19, 2013 - Savannah River Chapter of the HPS
1) The assumption of cell nucleus as the target.
2) The use of the average quantities, , to obtain ,
which then is used to assess the damage to the cell.
3) The sensitive subnuclear structures are not defined. As
such, there is no clear way to convert “hit size" (a physical
quantity) to a real biological endpoint.
and l
dx
dE
1z
22
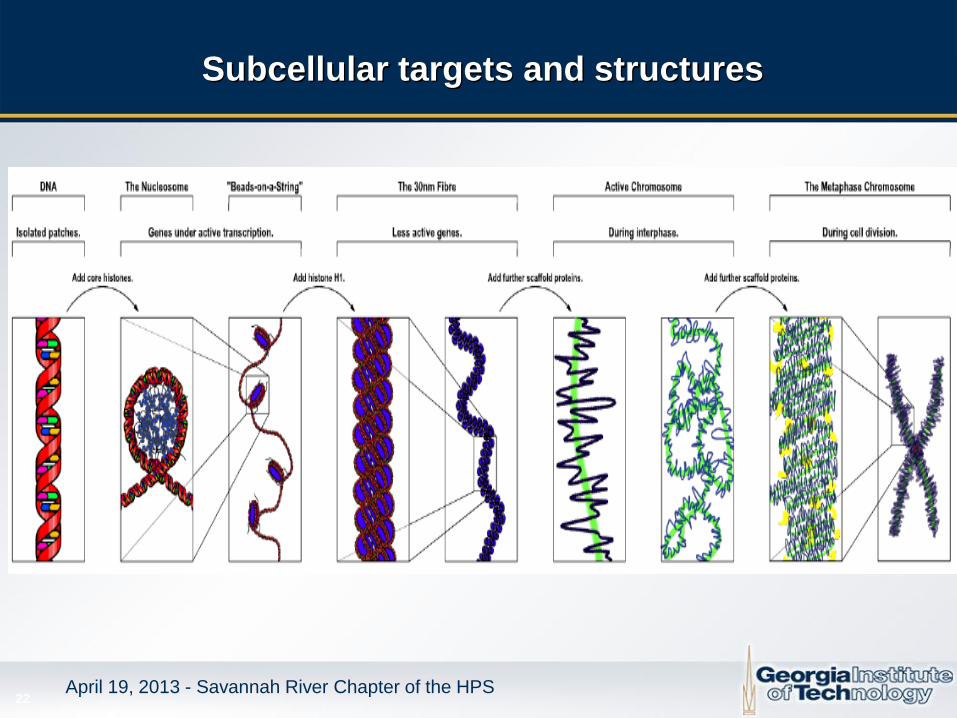
Subcellular targets and structures
April 19, 2013 - Savannah River Chapter of the HPS
23
Relevant radiation signatures (Characteristics of DNA damage as a function of LET)
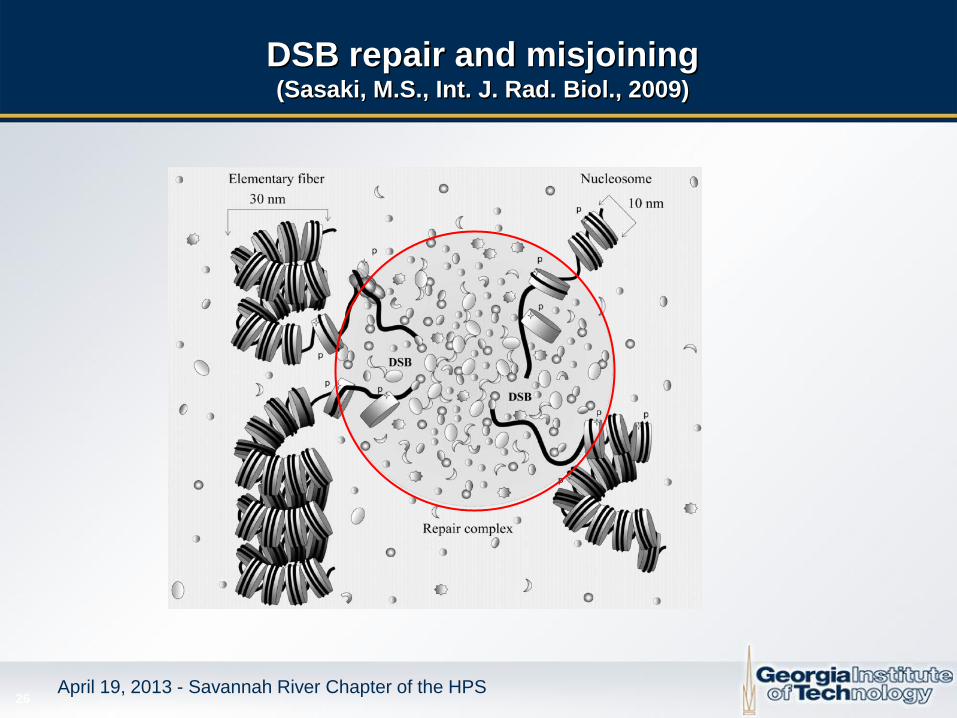
The total yield of DSBs (including both sDSB and cDSB) per unit dose does not vary greatly over a wide range of LET. The yield of cDSB per unit dose, however, proportionally increases with LET.
A mammalian cell’s ability to repair a DSB becomes increasingly inhibited as the complexity of a DSB increases.
The high yield of short (kilobase-sized) DNA fragments is a trait of high-LET radiation.
LET-dependence is found for the yield ratio of intra-arm to inter-arm chromosomal changes (interstitial deletions/centric rings = G-ratio) and for the yield ratio of intra-arm to interchromosomal exchanges (interstitial deletions/dicentrics = H-ratio).
April 19, 2013 - Savannah River Chapter of the HPS
24
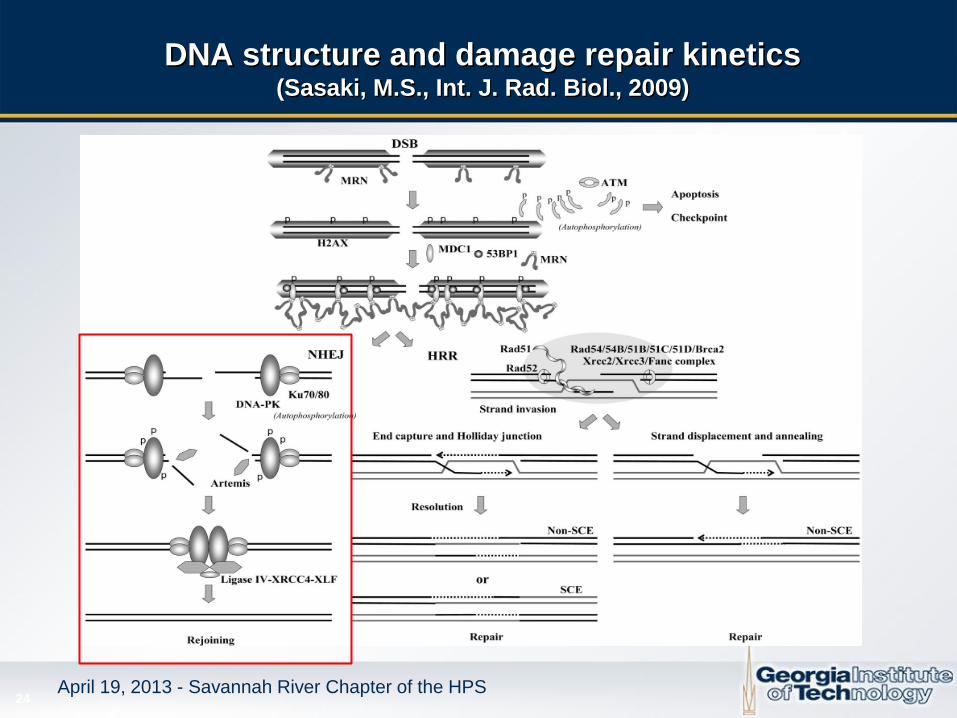
DNA structure and damage repair kinetics (Sasaki, M.S., Int. J. Rad. Biol., 2009)
April 19, 2013 - Savannah River Chapter of the HPS
25
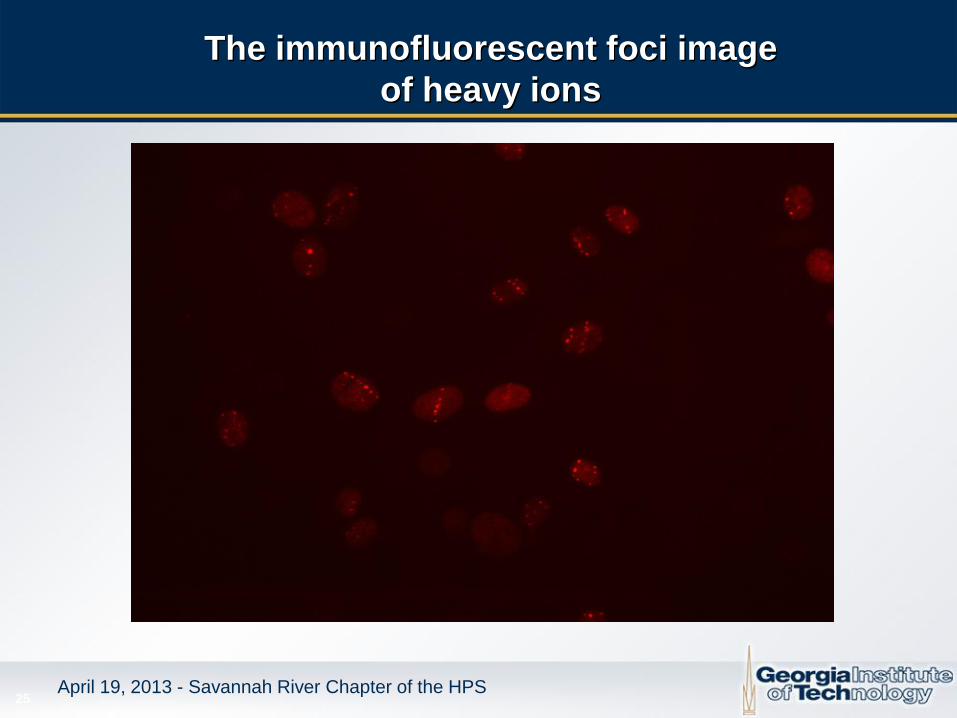
The immunofluorescent foci image
of heavy ions
April 19, 2013 - Savannah River Chapter of the HPS
26
DSB repair and misjoining (Sasaki, M.S., Int. J. Rad. Biol., 2009)
April 19, 2013 - Savannah River Chapter of the HPS
27
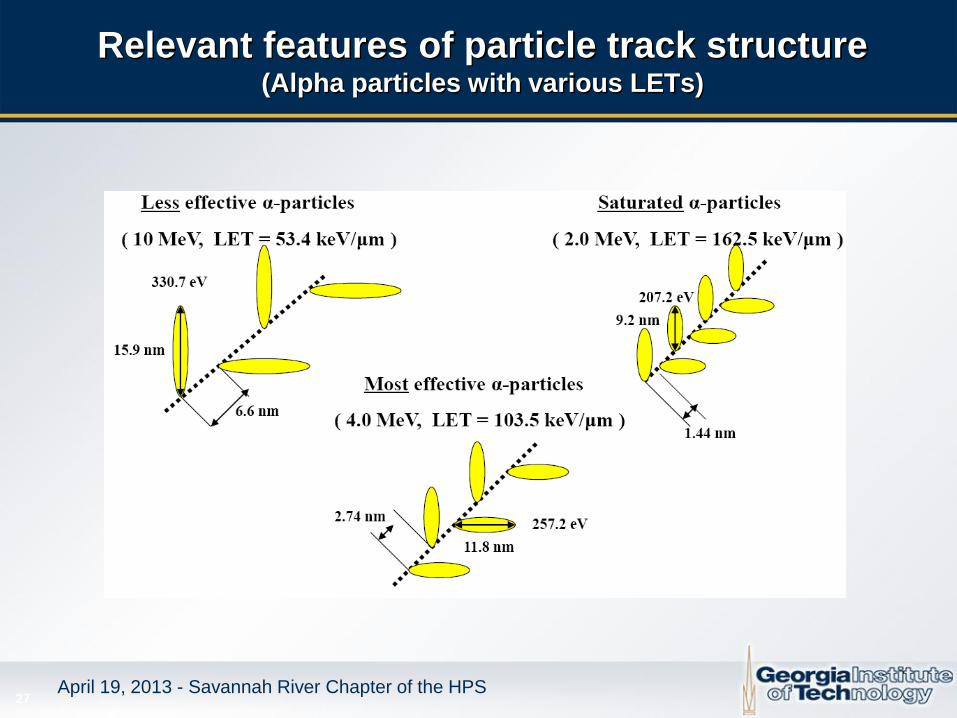
Relevant features of particle track structure (Alpha particles with various LETs)
April 19, 2013 - Savannah River Chapter of the HPS
28
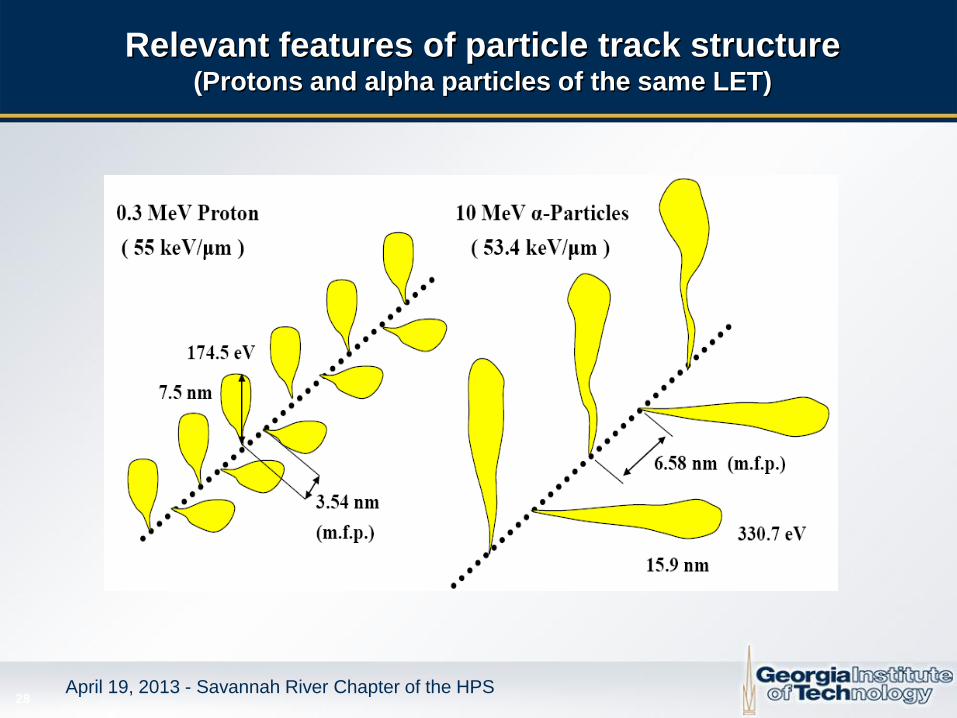
Relevant features of particle track structure (Protons and alpha particles of the same LET)
April 19, 2013 - Savannah River Chapter of the HPS
29
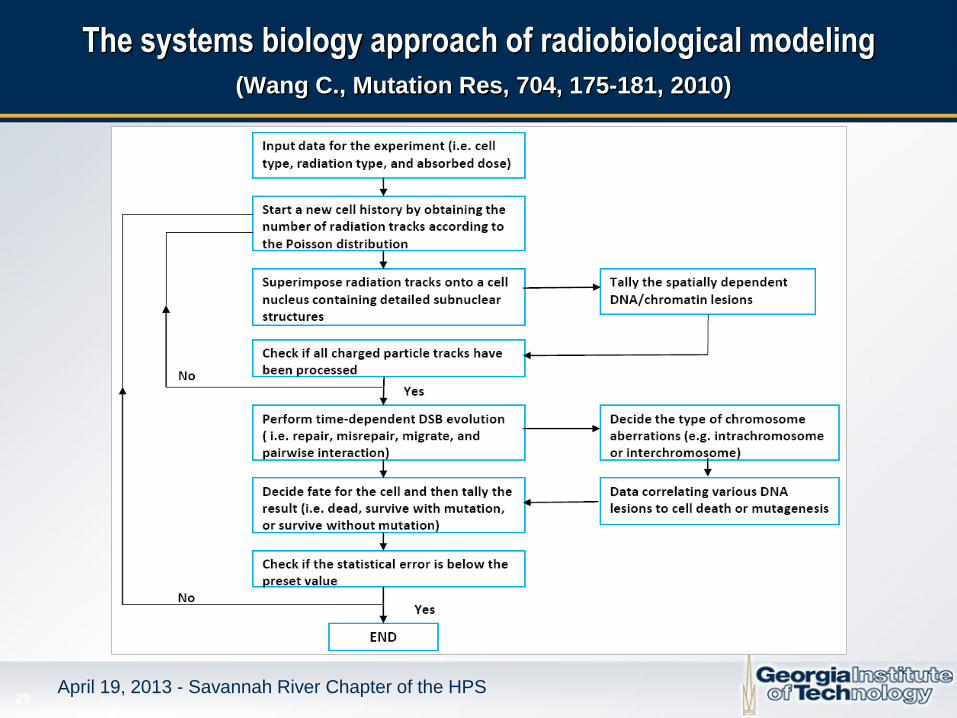
The systems biology approach of radiobiological modeling
(Wang C., Mutation Res, 704, 175-181, 2010)
April 19, 2013 - Savannah River Chapter of the HPS
30
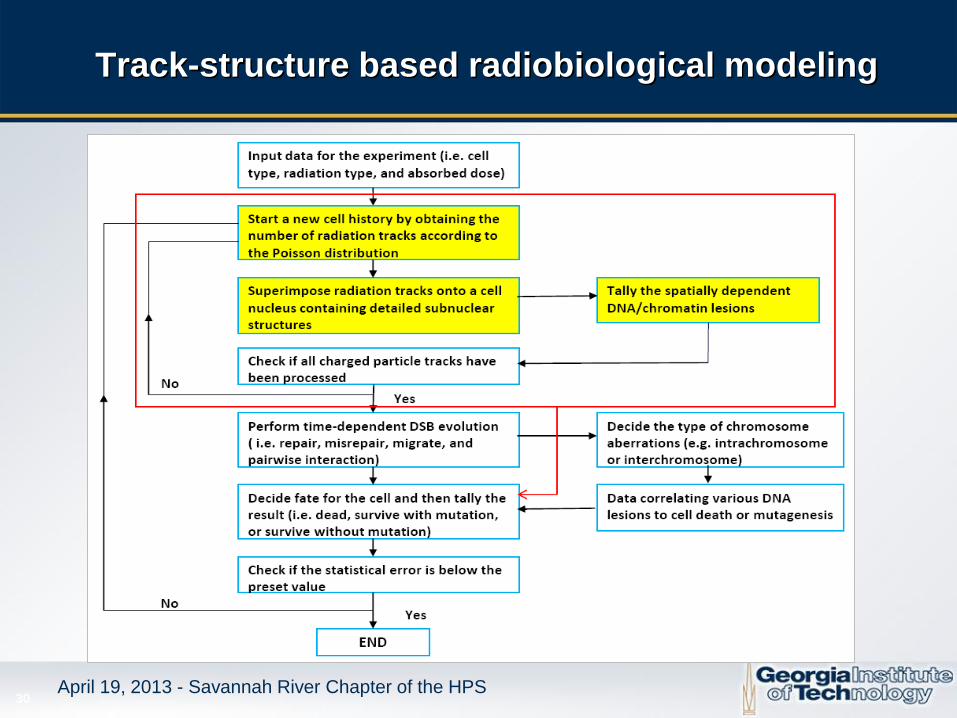
Track-structure based radiobiological modeling
April 19, 2013 - Savannah River Chapter of the HPS
31
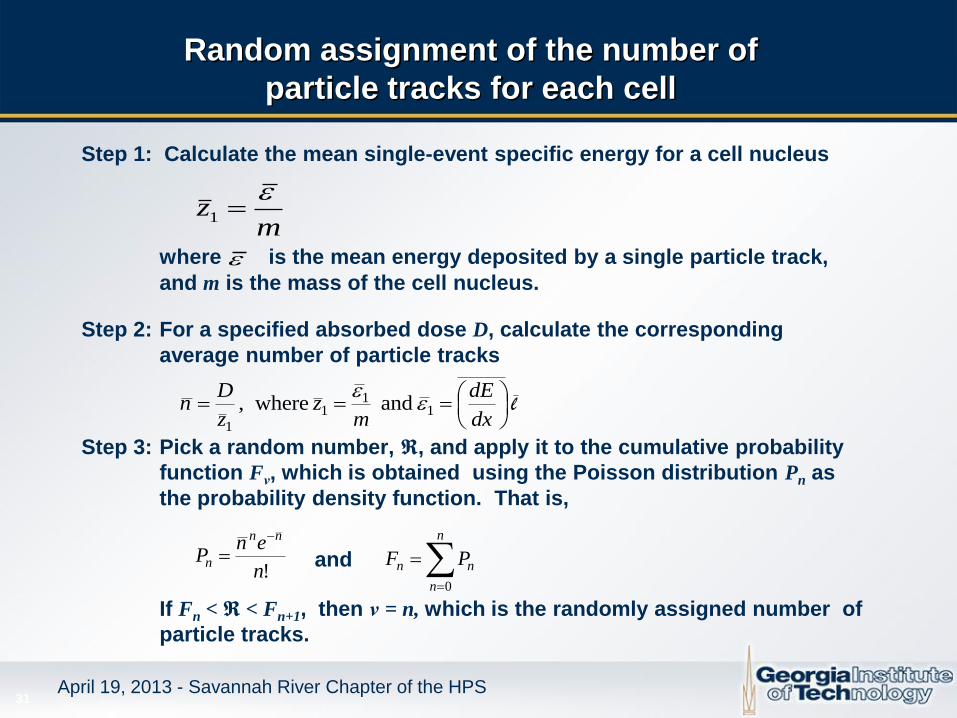
Random assignment of the number of
particle tracks for each cell
Step 1: Calculate the mean single-event specific energy for a cell nucleus
where is the mean energy deposited by a single particle track,
and m is the mass of the cell nucleus.
Step 2: For a specified absorbed dose D, calculate the corresponding
average number of particle tracks
Step 3: Pick a random number, 𝕽, and apply it to the cumulative probability
function Fν, which is obtained using the Poisson distribution Pn as
the probability density function. That is,
and
If Fn < 𝕽 < Fn+1, then ν = n, which is the randomly assigned number of
particle tracks.
mz
1
April 19, 2013 - Savannah River Chapter of the HPS
l and where, 11
1
1
dx
dE
mz
z
Dn
!n
enP
nn
n
n
n
nn PF
0
32
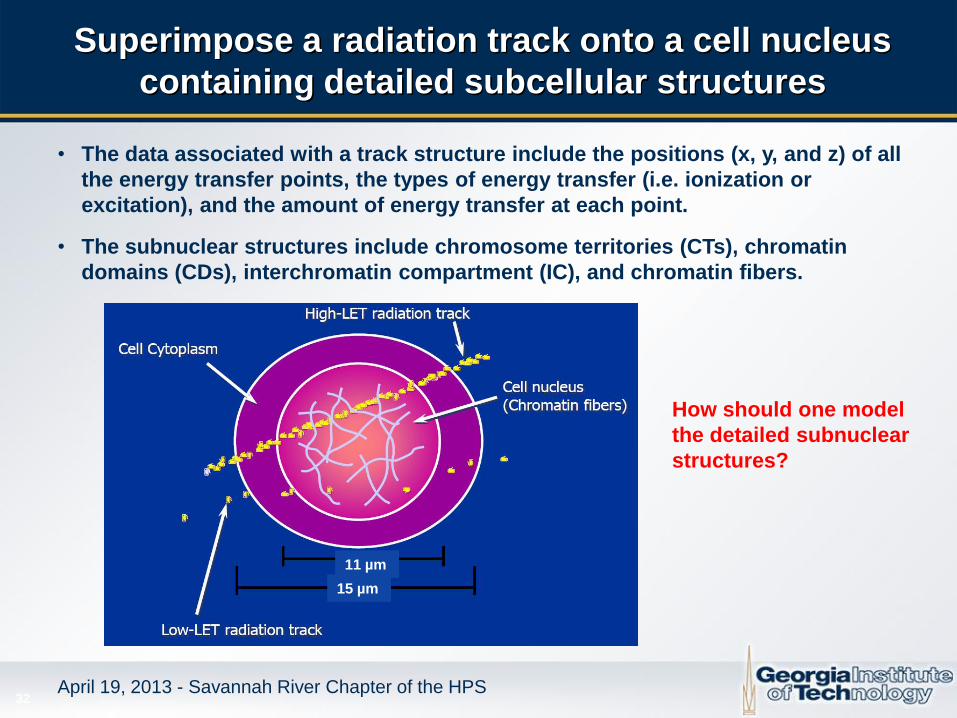
Superimpose a radiation track onto a cell nucleus
containing detailed subcellular structures
April 19, 2013 - Savannah River Chapter of the HPS
• The data associated with a track structure include the positions (x, y, and z) of all
the energy transfer points, the types of energy transfer (i.e. ionization or
excitation), and the amount of energy transfer at each point.
• The subnuclear structures include chromosome territories (CTs), chromatin
domains (CDs), interchromatin compartment (IC), and chromatin fibers.
How should one model
the detailed subnuclear
structures?
11 µm
15 µm
33
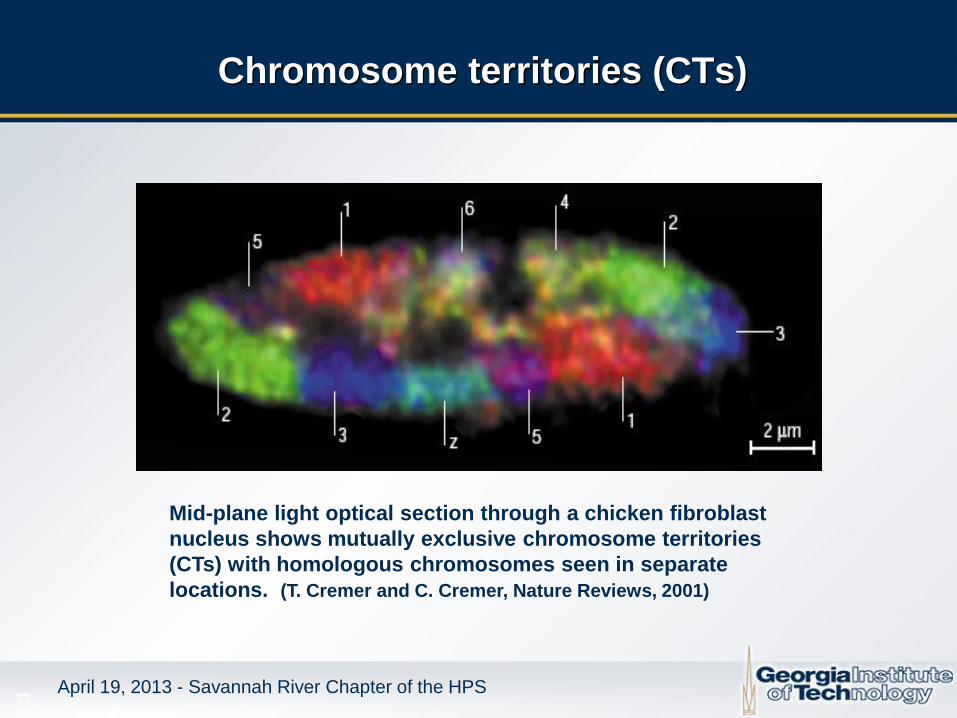
Chromosome territories (CTs)
April 19, 2013 - Savannah River Chapter of the HPS
Mid-plane light optical section through a chicken fibroblast
nucleus shows mutually exclusive chromosome territories
(CTs) with homologous chromosomes seen in separate
locations. (T. Cremer and C. Cremer, Nature Reviews, 2001)
34
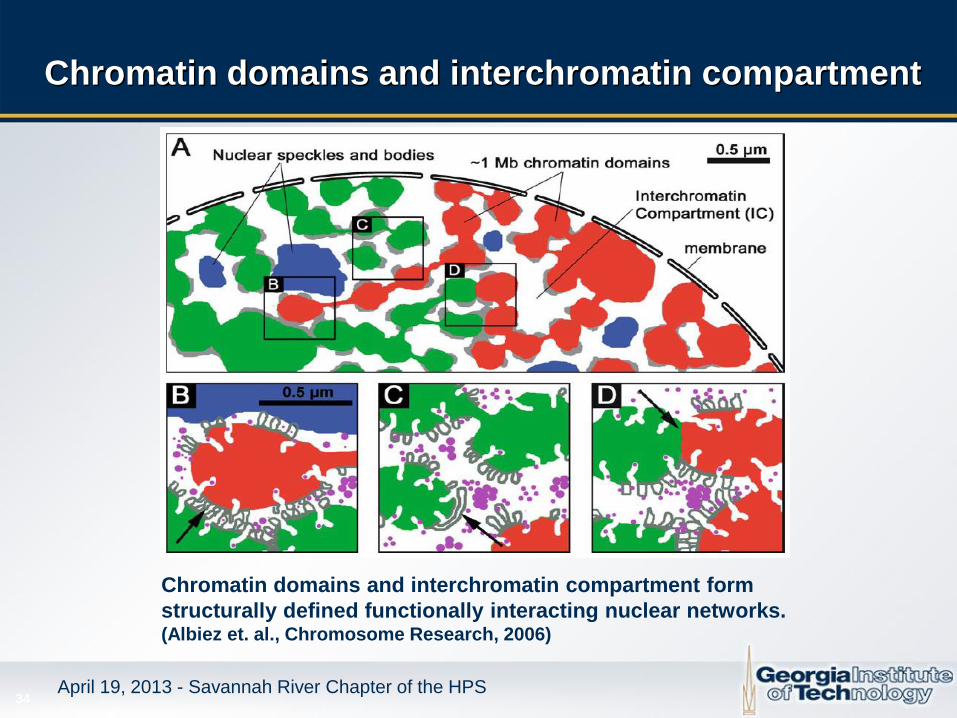
Chromatin domains and interchromatin compartment
April 19, 2013 - Savannah River Chapter of the HPS
Chromatin domains and interchromatin compartment form
structurally defined functionally interacting nuclear networks. (Albiez et. al., Chromosome Research, 2006)
35
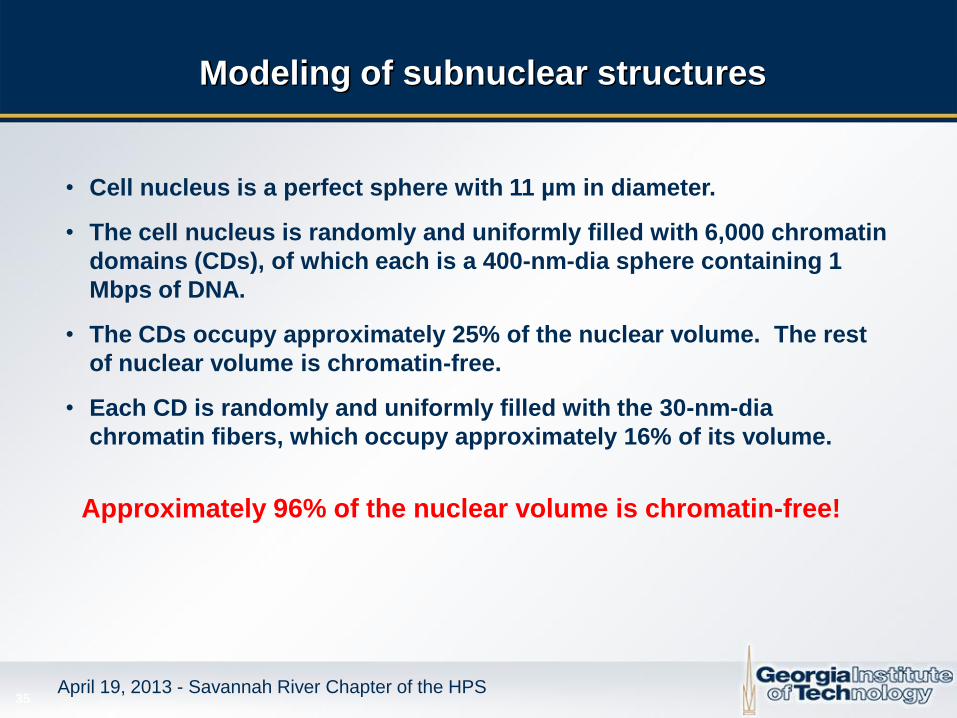
Modeling of subnuclear structures
April 19, 2013 - Savannah River Chapter of the HPS
• Cell nucleus is a perfect sphere with 11 µm in diameter.
• The cell nucleus is randomly and uniformly filled with 6,000 chromatin
domains (CDs), of which each is a 400-nm-dia sphere containing 1
Mbps of DNA.
• The CDs occupy approximately 25% of the nuclear volume. The rest
of nuclear volume is chromatin-free.
• Each CD is randomly and uniformly filled with the 30-nm-dia
chromatin fibers, which occupy approximately 16% of its volume.
Approximately 96% of the nuclear volume is chromatin-free!
36
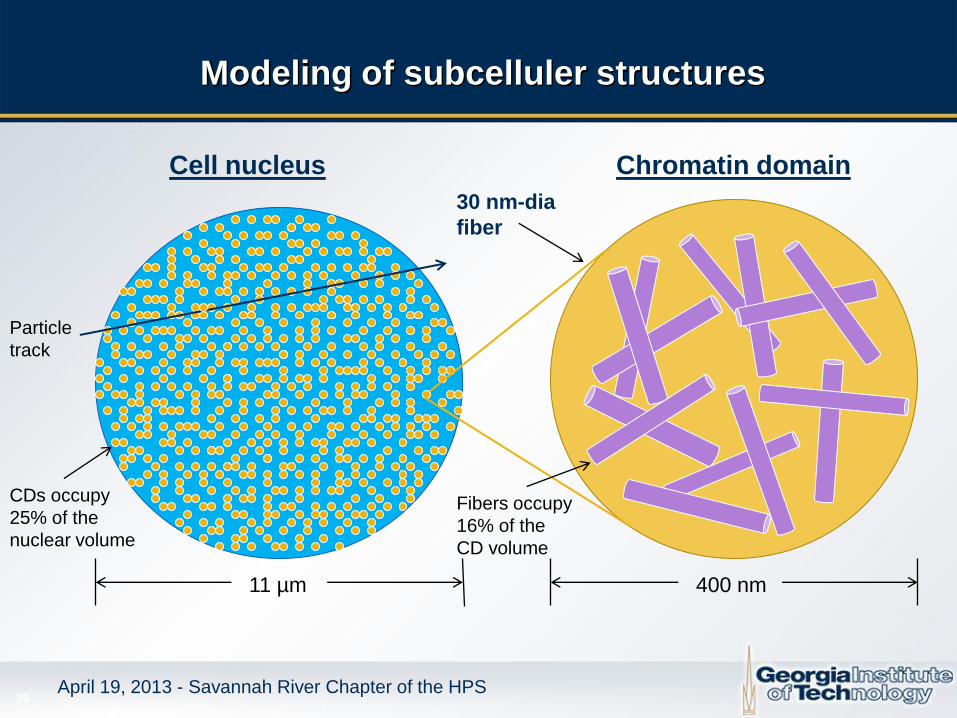
Modeling of subcelluler structures
April 19, 2013 - Savannah River Chapter of the HPS
11 µm 400 nm
Cell nucleus Chromatin domain
30 nm-dia
fiber
CDs occupy
25% of the
nuclear volume
Fibers occupy
16% of the
CD volume
Particle
track
37
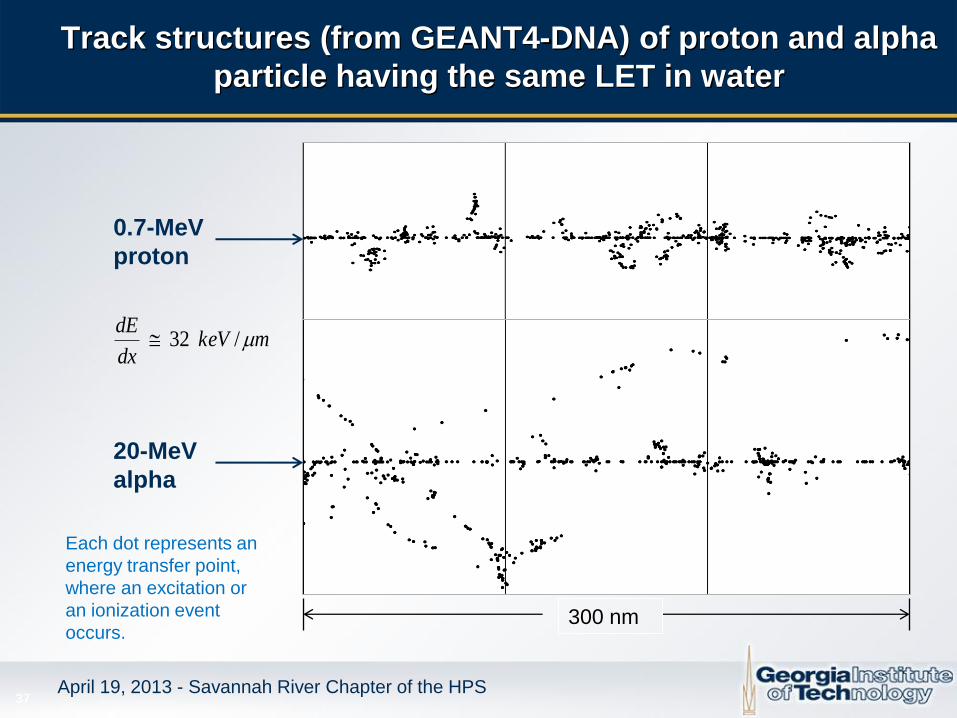
Track structures (from GEANT4-DNA) of proton and alpha
particle having the same LET in water
April 19, 2013 - Savannah River Chapter of the HPS
0.7-MeV
proton
20-MeV
alpha
mkeVdx
dE/ 32
300 nm
Each dot represents an
energy transfer point,
where an excitation or
an ionization event
occurs.
38
Monte Carlo procedure for generating the initial locations
of chromatin-damage site along a charged particle track
April 19, 2013 - Savannah River Chapter of the HPS
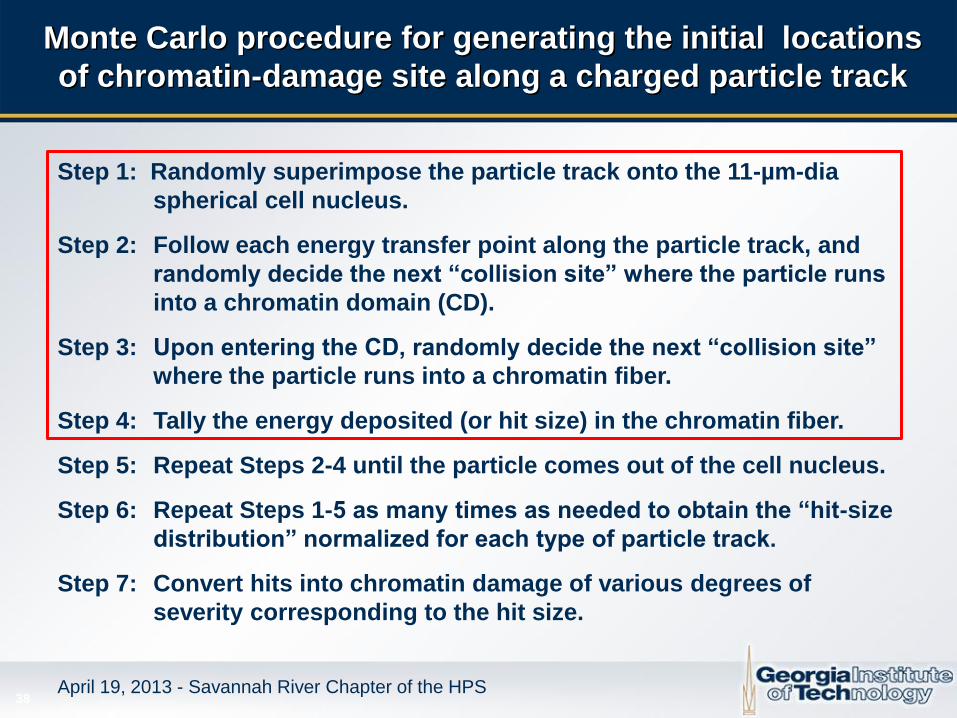
Step 1: Randomly superimpose the particle track onto the 11-µm-dia
spherical cell nucleus.
Step 2: Follow each energy transfer point along the particle track, and
randomly decide the next “collision site” where the particle runs
into a chromatin domain (CD).
Step 3: Upon entering the CD, randomly decide the next “collision site”
where the particle runs into a chromatin fiber.
Step 4: Tally the energy deposited (or hit size) in the chromatin fiber.
Step 5: Repeat Steps 2-4 until the particle comes out of the cell nucleus.
Step 6: Repeat Steps 1-5 as many times as needed to obtain the “hit-size
distribution” normalized for each type of particle track.
Step 7: Convert hits into chromatin damage of various degrees of
severity corresponding to the hit size.
39
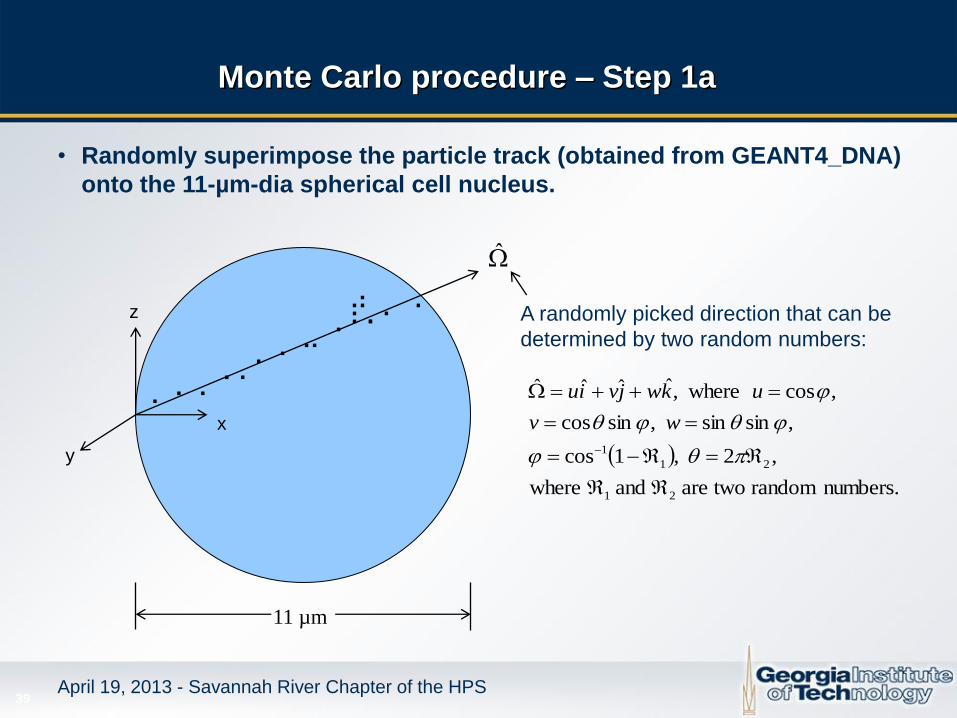
Monte Carlo procedure – Step 1a
April 19, 2013 - Savannah River Chapter of the HPS
• Randomly superimpose the particle track (obtained from GEANT4_DNA)
onto the 11-µm-dia spherical cell nucleus.
y
x
z
numbers. random twoare and where
,2 ,1cos
,sinsin ,sincos
,cos where,ˆˆˆˆ
21
21
1
wv
ukwjviu
A randomly picked direction that can be
determined by two random numbers:
11 µm
.
.
. .
. . .
. . . .
.
.
.
.
.
. . .
40
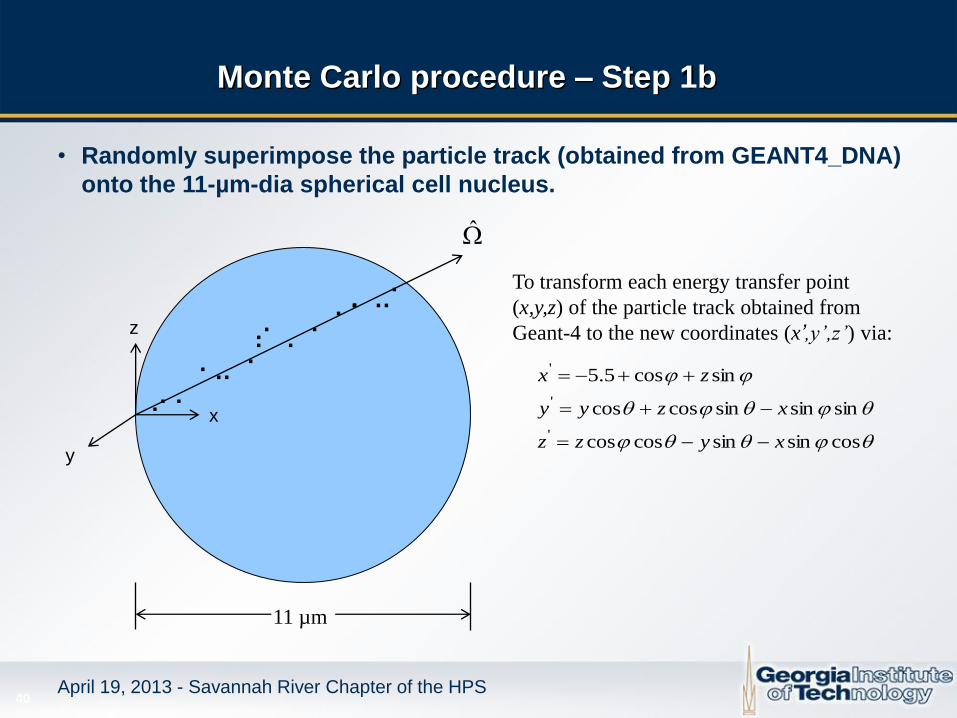
Monte Carlo procedure – Step 1b
April 19, 2013 - Savannah River Chapter of the HPS
• Randomly superimpose the particle track (obtained from GEANT4_DNA)
onto the 11-µm-dia spherical cell nucleus.
y
x
z
cossinsincoscos
sinsinsincoscos
sincos5.5
'
'
'
xyzz
xzyy
zx
To transform each energy transfer point
(x,y,z) of the particle track obtained from
Geant-4 to the new coordinates (x’,y’,z’) via:
11 µm
. .
. .
.
.
. . .
.
. .
. . .
.
. . .
41
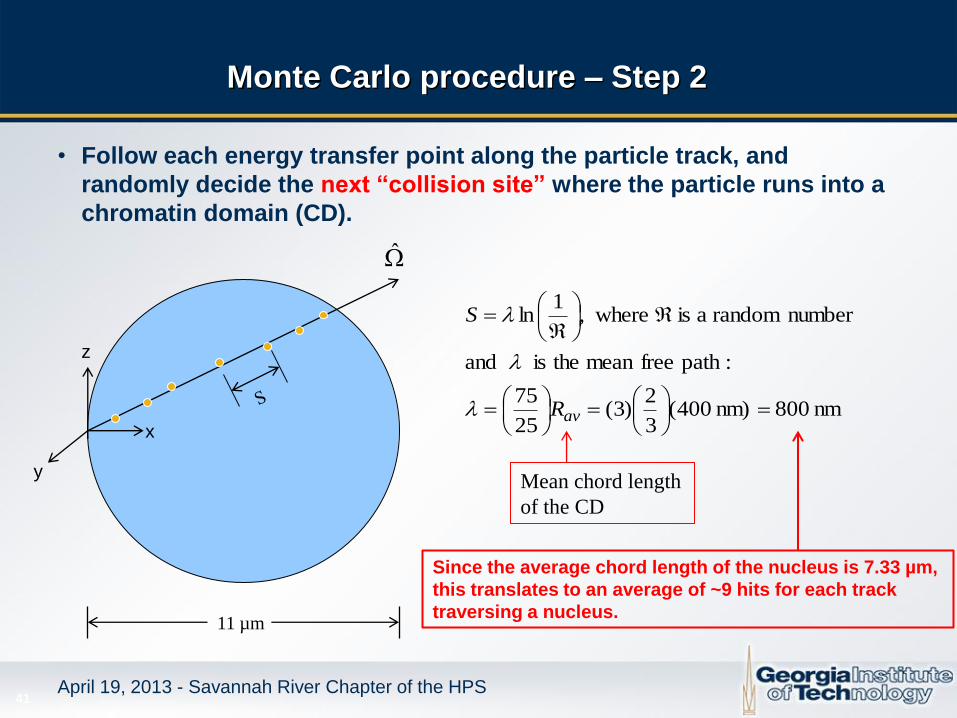
Monte Carlo procedure – Step 2
April 19, 2013 - Savannah River Chapter of the HPS
• Follow each energy transfer point along the particle track, and
randomly decide the next “collision site” where the particle runs into a
chromatin domain (CD).
y
x
z
nm 800nm) 400(3
2)3(
25
75
:path free mean theis and
number randoma is where,1
ln
avR
S
Mean chord length
of the CD
11 µm
S Since the average chord length of the nucleus is 7.33 µm,
this translates to an average of ~9 hits for each track
traversing a nucleus.
42
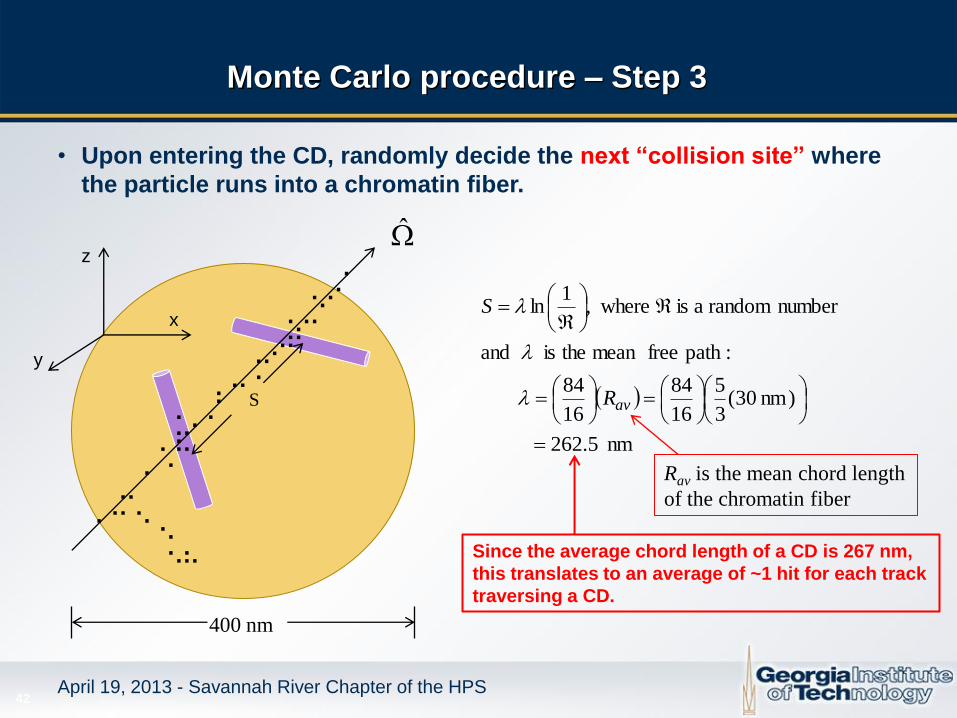
Monte Carlo procedure – Step 3
April 19, 2013 - Savannah River Chapter of the HPS
• Upon entering the CD, randomly decide the next “collision site” where
the particle runs into a chromatin fiber.
nm 5.262
)nm 30(3
5
16
84
16
84
:path free mean theis and
number randoma is where,1
ln
avR
S
S
x
z
y
S
. . .
.
. .
.
. .
.
. .
. . . . . . .
. . . . . . .
. . . . . . . .
.
.
.
. . . .
. . . . .
Rav is the mean chord length
of the chromatin fiber
400 nm
Since the average chord length of a CD is 267 nm,
this translates to an average of ~1 hit for each track
traversing a CD.
43
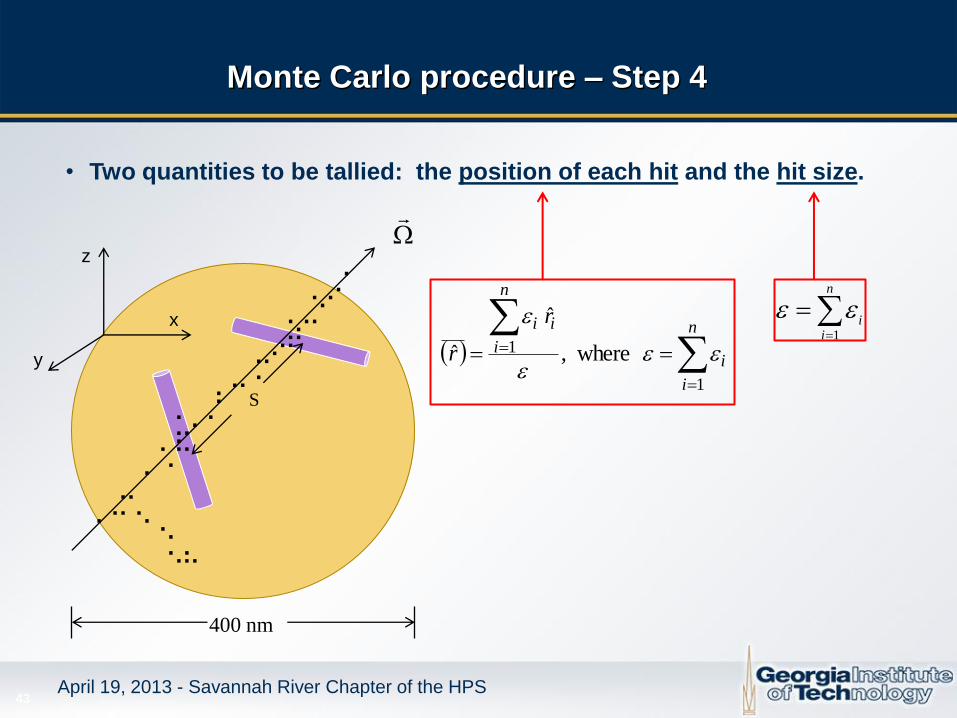
Monte Carlo procedure – Step 4
April 19, 2013 - Savannah River Chapter of the HPS
• Two quantities to be tallied: the position of each hit and the hit size.
S
x
z
y
S
. . .
.
. .
.
. .
.
. .
. . . . . . .
. . . . . . .
. . . . . . . .
.
.
.
. . . .
. . . . .
400 nm
n
i
i
n
i
ii r
r
1
1 where,
ˆ
ˆ
n
ii
1
44
Results
April 19, 2013 - Savannah River Chapter of the HPS
To be published soon!

45 April 19, 2013 - Savannah River Chapter of the HPS
Questions?


![HA Update 2010 C.ppt [โหมดความเข้ากันได้]bkh.moph.go.th/bkqc/file/HA Update 2010.pdfTrack 2 : Patient Safety ทบทวนความครอบคลุมของก](https://img.pdfslide.net/doc/110x75/5e3cf575f976d346e700994c/ha-update-2010-cppt-aaaaaaaaaaaaaaaaaabkhmophgothbkqcfileha.jpg)


![Recent Perspectives on Biological Effects of Ionizing ...hpschapters.org/northcarolina/fall2016/Ben Edwards Rad Bioeffects.… · The BEIR [Biological Effects of Ionizing Radiation]](https://img.pdfslide.net/doc/110x75/5f0971f37e708231d426ddff/recent-perspectives-on-biological-effects-of-ionizing-edwards-rad-bioeffects.jpg)