Embed Size (px)
Citation preview

Radiological Habits Survey: Barrow and the south-west
2013
Environment Report RL 01/13
Cefas contract report C2848
Cumbrian coast, 2012

This page has been intentionally left blank

Environment Report RL 01/13 Final report
Radiological Habits Survey: Barrow and the south-west Cumbrian coast, 2012 C.J. Garrod, F.J. Clyne, V.E. Ly, P. Rumney and G.P. Papworth Peer reviewed by G.J. Hunt Approved for publication by W.C. Camplin 2013
The work described in this report was carried out under contract to the Environment Agency,
the Food Standards Agency and the Health and Safety Executive. Cefas contract C2848
FSA Project PAU 198 / Lot 7 / ERI006

2
This report should be cited as: Garrod, C.J., Clyne, F.J., Ly, V.E., Rumney, P. and Papworth, G.P., 2013. Radiological Habits Survey: Barrow and the south-west Cumbrian coast, 2012. RL 01/13. Cefas, Lowestoft A copy can be obtained by downloading from the Cefas website: www.cefas.defra.gov.uk © Crown copyright, 2013

Radiological Habits Survey: Barrow and the south-west Cumbrian coast, 2012
3
CONTENTS
SUMMARY .............................................................................................................................................. 7
1 INTRODUCTION ........................................................................................................................... 12
1.1 Regulatory framework ........................................................................................................... 12
1.2 Radiological protection framework ........................................................................................ 13
2 THE SURVEY ............................................................................................................................... 15
2.1 Site activity ............................................................................................................................ 15
2.2 Survey objectives .................................................................................................................. 15
2.3 Survey areas ......................................................................................................................... 16
Figure 1. The aquatic survey area ................................................................................................ 17
Figure 2. The Barrow terrestrial (outer ring) and direct radiation (inner ring) survey areas ......... 18
2.4 Conduct of the survey ........................................................................................................... 19
3 METHODS FOR DATA ANALYSIS ............................................................................................. 21
3.1 Data recording and presentation ........................................................................................... 21
3.2 Data conversion .................................................................................................................... 21
3.3 Rounding and grouping of data ............................................................................................. 21
3.4 Approaches for the identification of high rates ...................................................................... 23
3.5 Data quality ........................................................................................................................... 24
4 AQUATIC RADIATION PATHWAYS ........................................................................................... 25
4.1 Aquatic survey area .............................................................................................................. 25
Figure 3. Selker Bay ..................................................................................................................... 26
Figure 4. Near Millom Iron Works Nature Reserve. ...................................................................... 27
Figure 5. West side of the Duddon Estuary .................................................................................. 28
Figure 6. South side of the pier at Askam-in-Furness .................................................................. 29
Figure 7. West Shore Park on the west coast of Walney Island .................................................. 30
Figure 8. The Walney Channel, near Jubilee Bridge .................................................................... 32
Figure 9. Between Roosebeck and Rampside ............................................................................. 33
4.2 Commercial fisheries ............................................................................................................. 34
4.3 Destination of seafood originating from the aquatic survey area .......................................... 35
4.4 Hobby fishing, angling and non-commercial shellfish collecting. .......................................... 35
4.5 Salthouse Wastewater Treatment Works ............................................................................. 36
4.6 Wildfowling ............................................................................................................................ 37
4.7 Other pathways ..................................................................................................................... 37
4.8 Food consumption data ......................................................................................................... 38
Table A. Summary of adults’ consumption rates of foods from the aquatic survey area .............. 38
Table B. Summary of children’s and infants’ consumption rates of foods from the aquatic survey area ................................................................................................................................................ 40
4.9 Intertidal occupancy .............................................................................................................. 40
Table C. Summary of adults’ intertidal occupancy rates .............................................................. 41
Table D. Summary of children’s and infants’ intertidal occupancy rates ...................................... 42
4.10 Gamma dose rate measurements......................................................................................... 42
4.11 Handling of fishing gear and sediment .................................................................................. 43
Table E. Summary of adults’ handling rates of fishing gear and sediment .................................. 43
Table F. Summary of children’s handling rates of sediment ........................................................ 44
4.12 Exposure to sewage, sewage sludge and sewage cake ...................................................... 44
4.13 Water based activities ........................................................................................................... 44
5 TERRESTRIAL RADIATION PATHWAYS .................................................................................. 46
5.1 Terrestrial survey area .......................................................................................................... 46
5.2 Destination of food originating from the terrestrial survey area ............................................ 47
5.3 The potential transfer of contamination off-site by wildlife .................................................... 47
5.4 Food consumption data ......................................................................................................... 48
Table G. Summary of adults’ consumption rates of foods from the terrestrial survey area .......... 49

CONTENTS
4
Table H. Summary of children’s and infants’ consumption rates of foods from the terrestrial survey area .................................................................................................................................... 50
6 DIRECT RADIATION PATHWAYS .............................................................................................. 51
6.1 Direct radiation survey area .................................................................................................. 51
6.2 Residential activities .............................................................................................................. 52
6.3 Leisure activities .................................................................................................................... 52
6.4 Commercial activities ............................................................................................................ 53
6.5 Educational activities ............................................................................................................. 53
6.6 Occupancy rates ................................................................................................................... 53
Table I. Summary of direct radiation occupancy rates ................................................................. 53
6.7 Gamma dose rate measurements......................................................................................... 54
7 USES OF HABITS DATA FOR DOSE ASSESSMENTS ............................................................. 56
7.1 Combined pathways .............................................................................................................. 56
7.2 Foetal dose assessment ....................................................................................................... 56
7.3 Total dose assessment ......................................................................................................... 56
8 COMPARISONS WITH THE PREVIOUS SURVEY ..................................................................... 58
8.1 Aquatic survey area .............................................................................................................. 58
Table K. Comparison between 1990 and 2012 intertidal occupancy rates and handling rates of fishing gear and sediment for adults .............................................................................................. 60
9 MAIN FINDINGS ........................................................................................................................... 61
9.1 Aquatic survey area .............................................................................................................. 61
9.2 Terrestrial survey area .......................................................................................................... 62
9.3 Direct radiation survey area .................................................................................................. 63
10 RECOMMENDATIONS FOR CHANGES TO THE MONITORING PROGRAMME ..................... 64
10.1 Summary of current environmental monitoring programmes ................................................ 64
10.2 Recommendations ................................................................................................................ 65
11 ACKNOWLEDGEMENTS ............................................................................................................. 67
12 REFERENCES .............................................................................................................................. 68
TABLES Table 1 Survey coverage Table 2 Typical food groups used in habits surveys Table 3 Adults’ consumption rates of fish from the aquatic survey area (kg y
-1)
Table 4 Adults’ consumption rates of crustaceans from the aquatic survey area (kg y-1
) Table 5 Adults’ consumption rates of molluscs from the aquatic survey area (kg y
-1)
Table 6 Adults’ consumption rates of wildfowl from the aquatic survey area (kg y-1
) Table 7 Adults’ consumption rates of marine plants/algae from the aquatic survey area (kg y
-1)
Table 8 Adults' consumption rates of salt marsh grazed sheep meat from the aquatic survey area (kg y
-1)
Table 9 Children's and infants’ consumption rates of fish from the aquatic survey area (kg y-1
) Table 10 Children’s consumption rates of molluscs from the aquatic survey area (kg y
-1)
Table 11 Children’s and infants’ consumption rates of wildfowl from the aquatic survey area (kg y
-1)
Table 12 Adults’ intertidal occupancy rates in the aquatic survey area (h y-1
) Table 13 Children’s and infants’ intertidal occupancy rates in the aquatic survey area (h y
-1)
Table 14 Gamma dose rate measurements over intertidal substrates in the aquatic survey area (µGy h
-1)
Table 15 Adults’ handling rates of fishing gear and sediment in the aquatic survey area (h y-1
) Table 16 Children’s handling rates of sediment in the aquatic survey area (h y
-1)
Table 17 Occupancy rates in close proximity to sewage, sewage sludge and sewage cake (h y
-1)

Radiological Habits Survey: Barrow and the south-west Cumbrian coast, 2012
5
Table 18 Adults’ occupancy rates in and on water in the aquatic survey area (h y-1
) Table 19 Children’s and infants’ occupancy rates in and on water in the aquatic survey area
(h y-1
) Table 20 Adults’ consumption rates of green vegetables from the terrestrial survey area (kg y
-1)
Table 21 Adults’ consumption rates of other vegetables from the terrestrial survey area (kg y-1
) Table 22 Adults’ consumption rates of root vegetables from the terrestrial survey area (kg y
-1)
Table 23 Adults’ consumption rates of potato from the terrestrial survey area (kg y-1)
Table 24 Adults’ consumption rates of domestic fruit from the terrestrial survey area (kg y-1
) Table 25 Adults’ consumption rates of milk from the terrestrial survey area (l y
-1)
Table 26 Adults’ consumption rates of cattle meat from the terrestrial survey area (kg y-1
) Table 27 Adults’ consumption rates of pig meat from the terrestrial survey area (kg y
-1)
Table 28 Adults’ consumption rates of sheep meat from the terrestrial survey area (kg y-1
) Table 29 Adults’ consumption rates of poultry from the terrestrial survey area (kg y
-1)
Table 30 Adults’ consumption rates of eggs from the terrestrial survey area (kg y-1
) Table 31 Adults’ consumption rates of wild/free foods from the terrestrial survey area (kg y
-1)
Table 32 Adults’ consumption rates of rabbits/hares from the terrestrial survey area (kg y-1
) Table 33 Adults’ consumption rates of wild fungi from the terrestrial survey area (kg y
-1)
Table 34 Adults’ consumption rates of freshwater fish from the terrestrial survey area (kg y-1
) Table 35 Children’s and infants’ consumption rates of green vegetables from the terrestrial
survey area (kg y-1
) Table 36 Children’s and infants’ consumption rates of other vegetables from the terrestrial
survey area (kg y-1
) Table 37 Children's and infants’ consumption rates of root vegetables from the terrestrial
survey area (kg y-1
) Table 38 Children's and infants’ consumption rates of potato from the terrestrial survey area
(kg y-1
) Table 39 Children's and infants’ consumption rates of domestic fruit from the terrestrial survey
area (kg y-1
) Table 40 Children’s and infants’ consumption rates of milk from the terrestrial survey area (l y
-1)
Table 41 Children’s and infants’ consumption rates of cattle meat from the terrestrial survey area (kg y
-1)
Table 42 Children’s consumption rates of pig meat from the terrestrial survey area (kg y-1
) Table 43 Children's and infants’ consumption rates of sheep meat from the terrestrial survey
area (kg y-1
) Table 44 Children's consumption rates of poultry from the terrestrial survey area (kg y
-1)
Table 45 Children's and infants' consumption rates of eggs from the terrestrial survey area (kg y
-1)
Table 46 Children's consumption rates of wild/free foods from the terrestrial survey area (kg y
-1)
Table 47 Children's consumption rates of rabbits/hares from the terrestrial survey area (kg y
-1)
Table 48 Infants’ consumption rates of wild fungi from the terrestrial survey area (kg y-1
) Table 49 Percentage contribution each food type makes to its terrestrial food group for adults Table 50 Direct radiation occupancy rates for adults, children and infants (h y
-1)
Table 51 Analysis of direct radiation occupancy rates for adults, children and infants Table 52 Gamma dose rate measurements for the direct radiation survey (µGy h
-1)
Table 53 Combinations of adult pathways for consideration in dose assessments
ANNEXES
Annex 1 Adults’ consumption rates (kg y-1 or l y
-1) and occupancy rates (h y
-1)
Annex 2 Children’s and infants’ consumption rates (kg y-1
or l y-1) and occupancy rates (h y
-1)
Annex 3 Qualitative and estimated data for use in dose assessments Annex 4 Ratios for determining consumption and occupancy rates for infants and children Annex 5 Consumption rates (kg y
-1 or l y
-1) and occupancy rates (h y
-1) for women of
childbearing age, for use in foetal dose assessments Annex 6 Summary of profiles for adults Annex 7 Summary of profiles for the child age group (6 - 15 years old)

CONTENTS
6
Annex 8 Summary of profiles for the infant age group (0 - 5 years old) Annex 9 Summary of profiles for women of childbearing age, for use in foetal dose
assessments

Radiological Habits Survey: Barrow and the south-west Cumbrian coast, 2012
7
SUMMARY
This report presents the results of a survey conducted in 2012 to determine the habits and
consumption patterns of people living, working and pursuing recreational activities in the vicinity of the
nuclear site at Barrow-in-Furness and along the south-west Cumbrian coast.
At Barrow-in-Furness, BAE Systems Marine Ltd builds, tests and commissions new nuclear powered
submarines. The site is permitted to discharge gaseous radioactive wastes via stacks and other
outlets to the atmosphere, liquid radioactive wastes to the local sewer and contains sources of direct
radiation. The sewer flows to a utility company’s wastewater treatment plant and after undergoing a
sewage treatment process the effluent is discharged into the sea in the Walney Channel. Areas likely
to be most affected by the discharges and sources of radiation were defined as the aquatic survey
area for liquid discharges, the terrestrial survey area for the deposition from gaseous discharges, and
the direct radiation survey area for ionising radiation emanating directly from the site. The occupancy
data collected from the direct radiation survey area is also applicable to the direct exposure arising
from potential gaseous releases from the site.
The discharges from the Barrow nuclear site are minor compared with those from other nuclear sites
located on the north-west coast of England. The coast and sea area in the vicinity of Barrow-in-
Furness and south-west Cumbria may be affected by discharges of liquid radioactive waste from
these sites, most notably Sellafield, and the results of this survey are also relevant to those sites.
The following potential exposure pathways were investigated:
• The consumption of food from the aquatic survey area
• Activities and occupancy over intertidal substrates
• The handling of fishing gear and sediment
• Occupancy in close proximity to sewage, sewage sludge and sewage cake
• Activities and occupancy in and on water
• The use of seaweed as a fertiliser or animal feed
• The consumption of food from the terrestrial survey area
• The use and destination of produce originating from the survey areas
• The consumption and use of groundwater and surface water in the terrestrial survey area
• The transfer of contamination off-site by wildlife
• Activities and occupancy within the direct radiation survey area
• Any new or unusual exposure pathways
Interviews were conducted with members of the public and data collected for 522 individuals are
presented and discussed. High rates of consumption, intertidal occupancy and handling are identified

SUMMARY
8
using established methods comprising (a) a ‘cut off’ to define the high-rate group and (b) 97.5th
percentiles. The rates so identified can be used in dose assessments. Additionally, profiles of
integrated habits data are presented specifically for use in total dose assessments.
The aquatic survey area
The aquatic survey area (Figure 1, page 17) covered the intertidal areas along the coast of Cumbria
between Tarn Point in the north and Roosebeck in the south, and the adjacent sea area up to 10 km
offshore. The Duddon Estuary, Walney Channel and the shore of Walney Island were included.
Foods from the aquatic survey area were consumed from the following food groups: fish; crustaceans;
molluscs; wildfowl; marine plants/algae; salt marsh grazed sheep meat. The mean consumption rates
for the adult high rate group for the separate aquatic consumption pathways for foods potentially
affected by liquid discharges were:
• 27 kg y-1
for fish
• 12 kg y-1
for crustaceans
• 5.9 kg y-1 for molluscs
• 17 kg y-1 for wildfowl
• 0.7 kg y-1 for marine plants/algae
• 5.7 kg y-1 for salt marsh grazed sheep meat
The predominant foods consumed by the high-rate groups were:
• For fish: bass; cod; flounder; mackerel; plaice.
• For crustaceans: brown crab and common lobster
• For molluscs: cockles; mussels; whelks; winkles
• For wildfowl: greylag goose; mallard; pink-footed goose; pintail.
• For marine plants/algae: samphire
• For salt marsh grazed sheep meat: salt marsh grazed lamb
The mean consumption rate for the adult high-rate group exceeded the generic 97.5th percentile rate for
crustaceans but not for fish or molluscs. Generic consumption rates have not been determined for
wildfowl, marine plants/algae or salt marsh grazed sheep meat.
The activities undertaken by adults in the high-rate groups for intertidal occupancy included collecting
mussels, wildfowling, angling, dog walking, oyster farming, collecting winkles, bait digging, boat
maintenance, tending livestock, boat dwelling (tide out) and sitting on the beach. Gamma dose rate
measurements were taken at most locations in the aquatic survey area where activities were
occurring. The only activities undertaken by adults in the high-rate group for handling fishing gear
were handling nets and pots. The activities undertaken by adults in the high-rate group for handling

Radiological Habits Survey: Barrow and the south-west Cumbrian coast, 2012
9
sediment were oyster farming and wildfowling. The activities undertaken by people in and on the
water included swimming, snorkelling, sub-aqua diving, windsurfing, kite-surfing, body-boarding,
kayaking, jet skiing, sailing, canoeing, boat angling, gill netting, potting, trawling, dredging, charter
boat skipper, working on a boat, RNLI duties, rescue boat duties, boat dwelling (tide in), fixing
moorings and paddling. The use of seaweed as a fertiliser or animal feed was not identified.
The Barrow site discharges liquid waste via the sewer pipes to the Salthouse Wastewater Treatment
Works where it undergoes a sewage treatment process. Occupancy rates were obtained for
employees and a contractor working in close proximity to sewage, sewage sludge and sewage cake
at the treatment works.
The terrestrial survey area
The terrestrial survey area (Figure 2, page 18) was defined as the land and bodies of freshwater
within 5 km of the centre of the Barrow site. Fifteen farms and smallholdings were identified that
farmed the land in the terrestrial survey area. They produced milk (from dairy cattle), beef cattle,
lambs and geese. The farmers and their families consumed foods that were produced commercially
on their land and also other foods that they produced solely for their own consumption. Seventeen
allotment sites with approximately 740 plots in total were identified where a variety of fruit and
vegetables were grown. Some allotment holders kept chickens for eggs on their allotment plots.
Beekeeping was reported to take place within the survey area but the beekeepers could not be
contacted. Freshwater fish were being consumed from waters in the terrestrial survey area.
Foods from the terrestrial survey area were consumed from the following food groups: green
vegetables; other vegetables; root vegetables; potato; domestic fruit; milk; cattle meat; pig meat;
sheep meat; poultry; eggs; wild/free foods; rabbits/hares; wild fungi; freshwater fish. Three mean
consumption rates for the adult high-rate groups were found to be greater than the generic 97.5th
percentile consumption rates. These were for milk, poultry and eggs. The consumption of honey,
cereals or venison was not identified.
The consumption of groundwater by humans or livestock was not identified. One household collected
rainwater for their domestic supply. Livestock were consuming spring, stream and ditch water.
Control measures taken by the site operator in order to limit the possibility that contamination is
transferred off-site by wildlife included ensuring that wildlife were unable to access the controlled
areas and clearing debris from gutters and ground level areas to discourage seagulls from nesting.

SUMMARY
10
The direct radiation survey area
The direct radiation survey area (Figure 2, page 18) was defined as the land and sea within 1 km of
the Barrow nuclear licensed site boundary. Occupancy rates were obtained for residents, visitors,
children attending school, and people working and undertaking recreational activities in the area.
The occupancy rates were analysed in zones according to the distance from the Barrow nuclear
licensed site boundary. With the exception of the highest outdoor occupancy rate in the 0 – 0.25 km
zone, which was for a worker, the highest indoor, outdoor and total occupancy rates in the
0 – 0.25 km, >0.25 – 0.5 km and >0.5 – 1.0 km zones were for residents, one of whom also attended
school in the direct radiation survey area.
Gamma dose rate measurements were taken indoors and outdoors at most properties where
interviews were conducted in the direct radiation survey area. Background readings were taken at
distances beyond 5 km of the Barrow site centre.
Comparisons with the previous survey
Comparisons were made with the results from a previous habits survey undertaken in the aquatic
survey area in 1990. No previous habits surveys for terrestrial or direct radiation pathways have been
undertaken by Cefas around Barrow so no comparisons with previous results could be made for
these. At the time of the 1990 survey, liquid discharges were made to a sewer that flowed directly
into the Walney Channel, but since 2002, when the sewer system was upgraded, liquid discharges
have been made to a sewer that flows to the Salthouse Wastewater Treatment Plant where the
effluent goes through a sewage treatment process before being discharged through a pipeline at
Roosecote Sands in the Walney Channel.
In the aquatic survey area in 2012, compared with 1990, there was a decrease in the mean
consumption rate for the adult high-rate group for fish, from 40 kg y-1
to 27 kg y-1
, and increases in the
mean consumption rates for the high-rate groups for crustaceans, from 8.0 kg y-1
to 12 kg y-1
, for
molluscs, from 3.5 kg y-1 to 5.9 kg y
-1, and for wildfowl, from 7.1 kg y
-1 to 17.2 kg y
-1. The consumption
of marine plants/algae and salt marsh grazed sheep meat was identified in 2012 but not in 1990.
The mean intertidal occupancy rates for the adult high-rate groups increased in 2012 compared to
1990 over the following substrates: salt marsh, from 220 h y-1
to 290 h y-1
, sand, from 290 h y-1 to
930 h y-1
. The mean intertidal occupancy rate for the high rate group for mud and sand decreased
from 910 h y-1
in 1990 to 630 h y-1
in 2012. In 2012 activities were recorded taking place over mud,
mud and stones, sand and stones and on board a boat resting on mud and sand, but no activities
were recorded over these substrates in 1990. The mean rate for the adult high-rate group for
Radiological Habits Survey: Barrow and the south-west Cumbrian coast, 2012
11
handling fishing gear increased from 680 h y-1
in 1990 to 990 h y-1 in 2012 and the mean rate for the
adult high-rate group for handling sediment decreased from 1100 h y-1
in 1990 to 310 h y-1 in 2012.
Recommendations
Recommendations for changes to the current environmental monitoring programmes are provided.
These are based on the information collected during the survey and also take into account the
potential radiological significance of the various pathways that were identified. It is suggested that the
location of a gamma dose rate measurement that is currently taken is moved, in order to be close to a
houseboat where a high occupancy rate was recorded. It is also suggested that the location of
another gamma dose rate measurement and a sediment sample are moved to a position to the south
of the discharge point of the effluent from the Salthouse Wastewater Treatment Works. Consideration
is given to taking a one-off sample of sewage cake from the Salthouse Wastewater Treatment Works,
but in view of the low and intermittent liquid discharges from the Barrow site, this is probably not
warranted.

INTRODUCTION
12
1 INTRODUCTION
The public may be exposed to radiation as a result of the operations of the Barrow nuclear licensed
site either through the permitted discharges of liquid or gaseous radioactive wastes into the local
environment, or from radiation emanating directly from the site. The discharges from the Barrow
nuclear site are minor compared with those from other nuclear sites located on the north-west coast
of England. The coast and sea area in the vicinity of Barrow-in-Furness and south-west Cumbria may
be affected by discharges of liquid radioactive waste from these sites, most notably Sellafield. This
report provides information on activities carried out by members of the public in the vicinity of the
Barrow site and along the south-west coast of Cumbria and the adjacent sea area, which may
influence their radiation exposure. The study has been funded by the Environment Agency, the Food
Standards Agency and the Office for Nuclear Regulation in order to support their respective roles in
protecting the public from exposure to radiation.
UK policy on the control of radiation exposure has long been based on the recommendations of the
International Commission on Radiological Protection (ICRP), which embody the principles of
justification of practices, optimisation of protection and dose limitation. Radiological protection of the
public is based on the concept of a ‘representative person’. This notional individual is defined as
being representative of the more highly exposed members of the population. It follows that, if the
dose to the representative person is acceptable when compared to dose limits and optimization, other
members of the public will receive acceptable doses, and overall protection to the public is provided
from the effects of radiation. The term ‘representative person’ is equivalent to, and replaces, the term
‘average member of the critical group’ as recommended by ICRP (ICRP, 2006). The
recommendations of the ICRP were updated in 2007 (ICRP, 2007) and, for the public, still include the
principle of protecting the individuals most highly exposed to radiation, characterised by the
representative person.
1.1 Regulatory framework
The Environment Agency regulates the discharges of radioactive waste under the Environmental
Permitting Regulations (UK Parliament, 2010). The regulations take account of the European Union
(EU) Basic Safety Standards (BSS) Directive 96/29/Euratom (CEC, 1996) which embody the
recommendations of the ICRP, particularly ICRP 60 (ICRP, 1991). Installation and operation of
certain prescribed activities can only occur on sites if they are licensed under the Nuclear Installations
Act 1965 (as amended) (NIA 65) (UK Parliament, 1965). Since 1st April 2011, the Office for Nuclear
Regulation (ONR), an agency of the Health and Safety Executive, has implemented this legislation
and is also responsible for regulating, under the Ionising Radiations Regulations 1999 (IRR 99) (UK
Parliament, 1999), the exposure of the public to direct radiation from the operations occurring on
Radiological Habits Survey: Barrow and the south-west Cumbrian coast, 2012
13
these sites. Prior to 1st April 2011 these functions were carried out by the Nuclear Installations
Inspectorate of the Health and Safety Executive.
Appropriate discharge limits are set by the Environment Agency after wide-ranging consultations that
include the Food Standards Agency. The Food Standards Agency has responsibilities for ensuring
that any radioactivity present in food does not compromise food safety and that permitted discharges
of radioactivity do not result in unacceptable doses to consumers via the food chain. The Food
Standards Agency also ensures that public radiation exposure via the food chain is within EU
acceptable limits.
1.2 Radiological protection framework
Dose standards for the public are embodied in the national policy (UK Parliament, 2009a), in
guidance from the International Atomic Energy Agency (IAEA), in the Basic Safety Standards for
Radiation Protection (IAEA, 1996) and in European Community legislation in the EU BSS Directive
96/29/Euratom (CEC, 1996). The public dose standards were incorporated into UK law in IRR 99.
The requirement to observe the conditions laid down in the Basic Safety Standards (BSS) in England
and Wales is incorporated in the Environmental Permitting Regulations 2010 (UK Parliament, 2010).
These require that the environment agencies ensure, wherever applicable, that:
• All public radiation exposures from radioactive waste disposals are kept As Low As
Reasonably Achievable (ALARA), social and economic factors being taken into account;
• The sum of all exposures does not exceed the dose limit of 1 mSv a year;
• The dose received from any new source does not exceed 0.3 mSv a year;
• The dose received from any single site does not exceed 0.5 mSv a year.
The dose limit of 1 mSv per year to the public from all anthropogenic sources other than medical
applications is also the recommendation made by the ICRP (ICRP, 2007).
The environment agencies are also required to ensure that the dose estimates are as realistic as
possible for the population as a whole and for reference groups of the population. They are required
to take all necessary steps to identify the reference groups of the population taking into account the
effective pathways of transmission of radioactive substances. Guidance on the principles underlying
prospective radiological assessment (i.e. assessments of potential future doses) has been provided
by the National Dose Assessment Working Group (NDAWG), which consists of representatives of UK
Government Bodies and other organisations with responsibilities for dose assessments (EA, SEPA,
DoENI, NRPB and FSA, 2002). NDAWG has also published principles underlying retrospective
radiological assessment (i.e. assessment of doses already received from past discharges) (Allott,
2005) and possible methods of carrying out these assessments using the data from combined habits
surveys (Camplin et al., 2005). NDAWG agreed that the optimal method for performing retrospective
dose assessments would be to use habits profiles (profiling method). This approach is being adopted

INTRODUCTION
14
in Radioactivity in Food and the Environment (RIFE) publications, (e.g. EA, NIEA, FSA and SEPA,
2011), as combined habits surveys are completed. NDAWG has also published reports on the
collection and use of habits survey data in retrospective and prospective dose assessments
(NDAWG, 2005; NDAWG 2009); the principles described in these reports are consistent with those
used here. More recently, the environment agencies, the Health Protection Agency and the Food
Standards Agency have jointly produced an update of the 2002 interim guidance and principles for
assessing doses (EA, SEPA, NIEA, HPA and FSA, 2012).
Radiological Habits Survey: Barrow and the south-west Cumbrian coast, 2012
15
2 THE SURVEY
2.1 Site activity
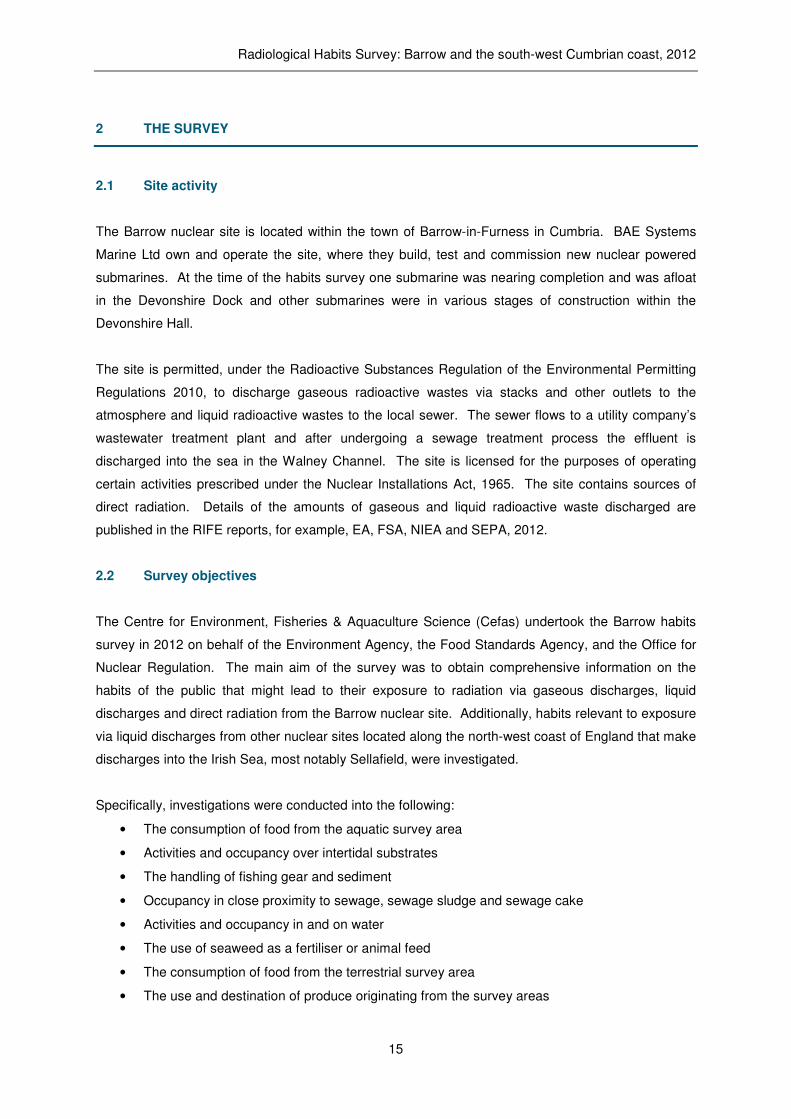
The Barrow nuclear site is located within the town of Barrow-in-Furness in Cumbria. BAE Systems
Marine Ltd own and operate the site, where they build, test and commission new nuclear powered
submarines. At the time of the habits survey one submarine was nearing completion and was afloat
in the Devonshire Dock and other submarines were in various stages of construction within the
Devonshire Hall.
The site is permitted, under the Radioactive Substances Regulation of the Environmental Permitting
Regulations 2010, to discharge gaseous radioactive wastes via stacks and other outlets to the
atmosphere and liquid radioactive wastes to the local sewer. The sewer flows to a utility company’s
wastewater treatment plant and after undergoing a sewage treatment process the effluent is
discharged into the sea in the Walney Channel. The site is licensed for the purposes of operating
certain activities prescribed under the Nuclear Installations Act, 1965. The site contains sources of
direct radiation. Details of the amounts of gaseous and liquid radioactive waste discharged are
published in the RIFE reports, for example, EA, FSA, NIEA and SEPA, 2012.
2.2 Survey objectives
The Centre for Environment, Fisheries & Aquaculture Science (Cefas) undertook the Barrow habits
survey in 2012 on behalf of the Environment Agency, the Food Standards Agency, and the Office for
Nuclear Regulation. The main aim of the survey was to obtain comprehensive information on the
habits of the public that might lead to their exposure to radiation via gaseous discharges, liquid
discharges and direct radiation from the Barrow nuclear site. Additionally, habits relevant to exposure
via liquid discharges from other nuclear sites located along the north-west coast of England that make
discharges into the Irish Sea, most notably Sellafield, were investigated.
Specifically, investigations were conducted into the following:
• The consumption of food from the aquatic survey area
• Activities and occupancy over intertidal substrates
• The handling of fishing gear and sediment
• Occupancy in close proximity to sewage, sewage sludge and sewage cake
• Activities and occupancy in and on water
• The use of seaweed as a fertiliser or animal feed
• The consumption of food from the terrestrial survey area
• The use and destination of produce originating from the survey areas

THE SURVEY
16
• The consumption and use of groundwater and surface water in the terrestrial survey area
• The transfer of contamination off-site by wildlife
• Activities and occupancy within the direct radiation survey area
• New or unusual exposure pathways
No additional site-specific investigations were requested by the Environment Agency, the Food
Standards Agency or the Office for Nuclear Regulation.
2.3 Survey areas
The geographic extents of potential effects from liquid discharges, from deposition from gaseous
releases, and from direct radiation are different. Therefore, different survey areas were defined to
cover each of these three main possible sources of exposure. These were an aquatic area relating to
liquid discharges, a terrestrial area relating to deposition from potential gaseous discharges, and a
direct radiation area relating to ionising radiation emanating directly from the site. The aquatic survey
area was extended northwards to include the coast and sea area of south-west Cumbria that may be
subject to the far-field effects of Sellafield, but which is not covered in other habits surveys.
The aquatic survey area (Figure 1, page 17) covered the intertidal areas along the coast of Cumbria
between Tarn Point in the north and Roosebeck in the south, and the adjacent sea area up to 10 km
offshore. The Duddon Estuary, Walney Channel and the shore of Walney Island were included. This
area was relevant to the far-field effects from Sellafield and encompassed the area taken to represent
the predominant area of mixing of radionuclides in seawater arising from discharges from Barrow.
The terrestrial survey area (Figure 2, page 18) covered all land and bodies of freshwater within 5 km
of the Barrow site centre (National Grid Reference: SD 192 689), to encompass the main areas of
potential deposition from gaseous discharges.
The direct radiation survey area (Figure 2, p18) was defined as all land and water within 1 km of the
Barrow nuclear licensed site boundary. The occupancy data collected from the direct radiation survey
area is also applicable to inhalation and external exposure pathways arising from potential gaseous
releases from the site.
The last aquatic habits survey conducted by Cefas along this stretch of coast was carried out in 1990
(Thurston et al., 1993). Cefas has not previously conducted terrestrial or direct radiation habits
surveys at Barrow.
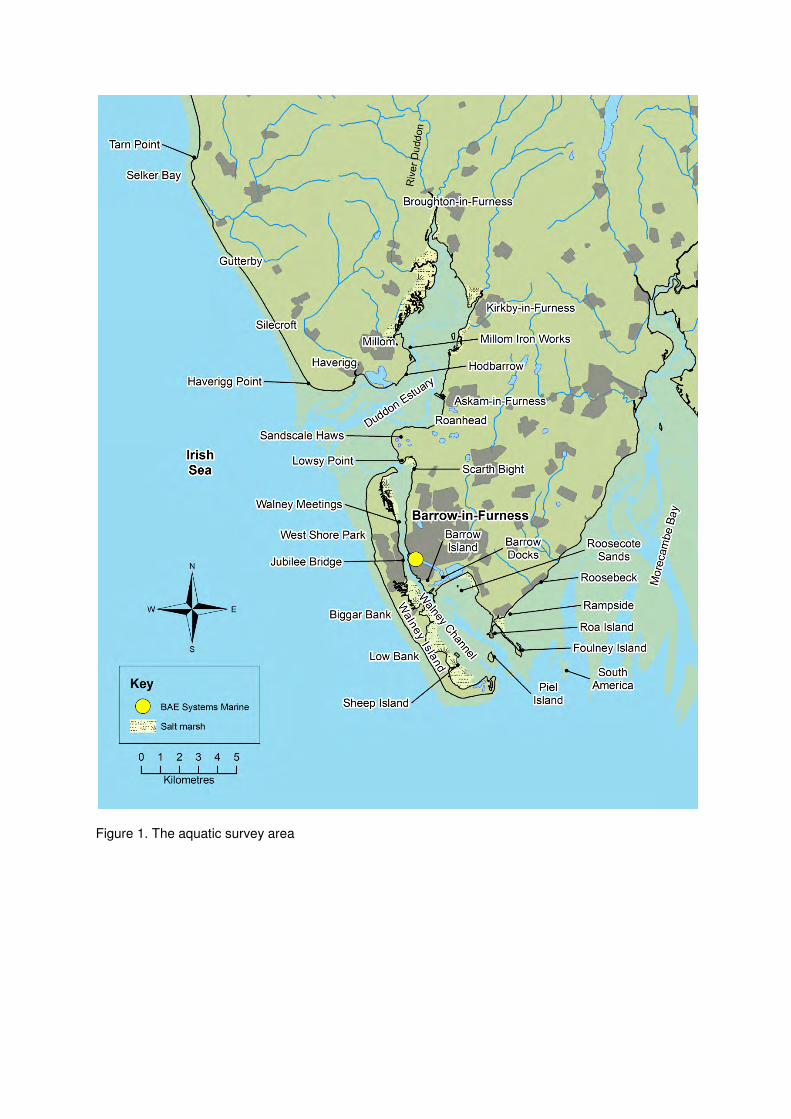
Figure 1. The aquatic survey area

Figure 2. The Barrow terrestrial (outer ring) and direct radiation (inner ring) survey areas
Key
Site Centre
Allotment Sites

Radiological Habits Survey: Barrow and the south-west Cumbrian coast, 2012
19
2.4 Conduct of the survey
As part of the pre-survey preparation, the Environment Agency, the Food Standards Agency and the
Office for Nuclear Regulation were contacted to identify any additional site-specific requirements.
Information relating to the activities of people in the aquatic and terrestrial survey areas was obtained
from Internet searches, Ordnance Survey maps and from previous habits surveys undertaken in the
aquatic survey area. People with local knowledge of the survey area were contacted for information
relevant to the various exposure pathways. These included representatives from councils, who
provided information on allotment sites.
A proposed programme for fieldwork was distributed to the Environment Agency, the Food Standards
Agency, and the Office for Nuclear Regulation before the fieldwork commenced, for their comment.
The fieldwork was carried out from the 5th to the 15
th June 2012 by a survey team of four people,
according to techniques described by Leonard et al. (1982). During the fieldwork a meeting was held
between the members of the survey team and representatives from BAE Systems Marine Ltd. This
discussion provided details about current site activities, local information, potential exposure
pathways and activities in the area, and the potential for transfer of contamination off-site by wildlife.
The following information was obtained during the meeting, or subsequently:
• The submarine moored in the Devonshire Dock at the time of the survey was nearing
completion but the reactor was not yet operational. Other submarines were in various stages
of construction in the hall.
• The site only makes liquid discharges for a period of about three months every two and a half
to three years. This is when the core plant is running during the commissioning of a new
submarine. The liquid effluent is transferred from the submarine to an Effluent Treatment
Plant on the dockside and after treatment it is discharged to the water utility company’s sewer
which flows to the Salthouse Wastewater Treatment Works. Up until 2002, when the sewage
system was upgraded, treated liquid effluent was discharged to a sewer that flowed directly
into the Walney Channel.
• The site holds permits to discharge gaseous waste but avoids making gaseous discharges
during normal operations.
• The main source of direct radiation is the radiography source store, which is located within the
licensed area. Radiography is carried out inside the licensed area and also in other parts of
the BAE premises that are outside the licensed area.
• Wildlife does not have access to the controlled areas. A Seagull Management Programme is
in operation throughout the BAE premises: debris is cleared from the gutters annually in order
to discourage the birds from nesting and regular sweeps are made of ground level areas.
• Information was provided on the possible location of farms, smallholdings and beehives.

THE SURVEY
20
Interviews were conducted with individuals who were identified in the pre-survey preparation and
others that were identified during the fieldwork. These included, for example, fishermen, anglers,
sailors, people carrying out activities on intertidal areas, farmers, gardeners, and people living,
working and undertaking recreational activities close to the site. Interviews were used to establish
individuals’ consumption, occupancy and handling rates relevant to the aquatic, terrestrial and direct
radiation survey areas. Any other information of possible use to the survey was also obtained.
Gamma dose rate measurements were taken over intertidal substrates in the aquatic area, and
indoors and outdoors at most properties in the direct radiation survey area where interviews were
conducted. Background gamma dose rates were taken at a distance beyond 5 km from the site
centre.
For practical and resource reasons, the survey did not involve the whole population in the vicinity of
the Barrow site, but targeted subsets or groups, chosen in order to identify those individuals
potentially most exposed to radiation pathways. However, it is possible that even within a subset or
group there may have been people not interviewed during the survey. Therefore, to aid interpretation,
the number of people for whom data were obtained in each group as a percentage of the estimated
complete coverage for that group (where it was possible to make such an estimate) has been
calculated. The results are summarised in Table 1. The ‘groups’ are described and quantified, and
the numbers of people for whom data were obtained are given as percentages of the totals. For
certain groups, such as anglers, it can be virtually impossible to calculate the total number of people
who undertake the activity in the survey area because it is difficult to quantify visitors from outside the
area or occasional visitors during the year. Based on UK Office of National Statistics residential data
for electoral wards (www.statistics.gov.uk) there were approximately 59300 people living in the
terrestrial survey area, although information was obtained for a significantly smaller number than this.
The survey did not include employees or contractors at the nuclear licensed site while they were at
work. This is because dose criteria applicable to these people whilst at work and the dose
assessment methods are different from those for members of the public. However, data were
collected for employees and contractors while outside work if these people were encountered during
the survey.
People were initially questioned about their habits relating to the survey area that their first identified
activity occurred in and, where possible, they were also asked about their habits relating to the other
two survey areas. For example, people in the terrestrial survey were initially questioned because it
was known that they grew or produced significant quantities of terrestrial foodstuffs. However, they
were also asked about habits that might lead to exposure to liquid discharges or direct radiation.
During interviews with representatives from groups of people, such as the crew of a rescue boat, it
was not possible to collect data for all pathways (for example consumption of local foods) for each
person. In these cases, the data were limited to those relating to the primary reason for the interview,
for example, in the case of a rescue boat crew, the time spent on intertidal areas and on water.

Radiological Habits Survey: Barrow and the south-west Cumbrian coast, 2012
21
3 METHODS FOR DATA ANALYSIS
3.1 Data recording and presentation
Data collected during the fieldwork were recorded in logbooks. On return to the laboratory, the data
were examined and any notably high rates were double-checked, where possible, by way of a
follow-up phone call. In cases where follow-up phone calls were not possible (e.g. interviewees who
wished to remain anonymous), the data were accepted at face value. The raw data were entered into
a habits survey database where each individual for whom information was obtained was given a
unique identifier (the observation number) to assist in maintaining data quality and traceability.
The results of the individuals’ consumption, occupancy and handling rates collected during the survey
were grouped and presented in tables with the high-rate group members indicated in bold and with
the calculated mean rates for the high-rate group and 97.5th percentile rates. The consumption rates,
occupancy rates and handling rates for all groups are presented in Annex 1 for adults and Annex 2 for
children and infants, with the high-rate group members indicated in bold.
Where quantifiable data cannot be obtained from interviews but pathways are believed to exist, it is
sometimes necessary to provide estimated habits data for use in dose assessments. In this series of
habits survey reports, such data is usually presented in Annex 3. It was not necessary to estimate
data for the Barrow survey, but Annex 3 is included in this report to maintain consistency of
presentation through the series of reports.
3.2 Data conversion
During the interviews, people could not always provide consumption rates in kilograms per year for
food or litres per year for milk. In these circumstances, interviewees were asked to provide the
information in a different format. For example, some estimated the size and number of items (e.g.
eggs) consumed per year, whereas others gave the number of plants in a crop or the length and
number of rows in which the crop was grown per year. The database converted these data into
consumption rates (kg y-1 for food and l y
-1 for milk) using a variety of conversion factors. These
factors included produce weights (Hessayon, 1990 and 1997 and Good Housekeeping, 1994), edible
fraction data researched by Cefas, and information supplied by the Meat and Livestock Commission.
3.3 Rounding and grouping of data
The consumption and occupancy data in the text of this report are rounded to two significant figures,
except for values less than 1.0, which are rounded to one decimal place. This method of presentation
reflects the authors’ judgement on the accuracy of the methods used. In the tables and annexes, the
METHODS FOR DATA ANALYSIS
22
consumption rate data are presented to one decimal place. Occasionally, this rounding process
causes the computed values (row totals, mean rates and 97.5th percentiles), which are based on
un-rounded data, to appear slightly erroneous. Consumption rates less than 0.05 kg y-1 are presented
to two decimal places in order to avoid the value of 0.0 kg y-1
. External exposure data are quoted as
integer numbers of hours per year.
For the purpose of data analysis, foodstuffs were aggregated into food groups as identified in Table 2.
Specific food types relevant to this survey are presented in the subsequent tables. The data are
structured into groups when it is reasonable to assume that consistent concentrations or dose rates
would apply within the group. For example, when considering terrestrial food consumption, all types
of root vegetables are grouped together in a food group called ‘root vegetables’. Similarly, for aquatic
food consumption, all crustacean species are grouped as ‘crustaceans’. For external exposure over
intertidal sediments, occupancies over the same substrate (e.g. sand) are grouped together.
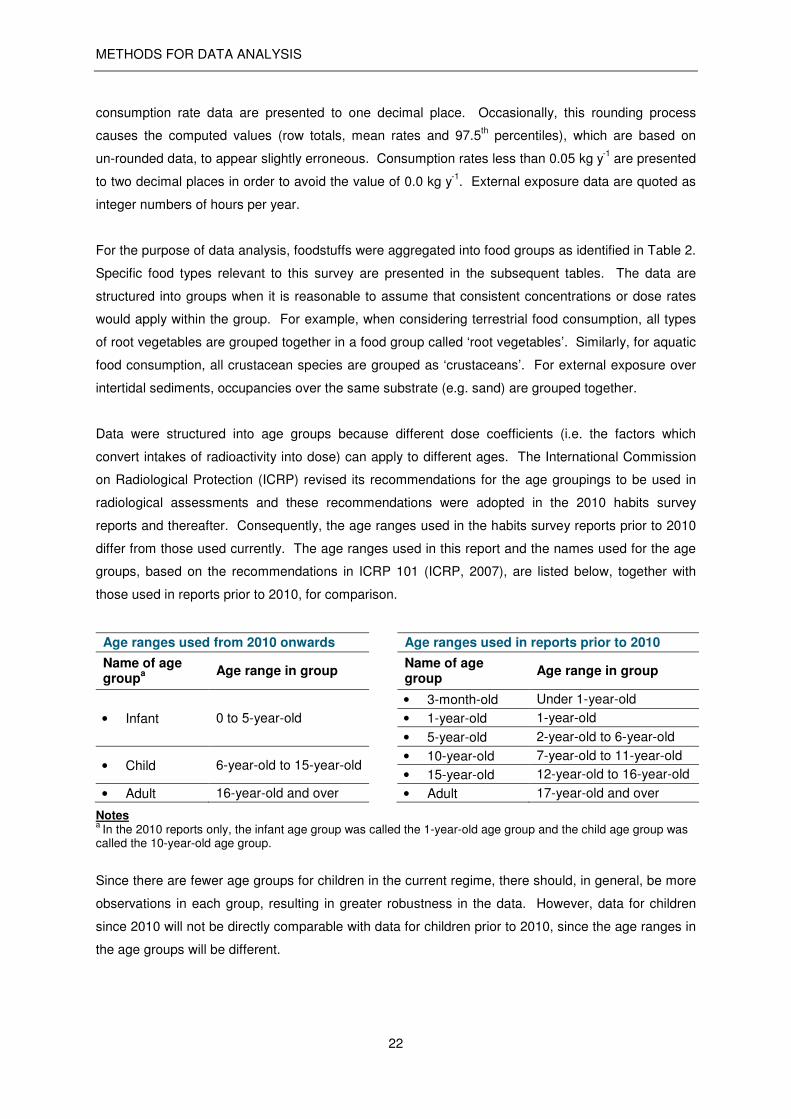
Data were structured into age groups because different dose coefficients (i.e. the factors which
convert intakes of radioactivity into dose) can apply to different ages. The International Commission
on Radiological Protection (ICRP) revised its recommendations for the age groupings to be used in
radiological assessments and these recommendations were adopted in the 2010 habits survey
reports and thereafter. Consequently, the age ranges used in the habits survey reports prior to 2010
differ from those used currently. The age ranges used in this report and the names used for the age
groups, based on the recommendations in ICRP 101 (ICRP, 2007), are listed below, together with
those used in reports prior to 2010, for comparison.
Age ranges used from 2010 onwards Age ranges used in reports prior to 2010
Name of age group
a
Age range in group Name of age group
Age range in group
• Infant 0 to 5-year-old
• 3-month-old Under 1-year-old
• 1-year-old 1-year-old
• 5-year-old 2-year-old to 6-year-old
• Child 6-year-old to 15-year-old • 10-year-old 7-year-old to 11-year-old
• 15-year-old 12-year-old to 16-year-old
• Adult 16-year-old and over • Adult 17-year-old and over
Notes a
In the 2010 reports only, the infant age group was called the 1-year-old age group and the child age group was called the 10-year-old age group.
Since there are fewer age groups for children in the current regime, there should, in general, be more
observations in each group, resulting in greater robustness in the data. However, data for children
since 2010 will not be directly comparable with data for children prior to 2010, since the age ranges in
the age groups will be different.

Radiological Habits Survey: Barrow and the south-west Cumbrian coast, 2012
23
For direct radiation pathways, the data were grouped into distance zones from the nuclear site
boundary as a coarse indication of the potential dose rate distribution due to this source of exposure.
The bands used in this report were: 0 – 0.25 km; >0.25 – 0.5 km; >0.5 – 1.0 km. These distance
bands are also useful when assessing exposure to gaseous discharges.
3.4 Approaches for the identification of high rates
The habits data have been analysed to identify high rates of consumption, occupancy and handling,
which are suitable for use in radiological assessments. Three approaches have been used:
Firstly, the ‘cut-off’ method described by Hunt et al. (1982) was used. With the ‘cut-off’ method, the
appropriate high rate was calculated by taking the arithmetic mean of the values between the
maximum observed rate and one third of the maximum observed rate. In this report, the term
‘high-rate group’ is used to represent the individuals derived by the ‘cut-off’ method. The mean of the
high-rate group was calculated for each food group, intertidal substrate and handling pathway
identified in the survey. In certain cases, using the ‘cut-off’ method resulted in only one person being
in the high-rate group. In these cases, expert judgement was used to decide whether the high-rate
group should remain as one individual or whether others should be included. If others were included,
the second highest rate was divided by three and all observations above this were included in the
high-rate group.
Secondly, the 97.5th percentile rate was calculated for each group by using the Microsoft Excel
mathematical function for calculating percentiles. The use of percentiles accords with precedents
used in risk assessments of the safety of food consumption. It should be noted that the interviewees
in this study are often selected and, therefore, the calculated percentiles are not based on random
data.
Thirdly, profiles have been produced that give a complete view of the habits of the individual that
might lead to exposure to all the discharges and radiation from the site. The profiles are based on
values calculated by the ‘cut-off’ method. The profiled data can be used to assess total dose
integrated across all pathways of exposure.
Mean and 97.5th percentile consumption rates for adults based on national statistics have been
derived by the Ministry of Agriculture, Fisheries and Food (MAFF) (now a part of the Department for
Environment, Food and Rural Affairs, Defra) and the Food Standards Agency (Byrom et al., 1995 and
FSA, 2002), and these are referred to as generic rates in this report. The generic rates are used as a
baseline for comparison with the observed rates.
The mean rates for the high-rate groups for children and infants for consumption, intertidal occupancy
and handling pathways, have been calculated. However, in cases where few child or infant

METHODS FOR DATA ANALYSIS
24
observations were identified, an alternative approach that may be used for assessments is to estimate
the mean rates for the high-rate groups for children and infants by applying scaling ratios to the mean
rates for the high-rate groups for adults. Ratios for this purpose for the consumption and intertidal
occupancy pathways, based on generic 97.5th percentile rates, are provided in Annex 4. The age
ranges within the age groups in Annex 4 do not correspond exactly with the age ranges within the age
groups used throughout the rest of this report, but these ratios are the best available data for
estimating child rates and infant rates from adult rates. Adult to child and adult to infant ratios are not
available for handling pathways.
For use in assessments of foetal dose, consumption and occupancy rates are provided in Annex 5 for
women of childbearing age. The age range used in this report for women of childbearing age is
15 – 44 years old, which is based on the classification used by the Office of National Statistics
(www.statistics.gov.uk).
For the direct radiation pathway, mean occupancy rates and 97.5th percentile rates have not been
calculated. Such an analysis is of limited value without a detailed knowledge of the spatial extent of
dose rates due to direct radiation.
3.5 Data quality
To ensure the quality of the data collected during the survey fieldwork and presented in the report, the
following procedures have been employed:
• Experienced scientific staff were used for the fieldwork and data analysis. They had been
trained in the techniques of interviewing and obtaining data for all pathways that were relevant
to the survey being conducted. Where individuals offered information during interview that
was considered unusual, they were questioned further in order to double-check the validity of
their claims.
• Where possible, interviewees were contacted again to confirm the results of the initial
interview if, when final consumption or occupancy rates were calculated, observations were
found to be high in relation to our experience of other surveys. Local factors were taken into
account in these cases.
• Data were manipulated in a purpose-built database using a consistent set of conversion
factors.
• Data were stored in a database in order to minimise transcription and other errors.
• Draft reports were reviewed by the Environment Agency, the Food Standards Agency and the
Office for Nuclear Regulation, and by a senior radiological consultant.
• Final reports were only issued when the Environment Agency, the Food Standards Agency
and the Office for Nuclear Regulation were entirely satisfied with the format and content of the
draft report.
Radiological Habits Survey: Barrow and the south-west Cumbrian coast, 2012
25
4 AQUATIC RADIATION PATHWAYS
4.1 Aquatic survey area
The aquatic survey area (Figure 1, page 17) relating to the Barrow site and also the far-field effects of
Sellafield, covered the intertidal areas along the coast of Cumbria between Tarn Point in the north and
Roosebeck in the south, and the adjacent sea area up to 10 km offshore. The Duddon Estuary,
Walney Channel and the shore of Walney Island were included. For the purposes of this survey the
entire stretch of water between Walney Island and the mainland is referred to as the Walney Channel.
The northern part of the survey area, between Tarn Point and Haverigg Point, and the west coast of
Walney Island have exposed shores of sand and stones. The Duddon Estuary and Walney Channel
are more sheltered areas with extensive sand flats and mud flats that are exposed at low tide, and
areas of fringing salt marsh. The small section of coast at the south end of the survey area, between
the south end of the Walney Channel and Roosebeck, is within Morecambe Bay and this area also
has extensive sand flats exposed at low water.
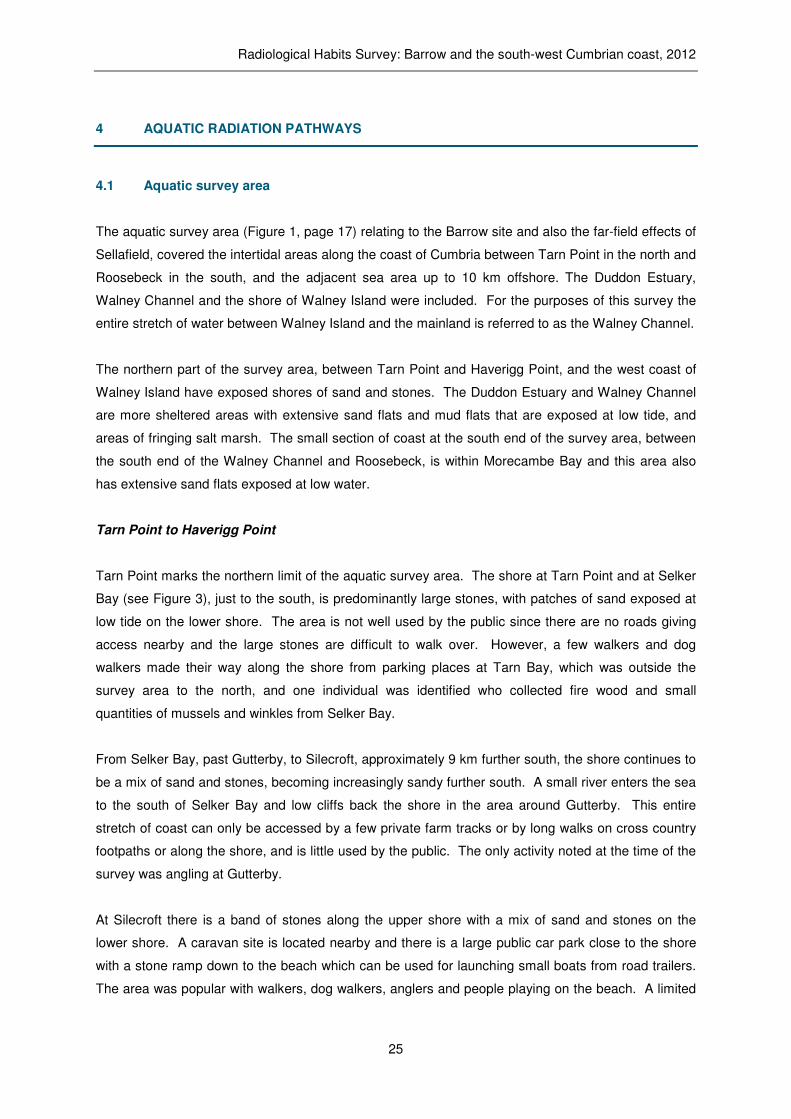
Tarn Point to Haverigg Point
Tarn Point marks the northern limit of the aquatic survey area. The shore at Tarn Point and at Selker
Bay (see Figure 3), just to the south, is predominantly large stones, with patches of sand exposed at
low tide on the lower shore. The area is not well used by the public since there are no roads giving
access nearby and the large stones are difficult to walk over. However, a few walkers and dog
walkers made their way along the shore from parking places at Tarn Bay, which was outside the
survey area to the north, and one individual was identified who collected fire wood and small
quantities of mussels and winkles from Selker Bay.
From Selker Bay, past Gutterby, to Silecroft, approximately 9 km further south, the shore continues to
be a mix of sand and stones, becoming increasingly sandy further south. A small river enters the sea
to the south of Selker Bay and low cliffs back the shore in the area around Gutterby. This entire
stretch of coast can only be accessed by a few private farm tracks or by long walks on cross country
footpaths or along the shore, and is little used by the public. The only activity noted at the time of the
survey was angling at Gutterby.
At Silecroft there is a band of stones along the upper shore with a mix of sand and stones on the
lower shore. A caravan site is located nearby and there is a large public car park close to the shore
with a stone ramp down to the beach which can be used for launching small boats from road trailers.
The area was popular with walkers, dog walkers, anglers and people playing on the beach. A limited

AQUATIC RADIATION PATHWAYS
26
amount of bait digging took place out on the sands and horse riders were observed. Individuals were
recorded swimming, body boarding and kayaking off the beach.
Figure 3. Selker Bay
South from Silecroft the shore continues as a band of stones with sand flats below, but towards the
mouth of the Duddon Estuary, around Haverigg Point, the stones fade out and the sand flats become
more extensive. A broad area of sand dunes backs the shore at Haverigg Point and there is no direct
road access along this stretch of coast.
Haverigg Point to Millom Iron Works
Situated to the east of Haverigg Point, the village of Haverigg is a popular coastal resort with large car
parks close to the beach and a caravan park and holiday chalets close by. The upper shore is
predominantly sand but there are patches of stones around the mouth of a small river that cuts
through the village before entering the sea. At low tide, wide sand flats are exposed that extend out
into the Duddon Estuary. A few yachts and other pleasure boats, which rest on sediments at low
water, are moored in the river or anchored just offshore. A tarmac ramp leads to the beach and this is
used for launching a volunteer inshore rescue boat that is based nearby and also small pleasure
boats brought by road trailer. The sand beach was popular for walking, dog walking, angling and
playing. Horse riders were observed out on the sands and individuals were recorded paddling and
kayaking in the water.
To the east of Haverigg there is a large brackish lagoon that is separated from the sea by an earth
embankment reinforced with boulders and concrete slabs on its seaward face. Water skiing takes

Radiological Habits Survey: Barrow and the south-west Cumbrian coast, 2012
27
place within the lagoon and a track runs along the top of the embankment providing access to the
seaward side. Anglers cast into the sea from the concrete slabs and one individual was identified
collecting small quantities of mussels from the rocks facing the embankment, for his own family’s
consumption.
Eastwards from the embankment, the upper shore at Hodbarrow is sand and stones backed by low
rock cliffs, changing to sand backed by low sand dunes further east. The shore at Hodbarrow can be
accessed from Haverigg via the track along the embankment and from another track round the
landward side of the lagoon, or from the town of Millom by footpaths across the fields. The area was
popular with anglers, who fished from the upper shore at high tide or made their way out across the
sand flats to fish in the estuary channel at low tide. The beach was also used by dog walkers and
people playing and sitting.
From the point at the north-east end of Hodbarrow beach a dilapidated quay, which is used by anglers
at high tide, extends north-west towards Millom Iron Works Nature Reserve. The quay gives way to a
rubble embankment in front of the nature reserve and a track down the embankment provides access
to the shore from a parking area at the end of an approach road. The upper shore in this area is a
mix of mud and stones. This was a very popular place for collecting peeler crabs from among the
stones, for use as angling bait (see Figure 4). Several individuals also built small shelters out of
house bricks or laid sections of plastic pipe and old car tyres to attract the crabs by providing hiding
places for them. At low water a shallow channel flows close to the shore but many people wade
across it in order to dig for lugworms for angling bait on the extensive sand flats on the other side.
Figure 4. Near Millom Iron Works Nature Reserve.

AQUATIC RADIATION PATHWAYS
28
To the west of the approach road, the coast turns northwards, creating a sheltered bay where a few
angling boats and other small pleasure craft are moored.
Millom Iron Works to Askam-in-Furness
From Millom northwards to where the River Duddon enters the Duddon Estuary, near Broughton-in-
Furness, there are extensive areas of salt marsh along almost all of the shore (see Figure 5). Most of
the marshes are only accessible via farm tracks or from a footpath on top of the earth embankment on
the landward side of the marshes. Dog walkers that used the marsh near Millom mainly stayed on the
embankment path, which was above the high water mark. Several local farmers grazed sheep on the
salt marshes for all or part of the year and spent time on the marshes tending their livestock. The
marshes were also used for shooting by the members of a wildfowling association. Farmers
occasionally went out onto the sand flats in the northern part of the estuary to rescue stray sheep but,
although it was possible to walk across the sand flats from one side of the estuary to the other, no
other activities were identified taking place on the sand flats in this area.
Figure 5. West side of the Duddon Estuary
From Broughton-in-Furness southwards towards Askam-in-Furness on the east side of the Duddon
Estuary the shore is predominantly sand with a few patches of stones and several belts of salt marsh.
Wildfowling and sheep grazing took place on the salt marshes but there were few access points to the
shore and no other activities were identified taking place on the intertidal zone in this area at the time
of the survey.

Radiological Habits Survey: Barrow and the south-west Cumbrian coast, 2012
29
At Askam-in-Furness there is a car park close to the shore and multiple access points to the shore
from the town. A prominent pier, made from slag from a former iron works, extends out into the sands
of the estuary and a few anglers fish from the pier at high water. The shore is mainly sand but to the
north of the pier there is a patch of salt marsh and several angling and pleasure boats are kept pulled
up on the marsh or moored in the mud gullies running through it. One individual was identified who
lived on a houseboat in this area. An inshore rescue boat is kept in a hut above the shore and a few
angling boats are kept in compounds close by. Vehicles are used to tow these craft down a track to
the beach for launching. At low tide the boats are towed a long way across the sands to reach the
deep water channel further south. The beaches at Askam-in-Furness, particularly those on the south
side of the pier (see Figure 6), were popular recreational areas used by dog walkers and people
playing. A limited amount of bait digging took place on the sands offshore and one person was
identified pleasure riding on a quad bike. A guided adventure walk takes place across the sands of
the estuary between Askam-in-Furness and Millom, approximately once per year.
Figure 6. South side of the pier at Askam-in-Furness
Askam-in-Furness to Lowsy Point
Approximately 2 km south of Askam-in-Furness there is a car park close to the shore at Roanhead,
which provides access to the dunes of the Sandscale Haws National Nature Reserve to the west, as
well as the beaches in the area. The shore at Roanhead and around Sandscale Haws is
predominantly sand with isolated patches of mixed sand and stones. At low tide the sand flats of
Duddon Sands are exposed, extending up to approximately 3 km from the shore. The area was
popular with visitors, and individuals were recorded dog walking, angling, playing, kite flying and bait
digging.

AQUATIC RADIATION PATHWAYS
30
To the south of Sandscale Haws, Lowsy Point marks the northern limit of the Walney Channel. There
are large areas of stones on the upper shore around the point and the lower shore is sand. Close to
the shore there is an isolated community of about twenty former fishermen’s huts which are now used
as holiday homes. Many of the residents have small boats, which they launch across the shore using
tractors, and are engaged in hobby fishing and boat angling. Bait digging, dog walking and shore
angling were identified taking place in the area and a few people collected small quantities of cockles
for their own consumption from out on the sands.
The west coast of Walney Island
A band of stones forms the upper shore along the whole length of the west coast of Walney Island
and the lower shore is composed of patches of sand, patches of stones and patches of mixed sand
and stones. The area is close to the population centres of Vickerstown and Barrow-in-Furness and is
popular with visitors. Most activities took place close to the four car parks spread along the coast.
At West Shore Park (see Figure 7), located towards the north end of Walney Island, there is a large
car park and a concrete slipway provides access to the shore. There is a holiday park and kite-
surfing school close by and the area is popular with kite-surfers, windsurfers, anglers, and families
having days out on the beach, playing and swimming.
Figure 7. West Shore Park on the west coast of Walney Island

Radiological Habits Survey: Barrow and the south-west Cumbrian coast, 2012
31
Further south there are two car parks in the vicinity of Biggar Bank and this area attracted many
visitors including walkers, dog walkers, anglers, bait diggers, and people collecting crabs, playing and
swimming.
Towards the south end of the island there is a car park at Low Bank and although the shore here was
not as busy as further north, it attracted a few visitors. Individuals were recorded dog walking,
angling, quad biking and collecting small quantities of winkles for their own consumption. Wildfowling
was reported to take place on the shore towards the southern end of the island. Oyster spat were
reared commercially in flooded gravel pits at the south end of the island but the operation did not
involve intertidal activities.
The Walney Channel (taken as the entire stretch of water between Walney Island and the mainland)
The north end of the Walney Channel dries out almost entirely at low tide, revealing wide sand flats
and mud flats. There is a large area of salt marsh on the Walney Island side of the channel and a
smaller area of salt marsh in Scarth Bight, on the mainland side. The central section of the Walney
Channel, from Walney Meetings southwards to the entrance to Barrow Docks, is narrower and the
substrate is a mix of mud, sand and stones. There is a large mussel bed at Walney Meetings and
several other mussel beds scattered throughout this section. A channel, which retains water at low
tide, extends southwards from just north of the Jubilee Bridge. To the south of the dock entrance
there are extensive sand flats and mud flats on both sides of the channel with large areas of salt
marsh on the Walney Island side and smaller areas of salt marsh at Roosecote Sands on the
mainland side. At the southern end of the Walney Channel there are four islands; Sheep Island, Piel
Island, Roa Island and Foulney Island. Roa Island is accessible by road along a causeway from the
mainland and Foulney Island can be reached on foot from the mainland by a path along a stone
causeway.
A wide variety of activities took place in the Walney Channel. It was a very popular boating area and
many yachts, pleasure boats, angling boats and fishing boats were moored in the channel, mainly in
the area close to the Jubilee Bridge (see Figure 8). Many of the boats rested on the sediment at low
tide and individuals were identified carrying out maintenance on their boats which were resting on
mud and sand. A sailing club with 80 members had its own slipway on the east side of the channel
just to the north of the Jubilee Bridge and slightly further north there was a compound on the quay
where fishermen stored their gear. On the opposite side of the channel there is a public slipway,
which is a popular place for launching small boats and jet-skis brought by road trailers. A boat club,
with its own boat compound, storage huts and slipway is located on the east side of the channel
approximately 1 km to the south of the bridge. The club had 45 adult members and 30 junior
members and catered for yacht sailors, boat anglers and hobby fishermen. At Roa Island, at the
south end of the Walney Channel, there is a boat club and a lifeboat station with both an inshore and
an offshore lifeboat. The boat club had 180 members and catered for yacht sailors, dinghy sailors,
AQUATIC RADIATION PATHWAYS
32
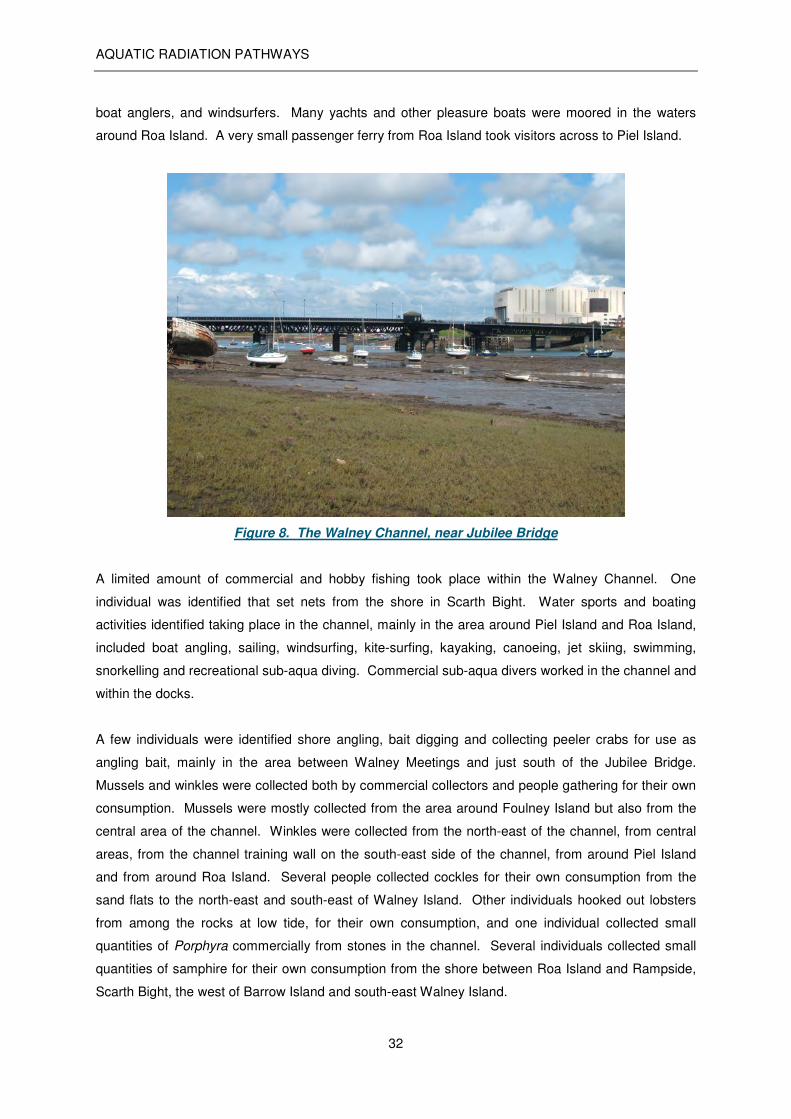
boat anglers, and windsurfers. Many yachts and other pleasure boats were moored in the waters
around Roa Island. A very small passenger ferry from Roa Island took visitors across to Piel Island.
Figure 8. The Walney Channel, near Jubilee Bridge
A limited amount of commercial and hobby fishing took place within the Walney Channel. One
individual was identified that set nets from the shore in Scarth Bight. Water sports and boating
activities identified taking place in the channel, mainly in the area around Piel Island and Roa Island,
included boat angling, sailing, windsurfing, kite-surfing, kayaking, canoeing, jet skiing, swimming,
snorkelling and recreational sub-aqua diving. Commercial sub-aqua divers worked in the channel and
within the docks.
A few individuals were identified shore angling, bait digging and collecting peeler crabs for use as
angling bait, mainly in the area between Walney Meetings and just south of the Jubilee Bridge.
Mussels and winkles were collected both by commercial collectors and people gathering for their own
consumption. Mussels were mostly collected from the area around Foulney Island but also from the
central area of the channel. Winkles were collected from the north-east of the channel, from central
areas, from the channel training wall on the south-east side of the channel, from around Piel Island
and from around Roa Island. Several people collected cockles for their own consumption from the
sand flats to the north-east and south-east of Walney Island. Other individuals hooked out lobsters
from among the rocks at low tide, for their own consumption, and one individual collected small
quantities of Porphyra commercially from stones in the channel. Several individuals collected small
quantities of samphire for their own consumption from the shore between Roa Island and Rampside,
Scarth Bight, the west of Barrow Island and south-east Walney Island.
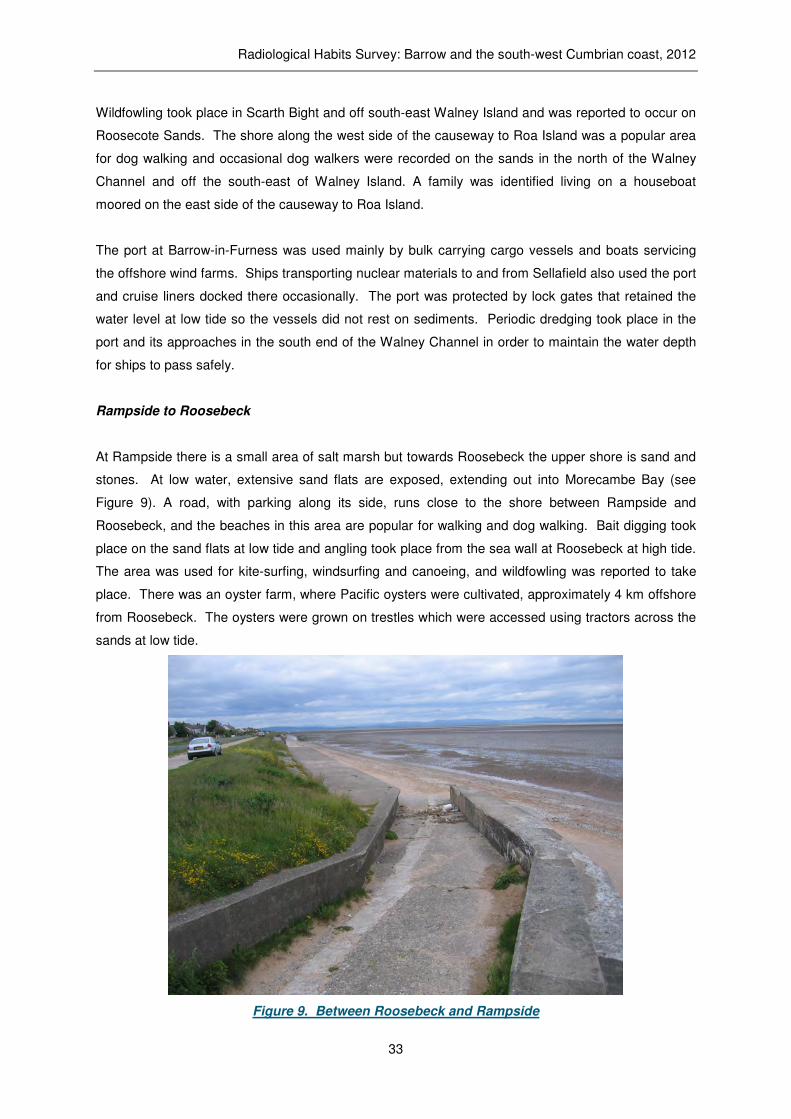
Radiological Habits Survey: Barrow and the south-west Cumbrian coast, 2012
33
Wildfowling took place in Scarth Bight and off south-east Walney Island and was reported to occur on
Roosecote Sands. The shore along the west side of the causeway to Roa Island was a popular area
for dog walking and occasional dog walkers were recorded on the sands in the north of the Walney
Channel and off the south-east of Walney Island. A family was identified living on a houseboat
moored on the east side of the causeway to Roa Island.
The port at Barrow-in-Furness was used mainly by bulk carrying cargo vessels and boats servicing
the offshore wind farms. Ships transporting nuclear materials to and from Sellafield also used the port
and cruise liners docked there occasionally. The port was protected by lock gates that retained the
water level at low tide so the vessels did not rest on sediments. Periodic dredging took place in the
port and its approaches in the south end of the Walney Channel in order to maintain the water depth
for ships to pass safely.
Rampside to Roosebeck
At Rampside there is a small area of salt marsh but towards Roosebeck the upper shore is sand and
stones. At low water, extensive sand flats are exposed, extending out into Morecambe Bay (see
Figure 9). A road, with parking along its side, runs close to the shore between Rampside and
Roosebeck, and the beaches in this area are popular for walking and dog walking. Bait digging took
place on the sand flats at low tide and angling took place from the sea wall at Roosebeck at high tide.
The area was used for kite-surfing, windsurfing and canoeing, and wildfowling was reported to take
place. There was an oyster farm, where Pacific oysters were cultivated, approximately 4 km offshore
from Roosebeck. The oysters were grown on trestles which were accessed using tractors across the
sands at low tide.
Figure 9. Between Roosebeck and Rampside
AQUATIC RADIATION PATHWAYS
34
4.2 Commercial fisheries
Commercial fisheries in the area were limited and only one full time commercial fisherman and a few
part time fishermen were identified. It was reported that several fishermen, who had sold up and left
the industry when the wind farms were built on many of the traditional fishing grounds offshore, were
attempting to start fishing again.
There were no fishing ports in the area. Most fishing boats were kept moored in the Walney Channel
and there was a compound used for storing fishing gear at the quay near to the Dock Museum.
Several different commercial fishing activities were identified and most were on a very small scale.
These included: gill netting for grey mullet and bass; gill netting for cod; potting for whelks; otter
trawling for mixed whitefish; hand gathering mussels, winkles and seaweed; oyster farming.
Gill netting for grey mullet and bass took place mainly in the Walney Channel during the summer
months and involved working from the shore as well as from boats. Gill netting for cod and other
whitefish was mainly carried out during the winter in the waters to the west of Walney Island and off
the mouth of the Duddon Estuary. Potting for whelks was mainly carried out in the south end of the
Walney Channel. Most of the trawling for mixed whitefish was carried out to the west and south of
Walney Island. Catches of whitefish included cod, whiting, plaice, flounder, lemon sole and a wide
variety of other species. It was reported that fishing boats based outside the survey area occasionally
fished within the survey area.
Mussels were collected by hand at low tide, mainly from the area around Foulney Island but also from
the Walney Channel. Both edible size mussels and seed (i.e. immature) mussels were collected.
The mussel fishery attracted collectors from outside the survey area as well as local people, but most
individuals only collected mussels for a few days each year. Small quantities of winkles were also
collected by hand from around Roa Island and the north-east of the Walney Channel.
During most years there is a good settlement of seed mussel on a bank to the south-east of Foulney
Island called South America, but the bank is exposed and the small mussels are in danger of being
swept away in winter storms. A large shellfish merchant based in Barrow-in-Furness reported that he
planned to dredge seed mussel from South America and relay them in the sheltered area around
Walney Meetings in the Walney Channel, after first removing the natural mussel beds found there,
which are of poor quality. The mussels would be left to grow overwinter in the channel before being
sold on to growers elsewhere. This venture had not commenced at the time of the survey. The same
merchant also reported that he hoped to start a fishery for razor shells off the mouth of the Duddon
Estuary and that he had already carried out experimental fishing trials.
Radiological Habits Survey: Barrow and the south-west Cumbrian coast, 2012
35
Pacific oysters spat were reared in flooded gravel pits at the south end of Walney Island and grown
on at an oyster farm situated about 4 km offshore from Roosebeck. One individual collected small
quantities of seaweed (Porphyra) from the Walney Channel on a commercial basis.
The sands off Roosebeck are part of the potential cockle fishing area of Morecambe Bay. Historically,
there has been an important cockle fishery in Morecambe Bay but the cockle beds have been closed
by the authorities since 2008 owing to low stocks and the small size of the cockles. It is not known
when, or if, the beds will be opened again. When the fishery was last open it attracted gangs from
outside the area as well as local people. The method of fishing for cockles is by hand raking at low
water.
4.3 Destination of seafood originating from the aquatic survey area
Most of the fish and shellfish were sent to destinations outside the survey area.
Grey mullet, bass and other whitefish were mainly sold through Fleetwood fish market, from where
they were distributed nationally. Whelks were mainly sold to a merchant in Fleetwood for export.
Mussels and winkles were bought by wholesalers based in Barrow-in-Furness and at Newbiggin,
which is just outside the survey area in Morecambe Bay. Edible size mussels were sold on to
operations in south-west England and France for depuration and seed mussels were sold on for
relaying in Wales and Europe. Winkles were mainly sent to France. Pacific oysters were sold for
further growing on, mainly in Scotland, Ireland and France. Seaweed (Porphyra) was sold to a
commercial producer of laverbread in Wales. Small quantities of fish, and shellfish were sold directly
to the public by the fishermen.
4.4 Hobby fishing, angling and non-commercial shellfish collecting.
In this report, the term ‘hobby fishing’ is used to describe recreational fishing on a small scale with
gear such as nets or pots. It is usually carried out by fishermen who do not have commercial fishing
licences and therefore it is illegal to offer the catch for sale. Several hobby fishermen operated in the
survey area and they mainly used gill nets, lobster pots and trawl nets. One individual was identified
who set nets from the shore in Scarth Bight, at the north end of the Walney Channel. At low tide,
brown crabs and common lobsters were hooked out from among the stones on the west side of
Walney Island and in the Walney Channel, particularly around Piel Island. It was reported that
recreational divers sometimes collected lobsters while diving in the Walney Channel. Hobby
fishermen mainly caught bass, grey mullet, flounder, plaice, brown crabs and common lobsters. The
catches were consumed by the fishermen’s families and friends.
A charter angling boat based in the Walney Channel offered occasional angling trips to the south and
west of Walney Island but also fished at offshore wrecks outside the survey area. Many private

AQUATIC RADIATION PATHWAYS
36
angling boats were moored or launched from slipways in the Walney Channel and a few were kept
near Millom Iron Works, at Askam-in-Furness and at Lowsy Point. Shore angling was popular at
many locations including Silecroft, Haverigg, Hodbarrow, Askam-in-Furness pier, Roanhead, Lowsy
Point, the west coast of Walney Island, near the Jubilee Bridge in the Walney Channel and off the
seawall at Roosebeck. The main edible species caught by shore anglers were bass, cod, dab,
flounder and plaice. Boat anglers caught the same species as shore anglers and also caught
mackerel.
Ten individuals were identified who collected small amounts of molluscs, including cockles, mussels
and winkles for their own family’s consumption. The cockles were collected from the sand flats off the
north-east and south-east of Walney Island and in the Duddon Estuary near Lowsy Point. The
mussels were collected from the Walney Channel, Foulney Island, Hodbarrow and Selker Bay. The
winkles were collected from the Walney Channel, the south-west of Walney Island and Selker Bay.
One recreational diver was identified who collected whelks while diving at the south end of the
Walney Channel and it was reported that other individuals caught or collected whelks from the area
around Piel Island.
4.5 Salthouse Wastewater Treatment Works
Activities at the Salthouse Wastewater Treatment Works were investigated because liquid waste from
the Barrow site is discharged via the sewer pipes to these works where it undergoes an activated
sludge sewage treatment process. (Prior to 2002, when the sewer system was upgraded, liquid
discharges were made to a sewer that flowed directly into the Walney Channel without going through
a sewage treatment plant).
During the sewage treatment process, solid matter settles out to form sludge. The sludge has further
treatment to remove water, which produces sewage cake. The sewage cake is taken away from the
plant by contractor’s lorries and spread on farmland as a fertiliser and soil conditioner, mainly in
Cumbria. No farms in the terrestrial survey area were identified that had sewage cake applied to the
land. The treated water is discharged into the Walney Channel via a pipeline across Roosecote
Sands.
Employees and contractors at the wastewater treatment works spent time in close proximity (<10
metres) to the sewage, sewage sludge and sewage cake while carrying out their duties. The works
were compact so the employees were within 10 metres of the sewage or its products for almost all of
the time they were at the works. Occupancy rates for these employees and a contractor are
presented in Section 4.12.

Radiological Habits Survey: Barrow and the south-west Cumbrian coast, 2012
37
It was reported that the only activities likely to take place in the sewers between the Barrow site and
the wastewater treatment works were repairs in the case of a collapse or cleaning in the case of a
blockage. Both of these were considered to be rare events.
4.6 Wildfowling
Three wildfowling clubs were identified that shot within the survey area. One club had approximately
30 members, another club had approximately 50 members and the third club had approximately 55
members. The wildfowling season extended from 1st September to 20
th February but the clubs
imposed more restrictive dates in some areas. Wildfowling took place on salt marshes and intertidal
areas on the west and east banks of the Duddon Estuary, at the north end of the Walney Channel, on
Roosecote Sands on the south-east side of the Walney Channel, on the south-west side of the
Walney Channel and, to a lesser extent, on the south-west side of Walney Island and off Roosebeck
in Morecambe Bay. A wide variety of wildfowl were being shot including Canada goose, greylag
goose, mallard, pink-footed goose, pintail, shoveler, teal and wigeon. The shot wildfowl were
consumed by the wildfowlers and their families and friends.
4.7 Other pathways
The Port of Barrow-in-Furness and the approaches to the port through the south end of the Walney
Channel are regularly dredged in order to maintain the water depth for ships to navigate. Dredging is
usually carried out two times per year over a period of five or six weeks each time, by a vessel using a
suction dredge. The dredged sediment is dumped at a spoil ground near Lightning Knoll,
approximately 7 km south of Walney Island. The dredger carries approximately 13 crew but the
dredging process is highly automated and they have little physical contact with the sediment.
Sheep were identified grazing on salt marsh at seven farms in the aquatic survey area, two of which
were also in the terrestrial survey area. The salt marshes where grazing took place were located on
the west side of the Duddon Estuary and the south-west of Walney Island. It was reported that sheep
were also grazed on salt marshes on the east side of the Duddon Estuary. Some sheep grazed on
salt marsh all year, while others spent only part of the year on the marsh.
Seven people were identified collecting small quantities of samphire for their own consumption and for
consumption by their families and friends. The samphire was collected from Scarth Bight, near the
Boat Club on the west side of Barrow Island, on south-east Walney Island and between Roa Island
and Rampside.
Two houseboats were identified. One was moored on the north side of the pier at Askam-in-Furness
and the other was moored on the east side of the causeway to Roa Island. Both the vessels were
kept on the higher shore and they rested on mud and sand for most of the time. The boat at Askam-

AQUATIC RADIATION PATHWAYS
38
in-Furness was occupied by one adult and the boat at Roa Island was occupied by two adults and a
child.
The use of seaweed as a fertiliser or animal fed was not identified.
4.8 Food consumption data
Consumption data for aquatic foods are presented in Tables 3 to 8 for adults and in Tables 9 to 11 for
children and infants. The tables include the mean consumption rates for the high-rate groups and the
observed 97.5th percentile rates calculated as described in Section 3.4.
Adults’ consumption rates
The people consuming the greatest quantities of food from the aquatic survey area were commercial
and hobby fishermen, anglers, wildfowlers, people who collected shellfish or marine plants, and the
families and friends of these groups of people.
Table A presents a summary of the adults’ consumption rates for the following food groups: fish;
crustaceans; molluscs; wildfowl; marine plants/algae; salt marsh grazed sheep meat. The table
includes the mean consumption rates for the high-rate groups and the observed 97.5th percentile
rates. For comparison, the table also includes mean consumption rates and 97.5th percentile
consumption rates for fish, crustaceans and molluscs based on national data, which are referred to as
‘generic’ data in this report. No generic rates have been determined for wildfowl, marine plants/algae
or salt marsh grazed sheep meat.
Table A. Summary of adults’ consumption rates of foods from the aquatic survey area
Fo
od
gro
up
Nu
mb
er
of
ob
serv
ati
on
s
Nu
mb
er
of
hig
h-r
ate
co
nsu
mers
Ob
serv
ed
m
axim
um
fo
r th
e h
igh
-rate
g
rou
p (
kg
y-1
)
Ob
serv
ed
m
inim
um
fo
r th
e h
igh
-rate
g
rou
p (
kg
y-1
)
Ob
serv
ed
mean
fo
r th
e h
igh
-ra
te g
rou
p
(kg
y-1
)
Ob
serv
ed
97.5
th
perc
en
tile
(k
g y
-1)
Gen
eri
c m
ean
(k
g y
-1)
Gen
eri
c 9
7.5
th
perc
en
tile
(k
g y
-1)
Fish 86 8 47.2 19.8 27.1 27.5 15.0 40.0
Crustaceans 8 2 17.7 6.1 11.9 15.7 3.5 10.0
Molluscs 23 4 6.8 4.8 5.9 6.5 3.5 10.0
Wildfowl 16 9 28.6 10.0 17.2 27.4 Not
determined Not
determined
Marine plants/algae 7 4 0.9 0.5 0.7 0.9
Not determined
Not determined
Salt marsh grazed sheep meat 6 6 5.7 5.7 5.7 5.7
Not determined
Not determined

Radiological Habits Survey: Barrow and the south-west Cumbrian coast, 2012
39
The predominant species of fish consumed by adults were bass, cod, flounder, mackerel and plaice,
with smaller quantities of dab, conger eel, eel, grey mullet, lemon sole, thornback ray and whiting.
Most of the fish were caught in the waters around Walney Island and offshore to the west of Walney
Island, but smaller quantities were caught in the areas around Silecroft, Haverigg, Millom and
Roosebeck. Of the fish consumed by the eight people in the high-rate group, the percentage
breakdown of species, rounded to the nearest 5%, was 30% mackerel, 20% bass, 20% cod, 15%
flounder, 10% plaice and 5% of a mix of dab, conger eel, eel and thornback ray.
The species of crustaceans consumed by adults were brown crab and common lobster. Both these
species were caught mainly in the Walney Channel and to the west of Walney Island. Of the
crustaceans consumed by the two people in the high-rate group, the percentage breakdown of
species, rounded to the nearest 5%, was 55% brown crab and 45% common lobster.
The predominant species of molluscs consumed by adults were cockles, mussels, whelks and
winkles. The cockles were collected from the sand flats off the north-east and south-east of Walney
Island and in the Duddon Estuary near Lowsy Point. The mussels were collected from the Walney
Channel, Foulney Island, Hodbarrow and Selker Bay. The whelks were caught or collected from the
south end of the Walney Channel and the winkles were collected from the Walney Channel, the
south-west of Walney Island and Selker Bay. Of the molluscs consumed by the four people in the
high-rate group, the percentage breakdown of species, rounded to the nearest 5%, was 40% cockles,
30% whelks, 20% winkles and 10% mussels.
The predominant species of wildfowl consumed by adults were greylag goose, mallard, pink-footed
goose and pintail, with smaller quantities of Canada goose, shoveler, teal and wigeon. These were
shot on salt marshes and intertidal areas on the west side of the Duddon Estuary, Scarth Bight and
the south-east and south-west of Walney Island. Of the wildfowl consumed by the nine people in the
high-rate group, the percentage breakdown of species, rounded to the nearest 5%, was 25% pink-
footed goose, 25% greylag goose, 20% mallard, 10% pintail and 20% of a mix of Canada goose,
shoveler, teal and wigeon.
The only species of marine plants/algae consumed by adults in this area was samphire, which was
collected from the shore between Roa Island and Rampside, Scarth Bight, the west of Barrow Island
and south-east Walney Island.
Adults’ consumption of lamb meat from animals that had grazed on the salt marshes on the west side
of the Duddon Estuary was identified.

AQUATIC RADIATION PATHWAYS
40
Children’s and infants’ consumption rates
Table B presents a summary of children’s and infants’ consumption rates of fish, molluscs and
wildfowl from the aquatic survey area. The table includes the mean consumption rates for the high-
rate groups and the observed 97.5th percentile rates. For the child age group, no consumption of
crustaceans, marine plants/algae or salt marsh grazed sheep was identified. For the infant age
group, no consumption of crustaceans, molluscs, marine plants/algae or salt marsh grazed sheep
meat was identified. No generic rates have been determined for the child or infant age groups.
Table B. Summary of children’s and infants’ consumption rates of foods from the aquatic survey area
Fo
od
gro
up
Nu
mb
er
of
ob
serv
ati
on
s
Nu
mb
er
of
hig
h-r
ate
co
nsu
mers
Ob
serv
ed
m
axim
um
fo
r th
e h
igh
-rate
g
rou
p (
kg
y-1
)
Ob
serv
ed
m
inim
um
fo
r th
e h
igh
-rate
g
rou
p (
kg
y-1
)
Ob
serv
ed
mean
fo
r th
e h
igh
-ra
te g
rou
p
(kg
y-1
)
Ob
serv
ed
97.5
th
perc
en
tile
(k
g y
-1)
Child age group (6 – 15 years old)
Fish 8 5 11.5 4.1 7.4 11.4
Molluscs 4 2 0.9 0.5 0.7 0.9
Wildfowl 1 1 12.9 12.9 12.9 Not
applicable Infant age group (0 – 5 years old)
Fish 1 1 6.5 6.5 6.5 Not
applicable
Wildfowl 1 1 1.4 1.4 1.4 Not
applicable
The predominant species of fish consumed by the individuals in the child age group were bass,
flounder and plaice, with smaller quantities of cod and dab. The species of fish consumed by the
individual in the infant age group were bass, cod, dab, flounder and plaice.
The species of mollusc consumed by the individuals in the child age group were cockles and mussels.
The species of wildfowl consumed by the individual in the child age group were Canada goose,
greylag goose, mallard, pintail, teal and wigeon. The species of wildfowl consumed by the individual in
the infant age group were, Canada goose, greylag goose, pintail, teal and wigeon.
4.9 Intertidal occupancy
Intertidal occupancy rates for adults are presented in Table 12 and intertidal occupancy rates for
children and infants are presented in Table 13. It should be noted that there are often more than one

Radiological Habits Survey: Barrow and the south-west Cumbrian coast, 2012
41
substrate at one named location and that substrates at a given location are liable to change over time.
Activities were assigned to the predominant substrate over which they were taking place.
Adults’ intertidal occupancy rates
Table C presents a summary of the adults’ intertidal occupancy rates in the aquatic survey area. The
table includes the mean occupancy rates for the high-rate groups and the observed 97.5th percentile
rates.
Table C. Summary of adults’ intertidal occupancy rates Intertidal substrate Number of
observations Number of
people in the high-rate
group
Maximum of the high-rate
group (h y
-1)
Mean of the high-rate
group (h y
-1)
97.5th
percentile
(h y-1
)
Mud 11 7 220 138 217
Mud and sand 9 1 625 625 536
Mud and stones 12 3 420 400 420
Salt marsh 23 16 293 287 293
Sand 94 7 1460 926 1076
Sand and stones 47 17 616 368 614
Boat on mud and sand 5 3 7615 5517 7364
The activities undertaken by people in the adult high-rate groups for occupancy over the following
intertidal substrates included:
• For mud: collecting mussels off Foulney Island; wildfowling in the south-east of Walney
Island; angling and boat maintenance in the Walney Channel.
• For mud and sand: dog walking in the north-east of the Walney Channel; wildfowling at Scarth
Bight; collecting winkles in the south of the Walney Channel.
• For mud and stones: boat maintenance in the Walney Channel.
• For salt marsh: tending livestock and wildfowling on marshes in the west Duddon Estuary.
• For sand: oyster farming offshore of Roosebeck; bait digging near Millom Iron Works; angling
at Hodbarrow and Haverigg; dog walking at Hodbarrow and the south-west of Walney Island
(Low Bank); sitting on the beach at Hodbarrow.
• For sand and stones: angling at Silecroft, Roanhead, west Walney Island (Biggar Bank), west
Walney Island (West Shore Park) and south-west Walney Island; dog walking at Silecroft and
west Walney Island (Biggar Bank); boat maintenance on the west side of Barrow Island in the
Walney Channel
• For boat on mud and sand: boat dwelling (tide out) near Roa Island and at Askam-in-Furness.

AQUATIC RADIATION PATHWAYS
42
Children’s and infants’ intertidal occupancy rates
Table D presents a summary of the children’s and infants’ intertidal occupancy rates in the aquatic
survey area. The table includes the mean occupancy rates for the high-rate groups and the observed
97.5th percentile rates.
Table D. Summary of children’s and infants’ intertidal occupancy rates Intertidal substrate Number of
observations Number of people in
the high-rate
group
Maximum of the high-rate
group (h y
-1)
Mean of the high-rate
group (h y
-1)
97.5th
percentile
(h y-1
)
Child age group (6 – 15 years old)
Sand 20 2 742 710 711
Sand and stones 4 1 200 200 189
Boat on mud and sand
1 1 3830 3830 Not applicable
Infant age group (0 – 5 years old)
Sand 3 1 149 149 143
Sand and stones 3 3 52 52 52
The activities undertaken by individuals in the child age group high-rate groups for occupancy over
the following intertidal substrates included:
• For sand: dog walking and angling at Hodbarrow; bait digging near Millom Iron Works
• For sand and stones: dog walking at Tarn Point and Selker Bay
• For boat on mud and sand: boat dwelling (tide out) near Roa Island
For individuals in the infant age group high-rate groups, one child was identified playing on sand at
west Walney Island (West Shore Park) and three other individuals were identified playing on sand and
stones at west Walney Island (Biggar Bank).
4.10 Gamma dose rate measurements
Gamma dose rate measurements were taken over seven intertidal substrates. All measurements
were taken at a height of 1 metre above the substrate. The results are presented in Table 14 and are
summarised below.
• Three measurements taken over mud ranged from 0.077 µGy h-1
to 0.081 µGy h-1
• One measurement taken over mud and sand was 0.079 µGy h-1
• Five measurements taken over salt marsh ranged from 0.064 µGy h-1
to 0.126 µGy h-1
• Thirteen measurements taken over sand ranged from 0.058 µGy h-1
to 0.101 µGy h-1
• Two measurements taken over stones ranged from 0.100 µGy h-1
to 0.108 µGy h-1
• One measurement taken over mud and stones was 0.073 µGy h-1
• One measurement taken over sand and stones was 0.087 µGy h-1

Radiological Habits Survey: Barrow and the south-west Cumbrian coast, 2012
43
For comparison, natural background levels have been estimated at 0.05 µGy h-1
over sand,
0.07 µGy h-1
over mud and over salt marsh, and 0.06 µGy h-1
over other substrates (EA, FSA, NIEA
and SEPA, 2012).
4.11 Handling of fishing gear and sediment
Handling fishing gear that has become entrained with fine sediment particles, or handling sediment
while undertaking activities such as bait digging or mollusc collecting, can potentially give rise to skin
exposure from beta radiation. Doses to the skin need consideration as part of the dose limitation
system (ICRP, 1991).
Fishing gear can also be a source of gamma exposure due to occupancy in the vicinity of the gear.
However, this pathway is minor compared with the exposure received during occupancy over
intertidal areas and it has therefore been omitted from the report. Handling of angling equipment was
not considered to be a significant pathway. Therefore, as in previous surveys, data for this pathway
were not collected.
Handling rates of fishing gear and sediment for adults are presented in Table 15 and handling rates of
sediment for children are presented in Table 16. No children were identified handling fishing gear and
no infants were identified handling fishing gear or sediment.
Adults’ handling rates of fishing gear and sediment
Table E presents a summary of the handling rates of fishing gear and sediment for adults. The table
includes the mean handling rates for the high-rate groups and the observed 97.5th percentile rates.
Table E. Summary of adults’ handling rates of fishing gear and sediment Handling activity
Number of observations
Number of people in the
high-rate group
Maximum of the high-rate
group (h y
-1)
Mean of the high-rate
group (h y
-1)
97.5th
percentile
(h y-1
)
Handling fishing gear
10 3 1485 990 1318
Handling sediment
72 19 546 311 350
The activities undertaken by people in the adult high-rate groups for handling included:
• For handling fishing gear: handling nets in the Walney Channel, west of Walney Island and in
the Duddon Estuary; handling pots in the Walney Channel.
• For handling sediment: oyster farming offshore of Roosebeck; wildfowling at the west Duddon
Estuary marshes and south-east and south-west Walney Island.

AQUATIC RADIATION PATHWAYS
44
Children’s handling rates of sediment
Table F presents a summary of the handling rates of fishing gear and sediment for children. The
table includes the mean handling rates for the high-rate group and the observed 97.5th percentile rate.
Table F. Summary of children’s handling rates of sediment Handling activity
Number of observations
Number of people in the
high-rate group
Maximum of the high-rate
group (h y
-1)
Mean of the high-rate
group (h y
-1)
97.5th
percentile
(h y-1
)
Handling sediment
4 1 52 52 49
The individual in the children’s high-rate group for handling sediment was bait digging near Millom
Iron Works.
4.12 Exposure to sewage, sewage sludge and sewage cake
Activities at the Salthouse Wastewater Treatment Works were investigated because liquid waste from
the Barrow site is discharged via the sewer pipes to this works where it undergoes an activated
sludge sewage treatment process. Table 17 shows the occupancy rates in close proximity (<10 m) to
sewage, sewage sludge and sewage cake for the employees at the Salthouse Wastewater Treatment
Works.
Five employees had occupancy rates of 1500 h y-1
in close proximity (<10 m) to sewage and 500 h y-1
in close proximity (<10 m) to sewage sludge and sewage cake. Three of the employees were
operational staff, whose duties included debris removal, cleaning filters and tanks, monitoring gauges
and operating machinery. They spent approximately 10% of their time cleaning tanks by swilling them
out with hoses. Two of the employees were maintenance staff whose main duty was to maintain the
pumps and equipment. A contractor, who worked full time at the site operating machinery, had an
occupancy rate of 1800 h y-1
in close proximity (<10 m) to sewage sludge and sewage cake.
A variety of other people visited the site for relatively small periods of time, including tanker drivers
delivering industrial waste for treatment and lorry drivers collecting sewage cake.
4.13 Water based activities
Activities taking place in or on the water can lead to ingestion of water and/or inhalation of spray.
These pathways are generally considered to be minor in comparison with other exposure pathways
such as the ingestion of foods produced in the vicinity of a nuclear site. However, relevant data have
been collected for consideration in dose assessments. Mean occupancy rates for the high-rate
groups and 97.5th percentile rates have not been calculated.

Radiological Habits Survey: Barrow and the south-west Cumbrian coast, 2012
45
Activities where there is a high likelihood of the individual’s face submerging under water have been
classified as activities ‘in water’, as they are more likely to lead to ingestion of water. All other
activities have been classified as activities ‘on water’.
Occupancy rates for activities taking place ‘in water’ and ‘on water’ in the survey area for adults are
presented in Table 18. Occupancy rates for activities taking place ‘in water’ and ‘on water’ for
children and ‘in water’ for infants are presented in Table 19. No infants were identified spending time
‘on water’. Data for members of clubs and organisations were gained through interviews with their
representatives.
Activities in the water
The activities identified taking place in the water in the aquatic survey area were swimming,
snorkelling, sub-aqua diving, windsurfing, kite-surfing, body-boarding, kayaking and jet skiing. Thirty-
six observations were recorded for adults, nine observations for the child age group and one
observation for the infant age group. The highest occupancy rate for adults was 140 h y-1
for two
individuals who were jet skiing and sub-aqua diving in the Walney Channel and at Piel Island. The
highest occupancy rate for children was 200 h y-1
for an individual kayaking from Tarn Point to
Silecroft. The individual in the infant age group was swimming at west Walney Island (West Shore
Park) for 21 h y-1
.
Activities on the water
The activities taking place on the water in the aquatic survey area were sailing, canoeing, boat
angling, gill netting, potting, trawling, dredging, charter boat skipper, working on a boat, RNLI duties,
rescue boat duties, boat dwelling (tide in), fixing moorings and paddling. One hundred and fifteen
observations were recorded for adults and six observations were recorded for individuals in the child
age group. The highest occupancy rate for adults was 3100 h y-1
for an individual who was working
on a boat off Walney Island and performing rescue boat duties in the Duddon Estuary. The highest
occupancy rate for individuals in the child age group was 1000 h y-1
for a child who was boat dwelling
(tide in) near Roa Island.

TERRESTRIAL RADIATION PATHWAYS
46
5 TERRESTRIAL RADIATION PATHWAYS
5.1 Terrestrial survey area
The terrestrial survey area (Figure 2, page 18) covered all land and bodies of freshwater within 5 km
of the Barrow site centre (National Grid Reference: SD 192 689). Most of Walney Island, which lies to
the west of the site on the other side of the Walney Channel, fell within the terrestrial survey area.
Much of the land in the terrestrial survey area is taken up by urban developments. The site is situated
in the dock area on the southern edge of the town of Barrow-in-Furness and built up areas extend
away from the site to the north and east. The small area of land to the south of the site, known as
Barrow Island, is also mainly a built-up area. To the west, on the other side of the Walney Channel,
the central part of Walney Island is mainly occupied by the urban area of Vickerstown and the villages
of North Scale, North Walney and Tummer Hill. Most of the northern part of Walney Island is taken
up by an airfield and a large nature reserve. The main area of agricultural land within the survey area
lies beyond the town of Barrow-in-Furness, towards the outside of the 5 km area, to the north and
east. The southern part of Walney Island is also predominantly agricultural land and there are a few
fields in the central and northern parts of the island. There is a freshwater reservoir near Ormsgill on
the west side of Barrow-in-Furness and a stream called Mill Beck runs north to south through the
eastern outskirts of Barrow-in-Furness and feeds a pond situated to the east of the dock area.
Fifteen farms and smallholdings were identified that farmed land in the Barrow terrestrial survey area.
Of these farms:
• One produced milk (from dairy cattle) and beef cattle
• One produced milk (from dairy cattle), beef cattle and lambs
• Two produced milk (from dairy cattle) and lambs
• One produced milk (from dairy cattle)
• Five produced beef cattle and lambs
• Three produced beef cattle
• One produced lambs
• One produced lambs and geese
Additionally, several individuals owned one or two fields on Walney Island which were farmed on a
small scale and mainly used for growing hay or grazing livestock.
Hay was grown for animal feed but no arable crops were produced for human consumption.

Radiological Habits Survey: Barrow and the south-west Cumbrian coast, 2012
47
Farmers, smallholders and their families were consuming milk, beef, lamb and geese produced on
their own farms and smallholdings. Four farmers/smallholders kept chickens for eggs for their own
families’ consumption. One smallholder kept turkeys and pigs for their own family’s consumption and
several farmers grew fruit and vegetables for their own families’ consumption.
Seventeen allotment sites with a total of approximately 740 individual plots were identified within the
survey area. The location of the allotment sites are shown in Figure 2, page 18. The allotment
holders grew a wide variety of fruit and vegetables and some people kept chickens for eggs on the
allotment sites.
Beekeeping was reported to take place in the survey area but the apiarists could not be contacted.
Blackberries, damsons, sloes and mushrooms were growing wild in the survey area and these were
collected and consumed.
Many of the farmers and smallholders allowed a small number of people to go rough shooting on their
land within the survey area. A wildfowling club held the shooting rights across the land owned by
several of the farms. The shooters and their families consumed the shot pheasant and rabbit.
Brown trout were consumed by two individuals from a freshwater pond in the terrestrial survey area
which was potentially affected by gaseous discharges.
The consumption of groundwater by humans or livestock was not identified. One remote household
collected rainwater from the roof as their sole domestic supply. Most livestock were supplied with
mains water for drinking and at several farms livestock also had access to spring, stream or ditch
water.
5.2 Destination of food originating from the terrestrial survey area
Beef cattle and lambs were sold through livestock auction markets in Lancashire, Kent and Cumbria.
Beef cattle and lambs were also sent to abattoirs or sold to a processing factory outside the survey
area. Milk was sold to a local co-operative, national distributors and supermarket chains. Geese
were sold through a livestock auction in Lancashire at Christmas time. Chicken eggs were sold from
the gate at one farm.
5.3 The potential transfer of contamination off-site by wildlife
Measures are taken in order to limit the possibility that contamination is transferred offsite by wildlife.
Wildlife cannot gain access to the controlled areas and a Seagull Management Programme is in

TERRESTRIAL RADIATION PATHWAYS
48
operation throughout the BAE dockyard, where debris is cleared from the gutters annually in order to
discourage the birds from nesting and regular sweeps are made of ground level areas.
5.4 Food consumption data
Consumption data for locally produced foodstuffs potentially affected by deposition of gaseous
discharges are presented in Tables 20 to 34 for adults and Tables 35 to 48 for children and infants.
In order to provide information relevant to monitoring and assessments studies, the consumption rate
data collected during the survey were analysed to indicate the percentage that each food type
contributed to each food group. The data are summarised in Table 49.
Adults’ consumption rates
Consumption of locally produced foods was identified in the following 15 food groups: green
vegetables; other vegetables; root vegetables; potato; domestic fruit; milk; cattle meat; pig meat;
sheep meat; poultry; eggs; wild/free foods; rabbits/hares; wild fungi; freshwater fish. No consumption
of honey, cereals or venison was identified.
Table G presents a summary of the adults’ consumption rates for the foods consumed from the
terrestrial survey area. The table includes the mean consumption rates for the high-rate groups and
the observed 97.5th percentile rates calculated as described in Section 3.4. For comparison, the table
also includes mean consumption rates and 97.5th percentile consumption rates based on national
data, which are referred to as ‘generic’ data in this report. No generic rates have been determined for
freshwater fish.

Radiological Habits Survey: Barrow and the south-west Cumbrian coast, 2012
49
Table G. Summary of adults’ consumption rates of foods from the terrestrial survey area F
oo
d g
rou
p
Nu
mb
er
of
ob
serv
ati
on
s
Nu
mb
er
of
hig
h-
rate
co
nsu
mers
Ob
serv
ed
m
axim
um
fo
r th
e
hig
h-r
ate
gro
up
(k
g y
-1 o
r l
y-1
)
Ob
serv
ed
m
inim
um
fo
r th
e
hig
h-r
ate
gro
up
(k
g y
-1 o
r l
y-1
)
Ob
serv
ed
mean
fo
r th
e h
igh
-rate
g
rou
p
(kg
y-1
or
l y
-1)
Ob
serv
ed
97.5
th
perc
en
tile
(k
g y
-1 o
r l
y-1
)
Gen
eri
c m
ean
(k
g y
-1 o
r l
y-1
)
Gen
eri
c 9
7.5
th
perc
en
tile
(k
g y
-1 o
r l
y-1
)
Green vegetables
76 28 30.1 10.5 16.4 29.4 15.0 45.0
Other vegetables
78 25 42.8 14.4 24.4 29.8 20.0 50.0
Root vegetables 87 41 37.3 12.5 25.0 35.3 10.0 40.0
Potato 72 25 54.5 18.2 26.5 40.3 50.0 120.0
Domestic fruit 65 6 57.0 19.5 28.8 26.7 20.0 75.0
Milk 11 11 414.9 155.6 284.4 414.9 95.0 240.0
Cattle meat 25 20 65.0 23.7 33.2 54.4 15.0 45.0
Pig meat 5 4 8.5 3.4 5.3 8.1 15.0 40.0
Sheep meat 20 15 11.3 4.5 7.6 11.3 8.0 25.0
Poultry 13 1 48.0 48.0 48.0 34.3 10.0 30.0
Eggs 46 9 59.3 20.1 34.3 41.6 8.5 25.0
Wild/free foods 17 6 3.5 1.8 3.2 3.5 7.0 25.0
Rabbits/hares 2 1 9.0 9.0 9.0 8.8 6.0 15.0
Wild fungi 18 2 3.9 3.9 3.9 3.9 3.0 10.0
Freshwater fish 2 2 3.5 3.5 3.5 3.5 Not
determined Not
determined
Three mean consumption rates for the high-rate groups were found to be greater than the generic
97.5th percentile consumption rates. These were for milk, poultry and eggs. Ten mean consumption
rates for the high-rate groups exceeded the generic mean consumption rates. These were for green
vegetables, other vegetables, root vegetables, domestic fruit, milk, cattle meat, poultry, eggs,
rabbits/hares and wild fungi. Four observed 97.5th percentile consumption rates exceeded the generic
97.5th percentile consumption rates. These were for milk, cattle meat, poultry and eggs.
Children’s and infants’ consumption rates
Fifteen individuals in the child age group and five individuals in the infant age group were identified
consuming foods from the terrestrial survey area. Table H presents a summary of children’s and
infants’ consumption rates. The table includes the mean consumption rates for the high-rate groups
and the observed 97.5th percentile rates. No generic data have been determined for the child or infant
age groups. In the child age group, no consumption of foods from the following food groups was
identified: honey; wild fungi; venison; cereals; freshwater fish. In the infant age group, no
consumption of foods from the following food groups was identified: honey; pig meat; poultry; wild/free
foods; rabbits/hares; venison; cereals; freshwater fish.
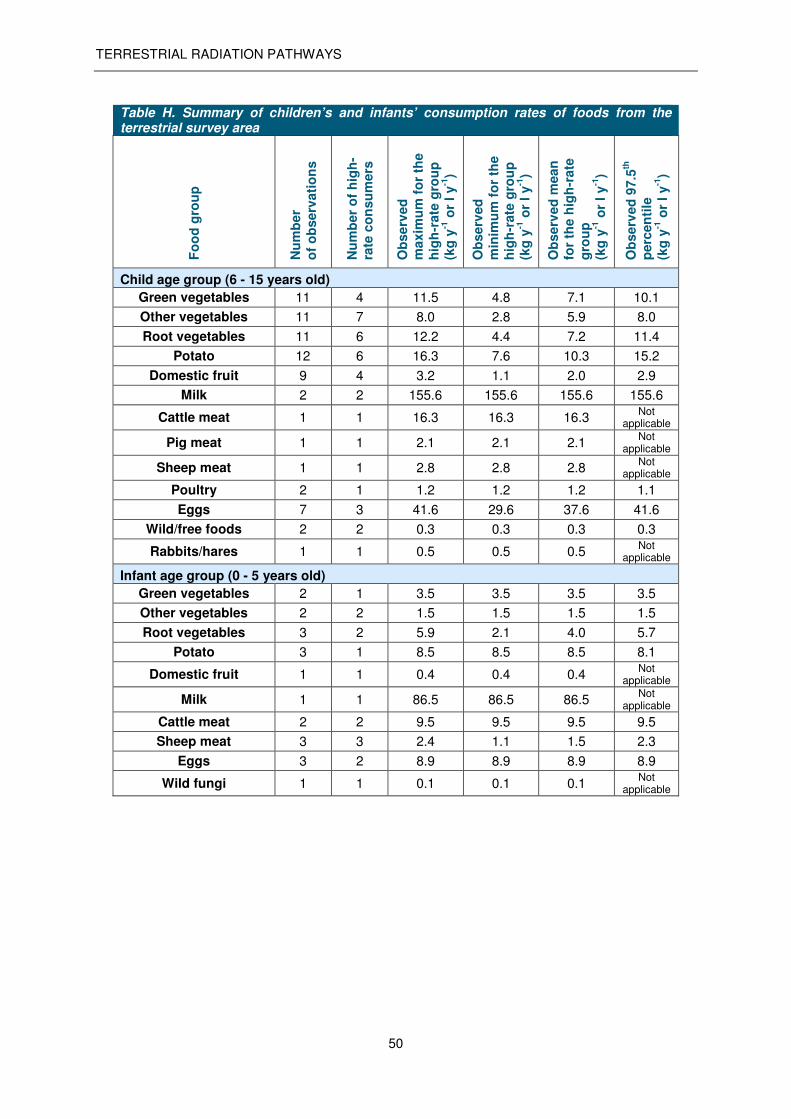
TERRESTRIAL RADIATION PATHWAYS
50
Table H. Summary of children’s and infants’ consumption rates of foods from the terrestrial survey area
Fo
od
gro
up
Nu
mb
er
of
ob
serv
ati
on
s
Nu
mb
er
of
hig
h-
rate
co
nsu
mers
Ob
serv
ed
m
axim
um
fo
r th
e
hig
h-r
ate
gro
up
(k
g y
-1 o
r l
y-1
)
Ob
serv
ed
m
inim
um
fo
r th
e
hig
h-r
ate
gro
up
(k
g y
-1 o
r l
y-1
)
Ob
serv
ed
mean
fo
r th
e h
igh
-rate
g
rou
p
(kg
y-1
or
l y
-1)
Ob
serv
ed
97.5
th
perc
en
tile
(k
g y
-1 o
r l
y-1
)
Child age group (6 - 15 years old)
Green vegetables 11 4 11.5 4.8 7.1 10.1
Other vegetables 11 7 8.0 2.8 5.9 8.0
Root vegetables 11 6 12.2 4.4 7.2 11.4
Potato 12 6 16.3 7.6 10.3 15.2
Domestic fruit 9 4 3.2 1.1 2.0 2.9
Milk 2 2 155.6 155.6 155.6 155.6
Cattle meat 1 1 16.3 16.3 16.3 Not
applicable
Pig meat 1 1 2.1 2.1 2.1 Not
applicable
Sheep meat 1 1 2.8 2.8 2.8 Not
applicable
Poultry 2 1 1.2 1.2 1.2 1.1
Eggs 7 3 41.6 29.6 37.6 41.6
Wild/free foods 2 2 0.3 0.3 0.3 0.3
Rabbits/hares 1 1 0.5 0.5 0.5 Not
applicable
Infant age group (0 - 5 years old)
Green vegetables 2 1 3.5 3.5 3.5 3.5
Other vegetables 2 2 1.5 1.5 1.5 1.5
Root vegetables 3 2 5.9 2.1 4.0 5.7
Potato 3 1 8.5 8.5 8.5 8.1
Domestic fruit 1 1 0.4 0.4 0.4 Not
applicable
Milk 1 1 86.5 86.5 86.5 Not
applicable
Cattle meat 2 2 9.5 9.5 9.5 9.5
Sheep meat 3 3 2.4 1.1 1.5 2.3
Eggs 3 2 8.9 8.9 8.9 8.9
Wild fungi 1 1 0.1 0.1 0.1 Not
applicable

Radiological Habits Survey: Barrow and the south-west Cumbrian coast, 2012
51
6 DIRECT RADIATION PATHWAYS
6.1 Direct radiation survey area
The direct radiation survey area (Figure 2, page 18) covered all land and water within 1 km of the
Barrow nuclear licensed site boundary. The occupancy data collected from the direct radiation area is
also applicable to the direct exposure arising from potential gaseous releases from the site.
Only part of the BAE works at Barrow is a nuclear licensed site. The licensed area is situated on the
northern side of the BAE premises and includes part of the Devonshire Dock. The non-licensed area
of the BAE works also contains sources of direct radiation.
The BAE licensed site is situated in a heavily built-up area that includes the town centre of Barrow-in-
Furness. The direct radiation survey area was a very busy area and a wide range of residential,
commercial, industrial and recreational activities took place within it. The narrow waters of the
Walney Channel cut north to south through the western side of the direct radiation survey area,
separating Walney Island from the mainland. To the south-east of the site, Devonshire Dock and the
Buccleuch Dock together form a channel of water extending to the border of the direct radiation
survey area. The land to the south of the licensed site, which is almost entirely surrounded by the
waters of the Walney Channel and various docks, is known as Barrow Island.
Just to the north of the site there were are three modern retail parks that together contain over 20
large retail outlets, several fast food restaurants, a cinema complex, a sports centre and large car
parking areas. Between the retail parks and the eastern shore of the Walney Channel there is a small
industrial estate and further north there is a college of further education, two business parks which
together hold approximately 60 offices and industrial units, and several other business premises.
The area to the north-east of the site, beyond the retail parks, contains the town centre shopping
district and densely populated residential neighbourhoods. There are also many public buildings,
offices, several schools and a sports stadium in this area. To the east of the site there is a large
supermarket on the north side of Buccleuch Dock and a road bridge crosses the docks, providing
access to Barrow Island from the town centre.
To the south of the licensed site most of the land in the northern part of Barrow Island is occupied by
non-licensed areas of the BAE works, which also extend along the quays on the southern side of the
eastern end of Devonshire Dock and the southern side of the Buccleuch Dock. The non-licensed
area of the works is dissected by public roads that provide access to the south of Barrow Island.
Immediately to the south-west of the licensed site there is a small triangular area with several
residential streets and to the south of the non-licensed area, in the centre of Barrow Island, there is a

DIRECT RADIATION PATHWAYS
52
larger residential district with a nursery school and a primary school. Further south, near the outskirts
of the direct radiation survey area, there are a few small industrial units, allotment sites, an area of
vacant land and a boat club premises that is situated next to the Walney Channel. The depots and
commercial docks at the south end of Barrow Island were outside the direct radiation survey area.
Between the western boundary of the licensed site and the Walney Channel there is a narrow strip of
land which is occupied by the Dock Museum, a small quay where fishing boats are moored, allotment
plots, a sailing club and public gardens. A main road passes the western edge of the licensed site
and leads to the Jubilee Bridge nearby, which crosses the Walney Channel and provides the only
road access to Walney Island. Many yachts and boats are kept moored in the Walney Channel within
the direct radiation survey area.
The western side of the direct radiation survey area extends into Vickerstown on Walney Island,
which is largely a residential area and includes several schools, two allotment sites and playing fields.
Proposals have been put forward to redevelop the unoccupied land at the south end of the direct
radiation survey area on Barrow Island into a business park and construct a new marina on the north
side of Buccleuch Dock. At the time of writing, these proposals have been shelved and it is not
known if they, or any alternative schemes, will proceed.
Owing to the busy nature of the direct radiation survey area it was not possible to conduct interviews
with people undertaking all the different activities that take place within it. Therefore effort was
directed at conducting interviews with residents, since they were likely to have higher occupancy
times than people undertaking other activities.
6.2 Residential activities
There were a high number of residential properties covering large parts of the survey area. The
closest residences to the licensed site were in the triangular housing area immediately adjacent to the
south-west of the site.
Interviews were conducted at 25 residential properties, four of which were occupied by families with
children. Thirteen properties were within the 0 – 0.25 km zone, seven properties were within the
>0.25 – 0.5 km zone and five properties were within the >0.5 – 1.0 km zone.
6.3 Leisure activities
A very wide range of leisure activities took place within the survey area, including, for example,
visiting museums, cinemas, sports centres, public houses and nightclubs; watching sports at the 7600
person capacity sports stadium; playing sports on a number of playing fields; leisure shopping and

Radiological Habits Survey: Barrow and the south-west Cumbrian coast, 2012
53
tending to allotments. There were coastal walks along most of the west bank of the Walney Channel
and parts of the east bank. Many pleasure craft were moored in the Walney Channel and people
spent time maintaining their boats and pursuing water-sports activities.
6.4 Commercial activities
Many businesses were located within the direct radiation survey area including shops, offices, leisure
facilities and industrial units. A few fishermen spent time working aboard boats kept in the small
harbour near the Dock Museum.
The activities of the BAE site employees and contractors while at work were not considered in the
direct radiation survey, as radiation workers are subject to different radiation protection criteria.
6.5 Educational activities
Approximately eight nursery schools, 12 primary and junior schools, and one college of further
education were identified in the direct radiation survey area. These were mostly located in the main
area of the town to the north-east of the site but five schools and a nursery were located in
Vickerstown on Walney Island and one school and one nursery were located on Barrow Island to the
south of the site.
6.6 Occupancy rates
Table 50 presents indoor, outdoor and total occupancy data for adults, children and infants. An
analysis of the data by distance zones and occupancy rates is shown in Table 51. A summary of
occupancy rates in the direct radiation survey area is presented in Table I.
Many residents had very high occupancy rates since most of the services that they used, such as
shops, were located inside the direct radiation survey area.
Table I. Summary of direct radiation occupancy rates Zone Number of
observations Highest indoor
occupancy (h y
-1)
Highest outdoor
occupancy (h y
-1)
Highest total occupancy
(h y-1
)
0 - 0.25 km 41 8535 1400 8750
>0.25 - 0.5 km 24 7814 1178 8386
>0.5 - 1.0 km 16 8612 3039 8734

DIRECT RADIATION PATHWAYS
54
0 - 0.25 km from the nuclear licensed site boundary
Occupancy data were collected for 41 individuals in the 0 - 0.25 km zone. The observations were for
29 residents, four of whom also worked in the area and two of whom were attending school, nine
visitors and three people who were working. The highest indoor occupancy rate was for a resident,
with another resident having the highest total occupancy rate. The highest outdoor occupancy rate
was for an individual who worked in the area.
>0.25 - 0.5 km from the nuclear licensed site boundary
Occupancy data were collected for 24 individuals in the >0.25 - 0.5 km zone. The observations were
for 15 residents, one of whom also worked in the area and one of whom was attending school, eight
jet skiers and one visitor. The highest indoor occupancy rate was for a resident who was also
attending school; the highest outdoor occupancy rate and the highest total occupancy rate were also
for residents.
>0.5 - 1.0 km from the nuclear licensed site boundary
Occupancy data were collected for 16 people in the >0.5 - 1.0 km zone. The observations were for 12
residents, three people performing boat maintenance tasks and one person collecting crabs. The
highest indoor, outdoor and total occupancy rates were for three different residents.
6.7 Gamma dose rate measurements
Gamma dose rate measurements were taken indoors and outdoors at most properties where
interviews were conducted in the Barrow direct radiation survey area. Where possible, outdoor
measurements were taken over grass and approximately 5 to 10 metres from the nearest building, but
owing to the heavily built-up nature of the direct radiation survey area this was not usually feasible
and most measurements were taken over concrete or tarmac at distances less than 5 metres from
buildings. Gamma dose rate measurements over rough grass were taken at locations at distances
further than 5 km from the site centre to obtain background dose rates. All measurements were taken
at a height of 1 metre above the substrate. It should be noted that the indoor and outdoor
measurements have not been adjusted for background dose rates. The results are presented in
Table 52 and are summarised below.
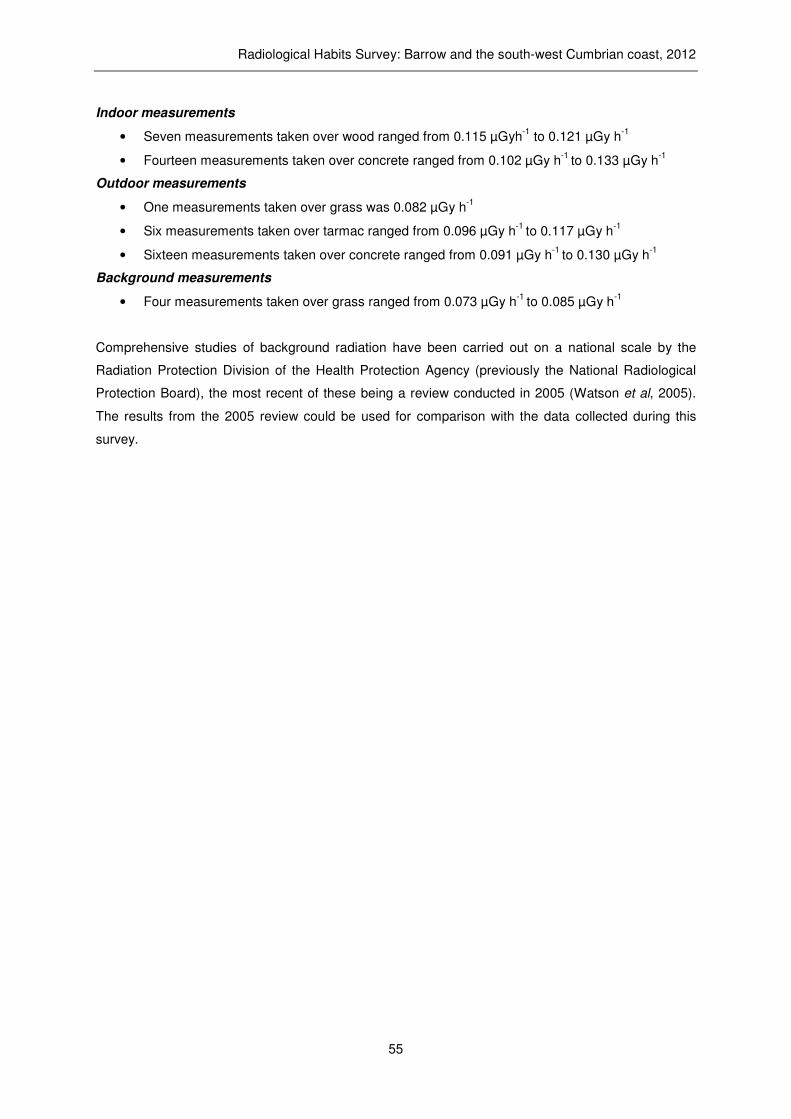
Radiological Habits Survey: Barrow and the south-west Cumbrian coast, 2012
55
Indoor measurements
• Seven measurements taken over wood ranged from 0.115 µGyh-1
to 0.121 µGy h-1
• Fourteen measurements taken over concrete ranged from 0.102 µGy h-1
to 0.133 µGy h-1
Outdoor measurements
• One measurements taken over grass was 0.082 µGy h-1
• Six measurements taken over tarmac ranged from 0.096 µGy h-1
to 0.117 µGy h-1
• Sixteen measurements taken over concrete ranged from 0.091 µGy h-1
to 0.130 µGy h-1
Background measurements
• Four measurements taken over grass ranged from 0.073 µGy h-1
to 0.085 µGy h-1
Comprehensive studies of background radiation have been carried out on a national scale by the
Radiation Protection Division of the Health Protection Agency (previously the National Radiological
Protection Board), the most recent of these being a review conducted in 2005 (Watson et al, 2005).
The results from the 2005 review could be used for comparison with the data collected during this
survey.

USE OF HABITS DATA FOR DOSE ASSESSMENTS
56
7 USES OF HABITS DATA FOR DOSE ASSESSMENTS
7.1 Combined pathways
In determining habits data for the purposes of assessing radiological doses to the public, it may be
necessary to consider a combination of pathways. Data are provided in Annex 1 and Annex 2 so that
the full effect of combining pathways can be assessed for individual observations, given the
concentrations and dose rates for a particular assessment. The rates for individuals in the high-rate
groups are emboldened. In some circumstances, it will be possible to make simplifying assumptions
and define the consumption and external exposure rates appropriate to a series of potential high-rate
groups.
The most extensive combinations of pathways for adult dose assessment are shown in Table 53.
Each of the 34 combinations shown in Table 53 represents an actual individual (or individuals) from
Annex 1 who has positive data (irrespective of the magnitude), for each pathway marked with a cross.
It should be noted that combination numbers in Table 53 do not correlate directly with observation
numbers in Annex 1. Other individuals from Annex 1 have combinations that are not listed in
Table 53 because they have fewer pathways and a dose assessment for them would be adequately
covered by one of the 34 listed combinations.
7.2 Foetal dose assessment
Dose assessment of the foetus was introduced routinely for the first time in the Radioactivity in Food
and the Environment report for 2005 (EA, EHS, FSA and SEPA, 2005), following the publication of
recommendations by the Radiation Protection Division of the Health Protection Agency (National
Radiological Protection Board, 2005). The adopted approach is to use the consumption and
occupancy data for women of childbearing age in order to calculate the potential dose to the foetus.
Therefore, consumption and occupancy data collected during the Barrow habits survey for females of
childbearing age are presented in Annex 5. The Office of National Statistics classifies women to be of
childbearing age if they are between 15 – 44 years old (www.statistics.gov.uk); this age range has
been used in Annex 5. It was not possible to collect ages for all female observations during the habits
survey. However, these females with unknown ages have been included in Annex 5 as they might be
women of childbearing age.
7.3 Total dose assessment
The environment agencies and the Food Standards Agency have considered ways of using habits
data to calculate total dose retrospectively. The adopted approach is to use the adult consumption
and occupancy data collected in each habits survey to create a matrix with a series of habits profiles

Radiological Habits Survey: Barrow and the south-west Cumbrian coast, 2012
57
for each site. The National Dose Assessment Working Group (NDAWG) has considered this
approach to assessing retrospective total doses (Camplin et al, 2005) and has agreed that using
habits profiles is an appropriate approach. The relevant matrix for the adults’ profiled habits data is
shown in Annex 6. Additionally, profiles have been created for the child and infant age groups, and
for women of childbearing age. These are shown in Annexes 7, 8, and 9 respectively.

COMPARISONS WITH THE PREVIOUS SURVEY
58
8 COMPARISONS WITH THE PREVIOUS SURVEY
Cefas has not previously conducted terrestrial or direct radiation surveys in the Barrow area so the
current findings for those pathways cannot be compared with previous results. Cefas conducted an
aquatic survey in the area in 1990 and the results from that survey are compared with the 2012
survey below. The methods of data analysis have changed since 1990 and the data from the 1990
survey have been re-analysed using the current methods. The comparisons are for adults only.
At the time of the 1990 survey liquid discharges from Barrow were made to a sewer that flowed
directly into the Walney Channel in the vicinity of the Jubilee Bridge, without passing through a
sewage treatment works. In 2002 the sewer system was upgraded and since then liquid discharges
have been made to a sewer that flows to the Salthouse Wastewater Treatment Works where it
undergoes an activated sludge sewage treatment process. Treated water from the works is
discharged down a pipeline onto Roosecote Sands in the south-eastern part of the Walney Channel.
8.1 Aquatic survey area
In 1990 the food groups from which foods were consumed by adults were fish, crustaceans, molluscs
and wildfowl. In 2012 the food groups from which foods were consumed by adults were fish,
crustaceans, molluscs, wildfowl, marine plants/algae and salt marsh grazed sheep meat.
A comparison between the 1990 and 2012 data for the consumption of aquatic foods is presented in
Table J.
Table J. Comparison between 1990 and 2012 consumption rates of aquatic food groups for adults
1990 2012
Food group Number in high-
rate group
Maximum consumption rate (kg y
-1)
Mean consumption rate for the high-rate
group (kg y
-1)
Number in high-
rate group
Maximum consumption rate (kg y
-1)
Mean consumption rate for the high-rate
group (kg y
-1)
Fish 10 81.2 40 8 47.2 27.1
Crustaceans 2 8.2 8.0 2 17.7 11.9
Molluscs 3 5.0 3.5 4 6.8 5.9
Wildfowl 1 7.1 7.1 9 28.6 17.2
Marine plants/algae
Not identified 4 0.9 0.7
Salt marsh grazed sheep meat
Not identified 6 5.7 5.7

Radiological Habits Survey: Barrow and the south-west Cumbrian coast, 2012
59
In 2012 compared with 1990, there was a decrease in the mean consumption rate for the adult
high-rate group for fish, from 40 kg y-1
to 27 kg y-1
, and increases in the mean consumption rates for
the adult high-rate groups for crustaceans, from 8.0 kg y-1 to 12 kg y
-1, for molluscs, from 3.5 kg y
-1 to
5.9 kg y-1 and for wildfowl, from 7.1 kg y
-1 to 17 kg y
-1. The consumption of marine plants/algae and salt
marsh grazed sheep was identified in 2012 but not in 1990.
For intertidal occupancy in 1990, activities were recorded over the following three substrates: mud
and sand; salt marsh; sand. In 2012, activities were recorded over the same substrates with the
addition of occupancy over mud, over mud and stones, over sand and stones and occupancy on
boats resting on mud and sand at low tide.
The following activities were undertaken by the individuals in the high-rate groups for intertidal
substrates:
• In 1990: angling, bait digging, dog walking, wildfowling, turf cutting, volunteer coastguard
duties, beach combing and setting nets.
• In 2012: angling, bait digging, dog walking, wildfowling, collecting mussels, collecting winkles,
oyster farming, tending livestock, boat maintenance, boat dwelling (tide out) and sitting on the
beach.
The following activities were undertaken by the individuals in the high-rate groups for handling fishing
gear:
• In 1990: handling nets.
• In 2012: handling nets and pots.
The following activities were undertaken by the individuals in the high-rate groups for handling
sediment:
• In 1990: bait digging.
• In 2012: oyster farming and wildfowling.
A comparison between the 1990 and 2012 data for occupancy over intertidal substrates, handling
fishing gear and handling sediment is shown in Table K.

COMPARISONS WITH THE PREVIOUS SURVEY
60
Table K. Comparison between 1990 and 2012 intertidal occupancy rates and handling rates of fishing gear and sediment for adults
1990 2012
Intertidal substrate
or handling pathway
Number in high-
rate group
Maximum occupancy or handling rate (h y
-1)
Mean occupancy or handling rate for the high-rate
group (h y
-1)
Number in high-
rate group
Maximum occupancy or handling rate (h y
-1)
Mean occupancy or handling rate for the high-rate group
(h y-1
)
Mud Not identified 7 220 138
Mud and sand
4 1236 907 1 625 625
Mud and stones
Not identified 3 420 400
Salt marsh 6 303 221 16 293 287
Sand 2 331 290 7 1460 926
Sand and stones
Not identified 17 616 368
Boat on mud and sand
Not identified 3 7615 5517
Handling fishing gear
3 789 679 3 1485 990
Handling sediment
1 1122 1122 19 546 311
In 2012 activities were recorded taking place over mud, mud and stones, sand and stones and on
board a boat resting on mud and sand, but no activities were recorded over these substrates in 1990.
In 2012 compared to 1990, the mean intertidal occupancy rate for the high-rate group over mud and
sand decreased moderately, whilst the mean rate for the high-rate group over salt marsh increased
slightly and the mean rate for the high-rate group over sand increased significantly.
The mean rate for the high-rate group for handling fishing gear increased moderately in 2012
compared with 1990, whilst the mean rate for the high-rate group for handling sediment decreased
significantly.

Radiological Habits Survey: Barrow and the south-west Cumbrian coast, 2012
61
9 MAIN FINDINGS
The survey investigated the following potential sources of public radiation exposure:
• Discharges of liquid radioactive waste from the Barrow site to the local sewer (and
subsequently into the sea in Walney Channel) and the far-field effects of liquid radioactive
waste discharged into the Irish Sea from other nuclear sites on the north-west coast of
England, most notably Sellafield
• Discharges of gaseous radioactive waste to the atmosphere from the Barrow site
• Emissions of direct radiation from the Barrow site
Data were collected for 522 individuals including, for example, commercial and hobby fishermen,
anglers, people spending time on intertidal substrates, farmers, allotment holders, gardeners and
people spending time within the direct radiation survey area. These people were targeted because
their habits and where they live may cause them to be exposed to radioactivity from the site.
However, it should be noted that the most exposed people can only be defined with the outcome of a
dose assessment. All consumption rates recorded are only for foods produced, collected or caught
from within the aquatic and terrestrial survey areas as defined in Section 2.3.
9.1 Aquatic survey area
The mean consumption rate for the adult high-rate group (as defined in Section 3.4) for the separate
aquatic consumption pathways for foods potentially affected by liquid discharges were:
• 27 kg y-1
for fish
• 12 kg y-1
for crustaceans
• 5.9 kg y-1 for molluscs
• 17 kg y-1
for wildfowl
• 0.7 kg y-1 for marine plants/algae
• 5.7 kg y-1 for salt marsh grazed sheep meat
The predominant foods consumed by the high-rate groups were:
• For fish: bass; cod; flounder; mackerel; plaice
• For crustaceans: brown crab and common lobster
• For molluscs: cockles; mussels; whelks; winkles
• For wildfowl: greylag goose; mallard; pink-footed goose; pintail
• For marine plants/algae: samphire
• For salt marsh grazed sheep meat: salt marsh grazed lamb
The use of seaweed as a fertiliser or animal feed was not identified.

MAIN FINDINGS
62
The mean occupancy rates for adult high-rate groups over the separate intertidal substrates were:
• 140 h y-1
for mud
• 630 h y-1
for mud and sand
• 400 h y-1
for mud and stones
• 290 h y-1
for salt marsh
• 930 h y-1
for sand
• 370 h y-1
for sand and stones
• 5500 h y-1
for a boat on mud and sand
The mean handling rate for the adult high-rate groups for handling were:
• 990 h y-1
for handling fishing gear
• 310 h y-1
for handling sediment
The adult maximum occupancy rates for water based activities were:
• 140 h y-1
for ‘in water’
• 3100 h y-1
for ‘on water’
9.2 Terrestrial survey area
The mean consumption rates for the adult high-rate groups for the separate consumption pathways
for foods potentially affected by gaseous discharges were:
• 16 kg y-1
for green vegetables
• 24 kg y-1
for other vegetables
• 25 kg y-1
for root vegetables
• 27 kg y-1
for potato
• 29 kg y-1
for domestic fruit
• 280 l y-1
for milk
• 33 kg y-1
for cattle meat
• 5.3 kg y-1 for pig meat
• 7.6 kg y-1 for sheep meat
• 48 kg y-1
for poultry
• 34 kg y-1
for eggs
• 3.2 kg y-1 for wild/free foods
• 9.0 kg y-1 for rabbits/hares
• 3.9 kg y-1 for wild fungi
• 3.5 kg y-1 for freshwater fish
No consumption of honey, cereals or venison from the survey area was identified.
Radiological Habits Survey: Barrow and the south-west Cumbrian coast, 2012
63
The consumption of foodstuffs by individuals in the child and infant age groups was also recorded.
No consumption of groundwater by humans or livestock was identified. One remote household
collected rainwater from the roof as their sole domestic supply. Most livestock were supplied with
mains water for drinking and at several farms livestock also had access to spring, stream or ditch
water.
Control measures taken in order to limit the possibility that contamination is transferred off the Barrow
site by wildlife included ensuring that wildlife were unable to access the controlled areas and clearing
debris from gutters and ground level areas to discourage seagulls from nesting.
9.3 Direct radiation survey area
With the exception of the highest outdoor occupancy rate in the 0 – 0.25 km zone, which was for an
individual who was working, the highest indoor, outdoor and total occupancy rates in all three of the
zones of the direct radiation survey area were for residents, one of whom also attended school in the
survey area. The highest indoor, outdoor and total occupancy rates recorded for all zones were:
0 - 0.25 km zone
• 8500 h y-1
for the indoor occupancy rate
• 1400 h y-1
for the outdoor occupancy rate
• 8750 h y-1
for the total occupancy rate
>0.25 - 0.5 km zone
• 7800 h y-1
for the indoor occupancy rate
• 1200 h y-1
for the outdoor occupancy rate
• 8400 h y-1
for the total occupancy rate
>0.5 - 1 km zone
• 8600 h y-1
for the indoor occupancy rate
• 3000 h y-1
for the outdoor occupancy rate
• 8700 h y-1
for the total occupancy rate
.
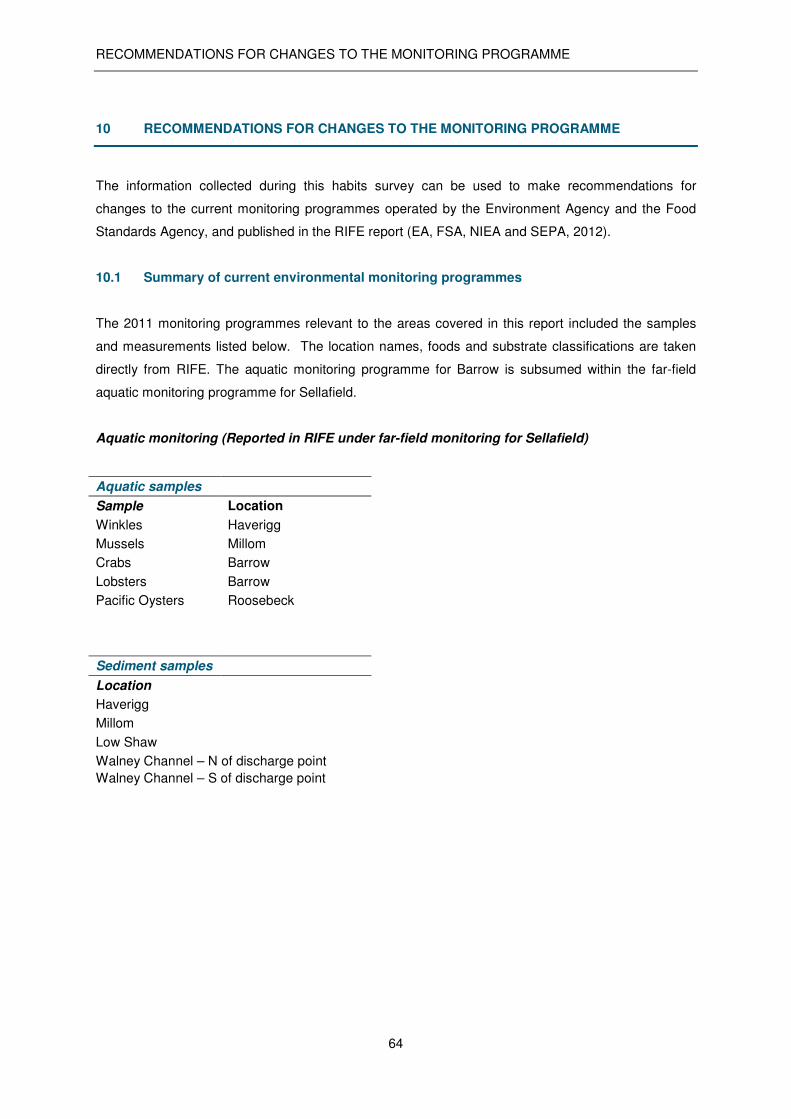
RECOMMENDATIONS FOR CHANGES TO THE MONITORING PROGRAMME
64
10 RECOMMENDATIONS FOR CHANGES TO THE MONITORING PROGRAMME
The information collected during this habits survey can be used to make recommendations for
changes to the current monitoring programmes operated by the Environment Agency and the Food
Standards Agency, and published in the RIFE report (EA, FSA, NIEA and SEPA, 2012).
10.1 Summary of current environmental monitoring programmes
The 2011 monitoring programmes relevant to the areas covered in this report included the samples
and measurements listed below. The location names, foods and substrate classifications are taken
directly from RIFE. The aquatic monitoring programme for Barrow is subsumed within the far-field
aquatic monitoring programme for Sellafield.
Aquatic monitoring (Reported in RIFE under far-field monitoring for Sellafield)
Aquatic samples
Sample Location
Winkles Haverigg
Mussels Millom
Crabs Barrow
Lobsters Barrow
Pacific Oysters Roosebeck
Sediment samples
Location
Haverigg
Millom
Low Shaw
Walney Channel – N of discharge point
Walney Channel – S of discharge point

Radiological Habits Survey: Barrow and the south-west Cumbrian coast, 2012
65
Gamma dose rate measurements
Substrate Location
Sand and pebbles Silecroft
Pebbles Silecroft
Mud Haverigg
Mud Millom
Mud and stones Millom
Grass Low Shaw
Mud and sand Askam
Mud Walney Channel, N of discharge point
Mud Walney Channel, S of discharge point
Mud and sand Walney Channel, S of discharge point
Salt marsh Tummer Hill Marsh
Grass Tummer Hill Marsh
Pebbles and stones Roa Island
Terrestrial monitoring
The terrestrial monitoring programme at Barrow comprised grass only.
10.2 Recommendations
Recommendations for changes to the current environmental monitoring programmes are made below.
They are based on the findings of this survey and also take into account the potential radiological
significance of the various pathways that were identified.
It is recommended that the samples and gamma dose rate measurements currently taken, which are
not listed below, remain unchanged in the monitoring programmes.
Environment Agency monitoring
• The gamma dose rate measurement currently taken over pebbles and stones at Roa Island
could be moved to the mud and sand on the east side of the causeway to Roa Island (NGR:
SD 233 654), close to a houseboat where high occupancy rates were recorded.
• The sediment sample and gamma dose rate measurements currently taken at the location
called ‘Walney Channel, S of discharge point’ (which is in the central part of Walney
Channel), could be moved to a location on the sand flats and mud flats to the north-west of
the Roa Island causeway, which is to the south of the discharge point of the effluent from the
Salthouse Wastewater Treatment Works.

RECOMMENDATIONS FOR CHANGES TO THE MONITORING PROGRAMME
66
• Consideration could be given to taking a one-off sample of sewage cake from the Salthouse
Wastewater Treatment Works, for public reassurance purposes. However, since the liquid
discharges from Barrow are low and intermittent (made over a period of approximately three
months every two and a half to three years), this is probably not warranted.
Food Standards Agency monitoring
The current aquatic monitoring programme adequately covers the aquatic survey area, both for
discharges from Barrow and for the far-field effects of discharges from Sellafield, and no changes to
this are suggested.
Given the low discharges of gaseous waste from Barrow (Nil recorded in 2011) the sampling of grass
is adequate for the terrestrial monitoring programme and no changes to this are suggested.

Radiological Habits Survey: Barrow and the south-west Cumbrian coast, 2012
67
11 ACKNOWLEDGEMENTS
Gratitude is expressed to representatives of BAE Systems Marine Ltd, local authorities and
associations, and members of the public who offered helpful advice and information during the
survey. This survey was undertaken on behalf of the Environment Agency, the Food Standards
Agency and the Office for Nuclear Regulation. The project officers for these organisations provided
considerable help during the planning of the survey and the drafting of the report.

REFERENCES
68
12 REFERENCES
Allott, R., 2005. Assessment of compliance with the public dose limit. Principles for the assessment
of total retrospective public doses. National Dose Assessment Working Group. NDAWG/2/2005.
Byrom, J., Robinson, C., Simmonds, J.R., Walters, B., and Taylor, R.R., 1995. Food consumption
rates for use in generalised radiological dose assessments. J. Radiol. Prot. 1995 Vol. 15 No 4 335-
341.
Camplin, W.C., Grzechnik, M.P. and Smedley, C.A., 2005. Methods for assessment of total dose in
the Radioactivity in Food and the Environment report. Presented to the National Dose Assessments
Working Group (NDAWG). Paper NDAWG/3/2005, 27th April 2005.
CEC, 1996. Council Directive 96/29/Euratom of 13 May 1996 laying down basic safety standards for
the protection of the health of workers and the general public against the dangers arising from ionizing
radiation. Off. J. Eur. Commun., 39(L159): 1-114.
EA, EHS, FSA and SEPA, 2006. Radioactivity in Food and the Environment, 2005. EA, EHS, FSA
and SEPA, Warrington, Belfast, London and Stirling. RIFE (11).
EA, FSA, NIEA and SEPA, 2012. Radioactivity in Food and the Environment, 2011. EA, FSA, NIEA
and SEPA, Warrington, London, Belfast and Stirling. RIFE (17).
EA, SEPA, DoENI, NRPB and FSA, 2002. Authorisation of discharges of radioactive waste to the
environment. Principles for the assessment of prospective public doses. Interim Guidance. EA,
SEPA, DoENI, NRPB and FSA, Lancaster.
EA, SEPA, NIEA, HPA and FSA, 2012. Principles for the Assessment of Prospective Public Doses
arising from Authorised Discharges of Radioactive Waste to the Environment. EA, SEPA, NIEA, HPA
and FSA, Penrith.
FSA, 2002. Assessment Methodology for the Potential Impact on Food of Radioactive Discharges to
the Environment. FSA, London.
Good Housekeeping, 1994. Good Housekeeping Cook Book. Ebury Press, London.
Hessayon, D. G., 1990. The Fruit Expert, pbi Publications, Waltham Cross.
Hessayon, D. G., 1997. The New Vegetable & Herb Expert, Expert Books, London.

Radiological Habits Survey: Barrow and the south-west Cumbrian coast, 2012
69
Hunt, G.J., Hewett, C.J. and Shepherd, J.G., 1982. The identification of critical groups and its
application to fish and shellfish consumers in the coastal area of the north-east Irish Sea. Health
Physics, Vol. 43, No 6, 875-889.
IAEA, 1996. International basic safety standards for protection against ionizing radiation and for the
safety of radiation sources. Saf. Ser. No. 115. IAEA, Vienna.
ICRP, 1991. 1990 Recommendations of the International Commission on Radiological Protection.
Annal. ICRP 21 (1-3). Pergamon Press, Oxford, (ICRP Publ. 60).
ICRP, 2006. Assessing dose of the representative person for the purpose of radiation protection of
the public. Annal. ICRP 36 (3). Elsevier Science, Oxford, (ICRP Publ. 101).
ICRP, 2007. The 2007 Recommendations of the International Commission on Radiological Protection.
Annal. ICRP 37 (2-4). Elsevier Science, Oxford, (ICRP Publ. 103).
Leonard, D.R.P., Hunt, G.J. and Jones, P.G.W., 1982. Investigation of individual radiation exposures
from discharges to the aquatic environment: techniques used in habits surveys. Proc. 3rd
Int. Symp.
Soc. Radiol. Prot., Inverness, 6 to 11 June 1982. Vol 2, 512-517. Society for Radiological Protection.
NDAWG, 2005. Position paper on the collection and use of habits data for retrospective dose
assessments. National Dose Assessment Working Group. NDAWG/4/2005.
NDAWG, 2009. Acquisition and use of habits data for prospective assessments. National Dose
Assessment Working Group. NDAWG/2/2009.
National Radiological Protection Board, 2005. Guidance on the application of dose coefficients for the
embryo and fetus from intakes of radionuclides by the mother. Docs NRPB 16(2). NRPB, Chilton,
41pp.
Smith, K.R. and Jones, A.L., 2003. Generalised habit data for radiological assessments. NRPB-W41.
NRPB, Chilton.
Thurston, L.M. and Huggins, I.A., 1993. Investigation of Radiation Exposure Pathways from Liquid
Effluents. Duddon and Barrow-in-Furness: Local Habits Survey 1990. MAFF Direct. Fish. Res.
Tech. Note RL 2/93. Lowestoft. (Unpublished)
UK Parliament, 1965. Nuclear Installations Act, 1965 (as amended). HMSO, London.
REFERENCES
70
UK Parliament, 1999. The Ionising Radiation Regulations 1999. Stat. Inst. 1999/3232. HMSO,
London, 67pp.
UK Parliament, 2009a. UK Strategy for Radioactive Discharges. DECC, London.
UK Parliament, 2009b. Draft National Policy Statement for Nuclear Power Generation (EN-6). DECC,
London.
UK Parliament, 2010. Environmental Permitting (England and Wales) Regulations, 2010. Statutory
Instrument 2010 No 675. HMSO, London.
Watson, S.J., Jones, A.L., Oatway, W.B. and Hughes, J.S., 2005. Ionising Radiation Exposure of the
UK Population: 2005 review. HPA-RPD-001, Chilton.
www.statistics.gov.uk

Group Criteria
Estim
ate
of
co
mp
lete
co
ve
rag
e
Nu
mb
er
for
wh
om
po
sitiv
e
da
ta w
as
ob
tain
ed
Co
ve
rag
e f
or
po
sitiv
e
ob
se
rva
tio
ns
Notes
Number of people resident in the terrestrial survey area
(excluding those resident in the direct radiation survey area)
(See (B) TERRESTRIAL PATHWAYS)50700
a130
c 0.3%
The survey targeted individuals who were potentially the most
exposed, mostly producers of local foods such as farmers and
allotment holders.
Number of people resident in the direct radiation survey area
(See (C) DIRECT RADIATION PATHWAYS)8600
b56
c 0.7%
Number of people working but not resident in the direct
radiation survey area (See (C) DIRECT RADIATION
PATHWAYS)
U 3c U
Excluding employees and contractors at the nuclear licensed
site.
Number of people visiting the direct radiation survey area
(See (C) DIRECT RADIATION PATHWAYS)U 22
c U
Number of people effected by liquid discharges (excluding
those assigned to other categories above) (See (A)
AQUATIC PATHWAYS)
U 311c U
Where an individual visited the direct radiation survey area as
well as being potentially affected by liquid discharges (e.g.
fishermen who worked on their boats in the direct radiation
survey area) they have been allocated to a direct radiation
pathway.
Total for aquatic, terrestrial and direct radiation survey areas U 522c U
Commercial and hobby fishermenNumber of commercial and hobby fishermen based in the
aquatic survey area20 11 55%
People undertaking activities in or on
water (e.g. swimming, boat angling,
sailing and lifeboat duties)
Number of people undertaking activities in or on water in the
aquatic survey areaU 159 U
People using the shore including anglers,
dog walkers and people playing etc.
Number of people undertaking intertidal activities in the
aquatic survey areaU 226 U
Wildfowlers Number of people wildfowling in the aquatic survey area 135 19 14%
Houseboat dwellers Number of people living on boats in the aquatic survey area 4 4 100%Two houseboats were identified in the survey area and
interviews were conducted at both.
Fish consumersNumber of people consuming fish from the aquatic survey
areaU 95 U
Crustacean consumers Number of people consuming crustaceans from the aquatic
survey areaU 8 U
Mollusc consumersNumber of people consuming molluscs from the aquatic
survey areaU 27 U
Wildfowl consumersNumber of people consuming wildfowl from the aquatic
survey areaU 7 U
Marine plant consumersNumber of people consuming marine plants from the aquatic
survey areaU 18 U
Salt marsh grazed sheep meat
consumers
Number of people consuming salt marsh grazed sheep meat
from the aquatic survey areaU 6 U
Table 1. Survey coverage
SUMMARY OF ALL PATHWAYS
All potential interviewees in the Barrow
aquatic, terrestrial and direct radiation
survey areas.
(A) AQUATIC PATHWAYS
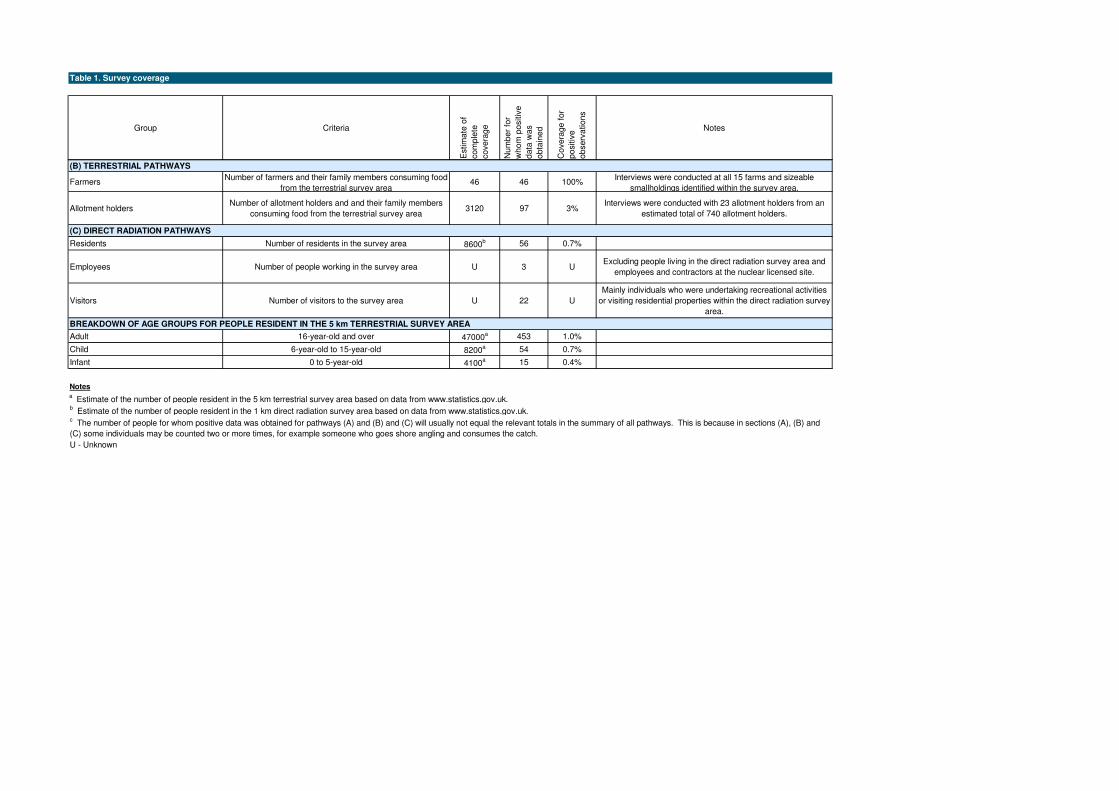
Group Criteria
Estim
ate
of
co
mp
lete
co
ve
rag
e
Nu
mb
er
for
wh
om
po
sitiv
e
da
ta w
as
ob
tain
ed
Co
ve
rag
e f
or
po
sitiv
e
ob
se
rva
tio
ns
Notes
Table 1. Survey coverage
FarmersNumber of farmers and their family members consuming food
from the terrestrial survey area46 46 100%
Interviews were conducted at all 15 farms and sizeable
smallholdings identified within the survey area.
Allotment holdersNumber of allotment holders and and their family members
consuming food from the terrestrial survey area3120 97 3%
Interviews were conducted with 23 allotment holders from an
estimated total of 740 allotment holders.
Residents Number of residents in the survey area 8600b 56 0.7%
Employees Number of people working in the survey area U 3 UExcluding people living in the direct radiation survey area and
employees and contractors at the nuclear licensed site.
Visitors Number of visitors to the survey area U 22 U
Mainly individuals who were undertaking recreational activities
or visiting residential properties within the direct radiation survey
area.
Adult 16-year-old and over 47000a 453 1.0%
Child 6-year-old to 15-year-old 8200a 54 0.7%
Infant 0 to 5-year-old 4100a 15 0.4%
Notesa Estimate of the number of people resident in the 5 km terrestrial survey area based on data from www.statistics.gov.uk.
b Estimate of the number of people resident in the 1 km direct radiation survey area based on data from www.statistics.gov.uk.
U - Unknown
BREAKDOWN OF AGE GROUPS FOR PEOPLE RESIDENT IN THE 5 km TERRESTRIAL SURVEY AREA
c The number of people for whom positive data was obtained for pathways (A) and (B) and (C) will usually not equal the relevant totals in the summary of all pathways. This is because in sections (A), (B) and
(C) some individuals may be counted two or more times, for example someone who goes shore angling and consumes the catch.
(B) TERRESTRIAL PATHWAYS
(C) DIRECT RADIATION PATHWAYS

Green vegetables Asparagus, broccoli, Brussels sprout, cabbage, calabrese, cauliflower, chard, courgette,
cucumber, gherkin, globe artichoke, herbs, kale, leaf beet, lettuce, marrow, spinach
Other vegetables Aubergine, broad bean, chilli pepper, French bean, kohl rabi, mangetout, pea, pepper,
pumpkin, runner bean, sweetcorn, tomato
Root vegetables Beetroot, carrot, celeriac, celery, chicory, fennel, garlic, Jerusalem artichoke, leek, onion,
parsnip, radish, shallot, spring onion, swede, turnip
Potato Potato
Domestic fruit Apple, apricot, blackberry, blackcurrant, boysenberry, cherry, damson, fig, gooseberry,
grape, greengage, huckleberry, loganberry, melon, nectarine, peach, pear, plum,
raspberry, redcurrant, rhubarb, rowanberry, strawberry, tayberry, whitecurrant
Milk Cows' milk, cream, goats' milk, yoghurt
Cattle meata
Beef
Pig meata
Pork
Sheep meata
Lamb, mutton
Poultryb
Chicken, duck, goose, grouse, guinea fowl, partridge, pheasant, pigeon, turkey, woodcock
Eggs Chicken egg, duck egg, goose egg
Wild/free foods Blackberry, chestnut, crab apple, damson, dandelion root, elderberry, nettle,
rowanberry, sloe
Honey Honey
Wild fungi Mushrooms, other edible fungi
Rabbits/Hares Hare, rabbit
Venisona
Venison
Fish (sea) Bass, brill, cod, common ling, dab, Dover sole, flounder, gurnard, haddock, hake, herring,
lemon sole, mackerel, monkfish, mullet, plaice, pollack, rays, saithe, salmon, sea trout,
sprat, turbot, whitebait, whiting, witch, cuttlefishc, squid
c
Fish (freshwater) Brown trout, eel (river), perch, pike, rainbow trout, salmon (river)
Crustaceans Brown crab, common lobster, crawfish, Nephrops , prawn, shrimp, spider crab,
squat lobster, velvet swimming crab
Molluscs Cockles, limpets, mussels, oysters, razor clam, scallops, whelks, winkles
Wildfowlb
Canada goose, greylag goose, mallard, pink-footed goose, pintail, shoveler, teal, wigeon
Notesa Including offal
b Domesticated ducks and geese are classified as poultry. Wild ducks and geese are classified as wildfowl.
c Although squid and cuttlefish are molluscs, radiologically they are more akin to fish.
Table 2. Typical food groups used in habits surveys
Food group Examples of foods within the group

Observation Bass Cod Dab Conger Eel Eel Flounder Grey mullet Lemon sole Mackerel Plaice Thornback ray Whiting Total
number
442 11.8 11.8 - - - - - - 11.8 11.8 - - 47.2
75 - 10.8 - - - 7.3 - - 10.0 - - - 28.1
76 - 10.8 - - - 7.3 - - 10.0 - - - 28.1
450 5.9 - - - - 5.9 - - 5.9 5.9 - - 23.6
451 5.9 - - - - 5.9 - - 5.9 5.9 - - 23.6
427 8.5 1.0 1.5 - - 2.5 - - 9.2 0.5 - - 23.1
428 8.5 1.0 1.5 - - 2.5 - - 9.2 0.5 - - 23.1
77 - 4.1 - 0.5 0.5 4.1 - - 2.5 4.1 4.1 - 19.8
256 5.4 8.2 - - - 1.4 - - - - - - 15.0
257 5.4 8.2 - - - 1.4 - - - - - - 15.0
258 5.4 8.2 - - - 1.4 - - - - - - 15.0
259 5.4 8.2 - - - 1.4 - - - - - - 15.0
278 3.6 3.6 1.6 - - 2.3 - - - 3.6 - - 14.7
279 3.6 3.6 1.6 - - 2.3 - - - 3.6 - - 14.7
410 7.1 6.6 - - - - - - - - - - 13.7
324 4.1 3.0 0.6 - - - 2.1 - - 3.0 - - 12.7
325 4.1 3.0 0.6 - - - 2.1 - - 3.0 - - 12.7
51 3.0 2.5 - - - - - - - 6.0 - - 11.5
52 3.0 2.5 - - - - - - - 6.0 - - 11.5
53 3.0 2.5 - - - - - - - 6.0 - - 11.5
54 3.0 2.5 - - - - - - - 6.0 - - 11.5
55 3.0 2.5 - - - - - - - 6.0 - - 11.5
56 3.0 2.5 - - - - - - - 6.0 - - 11.5
57 3.0 2.5 - - - - - - - 6.0 - - 11.5
338 10.7 - - - - - - - - - - - 10.7
330 5.7 - - - - - - - - 4.5 - - 10.2
331 5.7 - - - - - - - - 4.5 - - 10.2
287 2.3 2.3 - - - 0.9 - - - 1.8 - - 7.3
274 2.3 - - - - 1.4 - - - 2.3 - - 5.9
275 2.3 - - - - 1.4 - - - 2.3 - - 5.9
276 2.3 - - - - 1.4 - - - 2.3 - - 5.9
32 3.4 - - - - - - - - 2.4 - - 5.8
33 3.4 - - - - - - - - 2.4 - - 5.8
321 2.7 1.4 - - - 0.5 - - - 0.7 - 0.5 5.7
322 2.7 1.4 - - - 0.5 - - - 0.7 - 0.5 5.7
Table 3. Adults' consumption rates of fish from the aquatic survey area (kg y-1
)

Observation Bass Cod Dab Conger Eel Eel Flounder Grey mullet Lemon sole Mackerel Plaice Thornback ray Whiting Total
number
Table 3. Adults' consumption rates of fish from the aquatic survey area (kg y-1
)
323 2.7 1.4 - - - 0.5 - - - 0.7 - 0.5 5.7
429 5.6 - - - - - - - - - - - 5.6
38 2.0 2.0 - - - - - - - 1.6 - - 5.6
39 2.0 2.0 - - - - - - - 1.6 - - 5.6
405 2.8 2.6 - - - - - - - - - - 5.5
406 2.8 2.6 - - - - - - - - - - 5.5
348 - 1.8 - - - - - 1.8 - 1.8 - - 5.4
441 1.1 1.1 1.1 - - - - - 1.1 1.1 - - 5.4
298 - - - - - 2.6 - - - 2.5 - - 5.0
299 - - - - - 2.6 - - - 2.5 - - 5.0
501 - - - - - - - - 4.6 - - - 4.6
328 4.3 - - - - - - - - - - - 4.3
329 4.3 - - - - - - - - - - - 4.3
339 - - - - - - - - 4.2 - - - 4.2
340 - - - - - - - - 4.2 - - - 4.2
380 2.1 2.0 - - - - - - - - - - 4.1
381 2.1 2.0 - - - - - - - - - - 4.1
382 2.1 2.0 - - - - - - - - - - 4.1
396 2.1 2.0 - - - - - - - - - - 4.1
465 - - - - - - - - 3.4 - - - 3.4
466 - - - - - - - - 3.4 - - - 3.4
392 1.1 - - - - 1.2 1.1 - - - - - 3.3
393 1.1 - - - - 1.2 1.1 - - - - - 3.3
71 - 1.3 - - - 1.0 - - - 1.0 - - 3.3
72 - 1.3 - - - 1.0 - - - 1.0 - - 3.3
73 - 1.3 - - - 1.0 - - - 1.0 - - 3.3
411 2.1 - - - - - - - - 1.0 - - 3.1
412 2.1 - - - - - - - - 1.0 - - 3.1
351 2.8 - - - - - - - - - - - 2.8
352 2.8 - - - - - - - - - - - 2.8
459 - - - - - - - - 2.3 - - - 2.3
232 - 2.2 - - - - - - - - - - 2.2
233 - 2.2 - - - - - - - - - - 2.2
171 0.3 - 1.4 - - - - - - - - - 1.7
172 0.3 - 1.4 - - - - - - - - - 1.7

Observation Bass Cod Dab Conger Eel Eel Flounder Grey mullet Lemon sole Mackerel Plaice Thornback ray Whiting Total
number
Table 3. Adults' consumption rates of fish from the aquatic survey area (kg y-1
)
249 - - - - - 0.8 0.5 - - - - - 1.3
250 - - - - - 0.8 0.5 - - - - - 1.3
467 - - - - - - - - 1.3 - - - 1.3
468 - - - - - - - - 1.3 - - - 1.3
35 0.5 - - - - - - - - 0.4 - - 0.9
36 0.5 - - - - - - - - 0.4 - - 0.9
157 0.9 - - - - - - - - - - - 0.9
46 0.5 - - - - - - - - 0.4 - - 0.9
47 0.5 - - - - - - - - 0.4 - - 0.9
43 0.6 - - - - - - - - - - - 0.6
44 0.6 - - - - - - - - - - - 0.6
40 0.5 - - - - - - - - - - - 0.5
242 0.5 - - - - - - - - - - - 0.5
243 0.5 - - - - - - - - - - - 0.5
244 0.5 - - - - - - - - - - - 0.5
248 0.5 - - - - - - - - - - - 0.5
Notes
Emboldened observations are the high-rate consumers
The mean consumption rate of fish based on the 8 high-rate adult consumers is 27.1 kg y-1
The observed 97.5th
percentile rate based on 86 observations is 27.5 kg y-1
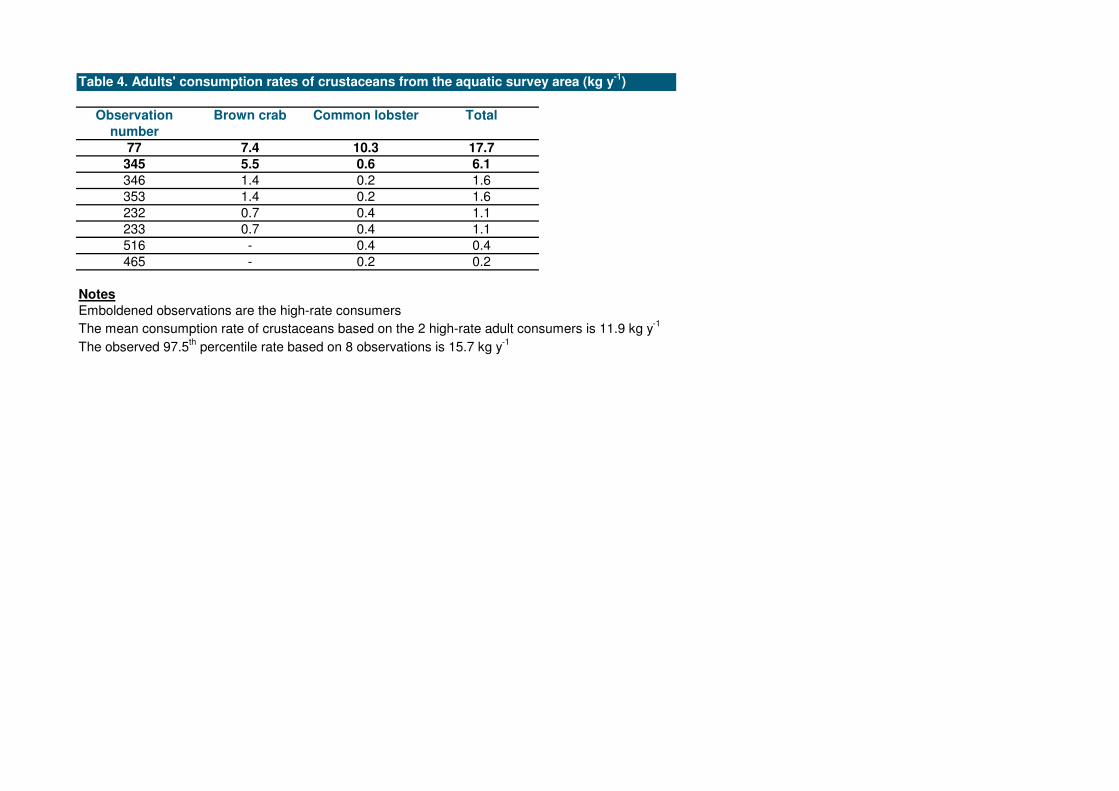
Observation Brown crab Common lobster Total
number
77 7.4 10.3 17.7
345 5.5 0.6 6.1
346 1.4 0.2 1.6
353 1.4 0.2 1.6
232 0.7 0.4 1.1
233 0.7 0.4 1.1
516 - 0.4 0.4
465 - 0.2 0.2
Notes
Emboldened observations are the high-rate consumers
The mean consumption rate of crustaceans based on the 2 high-rate adult consumers is 11.9 kg y-1
The observed 97.5th percentile rate based on 8 observations is 15.7 kg y
-1
Table 4. Adults' consumption rates of crustaceans from the aquatic survey area (kg y-1
)

Observation Cockle Mussel Whelk Winkle Total
number
450 4.3 1.1 - 1.4 6.8
77 1.1 1.2 2.5 1.3 6.1
442 - - 4.4 1.3 5.7
451 4.3 0.5 - - 4.8
292 - 0.9 - 0.7 1.6
293 - 0.9 - 0.7 1.6
441 - 0.2 0.5 - 0.7
465 - 0.6 - - 0.6
466 - 0.6 - - 0.6
351 0.3 - - 0.2 0.5
458 - 0.5 - - 0.5
171 0.4 - - - 0.4
172 0.4 - - - 0.4
516 - - 0.4 - 0.4
352 0.3 - - - 0.3
249 0.3 - - - 0.3
250 0.3 - - - 0.3
512 0.3 - - - 0.3
513 0.3 - - - 0.3
514 0.3 - - - 0.3
515 0.3 - - - 0.3
173 0.1 - - - 0.1
174 0.1 - - - 0.1
Notes
Emboldened observations are the high-rate consumers
The mean consumption rate of molluscs based on the 4 high-rate adult consumers is 5.9 kg y-1
The observed 97.5th percentile rate based on 23 observations is 6.5 kg y
-1
Table 5. Adults' consumption rates of molluscs from the aquatic survey area (kg y-1
)

Table 6. Adults' consumption rates of wildfowl from the aquatic survey area (kg y-1
)
Observation Canada goose Greylag goose Mallard Pink-footed goose Pintail Shoveler Teal Wigeon Total
number
104 - 4.4 - 22.1 2.1 - - - 28.6
345 5.6 2.2 6.8 8.5 - - 2.4 - 25.5
157 2.5 4.6 2.8 1.7 1.0 0.3 1.7 4.7 19.3
158 2.5 4.6 2.8 - 1.0 - 1.7 4.7 17.3
450 - 11.0 3.6 - 0.9 - 0.4 - 15.9
451 - 11.0 3.6 - 0.9 - 0.4 - 15.9
105 - - 1.8 8.5 1.1 - - 1.4 12.8
459 - - 5.6 - 4.4 - - - 10.0
460 - - 5.6 - 4.4 - - - 10.0
102 - - 1.4 3.4 - - 0.2 1.4 6.3
106 - - - 5.1 - - - - 5.1
132 - - 2.1 1.1 0.9 - 0.1 0.5 4.7
133 - - 2.1 1.1 0.9 - 0.1 0.5 4.7
134 - - 2.1 1.1 0.9 - 0.1 0.5 4.7
103 - - - 3.4 - - - - 3.4
101 1.4 - 0.9 - 1.1 - - - 3.4
Notes
Emboldened observations are the high-rate consumers
The mean consumption rate of wildfowl based on the 9 high-rate adult consumers is 17.2 kg y-1
The observed 97.5th percentile rate based on 16 observations is 27.4 kg y
-1

Observation Samphire
number
249 0.9
502 0.8
503 0.8
77 0.5
442 0.3
441 0.2
501 0.2
Notes
Emboldened observations are the high-rate consumers
The mean consumption rate of marine plants/algae based on the 4 high-rate adult consumers is 0.7 kg y-1
The observed 97.5th percentile rate based on 7 observations is 0.9 kg y
-1
Observation Salt marsh grazed lamb
number
107 5.7
108 5.7
109 5.7
110 5.7
111 5.7
112 5.7
Notes
Emboldened observations are the high-rate consumers
The mean consumption rate of salt marsh grazed sheep meat based on the 6 high-rate adult consumers is 5.7 kg y-1
The observed 97.5th percentile rate based on 6 observations is 5.7 kg y
-1
Table 7. Adults' consumption rates of marine plants/algae from the aquatic survey area (kg y-1
)
Table 8. Adults' consumption rates of salt marsh grazed sheep meat from the aquatic survey area (kg y-1
)

Observation Age Bass Cod Dab Flounder Plaice Total
number
58 10 3.0 2.5 - - 6.0 11.5
280 7 2.7 2.7 1.1 1.8 2.7 11.1
295 14 - - - 2.6 2.5 5.0
297 12 - - - 2.6 2.5 5.0
34 15 2.3 - - - 1.8 4.1
41 12 0.5 - - - - 0.5
42 15 0.5 - - - - 0.5
37 6 0.3 - - - 0.2 0.5
Notes
Emboldened observations are the high-rate consumers
The mean consumption rate of fish for the child age group based upon the 5 high-rate consumers is 7.4 kg y-1
The observed 97.5th percentile rate based on 8 observations is 11.4 kg y
-1
Observation Age Bass Cod Dab Flounder Plaice Total
number
281 5 1.8 1.8 0.9 1.1 0.8 6.5
Notes
Emboldened observations are the high-rate consumers
The mean consumption rate of fish for the infant age group based upon the only high-rate consumer is 6.5 kg y-1
The observed 97.5th percentile rate is not applicable for 1 observation
Infant age group (0 - 5 years old)
Child age group (6 - 15 years old)
Table 9. Children's and infants' consumption rates of fish from the aquatic survey area (kg y-1
)

Child age group (6 - 15 years old)
Observation Age Cockle Mussel Total
number
294 9 - 0.9 0.9
452 12 0.5 - 0.5
175 15 0.1 - 0.1
176 11 0.1 - 0.1
Notes
Emboldened observations are the high-rate consumers
The mean consumption rate of molluscs for the child age group based upon the 2 high-rate consumers is 0.7 kg y-1
The observed 97.5th percentile rate based on 4 observations is 0.9 kg y
-1
Table 10. Children's consumption rates of molluscs from the aquatic survey area (kg y-1
)

Child age group (6 - 15 years old)
Observation Age Canada goose Greylag goose Mallard Pintail Teal Wigeon Total
number
159 13 1.8 3.5 2.1 0.7 1.3 3.5 12.9
Notes
Emboldened observations are the high-rate consumers
The mean consumption rate of wildfowl for the child age group based upon the only high-rate consumer is 12.9 kg y-1
The observed 97.5th percentile rate is not applicable for 1 observation
Infant age group (0 - 5 years old)
Observation Age Canada goose Greylag goose Mallard Pintail Teal Wigeon Total
number
160 5 0.2 0.5 - 0.1 0.2 0.5 1.4
Notes
Emboldened observations are the high-rate consumers
The mean consumption rate of wildfowl for the infant age group based upon the only high-rate consumer is 1.4 kg y-1
The observed 97.5th percentile rate is not applicable for 1 observation
Table 11. Children's and infants' consumption rates of wildfowl from the aquatic survey area (kg y-1
)

Observation Location Activity Mud Mud and Mud and Salt marsh Sand Sand and Boat on
number sand stones stones mud and sand
South-east Walney Island Wildfowling 220 - - - - - -
Walney Channel Gill netting - 72 - - - - -
South-west Walney Island Wildfowling - - - - - 8 -
Walney Channel Angling 208 - - - - - -
Walney Channel Bait digging - 104 - - - - -
459 South-east Walney Island Wildfowling 200 - - - - - -
461 Foulney Island Collecting mussels 90 - - - - - -
462 Foulney Island Collecting mussels 90 - - - - - -
456 Walney Channel Boat maintenance 80 - - - - - 720
457 Walney Channel Boat maintenance 80 - - - - - 720
South-east Walney Island Wildfowling - - - - - -
South-west Walney Island Collecting crabs - - - - - -
South-east Walney Island Walking - - - 5 - - -
South-west Walney Island Angling - - - - - 240 -
Walney Channel Collecting crabs 34 - - - - - -
West Walney Island (Biggar Bank) Angling - - - - - 68 -
463 Foulney Island Collecting mussels 27 - - - - - -
464 Foulney Island Collecting mussels 27 - - - - - -
North-east Walney Channel Dog walking - - - - - -
Scarth Bight Wildfowling - - - - - -
South Walney Channel Collecting winkles - - - - - -
North-east and south-east Walney Island Collecting cockles - - - - - -
Hodbarrow Collecting mussels - - - - - -
501 Between Rampside and Roa Island Walking and collecting samphire - 182 - - - - -
427 Walney Channel Bait digging - 104 - - - - -
347 Walney Channel Gill netting - 72 - - - - -
502 Between Rampside and Roa Island Collecting samphire - 6 - - - - -
503 Between Rampside and Roa Island Collecting samphire - 6 - - - - -
South-east Walney Island Collecting cockles - 5 - - - - -
South-west Walney Island Collecting winkles - - - - - 6 -
71 Walney Channel Boat maintenance - - 420 - - - -
74 Walney Channel Boat maintenance - - 420 - - - -
Walney Channel Boat maintenance - - 360 - - - -
Roanhead and Askam-in-Furness Bait digging - - - - 54 - -
458 Foulney Island Collecting mussels - - 105 - - - -
Walney Channel Collecting mussels - - - - - -
Roa Island and north-east Walney Channel Collecting winkles - - - - - -
Walney Channel Angling - - 80 - - - -
Millom Iron Works Bait digging - - - - 50 - -
Silecroft Angling - - - - - 300 -
345
428
157
36
348
75
324
62
429
450
625
351
Table 12. Adults' intertidal occupancy rates in the aquatic survey area (h y-1
)
95

Observation Location Activity Mud Mud and Mud and Salt marsh Sand Sand and Boat on
number sand stones stones mud and sand
Table 12. Adults' intertidal occupancy rates in the aquatic survey area (h y-1
)
Millom Iron Works Collecting crabs - - 48 - - - -
Millom Iron Works Bait digging - - - - 45 - -
Gutterby, Silecroft and west Walney Island Angling - - - - - 40 -
Walney Channel Collecting mussels - - - - - -
Roa Island and north-east Walney Channel Collecting winkles - - - - - -
Walney Channel Collecting mussels - - - - - -
Roa Island and north-east Walney Channel Collecting winkles - - - - - -
Millom Iron Works Collecting crabs - - 20 - - - -
Millom Iron Works Bait digging - - - - - -
Hodbarrow and Haverigg Angling - - - - - -
Silecroft Angling - - - - - 250 -
455 Walney Channel Collecting seaweed - - 15 - - - -
Millom Iron Works Collecting crabs - - 12 - - - -
Millom Iron Works Bait digging - - - - - -
Hodbarrow and Haverigg Angling - - - - - -
Silecroft Angling - - - - - 300 -
92 West Duddon Estuary marshes Wildfowling - - - 293 - - -
93 West Duddon Estuary marshes Wildfowling - - - 293 - - -
94 West Duddon Estuary marshes Wildfowling - - - 293 - - -
95 West Duddon Estuary marshes Wildfowling - - - 293 - - -
96 West Duddon Estuary marshes Wildfowling - - - 293 - - -
97 West Duddon Estuary marshes Wildfowling - - - 293 - - -
98 West Duddon Estuary marshes Wildfowling - - - 293 - - -
99 West Duddon Estuary marshes Wildfowling - - - 293 - - -
100 West Duddon Estuary marshes Wildfowling - - - 293 - - -
101 West Duddon Estuary marshes Wildfowling - - - 293 - - -
102 West Duddon Estuary marshes Wildfowling - - - 293 - - -
103 West Duddon Estuary marshes Wildfowling - - - 293 - - -
104 West Duddon Estuary marshes Wildfowling - - - 293 - - -
105 West Duddon Estuary marshes Wildfowling - - - 293 - - -
106 West Duddon Estuary marshes Wildfowling - - - 293 - - -
107 West Duddon Estuary marshes Tending livestock - - - 199 - - -
113 West Duddon Estuary marshes Tending livestock - - - 52 - - -
114 West Duddon Estuary marshes Tending livestock - - - 52 - - -
South-east Walney Island Collecting samphire - - - 16 - - -
South-east Walney Island Collecting cockles - - - - - -
Walney Channel Collecting mussels - - - - - -
Piel Island Collecting winkles - - - - - 14 -
South-east Walney Island Dog walking - - - 12 - - -
West Walney Island (Biggar Bank) Dog walking - - - - - 100 -
349
248
77 16
278 175
625273
262
350 48
48

Observation Location Activity Mud Mud and Mud and Salt marsh Sand Sand and Boat on
number sand stones stones mud and sand
Table 12. Adults' intertidal occupancy rates in the aquatic survey area (h y-1
)
South-east Walney Island Dog walking - - - 12 - - -
West Walney Island (Biggar Bank) Dog walking - - - - - 100 -
Scarth Bight Collecting samphire - - - 1 - - -
Scarth Bight Setting nets - - - - - -
Duddon Sands (near Lowsy Point) Collecting cockles - - - - - -
296 Hodbarrow Dog walking - - - - 1460 - -
242 Hodbarrow Dog walking and sitting on the beach - - - - 1288 - -
243 Hodbarrow Dog walking and sitting on the beach - - - - 1288 - -
453 Off Roosebeck Oyster farming - - - - 637 - -
454 Off Roosebeck Oyster farming - - - - 637 - -
372 South-west Walney Island (Low Bank) Dog walking - - - - 548 - -
304 Hodbarrow and Haverigg Dog walking - - - - 400 - -
305 Hodbarrow and Haverigg Dog walking - - - - 400 - -
Askam-in-Furness Dog walking - - - - 365 - -
Askam-in-Furness Boat dwelling (tide out) - - - - - - 7615
375 West Walney Island (Biggar Bank) Dog walking - - - - 365 - -
376 West Walney Island (Biggar Bank) Dog walking - - - - 365 - -
390 Between Rampside and Roosebeck Dog walking - - - - 365 - -
391 Between Rampside and Roosebeck Dog walking - - - - 365 - -
378 West Walney Island (Biggar Bank) Dog walking - - - - 335 - -
379 West Walney Island (Biggar Bank) Dog walking - - - - 335 - -
Lowsy Point Dog walking and bait digging - - - - - -
Duddon Estuary Angling - - - - - -
Millom Iron Works and Silecroft Bait digging - - - - - -
Hodbarrow and Haverigg Angling - - - - - -
Silecroft Angling - - - - - 400 -
Millom Iron Works Bait digging - - - - - -
Hodbarrow and Haverigg Angling - - - - - -
Silecroft and west Walney Island (Biggar Bank) Angling - - - - - 362 -
31 Roanhead Dog walking - - - - 300 - -
50 Askam-in-Furness Dog walking - - - - 300 - -
Haverigg Walking - - - - 285 - -
Silecroft Walking - - - - - 65 -
Millom Iron Works and Silecroft Bait digging - - - - - -
Haverigg Angling - - - - - -
Silecroft Angling - - - - - 600 -
Millom Iron Works Bait digging - - - - - -
Hodbarrow and Haverigg Angling - - - - - -
Silecroft and west Walney Island (Biggar Bank) Angling - - - - - 270 -
330300
5
63
215
263
249
327250
326300
291
287250
334

Observation Location Activity Mud Mud and Mud and Salt marsh Sand Sand and Boat on
number sand stones stones mud and sand
Table 12. Adults' intertidal occupancy rates in the aquatic survey area (h y-1
)
Millom Iron Works Bait digging - - - - - -
Hodbarrow and Haverigg Angling - - - - - -
Silecroft Angling - - - - - 100 -
Haverigg Walking - - - - 220 - -
Silecroft Walking - - - - - 50 -
Millom Iron Works Bait digging - - - - - -
Hodbarrow and Haverigg Angling - - - - - -
Silecroft Angling - - - - - 100 -
314 Haverigg Playing - - - - 198 - -
377 West Walney Island (Biggar Bank) Dog walking - - - - 195 - -
312 Haverigg Dog walking - - - - 183 - -
310 Haverigg Dog walking - - - - 182 - -
Roanhead and Askam-in-Furness Bait digging - - - - - -
Duddon Estuary off Askam-in-Furness Boat launching - - - - - -
389 Between Rampside and Roosebeck Dog walking - - - - 160 - -
317 Haverigg Playing - - - - 156 - -
394 Between Rampside and Roa Island Dog walking - - - - 156 - -
395 Between Rampside and Roa Island Dog walking - - - - 156 - -
413 West Walney Island (West Shore Park) Playing - - - - 149 - -
414 West Walney Island (West Shore Park) Playing - - - - 149 - -
32 Roanhead Angling and bait digging - - - - 142 - -
214 Lowsy Point Angling and bait digging - - - - 142 - -
West Walney Island (Biggar Bank) Bait digging - - - - 130 - -
West Walney Island (West Shore Park) Angling - - - - - 234 -
302 Hodbarrow and Haverigg Dog walking - - - - 130 - -
303 Hodbarrow and Haverigg Dog walking - - - - 130 - -
366 West Walney Island (Biggar Bank) Walking - - - - 130 - -
367 West Walney Island (Biggar Bank) Walking - - - - 130 - -
306 Hodbarrow and Haverigg Playing - - - - 120 - -
387 Between Rampside and Roosebeck Dog walking - - - - 104 - -
388 Between Rampside and Roosebeck Dog walking - - - - 104 - -
359 West Walney Island (Biggar Bank) Playing - - - - 90 - -
360 West Walney Island (Biggar Bank) Playing - - - - 90 - -
311 Haverigg Dog walking - - - - 78 - -
374 South-West Walney Island (Low Bank) Quad biking - - - - 66 - -
309 Hodbarrow and Haverigg Playing - - - - 60 - -
407 West Walney Island (West Shore Park) Playing - - - - 60 - -
Silecroft Bait digging - - - - 50 - -
Silecroft Angling - - - - - 300 -
288
410
282
51 168
328200
277250

Observation Location Activity Mud Mud and Mud and Salt marsh Sand Sand and Boat on
number sand stones stones mud and sand
Table 12. Adults' intertidal occupancy rates in the aquatic survey area (h y-1
)
Millom Iron Works Bait digging - - - - 50 - -
Silecroft Angling - - - - - 300 -
45 Roosebeck Bait digging - - - - 45 - -
423 West Walney Island (Biggar Bank) Walking - - - - 39 - -
424 West Walney Island (Biggar Bank) Walking - - - - 39 - -
48 Askam-in-Furness Quad biking and playing - - - - 36 - -
332 Askam-in-Furness Rescue crew duties - - - - 36 - -
333 Askam-in-Furness Rescue crew duties - - - - 36 - -
334 Askam-in-Furness Rescue crew duties - - - - 36 - -
335 Askam-in-Furness Rescue crew duties - - - - 36 - -
336 Askam-in-Furness Rescue crew duties - - - - 36 - -
337 Askam-in-Furness Rescue crew duties - - - - 36 - -
338 Askam-in-Furness Rescue crew duties - - - - 36 - -
339 Askam-in-Furness Rescue crew duties - - - - 36 - -
46 Roosebeck Bait digging - - - - 28 - -
Walney Channel (Walney Meetings) Bait digging - - - - 26 - -
West Walney Island (West Shore Park) Angling - - - - - 91 -
Walney Channel (Walney Meetings) Bait digging - - - - 26 - -
West Walney Island (West Shore Park) Angling - - - - - 91 -
59 Roanhead Playing and kite flying - - - - 24 - -
300 Millom Iron Works Bait digging - - - - 24 - -
301 Millom Iron Works Bait digging - - - - 24 - -
425 West Walney Island (Biggar Bank) and Roa Island Walking - - - - 24 - -
426 West Walney Island (Biggar Bank) Walking - - - - 24 - -
35 Roanhead Angling - - - - 23 - -
West Walney Island (Biggar Bank) Bait digging - - - - 13 - -
West Walney Island (Biggar Bank) Angling - - - - - 39 -
West Walney Island (Biggar Bank) Bait digging - - - - 13 - -
West Walney Island (Biggar Bank) Angling - - - - - 39 -
West Walney Island (Biggar Bank) Bait digging - - - - 13 - -
West Walney Island (Biggar Bank) Angling - - - - - 39 -
171 Duddon Sands (near Lowsy Point) Collecting cockles - - - - 9 - -
40 Roanhead and Askam-in-Furness Bait digging - - - - 6 - -
396 Roa Island Walking - - - - 5 - -
512 South-east Walney Island Collecting cockles - - - - 5 - -
513 South-east Walney Island Collecting cockles - - - - 5 - -
514 South-east Walney Island Collecting cockles - - - - 5 - -
515 South-east Walney Island Collecting cockles - - - - 5 - -
177 Roanhead Angling - - - - - 616 -
178 Roanhead Angling - - - - - 616 -
380
381
382
321
411
412

Observation Location Activity Mud Mud and Mud and Salt marsh Sand Sand and Boat on
number sand stones stones mud and sand
Table 12. Adults' intertidal occupancy rates in the aquatic survey area (h y-1
)
286 Silecroft Dog walking - - - - - 520 -
256 West Walney Island (Biggar Bank) Dog walking and angling - - - - - 515 -
439 Walney Channel (west Barrow Island) Boat maintenance - - - - - 220 -
440 Walney Channel (west Barrow Island) Boat maintenance - - - - - 220 -
28 Askam-in-Furness Dog walking - - - - - 150 -
29 Askam-in-Furness Dog walking - - - - - 144 -
30 Askam-in-Furness Dog walking - - - - - 144 -
285 Silecroft Dog walking - - - - - 104 -
292 Selker Bay Collecting mussels, winkles and firewood - - - - - 78 -
268 West Walney Island (Biggar Bank) Walking - - - - - 52 -
269 West Walney Island (Biggar Bank) Walking - - - - - 52 -
383 West Walney Island (Biggar Bank) Angling - - - - - 52 -
241 Selker Bay Walking - - - - - 48 -
283 Silecroft Dog walking - - - - - 26 -
232 West Walney Island (Biggar Bank) Hooking crabs and lobsters - - - - - 24 -
238 West Walney Island (Biggar Bank) Hooking crabs and lobsters - - - - - 24 -
442 West Barrow Island Collecting samphire - - - - - 3 -
441 West Barrow Island Collecting samphire - - - - - 2 -
447 Near Roa Island Boat dwelling (tide out) - - - - - - 5107
448 Near Roa Island Boat dwelling (tide out) - - - - - - 3830
Notes
Emboldened observations are the high-rate individuals
The mean intertidal occupancy rate over mud based on 7 high-rate observations is 138 h y-1
The observed 97.5th
percentile rate based on 11 observations for mud is 217 h y-1
The mean intertidal occupancy rate over mud and sand based on 1 observation is 625 h y-1
The observed 97.5th
percentile rate based on 9 observations for mud and sand is 536 h y-1
The mean intertidal occupancy rate over mud and stones based on 3 high-rate observations is 400 h y-1
The observed 97.5th
percentile rate based on 12 observations for mud and stones is 420 h y-1
The mean intertidal occupancy rate over salt marsh based on 16 high-rate observations is 287 h y-1
The observed 97.5th
percentile rate based on 23 observations for salt marsh is 293 h y-1
The mean intertidal occupancy rate over sand based on 7 high-rate observations is 926 h y-1
The observed 97.5th
percentile rate based on 94 observations for sand is 1076 h y-1
The mean intertidal occupancy rate over sand and stones based on 17 high-rate observations is 368 h y-1
The observed 97.5th
percentile rate based on 47 observations for sand and stones is 614 h y-1
The mean intertidal occupancy rate over a boat on mud and sand based on 3 high-rate observations is 5517 h y-1
The observed 97.5th
percentile rate based on 5 observations for a boat on mud and sand is 7364 h y-1

Child age group (6 - 15 years old)
Observation Age Location Activity Sand Sand and Boat on
number stones mud and sand
Hodbarrow Dog walking - -
Millom Iron Works Bait digging - -
Hodbarrow Dog walking and angling - -
Millom Iron Works Bait digging - -
Haverigg Walking and playing 220 - -
Silecroft Walking and playing - 50 -
Haverigg Walking and playing 220 - -
Silecroft Walking and playing - 50 -
315 10 Haverigg Playing 198 - -
316 7 Haverigg Playing 198 - -
415 8 West Walney Island (West Shore Park) Playing 149 - -
369 10 West Walney Island (Biggar Bank) Walking 130 - -
307 10 Hodbarrow and Haverigg Playing 120 - -
308 8 Hodbarrow and Haverigg Playing 120 - -
313 8 Haverigg Dog walking 92 - -
373 11 South-west Walney Island (Low Bank) Quad biking 66 - -
408 7 West Walney Island (West Shore Park) Playing 60 - -
409 10 West Walney Island (West Shore Park) Playing 60 - -
Duddon Estuary Angling - -
Lowsy Point Bait digging - -
60 9 Roanhead Playing and kite flying 24 - -
62 11 Roanhead Playing and kite flying 24 - -
34 15 Roanhead Angling 20 - -
37 6 Roanhead Playing 10 - -
452 12 North-east and south-east Walney Island Collecting cockles 8 - -
240 15 Tarn Point and Selker Bay Dog walking - 200 -
284 11 Silecroft Dog walking - 26 -
449 11 Near Roa Island Boat dwelling (tide out) - - 3830
Notes
Emboldened observations are the high-rate individuals
The mean intertidal occupancy rate over sand for the child age group based on 2 high-rate observations is 710 h y-1
The observed 97.5th percentile rate based on 20 observations for sand is 711 h y
-1
The mean intertidal occupancy rate over sand and stones for the child age group based on 1 high-rate observations is 200 h y-1
The observed 97.5th percentile rate based on 4 observations for sand and stones is 189 h y
-1
The mean intertidal occupancy rate over a boat on mud and sand for the child age group based on the only observation is 3830 h y-1
The observed 97.5th percentile rate is not applicable for 1 observation
742
295 14 677
Table 13. Children's and infants' intertidal occupancy rates in the aquatic survey area (h y-1
)
37
289 11
290 9
217 9
297 12

Table 13. Children's and infants' intertidal occupancy rates in the aquatic survey area (h y-1
)
Infant age group (0 - 5 years old)
Observation Age Location Activity Sand Sand and
number stones
416 5 West Walney Island (West Shore Park) Playing 149 -
49 2 Askam-in-Furness Playing 36 -
61 4 Roanhead Playing and kite flying 24 -
270 3 West Walney Island (Biggar Bank) Playing - 52
271 2 West Walney Island (Biggar Bank) Playing - 52
272 1 West Walney Island (Biggar Bank) Playing - 52
Notes
Emboldened observations are the high-rate individuals
The mean intertidal occupancy rate over sand for the infant age group based on 1 high-rate observations is 149 h y-1
The observed 97.5th percentile rate based on 3 observations for sand is 143 h y
-1
The mean intertidal occupancy rate over sand and stones for the infant age group based on 3 high-rate observations is 52 h y-1
The observed 97.5th percentile rate based on 3 observations for sand and stones is 52 h y
-1

Location National Grid
Reference
Substrate Gamma dose rate
at 1 metrea
Tarn Point SD 075 894 Sand 0.101
Tarn Point SD 075 894 Stones 0.108
Selker Bay SD 076 890 Stones 0.100
Selker Bay SD 076 890 Sand 0.070
Silecroft SD 120 811 Sand 0.088
Haverigg SD 160 783 Sand 0.064
Hodbarrow SD 192 792 Sand 0.062
Millom Iron Works SD 188 799 Sand 0.060
Millom Iron Works SD 188 799 Mud and stones 0.073
West Duddon Estuary (Salthouse Pool) SD 180 806 Salt marsh 0.126
West Duddon Estuary (Arnaby Marsh) SD 202 834 Sand 0.068
West Duddon Estuary (Arnaby Marsh) SD 198 835 Salt marsh 0.115
Askam-in-Furness (north of pier) SD 207 774 Salt marsh 0.064
Askam-in-Furness (south of pier) SD 208 772 Sand 0.061
Roanhead SD 199 757 Sand 0.058
West Walney Island (West Shore Park) SD 170 701 Sand 0.063
South-west Walney Island (Low Bank) SD 198 637 Sand and stones 0.087
South-west Walney Island (Low Bank) SD 198 638 Sand 0.060
East Walney Island (just north of Jubilee Bridge) SD 186 688 Mud 0.081
East Walney Island (south of Jubilee Bridge) SD 187 676 Salt marsh 0.093
East Walney Island (south of Jubilee Bridge) SD 187 676 Mud 0.077
South-east Walney Island (near Sheep Island) SD 209 639 Mud 0.079
South-east Walney Island (near Sheep Island) SD 209 639 Salt marsh 0.086
East of Roa Island SD 234 654 Mud and sand 0.079
Between Rampside and Roosebeck SD 249 670 Sand 0.067
Roosebeck SD 254 673 Sand 0.072
Notesa These measurements have not been adjusted for natural background dose rates.
Table 14. Gamma dose rate measurements over intertidal substrates in the aquatic survey area (µGy h-1
)

Observation Location Activity Fishing gear Sediment
number
Walney Channel, west of Walney Island and Duddon Estuary Handling nets -
Walney Channel Handling pots -
Walney Channel Collecting mussels -
Roa Island and north-east Walney Channel Collecting winkles -
Walney Channel, west of Walney Island and Duddon Estuary Handling nets -
Walney Channel Handling pots -
Walney Channel Collecting mussels -
Roa Island and north-east Walney Channel Collecting winkles -
Walney Channel, west of Walney Island and Duddon Estuary Handling nets
Walney Channel Handling pots
Walney Channel Collecting mussels -
Roa Island and north-east Walney Channel Collecting winkles -
Walney Channel Handling nets 126 -
South-east and south-west Walney Island Wildfowling - 228
347 Walney Channel Handling nets 126 -
435 Off Walney Island Handling nets 20 -
436 Off Walney Island Handling nets 20 -
437 Off Walney Island Handling nets 20 -
438 Off Walney Island Handling nets 20 -
Scarth Bight Handling nets 3 -
Duddon Sands (near Lowsy Point) Collecting cockles - 2
453 Off Roosebeck Oyster farming - 546
454 Off Roosebeck Oyster farming - 546
92 West Duddon Estuary marshes Wildfowling - 293
93 West Duddon Estuary marshes Wildfowling - 293
94 West Duddon Estuary marshes Wildfowling - 293
95 West Duddon Estuary marshes Wildfowling - 293
96 West Duddon Estuary marshes Wildfowling - 293
97 West Duddon Estuary marshes Wildfowling - 293
98 West Duddon Estuary marshes Wildfowling - 293
99 West Duddon Estuary marshes Wildfowling - 293
100 West Duddon Estuary marshes Wildfowling - 293
101 West Duddon Estuary marshes Wildfowling - 293
102 West Duddon Estuary marshes Wildfowling - 293
103 West Duddon Estuary marshes Wildfowling - 293
104 West Duddon Estuary marshes Wildfowling - 293
350
743 -
48
345
348
1485
95
349
743
Table 15. Adults' handling rates of fishing gear and sediment in the aquatic survey area (h y-1
)
48
249
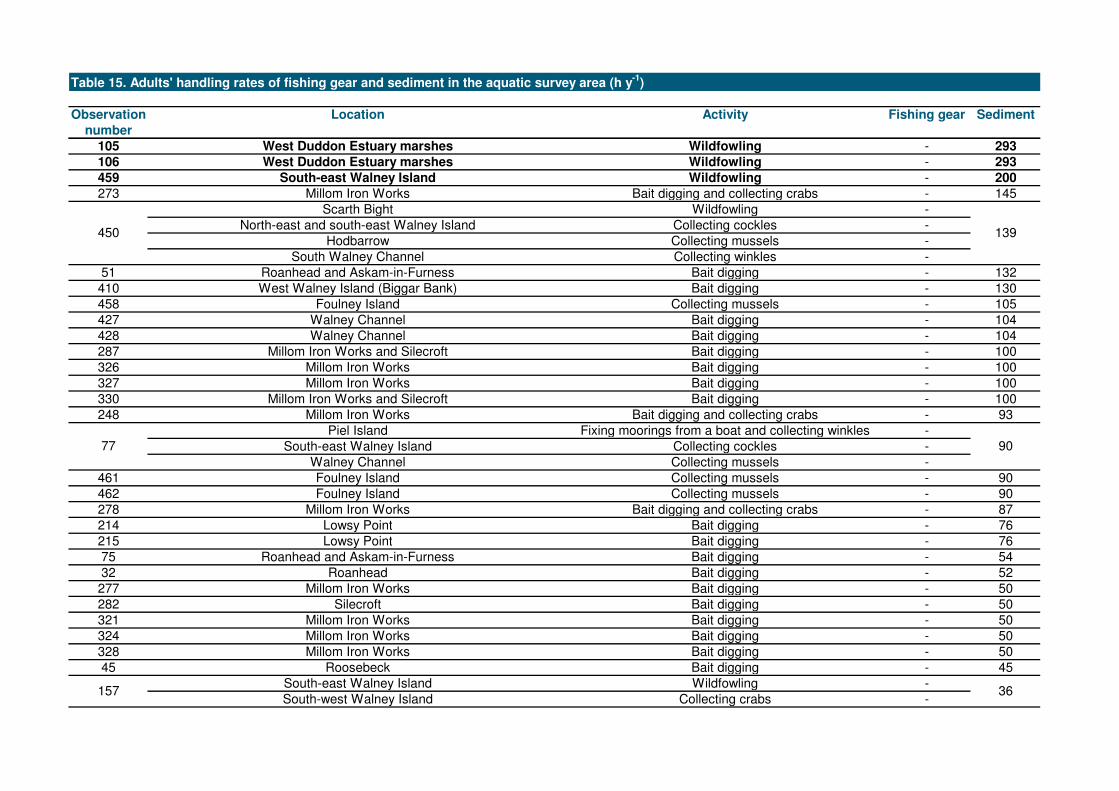
Observation Location Activity Fishing gear Sediment
number
Table 15. Adults' handling rates of fishing gear and sediment in the aquatic survey area (h y-1
)
105 West Duddon Estuary marshes Wildfowling - 293
106 West Duddon Estuary marshes Wildfowling - 293
459 South-east Walney Island Wildfowling - 200
273 Millom Iron Works Bait digging and collecting crabs - 145
Scarth Bight Wildfowling -
North-east and south-east Walney Island Collecting cockles -
Hodbarrow Collecting mussels -
South Walney Channel Collecting winkles -
51 Roanhead and Askam-in-Furness Bait digging - 132
410 West Walney Island (Biggar Bank) Bait digging - 130
458 Foulney Island Collecting mussels - 105
427 Walney Channel Bait digging - 104
428 Walney Channel Bait digging - 104
287 Millom Iron Works and Silecroft Bait digging - 100
326 Millom Iron Works Bait digging - 100
327 Millom Iron Works Bait digging - 100
330 Millom Iron Works and Silecroft Bait digging - 100
248 Millom Iron Works Bait digging and collecting crabs - 93
Piel Island Fixing moorings from a boat and collecting winkles -
South-east Walney Island Collecting cockles -
Walney Channel Collecting mussels -
461 Foulney Island Collecting mussels - 90
462 Foulney Island Collecting mussels - 90
278 Millom Iron Works Bait digging and collecting crabs - 87
214 Lowsy Point Bait digging - 76
215 Lowsy Point Bait digging - 76
75 Roanhead and Askam-in-Furness Bait digging - 54
32 Roanhead Bait digging - 52
277 Millom Iron Works Bait digging - 50
282 Silecroft Bait digging - 50
321 Millom Iron Works Bait digging - 50
324 Millom Iron Works Bait digging - 50
328 Millom Iron Works Bait digging - 50
45 Roosebeck Bait digging - 45
South-east Walney Island Wildfowling -
South-west Walney Island Collecting crabs -157 36
450 139
77 90

Observation Location Activity Fishing gear Sediment
number
Table 15. Adults' handling rates of fishing gear and sediment in the aquatic survey area (h y-1
)
429 Walney Channel Collecting crabs - 34
46 Roosebeck Bait digging - 28
463 Foulney Island Collecting mussels - 27
464 Foulney Island Collecting mussels - 27
292 Selker Bay Collecting mussels and winkles - 26
411 Walney Channel (Walney Meetings) Bait digging - 26
412 Walney Channel (Walney Meetings) Bait digging - 26
232 West Walney Island (Biggar Bank) Hooking crabs and lobsters - 24
238 West Walney Island (Biggar Bank) Hooking crabs and lobsters - 24
300 Millom Iron Works Bait digging - 24
301 Millom Iron Works Bait digging - 24
455 Walney Channel Collecting seaweed - 15
380 West Walney Island (Biggar Bank) Bait digging - 13
381 West Walney Island (Biggar Bank) Bait digging - 13
382 West Walney Island (Biggar Bank) Bait digging - 13
South-east Walney Island Collecting cockles -
South-west Walney Island Collecting winkles -
171 Duddon Sands (near Lowsy Point) Collecting cockles - 9
40 Roanhead and Askam-in-Furness Bait digging - 6
512 South-east Walney Island Collecting cockles - 5
513 South-east Walney Island Collecting cockles - 5
514 South-east Walney Island Collecting cockles - 5
515 South-east Walney Island Collecting cockles - 5
Notes
Emboldened observations are the high-rate individuals
The mean fishing gear handling rate based on 3 high-rate observations is 990 h y-1
The observed 97.5th percentile rate based on 10 observations for fishing gear is 1318 h y
-1
The mean sediment handling rate based on 19 high-rate observations is 311 h y-1
The observed 97.5th percentile rate based on 72 observations for sediment is 350 h y
-1
351 11

Child age group (6 - 15 years old)
Observation Age Location Activity Sediment
number
295 14 Millom Iron Works Bait digging 52
297 12 Millom Iron Works Bait digging 12
452 12 North-east and south-east Walney Island Collecting cockles 8
217 9 Lowsy Point Bait digging 4
Notes
Emboldened observations are the high-rate individuals
The mean sediment handling rate for the child age group based on 1 high-rate observations is 52 h y-1
The observed 97.5th percentile rate based on 4 observations for sediment handling is 49 h y
-1
Table 16. Children's handling rates of sediment in the aquatic survey area (h y-1
)
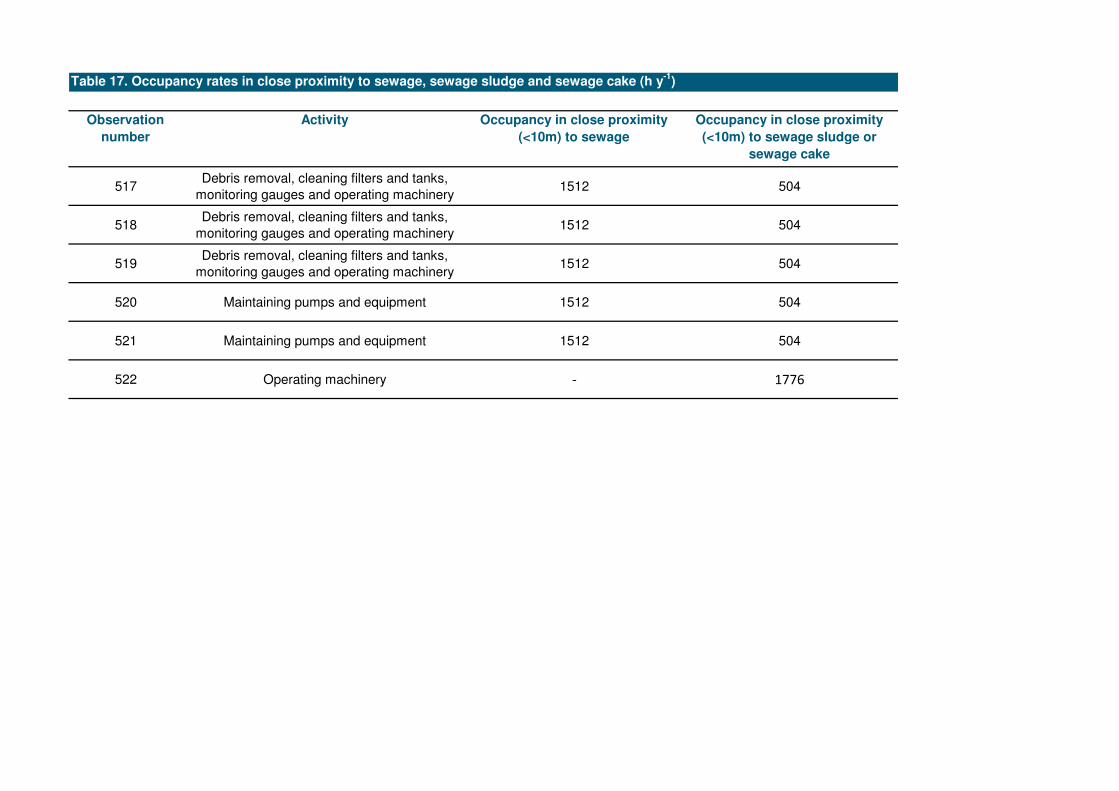
Table 17. Occupancy rates in close proximity to sewage, sewage sludge and sewage cake (h y-1
)
Observation
number
Activity Occupancy in close proximity
(<10m) to sewage
Occupancy in close proximity
(<10m) to sewage sludge or
sewage cake
517Debris removal, cleaning filters and tanks,
monitoring gauges and operating machinery1512 504
518Debris removal, cleaning filters and tanks,
monitoring gauges and operating machinery1512 504
519Debris removal, cleaning filters and tanks,
monitoring gauges and operating machinery1512 504
520 Maintaining pumps and equipment 1512 504
521 Maintaining pumps and equipment 1512 504
522 Operating machinery - 1776
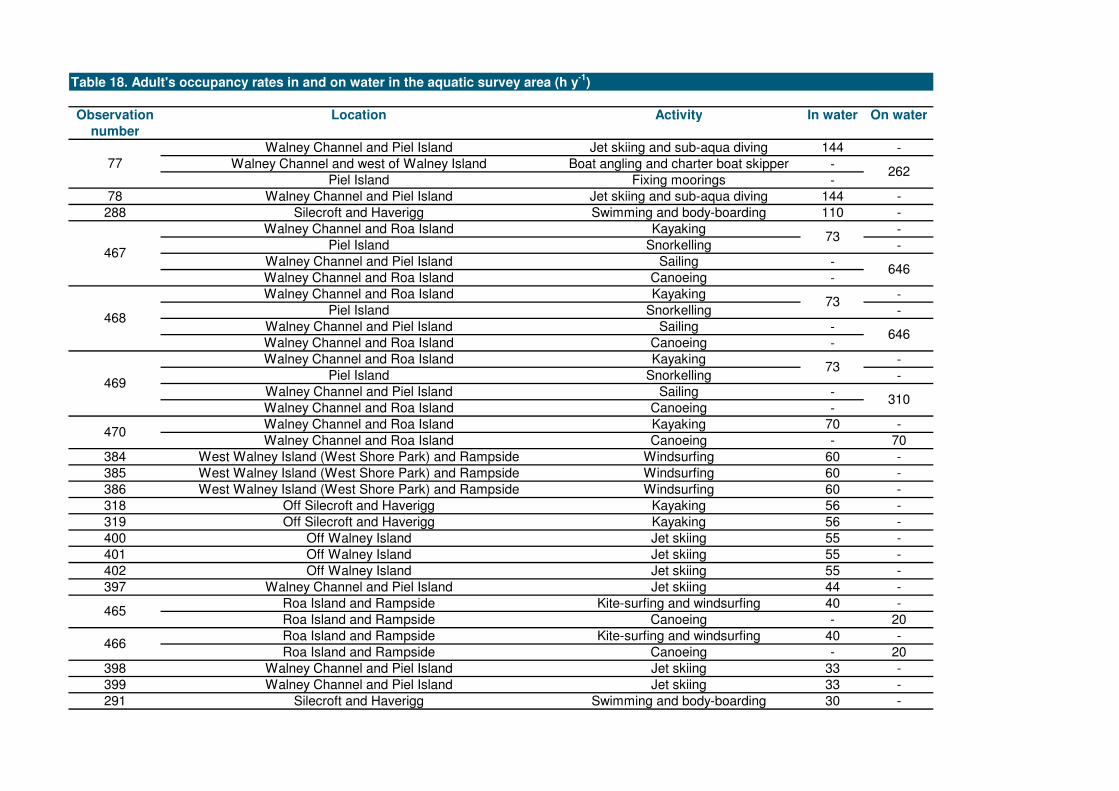
Observation Location Activity In water On water
number
Walney Channel and Piel Island Jet skiing and sub-aqua diving 144 -
Walney Channel and west of Walney Island Boat angling and charter boat skipper -
Piel Island Fixing moorings -
78 Walney Channel and Piel Island Jet skiing and sub-aqua diving 144 -
288 Silecroft and Haverigg Swimming and body-boarding 110 -
Walney Channel and Roa Island Kayaking -
Piel Island Snorkelling -
Walney Channel and Piel Island Sailing -
Walney Channel and Roa Island Canoeing -
Walney Channel and Roa Island Kayaking -
Piel Island Snorkelling -
Walney Channel and Piel Island Sailing -
Walney Channel and Roa Island Canoeing -
Walney Channel and Roa Island Kayaking -
Piel Island Snorkelling -
Walney Channel and Piel Island Sailing -
Walney Channel and Roa Island Canoeing -
Walney Channel and Roa Island Kayaking 70 -
Walney Channel and Roa Island Canoeing - 70
384 West Walney Island (West Shore Park) and Rampside Windsurfing 60 -
385 West Walney Island (West Shore Park) and Rampside Windsurfing 60 -
386 West Walney Island (West Shore Park) and Rampside Windsurfing 60 -
318 Off Silecroft and Haverigg Kayaking 56 -
319 Off Silecroft and Haverigg Kayaking 56 -
400 Off Walney Island Jet skiing 55 -
401 Off Walney Island Jet skiing 55 -
402 Off Walney Island Jet skiing 55 -
397 Walney Channel and Piel Island Jet skiing 44 -
Roa Island and Rampside Kite-surfing and windsurfing 40 -
Roa Island and Rampside Canoeing - 20
Roa Island and Rampside Kite-surfing and windsurfing 40 -
Roa Island and Rampside Canoeing - 20
398 Walney Channel and Piel Island Jet skiing 33 -
399 Walney Channel and Piel Island Jet skiing 33 -
291 Silecroft and Haverigg Swimming and body-boarding 30 -
77262
467
73
646
466
468
73
646
469
73
310
Table 18. Adult's occupancy rates in and on water in the aquatic survey area (h y-1
)
470
465

Observation Location Activity In water On water
number
Table 18. Adult's occupancy rates in and on water in the aquatic survey area (h y-1
)
413 West Walney Island (West Shore Park) Swimming 21 -
414 West Walney Island (West Shore Park) Swimming 21 -
496 Roa Island and Rampside Windsurfing 18 -
497 Roa Island and Rampside Windsurfing 18 -
498 Roa Island and Rampside Windsurfing 18 -
499 Roa Island and Rampside Windsurfing 18 -
500 Roa Island and Rampside Windsurfing 18 -
443 Walney Channel Sub-aqua diving 15 -
444 Walney Channel Sub-aqua diving 15 -
445 Walney Channel Sub-aqua diving 15 -
446 Walney Channel Sub-aqua diving 15 -
359 West Walney Island (Biggar Bank) Swimming 9 -
360 West Walney Island (Biggar Bank) Swimming 9 -
407 West Walney Island (West Shore Park) Swimming 9 -
Piel Island Swimming 5 -
Walney Channel and south of Walney Island Sailing - 72
Off Walney Island Working on a boat -
Duddon Estuary Rescue boat duties -
341 Off Walney Island Working on a boat - 3000
342 Off Walney Island Working on a boat - 3000
343 Off Walney Island Working on a boat - 3000
344 Off Walney Island Working on a boat - 3000
Walney Channel, west of Walney Island and Duddon Estuary Gill netting -
Walney Channel Potting -
447 Near Roa Island Boat dwelling (tide in) - 1344
Walney Channel, west of Walney Island and Duddon Estuary Gill netting -
Walney Channel Potting -
Walney Channel, west of Walney Island and Duddon Estuary Gill netting -
Walney Channel Potting -
448 Near Roa Island Boat dwelling (tide in) - 1008
63 Askam-in-Furness Boat dwelling (tide in) - 672
256 Walney Channel Boat angling - 400
71 Walney Channel Sailing and boat angling - 384
79 South Walney Channel and Port of Barrow-in-Furness Dredging - 264
80 South Walney Channel and Port of Barrow-in-Furness Dredging - 264
501
339
350 1095
3072
348 2190
349 1095

Observation Location Activity In water On water
number
Table 18. Adult's occupancy rates in and on water in the aquatic survey area (h y-1
)
81 South Walney Channel and Port of Barrow-in-Furness Dredging - 264
82 South Walney Channel and Port of Barrow-in-Furness Dredging - 264
83 South Walney Channel and Port of Barrow-in-Furness Dredging - 264
84 South Walney Channel and Port of Barrow-in-Furness Dredging - 264
85 South Walney Channel and Port of Barrow-in-Furness Dredging - 264
86 South Walney Channel and Port of Barrow-in-Furness Dredging - 264
87 South Walney Channel and Port of Barrow-in-Furness Dredging - 264
88 South Walney Channel and Port of Barrow-in-Furness Dredging - 264
89 South Walney Channel and Port of Barrow-in-Furness Dredging - 264
90 South Walney Channel and Port of Barrow-in-Furness Dredging - 264
91 South Walney Channel and Port of Barrow-in-Furness Dredging - 264
428 Off Walney Island Boat angling - 260
430 Off Walney Island Boat angling - 234
431 Off Walney Island Boat angling - 234
432 Off Walney Island Boat angling - 234
433 Off Walney Island Boat angling - 234
434 Off Walney Island Boat angling - 234
471 Walney Channel and west of Walney Island RNLI duties - 176
472 Walney Channel and west of Walney Island RNLI duties - 176
473 Walney Channel and west of Walney Island RNLI duties - 176
474 Walney Channel and west of Walney Island RNLI duties - 176
475 Walney Channel and west of Walney Island RNLI duties - 176
476 Walney Channel and west of Walney Island RNLI duties - 176
477 Walney Channel and west of Walney Island RNLI duties - 176
478 Walney Channel and west of Walney Island RNLI duties - 176
479 Walney Channel and west of Walney Island RNLI duties - 176
480 Walney Channel and west of Walney Island RNLI duties - 176
405 West of Walney Island Boat angling - 143
406 West of Walney Island Boat angling - 143
232 South Walney and West Walney Boat angling - 120
238 South Walney and West Walney Boat angling - 120
51 Walney Channel Boat angling - 108
345 Walney Channel Gill netting - 108
347 Walney Channel Gill netting - 108
459 Walney Channel and off Walney Island Sailing - 100
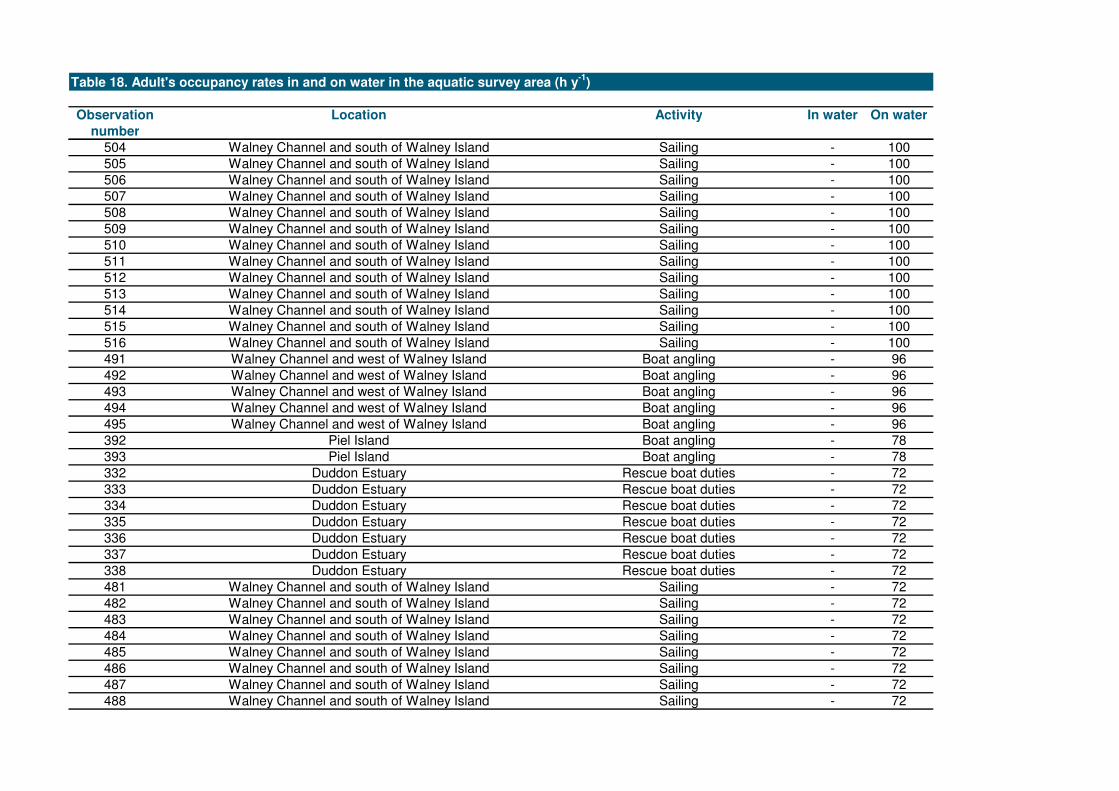
Observation Location Activity In water On water
number
Table 18. Adult's occupancy rates in and on water in the aquatic survey area (h y-1
)
504 Walney Channel and south of Walney Island Sailing - 100
505 Walney Channel and south of Walney Island Sailing - 100
506 Walney Channel and south of Walney Island Sailing - 100
507 Walney Channel and south of Walney Island Sailing - 100
508 Walney Channel and south of Walney Island Sailing - 100
509 Walney Channel and south of Walney Island Sailing - 100
510 Walney Channel and south of Walney Island Sailing - 100
511 Walney Channel and south of Walney Island Sailing - 100
512 Walney Channel and south of Walney Island Sailing - 100
513 Walney Channel and south of Walney Island Sailing - 100
514 Walney Channel and south of Walney Island Sailing - 100
515 Walney Channel and south of Walney Island Sailing - 100
516 Walney Channel and south of Walney Island Sailing - 100
491 Walney Channel and west of Walney Island Boat angling - 96
492 Walney Channel and west of Walney Island Boat angling - 96
493 Walney Channel and west of Walney Island Boat angling - 96
494 Walney Channel and west of Walney Island Boat angling - 96
495 Walney Channel and west of Walney Island Boat angling - 96
392 Piel Island Boat angling - 78
393 Piel Island Boat angling - 78
332 Duddon Estuary Rescue boat duties - 72
333 Duddon Estuary Rescue boat duties - 72
334 Duddon Estuary Rescue boat duties - 72
335 Duddon Estuary Rescue boat duties - 72
336 Duddon Estuary Rescue boat duties - 72
337 Duddon Estuary Rescue boat duties - 72
338 Duddon Estuary Rescue boat duties - 72
481 Walney Channel and south of Walney Island Sailing - 72
482 Walney Channel and south of Walney Island Sailing - 72
483 Walney Channel and south of Walney Island Sailing - 72
484 Walney Channel and south of Walney Island Sailing - 72
485 Walney Channel and south of Walney Island Sailing - 72
486 Walney Channel and south of Walney Island Sailing - 72
487 Walney Channel and south of Walney Island Sailing - 72
488 Walney Channel and south of Walney Island Sailing - 72

Observation Location Activity In water On water
number
Table 18. Adult's occupancy rates in and on water in the aquatic survey area (h y-1
)
489 Walney Channel and south of Walney Island Sailing - 72
490 Walney Channel and south of Walney Island Sailing - 72
435 Off Walney Island Trawling - 60
436 Off Walney Island Trawling - 60
437 Off Walney Island Trawling - 60
438 Off Walney Island Trawling - 60
75 Walney Channel Boat angling - 54
74 Walney Channel Sailing - 50
442 Off Walney Island Boat angling - 48
244 Duddon Estuary Boat angling - 42
245 Duddon Estuary Boat angling - 42
246 Duddon Estuary Boat angling - 42
247 Duddon Estuary Boat angling - 42
396 Piel Island Boat angling - 40
314 Haverigg Paddling - 33
249 Duddon Estuary Boat angling - 32
427 Off Walney Island Boat angling - 30
214 South of Walney Island Boat angling - 28
215 South of Walney Island Boat angling - 28
143 Off Walney Island Sailing - 16
144 Off Walney Island Sailing - 16
441 Off Walney Island Boat angling - 15

Child age group (6 - 15 years old)
Observation Age Location Activity In water On water
number
240 15 Tarn Point to Silecroft Kayaking 196 -
289 11 Silecroft and Haverigg Swimming and bodyboarding 110 -
290 9 Silecroft and Haverigg Swimming and bodyboarding 110 -
320 12 Off Silecroft and Haverigg Kayaking 56 -
403 11 Off Walney Island Jet skiing 55 -
404 9 Off Walney Island Jet skiing 55 -
415 8 West Walney Island (West Shore Park) Swimming 21 -
408 7 West Walney Island (West Shore Park) Swimming 9 -
409 10 West Walney Island (West Shore Park) Swimming 9 -
449 11 Near Roa Island Boat dwelling (tide in) - 1008
315 10 Haverigg Paddling - 33
316 7 Haverigg Paddling - 33
145 12 Off Walney Island Sailing - 16
146 13 Off Walney Island Sailing - 16
217 9 South of Walney Island Boat angling - 14
Infant age group (0 - 5 years old)
Observation Age Location Activity In water On water
number
416 5 West Walney Island (West Shore Park) Swimming 21 -
Table 19. Children's and infants' occupancy rates in and on water in the aquatic survey area (h y-1
)

Observation Broccoli Brussels sprout Cabbage Callaloo Cauliflower Chard Courgette Cucumber Gherkin Kale Lettuce Marrow Spinach Total
number
136 - 16.4 13.7 - - - - - - - - - - 30.1
137 - 16.4 13.7 - - - - - - - - - - 30.1
138 5.7 - 9.2 0.4 10.9 - - - - 3.1 - - - 29.3
139 5.7 - 9.2 0.4 10.9 - - - - 3.1 - - - 29.3
232 1.6 1.7 11.0 - - - 2.2 - - - 2.3 - - 18.8
233 1.6 1.7 11.0 - - - 2.2 - - - 2.3 - - 18.8
135 - - - - 18.4 - - - - - - - - 18.4
191 - - 5.5 - - - 4.6 4.3 0.9 - 0.7 - - 15.9
192 - - 5.5 - - - 4.6 4.3 0.9 - 0.7 - - 15.9
193 - - 5.5 - - - 4.6 4.3 0.9 - 0.7 - - 15.9
194 - - 5.5 - - - 4.6 4.3 0.9 - 0.7 - - 15.9
189 - 1.6 8.2 - 5.1 - - - - 0.8 - - - 15.7
190 - 1.6 8.2 - 5.1 - - - - 0.8 - - - 15.7
214 1.0 - 5.0 - - 0.3 1.4 4.3 - 2.7 0.6 - - 15.3
215 1.0 - 5.0 - - 0.3 1.4 4.3 - 2.7 0.6 - - 15.3
216 1.0 - 5.0 - - 0.3 1.4 4.3 - 2.7 0.6 - - 15.3
423 - 2.7 - - - - - 10.2 - - - - 1.0 14.0
424 - 2.7 - - - - - 10.2 - - - - 1.0 14.0
147 - - 4.6 - 2.8 - - 4.3 - - 1.2 - - 12.8
148 - - 4.6 - 2.8 - - 4.3 - - 1.2 - - 12.8
203 2.6 - 0.4 - - - 9.2 - - - 0.1 - - 12.3
204 2.6 - 0.4 - - - 9.2 - - - 0.1 - - 12.3
167 2.8 2.3 2.3 - 2.8 - - - - - 0.8 - - 10.9
168 2.8 2.3 2.3 - 2.8 - - - - - 0.8 - - 10.9
169 2.8 2.3 2.3 - 2.8 - - - - - 0.8 - - 10.9
170 2.8 2.3 2.3 - 2.8 - - - - - 0.8 - - 10.9
209 - 2.3 4.8 - 2.0 - - - - - 1.5 - - 10.5
210 - 2.3 4.8 - 2.0 - - - - - 1.5 - - 10.5
195 - - 9.1 - - - - - - - - - - 9.1
196 - - 9.1 - - - - - - - - - - 9.1
165 - - 5.0 - - - - 3.2 - - - - - 8.2
166 - - 5.0 - - - - 3.2 - - - - - 8.2
179 - - 2.7 - - - 5.0 - - - - - - 7.7
180 - - 2.7 - - - 5.0 - - - - - - 7.7
211 - 1.5 3.2 - 1.3 - - - - - 1.0 - - 7.0
212 - 1.5 3.2 - 1.3 - - - - - 1.0 - - 7.0
171 - 2.7 3.2 - - - - 1.1 - - - - - 7.0
172 - 2.7 3.2 - - - - 1.1 - - - - - 7.0
205 1.3 - 0.2 - - - 4.6 - - - 0.1 - - 6.1
206 1.3 - 0.2 - - - 4.6 - - - 0.1 - - 6.1
207 1.3 - 0.2 - - - 4.6 - - - 0.1 - - 6.1
161 0.7 - - - 0.7 - 2.8 - - - - 1.8 - 5.9
163 0.7 - - - 0.7 - 2.8 - - - - 1.8 - 5.9
Table 20. Adults' consumption rates of green vegetables from the terrestrial survey area (kg y-1
)

Observation Broccoli Brussels sprout Cabbage Callaloo Cauliflower Chard Courgette Cucumber Gherkin Kale Lettuce Marrow Spinach Total
number
Table 20. Adults' consumption rates of green vegetables from the terrestrial survey area (kg y-1
)
164 0.7 - - - 0.7 - 2.8 - - - - 1.8 - 5.9
153 0.8 - 2.8 - - - - - - - 1.2 - - 4.8
154 0.8 - 2.8 - - - - - - - 1.2 - - 4.8
140 1.0 - 1.5 - 1.8 - - - - 0.5 - - - 4.8
141 1.0 - 1.5 - 1.8 - - - - 0.5 - - - 4.8
155 0.5 - 1.9 - - - - - - - 0.8 - - 3.2
156 0.5 - 1.9 - - - - - - - 0.8 - - 3.2
149 - - 1.1 - 0.7 - - 1.1 - - 0.3 - - 3.2
150 - - 1.1 - 0.7 - - 1.1 - - 0.3 - - 3.2
115 - - 1.9 - 1.2 - - - - - - - - 3.1
116 - - 1.9 - 1.2 - - - - - - - - 3.1
117 - - 1.9 - 1.2 - - - - - - - - 3.1
118 - - 1.9 - 1.2 - - - - - - - - 3.1
119 - - 1.9 - 1.2 - - - - - - - - 3.1
120 - - 1.9 - 1.2 - - - - - - - - 3.1
218 - - 1.3 - - - - - - - 1.0 - - 2.3
219 - - 1.3 - - - - - - - 1.0 - - 2.3
220 - - 1.3 - - - - - - - 1.0 - - 2.3
234 0.2 0.2 1.2 - - - 0.2 - - - 0.3 - - 2.1
235 0.2 0.2 1.2 - - - 0.2 - - - 0.3 - - 2.1
197 - - - - - - - - - - 1.9 - - 1.9
198 - - - - - - - - - - 1.9 - - 1.9
221 - - 1.0 - - - - - - - 0.8 - - 1.7
222 - - 1.0 - - - - - - - 0.8 - - 1.7
173 - 0.5 0.6 - - - - 0.2 - - - - - 1.4
174 - 0.5 0.6 - - - - 0.2 - - - - - 1.4
186 - - 1.3 - - - - - - - - - - 1.3
187 - - 1.3 - - - - - - - - - - 1.3
181 - - 0.3 - - - 0.6 - - - - - - 0.9
199 - - - - - - - - - - 0.4 - - 0.4
200 - - - - - - - - - - 0.4 - - 0.4
201 - - - - - - - - - - 0.4 - - 0.4
202 - - - - - - - - - - 0.4 - - 0.4
Notes
Emboldened observations are the high-rate consumers
The mean consumption rate of green vegetables based on the 28 high-rate adult consumers is 16.4 kg y-1
The observed 97.5th
percentile rate based on 76 observations is 29.4 kg y-1

Observation Broad bean Chilli pepper French bean Pea Pepper Runner bean Squash Sweetcorn Tomato Total
number
135 - 4.4 - 13.4 8.8 - - - 16.2 42.8
197 - - - 2.8 - - - - 27.0 29.8
198 - - - 2.8 - - - - 27.0 29.8
147 - - - - 0.5 - - - 29.3 29.7
148 - - - - 0.5 - - - 29.3 29.7
191 2.0 - 2.4 2.0 3.9 2.6 0.1 0.3 15.8 29.2
192 2.0 - 2.4 2.0 3.9 2.6 0.1 0.3 15.8 29.2
193 2.0 - 2.4 2.0 3.9 2.6 0.1 0.3 15.8 29.2
194 2.0 - 2.4 2.0 3.9 2.6 0.1 0.3 15.8 29.2
185 - - - - - - - - 27.0 27.0
179 1.5 - 2.4 1.5 1.8 - - - 19.4 26.7
180 1.5 - 2.4 1.5 1.8 - - - 19.4 26.7
225 5.6 - - 2.3 - 3.6 - - 10.8 22.2
226 5.6 - - 2.3 - 3.6 - - 10.8 22.2
232 1.0 - - 0.3 1.8 1.8 - - 16.2 21.1
233 1.0 - - 0.3 1.8 1.8 - - 16.2 21.1
167 - - - 1.4 - 2.6 - - 16.2 20.1
168 - - - 1.4 - 2.6 - - 16.2 20.1
169 - - - 1.4 - 2.6 - - 16.2 20.1
170 - - - 1.4 - 2.6 - - 16.2 20.1
153 - - - - - - - - 18.9 18.9
154 - - - - - - - - 18.9 18.9
203 0.7 - 0.8 - - 1.5 - 1.0 11.7 15.7
204 0.7 - 0.8 - - 1.5 - 1.0 11.7 15.7
239 - - - - - - - - 14.4 14.4
184 - - - - - - - - 13.5 13.5
230 3.4 - - 1.4 - 2.1 - - 6.5 13.3
231 3.4 - - 1.4 - 2.1 - - 6.5 13.3
189 3.3 - 2.2 3.2 - - - 4.1 - 12.8
190 3.3 - 2.2 3.2 - - - 4.1 - 12.8
155 - - - - - - - - 12.6 12.6
156 - - - - - - - - 12.6 12.6
199 - - - 0.6 - - - - 10.8 11.4
200 - - - 0.6 - - - - 10.8 11.4
201 - - - 0.6 - - - - 10.8 11.4
202 - - - 0.6 - - - - 10.8 11.4
138 - - 0.9 5.8 - - - 2.8 - 9.4
139 - - 0.9 5.8 - - - 2.8 - 9.4
165 - - - 2.5 0.2 - - - 6.3 9.0
166 - - - 2.5 0.2 - - - 6.3 9.0
423 0.8 - - 0.1 - - - - 7.2 8.1
424 0.8 - - 0.1 - - - - 7.2 8.1
161 0.2 - 0.2 0.1 - 2.0 - - 5.4 8.0
163 0.2 - 0.2 0.1 - 2.0 - - 5.4 8.0
Table 21. Adults' consumption rates of other vegetables from the terrestrial survey area (kg y-1
)

Observation Broad bean Chilli pepper French bean Pea Pepper Runner bean Squash Sweetcorn Tomato Total
number
Table 21. Adults' consumption rates of other vegetables from the terrestrial survey area (kg y-1
)
164 0.2 - 0.2 0.1 - 2.0 - - 5.4 8.0
205 0.4 - 0.4 - - 0.8 - 0.5 5.9 7.9
206 0.4 - 0.4 - - 0.8 - 0.5 5.9 7.9
207 0.4 - 0.4 - - 0.8 - 0.5 5.9 7.9
171 - - 0.4 - - - - 0.6 6.8 7.7
172 - - 0.4 - - - - 0.6 6.8 7.7
188 4.6 - 0.7 2.3 - - - - - 7.5
149 - - - - 0.1 - - - 7.3 7.4
150 - - - - 0.1 - - - 7.3 7.4
195 - - 2.7 - - - - 4.1 - 6.8
196 - - 2.7 - - - - 4.1 - 6.8
209 2.3 - - 2.4 - 1.3 - - - 6.0
210 2.3 - - 2.4 - 1.3 - - - 6.0
214 0.4 - - 2.0 0.5 - - 0.7 1.8 5.4
215 0.4 - - 2.0 0.5 - - 0.7 1.8 5.4
216 0.4 - - 2.0 0.5 - - 0.7 1.8 5.4
218 4.5 - - 0.4 - - - - - 4.9
219 4.5 - - 0.4 - - - - - 4.9
220 4.5 - - 0.4 - - - - - 4.9
211 1.5 - - 1.6 - 0.9 - - - 4.0
212 1.5 - - 1.6 - 0.9 - - - 4.0
221 3.4 - - 0.3 - - - - - 3.7
222 3.4 - - 0.3 - - - - - 3.7
181 0.2 - 0.3 0.2 0.2 - - - 2.2 3.0
227 0.7 - - 0.3 - 0.5 - - 1.4 3.0
228 0.7 - - 0.3 - 0.5 - - 1.4 3.0
234 0.1 - - - 0.2 0.2 - - 1.8 2.3
235 0.1 - - - 0.2 0.2 - - 1.8 2.3
140 - - 0.3 1.0 - - - 0.5 - 1.7
141 - - 0.3 1.0 - - - 0.5 - 1.7
173 - - 0.1 - - - - 0.1 1.4 1.5
174 - - 0.1 - - - - 0.1 1.4 1.5
186 0.6 - - 0.5 - - - - - 1.0
187 0.6 - - 0.5 - - - - - 1.0
Notes
Emboldened observations are the high-rate consumers
The mean consumption rate of other vegetables based on the 25 high-rate adult consumers is 24.4 kg y-1
The observed 97.5th
percentile rate based on 78 observations is 29.8 kg y-1

Observation Beetroot Carrot Celeriac Garlic Kohl rabi Leek Onion Parsnip Radish Shallot Spring onion Swede Turnip Total
number
232 - 2.7 - - - 2.7 8.1 4.3 - 2.4 0.8 16.3 - 37.3
233 - 2.7 - - - 2.7 8.1 4.3 - 2.4 0.8 16.3 - 37.3
135 5.4 2.3 - - - 5.4 5.9 - - - - 11.5 4.9 35.4
189 8.9 - - - 4.1 - 16.8 - - - - 4.9 - 34.7
190 8.9 - - - 4.1 - 16.8 - - - - 4.9 - 34.7
138 5.8 - - - - 4.3 13.8 - - 4.1 - - 5.2 33.2
139 5.8 - - - - 4.3 13.8 - - 4.1 - - 5.2 33.2
184 3.4 - - - - 5.4 11.9 - - - - 12.3 - 32.9
185 3.4 - - - - 5.4 11.9 - - - - 12.3 - 32.9
218 12.3 - - - - 3.0 14.4 - - - - - 1.4 31.1
219 12.3 - - - - 3.0 14.4 - - - - - 1.4 31.1
220 12.3 - - - - 3.0 14.4 - - - - - 1.4 31.1
225 5.1 - - - - - 22.3 - - - - 3.4 - 30.8
226 5.1 - - - - - 22.3 - - - - 3.4 - 30.8
167 9.2 - - - - 10.1 6.8 - - 4.0 0.3 - - 30.4
168 9.2 - - - - 10.1 6.8 - - 4.0 0.3 - - 30.4
169 9.2 - - - - 10.1 6.8 - - 4.0 0.3 - - 30.4
170 9.2 - - - - 10.1 6.8 - - 4.0 0.3 - - 30.4
153 4.4 - - - - 5.9 13.2 2.2 - - - - - 25.7
154 4.4 - - - - 5.9 13.2 2.2 - - - - - 25.7
165 5.0 6.8 - - - 2.0 7.9 2.9 - - - - - 24.6
166 5.0 6.8 - - - 2.0 7.9 2.9 - - - - - 24.6
221 9.2 - - - - 2.3 10.8 - - - - - 1.0 23.3
222 9.2 - - - - 2.3 10.8 - - - - - 1.0 23.3
209 4.1 - - 0.3 - 2.2 7.1 - - 3.5 1.6 - 4.3 23.1
210 4.1 - - 0.3 - 2.2 7.1 - - 3.5 1.6 - 4.3 23.1
197 4.5 - - - - 14.1 4.5 - - - - - - 23.1
198 4.5 - - - - 14.1 4.5 - - - - - - 23.1
230 3.1 - - - - - 13.4 - - - - 2.0 - 18.5
231 3.1 - - - - - 13.4 - - - - 2.0 - 18.5
155 2.9 - - - - 3.9 8.8 1.4 - - - - - 17.1
156 2.9 - - - - 3.9 8.8 1.4 - - - - - 17.1
195 - - - - - 10.1 5.4 - - - - - - 15.5
196 - - - - - 10.1 5.4 - - - - - - 15.5
136 - - - - - - - - - - - - 14.6 14.6
137 - - - - - - - - - - - - 14.6 14.6
188 9.0 - - - - - 5.5 - - - - - - 14.5
171 1.1 - - - - - 4.1 0.7 - 0.2 - 6.8 - 13.0
172 1.1 - - - - - 4.1 0.7 - 0.2 - 6.8 - 13.0
211 2.7 - - 0.2 - 1.5 4.8 - - 2.3 1.1 - - 12.5
212 2.7 - - 0.2 - 1.5 4.8 - - 2.3 1.1 - - 12.5
203 2.7 - - - 0.8 - 8.8 - - - - - - 12.3
204 2.7 - - - 0.8 - 8.8 - - - - - - 12.3
182 - - - - - - 11.9 - - - - - - 11.9
179 5.5 - - - - - 3.2 - - - - - - 8.8
180 5.5 - - - - - 3.2 - - - - - - 8.8
214 0.4 0.6 - - - - 4.8 - - 0.2 - - 1.7 7.6
215 0.4 0.6 - - - - 4.8 - - 0.2 - - 1.7 7.6
Table 22. Adults' consumption rates of root vegetables from the terrestrial survey area (kg y-1
)

Observation Beetroot Carrot Celeriac Garlic Kohl rabi Leek Onion Parsnip Radish Shallot Spring onion Swede Turnip Total
number
Table 22. Adults' consumption rates of root vegetables from the terrestrial survey area (kg y-1
)
216 0.4 0.6 - - - - 4.8 - - 0.2 - - 1.7 7.6
205 1.3 - - - 0.4 - 4.4 - - - - - - 6.2
206 1.3 - - - 0.4 - 4.4 - - - - - - 6.2
207 1.3 - - - 0.4 - 4.4 - - - - - - 6.2
199 2.3 - - - - 2.8 0.9 - - - - - - 6.0
200 2.3 - - - - 2.8 0.9 - - - - - - 6.0
201 2.3 - - - - 2.8 0.9 - - - - - - 6.0
202 2.3 - - - - 2.8 0.9 - - - - - - 6.0
140 1.0 - - - - 0.7 2.3 - - 0.7 - - 0.9 5.5
141 1.0 - - - - 0.7 2.3 - - 0.7 - - 0.9 5.5
423 - 3.6 - - - - 1.3 - - - - - - 4.9
424 - 3.6 - - - - 1.3 - - - - - - 4.9
191 1.8 0.9 - - - - 1.6 - - - - - - 4.4
192 1.8 0.9 - - - - 1.6 - - - - - - 4.4
193 1.8 0.9 - - - - 1.6 - - - - - - 4.4
194 1.8 0.9 - - - - 1.6 - - - - - - 4.4
234 - 0.3 0.2 - - 0.3 0.9 0.5 - 0.3 0.1 1.8 - 4.4
235 - 0.3 0.2 - - 0.3 0.9 0.5 - 0.3 0.1 1.8 - 4.4
227 0.7 - - - - - 3.0 - - - - 0.5 - 4.1
228 0.7 - - - - - 3.0 - - - - 0.5 - 4.1
147 - - - - - 4.0 - - - - - - - 4.0
148 - - - - - 4.0 - - - - - - - 4.0
183 - - - - - - 4.0 - - - - - - 4.0
186 2.1 - - - - - - - - - - 1.7 - 3.8
187 2.1 - - - - - - - - - - 1.7 - 3.8
173 0.2 - - - - - 0.8 0.1 - - - 1.4 - 2.6
174 0.2 - - - - - 0.8 0.1 - - - 1.4 - 2.6
161 - - - 0.5 - - 1.7 - 0.1 - - - - 2.2
163 - - - 0.5 - - 1.7 - 0.1 - - - - 2.2
164 - - - 0.5 - - 1.7 - 0.1 - - - - 2.2
181 1.2 - - - - - 0.4 - - - - - - 1.6
149 - - - - - 1.0 - - - - - - - 1.0
150 - - - - - 1.0 - - - - - - - 1.0
115 - - - - - 0.9 - - - - - - - 0.9
116 - - - - - 0.9 - - - - - - - 0.9
117 - - - - - 0.9 - - - - - - - 0.9
118 - - - - - 0.9 - - - - - - - 0.9
119 - - - - - 0.9 - - - - - - - 0.9
120 - - - - - 0.9 - - - - - - - 0.9
Notes
Emboldened observations are the high-rate consumers
The mean consumption rate of root vegetables based on the 41 high-rate adult consumers is 25.0 kg y-1
The observed 97.5th percentile rate based on 87 observations is 35.3 kg y
-1

Observation Potato
number
182 54.5
232 40.3
233 40.3
147 32.6
148 32.6
239 32.5
188 27.2
209 25.5
210 25.5
167 24.5
168 24.5
169 24.5
170 24.5
165 23.2
166 23.2
197 22.8
198 22.8
218 21.8
219 21.8
220 21.8
189 20.5
190 20.5
203 18.2
204 18.2
183 18.2
211 17.0
212 17.0
136 16.4
137 16.4
221 16.3
222 16.3
179 10.2
180 10.2
214 10.1
215 10.1
216 10.1
205 9.1
206 9.1
207 9.1
184 8.2
185 8.2
149 8.2
150 8.2
423 6.1
424 6.1
186 5.6
187 5.6
171 5.1
172 5.1
199 4.6
200 4.6
201 4.6
202 4.6
234 3.4
235 3.4
Table 23. Adults' consumption rates of potato from the terrestrial survey area (kg y-1
)

Observation Potato
number
Table 23. Adults' consumption rates of potato from the terrestrial survey area (kg y-1
)
225 3.3
226 3.3
230 2.0
231 2.0
115 1.8
116 1.8
117 1.8
118 1.8
119 1.8
120 1.8
5 1.3
6 1.3
181 1.1
173 1.0
174 1.0
227 0.4
228 0.4
Notes
Emboldened observations are the high-rate consumers
The mean consumption rate of potato based on the 25 high-rate adult consumers is 26.5 kg y-1
The observed 97.5th percentile rate based on 72 observations is 40.3 kg y
-1

Observation Apple Blackberry Blackcurrant Cherry Damson Gooseberry Grape Melon Pear Plum Raspberry Redcurrant Rhubarb Strawberry Whitecurrant Total
number
346 35.0 - - - - 7.0 - - 15.0 - - - - - - 57.0
147 19.8 - - - - 3.1 0.3 - - - - - 3.5 - - 26.7
148 19.8 - - - - 3.1 0.3 - - - - - 3.5 - - 26.7
135 - - 6.0 - - - - 9.3 - - - - 8.2 - - 23.5
153 - - - - - - - - 2.0 0.6 - - 3.5 13.5 - 19.5
154 - - - - - - - - 2.0 0.6 - - 3.5 13.5 - 19.5
155 - - - - - - - - - - - - 2.3 13.6 - 15.9
156 - - - - - - - - - - - - 2.3 13.6 - 15.9
179 - 1.1 5.4 - - - - - - - - - 4.1 - - 10.7
180 - 1.1 5.4 - - - - - - - - - 4.1 - - 10.7
167 - - - - - 8.2 - - - - - - 2.3 - - 10.5
168 - - - - - 8.2 - - - - - - 2.3 - - 10.5
169 - - - - - 8.2 - - - - - - 2.3 - - 10.5
170 - - - - - 8.2 - - - - - - 2.3 - - 10.5
203 0.8 - - - 0.5 1.9 - - - - - 3.0 1.5 1.8 0.8 10.2
204 0.8 - - - 0.5 1.9 - - - - - 3.0 1.5 1.8 0.8 10.2
205 0.8 - - - - 1.9 - - - - - 3.0 1.5 0.9 0.8 8.8
181 - 3.6 3.4 - - - - - - - - - 0.5 - - 7.5
206 0.8 - - - - - - - - - - 3.0 1.5 0.9 0.8 6.9
138 - - - - - - - - - - - - - 6.8 - 6.8
139 - - - - - - - - - - - - - 6.8 - 6.8
191 0.5 - - 0.2 1.1 2.3 - - - - - - - 2.3 - 6.4
192 0.5 - - 0.2 1.1 2.3 - - - - - - - 2.3 - 6.4
225 - - - - - 5.1 - - - - - - 1.2 - - 6.3
226 - - - - - 5.1 - - - - - - 1.2 - - 6.3
197 - - - - - - - - - - - - 5.8 - - 5.8
198 - - - - - - - - - - - - 5.8 - - 5.8
193 - - - - 1.1 2.3 - - - - - - - 2.3 - 5.7
194 - - - - 1.1 2.3 - - - - - - - 2.3 - 5.7
423 - - - - - - - - - - 1.0 - - 3.4 - 4.4
424 - - - - - - - - - - 1.0 - - 3.4 - 4.4
184 - - - - - - - - - - - - 4.1 - - 4.1
185 - - - - - - - - - - - - 4.1 - - 4.1
230 - - - - - 3.1 - - - - - - 0.7 - - 3.8
231 - - - - - 3.1 - - - - - - 0.7 - - 3.8
207 0.8 - - - - - - - - - - - 1.5 0.9 - 3.2
5 0.6 - - - 0.3 - - - - - - - - 0.9 - 1.8
6 0.6 - - - 0.3 - - - - - - - - 0.9 - 1.8
209 0.9 - - - - - - - 0.3 - - - - - - 1.2
210 0.9 - - - - - - - 0.3 - - - - - - 1.2
199 - - - - - - - - - - - - 1.2 - - 1.2
200 - - - - - - - - - - - - 1.2 - - 1.2
201 - - - - - - - - - - - - 1.2 - - 1.2
202 - - - - - - - - - - - - 1.2 - - 1.2
140 - - - - - - - - - - - - - 1.1 - 1.1
141 - - - - - - - - - - - - - 1.1 - 1.1
218 - 0.9 - - - - - - - - - - - - - 0.9
Table 24. Adults' consumption rates of domestic fruit from the terrestrial survey area (kg y-1
)

Observation Apple Blackberry Blackcurrant Cherry Damson Gooseberry Grape Melon Pear Plum Raspberry Redcurrant Rhubarb Strawberry Whitecurrant Total
number
Table 24. Adults' consumption rates of domestic fruit from the terrestrial survey area (kg y-1
)
149 - - - - - - - - - - - - 0.9 - - 0.9
150 - - - - - - - - - - - - 0.9 - - 0.9
214 0.3 - - - - - - - 0.3 - - 0.2 - - - 0.8
215 0.3 - - - - - - - 0.3 - - 0.2 - - - 0.8
227 - - - - - 0.7 - - - - - - 0.2 - - 0.8
228 - - - - - 0.7 - - - - - - 0.2 - - 0.8
171 - - - - - - - - - - - - 0.6 - - 0.6
172 - - - - - - - - - - - - 0.6 - - 0.6
1 - - - - - - - - - - - 0.5 - - - 0.5
2 - - - - - - - - - - - 0.5 - - - 0.5
3 - - - - - - - - - - - 0.5 - - - 0.5
182 - 0.5 - - - - - - - - - - - - - 0.5
188 - 0.5 - - - - - - - - - - - - - 0.5
161 - - - - - - - - - - - - - 0.2 - 0.2
163 - - - - - - - - - - - - - 0.2 - 0.2
164 - - - - - - - - - - - - - 0.2 - 0.2
173 - - - - - - - - - - - - 0.1 - - 0.1
174 - - - - - - - - - - - - 0.1 - - 0.1
Notes
Emboldened observations are the high-rate consumers
The mean consumption rate of domestic fruit based on the 6 high-rate adult consumers is 28.8 kg y-1
The observed 97.5th
percentile rate based on 65 observations is 26.7 kg y-1
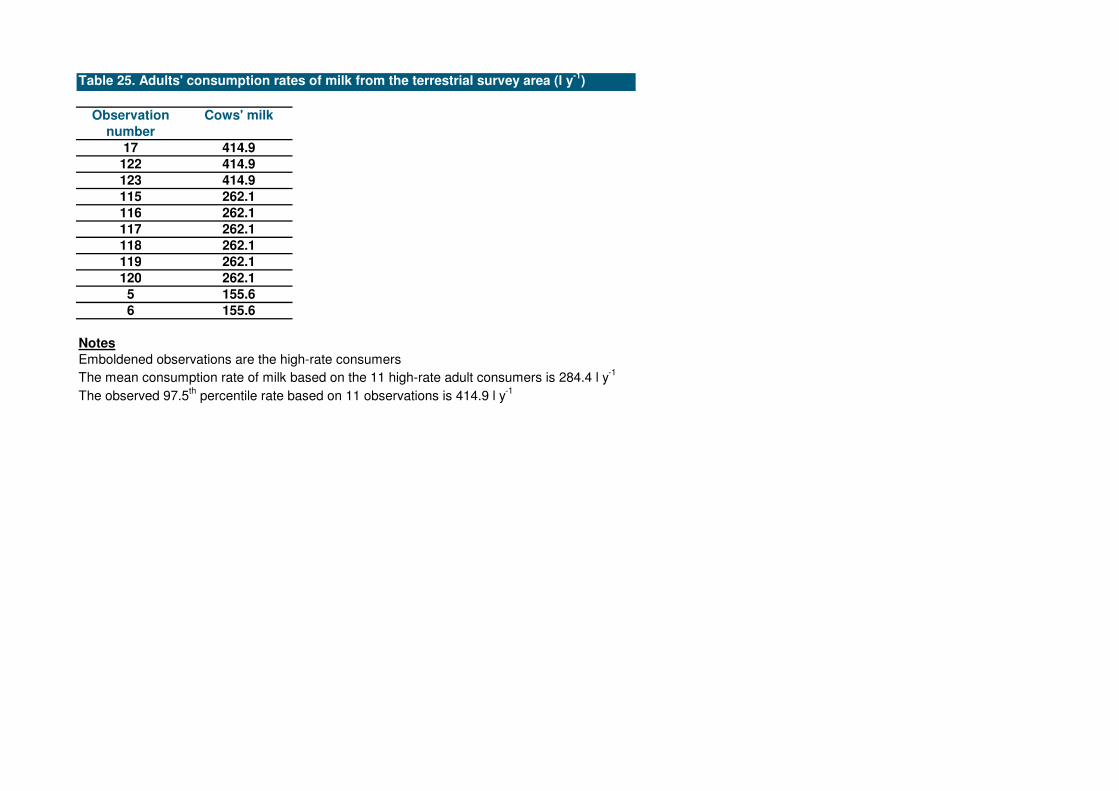
Table 25. Adults' consumption rates of milk from the terrestrial survey area (l y-1
)
Observation Cows' milk
number
17 414.9
122 414.9
123 414.9
115 262.1
116 262.1
117 262.1
118 262.1
119 262.1
120 262.1
5 155.6
6 155.6
Notes
Emboldened observations are the high-rate consumers
The mean consumption rate of milk based on the 11 high-rate adult consumers is 284.4 l y-1
The observed 97.5th percentile rate based on 11 observations is 414.9 l y
-1

Observation Beef
number
353 65.0
345 47.3
346 47.3
355 39.0
9 37.8
10 37.8
13 35.5
14 35.5
15 35.5
16 35.5
357 32.5
354 26.0
124 23.7
125 23.7
126 23.7
127 23.7
128 23.7
129 23.7
130 23.7
131 23.7
356 16.3
1 11.8
2 11.8
3 11.8
4 11.8
Notes
Emboldened observations are the high-rate consumers
The mean consumption rate of cattle meat based on the 20 high-rate adult consumers is 33.2 kg y-1
The observed 97.5th percentile rate based on 25 observations is 54.4 kg y
-1
Table 26. Adults' consumption rates of cattle meat from the terrestrial survey area (kg y-1
)

Observation Pork
number
353 8.5
355 5.1
357 4.3
354 3.4
356 2.1
Notes
Emboldened observations are the high-rate consumers
The mean consumption rate of pig meat based on the 4 high-rate adult consumers is 5.3 kg y-1
The observed 97.5th percentile rate based on 5 observations is 8.1 kg y
-1
Table 27. Adults' consumption rates of pig meat from the terrestrial survey area (kg y-1
)
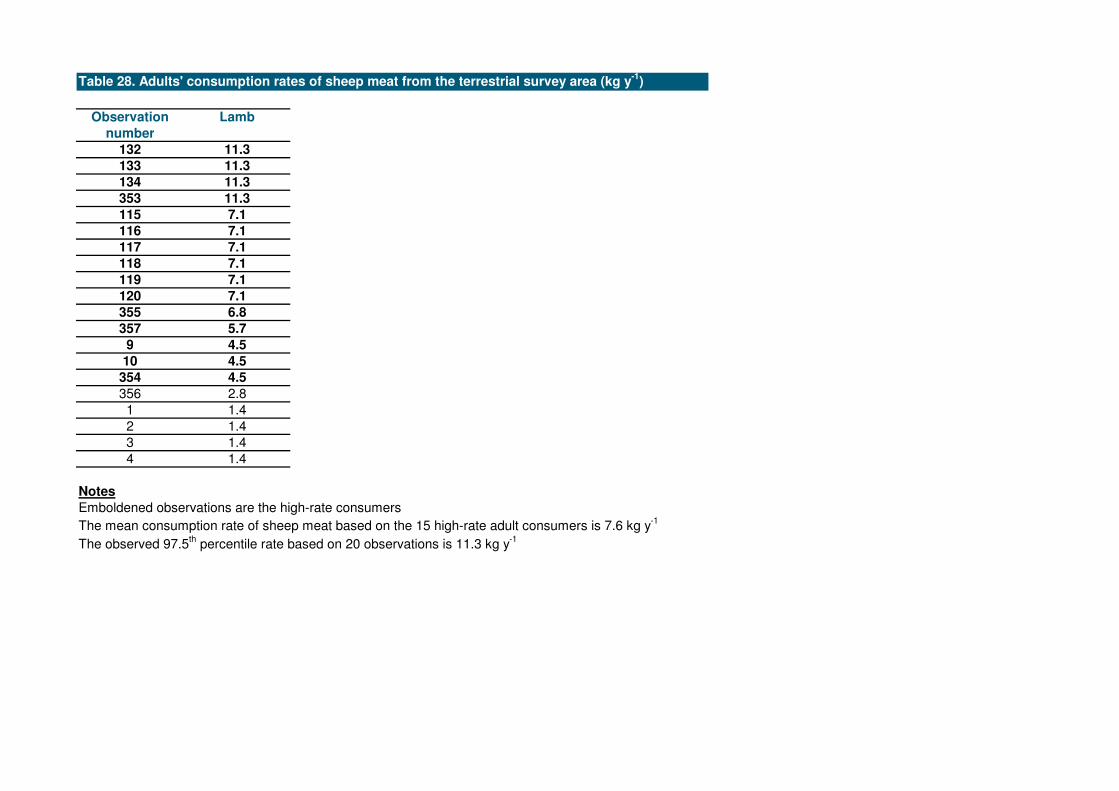
Observation Lamb
number
132 11.3
133 11.3
134 11.3
353 11.3
115 7.1
116 7.1
117 7.1
118 7.1
119 7.1
120 7.1
355 6.8
357 5.7
9 4.5
10 4.5
354 4.5
356 2.8
1 1.4
2 1.4
3 1.4
4 1.4
Notes
Emboldened observations are the high-rate consumers
The mean consumption rate of sheep meat based on the 15 high-rate adult consumers is 7.6 kg y-1
The observed 97.5th percentile rate based on 20 observations is 11.3 kg y
-1
Table 28. Adults' consumption rates of sheep meat from the terrestrial survey area (kg y-1
)
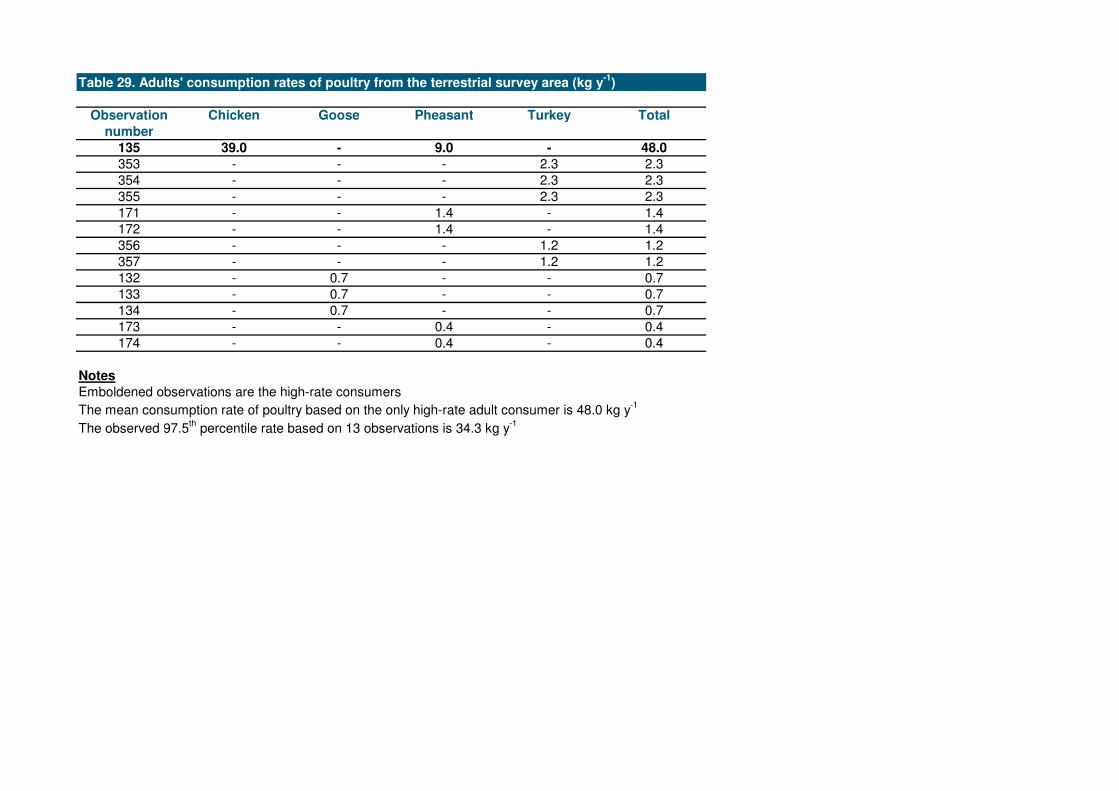
Observation Chicken Goose Pheasant Turkey Total
number
135 39.0 - 9.0 - 48.0
353 - - - 2.3 2.3
354 - - - 2.3 2.3
355 - - - 2.3 2.3
171 - - 1.4 - 1.4
172 - - 1.4 - 1.4
356 - - - 1.2 1.2
357 - - - 1.2 1.2
132 - 0.7 - - 0.7
133 - 0.7 - - 0.7
134 - 0.7 - - 0.7
173 - - 0.4 - 0.4
174 - - 0.4 - 0.4
Notes
Emboldened observations are the high-rate consumers
The mean consumption rate of poultry based on the only high-rate adult consumer is 48.0 kg y-1
The observed 97.5th percentile rate based on 13 observations is 34.3 kg y
-1
Table 29. Adults' consumption rates of poultry from the terrestrial survey area (kg y-1
)

Table 30. Adults' consumption rates of eggs from the terrestrial survey area (kg y-1
)
Observation Chicken egg
number
161 59.3
5 41.6
6 41.6
134 41.6
353 35.9
180 25.1
357 23.1
17 20.8
179 20.1
132 17.8
133 17.8
147 17.8
148 17.8
167 17.8
168 17.8
220 17.8
264 17.8
181 15.0
209 15.0
210 15.0
239 14.0
188 13.3
203 11.0
204 11.0
9 8.9
10 8.9
169 8.9
170 8.9
218 8.9
219 8.9
221 8.9
222 8.9
354 5.9
355 5.9
205 5.5
206 5.5
207 5.5
356 5.0
268 4.4
269 4.4
149 3.5
150 3.5
211 1.7
212 1.7
262 0.7
263 0.7
Notes
Emboldened observations are the high-rate consumers
The mean consumption rate of eggs based on the 9 high-rate adult consumers is 34.3 kg y-1
The observed 97.5th percentile rate based on 46 observations is 41.6 kg y
-1

Table 31. Adults' consumption rates of wild/free foods from the terrestrial survey area (kg y-1
)
Observation Blackberry Damson Sloe Total
number
353 3.0 - 0.5 3.5
354 3.0 - 0.5 3.5
355 3.0 - 0.5 3.5
450 3.4 - - 3.4
451 3.4 - - 3.4
182 - 1.8 - 1.8
179 - 1.1 - 1.1
180 - 1.1 - 1.1
17 0.9 - - 0.9
171 0.8 - - 0.8
172 0.8 - - 0.8
1 0.5 - - 0.5
2 0.5 - - 0.5
3 0.5 - - 0.5
181 - 0.5 - 0.5
5 0.3 - - 0.3
6 0.3 - - 0.3
Notes
Emboldened observations are the high-rate consumers
The mean consumption rate of wild/free foods based on the 6 high-rate adult consumers is 3.2 kg y-1
The observed 97.5th percentile rate based on 17 observations is 3.5 kg y
-1
Table 32. Adults' consumption rates of rabbits/hares from the terrestrial survey area (kg y-1
)
Observation Rabbit
number
135 9.0
353 2.3
Notes
Emboldened observations are the high-rate consumers
The mean consumption rate of rabbits/hares based on the only high-rate adult consumer is 9.0 kg y-1
The observed 97.5th percentile rate based on 2 observations is 8.8 kg y
-1

Observation Mushrooms
number
450 3.9
451 3.9
17 0.9
1 0.5
2 0.5
3 0.5
232 0.5
233 0.5
353 0.3
354 0.3
355 0.3
188 0.2
115 0.2
116 0.2
117 0.2
118 0.2
119 0.2
120 0.2
Notes
Emboldened observations are the high-rate consumers
Observation Brown trout
number
450 3.5
451 3.5
Notes
Emboldened observations are the high-rate consumers
Table 34. Adults' consumption rates of freshwater fish from the terrestrial survey area (kg y-1
)
Table 33. Adults' consumption rates of wild fungi from the terrestrial survey area (kg y-1
)
The mean consumption rate of freshwater fish based on the 2 high-rate adult consumers is 3.5 kg y-1
The observed 97.5th percentile rate based on 2 observations is 3.5 kg y
-1
The mean consumption rate of wild fungi based on the 2 high-rate adult consumers is 3.9 kg y-1
The observed 97.5th percentile rate based on 18 observations is 3.9 kg y
-1

Observation Age Broccoli Brussels sprout Cabbage Cauliflower Chard Courgette Cucumber Kale Lettuce Marrow Total
number
217 9 0.8 - 3.7 - 0.2 1.0 3.2 2.0 0.5 - 11.5
208 11 1.3 - 0.2 - - 4.6 - - 0.1 - 6.1
162 10 0.7 - - 0.7 - 2.8 - - - 1.8 5.9
142 12 1.0 - 1.5 1.8 - - - 0.5 - - 4.8
151 13 - - 1.1 0.7 - - 1.1 - 0.3 - 3.2
152 10 - - 1.1 0.7 - - 1.1 - 0.3 - 3.2
236 14 0.2 0.2 1.2 - - 0.2 - - 0.3 - 2.1
223 10 - - 1.0 - - - - - 0.8 - 1.7
175 15 - 0.5 0.6 - - - 0.2 - - - 1.4
176 11 - 0.5 0.6 - - - 0.2 - - - 1.4
224 7 - - 0.7 - - - - - 0.6 - 1.3
Notes
Emboldened observations are the high-rate consumers
The mean consumption rate of green vegetables for the child age group based upon the 4 high-rate consumers is 7.1 kg y-1
The observed 97.5th percentile rate based on 11 observations is 10.1 kg y
-1
Observation Age Broccoli Brussels sprout Cabbage Cauliflower Chard Courgette Cucumber Kale Lettuce Marrow Total
number
213 3 - 0.8 1.6 0.7 - - - - 0.5 - 3.5
121 2 - - 0.6 0.4 - - - - - - 1.0
Notes
Emboldened observations are the high-rate consumers
The mean consumption rate of green vegetables for the infant age group based upon the only high-rate consumer is 3.5 kg y-1
The observed 97.5th percentile rate based on 2 observations is 3.5 kg y
-1
Table 35. Children's and infants' consumption rates of green vegetables from the terrestrial survey area (kg y-1
)
Child age group (6 - 15 years old)
Infant age group (0 - 5 years old)

Observation Age Broad bean French bean Pea Pepper Runner bean Sweetcorn Tomato Total
number
162 10 0.2 0.2 0.1 - 2.0 - 5.4 8.0
208 11 0.4 0.4 - - 0.8 0.5 5.9 7.9
151 13 - - - 0.1 - - 7.3 7.4
152 10 - - - 0.1 - - 7.3 7.4
217 9 0.3 - 1.5 0.4 - 0.5 1.4 4.0
223 10 3.4 - 0.3 - - - - 3.7
224 7 2.6 - 0.2 - - - - 2.8
236 14 0.1 - - 0.2 0.2 - 1.8 2.3
142 12 - 0.3 1.0 - - 0.5 - 1.7
175 15 - 0.1 - - - 0.1 1.4 1.5
176 11 - 0.1 - - - 0.1 1.4 1.5
Notes
Emboldened observations are the high-rate consumers
The mean consumption rate of other vegetables for the child age group based upon the 7 high-rate consumers is 5.9 kg y-1
The observed 97.5th percentile rate based on 11 observations is 8.0 kg y
-1
Observation Age Broad bean French bean Pea Pepper Runner bean Sweetcorn Tomato Total
number
213 3 0.8 - 0.8 - - - - 1.5
229 5 0.4 - 0.2 - 0.2 - 0.7 1.5
Notes
Emboldened observations are the high-rate consumers
The mean consumption rate of other vegetables for the infant age group based upon the 2 high-rate consumers is 1.5 kg y-1
The observed 97.5th percentile rate based on 2 observations is 1.5 kg y
-1
Table 36. Children's and infants' consumption rates of other vegetables from the terrestrial survey area (kg y-1
)
Child age group (6 - 15 years old)
Infant age group (0 - 5 years old)

Observation Age Beetroot Carrot Celeriac Garlic Kohl rabi Leek Onion Parsnip Radish Shallot Spring onion Swede Turnip Total
number
223 10 4.6 - - - - 2.3 4.3 - - - - - 1.0 12.2
224 7 3.5 - - - - 1.7 3.2 - - - - - 0.8 9.1
208 11 1.3 - - - 0.4 - 4.4 - - - - - - 6.2
217 9 0.3 0.4 - - - - 3.6 - - 0.5 - - 1.3 6.1
142 12 1.0 - - - - 0.7 2.3 - - 0.7 - - 0.9 5.5
236 14 - 0.3 0.2 - - 0.3 0.9 0.5 - 0.3 0.1 1.8 - 4.4
175 11 0.2 - - - - - 0.8 0.1 - - - 1.4 - 2.6
176 15 0.2 - - - - - 0.8 0.1 - - - 1.4 - 2.6
162 10 - - - 0.5 - - 1.7 - 0.1 - - - - 2.2
151 13 - - - - - 1.0 - - - - - - - 1.0
152 10 - - - - - 1.0 - - - - - - - 1.0
Notes
Emboldened observations are the high-rate consumers
The mean consumption rate of root vegetables for the child age group based upon the 6 high-rate consumers is 7.2 kg y-1
The observed 97.5th percentile rate based on 11 observations is 11.4 kg y
-1
Observation Age Beetroot Carrot Celeriac Garlic Kohl rabi Leek Onion Parsnip Radish Shallot Spring onion Swede Turnip Total
number
213 3 1.4 - - - - 0.7 1.2 - - 1.2 0.5 - 1.0 5.9
229 5 0.3 - - - - - 1.5 - - - - 0.2 - 2.1
121 2 - - - - - 0.3 - - - - - - - 0.3
Notes
Emboldened observations are the high-rate consumers
The mean consumption rate of root vegetables for the infant age group based upon the 2 high-rate consumers is 4.0 kg y-1
The observed 97.5th percentile rate based on 3 observations is 5.7 kg y
-1
Table 37. Children's and infants' consumption rates of root vegetables from the terrestrial survey area (kg y-1
)
Infant age group (0 - 5 years old)
Child age group (6 - 15 years old)

Observation Age Potato
number
223 10 16.3
224 7 12.2
208 11 9.1
151 13 8.2
152 10 8.2
217 9 7.6
236 14 3.4
237 10 1.7
7 13 1.3
8 10 1.3
175 15 1.0
176 11 1.0
Notes
Emboldened observations are the high-rate consumers
The mean consumption rate of potato for the child age group based upon the 6 high-rate consumers is 10.3 kg y-1
The observed 97.5th percentile rate based on 12 observations is 15.2 kg y
-1
Observation Age Potato
number
213 3 8.5
121 2 0.6
229 5 0.2
Notes
Emboldened observations are the high-rate consumers
The mean consumption rate of potato for the infant age group based upon the only high-rate consumer is 8.5 kg y-1
The observed 97.5th percentile rate based on 3 observations is 8.1 kg y
-1
Table 38. Children's and infants' consumption rates of potato from the terrestrial survey area (kg y-1
)
Child age group (6 - 15 years old)
Infant age group (0 - 5 years old)

Observation Age Apple Damson Gooseberry Rhubarb Strawberry Total
number
208 11 0.8 - - 1.5 0.9 3.2
7 10 0.6 0.3 - - 0.9 1.8
8 13 0.6 0.3 - - 0.9 1.8
142 12 - - - - 1.1 1.1
151 13 - - - 0.9 - 0.9
152 10 - - - 0.9 - 0.9
162 10 - - - - 0.2 0.2
175 15 - - - 0.1 - 0.1
176 11 - - - 0.1 - 0.1
Notes
Emboldened observations are the high-rate consumers
The mean consumption rate of domestic fruit for the child age group based upon the 4 high-rate consumers is 2.0 kg y-1
The observed 97.5th percentile rate based on 9 observations is 2.9 kg y
-1
Observation Age Apple Damson Gooseberry Rhubarb Strawberry Total
number
229 5 - - 0.3 0.1 - 0.4
Notes
Emboldened observations are the high-rate consumers
The mean consumption rate of domestic fruit for the infant age group based upon the only high-rate consumer is 0.4 kg y-1
The observed 97.5th percentile rate is not applicable for 1 observation
Table 39. Children's and infants' consumption rates of domestic fruit from the terrestrial survey area (kg y-1
)
Child age group (6 - 15 years old)
Infant age group (0 - 5 years old)

Observation Age Cows' milk
number
7 13 155.6
8 10 155.6
Notes
Emboldened observations are the high-rate consumers
The mean consumption rate of milk for the child age group based upon the 2 high-rate consumers is 155.6 l y-1
The observed 97.5th percentile rate based on 2 observations is 155.6 l y
-1
Observation Age Cows' milk
number
121 2 86.5
Notes
Emboldened observations are the high-rate consumers
The mean consumption rate of milk for the infant age group based upon the only high-rate consumer is 86.5 l y-1
The observed 97.5th percentile rate is not applicable for 1 observation
Table 40. Children's and infants' consumption rates of milk from the terrestrial survey area (l y-1
)
Child age group (6 - 15 years old)
Infant age group (0 - 5 years old)

Observation Age Beef
number
358 7 16.3
Notes
Emboldened observations are the high-rate consumers
The mean consumption rate of cattle meat for the child age group based upon the only high-rate consumer is 16.3 kg y-1
The observed 97.5th percentile rate is not applicable for 1 observation
Observation Age Beef
number
11 3 9.5
12 3 9.5
Notes
Emboldened observations are the high-rate consumers
The mean consumption rate of cattle meat for the infant age group based upon the 2 high-rate consumers is 9.5 kg y-1
The observed 97.5th percentile rate based on 2 observations is 9.5 kg y
-1
Table 41. Children's and infants' consumption rates of cattle meat from the terrestrial survey area (kg y-1
)
Child age group (6 - 15 years old)
Infant age group (0 - 5 years old)

Observation Age Pork
number
358 7 2.1
Notes
Emboldened observations are the high-rate consumers
The mean consumption rate of pig meat for the child age group based upon the only high-rate consumer is 2.1 kg y-1
The observed 97.5th percentile rate is not applicable for 1 observation
Observation Age Lamb
number
358 7 2.8
Notes
Emboldened observations are the high-rate consumers
The mean consumption rate of sheep meat for the child age group based upon the only high-rate consumer is 2.8 kg y-1
The observed 97.5th percentile rate is not applicable for 1 observation
Observation Age Lamb
number
121 2 2.4
11 3 1.1
12 3 1.1
Notes
Emboldened observations are the high-rate consumers
The mean consumption rate of sheep meat for the infant age group based upon the 3 high-rate consumers is 1.5 kg y-1
The observed 97.5th percentile rate based on 3 observations is 2.3 kg y
-1
Infant age group (0 - 5 years old)
Table 43. Children's and infants' consumption rates of sheep meat from the terrestrial survey area (kg y-1
)
Table 42. Children's consumption rates of pig meat from the terrestrial survey area (kg y-1
)
Child age group (6 - 15 years old)
Child age group (6 - 15 years old)

Observation Age Pheasant Turkey Total
number
358 7 - 1.2 1.2
175 15 0.4 - 0.4
Notes
Emboldened observations are the high-rate consumers
The mean consumption rate of poultry for the child age group based upon the only high-rate consumer is 1.2 kg y-1
The observed 97.5th
percentile rate based on 2 observations is 1.1 kg y-1
Observation Age Chicken egg
number
7 13 41.6
8 10 41.6
162 10 29.6
208 11 5.5
358 7 5.0
151 13 3.5
152 10 3.5
Notes
Emboldened observations are the high-rate consumers
The mean consumption rate of eggs for the child age group based upon the 3 high-rate consumers is 37.6 kg y-1
The observed 97.5th
percentile rate based on 7 observations is 41.6 kg y-1
Observation Age Chicken egg
number
11 3 8.9
12 3 8.9
213 3 0.8
Notes
Emboldened observations are the high-rate consumers
The mean consumption rate of eggs for the infant group based upon the 2 high-rate consumers is 8.9 kg y-1
The observed 97.5th
percentile rate based on 3 observations is 8.9 kg y-1
Table 44. Children's consumption rates of poultry from the terrestrial survey area (kg y-1
)
Table 45. Children's and infants' consumption rates of eggs from the terrestrial survey area (kg y-1
)
Child age group (6 - 15 years old)
Child age group (6 - 15 years old)
Infant age group (0 - 5 years old)

Observation Age Blackberry
number
7 13 0.3
8 10 0.3
Notes
Emboldened observations are the high-rate consumers
The mean consumption rate of wild/free foods for the child age group based upon the 2 high-rate consumers is 0.3 kg y-1
The observed 97.5th
percentile rate based on 2 observations is 0.3 kg y-1
Observation Age Rabbit
number
358 7 0.5
Notes
Emboldened observations are the high-rate consumers
The mean consumption rate of rabbits/hares for the child age group based upon the only high-rate consumer is 0.5 kg y-1
The observed 97.5th
percentile rate is not applicable for 1 observation
Observation Age Mushrooms
number
121 2 0.1
Notes
Emboldened observations are the high-rate consumers
The mean consumption rate of wild fungi for the infant age group based upon the only high-rate consumer is 0.1 kg y-1
The observed 97.5th
percentile rate is not applicable for 1 observation
Table 46. Children's consumption rates of wild/free foods from the terrestrial survey area (kg y-1
)
Table 47. Children's consumption rates of rabbits/hares from the terrestrial survey area (kg y-1
)
Table 48. Infants' consumption rates of wild fungi from the survey area (kg y-1
)
Child age group (6 - 15 years old)
Child age group (6 - 15 years old)
Infant age group (0 - 5 years old)
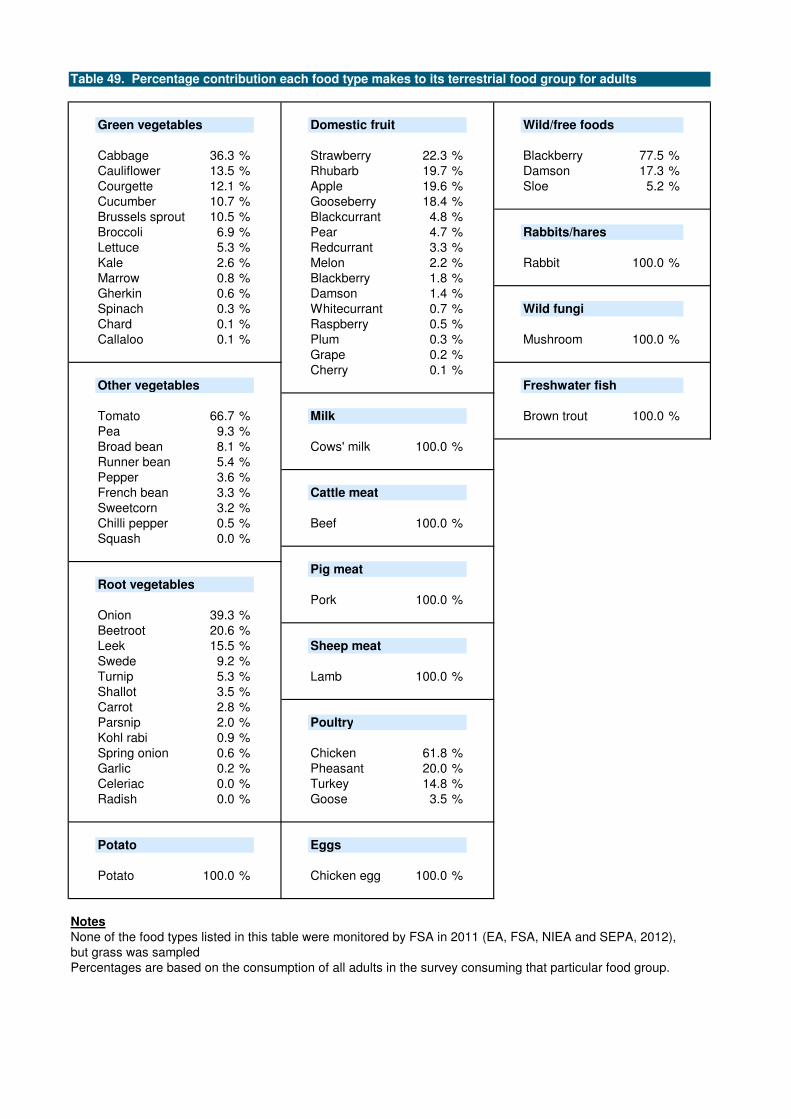
Green vegetables Domestic fruit Wild/free foods
Cabbage 36.3 % Strawberry 22.3 % Blackberry 77.5 %
Cauliflower 13.5 % Rhubarb 19.7 % Damson 17.3 %
Courgette 12.1 % Apple 19.6 % Sloe 5.2 %
Cucumber 10.7 % Gooseberry 18.4 %
Brussels sprout 10.5 % Blackcurrant 4.8 %
Broccoli 6.9 % Pear 4.7 % Rabbits/hares
Lettuce 5.3 % Redcurrant 3.3 %
Kale 2.6 % Melon 2.2 % Rabbit 100.0 %
Marrow 0.8 % Blackberry 1.8 %
Gherkin 0.6 % Damson 1.4 %
Spinach 0.3 % Whitecurrant 0.7 % Wild fungi
Chard 0.1 % Raspberry 0.5 %
Callaloo 0.1 % Plum 0.3 % Mushroom 100.0 %
Grape 0.2 %
Cherry 0.1 %
Other vegetables Freshwater fish
Tomato 66.7 % Milk Brown trout 100.0 %
Pea 9.3 %
Broad bean 8.1 % Cows' milk 100.0 %
Runner bean 5.4 %
Pepper 3.6 %
French bean 3.3 % Cattle meat
Sweetcorn 3.2 %
Chilli pepper 0.5 % Beef 100.0 %
Squash 0.0 %
Pig meat
Root vegetables
Pork 100.0 %
Onion 39.3 %
Beetroot 20.6 %
Leek 15.5 % Sheep meat
Swede 9.2 %
Turnip 5.3 % Lamb 100.0 %
Shallot 3.5 %
Carrot 2.8 %
Parsnip 2.0 % Poultry
Kohl rabi 0.9 %
Spring onion 0.6 % Chicken 61.8 %
Garlic 0.2 % Pheasant 20.0 %
Celeriac 0.0 % Turkey 14.8 %
Radish 0.0 % Goose 3.5 %
Potato Eggs
Potato 100.0 % Chicken egg 100.0 %
Notes
None of the food types listed in this table were monitored by FSA in 2011 (EA, FSA, NIEA and SEPA, 2012),
but grass was sampled
Percentages are based on the consumption of all adults in the survey consuming that particular food group.
Table 49. Percentage contribution each food type makes to its terrestrial food group for adults

Table 50. Direct radiation occupancy rates for adults, children and infants (h y-1
)
Observation Sex Age Main activity Indoor Outdoor Total
Number (years) occupancy occupancy occupancy
0 to 0.25 km zone
264 F 67 Residing 7970 780 8750
24 M 56 Residing 7624 1040 8664
25 F 10 Residing and attending school 8216 448 8664
67 M 43 Residing 8535 129 8664
269 F 24 Residing 7926 730 8656
270 F 3 Residing 7926 730 8656
271 F 2 Residing 7926 730 8656
272 F 1 Residing 7926 730 8656
68 M 67 Residing 8366 208 8574
69 F 64 Residing 8366 208 8574
363 F 85 Residing 8422 26 8448
267 F 79 Residing 7878 546 8424
251 M 49 Residing 7772 572 8344
252 F 42 Residing 7772 572 8344
19 F 33 Residing and working 8132 148 8280
21 M 11 Residing and attending school 7842 438 8280
421 M 45 Residing 7875 365 8240
422 F 42 Residing 7875 365 8240
370 M 31 Residing and working 7896 312 8208
371 F 28 Residing and working 7896 312 8208
253 F 42 Residing and working 7564 468 8032
268 M 30 Residing 6470 730 7200
27 F 18 Residing 6628 416 7044
20 F 15 Residing 6153 372 6525
417 F 66 Residing 5840 602 6442
359 M 64 Residing 5640 50 5690
360 F 58 Residing 4862 50 4912
18 M 36 Residing 3780 312 4092
26 M 15 Residing 3081 528 3609
348 M 51 Working 1000 1400 2400
349 M U Working 500 700 1200
350 M U Working 500 700 1200
361 F 7 Visiting 825 25 850
364 F 63 Visiting 496 52 548
365 F 60 Visiting 496 52 548
418 F 65 Visiting 280 28 308
419 M U Visiting 280 28 308
420 F U Visiting 280 28 308
362 M 38 Visiting 225 25 250
265 M 8 Visiting 130 26 156
266 M 5 Visiting 130 26 156

Table 50. Direct radiation occupancy rates for adults, children and infants (h y-1
)
Observation Sex Age Main activity Indoor Outdoor Total
Number (years) occupancy occupancy occupancy
>0.25 to 0.5 km zone
70 F 71 Residing 7314 1072 8386
369 M 10 Residing and attending school 7814 234 8048
368 M 18 Residing 7708 260 7968
424 F 33 Residing 7741 143 7884
366 F 40 Residing 7684 156 7840
367 M 35 Residing 7736 104 7840
425 M 57 Residing 6648 644 7292
426 F 57 Residing 6648 644 7292
154 M 57 Residing 5830 1178 7008
64 M 43 Residing and working 6457 331 6788
153 M 59 Residing 6339 403 6742
22 F 80 Residing 6188 294 6482
65 F 42 Residing 5809 283 6092
423 M 32 Residing 5901 143 6044
23 M U Residing 1882 50 1932
66 M 2 Visiting 1040 208 1248
400 M 25 Jet skiing - 41 41
401 M 34 Jet skiing - 41 41
402 M 36 Jet skiing - 41 41
403 M 11 Jet skiing - 41 41
404 M 9 Jet skiing - 41 41
397 M 40 Jet skiing - 33 33
398 M 25 Jet skiing - 25 25
399 F 25 Jet skiing - 25 25
>0.5 to 1 km zone
259 F 19 Residing 8369 365 8734
254 F 70 Residing 8612 100 8712
255 M 72 Residing 8264 400 8664
257 F 50 Residing 8291 365 8656
261 F 58 Residing 8049 350 8399
260 M 59 Residing 7674 700 8374
165 M 66 Residing 4816 3039 7855
262 M 68 Residing 7449 375 7824
263 F 64 Residing 7449 375 7824
256 M 46 Residing 7446 274 7720
166 F 56 Residing 5418 2156 7574
258 M 17 Residing 6028 912 6940
75 M 70 Boat maintenance - 360 360
439 M U Boat maintenance - 220 220
440 M U Boat maintenance - 220 220
429 M 52 Collecting crabs - 34 34
Notes
U = Unknown
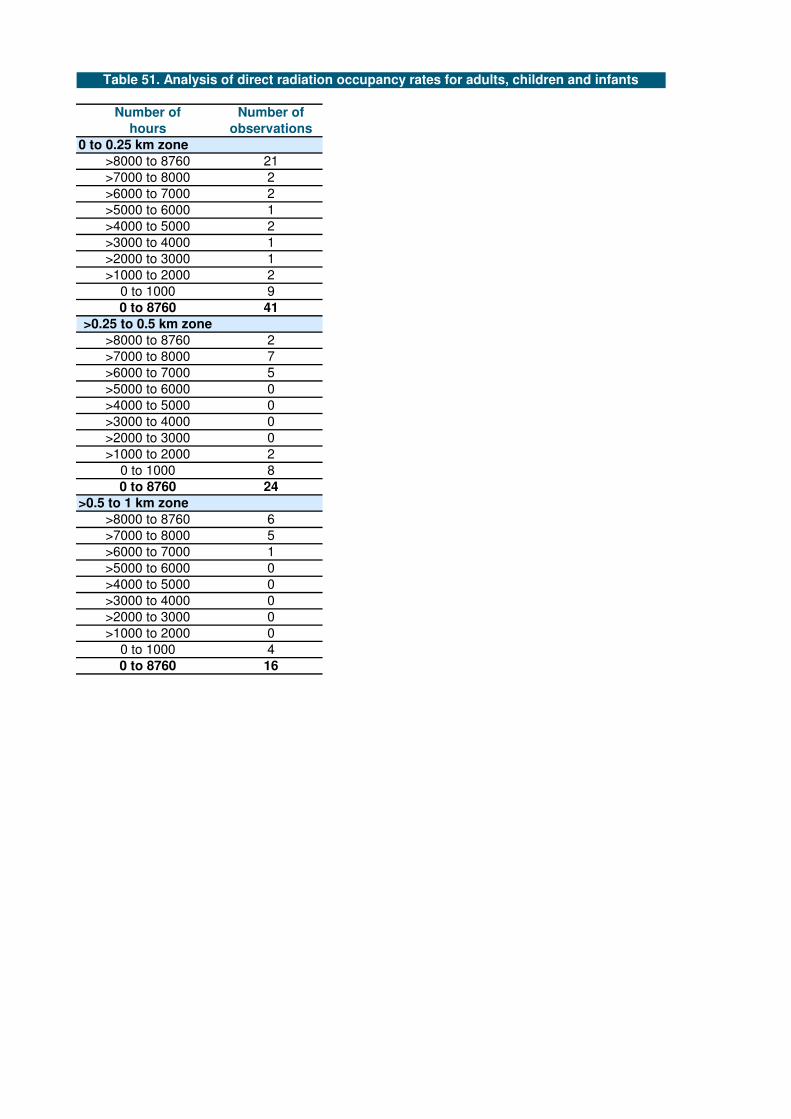
Number of Number of
hours observations
0 to 0.25 km zone
>8000 to 8760 21
>7000 to 8000 2
>6000 to 7000 2
>5000 to 6000 1
>4000 to 5000 2
>3000 to 4000 1
>2000 to 3000 1
>1000 to 2000 2
0 to 1000 9
0 to 8760 41
>0.25 to 0.5 km zone
>8000 to 8760 2
>7000 to 8000 7
>6000 to 7000 5
>5000 to 6000 0
>4000 to 5000 0
>3000 to 4000 0
>2000 to 3000 0
>1000 to 2000 2
0 to 1000 8
0 to 8760 24
>0.5 to 1 km zone
>8000 to 8760 6
>7000 to 8000 5
>6000 to 7000 1
>5000 to 6000 0
>4000 to 5000 0
>3000 to 4000 0
>2000 to 3000 0
>1000 to 2000 0
0 to 1000 4
0 to 8760 16
Table 51. Analysis of direct radiation occupancy rates for adults, children and infants
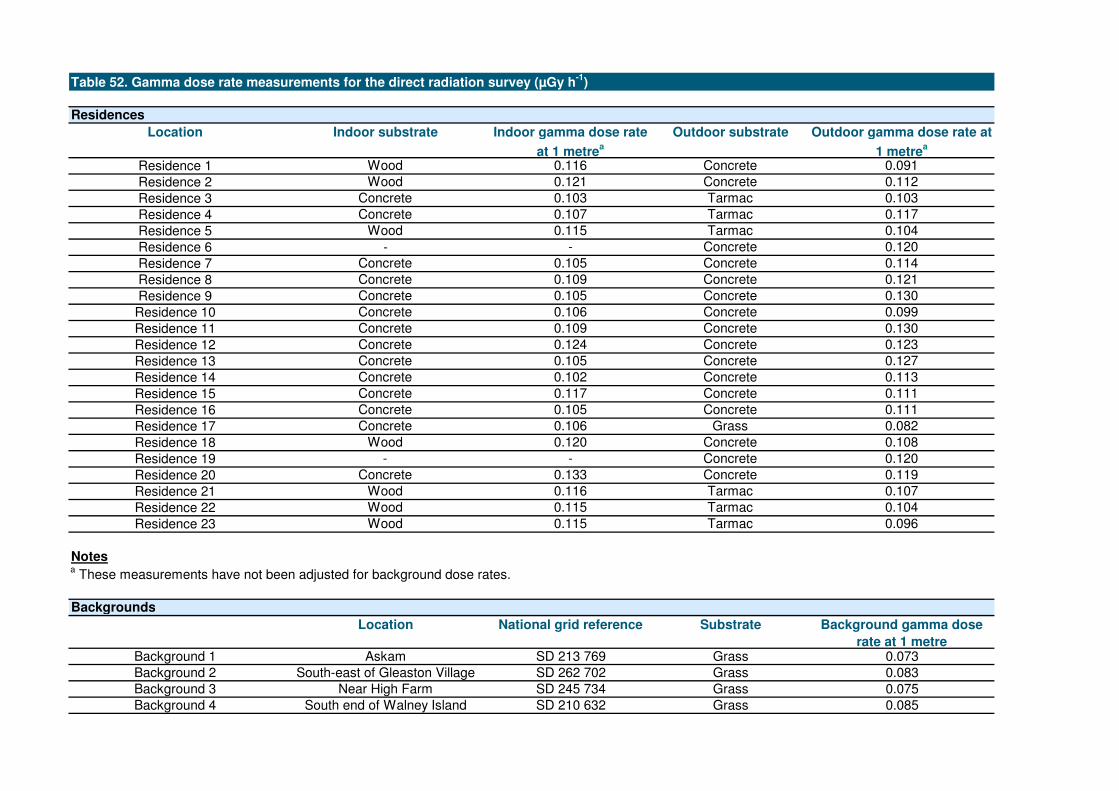
Residences
Location Indoor substrate Indoor gamma dose rate
at 1 metrea
Outdoor substrate Outdoor gamma dose rate at
1 metrea
Residence 1 Wood 0.116 Concrete 0.091
Residence 2 Wood 0.121 Concrete 0.112
Residence 3 Concrete 0.103 Tarmac 0.103
Residence 4 Concrete 0.107 Tarmac 0.117
Residence 5 Wood 0.115 Tarmac 0.104
Residence 6 - - Concrete 0.120
Residence 7 Concrete 0.105 Concrete 0.114
Residence 8 Concrete 0.109 Concrete 0.121
Residence 9 Concrete 0.105 Concrete 0.130
Residence 10 Concrete 0.106 Concrete 0.099
Residence 11 Concrete 0.109 Concrete 0.130
Residence 12 Concrete 0.124 Concrete 0.123
Residence 13 Concrete 0.105 Concrete 0.127
Residence 14 Concrete 0.102 Concrete 0.113
Residence 15 Concrete 0.117 Concrete 0.111
Residence 16 Concrete 0.105 Concrete 0.111
Residence 17 Concrete 0.106 Grass 0.082
Residence 18 Wood 0.120 Concrete 0.108
Residence 19 - - Concrete 0.120
Residence 20 Concrete 0.133 Concrete 0.119
Residence 21 Wood 0.116 Tarmac 0.107
Residence 22 Wood 0.115 Tarmac 0.104
Residence 23 Wood 0.115 Tarmac 0.096
Notesa These measurements have not been adjusted for background dose rates.
Backgrounds
Location National grid reference Substrate Background gamma dose
rate at 1 metreBackground 1 Askam SD 213 769 Grass 0.073
Background 2 South-east of Gleaston Village SD 262 702 Grass 0.083
Background 3 Near High Farm SD 245 734 Grass 0.075
Background 4 South end of Walney Island SD 210 632 Grass 0.085
Table 52. Gamma dose rate measurements for the direct radiation survey (µGy h-1
)

Co
mb
ina
tio
n n
um
be
r
Fis
h
Cru
sta
ce
an
s
Mo
llu
sc
s
Wild
fow
l
Ma
rin
e p
lan
ts/a
lga
e
Sa
ltm
ars
h g
raze
d s
he
ep
Gre
en
ve
ge
tab
les
Oth
er
ve
ge
tab
les
Ro
ot
ve
ge
tab
les
Po
tato
Do
me
sti
c f
ruit
Milk
Ca
ttle
me
at
Pig
me
at
Sh
ee
p m
ea
t
Po
ult
ry
Eg
gs
Wild
/fre
e f
oo
ds
Ra
bb
its
/ha
res
Wild
fu
ng
i
Fre
sh
wa
ter
fis
h
Inte
rtid
al o
cc
up
an
cy
ov
er
mu
d
Inte
rtid
al o
cc
up
an
cy
ov
er
mu
d a
nd
sa
nd
Inte
rtid
al o
cc
up
an
cy
ov
er
mu
d a
nd
sto
ne
s
Inte
rtid
al o
cc
up
an
cy
ov
er
sa
lt m
ars
h
Inte
rtid
al o
cc
up
an
cy
ov
er
sa
nd
Inte
rtid
al o
cc
up
an
cy
ov
er
sa
nd
an
d s
ton
es
Inte
rtid
al o
cc
up
an
cy
ov
er
bo
at
on
mu
d a
nd
sa
nd
Ha
nd
lin
g f
ish
ing
ge
ar
Ha
nd
lin
g s
ed
ime
nt
Oc
cu
pa
nc
y in
clo
se
pro
xim
ity
(<
10
m)
to
se
wa
ge
Oc
cu
pa
nc
y in
clo
se
pro
xim
ity
(<
10
m)
to
se
wa
ge
slu
dg
e o
r
se
wa
ge
ca
ke
Oc
cu
pa
nc
y in
wa
ter
Oc
cu
pa
nc
y o
n w
ate
r
Ind
oo
r o
cc
up
an
cy
wit
hin
1 k
m o
f th
e lic
en
se
d s
ite
bo
un
da
ry
Ou
tdo
or
oc
cu
pa
nc
y
wit
hin
1 k
m o
f th
e
lic
en
se
d s
ite
bo
un
da
ry
1 X X X X X
2 X X X X X
3 X X X X X X X X X
4 X X X X
5 X X X X X X X X
6 X X X X X X X X X X X
7 X X X X X X
8 X X X
9 X X X X X X
10 X X
11 X X X X X X
12 X X X X
13 X X X X X X
14 X X X X X X X
15 X X X X X X X X X X X
16 X X X X X X
17 X X X X X X X X
18 X X X X X X X X X X
19 X X X X X
20 X X X X X
21 X X X X X
22 X X X X X X X X X
23 X X X
24 X X X X X X X
25 X X X X X
26 X X X X
27 X X X X X
28 X X X X X
29 X X X X X X X X X
30 X X
31 X X X
32 X X X X X
33 X X X X X
34 X X
Notes
The food groups and external exposure pathways marked with a cross are combined for the corresponding combination number. For example, combination number 1 represents
an individual (or individuals) from Annex 1 who had positive data for the following pathways: domestic fruit, cattle meat, sheep meat, wild/free foods and wild fungi.
Table 53. Combinations of adult pathways for consideration in dose assessments

Ob
serv
ati
on
nu
mb
er
Sex
Ag
e (
years
)
Fis
h
Cru
sta
cean
s
Mo
llu
scs
Wild
fow
l
Mari
ne p
lan
ts/a
lgae
Salt
mars
h g
razed
sh
eep
Gre
en
veg
eta
ble
s
Oth
er
veg
eta
ble
s
Ro
ot
veg
eta
ble
s
Po
tato
Do
mesti
c f
ruit
Milk
Catt
le m
eat
Pig
meat
Sh
eep
meat
Po
ult
ry
Eg
gs
Wild
/fre
e f
oo
ds
Rab
bit
s
Wild
fu
ng
i
Fre
sh
wate
r fi
sh
Inte
rtid
al o
ccu
pan
cy o
ver
mu
d
Inte
rtid
al o
ccu
pan
cy o
ver
mu
d a
nd
san
d
Inte
rtid
al o
ccu
pan
cy o
ver
mu
d a
nd
sto
nes
Inte
rtid
al o
ccu
pan
cy o
ver
salt
mars
h
Inte
rtid
al o
ccu
pan
cy o
ver
san
d
Inte
rtid
al o
ccu
pan
cy o
ver
san
d a
nd
sto
nes
Inte
rtid
al o
ccu
pan
cy o
ver
bo
at
on
mu
d a
nd
san
d
Han
dlin
g f
ish
ing
gear
Han
dlin
g s
ed
imen
t
Occu
pan
cy in
clo
se p
roxim
ity
(<10m
) to
sew
ag
e
Occu
pan
cy in
clo
se p
roxim
ity
(<10m
) to
sew
ag
e s
lud
ge o
r
sew
ag
e c
ake
Occu
pan
cy in
wate
r
Occu
pan
cy o
n w
ate
r
Ind
oo
r o
ccu
pan
cy w
ith
in 1
km
of
the lic
en
sed
sit
e b
ou
nd
ary
Ou
tdo
or
occu
pan
cy w
ith
in 1
km
of
the lic
en
sed
sit
e
bo
un
dary
1 M 56 - - - - - - - - - - 0.5 - 11.8 - 1.4 - - 0.5 - 0.5 - - - - - - - - - - - - - - - -2 F 61 - - - - - - - - - - 0.5 - 11.8 - 1.4 - - 0.5 - 0.5 - - - - - - - - - - - - - - - -3 M 93 - - - - - - - - - - 0.5 - 11.8 - 1.4 - - 0.5 - 0.5 - - - - - - - - - - - - - - - -4 F 25 - - - - - - - - - - - - 11.8 - 1.4 - - - - - - - - - - - - - - - - - - - - -5 F 41 - - - - - - - - - 1.3 1.8 155.6 - - - - 41.6 0.3 - - - - - - - - - - - - - - - - - -6 M 44 - - - - - - - - - 1.3 1.8 155.6 - - - - 41.6 0.3 - - - - - - - - - - - - - - - - - -9 M 35 - - - - - - - - - - - - 37.8 - 4.5 - 8.9 - - - - - - - - - - - - - - - - - - -10 F 33 - - - - - - - - - - - - 37.8 - 4.5 - 8.9 - - - - - - - - - - - - - - - - - - -13 F 44 - - - - - - - - - - - - 35.5 - - - - - - - - - - - - - - - - - - - - - - -14 M 46 - - - - - - - - - - - - 35.5 - - - - - - - - - - - - - - - - - - - - - - -15 M 19 - - - - - - - - - - - - 35.5 - - - - - - - - - - - - - - - - - - - - - - -16 F 17 - - - - - - - - - - - - 35.5 - - - - - - - - - - - - - - - - - - - - - - -17 M 56 - - - - - - - - - - - 414.9 - - - - 20.8 0.9 - 0.9 - - - - - - - - - - - - - - - -18 M 36 - - - - - - - - - - - - - - - - - - - - - - - - - - - - - - - - - - 3780 31219 F 33 - - - - - - - - - - - - - - - - - - - - - - - - - - - - - - - - - - 8132 14822 F 80 - - - - - - - - - - - - - - - - - - - - - - - - - - - - - - - - - - 6188 29423 M U - - - - - - - - - - - - - - - - - - - - - - - - - - - - - - - - - - 1882 5024 M 56 - - - - - - - - - - - - - - - - - - - - - - - - - - - - - - - - - - 7624 104027 F 18 - - - - - - - - - - - - - - - - - - - - - - - - - - - - - - - - - - 6628 41628 M 55 - - - - - - - - - - - - - - - - - - - - - - - - - - 150 - - - - - - - - -29 M 36 - - - - - - - - - - - - - - - - - - - - - - - - - - 144 - - - - - - - - -30 F 34 - - - - - - - - - - - - - - - - - - - - - - - - - - 144 - - - - - - - - -31 M 45 - - - - - - - - - - - - - - - - - - - - - - - - - 300 - - - - - - - - - -32 M 45 5.8 - - - - - - - - - - - - - - - - - - - - - - - - 142 - - - 52 - - - - - -33 F 43 5.8 - - - - - - - - - - - - - - - - - - - - - - - - - - - - - - - - - - -35 M 41 0.9 - - - - - - - - - - - - - - - - - - - - - - - - 23 - - - - - - - - - -36 F 39 0.9 - - - - - - - - - - - - - - - - - - - - - - - - - - - - - - - - - - -38 M 57 5.6 - - - - - - - - - - - - - - - - - - - - - - - - - - - - - - - - - - -39 M 31 5.6 - - - - - - - - - - - - - - - - - - - - - - - - - - - - - - - - - - -40 M U 0.5 - - - - - - - - - - - - - - - - - - - - - - - - 6 - - - 6 - - - - - -43 M 64 0.6 - - - - - - - - - - - - - - - - - - - - - - - - - - - - - - - - - - -44 F U 0.6 - - - - - - - - - - - - - - - - - - - - - - - - - - - - - - - - - - -45 M 21 - - - - - - - - - - - - - - - - - - - - - - - - - 45 - - - 45 - - - - - -46 M 51 0.9 - - - - - - - - - - - - - - - - - - - - - - - - 28 - - - 28 - - - - - -47 M 77 0.9 - - - - - - - - - - - - - - - - - - - - - - - - - - - - - - - - - - -48 F 22 - - - - - - - - - - - - - - - - - - - - - - - - - 36 - - - - - - - - - -50 M 79 - - - - - - - - - - - - - - - - - - - - - - - - - 300 - - - - - - - - - -51 M U 11.5 - - - - - - - - - - - - - - - - - - - - - - - - 168 - - - 132 - - - 108 - -52 M U 11.5 - - - - - - - - - - - - - - - - - - - - - - - - - - - - - - - - - - -53 M U 11.5 - - - - - - - - - - - - - - - - - - - - - - - - - - - - - - - - - - -54 M U 11.5 - - - - - - - - - - - - - - - - - - - - - - - - - - - - - - - - - - -55 M U 11.5 - - - - - - - - - - - - - - - - - - - - - - - - - - - - - - - - - - -56 M U 11.5 - - - - - - - - - - - - - - - - - - - - - - - - - - - - - - - - - - -57 M U 11.5 - - - - - - - - - - - - - - - - - - - - - - - - - - - - - - - - - - -
Annex 1. Adults' consumption rates (kg y-1
or l y-1
) and occupancy rates (h y-1
)
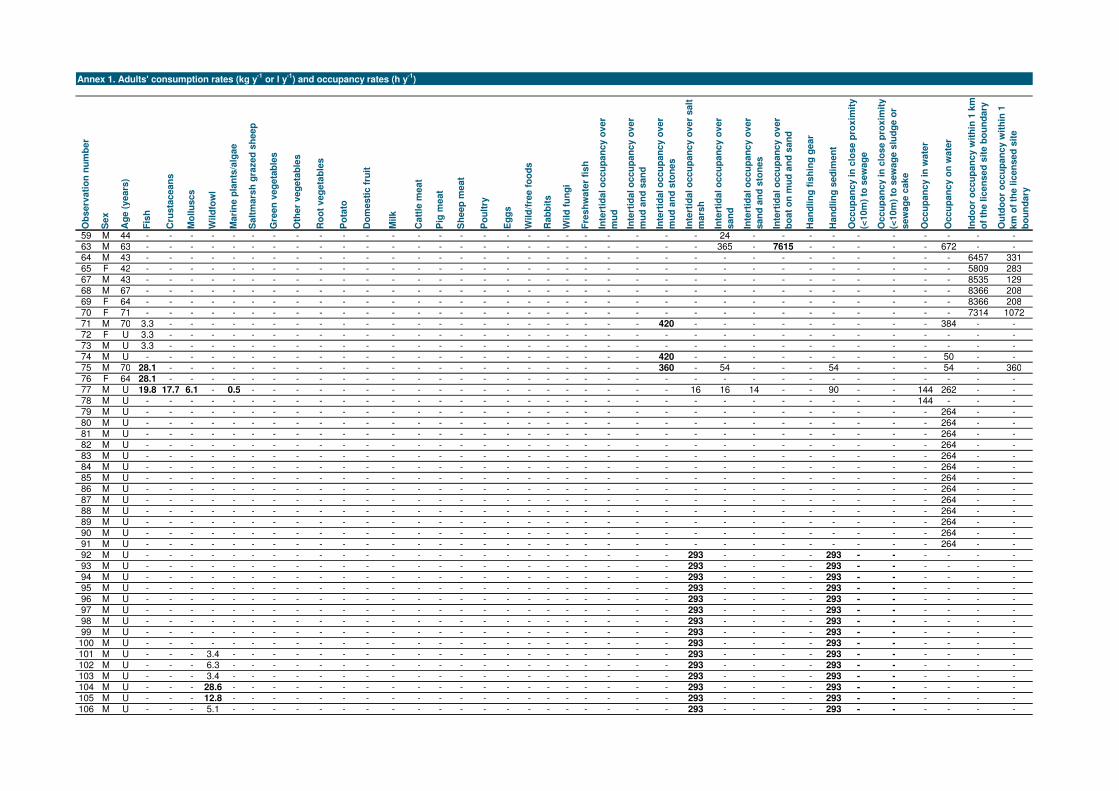
Ob
serv
ati
on
nu
mb
er
Sex
Ag
e (
years
)
Fis
h
Cru
sta
cean
s
Mo
llu
scs
Wild
fow
l
Mari
ne p
lan
ts/a
lgae
Salt
mars
h g
razed
sh
eep
Gre
en
veg
eta
ble
s
Oth
er
veg
eta
ble
s
Ro
ot
veg
eta
ble
s
Po
tato
Do
mesti
c f
ruit
Milk
Catt
le m
eat
Pig
meat
Sh
eep
meat
Po
ult
ry
Eg
gs
Wild
/fre
e f
oo
ds
Rab
bit
s
Wild
fu
ng
i
Fre
sh
wate
r fi
sh
Inte
rtid
al o
ccu
pan
cy o
ver
mu
d
Inte
rtid
al o
ccu
pan
cy o
ver
mu
d a
nd
san
d
Inte
rtid
al o
ccu
pan
cy o
ver
mu
d a
nd
sto
nes
Inte
rtid
al o
ccu
pan
cy o
ver
salt
mars
h
Inte
rtid
al o
ccu
pan
cy o
ver
san
d
Inte
rtid
al o
ccu
pan
cy o
ver
san
d a
nd
sto
nes
Inte
rtid
al o
ccu
pan
cy o
ver
bo
at
on
mu
d a
nd
san
d
Han
dlin
g f
ish
ing
gear
Han
dlin
g s
ed
imen
t
Occu
pan
cy in
clo
se p
roxim
ity
(<10m
) to
sew
ag
e
Occu
pan
cy in
clo
se p
roxim
ity
(<10m
) to
sew
ag
e s
lud
ge o
r
sew
ag
e c
ake
Occu
pan
cy in
wate
r
Occu
pan
cy o
n w
ate
r
Ind
oo
r o
ccu
pan
cy w
ith
in 1
km
of
the lic
en
sed
sit
e b
ou
nd
ary
Ou
tdo
or
occu
pan
cy w
ith
in 1
km
of
the lic
en
sed
sit
e
bo
un
dary
Annex 1. Adults' consumption rates (kg y-1
or l y-1
) and occupancy rates (h y-1
)
59 M 44 - - - - - - - - - - - - - - - - - - - - - - - - - 24 - - - - - - - - - -63 M 63 - - - - - - - - - - - - - - - - - - - - - - - - - 365 - 7615 - - - - - 672 - -64 M 43 - - - - - - - - - - - - - - - - - - - - - - - - - - - - - - - - - - 6457 33165 F 42 - - - - - - - - - - - - - - - - - - - - - - - - - - - - - - - - - - 5809 28367 M 43 - - - - - - - - - - - - - - - - - - - - - - - - - - - - - - - - - - 8535 12968 M 67 - - - - - - - - - - - - - - - - - - - - - - - - - - - - - - - - - - 8366 20869 F 64 - - - - - - - - - - - - - - - - - - - - - - - - - - - - - - - - - - 8366 20870 F 71 - - - - - - - - - - - - - - - - - - - - - - - - - - - - - - - - - - 7314 107271 M 70 3.3 - - - - - - - - - - - - - - - - - - - - - - 420 - - - - - - - - - 384 - -72 F U 3.3 - - - - - - - - - - - - - - - - - - - - - - - - - - - - - - - - - - -73 M U 3.3 - - - - - - - - - - - - - - - - - - - - - - - - - - - - - - - - - - -74 M U - - - - - - - - - - - - - - - - - - - - - - - 420 - - - - - - - - - 50 - -75 M 70 28.1 - - - - - - - - - - - - - - - - - - - - - - 360 - 54 - - - 54 - - - 54 - 36076 F 64 28.1 - - - - - - - - - - - - - - - - - - - - - - - - - - - - - - - - - - -77 M U 19.8 17.7 6.1 - 0.5 - - - - - - - - - - - - - - - - - - - 16 16 14 - - 90 - - 144 262 - -78 M U - - - - - - - - - - - - - - - - - - - - - - - - - - - - - - - - 144 - - -79 M U - - - - - - - - - - - - - - - - - - - - - - - - - - - - - - - - - 264 - -80 M U - - - - - - - - - - - - - - - - - - - - - - - - - - - - - - - - - 264 - -81 M U - - - - - - - - - - - - - - - - - - - - - - - - - - - - - - - - - 264 - -82 M U - - - - - - - - - - - - - - - - - - - - - - - - - - - - - - - - - 264 - -83 M U - - - - - - - - - - - - - - - - - - - - - - - - - - - - - - - - - 264 - -84 M U - - - - - - - - - - - - - - - - - - - - - - - - - - - - - - - - - 264 - -85 M U - - - - - - - - - - - - - - - - - - - - - - - - - - - - - - - - - 264 - -86 M U - - - - - - - - - - - - - - - - - - - - - - - - - - - - - - - - - 264 - -87 M U - - - - - - - - - - - - - - - - - - - - - - - - - - - - - - - - - 264 - -88 M U - - - - - - - - - - - - - - - - - - - - - - - - - - - - - - - - - 264 - -89 M U - - - - - - - - - - - - - - - - - - - - - - - - - - - - - - - - - 264 - -90 M U - - - - - - - - - - - - - - - - - - - - - - - - - - - - - - - - - 264 - -91 M U - - - - - - - - - - - - - - - - - - - - - - - - - - - - - - - - - 264 - -92 M U - - - - - - - - - - - - - - - - - - - - - - - - 293 - - - - 293 - - - - - -93 M U - - - - - - - - - - - - - - - - - - - - - - - - 293 - - - - 293 - - - - - -94 M U - - - - - - - - - - - - - - - - - - - - - - - - 293 - - - - 293 - - - - - -95 M U - - - - - - - - - - - - - - - - - - - - - - - - 293 - - - - 293 - - - - - -96 M U - - - - - - - - - - - - - - - - - - - - - - - - 293 - - - - 293 - - - - - -97 M U - - - - - - - - - - - - - - - - - - - - - - - - 293 - - - - 293 - - - - - -98 M U - - - - - - - - - - - - - - - - - - - - - - - - 293 - - - - 293 - - - - - -99 M U - - - - - - - - - - - - - - - - - - - - - - - - 293 - - - - 293 - - - - - -100 M U - - - - - - - - - - - - - - - - - - - - - - - - 293 - - - - 293 - - - - - -101 M U - - - 3.4 - - - - - - - - - - - - - - - - - - - - 293 - - - - 293 - - - - - -102 M U - - - 6.3 - - - - - - - - - - - - - - - - - - - - 293 - - - - 293 - - - - - -103 M U - - - 3.4 - - - - - - - - - - - - - - - - - - - - 293 - - - - 293 - - - - - -104 M U - - - 28.6 - - - - - - - - - - - - - - - - - - - - 293 - - - - 293 - - - - - -105 M U - - - 12.8 - - - - - - - - - - - - - - - - - - - - 293 - - - - 293 - - - - - -106 M U - - - 5.1 - - - - - - - - - - - - - - - - - - - - 293 - - - - 293 - - - - - -
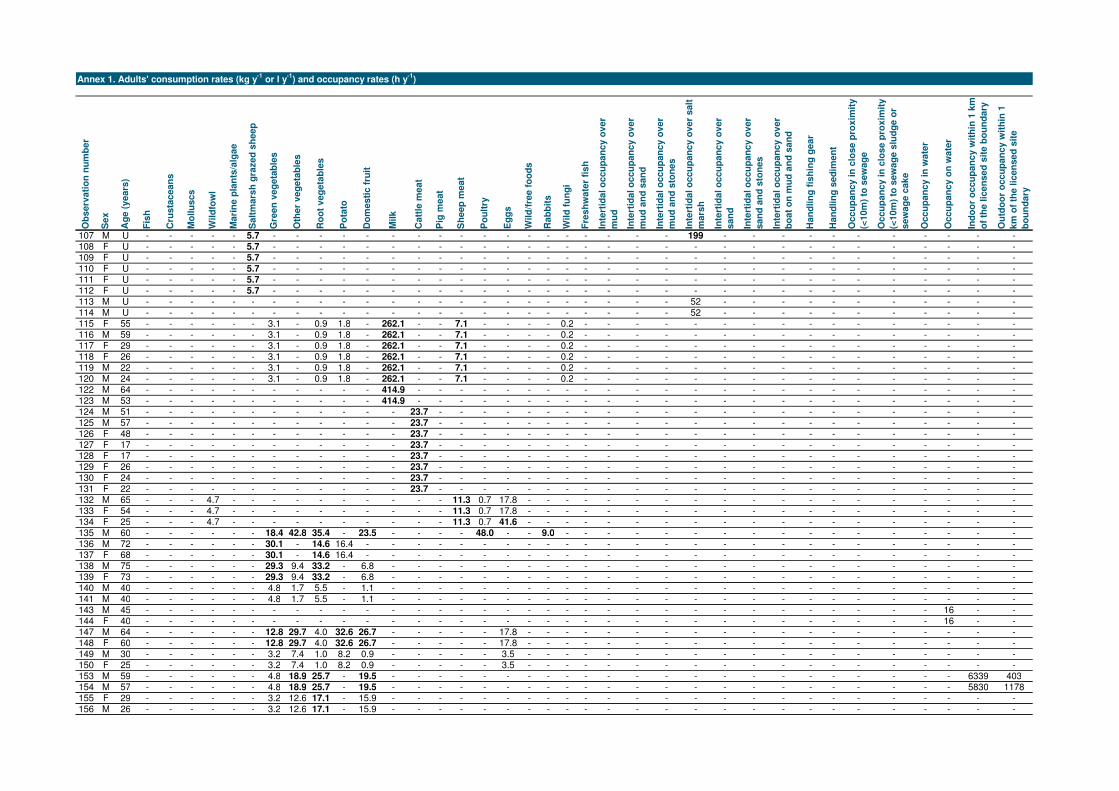
Ob
serv
ati
on
nu
mb
er
Sex
Ag
e (
years
)
Fis
h
Cru
sta
cean
s
Mo
llu
scs
Wild
fow
l
Mari
ne p
lan
ts/a
lgae
Salt
mars
h g
razed
sh
eep
Gre
en
veg
eta
ble
s
Oth
er
veg
eta
ble
s
Ro
ot
veg
eta
ble
s
Po
tato
Do
mesti
c f
ruit
Milk
Catt
le m
eat
Pig
meat
Sh
eep
meat
Po
ult
ry
Eg
gs
Wild
/fre
e f
oo
ds
Rab
bit
s
Wild
fu
ng
i
Fre
sh
wate
r fi
sh
Inte
rtid
al o
ccu
pan
cy o
ver
mu
d
Inte
rtid
al o
ccu
pan
cy o
ver
mu
d a
nd
san
d
Inte
rtid
al o
ccu
pan
cy o
ver
mu
d a
nd
sto
nes
Inte
rtid
al o
ccu
pan
cy o
ver
salt
mars
h
Inte
rtid
al o
ccu
pan
cy o
ver
san
d
Inte
rtid
al o
ccu
pan
cy o
ver
san
d a
nd
sto
nes
Inte
rtid
al o
ccu
pan
cy o
ver
bo
at
on
mu
d a
nd
san
d
Han
dlin
g f
ish
ing
gear
Han
dlin
g s
ed
imen
t
Occu
pan
cy in
clo
se p
roxim
ity
(<10m
) to
sew
ag
e
Occu
pan
cy in
clo
se p
roxim
ity
(<10m
) to
sew
ag
e s
lud
ge o
r
sew
ag
e c
ake
Occu
pan
cy in
wate
r
Occu
pan
cy o
n w
ate
r
Ind
oo
r o
ccu
pan
cy w
ith
in 1
km
of
the lic
en
sed
sit
e b
ou
nd
ary
Ou
tdo
or
occu
pan
cy w
ith
in 1
km
of
the lic
en
sed
sit
e
bo
un
dary
Annex 1. Adults' consumption rates (kg y-1
or l y-1
) and occupancy rates (h y-1
)
107 M U - - - - - 5.7 - - - - - - - - - - - - - - - - - - 199 - - - - - - - - - - -108 F U - - - - - 5.7 - - - - - - - - - - - - - - - - - - - - - - - - - - - - - -109 F U - - - - - 5.7 - - - - - - - - - - - - - - - - - - - - - - - - - - - - - -110 F U - - - - - 5.7 - - - - - - - - - - - - - - - - - - - - - - - - - - - - - -111 F U - - - - - 5.7 - - - - - - - - - - - - - - - - - - - - - - - - - - - - - -112 F U - - - - - 5.7 - - - - - - - - - - - - - - - - - - - - - - - - - - - - - -113 M U - - - - - - - - - - - - - - - - - - - - - - - - 52 - - - - - - - - - - -114 M U - - - - - - - - - - - - - - - - - - - - - - - - 52 - - - - - - - - - - -115 F 55 - - - - - - 3.1 - 0.9 1.8 - 262.1 - - 7.1 - - - - 0.2 - - - - - - - - - - - - - - - -116 M 59 - - - - - - 3.1 - 0.9 1.8 - 262.1 - - 7.1 - - - - 0.2 - - - - - - - - - - - - - - - -117 F 29 - - - - - - 3.1 - 0.9 1.8 - 262.1 - - 7.1 - - - - 0.2 - - - - - - - - - - - - - - - -118 F 26 - - - - - - 3.1 - 0.9 1.8 - 262.1 - - 7.1 - - - - 0.2 - - - - - - - - - - - - - - - -119 M 22 - - - - - - 3.1 - 0.9 1.8 - 262.1 - - 7.1 - - - - 0.2 - - - - - - - - - - - - - - - -120 M 24 - - - - - - 3.1 - 0.9 1.8 - 262.1 - - 7.1 - - - - 0.2 - - - - - - - - - - - - - - - -122 M 64 - - - - - - - - - - - 414.9 - - - - - - - - - - - - - - - - - - - - - - - -123 M 53 - - - - - - - - - - - 414.9 - - - - - - - - - - - - - - - - - - - - - - - -124 M 51 - - - - - - - - - - - - 23.7 - - - - - - - - - - - - - - - - - - - - - - -125 M 57 - - - - - - - - - - - - 23.7 - - - - - - - - - - - - - - - - - - - - - - -126 F 48 - - - - - - - - - - - - 23.7 - - - - - - - - - - - - - - - - - - - - - - -127 F 17 - - - - - - - - - - - - 23.7 - - - - - - - - - - - - - - - - - - - - - - -128 F 17 - - - - - - - - - - - - 23.7 - - - - - - - - - - - - - - - - - - - - - - -129 F 26 - - - - - - - - - - - - 23.7 - - - - - - - - - - - - - - - - - - - - - - -130 F 24 - - - - - - - - - - - - 23.7 - - - - - - - - - - - - - - - - - - - - - - -131 F 22 - - - - - - - - - - - - 23.7 - - - - - - - - - - - - - - - - - - - - - - -132 M 65 - - - 4.7 - - - - - - - - - - 11.3 0.7 17.8 - - - - - - - - - - - - - - - - - - -133 F 54 - - - 4.7 - - - - - - - - - - 11.3 0.7 17.8 - - - - - - - - - - - - - - - - - - -134 F 25 - - - 4.7 - - - - - - - - - - 11.3 0.7 41.6 - - - - - - - - - - - - - - - - - - -135 M 60 - - - - - - 18.4 42.8 35.4 - 23.5 - - - - 48.0 - - 9.0 - - - - - - - - - - - - - - - - -136 M 72 - - - - - - 30.1 - 14.6 16.4 - - - - - - - - - - - - - - - - - - - - - - - - - -137 F 68 - - - - - - 30.1 - 14.6 16.4 - - - - - - - - - - - - - - - - - - - - - - - - - -138 M 75 - - - - - - 29.3 9.4 33.2 - 6.8 - - - - - - - - - - - - - - - - - - - - - - - - -139 F 73 - - - - - - 29.3 9.4 33.2 - 6.8 - - - - - - - - - - - - - - - - - - - - - - - - -140 M 40 - - - - - - 4.8 1.7 5.5 - 1.1 - - - - - - - - - - - - - - - - - - - - - - - - -141 M 40 - - - - - - 4.8 1.7 5.5 - 1.1 - - - - - - - - - - - - - - - - - - - - - - - - -143 M 45 - - - - - - - - - - - - - - - - - - - - - - - - - - - - - - - - - 16 - -144 F 40 - - - - - - - - - - - - - - - - - - - - - - - - - - - - - - - - - 16 - -147 M 64 - - - - - - 12.8 29.7 4.0 32.6 26.7 - - - - - 17.8 - - - - - - - - - - - - - - - - - - -148 F 60 - - - - - - 12.8 29.7 4.0 32.6 26.7 - - - - - 17.8 - - - - - - - - - - - - - - - - - - -149 M 30 - - - - - - 3.2 7.4 1.0 8.2 0.9 - - - - - 3.5 - - - - - - - - - - - - - - - - - - -150 F 25 - - - - - - 3.2 7.4 1.0 8.2 0.9 - - - - - 3.5 - - - - - - - - - - - - - - - - - - -153 M 59 - - - - - - 4.8 18.9 25.7 - 19.5 - - - - - - - - - - - - - - - - - - - - - - - 6339 403154 M 57 - - - - - - 4.8 18.9 25.7 - 19.5 - - - - - - - - - - - - - - - - - - - - - - - 5830 1178155 F 29 - - - - - - 3.2 12.6 17.1 - 15.9 - - - - - - - - - - - - - - - - - - - - - - - - -156 M 26 - - - - - - 3.2 12.6 17.1 - 15.9 - - - - - - - - - - - - - - - - - - - - - - - - -

Ob
serv
ati
on
nu
mb
er
Sex
Ag
e (
years
)
Fis
h
Cru
sta
cean
s
Mo
llu
scs
Wild
fow
l
Mari
ne p
lan
ts/a
lgae
Salt
mars
h g
razed
sh
eep
Gre
en
veg
eta
ble
s
Oth
er
veg
eta
ble
s
Ro
ot
veg
eta
ble
s
Po
tato
Do
mesti
c f
ruit
Milk
Catt
le m
eat
Pig
meat
Sh
eep
meat
Po
ult
ry
Eg
gs
Wild
/fre
e f
oo
ds
Rab
bit
s
Wild
fu
ng
i
Fre
sh
wate
r fi
sh
Inte
rtid
al o
ccu
pan
cy o
ver
mu
d
Inte
rtid
al o
ccu
pan
cy o
ver
mu
d a
nd
san
d
Inte
rtid
al o
ccu
pan
cy o
ver
mu
d a
nd
sto
nes
Inte
rtid
al o
ccu
pan
cy o
ver
salt
mars
h
Inte
rtid
al o
ccu
pan
cy o
ver
san
d
Inte
rtid
al o
ccu
pan
cy o
ver
san
d a
nd
sto
nes
Inte
rtid
al o
ccu
pan
cy o
ver
bo
at
on
mu
d a
nd
san
d
Han
dlin
g f
ish
ing
gear
Han
dlin
g s
ed
imen
t
Occu
pan
cy in
clo
se p
roxim
ity
(<10m
) to
sew
ag
e
Occu
pan
cy in
clo
se p
roxim
ity
(<10m
) to
sew
ag
e s
lud
ge o
r
sew
ag
e c
ake
Occu
pan
cy in
wate
r
Occu
pan
cy o
n w
ate
r
Ind
oo
r o
ccu
pan
cy w
ith
in 1
km
of
the lic
en
sed
sit
e b
ou
nd
ary
Ou
tdo
or
occu
pan
cy w
ith
in 1
km
of
the lic
en
sed
sit
e
bo
un
dary
Annex 1. Adults' consumption rates (kg y-1
or l y-1
) and occupancy rates (h y-1
)
157 M 34 0.9 - - 19.3 - - - - - - - - - - - - - - - - - 36 - - 5 - 240 - - 36 - - - - - -158 M 32 - - - 17.3 - - - - - - - - - - - - - - - - - - - - - - - - - - - - - - - -161 F 39 - - - - - - 5.9 8.0 2.2 - 0.2 - - - - - 59.3 - - - - - - - - - - - - - - - - - - -163 M 53 - - - - - - 5.9 8.0 2.2 - 0.2 - - - - - - - - - - - - - - - - - - - - - - - - -164 M 49 - - - - - - 5.9 8.0 2.2 - 0.2 - - - - - - - - - - - - - - - - - - - - - - - - -165 M 66 - - - - - - 8.2 9.0 24.6 23.2 - - - - - - - - - - - - - - - - - - - - - - - - 4816 3039166 F 56 - - - - - - 8.2 9.0 24.6 23.2 - - - - - - - - - - - - - - - - - - - - - - - - 5418 2156167 M 49 - - - - - - 10.9 20.1 30.4 24.5 10.5 - - - - - 17.8 - - - - - - - - - - - - - - - - - - -168 F 49 - - - - - - 10.9 20.1 30.4 24.5 10.5 - - - - - 17.8 - - - - - - - - - - - - - - - - - - -169 M 66 - - - - - - 10.9 20.1 30.4 24.5 10.5 - - - - - 8.9 - - - - - - - - - - - - - - - - - - -170 F 75 - - - - - - 10.9 20.1 30.4 24.5 10.5 - - - - - 8.9 - - - - - - - - - - - - - - - - - - -171 M 58 1.7 - 0.4 - - - 7.0 7.7 13.0 5.1 0.6 - - - - 1.4 - 0.8 - - - - - - - 9 - - - 9 - - - - - -172 F 59 1.7 - 0.4 - - - 7.0 7.7 13.0 5.1 0.6 - - - - 1.4 - 0.8 - - - - - - - - - - - - - - - - - -173 F 37 - - 0.1 - - - 1.4 1.5 2.6 1.0 0.1 - - - - 0.4 - - - - - - - - - - - - - - - - - - - -174 M 40 - - 0.1 - - - 1.4 1.5 2.6 1.0 0.1 - - - - 0.4 - - - - - - - - - - - - - - - - - - - -177 M 26 - - - - - - - - - - - - - - - - - - - - - - - - - - 616 - - - - - - - - -178 M 17 - - - - - - - - - - - - - - - - - - - - - - - - - - 616 - - - - - - - - -179 F 56 - - - - - - 7.7 26.7 8.8 10.2 10.7 - - - - - 20.1 1.1 - - - - - - - - - - - - - - - - - -180 M 24 - - - - - - 7.7 26.7 8.8 10.2 10.7 - - - - - 25.1 1.1 - - - - - - - - - - - - - - - - - -181 M 63 - - - - - - 0.9 3.0 1.6 1.1 7.5 - - - - - 15.0 0.5 - - - - - - - - - - - - - - - - - -182 M 64 - - - - - - - - 11.9 54.5 0.5 - - - - - - 1.8 - - - - - - - - - - - - - - - - - -183 M 64 - - - - - - - - 4.0 18.2 - - - - - - - - - - - - - - - - - - - - - - - - - -184 M 78 - - - - - - - 13.5 32.9 8.2 4.1 - - - - - - - - - - - - - - - - - - - - - - - - -185 F 70 - - - - - - - 27.0 32.9 8.2 4.1 - - - - - - - - - - - - - - - - - - - - - - - - -186 M 66 - - - - - - 1.3 1.0 3.8 5.6 - - - - - - - - - - - - - - - - - - - - - - - - - -187 F 60 - - - - - - 1.3 1.0 3.8 5.6 - - - - - - - - - - - - - - - - - - - - - - - - - -188 M 62 - - - - - - - 7.5 14.5 27.2 0.5 - - - - - 13.3 - - 0.2 - - - - - - - - - - - - - - - -189 M 62 - - - - - - 15.7 12.8 34.7 20.5 - - - - - - - - - - - - - - - - - - - - - - - - - -190 F 59 - - - - - - 15.7 12.8 34.7 20.5 - - - - - - - - - - - - - - - - - - - - - - - - - -191 M 62 - - - - - - 15.9 29.2 4.4 - 6.4 - - - - - - - - - - - - - - - - - - - - - - - - -192 F 62 - - - - - - 15.9 29.2 4.4 - 6.4 - - - - - - - - - - - - - - - - - - - - - - - - -193 F 35 - - - - - - 15.9 29.2 4.4 - 5.7 - - - - - - - - - - - - - - - - - - - - - - - - -194 M 40 - - - - - - 15.9 29.2 4.4 - 5.7 - - - - - - - - - - - - - - - - - - - - - - - - -195 M 65 - - - - - - 9.1 6.8 15.5 - - - - - - - - - - - - - - - - - - - - - - - - - - -196 F 65 - - - - - - 9.1 6.8 15.5 - - - - - - - - - - - - - - - - - - - - - - - - - - -197 M 74 - - - - - - 1.9 29.8 23.1 22.8 5.8 - - - - - - - - - - - - - - - - - - - - - - - - -198 F 70 - - - - - - 1.9 29.8 23.1 22.8 5.8 - - - - - - - - - - - - - - - - - - - - - - - - -199 M 45 - - - - - - 0.4 11.4 6.0 4.6 1.2 - - - - - - - - - - - - - - - - - - - - - - - - -200 F 45 - - - - - - 0.4 11.4 6.0 4.6 1.2 - - - - - - - - - - - - - - - - - - - - - - - - -201 M 18 - - - - - - 0.4 11.4 6.0 4.6 1.2 - - - - - - - - - - - - - - - - - - - - - - - - -202 M 20 - - - - - - 0.4 11.4 6.0 4.6 1.2 - - - - - - - - - - - - - - - - - - - - - - - - -203 M 68 - - - - - - 12.3 15.7 12.3 18.2 10.2 - - - - - 11.0 - - - - - - - - - - - - - - - - - - -204 F 65 - - - - - - 12.3 15.7 12.3 18.2 10.2 - - - - - 11.0 - - - - - - - - - - - - - - - - - - -205 M 40 - - - - - - 6.1 7.9 6.2 9.1 8.8 - - - - - 5.5 - - - - - - - - - - - - - - - - - - -

Ob
serv
ati
on
nu
mb
er
Sex
Ag
e (
years
)
Fis
h
Cru
sta
cean
s
Mo
llu
scs
Wild
fow
l
Mari
ne p
lan
ts/a
lgae
Salt
mars
h g
razed
sh
eep
Gre
en
veg
eta
ble
s
Oth
er
veg
eta
ble
s
Ro
ot
veg
eta
ble
s
Po
tato
Do
mesti
c f
ruit
Milk
Catt
le m
eat
Pig
meat
Sh
eep
meat
Po
ult
ry
Eg
gs
Wild
/fre
e f
oo
ds
Rab
bit
s
Wild
fu
ng
i
Fre
sh
wate
r fi
sh
Inte
rtid
al o
ccu
pan
cy o
ver
mu
d
Inte
rtid
al o
ccu
pan
cy o
ver
mu
d a
nd
san
d
Inte
rtid
al o
ccu
pan
cy o
ver
mu
d a
nd
sto
nes
Inte
rtid
al o
ccu
pan
cy o
ver
salt
mars
h
Inte
rtid
al o
ccu
pan
cy o
ver
san
d
Inte
rtid
al o
ccu
pan
cy o
ver
san
d a
nd
sto
nes
Inte
rtid
al o
ccu
pan
cy o
ver
bo
at
on
mu
d a
nd
san
d
Han
dlin
g f
ish
ing
gear
Han
dlin
g s
ed
imen
t
Occu
pan
cy in
clo
se p
roxim
ity
(<10m
) to
sew
ag
e
Occu
pan
cy in
clo
se p
roxim
ity
(<10m
) to
sew
ag
e s
lud
ge o
r
sew
ag
e c
ake
Occu
pan
cy in
wate
r
Occu
pan
cy o
n w
ate
r
Ind
oo
r o
ccu
pan
cy w
ith
in 1
km
of
the lic
en
sed
sit
e b
ou
nd
ary
Ou
tdo
or
occu
pan
cy w
ith
in 1
km
of
the lic
en
sed
sit
e
bo
un
dary
Annex 1. Adults' consumption rates (kg y-1
or l y-1
) and occupancy rates (h y-1
)
206 F 40 - - - - - - 6.1 7.9 6.2 9.1 6.9 - - - - - 5.5 - - - - - - - - - - - - - - - - - - -207 M 17 - - - - - - 6.1 7.9 6.2 9.1 3.2 - - - - - 5.5 - - - - - - - - - - - - - - - - - - -209 M 66 - - - - - - 10.5 6.0 23.1 25.5 1.2 - - - - - 15.0 - - - - - - - - - - - - - - - - - - -210 F 54 - - - - - - 10.5 6.0 23.1 25.5 1.2 - - - - - 15.0 - - - - - - - - - - - - - - - - - - -211 M 43 - - - - - - 7.0 4.0 12.5 17.0 - - - - - - 1.7 - - - - - - - - - - - - - - - - - - -212 F 42 - - - - - - 7.0 4.0 12.5 17.0 - - - - - - 1.7 - - - - - - - - - - - - - - - - - - -214 M 63 - - - - - - 15.3 5.4 7.6 10.1 0.8 - - - - - - - - - - - - - - 142 - - - 76 - - - 28 - -215 F 61 - - - - - - 15.3 5.4 7.6 10.1 0.8 - - - - - - - - - - - - - - 334 - - - 76 - - - 28 - -216 F 42 - - - - - - 15.3 5.4 7.6 10.1 - - - - - - - - - - - - - - - - - - - - - - - - - -218 M 41 - - - - - - 2.3 4.9 31.1 21.8 0.9 - - - - - 8.9 - - - - - - - - - - - - - - - - - - -219 F 42 - - - - - - 2.3 4.9 31.1 21.8 - - - - - - 8.9 - - - - - - - - - - - - - - - - - - -220 M 70 - - - - - - 2.3 4.9 31.1 21.8 - - - - - - 17.8 - - - - - - - - - - - - - - - - - - -221 M 39 - - - - - - 1.7 3.7 23.3 16.3 - - - - - - 8.9 - - - - - - - - - - - - - - - - - - -222 F 37 - - - - - - 1.7 3.7 23.3 16.3 - - - - - - 8.9 - - - - - - - - - - - - - - - - - - -225 M 57 - - - - - - - 22.2 30.8 3.3 6.3 - - - - - - - - - - - - - - - - - - - - - - - - -226 F 50 - - - - - - - 22.2 30.8 3.3 6.3 - - - - - - - - - - - - - - - - - - - - - - - - -227 M 30 - - - - - - - 3.0 4.1 0.4 0.8 - - - - - - - - - - - - - - - - - - - - - - - - -228 F 28 - - - - - - - 3.0 4.1 0.4 0.8 - - - - - - - - - - - - - - - - - - - - - - - - -230 M 74 - - - - - - - 13.3 18.5 2.0 3.8 - - - - - - - - - - - - - - - - - - - - - - - - -231 F 70 - - - - - - - 13.3 18.5 2.0 3.8 - - - - - - - - - - - - - - - - - - - - - - - - -232 M 57 2.2 1.1 - - - - 18.8 21.1 37.3 40.3 - - - - - - - - - 0.5 - - - - - - 24 - - 24 - - - 120 - -233 F 57 2.2 1.1 - - - - 18.8 21.1 37.3 40.3 - - - - - - - - - 0.5 - - - - - - - - - - - - - - - -234 F 35 - - - - - - 2.1 2.3 4.4 3.4 - - - - - - - - - - - - - - - - - - - - - - - - - -235 M 40 - - - - - - 2.1 2.3 4.4 3.4 - - - - - - - - - - - - - - - - - - - - - - - - - -238 M 61 - - - - - - - - - - - - - - - - - - - - - - - - - - 24 - - 24 - - - 120 - -239 M 63 - - - - - - - 14.4 - 32.5 - - - - - - 14.0 - - - - - - - - - - - - - - - - - - -241 M 50 - - - - - - - - - - - - - - - - - - - - - - - - - - 48 - - - - - - - - -242 F 63 0.5 - - - - - - - - - - - - - - - - - - - - - - - - 1288 - - - - - - - - - -243 F 42 0.5 - - - - - - - - - - - - - - - - - - - - - - - - 1288 - - - - - - - - - -244 M 40 0.5 - - - - - - - - - - - - - - - - - - - - - - - - - - - - - - - - 42 - -245 M 33 - - - - - - - - - - - - - - - - - - - - - - - - - - - - - - - - - 42 - -246 M 38 - - - - - - - - - - - - - - - - - - - - - - - - - - - - - - - - - 42 - -247 M 30 - - - - - - - - - - - - - - - - - - - - - - - - - - - - - - - - - 42 - -248 M 19 0.5 - - - - - - - - - - - - - - - - - - - - - - 48 - 45 40 - - 93 - - - - - -249 M 68 1.3 - 0.3 - 0.9 - - - - - - - - - - - - - - - - - - - 1 5 - - 3 2 - - - 32 - -250 F 65 1.3 - 0.3 - - - - - - - - - - - - - - - - - - - - - - - - - - - - - - - - -251 M 49 - - - - - - - - - - - - - - - - - - - - - - - - - - - - - - - - - - 7772 572252 F 42 - - - - - - - - - - - - - - - - - - - - - - - - - - - - - - - - - - 7772 572253 F 42 - - - - - - - - - - - - - - - - - - - - - - - - - - - - - - - - - - 7564 468254 F 70 - - - - - - - - - - - - - - - - - - - - - - - - - - - - - - - - - - 8612 100255 M 72 - - - - - - - - - - - - - - - - - - - - - - - - - - - - - - - - - - 8264 400256 M 46 15.0 - - - - - - - - - - - - - - - - - - - - - - - - - 515 - - - - - - 400 7446 274257 F 50 15.0 - - - - - - - - - - - - - - - - - - - - - - - - - - - - - - - - - 8291 365258 M 17 15.0 - - - - - - - - - - - - - - - - - - - - - - - - - - - - - - - - - 6028 912

Ob
serv
ati
on
nu
mb
er
Sex
Ag
e (
years
)
Fis
h
Cru
sta
cean
s
Mo
llu
scs
Wild
fow
l
Mari
ne p
lan
ts/a
lgae
Salt
mars
h g
razed
sh
eep
Gre
en
veg
eta
ble
s
Oth
er
veg
eta
ble
s
Ro
ot
veg
eta
ble
s
Po
tato
Do
mesti
c f
ruit
Milk
Catt
le m
eat
Pig
meat
Sh
eep
meat
Po
ult
ry
Eg
gs
Wild
/fre
e f
oo
ds
Rab
bit
s
Wild
fu
ng
i
Fre
sh
wate
r fi
sh
Inte
rtid
al o
ccu
pan
cy o
ver
mu
d
Inte
rtid
al o
ccu
pan
cy o
ver
mu
d a
nd
san
d
Inte
rtid
al o
ccu
pan
cy o
ver
mu
d a
nd
sto
nes
Inte
rtid
al o
ccu
pan
cy o
ver
salt
mars
h
Inte
rtid
al o
ccu
pan
cy o
ver
san
d
Inte
rtid
al o
ccu
pan
cy o
ver
san
d a
nd
sto
nes
Inte
rtid
al o
ccu
pan
cy o
ver
bo
at
on
mu
d a
nd
san
d
Han
dlin
g f
ish
ing
gear
Han
dlin
g s
ed
imen
t
Occu
pan
cy in
clo
se p
roxim
ity
(<10m
) to
sew
ag
e
Occu
pan
cy in
clo
se p
roxim
ity
(<10m
) to
sew
ag
e s
lud
ge o
r
sew
ag
e c
ake
Occu
pan
cy in
wate
r
Occu
pan
cy o
n w
ate
r
Ind
oo
r o
ccu
pan
cy w
ith
in 1
km
of
the lic
en
sed
sit
e b
ou
nd
ary
Ou
tdo
or
occu
pan
cy w
ith
in 1
km
of
the lic
en
sed
sit
e
bo
un
dary
Annex 1. Adults' consumption rates (kg y-1
or l y-1
) and occupancy rates (h y-1
)
259 F 19 15.0 - - - - - - - - - - - - - - - - - - - - - - - - - - - - - - - - - 8369 365260 M 59 - - - - - - - - - - - - - - - - - - - - - - - - - - - - - - - - - - 7674 700261 F 58 - - - - - - - - - - - - - - - - - - - - - - - - - - - - - - - - - - 8049 350262 M 68 - - - - - - - - - - - - - - - - 0.7 - - - - - - - 12 - 100 - - - - - - - 7449 375263 F 64 - - - - - - - - - - - - - - - - 0.7 - - - - - - - 12 - 100 - - - - - - - 7449 375264 F 67 - - - - - - - - - - - - - - - - 17.8 - - - - - - - - - - - - - - - - - 7970 780267 F 79 - - - - - - - - - - - - - - - - - - - - - - - - - - - - - - - - - - 7878 546268 M 30 - - - - - - - - - - - - - - - - 4.4 - - - - - - - - - 52 - - - - - - - 6470 730269 F 24 - - - - - - - - - - - - - - - - 4.4 - - - - - - - - - 52 - - - - - - - 7926 730273 F 51 - - - - - - - - - - - - - - - - - - - - - - - 20 - 625 250 - - 145 - - - - - -274 M 79 5.9 - - - - - - - - - - - - - - - - - - - - - - - - - - - - - - - - - - -275 F 80 5.9 - - - - - - - - - - - - - - - - - - - - - - - - - - - - - - - - - - -276 F 82 5.9 - - - - - - - - - - - - - - - - - - - - - - - - - - - - - - - - - - -277 M 40 - - - - - - - - - - - - - - - - - - - - - - - - - 250 100 - - 50 - - - - - -278 M 31 14.7 - - - - - - - - - - - - - - - - - - - - - - 12 - 175 300 - - 87 - - - - - -279 F 30 14.7 - - - - - - - - - - - - - - - - - - - - - - - - - - - - - - - - - - -282 M 43 - - - - - - - - - - - - - - - - - - - - - - - - - 50 300 - - 50 - - - - - -283 F 58 - - - - - - - - - - - - - - - - - - - - - - - - - - 26 - - - - - - - - -285 F 46 - - - - - - - - - - - - - - - - - - - - - - - - - - 104 - - - - - - - - -286 M 42 - - - - - - - - - - - - - - - - - - - - - - - - - - 520 - - - - - - - - -287 M 49 7.3 - - - - - - - - - - - - - - - - - - - - - - - - 250 600 - - 100 - - - - - -288 M 41 - - - - - - - - - - - - - - - - - - - - - - - - - 220 50 - - - - - 110 - - -291 F 41 - - - - - - - - - - - - - - - - - - - - - - - - - 285 65 - - - - - 30 - - -292 M 36 - - 1.6 - - - - - - - - - - - - - - - - - - - - - - - 78 - - 26 - - - - - -293 F 34 - - 1.6 - - - - - - - - - - - - - - - - - - - - - - - - - - - - - - - - -296 F 62 - - - - - - - - - - - - - - - - - - - - - - - - - 1460 - - - - - - - - - -298 M 44 5.0 - - - - - - - - - - - - - - - - - - - - - - - - - - - - - - - - - - -299 F 40 5.0 - - - - - - - - - - - - - - - - - - - - - - - - - - - - - - - - - - -300 M 27 - - - - - - - - - - - - - - - - - - - - - - - - - 24 - - - 24 - - - - - -301 M 28 - - - - - - - - - - - - - - - - - - - - - - - - - 24 - - - 24 - - - - - -302 M 32 - - - - - - - - - - - - - - - - - - - - - - - - - 130 - - - - - - - - - -303 F 30 - - - - - - - - - - - - - - - - - - - - - - - - - 130 - - - - - - - - - -304 F 39 - - - - - - - - - - - - - - - - - - - - - - - - - 400 - - - - - - - - - -305 F 60 - - - - - - - - - - - - - - - - - - - - - - - - - 400 - - - - - - - - - -306 F 38 - - - - - - - - - - - - - - - - - - - - - - - - - 120 - - - - - - - - - -309 M 39 - - - - - - - - - - - - - - - - - - - - - - - - - 60 - - - - - - - - - -310 F 26 - - - - - - - - - - - - - - - - - - - - - - - - - 182 - - - - - - - - - -311 F 27 - - - - - - - - - - - - - - - - - - - - - - - - - 78 - - - - - - - - - -312 F 31 - - - - - - - - - - - - - - - - - - - - - - - - - 183 - - - - - - - - - -314 F 35 - - - - - - - - - - - - - - - - - - - - - - - - - 198 - - - - - - - 33 - -317 M 37 - - - - - - - - - - - - - - - - - - - - - - - - - 156 - - - - - - - - - -318 M 50 - - - - - - - - - - - - - - - - - - - - - - - - - - - - - - - - 56 - - -319 M 18 - - - - - - - - - - - - - - - - - - - - - - - - - - - - - - - - 56 - - -321 M 22 5.7 - - - - - - - - - - - - - - - - - - - - - - - - 50 300 - - 50 - - - - - -
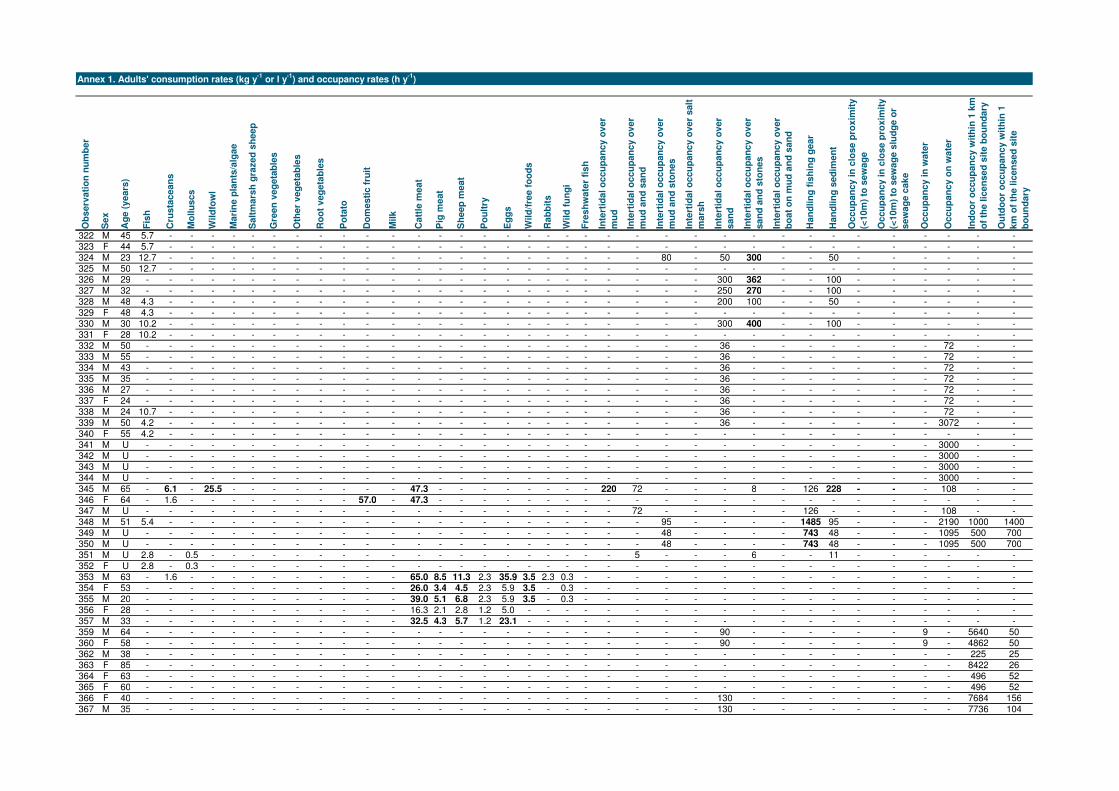
Ob
serv
ati
on
nu
mb
er
Sex
Ag
e (
years
)
Fis
h
Cru
sta
cean
s
Mo
llu
scs
Wild
fow
l
Mari
ne p
lan
ts/a
lgae
Salt
mars
h g
razed
sh
eep
Gre
en
veg
eta
ble
s
Oth
er
veg
eta
ble
s
Ro
ot
veg
eta
ble
s
Po
tato
Do
mesti
c f
ruit
Milk
Catt
le m
eat
Pig
meat
Sh
eep
meat
Po
ult
ry
Eg
gs
Wild
/fre
e f
oo
ds
Rab
bit
s
Wild
fu
ng
i
Fre
sh
wate
r fi
sh
Inte
rtid
al o
ccu
pan
cy o
ver
mu
d
Inte
rtid
al o
ccu
pan
cy o
ver
mu
d a
nd
san
d
Inte
rtid
al o
ccu
pan
cy o
ver
mu
d a
nd
sto
nes
Inte
rtid
al o
ccu
pan
cy o
ver
salt
mars
h
Inte
rtid
al o
ccu
pan
cy o
ver
san
d
Inte
rtid
al o
ccu
pan
cy o
ver
san
d a
nd
sto
nes
Inte
rtid
al o
ccu
pan
cy o
ver
bo
at
on
mu
d a
nd
san
d
Han
dlin
g f
ish
ing
gear
Han
dlin
g s
ed
imen
t
Occu
pan
cy in
clo
se p
roxim
ity
(<10m
) to
sew
ag
e
Occu
pan
cy in
clo
se p
roxim
ity
(<10m
) to
sew
ag
e s
lud
ge o
r
sew
ag
e c
ake
Occu
pan
cy in
wate
r
Occu
pan
cy o
n w
ate
r
Ind
oo
r o
ccu
pan
cy w
ith
in 1
km
of
the lic
en
sed
sit
e b
ou
nd
ary
Ou
tdo
or
occu
pan
cy w
ith
in 1
km
of
the lic
en
sed
sit
e
bo
un
dary
Annex 1. Adults' consumption rates (kg y-1
or l y-1
) and occupancy rates (h y-1
)
322 M 45 5.7 - - - - - - - - - - - - - - - - - - - - - - - - - - - - - - - - - - -323 F 44 5.7 - - - - - - - - - - - - - - - - - - - - - - - - - - - - - - - - - - -324 M 23 12.7 - - - - - - - - - - - - - - - - - - - - - - 80 - 50 300 - - 50 - - - - - -325 M 50 12.7 - - - - - - - - - - - - - - - - - - - - - - - - - - - - - - - - - - -326 M 29 - - - - - - - - - - - - - - - - - - - - - - - - - 300 362 - - 100 - - - - - -327 M 32 - - - - - - - - - - - - - - - - - - - - - - - - - 250 270 - - 100 - - - - - -328 M 48 4.3 - - - - - - - - - - - - - - - - - - - - - - - - 200 100 - - 50 - - - - - -329 F 48 4.3 - - - - - - - - - - - - - - - - - - - - - - - - - - - - - - - - - - -330 M 30 10.2 - - - - - - - - - - - - - - - - - - - - - - - - 300 400 - - 100 - - - - - -331 F 28 10.2 - - - - - - - - - - - - - - - - - - - - - - - - - - - - - - - - - - -332 M 50 - - - - - - - - - - - - - - - - - - - - - - - - - 36 - - - - - - - 72 - -333 M 55 - - - - - - - - - - - - - - - - - - - - - - - - - 36 - - - - - - - 72 - -334 M 43 - - - - - - - - - - - - - - - - - - - - - - - - - 36 - - - - - - - 72 - -335 M 35 - - - - - - - - - - - - - - - - - - - - - - - - - 36 - - - - - - - 72 - -336 M 27 - - - - - - - - - - - - - - - - - - - - - - - - - 36 - - - - - - - 72 - -337 F 24 - - - - - - - - - - - - - - - - - - - - - - - - - 36 - - - - - - - 72 - -338 M 24 10.7 - - - - - - - - - - - - - - - - - - - - - - - - 36 - - - - - - - 72 - -339 M 50 4.2 - - - - - - - - - - - - - - - - - - - - - - - - 36 - - - - - - - 3072 - -340 F 55 4.2 - - - - - - - - - - - - - - - - - - - - - - - - - - - - - - - - - - -341 M U - - - - - - - - - - - - - - - - - - - - - - - - - - - - - - - - - 3000 - -342 M U - - - - - - - - - - - - - - - - - - - - - - - - - - - - - - - - - 3000 - -343 M U - - - - - - - - - - - - - - - - - - - - - - - - - - - - - - - - - 3000 - -344 M U - - - - - - - - - - - - - - - - - - - - - - - - - - - - - - - - - 3000 - -345 M 65 - 6.1 - 25.5 - - - - - - - - 47.3 - - - - - - - - 220 72 - - - 8 - 126 228 - - - 108 - -346 F 64 - 1.6 - - - - - - - - 57.0 - 47.3 - - - - - - - - - - - - - - - - - - - - - - -347 M U - - - - - - - - - - - - - - - - - - - - - - 72 - - - - - 126 - - - - 108 - -348 M 51 5.4 - - - - - - - - - - - - - - - - - - - - - - 95 - - - - 1485 95 - - - 2190 1000 1400349 M U - - - - - - - - - - - - - - - - - - - - - - - 48 - - - - 743 48 - - - 1095 500 700350 M U - - - - - - - - - - - - - - - - - - - - - - - 48 - - - - 743 48 - - - 1095 500 700351 M U 2.8 - 0.5 - - - - - - - - - - - - - - - - - - - 5 - - - 6 - - 11 - - - - - -352 F U 2.8 - 0.3 - - - - - - - - - - - - - - - - - - - - - - - - - - - - - - - - -353 M 63 - 1.6 - - - - - - - - - - 65.0 8.5 11.3 2.3 35.9 3.5 2.3 0.3 - - - - - - - - - - - - - - - -354 F 53 - - - - - - - - - - - - 26.0 3.4 4.5 2.3 5.9 3.5 - 0.3 - - - - - - - - - - - - - - - -355 M 20 - - - - - - - - - - - - 39.0 5.1 6.8 2.3 5.9 3.5 - 0.3 - - - - - - - - - - - - - - - -356 F 28 - - - - - - - - - - - - 16.3 2.1 2.8 1.2 5.0 - - - - - - - - - - - - - - - - - - -357 M 33 - - - - - - - - - - - - 32.5 4.3 5.7 1.2 23.1 - - - - - - - - - - - - - - - - - - -359 M 64 - - - - - - - - - - - - - - - - - - - - - - - - - 90 - - - - - - 9 - 5640 50360 F 58 - - - - - - - - - - - - - - - - - - - - - - - - - 90 - - - - - - 9 - 4862 50362 M 38 - - - - - - - - - - - - - - - - - - - - - - - - - - - - - - - - - - 225 25363 F 85 - - - - - - - - - - - - - - - - - - - - - - - - - - - - - - - - - - 8422 26364 F 63 - - - - - - - - - - - - - - - - - - - - - - - - - - - - - - - - - - 496 52365 F 60 - - - - - - - - - - - - - - - - - - - - - - - - - - - - - - - - - - 496 52366 F 40 - - - - - - - - - - - - - - - - - - - - - - - - - 130 - - - - - - - - 7684 156367 M 35 - - - - - - - - - - - - - - - - - - - - - - - - - 130 - - - - - - - - 7736 104

Ob
serv
ati
on
nu
mb
er
Sex
Ag
e (
years
)
Fis
h
Cru
sta
cean
s
Mo
llu
scs
Wild
fow
l
Mari
ne p
lan
ts/a
lgae
Salt
mars
h g
razed
sh
eep
Gre
en
veg
eta
ble
s
Oth
er
veg
eta
ble
s
Ro
ot
veg
eta
ble
s
Po
tato
Do
mesti
c f
ruit
Milk
Catt
le m
eat
Pig
meat
Sh
eep
meat
Po
ult
ry
Eg
gs
Wild
/fre
e f
oo
ds
Rab
bit
s
Wild
fu
ng
i
Fre
sh
wate
r fi
sh
Inte
rtid
al o
ccu
pan
cy o
ver
mu
d
Inte
rtid
al o
ccu
pan
cy o
ver
mu
d a
nd
san
d
Inte
rtid
al o
ccu
pan
cy o
ver
mu
d a
nd
sto
nes
Inte
rtid
al o
ccu
pan
cy o
ver
salt
mars
h
Inte
rtid
al o
ccu
pan
cy o
ver
san
d
Inte
rtid
al o
ccu
pan
cy o
ver
san
d a
nd
sto
nes
Inte
rtid
al o
ccu
pan
cy o
ver
bo
at
on
mu
d a
nd
san
d
Han
dlin
g f
ish
ing
gear
Han
dlin
g s
ed
imen
t
Occu
pan
cy in
clo
se p
roxim
ity
(<10m
) to
sew
ag
e
Occu
pan
cy in
clo
se p
roxim
ity
(<10m
) to
sew
ag
e s
lud
ge o
r
sew
ag
e c
ake
Occu
pan
cy in
wate
r
Occu
pan
cy o
n w
ate
r
Ind
oo
r o
ccu
pan
cy w
ith
in 1
km
of
the lic
en
sed
sit
e b
ou
nd
ary
Ou
tdo
or
occu
pan
cy w
ith
in 1
km
of
the lic
en
sed
sit
e
bo
un
dary
Annex 1. Adults' consumption rates (kg y-1
or l y-1
) and occupancy rates (h y-1
)
368 M 18 - - - - - - - - - - - - - - - - - - - - - - - - - - - - - - - - - - 7708 260370 M 31 - - - - - - - - - - - - - - - - - - - - - - - - - - - - - - - - - - 7896 312371 F 28 - - - - - - - - - - - - - - - - - - - - - - - - - - - - - - - - - - 7896 312372 M 58 - - - - - - - - - - - - - - - - - - - - - - - - - 548 - - - - - - - - - -374 M 46 - - - - - - - - - - - - - - - - - - - - - - - - - 66 - - - - - - - - - -375 M 61 - - - - - - - - - - - - - - - - - - - - - - - - - 365 - - - - - - - - - -376 F 59 - - - - - - - - - - - - - - - - - - - - - - - - - 365 - - - - - - - - - -377 M 47 - - - - - - - - - - - - - - - - - - - - - - - - - 195 - - - - - - - - - -378 M 66 - - - - - - - - - - - - - - - - - - - - - - - - - 335 - - - - - - - - - -379 F 67 - - - - - - - - - - - - - - - - - - - - - - - - - 335 - - - - - - - - - -380 M 25 4.1 - - - - - - - - - - - - - - - - - - - - - - - - 13 39 - - 13 - - - - - -381 M 25 4.1 - - - - - - - - - - - - - - - - - - - - - - - - 13 39 - - 13 - - - - - -382 M 27 4.1 - - - - - - - - - - - - - - - - - - - - - - - - 13 39 - - 13 - - - - - -383 M 32 - - - - - - - - - - - - - - - - - - - - - - - - - - 52 - - - - - - - - -384 M 26 - - - - - - - - - - - - - - - - - - - - - - - - - - - - - - - - 60 - - -385 M 23 - - - - - - - - - - - - - - - - - - - - - - - - - - - - - - - - 60 - - -386 M 27 - - - - - - - - - - - - - - - - - - - - - - - - - - - - - - - - 60 - - -387 F 70 - - - - - - - - - - - - - - - - - - - - - - - - - 104 - - - - - - - - - -388 M 74 - - - - - - - - - - - - - - - - - - - - - - - - - 104 - - - - - - - - - -389 M 66 - - - - - - - - - - - - - - - - - - - - - - - - - 160 - - - - - - - - - -390 M 55 - - - - - - - - - - - - - - - - - - - - - - - - - 365 - - - - - - - - - -391 F 55 - - - - - - - - - - - - - - - - - - - - - - - - - 365 - - - - - - - - - -392 M 66 3.3 - - - - - - - - - - - - - - - - - - - - - - - - - - - - - - - - 78 - -393 M 60 3.3 - - - - - - - - - - - - - - - - - - - - - - - - - - - - - - - - 78 - -394 M 38 - - - - - - - - - - - - - - - - - - - - - - - - - 156 - - - - - - - - - -395 F 43 - - - - - - - - - - - - - - - - - - - - - - - - - 156 - - - - - - - - - -396 M 38 4.1 - - - - - - - - - - - - - - - - - - - - - - - - 5 - - - - - - - 40 - -397 M 40 - - - - - - - - - - - - - - - - - - - - - - - - - - - - - - - - 44 - - 33398 M 25 - - - - - - - - - - - - - - - - - - - - - - - - - - - - - - - - 33 - - 25399 F 25 - - - - - - - - - - - - - - - - - - - - - - - - - - - - - - - - 33 - - 25400 M 25 - - - - - - - - - - - - - - - - - - - - - - - - - - - - - - - - 55 - - 41401 M 34 - - - - - - - - - - - - - - - - - - - - - - - - - - - - - - - - 55 - - 41402 M 36 - - - - - - - - - - - - - - - - - - - - - - - - - - - - - - - - 55 - - 41405 M 57 5.5 - - - - - - - - - - - - - - - - - - - - - - - - - - - - - - - - 143 - -406 M 58 5.5 - - - - - - - - - - - - - - - - - - - - - - - - - - - - - - - - 143 - -407 F 30 - - - - - - - - - - - - - - - - - - - - - - - - - 60 - - - - - - 9 - - -410 M 44 13.7 - - - - - - - - - - - - - - - - - - - - - - - - 130 234 - - 130 - - - - - -411 M 17 3.1 - - - - - - - - - - - - - - - - - - - - - - - - 26 91 - - 26 - - - - - -412 M 17 3.1 - - - - - - - - - - - - - - - - - - - - - - - - 26 91 - - 26 - - - - - -413 M 30 - - - - - - - - - - - - - - - - - - - - - - - - - 149 - - - - - - 21 - - -414 F 30 - - - - - - - - - - - - - - - - - - - - - - - - - 149 - - - - - - 21 - - -417 F 66 - - - - - - - - - - - - - - - - - - - - - - - - - - - - - - - - - - 5840 602418 F 65 - - - - - - - - - - - - - - - - - - - - - - - - - - - - - - - - - - 280 28419 M U - - - - - - - - - - - - - - - - - - - - - - - - - - - - - - - - - - 280 28
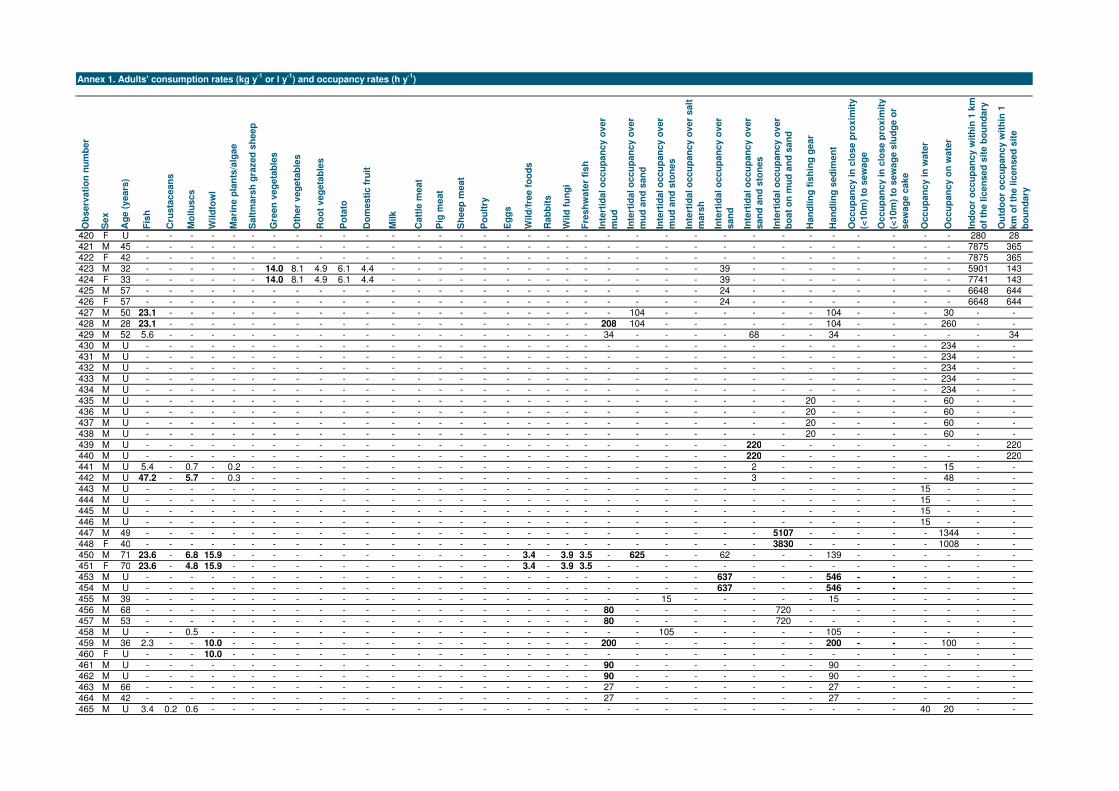
Ob
serv
ati
on
nu
mb
er
Sex
Ag
e (
years
)
Fis
h
Cru
sta
cean
s
Mo
llu
scs
Wild
fow
l
Mari
ne p
lan
ts/a
lgae
Salt
mars
h g
razed
sh
eep
Gre
en
veg
eta
ble
s
Oth
er
veg
eta
ble
s
Ro
ot
veg
eta
ble
s
Po
tato
Do
mesti
c f
ruit
Milk
Catt
le m
eat
Pig
meat
Sh
eep
meat
Po
ult
ry
Eg
gs
Wild
/fre
e f
oo
ds
Rab
bit
s
Wild
fu
ng
i
Fre
sh
wate
r fi
sh
Inte
rtid
al o
ccu
pan
cy o
ver
mu
d
Inte
rtid
al o
ccu
pan
cy o
ver
mu
d a
nd
san
d
Inte
rtid
al o
ccu
pan
cy o
ver
mu
d a
nd
sto
nes
Inte
rtid
al o
ccu
pan
cy o
ver
salt
mars
h
Inte
rtid
al o
ccu
pan
cy o
ver
san
d
Inte
rtid
al o
ccu
pan
cy o
ver
san
d a
nd
sto
nes
Inte
rtid
al o
ccu
pan
cy o
ver
bo
at
on
mu
d a
nd
san
d
Han
dlin
g f
ish
ing
gear
Han
dlin
g s
ed
imen
t
Occu
pan
cy in
clo
se p
roxim
ity
(<10m
) to
sew
ag
e
Occu
pan
cy in
clo
se p
roxim
ity
(<10m
) to
sew
ag
e s
lud
ge o
r
sew
ag
e c
ake
Occu
pan
cy in
wate
r
Occu
pan
cy o
n w
ate
r
Ind
oo
r o
ccu
pan
cy w
ith
in 1
km
of
the lic
en
sed
sit
e b
ou
nd
ary
Ou
tdo
or
occu
pan
cy w
ith
in 1
km
of
the lic
en
sed
sit
e
bo
un
dary
Annex 1. Adults' consumption rates (kg y-1
or l y-1
) and occupancy rates (h y-1
)
420 F U - - - - - - - - - - - - - - - - - - - - - - - - - - - - - - - - - - 280 28421 M 45 - - - - - - - - - - - - - - - - - - - - - - - - - - - - - - - - - - 7875 365422 F 42 - - - - - - - - - - - - - - - - - - - - - - - - - - - - - - - - - - 7875 365423 M 32 - - - - - - 14.0 8.1 4.9 6.1 4.4 - - - - - - - - - - - - - - 39 - - - - - - - - 5901 143424 F 33 - - - - - - 14.0 8.1 4.9 6.1 4.4 - - - - - - - - - - - - - - 39 - - - - - - - - 7741 143425 M 57 - - - - - - - - - - - - - - - - - - - - - - - - - 24 - - - - - - - - 6648 644426 F 57 - - - - - - - - - - - - - - - - - - - - - - - - - 24 - - - - - - - - 6648 644427 M 50 23.1 - - - - - - - - - - - - - - - - - - - - - 104 - - - - - - 104 - - - 30 - -428 M 28 23.1 - - - - - - - - - - - - - - - - - - - - 208 104 - - - - - - 104 - - - 260 - -429 M 52 5.6 - - - - - - - - - - - - - - - - - - - - 34 - - - - 68 - - 34 - - - - - 34430 M U - - - - - - - - - - - - - - - - - - - - - - - - - - - - - - - - - 234 - -431 M U - - - - - - - - - - - - - - - - - - - - - - - - - - - - - - - - - 234 - -432 M U - - - - - - - - - - - - - - - - - - - - - - - - - - - - - - - - - 234 - -433 M U - - - - - - - - - - - - - - - - - - - - - - - - - - - - - - - - - 234 - -434 M U - - - - - - - - - - - - - - - - - - - - - - - - - - - - - - - - - 234 - -435 M U - - - - - - - - - - - - - - - - - - - - - - - - - - - - 20 - - - - 60 - -436 M U - - - - - - - - - - - - - - - - - - - - - - - - - - - - 20 - - - - 60 - -437 M U - - - - - - - - - - - - - - - - - - - - - - - - - - - - 20 - - - - 60 - -438 M U - - - - - - - - - - - - - - - - - - - - - - - - - - - - 20 - - - - 60 - -439 M U - - - - - - - - - - - - - - - - - - - - - - - - - - 220 - - - - - - - - 220440 M U - - - - - - - - - - - - - - - - - - - - - - - - - - 220 - - - - - - - - 220441 M U 5.4 - 0.7 - 0.2 - - - - - - - - - - - - - - - - - - - - - 2 - - - - - - 15 - -442 M U 47.2 - 5.7 - 0.3 - - - - - - - - - - - - - - - - - - - - - 3 - - - - - - 48 - -443 M U - - - - - - - - - - - - - - - - - - - - - - - - - - - - - - - - 15 - - -444 M U - - - - - - - - - - - - - - - - - - - - - - - - - - - - - - - - 15 - - -445 M U - - - - - - - - - - - - - - - - - - - - - - - - - - - - - - - - 15 - - -446 M U - - - - - - - - - - - - - - - - - - - - - - - - - - - - - - - - 15 - - -447 M 49 - - - - - - - - - - - - - - - - - - - - - - - - - - - 5107 - - - - - 1344 - -448 F 40 - - - - - - - - - - - - - - - - - - - - - - - - - - - 3830 - - - - - 1008 - -450 M 71 23.6 - 6.8 15.9 - - - - - - - - - - - - - 3.4 - 3.9 3.5 - 625 - - 62 - - - 139 - - - - - -451 F 70 23.6 - 4.8 15.9 - - - - - - - - - - - - - 3.4 - 3.9 3.5 - - - - - - - - - - - - - - -453 M U - - - - - - - - - - - - - - - - - - - - - - - - - 637 - - - 546 - - - - - -454 M U - - - - - - - - - - - - - - - - - - - - - - - - - 637 - - - 546 - - - - - -455 M 39 - - - - - - - - - - - - - - - - - - - - - - - 15 - - - - - 15 - - - - - -456 M 68 - - - - - - - - - - - - - - - - - - - - - 80 - - - - - 720 - - - - - - - -457 M 53 - - - - - - - - - - - - - - - - - - - - - 80 - - - - - 720 - - - - - - - -458 M U - - 0.5 - - - - - - - - - - - - - - - - - - - - 105 - - - - - 105 - - - - - -459 M 36 2.3 - - 10.0 - - - - - - - - - - - - - - - - - 200 - - - - - - - 200 - - - 100 - -460 F U - - - 10.0 - - - - - - - - - - - - - - - - - - - - - - - - - - - - - - - -461 M U - - - - - - - - - - - - - - - - - - - - - 90 - - - - - - - 90 - - - - - -462 M U - - - - - - - - - - - - - - - - - - - - - 90 - - - - - - - 90 - - - - - -463 M 66 - - - - - - - - - - - - - - - - - - - - - 27 - - - - - - - 27 - - - - - -464 M 42 - - - - - - - - - - - - - - - - - - - - - 27 - - - - - - - 27 - - - - - -465 M U 3.4 0.2 0.6 - - - - - - - - - - - - - - - - - - - - - - - - - - - - - 40 20 - -

Ob
serv
ati
on
nu
mb
er
Sex
Ag
e (
years
)
Fis
h
Cru
sta
cean
s
Mo
llu
scs
Wild
fow
l
Mari
ne p
lan
ts/a
lgae
Salt
mars
h g
razed
sh
eep
Gre
en
veg
eta
ble
s
Oth
er
veg
eta
ble
s
Ro
ot
veg
eta
ble
s
Po
tato
Do
mesti
c f
ruit
Milk
Catt
le m
eat
Pig
meat
Sh
eep
meat
Po
ult
ry
Eg
gs
Wild
/fre
e f
oo
ds
Rab
bit
s
Wild
fu
ng
i
Fre
sh
wate
r fi
sh
Inte
rtid
al o
ccu
pan
cy o
ver
mu
d
Inte
rtid
al o
ccu
pan
cy o
ver
mu
d a
nd
san
d
Inte
rtid
al o
ccu
pan
cy o
ver
mu
d a
nd
sto
nes
Inte
rtid
al o
ccu
pan
cy o
ver
salt
mars
h
Inte
rtid
al o
ccu
pan
cy o
ver
san
d
Inte
rtid
al o
ccu
pan
cy o
ver
san
d a
nd
sto
nes
Inte
rtid
al o
ccu
pan
cy o
ver
bo
at
on
mu
d a
nd
san
d
Han
dlin
g f
ish
ing
gear
Han
dlin
g s
ed
imen
t
Occu
pan
cy in
clo
se p
roxim
ity
(<10m
) to
sew
ag
e
Occu
pan
cy in
clo
se p
roxim
ity
(<10m
) to
sew
ag
e s
lud
ge o
r
sew
ag
e c
ake
Occu
pan
cy in
wate
r
Occu
pan
cy o
n w
ate
r
Ind
oo
r o
ccu
pan
cy w
ith
in 1
km
of
the lic
en
sed
sit
e b
ou
nd
ary
Ou
tdo
or
occu
pan
cy w
ith
in 1
km
of
the lic
en
sed
sit
e
bo
un
dary
Annex 1. Adults' consumption rates (kg y-1
or l y-1
) and occupancy rates (h y-1
)
466 F U 3.4 - 0.6 - - - - - - - - - - - - - - - - - - - - - - - - - - - - - 40 20 - -467 M 49 1.3 - - - - - - - - - - - - - - - - - - - - - - - - - - - - - - - 73 646 - -468 F 49 1.3 - - - - - - - - - - - - - - - - - - - - - - - - - - - - - - - 73 646 - -469 M 19 - - - - - - - - - - - - - - - - - - - - - - - - - - - - - - - - 73 310 - -470 M 48 - - - - - - - - - - - - - - - - - - - - - - - - - - - - - - - - 70 70 - -471 M U - - - - - - - - - - - - - - - - - - - - - - - - - - - - - - - - - 176 - -472 M U - - - - - - - - - - - - - - - - - - - - - - - - - - - - - - - - - 176 - -473 M U - - - - - - - - - - - - - - - - - - - - - - - - - - - - - - - - - 176 - -474 M U - - - - - - - - - - - - - - - - - - - - - - - - - - - - - - - - - 176 - -475 M U - - - - - - - - - - - - - - - - - - - - - - - - - - - - - - - - - 176 - -476 M U - - - - - - - - - - - - - - - - - - - - - - - - - - - - - - - - - 176 - -477 M U - - - - - - - - - - - - - - - - - - - - - - - - - - - - - - - - - 176 - -478 M U - - - - - - - - - - - - - - - - - - - - - - - - - - - - - - - - - 176 - -479 M U - - - - - - - - - - - - - - - - - - - - - - - - - - - - - - - - - 176 - -480 M U - - - - - - - - - - - - - - - - - - - - - - - - - - - - - - - - - 176 - -481 M U - - - - - - - - - - - - - - - - - - - - - - - - - - - - - - - - - 72 - -482 M U - - - - - - - - - - - - - - - - - - - - - - - - - - - - - - - - - 72 - -483 M U - - - - - - - - - - - - - - - - - - - - - - - - - - - - - - - - - 72 - -484 M U - - - - - - - - - - - - - - - - - - - - - - - - - - - - - - - - - 72 - -485 M U - - - - - - - - - - - - - - - - - - - - - - - - - - - - - - - - - 72 - -486 F U - - - - - - - - - - - - - - - - - - - - - - - - - - - - - - - - - 72 - -487 F U - - - - - - - - - - - - - - - - - - - - - - - - - - - - - - - - - 72 - -488 F U - - - - - - - - - - - - - - - - - - - - - - - - - - - - - - - - - 72 - -489 F U - - - - - - - - - - - - - - - - - - - - - - - - - - - - - - - - - 72 - -490 F U - - - - - - - - - - - - - - - - - - - - - - - - - - - - - - - - - 72 - -491 M U - - - - - - - - - - - - - - - - - - - - - - - - - - - - - - - - - 96 - -492 M U - - - - - - - - - - - - - - - - - - - - - - - - - - - - - - - - - 96 - -493 M U - - - - - - - - - - - - - - - - - - - - - - - - - - - - - - - - - 96 - -494 M U - - - - - - - - - - - - - - - - - - - - - - - - - - - - - - - - - 96 - -495 M U - - - - - - - - - - - - - - - - - - - - - - - - - - - - - - - - - 96 - -496 M U - - - - - - - - - - - - - - - - - - - - - - - - - - - - - - - - 18 - - -497 M U - - - - - - - - - - - - - - - - - - - - - - - - - - - - - - - - 18 - - -498 M U - - - - - - - - - - - - - - - - - - - - - - - - - - - - - - - - 18 - - -499 F U - - - - - - - - - - - - - - - - - - - - - - - - - - - - - - - - 18 - - -500 F U - - - - - - - - - - - - - - - - - - - - - - - - - - - - - - - - 18 - - -501 F U 4.6 - - - 0.2 - - - - - - - - - - - - - - - - - 182 - - - - - - - - - 5 72 - -502 F U - - - - 0.8 - - - - - - - - - - - - - - - - - 6 - - - - - - - - - - - - -503 F U - - - - 0.8 - - - - - - - - - - - - - - - - - 6 - - - - - - - - - - - - -504 M U - - - - - - - - - - - - - - - - - - - - - - - - - - - - - - - - - 100 - -505 M U - - - - - - - - - - - - - - - - - - - - - - - - - - - - - - - - - 100 - -506 M U - - - - - - - - - - - - - - - - - - - - - - - - - - - - - - - - - 100 - -507 M U - - - - - - - - - - - - - - - - - - - - - - - - - - - - - - - - - 100 - -508 F U - - - - - - - - - - - - - - - - - - - - - - - - - - - - - - - - - 100 - -509 F U - - - - - - - - - - - - - - - - - - - - - - - - - - - - - - - - - 100 - -

Ob
serv
ati
on
nu
mb
er
Sex
Ag
e (
years
)
Fis
h
Cru
sta
cean
s
Mo
llu
scs
Wild
fow
l
Mari
ne p
lan
ts/a
lgae
Salt
mars
h g
razed
sh
eep
Gre
en
veg
eta
ble
s
Oth
er
veg
eta
ble
s
Ro
ot
veg
eta
ble
s
Po
tato
Do
mesti
c f
ruit
Milk
Catt
le m
eat
Pig
meat
Sh
eep
meat
Po
ult
ry
Eg
gs
Wild
/fre
e f
oo
ds
Rab
bit
s
Wild
fu
ng
i
Fre
sh
wate
r fi
sh
Inte
rtid
al o
ccu
pan
cy o
ver
mu
d
Inte
rtid
al o
ccu
pan
cy o
ver
mu
d a
nd
san
d
Inte
rtid
al o
ccu
pan
cy o
ver
mu
d a
nd
sto
nes
Inte
rtid
al o
ccu
pan
cy o
ver
salt
mars
h
Inte
rtid
al o
ccu
pan
cy o
ver
san
d
Inte
rtid
al o
ccu
pan
cy o
ver
san
d a
nd
sto
nes
Inte
rtid
al o
ccu
pan
cy o
ver
bo
at
on
mu
d a
nd
san
d
Han
dlin
g f
ish
ing
gear
Han
dlin
g s
ed
imen
t
Occu
pan
cy in
clo
se p
roxim
ity
(<10m
) to
sew
ag
e
Occu
pan
cy in
clo
se p
roxim
ity
(<10m
) to
sew
ag
e s
lud
ge o
r
sew
ag
e c
ake
Occu
pan
cy in
wate
r
Occu
pan
cy o
n w
ate
r
Ind
oo
r o
ccu
pan
cy w
ith
in 1
km
of
the lic
en
sed
sit
e b
ou
nd
ary
Ou
tdo
or
occu
pan
cy w
ith
in 1
km
of
the lic
en
sed
sit
e
bo
un
dary
Annex 1. Adults' consumption rates (kg y-1
or l y-1
) and occupancy rates (h y-1
)
510 F U - - - - - - - - - - - - - - - - - - - - - - - - - - - - - - - - - 100 - -511 F U - - - - - - - - - - - - - - - - - - - - - - - - - - - - - - - - - 100 - -512 M 29 - - 0.3 - - - - - - - - - - - - - - - - - - - - - - 5 - - - 5 - - - 100 - -513 F U - - 0.3 - - - - - - - - - - - - - - - - - - - - - - 5 - - - 5 - - - 100 - -514 F U - - 0.3 - - - - - - - - - - - - - - - - - - - - - - 5 - - - 5 - - - 100 - -515 M U - - 0.3 - - - - - - - - - - - - - - - - - - - - - - 5 - - - 5 - - - 100 - -516 M 61 - 0.4 0.4 - - - - - - - - - - - - - - - - - - - - - - - - - - - - - - 100 - -517 M U - - - - - - - - - - - - - - - - - - - - - - - - - - - - - - 1512 504 - - - -518 M U - - - - - - - - - - - - - - - - - - - - - - - - - - - - - - 1512 504 - - - -519 M U - - - - - - - - - - - - - - - - - - - - - - - - - - - - - - 1512 504 - - - -520 M U - - - - - - - - - - - - - - - - - - - - - - - - - - - - - - 1512 504 - - - -521 M U - - - - - - - - - - - - - - - - - - - - - - - - - - - - - - 1512 504 - - - -522 M U - - - - - - - - - - - - - - - - - - - - - - - - - - - - - - - 1776 - - - -
NotesEmboldened observations are the high-rate individualsU = Unknown

Ob
serv
ati
on
nu
mb
er
Sex
Ag
e (
years
)
Fis
h
Mo
llu
scs
Wild
fow
l
Gre
en
veg
eta
ble
s
Oth
er
veg
eta
ble
s
Ro
ot
veg
eta
ble
s
Po
tato
Do
mesti
c f
ruit
Milk
Catt
le m
eat
Pig
meat
Sh
eep
meat
Po
ult
ry
Eg
gs
Wild
/fre
e f
oo
ds
Rab
bit
s/h
are
s
Wild
fu
ng
i
Inte
rtid
al o
ccu
pan
cy o
ver
san
d
Inte
rtid
al o
ccu
pan
cy o
ver
san
d a
nd
sto
nes
Inte
rtid
al o
ccu
pan
cy o
ver
bo
at
on
mu
d a
nd
san
d
Han
dlin
g s
ed
imen
t
Occu
pan
cy in
wate
r
Occu
pan
cy o
n w
ate
r
Ind
oo
r o
ccu
pan
cy w
ith
in 1
km
of
the lic
en
sed
sit
e b
ou
nd
ary
Ou
tdo
or
occu
pan
cy w
ith
in 1
km
of
the lic
en
sed
sit
e
bo
un
dary
7 F 13 - - - - - - 1.3 1.8 155.6 - - - - 41.6 0.3 - - - - - - - - - -
8 M 10 - - - - - - 1.3 1.8 155.6 - - - - 41.6 0.3 - - - - - - - - - -
20 F 15 - - - - - - - - - - - - - - - - - - - - - - - 6153 372
21 M 11 - - - - - - - - - - - - - - - - - - - - - - - 7842 438
25 F 10 - - - - - - - - - - - - - - - - - - - - - - - 8216 448
26 M 15 - - - - - - - - - - - - - - - - - - - - - - - 3081 528
34 F 15 4.1 - - - - - - - - - - - - - - - - 20 - - - - - - -
37 M 6 0.5 - - - - - - - - - - - - - - - - 10 - - - - - - -
41 M 12 0.5 - - - - - - - - - - - - - - - - - - - - - - - -
42 M 15 0.5 - - - - - - - - - - - - - - - - - - - - - - - -
58 M 10 11.5 - - - - - - - - - - - - - - - - - - - - - - - -
60 M 9 - - - - - - - - - - - - - - - - - 24 - - - - - - -
62 M 11 - - - - - - - - - - - - - - - - - 24 - - - - - - -
142 M 12 - - - 4.8 1.7 5.5 - 1.1 - - - - - - - - - - - - - - - - -
145 M 12 - - - - - - - - - - - - - - - - - - - - - - 16 - -
146 F 13 - - - - - - - - - - - - - - - - - - - - - - 16 - -
151 M 10 - - - 3.2 7.4 1.0 8.2 0.9 - - - - - 3.5 - - - - - - - - - - -
152 F 13 - - - 3.2 7.4 1.0 8.2 0.9 - - - - - 3.5 - - - - - - - - - - -
159 M 13 - - 12.9 - - - - - - - - - - - - - - - - - - - - - -
162 M 10 - - - 5.9 8.0 2.2 - 0.2 - - - - - 29.6 - - - - - - - - - - -
175 F 15 - 0.1 - 1.4 1.5 2.6 1.0 0.1 - - - - 0.4 - - - - - - - - - - - -
176 F 11 - 0.1 - 1.4 1.5 2.6 1.0 0.1 - - - - - - - - - - - - - - - - -
208 M 11 - - - 6.1 7.9 6.2 9.1 3.2 - - - - - 5.5 - - - - - - - - - - -
217 M 9 - - - 11.5 4.0 6.1 7.6 - - - - - - - - - - 37 - - 4 - 14 - -
Annex 2. Children's and infants' consumption rates (kg y-1
or l y-1
) and occupancy rates (h y-1
)
Child age group (6 - 15 years old)

Ob
serv
ati
on
nu
mb
er
Sex
Ag
e (
years
)
Fis
h
Mo
llu
scs
Wild
fow
l
Gre
en
veg
eta
ble
s
Oth
er
veg
eta
ble
s
Ro
ot
veg
eta
ble
s
Po
tato
Do
mesti
c f
ruit
Milk
Catt
le m
eat
Pig
meat
Sh
eep
meat
Po
ult
ry
Eg
gs
Wild
/fre
e f
oo
ds
Rab
bit
s/h
are
s
Wild
fu
ng
i
Inte
rtid
al o
ccu
pan
cy o
ver
san
d
Inte
rtid
al o
ccu
pan
cy o
ver
san
d a
nd
sto
nes
Inte
rtid
al o
ccu
pan
cy o
ver
bo
at
on
mu
d a
nd
san
d
Han
dlin
g s
ed
imen
t
Occu
pan
cy in
wate
r
Occu
pan
cy o
n w
ate
r
Ind
oo
r o
ccu
pan
cy w
ith
in 1
km
of
the lic
en
sed
sit
e b
ou
nd
ary
Ou
tdo
or
occu
pan
cy w
ith
in 1
km
of
the lic
en
sed
sit
e
bo
un
dary
Annex 2. Children's and infants' consumption rates (kg y-1
or l y-1
) and occupancy rates (h y-1
)
223 F 10 - - - 1.7 3.7 12.2 16.3 - - - - - - - - - - - - - - - - - -
224 M 7 - - - 1.3 2.8 9.1 12.2 - - - - - - - - - - - - - - - - - -
236 M 14 - - - 2.1 2.3 4.4 3.4 - - - - - - - - - - - - - - - - - -
237 M 10 - - - - - - 1.7 - - - - - - - - - - - - - - - - - -
240 M 15 - - - - - - - - - - - - - - - - - - 200 - - 196 - - -
265 M 8 - - - - - - - - - - - - - - - - - - - - - - - 130 26
280 M 7 11.1 - - - - - - - - - - - - - - - - - - - - - - - -
284 F 11 - - - - - - - - - - - - - - - - - - 26 - - - - - -
289 F 11 - - - - - - - - - - - - - - - - - 220 50 - - 110 - - -
290 M 9 - - - - - - - - - - - - - - - - - 220 50 - - 110 - - -
294 F 9 - 0.9 - - - - - - - - - - - - - - - - - - - - - - -
295 M 14 5.0 - - - - - - - - - - - - - - - - 677 - - 52 - - - -
297 M 12 5.0 - - - - - - - - - - - - - - - - 742 - - 12 - - - -
307 F 10 - - - - - - - - - - - - - - - - - 120 - - - - - - -
308 F 8 - - - - - - - - - - - - - - - - - 120 - - - - - - -
313 F 8 - - - - - - - - - - - - - - - - - 92 - - - - - - -
315 F 10 - - - - - - - - - - - - - - - - - 198 - - - - 33 - -
316 F 7 - - - - - - - - - - - - - - - - - 198 - - - - 33 - -
320 M 12 - - - - - - - - - - - - - - - - - - - - - 56 - - -
358 M 7 - - - - - - - - - 16.3 2.1 2.8 1.2 5.0 - 0.5 - - - - - - - - -
361 F 7 - - - - - - - - - - - - - - - - - - - - - - - 825 25
369 M 10 - - - - - - - - - - - - - - - - - 130 - - - - - 7814 234
373 M 11 - - - - - - - - - - - - - - - - - 66 - - - - - - -
403 M 11 - - - - - - - - - - - - - - - - - - - - - 55 - - 41
404 M 9 - - - - - - - - - - - - - - - - - - - - - 55 - - 41

Ob
serv
ati
on
nu
mb
er
Sex
Ag
e (
years
)
Fis
h
Mo
llu
scs
Wild
fow
l
Gre
en
veg
eta
ble
s
Oth
er
veg
eta
ble
s
Ro
ot
veg
eta
ble
s
Po
tato
Do
mesti
c f
ruit
Milk
Catt
le m
eat
Pig
meat
Sh
eep
meat
Po
ult
ry
Eg
gs
Wild
/fre
e f
oo
ds
Rab
bit
s/h
are
s
Wild
fu
ng
i
Inte
rtid
al o
ccu
pan
cy o
ver
san
d
Inte
rtid
al o
ccu
pan
cy o
ver
san
d a
nd
sto
nes
Inte
rtid
al o
ccu
pan
cy o
ver
bo
at
on
mu
d a
nd
san
d
Han
dlin
g s
ed
imen
t
Occu
pan
cy in
wate
r
Occu
pan
cy o
n w
ate
r
Ind
oo
r o
ccu
pan
cy w
ith
in 1
km
of
the lic
en
sed
sit
e b
ou
nd
ary
Ou
tdo
or
occu
pan
cy w
ith
in 1
km
of
the lic
en
sed
sit
e
bo
un
dary
Annex 2. Children's and infants' consumption rates (kg y-1
or l y-1
) and occupancy rates (h y-1
)
408 F 7 - - - - - - - - - - - - - - - - - 60 - - - 9 - - -
409 M 10 - - - - - - - - - - - - - - - - - 60 - - - 9 - - -
415 M 8 - - - - - - - - - - - - - - - - - 149 - - - 21 - - -
449 F 11 - - - - - - - - - - - - - - - - - - - 3830 - - 1008 - -
452 M 12 - 0.5 - - - - - - - - - - - - - - - 8 - - 8 - - - -
11 F 3 - - - - - - - - - 9.5 - 1.1 - 8.9 - - - - - - - - - - -
12 F 3 - - - - - - - - - 9.5 - 1.1 - 8.9 - - - - - - - - - - -
49 M 2 - - - - - - - - - - - - - - - - - 36 - - - - - - -
61 M 4 - - - - - - - - - - - - - - - - - 24 - - - - - - -
66 M 2 - - - - - - - - - - - - - - - - - - - - - - - 1040 208
121 M 2 - - - 1.0 - 0.3 0.6 - 86.5 - - 2.4 - - - - 0.1 - - - - - - - -
160 F 5 - - 1.4 - - - - - - - - - - - - - - - - - - - - - -
213 F 3 - - - 3.5 1.5 5.9 8.5 - - - - - - 0.8 - - - - - - - - - - -
229 M 5 - - - - 1.5 2.1 0.2 0.4 - - - - - - - - - - - - - - - - -
266 M 5 - - - - - - - - - - - - - - - - - - - - - - - 130 26
270 F 3 - - - - - - - - - - - - - - - - - - 52 - - - - 7926 730
271 F 2 - - - - - - - - - - - - - - - - - - 52 - - - - 7926 730
272 F 1 - - - - - - - - - - - - - - - - - - 52 - - - - 7926 730
281 F 5 6.5 - - - - - - - - - - - - - - - - - - - - - - - -
416 F 5 - - - - - - - - - - - - - - - - - 149 - - - 21 - - -
Notes
U=Unknown
Emboldened observations are the high-rate individuals
Infant age group (0 - 5 years old)

Details of activity Exposure pathways
involved
Estimated rate
None identified None identified Not applicable
Group
Infante/adult Child
e/adult
Fishb
0.050 0.200
Crustaceansb
0.050 0.250
Molluscsb
0.050 0.250
Green vegetables 0.222 0.444
Other vegetables 0.200 0.500
Root vegetables 0.375 0.500
Potatoes 0.292 0.708
Domestic fruit 0.467 0.667
Milk 1.333 1.000
Cattle meat 0.222 0.667
Pig meat 0.138 0.625
Sheep meat 0.120 0.400
Poultry 0.183 0.500
Eggs 0.600 0.800
Wild/free foodsc
0.110 0.490
Gamed
0.140 0.500
Honey 0.789 0.789
Wild fungi 0.150 0.450
Freshwater fishb
0.050 0.250
External exposure over intertidal substrates 0.030 0.500
Notes
bRatios were derived from Smith and Jones, (2003) which presented data for infants and children of
unspecified ages.
eNote that the age ranges within the age groups in this table do not correspond exactly with the age
ranges within the age groups used throughout the rest of this report.
Annex 3. Qualitative and estimated data for use in dose assessments
Annex 4. Ratios for determining consumption and occupancy rates for infants and children
Ratioa
aExcepting notes b and c, consumption ratios were derived from Byrom et al., (1995) which presented
data for infants aged 6 to 12 months and children aged 10 to 11 years.
cRatios were derived from FSA data for wild fruit and nuts for infants and 10-year-old children.
dGame includes rabbits/hares and venison.

Annex 5. Consumption rates (kg y-1
or l y-1
) and occupancy rates (h y-1
) for women of childbearing agea, for use in foetal dose assessments
Ob
serv
ati
on
nu
mb
er
Sex
Ag
e (
years
)
Fis
h
Mo
llu
scs
Wil
dfo
wl
Mari
ne p
lan
ts/a
lgae
Salt
mars
h g
razed
sh
eep
Gre
en
veg
eta
ble
s
Oth
er
veg
eta
ble
s
Ro
ot
veg
eta
ble
s
Po
tato
Do
mesti
c f
ruit
Mil
k
Catt
le m
eat
Pig
meat
Sh
eep
meat
Po
ult
ry
Eg
gs
Wil
d/f
ree f
oo
ds
Wil
d f
un
gi
Inte
rtid
al
occu
pan
cy o
ver
mu
d a
nd
san
d
Inte
rtid
al
occu
pan
cy o
ver
salt
mars
h
Inte
rtid
al
occu
pan
cy o
ver
san
d
Inte
rtid
al
occu
pan
cy o
ver
san
d a
nd
sto
nes
Inte
rtid
al
occu
pan
cy o
ver
bo
at
on
mu
d a
nd
san
d
Han
dli
ng
sed
imen
t
Occu
pan
cy i
n w
ate
r
Occu
pan
cy o
n w
ate
r
Ind
oo
r o
ccu
pan
cy w
ith
in 1
km
of
the l
icen
sed
sit
e b
ou
nd
ary
Ou
tdo
or
occu
pan
cy w
ith
in 1
km
of
the l
icen
sed
sit
e
bo
un
dary
4 F 25 - - - - - - - - - - - 11.8 - 1.4 - - - - - - - - - - - - - -
5 F 41 - - - - - - - - 1.3 1.8 155.6 - - - - 41.6 0.3 - - - - - - - - - - -
10 F 33 - - - - - - - - - - - 37.8 - 4.5 - 8.9 - - - - - - - - - - - -
13 F 44 - - - - - - - - - - - 35.5 - - - - - - - - - - - - - - - -
16 F 17 - - - - - - - - - - - 35.5 - - - - - - - - - - - - - - - -
19 F 33 - - - - - - - - - - - - - - - - - - - - - - - - - - 8132 148
20 F 15 - - - - - - - - - - - - - - - - - - - - - - - - - - 6153 372
27 F 18 - - - - - - - - - - - - - - - - - - - - - - - - - - 6628 416
30 F 34 - - - - - - - - - - - - - - - - - - - - - 144 - - - - - -
33 F 43 5.8 - - - - - - - - - - - - - - - - - - - - - - - - - - -
34 F 15 4.1 - - - - - - - - - - - - - - - - - - - 20 - - - - - - -
36 F 39 0.9 - - - - - - - - - - - - - - - - - - - - - - - - - - -
44 F U 0.6 - - - - - - - - - - - - - - - - - - - - - - - - - - -
48 F 22 - - - - - - - - - - - - - - - - - - - - 36 - - - - - - -
65 F 42 - - - - - - - - - - - - - - - - - - - - - - - - - - 5809 283
72 F U 3.3 - - - - - - - - - - - - - - - - - - - - - - - - - - -
108 F U - - - - 5.7 - - - - - - - - - - - - - - - - - - - - - - -
109 F U - - - - 5.7 - - - - - - - - - - - - - - - - - - - - - - -
110 F U - - - - 5.7 - - - - - - - - - - - - - - - - - - - - - - -
111 F U - - - - 5.7 - - - - - - - - - - - - - - - - - - - - - - -
112 F U - - - - 5.7 - - - - - - - - - - - - - - - - - - - - - - -
117 F 29 - - - - - 3.1 - 0.9 1.8 - 262.1 - - 7.1 - - - 0.2 - - - - - - - - - -
118 F 26 - - - - - 3.1 - 0.9 1.8 - 262.1 - - 7.1 - - - 0.2 - - - - - - - - - -
127 F 17 - - - - - - - - - - - 23.7 - - - - - - - - - - - - - - - -
128 F 17 - - - - - - - - - - - 23.7 - - - - - - - - - - - - - - - -
129 F 26 - - - - - - - - - - - 23.7 - - - - - - - - - - - - - - - -
130 F 24 - - - - - - - - - - - 23.7 - - - - - - - - - - - - - - - -
131 F 22 - - - - - - - - - - - 23.7 - - - - - - - - - - - - - - - -
134 F 25 - - 4.7 - - - - - - - - - - 11.3 0.7 41.6 - - - - - - - - - - - -
144 F 40 - - - - - - - - - - - - - - - - - - - - - - - - - 16 - -
150 F 25 - - - - - 3.2 7.4 1.0 8.2 0.9 - - - - - 3.5 - - - - - - - - - - - -
155 F 29 - - - - - 3.2 12.6 17.1 - 15.9 - - - - - - - - - - - - - - - - - -
161 F 39 - - - - - 5.9 8.0 2.2 - 0.2 - - - - - 59.3 - - - - - - - - - - - -
173 F 37 - 0.1 - - - 1.4 1.5 2.6 1.0 0.1 - - - - 0.4 - - - - - - - - - - - - -
175 F 15 - 0.1 - - - 1.4 1.5 2.6 1.0 0.1 - - - - 0.4 - - - - - - - - - - - - -
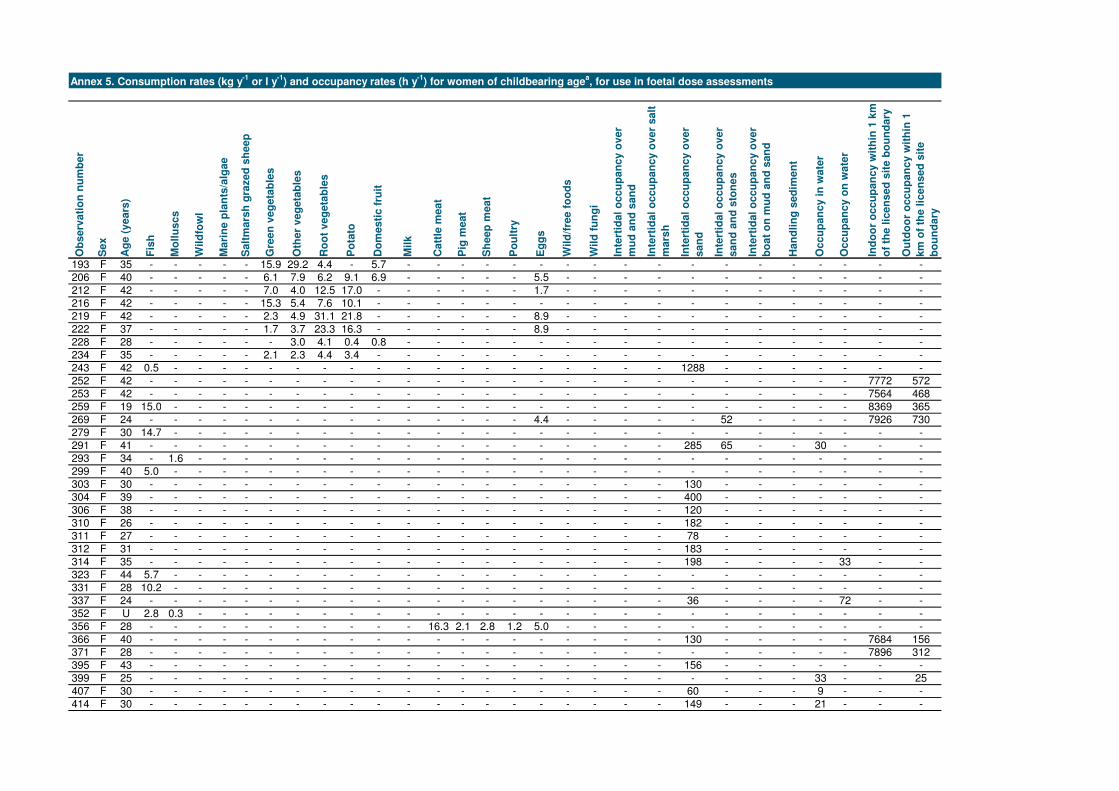
Annex 5. Consumption rates (kg y-1
or l y-1
) and occupancy rates (h y-1
) for women of childbearing agea, for use in foetal dose assessments
Ob
serv
ati
on
nu
mb
er
Sex
Ag
e (
years
)
Fis
h
Mo
llu
scs
Wil
dfo
wl
Mari
ne p
lan
ts/a
lgae
Salt
mars
h g
razed
sh
eep
Gre
en
veg
eta
ble
s
Oth
er
veg
eta
ble
s
Ro
ot
veg
eta
ble
s
Po
tato
Do
mesti
c f
ruit
Mil
k
Catt
le m
eat
Pig
meat
Sh
eep
meat
Po
ult
ry
Eg
gs
Wil
d/f
ree f
oo
ds
Wil
d f
un
gi
Inte
rtid
al
occu
pan
cy o
ver
mu
d a
nd
san
d
Inte
rtid
al
occu
pan
cy o
ver
salt
mars
h
Inte
rtid
al
occu
pan
cy o
ver
san
d
Inte
rtid
al
occu
pan
cy o
ver
san
d a
nd
sto
nes
Inte
rtid
al
occu
pan
cy o
ver
bo
at
on
mu
d a
nd
san
d
Han
dli
ng
sed
imen
t
Occu
pan
cy i
n w
ate
r
Occu
pan
cy o
n w
ate
r
Ind
oo
r o
ccu
pan
cy w
ith
in 1
km
of
the l
icen
sed
sit
e b
ou
nd
ary
Ou
tdo
or
occu
pan
cy w
ith
in 1
km
of
the l
icen
sed
sit
e
bo
un
dary
193 F 35 - - - - - 15.9 29.2 4.4 - 5.7 - - - - - - - - - - - - - - - - - -
206 F 40 - - - - - 6.1 7.9 6.2 9.1 6.9 - - - - - 5.5 - - - - - - - - - - - -
212 F 42 - - - - - 7.0 4.0 12.5 17.0 - - - - - - 1.7 - - - - - - - - - - - -
216 F 42 - - - - - 15.3 5.4 7.6 10.1 - - - - - - - - - - - - - - - - - - -
219 F 42 - - - - - 2.3 4.9 31.1 21.8 - - - - - - 8.9 - - - - - - - - - - - -
222 F 37 - - - - - 1.7 3.7 23.3 16.3 - - - - - - 8.9 - - - - - - - - - - - -
228 F 28 - - - - - - 3.0 4.1 0.4 0.8 - - - - - - - - - - - - - - - - - -
234 F 35 - - - - - 2.1 2.3 4.4 3.4 - - - - - - - - - - - - - - - - - - -
243 F 42 0.5 - - - - - - - - - - - - - - - - - - - 1288 - - - - - - -
252 F 42 - - - - - - - - - - - - - - - - - - - - - - - - - - 7772 572
253 F 42 - - - - - - - - - - - - - - - - - - - - - - - - - - 7564 468
259 F 19 15.0 - - - - - - - - - - - - - - - - - - - - - - - - - 8369 365
269 F 24 - - - - - - - - - - - - - - - 4.4 - - - - - 52 - - - - 7926 730
279 F 30 14.7 - - - - - - - - - - - - - - - - - - - - - - - - - - -
291 F 41 - - - - - - - - - - - - - - - - - - - - 285 65 - - 30 - - -
293 F 34 - 1.6 - - - - - - - - - - - - - - - - - - - - - - - - - -
299 F 40 5.0 - - - - - - - - - - - - - - - - - - - - - - - - - - -
303 F 30 - - - - - - - - - - - - - - - - - - - - 130 - - - - - - -
304 F 39 - - - - - - - - - - - - - - - - - - - - 400 - - - - - - -
306 F 38 - - - - - - - - - - - - - - - - - - - - 120 - - - - - - -
310 F 26 - - - - - - - - - - - - - - - - - - - - 182 - - - - - - -
311 F 27 - - - - - - - - - - - - - - - - - - - - 78 - - - - - - -
312 F 31 - - - - - - - - - - - - - - - - - - - - 183 - - - - - - -
314 F 35 - - - - - - - - - - - - - - - - - - - - 198 - - - - 33 - -
323 F 44 5.7 - - - - - - - - - - - - - - - - - - - - - - - - - - -
331 F 28 10.2 - - - - - - - - - - - - - - - - - - - - - - - - - - -
337 F 24 - - - - - - - - - - - - - - - - - - - - 36 - - - - 72 - -
352 F U 2.8 0.3 - - - - - - - - - - - - - - - - - - - - - - - - - -
356 F 28 - - - - - - - - - - - 16.3 2.1 2.8 1.2 5.0 - - - - - - - - - - - -
366 F 40 - - - - - - - - - - - - - - - - - - - - 130 - - - - - 7684 156
371 F 28 - - - - - - - - - - - - - - - - - - - - - - - - - - 7896 312
395 F 43 - - - - - - - - - - - - - - - - - - - - 156 - - - - - - -
399 F 25 - - - - - - - - - - - - - - - - - - - - - - - - 33 - - 25
407 F 30 - - - - - - - - - - - - - - - - - - - - 60 - - - 9 - - -
414 F 30 - - - - - - - - - - - - - - - - - - - - 149 - - - 21 - - -

Annex 5. Consumption rates (kg y-1
or l y-1
) and occupancy rates (h y-1
) for women of childbearing agea, for use in foetal dose assessments
Ob
serv
ati
on
nu
mb
er
Sex
Ag
e (
years
)
Fis
h
Mo
llu
scs
Wil
dfo
wl
Mari
ne p
lan
ts/a
lgae
Salt
mars
h g
razed
sh
eep
Gre
en
veg
eta
ble
s
Oth
er
veg
eta
ble
s
Ro
ot
veg
eta
ble
s
Po
tato
Do
mesti
c f
ruit
Mil
k
Catt
le m
eat
Pig
meat
Sh
eep
meat
Po
ult
ry
Eg
gs
Wil
d/f
ree f
oo
ds
Wil
d f
un
gi
Inte
rtid
al
occu
pan
cy o
ver
mu
d a
nd
san
d
Inte
rtid
al
occu
pan
cy o
ver
salt
mars
h
Inte
rtid
al
occu
pan
cy o
ver
san
d
Inte
rtid
al
occu
pan
cy o
ver
san
d a
nd
sto
nes
Inte
rtid
al
occu
pan
cy o
ver
bo
at
on
mu
d a
nd
san
d
Han
dli
ng
sed
imen
t
Occu
pan
cy i
n w
ate
r
Occu
pan
cy o
n w
ate
r
Ind
oo
r o
ccu
pan
cy w
ith
in 1
km
of
the l
icen
sed
sit
e b
ou
nd
ary
Ou
tdo
or
occu
pan
cy w
ith
in 1
km
of
the l
icen
sed
sit
e
bo
un
dary
420 F U - - - - - - - - - - - - - - - - - - - - - - - - - - 280 28
422 F 42 - - - - - - - - - - - - - - - - - - - - - - - - - - 7875 365
424 F 33 - - - - - 14.0 8.1 4.9 6.1 4.4 - - - - - - - - - - 39 - - - - - 7741 143
448 F 40 - - - - - - - - - - - - - - - - - - - - - - 3830 - - 1008 - -
460 F U - - 10.0 - - - - - - - - - - - - - - - - - - - - - - - - -
466 F U 3.4 0.6 - - - - - - - - - - - - - - - - - - - - - - 40 20 - -
486 F U - - - - - - - - - - - - - - - - - - - - - - - - - 72 - -
487 F U - - - - - - - - - - - - - - - - - - - - - - - - - 72 - -
488 F U - - - - - - - - - - - - - - - - - - - - - - - - - 72 - -
489 F U - - - - - - - - - - - - - - - - - - - - - - - - - 72 - -
490 F U - - - - - - - - - - - - - - - - - - - - - - - - - 72 - -
499 F U - - - - - - - - - - - - - - - - - - - - - - - - 18 - - -
500 F U - - - - - - - - - - - - - - - - - - - - - - - - 18 - - -
501 F U 4.6 - - 0.2 - - - - - - - - - - - - - - 182 - - - - - 5 72 - -
502 F U - - - 0.8 - - - - - - - - - - - - - - 6 - - - - - - - - -
503 F U - - - 0.8 - - - - - - - - - - - - - - 6 - - - - - - - - -
508 F U - - - - - - - - - - - - - - - - - - - - - - - - - 100 - -
509 F U - - - - - - - - - - - - - - - - - - - - - - - - - 100 - -
510 F U - - - - - - - - - - - - - - - - - - - - - - - - - 100 - -
511 F U - - - - - - - - - - - - - - - - - - - - - - - - - 100 - -
513 F U - 0.3 - - - - - - - - - - - - - - - - - - 5 - - 5 - 100 - -
514 F U - 0.3 - - - - - - - - - - - - - - - - - - 5 - - 5 - 100 - -
Notes
Emboldened observations are the high-rate individuals
U = Unknowna Based on National Statistics guidelines women were deemed to be of childbearing age if they were between 15 and 44 years old. Women of unknown age
were included as they were potentially women of childbearing age.

Annex 6. Summary of profiles for adults
Profile Name Nu
mb
er
of
ind
ivid
uals
Cru
sta
cea
Dir
ecta
Eg
gs
Fis
h -
Fre
sh
wate
r
Fis
h -
Sea
Fru
it -
Do
mesti
c
Fru
it a
nd
nu
ts -
Wild
Ho
useb
oat
occu
pan
tsb
Gam
ma e
xt
- S
alt
mars
hc
Gam
ma e
xt
- S
ed
imen
td
Mari
ne p
lan
ts/a
lgae
Meat
- C
ow
Meat
- G
am
ee
Meat
- P
ig
Meat
- P
ou
ltry
Meat
- salt
mars
h g
razed
sh
eep
Meat
- S
heep
Wild
fow
l
Milk
Mo
llu
scs
Mu
sh
roo
ms
Occu
pan
cy in
clo
se
pro
xim
ity t
o s
ew
ag
e
Occu
pan
cy in
clo
se
pro
xim
ity t
o s
ew
ag
e s
lud
ge
or
sew
ag
e c
ake
Occu
pan
cy IN
wate
r
Occu
pan
cy O
N w
ate
r
Plu
me (
IN;
0-0
.25km
)f
Plu
me (
MID
; >
0.2
5-0
.5km
)f
Plu
me (
OU
T;
>0.5
-1.1
km
)f
Veg
eta
ble
s -
Gre
en
Veg
eta
ble
s -
Oth
er
Do
mesti
c
Veg
eta
ble
s -
Po
tato
es
Veg
eta
ble
s -
Ro
ot
kg - kg kg kg kg kg h h h kg kg kg kg kg kg kg kg l kg kg h h h h h h h kg kg kg kg
Crustacean consumers 2 11.9 - - - 9.9 - - - 8 170 0.23 23.7 - - - - - 12.7 - 3.1 - - - 72 190 - - - - - - -
Occupants for direct radiation 67 - 1.00 0.42 - 1.5 0.71 - - <1 38 - - - - - - - - - - - - - 4 72 2640 1430 1460 0.81 1.1 0.87 1.6
Egg consumers 9 0.18 - 34.3 - - 2.8 0.81 - - - - 10.8 0.25 1.4 0.47 - 3.1 0.53 80.7 - 0.13 - - - - - - - 2.4 6.8 2.6 2.2
Freshwater fish consumers 2 - - - 3.5 23.6 - 3.4 - - 340 - - - - - - - 15.9 - 5.8 3.9 - - - - - - - - - - -
Sea fish consumers 8 2.2 0.13 - 0.88 27.1 - 0.85 - 2 190 0.09 - - - - - - 4.0 - 2.9 0.96 - - 18 82 - - 45 - - - -
Domestic fruit consumers 6 0.26 0.33 5.9 - - 28.8 - - - - - 7.9 1.5 - 8.0 - - - - - - - - - - - 2290 - 8.9 23.3 10.9 15.8
Wild fruit and nut consumers 6 0.26 - 8.0 1.2 7.9 0.08 3.2 - - 110 - 21.7 0.38 2.8 1.2 - 3.8 5.3 - 1.9 1.4 - - - - - - - - - 9.1 2.0
Houseboat occupants 3 - - - - - - - 5520 - 120 - - - - - - - - - - - - - - 1010 - - - - - - -
Occupants for exposure - Salt marsh 16 - - - - - - - - 290 - - - - - - 0.35 - 3.7 - - - - - - - - - - - - - -
Occupants for exposure - Sediment 17 - 0.06 - 0.21 4.2 - 0.20 - - 760 - - - - - - - 0.93 - 0.40 0.23 - - - 24 - - 450 - - - -
Marine plants/algae consumers 4 4.4 - - - 5.3 - - - 4 12 0.72 - - - - - - - - 1.6 - - - 36 74 - - - - - - -
Cattle meat consumers 20 0.47 - 4.4 - - 2.9 0.52 - - 15 - 33.2 0.11 1.1 0.41 - 1.9 1.3 - - 0.05 - - - 5 - - - - - - -
Game meat consumers 1 - - - - - 23.5 - - - - - - 9.0 - 48.0 - - - - - - - - - - - - - 18.4 42.8 - 35.4
Pork meat consumers 4 0.40 - 17.7 - - - 2.6 - - - - 40.6 0.56 5.3 2.0 - 7.1 - - - 0.23 - - - - - - - - - - -
Poultry meat consumers 1 - - - - - 23.5 - - - - - - 9.0 - 48.0 - - - - - - - - - - - - - 18.4 42.8 - 35.4
Salt marsh grazed sheep meat consumers 6 - - - - - - - - 33 - - - - - - 5.7 - - - - - - - - - - - - - - - -
Sheep meat consumers 15 0.11 - 11.1 - - - 0.70 - - - - 15.9 0.15 1.4 0.69 - 7.6 0.95 104.9 - 0.12 - - - - - - - 1.2 - 0.72 0.38
Wildfowl consumers 9 0.68 - - 0.79 5.6 - 0.76 - 66 160 - 5.3 - - - - - 17.2 - 1.3 0.86 - - - 23 - - - - - - -
Milk consumers 11 - - 9.5 - - 0.32 0.14 - - - - - - - - - 3.9 - 284.4 - 0.17 - - - - - - - 1.7 - 1.2 0.52
Mollusc consumers 4 4.4 - - 1.8 28.5 - 1.7 - 4 180 0.18 - - - - - - 7.9 - 5.9 1.9 - - 36 78 - - - - - - -
Mushroom consumers 2 - - - 3.5 23.6 - 3.4 - - 340 - - - - - - - 15.9 - 5.8 3.9 - - - - - - - - - - -
Occupancy in proximity to sewage 5 - - - - - - - - - - - - - - - - - - - - - 1510 500 - - - - - - - - -
Occupancy in proximity to sewage sludge or cake 1 - - - - - - - - - - - - - - - - - - - - - - 1780 - - - - - - - - -
Occupancy IN water 15 1.2 0.20 - - 1.5 - - - 1 20 0.03 - - - - - - - - 0.41 - - - 76 130 - 8 - - - - -
Occupancy ON water 9 - 0.33 - - 1.1 - - 570 - 25 - - - - - - - - - - - - - - 2310 530 - - - - - -
Occupants for plume pathways (inner area) 22 - 1.00 1.2 - - - - - - 13 - - - - - - - - - - - - - <1 - 7730 - - - - - -
Occupants for plume pathways (mid area) 13 - 1.00 - - - 3.7 - - - 30 - - - - - - - - - - - - - - - - 7200 - 2.9 4.2 0.93 4.7
Occupants for plume pathways (outer area) 12 - 1.00 0.11 - 5.0 - - - 2 60 - - - - - - - - - - - - - - 33 - - 8110 1.4 1.5 3.9 4.1
Green vegetable consumers 28 0.08 0.07 5.0 - 0.16 6.8 - - - 21 - - 0.32 - 1.7 - - - - - 0.03 - - - 6 - 500 - 16.4 16.5 16.0 18.8
Other domestic vegetable consumers 25 0.09 0.08 6.8 - 0.18 10.1 0.09 - - <1 - - 0.36 - 1.9 - - - - - 0.04 - - - 5 - 550 - 9.7 24.4 15.7 19.6
Potato consumers 25 0.09 0.08 8.2 - 0.18 5.3 0.07 - - <1 - - - - - - - - - - 0.05 - - - 5 - - 620 8.4 14.6 26.5 22.5
Root vegetable consumers 41 0.05 0.10 3.7 - 0.19 4.7 0.04 - - <1 - - 0.22 - 1.2 - - - - 0.02 0.03 - - - 3 - 340 380 8.9 13.2 14.4 25.0
NotesaExpressed as the proportion of the profile members who are exposed to direct radiation.
bGamma ext - houseboat represents occupancy of boat on mud and sand.
cGamma ext - salt marsh represents occupancy over salt marsh.
dGamma ext - sediment includes occupancy over mud; mud and sand; mud and stones; sand and stones; sand.
eGame meat includes rabbits
fPlume times are the sums of individuals' indoor and outdoor times.
The means of the high-rate groups are determined by the 'cut-off' method and are highlighted on the diagonal.
Pathway Name

Annex 7. Summary of profiles for the child age group (6 - 15 years old)
Profile Name Nu
mb
er
of
ind
ivid
ua
ls
Dir
ec
ta
Eg
gs
Fis
h -
Se
a
Fru
it -
Do
me
sti
c
Fru
it a
nd
nu
ts -
Wild
Ho
us
eb
oa
t o
cc
up
an
tsb
Ga
mm
a e
xt
- S
ed
ime
ntc
Me
at
- C
ow
Me
at
- G
am
ed
Me
at
- P
ig
Me
at
- P
ou
ltry
Me
at
- S
he
ep
Wild
fow
l
Milk
Mo
llu
sc
s
Oc
cu
pa
nc
y IN
wa
ter
Oc
cu
pa
nc
y O
N w
ate
r
Plu
me
(IN
; 0
-0.2
5k
m)e
Plu
me
(M
ID;
>0
.25
-0.5
km
)e
Ve
ge
tab
les
- G
ree
n
Ve
ge
tab
les
- O
the
r D
om
es
tic
Ve
ge
tab
les
- P
ota
toe
s
Ve
ge
tab
les
- R
oo
t
- kg kg kg kg h h kg kg kg kg kg kg l kg h h h h kg kg kg kg
Occupants for direct radiation 9 1.00 - - - - - 14 - - - - - - - - 12 - 3120 900 - - - -
Egg consumers 3 - 37.6 - 1.2 0.23 - - - - - - - - 103.7 - - - - - 2.0 2.7 0.84 0.75
Sea fish consumers 5 - - 7.4 - - - 290 - - - - - - - - - - - - - - - -
Domestic fruit consumers 4 - 22.2 - 2.0 0.17 - - - - - - - - 77.8 - - - - - 2.7 2.4 2.9 2.9
Wild fruit and nut consumers 2 - 41.6 - 1.8 0.34 - - - - - - - - 155.6 - - - - - - - 1.3 -
Houseboat occupants 1 - - - - - 3830 - - - - - - - - - - 1010 - - - - - -
Occupants for exposure - Sediment 4 - - 2.5 - - - 490 - - - - - - - - 55 - - - - - - -
Cattle meat consumers 1 - 5.0 - - - - - 16.3 0.45 2.1 1.2 2.8 - - - - - - - - - - -
Game meat consumers 1 - 5.0 - - - - - 16.3 0.45 2.1 1.2 2.8 - - - - - - - - - - -
Pork meat consumers 1 - 5.0 - - - - - 16.3 0.45 2.1 1.2 2.8 - - - - - - - - - - -
Poultry meat consumers 1 - 5.0 - - - - - 16.3 0.45 2.1 1.2 2.8 - - - - - - - - - - -
Sheep meat consumers 1 - 5.0 - - - - - 16.3 0.45 2.1 1.2 2.8 - - - - - - - - - - -
Wildfowl consumers 1 - - - - - - - - - - - - 12.9 - - - - - - - - - -
Milk consumers 2 - 41.6 - 1.8 0.34 - - - - - - - - 155.6 - - - - - - - 1.3 -
Mollusc consumers 2 - - - - - - 4 - - - - - - - 0.73 - - - - - - - -
Occupancy IN water 3 - - - - - - 250 - - - - - - - - 140 - - - - - - -
Occupancy ON water 1 - - - - - 3830 - - - - - - - - - - 1010 - - - - - -
Occupants for plume pathways (inner area) 4 1.00 - - - - - - - - - - - - - - - - 6770 - - - - -
Occupants for plume pathways (mid area) 1 1.00 - - - - - 130 - - - - - - - - - - - 8050 - - - -
Green vegetable consumers 4 - 8.8 - 1.1 - - 9 - - - - - - - - - 4 - - 7.1 5.4 4.2 5.0
Other domestic vegetable consumers 7 - 6.0 - 0.73 - - 5 - - - - - - - - - 2 - - 4.7 5.9 8.8 5.4
Potato consumers 6 - 2.1 - 0.82 - - 6 - - - - - - - - - 2 - - 4.5 5.5 10.3 5.9
Root vegetable consumers 6 - 0.91 - 0.72 - - 6 - - - - - - - - - 2 - - 4.6 3.7 8.1 7.2
NotesaExpressed as the proportion of the profile members who are exposed to direct radiation.
bGamma ext - houseboat represents occupancy of boat on mud and sand.
cGamma ext - sediment includes occupancy over sand; sand and stones.
dGame meat includes rabbits
ePlume times are the sums of individuals' indoor and outdoor times.
The means of the high-rate groups are determined by the 'cut-off' method and are highlighted on the diagonal.
Pathway Name

Annex 8. Summary of profiles for the infant age group (0 - 5 years old)
Profile Name Nu
mb
er
of
ind
ivid
uals
Dir
ecta
Eg
gs
Fis
h -
Sea
Fru
it -
Do
mesti
c
Gam
ma e
xt
- S
ed
imen
tb
Meat
- C
ow
Meat
- S
heep
Wild
fow
l
Milk
Mu
sh
roo
ms
Occu
pan
cy IN
wate
r
Plu
me (
IN;
0-0
.25km
)c
Plu
me (
MID
; >
0.2
5-0
.5km
)c
Veg
eta
ble
s -
Gre
en
Veg
eta
ble
s -
Oth
er
Do
mesti
c
Veg
eta
ble
s -
Po
tato
es
Veg
eta
ble
s -
Ro
ot
- kg kg kg h kg kg kg l kg h h h kg kg kg kg
Occupants for direct radiation 5 1.00 - - - 31 - - - - - - 5220 250 - - - -
Egg consumers 2 - 8.9 - - - 9.5 1.1 - - - - - - - - - -
Sea fish consumers 1 - - 6.5 - - - - - - - - - - - - - -
Domestic fruit consumers 1 - - - 0.42 - - - - - - - - - - 1.5 0.22 2.1
Occupants for exposure - Sediment 4 0.75 - - - 76 - - - - - 5 6490 - - - - -
Cattle meat consumers 2 - 8.9 - - - 9.5 1.1 - - - - - - - - - -
Sheep meat consumers 3 - 5.9 - - - 6.3 1.5 - 28.8 0.02 - - - 0.34 - 0.20 0.10
Wildfowl consumers 1 - - - - - - - 1.4 - - - - - - - - -
Milk consumers 1 - - - - - - 2.4 - 86.5 0.05 - - - 1.0 - 0.59 0.31
Mushroom consumers 1 - - - - - - 2.4 - 86.5 0.05 - - - 1.0 - 0.59 0.31
Occupancy IN water 1 - - - - 150 - - - - - 21 - - - - - -
Occupants for plume pathways (inner area) 3 1.00 - - - 52 - - - - - - 8660 - - - - -
Occupants for plume pathways (mid area) 1 1.00 - - - - - - - - - - - 1250 - - - -
Green vegetable consumers 1 - 0.83 - - - - - - - - - - - 3.5 1.5 8.5 5.9
Other domestic vegetable consumers 2 - 0.41 - 0.21 - - - - - - - - - 1.8 1.5 4.4 4.0
Potato consumers 1 - 0.83 - - - - - - - - - - - 3.5 1.5 8.5 5.9
Root vegetable consumers 2 - 0.41 - 0.21 - - - - - - - - - 1.8 1.5 4.4 4.0
NotesaExpressed as the proportion of the profile members who are exposed to direct radiation.
bGamma ext - sediment includes occupancy over sand; sand and stones.
cPlume times are the sums of individuals' indoor and outdoor times.
The means of the high-rate groups are determined by the 'cut-off' method and are highlighted on the diagonal.
Pathway Name
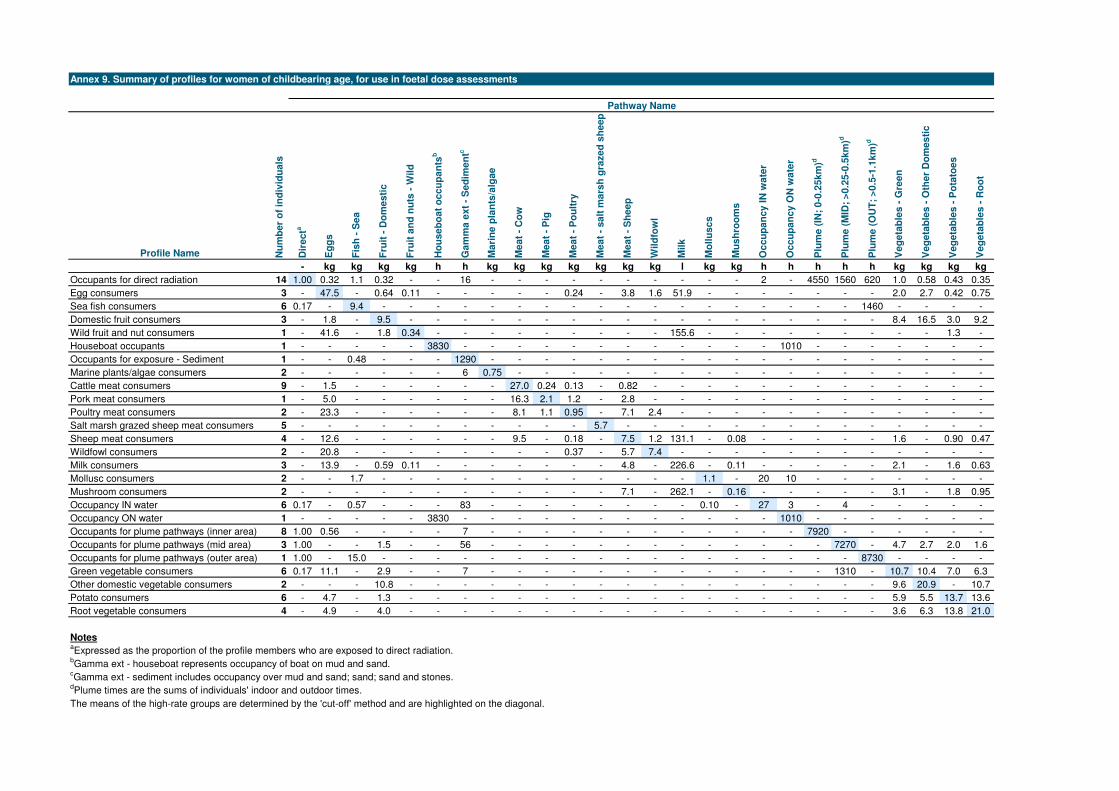
Annex 9. Summary of profiles for women of childbearing age, for use in foetal dose assessments
Profile Name Nu
mb
er
of
ind
ivid
ua
ls
Dir
ec
ta
Eg
gs
Fis
h -
Se
a
Fru
it -
Do
me
sti
c
Fru
it a
nd
nu
ts -
Wil
d
Ho
us
eb
oa
t o
cc
up
an
tsb
Ga
mm
a e
xt
- S
ed
ime
ntc
Ma
rin
e p
lan
ts/a
lga
e
Me
at
- C
ow
Me
at
- P
ig
Me
at
- P
ou
ltry
Me
at
- s
alt
ma
rsh
gra
ze
d s
he
ep
Me
at
- S
he
ep
Wil
dfo
wl
Mil
k
Mo
llu
sc
s
Mu
sh
roo
ms
Oc
cu
pa
nc
y I
N w
ate
r
Oc
cu
pa
nc
y O
N w
ate
r
Plu
me
(IN
; 0
-0.2
5k
m)d
Plu
me
(M
ID;
>0
.25
-0.5
km
)d
Plu
me
(O
UT
; >
0.5
-1.1
km
)d
Ve
ge
tab
les
- G
ree
n
Ve
ge
tab
les
- O
the
r D
om
es
tic
Ve
ge
tab
les
- P
ota
toe
s
Ve
ge
tab
les
- R
oo
t
- kg kg kg kg h h kg kg kg kg kg kg kg l kg kg h h h h h kg kg kg kg
Occupants for direct radiation 14 1.00 0.32 1.1 0.32 - - 16 - - - - - - - - - - 2 - 4550 1560 620 1.0 0.58 0.43 0.35
Egg consumers 3 - 47.5 - 0.64 0.11 - - - - - 0.24 - 3.8 1.6 51.9 - - - - - - - 2.0 2.7 0.42 0.75
Sea fish consumers 6 0.17 - 9.4 - - - - - - - - - - - - - - - - - - 1460 - - - -
Domestic fruit consumers 3 - 1.8 - 9.5 - - - - - - - - - - - - - - - - - - 8.4 16.5 3.0 9.2
Wild fruit and nut consumers 1 - 41.6 - 1.8 0.34 - - - - - - - - - 155.6 - - - - - - - - - 1.3 -
Houseboat occupants 1 - - - - - 3830 - - - - - - - - - - - - 1010 - - - - - - -
Occupants for exposure - Sediment 1 - - 0.48 - - - 1290 - - - - - - - - - - - - - - - - - - -
Marine plants/algae consumers 2 - - - - - - 6 0.75 - - - - - - - - - - - - - - - - - -
Cattle meat consumers 9 - 1.5 - - - - - - 27.0 0.24 0.13 - 0.82 - - - - - - - - - - - - -
Pork meat consumers 1 - 5.0 - - - - - - 16.3 2.1 1.2 - 2.8 - - - - - - - - - - - - -
Poultry meat consumers 2 - 23.3 - - - - - - 8.1 1.1 0.95 - 7.1 2.4 - - - - - - - - - - - -
Salt marsh grazed sheep meat consumers 5 - - - - - - - - - - - 5.7 - - - - - - - - - - - - - -
Sheep meat consumers 4 - 12.6 - - - - - - 9.5 - 0.18 - 7.5 1.2 131.1 - 0.08 - - - - - 1.6 - 0.90 0.47
Wildfowl consumers 2 - 20.8 - - - - - - - - 0.37 - 5.7 7.4 - - - - - - - - - - - -
Milk consumers 3 - 13.9 - 0.59 0.11 - - - - - - - 4.8 - 226.6 - 0.11 - - - - - 2.1 - 1.6 0.63
Mollusc consumers 2 - - 1.7 - - - - - - - - - - - - 1.1 - 20 10 - - - - - - -
Mushroom consumers 2 - - - - - - - - - - - - 7.1 - 262.1 - 0.16 - - - - - 3.1 - 1.8 0.95
Occupancy IN water 6 0.17 - 0.57 - - - 83 - - - - - - - - 0.10 - 27 3 - 4 - - - - -
Occupancy ON water 1 - - - - - 3830 - - - - - - - - - - - - 1010 - - - - - - -
Occupants for plume pathways (inner area) 8 1.00 0.56 - - - - 7 - - - - - - - - - - - - 7920 - - - - - -
Occupants for plume pathways (mid area) 3 1.00 - - 1.5 - - 56 - - - - - - - - - - - - - 7270 - 4.7 2.7 2.0 1.6
Occupants for plume pathways (outer area) 1 1.00 - 15.0 - - - - - - - - - - - - - - - - - - 8730 - - - -
Green vegetable consumers 6 0.17 11.1 - 2.9 - - 7 - - - - - - - - - - - - - 1310 - 10.7 10.4 7.0 6.3
Other domestic vegetable consumers 2 - - - 10.8 - - - - - - - - - - - - - - - - - - 9.6 20.9 - 10.7
Potato consumers 6 - 4.7 - 1.3 - - - - - - - - - - - - - - - - - - 5.9 5.5 13.7 13.6
Root vegetable consumers 4 - 4.9 - 4.0 - - - - - - - - - - - - - - - - - - 3.6 6.3 13.8 21.0
NotesaExpressed as the proportion of the profile members who are exposed to direct radiation.
bGamma ext - houseboat represents occupancy of boat on mud and sand.
cGamma ext - sediment includes occupancy over mud and sand; sand; sand and stones.
dPlume times are the sums of individuals' indoor and outdoor times.
The means of the high-rate groups are determined by the 'cut-off' method and are highlighted on the diagonal.
Pathway Name

This page has been intentionally left blank

This page has been intentionally left blank

Head office
Centre for Environment,
Fisheries & Aquaculture Science
Pakefield Road, Lowestoft,
Suffolk NR33 0HT UK
Tel +44 (0) 1502 56 2244
Fax +44 (0) 1502 51 3865
Web www.cefas.defra.gov.uk
About usCefas is a multi-disciplinary scientific research and
consultancy centre providing a comprehensive range
of services in fisheries management, environmental
monitoring and assessment, and aquaculture to a large
number of clients worldwide.
We have more than 500 staff based in 2 laboratories,
our own ocean-going research vessel, and over 100 years
of fisheries experience.
We have a long and successful track record in
delivering high-quality services to clients in a confidential
and impartial manner.
(www.cefas.defra.gov.uk)
Cefas Technology Limited (CTL) is a wholly owned
subsidiary of Cefas specialising in the application of Cefas
technology to specific customer needs in a cost-effective
and focussed manner.
CTL systems and services are developed by teams that
are experienced in fisheries, environmental management
and aquaculture, and in working closely with clients to
ensure that their needs are fully met.
(www.cefastechnology.co.uk)
Customer focusWith our unique facilities and our breadth of expertise in
environmental and fisheries management, we can rapidly put
together a multi-disciplinary team of experienced specialists,
fully supported by our comprehensive in-house resources.
Our existing customers are drawn from a broad spectrum
with wide ranging interests. Clients include:
• international and UK government departments
• the European Commission
• the World Bank
• Food and Agriculture Organisation of the United Nations
(FAO)
• oil, water, chemical, pharmaceutical, agro-chemical,
aggregate and marine industries
• non-governmental and environmental organisations
• regulators and enforcement agencies
• local authorities and other public bodies
We also work successfully in partnership with other
organisations, operate in international consortia and have
several joint ventures commercialising our intellectual
property.
printed on paper made from a minimum 75% de-inked post-consumer waste
© Crown copyright 2013