Embed Size (px)
Citation preview
Raman Spectroscopy Measurements of the Pressure-Temperature Behavior of LiAlH4
Juan C. Fallas, Wen-Ming Chien, Dhanesh Chandra,* and Vamsi K. KamisettyMaterials Science and Engineering DiVision, Department of Chemical and Metallurgical Engineering (MS 388),UniVersity of NeVada, Reno, Reno, NeVada 89557
Erik D. EmmonsU.S. Army Edgewood Chemical Biological Center, AMSRD-ECB-RT-DL/BLDG E5560, 5183 Blackhawk Road,Aberdeen ProVing Ground, Maryland 21010-5424
Aaron M. CovingtonDepartment of Physics and NeVada Terawatt Facility (MS 220), UniVersity of NeVada,Reno, Reno, NeVada 89557
Raja Chellappa, Stephen A. Gramsch, and Russell J. HemleyGeophysical Laboratory, Carnegie Institution of Washington, 5251 Broad Branch Road NW,Washington, D.C. 20015
Hans HagemannDepartment of Physical Chemistry, UniVersity of GeneVa, 30 Quai Ernest Ansermet,CH-1211, GeneVa, Switzerland
ReceiVed: February 18, 2010; ReVised Manuscript ReceiVed: June 1, 2010
The pressure/temperature phase diagram of LiAlH4 has been constructed by using Raman spectroscopy data.In situ high pressure-temperature experiments were carried out using resistively heated diamond anvil cellsup to 150 °C and 7 GPa. Room temperature phase transitions of monoclinic R-LiAlH4 f δ-LiAlH4 wereobserved at ∼3.2 GPa. As the temperature is increased to ∼100 °C, both the R and δ phases transform to�-LiAlH4 and remain stable up to 5.5 GPa. At temperatures greater than 300 °C, a new γ-LiAlH4 phaseforms. Data of Konovalov (1995) has been used to define the phase boundary between �- and γ-LiAlH4
phases. We present a pressure-temperature phase diagram of LiAlH4 based using diamond anvil cells coupledwith Raman spectroscopy.
I. Introduction
Complex alkali alumino-hydrides, such as NaAlH4 andLiAlH4, with ∼10.5 wt % H are potential candidates forhydrogen storage applications.1 The dehydrogenation charac-teristics of MAlH4 (M ) Na, Li)2 are given by
Bogdanovic et al.3 demonstrated that the addition of Ti-basedcatalysts to NaAlH4 improves the compound chemical kineticswhile decreasing its decomposition temperature. However, thecurrent reversible amount of hydrogen in NaAlH4 is 5.6 wt %H in the presence of a Ti-based catalyst,4 with more work inprogress.5 The mechanochemical addition of catalysts via ballmilling has been shown to be beneficial for enhancing hydrogenrelease kinetics. During ball milling, the hydrides can undergo
local stress-induced transformations1,6 as well as catalyticinteractions. In a systematic study, Andreasen et al.7 concludedthat ball-milled LiAlH4 has faster dehydrogenation kinetics thanunmilled material and identified a proportional relation betweenmilling time and the rate of dehydrogenation. A fundamentalunderstanding of the effects of stress during ball milling isnecessary to improve the process of hydrogenation mechanisms.Thus high pressure studies were undertaken in our studiesprompted by the ab initio studies of Vajeeston et al.8 whopredicted R-LiAlH4 f δ-LiAlH4 structural transition at roomtemperature at 2.6 GPa with a 17% volume collapse. They8
attributed this volume collapse due to electronic transition froms to p states of Al and much larger when compared to NaAlH4
(4%). Talyzin et al.4 reported a reversible structural phasetransition from R′-NaAlH4 to �-NaAlH4 between 14-15 GPa.These pressure-induced transitions were confirmed by Ramanspectroscopy1 and a disorder-order transition to δ-LiAlH4 at∼3 GPa. The structure of the high pressure phase has beendetermined9 to be I2/b with a large reduction in unit cell volume(26.9% at 7.15 GPa) compared to ambient pressure. Hauback10
showed that LiAlH4 presents similar characteristics in thecrystalline structure of other complex aluminum based hydrides,noting that the Al-D distances are comparable in the tetrahedraand octahedra. Sundqvist and Andersson11 mapped the P-T
* To whom correspondence should be addressed. E-mail: [email protected].
3MAlH4 f M3AlH6 + 2Al + 3H2 (1)
M3AlH6 f 3MH + Al + 32
H2 (2)
J. Phys. Chem. C XXXX, xxx, 000 A
10.1021/jp1015017 XXXX American Chemical Society
structural phase diagram of NaBH4 using thermal measurementsand their results show with the tetragonal to cubic transitionof NaBH4 in the P-T phase diagram (up to ∼2 GPa and∼250 °C). A temperature-dependent Raman spectroscopy studyon NaAlH4 revealed possible catalytic interaction of Ti withthe AlH4
- anion, leading to a weakening of the Al-H bondstrength, and disintegration of the structural unit.12 Going backto LiAlH4, Majzoub et al.5 reported decomposition of LiAlH4
above 145 °C decomposed to according to reaction 1 fromRaman spectroscopy5 measurements. Majzoub et al.5 wereunable to observe any vibrational bands in the Raman spectrumat 145 °C, although the presence of Li3AlH6 should have beendetectable. The presence of micro or nanocrystalline aluminummay have led to excessive Rayleigh scattering, making it difficultto observe the Raman spectra, as commented in that study.LiAlH4 must be handled in an inert atmosphere to avoid itsdecomposition. Ke et al.13 demonstrated that LiAlH4 decomposesat all temperatures and pressures studied by a computationalsimulation method. Mal’tseva et al.14 emphasized that it isimportant to take this decomposition into account in theseLiAlH4 studies and demonstrated that the sample decomposedinto a mixture of hydrides ambient pressure and temperature.They14 showed that white powder of LiAlH4 turned gray uponformation of metallic aluminum, which demonstrating thedecomposition of the sample. As mentioned earlier, there havebeen some prior studies on pressure-induced transitions at roomtemperature on LiAlH4; however, there are few reports oncombined P-T behavior. Bulychev et al.15 reported a phasetransition at ∼7 GPa and 250-300 °C from � (tetragonal) to γ(orthorhombic)-LiAlH4; and they also found �- and γ-LiAlH4
phases present under ambient conditions. In addition, this authorobserved a change in the coordination number of Al3+ ion from4 to 6 when the phase transition occurs. In our study, we haveextended the phase diagram of LiAlH4 studies from 22 to 150 °Cand up to 7 GPa using in situ Raman spectra measurements.The pressure effects on AlH4 unit are discussed in the variousphase fields at higher temperatures.
II. Experimental Methods
The samples of LiAlH4 (95% purity) were procured from AlfaAesar and were used without any further purification process.
Sample preparation was performed in a glovebox to avoid thereaction of the material with moisture and oxygen. Also, thediamond anvil cell was loaded in an inert atmosphere to preventthe same reaction possibility. Raman spectroscopy experimentswere performed in the Optical Properties of Materials Laboratoryin the Physics Department at the University of Nevada, Reno.The Raman spectral data were obtained with a Renishaw InViaRaman microspectroscopy system with a 20× objective lensand 514.5 nm laser using 5-10 mW of laser power incidentupon the DAC. Further details of the diamond anvil cell andRaman spectrometer are available in Emmons et al.16,17 TheRaman scattering wavelength was calibrated using Ne lines, anda small offset correction was performed.18 The LiAlH4 samplein the DAC was heated with an Omega temperature controllersystem attached to an adjustable resistive heater. The DAC usedhad diamonds with 600 µm culets, and samples were loaded ina ∼200 µm diameter hole in an Inconel gasket with no pressuremedia. Due to the reactivity of the sample, the commonly used4:1 methanol/ethanol pressure media was not used in this study.The ruby fluorescence method19 was used to determine thepressure inside the DAC (Cr3+-doped Al2O3, R1 line at 694.2nm under ambient conditions). Because the sample was heated,it is important to take into account a temperature correction inthe measurement of the pressure in the DAC by the rubyfluorescence technique. Vos and Schouten20 found an increasein the ruby wavelengths with increasing temperature at a rateof 0.0068 nm/K. Several ruby chips were distributed within thesample for the pressure measurements. The DAC was loadedand closed with minimal pressure. Because of the absence of apressure medium, the effect of nonhydrostaticity needed to beconsidered. However, observation of the ruby R1 and R2 linesshowed that they were well resolved, indicating a reasonablyhydrostatic environment was maintained during all measurements.
III. Results
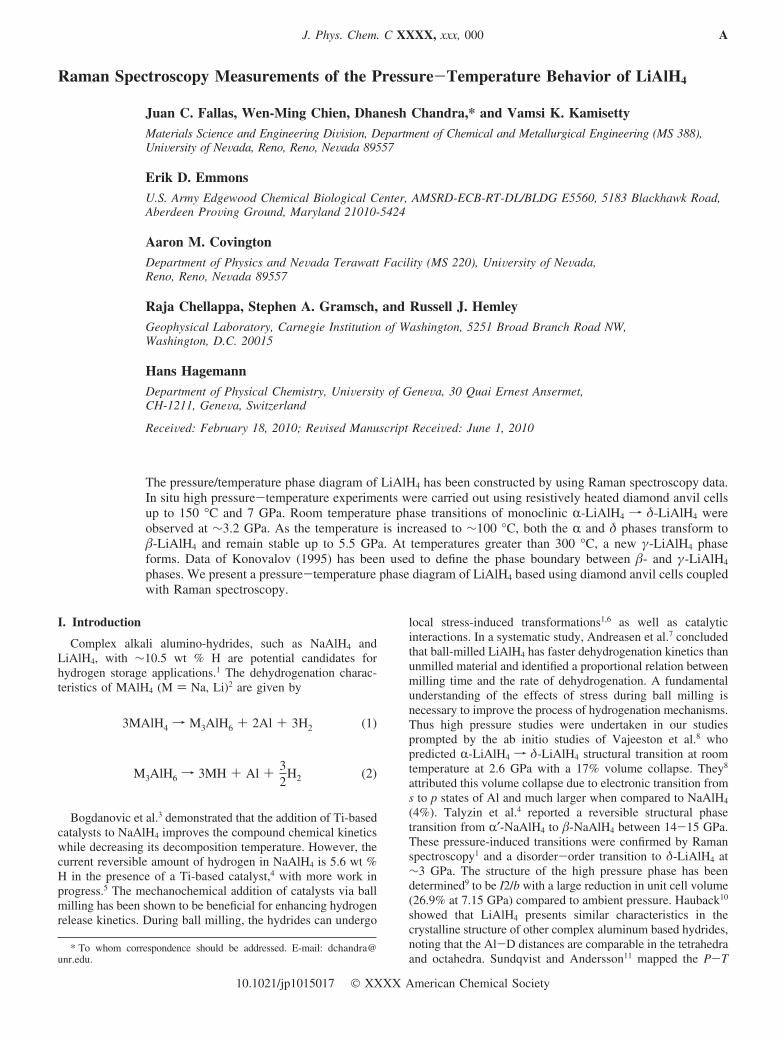
Raman Spectroscopy Results. The Raman spectrum ofLiAlH4 at ∼0 GPa and room temperature is shown in Figure 1.The assignment of the various modes is given in Table 1 and isin good agreement with literature.1 The spectrum is dominatedby the internal modes (bending and stretching) due to Al-Hbonds. The relatively high frequency indicates that the AlH4
-
Figure 1. Mode assignments for LiAlH4 from this study (as-loaded sample, ∼0 GPa), showing the various vibrational modes. Peak assignmentsare given in Table 1.
B J. Phys. Chem. C, Vol. xxx, No. xx, XXXX Fallas et al.
is a stable ion fixed in the lattice. Gorbunov et al.21 also founda librational mode for LiAlH4 at 472 cm-1. The pressure- andtemperature-induced changes to the [AlH4]- unit providesinformation on the strength of Al-H bonding and is useful tounderstand hydrogen release mechanisms.
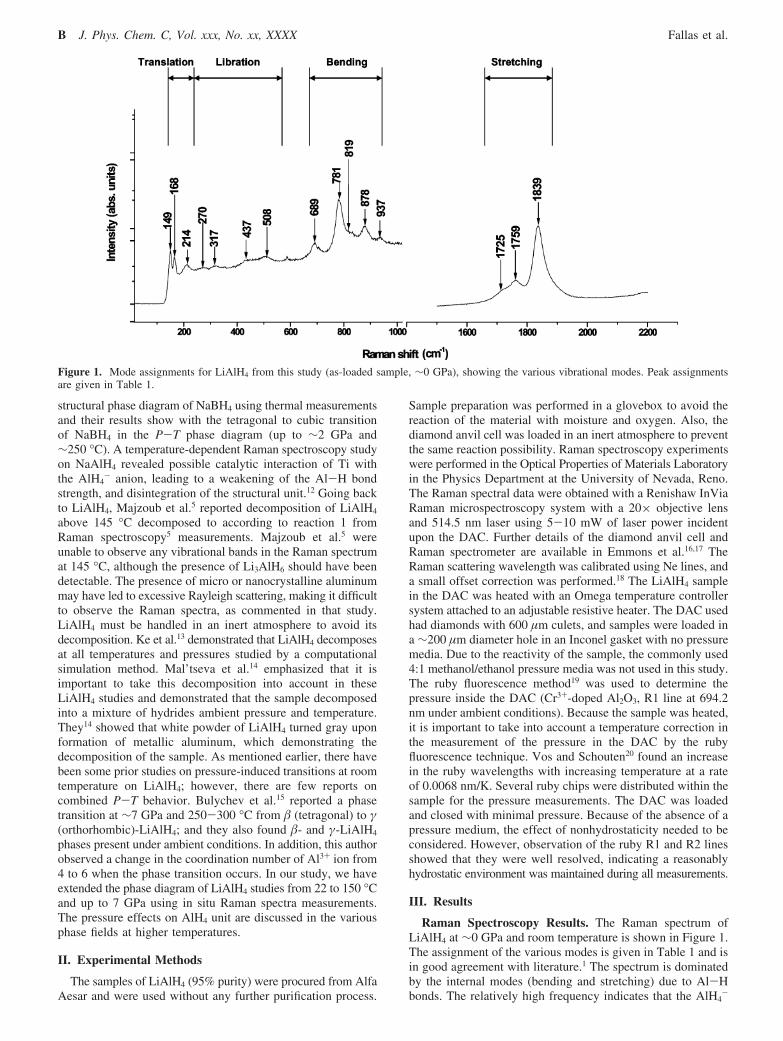
A good reference for the librational motion in LiAlH4 is thestudy of Temme and Waddington.22 The frequency shiftsindicate that the temperature increase in the system at constantpressure is producing a phase transition from R-LiAlH4 toδ-LiAlH4. A shifting in the band corresponding to the stretchingmode is probably the most significant difference in both Figures1 and 2, moving from 1839 to 1749 cm-1. The disappearanceof the bands at 1725 and 1759 cm-1 at high pressure in theAl-H bond is transcendental to considerate a new molecularstructure in the sample due a phase transition. Other changesin the vibrational modes and peaks at high pressure areperceptible in the bending region, having prominent peaks at1124 and 1154 cm-1, with minor bands at 911, 778, and 715
cm-1. A shifting in the peaks of the librational mode is observedat ∼6.6 GPa, with bands of moderated intensity at 336, 387,478, and 514 cm-1. Finally, the translation mode has regularpeaks also at higher frequencies than the data obtained at roomtemperature and pressure.
In this case, two peaks at 222 and 252 cm-1 are present inthis zone of the spectra. There is no evidence or studiesinvolving high pressure or temperature assignment of vibrationalmodes in LiAlH4.
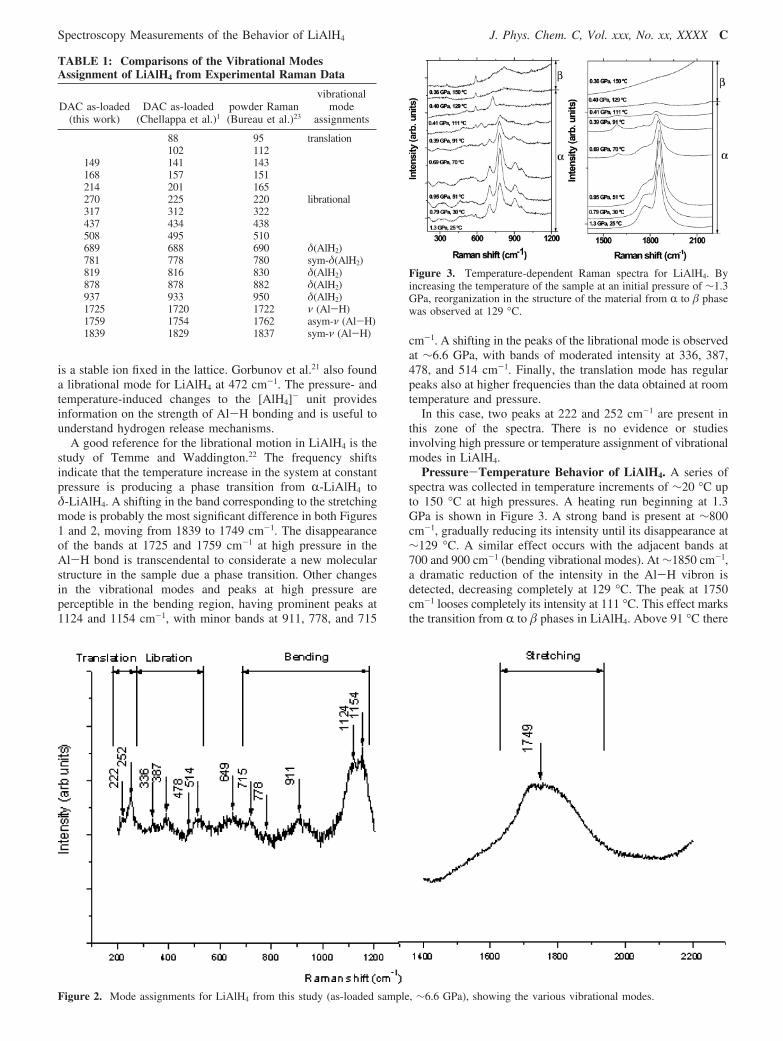
Pressure-Temperature Behavior of LiAlH4. A series ofspectra was collected in temperature increments of ∼20 °C upto 150 °C at high pressures. A heating run beginning at 1.3GPa is shown in Figure 3. A strong band is present at ∼800cm-1, gradually reducing its intensity until its disappearance at∼129 °C. A similar effect occurs with the adjacent bands at700 and 900 cm-1 (bending vibrational modes). At ∼1850 cm-1,a dramatic reduction of the intensity in the Al-H vibron isdetected, decreasing completely at 129 °C. The peak at 1750cm-1 looses completely its intensity at 111 °C. This effect marksthe transition from R to � phases in LiAlH4. Above 91 °C there
TABLE 1: Comparisons of the Vibrational ModesAssignment of LiAlH4 from Experimental Raman Data
DAC as-loaded(this work)
DAC as-loaded(Chellappa et al.)1
powder Raman(Bureau et al.)23
vibrationalmode
assignments
88 95 translation102 112
149 141 143168 157 151214 201 165270 225 220 librational317 312 322437 434 438508 495 510689 688 690 δ(AlH2)781 778 780 sym-δ(AlH2)819 816 830 δ(AlH2)878 878 882 δ(AlH2)937 933 950 δ(AlH2)1725 1720 1722 ν (Al-H)1759 1754 1762 asym-ν (Al-H)1839 1829 1837 sym-ν (Al-H)
Figure 2. Mode assignments for LiAlH4 from this study (as-loaded sample, ∼6.6 GPa), showing the various vibrational modes.
Figure 3. Temperature-dependent Raman spectra for LiAlH4. Byincreasing the temperature of the sample at an initial pressure of ∼1.3GPa, reorganization in the structure of the material from R to � phasewas observed at 129 °C.
Spectroscopy Measurements of the Behavior of LiAlH4 J. Phys. Chem. C, Vol. xxx, No. xx, XXXX C

are signals of the phase transition zone, with new peaks at ∼600and ∼650 cm-1, surviving only the first one in the new phase.Above 70 °C, similar behavior can be observed in the highfrequency region, specifically at ∼1600 cm-1.
In Figure 4, pressure was initially set near 3 GPa at roomtemperature, to be slightly below the pressure-induced orien-tational-disorder phase transition of LiAlH4. Significant changesare seen between 60-80 °C with a drop in pressure from 2.6to 1.5 GPa. At 3 GPa, between 60 and 80 °C, Al-H bands at1850 cm-1 disappear completely. The new band at 1600 cm-1
is seen up to 147 °C without broadening. At 3.0 GPa, a band at1100 cm-1 already present at 22 °C undergoes significantchanges between 60 and 80 °C, with further changes between124 and 148 °C. In the lower frequency region, there is a lossof crystallinity with the disappearance of the lattice modes.
An increase of the intensity in the peak is seen at ∼1100cm-1 starting at the phase transition temperature (∼60 °C).Additionally, the formation of new bands at ∼650 cm-1 providessubstantial evidence of the phase transition in the material.Softening in the intensity of the strong peak at ∼800 cm-1 wasobserved and the shoulders present at 700 and 900 cm-1. TheRaman spectra at an initial pressure of ∼3.3 GPa showedevidence for structural changes in the material upon heating(Figure 5); this pressure was selected to be just above theorientational disorder transition pressure. The Al-H stretchingmodes show clear evidence of the transition, with a softening
above the transition temperature and a sharpening of the mainfeature in this region.
Between 104 and 129 °C, disappearance of the 1780 cm-1
band occurs, along with the appearance of new bands at 650,900, and 1120 cm-1, being characteristic of � phase as will beexplained. We designed the experiments by intentionally select-ing the pressure values slightly below and above the R S δphase transition in LiAlH4, starting from the δ phase of thematerial under study (in Figure 5). Increasing the temperatureinitially leads to a slight pressure drop due the DAC and itsrelaxation brought a combination of factors. When the temper-ature was raised from 32 to 52 °C, the pressure dropped from3.4 to 2.9 GPa still maintaining δ phase (Figure 5). Also, the δphase is stable at higher pressures, 4.4 GPa (Figure 6) and 6.6GPa (Figure 7). Probably the best point of reference is the strongband that exists at ∼1100 cm-1 (bending mode zone), which iscommon for the figures with δ-LiAlH4 Raman spectra. Otherfeatures such as those present at ∼650 and ∼250 cm-1 arecharacteristics in that specific phase. Apart, the peaks detectedin the � region of Figure 4 share similarities with the obtainedin the � zone of Figure 5, as well as the bands detected in furtherexperiments (∼1100, ∼650, and ∼900 cm-1). The heating runstarting from δ-LiAlH4 phase at 4.4 (30 °C) and 6.2 GPa areshown in Figures 6 and 7 with changes occurring 109-133 °Cand 120-140 °C, respectively.
Figure 4. Temperature-dependent Raman spectra for LiAlH4. Byincreasing the temperature of a sample initially pressurized to ∼3.0GPa, a phase transition from R to � can be observed between 60 and80 °C.
Figure 5. Temperature-dependent Raman spectra for LiAlH4. Byincreasing the temperature of the sample at an initial pressure of ∼3.3GPa, a phase transition from δ- to �-LiAlH4 can be observed between104 and 129 °C.
Figure 6. Temperature-dependent Raman spectra for LiAlH4. Byincreasing the temperature of the sample at initial pressure of ∼4.4GPa, a phase transition from δ- to �-LiAlH4 can be observed between109-133 °C.
Figure 7. Temperature-dependent Raman spectra for LiAlH4. Byincreasing the temperature of the sample at an initial pressure of ∼6.6GPa, a phase transition from δ- to �-LiAlH4 can be observed between120-140 °C.
D J. Phys. Chem. C, Vol. xxx, No. xx, XXXX Fallas et al.
Both Figures 5 and 6 share features because they are havinga similar δ- to �-LiAlH4 transition, such as the prominent peakat ∼1100 cm-1, which increase its intensity when the phasetransition happen. The peaks present at ∼650, ∼250, and ∼900cm-1 are also common in Figures 6 and 7. The �-LiAlH4
characteristic bands explained for the case of Figures 4 and 5are present in the data obtained for the specific experimentsunder study. The Al-H bond behavior is notorious in Figure6, where at 109 °C the band present at ∼1700 cm-1 increasesits sharpness due the reach of the phase transition temperature.Nevertheless, Figure 7 shows an evolution on the stretchingbond, while the temperature is increased. At 120 °C, when thephase transition occurs, it is possible to see how the bandbecomes sharp.
IV. Discussion
Hydrogen release in aluminohydrides must involve thebreaking of the strong covalent Al-H bond in the [AlH4]-
unit.25,26 It is interesting to note that at room temperature thereis a pressure-induced weakening of Al-H bonds in LiAlH4
8,9,27
as well as B-H bonds in NaBH411,28 and LiBH4
29 resulting indisorder in the high pressure phases. There is a parallel to thepressure and temperature effects on AlH4 unit5 and in case ofNaAlH4 that Al-H stretching and bending modes do not weakennoticeably with pressure remaining stable even in the melt. Asmentioned earlier, the action of Ti-based catalysts may be tofacilitate the weakening of the AlH4 tetrahedra. It is informativeto compare the experimental results shown in Figures 4 and 5.The main difference observed is that the pressure drop due totemperature increases in Figure 5 is not as large as that observedin Figure 4, resulting in a more constant pressure in theexperiment. The shifting of the bands in Figure 4 presents aclear transition. Although the shifting of the features in Figure5 is not as remarkable as in Figure 4, the δ-LiAlH4 to �-LiAlH4
phase transition between 104 and 129 °C can be observed. Therewere also significant changes in the Al-H stretching modes athigher temperatures. At low temperatures in the orientationallydisordered phase (Figures 5-7), there is a broad Al-Hstretching feature present in the vicinity of 1700 cm-1. As thesample is heated, a sharper feature, in the range from 1630-1680cm-1, becomes superimposed upon the broad peak. Thesechanges are correlated with the changes in the Al-H bendingmodes and indicate significant structural changes in the sample.The sharper profile of the features may indicate a decrease inthe level of disorder. Another valuable experimental publicationrelated to the present study was performed by Pitt et al.9 usingneutron diffraction to characterize the crystalline structure ofLiAlD4 at high pressure. Their research determined that thereis a coexistence of phases at 60 °C and 7.15 GPa, R-LiAlD4
has lattice parameters of a ) 4.328(2) Å, b ) 6.715(2) Å, c )7.231(3) Å, and � ) 105.29(5)°, with a space group of P21/cand δ-phase of LiAlD4 is monoclinic (I2/b), and its latticeparameters are a ) 4.099(3) Å, b ) 4.321(4) Å, c ) 10.006(3)Å, and γ ) 88.43(4)°, being consistent with a distorted AlH4
-
tetrahedron. They also found a reversible phase transition (from� to R phase) when the sample underwent a slow pressurerelease and was then cooled from a temperatures of 60 °C. At295 K, Hauback et al.30 performed a study on LiAlD4 by neutrondiffraction and powder X-ray diffraction. A trigonal bipyramidof five deuterium atoms from five neighboring [AlD4]- tetra-hedral surrounds the Li atoms. At 295 K, LiAlD4 has latticeparameters of a ) 4.83(1), b ) 7.80(1), and c ) 7.90(1) Å. Atlow temperatures, there is an increase in a minor distortion ofthe AlD tetrahedra. Also, the experiments determined that the
distances of the Al-D bond are in the range of 1.60(7)-1.63(5)Å at 295 K and 1.60(6)-1.65(5) Å at 8 K. In an early study ofLiAlH4, Bulychev et al.15 also made reference to the crystalstructure properties of this material and its phases. In theirquenched samples, the R-phase (δ in our nomenclature) is givenas monoclinic, with a calculated density of 0.917 g/cm3 andunit cell parameters of a ) 9.6 Å, b ) 7.86 Å, c ) 7.90 Å, andz ) 4. The structure of �-LiAlH4 is tetragonal, with latticeparameters of a ) 6.75 Å, c ) 8.081 Å, z ) 6, and a calculateddensity of 1.02 g/cm3. Finally, the γ-phase is orthorhombic, withlattice parameters of a ) 5.11 Å, b ) 9.21 Å, c ) 4.29 Å, andz ) 4. The γ-LiAlH4 density was calculated to be 1.20 g/cm3.Talyzin and Sundquist27 reported that the crystal structure inthe high pressure R-LiAlH4 phase is not the same as that ofR-NaAlH4 after observing a triplet structure for the Al-Hstretching modes in high pressure �-LiAlH4. This conclusionis based upon the observation of two strong peaks in the Ramanspectra of LiAlH4, in the Al-H stretching region, and is incontrast with the results of Chellappa et al.1 It is not obvious todraw a clear correlation between Al-H bond lengths in LiAlH4
measured by neutron powder diffraction for the alpha and deltaphases (Pitt et al.9) and the Al-H stretching mode seen byRaman spectroscopy. Indeed, the Al-H Raman stretchingmodes at room temperature shift significantly to lower frequen-cies with increasing pressure at the alpha-delta phase transition(around 3 GPa) except for one weak band, while the Al-Dbond length becomes shorter. This conflicts with the correlationreported by Yukawa et al.31 for the sodium alanates; thus, thisdiscrepancy exists. If this correlation is generally applicable, itimplies that for LiAlH4 the Al-H bonds become longer at higherpressures, which must then be associated with an increase ofthe coordination number (for example, from 4 to 6) for thecentral Al atom. This is in principle possible, but it is notconfirmed by the neutron powder diffraction data by Pitt et al.9
Another potential explanation for this shift to lower frequenciesmay arise from a change of the bonding properties, that is, theLi-H bonds become stronger and the Al-H bonds becomeweaker upon compression. Note that the Raman stretching bandsobserved in this study are rather broad, which does not help tomonitor the changes and also suggests either dynamical behavioror disorder in the structure.
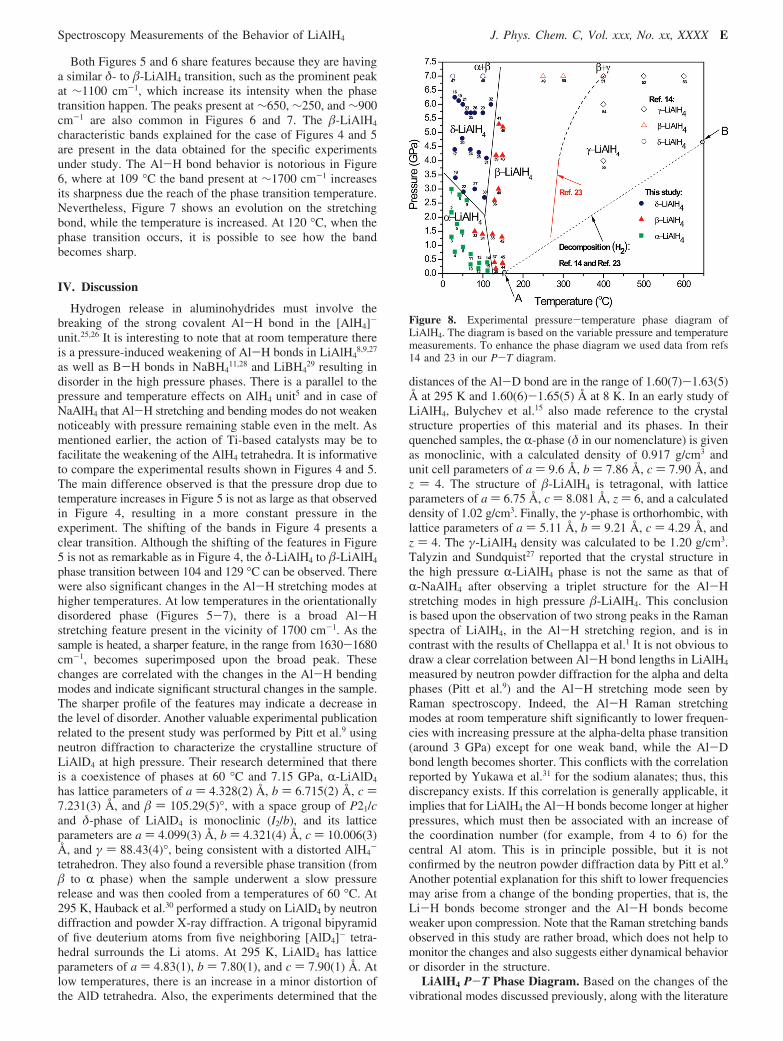
LiAlH4 P-T Phase Diagram. Based on the changes of thevibrational modes discussed previously, along with the literature
Figure 8. Experimental pressure-temperature phase diagram ofLiAlH4. The diagram is based on the variable pressure and temperaturemeasurements. To enhance the phase diagram we used data from refs14 and 23 in our P-T diagram.
Spectroscopy Measurements of the Behavior of LiAlH4 J. Phys. Chem. C, Vol. xxx, No. xx, XXXX E
data, the P-T phase diagram of LiAlH4 is established, as shownin Figure 8. The transition from R to � is sluggish, with apossibility of an R+� mixed phase between 80-100 °C and∼1.5 GPa. A dramatic weakening of the Al-H bond is seen inFigure 4 from 60 to 90 °C. In the phase transition from R-LiAlH4
to �-LiAlH4, it is also remarkable that the Raman spectrum ofthis phase presents similar features compared to a sample ofNaAlH4 cooled from 508 K to room temperature, which havebeen assigned to AlH6 vibrations by analogy with reported datafor Na3AlH6 (Bureau). The γ phase is characterized by verybroad bands at 1750 and 1100 cm-1. The band at 1650 cm-1
could in fact originate from R phase, with a transition temper-ature increasing with pressure. Note that this phase does notshow the expected AlH4 bending modes around 750 and 900cm-1. The transition among the phases � and γ in the PTphase diagram was observed in the experiments of Konovalovet al.,24 who plotted a line in the phase from approximately250-350 °C and 0.5-7.5 GPa. The line is shown in the phasediagram below. Bulychev et al.15 also detected phase transi-tions in the PT phase diagram of LiAlH4 in their quenchedsamples. At a constant pressure of approximately 7 GPa, theywere able to observe a phase transition in the material fromδ-LiAlH4 to γ-LiAlH4 at 400 °C. The transition matches withthe Konovalov et al.24 study, and examine regions of the PTphase diagram above the maximum temperature used in thepresent study. Finally, the decomposition line was ap-proximated using data of Block and Gray32 establishing onepoint (A) at atmospheric pressure and 150 °C decompositiontemperature. We performed a linear extrapolation of thedecomposition line using Bulychev et al.15 data at a higherpressure point (B), at 7 GPa and 900 °C. A summary tableof LiAlH4 (LiAlD4) from this study and others’ results arelisted in Table 2.
V. Conclusions
A P-T phase diagram of LiAlH4 has been determined from0-6 GPa and 25-150 °C using in situ Raman spectroscopy.The room temperature phase transition from ambient pressureR-LiAlH4 to δ-LiAlH4 was observed at ∼3.0 GPa, in agreementwith literature. In the high frequency region of the Ramanspectra it is possible to see a significant change in the peaks ofthe Al-H stretching modes, corresponding to the phase transi-tions in each case. X-ray diffraction measurements are requiredto resolve the nature of the phases in LiAlH4 and can alsoprovide a better understanding of volume collapse phenomenain the material.
Acknowledgment. We thank our DOE funding agency forthe support of the program (CDAC: DE-FC-03-03NA00144).
We gratefully acknowledge the support of Carnegie Institu-tion of Washington. We also thank the Optical Properties ofMaterials Laboratory, UNR, and gratefully acknowledge supportfrom the US DOE under Grant No. DEFC52-06NA27616. J.C.F.acknowledges the Costa Rican National Council of Science andTechnology (CONICIT).
Supporting Information Available: Symmetry analysis forLiAlH4. Tables 3-5 summarize previous experimental resultsand define the nomenclature used in this study for the differentphases encountered for LiAlH4 This material is available freeof charge via the Internet at http://pubs.acs.org.
References and Notes
(1) Chellappa, R. S.; Chandra, D.; Gramsch, S. A.; Hemley, R. J.; Lin,J. F.; Song, Y. J. Phys. Chem. B 2006, 110, 11088.
(2) Dymova, T. N.; Aleksandrov, D. P.; Konoplev, V. N.; Silina, T. A.;Sizareva, A. S. Koordinatsionnaya Khimiya 1994, 20, 279.
(3) Bogdanovic, B.; Schwickardi, M. J. Alloys Compd. 1997, 253, 1.(4) Talyzin, A. V.; Sundqvist, B. High Pressure Res. 2006, 26, 165.(5) Majzoub, E.; Ronnebro, E.; Seballos, L.; Newhouse, R.; Zhang,
J. Z. Sol. Hydrogen Nanotechnol. II 2007, 6650.(6) Balema, V. P.; Pecharsky, V. K.; Dennis, K. W. J. Alloys Compd.
2000, 313, 69.(7) Andreasen, A.; Vegge, T.; Pedersen, A. S. J. Solid State Chem.
2005, 178, 3672.(8) Vajeeston, P.; Ravindran, P.; Vidya, R.; Fjellvag, H.; Kjekshus,
A. Phys. ReV. B 2003, 68.(9) Pitt, M. P.; Blanchard, D.; Hauback, B. C.; Fjellvag, H.; Marshall,
W. G. Phys. ReV. B 2005, 72 (21), 214113/1–214113/9.(10) Hauback, B. Z. Kristallogr. 2008, 636.(11) Sundqvist, B.; Andersson, O. Phys. ReV. B 2006, 73.(12) Majzoub, E. H.; McCarty, K. F.; Ozolins, V. Phys. ReV. B 2005,
71, 024118/1-024118/10.(13) Ke, X.; Chen, C. F. Phys. ReV. B 2007, 76, 024112.(14) Mal’tseva, N. N.; Golovanova, A. I. Russ. J. Appl. Chem. 2000,
73, 747.(15) Bulychev, B. M.; Verbetskii, V. N.; Semenenko, K. N. Russ.
J. Inorg. Chem. 1977, 22, 1611.(16) Emmons, E. D.; Kraus, R. G.; Duvvuri, S. S.; Thompson, J. S.;
Covington, A. M. J. Polym. Sci., Part B: Polym. Phys. 2007, 45, 358.(17) Emmons, E. D.; Velisavljevic, N.; Schoonoiver, J. R.; Dattelbaum,
D. M. Appl. Spectrosc. 2008, 62, 142.(18) Song, Y.; Hemley, R. J.; Mao, H. K. A.; Liu, Z. X.; Herschbach,
D. R. Chem. Phys. Lett. 2003, 382, 686.(19) Gillet, P.; Hemley, R. J.; McMillan, P. F. Vibrational properties at
high pressures and temperatures. In. Ultrahigh-Press. Mineral. 1998, 37,525.
(20) Vos, W. L.; Schouten, J. A. J. Appl. Phys. 1991, 69, 6744.(21) Gorbunov, V. E.; Gavrichev, K. S.; Sharpataya, G. A. Zh. Neorg.
Khim. 1988, 33, 2678.(22) Temme, F. P.; Waddington, T. C. J. Chem. Soc., Faraday Trans.
1973, 69, 783.(23) Bureau, J. C.; Bonnetot, B.; Claudy, P.; Eddaoudi, H. Mater. Res.
Bull. 1985, 20, 1147.(24) Konovalov, S. K.; Bulychev, B. M. Inorg. Chem. 1995, 34, 172.(25) Yoshino, M.; Komiya, K.; Takahashi, Y.; Shinzato, Y.; Yukawa,
H.; Morinaga, M. J. Alloys Compd. 2005, 404, 185.
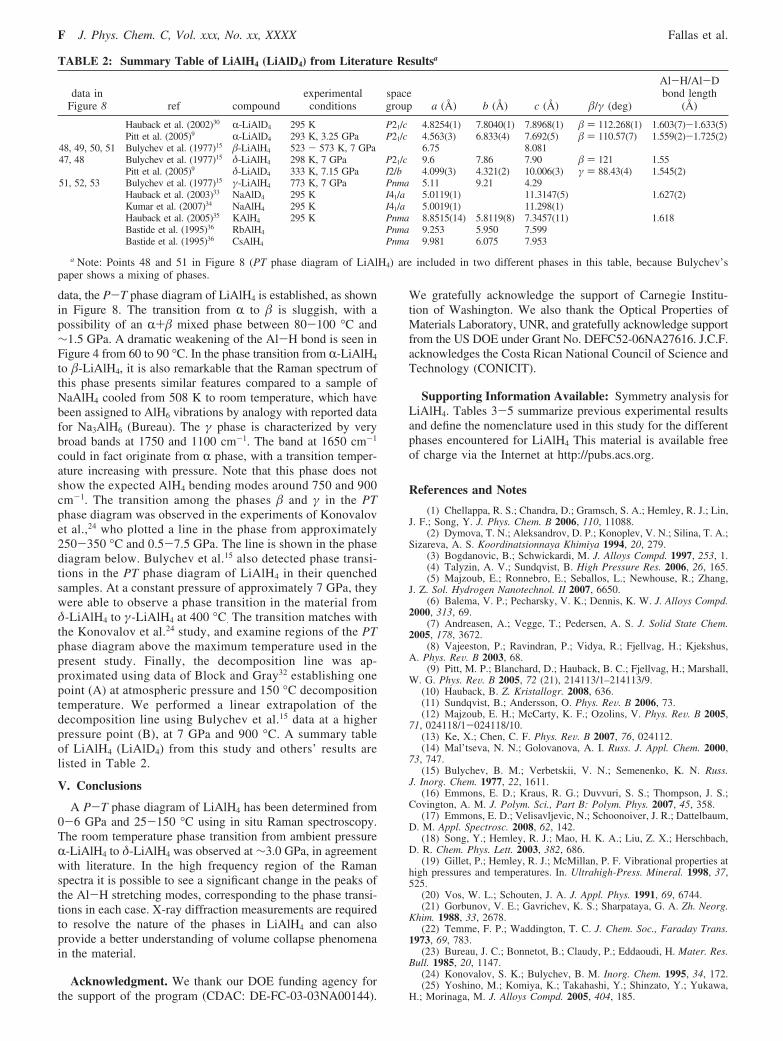
TABLE 2: Summary Table of LiAlH4 (LiAlD4) from Literature Resultsa
data inFigure 8 ref compound
experimentalconditions
spacegroup a (Å) b (Å) c (Å) �/γ (deg)
Al-H/Al-Dbond length
(Å)
Hauback et al. (2002)30 R-LiAlD4 295 K P21/c 4.8254(1) 7.8040(1) 7.8968(1) � ) 112.268(1) 1.603(7)-1.633(5)Pitt et al. (2005)9 R-LiAlD4 293 K, 3.25 GPa P21/c 4.563(3) 6.833(4) 7.692(5) � ) 110.57(7) 1.559(2)-1.725(2)
48, 49, 50, 51 Bulychev et al. (1977)15 �-LiAlH4 523 - 573 K, 7 GPa 6.75 8.08147, 48 Bulychev et al. (1977)15 δ-LiAlH4 298 K, 7 GPa P21/c 9.6 7.86 7.90 � ) 121 1.55
Pitt et al. (2005)9 δ-LiAlD4 333 K, 7.15 GPa I2/b 4.099(3) 4.321(2) 10.006(3) γ ) 88.43(4) 1.545(2)51, 52, 53 Bulychev et al. (1977)15 γ-LiAlH4 773 K, 7 GPa Pnma 5.11 9.21 4.29
Hauback et al. (2003)33 NaAlD4 295 K I41/a 5.0119(1) 11.3147(5) 1.627(2)Kumar et al. (2007)34 NaAlH4 295 K I41/a 5.0019(1) 11.298(1)Hauback et al. (2005)35 KAlH4 295 K Pnma 8.8515(14) 5.8119(8) 7.3457(11) 1.618Bastide et al. (1995)36 RbAlH4 Pnma 9.253 5.950 7.599Bastide et al. (1995)36 CsAlH4 Pnma 9.981 6.075 7.953
a Note: Points 48 and 51 in Figure 8 (PT phase diagram of LiAlH4) are included in two different phases in this table, because Bulychev’spaper shows a mixing of phases.
F J. Phys. Chem. C, Vol. xxx, No. xx, XXXX Fallas et al.
(26) Chellappa, R. S.; Chandra, D.; Somayazulu, M.; Gramsch, S. A.;Hemley, R. J. J. Phys. Chem. B 2007, 111, 10785.
(27) Talyzin, A. V.; Sundqvist, B. Phys. ReV. B 2004, 70, 180101/1–180101/3.
(28) Araujo, C. M.; Ahuja, R.; Talyzin, A. V.; Sundqvist, B. Phys. ReV.B 2005, 72, 054125/1-054125/5.
(29) Talyzin, A. V.; Andersson, O.; Sundqvist, B.; Kurnosov, A.;Dubrovinsky, L. J. Solid State Chem. 2007, 180, 510.
(30) Hauback, B. C.; Brinks, H. W.; Fjellvag, H. J. Alloys Compd. 2002,346 (1-2), 184–189.
(31) Yukawa, H.; Morisaku, N.; Li, Y.; Komiya, K.; Rong, R.; Shinzato,Y.; Sekine, R.; Morinaga, M. J. Alloys Compd. 2007, 446-447, 242–247.
(32) Block, J.; Gray, A. P. Inorg. Chem. 1965, 4, 304.(33) Hauback, B. C.; Brinks, H. W.; Jensen, C. M.; Murphy, K.;
Maeland, A. J. J. Alloys Compd. 2003, 358, 142–145.(34) Kumar, R. S.; Kim, E.; Tschauner, O.; Corneluis, A. L.; Sulic, M. P.;
Jensen, C. M. Phys. ReV. B 2007, 75, 174110.(35) Hauback, B. C.; Brinks, H. W.; Heyn, R. H.; Blom, R.; Fjellvag,
H. J. Alloys Compd. 2005, 394, 35–38.(36) Bastide, J. P.; El Hajri, J.; Claudy, P.; El Hajbi, A. Synth. React.
Inorg., Met.-Org. Chem. 1995, 25, 1037–1047.
JP1015017
Spectroscopy Measurements of the Behavior of LiAlH4 J. Phys. Chem. C, Vol. xxx, No. xx, XXXX G