Embed Size (px)
Citation preview

RANKING OF DISTRICTS ON THE BASIS OF PROGRAM REVIEW
INDICATORS
Apr - Jul 2015
OBJECTIVE
• The objective of the analysis is to rank districts based
on their performance
• Performance is measured using set of input and
output indicators used for program reviews by
GoUP
Variables Mean Std. Dev. Min Max
% change in OPD from last year 16.1 23.9 -29.4 103.9
% change in IPD from last year 17.8 55.8 -51.9 228.9
Bed occupancy rate 18.3 16.4 0.0 99.5
% change in pathology investigation from last year 63.4 74.6 -50.9 411.6
% Institutional deliveries 37.2 10.8 11.0 71.3
% of beneficiaries received JSY 81.3 81.5 21.6 754.3
% % Institutional deliveries ASHA received JSY
benefits 52.1 18.7 12.2 112.8
% of C-section deliveries 3.3 4.3 0.0 24.1
% fully immunized children 79.8 15.1 46.7 154.1
dropout children from BCG to Measles -6.9 12.2 -61.0 18.9
% of Sterilization to total workload 2.2 2.4 0.0 12.9
% of IUCD insertion to total workload 10.5 5.1 2.4 24.2
% of PPIUCD insertion to total IUCD inserted 9.1 10.7 0.0 70.0
% Cataract Operation against target 2.2 3.0 0.0 16.0
% facilities uploaded HMIS data on or before 5th 87.4 18.9 14.8 100.0
% of estimated preg women registered in MCTS 48.8 13.2 22.5 85.8
% of estimated children registered in MCTS 24.7 10.3 8.7 45.9
% of Budget utilized RCH flexi pool 26.3 9.5 8.0 63.5
% of Budget utilized Mission flexi pool 8.8 5.1 1.6 29.6
% of Budget utilized RI 8.2 9.2 0.0 65.8
% of Budget utilized NUHM 15.2 10.6 0.0 48.3
% of Budget utilized National programme 17.0 11.5 0.0 57.0
% of construction works completed/in progress 86.0 24.9 0.0 100.0
% Budget utilized in construction work 62.1 29.7 0.0 100.0
3
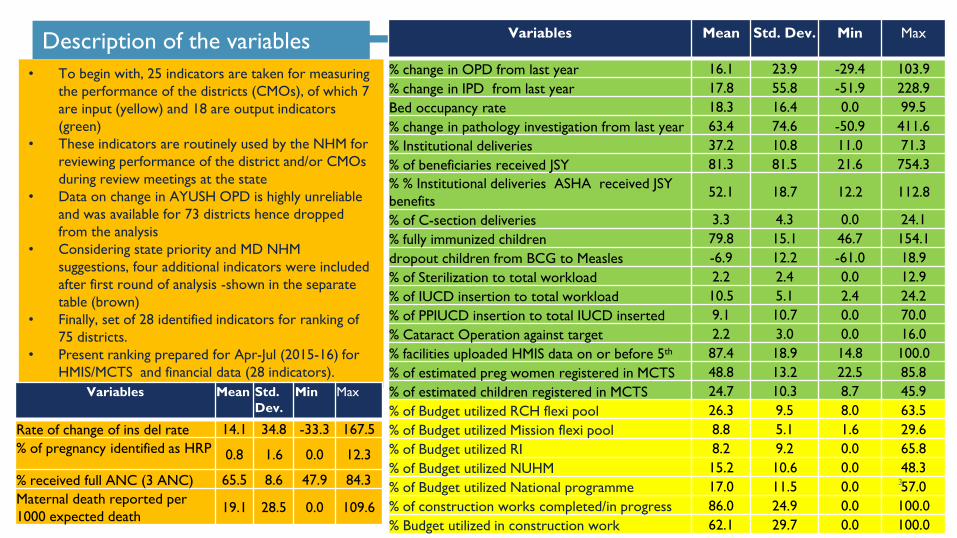
Description of the variables
• To begin with, 25 indicators are taken for measuring
the performance of the districts (CMOs), of which 7
are input (yellow) and 18 are output indicators
(green)
• These indicators are routinely used by the NHM for
reviewing performance of the district and/or CMOs
during review meetings at the state
• Data on change in AYUSH OPD is highly unreliable
and was available for 73 districts hence dropped
from the analysis
• Considering state priority and MD NHM
suggestions, four additional indicators were included
after first round of analysis -shown in the separate
table (brown)
• Finally, set of 28 identified indicators for ranking of
75 districts.
• Present ranking prepared for Apr-Jul (2015-16) for
HMIS/MCTS and financial data (28 indicators).
Variables Mean Std.
Dev.
Min Max
Rate of change of ins del rate 14.1 34.8 -33.3 167.5
% of pregnancy identified as HRP 0.8 1.6 0.0 12.3
% received full ANC (3 ANC) 65.5 8.6 47.9 84.3
Maternal death reported per
1000 expected death19.1 28.5 0.0 109.6
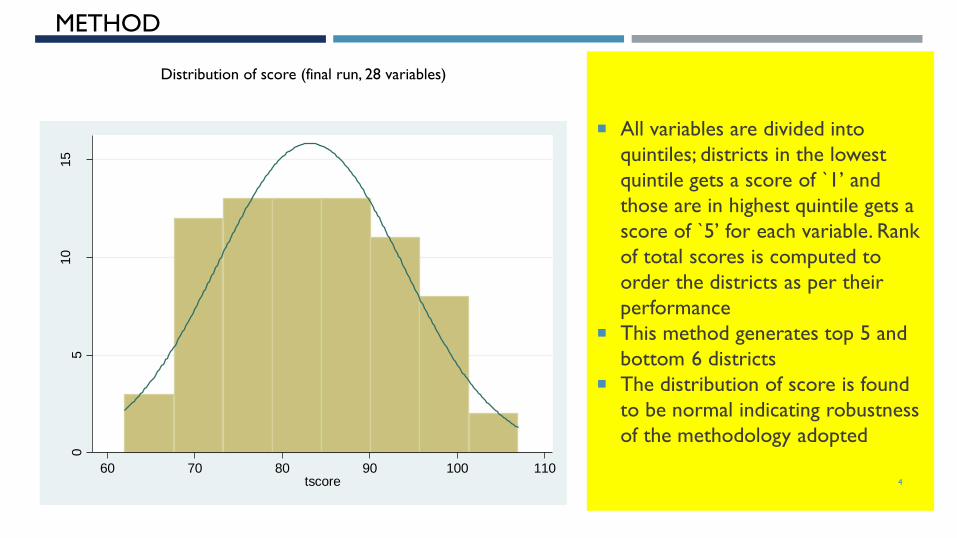
METHOD
All variables are divided into
quintiles; districts in the lowest
quintile gets a score of `1’ and
those are in highest quintile gets a
score of `5’ for each variable. Rank
of total scores is computed to
order the districts as per their
performance
This method generates top 5 and
bottom 6 districts
The distribution of score is found
to be normal indicating robustness
of the methodology adopted
4
Distribution of score (final run, 28 variables)0
510
15
Fre
quency
60 70 80 90 100 110tscore
Variables Mean Std. Dev. Min Max Mean Std. Dev. Min Max
Poor performer Best performer
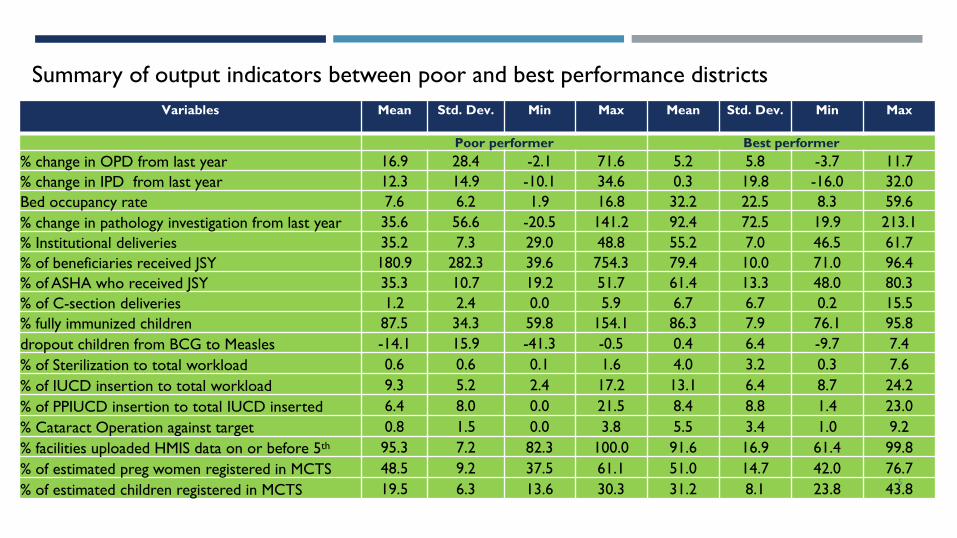
% change in OPD from last year 16.9 28.4 -2.1 71.6 5.2 5.8 -3.7 11.7
% change in IPD from last year 12.3 14.9 -10.1 34.6 0.3 19.8 -16.0 32.0
Bed occupancy rate 7.6 6.2 1.9 16.8 32.2 22.5 8.3 59.6
% change in pathology investigation from last year 35.6 56.6 -20.5 141.2 92.4 72.5 19.9 213.1
% Institutional deliveries 35.2 7.3 29.0 48.8 55.2 7.0 46.5 61.7
% of beneficiaries received JSY 180.9 282.3 39.6 754.3 79.4 10.0 71.0 96.4
% of ASHA who received JSY 35.3 10.7 19.2 51.7 61.4 13.3 48.0 80.3
% of C-section deliveries 1.2 2.4 0.0 5.9 6.7 6.7 0.2 15.5
% fully immunized children 87.5 34.3 59.8 154.1 86.3 7.9 76.1 95.8
dropout children from BCG to Measles -14.1 15.9 -41.3 -0.5 0.4 6.4 -9.7 7.4
% of Sterilization to total workload 0.6 0.6 0.1 1.6 4.0 3.2 0.3 7.6
% of IUCD insertion to total workload 9.3 5.2 2.4 17.2 13.1 6.4 8.7 24.2
% of PPIUCD insertion to total IUCD inserted 6.4 8.0 0.0 21.5 8.4 8.8 1.4 23.0
% Cataract Operation against target 0.8 1.5 0.0 3.8 5.5 3.4 1.0 9.2
% facilities uploaded HMIS data on or before 5th 95.3 7.2 82.3 100.0 91.6 16.9 61.4 99.8
% of estimated preg women registered in MCTS 48.5 9.2 37.5 61.1 51.0 14.7 42.0 76.7
% of estimated children registered in MCTS 19.5 6.3 13.6 30.3 31.2 8.1 23.8 43.85
Summary of output indicators between poor and best performance districts
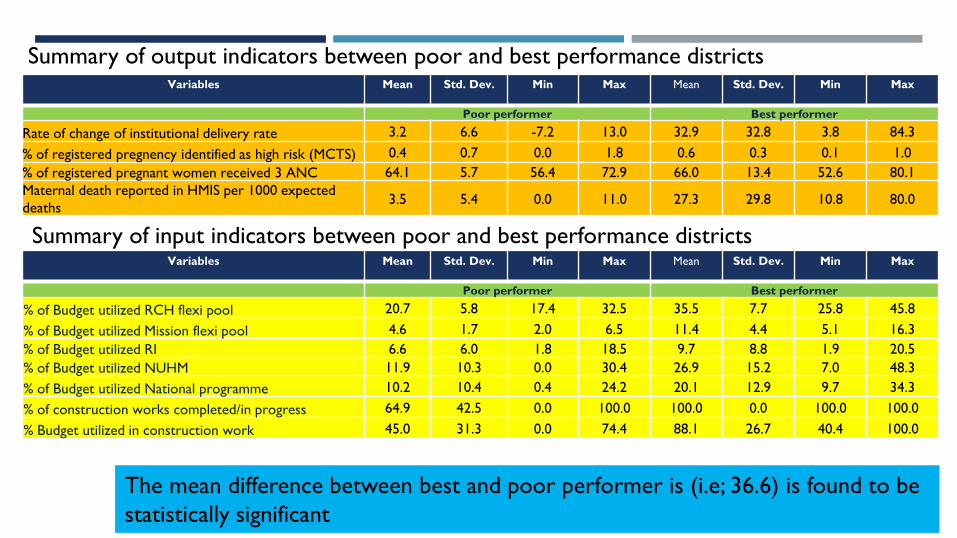
Variables Mean Std. Dev. Min Max Mean Std. Dev. Min Max
Poor performer Best performer
% of Budget utilized RCH flexi pool 20.7 5.8 17.4 32.5 35.5 7.7 25.8 45.8
% of Budget utilized Mission flexi pool 4.6 1.7 2.0 6.5 11.4 4.4 5.1 16.3
% of Budget utilized RI 6.6 6.0 1.8 18.5 9.7 8.8 1.9 20.5
% of Budget utilized NUHM 11.9 10.3 0.0 30.4 26.9 15.2 7.0 48.3
% of Budget utilized National programme 10.2 10.4 0.4 24.2 20.1 12.9 9.7 34.3
% of construction works completed/in progress 64.9 42.5 0.0 100.0 100.0 0.0 100.0 100.0
% Budget utilized in construction work 45.0 31.3 0.0 74.4 88.1 26.7 40.4 100.0
6
Summary of input indicators between poor and best performance districts
Variables Mean Std. Dev. Min Max Mean Std. Dev. Min Max
Poor performer Best performer
Rate of change of institutional delivery rate 3.2 6.6 -7.2 13.0 32.9 32.8 3.8 84.3
% of registered pregnency identified as high risk (MCTS) 0.4 0.7 0.0 1.8 0.6 0.3 0.1 1.0
% of registered pregnant women received 3 ANC 64.1 5.7 56.4 72.9 66.0 13.4 52.6 80.1
Maternal death reported in HMIS per 1000 expected
deaths 3.5 5.4 0.0 11.0 27.3 29.8 10.8 80.0
Summary of output indicators between poor and best performance districts
The mean difference between best and poor performer is (i.e; 36.6) is found to be
statistically significant
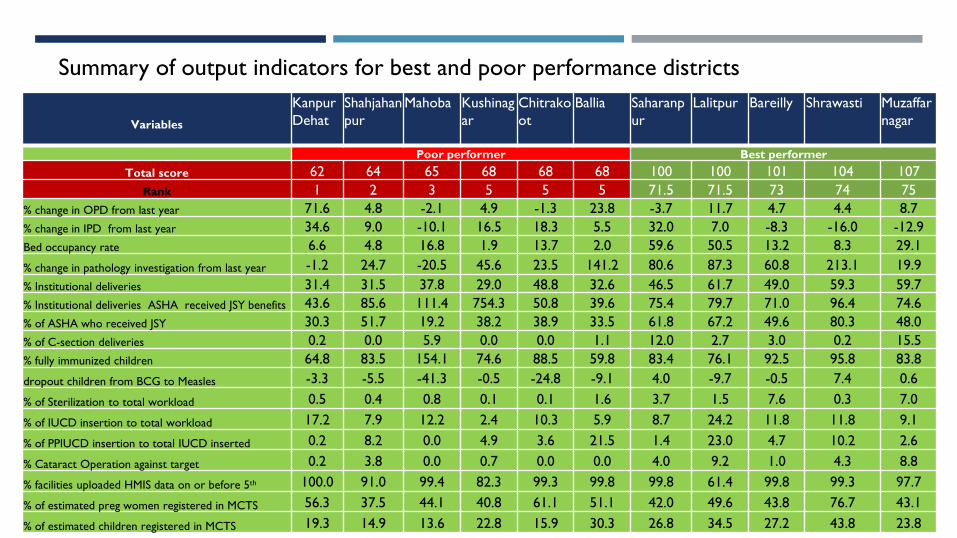
Variables
Kanpur
Dehat
Shahjahan
pur
Mahoba Kushinag
ar
Chitrako
ot
Ballia Saharanp
ur
Lalitpur Bareilly Shrawasti Muzaffar
nagar
Poor performer Best performer
Total score 62 64 65 68 68 68 100 100 101 104 107
Rank 1 2 3 5 5 5 71.5 71.5 73 74 75
% change in OPD from last year 71.6 4.8 -2.1 4.9 -1.3 23.8 -3.7 11.7 4.7 4.4 8.7
% change in IPD from last year 34.6 9.0 -10.1 16.5 18.3 5.5 32.0 7.0 -8.3 -16.0 -12.9
Bed occupancy rate 6.6 4.8 16.8 1.9 13.7 2.0 59.6 50.5 13.2 8.3 29.1
% change in pathology investigation from last year -1.2 24.7 -20.5 45.6 23.5 141.2 80.6 87.3 60.8 213.1 19.9
% Institutional deliveries 31.4 31.5 37.8 29.0 48.8 32.6 46.5 61.7 49.0 59.3 59.7
% Institutional deliveries ASHA received JSY benefits 43.6 85.6 111.4 754.3 50.8 39.6 75.4 79.7 71.0 96.4 74.6
% of ASHA who received JSY 30.3 51.7 19.2 38.2 38.9 33.5 61.8 67.2 49.6 80.3 48.0
% of C-section deliveries 0.2 0.0 5.9 0.0 0.0 1.1 12.0 2.7 3.0 0.2 15.5
% fully immunized children 64.8 83.5 154.1 74.6 88.5 59.8 83.4 76.1 92.5 95.8 83.8
dropout children from BCG to Measles -3.3 -5.5 -41.3 -0.5 -24.8 -9.1 4.0 -9.7 -0.5 7.4 0.6
% of Sterilization to total workload 0.5 0.4 0.8 0.1 0.1 1.6 3.7 1.5 7.6 0.3 7.0
% of IUCD insertion to total workload 17.2 7.9 12.2 2.4 10.3 5.9 8.7 24.2 11.8 11.8 9.1
% of PPIUCD insertion to total IUCD inserted 0.2 8.2 0.0 4.9 3.6 21.5 1.4 23.0 4.7 10.2 2.6
% Cataract Operation against target 0.2 3.8 0.0 0.7 0.0 0.0 4.0 9.2 1.0 4.3 8.8
% facilities uploaded HMIS data on or before 5th 100.0 91.0 99.4 82.3 99.3 99.8 99.8 61.4 99.8 99.3 97.7
% of estimated preg women registered in MCTS 56.3 37.5 44.1 40.8 61.1 51.1 42.0 49.6 43.8 76.7 43.1
% of estimated children registered in MCTS 19.3 14.9 13.6 22.8 15.9 30.3 26.8 34.5 27.2 43.8 23.8
7
Summary of output indicators for best and poor performance districts
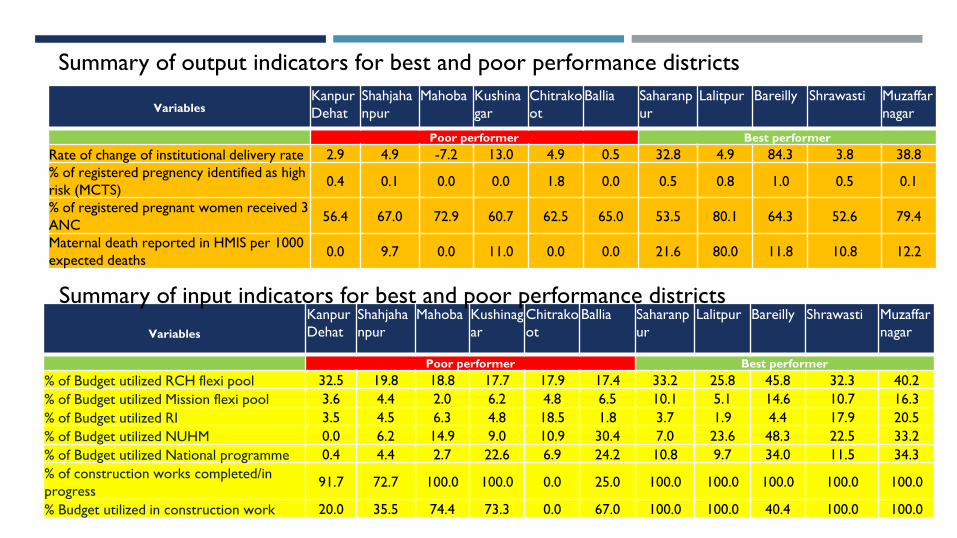
VariablesKanpur
Dehat
Shahjaha
npur
Mahoba Kushina
gar
Chitrako
ot
Ballia Saharanp
ur
Lalitpur Bareilly Shrawasti Muzaffar
nagar
Poor performer Best performer
Rate of change of institutional delivery rate 2.9 4.9 -7.2 13.0 4.9 0.5 32.8 4.9 84.3 3.8 38.8
% of registered pregnency identified as high
risk (MCTS)0.4 0.1 0.0 0.0 1.8 0.0 0.5 0.8 1.0 0.5 0.1
% of registered pregnant women received 3
ANC56.4 67.0 72.9 60.7 62.5 65.0 53.5 80.1 64.3 52.6 79.4
Maternal death reported in HMIS per 1000
expected deaths 0.0 9.7 0.0 11.0 0.0 0.0 21.6 80.0 11.8 10.8 12.2
8
Summary of output indicators for best and poor performance districts
Variables
Kanpur
Dehat
Shahjaha
npur
Mahoba Kushinag
ar
Chitrako
ot
Ballia Saharanp
ur
Lalitpur Bareilly Shrawasti Muzaffar
nagar
Poor performer Best performer
% of Budget utilized RCH flexi pool 32.5 19.8 18.8 17.7 17.9 17.4 33.2 25.8 45.8 32.3 40.2
% of Budget utilized Mission flexi pool 3.6 4.4 2.0 6.2 4.8 6.5 10.1 5.1 14.6 10.7 16.3
% of Budget utilized RI 3.5 4.5 6.3 4.8 18.5 1.8 3.7 1.9 4.4 17.9 20.5
% of Budget utilized NUHM 0.0 6.2 14.9 9.0 10.9 30.4 7.0 23.6 48.3 22.5 33.2
% of Budget utilized National programme 0.4 4.4 2.7 22.6 6.9 24.2 10.8 9.7 34.0 11.5 34.3
% of construction works completed/in
progress 91.7 72.7 100.0 100.0 0.0 25.0 100.0 100.0 100.0 100.0 100.0
% Budget utilized in construction work 20.0 35.5 74.4 73.3 0.0 67.0 100.0 100.0 40.4 100.0 100.0
Summary of input indicators for best and poor performance districts
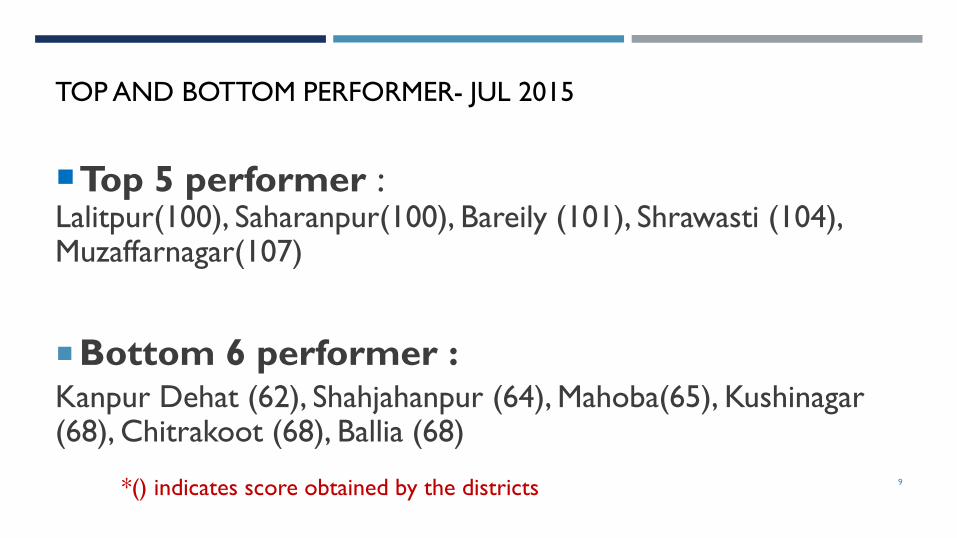
TOP AND BOTTOM PERFORMER- JUL 2015
Top 5 performer :Lalitpur(100), Saharanpur(100), Bareily (101), Shrawasti (104), Muzaffarnagar(107)
Bottom 6 performer : Kanpur Dehat (62), Shahjahanpur (64), Mahoba(65), Kushinagar(68), Chitrakoot (68), Ballia (68)
9*() indicates score obtained by the districts
10
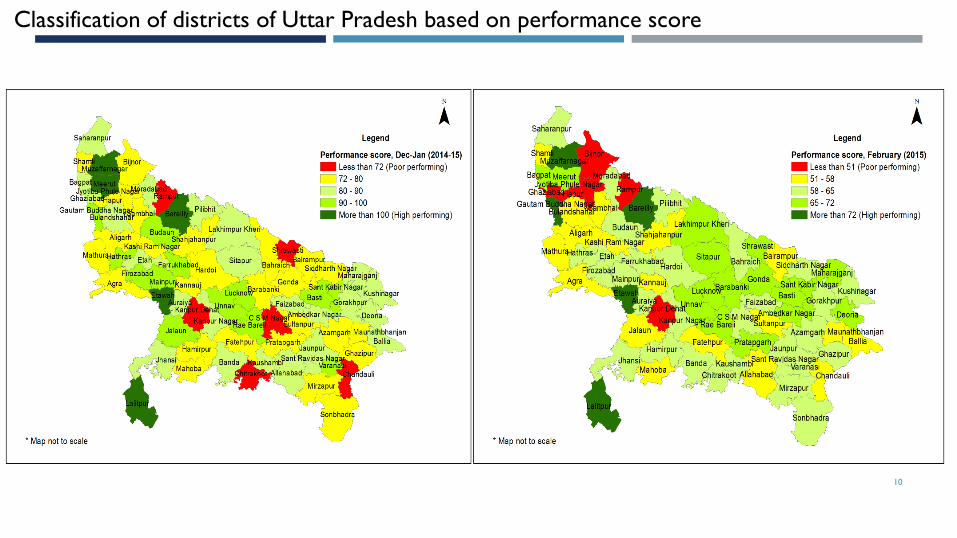
Classification of districts of Uttar Pradesh based on performance score
11
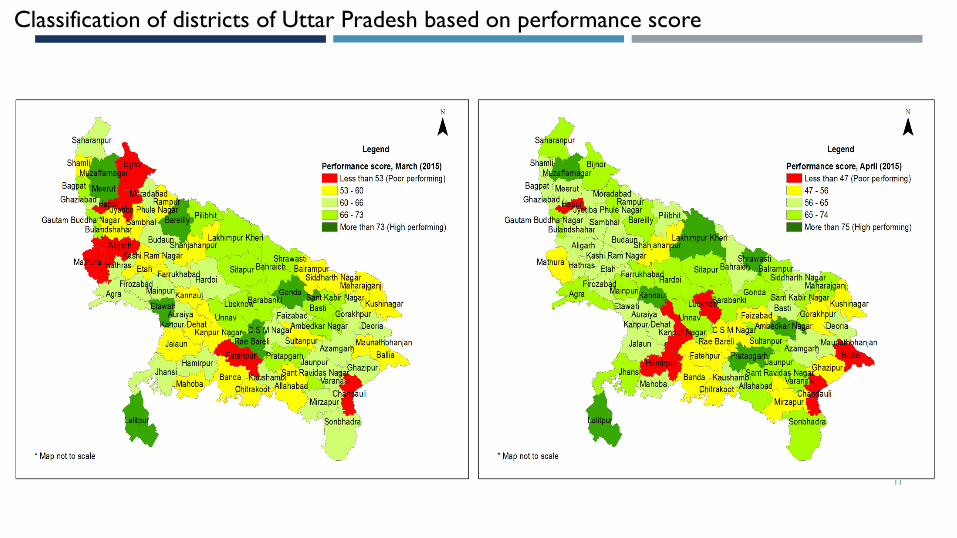
Classification of districts of Uttar Pradesh based on performance score
12
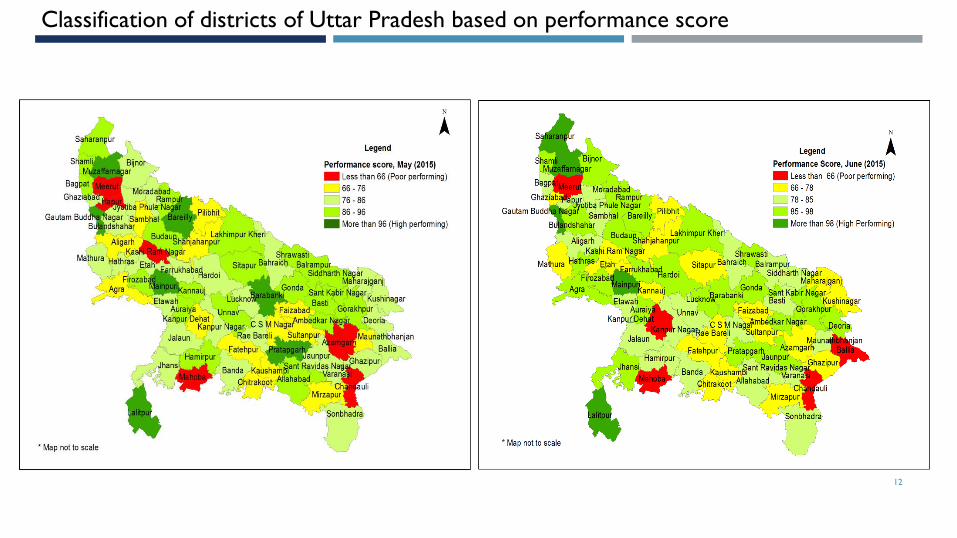
Classification of districts of Uttar Pradesh based on performance score
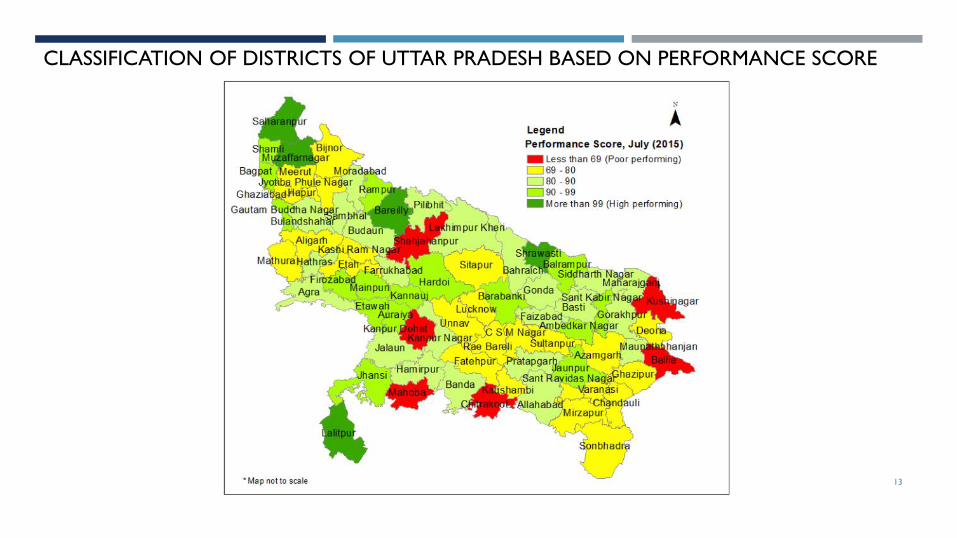
CLASSIFICATION OF DISTRICTS OF UTTAR PRADESH BASED ON PERFORMANCE SCORE
13
14
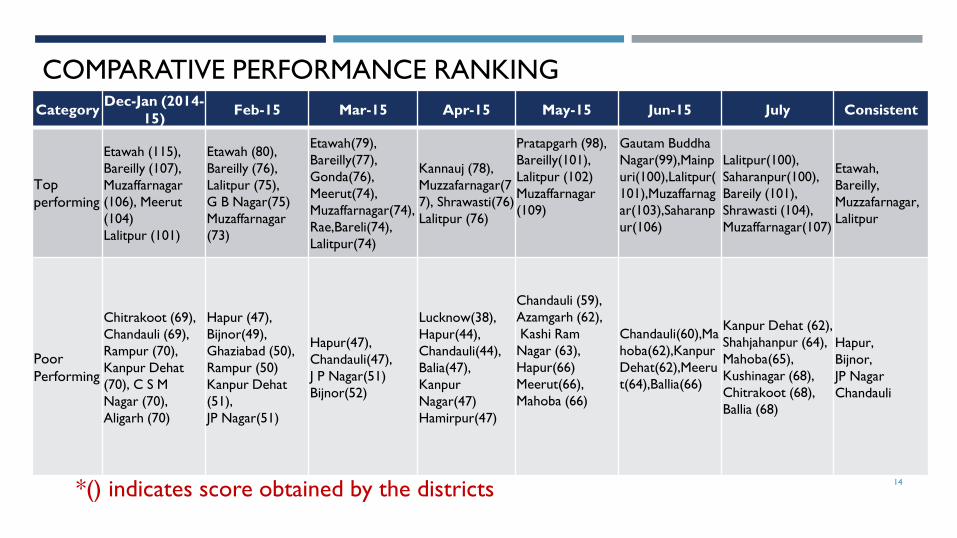
COMPARATIVE PERFORMANCE RANKING
*() indicates score obtained by the districts
CategoryDec-Jan (2014-
15)Feb-15 Mar-15 Apr-15 May-15 Jun-15 July Consistent
Top
performing
Etawah (115),
Bareilly (107),
Muzaffarnagar
(106), Meerut
(104)
Lalitpur (101)
Etawah (80),
Bareilly (76),
Lalitpur (75),
G B Nagar(75)
Muzaffarnagar
(73)
Etawah(79),
Bareilly(77),
Gonda(76),
Meerut(74),
Muzaffarnagar(74),
Rae,Bareli(74),
Lalitpur(74)
Kannauj (78),
Muzzafarnagar(7
7), Shrawasti(76)
Lalitpur (76)
Pratapgarh (98),
Bareilly(101),
Lalitpur (102)
Muzaffarnagar
(109)
Gautam Buddha
Nagar(99),Mainp
uri(100),Lalitpur(
101),Muzaffarnag
ar(103),Saharanp
ur(106)
Lalitpur(100),
Saharanpur(100),
Bareily (101),
Shrawasti (104),
Muzaffarnagar(107)
Etawah,
Bareilly,
Muzzafarnagar,
Lalitpur
Poor
Performing
Chitrakoot (69),
Chandauli (69),
Rampur (70),
Kanpur Dehat
(70), C S M
Nagar (70),
Aligarh (70)
Hapur (47),
Bijnor(49),
Ghaziabad (50),
Rampur (50)
Kanpur Dehat
(51),
JP Nagar(51)
Hapur(47),
Chandauli(47),
J P Nagar(51)
Bijnor(52)
Lucknow(38),
Hapur(44),
Chandauli(44),
Balia(47),
Kanpur
Nagar(47)
Hamirpur(47)
Chandauli (59),
Azamgarh (62),
Kashi Ram
Nagar (63),
Hapur(66)
Meerut(66),
Mahoba (66)
Chandauli(60),Ma
hoba(62),Kanpur
Dehat(62),Meeru
t(64),Ballia(66)
Kanpur Dehat (62),
Shahjahanpur (64),
Mahoba(65),
Kushinagar (68),
Chitrakoot (68),
Ballia (68)
Hapur,
Bijnor,
JP Nagar
Chandauli

THANK YOU