Embed Size (px)
Citation preview

Rapid Assessments Project Training Manual
Part I
2
Table of Contents
Welcome! ................................................................................................................................... 3 Section 1: Introductions ............................................................................................................. 4
Background to the Rapid Assessments Project ..................................................................... 5 Social Determinants of Health 101 ......................................................................................... 5 Social Determinants of Health 101 ......................................................................................... 6 Neighbourhoods and Health ................................................................................................ 18 Priority Neighbourhoods 101 ................................................................................................ 25
Section 2: The Rapid Assessment Neighbourhoods ............................................................... 31 Eglinton East ........................................................................................................................ 32 Parkdale ............................................................................................................................... 35 St. Jamestown ..................................................................................................................... 38 Weston ................................................................................................................................. 41 Beyond the Numbers- Case example of a Scarborough neighbourhood ............................. 44
Section 3: Interview Skills ........................................................................................................ 47 Interview Skills 101 .............................................................................................................. 48
3
Welcome! Welcome to the Rapid Assessments Project Training Manual, Part I. Part I of the manual includes three sections of reading.
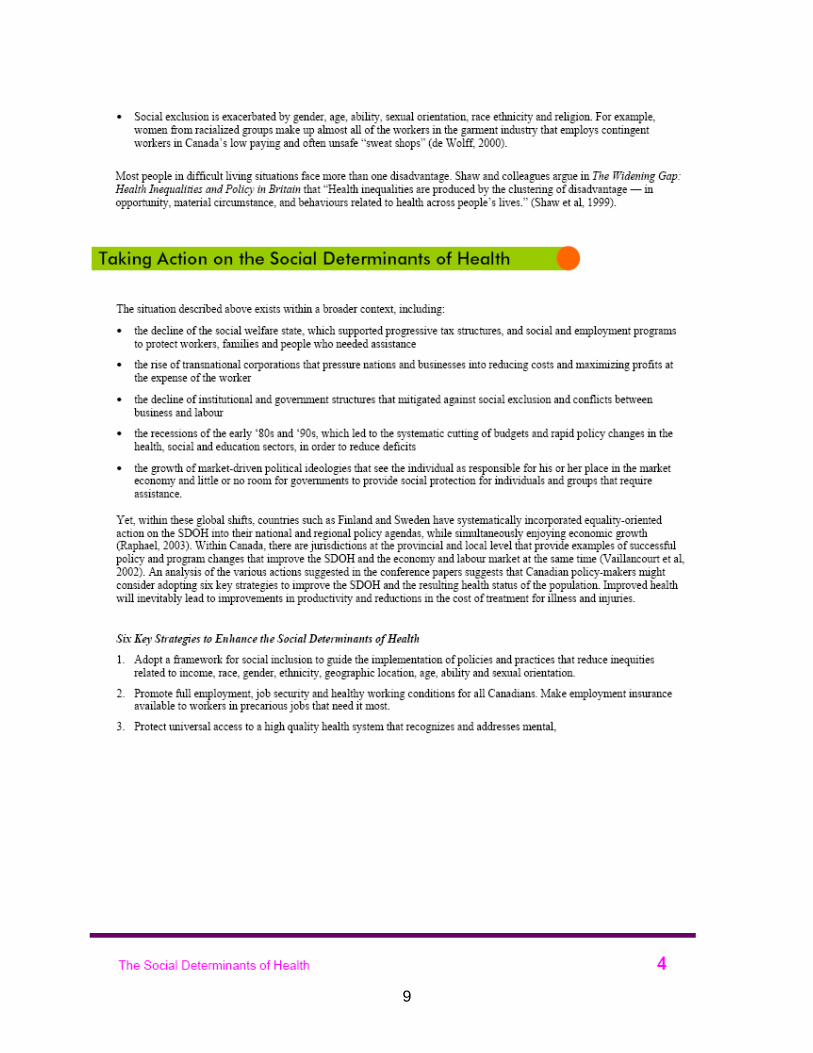
• Section 1 will introduce you to the Rapid Assessments Project, provide basic understandings of social determinants of health and neighbourhoods and health, and offer some context specific to Toronto priority neighbourhoods.
• Section 2 will provide a background of each of the neighbourhoods that are part of the
project: Eglinton East, Parkdale, St. Jamestown, and Weston.
• Section 3 will introduce the tool you’ll be using through the project and provide a primer for interview skills.
Manual assembled by Amina Jabbar

4
Section 1: Introductions

5
Background to the Rapid Assessments Project Data on health status, determinants of health and access to health care at the small area level is surprisingly scarce, but urgently needed. There is now a large body of research showing substantial small-area differences in crude measures of health status (e.g., infant mortality) and health care utilization (e.g., hospital admissions), but no information on the prevalence of health risk factors or unmet health care need. Moreover, data is required that would allow for analyses of the factors (e.g., socio-economic status, health behaviours, etc.) contributing to health status, and health care utilization (or unmet need) at a small area level. National surveys such as the Canadian Community Health Survey cannot be disaggregated to such a small geographic level and administrative health care data can only make inferences about previous use, which is not an indicator of need, health status, risk or unmet need. The data that is needed to ensure equitable health outcomes and health care access, is quite simply, unavailable. The Rapid Assessments Project is part of the larger Intensive Research on Neighbourhoods and Health Initiative (IRONhI), a piece of research infrastructure that allows for comparative case studies of differences in "health opportunity structures" between low-income and upper-income neighbourhoods in Toronto. In developing, testing and evaluating the rapid assessment tool for small-area health needs, our objectives are fourfold. First, we seek to develop a tool that decision-makers, service providers, and community groups can use to quickly and reliably assess local health status and needs. Second, we will create a manual for rapid assessment of small-area health needs that will be made available for download by interested groups. Third, we will develop a set of best practices for knowledge translation that involves potential end users of the knowledge from the beginning of the research process. Finally, we will use the data collected for this pilot study of the rapid assessment tool to identify health needs and priorities of the four selected neighbourhoods and evaluate the effectiveness of the tool in a) generating a sufficient response rate, b) producing knowledge relevant to stakeholders, and c) in generating knowledge that is likely to be used in decision-making. This tool will equip Local Health Integrated Networks (LHINs), community-based health care providers and other decision-makers, providers and community groups in Ontario to use evidence to understand local health needs, to generate solutions that are appropriate to local conditions and to act on significant disparities in health and health care access between local communities within their jurisdictions. We propose to conduct a community survey with 300 households in each of the following 4 Toronto neighbourhoods: South Parkdale, North St. Jamestown, Weston, and Eglinton East.
Adapted from the project’s Research Grant Proposal Form submitted to the Ministry of Health and Long Term, Care. (2006). Adapted by Amina Jabbar.
6
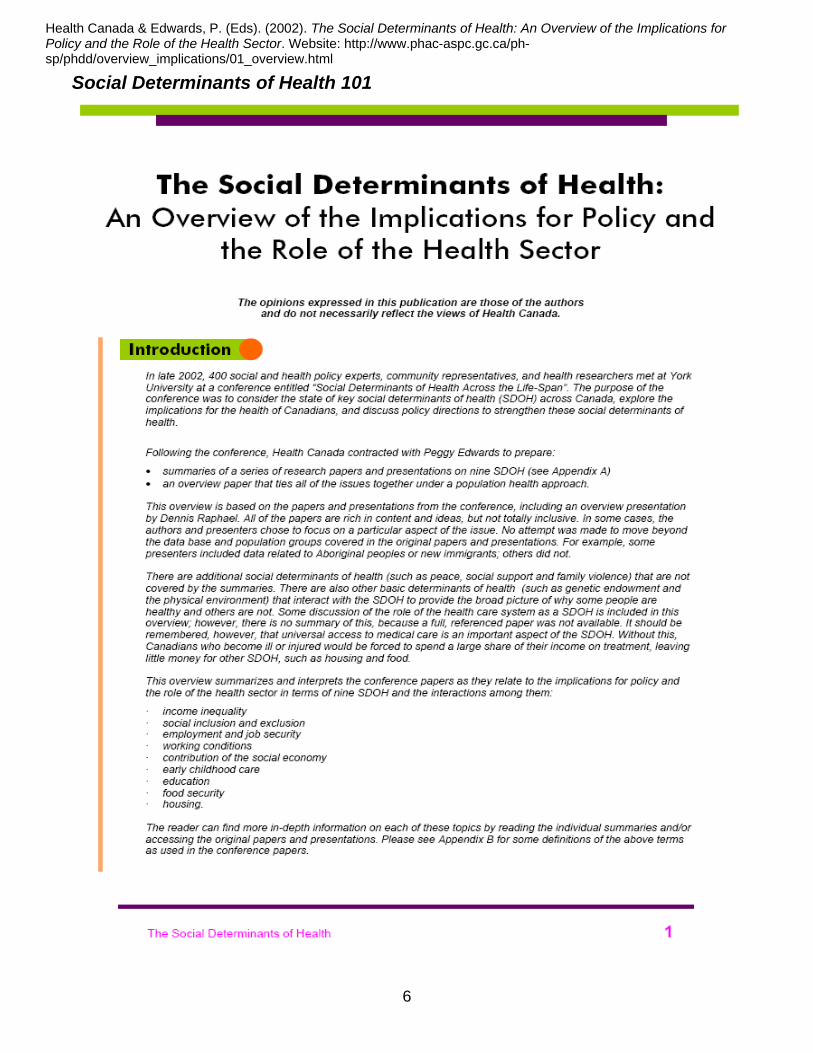
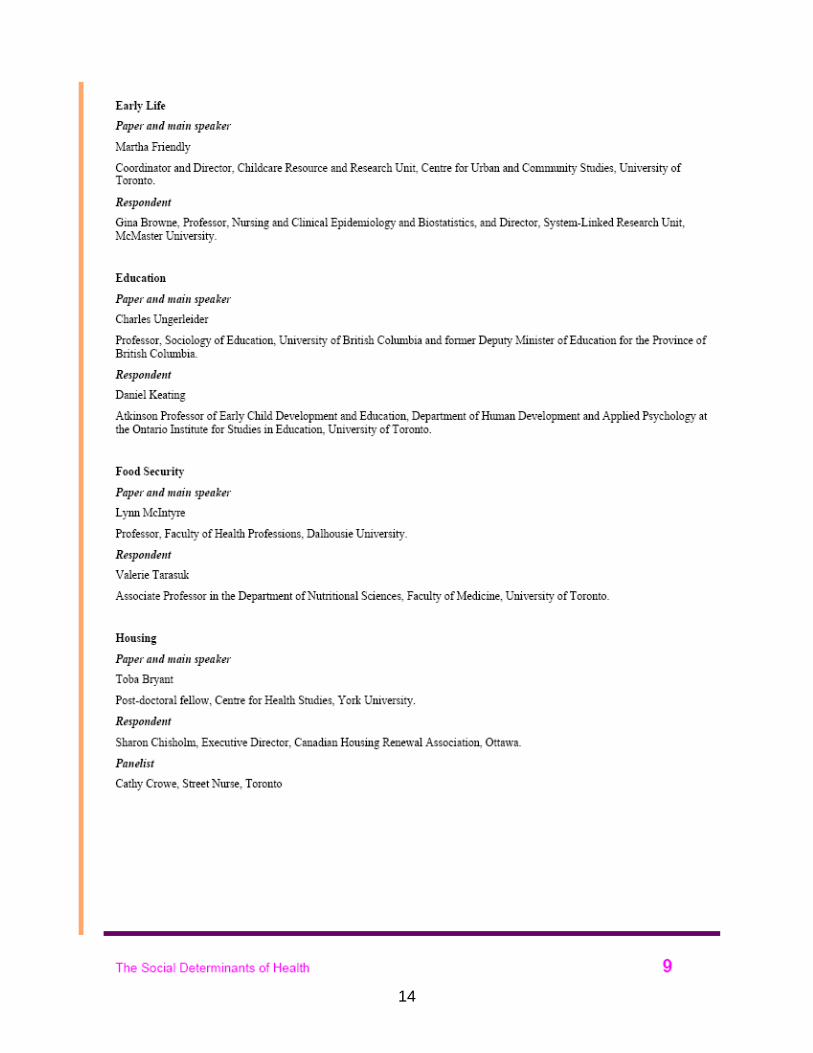
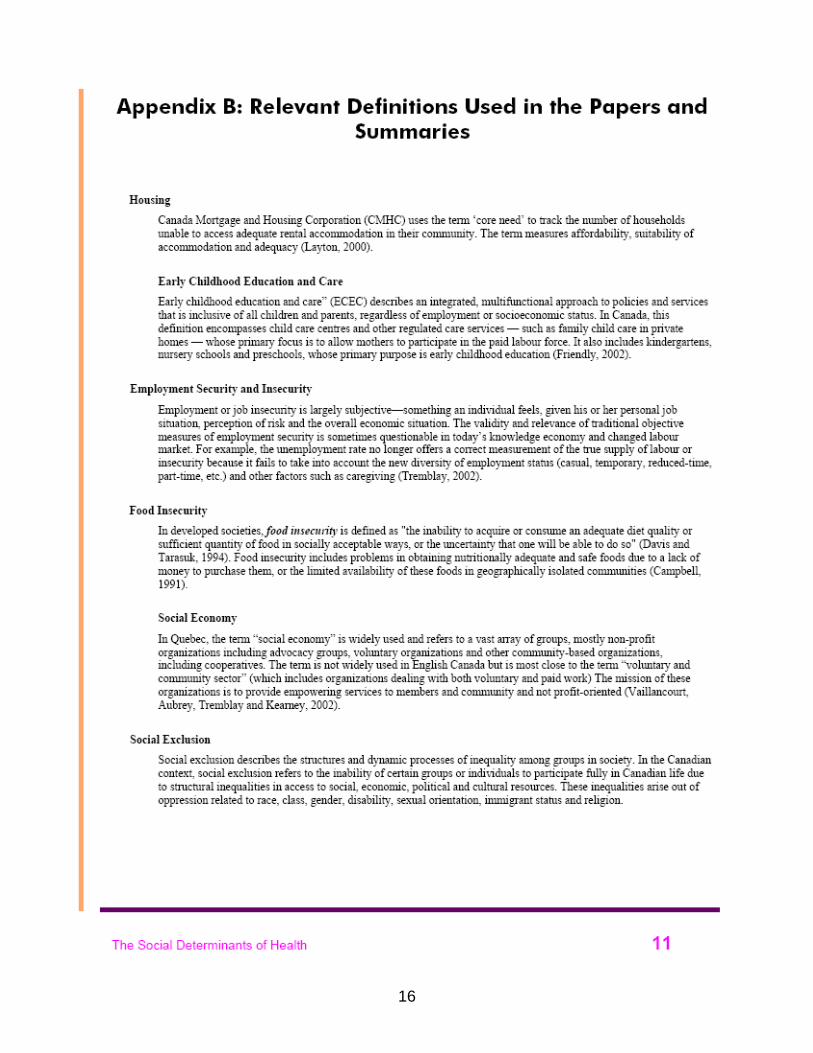
Social Determinants of Health 101
Health Canada & Edwards, P. (Eds). (2002). The Social Determinants of Health: An Overview of the Implications for Policy and the Role of the Health Sector. Website: http://www.phac-aspc.gc.ca/ph-sp/phdd/overview_implications/01_overview.html

7

8
9

10

11

12

13
14

15
16

17

18
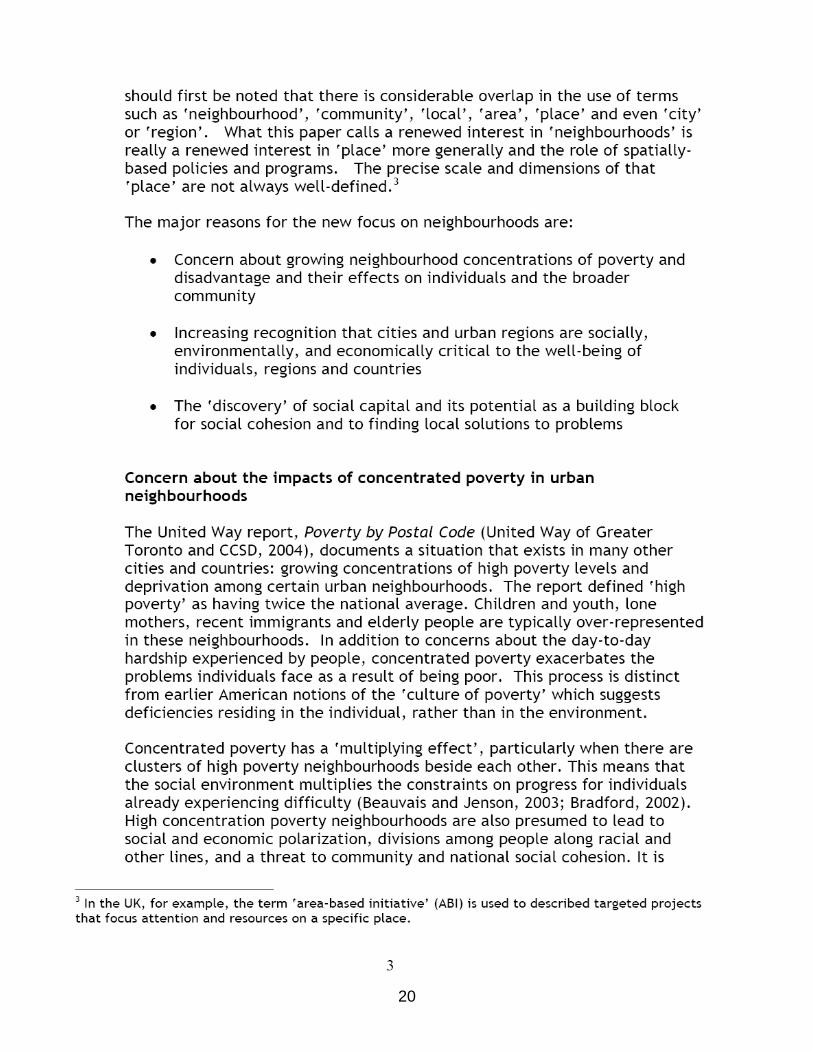
Neighbourhoods and Health
Freiler, C. (2004). Why strong neighbourhoods matter: Implications for policy and practice. Strong Neighbourhoods Task Force Toronto. Website: http://www.urbancentre.utoronto.ca/pdfs/curp/SNTF_Why-Neighbourhoods-Mat.pdf

19
20
21
22
23
24

25
Priority Neighbourhoods 101
26
27
28
29

30

31
Section 2: The Rapid Assessment Neighbourhoods
32
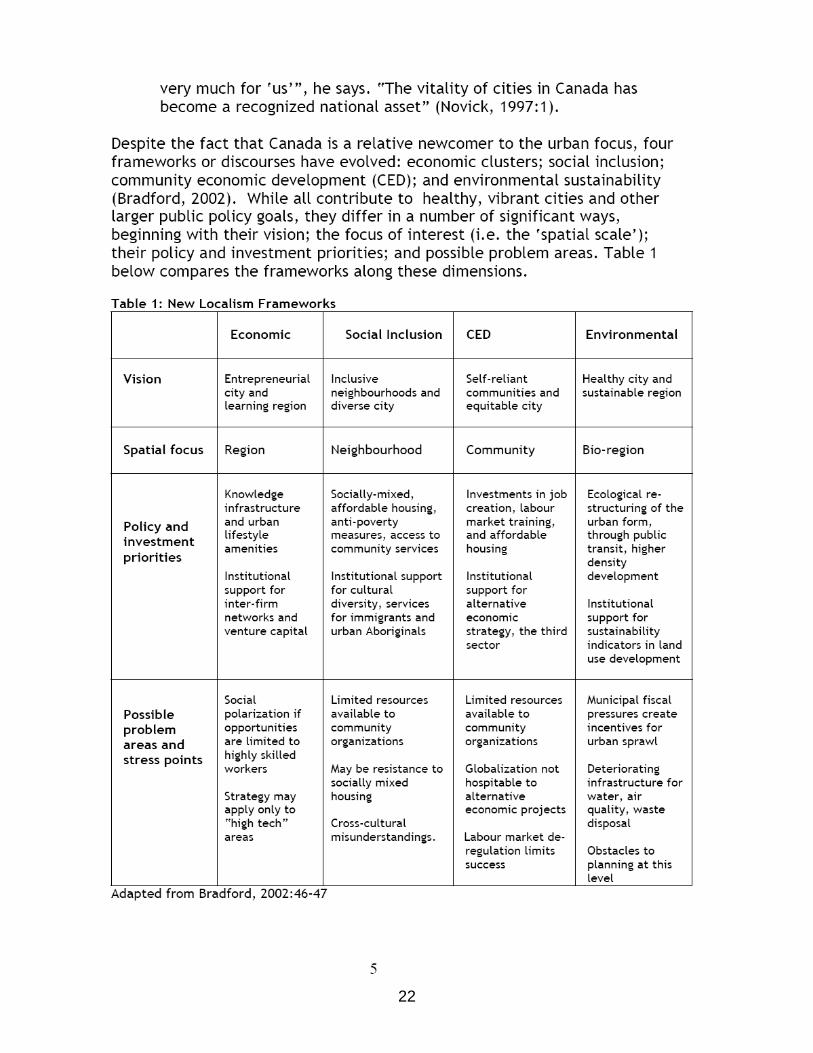
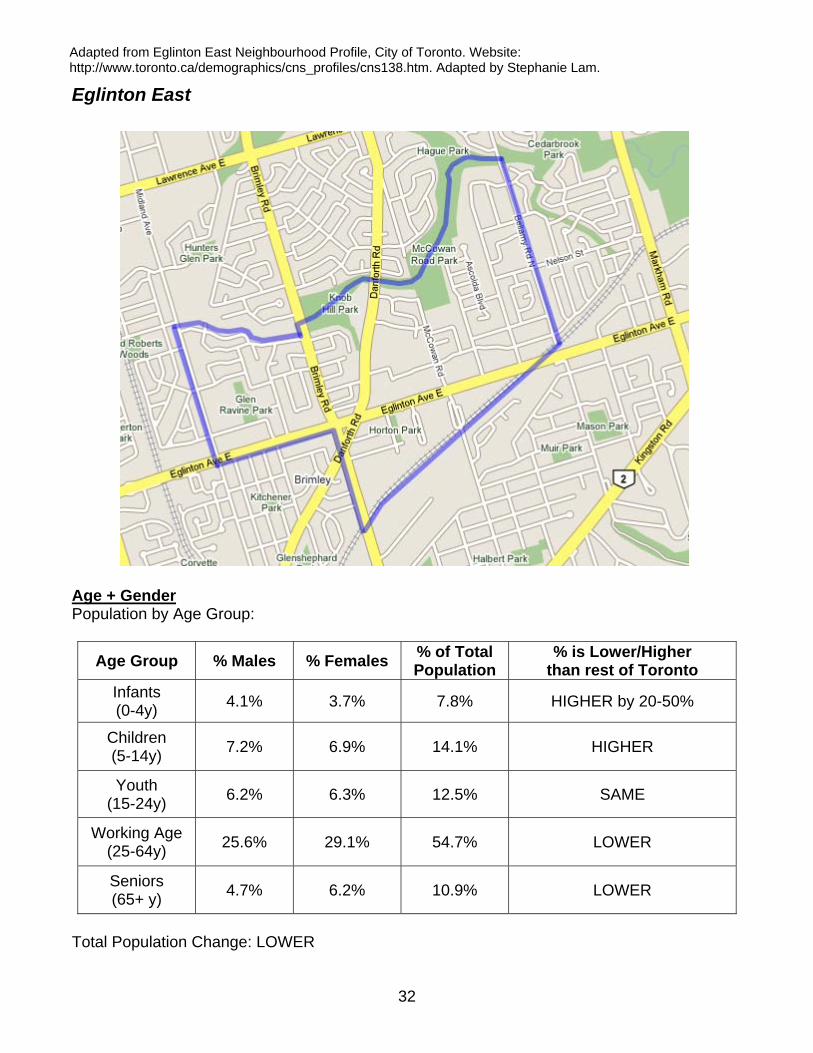
Eglinton East Age + Gender Population by Age Group:
Age Group % Males % Females % of Total Population
% is Lower/Higher than rest of Toronto
Infants (0-4y) 4.1% 3.7% 7.8% HIGHER by 20-50%
Children (5-14y) 7.2% 6.9% 14.1% HIGHER
Youth (15-24y) 6.2% 6.3% 12.5% SAME
Working Age (25-64y) 25.6% 29.1% 54.7% LOWER
Seniors (65+ y) 4.7% 6.2% 10.9% LOWER
Total Population Change: LOWER
Adapted from Eglinton East Neighbourhood Profile, City of Toronto. Website: http://www.toronto.ca/demographics/cns_profiles/cns138.htm. Adapted by Stephanie Lam.
33
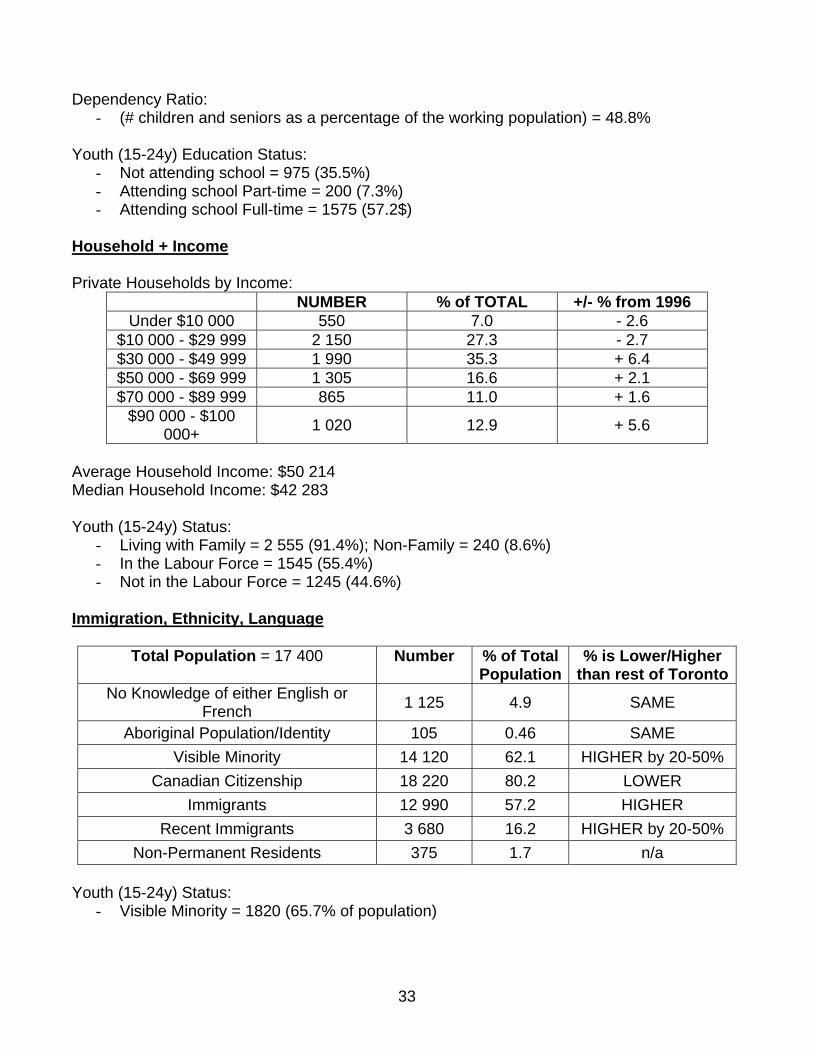
Dependency Ratio:
- (# children and seniors as a percentage of the working population) = 48.8% Youth (15-24y) Education Status:
- Not attending school = 975 (35.5%) - Attending school Part-time = 200 (7.3%) - Attending school Full-time = 1575 (57.2$)
Household + Income Private Households by Income:
NUMBER % of TOTAL +/- % from 1996 Under $10 000 550 7.0 - 2.6
$10 000 - $29 999 2 150 27.3 - 2.7 $30 000 - $49 999 1 990 35.3 + 6.4 $50 000 - $69 999 1 305 16.6 + 2.1 $70 000 - $89 999 865 11.0 + 1.6
$90 000 - $100 000+ 1 020 12.9 + 5.6
Average Household Income: $50 214 Median Household Income: $42 283 Youth (15-24y) Status:
- Living with Family = 2 555 (91.4%); Non-Family = 240 (8.6%) - In the Labour Force = 1545 (55.4%) - Not in the Labour Force = 1245 (44.6%)
Immigration, Ethnicity, Language
Total Population = 17 400 Number % of Total Population
% is Lower/Higher than rest of Toronto
No Knowledge of either English or French 1 125 4.9 SAME
Aboriginal Population/Identity 105 0.46 SAME Visible Minority 14 120 62.1 HIGHER by 20-50%
Canadian Citizenship 18 220 80.2 LOWER Immigrants 12 990 57.2 HIGHER
Recent Immigrants 3 680 16.2 HIGHER by 20-50% Non-Permanent Residents 375 1.7 n/a
Youth (15-24y) Status:
- Visible Minority = 1820 (65.7% of population)

34
Recent Immigrants’ Origins:
- (top ten countries)
COUNTRY NUMBER COUNTRY NUMBER Sri Lanka 615 Pakistan 185 China 450 Jamaica 145 India 405 Yugoslavia 85 Philippines 290 Afghanistan 75 Guyana 255 Congo 65
Home Languages:
- (top ten non-official languages)
LANGUAGE NUMBER % of Total Pop LANGUAGE NUMBER % of Total
Pop Tamil 930 4.09 Italian 195 0.86 Chinese 880 3.87 Polish 160 0.70 Tagalog 320 1.41 Greek 155 0.68 Macedonian 245 1.08 Spanish 120 0.53 Urdu 200 0.88 Vietnamese 115 0.51
35
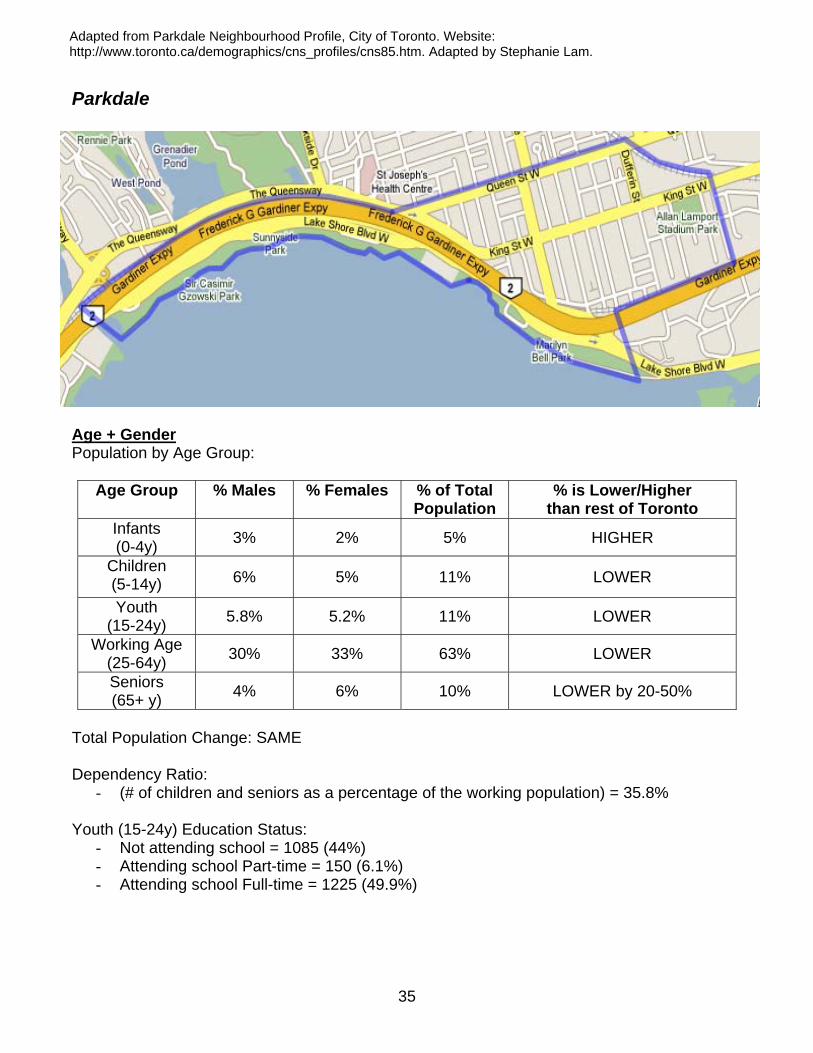
Parkdale
Age + Gender Population by Age Group:
Age Group % Males % Females % of Total Population
% is Lower/Higher than rest of Toronto
Infants (0-4y) 3% 2% 5% HIGHER
Children (5-14y) 6% 5% 11% LOWER
Youth (15-24y) 5.8% 5.2% 11% LOWER
Working Age (25-64y) 30% 33% 63% LOWER
Seniors (65+ y) 4% 6% 10% LOWER by 20-50%
Total Population Change: SAME Dependency Ratio:
- (# of children and seniors as a percentage of the working population) = 35.8% Youth (15-24y) Education Status:
- Not attending school = 1085 (44%) - Attending school Part-time = 150 (6.1%) - Attending school Full-time = 1225 (49.9%)
Adapted from Parkdale Neighbourhood Profile, City of Toronto. Website: http://www.toronto.ca/demographics/cns_profiles/cns85.htm. Adapted by Stephanie Lam.
36
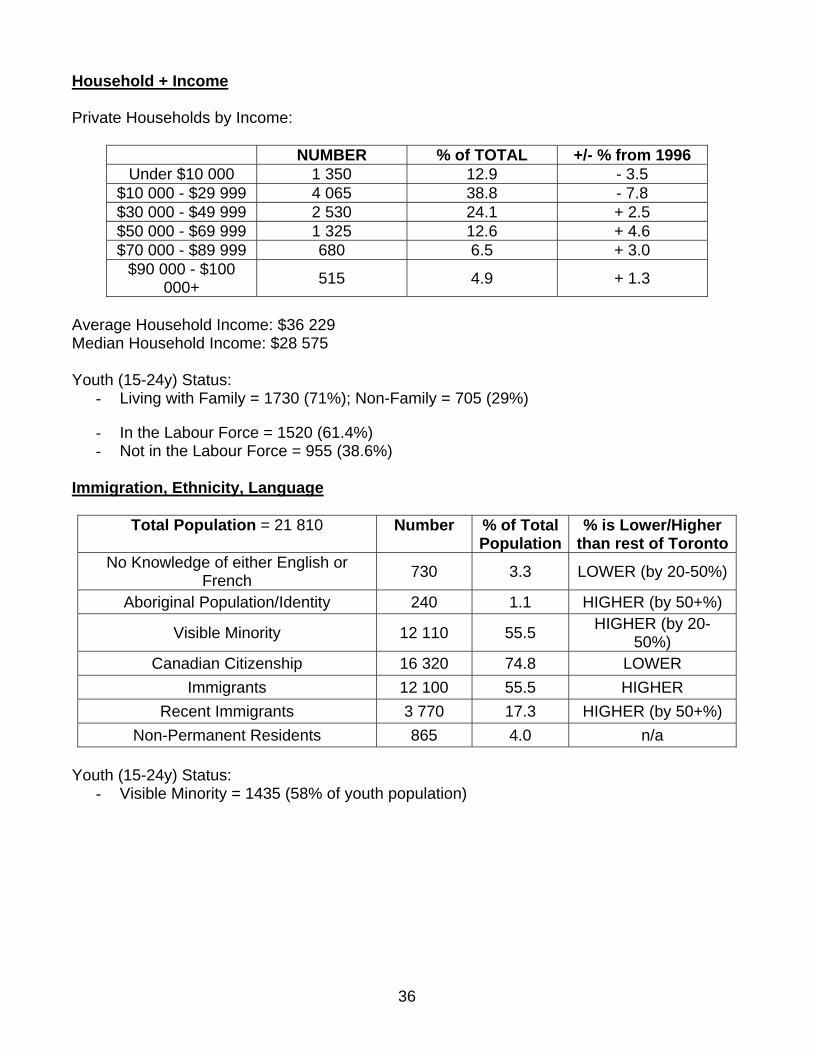
Household + Income Private Households by Income:
NUMBER % of TOTAL +/- % from 1996 Under $10 000 1 350 12.9 - 3.5
$10 000 - $29 999 4 065 38.8 - 7.8 $30 000 - $49 999 2 530 24.1 + 2.5 $50 000 - $69 999 1 325 12.6 + 4.6 $70 000 - $89 999 680 6.5 + 3.0
$90 000 - $100 000+ 515 4.9 + 1.3
Average Household Income: $36 229 Median Household Income: $28 575 Youth (15-24y) Status:
- Living with Family = 1730 (71%); Non-Family = 705 (29%)
- In the Labour Force = 1520 (61.4%) - Not in the Labour Force = 955 (38.6%)
Immigration, Ethnicity, Language
Total Population = 21 810 Number % of Total Population
% is Lower/Higher than rest of Toronto
No Knowledge of either English or French 730 3.3 LOWER (by 20-50%)
Aboriginal Population/Identity 240 1.1 HIGHER (by 50+%)
Visible Minority 12 110 55.5 HIGHER (by 20-50%)
Canadian Citizenship 16 320 74.8 LOWER Immigrants 12 100 55.5 HIGHER
Recent Immigrants 3 770 17.3 HIGHER (by 50+%) Non-Permanent Residents 865 4.0 n/a
Youth (15-24y) Status:
- Visible Minority = 1435 (58% of youth population)
37
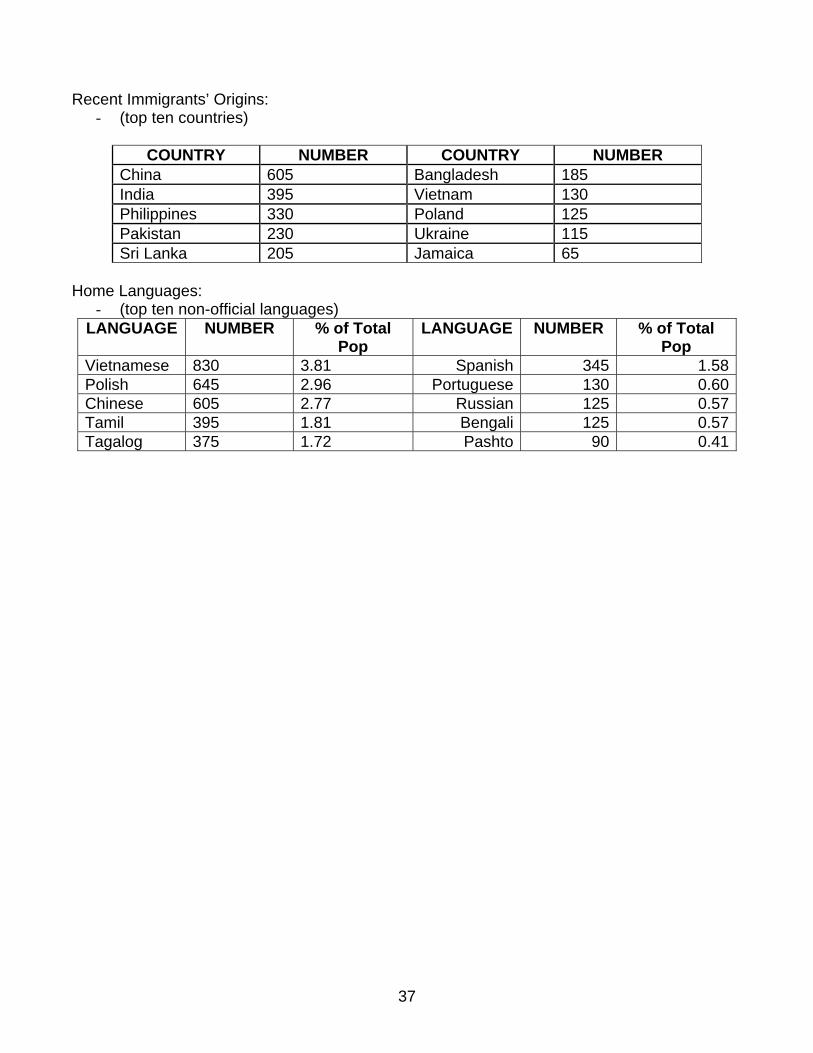
Recent Immigrants’ Origins:
- (top ten countries)
COUNTRY NUMBER COUNTRY NUMBER China 605 Bangladesh 185 India 395 Vietnam 130 Philippines 330 Poland 125 Pakistan 230 Ukraine 115 Sri Lanka 205 Jamaica 65
Home Languages:
- (top ten non-official languages) LANGUAGE NUMBER % of Total
Pop LANGUAGE NUMBER % of Total
Pop Vietnamese 830 3.81 Spanish 345 1.58Polish 645 2.96 Portuguese 130 0.60Chinese 605 2.77 Russian 125 0.57Tamil 395 1.81 Bengali 125 0.57Tagalog 375 1.72 Pashto 90 0.41
38
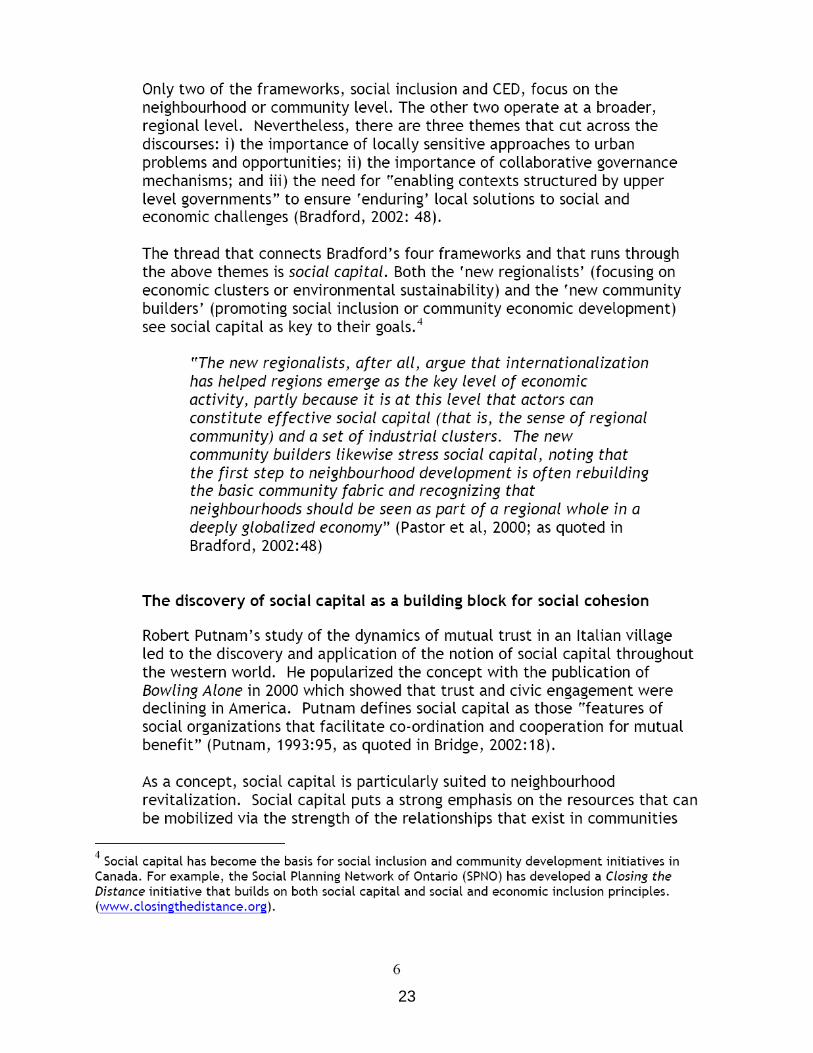
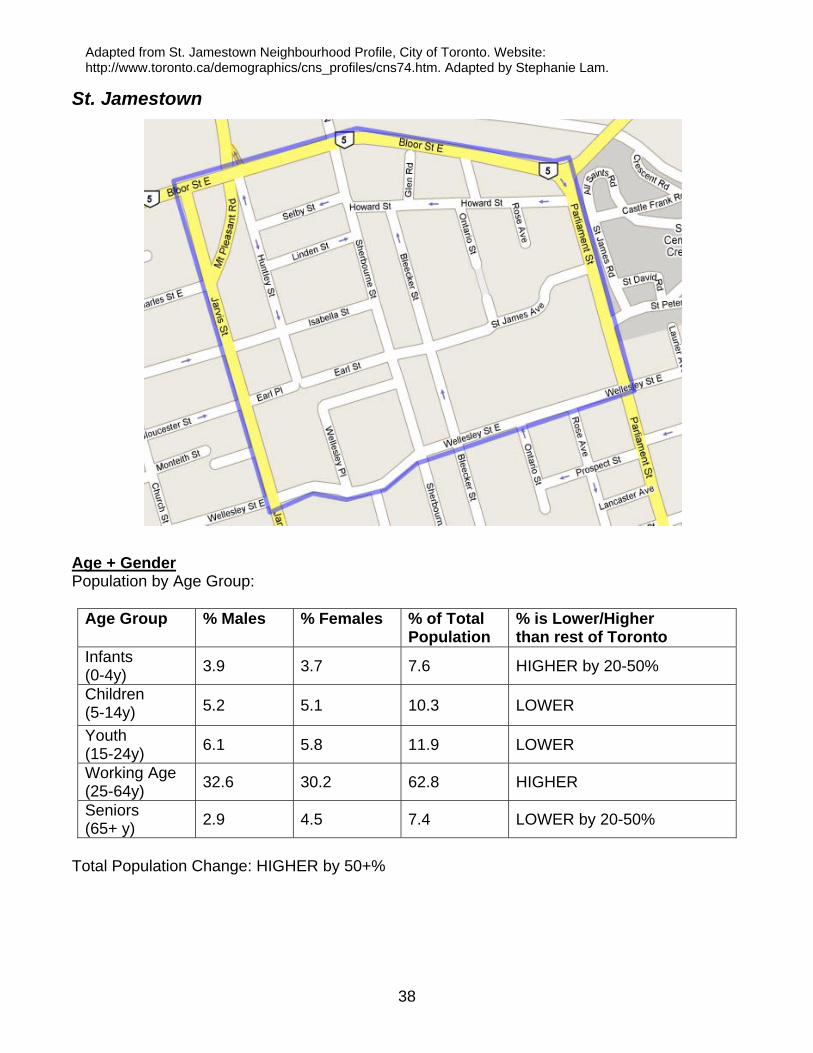
St. Jamestown Age + Gender Population by Age Group:
Age Group % Males % Females % of Total Population
% is Lower/Higher than rest of Toronto
Infants (0-4y) 3.9 3.7 7.6 HIGHER by 20-50%
Children (5-14y) 5.2 5.1 10.3 LOWER
Youth (15-24y) 6.1 5.8 11.9 LOWER
Working Age (25-64y) 32.6 30.2 62.8 HIGHER
Seniors (65+ y) 2.9 4.5 7.4 LOWER by 20-50%
Total Population Change: HIGHER by 50+%
Adapted from St. Jamestown Neighbourhood Profile, City of Toronto. Website: http://www.toronto.ca/demographics/cns_profiles/cns74.htm. Adapted by Stephanie Lam.

39
Dependency Ratio: (# children and seniors as a percentage of the working population) = 33.7% Youth (15-24y) Education Status: Not attending school = 710 (33%) Attending school Part-time = 195 (9.0%) Attending school Full-time = 1250 (58%) Household + Income Private Households by Income:
NUMBER % of TOTAL +/- % from 1996 Under $10 000 1 485 17.6 - 3.1
$10 000 - $29 999 3 130 37.1 - 6.8 $30 000 - $49 999 2 175 25.7 + 2.3 $50 000 - $69 999 1 040 12.3 + 3.9 $70 000 - $89 999 375 4.5 + 2.2
$90 000 - $100 000+ 245 2.9 + 1.6
Average Household Income: $34 229 Median Household Income: $28 396 Youth (15-24y) Status:
- Living with Family = 1420 (66%); Non-Family = 730 (34%)
- In the Labour Force = 1055 (49.5%) - Not in the Labour Force = 1075 (50.5%)
Immigration, Ethnicity, Language
Total Population = 17 400 Number % of Total Population
% is Lower/Higher than rest of Toronto
No Knowledge of either English or French 920 5.0 SAME
Aboriginal Population/Identity 145 0.78 HIGHER by 20-50% Visible Minority 13 375 72.3 HIGHER by 50+%
Canadian Citizenship 12 810 69.3 LOWER Immigrants 11 765 63.6 HIGHER by 20-50%
Recent Immigrants 4 850 26.2 HIGHER by 50+% Non-Permanent Residents 795 4.30 n/a
Youth (15-24y) Status:
- Visible Minority = 1520 (70.4% of population)

40
Recent Immigrants’ Origins:
- (top ten countries) COUNTRY NUMBER COUNTRY NUMBER
Philippines 1230 Bangladesh 200 Sri Lanka 670 India 180
China 485 Russian Federation
1550
Pakistan 465 Romania 90 Korea 275 Yugoslavia 80
Home Languages:
- (top ten non-official languages)
LANGUAGE NUMBER % of Total Pop LANGUAGE NUMBER % of Total
Pop Tamil 1135 6.14 Bengali 240 1.30 Chinese 680 3.68 Persian (Farsi) 175 0.95 Tagalog 670 3.62 Russian 175 0.95 Korean 535 2.89 Spanish 85 0.46 Urdu 260 1.41 Serbian 60 0.32

41
Weston
Age + Gender Population by Age Group:
Age Group % Males % Females % of Total Population
% is Lower/Higher than rest of Toronto
Infants (0-4y) 4% 3.6% 7.6% HIGHER by 20-50%
Children (5-14y) 6.7% 6.1% 12.8% HIGHER
Youth (15-24y) 5.5% 6.5% 12.0% SAME
Working Age (25-64y) 26.9% 28.9% 55.8% LOWER
Seniors (65+ y) 4.6% 7.2% 11.8% LOWER
Total Population Change: HIGHER by 50+%
Adapted from Weston Neighbourhood Profile, City of Toronto. Website: http://www.toronto.ca/demographics/cns_profiles/cns113.htm. Adapted by Stephanie Lam.

42
Dependency Ratio: - (# children and seniors as a percentage of the working population) = 47.3%
Youth (15-24y) Education Status:
- Not attending school = 925 (44.3%) - Attending school Part-time = 120 (5.8%) - Attending school Full-time = 1040 (49.9%)
Household + Income Private Households by Income:
NUMBER % of TOTAL +/- % from 1996 Under $10 000 880 12.1 - 1.2
$10 000 - $29 999 2 155 29.7 - 5.3 $30 000 - $49 999 1 795 24.6 + 0.2 $50 000 - $69 999 920 12.6 + 0.1 $70 000 - $89 999 635 8.7 + 1.6
$90 000 - $100 000+ 900 12.3 + 4.8
Average Household Income: $49 522 Median Household Income: $40 902 Youth (15-24y) Status:
- Living with Family = 1800 (86.3%); Non-Family = 285 (13.7%)
- In the Labour Force = 1290 (61.9%) - Not in the Labour Force = 795 (38.1%)
Immigration, Ethnicity, Language
Total Population = 17 400 Number % of Total Population
% is Lower/Higher than rest of Toronto
No Knowledge of either English or French 740 4.3 LOWER
Aboriginal Population/Identity 135 0.78 HIGHER by 20-50% Visible Minority 8 170 47.0 HIGHER
Canadian Citizenship 14 260 82.0 LOWER Immigrants 8 235 47.3 LOWER
Recent Immigrants 1 920 11.0 SAME Non-Permanent Residents 435 2.5 n/a
Youth (15-24y) Status:
- Visible Minority = 1135 (54.6% of population)
43
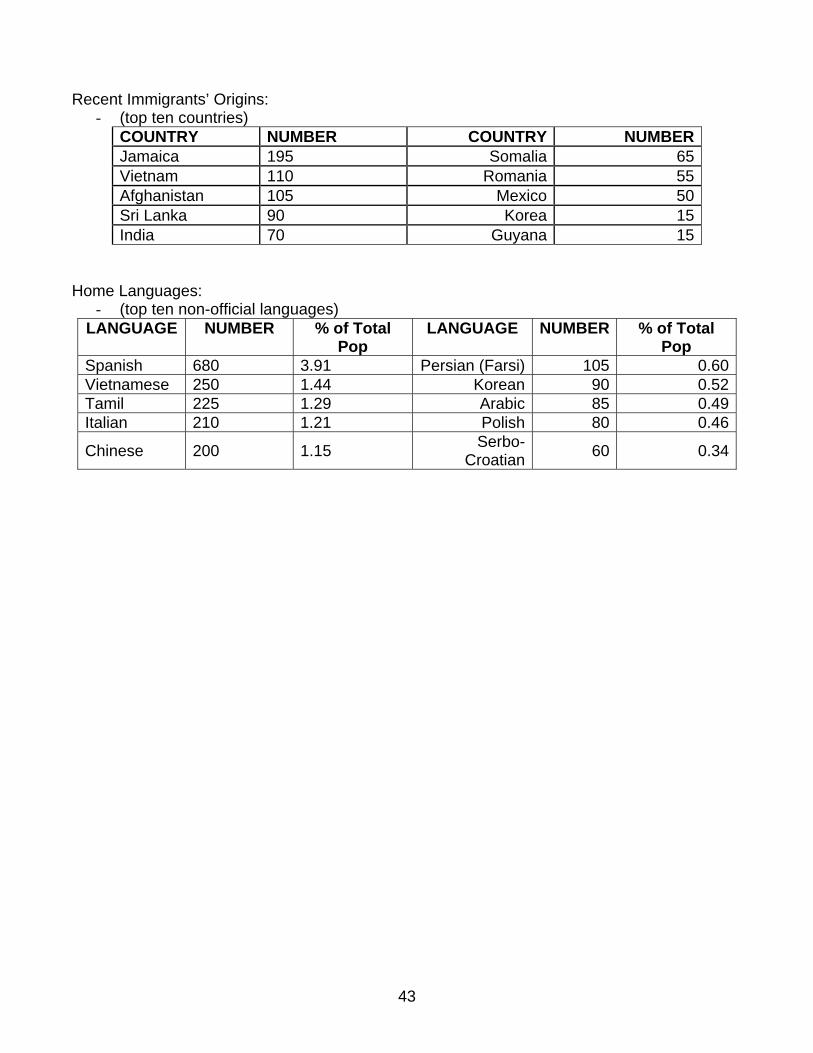
Recent Immigrants’ Origins:
- (top ten countries) COUNTRY NUMBER COUNTRY NUMBERJamaica 195 Somalia 65Vietnam 110 Romania 55Afghanistan 105 Mexico 50Sri Lanka 90 Korea 15India 70 Guyana 15
Home Languages:
- (top ten non-official languages) LANGUAGE NUMBER % of Total
Pop LANGUAGE NUMBER % of Total
Pop Spanish 680 3.91 Persian (Farsi) 105 0.60Vietnamese 250 1.44 Korean 90 0.52Tamil 225 1.29 Arabic 85 0.49Italian 210 1.21 Polish 80 0.46
Chinese 200 1.15 Serbo-Croatian 60 0.34
44
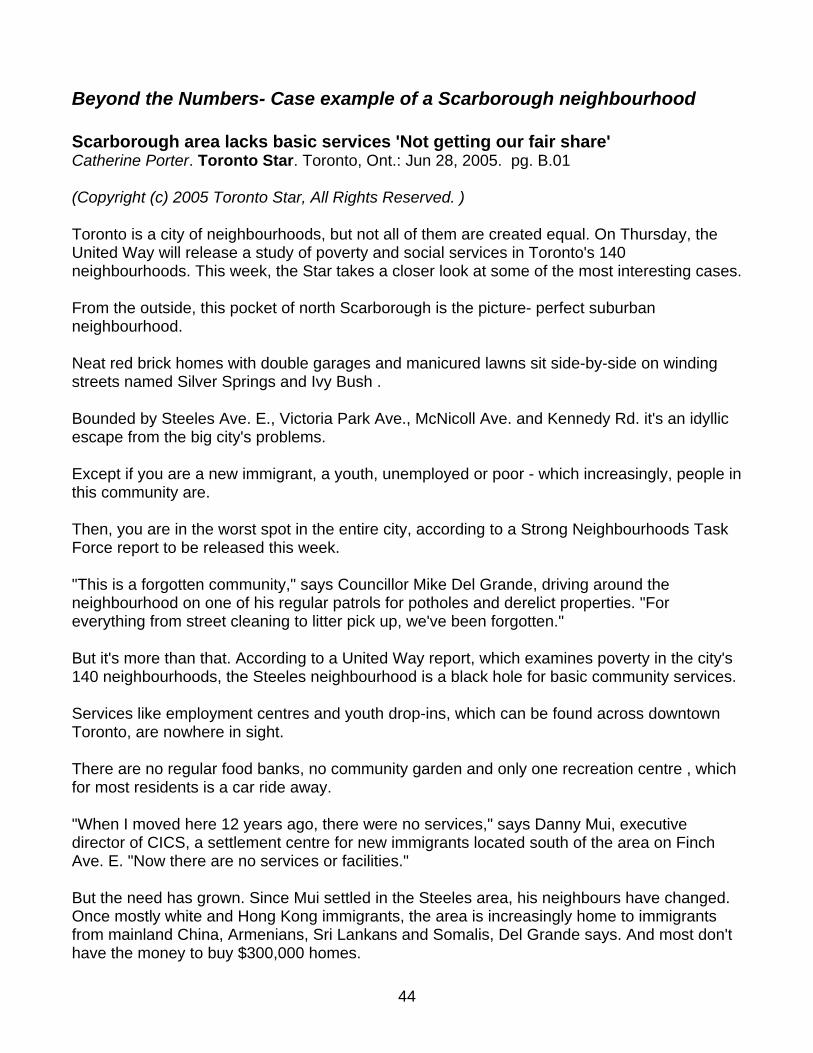
Beyond the Numbers- Case example of a Scarborough neighbourhood Scarborough area lacks basic services 'Not getting our fair share' Catherine Porter. Toronto Star. Toronto, Ont.: Jun 28, 2005. pg. B.01 (Copyright (c) 2005 Toronto Star, All Rights Reserved. )
Toronto is a city of neighbourhoods, but not all of them are created equal. On Thursday, the United Way will release a study of poverty and social services in Toronto's 140 neighbourhoods. This week, the Star takes a closer look at some of the most interesting cases.
From the outside, this pocket of north Scarborough is the picture- perfect suburban neighbourhood.
Neat red brick homes with double garages and manicured lawns sit side-by-side on winding streets named Silver Springs and Ivy Bush .
Bounded by Steeles Ave. E., Victoria Park Ave., McNicoll Ave. and Kennedy Rd. it's an idyllic escape from the big city's problems.
Except if you are a new immigrant, a youth, unemployed or poor - which increasingly, people in this community are.
Then, you are in the worst spot in the entire city, according to a Strong Neighbourhoods Task Force report to be released this week.
"This is a forgotten community," says Councillor Mike Del Grande, driving around the neighbourhood on one of his regular patrols for potholes and derelict properties. "For everything from street cleaning to litter pick up, we've been forgotten."
But it's more than that. According to a United Way report, which examines poverty in the city's 140 neighbourhoods, the Steeles neighbourhood is a black hole for basic community services.
Services like employment centres and youth drop-ins, which can be found across downtown Toronto, are nowhere in sight.
There are no regular food banks, no community garden and only one recreation centre , which for most residents is a car ride away.
"When I moved here 12 years ago, there were no services," says Danny Mui, executive director of CICS, a settlement centre for new immigrants located south of the area on Finch Ave. E. "Now there are no services or facilities."
But the need has grown. Since Mui settled in the Steeles area, his neighbours have changed. Once mostly white and Hong Kong immigrants, the area is increasingly home to immigrants from mainland China, Armenians, Sri Lankans and Somalis, Del Grande says. And most don't have the money to buy $300,000 homes.
45
"There are three or four families living in a house," says Del Grande (Ward 39, Scarborough-Agincourt).
"On the outside, it all looks good. What happens on the inside is a whole different story."
Earlier this month, he stopped by a home to ask about its unkempt lawn, and found a tenant living in a closet-sized single room apartment at the back of the house, Del Grande says. He was an Iranian immigrant, who had just moved to Toronto, and was paying $430 a month for the room.
"He doesn't know his rights," says Del Grande. "He said, 'I don't know where to go, what to do.'"
To service the area's 3,425 new immigrants - roughly one of every six people - there are only two English-as-a-second-language classes, both held in the basement of a local church.
For Cathy Yu, that's meant only two half-day classes a week - not enough to boost her confidence when speaking English on the phone.
"I don't know how to find more ESL classes," says Yu, who came to Canada with her husband and daughter from China two years ago.
"I want to do exercise but I don't know where. I want to have some activity, I don't know where to find this place."
The truth is, there is no place.
"There is no social infrastructure," Mui says. "Even if we want to deliver services, we have no space to do it from."
The Strong Neighbourhood Task Force formed last year, in response to a United Way report that showed poverty was moving to Toronto's former suburbs. Called "Poverty by Postal Code," the report revealed that the number of neighbourhoods where more than one-quarter of families live in poverty has doubled each decade since 1981, comprising 23 per cent of the city's neighbourhoods by 2001.
Over the past year, the 23-member task force tried to flesh out that picture, examining the city's 140 neighbourhoods with a broader lens of "poverty," including not just income levels but unemployment rates, teenage pregnancy rates, education levels, competency in English, and housing conditions, among other things.
Funded by the provincial and federal governments, the task force also examined what services were available in each neighbourhood to alleviate poverty - things like community centres, food banks and settlement services.
It found that the city's former suburbs are increasingly home to poorer and poorer neighbourhoods. And, once intended as middle- class communities, they don't have the resources to deal with the increasing problems.

46
"There's been a huge influx of people into communities without a change in the way services or infrastructure are provided," said Frances Lankin, president of the United Way of Greater Toronto, and the task force's co-chair.
So, while you can walk to a boys' and girls' club, a seniors' residence, or an employment centre if you are dropped anywhere in downtown Toronto, it will mean bus rides - expensive for people barely scraping by - in Scarborough.
"If you're downtown and you're homeless, I could guarantee we could get you a hot meal every day somewhere within walking distances. In Scarborough, you'd have to take three buses to one. There is nothing within walking distance," says Heather Urbansky, the manager of social support with West Hill Community Services, one of the few service providers in Scarborough. The food bank it runs serves 170 families a week.
The city's east end proved the most underserved, the report found. Of the city's 38 neighbourhoods found lacking in general basic services, 23 are in Scarborough or along its border.
Downtown Toronto has 17 community health centres; Scarborough has one.
And of them all, the neighbourhood of Steeles has received the shortest stick.
Del Grande hopes the task force's report will change that.
"We're not getting our fair share," he says.

47
Section 3: Interview Skills
48
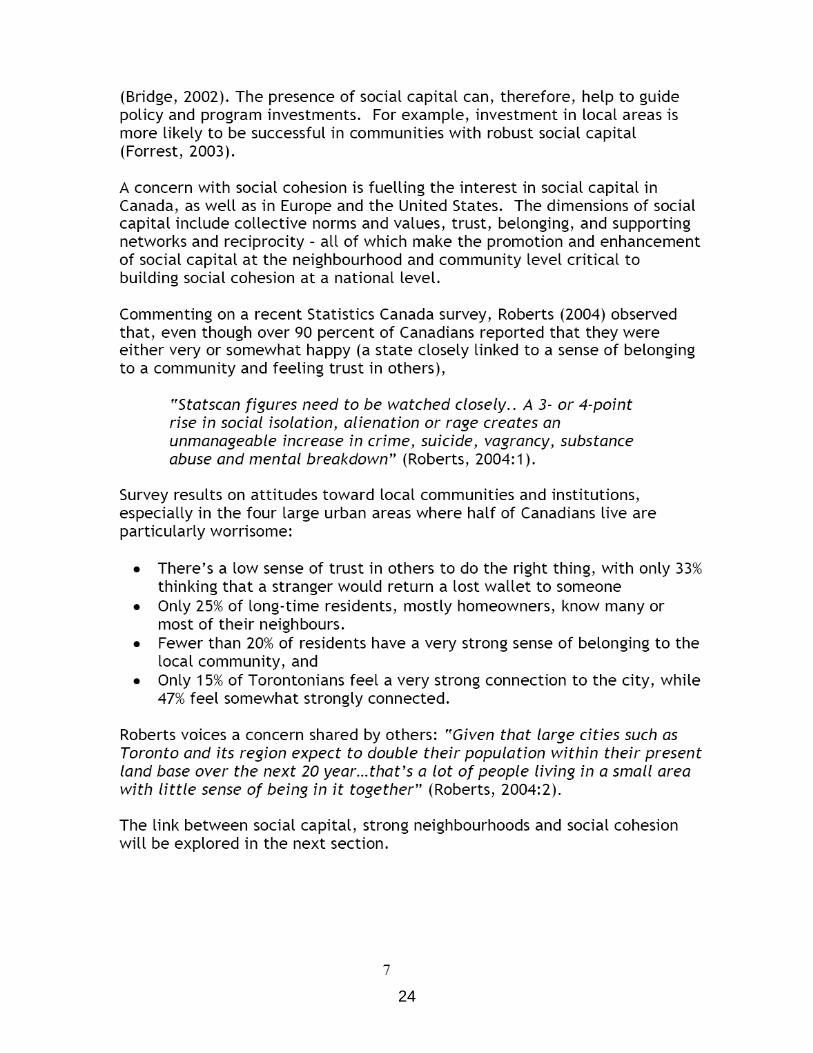
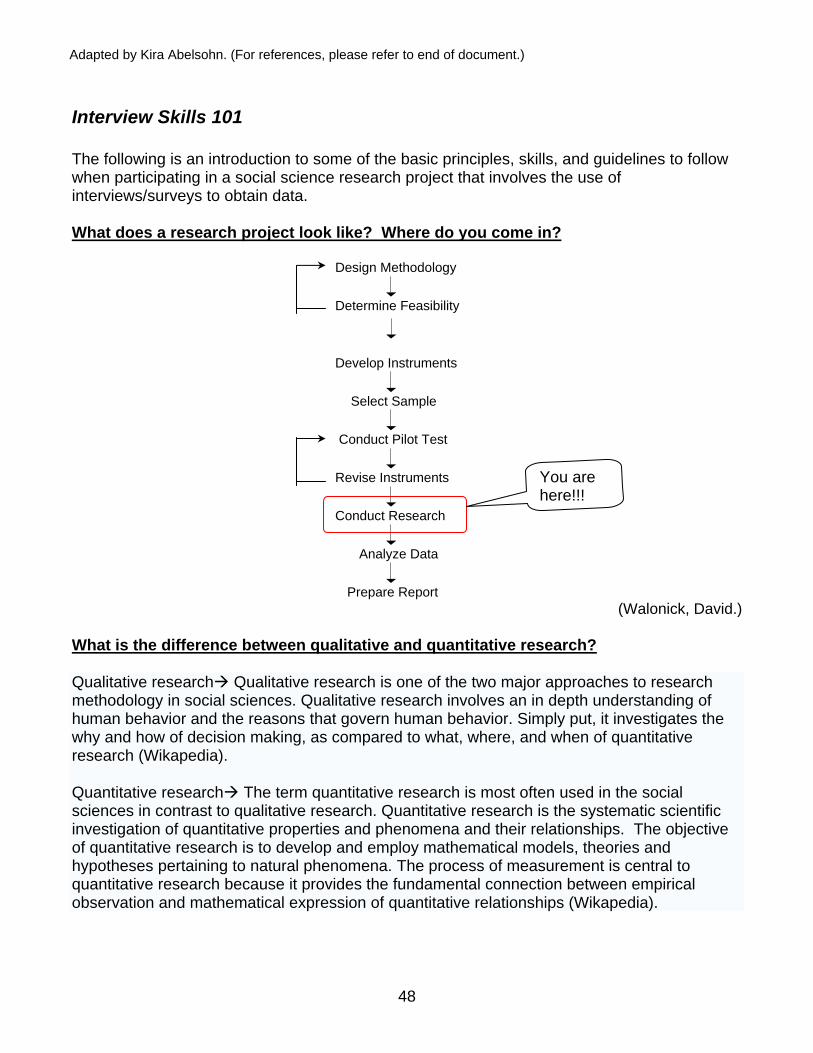
Interview Skills 101 The following is an introduction to some of the basic principles, skills, and guidelines to follow when participating in a social science research project that involves the use of interviews/surveys to obtain data. What does a research project look like? Where do you come in?
Design Methodology
Determine Feasibility
Develop Instruments
Select Sample
Conduct Pilot Test
Revise Instruments
Conduct Research
Analyze Data
Prepare Report
(Walonick, David.) What is the difference between qualitative and quantitative research?
Qualitative research Qualitative research is one of the two major approaches to research methodology in social sciences. Qualitative research involves an in depth understanding of human behavior and the reasons that govern human behavior. Simply put, it investigates the why and how of decision making, as compared to what, where, and when of quantitative research (Wikapedia).
Quantitative research The term quantitative research is most often used in the social sciences in contrast to qualitative research. Quantitative research is the systematic scientific investigation of quantitative properties and phenomena and their relationships. The objective of quantitative research is to develop and employ mathematical models, theories and hypotheses pertaining to natural phenomena. The process of measurement is central to quantitative research because it provides the fundamental connection between empirical observation and mathematical expression of quantitative relationships (Wikapedia).
You are here!!!
Adapted by Kira Abelsohn. (For references, please refer to end of document.)

49
Why use interviews? Personal interviews are a way to get in-depth and comprehensive information. They involve one person interviewing another person for personal or detailed information. Typically, an interviewer will ask questions from a written questionnaire and record the answers verbatim (Walonick, David). Some tips for conducting a successful interview: (Brune, Christina)
1. Be Prepared Knowing the background information, purpose of the study, organizations name, who’s funding the project, etc. are all aspects of being prepared for the interview. Thinking about the objective of the interview before beginning the process will bring clarity and provide context for yourself, and for the person you are interviewing.
2. Keep the interaction professional Use your first and last name when you introduce yourself. Show your ID card immediately. Be confident and positive. Try to assume that the respondent wants to cooperate.
3. Select the appropriate environment The level of cooperation from the interviewee is largely dependent on the interview setting. Experts agree that it’s helpful to conduct the interview in an environment that’s comfortable to the interviewee.
4. Keep in mind the number of people present Considering this survey is health-related, it may contain some questions that are of personal nature. Informing the interviewee before beginning the survey and negotiating a space away from family members etc. may help make the interviewee feel more comfortable.
5. Be time conscious Keep in mind that you may be interrupting a significant portion of the interviewees day. Being respectful of potential time constraints includes informing the interviewee of the length of the survey before you begin, and staying focused throughout the interview process to as to keep the interview as short as possible.
6. Listen Use active listening to let the interviewee know that you’re interested in what they have to say, and that their personal information and opinions are extremely valuable for the purpose of your study.
7. Be Patient Don’t rush the interviewee. Some questions may be difficult for them to understand, some answers may take longer than others, there may be slight language barriers, etc. Take the time to make the interviewee feel comfortable.
8. Be aware of your own body language Pay attention to the signals you may be sending to the interviewee. Try to avoid showing any kind of surprise or negativity. Acting like ‘you’ve heard it all before,’ and demonstrating that you’re there to help, not accuse, will encourage the cooperation of the interviewee.
9. Neutrality Avoid communicating your own opinions and beliefs. Do not judge respondent’s answers, and never interview friends, relatives, or neighbors, etc.

50
10. Don’t be afraid to confirm information If you’re unsure about an answer, repeating back what you think their response was not only shows the interviewee that you’re listening, but it also ensures that you completely understand the information that they are giving you.
A good interviewer is someone who: (SPSS Survey Tips)
• Understands respondents and is empathetic • Listens well • Maintains an attitude of genuine interest • Is articulate • Can be objective • Accepts rejection—doesn’t take “no” personally • Doesn’t let mood affect performance
Reading questions: (Clements, Cayge)
• Read exactly as worded • Read slowly and clearly • Read entire question • Ask every question unless instructed to skip • Read in conversational tone • Emphasize words that are in bold or underlined • Don’t define words or phrases unless definition provided
Probing the respondent: (Clements, Cayge) There are tactics that the interviewer can use to help the respondent answer the questions:
• Used when respondent doesn’t give a direct answer to the question, or doesn’t choose a specific answer category
• Purpose: to obtain specific, complete, and relevant answers from respondent • Difficult skill to learn (i.e. It’s easy to lead respondent, change context of questions, etc.) • Requires active listening on part of the interviewer
Reasons for “don’t know” responses and suggestions for probing them:
• Respondent is in a hurry, doesn’t want to think about the questions, OR has never thought about the subject before:
o Probe “Please take a moment to think about it.”
• Respondent doesn’t feel he/she is expert or knowledgeable enough to answer correctly: o Probe “There are no right or wrong answers. Please just base your answer on
anything you may have seen, read, or heard.”
51
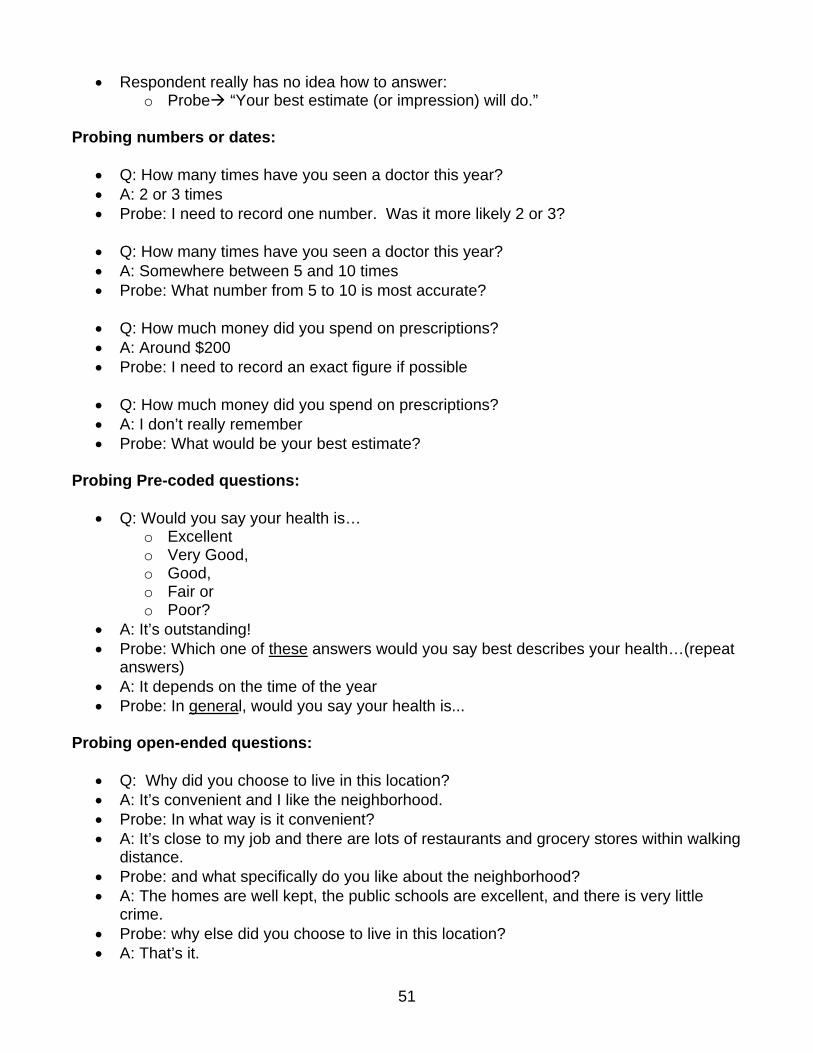
• Respondent really has no idea how to answer: o Probe “Your best estimate (or impression) will do.”
Probing numbers or dates:
• Q: How many times have you seen a doctor this year? • A: 2 or 3 times • Probe: I need to record one number. Was it more likely 2 or 3? • Q: How many times have you seen a doctor this year? • A: Somewhere between 5 and 10 times • Probe: What number from 5 to 10 is most accurate? • Q: How much money did you spend on prescriptions? • A: Around $200 • Probe: I need to record an exact figure if possible • Q: How much money did you spend on prescriptions? • A: I don’t really remember • Probe: What would be your best estimate?
Probing Pre-coded questions:
• Q: Would you say your health is… o Excellent o Very Good, o Good, o Fair or o Poor?
• A: It’s outstanding! • Probe: Which one of these answers would you say best describes your health…(repeat
answers) • A: It depends on the time of the year • Probe: In general, would you say your health is...
Probing open-ended questions:
• Q: Why did you choose to live in this location? • A: It’s convenient and I like the neighborhood. • Probe: In what way is it convenient? • A: It’s close to my job and there are lots of restaurants and grocery stores within walking
distance. • Probe: and what specifically do you like about the neighborhood? • A: The homes are well kept, the public schools are excellent, and there is very little
crime. • Probe: why else did you choose to live in this location? • A: That’s it.

52
Commonly asked questions: (Clements, Cayge) Be prepared to answer all kinds of questions about the project you are working on. Keep in mind that if people are willing to offer you their personal information, they are entitled to know what it’s going to be used for, how it will benefit themselves and their neighbours, etc.
• How did you pick me? Where did you get my name? • What is the purpose of this study? • Who will see my answer? • What good does this do? How do I benefit? • How long will this take?
References: Brune, Christina. The Artful Interviewer. The Internal Auditor. April 2003, 60, (2).
Clements, Cayge. Introduction to Survey Interviewing. Survey Research Laboratory Seminar
Series. Available at: www.srl.uic.edu
SPSS Survey Tips: A handy guide to help you save time and money as you plan, develop, and execute your surveys. Available at: www.spss.com
Walonick, David. Excerpts from: Survival Statistics. StatPac, Inc. Bloomington, MN. Suggested Reading: Britten, Nicky. Qualitative Research: Qualitative interviews in medical research. Available at:
www.bmj.com/cgi/content/full/311/6999/251?eaf Birks, Melanie; Chapman, Ysanne; and Francis, Karen. Breaching the Wall: Interviewing
People from Other Cultures.