Embed Size (px)
Citation preview
Rapid Bioassessment in
Wadeable Streams and Rivers
By Volunteer Monitors
Year 2004 Summary Report
State of Connecticut
Department of Environmental Protection
Bureau of Water Management
Planning and Standards Division
Ambient Monitoring Program
Regina McCarthy, Commissioner
Rapid Bioassessment in Wadeable Streams and Rivers by Volunteer Monitors 2004 Summary Report
Page 2 of 23
Rapid Bioassessment in Wadeable Streams and Rivers
By Volunteer Monitors Year 2004 Summary Report
By Mike Beauchene
January 2005
Executive Summary: Rapid Bioassessment in Wadeable Streams and Rivers by
Volunteer Monitors (RBV), http://www.dep.state.ct.us/wtr/volunmon/volopp.htm ,
(Appendix A), is a macroinvertebrate collection protocol developed by the Connecticut
Department of Environmental Protection, Bureau of Water Management, Ambient
Monitoring Program (herein referred to as DEP). The goal of RBV is to provide
volunteer monitoring programs with a quick, efficient, and standardized methodology for
the collection of macroinvertebrate community data from wadeable streams. This data
can be used to screen for either very high or very low water quality and augment
monitoring conducted by DEP. The DEP has 20 sets of equipment available for short-
term loan to groups who have sponsored at least 1-RBV training session and intend to
submit samples to the DEP.
During the fifth official sampling season (fall 2004) 19 volunteer groups collected 54
macroinvertebrate samples on 43 different waterbodies across Connecticut. The number
of "most wanted" types ranged from a high of 5 at 4 locations (Beaver Brook-Lyme, East
Branch Salmon Brook-Granby, and 2 sites on the Saugatuck River-Weston) to a low of 0
at tributary to Gages Brook, Vernon. The 4 samples with 5 different types of the most
wanted indicate full support of aquatic life use. Twenty-seven of 54 samples indicated
excellent water quality (3-4 different types of most wanted), 11 very good water quality,
and 11 fair/good water quality, and only 1 poor water quality. To obtain additional
information about RBV or to become involved, please contact Mike Beauchene,
volunteer monitoring coordinator, by phone (860) 424-4185 or email
Acknowledgements: Without participation from the following this program would
not be possible: Connecticut Audubon (Glastonbury and Pomfret), Connecticut Fly
Fisherman's Association, Connecticut River Watch (Bolton Conservation
Commission, Eightmile River Watershed and Hockanum River Watershed
Associations), Enfield Conservation and Inland Wetlands Commissions, Farmington
River Watershed Association, Housatonic Valley Association, Manchester
Community Technical College Science Club, Mansfield Girl Scout Troop 5284,
Nature Conservancy-Devils Den, Salmon Brook Watershed Association, Stafford
River Watchers, Trout Unlimited-Thames Chapter, UCONN soil and water
conservation society, and Willington Conservation Commission. In addition the
following individuals submitted data independent of a formal organization; Alex and
Cody Lorentson, Jane Seymour, and Carrie and David Sinish. Introduction: The Connecticut Department of Environmental Protection is an equal opportunity/affirmative action
employer, offering their services without regard to race, color, religion, national origin, age, sex, or
disability. In conformance with the Americans with Disabilities Act, the DEP makes every effort to
provide equally effective services for persons with disabilities. http://dep.state.ct.us/
Rapid Bioassessment in Wadeable Streams and Rivers by Volunteer Monitors 2004 Summary Report
Page 3 of 23
Stream and River Water Quality Monitoring:
Staff assigned to the ambient water quality monitoring and assessment program
are responsible for monitoring Connecticut’s approximately 5,484 miles of perennial
streams and rivers (CT DEP 1999). The monitoring program supports activities of the
DEP by providing data (chemical, physical, and biological) and related expertise to assess
surface water quality conditions and trends. Monitoring activities are prioritized and
focus on the most significant resources, selected reference sites, and in response to
nuisance complaints or concerns regarding pollution impacts. Approximately 20% of
state rivers and streams are monitored (CT DEP 2004).
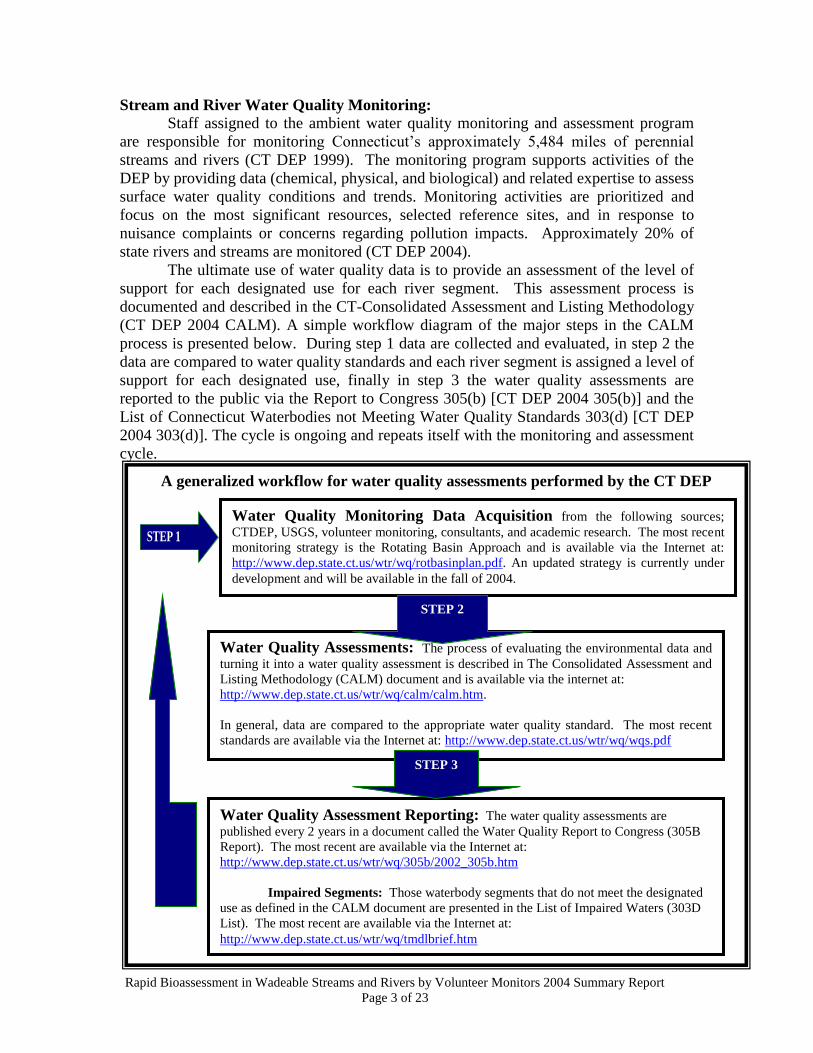
The ultimate use of water quality data is to provide an assessment of the level of
support for each designated use for each river segment. This assessment process is
documented and described in the CT-Consolidated Assessment and Listing Methodology
(CT DEP 2004 CALM). A simple workflow diagram of the major steps in the CALM
process is presented below. During step 1 data are collected and evaluated, in step 2 the
data are compared to water quality standards and each river segment is assigned a level of
support for each designated use, finally in step 3 the water quality assessments are
reported to the public via the Report to Congress 305(b) [CT DEP 2004 305(b)] and the
List of Connecticut Waterbodies not Meeting Water Quality Standards 303(d) [CT DEP
2004 303(d)]. The cycle is ongoing and repeats itself with the monitoring and assessment
cycle.
A generalized workflow for water quality assessments performed by the CT DEP
STEP 1
Water Quality Monitoring Data Acquisition from the following sources;
CTDEP, USGS, volunteer monitoring, consultants, and academic research. The most recent
monitoring strategy is the Rotating Basin Approach and is available via the Internet at:
http://www.dep.state.ct.us/wtr/wq/rotbasinplan.pdf. An updated strategy is currently under
development and will be available in the fall of 2004.
Water Quality Assessments: The process of evaluating the environmental data and
turning it into a water quality assessment is described in The Consolidated Assessment and
Listing Methodology (CALM) document and is available via the internet at:
http://www.dep.state.ct.us/wtr/wq/calm/calm.htm.
In general, data are compared to the appropriate water quality standard. The most recent
standards are available via the Internet at: http://www.dep.state.ct.us/wtr/wq/wqs.pdf
Water Quality Assessment Reporting: The water quality assessments are
published every 2 years in a document called the Water Quality Report to Congress (305B
Report). The most recent are available via the Internet at:
http://www.dep.state.ct.us/wtr/wq/305b/2002_305b.htm
Impaired Segments: Those waterbody segments that do not meet the designated
use as defined in the CALM document are presented in the List of Impaired Waters (303D
List). The most recent are available via the Internet at:
http://www.dep.state.ct.us/wtr/wq/tmdlbrief.htm
STEP 2
STEP 3
Rapid Bioassessment in Wadeable Streams and Rivers by Volunteer Monitors 2004 Summary Report
Page 4 of 23
WATER QUALITY MONITOIRING ASSESSMENTS:
A primary component of the Ambient Monitoring Program utilizes the riffle-
dwelling benthic macroinvertebrate community as an indicator of biological integrity.
Methods follow the USEPA Rapid Bioassessment Protocol III (RBPIII) for Streams and
Rivers [http://www.epa.gov/owow/monitoring/rbp] (Plafkin et al 1989). The RBPIII involves
collecting, sub-sampling, and identifying macroinvertebrates collected from riffle areas in
wadeable streams. The variety and abundance of macroinvertebrates from each site are
converted into a series of community structure metrics. The metrics from each site are
then compared to metrics from a reference site. The final result is an assessment of the
impairment level of the benthic community for each site.
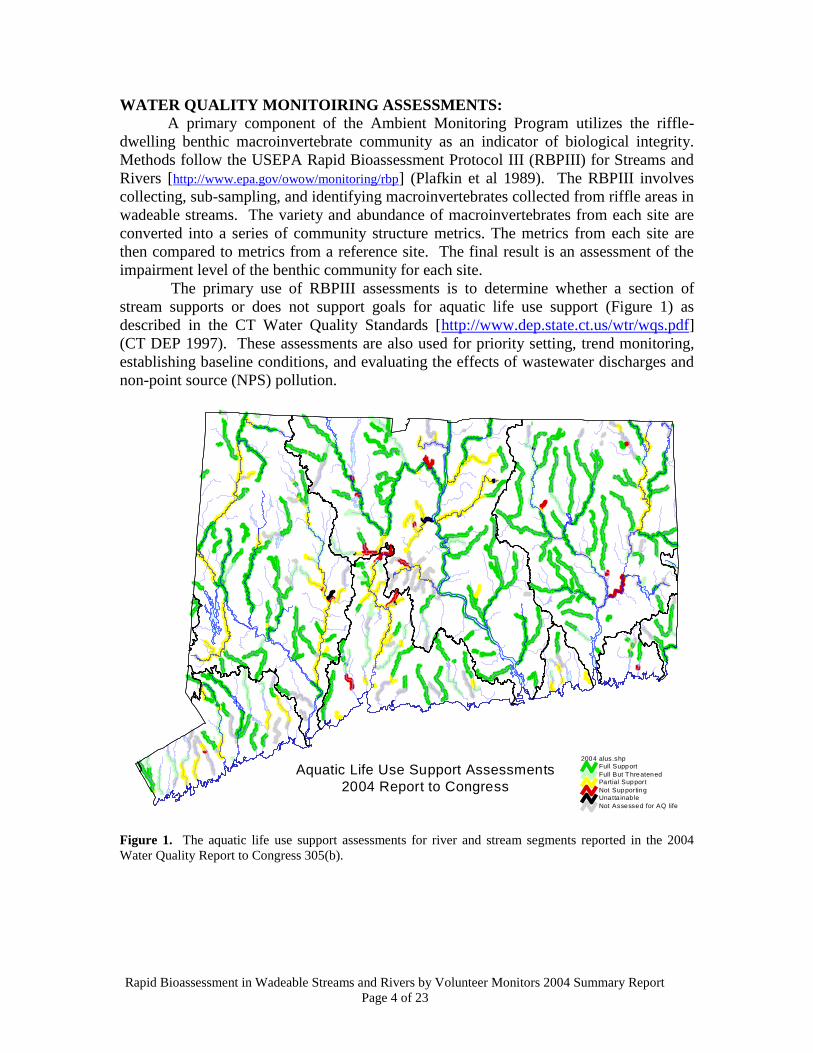
The primary use of RBPIII assessments is to determine whether a section of
stream supports or does not support goals for aquatic life use support (Figure 1) as
described in the CT Water Quality Standards [http://www.dep.state.ct.us/wtr/wqs.pdf]
(CT DEP 1997). These assessments are also used for priority setting, trend monitoring,
establishing baseline conditions, and evaluating the effects of wastewater discharges and
non-point source (NPS) pollution.
2004 alus.shpFull Support
Full But T hreatenedPartial Support
Not SupportingUnatta inable
Not Assessed for AQ life
Aquatic Life Use Support Assessments
2004 Report to Congress
Figure 1. The aquatic life use support assessments for river and stream segments reported in the 2004
Water Quality Report to Congress 305(b).
Rapid Bioassessment in Wadeable Streams and Rivers by Volunteer Monitors 2004 Summary Report
Page 5 of 23
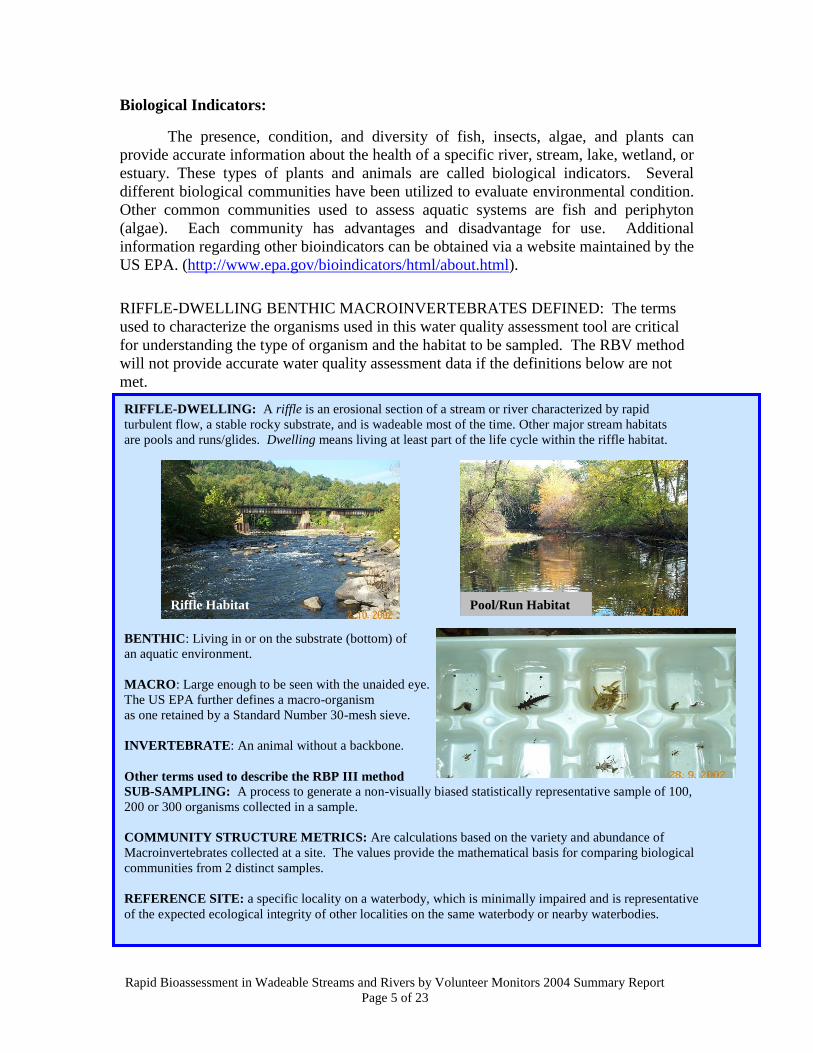
RIFFLE-DWELLING: A riffle is an erosional section of a stream or river characterized by rapid
turbulent flow, a stable rocky substrate, and is wadeable most of the time. Other major stream habitats
are pools and runs/glides. Dwelling means living at least part of the life cycle within the riffle habitat.
BENTHIC: Living in or on the substrate (bottom) of
an aquatic environment.
MACRO: Large enough to be seen with the unaided eye.
The US EPA further defines a macro-organism
as one retained by a Standard Number 30-mesh sieve.
INVERTEBRATE: An animal without a backbone.
Other terms used to describe the RBP III method
SUB-SAMPLING: A process to generate a non-visually biased statistically representative sample of 100,
200 or 300 organisms collected in a sample.
COMMUNITY STRUCTURE METRICS: Are calculations based on the variety and abundance of
Macroinvertebrates collected at a site. The values provide the mathematical basis for comparing biological
communities from 2 distinct samples.
REFERENCE SITE: a specific locality on a waterbody, which is minimally impaired and is representative
of the expected ecological integrity of other localities on the same waterbody or nearby waterbodies.
Biological Indicators:
The presence, condition, and diversity of fish, insects, algae, and plants can
provide accurate information about the health of a specific river, stream, lake, wetland, or
estuary. These types of plants and animals are called biological indicators. Several
different biological communities have been utilized to evaluate environmental condition.
Other common communities used to assess aquatic systems are fish and periphyton
(algae). Each community has advantages and disadvantage for use. Additional
information regarding other bioindicators can be obtained via a website maintained by the
US EPA. (http://www.epa.gov/bioindicators/html/about.html).
RIFFLE-DWELLING BENTHIC MACROINVERTEBRATES DEFINED: The terms
used to characterize the organisms used in this water quality assessment tool are critical
for understanding the type of organism and the habitat to be sampled. The RBV method
will not provide accurate water quality assessment data if the definitions below are not
met.
Riffle Habitat Pool/Run Habitat
Rapid Bioassessment in Wadeable Streams and Rivers by Volunteer Monitors 2004 Summary Report
Page 6 of 23
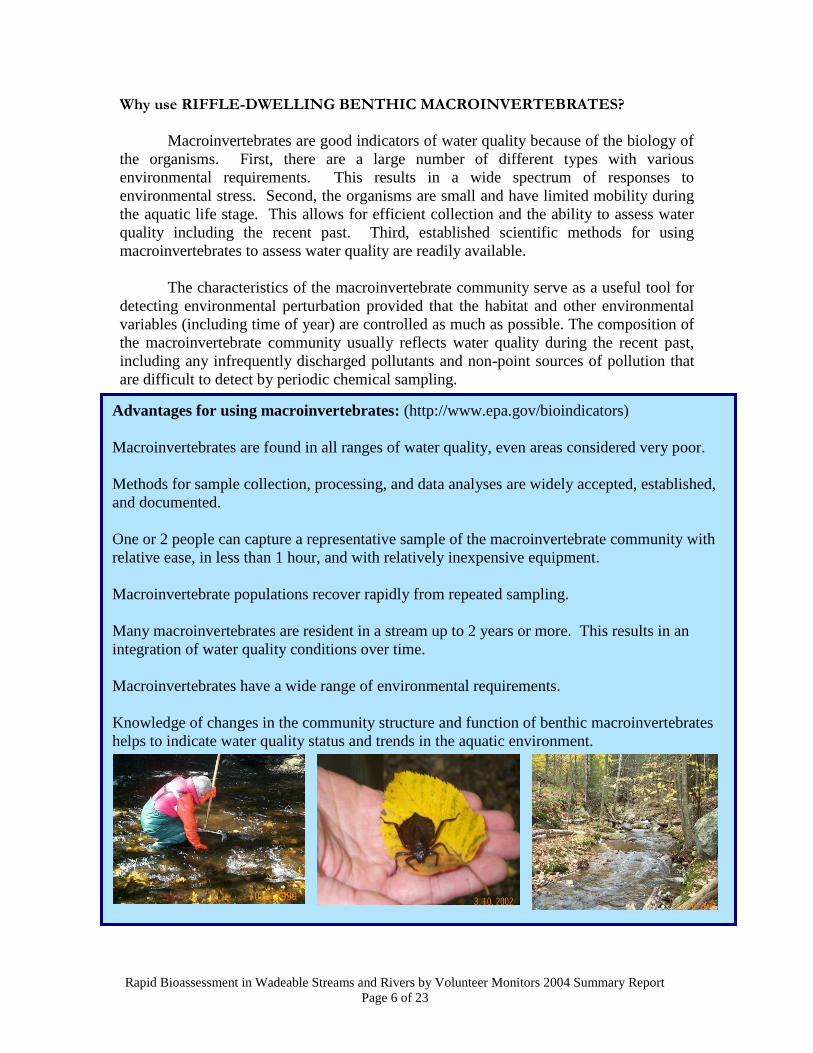
Advantages for using macroinvertebrates: (http://www.epa.gov/bioindicators)
Macroinvertebrates are found in all ranges of water quality, even areas considered very poor.
Methods for sample collection, processing, and data analyses are widely accepted, established,
and documented.
One or 2 people can capture a representative sample of the macroinvertebrate community with
relative ease, in less than 1 hour, and with relatively inexpensive equipment.
Macroinvertebrate populations recover rapidly from repeated sampling.
Many macroinvertebrates are resident in a stream up to 2 years or more. This results in an
integration of water quality conditions over time.
Macroinvertebrates have a wide range of environmental requirements.
Knowledge of changes in the community structure and function of benthic macroinvertebrates
helps to indicate water quality status and trends in the aquatic environment.
Why use RIFFLE-DWELLING BENTHIC MACROINVERTEBRATES?
Macroinvertebrates are good indicators of water quality because of the biology of
the organisms. First, there are a large number of different types with various
environmental requirements. This results in a wide spectrum of responses to
environmental stress. Second, the organisms are small and have limited mobility during
the aquatic life stage. This allows for efficient collection and the ability to assess water
quality including the recent past. Third, established scientific methods for using
macroinvertebrates to assess water quality are readily available.
The characteristics of the macroinvertebrate community serve as a useful tool for
detecting environmental perturbation provided that the habitat and other environmental
variables (including time of year) are controlled as much as possible. The composition of
the macroinvertebrate community usually reflects water quality during the recent past,
including any infrequently discharged pollutants and non-point sources of pollution that
are difficult to detect by periodic chemical sampling.
Rapid Bioassessment in Wadeable Streams and Rivers by Volunteer Monitors 2004 Summary Report
Page 7 of 23
THE RBV ORGANISMS
Additional information including Field Identification Cards can be found on the web at:
(http://dep.state.ct.us/wtr/volunmon/volopp.htm)
Each RBV organism has distinct shape, structure, color, or behavior and provides key ecological information about the
stream environment. Each of the organisms are grouped into one of three "wanted" categories; Most, Moderate, or Least.
Most Wanted: In general these organisms require a narrow range of high quality environmental conditions. When
found in abundance very good water quality can be inferred.
Moderately Wanted: These organisms can be found in a variety of environmental conditions from high to
medium quality. When found in abundance and in the absence of most wanted types, water quality may be less
than optimal.
Least Wanted: These organisms tend to be tolerant of a wide range of environmental conditions including poor water
quality. When found in abundance and in the absence of either most or moderate representatives, some level of water
quality impairment can be inferred.
It is important to note that the "least wanted" are able to thrive in many environmental conditions while the "most
wanted" thrive only under non-impacted high quality conditions. Therefore the most definitive RBV data are the
collections with good representation of organisms in the "most wanted" category.
Volunteer Monitoring and Macroinvertebrates:
Due to the utility of macroinvertebrate data, some volunteer monitoring groups
have implemented programs similar to RBPIII used by the DEP. However, many
monitors will agree that this process is anything but rapid. Even the most dedicated
volunteers can struggle with the tedium of sub-sampling and family level identification.
RBV capitalizes on the utility of macroinvertebrate data while keeping the methods and
equipment straightforward, standardized, inexpensive, and most importantly “rapid”.
The RBV method may be less sensitive in terms of its ability to detect subtle
differences in the community structure because of reduced taxonomic rigor. However,
the ability to characterize a broad range of water quality conditions is good. We believe
the benefits of RBV in terms of the utility it provides to volunteer monitoring groups and
consequently the additional data they provide to DEP far offset any loss of sensitivity.
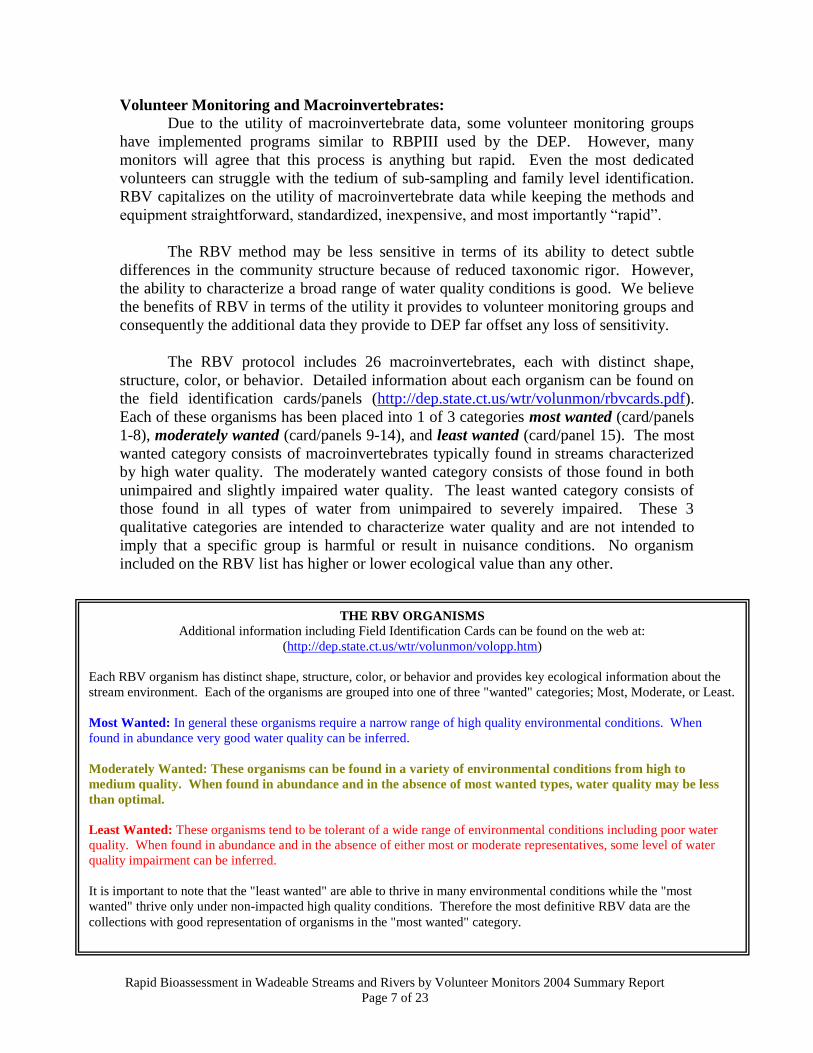
The RBV protocol includes 26 macroinvertebrates, each with distinct shape,
structure, color, or behavior. Detailed information about each organism can be found on
the field identification cards/panels (http://dep.state.ct.us/wtr/volunmon/rbvcards.pdf).
Each of these organisms has been placed into 1 of 3 categories most wanted (card/panels
1-8), moderately wanted (card/panels 9-14), and least wanted (card/panel 15). The most
wanted category consists of macroinvertebrates typically found in streams characterized
by high water quality. The moderately wanted category consists of those found in both
unimpaired and slightly impaired water quality. The least wanted category consists of
those found in all types of water from unimpaired to severely impaired. These 3
qualitative categories are intended to characterize water quality and are not intended to
imply that a specific group is harmful or result in nuisance conditions. No organism
included on the RBV list has higher or lower ecological value than any other.
Rapid Bioassessment in Wadeable Streams and Rivers by Volunteer Monitors 2004 Summary Report
Page 8 of 23
RBV Program Implementation:
Twenty volunteer monitoring programs or individual citizens participated during
the 2004 sampling season (September-December). Prior to collecting the
macroinvertebrates most groups sponsored a 3-hour training session in which the DEP
Volunteer Monitoring Coordinator described the program and introduced the participants
to the RBV methodology. Approximately 232 people attended at least one of these
training sessions. In most cases, the organization implemented RBV either immediately
following the training session or within a week. A quality assurance project plan (QAPP)
was written by DEP and approved by EPA in January of 2003. This document describes
all aspects of the RBV program and how controls are in place to insure the data collected
meets data quality standards. Any group participating in the program will be covered
under the QAPP until 2007.
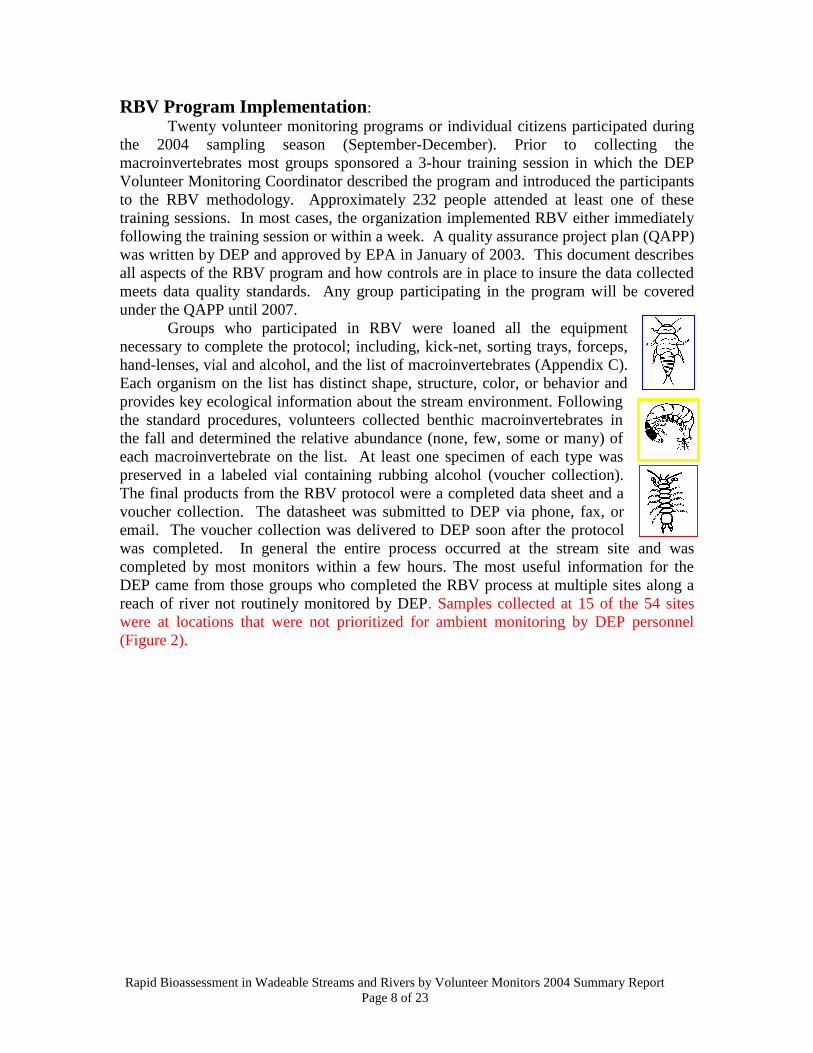
Groups who participated in RBV were loaned all the equipment
necessary to complete the protocol; including, kick-net, sorting trays, forceps,
hand-lenses, vial and alcohol, and the list of macroinvertebrates (Appendix C).
Each organism on the list has distinct shape, structure, color, or behavior and
provides key ecological information about the stream environment. Following
the standard procedures, volunteers collected benthic macroinvertebrates in
the fall and determined the relative abundance (none, few, some or many) of
each macroinvertebrate on the list. At least one specimen of each type was
preserved in a labeled vial containing rubbing alcohol (voucher collection).
The final products from the RBV protocol were a completed data sheet and a
voucher collection. The datasheet was submitted to DEP via phone, fax, or
email. The voucher collection was delivered to DEP soon after the protocol
was completed. In general the entire process occurred at the stream site and was
completed by most monitors within a few hours. The most useful information for the
DEP came from those groups who completed the RBV process at multiple sites along a
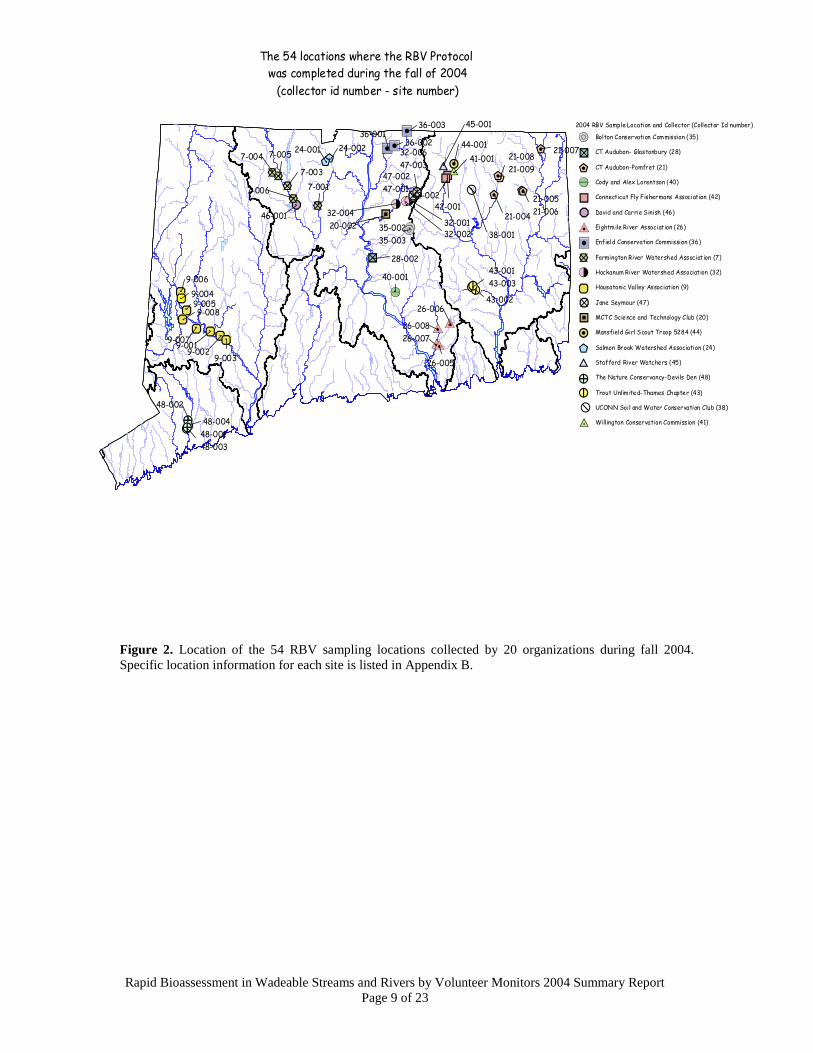
reach of river not routinely monitored by DEP. Samples collected at 15 of the 54 sites
were at locations that were not prioritized for ambient monitoring by DEP personnel
(Figure 2).
Rapid Bioassessment in Wadeable Streams and Rivers by Volunteer Monitors 2004 Summary Report
Page 9 of 23
Figure 2. Location of the 54 RBV sampling locations collected by 20 organizations during fall 2004.
Specific location information for each site is listed in Appendix B.
"³
"
"³
"²
%O
&J
&J
"±
&J
"²"²"²
&D
"±
%x%x
'Q
#·
$y$y
$y$y
&J"³"³
%I
&D
%x
x|x|x|
x|
x|x|
x|x|
#·
(R(R(R&J
&J(F'Q'Q
"±
$B%C%C$Z"G'Q'Q
#
9-006
#9-004
#
9-005
#
9-008
#
9-007#
9-001#
9-003
#
9-002
#
48-002
#
48-001
48-003
# 48-004
#
7-004
#
7-005
#
7-003
#
7-006
#
46-001
#
7-001
#
24-002#
24-001
#
36-003
# 36-002#
36-001
# 21-007
#
21-005
21-006
#
21-008
21-009
#
21-004
#
43-001
43-003#
43-002
#
26-006
#26-008
#
26-007#
26-005
#
40-001
# 28-002
#35-002
35-003
#
44-001
#
41-001#
45-001
#
42-001
#
42-002#
38-001
#
20-002
#
32-004
#
32-006
47-003
#
47-002
47-001#
32-001
#
32-002
2004 RBV Sample Location and Collector (Collector Id number)
#· Bolton Conservation Commission (35)
%O CT Audubon- Glastonbury (28)
&J CT Audubon-Pomfret (21)
"¶ Cody and Alex Lorentson (40)
%C Connecticut Fly Fishermans Association (42)
(F David and Carrie Sinish (46)
$y Eightmile River Association (26)
%x Enfield Conservation Commission (36)
'Q Farmington River Watershed Association (7)
"³ Hockanum River Watershed Association (32)
x| Housatonic Valley Association (9)
(R Jane Seymour (47)
%I MCTC Science and Technology Club (20)
"G Mansfield Girl Scout Troop 5284 (44)
&D Salmon Brook Watershed Association (24)
$B Stafford River Watchers (45)
"² The Nature Conservancy-Devils Den (48)
"± Trout Unlimited-Thames Chapter (43)
UCONN Soil and Water Conservation Club (38)
$Z Willington Conservation Commission (41)
The 54 locations where the RBV Protocol
was completed during the fall of 2004
(collector id number - site number)
Rapid Bioassessment in Wadeable Streams and Rivers by Volunteer Monitors 2004 Summary Report
Page 10 of 23
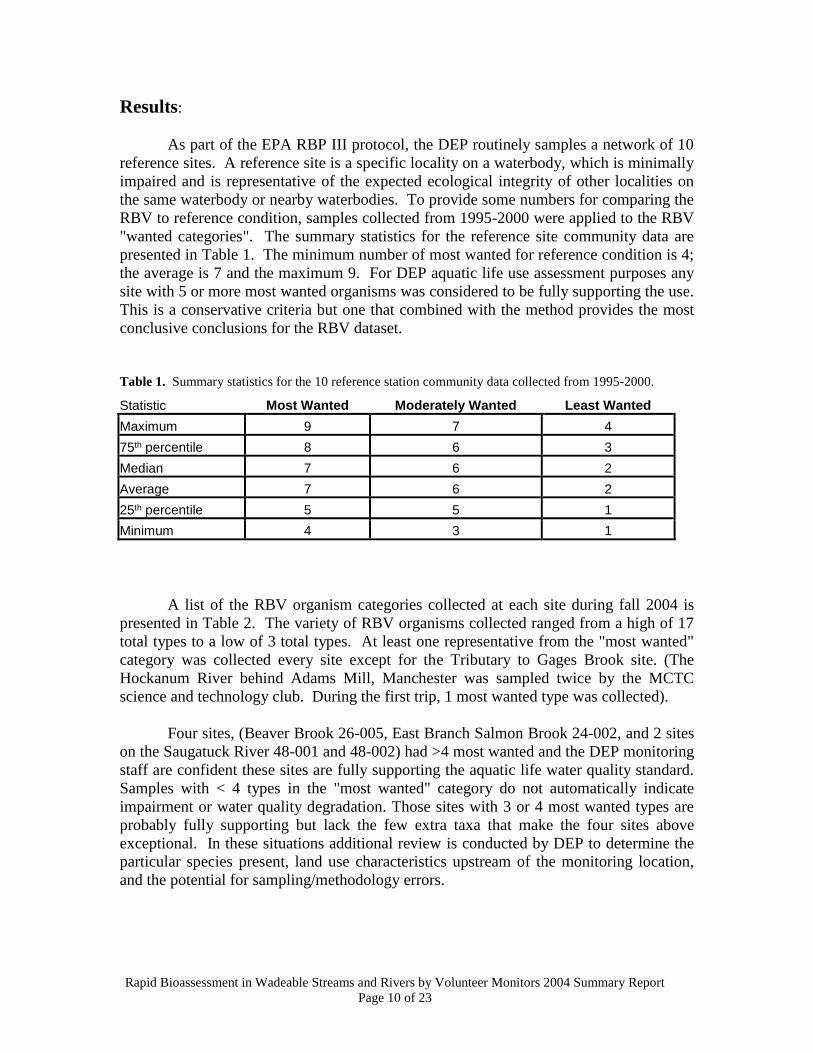
Results:
As part of the EPA RBP III protocol, the DEP routinely samples a network of 10
reference sites. A reference site is a specific locality on a waterbody, which is minimally
impaired and is representative of the expected ecological integrity of other localities on
the same waterbody or nearby waterbodies. To provide some numbers for comparing the
RBV to reference condition, samples collected from 1995-2000 were applied to the RBV
"wanted categories". The summary statistics for the reference site community data are
presented in Table 1. The minimum number of most wanted for reference condition is 4;
the average is 7 and the maximum 9. For DEP aquatic life use assessment purposes any
site with 5 or more most wanted organisms was considered to be fully supporting the use.
This is a conservative criteria but one that combined with the method provides the most
conclusive conclusions for the RBV dataset.
Table 1. Summary statistics for the 10 reference station community data collected from 1995-2000.
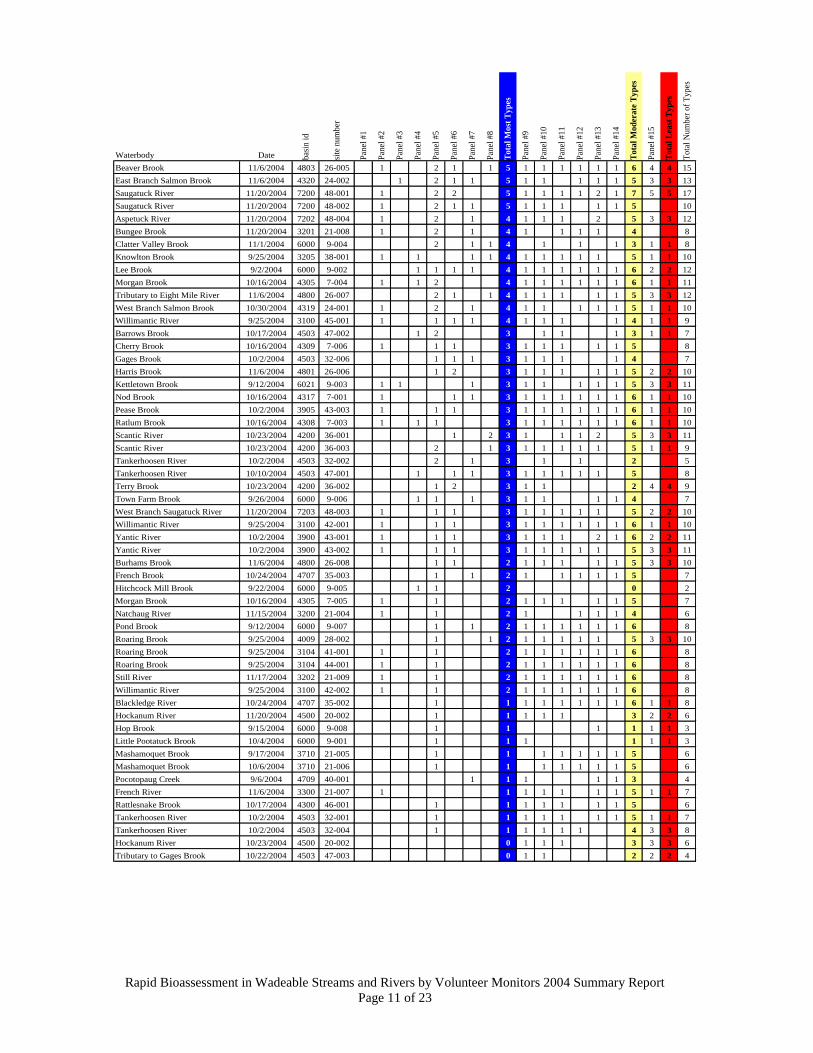
A list of the RBV organism categories collected at each site during fall 2004 is
presented in Table 2. The variety of RBV organisms collected ranged from a high of 17
total types to a low of 3 total types. At least one representative from the "most wanted"
category was collected every site except for the Tributary to Gages Brook site. (The
Hockanum River behind Adams Mill, Manchester was sampled twice by the MCTC
science and technology club. During the first trip, 1 most wanted type was collected).
Four sites, (Beaver Brook 26-005, East Branch Salmon Brook 24-002, and 2 sites
on the Saugatuck River 48-001 and 48-002) had >4 most wanted and the DEP monitoring
staff are confident these sites are fully supporting the aquatic life water quality standard.
Samples with < 4 types in the "most wanted" category do not automatically indicate
impairment or water quality degradation. Those sites with 3 or 4 most wanted types are
probably fully supporting but lack the few extra taxa that make the four sites above
exceptional. In these situations additional review is conducted by DEP to determine the
particular species present, land use characteristics upstream of the monitoring location,
and the potential for sampling/methodology errors.
Statistic Most Wanted Moderately Wanted Least Wanted
Maximum 9 7 4
75th percentile 8 6 3
Median 7 6 2
Average 7 6 2
25th percentile 5 5 1
Minimum 4 3 1
Rapid Bioassessment in Wadeable Streams and Rivers by Volunteer Monitors 2004 Summary Report
Page 11 of 23
Waterbody Date bas
in i
d
site
nu
mb
er
Pan
el #
1
Pan
el #
2
Pan
el #
3
Pan
el #
4
Pan
el #
5
Pan
el #
6
Pan
el #
7
Pan
el #
8
To
tal
Mo
st T
yp
es
Pan
el #
9
Pan
el #
10
Pan
el #
11
Pan
el #
12
Pan
el #
13
Pan
el #
14
To
tal
Mo
der
ate
Ty
pes
Pan
el #
15
To
tal
Lea
st T
yp
es
To
tal
Nu
mb
er o
f T
yp
es
Beaver Brook 11/6/2004 4803 26-005 1 2 1 1 5 1 1 1 1 1 1 6 4 4 15
East Branch Salmon Brook 11/6/2004 4320 24-002 1 2 1 1 5 1 1 1 1 1 5 3 3 13
Saugatuck River 11/20/2004 7200 48-001 1 2 2 5 1 1 1 1 2 1 7 5 5 17
Saugatuck River 11/20/2004 7200 48-002 1 2 1 1 5 1 1 1 1 1 5 10
Aspetuck River 11/20/2004 7202 48-004 1 2 1 4 1 1 1 2 5 3 3 12
Bungee Brook 11/20/2004 3201 21-008 1 2 1 4 1 1 1 1 4 8
Clatter Valley Brook 11/1/2004 6000 9-004 2 1 1 4 1 1 1 3 1 1 8
Knowlton Brook 9/25/2004 3205 38-001 1 1 1 1 4 1 1 1 1 1 5 1 1 10
Lee Brook 9/2/2004 6000 9-002 1 1 1 1 4 1 1 1 1 1 1 6 2 2 12
Morgan Brook 10/16/2004 4305 7-004 1 1 2 4 1 1 1 1 1 1 6 1 1 11
Tributary to Eight Mile River 11/6/2004 4800 26-007 2 1 1 4 1 1 1 1 1 5 3 3 12
West Branch Salmon Brook 10/30/2004 4319 24-001 1 2 1 4 1 1 1 1 1 5 1 1 10
Willimantic River 9/25/2004 3100 45-001 1 1 1 1 4 1 1 1 1 4 1 1 9
Barrows Brook 10/17/2004 4503 47-002 1 2 3 1 1 1 3 1 1 7
Cherry Brook 10/16/2004 4309 7-006 1 1 1 3 1 1 1 1 1 5 8
Gages Brook 10/2/2004 4503 32-006 1 1 1 3 1 1 1 1 4 7
Harris Brook 11/6/2004 4801 26-006 1 2 3 1 1 1 1 1 5 2 2 10
Kettletown Brook 9/12/2004 6021 9-003 1 1 1 3 1 1 1 1 1 5 3 3 11
Nod Brook 10/16/2004 4317 7-001 1 1 1 3 1 1 1 1 1 1 6 1 1 10
Pease Brook 10/2/2004 3905 43-003 1 1 1 3 1 1 1 1 1 1 6 1 1 10
Ratlum Brook 10/16/2004 4308 7-003 1 1 1 3 1 1 1 1 1 1 6 1 1 10
Scantic River 10/23/2004 4200 36-001 1 2 3 1 1 1 2 5 3 3 11
Scantic River 10/23/2004 4200 36-003 2 1 3 1 1 1 1 1 5 1 1 9
Tankerhoosen River 10/2/2004 4503 32-002 2 1 3 1 1 2 5
Tankerhoosen River 10/10/2004 4503 47-001 1 1 1 3 1 1 1 1 1 5 8
Terry Brook 10/23/2004 4200 36-002 1 2 3 1 1 2 4 4 9
Town Farm Brook 9/26/2004 6000 9-006 1 1 1 3 1 1 1 1 4 7
West Branch Saugatuck River 11/20/2004 7203 48-003 1 1 1 3 1 1 1 1 1 5 2 2 10
Willimantic River 9/25/2004 3100 42-001 1 1 1 3 1 1 1 1 1 1 6 1 1 10
Yantic River 10/2/2004 3900 43-001 1 1 1 3 1 1 1 2 1 6 2 2 11
Yantic River 10/2/2004 3900 43-002 1 1 1 3 1 1 1 1 1 5 3 3 11
Burhams Brook 11/6/2004 4800 26-008 1 1 2 1 1 1 1 1 5 3 3 10
French Brook 10/24/2004 4707 35-003 1 1 2 1 1 1 1 1 5 7
Hitchcock Mill Brook 9/22/2004 6000 9-005 1 1 2 0 2
Morgan Brook 10/16/2004 4305 7-005 1 1 2 1 1 1 1 1 5 7
Natchaug River 11/15/2004 3200 21-004 1 1 2 1 1 1 1 4 6
Pond Brook 9/12/2004 6000 9-007 1 1 2 1 1 1 1 1 1 6 8
Roaring Brook 9/25/2004 4009 28-002 1 1 2 1 1 1 1 1 5 3 3 10
Roaring Brook 9/25/2004 3104 41-001 1 1 2 1 1 1 1 1 1 6 8
Roaring Brook 9/25/2004 3104 44-001 1 1 2 1 1 1 1 1 1 6 8
Still River 11/17/2004 3202 21-009 1 1 2 1 1 1 1 1 1 6 8
Willimantic River 9/25/2004 3100 42-002 1 1 2 1 1 1 1 1 1 6 8
Blackledge River 10/24/2004 4707 35-002 1 1 1 1 1 1 1 1 6 1 1 8
Hockanum River 11/20/2004 4500 20-002 1 1 1 1 1 3 2 2 6
Hop Brook 9/15/2004 6000 9-008 1 1 1 1 1 1 3
Little Pootatuck Brook 10/4/2004 6000 9-001 1 1 1 1 1 1 3
Mashamoquet Brook 9/17/2004 3710 21-005 1 1 1 1 1 1 1 5 6
Mashamoquet Brook 10/6/2004 3710 21-006 1 1 1 1 1 1 1 5 6
Pocotopaug Creek 9/6/2004 4709 40-001 1 1 1 1 1 3 4
French River 11/6/2004 3300 21-007 1 1 1 1 1 1 1 5 1 1 7
Rattlesnake Brook 10/17/2004 4300 46-001 1 1 1 1 1 1 1 5 6
Tankerhoosen River 10/2/2004 4503 32-001 1 1 1 1 1 1 1 5 1 1 7
Tankerhoosen River 10/2/2004 4503 32-004 1 1 1 1 1 1 4 3 3 8
Hockanum River 10/23/2004 4500 20-002 0 1 1 1 3 3 3 6
Tributary to Gages Brook 10/22/2004 4503 47-003 0 1 1 2 2 2 4
Rapid Bioassessment in Wadeable Streams and Rivers by Volunteer Monitors 2004 Summary Report
Page 12 of 23
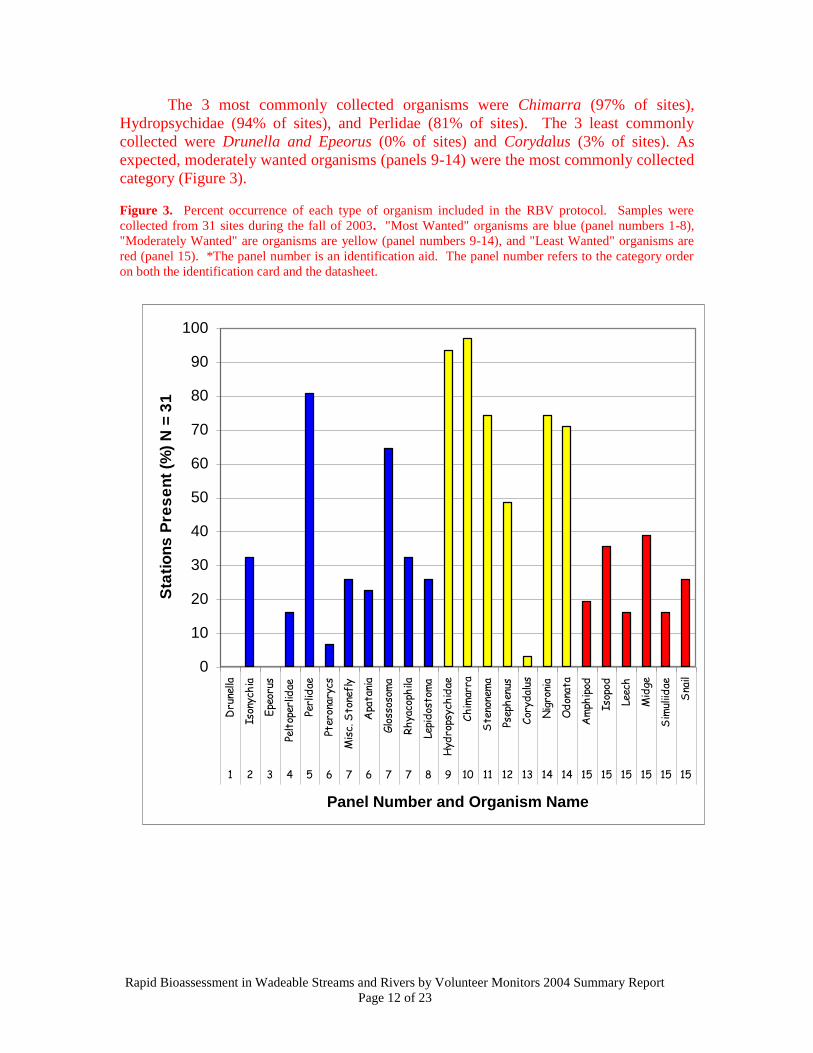
The 3 most commonly collected organisms were Chimarra (97% of sites),
Hydropsychidae (94% of sites), and Perlidae (81% of sites). The 3 least commonly
collected were Drunella and Epeorus (0% of sites) and Corydalus (3% of sites). As
expected, moderately wanted organisms (panels 9-14) were the most commonly collected
category (Figure 3).
Figure 3. Percent occurrence of each type of organism included in the RBV protocol. Samples were
collected from 31 sites during the fall of 2003. "Most Wanted" organisms are blue (panel numbers 1-8),
"Moderately Wanted" are organisms are yellow (panel numbers 9-14), and "Least Wanted" organisms are
red (panel 15). *The panel number is an identification aid. The panel number refers to the category order
on both the identification card and the datasheet.
0
10
20
30
40
50
60
70
80
90
100
Dru
nella
Ison
ych
ia
Epe
orus
Pelt
oper
lidae
Perl
idae
Pter
onar
ycs
Mis
c. S
tone
fly
Apa
tani
a
Glo
ssos
oma
Rh
yaco
phila
Lepi
dos
tom
a
Hyd
rops
ych
idae
Ch
imar
ra
Ste
none
ma
Psep
hen
us
Cor
ydal
us
Nig
roni
a
Od
onat
a
Am
phip
od
Isop
od
Leec
h
Mid
ge
Sim
uliid
ae
Sna
il
1 2 3 4 5 6 7 6 7 7 8 9 10 11 12 13 14 14 15 15 15 15 15 15
Panel Number and Organism Name
Sta
tio
ns
Pre
se
nt
(%)
N =
31
Rapid Bioassessment in Wadeable Streams and Rivers by Volunteer Monitors 2004 Summary Report
Page 13 of 23
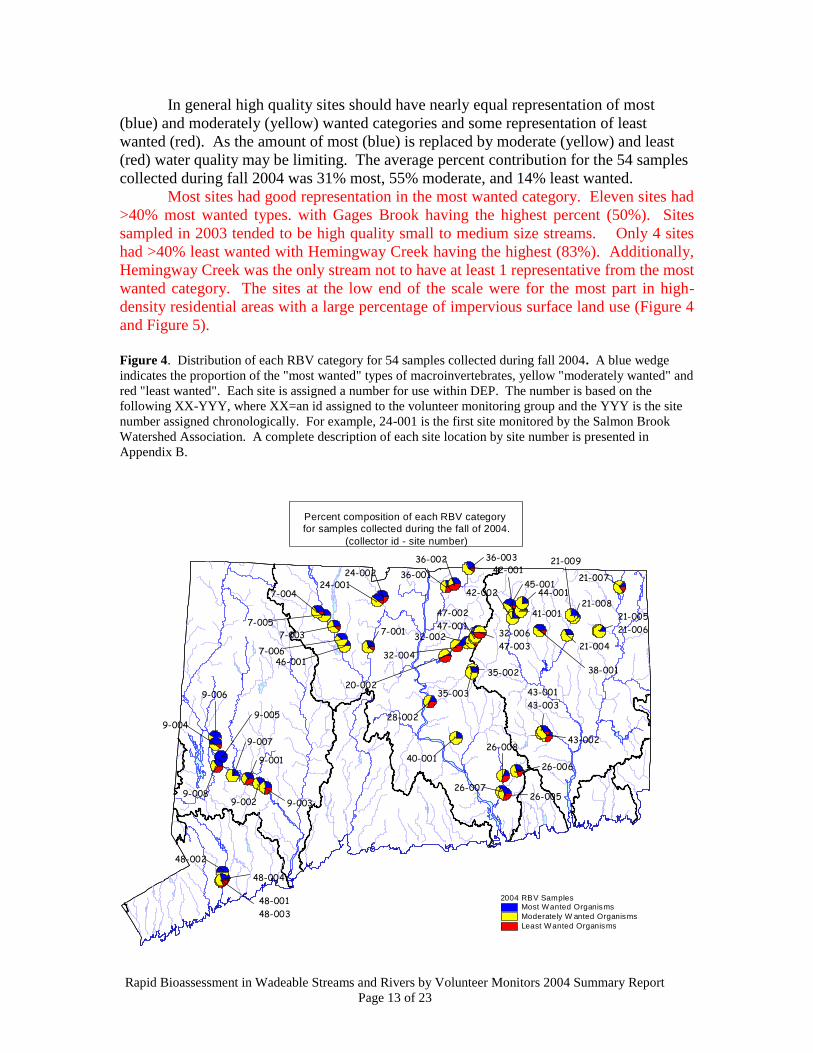
In general high quality sites should have nearly equal representation of most
(blue) and moderately (yellow) wanted categories and some representation of least
wanted (red). As the amount of most (blue) is replaced by moderate (yellow) and least
(red) water quality may be limiting. The average percent contribution for the 54 samples
collected during fall 2004 was 31% most, 55% moderate, and 14% least wanted.
Most sites had good representation in the most wanted category. Eleven sites had
>40% most wanted types. with Gages Brook having the highest percent (50%). Sites
sampled in 2003 tended to be high quality small to medium size streams. Only 4 sites
had >40% least wanted with Hemingway Creek having the highest (83%). Additionally,
Hemingway Creek was the only stream not to have at least 1 representative from the most
wanted category. The sites at the low end of the scale were for the most part in high-
density residential areas with a large percentage of impervious surface land use (Figure 4
and Figure 5).
Figure 4. Distribution of each RBV category for 54 samples collected during fall 2004. A blue wedge
indicates the proportion of the "most wanted" types of macroinvertebrates, yellow "moderately wanted" and
red "least wanted". Each site is assigned a number for use within DEP. The number is based on the
following XX-YYY, where XX=an id assigned to the volunteer monitoring group and the YYY is the site
number assigned chronologically. For example, 24-001 is the first site monitored by the Salmon Brook
Watershed Association. A complete description of each site location by site number is presented in
Appendix B.
#
#
#
#
#
#
#
#
#
##
#
#
#
# #
#
#
#
##
##
##
#
#
#
#
##
#
#
#
#
#
#
#
###
#
#
##
#
#
#
##
#
#
##
#
21-007
#
21-005
21-006
#
43-002
#
43-001
43-003
#
26-006#
26-008
# 26-005#26-007
#
40-001
#
28-002
#
35-003
#
35-002
#
21-004
#
38-001
#
21-009
#
21-008
#
36-003
#
36-002
#
36-001
#
24-001#
24-002
#
7-001
#
7-004
#
7-005#
7-003#
7-006#
46-001
#
48-001
48-003
#
48-002
# 48-004
#
9-003
#
9-002
#
9-001
#
9-007
#
9-008
#
9-005
#
9-004#
9-006
#
20-002
#
32-004
#
44-001#
45-001
# 41-001#
42-002
#
42-001
# 32-006
47-003#
47-002
47-001
#
32-002
2004 RBV SamplesMost Wanted Organisms
Moderately W anted Organisms
Least Wanted Organisms
Percent composition of each RBV category
for samples collected during the fall of 2004.
(collector id - site number)
Rapid Bioassessment in Wadeable Streams and Rivers by Volunteer Monitors 2004 Summary Report
Page 14 of 23
Upp er Tha me s Basin
Site Loca tio ns
##
#
#
#
#
#
#
##
#
#
#
#
#
#
Vernon
Manc hes ter
Bolton
South W inds or
East Hartford
#
32-006
#
32-001
#
32-002
#
32-004
#
35-001
#
35-002
#
20-002
#
38-002
Tankerhoosen and Black ledge
Site Locations
#
#
##
#
#
##
Suffield
Granby
Enfield
Ellington
Windsor
Simsbury
Barkhamsted
Bloomfield
East Windsor
South Windsor
East Granby
Windsor Locks
#
24-002
#
24-001
#
36-001
#
36-002
Upper C T River W atershed
Site loc ations
#
#
#
#
#
#
#
#
Lym e
Sa le m
Ea st Ha dda m
#
26-006
#
26-008
#
26-007
#
26-005
Eight mile Rive r W ate rsh ed
Site Loca tion s
#
#
#
#
Avon
#
07-002
#
07-001
Nod Bro ok
Site Loca tio ns
RBV CategoryMost WantedModerately WantedLeast Wanted
# Sample location
Percentage of each "wanted category"by site for samples collected
Fall 2003
#
#
# #
#
#
#
# #
#
#
# #
#
#
#
# #
Po mf re t
Ashford
Man sfield
Coven try
Ea st ford
W ill in gto n
Broo klyn
Ham pto n
Pu tna m
Cha plin
#
21-002
#
21-005
#
21-003
#
21-004#
38-001
#
11-005
#
11-004#
11-002#
11-003
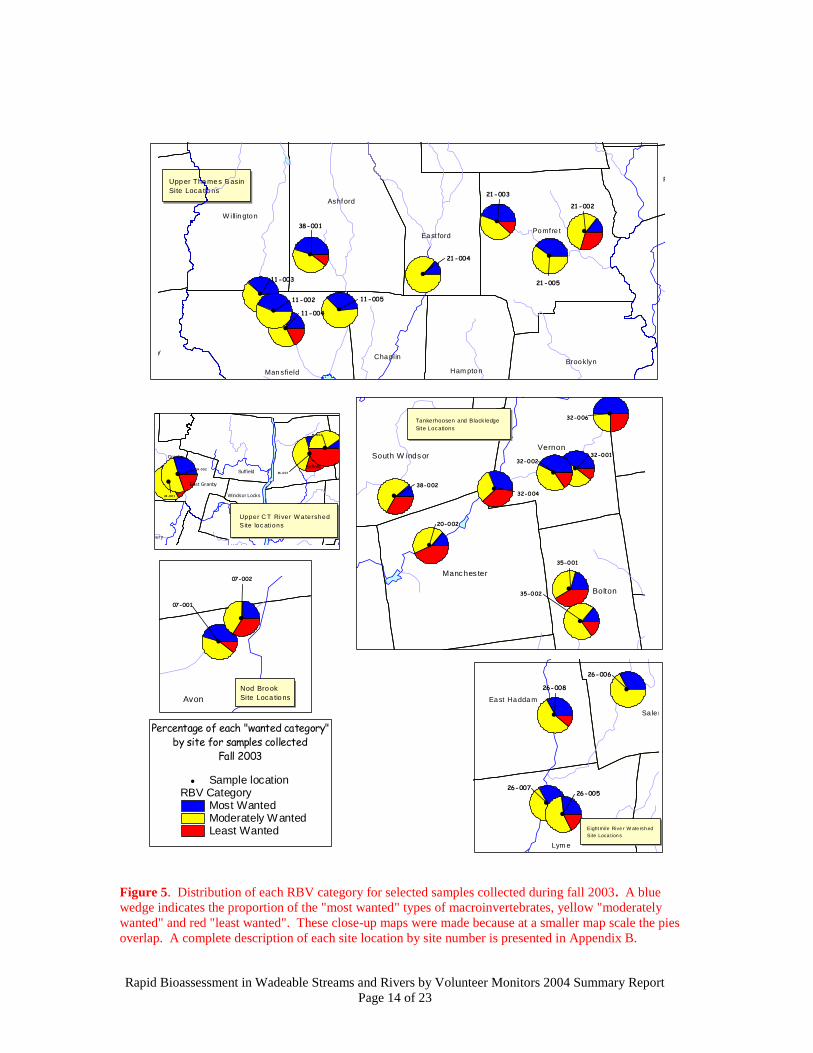
Figure 5. Distribution of each RBV category for selected samples collected during fall 2003. A blue
wedge indicates the proportion of the "most wanted" types of macroinvertebrates, yellow "moderately
wanted" and red "least wanted". These close-up maps were made because at a smaller map scale the pies
overlap. A complete description of each site location by site number is presented in Appendix B.
Rapid Bioassessment in Wadeable Streams and Rivers by Volunteer Monitors 2004 Summary Report
Page 15 of 23
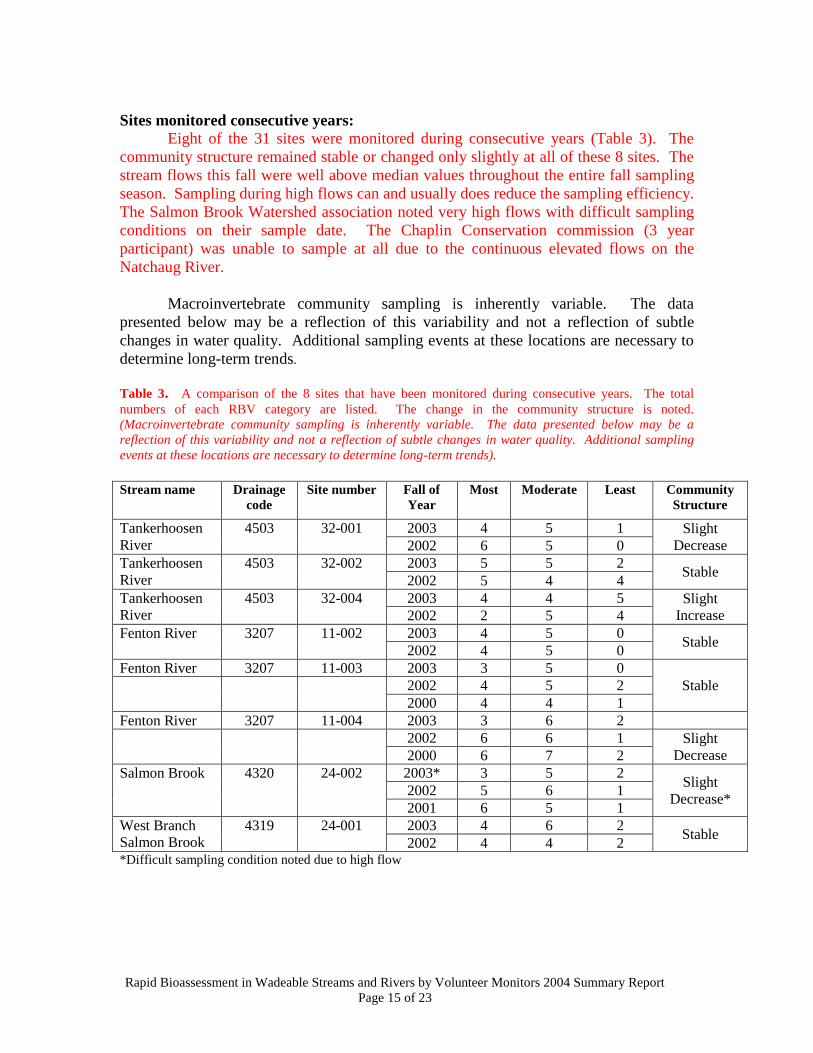
Sites monitored consecutive years:
Eight of the 31 sites were monitored during consecutive years (Table 3). The
community structure remained stable or changed only slightly at all of these 8 sites. The
stream flows this fall were well above median values throughout the entire fall sampling
season. Sampling during high flows can and usually does reduce the sampling efficiency.
The Salmon Brook Watershed association noted very high flows with difficult sampling
conditions on their sample date. The Chaplin Conservation commission (3 year
participant) was unable to sample at all due to the continuous elevated flows on the
Natchaug River.
Macroinvertebrate community sampling is inherently variable. The data
presented below may be a reflection of this variability and not a reflection of subtle
changes in water quality. Additional sampling events at these locations are necessary to
determine long-term trends.
Table 3. A comparison of the 8 sites that have been monitored during consecutive years. The total
numbers of each RBV category are listed. The change in the community structure is noted.
(Macroinvertebrate community sampling is inherently variable. The data presented below may be a
reflection of this variability and not a reflection of subtle changes in water quality. Additional sampling
events at these locations are necessary to determine long-term trends).
Stream name Drainage
code
Site number Fall of
Year
Most Moderate Least Community
Structure
Tankerhoosen
River
4503 32-001 2003 4 5 1 Slight
Decrease 2002 6 5 0
Tankerhoosen
River
4503 32-002 2003 5 5 2 Stable
2002 5 4 4
Tankerhoosen
River
4503 32-004 2003 4 4 5 Slight
Increase 2002 2 5 4
Fenton River 3207 11-002 2003 4 5 0 Stable
2002 4 5 0
Fenton River 3207 11-003 2003 3 5 0
Stable 2002 4 5 2
2000 4 4 1
Fenton River 3207 11-004 2003 3 6 2
2002 6 6 1 Slight
Decrease 2000 6 7 2
Salmon Brook 4320 24-002 2003* 3 5 2 Slight
Decrease* 2002 5 6 1
2001 6 5 1
West Branch
Salmon Brook
4319 24-001 2003 4 6 2 Stable
2002 4 4 2 *Difficult sampling condition noted due to high flow
Rapid Bioassessment in Wadeable Streams and Rivers by Volunteer Monitors 2004 Summary Report
Page 16 of 23
Discussion The major success of the RBV program during the fourth sampling season was
the level of participation by volunteer monitoring programs. During the early to mid
1990's volunteer monitoring using macroinvertebrates was very popular. Most groups
implemented the family-level bioassessment method. Unfortunately the extensive time
commitment required to complete the process at a single site caused many groups to
abandon or reduce their monitoring activity. During the RBV field trial year (1999), the
DEP encouraged these programs to "try" the new RBV protocol. Following the first field
season (fall 2000), most groups were very successful and intended to participate in fall
2001. Only 3 of the 7 groups originally trained in either 1999 or 2000 participated in the
program during 2004. Of the 9 groups who participated in 2002, five returned to repeat
the sampling during 2003.
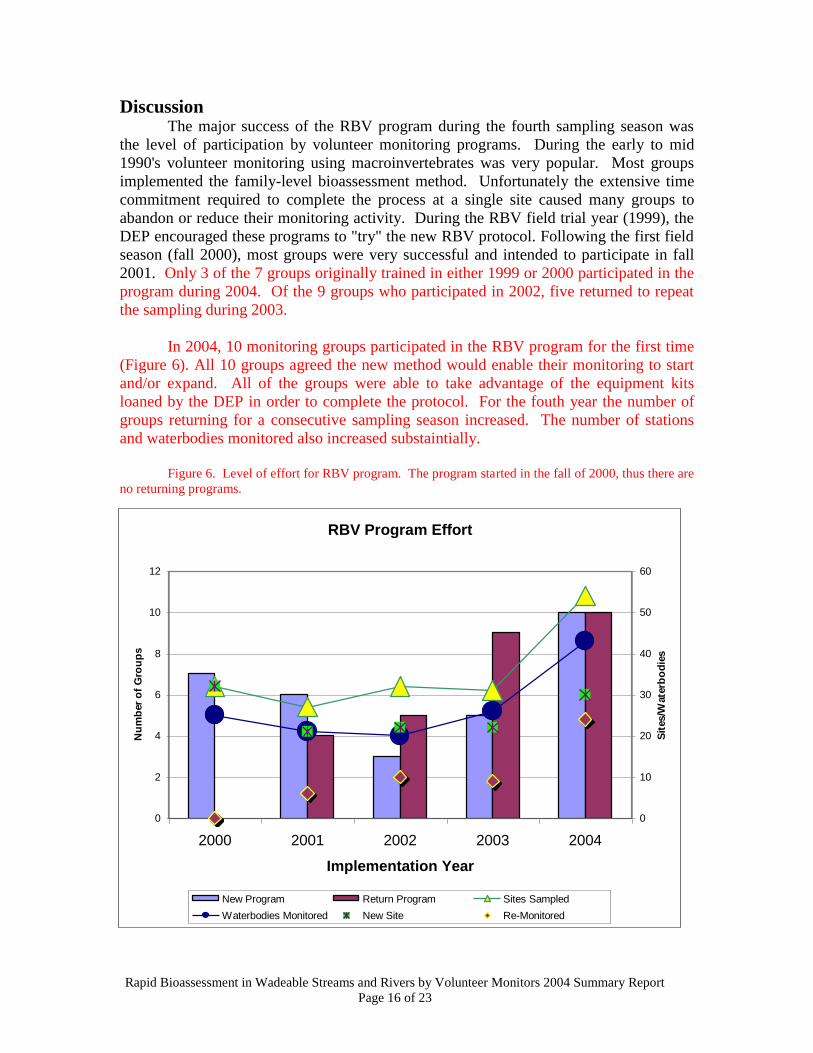
In 2004, 10 monitoring groups participated in the RBV program for the first time
(Figure 6). All 10 groups agreed the new method would enable their monitoring to start
and/or expand. All of the groups were able to take advantage of the equipment kits
loaned by the DEP in order to complete the protocol. For the fouth year the number of
groups returning for a consecutive sampling season increased. The number of stations
and waterbodies monitored also increased substaintially.
Figure 6. Level of effort for RBV program. The program started in the fall of 2000, thus there are
no returning programs.
RBV Program Effort
0
2
4
6
8
10
12
2000 2001 2002 2003 2004
Implementation Year
Nu
mb
er
of
Gro
up
s
0
10
20
30
40
50
60
Sit
es/W
ate
rbo
die
s
New Program Return Program Sites Sampled
Waterbodies Monitored New Site Re-Monitored
Rapid Bioassessment in Wadeable Streams and Rivers by Volunteer Monitors 2004 Summary Report
Page 17 of 23
Of equal if not greater importance, was the sense of accomplishment by the
volunteers. After completing the protocol many volunteers were satisfied that they had
(1) helped their program meet it's goals, (2) provided some useful information to the
DEP, and (3) successfully used a tool to obtain additional knowledge about a stream
based upon the resident aquatic life. Compared to traditional family-level bioassessment,
most participants agree the RBV program is better for their needs.
The most efficient implementation of RBV was through an "RBV day". An
"RBV day" is a daylong event sponsored by a volunteer group. All participants meet at a
central location where the morning is dedicated to training and the afternoon to collection
and data analysis. Each team of monitors are assigned a sampling site(s) and provided
with an equipment kit borrowed from the DEP. The participants then travel to their site,
collect, identify, and preserve their voucher collection. The samples and equipment are
then returned to the DEP. The entire "RBV day" lasts 6-7 hours. Additionally, on such
days, Mike Beauchene (DEP volunteer monitoring coordinator) was able to attend to
provide both technical assistance and quality assurance/quality control (QA/QC).
The DEP encourages implementation of the RBV protocol through "RBV-days".
By having the day split between training (or refresher training) and actual sample
collection, DEP resources (loaner equipment and QA/QC support) are maximized while
reducing the time commitment for each volunteer. As the program organizers gain
confidence in the sampling methodology, the DEP encourages the veteran groups to
"strike out on their own". This enables DEP staff to focus on training new programs or
refreshing year 2 programs.
DEP Concerns and Potential Solution from year 5 and progress:
While some minor issues were discovered during these first 4 sampling seasons
the RBV method seems to be a useful tool. It has been observed that as each group gains
experience and confidence their effort becomes more efficient. They are successful at
implementing the program independently while borrowing the equipment from DEP.
Concern: "Organisms not accounted for" check off on the datasheet not in
voucher collection.
Potential Solution: Emphasize must have at least one of each type of organism
to count. When in doubt put it in.
Concern: "Too rapid": The major concern regarding the RBV protocol is the
volunteer's perception of "ease". One major advantage of RBV is the reduced total time
commitment for volunteers. The reduced time is a result of the elimination of post
collection processing (sub-sampling), family level identification, metric calculations, and
metric comparison. However, the field component of the RBV protocol (collection and
observation of the organisms) is not any less time consuming than more intensive
methods like family-level bioassessment. In fact, to collect high quality data, the
collection and observation of the organisms must involve more time than traditional
Rapid Bioassessment in Wadeable Streams and Rivers by Volunteer Monitors 2004 Summary Report
Page 18 of 23
methods. Participants must take significant time and care to (1) select an appropriate
riffle sampling location (2) perform an adequate kick sample, and (3) observe and sort
the organisms carefully to insure representation of all types of macroinvertebrates
present. Potential Solution: Additional support materials were developed to emphasize
"Good Technique". A Microsoft Power-point presentation was implemented during the
training sessions, which served to compare and contrast good vs. poor techniques.
Several "Good techniques" for the RBV protocol include; look for loosely embedded
cobbles in moderate to swift moving sections of a riffle, carefully rub each rock in order
to remove all organisms, and spread the collected debris thin enough with limited water
in each tray to optimize organism visibility. The integrity of the protocol is greatly
reduced by poorly selected riffles, limited kick effort, and/or hasty organism sorting.
Concern: "Other organism(s)": The potential for collection of organisms not
included in the RBV protocol is very high because RBV focuses on relatively few stream
macroinvertebrates. Some of the commonly collected "others" create some minor
confusion during identification and enumeration process.
Potential Solution: A new datasheet will be implemented in the fall of 2005. The
datasheet has a set of commonly collected organisms that are not part of the Most,
Moderate, or Least groupings. The organisms included are crayfish, crane fly larvae,
riffle beetle adult and larva, planaria (flatworms), and fingernail clams and freshwater
mussels. These can be checked off indicating presence at the site. These organism
should be contained in the voucher collection as well.
References: CT DEP 2004. 2004 Water Quality Report To Congress. Bureau of Water Management,
Planning and Standards Division, Hartford, CT.
http://www.dep.state.ct.us/wtr/wq/305b/2004_305b.htm
CT DEP 2004 CALM. Consolidated Assessment and Listing Methodology for 305(b) and
303(d) Reporting. Bureau of Water Management, Planning and Standards Division,
Hartford, CT. http://www.dep.state.ct.us/wtr/wq/calm/calm.htm
CT DEP 2004 303(d). 2004 List of Connecticut Water Bodies not meeting Water Quality
Standards. Bureau of Water Management, Planning and Standards Division, Hartford,
CT. http://www.dep.state.ct.us/wtr/wq/tmdlbrief.htm
CT DEP 1999. Ambient Monitoring Strategy for Rivers and Streams, Rotating Basin
Approach. Bureau of Water Management, Planning and Standards Division, Hartford,
CT. http://www.dep.state.ct.us/wtr/wq/rotbasinplan.pdf
Rapid Bioassessment in Wadeable Streams and Rivers by Volunteer Monitors 2004 Summary Report
Page 19 of 23
CT DEP 1997. Water Quality Standards. Bureau of Water Management, Planning and
Standards Division, Hartford, CT. http://www.dep.state.ct.us/wtr/wq/wqs.pdf
Plafkin, J.L., M.T. Barbour, K.D. Porter, S.K. Gross, and R.M. Hughes. 1989. Rapid
Bioassessment Protocols for use in Streams and Rivers: Benthic Macroinvertebrates and
Fish. EPA/444/4-89-00.
Additional Sources of Related Information
Connecticut Department of Environmental Protection
DEP Web site: http://dep.state.ct.us/
DEP Bureau of water management: http://dep.state.ct.us/wtr/index.htm
RBV web page: http://dep.state.ct.us/wtr/volunmon/volopp.htm
United States Environmental Protection Agency:
Volunteer monitoring: http://www.epa.gov/OWOW/monitoring/vol.html
Rapid Bioassessment Protocols: http://www.epa.gov/owow/monitoring/rbp/
Biological Monitoring: http://www.epa.gov/bioindicators
Regional Web Sites:
New England Regional Monitoring Collaborative:
http://www.umass.edu/tei/mwwp/nermc.html
RBV Participant Program web sites:
Thames Chapter Trout Unlimited:
Connecticut Audubon
Pomfret, Contact: Paula Coughlin (860) 928-4948
http://www.ctaudubon.org/centers/pomfret/pomfret.htm
Glastonbury, Contact: Judy Harper (860) 633-8402
http://www.ctaudubon.org/centers/glastonbury/glastonbury.htm
Other Volunteer Monitoring Organizations In Connecticut Who Have Submitted
Wadeable Stream Data to DEP:
A national directory of volunteer monitoring organization can be found at:
http://www.epa.gov/OWOW/monitoring/vol.html
Connecticut River Watch Program
Middletown, Contact Jane Brawerman (860) 346-3282.
Housatonic Valley Association Cornwall, Contact: Petra Volinski (860) 672-6678.
Windham County Soil and Water Conservation District
Brooklyn, Contact: Scott Gravatt (860) 774-8397.
Rapid Bioassessment in Wadeable Streams and Rivers by Volunteer Monitors 2004 Summary Report
Page 20 of 23
Nature Center for Environmental Activities Westport, Contact: Richard Harris (203) 227-7253.
Project SEARCH
Derby, Contact: Chris Sullivan (203) 734-2513.
Quinnipiac River Watershed Association: http://www.qrwa.org/
APPENDIX A: RBV resources available on the Internet: All of the materials for the RBV program are available on the DEP web page at these
addresses. HOME PAGE: http://dep.state.ct.us/wtr/volunmon/volopp.htm
2002 Summary of Volunteer Monitoring Program (PDF, 1230K)
2001 Summary of Volunteer Monitoring Program (PDF, 869K)
2000 Summary of Volunteer Monitoring Program (PDF, 433K)
Part 1: Program Description (PDF, 750 K) - This document describes the Rapid
Bioassessment in Wadeable Streams and Rivers by Volunteer Monitors (RBV)
program.
Part 2: Instructions (PDF, 1415 K) - This document provides step by step
instructions for the RBV protocol and provides a consistent method for volunteer
groups to use when submitting surface water quality information to DEP.
Macroinvertebrate Field Identification Cards (PDF, 676 K) - At the core of the
RBV program are the macroinvertebrates represented on these cards. Each
organism has distinct shape, structure, color, or behavior and provides key
ecological information about the stream environment. Each card lists the common
name across the top and the category at the bottom. These bands are color-coded
based on the ecology of each organism.
Blue = Most Wanted. In general these organisms require a narrow range of
environmental conditions. When found in abundance one can infer non-impaired
stream condition.
Yellow = Moderately Wanted. These organisms can be found in a variety of
water quality conditions. When found in abundance further information about
the upstream watershed may be necessary to infer water quality.
Red = Least Wanted. These organisms tend to be very tolerant of a wide range
of environmental conditions. As a result when these organisms comprise the
majority of a sample, one can infer some level of water quality impairment.
Data sheet (PDF, 133 K) - This is the official data sheet for the RBV protocol. It
should be submitted along with the collection of macroinvertebrate vouchers to
Mike Beauchene, Volunteer Monitoring Coordinator, at phone (860) 424-4185,
fax (860) 424-4055, or [email protected]
Macroinvertebrate Sorting Guide (PDF, 211 K) - This 1 page flow chart will
assist volunteer monitors in narrowing their macroinvertebrate identification
Rapid Bioassessment in Wadeable Streams and Rivers by Volunteer Monitors 2004 Summary Report
Page 21 of 23
choice. The flow chart is not designed to be a comprehensive key for
macroinvertebrates. The chart should be used for preliminary sorting and
grouping when implementing the RBV protocol.
Quality Assurance Project Plan (PDF, 163 K) - A Quality Assurance Project Plan is a document that
provides a plan to insure data collected for a specific project will meet a particular standard. A QAPP is
required for any water quality monitoring program that receives funding through EPA. This document is a
template that can be used by any volunteer monitoring program intending collect macroinvertebrate
community data using the RBV method. Standardized guidance for QAPP can be found on the EPA
volunteer monitoring web page: http://www.epa.gov/OWOW/monitoring/vol.html
Appendix B Table of locations sorted by Volunteer Group name and site number.
RBV participant site number Waterbody Basin id proximity landmark Municipality
Bolton Conservation Commission 35-002 Blackledge River 4707 500 downstream Deming Road Bolton
Bolton Conservation Commission 35-003 French Brook 4707 at French Road Bolton
CT Audubon- Glastonbury 28-002 Roaring Brook 4009 upstream Route 17 Glastonbury
CT Audubon-Pomfret 21-004 Natchaug River 3200 at Route 198 entrance to Natchaug SF Eastford
CT Audubon-Pomfret 21-005 Mashamoquet Brook 3710 500 meters downstream Route 44 in State Park Pomfret
CT Audubon-Pomfret 21-006 Mashamoquet Brook 3710 end paved section of road in state park Pomfret
CT Audubon-Pomfret 21-007 French River 3300 at Main Street (Red Bridge Road) Thompson
CT Audubon-Pomfret 21-008 Bungee Brook 3201 downstream Mill Bridge Road Eastford
CT Audubon-Pomfret 21-009 Still River 3202 behind Post Office at eastford center Eastford
Cody and Alex Lorentson 40-001 Pocotopaug Creek 4709 50 m upstream Route 16 East Hampton
Connecticut Fly Fishermans Association 42-001 Willimantic River 3100 upstream Roaring Brook Confluence Willington
Connecticut Fly Fishermans Association 42-002 Willimantic River 3100 behind I-84 Rest Stop at exits 69-70 West bound Willington
David and Carrie Sinish 46-001 Rattlesnake Brook 4300 upstream 200 meters from Dyer Ave. Canton
Eightmile River Association 26-005 Beaver Brook 4803 Downstream bridge at 55-123 Beaver Brook Road Lyme
Eightmile River Association 26-006 Harris Brook 4801 at Mouth Salem
Eightmile River Association 26-007 Tributary to Eight Mile River 4800 at trail crossing off MacIntosh Road Lyme
Eightmile River Association 26-008 Burhams Brook 4800 at Mouth East Haddam
Enfield Conservation Commission 36-001 Scantic River 4200 downstream 100 meters South Maple Street Enfield
Enfield Conservation Commission 36-002 Terry Brook 4200 Downstream footbridge Green manor Park Enfield
Enfield Conservation Commission 36-003 Scantic River 4200 downstream Route 83 at state line Somers
Farmington River Watershed Association 7-001 Nod Brook 4317 DS Route 10 Avon
Farmington River Watershed Association 7-003 Ratlum Brook 4308 downstream Farmington River Turnpyke at mouth New Hartford
Farmington River Watershed Association 7-004 Morgan Brook 4305 downstream East West Hill Road ADJ to Rte 44 Barkhamsted
Farmington River Watershed Association 7-005 Morgan Brook 4305 downstream Morgan Brook Road Barkhamsted
Farmington River Watershed Association 7-006 Cherry Brook 4309 upstream Route 44 Canton
Hockanum River Watershed Association 32-001 Tankerhoosen River 4503 DS Bolton Road Vernon
Hockanum River Watershed Association 32-002 Tankerhoosen River 4503 upstream Tunnel Road Vernon
Hockanum River Watershed Association 32-004 Tankerhoosen River 4503 upstream 100 m mouth at golf land Vernon
Hockanum River Watershed Association 32-006 Gages Brook 4503 at footbridge on Tolland Agricultural Center Property Tolland
Housatonic Valley Association 9-001 Little Pootatuck Brook 6000 adjacent Flat Hill Road near River Road Southbury
Housatonic Valley Association 9-002 Lee Brook 6000 at Lakemere Road Southbury
Housatonic Valley Association 9-003 Kettletown Brook 6021 at Mouth Southbury
Housatonic Valley Association 9-004 Clatter Valley Brook 6000 at Stone Bridge in Clatter Valley Park Bridgewater
Housatonic Valley Association 9-005 Hitchcock Mill Brook 6000 at Sunny Valley Preserve Bridge near camp silverman Bridgewater
Housatonic Valley Association 9-006 Town Farm Brook 6000 at Darwin Hill Road New Milford
Housatonic Valley Association 9-007 Pond Brook 6000 at Bridge at State Boat Launch Newtown
Housatonic Valley Association 9-008 Hop Brook 6000 at Barkwood Hill Road and Hop Brook Road Brookfield
Jane Seymour 47-001 Tankerhoosen River 4503 upstream Fish and Game Road and tributary Vernon
Jane Seymour 47-002 Barrows Brook 4503 upstream Confluence with Tankerhoosen Vernon
Jane Seymour 47-003 Triburary to Gages Brook 4503 between Rte 84 and confluence with Gages Brook Tolland
Mansfield Girl Scout Troop 5284 44-001 Roaring Brook 3104 upstream Polister Road Willington
MCTC Science and Technology Club 20-002 Hockanum River 4500 behind Adams Mill Restaurant Manchester
MCTC Science and Technology Club 20-002 Hockanum River 4500 behind Adams Mill Restaurant Manchester
Salmon Brook Watershed Association 24-001 West Branch Salmon Brook 4319 Adjacent Salmon Brook Park Granby
Salmon Brook Watershed Association 24-002 East Branch Salmon Brook 4320 Downstream Route 20 Granby
Stafford River Watchers 45-001 Willimantic River 3100 upstream Route 32 Ellington
The Nature Conservancy-Devils Den 48-001 Saugatuck River 7200 at DS end of Fly Fishing Only Area (1 Ford Rd) Westport
The Nature Conservancy-Devils Den 48-002 Saugatuck River 7200 at Keene Park Parking Lot Weston
The Nature Conservancy-Devils Den 48-003 West Branch Saugatuck River 7203 at Glendenning Parking Lot Weston
The Nature Conservancy-Devils Den 48-004 Aspetuck River 7202 Upstream Confluence with Saugatuck River at Lyons Plain Rd Weston
Trout Unlimited-Thames Chapter 43-001 Yantic River 3900 upstream Stanton Road Bozrah
Trout Unlimited-Thames Chapter 43-002 Yantic River 3900 upstream Stockhouse Road adjacent to Bozrah Cemetary Bozrah
Trout Unlimited-Thames Chapter 43-003 Pease Brook 3905 upstream 150 meters from confluence with Yantic River Bozrah
UCONN Soil and Water Conservation Club 38-001 Knowlton Brook 3205 downstream Upton Road Ashford
Willington Conservation Commission 41-001 Roaring Brook 3104 downstream Ruby Lake outlet Willington
Rapid Bioassessment in Wadeable Streams and Rivers by Volunteer Monitors 2004 Summary Report
Page 22 of 23
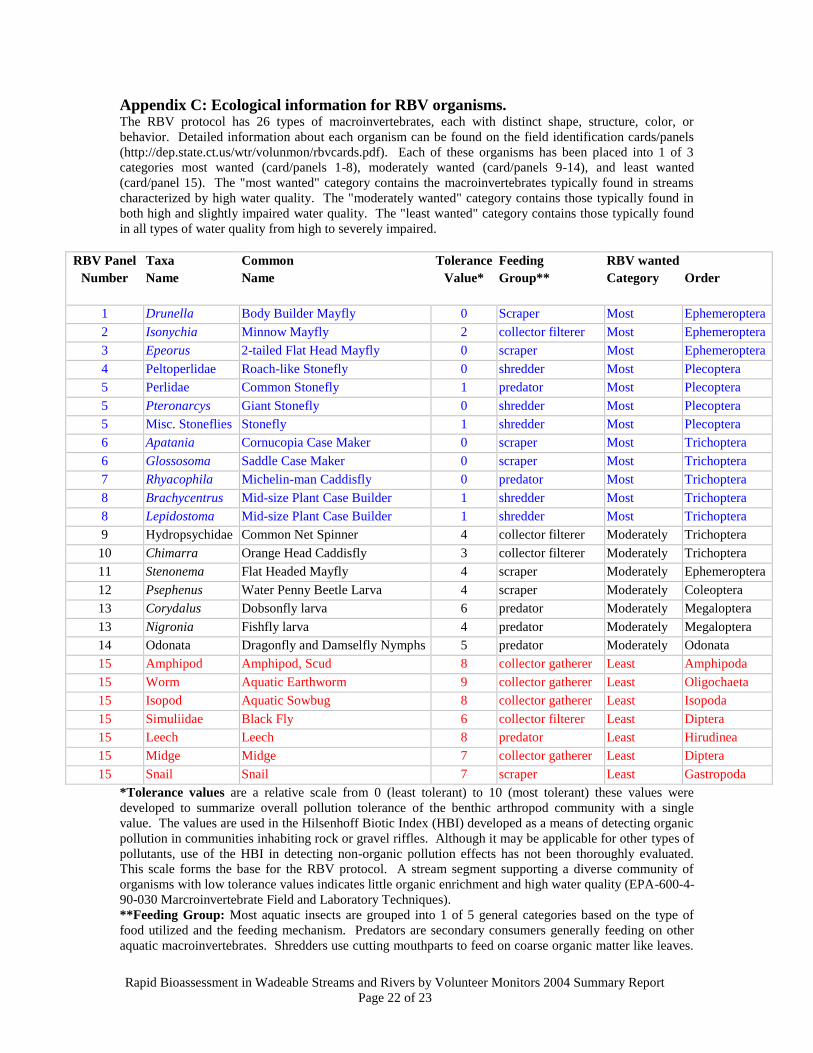
Appendix C: Ecological information for RBV organisms. The RBV protocol has 26 types of macroinvertebrates, each with distinct shape, structure, color, or
behavior. Detailed information about each organism can be found on the field identification cards/panels
(http://dep.state.ct.us/wtr/volunmon/rbvcards.pdf). Each of these organisms has been placed into 1 of 3
categories most wanted (card/panels 1-8), moderately wanted (card/panels 9-14), and least wanted
(card/panel 15). The "most wanted" category contains the macroinvertebrates typically found in streams
characterized by high water quality. The "moderately wanted" category contains those typically found in
both high and slightly impaired water quality. The "least wanted" category contains those typically found
in all types of water quality from high to severely impaired.
RBV Panel Taxa Common Tolerance Feeding RBV wanted
Number Name Name Value* Group** Category Order
1 Drunella Body Builder Mayfly 0 Scraper Most Ephemeroptera
2 Isonychia Minnow Mayfly 2 collector filterer Most Ephemeroptera
3 Epeorus 2-tailed Flat Head Mayfly 0 scraper Most Ephemeroptera
4 Peltoperlidae Roach-like Stonefly 0 shredder Most Plecoptera
5 Perlidae Common Stonefly 1 predator Most Plecoptera
5 Pteronarcys Giant Stonefly 0 shredder Most Plecoptera
5 Misc. Stoneflies Stonefly 1 shredder Most Plecoptera
6 Apatania Cornucopia Case Maker 0 scraper Most Trichoptera
6 Glossosoma Saddle Case Maker 0 scraper Most Trichoptera
7 Rhyacophila Michelin-man Caddisfly 0 predator Most Trichoptera
8 Brachycentrus Mid-size Plant Case Builder 1 shredder Most Trichoptera
8 Lepidostoma Mid-size Plant Case Builder 1 shredder Most Trichoptera
9 Hydropsychidae Common Net Spinner 4 collector filterer Moderately Trichoptera
10 Chimarra Orange Head Caddisfly 3 collector filterer Moderately Trichoptera
11 Stenonema Flat Headed Mayfly 4 scraper Moderately Ephemeroptera
12 Psephenus Water Penny Beetle Larva 4 scraper Moderately Coleoptera
13 Corydalus Dobsonfly larva 6 predator Moderately Megaloptera
13 Nigronia Fishfly larva 4 predator Moderately Megaloptera
14 Odonata Dragonfly and Damselfly Nymphs 5 predator Moderately Odonata
15 Amphipod Amphipod, Scud 8 collector gatherer Least Amphipoda
15 Worm Aquatic Earthworm 9 collector gatherer Least Oligochaeta
15 Isopod Aquatic Sowbug 8 collector gatherer Least Isopoda
15 Simuliidae Black Fly 6 collector filterer Least Diptera
15 Leech Leech 8 predator Least Hirudinea
15 Midge Midge 7 collector gatherer Least Diptera
15 Snail Snail 7 scraper Least Gastropoda
*Tolerance values are a relative scale from 0 (least tolerant) to 10 (most tolerant) these values were
developed to summarize overall pollution tolerance of the benthic arthropod community with a single
value. The values are used in the Hilsenhoff Biotic Index (HBI) developed as a means of detecting organic
pollution in communities inhabiting rock or gravel riffles. Although it may be applicable for other types of
pollutants, use of the HBI in detecting non-organic pollution effects has not been thoroughly evaluated.
This scale forms the base for the RBV protocol. A stream segment supporting a diverse community of
organisms with low tolerance values indicates little organic enrichment and high water quality (EPA-600-4-
90-030 Marcroinvertebrate Field and Laboratory Techniques).
**Feeding Group: Most aquatic insects are grouped into 1 of 5 general categories based on the type of
food utilized and the feeding mechanism. Predators are secondary consumers generally feeding on other
aquatic macroinvertebrates. Shredders use cutting mouthparts to feed on coarse organic matter like leaves.
Rapid Bioassessment in Wadeable Streams and Rivers by Volunteer Monitors 2004 Summary Report
Page 23 of 23
Scrapers use file-like mouthparts to feed primarily on microscopic algae. Collector-filterers and collector-
gatherers both utilize fine organic material as the primary food but differ in feeding mechanism. Filterers
allow the stream flow to carry the food to them while the gatherers actively search. Feeding groups can
reflect the food base of the riffle and provide insight into the nature of potential disturbance factors.
Proportion of feeding groups is important because predominance of a particular type may indicate an
unbalanced community responding to an overabundance of a particular food type. The predominant
feeding strategy reflects the type of impact detected. In general shredders and scrapers are dominant in
high quality stream while collector-filterers and gatherers dominate in disturbed systems.