Embed Size (px)
Citation preview
1
Final Project Report
RAPID: Collection of Data on Flood and Hydrodynamic Impact on
Coastal Infrastructure in the New York City Metropolitan Region
during the Hurricane Sandy
Grant Dates: January 15, 2013 -- December 31, 2014
NSF Award Number: CMMI # 1313877
Grant Amount: $35,000
Project manager: Kishor C. Mehta
Hansong Tang (PI), Anil Agrawal (co-PI)
Dept. of Civil Eng., City College
The City University of New York
138th Street & Convent Avenue
New York, NY 10031
March 31, 2015
2
Acknowledgment
We sincerely acknowledge the contribution of Damian Okon, Yan Fei Luo, Ananth Niraula,
Rianna Marishka Yuen, Jon Rosen, Chris Santana, Joseph Muller, Rifat Hussain, Ke Qu, Yalong
Cai, and Mohsen Amjadian in field data collection, analysis, and documentation. This project is
sponsored by Natural Science Foundation (award number CMMI # 1313877). The PIs are
grateful to the project manager Dr. Kishor Mehta for his valuable suggestion during this project.
We thank Mr. Krish Kramalingam, project manager of Applied Research Program in New York
City Department of Environmental Protection, Ms. Bridget McKenna, chief operating officer of
New Jersey Valley Sewerage Commission, and Mr. John Hinge, assistant facility engineer of MTA
Bridges and Tunnels, for their help on data collection. Support of Dr. Henry Perahia, former
deputy commissioner of New York City Department of Transportation, in accessing field data on
bridges in New York City area is acknowledged.
3
Contents
Summary 4 1. Motivation and objective 5 2. Plan and approach 6 3. Collected data and discussion 6 4. Computer modeling of storm surge in Hudson River 13 5. Deliverables 15 6. Concluding remarks 15 References 16
4
Summary
While Hurricane Sandy has significantly impacted the metropolitan New York City (NYC) region,
it also left behind rich, unique, and valuable data on its trace in the form of water marks,
damage and destruction to infrastructure, etc. In this project, perishable field data on flood,
wind, and consequent damage to coastal facilities and infrastructure, such as high water marks,
damaged residential houses, and fallen trees, has been collected through extensive site visits
and discussions with stakeholders. The regions of data collection cover several zones in the
New York City metropolitan area such as Manhattan, Queens, Staten Island as well as a few
zones in New York and New Jersey. The data indicates that while there was extensive damage
to coastal houses and wooden components, there has been no apparent damage to bridges,
ports, and other major infrastructure because of hydrodynamic impact. A website integrated
with a Google Earth file has been created to disseminate the collected data. Preliminary
computer modeling has been made to numerically simulate the storm surge in Hudson River
during Sandy, and the simulation has been compared to collected data. It is anticipated that the
collected data will be very useful in study and prediction of future hurricane wind field, storm
surge, and coastal flooding and plan development for mitigation of their damage to
infrastructure.
5
I. Motivation and Objective
Measurement records indicate that frequency of strong hurricanes, e.g., the number of
category IV and V storms, along with the ocean temperature, has greatly increased over past 35
years [1]. In addition, due to global warming and climate change, sea level is rising at an
alarming speed, and this speed has been twice as fast along the Northeastern U.S. coastline as
compared to the global average rate [2]. A severe consequence of the increase in frequency of
strong hurricanes and the sea level is a significant increase in the risk of catastrophic flooding
along coastlines. Therefore, it is crucial to collect field data on storm surges during hurricanes
and damage because of such flooding to coastal infrastructure and communities. These field
data can be used to develop reliable methods to predict future events and develop effective
plans to mitigate consequent damage to our coastal built infrastructure.
While Hurricane Sandy has significantly impacted the metropolitan New York City (NYC)
area by causing catastrophic damage to residential and commercial facilities, and
transportation, and other infrastructure, it also left behind rich, unique, and valuable data on its
path and intensity in the form of damage and water marks. Since Hurricane Sandy struck the
NYC metropolitan area on October 29, 2012, a number of efforts have been made to collect
perishable data on storm surge and damage during this event. The collected data include
satellite images, tidal gage records, aerial surveys, ground examination, etc. [3-6]. For instance,
USGS has collected a variety of information on tides and floods during Hurricane Sandy and has
produced a database on the USGS website for public use [4,5].
The objective of this NSF RAPID project is to collect field data, especially perishable data, of
flooding, wind, and infrastructure damage in the metropolitan NYC region during Hurricane
Sandy, and produce a database and a preliminary analysis for future scientific studies and
management use. Besides supplementing to the efforts of other teams and agencies, this
project also targets data with information on wind and coastal flood, dynamic loads, as well the
process of structural damage (e.g., displacement, deformation, destruction). Such data will be
useful for validation of computer models for damage to facilities and structures during similar
future events. Special effort has been made to ensure that the data resolution, i.e., the distance
between two adjacent sites for data collection, is 50 m or less.
The objective of the project has been realized through the following three tasks:
1) Collection of wind and flood information, such as high water marks on coastal
infrastructure, and if possible, data on wind and flood speed and their evolution.
2) Identification of damaged structures, including damaged houses and coastal
infrastructure
3) Preliminary analysis of the collected data and creation of a database.
The time of the recorded data spans from October 29, 2012, right after the Hurricane
Sandy, to February of 2015.
6
2. Plan and Approach
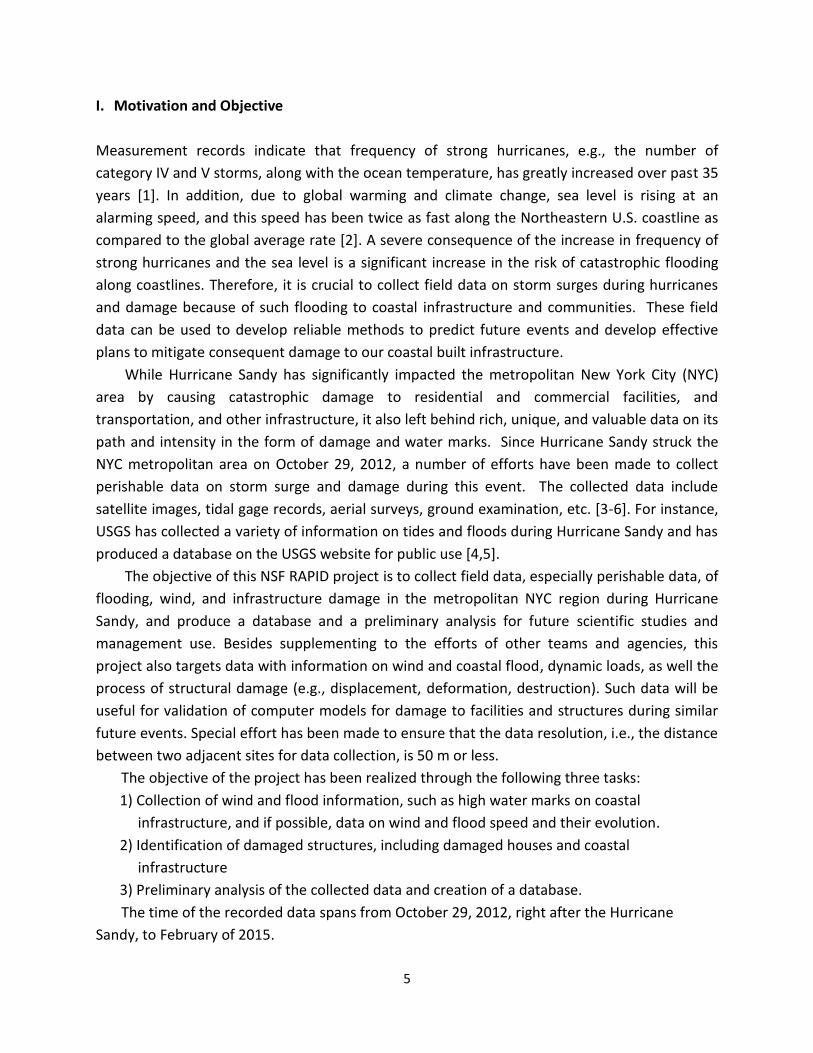
On the basis of information on Hurricane Sandy and damage reported in news media, computer
modeling, interview of residents, etc., a number of local zones within the metropolitan NYC
region were selected for field data collection. Fig. 1 illustrates one of such zone for data
collection. A particularly useful source of such information has been the USGS database [4].
We have also contacted agencies, such as New York City Department of Transportation, New
York State Department of Transportation, MTA, etc. for the availability of data.
Figure 1. A sample zone for data collection. The map is from USGS database [4]. In the
map, blue color indicates area flooded by the storm surge, and red diamonds represent
sites with collected data. The red circle denotes a zone for field data collection, which is
at the southern tip of Manhattan. Field trips have been made to collect data in zones
like this.
Several teams of students, each consisting of 2-3 people, were formed and sent to the
selected local zones for data collection with necessary tools and documents (e.g., GPS, cell
phone, camera, rulers, a data collection form, etc. ). Many of these students live in regions
affected by the Hurricane Sandy. During the trips for data collection, they interviewed residents
and field workers, measured data, took pictures, and wrote notes. Computer modeling was also
made to simulate storm surge within the Hudson River during Hurricane Sandy. Results of
computer models have been compared with available field data.
3. Collected Data and Discussion
The waterfront of the New York City metropolitan area was severely impacted because of
flooding and damage to built environment. In this project, data collection was carried out at
7
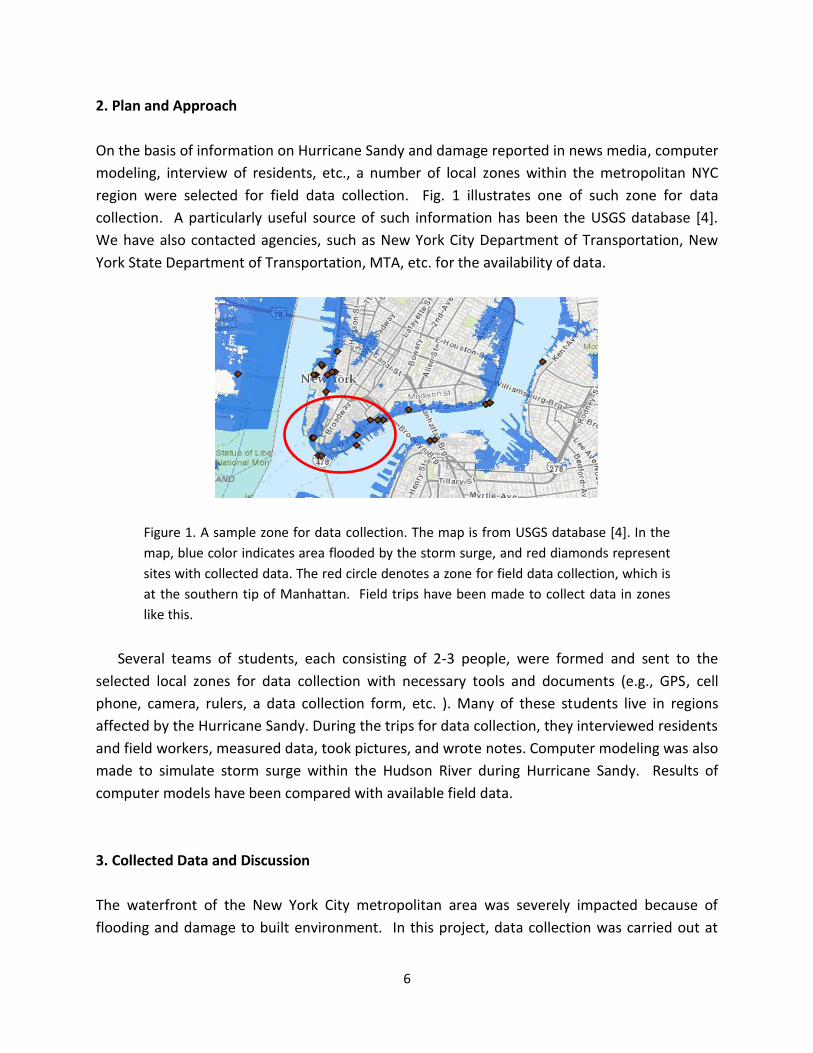
many waterfront locations, such as Long Beach, Rockaway, Howard Beach, Manhattan, Long
Island, Inwood, etc. Data on high water marks were recorded at residential structures and
other infrastructure. At each of the sites, besides the measurement for the high water marks,
at least two photographs showing water marks and surrounding environment were taken. Fig.
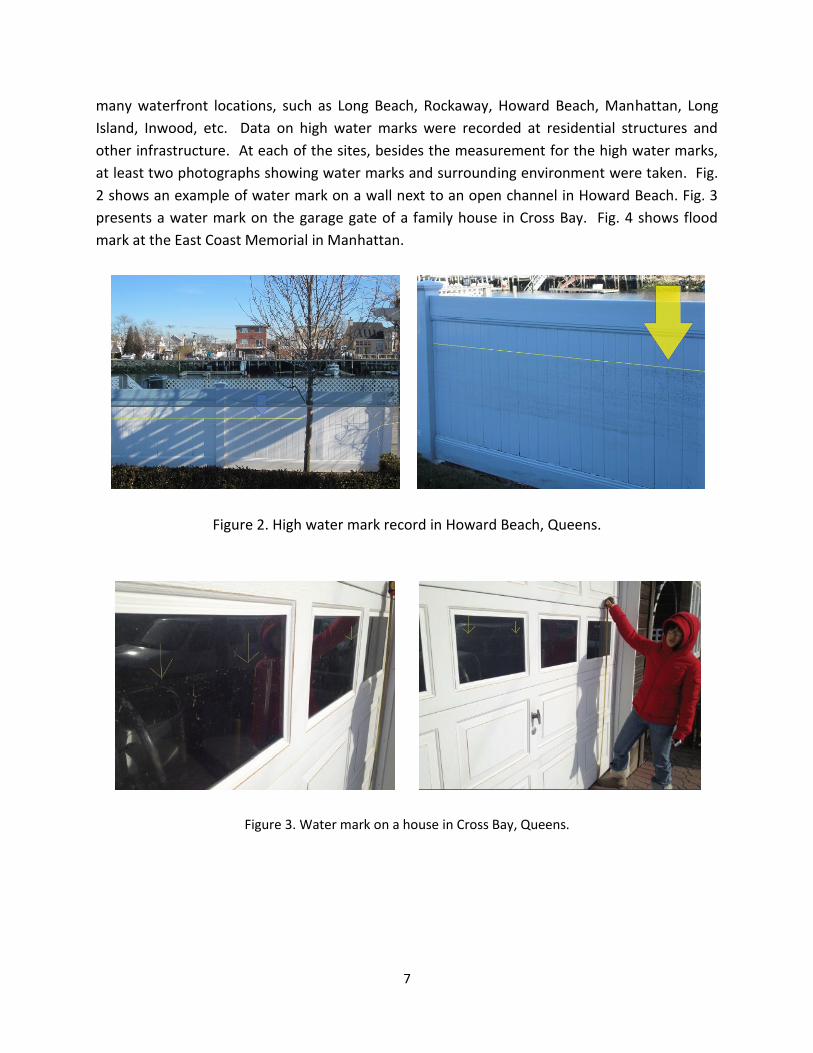
2 shows an example of water mark on a wall next to an open channel in Howard Beach. Fig. 3
presents a water mark on the garage gate of a family house in Cross Bay. Fig. 4 shows flood
mark at the East Coast Memorial in Manhattan.
Figure 2. High water mark record in Howard Beach, Queens.
Figure 3. Water mark on a house in Cross Bay, Queens.
8
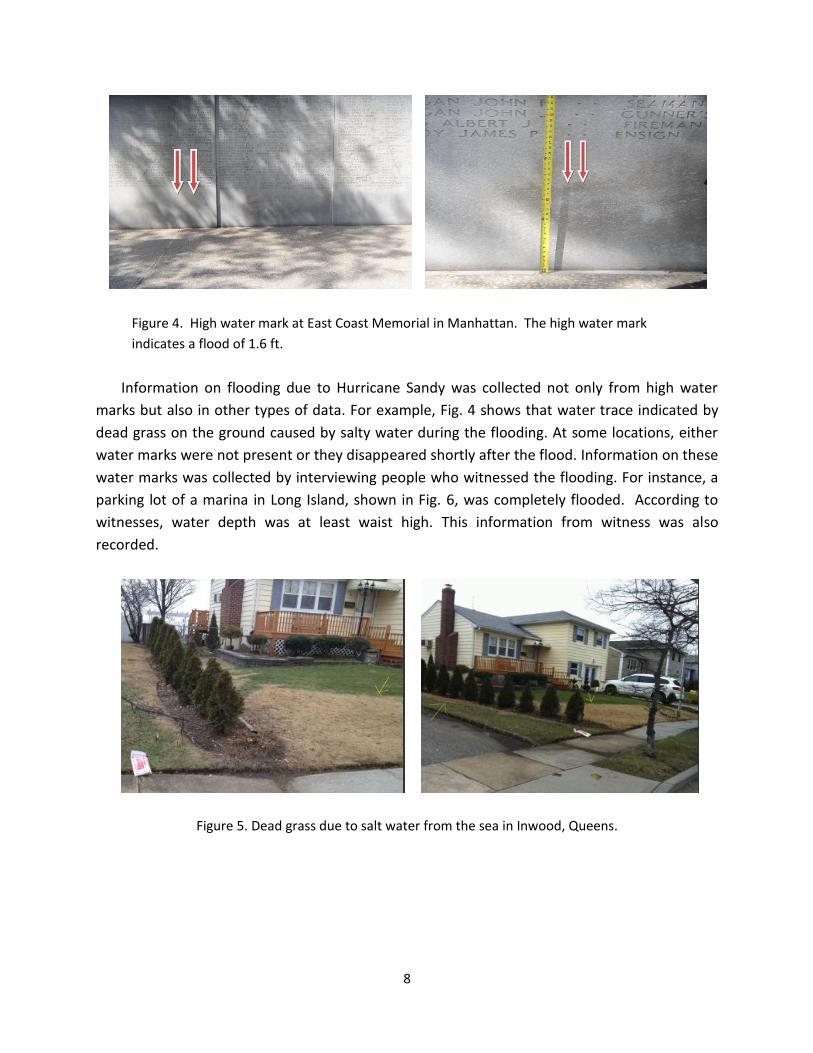
Figure 4. High water mark at East Coast Memorial in Manhattan. The high water mark
indicates a flood of 1.6 ft.
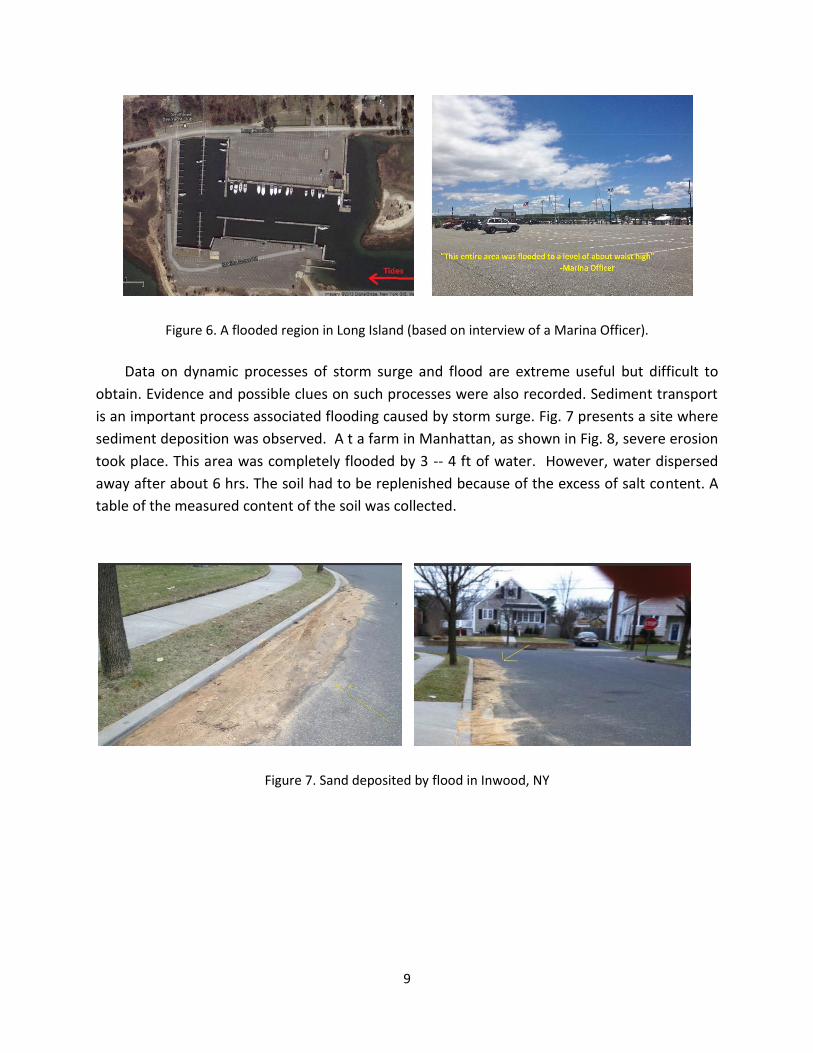
Information on flooding due to Hurricane Sandy was collected not only from high water
marks but also in other types of data. For example, Fig. 4 shows that water trace indicated by
dead grass on the ground caused by salty water during the flooding. At some locations, either
water marks were not present or they disappeared shortly after the flood. Information on these
water marks was collected by interviewing people who witnessed the flooding. For instance, a
parking lot of a marina in Long Island, shown in Fig. 6, was completely flooded. According to
witnesses, water depth was at least waist high. This information from witness was also
recorded.
Figure 5. Dead grass due to salt water from the sea in Inwood, Queens.
9
Figure 6. A flooded region in Long Island (based on interview of a Marina Officer).
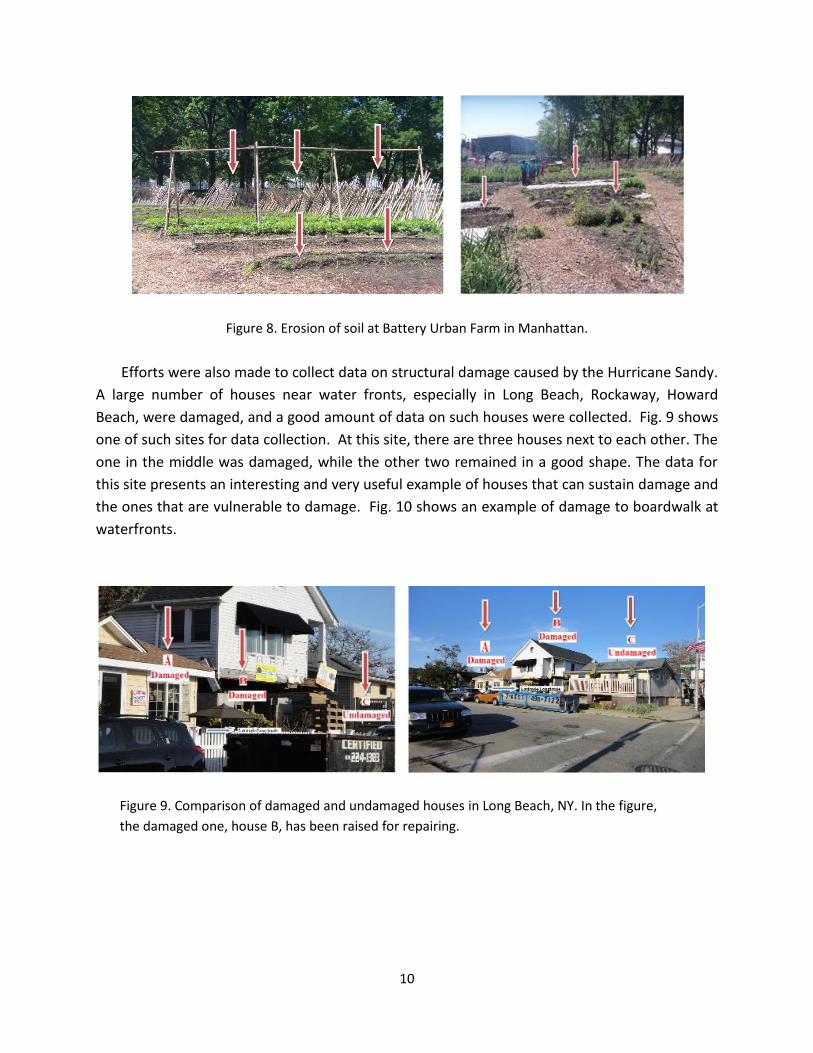
Data on dynamic processes of storm surge and flood are extreme useful but difficult to
obtain. Evidence and possible clues on such processes were also recorded. Sediment transport
is an important process associated flooding caused by storm surge. Fig. 7 presents a site where
sediment deposition was observed. A t a farm in Manhattan, as shown in Fig. 8, severe erosion
took place. This area was completely flooded by 3 -- 4 ft of water. However, water dispersed
away after about 6 hrs. The soil had to be replenished because of the excess of salt content. A
table of the measured content of the soil was collected.
Figure 7. Sand deposited by flood in Inwood, NY
10
Figure 8. Erosion of soil at Battery Urban Farm in Manhattan.
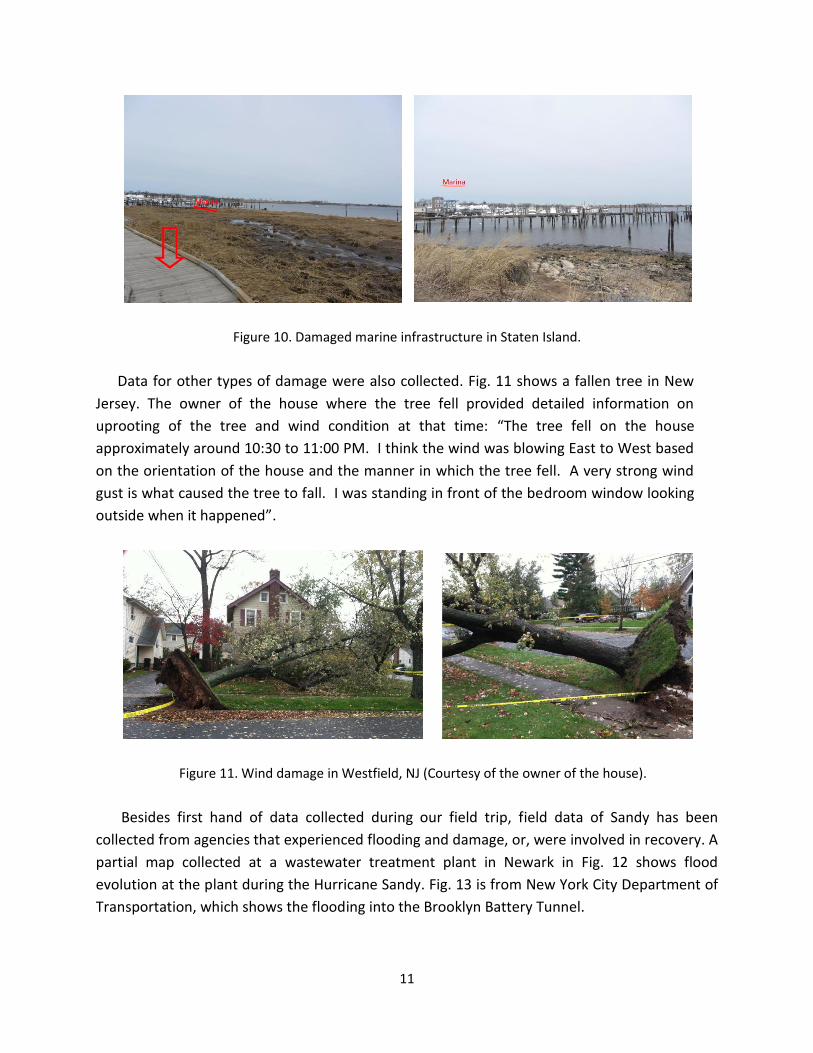
Efforts were also made to collect data on structural damage caused by the Hurricane Sandy.
A large number of houses near water fronts, especially in Long Beach, Rockaway, Howard
Beach, were damaged, and a good amount of data on such houses were collected. Fig. 9 shows
one of such sites for data collection. At this site, there are three houses next to each other. The
one in the middle was damaged, while the other two remained in a good shape. The data for
this site presents an interesting and very useful example of houses that can sustain damage and
the ones that are vulnerable to damage. Fig. 10 shows an example of damage to boardwalk at
waterfronts.
Figure 9. Comparison of damaged and undamaged houses in Long Beach, NY. In the figure,
the damaged one, house B, has been raised for repairing.
11
Figure 10. Damaged marine infrastructure in Staten Island.
Data for other types of damage were also collected. Fig. 11 shows a fallen tree in New
Jersey. The owner of the house where the tree fell provided detailed information on
uprooting of the tree and wind condition at that time: “The tree fell on the house
approximately around 10:30 to 11:00 PM. I think the wind was blowing East to West based
on the orientation of the house and the manner in which the tree fell. A very strong wind
gust is what caused the tree to fall. I was standing in front of the bedroom window looking
outside when it happened”.
Figure 11. Wind damage in Westfield, NJ (Courtesy of the owner of the house).
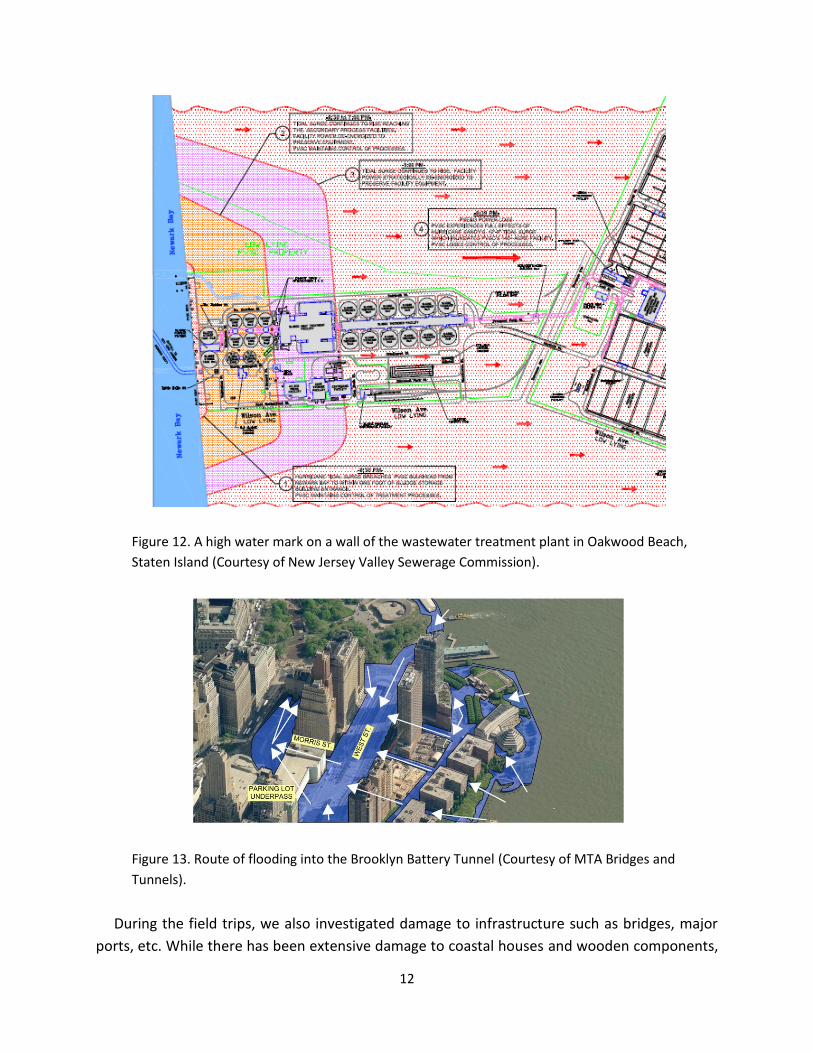
Besides first hand of data collected during our field trip, field data of Sandy has been
collected from agencies that experienced flooding and damage, or, were involved in recovery. A
partial map collected at a wastewater treatment plant in Newark in Fig. 12 shows flood
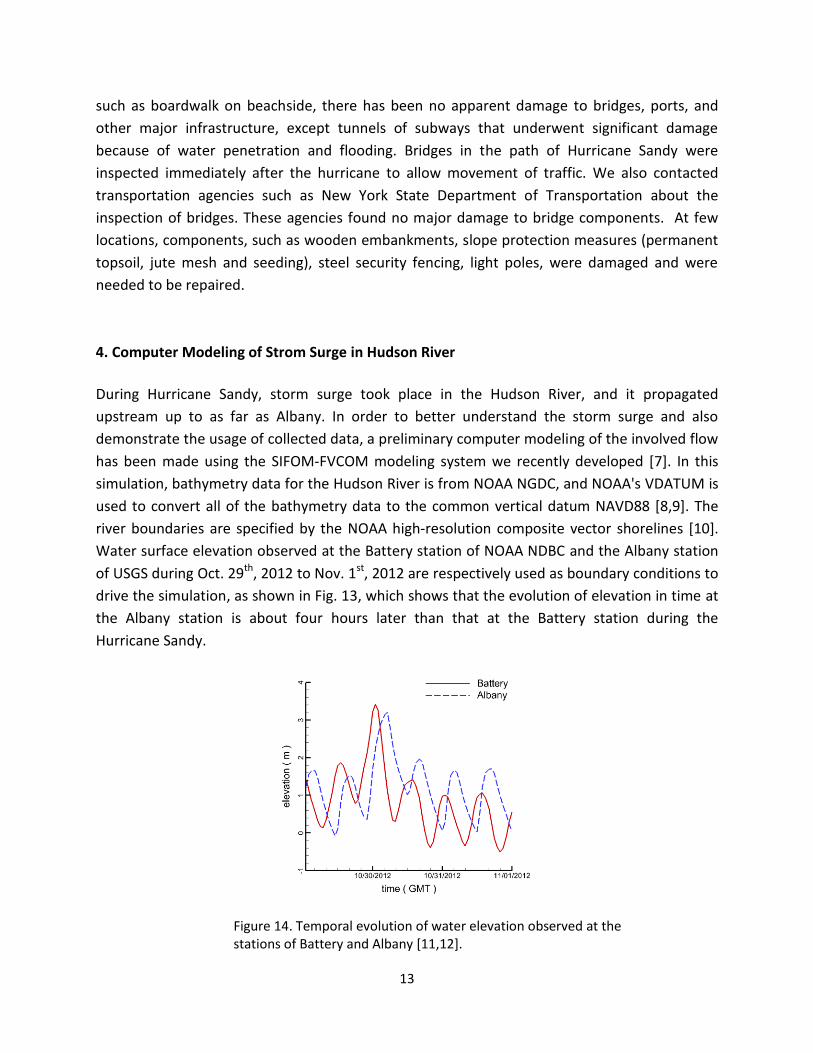
evolution at the plant during the Hurricane Sandy. Fig. 13 is from New York City Department of
Transportation, which shows the flooding into the Brooklyn Battery Tunnel.
12
Figure 12. A high water mark on a wall of the wastewater treatment plant in Oakwood Beach,
Staten Island (Courtesy of New Jersey Valley Sewerage Commission).
Figure 13. Route of flooding into the Brooklyn Battery Tunnel (Courtesy of MTA Bridges and
Tunnels).
During the field trips, we also investigated damage to infrastructure such as bridges, major
ports, etc. While there has been extensive damage to coastal houses and wooden components,
13
such as boardwalk on beachside, there has been no apparent damage to bridges, ports, and
other major infrastructure, except tunnels of subways that underwent significant damage
because of water penetration and flooding. Bridges in the path of Hurricane Sandy were
inspected immediately after the hurricane to allow movement of traffic. We also contacted
transportation agencies such as New York State Department of Transportation about the
inspection of bridges. These agencies found no major damage to bridge components. At few
locations, components, such as wooden embankments, slope protection measures (permanent
topsoil, jute mesh and seeding), steel security fencing, light poles, were damaged and were
needed to be repaired.
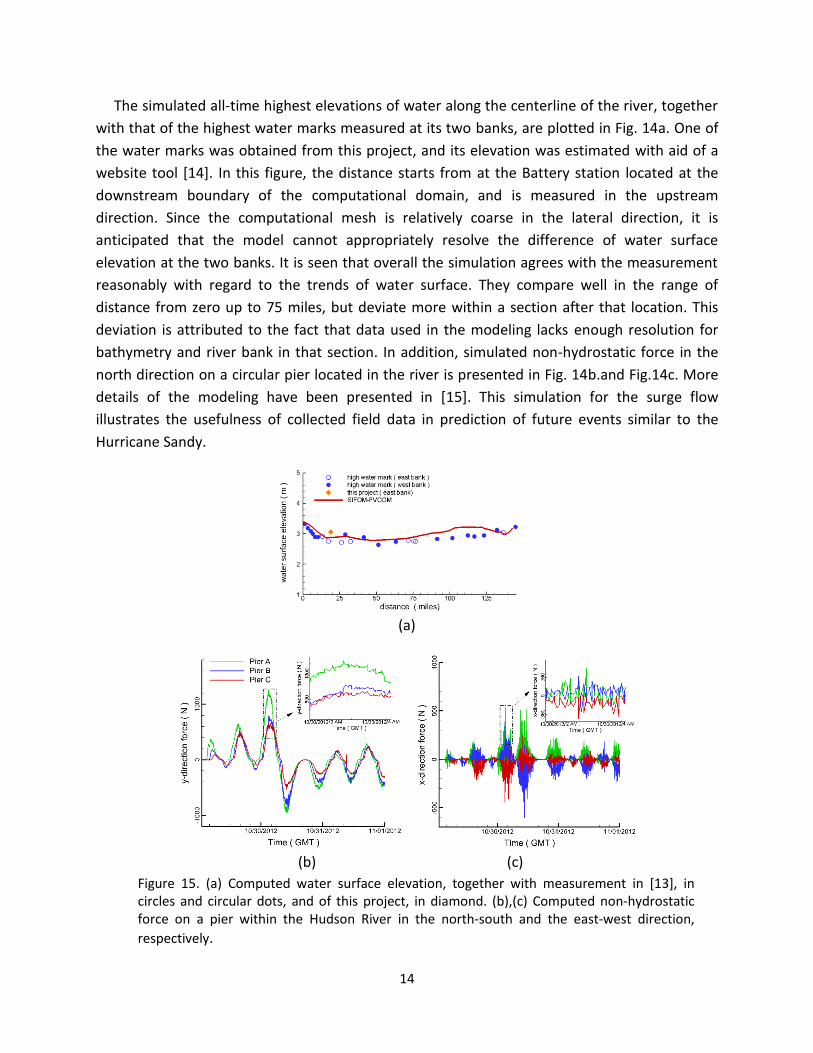
4. Computer Modeling of Strom Surge in Hudson River
During Hurricane Sandy, storm surge took place in the Hudson River, and it propagated
upstream up to as far as Albany. In order to better understand the storm surge and also
demonstrate the usage of collected data, a preliminary computer modeling of the involved flow
has been made using the SIFOM-FVCOM modeling system we recently developed [7]. In this
simulation, bathymetry data for the Hudson River is from NOAA NGDC, and NOAA's VDATUM is
used to convert all of the bathymetry data to the common vertical datum NAVD88 [8,9]. The
river boundaries are specified by the NOAA high-resolution composite vector shorelines [10].
Water surface elevation observed at the Battery station of NOAA NDBC and the Albany station
of USGS during Oct. 29th, 2012 to Nov. 1st, 2012 are respectively used as boundary conditions to
drive the simulation, as shown in Fig. 13, which shows that the evolution of elevation in time at
the Albany station is about four hours later than that at the Battery station during the
Hurricane Sandy.
Figure 14. Temporal evolution of water elevation observed at the stations of Battery and Albany [11,12].
14
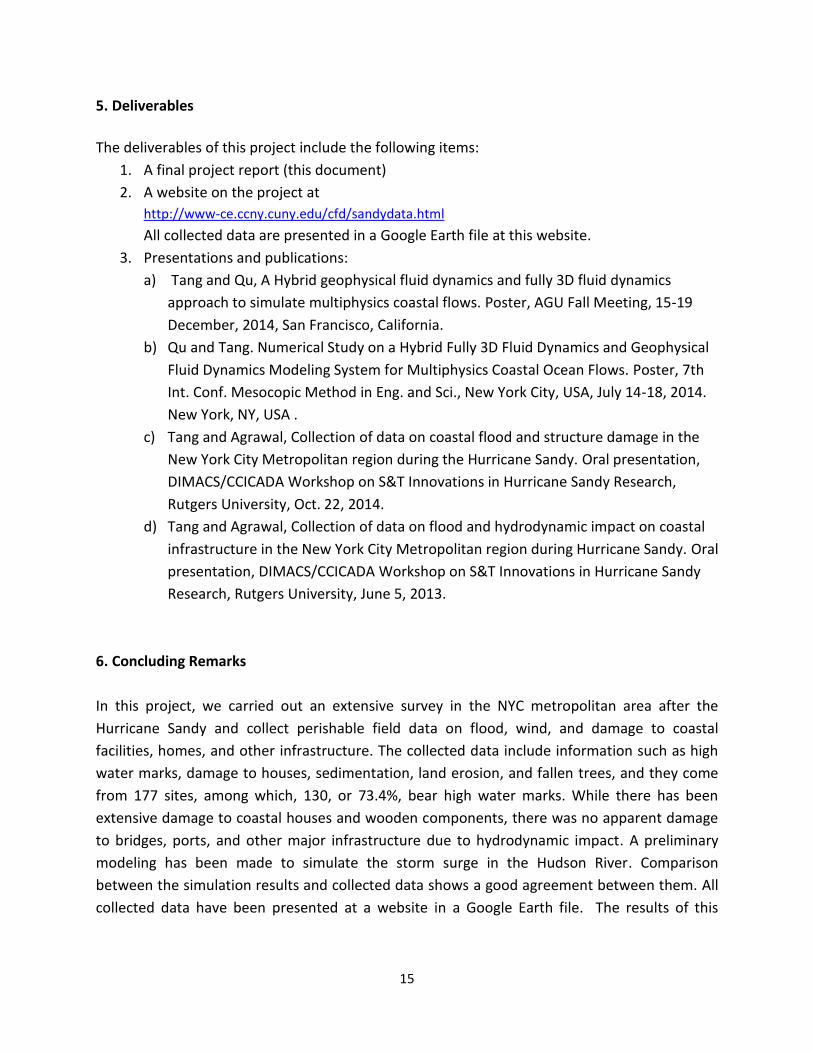
The simulated all-time highest elevations of water along the centerline of the river, together
with that of the highest water marks measured at its two banks, are plotted in Fig. 14a. One of
the water marks was obtained from this project, and its elevation was estimated with aid of a
website tool [14]. In this figure, the distance starts from at the Battery station located at the
downstream boundary of the computational domain, and is measured in the upstream
direction. Since the computational mesh is relatively coarse in the lateral direction, it is
anticipated that the model cannot appropriately resolve the difference of water surface
elevation at the two banks. It is seen that overall the simulation agrees with the measurement
reasonably with regard to the trends of water surface. They compare well in the range of
distance from zero up to 75 miles, but deviate more within a section after that location. This
deviation is attributed to the fact that data used in the modeling lacks enough resolution for
bathymetry and river bank in that section. In addition, simulated non-hydrostatic force in the
north direction on a circular pier located in the river is presented in Fig. 14b.and Fig.14c. More
details of the modeling have been presented in [15]. This simulation for the surge flow
illustrates the usefulness of collected field data in prediction of future events similar to the
Hurricane Sandy.
(a)
(b) (c)
Figure 15. (a) Computed water surface elevation, together with measurement in [13], in circles and circular dots, and of this project, in diamond. (b),(c) Computed non-hydrostatic force on a pier within the Hudson River in the north-south and the east-west direction,
respectively.
15
5. Deliverables
The deliverables of this project include the following items:
1. A final project report (this document)
2. A website on the project at
http://www-ce.ccny.cuny.edu/cfd/sandydata.html
All collected data are presented in a Google Earth file at this website.
3. Presentations and publications:
a) Tang and Qu, A Hybrid geophysical fluid dynamics and fully 3D fluid dynamics
approach to simulate multiphysics coastal flows. Poster, AGU Fall Meeting, 15-19
December, 2014, San Francisco, California.
b) Qu and Tang. Numerical Study on a Hybrid Fully 3D Fluid Dynamics and Geophysical
Fluid Dynamics Modeling System for Multiphysics Coastal Ocean Flows. Poster, 7th
Int. Conf. Mesocopic Method in Eng. and Sci., New York City, USA, July 14-18, 2014.
New York, NY, USA .
c) Tang and Agrawal, Collection of data on coastal flood and structure damage in the
New York City Metropolitan region during the Hurricane Sandy. Oral presentation,
DIMACS/CCICADA Workshop on S&T Innovations in Hurricane Sandy Research,
Rutgers University, Oct. 22, 2014.
d) Tang and Agrawal, Collection of data on flood and hydrodynamic impact on coastal
infrastructure in the New York City Metropolitan region during Hurricane Sandy. Oral
presentation, DIMACS/CCICADA Workshop on S&T Innovations in Hurricane Sandy
Research, Rutgers University, June 5, 2013.
6. Concluding Remarks
In this project, we carried out an extensive survey in the NYC metropolitan area after the
Hurricane Sandy and collect perishable field data on flood, wind, and damage to coastal
facilities, homes, and other infrastructure. The collected data include information such as high
water marks, damage to houses, sedimentation, land erosion, and fallen trees, and they come
from 177 sites, among which, 130, or 73.4%, bear high water marks. While there has been
extensive damage to coastal houses and wooden components, there was no apparent damage
to bridges, ports, and other major infrastructure due to hydrodynamic impact. A preliminary
modeling has been made to simulate the storm surge in the Hudson River. Comparison
between the simulation results and collected data shows a good agreement between them. All
collected data have been presented at a website in a Google Earth file. The results of this
16
research have also been presented during several conferences. It is expected that the collected
data will be useful for study of future coastal flooding due to hurricanes and resulting damage.
A strong motivation in data collection of this project is to identify and gather information
that can be used to extract and recover dynamic processes of wind, flood, dynamic impact, and
structural response during the hurricane. In general, the data collected in this project, such as
high water marks and fallen trees, do not directly reflect such processes. Careful and detailed
analysis is necessary for recovery of the involved dynamic processes, which can be used for
future development of models that are able to predict such processes. Such analysis will be
significant and the focus of our research in the future. In addition, examination is necessary for
data accuracy, such as latitude and longitude of the position of a site measured by a GPS or a
cell phone.
It is mentioned that the current Google Earth file contains data for 177 sites. However, we
may continue our data collection through outreach with numerous agencies in the City that
have vast amount of filed data on water marks in the form of photographs. One of the
challenges dealing with these agencies is their requirement for confidential agreement to
access their report, which also contains future plans to deal with future events like Hurricane
Sandy. We will continue to update our Google Earth file and the website as we received further
data from agencies in the NYC metropolitan region.
References [1] NOAA NRDC 2012, The consequences of global warming on weather patterns. http://www.nrdc.org/globalwarming/fcons/fcons1.asp. [2] Yin et al. (2009). Model projections of rapid sea-level rise on the northeast coast of the United States.
Nature Geoscience, March 15, 2009; DOI: 10.1038 [3] Lillibridge J, Lin MS, Shum CK. (2013). Hurricane Sandy Storm Surge Measured by Satellite Altimetry
Oceanography, 26, SI, 8-9 [4] USGS, Hurricane Sandy Storm Tide mapper.
http://54.243.149.253/home/webmap/viewer.html?webmap=c07fae08c20c4117bdb8e92e3239837e.
[5] USGS, Hurricane Sandy Monitoring http://ga.water.usgs.gov/flood/hurricane/sandy/sites/hwm/HWM-NY-QUE-730.html.
[6] NOAA National Ocean Service, Aerial Photos of Hurricane Sandy Damage from NOAA's National Geodetic Survey. http://oceanservice.noaa.gov/news/weeklynews/nov12/ngs-sandy-imagery.html.
[7] H. S. Tang, K. Qu, and X. G. Wu, An overset grid method for integration of fully 3D fluid dynamics and geophysics fluid dynamics models to simulate multiphysics coastal ocean flows. J. Comput. Phys., 273(2014), 548-571
[8] NOAA NGDC, http://www.ngdc.noaa.gov/. [9] NOAA VDATUM, http://vdatum.noaa.gov/. [10] NOAA Coastal Services Center. NOAA composite coastline,
http://shoreline.noaa.gov/data/datasheets/composite.html. [11]NOAA NDBC, http://www.ndbc.noaa.gov/.

17
[12] USGS Water, http://water.usgs.gov/wateralert/. [13] USGS NY Water, http://ny.water.usgs.gov/flood/HudsonSandy.JPG. [14] Free Map Tool. http://www.freemaptools.com/elevation-finder.htm. [15] K. Qu and H. S. Tang. Numerical Study on a Hybrid Fully 3D Fluid Dynamics and Geophysical Fluid
Dynamics Modeling System for Multiphysics Coastal Ocean Flows. Oral presentation. 7th Int. Conf. Mesocopic Method in Eng. and Sci., New York City, USA, July 14-18, 2014.