Embed Size (px)
Citation preview

This article was downloaded by: [122.160.208.114]On: 20 February 2012, At: 22:32Publisher: RoutledgeInforma Ltd Registered in England and Wales Registered Number: 1072954 Registeredoffice: Mortimer House, 37-41 Mortimer Street, London W1T 3JH, UK
Asian GeographerPublication details, including instructions for authors andsubscription information:http://www.tandfonline.com/loi/rage20
Rapid urbanization and induced floodrisk in Noida, IndiaR. B. Singh a & S. Singh aa Department of Geography, Delhi School of Economics, Universityof Delhi, Delhi-7, India
Available online: 16 Dec 2011
To cite this article: R. B. Singh & S. Singh (2011): Rapid urbanization and induced flood risk inNoida, India, Asian Geographer, 28:2, 147-169
To link to this article: http://dx.doi.org/10.1080/10225706.2011.629417
PLEASE SCROLL DOWN FOR ARTICLE
Full terms and conditions of use: http://www.tandfonline.com/page/terms-and-conditions
This article may be used for research, teaching, and private study purposes. Anysubstantial or systematic reproduction, redistribution, reselling, loan, sub-licensing,systematic supply, or distribution in any form to anyone is expressly forbidden.
The publisher does not give any warranty express or implied or make any representationthat the contents will be complete or accurate or up to date. The accuracy of anyinstructions, formulae, and drug doses should be independently verified with primarysources. The publisher shall not be liable for any loss, actions, claims, proceedings,demand, or costs or damages whatsoever or howsoever caused arising directly orindirectly in connection with or arising out of the use of this material.
Rapid urbanization and induced flood risk in Noida, India
R.B. Singh* and S. Singh
Department of Geography, Delhi School of Economics, University of Delhi, Delhi-7, India
(Final version received 30 September 2011)
The amount and intensity of runoff at catchment scale are largely determined by the presence ofimpervious land cover types, which are predominant in an urbanized area. This paper examinesthe impact of different methods for estimating impervious surface cover on the prediction ofpeak discharges as determined by a fully distributed rainfall-runoff model (WetSpa). Thestudy of River Yamuna and Hindon basin area shows detailed information on the spatialdistribution of impervious surfaces, as obtained/calibrated from remotely sensed data. Itproduces substantial estimates of peak discharges for different types of urban land uses.Land use and cover change in Noida during 1981–2011 and historical hydrological dataduring 1957–2010 have been used to determine the results. It shows that the direct runofffrom urban areas is responsible for a flood event compared with runoff from other land useareas. The interflow from forested, pasture and agricultural field areas contributes to therecession flow. The study also demonstrates that sub-pixel estimation of imperviousnessmay be a useful alternative for more expensive high-resolution mapping for rainfall-runoffmodeling at small scale based on pre-existing land use pattern and the two floodingscenarios. The study proves that rapid urbanization has resulted in losses of farmland, forestand shrub since 1995 as more than 36% of the forest and 22% of the shrub areas weretransformed into farmlands and settlements. The changed hydrological condition hasimpaired the river’s flood protection capacity. Apart from natural processes, human activitiesdriven by socio-economic transformation are being considered as a major driver for theincreasing flood risks.
Keywords: Flood risk mapping; GIS-scenario modeling; land use/land cover change; remotesensing and urbanization
Introduction
The expansion of human settlements and accompanying anthropogenic activities, especially rapidurbanization, plays an important role in the land use and land cover change, leading to changes inecological processes and hydrologic resources on local to global scales. Urbanization at all levelsis an integral part of development but rapid urbanization is elevating the vulnerability of theregion. Cities in the developing world are more vulnerable to damage caused by floodsbecause their capacity to cope with disasters is limited (GOI 1990, Banasik and Pham 2010, Hard-ison et al. 2009). Urban land uses also reduce the surface roughness and therefore shorten theoverland flow detention time. In contrast, less runoff is produced from undisturbed grasslandand unpaved areas; this is due to the factors such as interception of precipitation by the vegetationcanopy, the dense network of roots that increases infiltration capacity, soil porosity and overland
ISSN 1022-5706 print/ISSN 2158-1762 online© 2011 Taylor & Francishttp://dx.doi.org/10.1080/10225706.2011.629417http://www.tandfonline.com
*Corresponding author. Email: [email protected]
Asian GeographerVol. 28, No. 2, December 2011, 147–169
Dow
nloa
ded
by [
122.
160.
208.
114]
at 2
2:32
20
Febr
uary
201
2
flow. Evidently, areas with a high percentage of cropland or urban land use yield more stormrunoff than the areas of similar soils and topography of grassland. It is pertinent to use relevantlocal, national, and international literature in order to understand a range of issues related to urbanflooding and their effects on the local receiving environment. Despite a sizable literature invol-ving urbanization and flooding in large cities (e.g. Misra and Chapman 1991, Arnold andGibbons 1996, Lahiri-Dutt 2001, Bhandari 2006, Shaw 2007, Singh and Singh 2007, Eschet al. 2008, Bachofer et al. 2009, Banasik et al. 2010), the compendious answer to the floodrisk in newly developed small and intermediate urban centers across India is relatively unex-plored. An attempt to carry out such a study may serve as a basis for an assessment of urbanflash flood hazard in newly urbanized areas in developing countries.
Surrounding the mega cities of India, many satellite towns have evolved in order to accom-modate industrial development. The 1990s saw huge growth in the Indian economy andadditional migration to the capital city Delhi exceeded planning estimates. At the outskirts ofDelhi, a large amount of land was reclaimed from the River Yamuna flood plain to construct acity for about half a million population widely known as New Okhla Industrial DevelopmentArea (NOIDA, popularly known as Noida). As a planned expansion, Noida’s infrastructureand utilities were carefully laid out. It was developed to accommodate additional populationgrowth of Delhi for 20–25 years. But, with the massive influx to Delhi, it became overloadedin just 15 years. It is one of the largest planned industrial townships of Asia, and symbolizesharmony between human habitat and industrial enterprise in India. It is an important fringetown to Delhi and has been recognized as a flood prone zone, even though an embankmentwas made. The ecology of this site is relatively unsuited to the purpose of industrial development.The site, being formerly a river basin, is low-lying and hence prone to various problems of drai-nage, disposal of liquid waste and water logging. In the past 30 years Noida has suffered severalheavy floods, the disastrous consequences of which demonstrate the vulnerability of the area par-allel to the drainage. Analyses of the reported number of flash flood events over the last 30 yearsin Noida also show a positive trend (Singh and Singh 2007). Whereas a part of the increased flashflood hazard can be ascribed to increase in impervious areas as a consequence of urbanization,and also has a great effect on the local water balance.
The aim of this paper is to develop a methodology for estimating flood risk, considering Noidaas a case study. We will establish a relationship between an impervious area and river flow,making use of remote sensing techniques and simultaneously analyzing the relevant meteorolo-gical and hydrological data. Emphasis will be given to highlight the local causes and land usechange associated with storm water runoff and other discharges to waterways in urban catch-ments. Results of this study have a direct application in the formulation of policies on land useplanning and future balancing of urbanization through conservation means. Once the influenceof urbanization on river flow is quantified, it will be possible to predict the future trends of flood-ing, so that measures can be taken to cope up with increasing demand for residential and commer-cial areas without risking the increased intensity and extent of storm water in rainy periods (Biftuand Gan 2001). Results of this study confirm that the main driving force of increased flood risk isfound in new urban developments in flood prone areas (Singh and Singh 2007). The forecast andsimulation of floods is therefore essential for planning and operation of civil protection measuresand for early flood warning (Sen Roy et al. 2011). The findings of this study thus encourage emer-gency managers and local planning authorities to consider land use planning as an effective non-structural measure for flood risk mitigation.
The following sections contribute some perspectives on the study area, its geographicallocation and soil type in the context of urbanization and flooding embraced by database andresearch methodology, discussion of the current research findings and some concluding thoughts.
148 R.B. Singh and S. Singh
Dow
nloa
ded
by [
122.
160.
208.
114]
at 2
2:32
20
Febr
uary
201
2
Study area
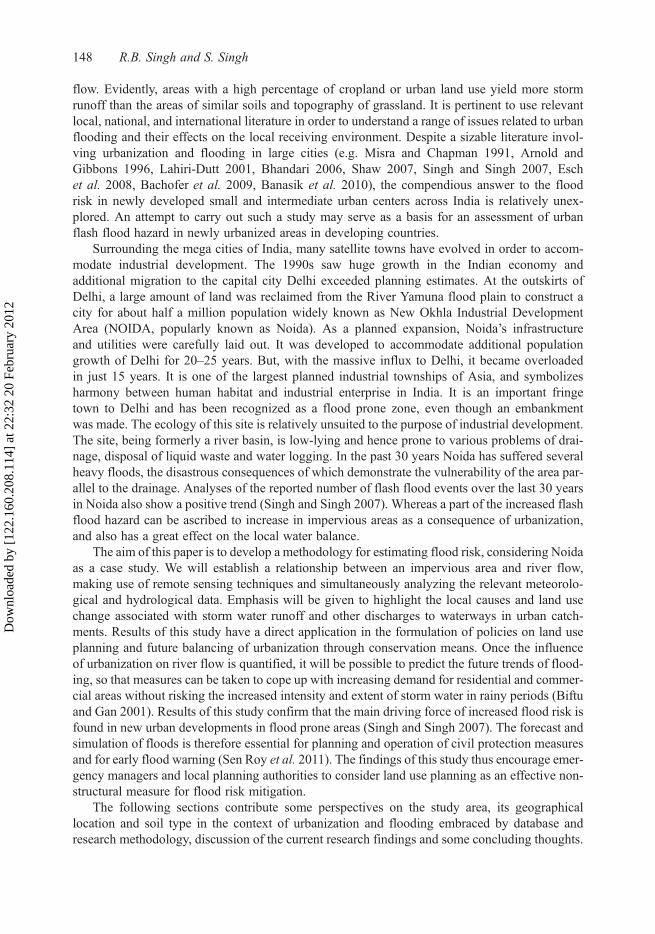
The latitude and longitude of Noida township are 28° 2’N and 70° 30’ E respectively. Noida isanalogous to the planning area/Notified Area, and falls entirely within the newly carved districtof Gautam Buddha Nagar. It covers 81 revenue villages of which 65 villages lie in Dadri Tehsil(formerly in the district of Ghaziabad) and 16 villages in Sikandrabad Tehsil. It is located in closeproximity to the metropolitan city of Delhi and lies along the eastern and southeastern boundariesof the National Capital Territory of Delhi (Figure 1). It falls within the Delhi Metropolitan Area(DMA) and for this reason the city of Noida enjoys the status of a DMA town within the policyframework of the regional plan of the National Capital Region (NCR). The area also forms part ofthe Uttar Pradesh sub-region of NCR. The total area of Noida is approximately 203.2 sq. km. It isan industrial city and important satellite town to Delhi, located on Delhi-Uttar Pradesh border,situated between the River Yamuna and the River Hindon (TCPO 1992). The Noida NotifiedArea is part of the National Capital Region (NCR) and comprises a total of 20,316 hectares(including 81 villages); 37,000 persons lived in the city in 1981 (Census of India 1981). By
Figure 1. The geographical location of the study area Noida in relation to Delhi and River Yamuna.
Asian Geographer 149
Dow
nloa
ded
by [
122.
160.
208.
114]
at 2
2:32
20
Febr
uary
201
2
1991, it was declared as a Census Town, its population had increased four times and the totalpopulation exceeded to 140,500. In 2001, Noida’s total population was 293,908 and reached504,842 in 2011. All 81 villages have been engulfed as the city has grown.
The terrain of the area is generally plain with an average elevation of 200 meters above mean sealevel (MSL), having a gradual slope varying between 0.2–0.1% from northeast to southwest. Themaximum altitude is 204 meters above MSL near Parthala Khanjarpur village in the northeast andthe minimum elevation is 196 meters above MSL near Garhi village in the southwestern part of thearea. It shouldbenoted that theground level of the site is lower than thehigh flood level of riverYamuna.
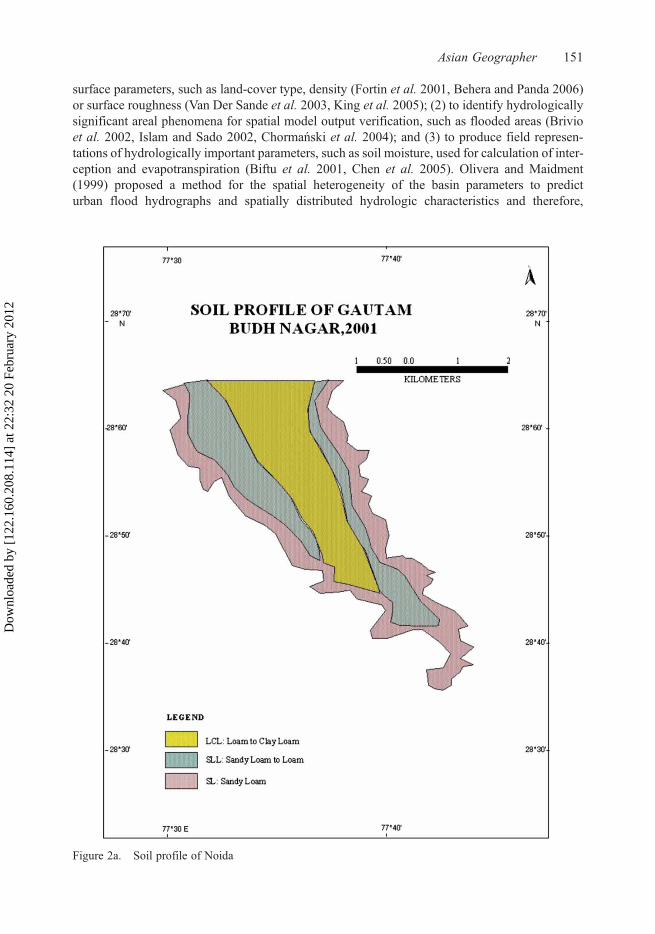
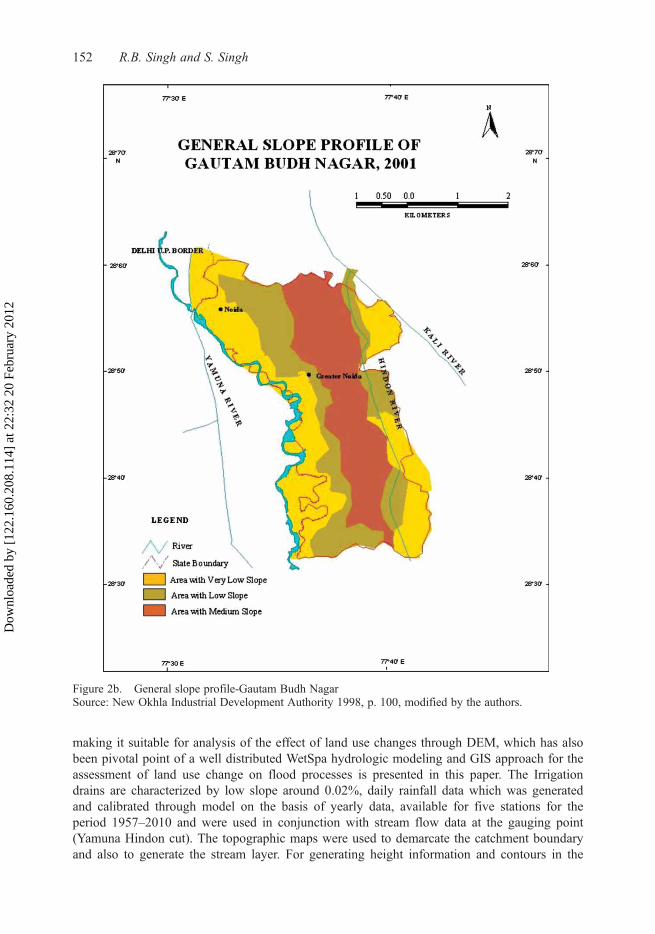
Flooding of the area is prevented due to the construction of the embankment along the riversYamuna and Hindon. However, the general low level of the site is a constraint for effective stormwater and sewage disposal. For this reason the general sanitary and hygienic condition of the areais relatively poor. The soil is mostly silt, deposited over a large span of time (Das and Kant 1980,Gupta 2000, Zheng et al. 2008). Silt composition makes it difficult for the rainwater to percolatethrough. It induces void’s shrinkages, thereby decreasing the percolation (Figures 2a and 2b). Theunderground water is saline and its mineral contents are high. Existing flood protection measuresdo not save the area from extreme floods. As the site is low-lying and almost flat, one cannotneglect the local flooding scenario that normally occurs in Noida. The area has been experiencingfloods of various magnitudes in the past due to floods in the drainage system of the River Yamunaand Hindon. The River Yamuna crossed its danger level (fixed at 204.83m) 25 times during thelast 33 years (Singh and Singh 2007). Since 1900, it has experienced nine major floods in theyears 1924, 1947, 1976, 1978, 1988, 1995, 1999, 2005 and 2010 when the peak level of theYamuna River was more than a meter or above. The River Yamuna crossed the danger level of206.93 m at Hindon Cut (2.66m above the danger level) during the flood occurred on 6 September1995. The second record peak of 208.20 m was on 27 October 2010. In the recent past, the highmagnitude floods caused misery, loss of life and property to the residents of the low lying areas.
The climate of the area is monsoonal. The temperature ranges between 15° to 46°C, andaverage rainfall is approximately 700 mm/annum, over 80% of which falls during themonsoon. July and August are the wettest months, receiving about 60% of the monsoonseason rainfall. Average runoff from the catchment is about 1,923 cumecs with a runoff coeffi-cient of 0.329. There are five storm water drains covering the whole of Noida. Drain no.1(passes through sector 14) and Drain no. 4 (sector 34 to sector 51) meet Drain no. 2 (sector 37to sector 50), which finally meets the Irrigation Drain. Drain no. 3 passes through sectors 8,10, 11, 12, 21, 21A, 23, 24, 25, 32 and 33 and finally meets the Irrigation drain. Drain no.5passes through Noida Export Processing Zone (NEPZ) and meets the Irrigation drain.
Research methodology
In this type of analysis, it was desirable that the hydrologic modeling should describe the spatio-temporal variability of anthropogenic effects, so that the assessment could reflect the variability ofthe hydrologic parameter at the required micro scale. Recent advances in computer hardware andGIS software coupled with WetSpa and Digital Elevation Model (DEM) have been developed inErdas 9.2 for flood prediction. WetSpa model has been found most suitable for Noida because itanalyzes the data on grid bases and provides simulation output for flood on hourly time step,whereas models like SHE and TOPMODEL needs compatibility for new type of data whichcan benefit from the GIS techniques (Quinn et al. 1991, Ewen et al. 2000). At the same time,other advance hydrologic models compatible with remotely sensed data and GIS such as theSWAT (Borah et al. 2002), CASC2D (Julien et al. 1995), and HYDROTEL (Fortin et al.2001) needed more user friendly tools. The remote sensing data on land use and land coverhas been used for hydrological modeling in the study in following ways: (1) to quantify
150 R.B. Singh and S. Singh
Dow
nloa
ded
by [
122.
160.
208.
114]
at 2
2:32
20
Febr
uary
201
2
surface parameters, such as land-cover type, density (Fortin et al. 2001, Behera and Panda 2006)or surface roughness (Van Der Sande et al. 2003, King et al. 2005); (2) to identify hydrologicallysignificant areal phenomena for spatial model output verification, such as flooded areas (Brivioet al. 2002, Islam and Sado 2002, Chormański et al. 2004); and (3) to produce field represen-tations of hydrologically important parameters, such as soil moisture, used for calculation of inter-ception and evapotranspiration (Biftu et al. 2001, Chen et al. 2005). Olivera and Maidment(1999) proposed a method for the spatial heterogeneity of the basin parameters to predicturban flood hydrographs and spatially distributed hydrologic characteristics and therefore,
Figure 2a. Soil profile of Noida
Asian Geographer 151
Dow
nloa
ded
by [
122.
160.
208.
114]
at 2
2:32
20
Febr
uary
201
2
making it suitable for analysis of the effect of land use changes through DEM, which has alsobeen pivotal point of a well distributed WetSpa hydrologic modeling and GIS approach for theassessment of land use change on flood processes is presented in this paper. The Irrigationdrains are characterized by low slope around 0.02%, daily rainfall data which was generatedand calibrated through model on the basis of yearly data, available for five stations for theperiod 1957–2010 and were used in conjunction with stream flow data at the gauging point(Yamuna Hindon cut). The topographic maps were used to demarcate the catchment boundaryand also to generate the stream layer. For generating height information and contours in the
Figure 2b. General slope profile-Gautam Budh NagarSource: New Okhla Industrial Development Authority 1998, p. 100, modified by the authors.
152 R.B. Singh and S. Singh
Dow
nloa
ded
by [
122.
160.
208.
114]
at 2
2:32
20
Febr
uary
201
2
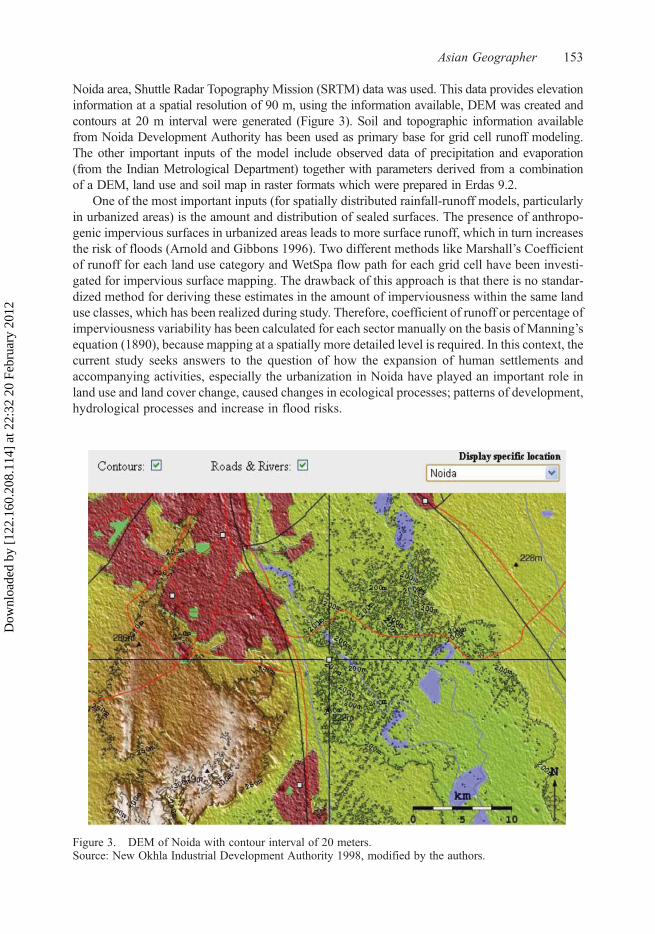
Noida area, Shuttle Radar Topography Mission (SRTM) data was used. This data provides elevationinformation at a spatial resolution of 90 m, using the information available, DEM was created andcontours at 20 m interval were generated (Figure 3). Soil and topographic information availablefrom Noida Development Authority has been used as primary base for grid cell runoff modeling.The other important inputs of the model include observed data of precipitation and evaporation(from the Indian Metrological Department) together with parameters derived from a combinationof a DEM, land use and soil map in raster formats which were prepared in Erdas 9.2.
One of the most important inputs (for spatially distributed rainfall-runoff models, particularlyin urbanized areas) is the amount and distribution of sealed surfaces. The presence of anthropo-genic impervious surfaces in urbanized areas leads to more surface runoff, which in turn increasesthe risk of floods (Arnold and Gibbons 1996). Two different methods like Marshall’s Coefficientof runoff for each land use category and WetSpa flow path for each grid cell have been investi-gated for impervious surface mapping. The drawback of this approach is that there is no standar-dized method for deriving these estimates in the amount of imperviousness within the same landuse classes, which has been realized during study. Therefore, coefficient of runoff or percentage ofimperviousness variability has been calculated for each sector manually on the basis of Manning’sequation (1890), because mapping at a spatially more detailed level is required. In this context, thecurrent study seeks answers to the question of how the expansion of human settlements andaccompanying activities, especially the urbanization in Noida have played an important role inland use and land cover change, caused changes in ecological processes; patterns of development,hydrological processes and increase in flood risks.
Figure 3. DEM of Noida with contour interval of 20 meters.Source: New Okhla Industrial Development Authority 1998, modified by the authors.
Asian Geographer 153
Dow
nloa
ded
by [
122.
160.
208.
114]
at 2
2:32
20
Febr
uary
201
2
The study has the following five methodological components: model description, remotesensing and hydrologic data integration, overland flow modeling using Integrated Land andWater Information System (ILWIS), urban flash flood modeling and land use change classifi-cation through satellite imagery. All are interrelated and interdependent on each other. Therefore,to analyze and achieve results from these components, various related information was gathered,like: the local planning authority boundary, location of main rivers, location of all other water-courses, rainfall information, existing and proposed land use pattern, location of flood defense,geology, topographical data, environmental problems and/or strategies for those are sensitive toflood management activities, i.e. Catchment Flood Management Plans (CFMPs).
Description of the hydrologic model
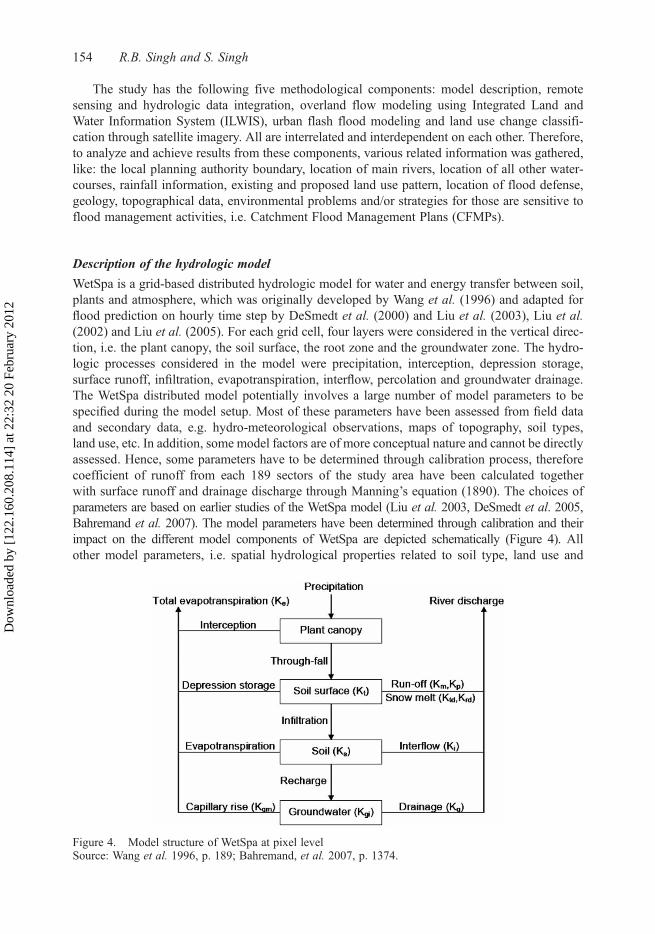
WetSpa is a grid-based distributed hydrologic model for water and energy transfer between soil,plants and atmosphere, which was originally developed by Wang et al. (1996) and adapted forflood prediction on hourly time step by DeSmedt et al. (2000) and Liu et al. (2003), Liu et al.(2002) and Liu et al. (2005). For each grid cell, four layers were considered in the vertical direc-tion, i.e. the plant canopy, the soil surface, the root zone and the groundwater zone. The hydro-logic processes considered in the model were precipitation, interception, depression storage,surface runoff, infiltration, evapotranspiration, interflow, percolation and groundwater drainage.The WetSpa distributed model potentially involves a large number of model parameters to bespecified during the model setup. Most of these parameters have been assessed from field dataand secondary data, e.g. hydro-meteorological observations, maps of topography, soil types,land use, etc. In addition, some model factors are of more conceptual nature and cannot be directlyassessed. Hence, some parameters have to be determined through calibration process, thereforecoefficient of runoff from each 189 sectors of the study area have been calculated togetherwith surface runoff and drainage discharge through Manning’s equation (1890). The choices ofparameters are based on earlier studies of the WetSpa model (Liu et al. 2003, DeSmedt et al. 2005,Bahremand et al. 2007). The model parameters have been determined through calibration and theirimpact on the different model components of WetSpa are depicted schematically (Figure 4). Allother model parameters, i.e. spatial hydrological properties related to soil type, land use and
Figure 4. Model structure of WetSpa at pixel levelSource: Wang et al. 1996, p. 189; Bahremand, et al. 2007, p. 1374.
154 R.B. Singh and S. Singh
Dow
nloa
ded
by [
122.
160.
208.
114]
at 2
2:32
20
Febr
uary
201
2
topography have been automatically derived using GIS tools as explained in classifying land usechange through satellite imagery.
Land use classification and change through satellite imagery
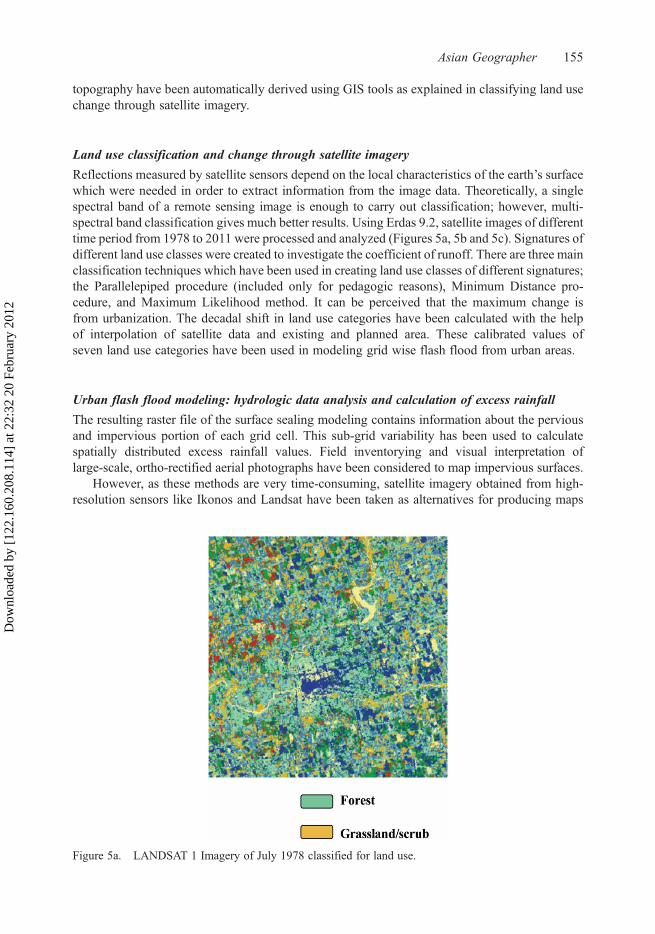
Reflections measured by satellite sensors depend on the local characteristics of the earth’s surfacewhich were needed in order to extract information from the image data. Theoretically, a singlespectral band of a remote sensing image is enough to carry out classification; however, multi-spectral band classification gives much better results. Using Erdas 9.2, satellite images of differenttime period from 1978 to 2011 were processed and analyzed (Figures 5a, 5b and 5c). Signatures ofdifferent land use classes were created to investigate the coefficient of runoff. There are three mainclassification techniques which have been used in creating land use classes of different signatures;the Parallelepiped procedure (included only for pedagogic reasons), Minimum Distance pro-cedure, and Maximum Likelihood method. It can be perceived that the maximum change isfrom urbanization. The decadal shift in land use categories have been calculated with the helpof interpolation of satellite data and existing and planned area. These calibrated values ofseven land use categories have been used in modeling grid wise flash flood from urban areas.
Urban flash flood modeling: hydrologic data analysis and calculation of excess rainfall
The resulting raster file of the surface sealing modeling contains information about the perviousand impervious portion of each grid cell. This sub-grid variability has been used to calculatespatially distributed excess rainfall values. Field inventorying and visual interpretation oflarge-scale, ortho-rectified aerial photographs have been considered to map impervious surfaces.
However, as these methods are very time-consuming, satellite imagery obtained from high-resolution sensors like Ikonos and Landsat have been taken as alternatives for producing maps
Figure 5a. LANDSAT 1 Imagery of July 1978 classified for land use.
Asian Geographer 155
Dow
nloa
ded
by [
122.
160.
208.
114]
at 2
2:32
20
Febr
uary
201
2
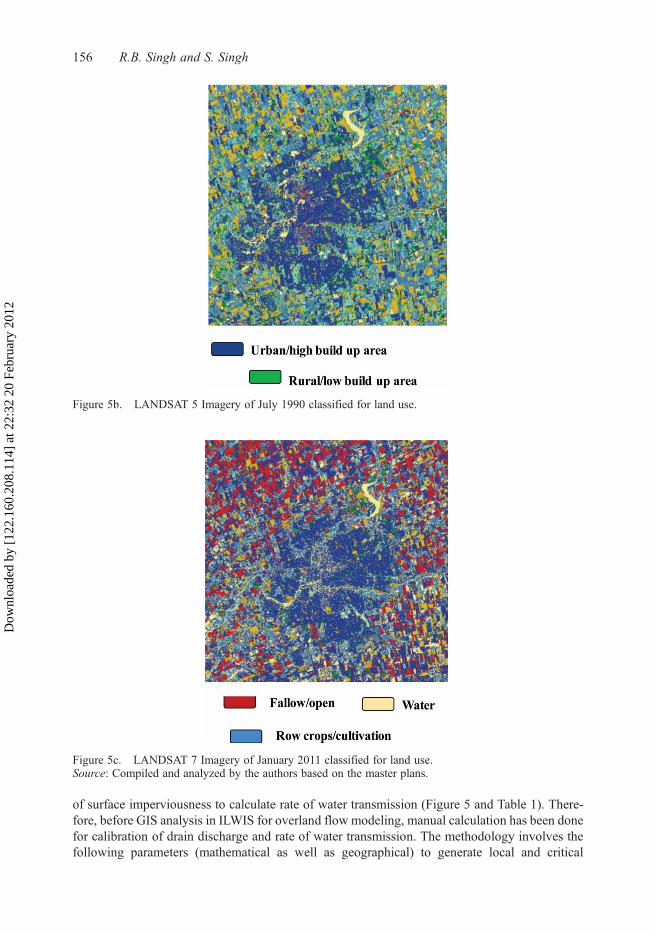
of surface imperviousness to calculate rate of water transmission (Figure 5 and Table 1). There-fore, before GIS analysis in ILWIS for overland flow modeling, manual calculation has been donefor calibration of drain discharge and rate of water transmission. The methodology involves thefollowing parameters (mathematical as well as geographical) to generate local and critical
Figure 5b. LANDSAT 5 Imagery of July 1990 classified for land use.
Figure 5c. LANDSAT 7 Imagery of January 2011 classified for land use.Source: Compiled and analyzed by the authors based on the master plans.
156 R.B. Singh and S. Singh
Dow
nloa
ded
by [
122.
160.
208.
114]
at 2
2:32
20
Febr
uary
201
2
flooding scenarios through calculations and calibrations of drain discharge and runoff in each landuse type across 189 sectors.
Therefore, the first step in finding out the volume of accumulated surface water in 24 hours(local flood) in Noida is expressed in Equation (1) as a rate of water transmission:
K(m/sec) = 1
86400
∗ Water in meters
Time in secondsEquation(1)
(86400= 24*60*60)For calculation of discharge in open channels i.e. in storm water Manning’s Equation (V) and
for drains water discharge, Continuity Equation (Q) formulae (Manning 1890) have been used(Equation 2) to find out the capacity of drains to discharge storm water and coverage ofunpaved surface to reduce runoff:
For storm water discharge, V = (1.486/n) ∗R0.67 ∗ S0.50n
Equation(2)
Where,V = velocity of flow in m/sec.n = dimensionless roughness coefficientR = hydraulic radius in (m) = (cross-sectional area in m2/ wetted perimeter in meter)S= slopeAfter storm water discharge Drain water discharge is also needed to calculate with the help of
the Continuity Equation, Equation (3):
Continuity Equation Qw = A∗V Equation(3)
Where Qw= discharge through drain in m3/secA = cross-sectional area of flow in m2/secV = velocity of flow in m/secThere are two dimensionless roughness coefficient constant used in the fluid mechanics for
example Manning’s n and Kutter n (numerically identical to the Manning’s). The Manning’sequation has a great benefit. It is simple, accurate and of extensive practical use. There exists awealth of publicly available values of n for a very wide range of channels that has been usedto find out overland flow through ILWIS in all 189 sectors.
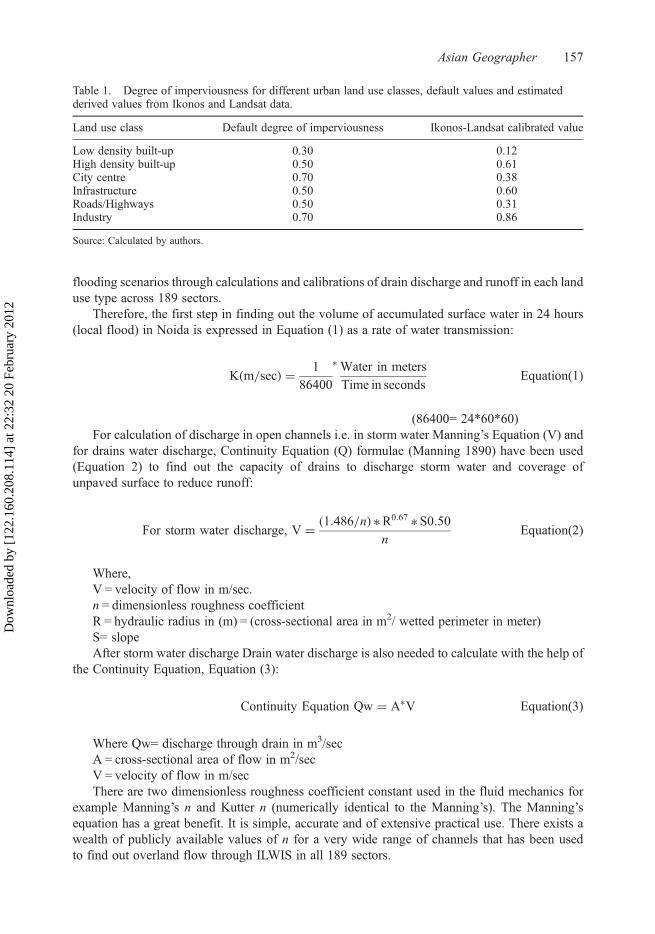
Table 1. Degree of imperviousness for different urban land use classes, default values and estimatedderived values from Ikonos and Landsat data.
Land use class Default degree of imperviousness Ikonos-Landsat calibrated value
Low density built-up 0.30 0.12High density built-up 0.50 0.61City centre 0.70 0.38Infrastructure 0.50 0.60Roads/Highways 0.50 0.31Industry 0.70 0.86
Source: Calculated by authors.
Asian Geographer 157
Dow
nloa
ded
by [
122.
160.
208.
114]
at 2
2:32
20
Febr
uary
201
2
Remote sensing data analysis: overland flow modeling using ILWIS
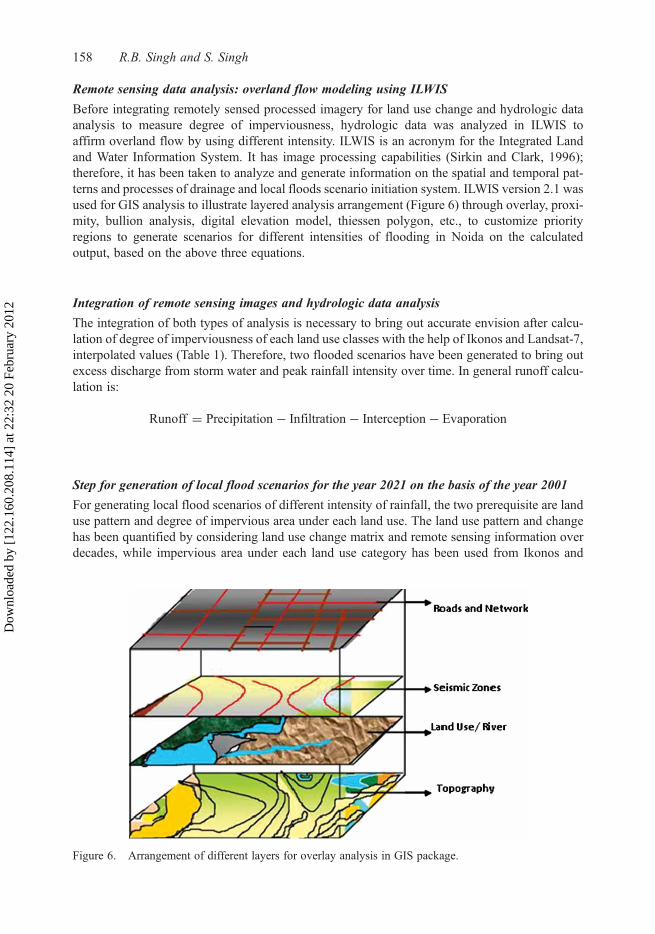
Before integrating remotely sensed processed imagery for land use change and hydrologic dataanalysis to measure degree of imperviousness, hydrologic data was analyzed in ILWIS toaffirm overland flow by using different intensity. ILWIS is an acronym for the Integrated Landand Water Information System. It has image processing capabilities (Sirkin and Clark, 1996);therefore, it has been taken to analyze and generate information on the spatial and temporal pat-terns and processes of drainage and local floods scenario initiation system. ILWIS version 2.1 wasused for GIS analysis to illustrate layered analysis arrangement (Figure 6) through overlay, proxi-mity, bullion analysis, digital elevation model, thiessen polygon, etc., to customize priorityregions to generate scenarios for different intensities of flooding in Noida on the calculatedoutput, based on the above three equations.
Integration of remote sensing images and hydrologic data analysis
The integration of both types of analysis is necessary to bring out accurate envision after calcu-lation of degree of imperviousness of each land use classes with the help of Ikonos and Landsat-7,interpolated values (Table 1). Therefore, two flooded scenarios have been generated to bring outexcess discharge from storm water and peak rainfall intensity over time. In general runoff calcu-lation is:
Runoff = Precipitation− Infiltration − Interception− Evaporation
Step for generation of local flood scenarios for the year 2021 on the basis of the year 2001
For generating local flood scenarios of different intensity of rainfall, the two prerequisite are landuse pattern and degree of impervious area under each land use. The land use pattern and changehas been quantified by considering land use change matrix and remote sensing information overdecades, while impervious area under each land use category has been used from Ikonos and
Figure 6. Arrangement of different layers for overlay analysis in GIS package.
158 R.B. Singh and S. Singh
Dow
nloa
ded
by [
122.
160.
208.
114]
at 2
2:32
20
Febr
uary
201
2
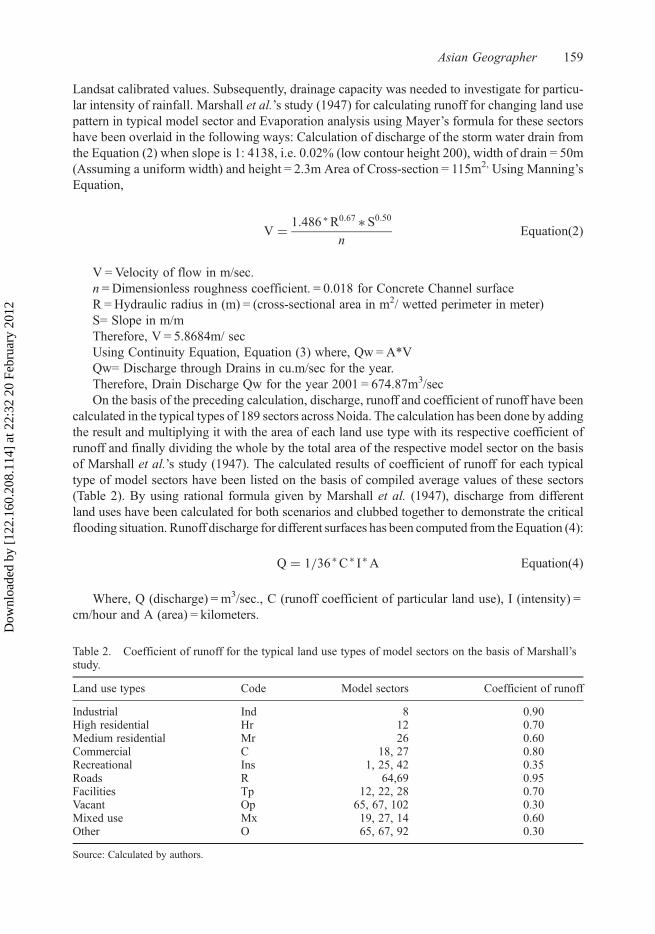
Landsat calibrated values. Subsequently, drainage capacity was needed to investigate for particu-lar intensity of rainfall. Marshall et al.’s study (1947) for calculating runoff for changing land usepattern in typical model sector and Evaporation analysis using Mayer’s formula for these sectorshave been overlaid in the following ways: Calculation of discharge of the storm water drain fromthe Equation (2) when slope is 1: 4138, i.e. 0.02% (low contour height 200), width of drain = 50m(Assuming a uniform width) and height = 2.3m Area of Cross-section = 115m2, Using Manning’sEquation,
V = 1.486 ∗R0.67 ∗ S0.50n
Equation(2)
V = Velocity of flow in m/sec.n = Dimensionless roughness coefficient. = 0.018 for Concrete Channel surfaceR = Hydraulic radius in (m) = (cross-sectional area in m2/ wetted perimeter in meter)S= Slope in m/mTherefore, V = 5.8684m/ secUsing Continuity Equation, Equation (3) where, Qw = A*VQw= Discharge through Drains in cu.m/sec for the year.Therefore, Drain Discharge Qw for the year 2001 = 674.87m3/secOn the basis of the preceding calculation, discharge, runoff and coefficient of runoff have been
calculated in the typical types of 189 sectors across Noida. The calculation has been done by addingthe result and multiplying it with the area of each land use type with its respective coefficient ofrunoff and finally dividing the whole by the total area of the respective model sector on the basisof Marshall et al.’s study (1947). The calculated results of coefficient of runoff for each typicaltype of model sectors have been listed on the basis of compiled average values of these sectors(Table 2). By using rational formula given by Marshall et al. (1947), discharge from differentland uses have been calculated for both scenarios and clubbed together to demonstrate the criticalflooding situation. Runoff discharge for different surfaces has been computed from the Equation (4):
Q = 1/36 ∗C ∗ I ∗A Equation(4)
Where, Q (discharge) = m3/sec., C (runoff coefficient of particular land use), I (intensity) =cm/hour and A (area) = kilometers.
Table 2. Coefficient of runoff for the typical land use types of model sectors on the basis of Marshall’sstudy.
Land use types Code Model sectors Coefficient of runoff
Industrial Ind 8 0.90High residential Hr 12 0.70Medium residential Mr 26 0.60Commercial C 18, 27 0.80Recreational Ins 1, 25, 42 0.35Roads R 64,69 0.95Facilities Tp 12, 22, 28 0.70Vacant Op 65, 67, 102 0.30Mixed use Mx 19, 27, 14 0.60Other O 65, 67, 92 0.30
Source: Calculated by authors.
Asian Geographer 159
Dow
nloa
ded
by [
122.
160.
208.
114]
at 2
2:32
20
Febr
uary
201
2
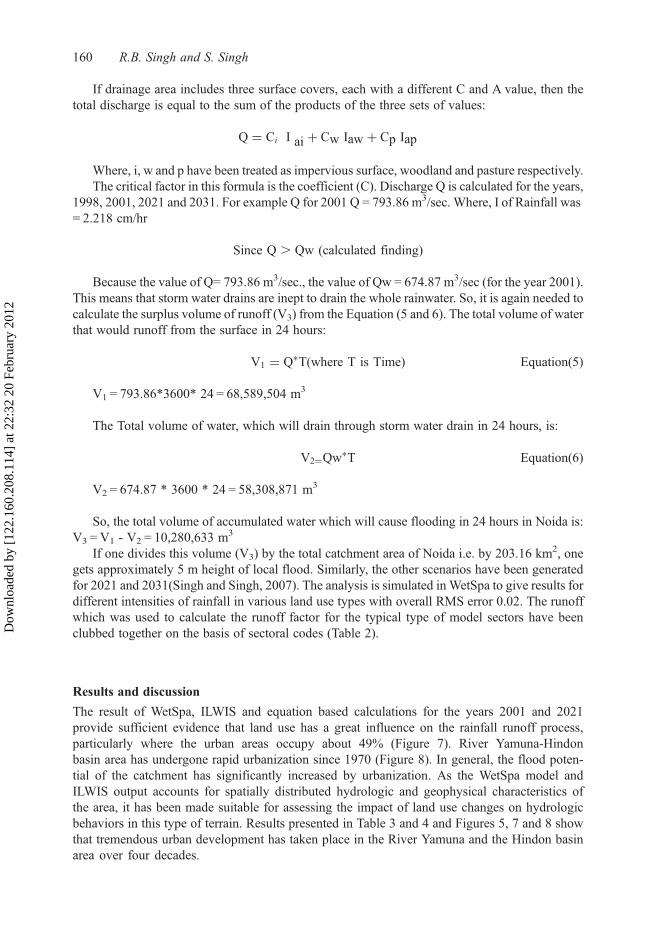
If drainage area includes three surface covers, each with a different C and A value, then thetotal discharge is equal to the sum of the products of the three sets of values:
Q = Ci I ai + Cw Iaw + Cp Iap
Where, i, w and p have been treated as impervious surface, woodland and pasture respectively.The critical factor in this formula is the coefficient (C). Discharge Q is calculated for the years,
1998, 2001, 2021 and 2031. For example Q for 2001 Q = 793.86 m3/sec. Where, I of Rainfall was= 2.218 cm/hr
Since Q . Qw (calculated finding)
Because the value of Q= 793.86 m3/sec., the value of Qw = 674.87 m3/sec (for the year 2001).This means that storm water drains are inept to drain the whole rainwater. So, it is again needed tocalculate the surplus volume of runoff (V3) from the Equation (5 and 6). The total volume of waterthat would runoff from the surface in 24 hours:
V1 = Q∗T(where T is Time) Equation(5)
V1 = 793.86*3600* 24 = 68,589,504 m3
The Total volume of water, which will drain through storm water drain in 24 hours, is:
V2=Qw∗T Equation(6)
V2 = 674.87 * 3600 * 24 = 58,308,871 m3
So, the total volume of accumulated water which will cause flooding in 24 hours in Noida is:V3 = V1 - V2 = 10,280,633 m3
If one divides this volume (V3) by the total catchment area of Noida i.e. by 203.16 km2, onegets approximately 5 m height of local flood. Similarly, the other scenarios have been generatedfor 2021 and 2031(Singh and Singh, 2007). The analysis is simulated in WetSpa to give results fordifferent intensities of rainfall in various land use types with overall RMS error 0.02. The runoffwhich was used to calculate the runoff factor for the typical type of model sectors have beenclubbed together on the basis of sectoral codes (Table 2).
Results and discussion
The result of WetSpa, ILWIS and equation based calculations for the years 2001 and 2021provide sufficient evidence that land use has a great influence on the rainfall runoff process,particularly where the urban areas occupy about 49% (Figure 7). River Yamuna-Hindonbasin area has undergone rapid urbanization since 1970 (Figure 8). In general, the flood poten-tial of the catchment has significantly increased by urbanization. As the WetSpa model andILWIS output accounts for spatially distributed hydrologic and geophysical characteristics ofthe area, it has been made suitable for assessing the impact of land use changes on hydrologicbehaviors in this type of terrain. Results presented in Table 3 and 4 and Figures 5, 7 and 8 showthat tremendous urban development has taken place in the River Yamuna and the Hindon basinarea over four decades.
160 R.B. Singh and S. Singh
Dow
nloa
ded
by [
122.
160.
208.
114]
at 2
2:32
20
Febr
uary
201
2
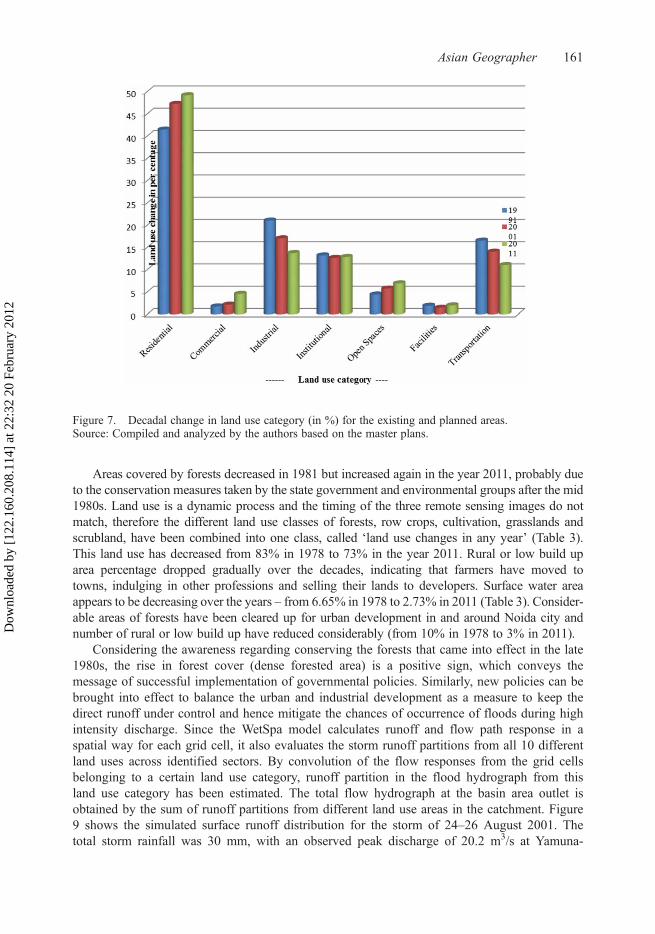
Areas covered by forests decreased in 1981 but increased again in the year 2011, probably dueto the conservation measures taken by the state government and environmental groups after the mid1980s. Land use is a dynamic process and the timing of the three remote sensing images do notmatch, therefore the different land use classes of forests, row crops, cultivation, grasslands andscrubland, have been combined into one class, called ‘land use changes in any year’ (Table 3).This land use has decreased from 83% in 1978 to 73% in the year 2011. Rural or low build uparea percentage dropped gradually over the decades, indicating that farmers have moved totowns, indulging in other professions and selling their lands to developers. Surface water areaappears to be decreasing over the years – from 6.65% in 1978 to 2.73% in 2011 (Table 3). Consider-able areas of forests have been cleared up for urban development in and around Noida city andnumber of rural or low build up have reduced considerably (from 10% in 1978 to 3% in 2011).
Considering the awareness regarding conserving the forests that came into effect in the late1980s, the rise in forest cover (dense forested area) is a positive sign, which conveys themessage of successful implementation of governmental policies. Similarly, new policies can bebrought into effect to balance the urban and industrial development as a measure to keep thedirect runoff under control and hence mitigate the chances of occurrence of floods during highintensity discharge. Since the WetSpa model calculates runoff and flow path response in aspatial way for each grid cell, it also evaluates the storm runoff partitions from all 10 differentland uses across identified sectors. By convolution of the flow responses from the grid cellsbelonging to a certain land use category, runoff partition in the flood hydrograph from thisland use category has been estimated. The total flow hydrograph at the basin area outlet isobtained by the sum of runoff partitions from different land use areas in the catchment. Figure9 shows the simulated surface runoff distribution for the storm of 24–26 August 2001. Thetotal storm rainfall was 30 mm, with an observed peak discharge of 20.2 m3/s at Yamuna-
Figure 7. Decadal change in land use category (in %) for the existing and planned areas.Source: Compiled and analyzed by the authors based on the master plans.
Asian Geographer 161
Dow
nloa
ded
by [
122.
160.
208.
114]
at 2
2:32
20
Febr
uary
201
2
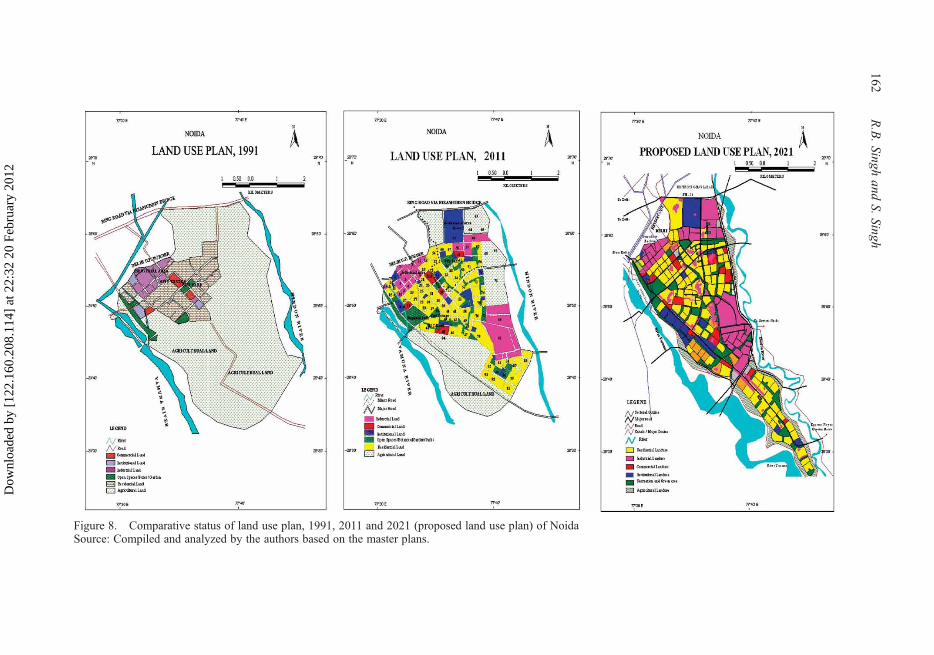
Figure 8. Comparative status of land use plan, 1991, 2011 and 2021 (proposed land use plan) of NoidaSource: Compiled and analyzed by the authors based on the master plans.
162R.B.Singh
andS.
Singh
Dow
nloa
ded
by [
122.
160.
208.
114]
at 2
2:32
20
Febr
uary
201
2
Hindon cut. Due to the very high antecedent soil moisture content of this storm, almost all areascontribute to the storm runoff but with different volumes according to their land use types.
The location of high flow depths are in relatively good accordance to buildings which wereinundated in the 2001 event. The simulation results clearly shows that the danger of local floodingand high surface sealing (e.g. in the inner city) is more. The results revealed that surface runoffmainly follows the streets and accumulates in a depression where several streets meet. The effectof urban development in the last half of the twentieth century on small floods is evident in acrossall 189 sectors. With the exception of an unusually large flood in 1978, 2001 and 2010 they haveincreased by about 30% (from about 118 cubic meters per second in 2001 to about 500 m3/s in2021) while small floods have increased by about 200%. Nonetheless, even a small increase in thepeak discharge of a flood has increased flood damages across sectors (Table 4).
Using the computer-generated output, all 189 sectors of Noida have been divided into zonesof flooding severity. Therefore, the severely affected flooding area where storm flood height ismore than 1 meter, has been identified as zone 3 and the moderate flooding zone (with less thana meter water accumulation) was kept in the category one on the basis of the government norm.
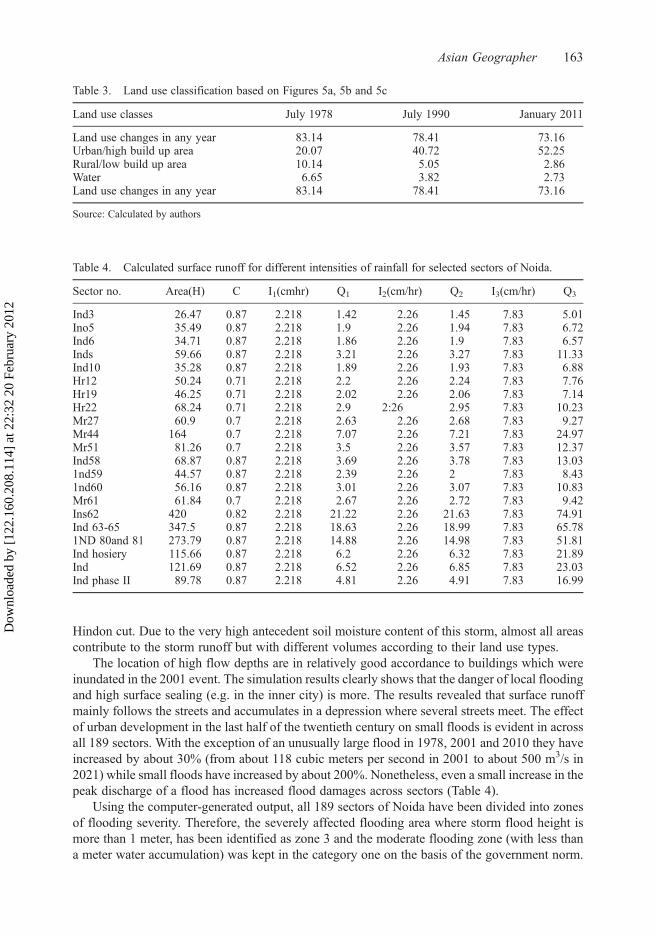
Table 3. Land use classification based on Figures 5a, 5b and 5c
Land use classes July 1978 July 1990 January 2011
Land use changes in any year 83.14 78.41 73.16Urban/high build up area 20.07 40.72 52.25Rural/low build up area 10.14 5.05 2.86Water 6.65 3.82 2.73Land use changes in any year 83.14 78.41 73.16
Source: Calculated by authors
Table 4. Calculated surface runoff for different intensities of rainfall for selected sectors of Noida.
Sector no. Area(H) C I1(cmhr) Q1 I2(cm/hr) Q2 I3(cm/hr) Q3
Ind3 26.47 0.87 2.218 1.42 2.26 1.45 7.83 5.01Ino5 35.49 0.87 2.218 1.9 2.26 1.94 7.83 6.72Ind6 34.71 0.87 2.218 1.86 2.26 1.9 7.83 6.57Inds 59.66 0.87 2.218 3.21 2.26 3.27 7.83 11.33Ind10 35.28 0.87 2.218 1.89 2.26 1.93 7.83 6.88Hr12 50.24 0.71 2.218 2.2 2.26 2.24 7.83 7.76Hr19 46.25 0.71 2.218 2.02 2.26 2.06 7.83 7.14Hr22 68.24 0.71 2.218 2.9 2:26 2.95 7.83 10.23Mr27 60.9 0.7 2.218 2.63 2.26 2.68 7.83 9.27Mr44 164 0.7 2.218 7.07 2.26 7.21 7.83 24.97Mr51 81.26 0.7 2.218 3.5 2.26 3.57 7.83 12.37Ind58 68.87 0.87 2.218 3.69 2.26 3.78 7.83 13.031nd59 44.57 0.87 2.218 2.39 2.26 2 7.83 8.431nd60 56.16 0.87 2.218 3.01 2.26 3.07 7.83 10.83Mr61 61.84 0.7 2.218 2.67 2.26 2.72 7.83 9.42Ins62 420 0.82 2.218 21.22 2.26 21.63 7.83 74.91Ind 63-65 347.5 0.87 2.218 18.63 2.26 18.99 7.83 65.781ND 80and 81 273.79 0.87 2.218 14.88 2.26 14.98 7.83 51.81Ind hosiery 115.66 0.87 2.218 6.2 2.26 6.32 7.83 21.89Ind 121.69 0.87 2.218 6.52 2.26 6.85 7.83 23.03Ind phase II 89.78 0.87 2.218 4.81 2.26 4.91 7.83 16.99
Asian Geographer 163
Dow
nloa
ded
by [
122.
160.
208.
114]
at 2
2:32
20
Febr
uary
201
2
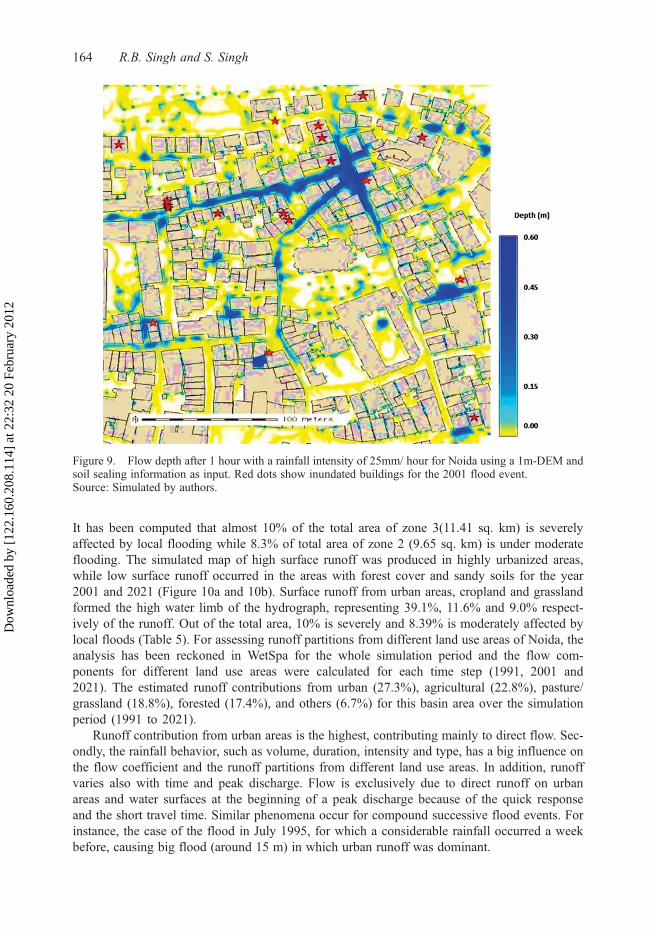
It has been computed that almost 10% of the total area of zone 3(11.41 sq. km) is severelyaffected by local flooding while 8.3% of total area of zone 2 (9.65 sq. km) is under moderateflooding. The simulated map of high surface runoff was produced in highly urbanized areas,while low surface runoff occurred in the areas with forest cover and sandy soils for the year2001 and 2021 (Figure 10a and 10b). Surface runoff from urban areas, cropland and grasslandformed the high water limb of the hydrograph, representing 39.1%, 11.6% and 9.0% respect-ively of the runoff. Out of the total area, 10% is severely and 8.39% is moderately affected bylocal floods (Table 5). For assessing runoff partitions from different land use areas of Noida, theanalysis has been reckoned in WetSpa for the whole simulation period and the flow com-ponents for different land use areas were calculated for each time step (1991, 2001 and2021). The estimated runoff contributions from urban (27.3%), agricultural (22.8%), pasture/grassland (18.8%), forested (17.4%), and others (6.7%) for this basin area over the simulationperiod (1991 to 2021).
Runoff contribution from urban areas is the highest, contributing mainly to direct flow. Sec-ondly, the rainfall behavior, such as volume, duration, intensity and type, has a big influence onthe flow coefficient and the runoff partitions from different land use areas. In addition, runoffvaries also with time and peak discharge. Flow is exclusively due to direct runoff on urbanareas and water surfaces at the beginning of a peak discharge because of the quick responseand the short travel time. Similar phenomena occur for compound successive flood events. Forinstance, the case of the flood in July 1995, for which a considerable rainfall occurred a weekbefore, causing big flood (around 15 m) in which urban runoff was dominant.
Figure 9. Flow depth after 1 hour with a rainfall intensity of 25mm/ hour for Noida using a 1m-DEM andsoil sealing information as input. Red dots show inundated buildings for the 2001 flood event.Source: Simulated by authors.
164 R.B. Singh and S. Singh
Dow
nloa
ded
by [
122.
160.
208.
114]
at 2
2:32
20
Febr
uary
201
2
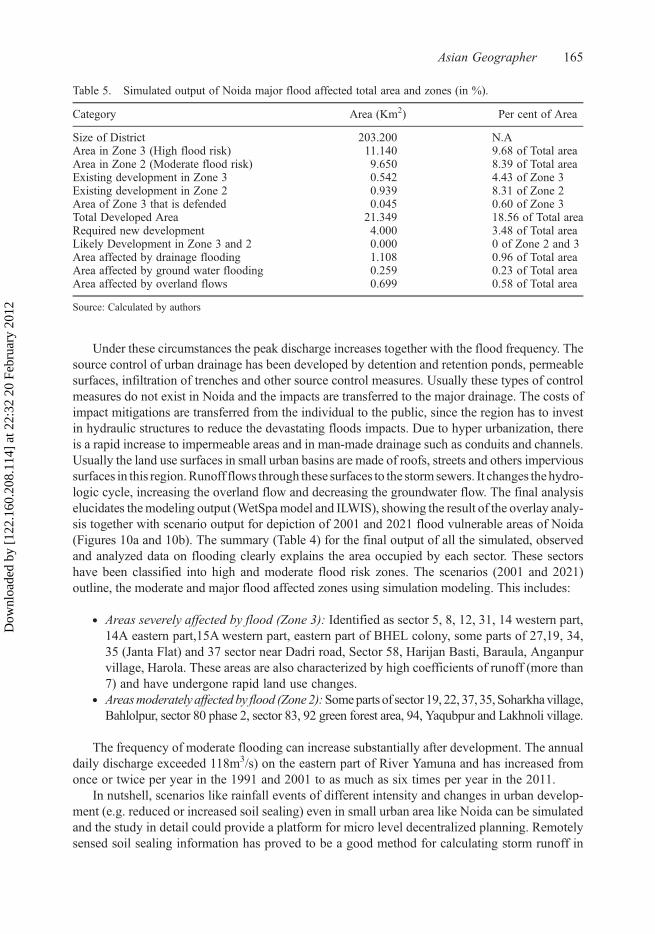
Under these circumstances the peak discharge increases together with the flood frequency. Thesource control of urban drainage has been developed by detention and retention ponds, permeablesurfaces, infiltration of trenches and other source control measures. Usually these types of controlmeasures do not exist in Noida and the impacts are transferred to the major drainage. The costs ofimpact mitigations are transferred from the individual to the public, since the region has to investin hydraulic structures to reduce the devastating floods impacts. Due to hyper urbanization, thereis a rapid increase to impermeable areas and in man-made drainage such as conduits and channels.Usually the land use surfaces in small urban basins are made of roofs, streets and others impervioussurfaces in this region.Runoff flows through these surfaces to the storm sewers. It changes thehydro-logic cycle, increasing the overland flow and decreasing the groundwater flow. The final analysiselucidates themodeling output (WetSpamodel and ILWIS), showing the result of the overlay analy-sis together with scenario output for depiction of 2001 and 2021 flood vulnerable areas of Noida(Figures 10a and 10b). The summary (Table 4) for the final output of all the simulated, observedand analyzed data on flooding clearly explains the area occupied by each sector. These sectorshave been classified into high and moderate flood risk zones. The scenarios (2001 and 2021)outline, the moderate and major flood affected zones using simulation modeling. This includes:
. Areas severely affected by flood (Zone 3): Identified as sector 5, 8, 12, 31, 14 western part,14A eastern part,15A western part, eastern part of BHEL colony, some parts of 27,19, 34,35 (Janta Flat) and 37 sector near Dadri road, Sector 58, Harijan Basti, Baraula, Anganpurvillage, Harola. These areas are also characterized by high coefficients of runoff (more than7) and have undergone rapid land use changes.
. Areasmoderately affectedby flood (Zone2):Someparts of sector 19, 22, 37, 35,Soharkhavillage,Bahlolpur, sector 80 phase 2, sector 83, 92 green forest area, 94, Yaqubpur and Lakhnoli village.
The frequency of moderate flooding can increase substantially after development. The annualdaily discharge exceeded 118m3/s) on the eastern part of River Yamuna and has increased fromonce or twice per year in the 1991 and 2001 to as much as six times per year in the 2011.
In nutshell, scenarios like rainfall events of different intensity and changes in urban develop-ment (e.g. reduced or increased soil sealing) even in small urban area like Noida can be simulatedand the study in detail could provide a platform for micro level decentralized planning. Remotelysensed soil sealing information has proved to be a good method for calculating storm runoff in
Table 5. Simulated output of Noida major flood affected total area and zones (in %).
Category Area (Km2) Per cent of Area
Size of District 203.200 N.AArea in Zone 3 (High flood risk) 11.140 9.68 of Total areaArea in Zone 2 (Moderate flood risk) 9.650 8.39 of Total areaExisting development in Zone 3 0.542 4.43 of Zone 3Existing development in Zone 2 0.939 8.31 of Zone 2Area of Zone 3 that is defended 0.045 0.60 of Zone 3Total Developed Area 21.349 18.56 of Total areaRequired new development 4.000 3.48 of Total areaLikely Development in Zone 3 and 2 0.000 0 of Zone 2 and 3Area affected by drainage flooding 1.108 0.96 of Total areaArea affected by ground water flooding 0.259 0.23 of Total areaArea affected by overland flows 0.699 0.58 of Total area
Source: Calculated by authors
Asian Geographer 165
Dow
nloa
ded
by [
122.
160.
208.
114]
at 2
2:32
20
Febr
uary
201
2
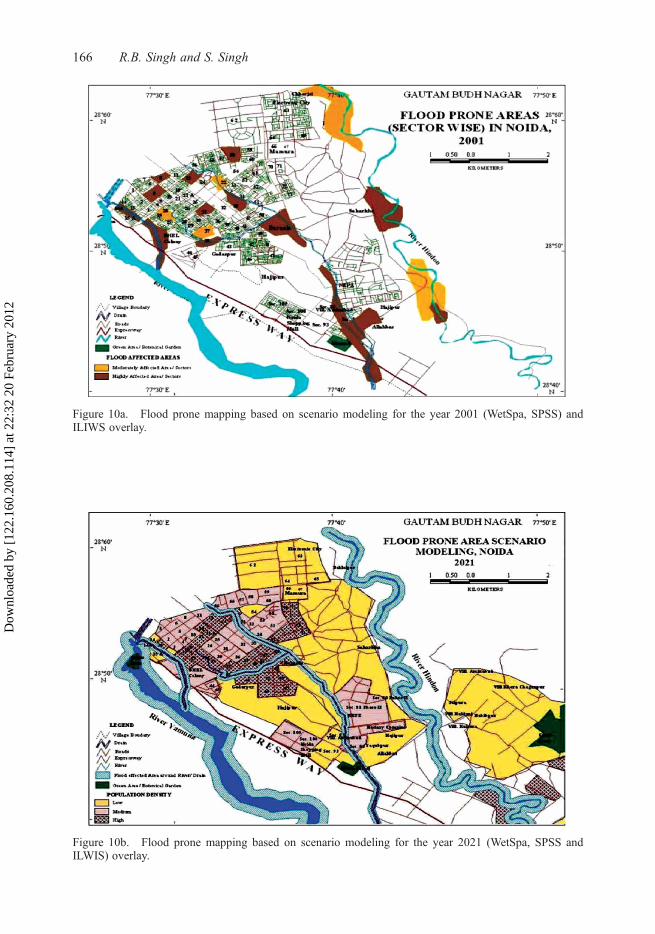
Figure 10a. Flood prone mapping based on scenario modeling for the year 2001 (WetSpa, SPSS) andILIWS overlay.
Figure 10b. Flood prone mapping based on scenario modeling for the year 2021 (WetSpa, SPSS andILWIS) overlay.
166 R.B. Singh and S. Singh
Dow
nloa
ded
by [
122.
160.
208.
114]
at 2
2:32
20
Febr
uary
201
2
particular urban area. To further improve the model, a simplified method could be incorporated toaccount for losses of surface flow into this urban drainage system. As an alternative, it could becoupled with a sewage model that would be able to simulate outflow from the sewage system.
Conclusion
The exercised methodology aims to offer a new approach to land use based flood assessment.Combined with existing information about land use and flood depth, maps of the flooded areasprovide important information that can be used for flood damage assessments in any microurban unit. The results show the capability of remote sensing to provide multi-scale and multitemporal products at micro level flood forecasting and monitoring. A synoptic overview showsassessment of potentially flood prone zone on DEM and spatial pattern of urbanization overtime is increasing. Furthermore, the past and simulated flood events have been mapped and over-laid with geometric details to fill the knowledge gap between the stakeholder’s data requirementsand operation processes. The integrated methodological framework, which combines WetSpaanalysis, remote sensing and GIS together with conventional techniques (Manning’s and Mar-shall’s) selected for this study, has a great benefit due to its simplicity, accuracy and long extensivepractical use. The study has direct implications for policy formulation for land use planning andsustainable urban development.
In the coming years, the core of Noida city appears destined to expand into the major flood-plain of the Yamuna and the Hindon River basins. This expanded core, having proximity to theexisting metropolitan core (Delhi), will have to cope with increasing flood risk, arising largelyfrom growth of economic activity on vulnerable lands or perhaps from growing flood frequencies.If flood scenario and economic trends continue and accelerate, then major land use dislocationswould be required in the city region to create a broader floodway for the Yamuna and the HindonRivers, although the timing and extent of such dislocations remain uncertain. It is estimated thatNoida cannot sustain rainfall intensity in excess of 1.885 centimeters per hour, or surface runoffcoefficient more than 0.53. However, it is already experiencing these threatening conditions andposing a constant danger to its surroundings. As the simulation for 2021 suggests, if the futurerainfall intensity is more than 2.26 then entire industrial and urban centers of Noida would beinundated under 6.8 meters of flood water. Over the past two decades, Noida has become anincreasingly urban society. The changes in land use associated with urban development affectflooding in many ways, such as removing vegetation and soil, grading the land surface and con-structing drainage networks, increase runoff to streams from rainfall, etc. As a result, the peakdischarge, volume, and frequency of floods have increased in five nearby streams. Changes tostream channels during urban development can limit their capacity to convey floodwaters.Roads and buildings constructed in flood-prone areas (severely flood affected areas) areexposed to increased flood hazards, including inundation and erosion, as new development con-tinues. Information about stream flow and how it is affected by land use can help communities toreduce their current and future vulnerability to floods. Conventionally, flood emergency manage-ment in the area; both public and private usually responds to crisis rather than being concernedwith the broader issues of vulnerability and its mitigation. Therefore, the study may offer anew orientation for launching future research on remote sensing technology in understandingthe development pattern and its effect on the hydrology of the area together with the sustainableurban governance, opportunities for innovative urban strategies and challenges to mitigate theexisting institutional constraints. It is a high time to change the existing system so that theother alternatives for mitigation of flood damages and planned land use could be explored, pro-posed and implemented. The future is promising with the new generation of very high-resolutionsatellites like IKONOS, QUICKBIRD and many more in the coming future.
Asian Geographer 167
Dow
nloa
ded
by [
122.
160.
208.
114]
at 2
2:32
20
Febr
uary
201
2
AcknowledgementsThe authors are thankful to the Noida Development Authority, the Indian Meteorological Division (Pune)and the School of Planning and Architecture, Delhi, India, for providing guidelines as well as the basic infor-mation to carry out this research work. The authors also wish to thank all the members of the National Insti-tute of Disaster Management (NIDM) Delhi, India for their help and providing other inputs at various levels.
ReferencesArnold, C.A. and Gibbons, C.J., 1996. Impervious surface coverage: the emergence of a key urban environ-
mental indicator. Journal of the American Planning Association, 62, 243–258.Bachofer, F., Esch, T., and Klein, D., 2009. Ableitung von versiegelungsgraden basierend auf
hochaufgelösten fernerkundungsdaten mittels support vector machines (Derivation of soil sealing infor-mation from high resolution remote sensing data by application of support vector machines).Angewandte Geoinformatik, 32, 432–441.
Bahremand, A. DeSmedt, F. Corluy, J., and Liu, Y.B., 2007. WetSpa model application for assessing refor-estation impacts on floods in Margecany-Hornad watershed, Slovakia.Water Resource Management, 21,1373–1391.
Banasik, K. and Pham, N., 2010. Modeling of the effects of land use changes on flood hydrograph in a smallcatchment of the Płaskowicka, southern part of Warsaw, Poland. Annals of Warsaw University of LifeSciences. Land Reclamation, 42 (2), 229–240.
Behera, S. and Panda, R.K., 2006. Evaluation of management alternatives for an agricultural watershed in asub-humid subtropical region using a physical process based model. Agriculture, Ecosystems andEnvironment, 113, 62–72.
Bhandari, L., 2006. The city skyline of India 2006. New Delhi: Indicus Analytics Private Limited.Biftu, G.F. and Gan, T.Y., 2001. Semi-distributed, physically based, hydrologic modeling of the Paddle River
basin, Alberta, using remotely sensed data. Journal of Hydrology, 244, 137–156.Borah, D.K., Xia, R., and Bera, M., 2002. A dynamic watershed simulation model. In: V.P. Singh and D.K.
Freyert, eds. Mathematical models of small watershed hydrology and applications. Colorado: WaterResources Publications, 113--166.
Brivio, P.A., Colombo, R., Maggi, M., and Tomasoni, R., 2002. Integration of remote sensing data and GISfor accurate mapping of flooded areas. International Journal of Remote Sensing, 23, 429–441.
Census of India, 1981. Rural-urban distribution. New Delhi: Office of the Registrar General and CensusCommissioner.
Chen, J.M., Chen, X., Ju, W., and Geng, X., 2005. Distributed hydrologic model for mapping evapotran-spiration using remote sensing inputs. Journal of Hydrology, 305, 15–39.
Chormański, J. Mirosław-Świątek, D., and Okruszko, T., 2004. Remote sensing limitation in flood modelingverification in wetlands. In: J. Kubrak, T. Okruszko and S. Ignar, eds. Model application for wetlandshydrology and hydraulics. Warsaw: Warsaw Agricultural Press, 51--72.
Das, S. and Kant, S., 1980. Noida regional setting, survey and analysis of New Okhla IndustrialDevelopment Area: a report on the regional aspects. New Delhi: School of Planning and Architecture.
DeSmedt, F., Liu, Y.B., and Gebremeskel, S., 2000. Hydrologic modeling on a catchment scale using GISand remote sensed land use information. In: C.A. Brebbia, ed. Risk analysis II. Southampton: WTI Press,295--304.
Esch, T., Conrad, C., Schorcht, G., Thiel, M., Wehrmann, T., and Dech, S., 2008. Model-based estimation ofimpervious surface by application of support vector machines. In: Proceedings of ISPRS 2008 Congress,3–11 July Beijing 41--45.
Ewen, J., Parkin, G., and O’ Connell, P.E., 2000. Distributed river basin flow and transport modeling system.Journal of Hydrologic Engineering, 5, 250–258.
Fortin, J.P., Turcotte, R., Massicotte, S., Moussa, R., Fitzback, J., and Villeneuve, J.P., 2001. A distributedwatershed model compatible with remote sensing and GIS data: description of the model. Journal ofHydrologic Engineering, 6 (2), 91–99.
Government of India, 1990.Master Plan for Delhi: the gazette of India extraordinary, part ii, section 3. NewDelhi: Union Ministry of Urban Affairs and Employment.
Gupta, M., 2000. GIS approach to land use planning: a case study of Noida. Thesis (B.Plan). School ofPlanning and Architecture, New Delhi.
168 R.B. Singh and S. Singh
Dow
nloa
ded
by [
122.
160.
208.
114]
at 2
2:32
20
Febr
uary
201
2
Hardison, E.C., Michael, A., John, P.D., Robert, J.H., and Mark, M.B., 2009. Urban land use, channelincision, and riparian water table decline along inner coastal plain streams, North Carolina. Journalof American Water Resource Association, 45 (4), 1032–1046.
Indian Meteorological Department, 2001. Climatological tables for (1931–1999). Pune: IndianMeteorological Department.
Indian Meteorological Department, 2001. Past flood on Yamuna basin. New Delhi: Indian MeteorologicalDepartment.
Islam, M. and Sado, K., 2002. Development priority map for flood counter measures by remote sensing datawith geographic information system. Journal of Hydrologic Engineering, 7, 346–355.
Julien, P.Y., Saghafian, B., and Ogden, F.L., 1995. Raster-based hydrologic modeling of spatially variedsurface runoff. Water Resources Bulletin, 31 (3), 523–536.
King, C., Lecomte, V., Le Bissonnais, Y., Baghdadi, N., Souchère, V., and Cerdan, O., 2005. Remote sensingdata as an alternative input for the stream runoff model. Journal of Hydrology, 62, 125–135.
Lahiri-Dutt, K., 2001. Growth and occupational structures of million cities of India. Asian Geographer,20 (1–2), 153–167.
Liu, Y.B., Batelaan, O., DeSmedt, F., Poorova, J., and Velcicka, L., 2005. Automated calibration applied to aGIS based flood simulation model using PEST. In: J. Van Alphen, E. Van Beek and M. Taal, eds. Floods,from defence to management. London: Taylor and Francis Group, 317--326.
Liu, Y.B., DeSmedt, F., and Pfister, L., 2002. Flood prediction with the WetSpa model on catchment scale.In: Wu, et al., eds. Flood defense. New York: Science Press, 499--507.
Liu, Y.B., Gebremeskel, S., Smedt, F., De Hoffmann, L., and Pfister, L., 2003. A diffusive transport approachfor flow routing in GIS-based flood modeling. Journal of Hydrology, 283, 91–106.
Manning, R., 1890. Flow of water in open channels and pipes. Transactions of the Institution of CivilEngineers of Ireland, 20, 443–449.
Marshall, J.S., Langille, R.C., and Palmer, W., 1947. Measurement of rainfall by radar. Journal ofMeteorology, 4, 186–192.
Misra, H.N. and Chapman, G.P., 1991. Patterns of growth in India’s class I cities. Geoforum, 22 (3),271–286.
NCRPB, 2011. Delhi 2010: a fact sheet. New Delhi: National Capital Region Planning Board.New Okhla Industrial Development Authority, 1998. Master plan for NOIDA-2001. Delhi.New Okhla Industrial Development Authority, 2004. Master plan for NOIDA-2011. Delhi.Olivera, F. and Maidment, D., 1999. Geographic information systems (GIS) based spatially distributed
model for runoff routing. Water Resources Research, 35 (4), 1155–1164.Quinn, P., Beven, K., Chevallier, P., and Planchon, O., 1991. The prediction of hillslope flow paths for dis-
tributed hydrologic modeling using digital terrain models. Hydrological Processes, 5, 59–79.Roy, S., Singh, R.B., and Kumar, M., 2011. An analysis of local spatial temperature patterns in the Delhi
metropolital area. Physical Geography, 32 (2), 114–138.Shaw, A., ed., 2007. Indian cities in transition. Chennai: Orient Longman.Singh, R.B. and Singh, S., 2007. Challenges of flood disaster management: a case study of Noida: a GIS
approach. In: J. Singh, ed. Disaster management: future challenges and opportunities. New Delhi:IKM Publications, 95--112.
Sirkin, M. and Clarke, G., 1996. Intelligent GIS - location decisions and strategic planning. Cambridge:Geo-information International.
Town and Country Planning Organisation of Uttar Pradesh, 1992. Sub-regional plan 2001: UP sub-regionand National Capital Region. Lucknow: Town and Country Planning Department of Uttar Pradesh.
Van Der Sande, C.J., De Jong, S.M., and De Roo, A.P.J., 2003. A segmentation and classification approachof IKONOS-2 imagery for land cover mapping to assist flood risk and flood damage assessment.International Journal of Applied Earth Observation and Geoinformation, 4, 217–229.
Wang, Z., Batelaan, O., and DeSmedt, F., 1996. A distributed model for water and energy transfer betweensoil, plants and atmosphere (WetSpa). Physics and Chemistry of the Earth, 21 (3), 189–193.
Zheng, N., Tachikawa, N., and Takara, K., 2008. A simplified flood inundation model integrating with rain-fall-runoff processes using globally available topographic data. Annual Journal of HydraulicEngineering, 52, 61–66.
Asian Geographer 169
Dow
nloa
ded
by [
122.
160.
208.
114]
at 2
2:32
20
Febr
uary
201
2
![Flood Discharge Changes by Urbanization from …evaluated by unit graph changes by urbanization [5] [6]. After the Kadoyas report, we searched about sixteen repor’ ts by urbanization](https://img.pdfslide.net/doc/110x75/5f3e20aa17e9bb52ce543c52/flood-discharge-changes-by-urbanization-from-evaluated-by-unit-graph-changes-by.jpg)