Embed Size (px)
Citation preview

349
Clinical Chemistry 42:3349-355 (1996) t4lecular PathoIo�y
Rapid diagnosis of homocystinuria and otherhypermethioninemias from newborns’ blood spots
by tandem mass spectrometryDONALD H. CIi�cE,I* STEVEN L. HILLMAN,1 DAVID S. MILLINGTON,1 STEPHEN G. KAHLER,1
BARBARA W. ADAM,2 and HARVEY L. LEVY3
We report a new method for the diagnosis of homocystin-
uria and other hypermethioninemias from dried blood spots
on newborn screening cards, based on isotope-dilution
tandem mass spectrometry. The mean concentration of
methionine in 909 unaffected newborns was 19 �mol/L
(CV 44%). The variability of results was reduced when the
concentration of methionine was expressed relative to that
of another amino acid in the same specimen. The mean
ratio of methionine to leucine plus isoleucine for these
same newborn blood spots was 0.16 (CV 25%). In newborn
samples from a collection categorized by a Guthrie bacterial
inhibition assay as true positive, unaffected, or falsely pos-
itive for hypermethioninemias, the ratio of methionine to
leucine for each true-positive specimen was at least 2.5
times greater than for respective age-matched unaffected
blood specimens. The ratio for falsely positive samples didnot differ from that for unaffected blood samples. We
predict that the ratio of methionine to leucine plus isoleu-
cine determined by tandem mass spectrometry will success-
fully detect hypermethiomnemias with very low rates for
false positives and false negatives.
��DEXIN� ThRMS: pediatric chemistry . heritable disorders
screening, metabolic
-ugh blood concentrations of methionine are found in two
nherited amino acid metabolic disorders: isolated hypermethi-
Mass Spectrometry Facility, Department of Pediatrics, Division of Biochem-cal Genetics, Duke University Medical Center, Box 14991, Research Triangle
ark, NC 27709.2 Newborn Screening Quality Assurance Laboratory, Division of Environ-
ental Health Laboratory Sciences, National Center for Environmental Health,enters for Disease Control and Prevention, Atlanta, GA 30341.
New England Regional Newborn Screening Program, State Laboratory
stirute, 305 South St., Boston, MA 02130.
* Author for correspondence. Fax 919-549-0709, e-mail dhchace@
pub.duke.edu.
Received September 21, 1995; accepted December 7, 1995.
oninemia and homocystinuria due to cystathionine 13-synthase
(EC 4.2.1.22) deficiency [1]. In isolated hypermethioninemia,
the degradation of methionine is reduced, at least in some cases,
by a deficiency of methionine adenosyltransferase (EC 2.5.1.6).
Individuals with isolated hypermethionmnemia have been normal
or, in a few instances, have had reduced cognitive function [2]. In
homocystinuria due to cystathionmne 13-synthase deficiency, the
hypermethionmnemia comes from overproduction of the homo-
cysteine that accumulates in persons with this disease. Primary
symptoms of this disorder include dislocation of the ocular lens
(ectopia lentis), mental retardation, neurological disturbances,
and skeletal defects. Presymptomatic diagnosis, usually through
newborn screening, followed by dietary restriction of methio-
nine and supplementation with cystine or simply treatment with
pyridoxine (vitamin B6) for those who are pyridoxine responsive,
has greatly improved the outcome of affected infants [1].
Newborn screening for both isolated hypermethioninemia
and homocystinuria is accomplished by analyzing methionine in
the dried blood spots collected routinely on filter paper. The
Guthrie bacterial inhibition assay is the semiquantitative
method used for this purpose [3]. Concentrations of methionine
>67 �.�mol/L (10 mg/L) are considered abnormal in some
laboratories, whereas other laboratories use a cutoff methionine
concentration of >134 p.mol/L (20 mg/L) [4]. With lower
protein intake because of increased breast feeding by neonates
[5] and with earlier newborn specimen collection because of
early hospital discharge [6], methionine concentrations in af-
fected neonates are likely to be only very slightly increased,
perhaps just above the 40 �mol/L (6 mg/L) concentration
considered the upper limit of normal for this amino acid in
plasma. Thus, false-negative results, already a recognized prob-
lem when newborn screening for homocystinuria is performed
by bacterial assay [6], will likely increase. Furthermore, the
number of false-positive results in the bacterial assay for methi-
onine is substantial.
We have developed a tandem mass spectrolnetric (MS-MS)
method for the analysis of methionine from dried blood spots in
a single test that also detects several other amino acids. Prey-

350 Chace et al.: MS-MS of homocystine in blood spots
ously, we validated this methodology for newborn screening of
phenylketonuria and tyrosinemia by measuring phenylalanine
and tyrosine, respectively /7], and for maple syrup urine disease
screening by measuring leucine/isoleucine and valine [8]. The
MS-MS method can now simultaneously measure methionine
and several other amino acids and acylcarniunes [9, 10] in one
test. Thus, the information for disease-specific quantitative
diagnostic components increasingly required for screening can
be efficiently obtained by the MS-MS method. Because of the
high selectivity and sensitivity of MS-MS, the frequency of
false-positive and false-negative results in measurements of
disease-specific metabolites is minimized. With further valida-
tion, the use of MS-MS should expand to allow for the detection
of many other disorders of newborns in a rapid and cost-
effective manner. Here, we describe our experiences with this
method for analyzing methionine in dried blood specimens from
newborns.
Matenals and Methods
SOLVENTS, REAGENTS, AND INTERNAL STANDARDS
High-purity methanol was obtained from Burdick and Jackson
(Muskegon, MI). Glycerol, sodium octyl sulfate, and methionine
were obtained from Sigma (St. Louis, MO). Butanolic-HCI
(3 mol/L) was obtained from Regis (Morton Grove, IL).
For internal standards we used stable isotopes obtained from
Cambridge Isotopes (Andover, MA); these included
‘3C� Iglycine, [2H4]alanine, [2H8]valine, [2H3jleucine,
[2H3]methionine, [2H5]phenylalanine, [2H4]tyrosine, and
[2H�]glutamate.
BLOOD SPECIMEN COLLECTION
The specimens tested consisted of the following: >16 000 driedblood spots from the North Carolina Division of Laboratory
Services Newborn Screening Program; a collection of blood
spots from newborns from the New England Regional Newborn
Screening Program (NERNSP); and a collection of blood spots
from the Newborn Screening Quality Assurance Laboratory,
National Center for Environmental Health, Centers for Disease
Control and Prevention (CDC), which was included as part of a
study on the extraction efficiency for methionine. The speci-
mens from the NERNSP had been previously analyzed by the
bacterial inhibition assay and stored at room temperature. They
were from infants categorized as unaffected, confirmed to have
either homocystinuria or isolated hypermethioninemia, or
falsely positive for hypermethioninemia. Each NERNSP spec-
imen from an affected infant was accompanied by two control
specimens matched for birth date and length of storage. The
specimens were sent to Duke University Medical Center for
blinded analysis. The specimen set from the CDC was prepared
by enriching specimens of whole blood with predetermined
concentrations of methionine and spotting them onto filter
paper. All specimens from the North Carolina Newborn
Screening Program, the NERNSP, and the CDC were collected
or prepared on S&S Grade 903 filter paper (Schleicher and
Schuell, Keene, NH).
SAMPLE PREPARATION
The semiautomated preparation of butyl ester derivatives of
amino acids from blood spots consists of a simple solvent
extraction and derivatization procedure that takes -2.5 h for a
batch of 60 samples. Two 3/16-in. (-4.8 mm)-diameter dots
were punched from a 1/2-in. (-12.7 mm)-diameter dried blood
spot into a 0.6-mL conical plastic vial. These two punched blood
dots are equivalent to 15.2 j�L of whole blood [11]. A methanol
stock solution of internal standards was prepared, containing 2.5
Mmol/L each of [2H4]alanine, [2H8]valine, [2H3]leucine,[2H1]methionine, [2H5}phenylalanine, [2H4}tyrosine, and
[2H3lglutamate and 12.5 p.moVL [‘5N1,’3C1]glycine. A Model
222 sample changer (Gilson Instruments, Middleton, ‘Wi) was
used to add 400 �L of this stock solution to each vial in the
60-sample rack. The sample rack was placed on an orbital shaker
for 30 mm. The sample changer then transferred the supernates
to corresponding 1 -mL flat-bottom vials in another rack, where
the samples were evaporated to dryness at 50 #{176}Cunder a gentle
stream of nitrogen with a custom-designed warm air incubator
(Grey Line Engineering, Churchton, MD). The sample changer
was then used to add 50 j�L of 3 moVL HCI in n-butanol to each
vial. The 60 vials contained in the rack were sealed with a bilayer
cover made from a sheet of septum material (bottom layer) and
a steel weight (top layer), placed in a forced-air oven, and
incubated at 65 #{176}Cfor 15 mm. After removal of the bilayer
cover, the vials containing the samples were placed in the warm
air incubator, and excess HCI-butanol was evaporated to dryness
under dry nitrogen. These derivatized samples were reconsti-
tuted with 35 �tL of an equivolume methanol:glycerol solution
containing sodium octyl sulfate, 1 g/L, and the vials were sealed
with Teflon-lined caps. The samples were then ready for
analysis by MS-MS.
To estimate the linearity of this assay, we enriched 200-�L
aliquots of whole blood from a single donor with 0, 2, 5, 10, 20,
50, and 100 nmol of added methionine. These samples were
spotted onto filter paper and dried overnight. To estimate
recovery (extraction efficiency) of methionine from blood spots,
we prepared two sets of four 1 .0-mL aliquots per set from a
single donor pool and enriched them with 0, 50, 100, and 200
nmol of added methionine. One set of samples was spotted onto
filter paper and dried overnight. These samples were then
prepared for analysis by the extraction and derivatizauon pro-
cedure described above. To the second set of samples we added
80 nmol of [2H3]methionine per aliquot and mixed well. These
whole-blood samples were spotted onto filter paper, drie
overnight, and extracted with pure methanol containing n
internal standards; the remainder of the sample preparatio
procedure was as described above.
Instrument variability was measured by performing 10 rep
licate injections of the singly derivatized product of one sample
Assay variability was measured by performing analyses of 1
control samples prepared from the same blood on one da
(intraday variability) and over a period of several weeks (interda
variability). At the CDC, a set of 11 methionine-enriched drieblood specimens was prepared from a single batch of whol
blood that had been frozen to lyse the erythrocytes. Methionin
enrichments of the specimens in this set ranged from 0 to 67
206
Product Ions of m/z 206
56 10461
41
101
5)a)t� 500
a)>a
c
101
CoCa)C
C 500
aII)
[-102)
40 60 60 100Mass
206
120 140/ Charge
i�0 180 200
Neutral Loss of 102
260 zeu suu
H
Clinical Chemistry 42, No. 3, 1996 351
�.tmol/L (0-100 mgfL blood). These samples were prepared as
described above.
MASS SPECTROMETRY
A VG Quattro triple-quadrupole tandem mass spectrometer
with Lab-base data system (Fisons Instruments, Danvers, MA)
was used and operated in the static liquid secondary ionization
mode. This mode incorporates an ion source containing a
cesium ion gun operating at 10 keV and a manually operated
insertion probe. Positively charged molecules are detected after
their separation in the first mass analyzer region (MSI) and in
the final mass analyzer region (MS2). An intermediate quadru-
pole located between the first and third quadrupole is used as the
collision region into which argon gas is introduced.
Tuning of the instrument is optimized by using a solution
containing deuterium-labeled standards prepared as butyl esters
as described previously [7, 8/. Product ion scans were produced
by focusing MS1 on the molecular mass (M + H)� of the butylester of methionine (m/z 206), whereas MS2 was used to scan
product ions between m/z 25 and m/z 215. The mass spectrum
obtained showed the fragmentation for each molecular ion of
methionine. Neutral loss scans of 102 Da were produced by
scanning MS1 from m/z 125 to m/z 300 while simultaneously
scanning MS2 at a mass range 102 Da lower, m/z 23 and m/z
198. This resulted in a spectrum of product ions corresponding
to (M + H - l02)�.
Quantification of methionine is achieved by converting the
ion abundance ratios of methionine:[2H3]methionine (m/z 206:
209) to the concentrations of methionine by reference to a
calibration curve. The calibration curve was generated from the
analyses of blood spots containing serially added known concen-
trations of methionine.
ResuttsANALYSIS OF METHIONINE BY MS-MS
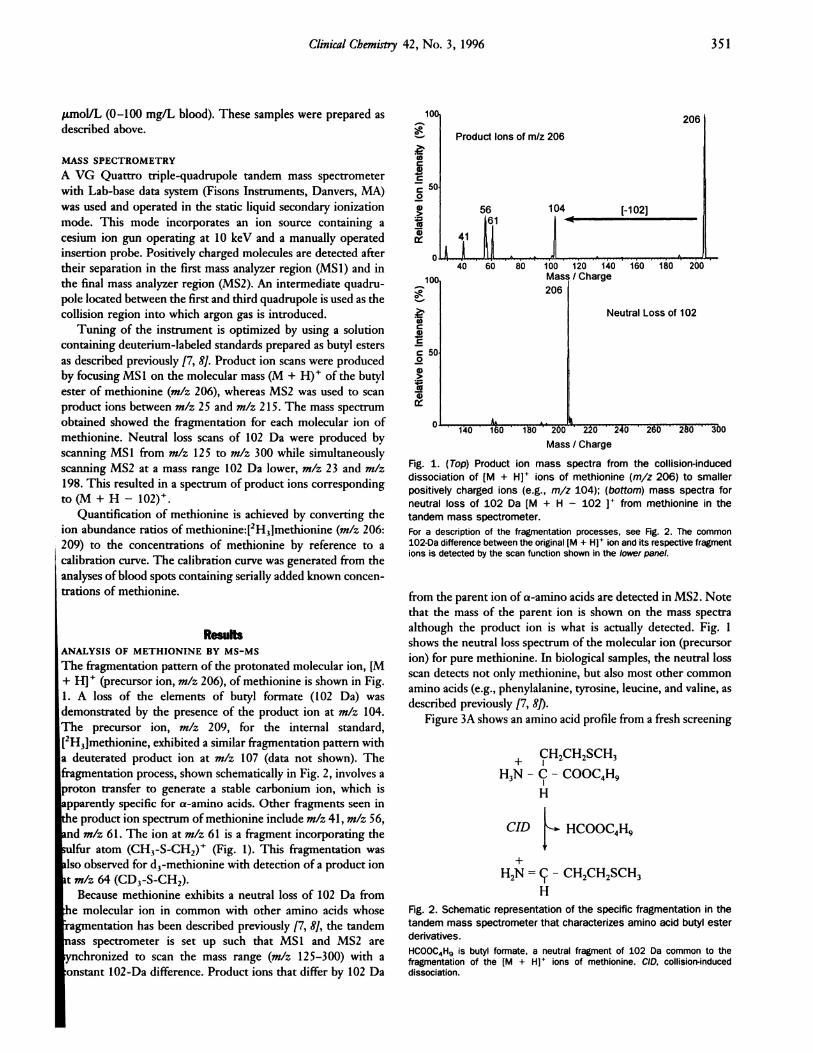
The fragmentation pattern of the protonated molecular ion, [M
+ H1� (precursor ion, m/z 206), of methionine is shown in Fig.
1. A loss of the elements of butyl formate (102 Da) was
demonstrated by the presence of the product ion at mIx 104.
The precursor ion, mlz 209, for the internal standard,
[2H3]methionine, exhibited a similar fragmentation pattern with
a deuterated product ion at m/z 107 (data not shown). The
fragmentation process, shown schematically in Fig. 2, involves a
proton transfer to generate a stable carbonium ion, which is
apparently specific for a-amino acids. Other fragments seen in
the product ion spectrum of methionine include mIx 41, mIx 56,
md m/z 61. The ion at mIx 61 is a fragment incorporating the
ulfur atom (CH3-S-CH2)� (Fig. 1). This fragmentation was
iso observed for d�-methionine with detection of a product ion
t mlz 64 (CD3-S-CH2).
Because methionine exhibits a neutral loss of 102 Da from
hie molecular ion in common with other amino acids whose
agmentation has been described previously [7, 8], the tandem
‘iass spectrometer is set up such that MS1 and MS2 are
ynchronized to scan the mass range (mIx 125-300) with a
onstant 102-Da difference. Product ions that differ by 102 Da
140 160 160 200 22U 240
Mass / Charge
Fig. 1. (Top) Product ion mass spectra from the collision-induceddissociation of [M + Hl� ions of methionine (m/z 206) to smallerpositively charged ions (e.g., m/z 104); (bottom) mass spectra for
neutral loss of 102 Da [M + H -102 1 from methionine in the
tandem mass spectrometer.For a description of the fragmentation processes, see Fig. 2. The common102-Da difference between the original IM + H]� ion and its respective fragmentions is detected by the scan function shown in the lower panel.
from the parent ion of a-amino acids are detected in MS2. Note
that the mass of the parent ion is shown on the mass spectra
although the product ion is what is actually detected. Fig. 1
shows the neutral loss spectrum of the molecular ion (precursor
ion) for pure methionine. In biological samples, the neutral loss
scan detects not only methionine, but also most other common
amino acids (e.g., phenylalanine, tyrosine, leucine, and valine, as
described previously [7, 8]).
Figure 3A shows an amino acid profile from a fresh screening
+ CH2CH2SCH3H3N - C - COOC4H9
CID HCOOC4H9
+
H2N = #{231}-CH2CH2SCH3
H
Fig. 2. Schematic representation of the specific fragmentation in the
tandem mass spectrometer that characterizes amino acid butyl ester
derivatives.
HCOOC4H9 is butyl formate, a neutral fragment of 102 Da common to thefragmentation of the EM + H]’ ions of methionine. CID, collision-induceddissociation.
tOC
C
C0
A
Leu+lIe
Fresh Control
*
100 Pro
1*
*
(0C4)C
c 500
aa)
BAge Matched Control
*Ala
*
eu#{247}lIe
VaI
Sor
(0Ca)C
C0
a)>a4)
180 200 220
Mass / Charge
352 Chace et al.: MS-MS of homocystine in blood spots
Glu
Tyr
140 160 180 200 220 240 260 280 300
Pro Mass/Charge
CHomocystinuria
*Tyr� �*
�240 260 280 300
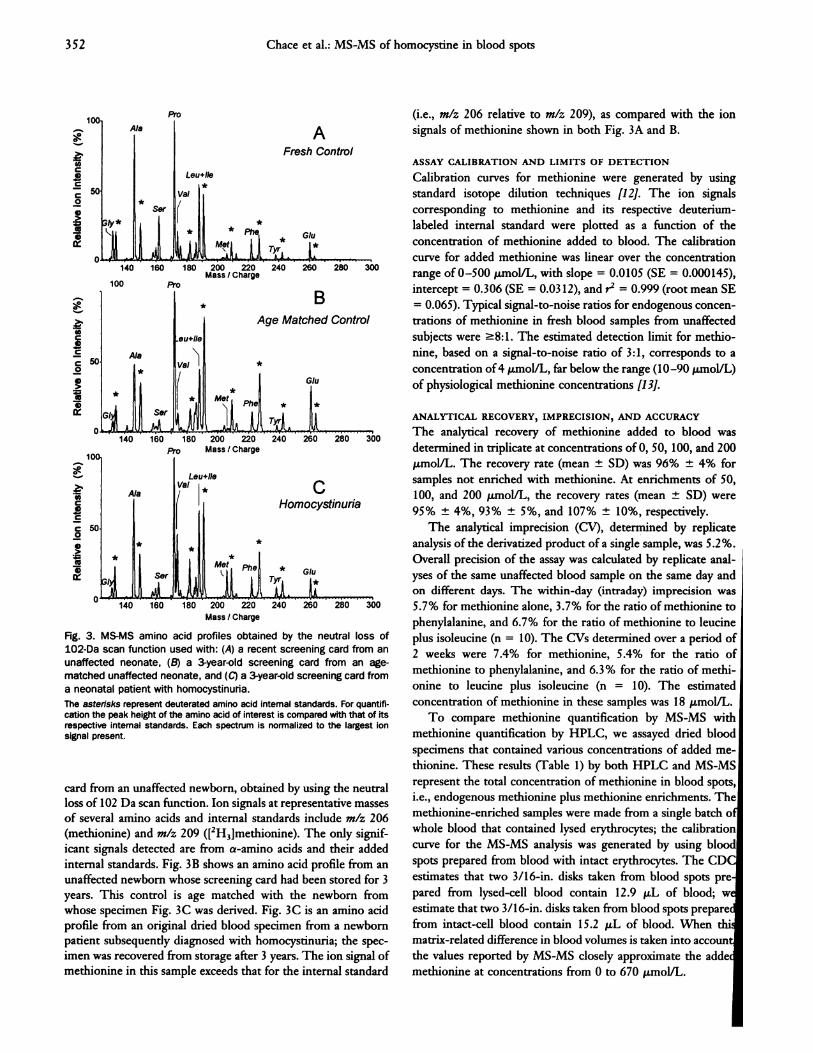
Fig. 3. MS-MS amino acid profiles obtained by the neutral loss of
1O2�Da scan function used with: (A) a recent screening card from an
unaffected neonate, (B) a 3-year-old screening card from an age-
matched unaffected neonate, and (C) a 3-year�old screening card from
a neonatal patient with homocystinuria.
The asterisks represent deuterated amino acid internal standards. For quantifi-cation the peak height of the amino acid of interest is compared with that of itsrespective internal standards. Each spectrum is normalized to the largest ionsignal present.
card from an unaffected newborn, obtained by using the neutral
loss of 102 Da scan function. Ion signals at representative masses
of several amino acids and internal standards include mlz 206
(methionine) and mlz 209 ([2H3]methionine). The only signif-
icant signals detected are from a-amino acids and their added
internal standards. Fig. 3B shows an amino acid profile from an
unaffected newborn whose screening card had been stored for 3
years. This control is age matched with the newborn from
whose specimen Fig. 3C was derived. Fig. 3C is an amino acid
profile from an original dried blood specimen from a newborn
patient subsequently diagnosed with homocystinuria; the spec-
imen was recovered from storage after 3 years. The ion signal of
methionine in this sample exceeds that for the internal standard
(i.e., mlz 206 relative to mlz 209), as compared with the ion
signals of methionine shown in both Fig. 3A and B.
ASSAY CALIBRATION AND LIMITS OF DETECTION
Calibration curves for methionine were generated by using
standard isotope dilution techniques [12]. The ion signals
corresponding to methionine and its respective deuterium-
labeled internal standard were plotted as a function of the
concentration of methionine added to blood. The calibration
curve for added methionine was linear over the concentration
range of 0-500 �.tmoVL, with slope = 0.0105 (SE = 0.000145),
intercept = 0.306 (SE = 0.0312), and r2 = 0.999 (root mean SE
= 0.065). Typical signal-to-noise ratios for endogenous concen-
trations of methionine in fresh blood samples from unaffected
subjects were �8: 1. The estimated detection limit for methio-
nine, based on a signal-to-noise ratio of 3:1, corresponds to a
concentration of 4 j.�mol/L, far below the range (10-90 �moVL)
of physiological methionine concentrations [13].
ANALYTICAL RECOVERY, IMPRECISION, AND ACCURACY
The analytical recovery of methionine added to blood was
determined in triplicate at concentrations of 0, 50, 100, and 200
Mm0VL. The recovery rate (mean ± SD) was 96% ± 4% for
samples not enriched with methionine. At enrichments of 50,
100, and 200 �tmolfL, the recovery rates (mean ± SD) were
95% ± 4%, 93% ± 5%, and 107% ± 10%, respectively.
The analytical imprecision (CV), determined by replicate
analysis of the derivatized product of a single sample, was 5.2%.
Overall precision of the assay was calculated by replicate anal-
yses of the same unaffected blood sample on the same day and
on different days. The within-day (intraday) imprecision was
5.7% for methionine alone, 3.7% for the ratio of methionine to
phenylalanine, and 6.7% for the ratio of methionine to leucine
plus isoleucine (n 10). The CVs determined over a period of
2 weeks were 7.4% for methionine, 5.4% for the ratio of
methionine to phenylalanine, and 6.3% for the ratio of methi-
onine to leucine plus isoleucine (n = 10). The estimated
concentration of methionine in these samples was 18 .tmoVL.
To compare methionine quantification by MS-MS with
methionine quantification by HPLC, we assayed dried blood
specimens that contained various concentrations of added me-
thionine. These results (Table 1) by both HPLC and MS-MS
represent the total concentration of methionine in blood spots,
i.e., endogenous methionine plus methionine enrichments. The
methionine-enriched samples were made from a single batch 0:
whole blood that contained lysed erythrocytes; the calibration
curve for the MS-MS analysis was generated by using blood
spots prepared from blood with intact erythrocytes. The CDC
estimates that two 3/16-in, disks taken from blood spots pre
pared from lysed-cell blood contain 12.9 �L of blood; w
estimate that two 3/16-in, disks taken from blood spots prepare
from intact-cell blood contain 15.2 �L of blood. When thi
matrix-related difference in blood volumes is taken into account
the values reported by MS-MS closely approximate the addem
methionine at concentrations from 0 to 670 �molJL.

Table 1. Methlonine analysis by tandem MS and HPLC
compared.Enriched Meta Met by MS-MS Met by HPLC
mg/L pmoi/L mg,/L �tmoiIL m&’L �sn1oIIL
0 0.0 2 13.4 4 26.8
20 134.2 18 120.8 16 107.4
40 268.4 35 234.9 31 208.0
50 335.6 53 355.7 47 315.4
50 335.6 43 288.6 35 234.9
50 335.6 54 362.4 49 328.8
60 402.7 50 335.6 39 261.7
70 469.8 59 395.9 49 328.8
80 536.9 68 456.3 55 369.1
100 671.1 92 617.4 70 469.8
� Enrichments prepared with whole blood containing lysed erythrocytes. These
samples contain less blood per disk than intact cells (12.9 j.�L for lysed cells vs
15.2 �L for whole blood).
Clinical Chemistry 42, No. 3, 1996 353
Specimens autoclaved at newborn screening and before storage.
ANALYSIS OF BLOOD SPECIMEN COLLECTIONS
More than 16 000 fresh dried blood spots have been analyzed at
Duke University Medical Center as part of a pilot screening
program in collaboration with the North Carolina State Screen-
ing Laboratory. The majority of these samples were obtained
from the population in the Raleigh-Durham-Chapel Hill re-
gion of North Carolina. In a sampling of this group of neonatal
blood spots, the mean ± SD for methionine was 19 ± 8.3 (n =
909) �tmol/L. This is comparable with the concentration range
for methionine of 10-90 .tmol/L [13] in unaffected neonates.
The value of methionine in our study at 5 SD above the mean,
60.5 �imoVL, also compares well with this range. The methio-
nine to phenylalanmne ratio was 0.39 ± 0.11 and the methionine
to leucine plus isoleucine ratio was 0.16 ± 0.04.
Results of the blinded analysis of dried blood spots received
from the NERNSP are presented in Table 2. This collection
includes six control samples from unaffected patients, four
samples from patients diagnosed with homocystinuria by the
Table 2. QuantItative analysis of methionine in blood spots.
Met, Met:Sample Storage time �emo1IL Met:Phe Leu + lie
Homocystinuria 3.8 years 25.1 0.84 0.27
Control “ 8.6 0.24 0.10
Control “ 9.9 0.26 0.10
Homocystinuria 4.6 years 24.4 0.66 0.29Control “ 9.9 0.60 0.09
Control “ 7.2 0.22 0.10
Homocystinuria 3.4 years 61.7 2.09 0.78
Homocystinuria#{176} 3.5 years 8.6 1.65 0.34
Hypermethioninemia 1.2 years 26.8 0.81 0.37
Hypermethioninemia 40 days 117.0 2.12 1.36
Control 40 days 38.5 0.58 0.28
False positive5 54 days 16.6 0.51 0.17
False positive8 122 days 24.8 1.21 0.17
False positive8 52 days 19.7 0.52 0.22False positive8 54 days 24.0 0.73 0.21
bacterial inhibition assay, four samples from patients with
isolated hypermethioninemia, and four samples in which methi-
onine was measured as increased by the bacterial inhibition assay
but were found to be normal by repeat analysis or follow-up of
false-positive results. The methionine concentrations and the
molar ratios of methionine to phenylalanmne and methionine to
leucine plus isoleucine presented in Table 2 show that the
Met:Leu + lie ratio successfully discriminated between the
positives and both the controls and the false positives. These
data do not allow the prediction of a normal cutoff value for the
Met:Leu + lie ratio because (a) the concentration of methionine
is higher in fresher samples, and (b) the ratio of Met:Leu + lie
is also slightly higher, presumably because of small differences in
their rates of degradation. However, regardless of the storage
age of the samples, in each instance the ratio of Met to Leu +
lie is clearly higher than this ratio in the age-matched controls
(by >2.5 times). Some variabilities in the data are observed,
presumably because the storage times for the specimens vary
from 40 days to >4 years. Notably, some specimens had
previously been autoclaved at the NERNSP laboratory, but no
alterations in the amino acid profiles were apparent (data not
shown).
DiscussionTandem mass spectrometry is a new analytical tool for neonatal
screening of amino acid metabolic disorders. Samples are pre-
pared by a simple semiautomated extraction and derivatization
procedure in batches of 60. Each analysis takes <3 mm. This
method incorporates isotope dilution techniques that provide
accurate quantitative information for specific components of
each sample. The method is robust and capable of analyzing
large numbers of samples because its nonchromatographic na-
ture and new methods of ionization make full automation
possible.
Quantitative data for > 16 000 blood samples from newborns
revealed that the mean concentration pius 5 SD was within the
published upper range for methionine in full-term and prema-
ture newborns. Samples that had been previously categorized as
falsely positive gave normal Met:Leu + lie ratios by MS-MS.
Blinded analysis of samples from six patients previously diag-
nosed with either homocystinuria or hypermethioninemia de-
tected an above-normal Met:Leu + lie ratio in all six (Met:Leu
+ lIe >0.2 7). Of these samples, two had a methionine concen-
tration >67 /LmoVL (>10 mg/L), the cutoff concentration used
for the bacterial inhibition assay in the NERNSP. Because
methionine is easily lost through oxidation, one would expect to
find reduced concentrations of methionine in samples stored as
long as 3 years. The degradation rate of leucine seems closer to
that of methionine than of phenylalanine [14]. Consequently, a
Met:Leu ratio should better reflect the original ratio of these
amino acids than does the Met:Phe ratio and thus allow for the
retrospective detection of hypermethionmnemias (including ho-
mocystinuria). This may explain why the Met:Phe ratio was not
as accurate in detecting homocystinuria. In fresh samples,
however, the Met:Phe ratio might be as valid an index for
differentiating controls, false positives, and true positives for
hypermethioninemia as the Leu + Ile:Phe ratio is in detecting
354 Chace et al.: MS-MS of homocystine in blood spots
maple syrup urine disease [8]. This can be seen by examining the
fresh hypermethioninemia sample after storage for 40 days, for
which the ratio of Met:Phe or Met:Leu + Tie is clearly greater
than that for the age-matched control.
We have no direct data demonstrating the reduction of
false-negative results, having been unable to obtain such sam-
ples. However, the results reported here suggest that the
probability of a false-negative result is greatly reduced. Support
for this assumption is provided in Table 2 for samples in which
the actual concentration of methionine is below the detection
limit while the ratio of Met:Leu + lie exceeds that for the
controls. Further, in a preliminary report, we demonstrated that
the use of molar ratios of amino acids reduced false-positive and
false-negative results attributable to laboratory error or sample
age [15].Our experience shows that MS-MS increases the specificity
of newborn screening for hypermethioninemia. The sensitivity
for methionine quantification by MS-MS appears to be very
good, and its accuracy is indicated by its ability to discriminate
false positives from true positives and by the high correlation of
its results with those obtained by HPLC, a standard assay for
quantifying methionine.
Concerns have been raised by other clinical scientists with
regard to the validity of newborn screening for hypermethi-
oninemias including homocystinuria. These concerns deal with
the prevalence of this disorder in whole-population screening,
the ability to effectively treat homocystinuria, and the cost-
benefit of screening for this disorder. Although these consider-
ations are important, we consider them not particularly relevant
to this paper, which describes and validates the methionine
component of a method that can identify several metabolic
disorders (including phenylketonuria) rather than presenting
data for or against the validity of newborn screening for
homocystinuria. However, the reality is that >20 states and
most European countries and Japan screen for homocystinuria
with a single test that measures methionine concentration;
screening for this disease is often mandated by state legislative
bodies. The new technique we present has greater precision and
accuracy and the ability to diagnose additional diseases screened
for in these same states (phenyiketonuria and maple syrup urine
disease). We believe that MS-MS is entirely cost effective
because it screens for more than one disease in one assay. Using
MS-MS to screen for other diseases such as phenylketonuria and
maple syrup urine disease incurs no additional costs in screening
for homocystinuria. In addition, whole-population screening
with a more precise method than that currently available may
provide important data on disease frequency. Current methods
used to screen for homocystinuria may not be adequately
accurate and precise to detect small increases of methionine in
newborns whose specimens are collected at 24 h or less post-
partum, a result of increasing early discharges of newborns. One
way to address this issue is to develop new, more accurate and
precise methodologies such as the MS-MS method presented
here.We believe that MS-MS applied to newborn screening is a
cost-effective methodology for the following reasons: It allows
for many disease markers to be tested at one time by a single
method, thus substantially expanding newborn screening cover-
age. There are no required kits, and the costs of reagents and
internal standards are minimal. Automation of sample prepara-
tion, analysis, and interpretation, all of which are currently
under development, will increase the number of samples ana-
lyzed per instrument per day, further reducing the cost per test.
The accuracy and precision of the MS-MS method should result
in very low false-positive rates compared with those obtained by
existing methods. Basing diagnosis on the ratios of key metab-
olites reduces the adverse effect of sample collection and prep-
aration on analytical accuracy, as described previously [13]. This
should reduce the number of repeat specimens required and
thus reduce the overall costs of newborn screening.
We are indebted to Susan Moore of the New Hampshire
component and Jane Simmons of the Massachusetts component
of the NIERNSP for recovery of these newborn specimens from
storage. Financial support was from the North Carolina Depart-
ment of Environmental Health and Natural Resources, Division
of Maternal and Child Health, Raleigh, NC (grant no.
C-05070).
References1. Mudd SH, Levy HL, Skovby F. Disorders of transsulfuration. In:
Scriver CR, Beaudet AL, Sly WS, Valle D, eds. The metabolic andmolecular bases of inherited disease, 7th ed. New York: McGraw-
Hill, 1995:1279-327.2. Mudd SH, Levy HL, Tangerman A, Boujet CH, Buist N, Davison-
Mundt A, et al. Isolated persistent hypermethioninemia. Am J Hum
Genet 1995;57:882-92.
3. Guthrie R. Screening for inborn errors of metabolism” in the
newborn infant-a multiple test program. Birth Defects 1968:4:
92-8.
4. Illinois Department of Public Health and Council of Regional
Networks. An overview of newbom screening programs in theUnited States and Canada. Springfield, IL, 1993.
5. Whiteman PD, Clayton BE, Ersser RS, Lilly P, Seakins JWT.
Changing incidence of neonatal hypermethioninaemias: implica-tions for the detection of homocystinuria. Arch Dis Child 1979;54:593-8.
6. Levy HL, Naruse H. Early discharge from the newborn nursery. Apotential threat to effective newborn screening [Editoriali. Screen-ing 1994;3:45-8.
7. Chace DH, Millington DS, Terada N, Kahler SG, Roe CR, HofmanLF. Rapid diagnosis of phenylketonuria by quantitative analysis forphenylalanine and tyrosine in neonatal blood spots by tandem
mass spectrometry. Clin Chem 1993;39:66-71.
8. Chace DH, Hiliman SL, Millington DS, Kahler CR, Naylor EW. Rapid
diagnosis of maple syrup urine disease in blood spots from
newborns by tandem mass spectrometry. Clin Chem 1995:41:
62-8.
9. Millington DS, Kodo N, Terada N, Roe D, Chace DH. The analysis
of diagnostic markers of genetic disorders in human blood andurine using tandem mass spectrometry with liquid secondary ionmass spectrometry. nt J Mass Spectrom Ion Process 1991;111:
211-28.10. Millington DS, Chace DH, Hillman SL, Kodo N, Terada N. Diagno-
sis of metabolic disease. In: Matsumoto T, Caprioli R, Gross ML,
Seyama Y, eds. Biological mass spectrometry: present and future.
New York: John Wiley & Sons, 1994:559-79.

Clinical Chemistry 42, No. 3, 1996 355
LI. Hannon WH, Aziz KJ, Collier FC, Fisher DA. Blood collection on
filter paper for neonatal screening programs, 2nd ed. Villanova,PA: National Committee for Clinical Laboratory Standards, 1992:
12:1.12. Markey SF. Quantitative mass spectrometry. Biomed Mass Spec-
trom 1981;8:426-30.13. Slocum RH, Cummings JG. Amino acid analysis of physiological
samples. In: Hommes FA, ed. Techniques in diagnostic humanbiochemical genetics: a laboratory manual. New York: John Wiley& Sons, 1991:87-126.
14. Levy HL, Simmons JR, MacCready RA. Stability of amino acids and
galactose in the newborn screening filter paper blood specimen. JPediatr 1985;107:757-60.
15. Chace DH, Millington DS, Hillman SL. The role of tandem massspectrometry in reducing the number of false positive and falsenegative results in the diagnosis of metabolic disease from driedblood spots. In: Pass K, Levy H, eds. Early hospital discharge:impact on newborn screening. Atlanta: Emory University School ofMedicine, Council of Regional Networks for Genetics Services,1995:272-83.
![REVIEW Open Access Proposed guidelines for the diagnosis ......also manifest as combined methylmalonic aciduria and homocystinuria (cblC, cblD, cblF and cblJ defects) [2,3]. MMA and](https://img.pdfslide.net/doc/110x75/60a702da0ccce350ab13ff02/review-open-access-proposed-guidelines-for-the-diagnosis-also-manifest-as.jpg)