Embed Size (px)
Citation preview
AFRL-RX-TY-TR-2009-4573 RAPID SOIL STABILIZATION OF SOFT CLAY SOILS FOR CONTINGENCY AIRFIELDS Susan Rafalko, Thomas L. Brandon, George M. Filz, James K. Mitchell Virginia Polytechnic Institute and State University Blacksburg, VA DECEMBER 2006 Final Report for 11 August 2004 – 7 December 2006
DISTRIBUTION STATEMENT A: Approved for public release; distribution unlimited.
AIRBASE TECHNOLOGIES DIVISION MATERIALS AND MANUFACTURING DIRECTORATE
AIR FORCE RESEARCH LABORATORY AIR FORCE MATERIEL COMMAND
139 BARNES DRIVE, SUITE 2 TYNDALL AIR FORCE BASE, FL 32403-5323
Standard Form 298 (Rev. 8/98)
REPORT DOCUMENTATION PAGE
Prescribed by ANSI Std. Z39.18
Form Approved OMB No. 0704-0188
The public reporting burden for this collection of information is estimated to average 1 hour per response, including the time for reviewing instructions, searching existing data sources, gathering and maintaining the data needed, and completing and reviewing the collection of information. Send comments regarding this burden estimate or any other aspect of this collection of information, including suggestions for reducing the burden, to Department of Defense, Washington Headquarters Services, Directorate for Information Operations and Reports (0704-0188), 1215 Jefferson Davis Highway, Suite 1204, Arlington, VA 22202-4302. Respondents should be aware that notwithstanding any other provision of law, no person shall be subject to any penalty for failing to comply with a collection of information if it does not display a currently valid OMB control number. PLEASE DO NOT RETURN YOUR FORM TO THE ABOVE ADDRESS. 1. REPORT DATE (DD-MM-YYYY) 2. REPORT TYPE 3. DATES COVERED (From - To)
4. TITLE AND SUBTITLE 5a. CONTRACT NUMBER
5b. GRANT NUMBER
5c. PROGRAM ELEMENT NUMBER
5d. PROJECT NUMBER
5e. TASK NUMBER
5f. WORK UNIT NUMBER
6. AUTHOR(S)
7. PERFORMING ORGANIZATION NAME(S) AND ADDRESS(ES) 8. PERFORMING ORGANIZATION REPORT NUMBER
9. SPONSORING/MONITORING AGENCY NAME(S) AND ADDRESS(ES) 10. SPONSOR/MONITOR'S ACRONYM(S)
11. SPONSOR/MONITOR'S REPORT NUMBER(S)
12. DISTRIBUTION/AVAILABILITY STATEMENT
13. SUPPLEMENTARY NOTES
14. ABSTRACT
15. SUBJECT TERMS
16. SECURITY CLASSIFICATION OF: a. REPORT b. ABSTRACT c. THIS PAGE
17. LIMITATION OF ABSTRACT
18. NUMBER OF PAGES
19a. NAME OF RESPONSIBLE PERSON
19b. TELEPHONE NUMBER (Include area code)
07-DEC-2006 Final Technical Report 11-AUG-2004 -- 07-DEC-2006
Rapid Soil Stabilization of Soft Clay Soils for Contingency Airfields FA8651-04-C-0397
62102F
4915
D1
QD101001
Rafalko, Susan; Brandon, Thomas L.; Filz, George M.; Mitchell, James K.
Department of Civil and Environmental Engineering and Department of Crop and Soil Environmental Sciences Virginia Polytechnic Institute and State University Blacksburg, VA 24060-0105
Air Force Research Laboratory Materials and Manufacturing Directorate Airbase Technologies Division 139 Barnes Drive, Suite 2 Tyndall Air Force Base, FL 32403-5323
AFRL/RXQD
AFRL-RX-TY-TR-2009-4573
Distribution Statement A: Approved for public release; distribution unlimited.
Ref AFRL/RXQ Public Affairs Case # 10-00x. Document contains color images. Associated publications: AFRL-RX-TY-TP-2009-4601, AFRL-RX-TY-TP-2009-4602, AFRL-RX-TY-TP-2009-4603 and AFRL-RX-TY-TP-2009-4604.
Since World War II, the military has sought methods for rapid stabilization of weak soils for support of its missions worldwide. Over the past 60 years, cement and lime have consistently been found to be among the most effective stabilizers for road and airfield applications, although recent developments show promise using nontraditional stabilizers. The purpose of this research is to determine the most effective stabilizers and dosage rates of stabilizers to increase the strength of soft clay soils (initial CBR = 2) within 72 hours for contingency airfields to support C-17 and C-130 aircraft traffic. Pavement design charts for various aircraft loading conditions were generated using the Pavement- Transportation Computer Assisted Structural Engineering Program, which was developed by the Engineering Research and Development Center to determine ranges of required strength and thickness for an underlying subbase layer and a top base layer, such as stabilized soil, crushed-aggregate, or aluminum matting. From laboratory studies, the required design strengths for many loading conditions were achieved by treating clay with 2%-4% pelletized quicklime for the underlying subbase layer, and treating clay with 2%- 4% pelletized quicklime, 1% RSC15 fibers, and 11% Type III cement for the top base layer. While the base layer requires a minimum thickness of six inches, the required subbase layer thickness is often quite large and may be difficult to construct. However, newly developed construction equipment currently used for subgrade stabilization on civilian projects should be able to stabilize the soil down to these large required depths and make construction possible.
Soil, Stabilization, Contingency, Airfield, C-17, C-130, Portland Cement, Lime, Geo-synthetic Fibers and Calcium Carbide, Clay, subbase, base, polymer, super plasticizer, accelerator, roadminer, quicklime and J.H. Becker Co.
U U U UU 132
Troy Thomas
Reset
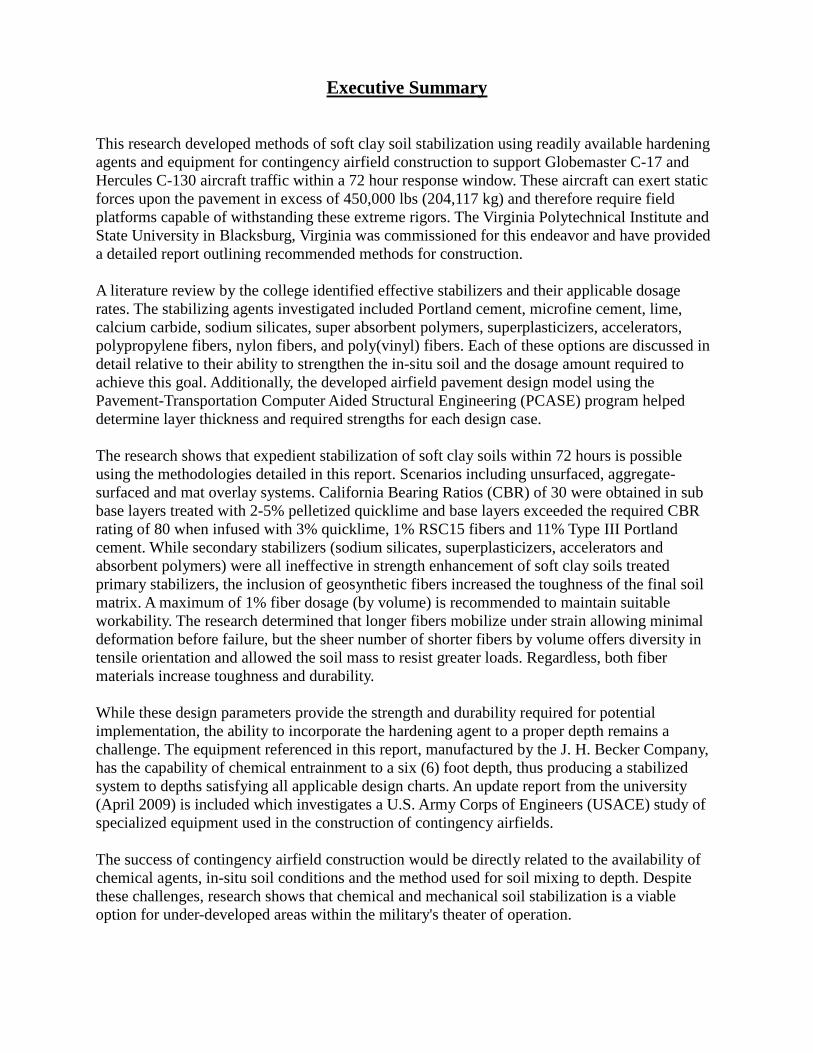
Executive Summary
This research developed methods of soft clay soil stabilization using readily available hardening agents and equipment for contingency airfield construction to support Globemaster C-17 and Hercules C-130 aircraft traffic within a 72 hour response window. These aircraft can exert static forces upon the pavement in excess of 450,000 lbs (204,117 kg) and therefore require field platforms capable of withstanding these extreme rigors. The Virginia Polytechnical Institute and State University in Blacksburg, Virginia was commissioned for this endeavor and have provided a detailed report outlining recommended methods for construction. A literature review by the college identified effective stabilizers and their applicable dosage rates. The stabilizing agents investigated included Portland cement, microfine cement, lime, calcium carbide, sodium silicates, super absorbent polymers, superplasticizers, accelerators, polypropylene fibers, nylon fibers, and poly(vinyl) fibers. Each of these options are discussed in detail relative to their ability to strengthen the in-situ soil and the dosage amount required to achieve this goal. Additionally, the developed airfield pavement design model using the Pavement-Transportation Computer Aided Structural Engineering (PCASE) program helped determine layer thickness and required strengths for each design case. The research shows that expedient stabilization of soft clay soils within 72 hours is possible using the methodologies detailed in this report. Scenarios including unsurfaced, aggregate-surfaced and mat overlay systems. California Bearing Ratios (CBR) of 30 were obtained in sub base layers treated with 2-5% pelletized quicklime and base layers exceeded the required CBR rating of 80 when infused with 3% quicklime, 1% RSC15 fibers and 11% Type III Portland cement. While secondary stabilizers (sodium silicates, superplasticizers, accelerators and absorbent polymers) were all ineffective in strength enhancement of soft clay soils treated primary stabilizers, the inclusion of geosynthetic fibers increased the toughness of the final soil matrix. A maximum of 1% fiber dosage (by volume) is recommended to maintain suitable workability. The research determined that longer fibers mobilize under strain allowing minimal deformation before failure, but the sheer number of shorter fibers by volume offers diversity in tensile orientation and allowed the soil mass to resist greater loads. Regardless, both fiber materials increase toughness and durability. While these design parameters provide the strength and durability required for potential implementation, the ability to incorporate the hardening agent to a proper depth remains a challenge. The equipment referenced in this report, manufactured by the J. H. Becker Company, has the capability of chemical entrainment to a six (6) foot depth, thus producing a stabilized system to depths satisfying all applicable design charts. An update report from the university (April 2009) is included which investigates a U.S. Army Corps of Engineers (USACE) study of specialized equipment used in the construction of contingency airfields. The success of contingency airfield construction would be directly related to the availability of chemical agents, in-situ soil conditions and the method used for soil mixing to depth. Despite these challenges, research shows that chemical and mechanical soil stabilization is a viable option for under-developed areas within the military's theater of operation.
iii
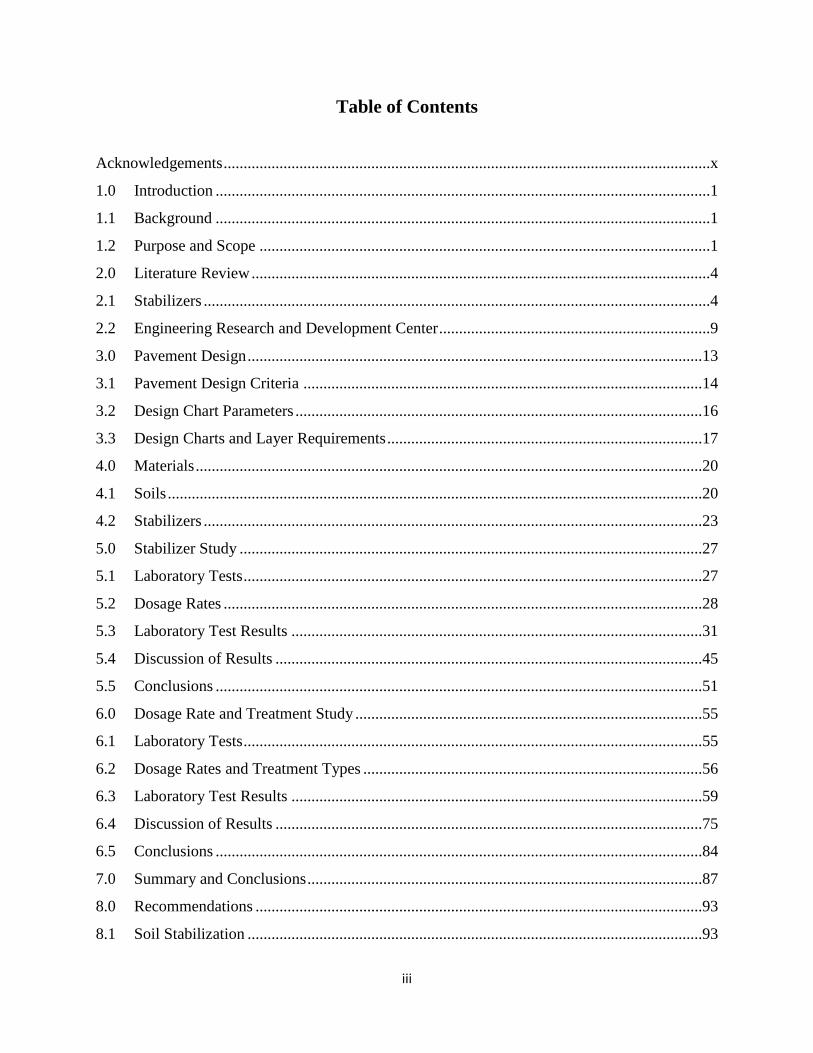
Table of Contents Acknowledgements ..........................................................................................................................x
1.0 Introduction ............................................................................................................................1
1.1 Background ............................................................................................................................1
1.2 Purpose and Scope .................................................................................................................1
2.0 Literature Review ...................................................................................................................4
2.1 Stabilizers ...............................................................................................................................4
2.2 Engineering Research and Development Center ....................................................................9
3.0 Pavement Design ..................................................................................................................13
3.1 Pavement Design Criteria ....................................................................................................14
3.2 Design Chart Parameters ......................................................................................................16
3.3 Design Charts and Layer Requirements ...............................................................................17
4.0 Materials ...............................................................................................................................20
4.1 Soils ......................................................................................................................................20
4.2 Stabilizers .............................................................................................................................23
5.0 Stabilizer Study ....................................................................................................................27
5.1 Laboratory Tests ...................................................................................................................27
5.2 Dosage Rates ........................................................................................................................28
5.3 Laboratory Test Results .......................................................................................................31
5.4 Discussion of Results ...........................................................................................................45
5.5 Conclusions ..........................................................................................................................51
6.0 Dosage Rate and Treatment Study .......................................................................................55
6.1 Laboratory Tests ...................................................................................................................55
6.2 Dosage Rates and Treatment Types .....................................................................................56
6.3 Laboratory Test Results .......................................................................................................59
6.4 Discussion of Results ...........................................................................................................75
6.5 Conclusions ..........................................................................................................................84
7.0 Summary and Conclusions ...................................................................................................87
8.0 Recommendations ................................................................................................................93
8.1 Soil Stabilization ..................................................................................................................93
iv
8.2 Laboratory Tests ...................................................................................................................94
8.3 In-Situ and Field Tests .........................................................................................................95
8.4 Pavement Design ..................................................................................................................95
References ......................................................................................................................................96
Appendix A ..................................................................................................................................100
Laboratory Procedure for Unconfined Compressive Strength Tests ...........................................100
Appendix B ..................................................................................................................................110
Mixing Study ...............................................................................................................................110
Appendix C ..................................................................................................................................113
Mellowing Time Study ................................................................................................................113
Appendix D ..................................................................................................................................117
PCASE: Pavement Design Charts for a Contingency C-17.........................................................117
v
List of Figures
2-1 A pulverizer mixing stabilizers into the soil. (Newman 2005) ............................................12
2-2 Closer view of a pulverizer and its blades. (Photo by James K. Mitchell) ..........................12
2-3 A sprayer equipped HUMVEE spraying emulsion polymers over the soil. (Newman
2005) .....................................................................................................................................12
3-1 Pavement design sections for four different base layer types (contingency C-17, area
B, and 1,000 passes). (1 inch = 2.54 cm) .............................................................................13
3-2 CBR design chart for a contingency C-17............................................................................18
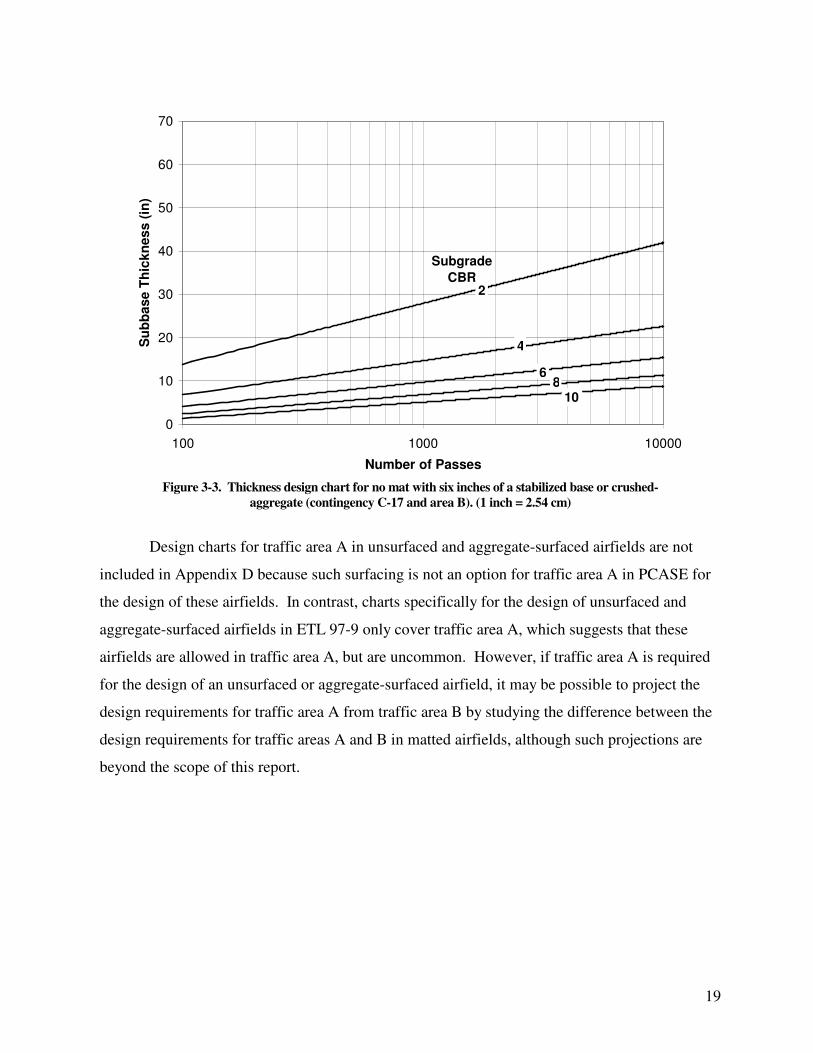
3-3 Thickness design chart for no mat with six inches of a stabilized base or crushed
aggregate (contingency C-17 and area B). (1 inch = 2.54 cm) ............................................19
4-1 CBR value vs. water content for Staunton clay, NoVa clay, Rome clay, and VBC using
standard Proctor effort ..........................................................................................................23
5-1 Three-day normalized UCS vs. percent fibers by dry weight of Staunton clay ...................32
5-2 Three-day normalized toughness calculated at 15% strain vs. percent fibers by dry
weight of Staunton clay ........................................................................................................33
5-3 Three-day normalized UCS vs. fiber length for Staunton clay treated with 5% primary
stabilizer and 1% fibers by dry weight of soil. (1 inch = 2.54 cm) ......................................35
5-4 Three-day normalized toughness calculated at 2% strain vs. fiber length for Staunton
clay treated with 5% primary stabilizer and 1% fibers by dry weight of soil ......................37
5-5 Three-day stress-strain curves for Staunton clay treated with 5% Type III cement and
1% fibers by dry weight of soil. (1 psi = 6.89 kPa) ..............................................................38
5-6 Three-day normalized UCS vs. percent fibers by dry weight of NoVa clay........................39
5-7 Three-day normalized toughness calculated at 15% strain vs. percent fibers by dry
weight of NoVa clay .............................................................................................................40
5-8 Three-day stress vs. strain curves for VBC treated with 5% pulverized quicklime or 5%
pelletized quicklime by dry weight of soil. (1 psi = 6.89 kPa).............................................42
5-9 Three-day stress-strain curves for VBC treated with 5% Type III cement and 1% fibers
by dry weight of soil. (1 psi = 6.89 kPa) ..............................................................................45
6-1 Three-day UCS and pH vs. dosage rate of pelletized quicklime for treatment of the VBC.
(1 psi = 6.89 kPa) .................................................................................................................59
vi
6-2 CBR value and pH vs. dosage rate of pelletized quicklime for treatment of the VBC ........60
6-3 Three-day UCS vs. dosage rate of Type III cement for the VBC treated with the
indicated percentages of RSC15 fibers and Type III cement. (1 psi = 6.89 kPa) ................61
6-4 Three-day normalized toughness vs. dosage rate of Type III cement for the VBC treated
with 1% RSC15 fibers and the indicated percentages of Type III cement ...........................62
6-5 CBR value vs. dosage rate of Type III cement for the VBC treated with the indicated
percentages of RSC15 fibers and Type III cement ...............................................................63
6-6 Three-day UCS vs. dosage rate of RSC15 fibers for the VBC pretreated with 3%
pelletized quicklime and treated with the indicated percentages of RSC15 fibers and
Type III cement on the second day (Method 1). (1 psi = 6.89 kPa) .....................................64
6-7 Three-day normalized toughness vs. dosage rate of RSC15 fibers for the VBC pretreated
with 3% pelletized quicklime and treated with the indicated percentages of RSC15 fibers
and Type III cement on the second day (Method 1) .............................................................66
6-8 Three-day UCS vs. dosage rate of pelletized quicklime for the four different treatment
methods using the indicated percentages of pelletized quicklime, 1% RSC15 fibers, and
11% Type III cement. (1 psi = 6.89 kPa) .............................................................................67
6-9 CBR values at different penetrations vs. dosage rate of pelletized quicklime for two
treatment methods using the indicated percentages of pelletized quicklime, 1% RSC15
fibers, and 11% Type III cement ..........................................................................................68
6-10 Three-day UCS vs. dosage rate of RSC15 fibers for the four different treatment
methods using 3% pelletized quicklime, the indicated percentages of RSC15 fibers, and
11% Type III cement. (1 psi = 6.89 kPa) .............................................................................69
6-11 Three-day normalized toughness vs. dosage rate of RSC15 fibers for the four different
treatment methods using 3% quicklime, the indicated percentages of RSC15 fibers, and
11% Type III cement ............................................................................................................71
6-12 CBR value at different penetrations vs. dosage rate of RSC15 fibers for the VBC treated
with 3% pelletized quicklime, indicated percentages of RSC15 fibers, and 11% Type III
cement (Method 4) ...............................................................................................................72
6-13 Correlation of CBR values at different penetrations vs. three-day UCS for the VBC
treated with various dosage rates of pelletized quicklime, RSC15 fibers, and Type III
cement using treatment Methods 1 and 4. (1 psi = 6.89 kPa) ..............................................74
vii
6-14 Published correlations of CBR values vs. UCS. (1 psi = 6.89 kPa) .....................................82
7-1 J. H. Becker Company (2006) equipment mixing lime into soil ..........................................88
7-2 J. H. Becker Company equipment mixing lime into soil. (J. H. Becker, personal
communication, 2005) ..........................................................................................................88
7-3 RIC (2004) compacting soil .................................................................................................88
A-1 Cutting the sample mold on the lathe .................................................................................102
A-2 Hobart kitchen mixer ..........................................................................................................104
A-3 The “Geiman Cylinder Mold Stand,” retaining ring and screws, the “Geiman Special
Hammer,” modified plastic molds, detached plastic bottom, and metal screed .................106
A-4 Sample extruder ..................................................................................................................108
B-1 Three-day UCS vs. mixing time for VBC treated with 5% Type I/II cement by dry
weight of soil ......................................................................................................................112
C-1 Three-day UCS vs. mellowing time for VBC treated with 5% pelletized quicklime
by dry weight of soil ...........................................................................................................115
C-2 Three-day dry density vs. mellowing time for VBC treated with 5% pelletized
quicklime by dry weight of soil ..........................................................................................116
D-1 CBR design chart for a contingency C-17..........................................................................118
D-2 Thickness design chart for a light mat (contingency C-17 and area A) .............................118
D-3 Thickness design chart for a medium mat (contingency C-17 & area A) ..........................119
D-4 Thickness design chart for a heavy mat (contingency C-17 & area A) .............................119
D-5 Thickness design chart for no mat with six inches of a stabilized base or crushed
aggregate (contingency C-17 and area B) ..........................................................................120
D-6 Thickness design chart for a light mat (contingency C-17 and area B) .............................120
D-7 Thickness design charts for a medium mat (contingency C-17 and area B) ......................121
D-8 Thickness design chart for a heavy mat (contingency C-17 and area B) ...........................121
viii
List of Tables 3-1 Gradation Requirments for Cement- and Lime-Stabilized Base and Subbase Layers
(Joint Departments of the Army and Air Force 1994) .........................................................15
3-2 Requirements for the Different Types of Aluminum Mats ..................................................16
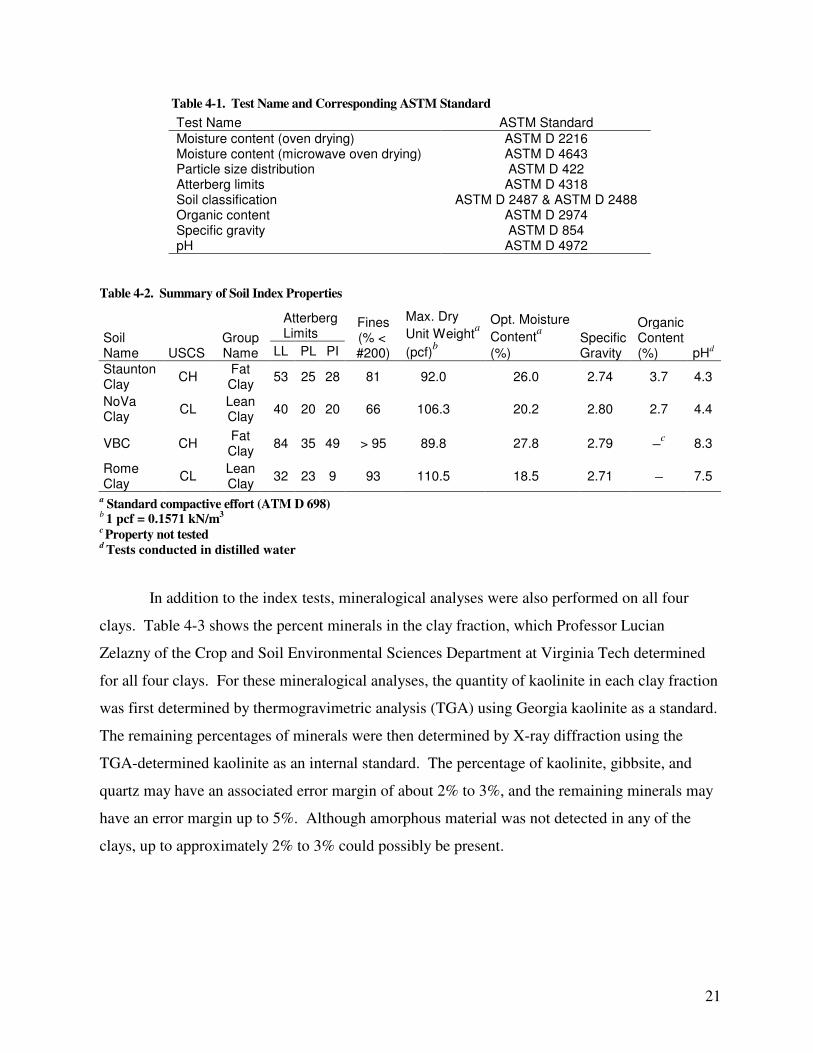
4-1 Test Name and Corresponding ASTM Standard ..................................................................21
4-2 Summary of Soil Index Properties .......................................................................................21
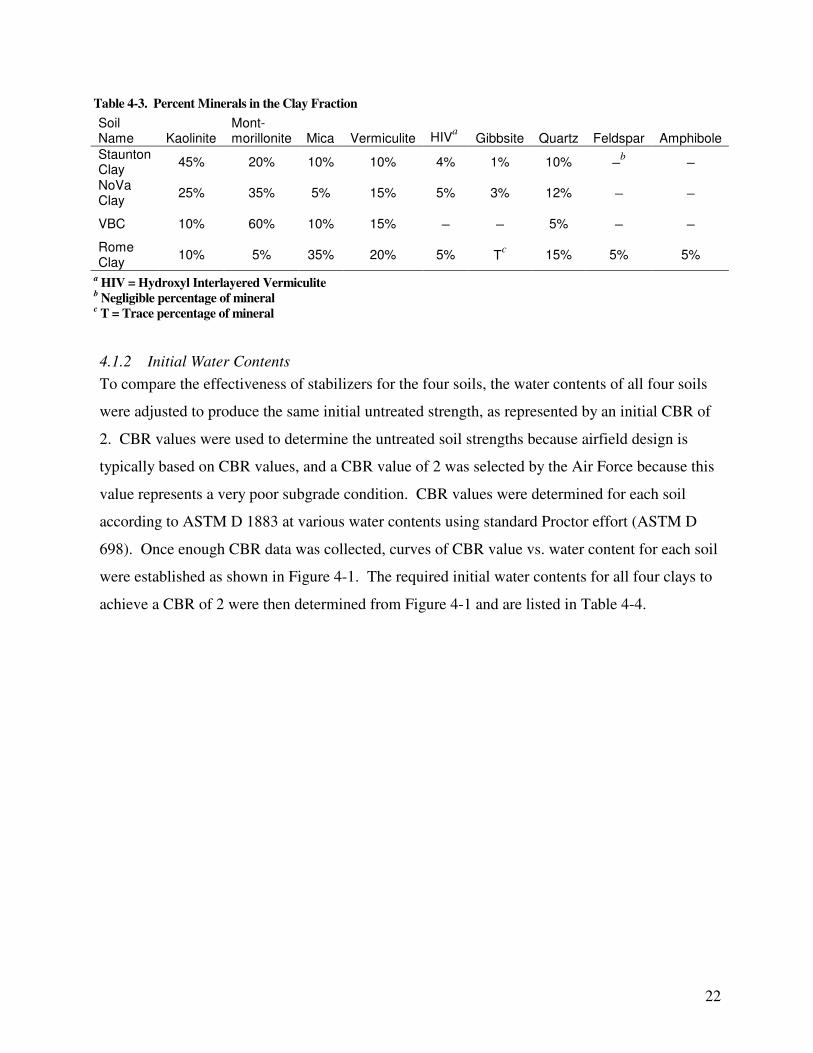
4-3 Percent Minerals in the Clay Fraction ..................................................................................22
4-4 Optimum Water Content and Water Contents Required to Achieve a CBR of 2 using
Standard Proctor Effort ........................................................................................................23
5-1 UCS Test Dosage Rates for Staunton Clay, NoVa Clay, and VBC by Dry Weight of
Soil ........................................................................................................................................29
5-2 Three-Day UCS for Staunton Clay Treated with 5% Primary Stabilizer by Dry
Weight of Soil .....................................................................................................................31
5-3 Three-Day UCS for Staunton Clay Treated with 5% Sodium Silicate to Calcium
Carbide or Quicklime by Dry Weight of Soil ......................................................................34
5-4 Three-Day UCS for Staunton Clay Treated with 5% Primary Stabilizer and 1%
Fibers by Dry Weight of Soil ...............................................................................................35
5-5 Three-Day Toughness Calculated at 2% Strain for Staunton Clay Treated with 5%
Primary Stabilizer and without or with 1% Fibers by Dry Weight of Soil ..........................36
5-6 Three-Day UCS for VBC Treated with 5% Primary Stabilizer by Dry Weight of Soil ......41
5-7 Three-Day UCS for VBC Treated with 5% Primary Stabilizer and Indicated
Percentage of Secondary Chemical Stabilizer by Dry Weight of Soil .................................43
5-8 Three-Day UCS for VBC Treated with 5% Primary Stabilizer and 1% Fibers by Dry
Weight of Soil ......................................................................................................................44
6-1 Dosage Rates for the Subbase Layer by Dry Weight of Soil ...............................................57
6-2 Dosage Rates by Dry Weight of Soil and Treatment Method Type for the Base Layer ......58
6-3 Average Three-Day Toughness Calculated at the Indicated Strain for the VBC Treated
with or without 1% RSC15 Fibers and the Indicated Percentages of Type III Cement .......62
6-4 Corrected CBR Values at Different Penetrations for VBC Treated with 7% Type III
Cement and the Indicated Percentages of RSC15 Fibers .....................................................64
7-1 Overall Best to Worst Three-Day UCS Results for Staunton Clay ......................................89
ix
7-2 Overall Best to Worst Three-Day UCS Results for NoVa Clay ..........................................89
7-3 Three-Day UCS for Rome Clay ...........................................................................................90
7-4 Overall Best to Worst Three-Day UCS Results for VBC ....................................................90
x
Acknowledgements This research was funded by the Air Force Research Laboratory and was performed under the
consultation and guidance of Jonathan Porter.
Jonathan Brown began this project and compiled a large number of resources for the
literature review. Kevin Golart, Andy Hill, Robin Wood, and Stephan Pietsch performed a large
portion of the laboratory work. Professor Lucian Zelazny performed mineralogical analyses on
all of the soils. Milton Myers provided the Vicksburg Buckshot clay. Liselle Vega contributed to
the laboratory work and is continuing this research project with a field study.
Roanoke Cement Company, SureCrete, U.S. Grout, Degussa Building Systems, Chemical
Lime, Graymont, Inc., PQ Corporation, Emerging Technologies, Inc., Alco Chemical, Grace
Construction, Fritz-Pak, Euclid Chemical Company, Nycon, Inc., and Kuraray America, Inc. all
generously donated samples of their products.
1
1.0 Introduction
1.1 Background
Since World War II, the military has had need for stabilizing weak soils to support its overseas
operations, and as a result, initiated research programs on rapid soil stabilization both in the
military and academia. The goal was to find a stabilizer that could be quickly and easily mixed
into weak soil to create a pavement capable of supporting traffic from military vehicles. Over
the past 60 years, progress has been made, but a “magic juice” has not yet been found that has
the ability to convert a weak soil to a strong material with very little effort and in a matter of
hours. Cement and lime have been the traditional stabilizers, and they are still among the most
effective stabilizers in use today, although recent developments in technology and materials
show promise from nontraditional stabilizers. Consequently, the U. S. Air Force Research
Laboratory sponsored a research project at Virginia Tech to investigate the effectiveness of
traditional and nontraditional stabilizers for rapid stabilization of soft clay subgrades.
1.2 Purpose and Scope
The purpose of this research is to determine the most effective stabilizers and their dosage rates
to increase the strength of wet and soft clay soils within 72 hours for contingency airfields and
aprons on existing airfields. The soft clay soils are assumed to have an initial California Bearing
Ratio (CBR) of 2 in the field, which represents a very poor subgrade condition. After treatment,
the stabilized clay must sustain aircraft traffic from Globemaster C-17s and Hercules C-130s.
Because of weight limitations on transport to remote contingency airfield, the design will consist
of stabilized soil alone, a light-weight aluminum mat overlying stabilized soil, or crushed-
aggregate overlying stabilized soil, although the latter option depends on available resources
near the airfield. The results of this research are intended to serve as the basis for determining
the required type of treatment based on soil composition and mineralogy. The scope of this
research consists of the following activities:
Literature Review
Approximately 250 references were gathered on soil stabilization and pavement design, and the
most relevant and significant findings are discussed, as well as information gathered from a visit
to the Engineering Research and Development Center (ERDC) in Vicksburg, Mississippi.
2
Pavement Design
Pavement design of airfields was investigated, so that the required depth and necessary degree of
improvement of the natural subgrade for a contingency airfield could be determined. Using the
Pavement-Transportation Computer Assisted Structural Engineering (PCASE) Program,
pavement design charts were generated that can be used to determine required strength and
thickness for pavement layers. These design charts are provided in Appendix D.
Soil Characterization
Laboratory tests, generally following ASTM standards, were used to determine the particle size
distribution, Atterberg limits, classification, organic content, specific gravity, and pH for four
clays used in this research. In addition, mineralogical analyses were also performed on all four
clays.
Stabilizer Study
A study on the effectiveness of the stabilizers was performed that consisted of treating clays with
similar dosage rates of different stabilizers, and using unconfined compressive strength (UCS)
tests to evaluate their resulting strength and toughness. UCS tests were chosen to evaluate the
effectiveness of the stabilizers because a large number of samples could be prepared and tested
quickly.
Dosage Rate and Treatment Study
Using the most effective stabilizers determined from the stabilizer study, another study was
performed to determine appropriate treatments to achieve adequate performance characteristics
for a potential underlying subbase layer and top base layer of a pavement design section. To
accomplish this, clay was treated with different treatments at various dosage rates for each layer,
and the treatment was considered to be successful when the treated soil satisfied the layer
strength requirements determined from PCASE. Strength was evaluated with both UCS and
CBR tests at corresponding dosage rates in this study, so that strength could be quickly evaluated
with UCS tests and then correlated to CBR values for pavement design.

3
Laboratory Procedures
A laboratory procedure for preparing samples for UCS tests was refined and is described in
Appendix A.
4
2.0 Literature Review
This section presents information from an extensive literature review on potential soil stabilizers
that will be evaluated in this research project. In addition, information gathered during a visit to
ERDC is also discussed.
2.1 Stabilizers
2.1.1 Portland Cement
The main compounds of Portland cement are tricalcium silicates (C3S), dicalcium silicates (C2S),
tricalcium aluminates (C3A), and tetracalcium aluminoferrites (C4AF) (where C = Ca, S = SiO2,
A = Al2O3, and F = Fe2O3). Prusinski and Bhattacharja (1999) state that when cement is mixed
with water, and then hydrates, the most important products from the chemical reaction include
calcium silicate hydrate and calcium hydroxide from the two calcium silicates. The calcium
silicate hydrate stabilizes the soil by forming a hard structure around the soil particles, and the
calcium hydroxide stabilizes the soil through ion exchange, flocculation of the clay particles, and
over the long term, by secondary cementing material formed by release of silicates from the clay
and their combination with calcium from the calcium hydroxide. Herzog and Mitchell (1963)
believe that the calcium hydroxide generated from the hydration of the calcium silicates is more
reactive than hydrated lime, since the calcium hydroxide created from the calcium silicates is
very fine and well dispersed throughout the soil.
These chemical reactions will occur more quickly if the cement particles are smaller,
since a decrease in particle size will increase the surface area of the cement particles. Five
standard types of Portland cement are specified by ASTM C 150, and all except one have a
Blaine Fineness of 370 to 380 m2/kg. The Type III cement, or high early strength cement, is the
only standard Portland cement that has a much higher Blaine Fineness of 540 m2/kg. Type III
cement has the same chemical composition as Type I cement; Type I is the most available and
commonly used cement for soil stabilization, so fineness is the only difference between them.
The main disadvantage of the Type III cement is the higher cost associated with the more
stringent gradation requirements.
2.1.2 Microfine Cement
Microfine cement should hydrate more quickly and flow more easily than ordinary Portland
cement based on its smaller particle size and larger surface area, with a Blaine Fineness greater
5
than 800 m2/kg (Naudts et al. 2002). Accordingly, soil treated with microfine cement would be
expected to have higher early strength than soil treated with ordinary Portland cement.
However, Krizek and Pepper (2004) state that the microfine cement particles have a tendency to
flocculate, and in effect, create larger particles with an overall smaller surface area. To
counteract flocculation of microfine cement particles, dispersants are often used to keep the
cement particles separated. Gallagher (2000) adds that special high-speed shear mixers are
typically used in the field to separate the individual microfine cement particles, which should
also help prevent flocculation.
Gallagher (2000) indicates that microfine cement typically contains large percentages of
blast furnace slag and/or pumice, which Mamlouk and Zaniewski (1999) state increase the
workability and set time of the cement. Since microfine cement is typically used for grouting
applications, increases in workability and set time are usually beneficial. On the other hand,
blast furnace slag and pumice may not be desirable for high early strength because of the
increase in set time.
2.1.3 Lime
Little (1995) discusses two major lime stabilization reactions in clay soils, one in the short-term
and one in the long-term. The short-term process involves ion exchange between calcium ions
from lime and cations near the clay particle surface, which will only occur if the calcium ions
have a higher charge or if they have a greater concentration than the cations near the clay particle
surface. This ion exchange can be quite beneficial, since it tends to transform the soil from a
weak dispersed structure to a strong flocculated structure. The long-term pozzolanic reactions
begin as an increase in hydroxyl ions from the lime causes an increase in the pH of the soil
water, which can begin to dissolve the silicate and aluminate sheets of the clay. As the silica
and/or alumina are released, they can combine with the calcium to form calcium silicate hydrates
and/or calcium aluminate hydrates, which can cement the clay particles together.
Unlike cement, where increases in dosage rate continue to strengthen the soil, lime has an
optimal dosage rate for the maximum possible strength gain, which depends mainly on soil type
and mineralogy. Little (1995) describes only long-term pozzolanic reactions in the lime
stabilization of kaolinite, while he states that short-term ion exchange must be completed before
these same pozzolanic reactions occur in the lime stabilization of montmorillonite. Therefore,
6
higher dosages of lime are required to reach the optimal dosage for clays containing more
montmorillonite than kaolinite. Although clays containing montmorillonite may require more
lime to reach their optimal dose, they may be able to achieve higher strengths, since
montmorillonite may be more receptive to pozzolanic reactions due to its high specific surface
area, which allows greater access to silica and/or alumina. If, on the other hand, the lime dosage
is so high that the optimal dosage rate is exceeded, the strength gain may begin to slightly
decrease due to a decrease in the dry density of the soil-lime mixture (Alexander et al. 1972).
2.1.4 Calcium Carbide
Calcium carbide is used for the Speedy Moisture Test (ASTM D 4944), but it apparently has not
been used for soil stabilization. Nevertheless, calcium carbide should stabilize soil in a manner
similar to lime, and it could actually be more effective than lime.
When calcium carbide reacts with water in the soil, the end products are acetylene gas
and hydrated lime, with production of quicklime during an intermediate step, as demonstrated in
the equation below.
( ) ( ) ( ) ( )aqOHCagHCOHsCaC 22222 2 +→+
=
CaOHCOHCaC +→+ 2222
+
( )22 OHCaOHCaO →+
More water is consumed in these chemical reactions than is consumed by quicklime hydration
alone. In addition, more heat is generated by the calcium carbide reactions, which would
evaporate more water than would be evaporated by quicklime hydration alone. Furthermore, if
the acetylene gas were captured and combusted, even more water could be driven off. As an
alternative to combusting the acetylene gas, it may be possible to polymerize the acetylene gas in
the clay, since acetylene gas consists of unsaturated monomers that can be polymerized under
the right conditions. Such polymers could stiffen and strengthen the mixture.
7
2.1.5 Sodium Silicates
Ding et al. (1996) found that the addition of only sodium silicates to hydrated clay may actually
negatively affect soil stabilization. Clay particles typically have a net negative charge on their
face and a positive charge along their edges due to broken bonds. When sodium silicates are
added to hydrated clay, the negative silicate ions from the sodium silicates are attracted and
attach to clay particle edges causing entire clay particles to become negatively charged. If the
entire clay particles have a negative charge, they will repel one another and the clay structure
will become dispersed and weak.
Although sodium silicates may weaken clay when added alone, Ruff and Davidson
(1961) affirm that sodium silicates may strengthen clay if lime is added along with the sodium
silicates. The lime can be used as a source of calcium ions, and with the presence of both
calcium ions and silicate ions, calcium silicate gel can form, hydrate, and harden, thereby
cementing the clay particles together.
2.1.6 Super Absorbent Polymers
According to Dr. Joseph Rafalko (personal communication, 2006), soil could possibly be
stabilized with calcium and super absorbent polymers, such as sodium or potassium polyacrylic
acids. This combination of calcium and super absorbent polymers could stabilize the soil by
absorbing excess water, exchanging ions with the clay particles, and hardening a polymer
network throughout the soil. When the polymers absorb water, a weak gel is formed, but
calcium from other sources, such as quicklime or calcium carbide, could possibly crosslink the
polymers of sodium or potassium polyacrylic acid together to form a harder material.
Very little research exists on soil stabilization with calcium and sodium or potassium
polyacrylic acids, but Lambe (1951) studied a similar material, calcium acrylate, as a potential
soil stabilizer. The calcium acrylate should theoretically exchange ions with the soil as well as
crosslink other polymers of calcium acrylate together. Lambe (1951) found that the addition of
calcium acrylate did significantly increase the compressive strength. However, calcium acrylate
treated soil may lose strength over time, which may be a problem for a soil treated with calcium
and sodium or potassium polyacrylic acid as well (Karol 2003).
8
2.1.7 Dispersants/Superplasticizer/Water Reducers
Naudts et al. (2002) maintain that dispersants, superplasticizers, and water reducers are all
common cement admixtures that increase the workability and increase the strength of a cement
mixture at low water-to-cement ratios. More specifically, Gallagher (2000) indicates that
dispersants increase the workability by coating the cement particles with a negative charge so
they will repel one another, which also prevents flocculation of microfine cement particles. If
cement particles are prevented from flocculating into larger particles, the overall surface area
may not be reduced and chemical reactions may not be slowed.
2.1.8 Accelerators
Accelerators are cement admixtures that decrease set time and increase rate of strength gain for a
concrete mixture. Mamlouk and Zaniewski (1999) report that the most common type of
accelerator is calcium chloride, which can reduce the typical final set time from six hours to
three hours with a dosage rate of 1% of the cement weight, and to two hours with a dosage rate
of 2% of the cement weight. The Materials Group (1999) at the Federal Highway
Administration state that calcium chloride can slightly increase the workability of the cement
and reduce the amount of water needed, similar to the effect of dispersants, superplasticizers, and
water reducers, but to a lesser degree. However, exposure of metals to this accelerator should be
limited, since calcium chloride can corrode and weaken certain metals. Other non-chloride
accelerators can be used when contact with metal is unavoidable, such as in reinforced concrete,
but unfortunately, these accelerators are often not as effective as calcium chloride.
2.1.9 Polypropylene Fibers
Overall, polypropylene seems to be one of the most common materials used for fiber
reinforcement of soils, and it is manufactured in two forms: monofilament and fibrillated.
Monofilament fibers are individual, cylindrical fibers. Fibrillated fibers are flat, tape-like fibers
that Fletcher and Humphries (1991) describe as a latticework of “stems and webs” as the fibers
break apart during mixing and compaction.
2.1.10 Nylon Fibers
Nylon fibers are used as reinforcement in concrete to increase its ductility, durability, and
toughness. According to Zellers and Cruso (2002), when the nylon fibers are used in concrete,
9
they can absorb water, allowing the fibers to cure the concrete from the inside out. In addition to
curing the concrete, this absorbed water also contributes to adhesion between the fibers and
concrete. Although very little research has been done on the use of nylon fibers with soil, these
fibers may have the ability to mechanically and chemically stabilize soil, especially when
combined with cement.
2.1.11 Poly(vinyl) Alcohol Fibers
Like the nylon fibers, poly(vinyl) alcohol (PVA) fibers are typically not used for soil
stabilization, but they are used as concrete reinforcement in Engineered Cementitious
Composites (ECC) to increase ductility, durability, and toughness. Kanda and Li (1998) state
that when PVA fibers are used in cement, hydrogen bonds form between the hydroxyl groups of
the PVA fibers and the cement particles. However, De Bussetti and Ferreiro (2004) report that
clay has been stabilized with PVA solution instead of PVA fibers, where hydrogen bonds form
between the hydroxyl groups of the PVA molecules and the silicate sheets of the clay.
Combining these two findings, the hydroxyl groups of the PVA fibers should theoretically form
hydrogen bonds with the silicate sheets of the clay and could be effective stabilizing the clay soil
both chemically and mechanically. If the soil is also treated with cement in addition to the PVA
fibers, the fibers may bond better to a clay-cement mixture than clay alone, since bonding
between the fibers and cement has been verified.
According to Kanda and Li (1998), the hydrogen bonding between the PVA fibers and
the concrete is occasionally strong enough that the PVA fibers rupture instead of pulling out of
the cement matrix. If the PVA fibers do rupture due to strong hydrogen bonding, the ECC may
be too brittle for a particular application. To counteract this phenomenon, some PVA fibers are
coated with an oiling agent so that the PVA fibers will pull out of the cement matrix prior to
rupturing, and thereby increase the ductility of the ECC.
2.2 Engineering Research and Development Center
While the Air Force Research Laboratory has been funding this research at Virginia Tech, the
pavements branch of the U. S. Army Corps of Engineers has also been researching rapid soil
stabilization (Santoni et al. 2001; Tingle and Santoni 2003) for unsurfaced airfields supporting
C-17 aircraft traffic (Grogan and Tingle 1999; Tingle and Grogan 1999) at ERDC in Vicksburg,
10
MS, previously known as the Waterways Experiment Station. Their most recent research is part
of the Joint Rapid Airfield Construction (JRAC) program, whose goal is to rapidly upgrade or
construct new contingency airfields by accelerating site assessment and selection, soil
stabilization, construction, and repair and maintenance (Anderton 2005). A visit was made to
ERDC since certain aspects of JRAC relate directly to this research, such as soil stabilization,
mats, pavement design methods for unsurfaced airfields, and development of a rapid
construction process (Newman 2005).
To determine the most effective commercially available stabilizers for soils with CBR
values as low as 6, the pavements branch researchers at ERDC tested the UCS of silty sand
treated with different fiber types, cement, emulsion polymers, and polyurethanes, and also plan
to test the UCS of clay treated with lime, cement, fibers, and ionic stabilizers. Based on these
laboratory UCS tests and field test results, Newman (2005) determined the following for silty
sand:
• Even though the polyurethanes mixtures had higher UCS results, cement was the
most effective stabilizer, since the polyurethanes are difficult to handle, expensive,
hazardous, and have a short shelf life.
• Emulsion polymers were very effective in dust-proofing and water-proofing
applications.
• If cement was used with fibers, the 0.75-inch (19 mm) monofilament fibers were the
most effective by increasing UCS, increasing toughness, and decreasing cracking.
• If cement was not used, longer monofilament fibers were more effective.
Additionally, the researchers at ERDC are working to replace the AM-2 mat with a
lighter-weight mat, which also must be able to support aircraft traffic over a soil having a CBR
value of 6. Mats have been tested over both silty sand and clay, but Newman (2005) specifically
describes the testing of the Soloco Durabase, Soloco Bravo, and ACE mat over silty sand. Based
on this testing, the heavy-duty Soloco Durabase mat performed well, but may not be practical for
field applications. The lightweight ACE mat performed better than the lightweight Soloco Bravo
mat, especially for soils with a CBR value greater than 8.
11
ERDC researchers are also developing a new pavement design method for cement-
stabilized soil. This design method will still be based on some empirical data, as is the case in
all pavement design models, but it has a much more sound theoretical basis compared to the
CBR method currently in use. In this theoretical model, cement-stabilized soil will be
approximated as a granular material for layered-elastic design, since stabilized soil is assumed to
crack and break into pieces under loading, but only to a certain extent. So far based on field
testing, the researchers have already found that for each combination of stabilizer and soil type, a
certain threshold dosage rate exists at which the top base layer will be durable enough to hold up
reasonably against traffic. They have found that applying a dosage rate below the threshold will
result in significant cracking, while applying a dosage rate above the threshold will not be much
more effective than the threshold dosage rate.
In addition to this theoretical model, the researchers are also developing a more accurate
method to determine the stress distribution through a pavement design section for multiple wheel
loads and elliptical wheel loads by approximating these loads with many individual point loads.
Once appropriate point loads are determined, the superposition of the stress distributions of all
these individual point loads should more accurately represent the stress distribution for the
multiple and elliptical wheel loads than an approximation with an equivalent single wheel load
or a circular wheel load, which are often currently used for pavement design.
JRAC has completed development of a rapid construction process, which has already
been demonstrated at Fort Bragg, NC in 2004 with the construction of two aprons (Anderton
2005). At the Fort Bragg demonstration, the site terrain data was first obtained by driving over
the area of interest with a Rapid Assessment Vehicle – Engineer (RAVEN) equipped with a GPS
unit. Meanwhile, the soil at the site was analyzed with a soil analysis field kit developed by the
researchers at ERDC. Once the site terrain data was collected, the new grade for the site was
digitally designed, and then the site was cleared, grubbed, and graded to this design using
construction equipment also equipped with GPS. Lastly, mats were placed over a compacted
subgrade in half of the first apron, and then stabilizers, chosen based on the soil analysis, were
mixed into the soil and compacted in the remaining half of the first apron and the entire second
apron. The construction of the first apron only took 48 hours and the second apron took an
additional 27 hours to complete with an overall construction time of 75 hours.
12
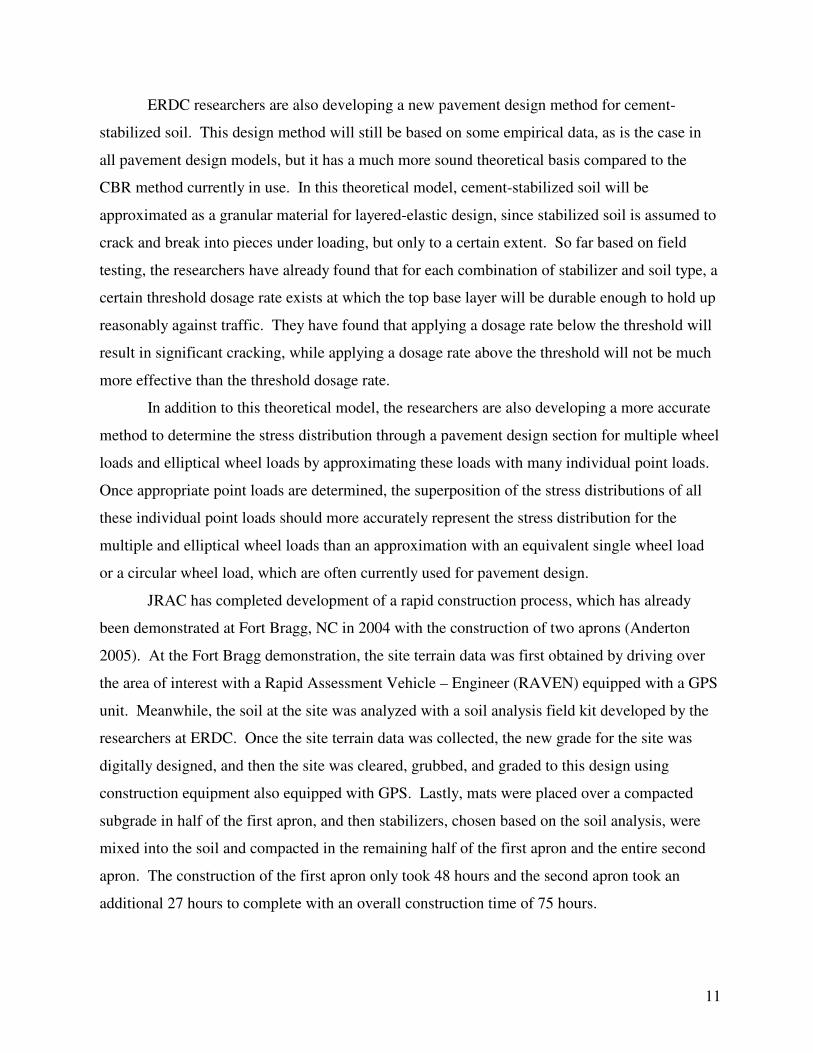
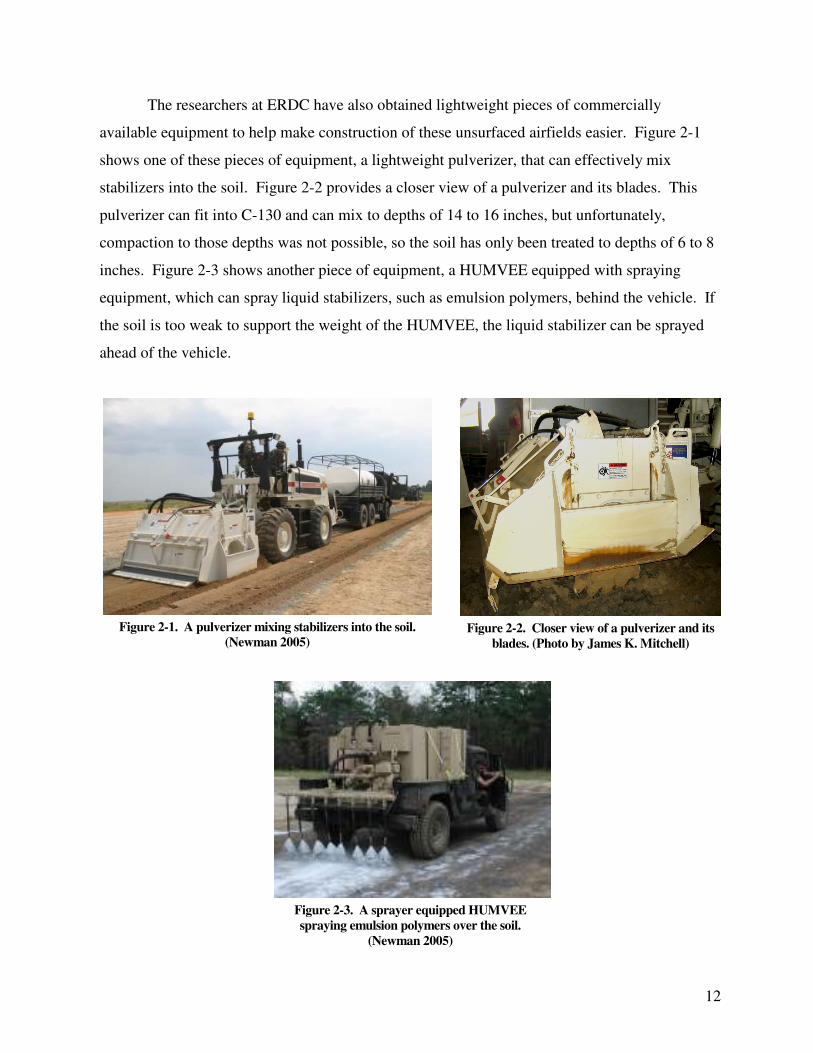
The researchers at ERDC have also obtained lightweight pieces of commercially
available equipment to help make construction of these unsurfaced airfields easier. Figure 2-1
shows one of these pieces of equipment, a lightweight pulverizer, that can effectively mix
stabilizers into the soil. Figure 2-2 provides a closer view of a pulverizer and its blades. This
pulverizer can fit into C-130 and can mix to depths of 14 to 16 inches, but unfortunately,
compaction to those depths was not possible, so the soil has only been treated to depths of 6 to 8
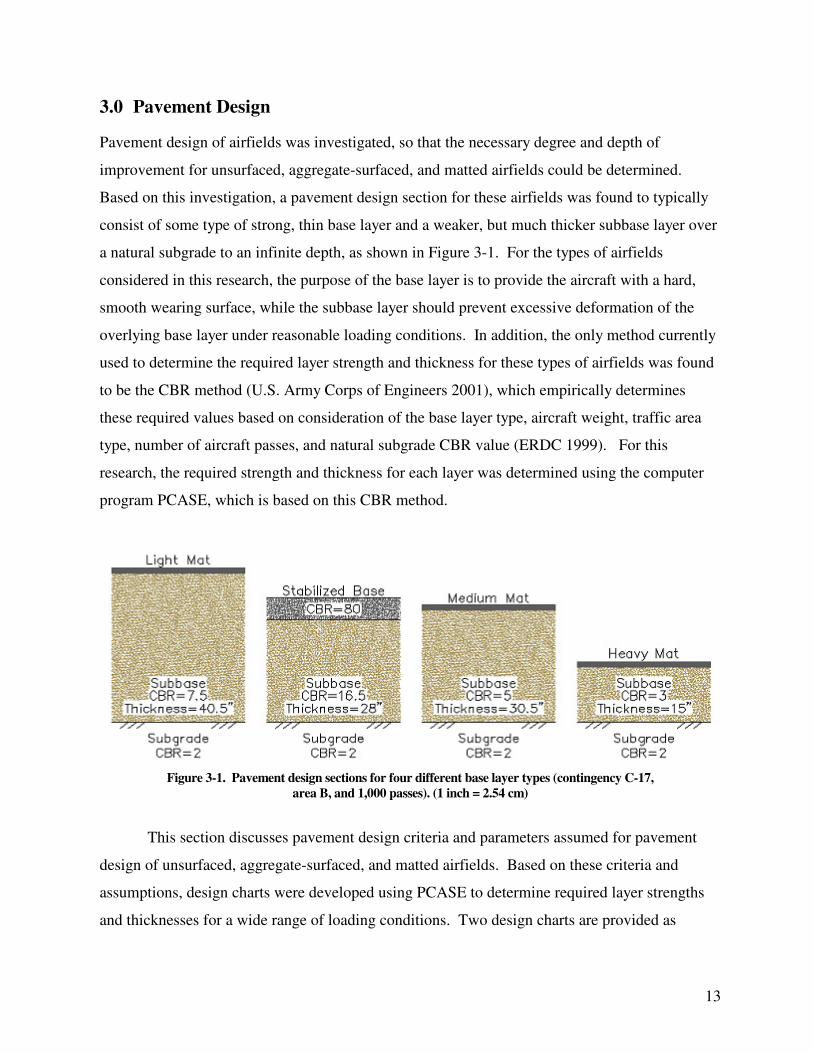
inches. Figure 2-3 shows another piece of equipment, a HUMVEE equipped with spraying
equipment, which can spray liquid stabilizers, such as emulsion polymers, behind the vehicle. If
the soil is too weak to support the weight of the HUMVEE, the liquid stabilizer can be sprayed
ahead of the vehicle.
Figure 2-1. A pulverizer mixing stabilizers into the soil.
(Newman 2005)
Figure 2-2. Closer view of a pulverizer and its
blades. (Photo by James K. Mitchell)
Figure 2-3. A sprayer equipped HUMVEE
spraying emulsion polymers over the soil.
(Newman 2005)
13
3.0 Pavement Design
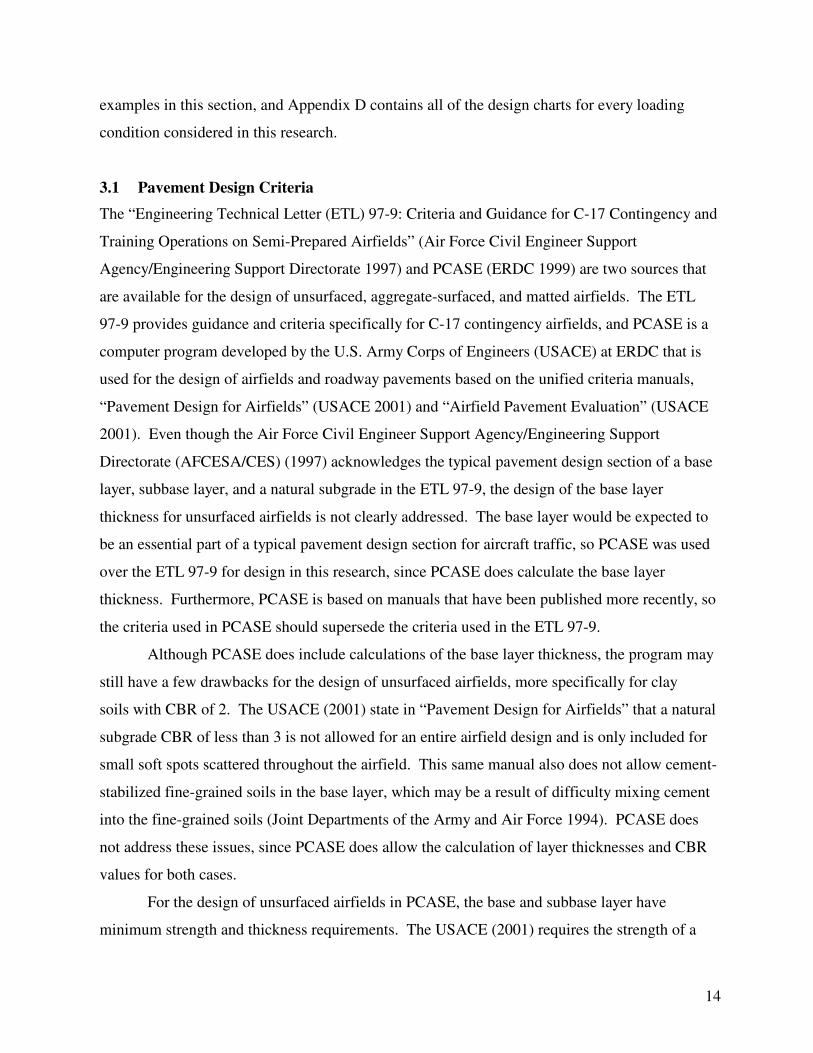
Pavement design of airfields was investigated, so that the necessary degree and depth of
improvement for unsurfaced, aggregate-surfaced, and matted airfields could be determined.
Based on this investigation, a pavement design section for these airfields was found to typically
consist of some type of strong, thin base layer and a weaker, but much thicker subbase layer over
a natural subgrade to an infinite depth, as shown in Figure 3-1. For the types of airfields
considered in this research, the purpose of the base layer is to provide the aircraft with a hard,
smooth wearing surface, while the subbase layer should prevent excessive deformation of the
overlying base layer under reasonable loading conditions. In addition, the only method currently
used to determine the required layer strength and thickness for these types of airfields was found
to be the CBR method (U.S. Army Corps of Engineers 2001), which empirically determines
these required values based on consideration of the base layer type, aircraft weight, traffic area
type, number of aircraft passes, and natural subgrade CBR value (ERDC 1999). For this
research, the required strength and thickness for each layer was determined using the computer
program PCASE, which is based on this CBR method.
Figure 3-1. Pavement design sections for four different base layer types (contingency C-17,
area B, and 1,000 passes). (1 inch = 2.54 cm)
This section discusses pavement design criteria and parameters assumed for pavement
design of unsurfaced, aggregate-surfaced, and matted airfields. Based on these criteria and
assumptions, design charts were developed using PCASE to determine required layer strengths
and thicknesses for a wide range of loading conditions. Two design charts are provided as
14
examples in this section, and Appendix D contains all of the design charts for every loading
condition considered in this research.
3.1 Pavement Design Criteria
The “Engineering Technical Letter (ETL) 97-9: Criteria and Guidance for C-17 Contingency and
Training Operations on Semi-Prepared Airfields” (Air Force Civil Engineer Support
Agency/Engineering Support Directorate 1997) and PCASE (ERDC 1999) are two sources that
are available for the design of unsurfaced, aggregate-surfaced, and matted airfields. The ETL
97-9 provides guidance and criteria specifically for C-17 contingency airfields, and PCASE is a
computer program developed by the U.S. Army Corps of Engineers (USACE) at ERDC that is
used for the design of airfields and roadway pavements based on the unified criteria manuals,
“Pavement Design for Airfields” (USACE 2001) and “Airfield Pavement Evaluation” (USACE
2001). Even though the Air Force Civil Engineer Support Agency/Engineering Support
Directorate (AFCESA/CES) (1997) acknowledges the typical pavement design section of a base
layer, subbase layer, and a natural subgrade in the ETL 97-9, the design of the base layer
thickness for unsurfaced airfields is not clearly addressed. The base layer would be expected to
be an essential part of a typical pavement design section for aircraft traffic, so PCASE was used
over the ETL 97-9 for design in this research, since PCASE does calculate the base layer
thickness. Furthermore, PCASE is based on manuals that have been published more recently, so
the criteria used in PCASE should supersede the criteria used in the ETL 97-9.
Although PCASE does include calculations of the base layer thickness, the program may
still have a few drawbacks for the design of unsurfaced airfields, more specifically for clay
soils with CBR of 2. The USACE (2001) state in “Pavement Design for Airfields” that a natural
subgrade CBR of less than 3 is not allowed for an entire airfield design and is only included for
small soft spots scattered throughout the airfield. This same manual also does not allow cement-
stabilized fine-grained soils in the base layer, which may be a result of difficulty mixing cement
into the fine-grained soils (Joint Departments of the Army and Air Force 1994). PCASE does
not address these issues, since PCASE does allow the calculation of layer thicknesses and CBR
values for both cases.
For the design of unsurfaced airfields in PCASE, the base and subbase layer have
minimum strength and thickness requirements. The USACE (2001) requires the strength of a
15
stabilized base layer to have a UCS of 750 psi and a stabilized subbase layer to have a UCS of
250 psi after 7 days for cement and after 28 days for lime. In addition to the UCS, the USACE
(2001) also specifies that the base layer must have a CBR value ranging from 80 to 100, and the
subbase layer must have a CBR value ranging from 20 to 50. However, PCASE only uses CBR
values for the design of unsurfaced airfields. For the minimum design thickness, the USACE
(2001) only discusses flexible pavement design, which requires that contingency airfields and
aprons have six inches of a base layer as well as a surface layer, except for medium and heavy
loaded aprons, which require an additional two or three inches of base layer. In contrast, PCASE
calculates a minimum base layer thickness of six inches without a surfacing layer for all
unsurfaced airfield conditions considered in this research.
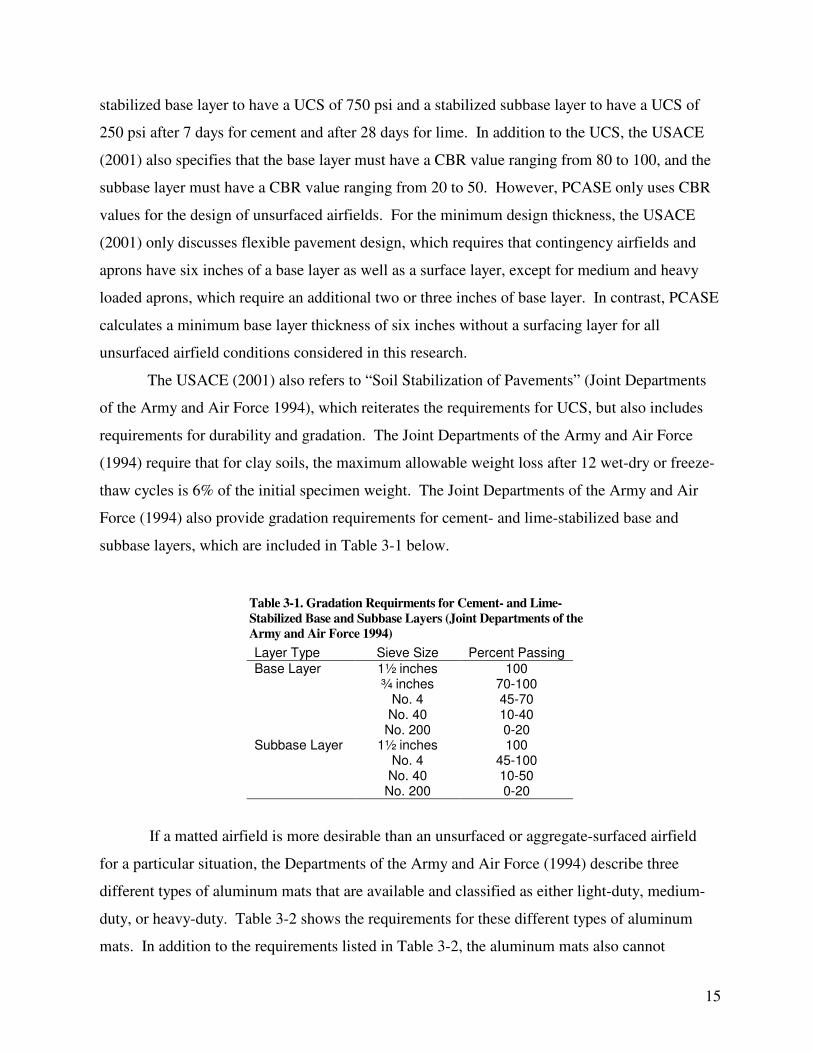
The USACE (2001) also refers to “Soil Stabilization of Pavements” (Joint Departments
of the Army and Air Force 1994), which reiterates the requirements for UCS, but also includes
requirements for durability and gradation. The Joint Departments of the Army and Air Force
(1994) require that for clay soils, the maximum allowable weight loss after 12 wet-dry or freeze-
thaw cycles is 6% of the initial specimen weight. The Joint Departments of the Army and Air
Force (1994) also provide gradation requirements for cement- and lime-stabilized base and
subbase layers, which are included in Table 3-1 below.
Table 3-1. Gradation Requirments for Cement- and Lime-
Stabilized Base and Subbase Layers (Joint Departments of the
Army and Air Force 1994)
Layer Type Sieve Size Percent Passing
1½ inches 100 ¾ inches 70-100
No. 4 45-70 No. 40 10-40
Base Layer
No. 200 0-20 1½ inches 100
No. 4 45-100 No. 40 10-50
Subbase Layer
No. 200 0-20
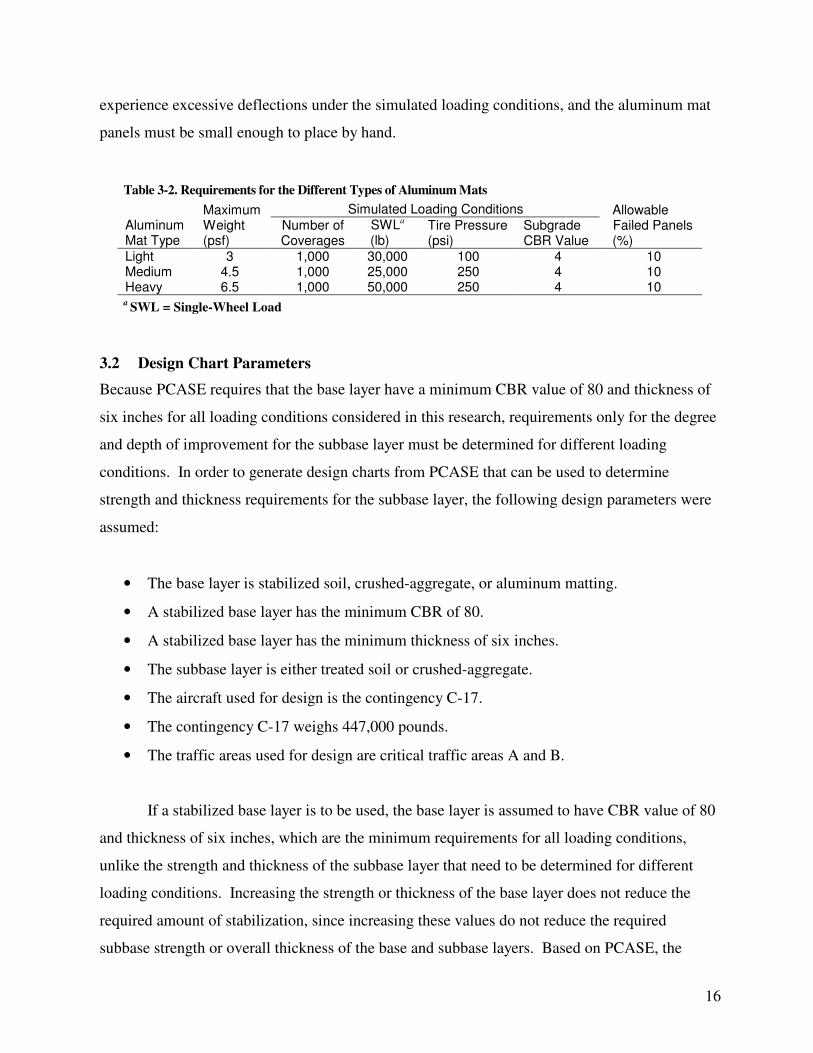
If a matted airfield is more desirable than an unsurfaced or aggregate-surfaced airfield
for a particular situation, the Departments of the Army and Air Force (1994) describe three
different types of aluminum mats that are available and classified as either light-duty, medium-
duty, or heavy-duty. Table 3-2 shows the requirements for these different types of aluminum
mats. In addition to the requirements listed in Table 3-2, the aluminum mats also cannot
16
experience excessive deflections under the simulated loading conditions, and the aluminum mat
panels must be small enough to place by hand.
Table 3-2. Requirements for the Different Types of Aluminum Mats
Simulated Loading Conditions
Aluminum Mat Type
Maximum Weight (psf)
Number of Coverages
SWLa (lb)
Tire Pressure (psi)
Subgrade CBR Value
Allowable Failed Panels (%)
Light 3 1,000 30,000 100 4 10 Medium 4.5 1,000 25,000 250 4 10 Heavy 6.5 1,000 50,000 250 4 10 a SWL = Single-Wheel Load
3.2 Design Chart Parameters
Because PCASE requires that the base layer have a minimum CBR value of 80 and thickness of
six inches for all loading conditions considered in this research, requirements only for the degree
and depth of improvement for the subbase layer must be determined for different loading
conditions. In order to generate design charts from PCASE that can be used to determine
strength and thickness requirements for the subbase layer, the following design parameters were
assumed:
• The base layer is stabilized soil, crushed-aggregate, or aluminum matting.
• A stabilized base layer has the minimum CBR of 80.
• A stabilized base layer has the minimum thickness of six inches.
• The subbase layer is either treated soil or crushed-aggregate.
• The aircraft used for design is the contingency C-17.
• The contingency C-17 weighs 447,000 pounds.
• The traffic areas used for design are critical traffic areas A and B.
If a stabilized base layer is to be used, the base layer is assumed to have CBR value of 80
and thickness of six inches, which are the minimum requirements for all loading conditions,
unlike the strength and thickness of the subbase layer that need to be determined for different
loading conditions. Increasing the strength or thickness of the base layer does not reduce the
required amount of stabilization, since increasing these values do not reduce the required
subbase strength or overall thickness of the base and subbase layers. Based on PCASE, the
17
subbase strength and overall thickness are not functions of the strength or thickness of any layer,
but functions of the natural subgrade CBR, type of overlying base layer, number of aircraft
passes, aircraft weight, and traffic area type.
As mentioned previously, aircraft traffic from C-17s and C-130s must be considered for
design, although the C-17 was assumed for design because the C-17 weighs significantly more
than the C-130. The C-17 has a maximum gross weight of 585,000 pounds, a contingency
weight of 447,000 pounds (AFCESA/CES 1997), and an empty weight of 277,000 pounds (U.S.
Air Force 2006), while the C-130 has a maximum overload weight of 175,000 pounds, a
maximum normal weight of 155,000 pounds, and an empty weight of 75,331 pounds (U.S. Navy
2000). More specifically, the contingency C-17 weight was chosen, since this research was
requested for soil stabilization in contingency airfields.
Even though most airfields consist of traffic areas A, B, C, and D according to the
USACE (2001), the design charts generated from PCASE only include the most critical and
relevant traffic areas A and B. Traffic areas A and B are the most critical areas and require the
thickest layers with the highest CBR values, since traffic area A receives channelized traffic and
the maximum design weight of the aircraft, and traffic area B receives more evenly distributed
traffic and the maximum design weight of the aircraft, while traffic area C receives a low traffic
volume or aircraft weighing below the maximum design weight, and traffic area D receives a
very low traffic volume or aircraft weighing much lower than the maximum design weight.
Moreover, traffic areas A and B are the most relevant to this research because contingency
airfields for C-17s and C-130s consist only of traffic area A, and all of the apron areas except
hangar access aprons are classified as traffic area B (USACE 2001).
3.3 Design Charts and Layer Requirements
As previously discussed, a stabilized base layer must have a minimum CBR value of 80 and
thickness of six inches, while the required strength and thickness for the subbase layer can be
determined from the design charts generated from PCASE that are shown in Appendix D. These
design charts are based on the assumed design parameters discussed in the previous section and
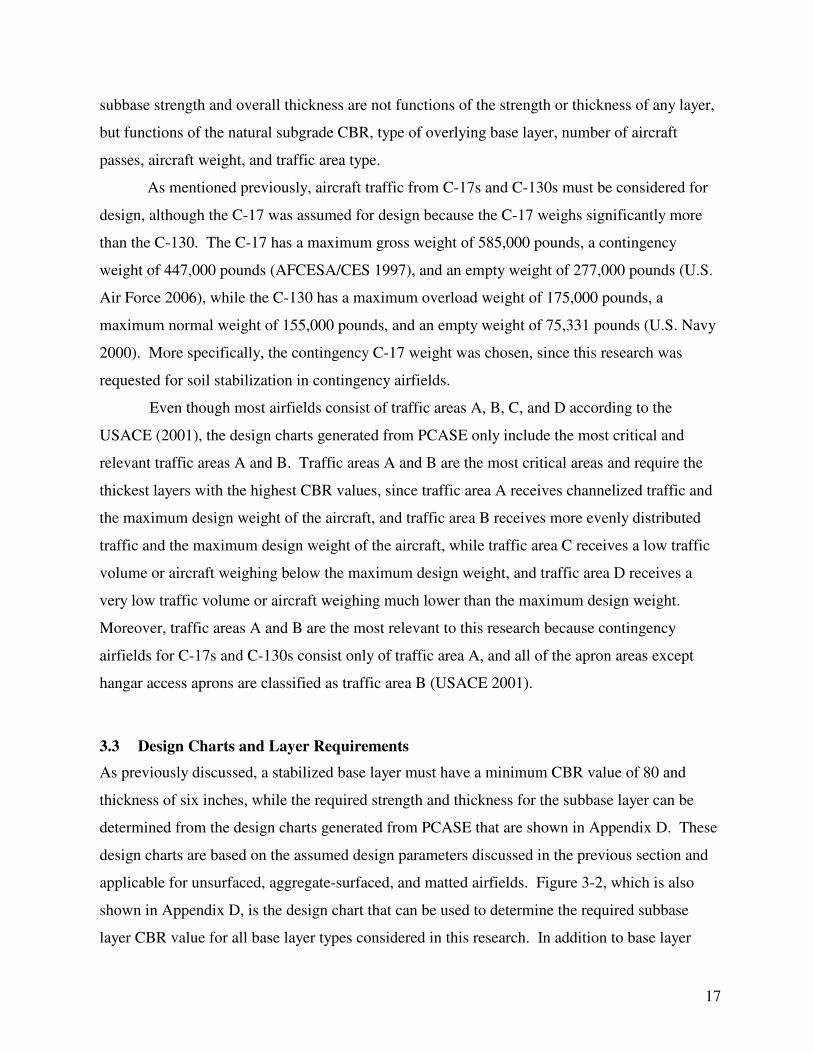
applicable for unsurfaced, aggregate-surfaced, and matted airfields. Figure 3-2, which is also
shown in Appendix D, is the design chart that can be used to determine the required subbase
layer CBR value for all base layer types considered in this research. In addition to base layer
18
type, the required subbase layer CBR value in Figure 3-2 is also a function of the number of
aircraft passes, aircraft weight, and traffic area type. Figure 3-3 is an example of one of the
design charts in Appendix D that can be used to determine the required subbase thickness for an
unsurfaced or aggregate-surfaced airfield in traffic area B. In addition to base layer and traffic
area, the required subbase thickness is also based on the number of aircraft passes, aircraft
weight, and subgrade CBR. Six other thickness design charts are also included in Appendix D
for matted airfields in traffic areas A and B.
Number of Passes
100 1000 10000
Su
bb
ase
CB
R V
alu
e
0
10
20
30
40
50
No Mat w/ 6" Stabilized Base or Crushed-Aggregate
Light Mat
Medium Mat
Heavy Mat
Area A
Area A
Area A
Area B
Area B
Area B
Area B
Figure 3-2. CBR design chart for a contingency C-17.
19
0
10
20
30
40
50
60
70
100 1000 10000
Number of Passes
Su
bb
ase
Th
ickn
es
s (
in)
Subgrade
CBR2
4
68
10
Figure 3-3. Thickness design chart for no mat with six inches of a stabilized base or crushed-
aggregate (contingency C-17 and area B). (1 inch = 2.54 cm)
Design charts for traffic area A in unsurfaced and aggregate-surfaced airfields are not
included in Appendix D because such surfacing is not an option for traffic area A in PCASE for
the design of these airfields. In contrast, charts specifically for the design of unsurfaced and
aggregate-surfaced airfields in ETL 97-9 only cover traffic area A, which suggests that these
airfields are allowed in traffic area A, but are uncommon. However, if traffic area A is required
for the design of an unsurfaced or aggregate-surfaced airfield, it may be possible to project the
design requirements for traffic area A from traffic area B by studying the difference between the
design requirements for traffic areas A and B in matted airfields, although such projections are
beyond the scope of this report.
20
4.0 Materials
This section provides background information on the soils used in this research, the soils’
properties and composition determined from various index tests and mineralogical analyses, and
the required water content for each soil to achieve an initial CBR value of 2. In addition, this
section also provides relevant properties of all the stabilizers used in this research.
4.1 Soils
The four different clays used for this research are Staunton clay, Northern Virginia (NoVa) clay,
Vicksburg Buckshot clay (VBC), and Rome clay. The VBC and the Rome clay were used for
this research because these two clays were requested by the Air Force. The NoVa clay and
Staunton clay were obtained from another research project conducted at Virginia Tech by
Geiman (2005) and used for this research because significant amounts of both clays were
available and information on both clays was readily accessible. Moreover, the NoVa and
Staunton clay were used for this research to provide a wider range of clay types in addition to the
clays that were specifically requested. Geiman (2005) obtained the NoVa clay from Springfield,
VA and Staunton clay from Staunton, VA, and the U.S. Army Corps of Engineers provided the
Rome clay from Rome Air Force Base, NY and VBC from Vicksburg, MS.
4.1.1 Soil Characterization
A wide range of index tests was conducted according to ASTM standards on the VBC and Rome
clay to characterize their properties, which was not necessary for the Staunton and NoVa clay,
since Geiman (2005) had already determined their index properties. Table 4-1 shows a list of the
different tests that were run and their corresponding ASTM standard number. Table 4-2
summarizes the soil index properties that resulted from these tests for the VBC and Rome clay
and the soil index properties obtained from Geiman (2005) for the Staunton and NoVa clay.
21
Table 4-1. Test Name and Corresponding ASTM Standard
Test Name ASTM Standard
Moisture content (oven drying) ASTM D 2216 Moisture content (microwave oven drying) ASTM D 4643 Particle size distribution ASTM D 422 Atterberg limits ASTM D 4318 Soil classification ASTM D 2487 & ASTM D 2488 Organic content ASTM D 2974 Specific gravity ASTM D 854 pH ASTM D 4972
Table 4-2. Summary of Soil Index Properties
Atterberg Limits Soil
Name USCS Group Name LL PL PI
Fines (% < #200)
Max. Dry
Unit Weighta
(pcf)b
Opt. Moisture
Contenta
(%) Specific Gravity
Organic Content (%) pHd
Staunton Clay
CH Fat Clay
53 25 28 81 92.0 26.0 2.74 3.7 4.3
NoVa Clay
CL Lean Clay
40 20 20 66 106.3 20.2 2.80 2.7 4.4
VBC CH Fat Clay
84 35 49 > 95 89.8 27.8 2.79 –c 8.3
Rome Clay
CL Lean Clay
32 23 9 93 110.5 18.5 2.71 – 7.5
a Standard compactive effort (ATM D 698)
b 1 pcf = 0.1571 kN/m
3 c Property not tested
d Tests conducted in distilled water
In addition to the index tests, mineralogical analyses were also performed on all four
clays. Table 4-3 shows the percent minerals in the clay fraction, which Professor Lucian
Zelazny of the Crop and Soil Environmental Sciences Department at Virginia Tech determined
for all four clays. For these mineralogical analyses, the quantity of kaolinite in each clay fraction
was first determined by thermogravimetric analysis (TGA) using Georgia kaolinite as a standard.
The remaining percentages of minerals were then determined by X-ray diffraction using the
TGA-determined kaolinite as an internal standard. The percentage of kaolinite, gibbsite, and
quartz may have an associated error margin of about 2% to 3%, and the remaining minerals may
have an error margin up to 5%. Although amorphous material was not detected in any of the
clays, up to approximately 2% to 3% could possibly be present.
22
Table 4-3. Percent Minerals in the Clay Fraction
Soil Name Kaolinite
Mont-morillonite Mica Vermiculite HIV
a Gibbsite Quartz Feldspar Amphibole
Staunton Clay
45% 20% 10% 10% 4% 1% 10% –b –
NoVa Clay
25% 35% 5% 15% 5% 3% 12% – –
VBC 10% 60% 10% 15% – – 5% – –
Rome Clay
10% 5% 35% 20% 5% Tc 15% 5% 5%
a HIV = Hydroxyl Interlayered Vermiculite
b Negligible percentage of mineral
c T = Trace percentage of mineral
4.1.2 Initial Water Contents
To compare the effectiveness of stabilizers for the four soils, the water contents of all four soils
were adjusted to produce the same initial untreated strength, as represented by an initial CBR of
2. CBR values were used to determine the untreated soil strengths because airfield design is
typically based on CBR values, and a CBR value of 2 was selected by the Air Force because this
value represents a very poor subgrade condition. CBR values were determined for each soil
according to ASTM D 1883 at various water contents using standard Proctor effort (ASTM D
698). Once enough CBR data was collected, curves of CBR value vs. water content for each soil
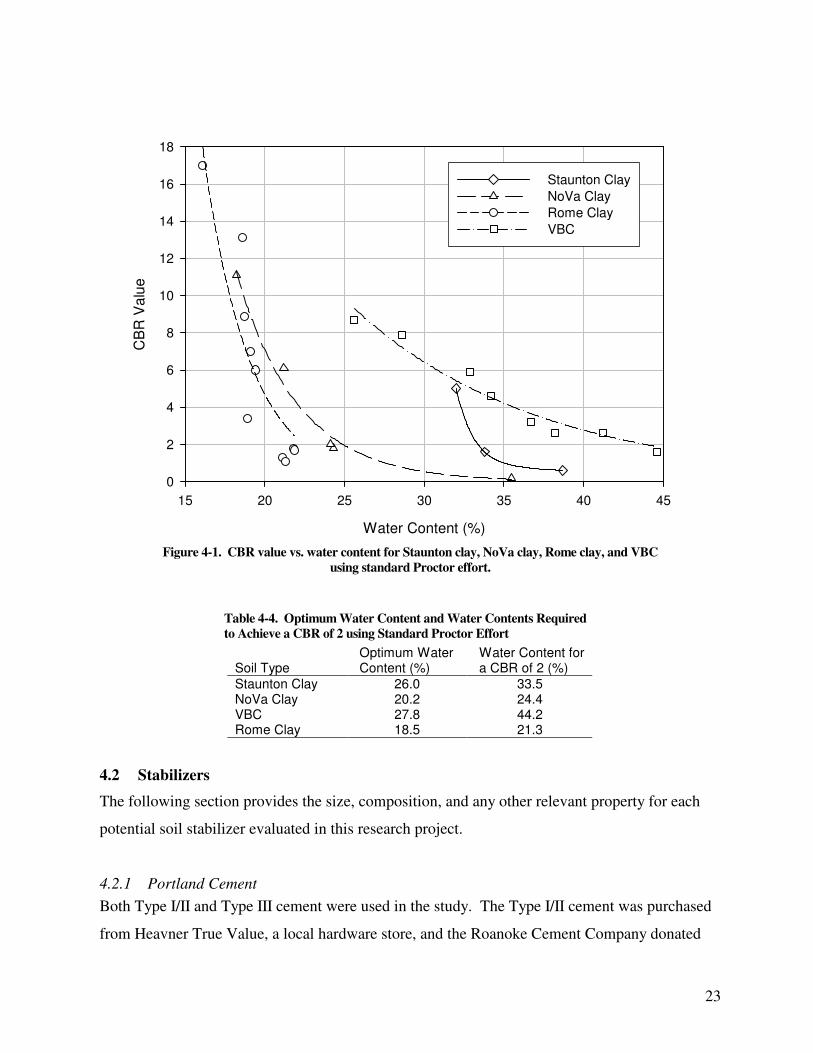
were established as shown in Figure 4-1. The required initial water contents for all four clays to
achieve a CBR of 2 were then determined from Figure 4-1 and are listed in Table 4-4.
23
Water Content (%)
15 20 25 30 35 40 45
CB
R V
alu
e
0
2
4
6
8
10
12
14
16
18
Staunton Clay
NoVa Clay
Rome Clay
VBC
Figure 4-1. CBR value vs. water content for Staunton clay, NoVa clay, Rome clay, and VBC
using standard Proctor effort.
Table 4-4. Optimum Water Content and Water Contents Required
to Achieve a CBR of 2 using Standard Proctor Effort
Soil Type Optimum Water Content (%)
Water Content for a CBR of 2 (%)
Staunton Clay 26.0 33.5 NoVa Clay 20.2 24.4 VBC 27.8 44.2 Rome Clay 18.5 21.3
4.2 Stabilizers
The following section provides the size, composition, and any other relevant property for each
potential soil stabilizer evaluated in this research project.
4.2.1 Portland Cement
Both Type I/II and Type III cement were used in the study. The Type I/II cement was purchased
from Heavner True Value, a local hardware store, and the Roanoke Cement Company donated
24
the Type III cement. ASTM C 150 specifies that the composition of both Type I and Type III
cement has a maximum of 55 to 56% C3S, 19% C2S, 10% C3A, and 7% C4AF, while the
composition of Type II cement has a maximum of 51% C3S, 24% C2S, 6% C3A, and 11% C4AF.
According to Mamlouk and Zaniewski (1999), the Type I/II cement must meet the compositional
requirements of both Type I and Type II cements.
4.2.2 Microfine Cement
Four types of microfine cement were used in this study. SureCrete donated the Nittetsu Super
Fine, U.S. Grout donated the Type V Premium Grout, and Degussa Building Systems donated
Embeco 885 and 14K HY Flow. The Nittetsu Super Fine consists of 30% Portland cement and
70% blast furnace slag, and it has a Blaine fineness of 900 m2/kg. The Type V Premium Grout
consists of 45% Type V cement and 55% pumice, and it has a Blaine fineness of 1,710 m2/kg. In
addition, the Type V Premium Grout also contains 1.5% of a superplasticizer by dry weight of
cement. Embeco 885 consists mainly of 15% to 40% Portland cement, 15% to 40% silica, 15%
to 40% iron oxide, and 5% to 10% limestone. Embeco 885 also contains less than 5% of
gypsum, calcium oxide, amorphous silica, and magnesium oxide. 14K HY Flow mainly consists
of 30% to 60% silica, 15% to 40% Portland cement, and 0% to 10% limestone. 14K HY Flow
also contains less than 5% of calcium oxide, gypsum, amorphous silica, magnesium oxide, and
alumina cement.
4.2.3 Lime
Pelletized and pulverized quicklimes were chosen over hydrated lime in the study, since
quicklime consumes more water during the lime stabilization process. Chemical Lime donated
the pelletized quicklime and Graymont, Inc. donated the pulverized quicklime. The pelletized
quicklime contains more than 90% CaO and has particles are less than 0.125 inches (3.2 mm) in
size. The pulverized quicklime contains more than 90% CaO and has particles less than 0.0058
inches (0.15 mm) in size such that it can pass through a 100-mesh screen.
4.2.4 Calcium Carbide
The calcium carbide used in this study was purchased from ELE International and is a reagent
for the Speedy Moisture Test. It contains 75% to 85% calcium carbide and 10% to 20%
calcium oxide.
25
4.2.5 Sodium Silicates
The PQ Corporation donated the sodium silicate used in this study under the name of SS®65
Powder. The sodium silicate consists of 74.4% SiO2, 23.1% Na2O, and 0% H20, and has
particles less than 0.0083 inches (0.21 mm) in size such that it can pass through a 65-mesh
screen.
4.2.6 Super Absorbent Polymers
Three types of super absorbent polymers were used in this study. Emerging Technologies, Inc.
donated the super absorbent polymers under the names of LiquiBlock 2G-90, LiquiBlock 40K,
and LiquiBlock 41K. LiquiBlock 2G-90 is a sodium salt of crosslinked polyacrylic acids that
gels in the presence of water and can absorb more than 200 times its weight in water.
LiquiBlock 2G-90 is granular in form with particle sizes ranging from 0.0039 to 0.033 inches
(0.1 to 0.85 mm). LiquiBlock 40K and 41K are both potassium salts of crosslinked polyacrylic
acids/polyacrylamide copolymers in granular form that also gel in the presence of water.
LiquiBlock 40K can absorb more than 200 times its weight in water and LiquiBlock 41K can
absorb more than 180 times its weight in water. The main difference between LiquiBlock 40K
and 41K is their particle sizes, which range from 0.0079 to 0.039 inches (0.2 to 1 mm) for
LiquiBlock 40K and 0.039 to 0.12 inches (1 to 3 mm) for LiquiBlock 41K.
4.2.7 Superplasticizer
Alco Chemical donated the superplasticizer used in this study under the name of Narlex D36.
Narlex D36 is a sodium salt of an acrylic acid copolymer supplied as a powder with typical
particle sizes of 0.003 inches (0.075 mm).
4.2.8 Accelerator
Two types of accelerators were used in this study. Grace Construction donated the accelerator
under the name of Daraccel and Fritz-Pak donated the accelerator under the name of Fritz-Pak
NCA. Daraccel is a calcium chloride accelerator in liquid form and meets the requirements of
ASTM C 494 as a Type E admixture. Fritz-Pak NCA is a non-chloride accelerator in powdered
form that meets the requirements of ASTM C 494 as a Type C and Type E admixture.
26
4.2.9 Polypropylene Fibers
Two types of polypropylene fibers were used in this study. Euclid Chemical Company donated
the polypropylene fibers under the names of Eucon fibrillated polypropylene (FP) and
Fiberstrand 100. The Eucon FP fibers are flat fibrillated fibers that are 0.001 inches (0.025 mm)
thick, variable in width, and 0.75 inches (19 mm) long, with a specific gravity of 0.91. The
Eucon FP fibers have a tensile strength of 97 ksi (0.67 GPa) and a Young’s Modulus of 580 ksi
(4 GPa). The Fiberstrand 100 fibers are monofilament polypropylene fibers that are 0.75 inches
(19 mm) long and have a nominal diameter of 0.002 inches (0.051 mm). The Fiberstrand 100
fibers have a specific gravity of 0.92 and a Young’s Modulus of 550 ksi (3.8 GPa).
4.2.10 Nylon Fibers
Kuraray America, Inc. donated the nylon fibers used in this study under the name of NyconRC.
The NyconRC fibers are 0.75 inches (19 mm) long and 0.0013 inches (0.033 mm) in diameter,
with a specific gravity of 1.16. These fibers have a tensile strength of 130 ksi (0.9 GPa) and a
Young’s Modulus of 750 ksi (5.2 GPa). The NyconRC fibers can absorb up to 4.5% of their
weight in water.
4.2.11 Poly(vinyl) Alcohol Fibers
Two types of PVA fibers were used in this study. Kuraray America, Inc. donated both the PVA
fibers under the names of RSC15 fibers and RECS100 fibers. The RSC15 fibers are 0.33 inches
(8.4 mm) long and 0.0016 inches (0.041 mm) in diameter, with a specific gravity of 1.3. The
RSC15 fibers have a tensile strength of 203 ksi (1.4 GPa). The RECS100 fibers are 0.50 inches
(13 mm) long and 0.004 inches (0.1 mm) in diameter, with a specific gravity of 1.3. The
RECS100 fibers have a tensile strength of 160 ksi (1.1 GPa) and a Young’s Modulus of 4,210
ksi (29 GPa). Both fibers are resin bundled for easier mixing. According to Bob Zellers, the
Vice President of Technology and Engineering at Nycon, Inc., the RECS100 fibers are coated in
an oiling agent, while the RSC15 fibers are not.
27
5.0 Stabilizer Study
The purpose of this study was to determine the most effective stabilizer by treating the soil with
similar dosage rates of different stabilizers, and then comparing their resulting three-day UCS
and toughness.
This section describes the testing methods used to evaluate the stabilizers, lists the
different stabilizers and combination of stabilizers used to treat the soil, and lists the dosage rates
in which the different stabilizers were applied. This section also presents the results from each
treatment as well as a discussion of the results.
5.1 Laboratory Tests
UCS tests were run in the stabilizer study to evaluate the three-day UCS of the soils treated with
similar dosage rates of different stabilizers, since UCS tests only require a small amount of soil
for samples that can be prepared and tested quickly. To determine this three-day UCS for each
stabilizer or combination of stabilizers, two batches were prepared and tested, where a batch for
the stabilizer study consisted of four samples tested after 1, 3, 7, and 28 days of curing. Once all
of the UCS test data were collected, they were plotted against curing time for both batches, and
the three-day UCS was calculated from a trend line that best fit the data. This process mitigates
the effect of scatter in the data. All of the UCS tests were run in accordance with ASTM D
2166, and the lab procedure described in Appendix A.
In addition to strength, the results from UCS tests were also used to evaluate the
toughness of the treated soils. Toughness is a measure of the amount of energy a material can
absorb, which can be evaluated by calculating the area underneath the stress-strain curve from a
UCS test. Toughness is important because chemically treated-soils without fibers exhibit brittle
stress-strain curves and have relatively little toughness, which may cause the treated soil to crack
and fail suddenly. Not only will a runway fail more quickly, but this sudden cracking and failure
can also create foreign object debris on a runway surface, which fibers have been found to
reduce (Newman 2005). An increase in toughness is desirable, as the longevity of the airfield
would be expected to increase with increasing toughness.
For the stabilizer study, toughness of untreated samples and samples treated with only
fibers was calculated at 15% strain because these samples were very ductile and their peak
strengths occurred at very high strains around 15%. On the other hand, toughness of samples
28
treated with chemical stabilizers or chemical stabilizers and fibers was calculated at 2% strain
because these samples were more brittle and more significant differences occurred in their stress-
strain curves at lower strains.
5.2 Dosage Rates
In this study, the stabilizers were categorized as primary or secondary stabilizers. The primary
stabilizers were applied at a dosage rate of 5% chemical stabilizer or 0.05% to 1% fibers by dry
weight of soil. Secondary stabilizers were used in addition to the primary stabilizers. The most
typical dosage rate for the secondary stabilizers was 1% by dry weight of soil, but these dosage
rates ranged from 0.1% up to 3.33%. Table 5-1 summarizes the UCS test dosage rates for the
Staunton clay, the NoVa clay, and the VBC. Due to the limited amount of material available,
UCS tests were only run on untreated Rome clay.
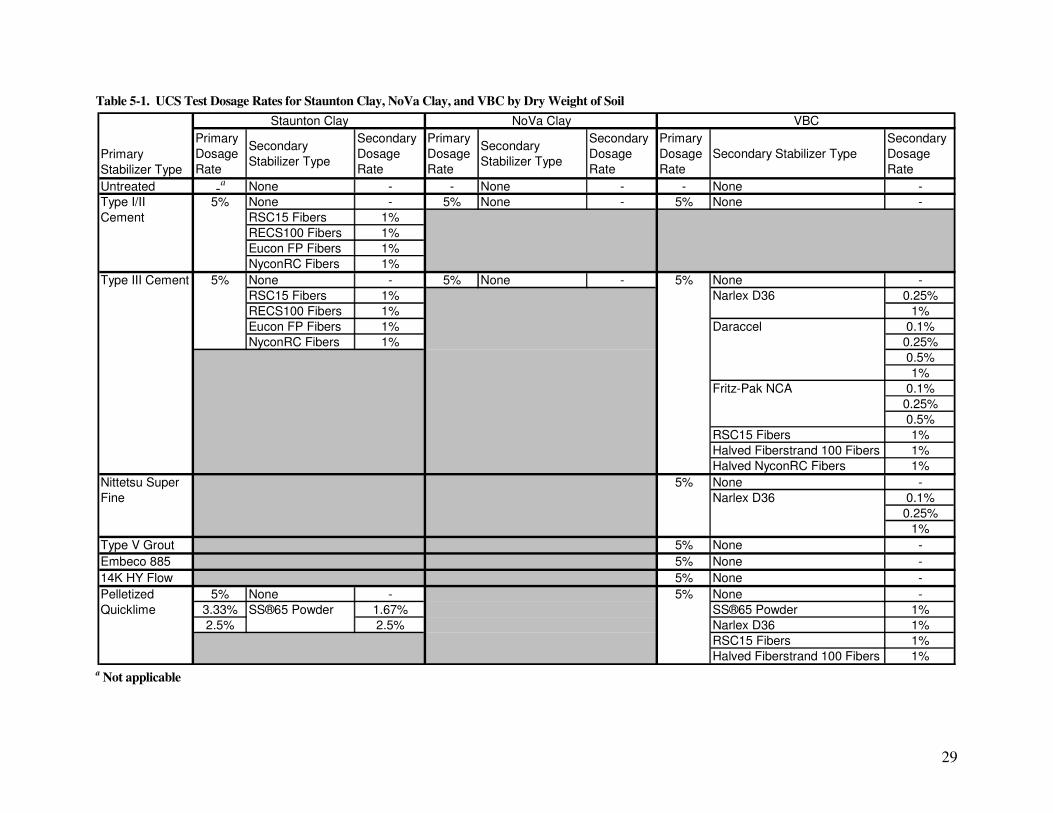
29
Table 5-1. UCS Test Dosage Rates for Staunton Clay, NoVa Clay, and VBC by Dry Weight of Soil
Primary
Dosage
Rate
Secondary
Stabilizer Type
Secondary
Dosage
Rate
Primary
Dosage
Rate
Secondary
Stabilizer Type
Secondary
Dosage
Rate
Primary
Dosage
Rate
Secondary Stabilizer Type
Secondary
Dosage
Rate
Untreated -a None - - None - - None -
None - 5% None - 5% None -
RSC15 Fibers 1%
RECS100 Fibers 1%
Eucon FP Fibers 1%
NyconRC Fibers 1%
None - 5% None - None -
RSC15 Fibers 1% 0.25%
RECS100 Fibers 1% 1%
Eucon FP Fibers 1% 0.1%
NyconRC Fibers 1% 0.25%
0.5%
1%
0.1%
0.25%
0.5%
RSC15 Fibers 1%
Halved Fiberstrand 100 Fibers 1%
Halved NyconRC Fibers 1%
None -
0.1%
0.25%
1%
Type V Grout 5% None -
Embeco 885 5% None -
14K HY Flow 5% None -
5% None - None -
3.33% 1.67% SS®65 Powder 1%
2.5% 2.5% Narlex D36 1%
RSC15 Fibers 1%
Halved Fiberstrand 100 Fibers 1%
Pelletized
Quicklime
Nittetsu Super
Fine
VBC
Primary
Stabilizer Type
Staunton Clay NoVa Clay
5%
Type I/II
Cement
5%
Type III Cement 5%
5%
Narlex D36
SS®65 Powder
Narlex D36
5%
Fritz-Pak NCA
Daraccel
a Not applicable
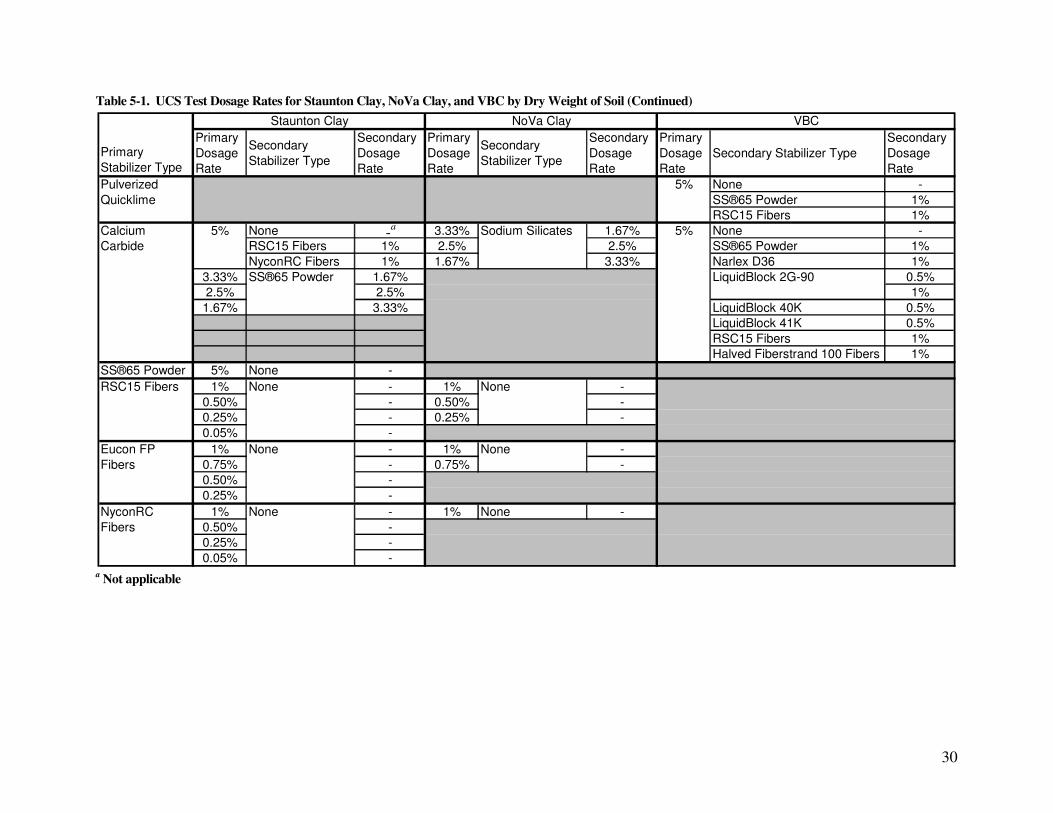
30
Table 5-1. UCS Test Dosage Rates for Staunton Clay, NoVa Clay, and VBC by Dry Weight of Soil (Continued)
Primary
Dosage
Rate
Secondary
Stabilizer Type
Secondary
Dosage
Rate
Primary
Dosage
Rate
Secondary
Stabilizer Type
Secondary
Dosage
Rate
Primary
Dosage
Rate
Secondary Stabilizer Type
Secondary
Dosage
Rate
None -
SS®65 Powder 1%
RSC15 Fibers 1%
None -a 3.33% 1.67% None -
RSC15 Fibers 1% 2.5% 2.5% SS®65 Powder 1%
NyconRC Fibers 1% 1.67% 3.33% Narlex D36 1%
3.33% 1.67% 0.5%
2.5% 2.5% 1%
1.67% 3.33% LiquidBlock 40K 0.5%
LiquidBlock 41K 0.5%
RSC15 Fibers 1%
Halved Fiberstrand 100 Fibers 1%
SS®65 Powder 5% None -
1% - 1% -
0.50% - 0.50% -
0.25% - 0.25% -
0.05% -
1% - 1% -
0.75% - 0.75% -
0.50% -
0.25% -
1% - 1% None -
0.50% -
0.25% -
0.05% -
Pulverized
Quicklime
Calcium
Carbide
Primary
Stabilizer Type
LiquidBlock 2G-90SS®65 Powder
None
5%
5%
Staunton Clay NoVa Clay VBC
NyconRC
Fibers
Sodium Silicates
None
None
None
None
5%
RSC15 Fibers
Eucon FP
Fibers
a Not applicable
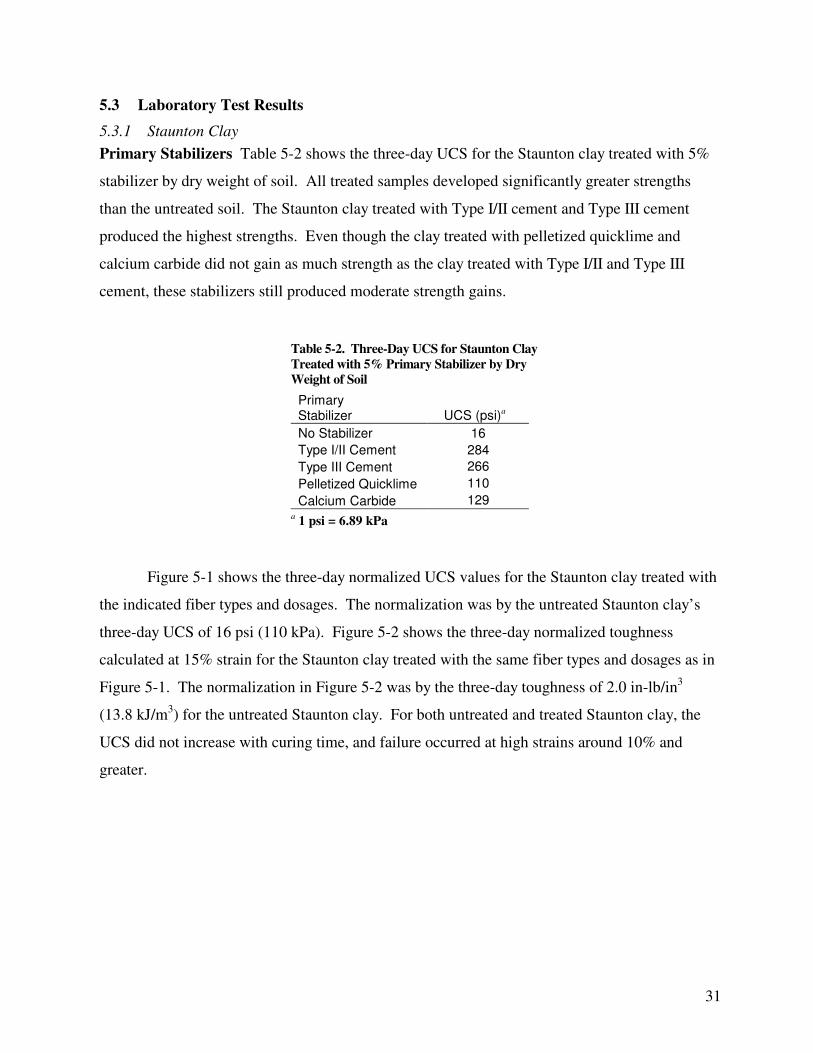
31
5.3 Laboratory Test Results
5.3.1 Staunton Clay
Primary Stabilizers Table 5-2 shows the three-day UCS for the Staunton clay treated with 5%
stabilizer by dry weight of soil. All treated samples developed significantly greater strengths
than the untreated soil. The Staunton clay treated with Type I/II cement and Type III cement
produced the highest strengths. Even though the clay treated with pelletized quicklime and
calcium carbide did not gain as much strength as the clay treated with Type I/II and Type III
cement, these stabilizers still produced moderate strength gains.
Table 5-2. Three-Day UCS for Staunton Clay
Treated with 5% Primary Stabilizer by Dry
Weight of Soil
Primary Stabilizer UCS (psi)a
No Stabilizer 16
Type I/II Cement 284
Type III Cement 266
Pelletized Quicklime 110
Calcium Carbide 129 a 1 psi = 6.89 kPa
Figure 5-1 shows the three-day normalized UCS values for the Staunton clay treated with
the indicated fiber types and dosages. The normalization was by the untreated Staunton clay’s
three-day UCS of 16 psi (110 kPa). Figure 5-2 shows the three-day normalized toughness
calculated at 15% strain for the Staunton clay treated with the same fiber types and dosages as in
Figure 5-1. The normalization in Figure 5-2 was by the three-day toughness of 2.0 in-lb/in3
(13.8 kJ/m3) for the untreated Staunton clay. For both untreated and treated Staunton clay, the
UCS did not increase with curing time, and failure occurred at high strains around 10% and
greater.
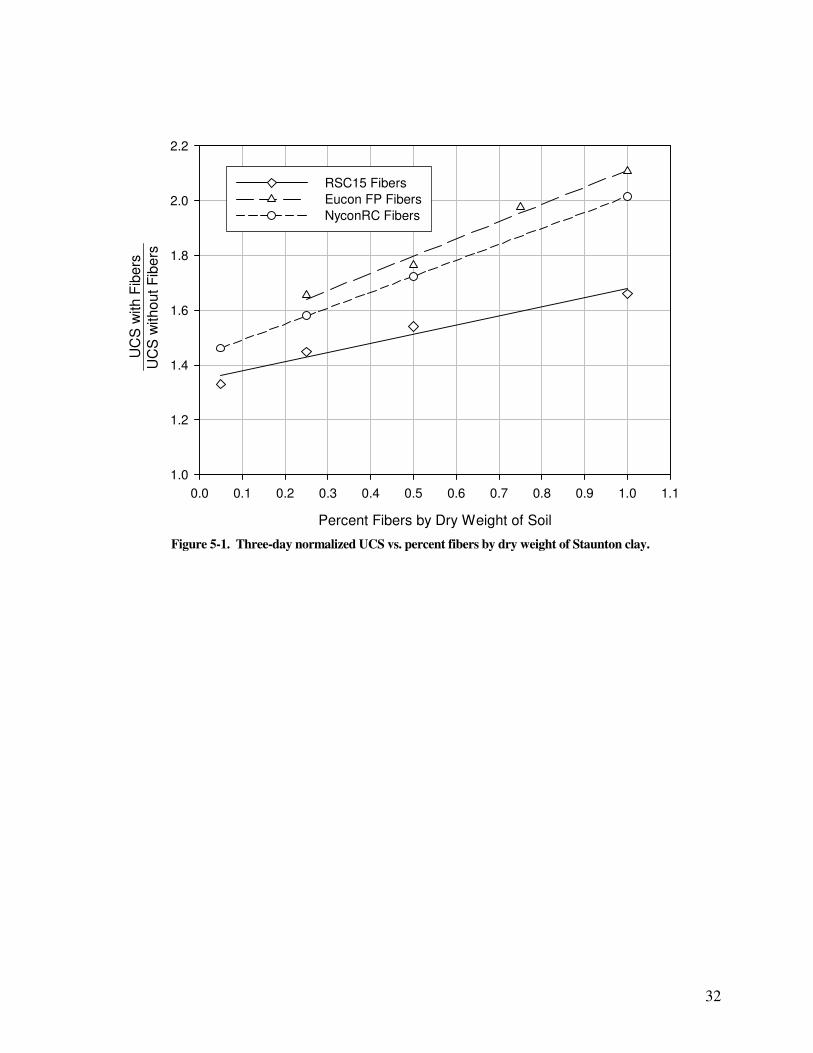
32
Percent Fibers by Dry Weight of Soil
0.0 0.1 0.2 0.3 0.4 0.5 0.6 0.7 0.8 0.9 1.0 1.1
UC
S w
ith
Fib
ers
1.0
1.2
1.4
1.6
1.8
2.0
2.2
RSC15 Fibers
Eucon FP Fibers
NyconRC Fibers
UC
S w
ith
ou
t F
ibe
rs
Figure 5-1. Three-day normalized UCS vs. percent fibers by dry weight of Staunton clay.
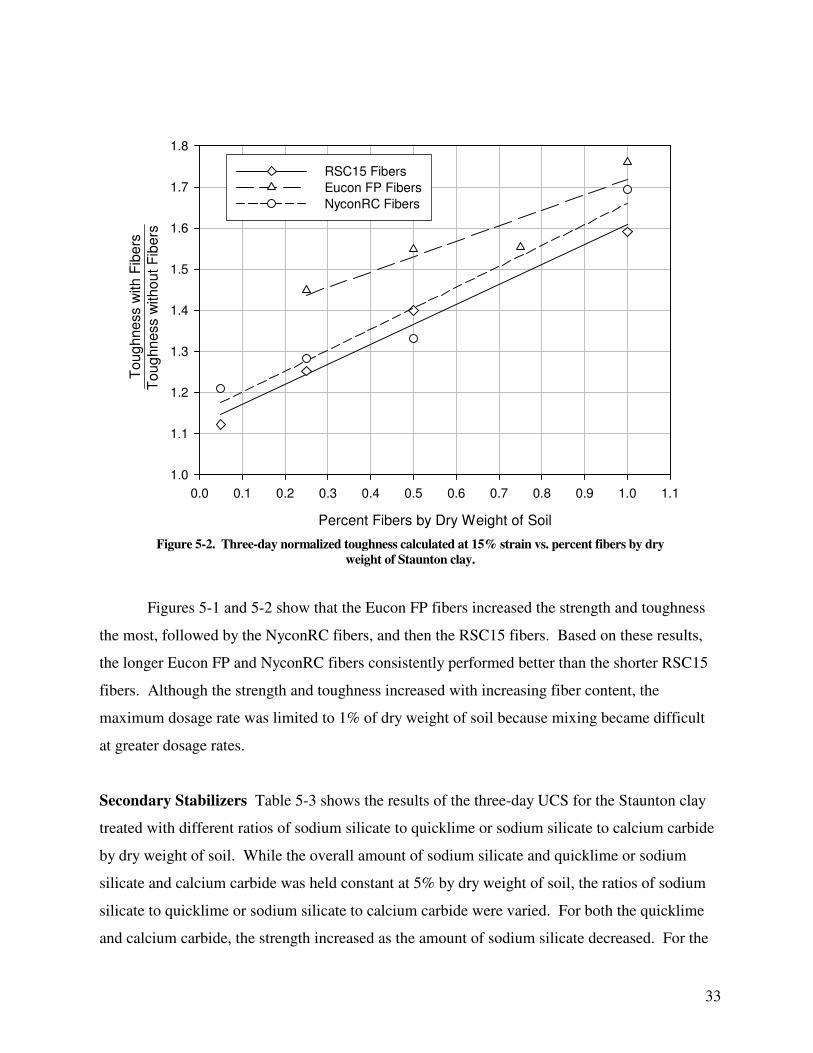
33
Percent Fibers by Dry Weight of Soil
0.0 0.1 0.2 0.3 0.4 0.5 0.6 0.7 0.8 0.9 1.0 1.1
To
ug
hn
ess w
ith
Fib
ers
1.0
1.1
1.2
1.3
1.4
1.5
1.6
1.7
1.8
RSC15 Fibers
Eucon FP Fibers
NyconRC Fibers
To
ug
hn
ess w
ith
ou
t F
ibe
rs
Figure 5-2. Three-day normalized toughness calculated at 15% strain vs. percent fibers by dry
weight of Staunton clay.
Figures 5-1 and 5-2 show that the Eucon FP fibers increased the strength and toughness
the most, followed by the NyconRC fibers, and then the RSC15 fibers. Based on these results,
the longer Eucon FP and NyconRC fibers consistently performed better than the shorter RSC15
fibers. Although the strength and toughness increased with increasing fiber content, the
maximum dosage rate was limited to 1% of dry weight of soil because mixing became difficult
at greater dosage rates.
Secondary Stabilizers Table 5-3 shows the results of the three-day UCS for the Staunton clay
treated with different ratios of sodium silicate to quicklime or sodium silicate to calcium carbide
by dry weight of soil. While the overall amount of sodium silicate and quicklime or sodium
silicate and calcium carbide was held constant at 5% by dry weight of soil, the ratios of sodium
silicate to quicklime or sodium silicate to calcium carbide were varied. For both the quicklime
and calcium carbide, the strength increased as the amount of sodium silicate decreased. For the
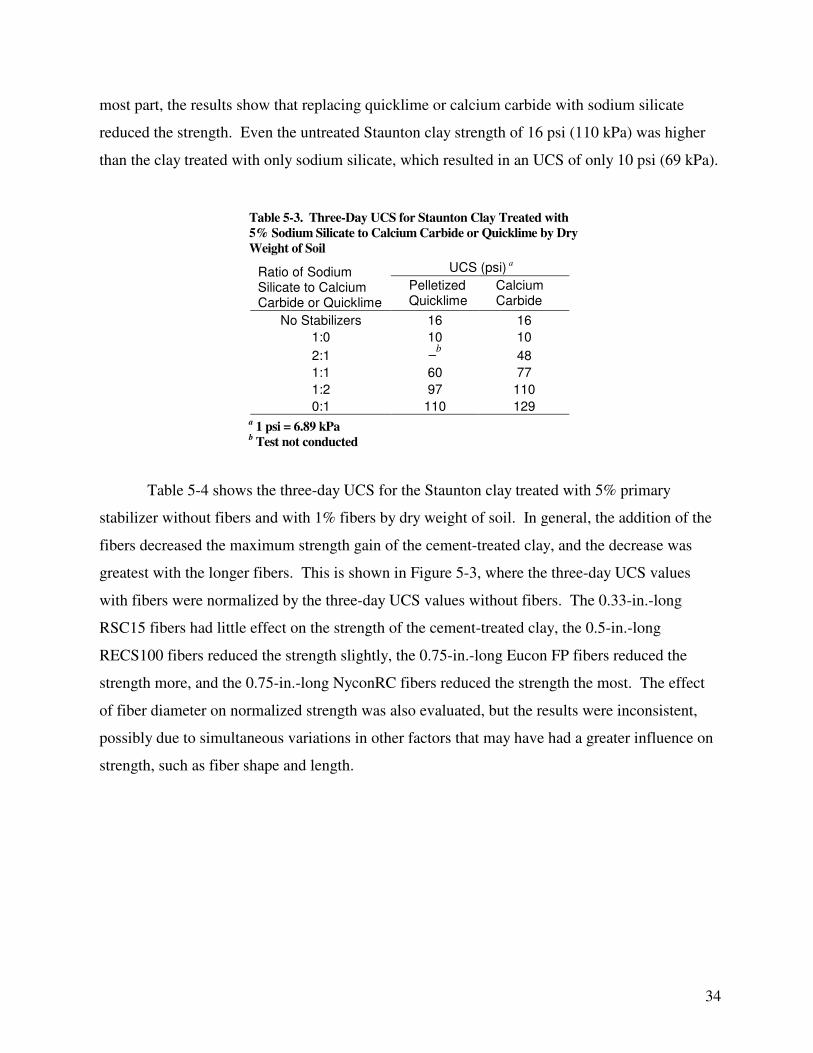
34
most part, the results show that replacing quicklime or calcium carbide with sodium silicate
reduced the strength. Even the untreated Staunton clay strength of 16 psi (110 kPa) was higher
than the clay treated with only sodium silicate, which resulted in an UCS of only 10 psi (69 kPa).
Table 5-3. Three-Day UCS for Staunton Clay Treated with
5% Sodium Silicate to Calcium Carbide or Quicklime by Dry
Weight of Soil
UCS (psi) a Ratio of Sodium Silicate to Calcium Carbide or Quicklime
Pelletized Quicklime
Calcium Carbide
No Stabilizers 16 16
1:0 10 10
2:1 –b 48
1:1 60 77
1:2 97 110
0:1 110 129 a 1 psi = 6.89 kPa
b Test not conducted
Table 5-4 shows the three-day UCS for the Staunton clay treated with 5% primary
stabilizer without fibers and with 1% fibers by dry weight of soil. In general, the addition of the
fibers decreased the maximum strength gain of the cement-treated clay, and the decrease was
greatest with the longer fibers. This is shown in Figure 5-3, where the three-day UCS values
with fibers were normalized by the three-day UCS values without fibers. The 0.33-in.-long
RSC15 fibers had little effect on the strength of the cement-treated clay, the 0.5-in.-long
RECS100 fibers reduced the strength slightly, the 0.75-in.-long Eucon FP fibers reduced the
strength more, and the 0.75-in.-long NyconRC fibers reduced the strength the most. The effect
of fiber diameter on normalized strength was also evaluated, but the results were inconsistent,
possibly due to simultaneous variations in other factors that may have had a greater influence on
strength, such as fiber shape and length.
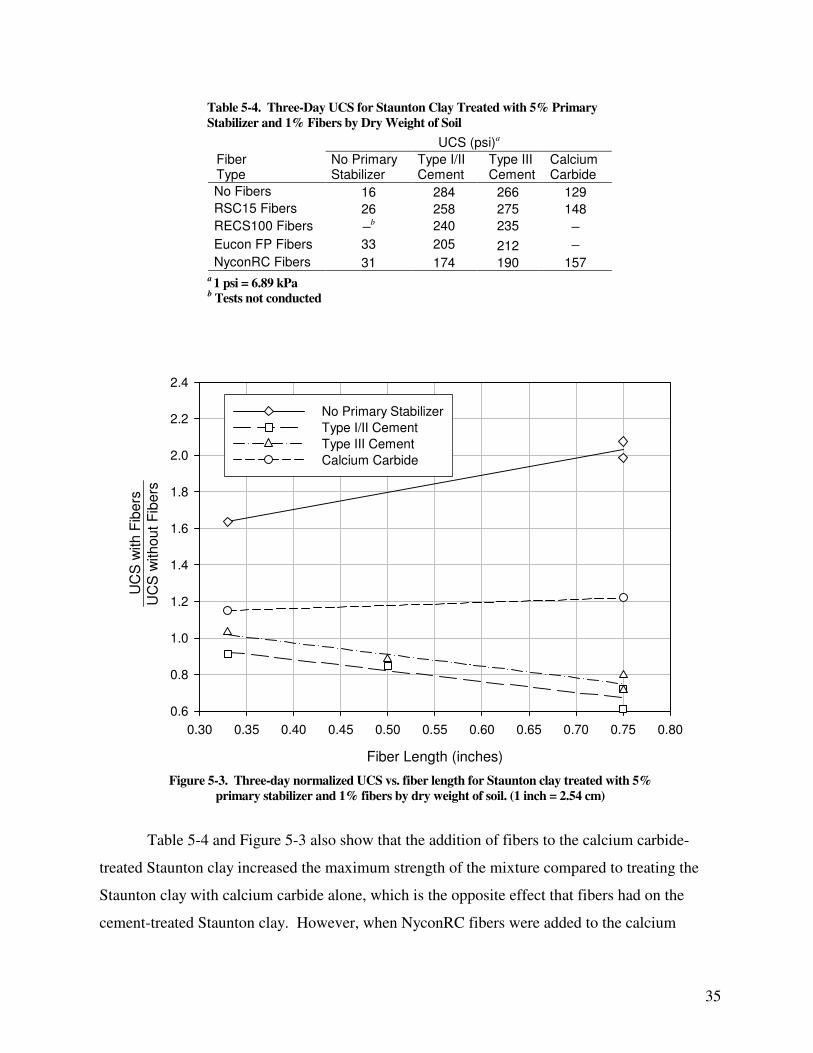
35
Table 5-4. Three-Day UCS for Staunton Clay Treated with 5% Primary
Stabilizer and 1% Fibers by Dry Weight of Soil
UCS (psi)a
Fiber Type
No Primary Stabilizer
Type I/II Cement
Type III Cement
Calcium Carbide
No Fibers 16 284 266 129
RSC15 Fibers 26 258 275 148
RECS100 Fibers –b 240 235 –
Eucon FP Fibers 33 205 212 –
NyconRC Fibers 31 174 190 157 a 1 psi = 6.89 kPa
b Tests not conducted
Fiber Length (inches)
0.30 0.35 0.40 0.45 0.50 0.55 0.60 0.65 0.70 0.75 0.80
UC
S w
ith
Fib
ers
0.6
0.8
1.0
1.2
1.4
1.6
1.8
2.0
2.2
2.4
No Primary Stabilizer
Type I/II Cement
Type III Cement
Calcium Carbide
UC
S w
ith
ou
t F
ibe
rs
Figure 5-3. Three-day normalized UCS vs. fiber length for Staunton clay treated with 5%
primary stabilizer and 1% fibers by dry weight of soil. (1 inch = 2.54 cm)
Table 5-4 and Figure 5-3 also show that the addition of fibers to the calcium carbide-
treated Staunton clay increased the maximum strength of the mixture compared to treating the
Staunton clay with calcium carbide alone, which is the opposite effect that fibers had on the
cement-treated Staunton clay. However, when NyconRC fibers were added to the calcium
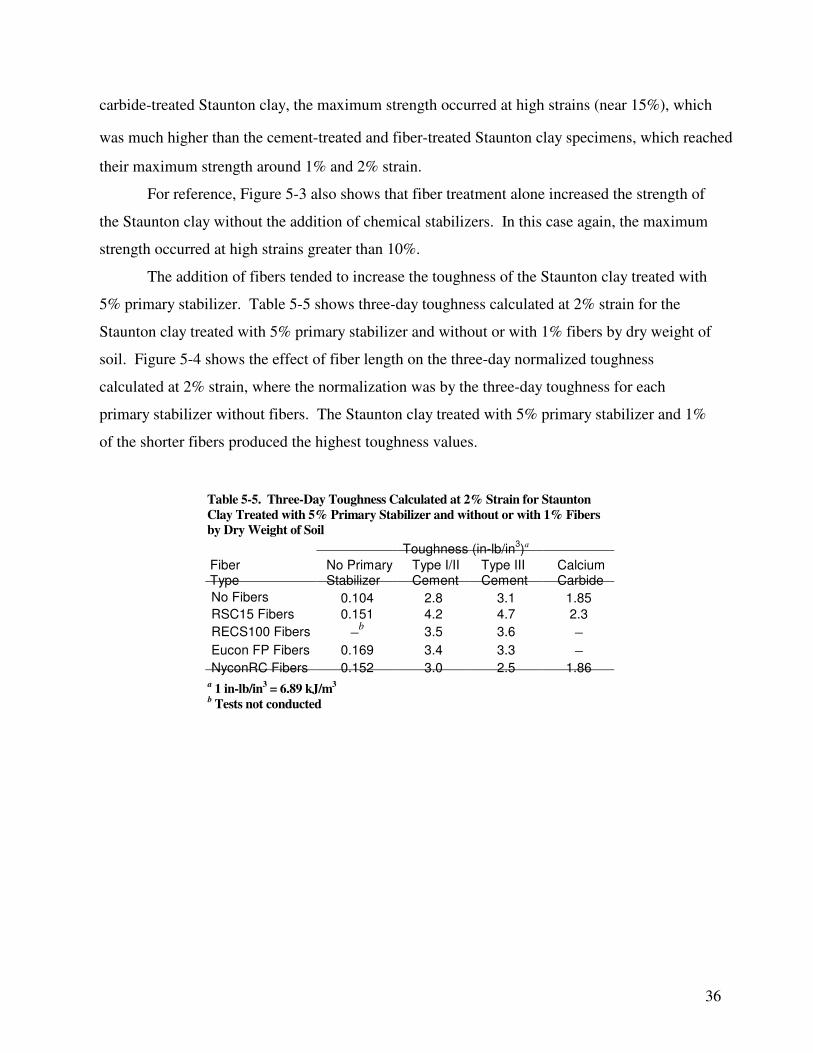
36
carbide-treated Staunton clay, the maximum strength occurred at high strains (near 15%), which
was much higher than the cement-treated and fiber-treated Staunton clay specimens, which reached
their maximum strength around 1% and 2% strain.
For reference, Figure 5-3 also shows that fiber treatment alone increased the strength of
the Staunton clay without the addition of chemical stabilizers. In this case again, the maximum
strength occurred at high strains greater than 10%.
The addition of fibers tended to increase the toughness of the Staunton clay treated with
5% primary stabilizer. Table 5-5 shows three-day toughness calculated at 2% strain for the
Staunton clay treated with 5% primary stabilizer and without or with 1% fibers by dry weight of
soil. Figure 5-4 shows the effect of fiber length on the three-day normalized toughness
calculated at 2% strain, where the normalization was by the three-day toughness for each
primary stabilizer without fibers. The Staunton clay treated with 5% primary stabilizer and 1%
of the shorter fibers produced the highest toughness values.
Table 5-5. Three-Day Toughness Calculated at 2% Strain for Staunton
Clay Treated with 5% Primary Stabilizer and without or with 1% Fibers
by Dry Weight of Soil
Toughness (in-lb/in3)a
Fiber Type
No Primary Stabilizer
Type I/II Cement
Type III Cement
Calcium Carbide
No Fibers 0.104 2.8 3.1 1.85
RSC15 Fibers 0.151 4.2 4.7 2.3
RECS100 Fibers –b 3.5 3.6 –
Eucon FP Fibers 0.169 3.4 3.3 –
NyconRC Fibers 0.152 3.0 2.5 1.86 a 1 in-lb/in
3 = 6.89 kJ/m
3
b Tests not conducted
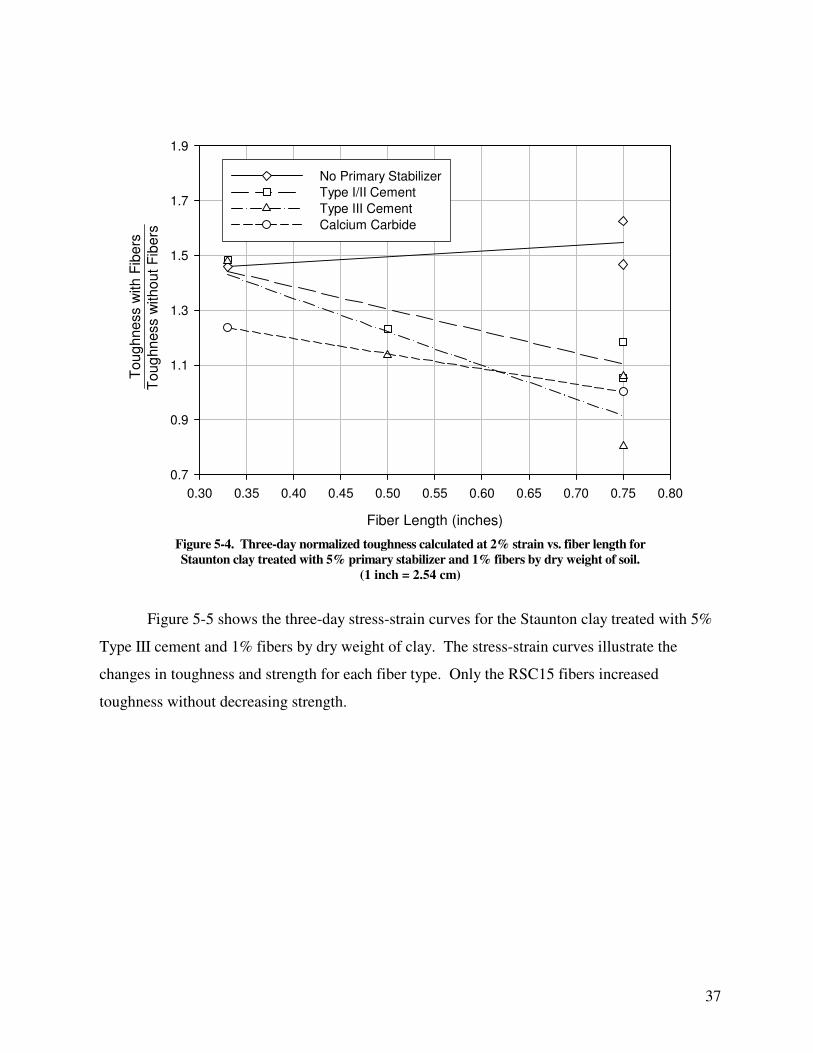
37
Fiber Length (inches)
0.30 0.35 0.40 0.45 0.50 0.55 0.60 0.65 0.70 0.75 0.80
To
ug
hn
ess w
ith
Fib
ers
0.7
0.9
1.1
1.3
1.5
1.7
1.9
No Primary Stabilizer
Type I/II Cement
Type III Cement
Calcium Carbide
To
ug
hn
ess w
ith
ou
t F
ibe
rs
Figure 5-4. Three-day normalized toughness calculated at 2% strain vs. fiber length for
Staunton clay treated with 5% primary stabilizer and 1% fibers by dry weight of soil.
(1 inch = 2.54 cm)
Figure 5-5 shows the three-day stress-strain curves for the Staunton clay treated with 5%
Type III cement and 1% fibers by dry weight of clay. The stress-strain curves illustrate the
changes in toughness and strength for each fiber type. Only the RSC15 fibers increased
toughness without decreasing strength.
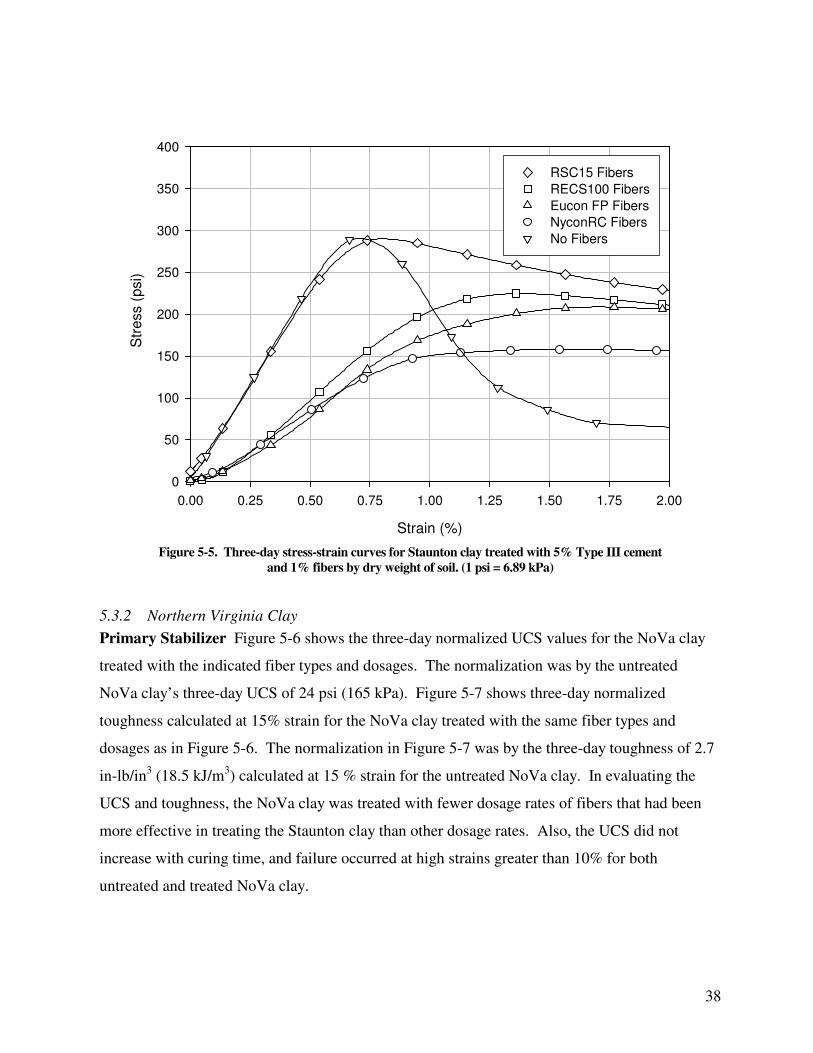
38
Strain (%)
0.00 0.25 0.50 0.75 1.00 1.25 1.50 1.75 2.00
Str
ess (
psi)
0
50
100
150
200
250
300
350
400
RSC15 Fibers
RECS100 Fibers
Eucon FP Fibers
NyconRC Fibers
No Fibers
Figure 5-5. Three-day stress-strain curves for Staunton clay treated with 5% Type III cement
and 1% fibers by dry weight of soil. (1 psi = 6.89 kPa)
5.3.2 Northern Virginia Clay
Primary Stabilizer Figure 5-6 shows the three-day normalized UCS values for the NoVa clay
treated with the indicated fiber types and dosages. The normalization was by the untreated
NoVa clay’s three-day UCS of 24 psi (165 kPa). Figure 5-7 shows three-day normalized
toughness calculated at 15% strain for the NoVa clay treated with the same fiber types and
dosages as in Figure 5-6. The normalization in Figure 5-7 was by the three-day toughness of 2.7
in-lb/in3 (18.5 kJ/m
3) calculated at 15 % strain for the untreated NoVa clay. In evaluating the
UCS and toughness, the NoVa clay was treated with fewer dosage rates of fibers that had been
more effective in treating the Staunton clay than other dosage rates. Also, the UCS did not
increase with curing time, and failure occurred at high strains greater than 10% for both
untreated and treated NoVa clay.
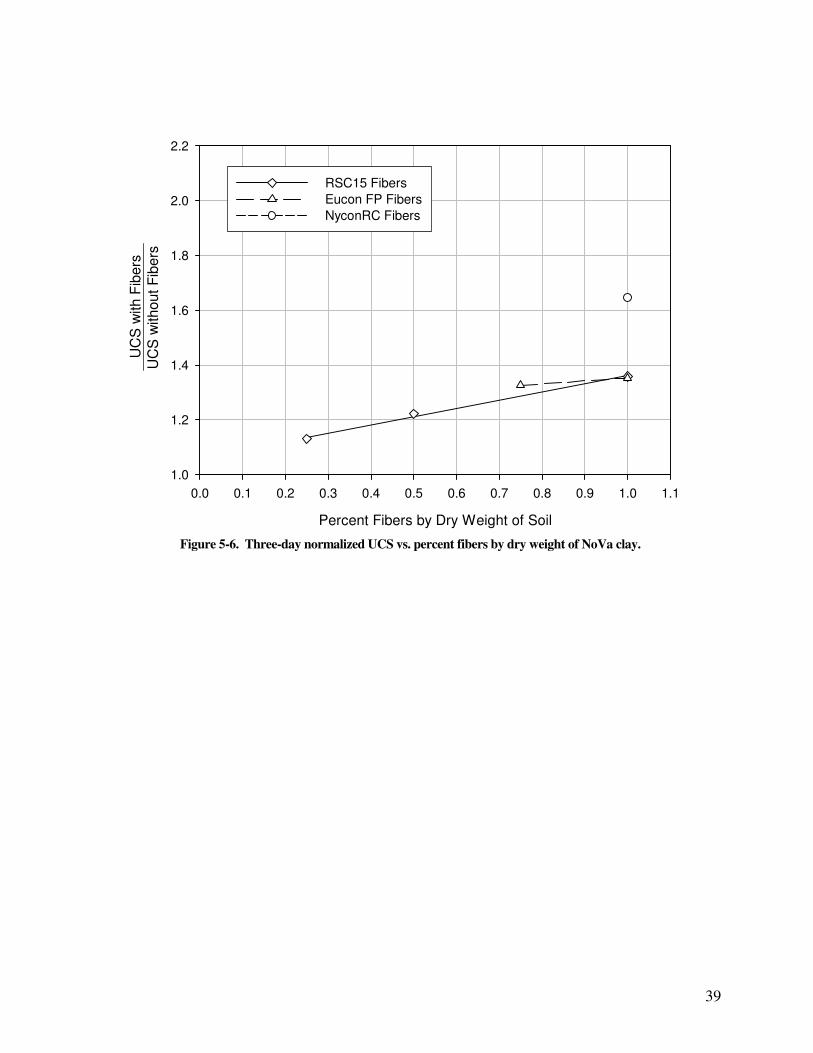
39
Percent Fibers by Dry Weight of Soil
0.0 0.1 0.2 0.3 0.4 0.5 0.6 0.7 0.8 0.9 1.0 1.1
UC
S w
ith
Fib
ers
1.0
1.2
1.4
1.6
1.8
2.0
2.2
RSC15 Fibers
Eucon FP Fibers
NyconRC Fibers
UC
S w
ith
ou
t F
ibe
rs
Figure 5-6. Three-day normalized UCS vs. percent fibers by dry weight of NoVa clay.
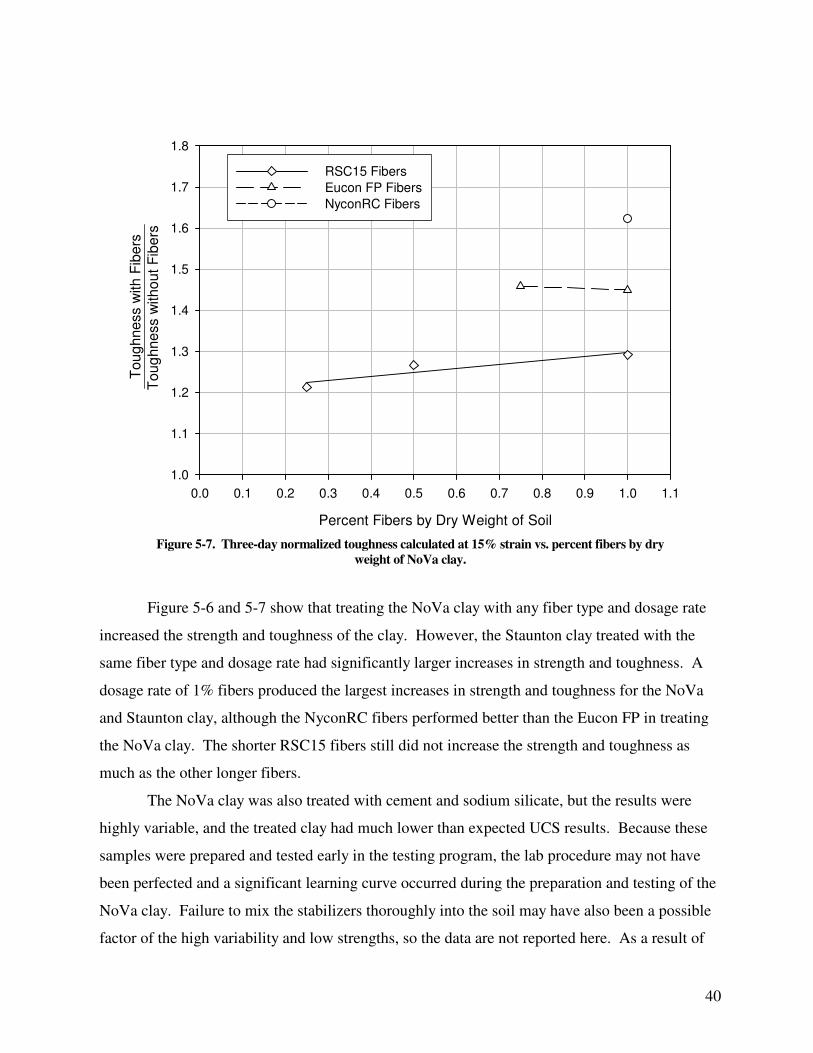
40
Percent Fibers by Dry Weight of Soil
0.0 0.1 0.2 0.3 0.4 0.5 0.6 0.7 0.8 0.9 1.0 1.1
To
ug
hn
ess w
ith
Fib
ers
1.0
1.1
1.2
1.3
1.4
1.5
1.6
1.7
1.8
RSC15 Fibers
Eucon FP Fibers
NyconRC Fibers
To
ug
hn
ess w
ith
ou
t F
ibe
rs
Figure 5-7. Three-day normalized toughness calculated at 15% strain vs. percent fibers by dry
weight of NoVa clay.
Figure 5-6 and 5-7 show that treating the NoVa clay with any fiber type and dosage rate
increased the strength and toughness of the clay. However, the Staunton clay treated with the
same fiber type and dosage rate had significantly larger increases in strength and toughness. A
dosage rate of 1% fibers produced the largest increases in strength and toughness for the NoVa
and Staunton clay, although the NyconRC fibers performed better than the Eucon FP in treating
the NoVa clay. The shorter RSC15 fibers still did not increase the strength and toughness as
much as the other longer fibers.
The NoVa clay was also treated with cement and sodium silicate, but the results were
highly variable, and the treated clay had much lower than expected UCS results. Because these
samples were prepared and tested early in the testing program, the lab procedure may not have
been perfected and a significant learning curve occurred during the preparation and testing of the
NoVa clay. Failure to mix the stabilizers thoroughly into the soil may have also been a possible
factor of the high variability and low strengths, so the data are not reported here. As a result of

41
this experience, a mixing study was performed to evaluate the thoroughness of mixing stabilizers
into the soil. The details of this mixing study are discussed in Appendix B, and the results were
applied to subsequent testing.
5.3.3 Vicksburg Buckshot Clay
Primary Stabilizers Table 5-6 shows the three-day UCS for the VBC treated with 5% stabilizer
by dry weight of soil. Overall, the VBC treated with 5% Type III cement by dry weight of soil
had the best results, while the VBC treated with 5% Type I/II cement, pelletized quicklime, and
calcium carbide by dry weight of soil had slightly lower strength gains. The next lower strength
occurred for the VBC treated with 5% pulverized quicklime. The four microfine cements
produced even lower strength gains. Without treatment, the VBC had a three-day UCS of 7 psi
(48 kPa) and did not appear to gain strength over time.
Table 5-6. Three-Day UCS for VBC Treated with
5% Primary Stabilizer by Dry Weight of Soil
Primary Stabilizer
UCS (psi)a
No Stabilizer 7 Type I/II Cement 95 Type III Cement 112 Nittetsu Super Fine 64 Type V Premium Grout 40 Embeco 885 31 14K HY Flow 28 Pelletized Quicklime 93 Pulverized Quicklime 79 Calcium Carbide 89
a 1 psi = 6.89 kPa
The pulverized quicklime produced stress-strain curves that were consistently more
ductile than the rest of the stabilizers, with the exception of the microfine cements. Figure 5-8
illustrates the difference in the stress-strain curves between the pulverized and pelletized
quicklime.
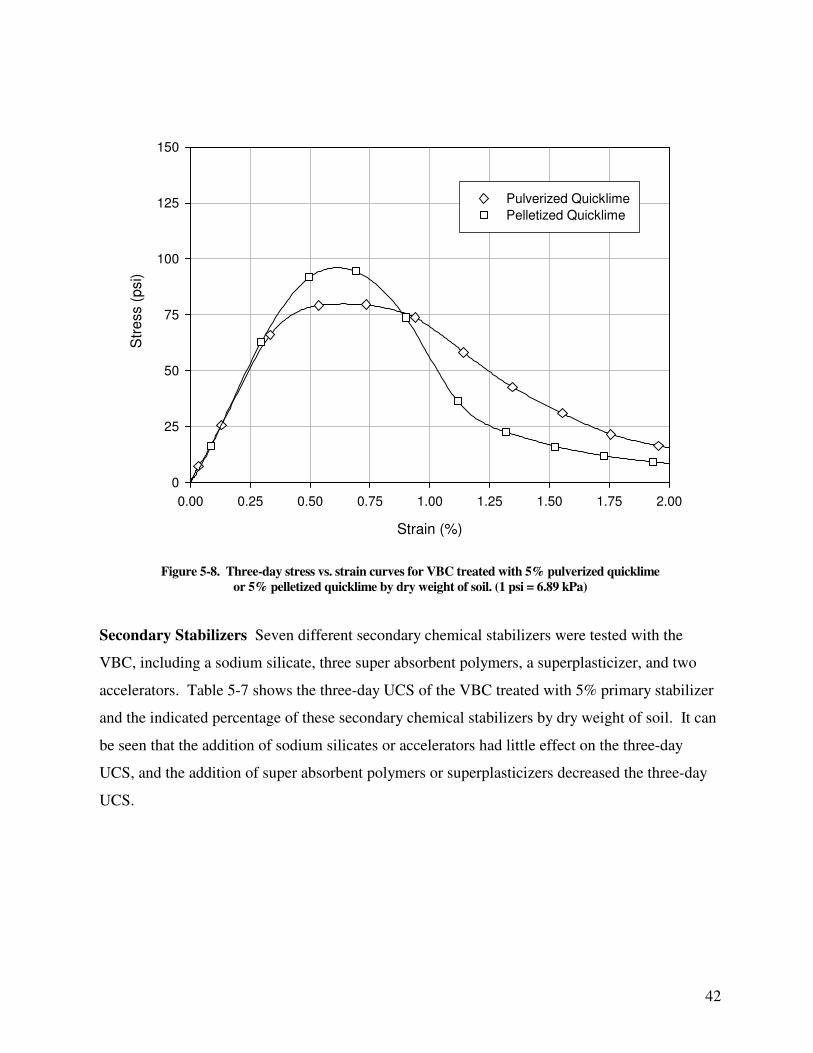
42
Strain (%)
0.00 0.25 0.50 0.75 1.00 1.25 1.50 1.75 2.00
Str
ess (
psi)
0
25
50
75
100
125
150
Pulverized Quicklime
Pelletized Quicklime
Figure 5-8. Three-day stress vs. strain curves for VBC treated with 5% pulverized quicklime
or 5% pelletized quicklime by dry weight of soil. (1 psi = 6.89 kPa)
Secondary Stabilizers Seven different secondary chemical stabilizers were tested with the
VBC, including a sodium silicate, three super absorbent polymers, a superplasticizer, and two
accelerators. Table 5-7 shows the three-day UCS of the VBC treated with 5% primary stabilizer
and the indicated percentage of these secondary chemical stabilizers by dry weight of soil. It can
be seen that the addition of sodium silicates or accelerators had little effect on the three-day
UCS, and the addition of super absorbent polymers or superplasticizers decreased the three-day
UCS.
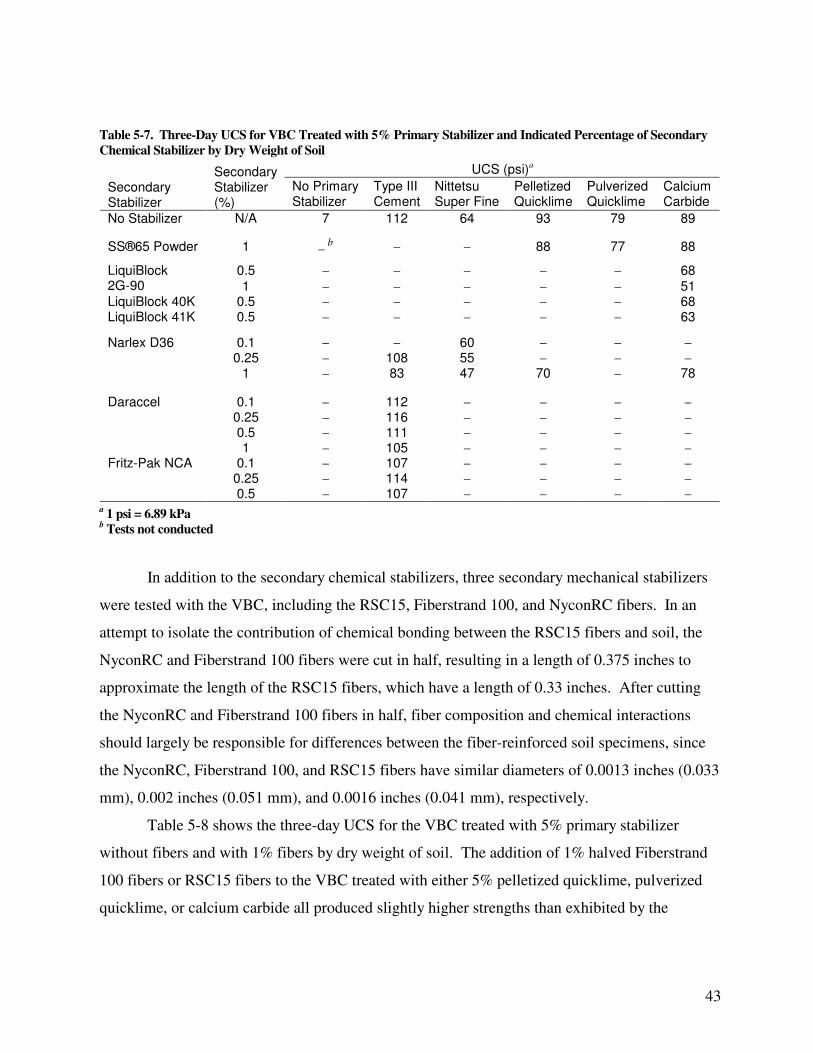
43
Table 5-7. Three-Day UCS for VBC Treated with 5% Primary Stabilizer and Indicated Percentage of Secondary
Chemical Stabilizer by Dry Weight of Soil
UCS (psi)a Secondary Stabilizer
Secondary Stabilizer (%)
No Primary Stabilizer
Type III Cement
Nittetsu Super Fine
Pelletized Quicklime
Pulverized Quicklime
Calcium Carbide
No Stabilizer N/A 7 112 64 93 79 89
SS®65 Powder 1 – b
– – 88 77 88
0.5 – – – – – 68 LiquiBlock 2G-90 1 – – – – – 51 LiquiBlock 40K 0.5 – – – – – 68 LiquiBlock 41K 0.5 – – – – – 63
Narlex D36 0.1 – – 60 – – – 0.25 – 108 55 – – – 1 – 83 47 70 – 78
Daraccel 0.1 – 112 – – – – 0.25 – 116 – – – – 0.5 – 111 – – – – 1 – 105 – – – – Fritz-Pak NCA 0.1 – 107 – – – – 0.25 – 114 – – – – 0.5 – 107 – – – –
a 1 psi = 6.89 kPa
b Tests not conducted
In addition to the secondary chemical stabilizers, three secondary mechanical stabilizers
were tested with the VBC, including the RSC15, Fiberstrand 100, and NyconRC fibers. In an
attempt to isolate the contribution of chemical bonding between the RSC15 fibers and soil, the
NyconRC and Fiberstrand 100 fibers were cut in half, resulting in a length of 0.375 inches to
approximate the length of the RSC15 fibers, which have a length of 0.33 inches. After cutting
the NyconRC and Fiberstrand 100 fibers in half, fiber composition and chemical interactions
should largely be responsible for differences between the fiber-reinforced soil specimens, since
the NyconRC, Fiberstrand 100, and RSC15 fibers have similar diameters of 0.0013 inches (0.033
mm), 0.002 inches (0.051 mm), and 0.0016 inches (0.041 mm), respectively.
Table 5-8 shows the three-day UCS for the VBC treated with 5% primary stabilizer
without fibers and with 1% fibers by dry weight of soil. The addition of 1% halved Fiberstrand
100 fibers or RSC15 fibers to the VBC treated with either 5% pelletized quicklime, pulverized
quicklime, or calcium carbide all produced slightly higher strengths than exhibited by the
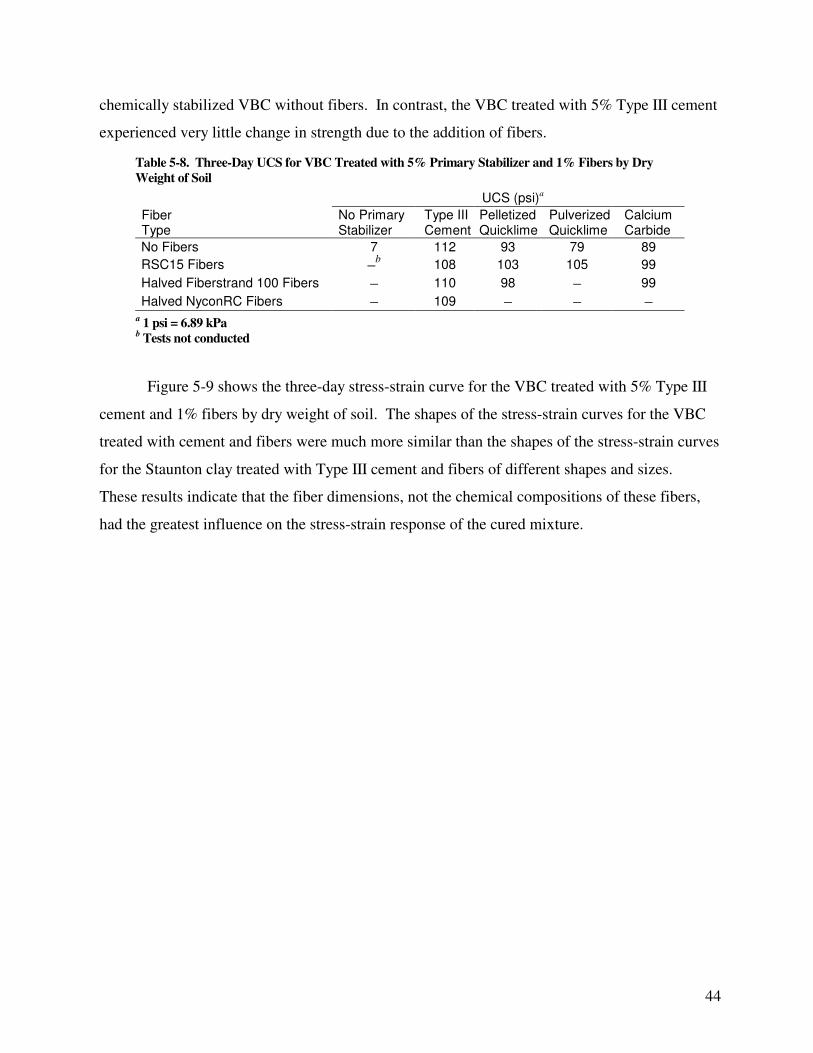
44
chemically stabilized VBC without fibers. In contrast, the VBC treated with 5% Type III cement
experienced very little change in strength due to the addition of fibers.
Table 5-8. Three-Day UCS for VBC Treated with 5% Primary Stabilizer and 1% Fibers by Dry
Weight of Soil
UCS (psi)a
Fiber Type
No Primary Stabilizer
Type III Cement
Pelletized Quicklime
Pulverized Quicklime
Calcium Carbide
No Fibers 7 112 93 79 89
RSC15 Fibers –b 108 103 105 99
Halved Fiberstrand 100 Fibers – 110 98 – 99
Halved NyconRC Fibers – 109 – – – a 1 psi = 6.89 kPa
b Tests not conducted
Figure 5-9 shows the three-day stress-strain curve for the VBC treated with 5% Type III
cement and 1% fibers by dry weight of soil. The shapes of the stress-strain curves for the VBC
treated with cement and fibers were much more similar than the shapes of the stress-strain curves
for the Staunton clay treated with Type III cement and fibers of different shapes and sizes.
These results indicate that the fiber dimensions, not the chemical compositions of these fibers,
had the greatest influence on the stress-strain response of the cured mixture.
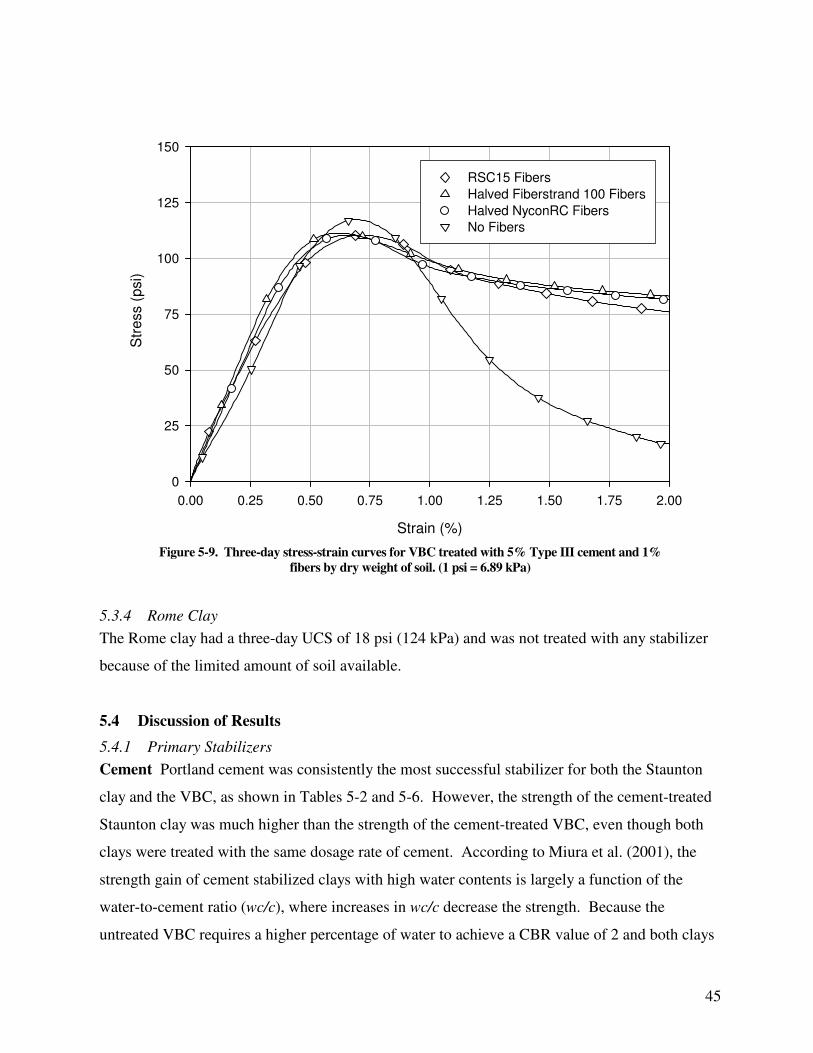
45
Strain (%)
0.00 0.25 0.50 0.75 1.00 1.25 1.50 1.75 2.00
Str
ess (
psi)
0
25
50
75
100
125
150
RSC15 Fibers
Halved Fiberstrand 100 Fibers
Halved NyconRC Fibers
No Fibers
Figure 5-9. Three-day stress-strain curves for VBC treated with 5% Type III cement and 1%
fibers by dry weight of soil. (1 psi = 6.89 kPa)
5.3.4 Rome Clay
The Rome clay had a three-day UCS of 18 psi (124 kPa) and was not treated with any stabilizer
because of the limited amount of soil available.
5.4 Discussion of Results
5.4.1 Primary Stabilizers
Cement Portland cement was consistently the most successful stabilizer for both the Staunton
clay and the VBC, as shown in Tables 5-2 and 5-6. However, the strength of the cement-treated
Staunton clay was much higher than the strength of the cement-treated VBC, even though both
clays were treated with the same dosage rate of cement. According to Miura et al. (2001), the
strength gain of cement stabilized clays with high water contents is largely a function of the
water-to-cement ratio (wc/c), where increases in wc/c decrease the strength. Because the
untreated VBC requires a higher percentage of water to achieve a CBR value of 2 and both clays
46
were treated with 5% cement by dry weight of soil, the VBC has a much higher wc/c of 8.8
compared to the Staunton clay, which has a wc/c of 6.7. This difference in wc/c may explain
why the Staunton clay had a larger strength gain than the VBC when treated with cement. Soil
type may also have an influence on the effectiveness of cement stabilization (Prusinski and
Bhattacharja 1999), but the wc/c appears to have a dominant effect, especially when the clay has
a very high water content (Miura et al. 2001).
The strength results were quite similar for the Staunton clay treated with Type I/II and
Type III cement, although the strength gain for the VBC treated with Type III cement was higher
than with the Type I/II cement. The Type III cement was likely more effective for the VBC
because, in addition to the larger surface area of the Type III cement, the montmorillonite in the
VBC also has a larger specific surface area that allows the calcium hydroxide created by the
hydration of cement to have greater access to silica and/or alumina for pozzolanic reactions.
Although the Type III cement was more effective for the VBC, Type I/II cement costs less than
Type III cement, and may be more cost effective for certain field applications.
Compared to the Type I/II and Type III cements, Table 5-6 shows that the microfine
cements were poor stabilizers for the VBC. The microfine cements may have been unsuccessful
for two reasons. First, the very fine cement particles of the microfine cements may have
flocculated, which may have created larger particles of cement having less surface area, with an
associated slower rate of strength gain. Second, some of the microfine cements contain large
percentages of blast furnace slag and/or pumice, which may be useful for grouting applications,
but not for high early strength, since blast furnace slag and pumice both increase the set time.
Quicklime The treatment of Staunton clay and VBC with pelletized quicklime produced similar
results for both clays, as shown in Tables 5-2 and 5-6. These similar results may have occurred
because the effectiveness of quicklime is influenced by both water content and soil type. Like
cement, a higher water content lowers the strength gain from quicklime, so the resulting strength
gain for the VBC may have been lower than for the Staunton clay due to the VBC’s higher water
content. On the other hand, based solely on soil type, the VBC may have had a higher strength
gain than the Staunton clay because the VBC contains more montmorillonite, which has a higher
specific surface area than other clay minerals. Furthermore, the dosage rate applied in this study
of 5% quicklime, which converts to 6.6% hydrated lime, is above the optimal rate for the
47
Staunton clay and close to the optimal rate for the VBC as determined by the Texas Procedure
(2000). The Texas Procedure (2000) estimates the optimal dosage rate of hydrated lime for
different soil types based on the percent passing the #40 sieve and plasticity index, which can
also be influenced by the amount of montmorillonite in a clay. Both clays may have had similar
results for lime treatment because the strength increase due to the lower water content of the
Staunton clay seems to have canceled out the effects of the VBC containing a larger percentage
of montmorillonite and treating the VBC close to its optimal dosage rate of lime.
Based on the pulverized quicklime’s smaller particle size and larger surface area, soil
treated with pulverized quicklime would be expected to achieve higher peak strengths than
pelletized quicklime, which was not the case for the VBC tested here. Although the VBC
stabilized with pulverized quicklime had lower peak strengths, this soil had more ductility than
the soil treated with the pelletized quicklime, as shown in Figure 5-8. If the pulverized
quicklime particles were very well dispersed, the formation of chemical bonds from the
flocculation of clay particles and pozzolanic reactions may have been uniformly distributed
throughout the soil. In contrast, the chemical bonds within the soil treated with pelletized
quicklime may have been concentrated near the surface of the quicklime granules, which may
have formed a framework of highly-treated soil around pockets of relatively untreated soil. Such
a framework would likely be stronger yet more brittle than the more homogenous mixture
thought to be produced by using pulverized lime. Alexander, et al. (1972) also found that
coarser lime gave higher strengths, and they attributed the higher strengths to higher dry unit
weights. The difference in strength gain was not caused by differences in dry unit weight for the
research reported here, since the clay treated with pelletized and pulverized quicklime had very
similar dry unit weights.
Calcium Carbide Pelletized quicklime and calcium carbide produced similar results in the
Staunton clay and the VBC, as shown in Tables 5-2 and 5-6. Chemically, the calcium carbide
should stabilize the soil in the same manner as the quicklime, except the calcium carbide should
consume more water and generate more heat. Although the calcium carbide does appear to have
driven off more water than the quicklime, the difference does not seem to have had a great effect
on the resulting strength gain, perhaps because the water content is still well above optimum.
Even though calcium carbide has stabilizing effects comparable to quicklime, quicklime may be
48
preferable in field applications because calcium carbide costs more than quicklime, and the
acetylene gas created during hydration of calcium carbide is highly flammable and dangerous.
On the other hand, additional research may be warranted to determine whether calcium carbide
can be safely used, with the acetylene gas being polymerized in the soil, or captured and used to
heat the soil.
Fibers When used as primary stabilizers, Figures 5-1, 5-2, 5-6, and 5-7 show that all of the fiber
types and dosages increased the strength and toughness of the Staunton clay and NoVa clay,
although the fibers were more effective in treating the Staunton clay. Overall, treatment with the
longer fibers at the highest mixable dosage rate of 1% increased the strength and toughness of
both clays the most. Longer fibers may have been more effective in these cases because the
untreated clays were quite ductile and failed at high strains, which may have allowed a greater
portion of the tensile strength of the fibers to be mobilized. Furthermore, the longer fibers may
have been more effective treating the Staunton clay, since the Staunton clay had a higher water
content than the NoVa clay, and therefore, was more ductile than the NoVa clay.
The strength increase from the addition of fibers as a primary stabilizer may be more
significant than the increase in toughness, since the untreated Staunton clay at a water content of
33.5% and NoVa clay at a water content of 24.4% are already quite ductile. However, even the
best UCS results for both wet clays treated with fibers were still very low. Therefore, using
fibers as a primary stabilizer for clays with high water contents may not provide enough
improvement to be of significant value in most field applications.
5.4.2 Secondary Stabilizers
For a secondary stabilizer to be considered somewhat effective, it must improve performance
enough to outweigh the added cost and complexity of treatment.
Sodium Silicates Table 5-2 shows that the replacement of quicklime and calcium carbide with
sodium silicate had a negative effect on strength gain for the Staunton clay, and Table 5-7 shows
that the addition of 1% sodium silicate by dry weight of soil had little effect on the rate of
strength gain for the VBC. Hurley and Thornburn (1972) note that mixing a sodium silicate
“with almost any other inorganic material is likely to cause the formation of a silica gel,” but
49
“the properties of the gel, such as strength, durability, and permeability, may vary greatly
depending on factors such as concentration of the solution, Na2O:SiO2 ratio, temperature, and the
kind of salts, acids, and bases with which it reacts.” In this research, the calcium silicate gel
apparently was not very strong, as indicated by the soil strength after treatment. Also, since the
calcium ions may have combined with silicates to form this weak calcium silicate gel, fewer
calcium ions would have been available for ion exchange, which might have further decreased
the strength of the treated soil. Additionally, the larger dosages of sodium silicate may have
created large concentrations of sodium ions, which may have weakened and dispersed the clay
structure if ion exchange occurred between the high concentrations of sodium ions and any more
positively charged cations on the clay particle surface. Finally, if a sufficient supply of calcium
ions was not available, excess silicate ions may have attached to the edges of the clay particles
and deflocculated the clay structure.
Super Absorbent Polymers Compared to soil treated with calcium carbide only, the addition of
super absorbent polymers to calcium carbide treated soil appears to have had a negative effect on
strength gain, as shown in Table 5-7. For soil treated only with calcium carbide, the calcium
ions from the calcium carbide are mainly used for ion exchange and pozzolanic reactions, but
with the addition of the polymers, these calcium ions may have been used instead to crosslink
the polymers together, and the resulting network of polymers may have also been quite weak. In
addition, granules of the super absorbent polymers were still visible after stabilization and may
have acted as pockets of lubricant within the clay soil, especially after the polymers absorbed
water.
Cement Admixtures The superplasticizer decreased the strength gain for soils treated with
either microfine cement or Type III cement, as shown in Table 5-7. Even though
superplasticizers are often used with microfine cements to prevent fine cement particles from
flocculating and creating larger particles, this is usually for grouting applications where
workability is of great concern and high early strength is not. If the superplasticizer was
successful in preventing flocculation of the microfine cement particles, the negatively charged
coating on the microfine cement particles may have been detrimental to strength gain. Similarly,
a negatively charged coating on the Type III cement particles may have had adverse affects on
50
strength gain, but in addition, the Type III cement particles may not have been so fine as to need
a superplasticizer to prevent flocculation in the first place.
Another difficulty of treating the soil with a superplasticizer as well as an accelerator is
related to the small amount of cement required for soil stabilization. A typical dosage rate of 5%
cement by dry weight of soil is quite low compared to a typical concrete mixture, so the
appropriate amount of superplasticizer or accelerator is very small. The suggested dosage rate
for a superplasticizer or accelerator is approximately 2% of cement weight, so only 0.1%
superplasticizer or accelerator by dry weight of soil is needed for 5% cement by dry weight of
soil. With such a small dosage rate, the superplasticizer or accelerator may not come into
contact with the cement particles enough to effectively coat or react with the majority of the
particles. Also, the superplasticizer and cement may not be thoroughly mixed together in a soil,
since a special high-speed shear mixer is typically required for superplasticizers.
Fibers As secondary stabilizers, Figures 5-5 and 5-9 show that most of the fiber types increased
the toughness of the chemically treated Staunton clay and VBC, but often decreased the UCS of
the chemically treated Staunton clay. Shorter fibers tended to increase toughness the most and
decrease UCS the least for Staunton clay treated with 5% primary stabilizer and 1% fibers, as
shown in Figures 5-3 and 5-4. Shorter fibers may have been more effective because there are a
larger number of shorter fibers than longer fibers at the same dosage rate, so more fibers may be
properly oriented and positioned to resist loading. However, Figure 5-3 shows that longer fibers
were better for the Staunton clay treated with 5% calcium carbide and 1% NyconRC fibers.
Similar to the untreated Staunton clay, this mixture reached its peak strength at high strains
where the fibers may have became more effective as they became more straightened and
tensioned. If the toughness effects of fiber reinforcement are mainly influenced by fiber length
and soil stiffness, shorter fibers may be more effective for untreated clays with much lower water
contents than the clays tested in this study, since such clays would have more stiff and brittle
response.
The decrease in UCS of cement-treated Staunton clay shown in Figures 5-3 and 5-5 due
to the addition of 1% fibers may have been caused by planes or pockets of weakness introduced
by the fibers. Either the fibers may have been poorly distributed throughout the soil, or
according to Maher and Ho (1994), the load may not be transferred well between the fibers and a
51
soil with such a high water content, since the water may have acted as a lubricant between the
fibers and soil particles. The RECS100 fibers may have introduced larger pockets of weakness
as a result of the larger fiber diameter, which is more than two times the diameter of any of the
other fibers, and/or the oiling agent covering the fibers, which may have acted as an additional
lubricant between the fibers and the soil. The Eucon FP may have introduced small failure
planes, since the Eucon FP fibers may not have been mixed well into the soil and did not fully
break apart into the “stems and webs” as described by Fletchers and Humphries (1991). The
NyconRC fibers may have also introduced pockets of weakness because these fibers also did not
mix well into the soil and often “bunched up,” creating pockets of NyconRC fibers throughout
the soil.
The fiber composition did not have a large influence on effectiveness, as shown in Figure
5-9 by the similar stress-strain curves for the VBC treated with 5% Type III cement and 1%
fibers of different materials but all of approximately the same dimensions. In addition, the fibers
were also observed to pull out of the soil matrix and no distress of the fibers was observed, so the
fiber material strength most likely did not influence the treated soil strength.
Both types of PVA fibers did not exhibit any evidence of improvement due to possible
hydrogen bonding with the untreated or treated clay. In treating the Staunton clay and the VBC,
the PVA fibers were not distressed after failure, and in treating the VBC, Figure 5-9 shows that
they performed very similarly to the Fiberstrand 100 and NyconRC fibers, which had the same
approximate dimensions. Apparently, the PVA fibers could not form significant hydrogen bonds
in these clays. Although Kanda and Li (1998) state that the effectiveness of the PVA fibers is
independent of water-to-cement ratio (wc/c) for concrete mixtures, the effectiveness of the PVA
fibers may have been influenced by the drastically higher wc/c of the Staunton clay and the
VBC, which was about 8 to 22 times higher than the wc/c of a typical concrete mixture.
5.5 Conclusions
5.5.1 Primary Stabilizers
The traditional stabilizers, cement and lime, were the most effective in increasing the UCS of the
Staunton clay and the VBC tested in this study. Other key findings are listed below.
52
• Cement was consistently an effective stabilizer, regardless of the water content or soil
type, although the water content appeared to have a strong influence on the strength gain,
especially for soils with high water contents.
• Microfine cements were ineffective stabilizers. This may have been due to flocculation
of the fine cement particles, as well as the presence of blast furnace slag and pumice in the
cement, which may have increased set time.
• Quicklime had similar moderate strength gains for the Staunton clay and the VBC
because the higher water content of the VBC decreased the strength gain, while the large
percentage of montmorillonite in the VBC counteracted this decrease in strength.
• Pelletized quicklime produced higher strengths and more brittle stress-strain response
than the pulverized quicklime possibly because the pelletized quicklime may have formed a stiff
framework of highly-treated soil compared to the more well-dispersed pulverized quicklime.
• Quicklime and calcium carbide had very similar results, even though calcium carbide
consumed more water than quicklime due to additional chemical reactions that generated
acetylene gas as a by-product. However, calcium carbide could be more effective than
quicklime, if this acetylene gas could be polymerized into a strong and hard material within the
soil.
• When used as primary stabilizers, increasing the dosage rate of fibers continued to
increase the strength and toughness of the soil, but the maximum dosage rate was limited to 1%
of the dry weight of soil because mixing became difficult above this dosage.
• When used as primary stabilizers for soils with high water contents, longer fibers may
have increased the strength more than shorter fibers because the soil was ductile and bulged at
high strains before failure, which should have allowed a greater mobilization of the strength of
long fibers before pullout.
• Although adding fibers as a primary stabilizer to a soft clay resulted in strength increases,
the relatively small increase in strength may be of little practical value in field applications.
5.5.2 Secondary Stabilizers
The combination of chemical stabilizer and short fibers was most effective in treating the
Staunton clay and the VBC, since the chemical stabilizer greatly increased the UCS, the short
fibers significantly increased the toughness, and all of the other secondary stabilizers failed to
53
produce any significant increases in UCS. Because soil treated with only a chemical stabilizer is
often brittle, the addition of the short fibers may be very important in contingency airfield
applications. Other key findings are listed below.
• Sodium silicate was ineffective alone and as a secondary stabilizer. This may have been
due to the formation of a weak calcium silicate gel, fewer calcium ions available for ion
exchange, and/or ions dissociated from the sodium silicate causing the clay structure to disperse.
• The super absorbent polymers reduced the effects of the calcium carbide because the
polymers did not harden and remained in granular form, which created pockets of weakness
throughout the soil. Also, if the polymers did react at all with the calcium carbide, the
availability of calcium for ion exchange with the clay particles would have been reduced.
• Superplasticizers may be beneficial for grouting applications, as they increase the
workability of microfine cement by separating the cement particles, but they are not beneficial
for high early strength and decreased the rate of strength gain for the cement-stabilized soil in
this study.
• Superplasticizers and accelerators had little effect on the UCS because the most effective
dosage rate based on cement weight may have been too small considering that the percentage of
cement used in the soil was much lower than the percentage typically used in concrete mixtures.
• The most important effect of adding fibers to a clay already treated with a primary
chemical stabilizer may have been an increase in toughness, since soil treated with only a
primary chemical stabilizer was often brittle and the fibers had little effect on strength at small
strains.
• As secondary stabilizers, shorter fibers appeared to increase the toughness the most, since
the treated soil was brittle and failed at small strains, where a greater number of short fibers may
have been oriented to resist loading than fewer long fibers at the same dosage rate.
• As secondary stabilizers, the size and shape of the fibers may have been very important,
since fibers that were too large or did not disperse well during mixing may have negatively
affected the UCS strength of a treated clay by introducing failure planes or pockets of weakness.
• The type of fiber material may not have had much influence on the UCS as secondary
stabilizers, as demonstrated by the similar stress-strain curves of the VBC treated with different
fibers of the same dimensions.
54
• Hydrogen bonding between the PVA fibers and untreated or treated clay may not have
occurred as a result of the very high wc/c of the Staunton clay and the VBC.
55
6.0 Dosage Rate and Treatment Study
The purpose of this study was to determine appropriate dosage rates and treatment types to
achieve adequate performance characteristics for a potential underlying subbase layer and top
base layer. Since the subbase layer requires only moderate strength and the base layer requires
high strength and toughness, different treatments at different dosage rates were chosen and
evaluated for each layer. However, the dosage rates and treatments for each layer are not
completely independent of one another, since the base layer must be created out of the subbase
layer for constructability reasons. As a result, the base layer treatment must include the same
stabilizer at the same dosage rate used to treat the subbase layer in addition to other stabilizers
that will make the base layer stronger and tougher. For a dosage rate and treatment type to be
considered successful, a potential subbase layer must satisfy the required CBR value found in the
design charts in Appendix D for a particular loading condition, and a potential base layer must
have a minimum CBR value of 80.
This section describes the testing methods used to evaluate the different dosage rates and
treatment methods, lists the different stabilizers and combination of stabilizers tested, and lists
the dosage rates and methods in which the different stabilizers were applied. This section also
presents the results from each treatment method as well as a discussion of the results.
6.1 Laboratory Tests
UCS tests were run in general accordance with ASTM D 2166 at various dosage rates of the
most effective stabilizers to determine the dosage rates needed to achieve different pavement
design strengths for the subbase and base layer, since UCS tests require a small amount of soil
for samples that can be prepared and tested quickly. Unlike the stabilizer study, only one batch
of four samples was prepared, and all sample were tested after 72 hours of curing to determine
the average three-day UCS for each dosage rate of stabilizer or combination of stabilizers. Only
the three-day UCS values were evaluated, since the long-term UCS had already been evaluated
in the stabilizer study, fewer batches needed to be prepared, and the UCS tests could be
completed more quickly. The lab procedure used in this research for UCS tests is described in
Appendix A.
Like the stabilizer study, the results from the UCS tests were also used to evaluate
toughness in addition to strength. For the dosage rate and treatment study, toughness of samples
56
treated only with chemical stabilizers was calculated at 2% strain because these samples were
brittle and could not carry much load above a strain of 2%. For samples treated with chemical
stabilizers and fibers, toughness was calculated at 2% strain as well as 5% strain because these
samples were more ductile than the samples without fibers and the addition of the fibers allowed
these samples to sustain loads at strain levels often even exceeding 5%.
CBR tests were also run at dosage rates corresponding to the UCS tests in accordance
with ASTM D 1883, so that UCS could be correlated to CBR values for pavement design. As
suggested by ASTM D 1883, all samples were soaked for four days with a surcharge of 4.54 kg
before testing. To determine CBR values per ASTM D 1883, corrected CBR values were
calculated at penetrations of 0.1, 0.2, and 0.3 inches by dividing the stress recorded at these
penetrations by different correction factors, which increase in value as penetration increases.
The maximum corrected CBR value is the final reported CBR value for a particular sample,
which typically occurs at a penetration of 0.1 inches for untreated soils.
In addition, pH tests were also run for the untreated soil and at all dosage rates for the
soil treated with pelletized quicklime. These pH tests were run in general accordance with
ASTM D 4972 for testing the pH of the untreated soil in water and calcium chloride solutions,
and ASTM D 6276 for testing the pH of soil-lime mixtures in a water solution.
6.2 Dosage Rates and Treatment Types
Subbase Layer Pelletized quicklime was chosen to treat the VBC for consideration as a
subbase layer because this layer does not require exceptionally high strengths or durability, and
quicklime is easier to handle than cement. Table 6-1 summarizes the applied dosage rates by dry
weight of soil for the UCS, CBR, and pH tests.
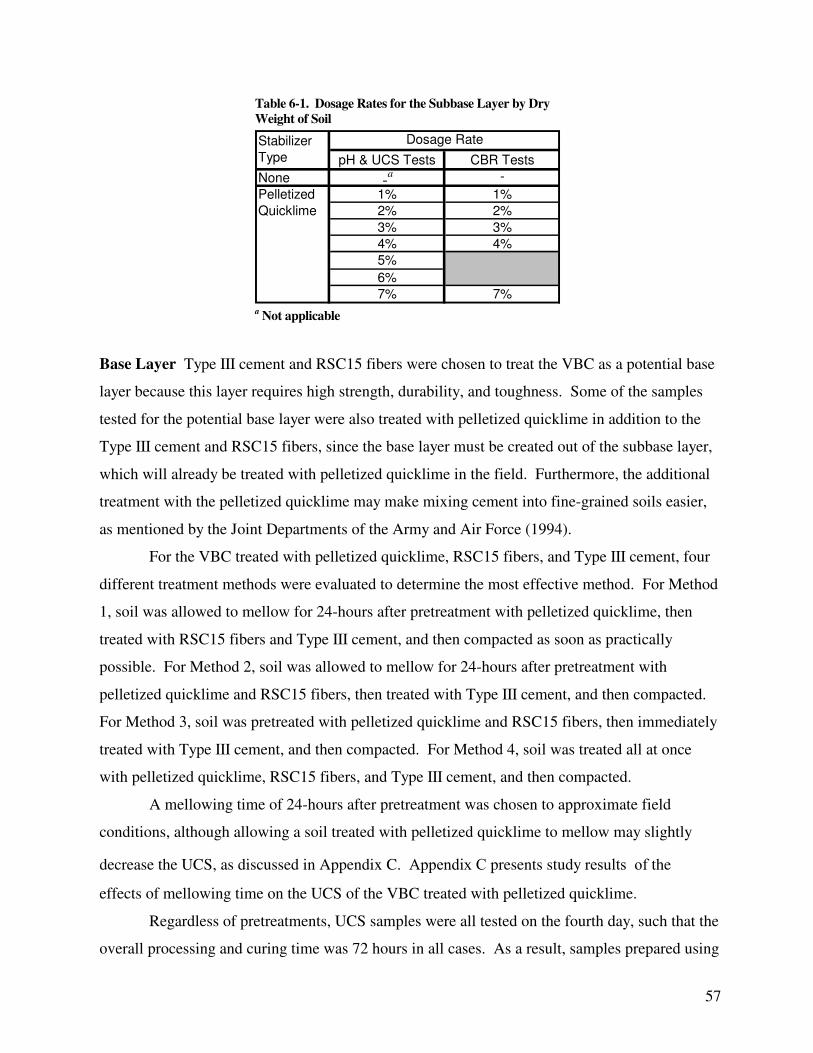
57
Table 6-1. Dosage Rates for the Subbase Layer by Dry
Weight of Soil
pH & UCS Tests CBR Tests
None -a -
1% 1%
2% 2%
3% 3%
4% 4%
5%
6%
7% 7%
Dosage RateStabilizer
Type
Pelletized
Quicklime
a Not applicable
Base Layer Type III cement and RSC15 fibers were chosen to treat the VBC as a potential base
layer because this layer requires high strength, durability, and toughness. Some of the samples
tested for the potential base layer were also treated with pelletized quicklime in addition to the
Type III cement and RSC15 fibers, since the base layer must be created out of the subbase layer,
which will already be treated with pelletized quicklime in the field. Furthermore, the additional
treatment with the pelletized quicklime may make mixing cement into fine-grained soils easier,
as mentioned by the Joint Departments of the Army and Air Force (1994).
For the VBC treated with pelletized quicklime, RSC15 fibers, and Type III cement, four
different treatment methods were evaluated to determine the most effective method. For Method
1, soil was allowed to mellow for 24-hours after pretreatment with pelletized quicklime, then
treated with RSC15 fibers and Type III cement, and then compacted as soon as practically
possible. For Method 2, soil was allowed to mellow for 24-hours after pretreatment with
pelletized quicklime and RSC15 fibers, then treated with Type III cement, and then compacted.
For Method 3, soil was pretreated with pelletized quicklime and RSC15 fibers, then immediately
treated with Type III cement, and then compacted. For Method 4, soil was treated all at once
with pelletized quicklime, RSC15 fibers, and Type III cement, and then compacted.
A mellowing time of 24-hours after pretreatment was chosen to approximate field
conditions, although allowing a soil treated with pelletized quicklime to mellow may slightly
decrease the UCS, as discussed in Appendix C. Appendix C presents study results of the
effects of mellowing time on the UCS of the VBC treated with pelletized quicklime.
Regardless of pretreatments, UCS samples were all tested on the fourth day, such that the
overall processing and curing time was 72 hours in all cases. As a result, samples prepared using
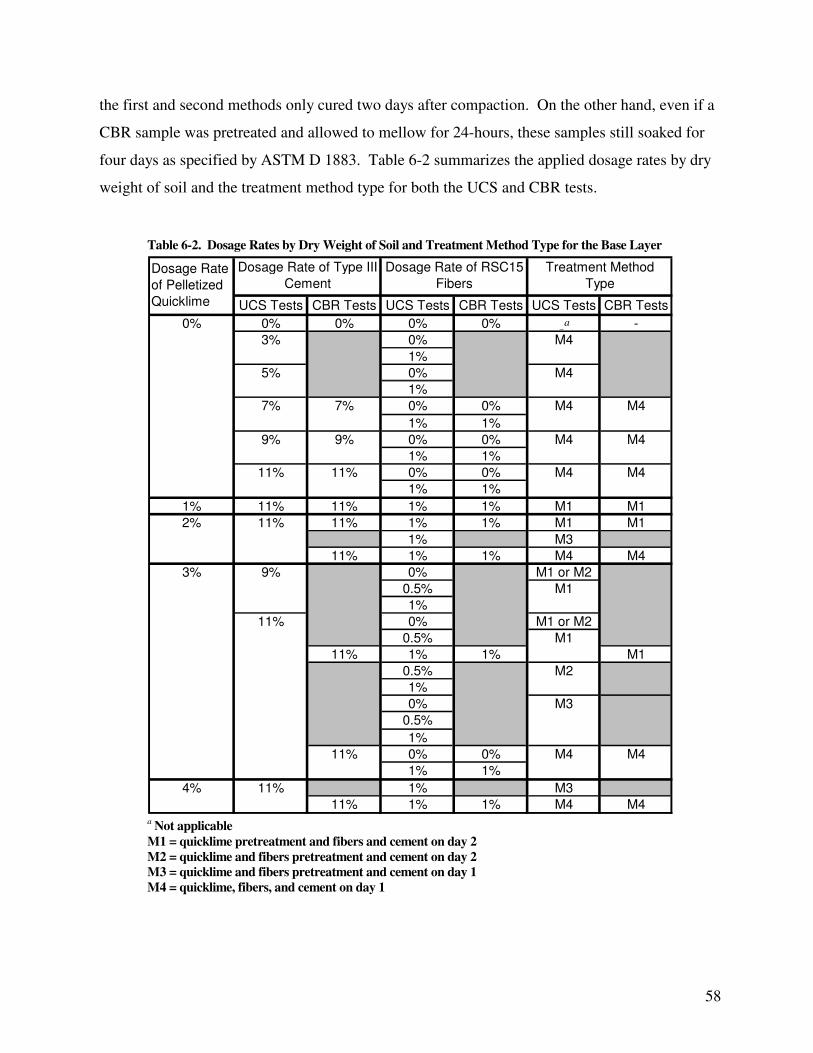
58
the first and second methods only cured two days after compaction. On the other hand, even if a
CBR sample was pretreated and allowed to mellow for 24-hours, these samples still soaked for
four days as specified by ASTM D 1883. Table 6-2 summarizes the applied dosage rates by dry
weight of soil and the treatment method type for both the UCS and CBR tests.
Table 6-2. Dosage Rates by Dry Weight of Soil and Treatment Method Type for the Base Layer
UCS Tests CBR Tests UCS Tests CBR Tests UCS Tests CBR Tests
0% 0% 0% 0% -a -
0%
1%
0%
1%
0% 0%
1% 1%
0% 0%
1% 1%
0% 0%
1% 1%
1% 11% 11% 1% 1% M1 M1
11% 1% 1% M1 M1
1% M3
11% 1% 1% M4 M4
0% M1 or M2
0.5%
1%
0% M1 or M2
0.5%
11% 1% 1% M1
0.5%
1%
0%
0.5%
1%
0% 0%
1% 1%
1% M3
11% 1% 1% M4 M4
Dosage Rate of RSC15
Fibers
M4
M4 M4
Treatment Method
Type
7%
9%
11%
7%
Dosage Rate
of Pelletized
Quicklime
11%
M4
M4
M4 M4
Dosage Rate of Type III
Cement
0%
9%
3%
5% M4
9%
4% 11%
M4 M411%
11%
3%
M3
2% 11%
M1
M2
M1
a Not applicable
M1 = quicklime pretreatment and fibers and cement on day 2
M2 = quicklime and fibers pretreatment and cement on day 2
M3 = quicklime and fibers pretreatment and cement on day 1
M4 = quicklime, fibers, and cement on day 1
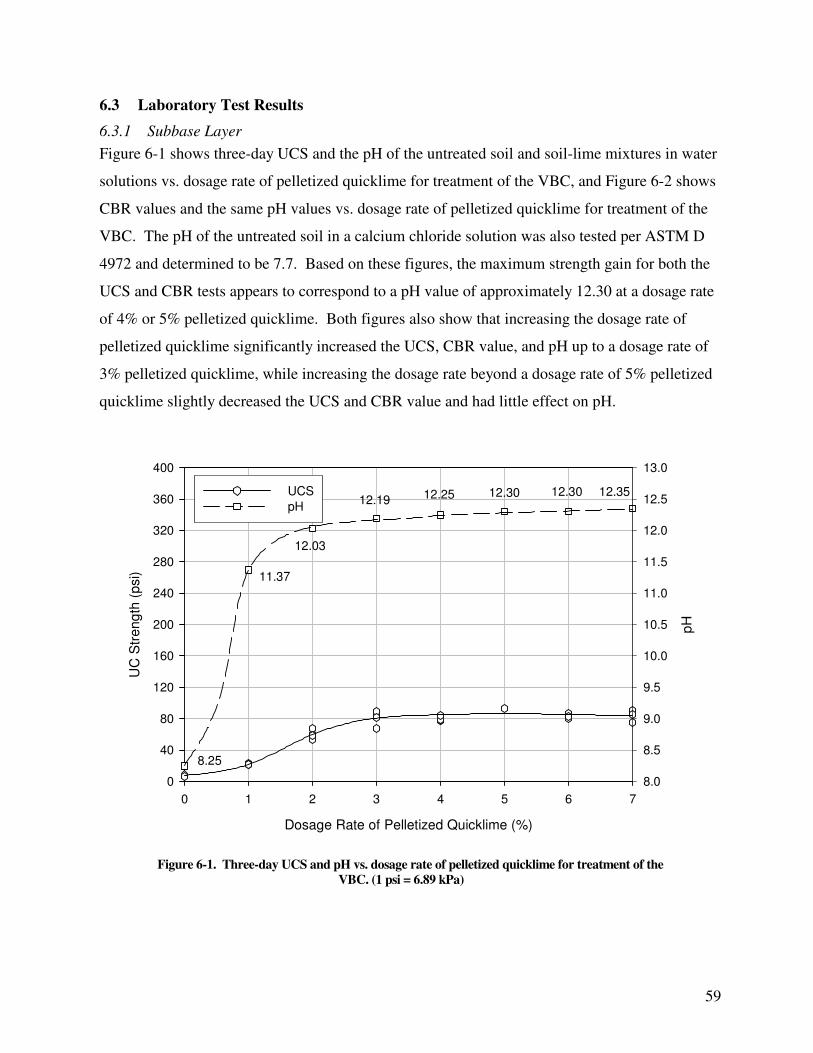
59
6.3 Laboratory Test Results
6.3.1 Subbase Layer
Figure 6-1 shows three-day UCS and the pH of the untreated soil and soil-lime mixtures in water
solutions vs. dosage rate of pelletized quicklime for treatment of the VBC, and Figure 6-2 shows
CBR values and the same pH values vs. dosage rate of pelletized quicklime for treatment of the
VBC. The pH of the untreated soil in a calcium chloride solution was also tested per ASTM D
4972 and determined to be 7.7. Based on these figures, the maximum strength gain for both the
UCS and CBR tests appears to correspond to a pH value of approximately 12.30 at a dosage rate
of 4% or 5% pelletized quicklime. Both figures also show that increasing the dosage rate of
pelletized quicklime significantly increased the UCS, CBR value, and pH up to a dosage rate of
3% pelletized quicklime, while increasing the dosage rate beyond a dosage rate of 5% pelletized
quicklime slightly decreased the UCS and CBR value and had little effect on pH.
Dosage Rate of Pelletized Quicklime (%)
0 1 2 3 4 5 6 7
UC
Str
en
gth
(p
si)
0
40
80
120
160
200
240
280
320
360
400
pH
8.0
8.5
9.0
9.5
10.0
10.5
11.0
11.5
12.0
12.5
13.0
UCS
pH
8.25
11.37
12.25 12.3512.3012.30
12.03
12.19
Figure 6-1. Three-day UCS and pH vs. dosage rate of pelletized quicklime for treatment of the
VBC. (1 psi = 6.89 kPa)
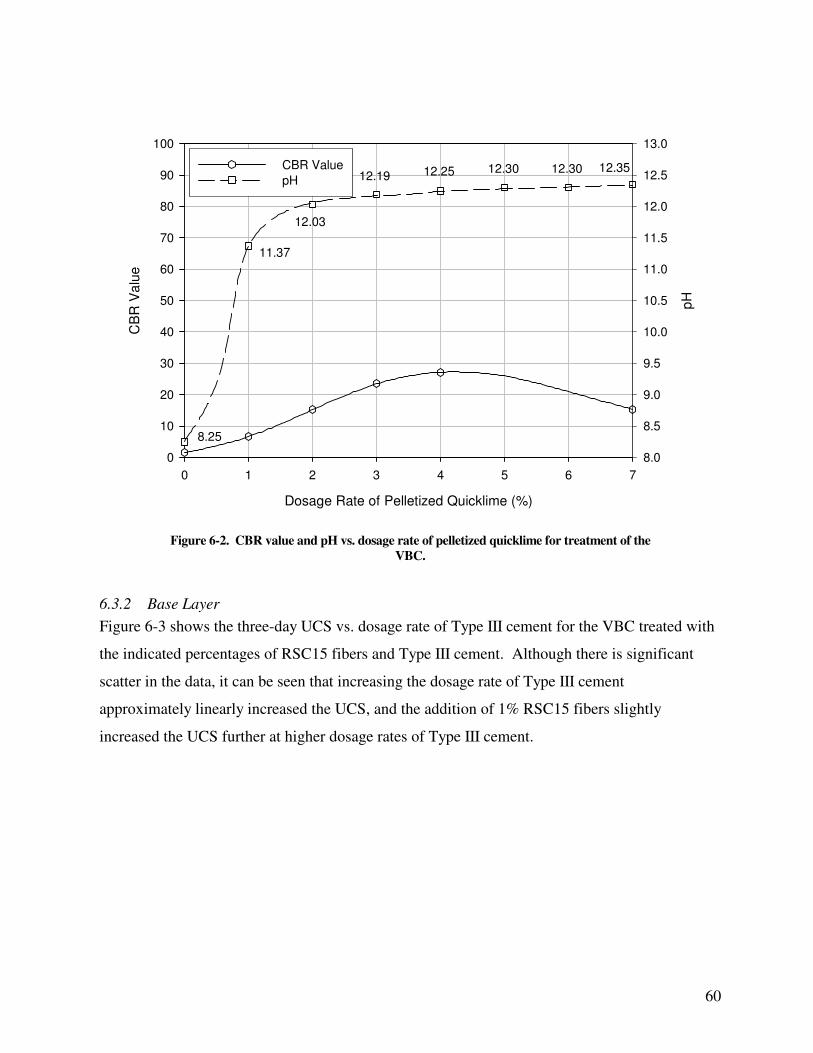
60
Dosage Rate of Pelletized Quicklime (%)
0 1 2 3 4 5 6 7
CB
R V
alu
e
0
10
20
30
40
50
60
70
80
90
100
pH
8.0
8.5
9.0
9.5
10.0
10.5
11.0
11.5
12.0
12.5
13.0
CBR Value
pH
8.25
11.37
12.25 12.3512.3012.30
12.03
12.19
Figure 6-2. CBR value and pH vs. dosage rate of pelletized quicklime for treatment of the
VBC.
6.3.2 Base Layer
Figure 6-3 shows the three-day UCS vs. dosage rate of Type III cement for the VBC treated with
the indicated percentages of RSC15 fibers and Type III cement. Although there is significant
scatter in the data, it can be seen that increasing the dosage rate of Type III cement
approximately linearly increased the UCS, and the addition of 1% RSC15 fibers slightly
increased the UCS further at higher dosage rates of Type III cement.
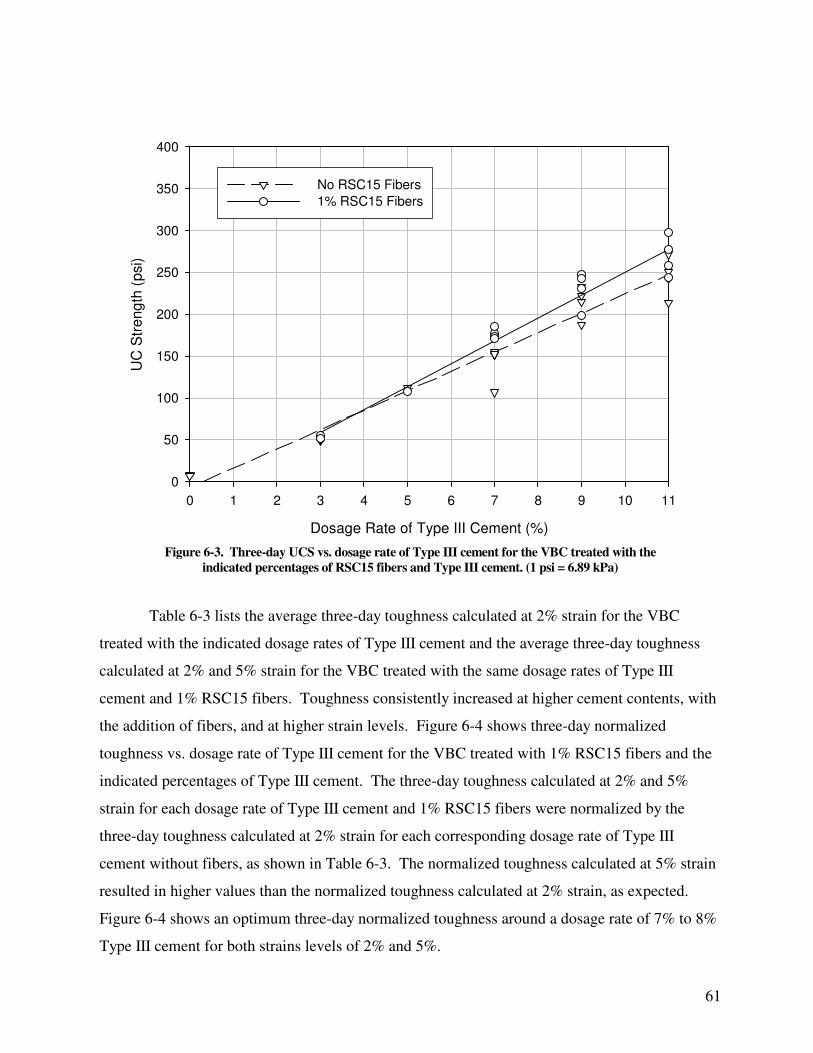
61
Dosage Rate of Type III Cement (%)
0 1 2 3 4 5 6 7 8 9 10 11
UC
Str
en
gth
(p
si)
0
50
100
150
200
250
300
350
400
No RSC15 Fibers
1% RSC15 Fibers
Figure 6-3. Three-day UCS vs. dosage rate of Type III cement for the VBC treated with the
indicated percentages of RSC15 fibers and Type III cement. (1 psi = 6.89 kPa)
Table 6-3 lists the average three-day toughness calculated at 2% strain for the VBC
treated with the indicated dosage rates of Type III cement and the average three-day toughness
calculated at 2% and 5% strain for the VBC treated with the same dosage rates of Type III
cement and 1% RSC15 fibers. Toughness consistently increased at higher cement contents, with
the addition of fibers, and at higher strain levels. Figure 6-4 shows three-day normalized
toughness vs. dosage rate of Type III cement for the VBC treated with 1% RSC15 fibers and the
indicated percentages of Type III cement. The three-day toughness calculated at 2% and 5%
strain for each dosage rate of Type III cement and 1% RSC15 fibers were normalized by the
three-day toughness calculated at 2% strain for each corresponding dosage rate of Type III
cement without fibers, as shown in Table 6-3. The normalized toughness calculated at 5% strain
resulted in higher values than the normalized toughness calculated at 2% strain, as expected.
Figure 6-4 shows an optimum three-day normalized toughness around a dosage rate of 7% to 8%
Type III cement for both strains levels of 2% and 5%.
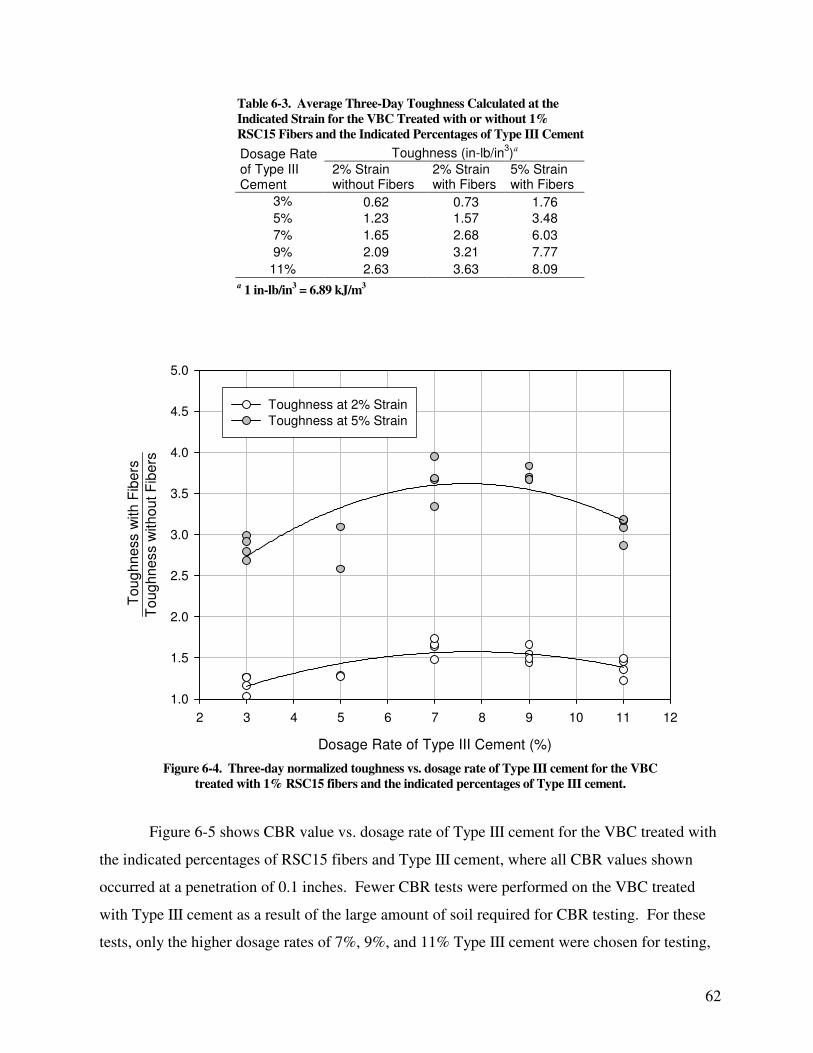
62
Table 6-3. Average Three-Day Toughness Calculated at the
Indicated Strain for the VBC Treated with or without 1%
RSC15 Fibers and the Indicated Percentages of Type III Cement
Toughness (in-lb/in3)a Dosage Rate
of Type III Cement
2% Strain without Fibers
2% Strain with Fibers
5% Strain with Fibers
3% 0.62 0.73 1.76
5% 1.23 1.57 3.48
7% 1.65 2.68 6.03
9% 2.09 3.21 7.77
11% 2.63 3.63 8.09 a 1 in-lb/in
3 = 6.89 kJ/m
3
Dosage Rate of Type III Cement (%)
2 3 4 5 6 7 8 9 10 11 12
To
ug
hn
ess w
ith
ou
t F
ibe
rs
1.0
1.5
2.0
2.5
3.0
3.5
4.0
4.5
5.0
Toughness at 2% Strain
Toughness at 5% Strain
To
ug
hn
ess w
ith
Fib
ers
Figure 6-4. Three-day normalized toughness vs. dosage rate of Type III cement for the VBC
treated with 1% RSC15 fibers and the indicated percentages of Type III cement.
Figure 6-5 shows CBR value vs. dosage rate of Type III cement for the VBC treated with
the indicated percentages of RSC15 fibers and Type III cement, where all CBR values shown
occurred at a penetration of 0.1 inches. Fewer CBR tests were performed on the VBC treated
with Type III cement as a result of the large amount of soil required for CBR testing. For these
tests, only the higher dosage rates of 7%, 9%, and 11% Type III cement were chosen for testing,
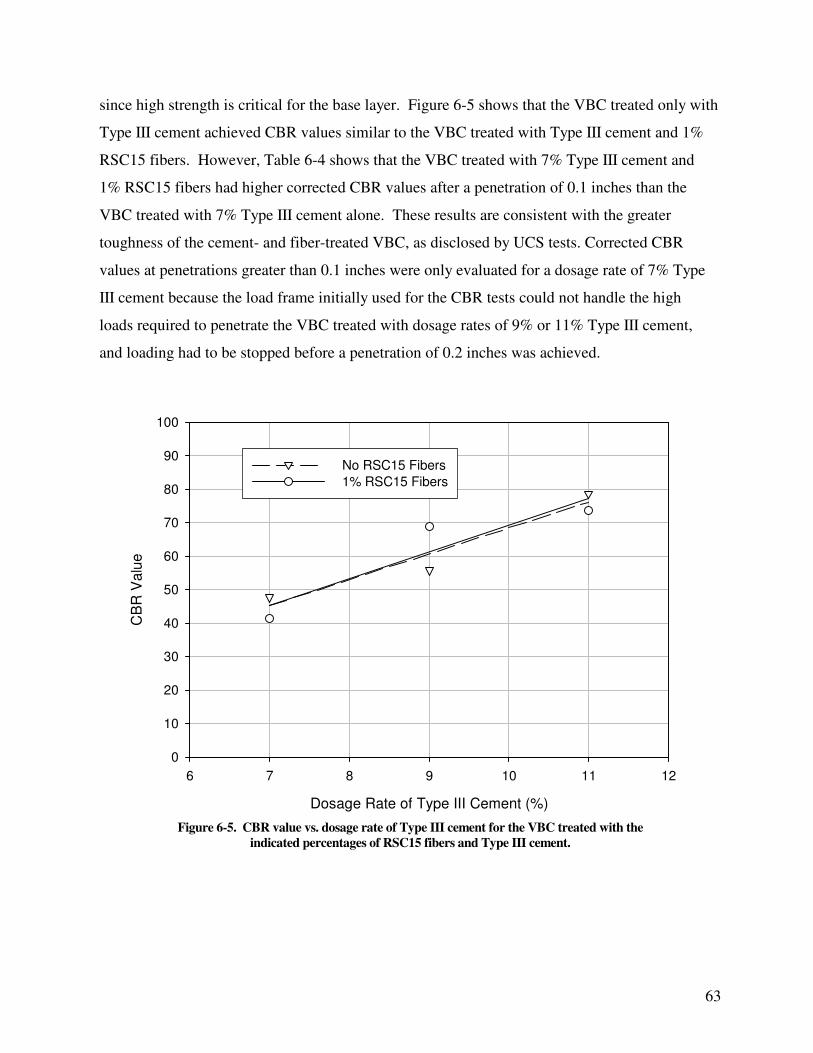
63
since high strength is critical for the base layer. Figure 6-5 shows that the VBC treated only with
Type III cement achieved CBR values similar to the VBC treated with Type III cement and 1%
RSC15 fibers. However, Table 6-4 shows that the VBC treated with 7% Type III cement and
1% RSC15 fibers had higher corrected CBR values after a penetration of 0.1 inches than the
VBC treated with 7% Type III cement alone. These results are consistent with the greater
toughness of the cement- and fiber-treated VBC, as disclosed by UCS tests. Corrected CBR
values at penetrations greater than 0.1 inches were only evaluated for a dosage rate of 7% Type
III cement because the load frame initially used for the CBR tests could not handle the high
loads required to penetrate the VBC treated with dosage rates of 9% or 11% Type III cement,
and loading had to be stopped before a penetration of 0.2 inches was achieved.
Dosage Rate of Type III Cement (%)
6 7 8 9 10 11 12
CB
R V
alu
e
0
10
20
30
40
50
60
70
80
90
100
No RSC15 Fibers
1% RSC15 Fibers
Figure 6-5. CBR value vs. dosage rate of Type III cement for the VBC treated with the
indicated percentages of RSC15 fibers and Type III cement.
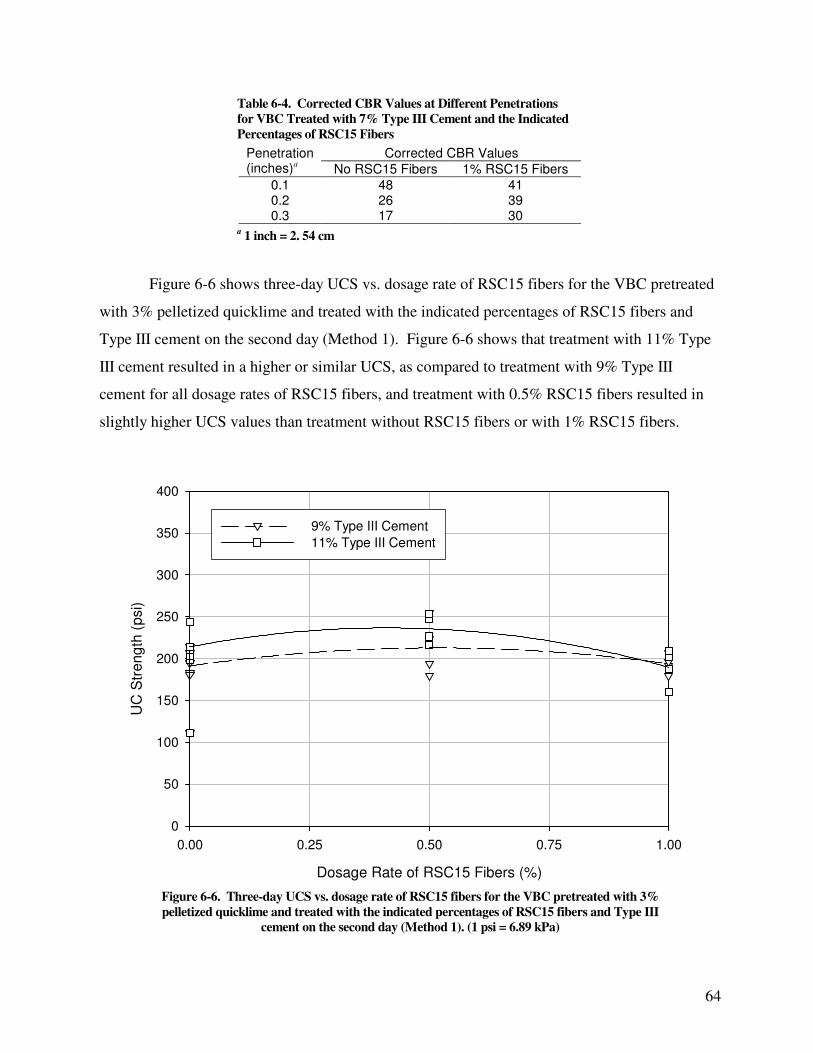
64
Table 6-4. Corrected CBR Values at Different Penetrations
for VBC Treated with 7% Type III Cement and the Indicated
Percentages of RSC15 Fibers
Corrected CBR Values Penetration (inches)a No RSC15 Fibers 1% RSC15 Fibers
0.1 48 41 0.2 26 39 0.3 17 30
a 1 inch = 2. 54 cm
Figure 6-6 shows three-day UCS vs. dosage rate of RSC15 fibers for the VBC pretreated
with 3% pelletized quicklime and treated with the indicated percentages of RSC15 fibers and
Type III cement on the second day (Method 1). Figure 6-6 shows that treatment with 11% Type
III cement resulted in a higher or similar UCS, as compared to treatment with 9% Type III
cement for all dosage rates of RSC15 fibers, and treatment with 0.5% RSC15 fibers resulted in
slightly higher UCS values than treatment without RSC15 fibers or with 1% RSC15 fibers.
Dosage Rate of RSC15 Fibers (%)
0.00 0.25 0.50 0.75 1.00
UC
Str
en
gth
(p
si)
0
50
100
150
200
250
300
350
400
9% Type III Cement
11% Type III Cement
Figure 6-6. Three-day UCS vs. dosage rate of RSC15 fibers for the VBC pretreated with 3%
pelletized quicklime and treated with the indicated percentages of RSC15 fibers and Type III
cement on the second day (Method 1). (1 psi = 6.89 kPa)
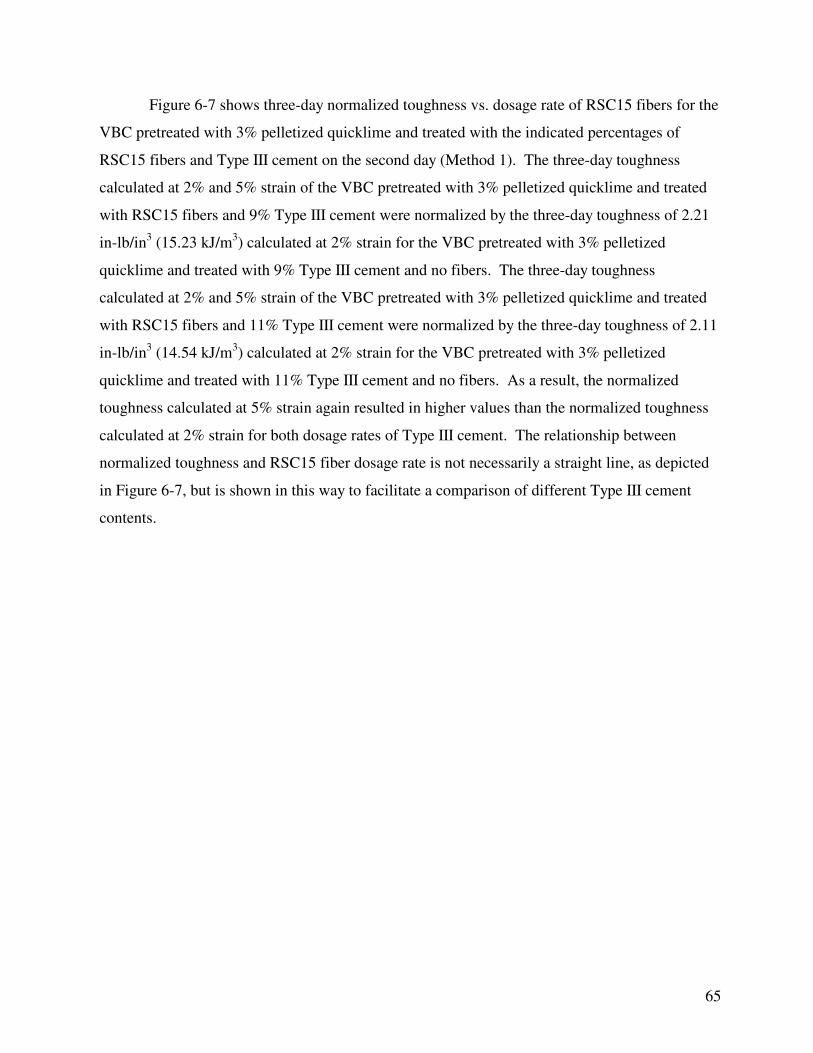
65
Figure 6-7 shows three-day normalized toughness vs. dosage rate of RSC15 fibers for the
VBC pretreated with 3% pelletized quicklime and treated with the indicated percentages of
RSC15 fibers and Type III cement on the second day (Method 1). The three-day toughness
calculated at 2% and 5% strain of the VBC pretreated with 3% pelletized quicklime and treated
with RSC15 fibers and 9% Type III cement were normalized by the three-day toughness of 2.21
in-lb/in3 (15.23 kJ/m
3) calculated at 2% strain for the VBC pretreated with 3% pelletized
quicklime and treated with 9% Type III cement and no fibers. The three-day toughness
calculated at 2% and 5% strain of the VBC pretreated with 3% pelletized quicklime and treated
with RSC15 fibers and 11% Type III cement were normalized by the three-day toughness of 2.11
in-lb/in3 (14.54 kJ/m
3) calculated at 2% strain for the VBC pretreated with 3% pelletized
quicklime and treated with 11% Type III cement and no fibers. As a result, the normalized
toughness calculated at 5% strain again resulted in higher values than the normalized toughness
calculated at 2% strain for both dosage rates of Type III cement. The relationship between
normalized toughness and RSC15 fiber dosage rate is not necessarily a straight line, as depicted
in Figure 6-7, but is shown in this way to facilitate a comparison of different Type III cement
contents.
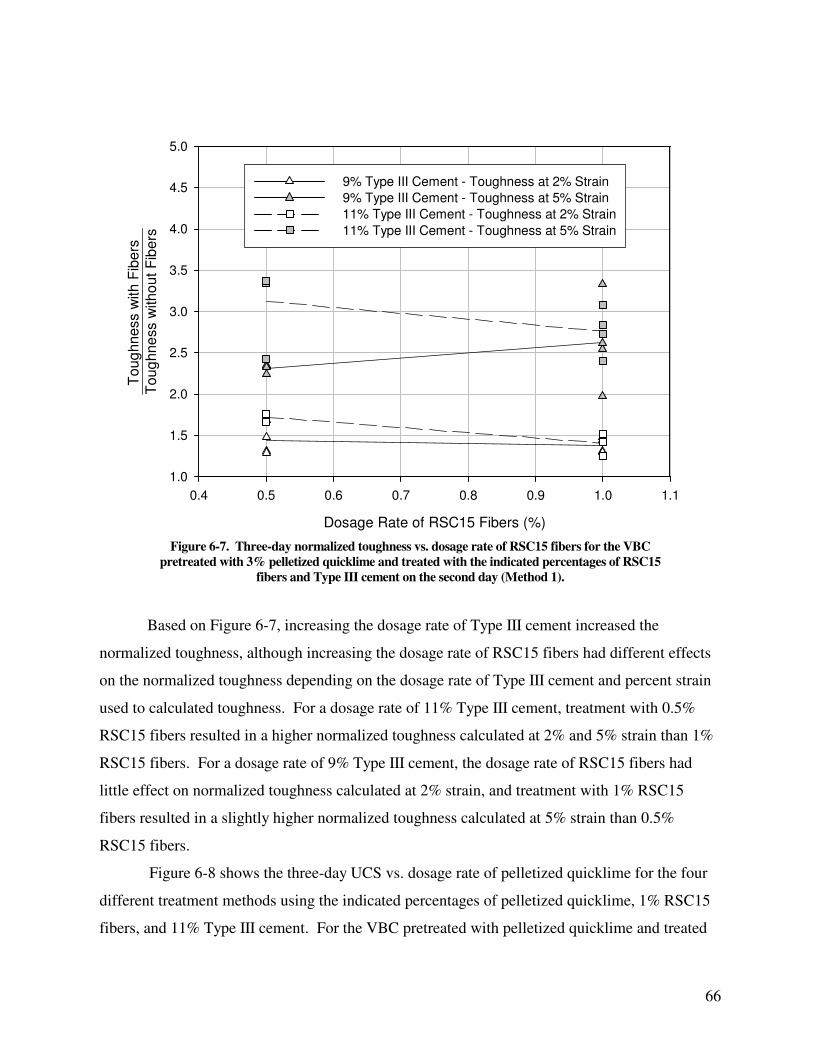
66
Dosage Rate of RSC15 Fibers (%)
0.4 0.5 0.6 0.7 0.8 0.9 1.0 1.1
Toug
hne
ss w
itho
ut
Fib
ers
1.0
1.5
2.0
2.5
3.0
3.5
4.0
4.5
5.0
9% Type III Cement - Toughness at 2% Strain
9% Type III Cement - Toughness at 5% Strain
11% Type III Cement - Toughness at 2% Strain
11% Type III Cement - Toughness at 5% Strain
Toug
hness w
ith F
ibe
rs
Figure 6-7. Three-day normalized toughness vs. dosage rate of RSC15 fibers for the VBC
pretreated with 3% pelletized quicklime and treated with the indicated percentages of RSC15
fibers and Type III cement on the second day (Method 1).
Based on Figure 6-7, increasing the dosage rate of Type III cement increased the
normalized toughness, although increasing the dosage rate of RSC15 fibers had different effects
on the normalized toughness depending on the dosage rate of Type III cement and percent strain
used to calculated toughness. For a dosage rate of 11% Type III cement, treatment with 0.5%
RSC15 fibers resulted in a higher normalized toughness calculated at 2% and 5% strain than 1%
RSC15 fibers. For a dosage rate of 9% Type III cement, the dosage rate of RSC15 fibers had
little effect on normalized toughness calculated at 2% strain, and treatment with 1% RSC15
fibers resulted in a slightly higher normalized toughness calculated at 5% strain than 0.5%
RSC15 fibers.
Figure 6-8 shows the three-day UCS vs. dosage rate of pelletized quicklime for the four
different treatment methods using the indicated percentages of pelletized quicklime, 1% RSC15
fibers, and 11% Type III cement. For the VBC pretreated with pelletized quicklime and treated
67
with 1% RSC15 fibers and 11% Type III cement on the second day (Method 1), Figure 6-8
shows that increasing the dosage rate of pelletized quicklime decreased the UCS. On the other
hand, increasing the dosage rate of pelletized quicklime increased the UCS for the VBC
pretreated with pelletized quicklime and 1% RSC15 fibers and then treated with 11% Type III
cement on the first day (Method 3) and for the VBC treated with pelletized quicklime, 1%
RSC15 fibers, and 11% Type III cement on the first day (Method 4). Overall, the highest UCS
for all tested dosage rates of pelletized quicklime resulted from the VBC treated with pelletized
quicklime, 1% RSC15 fibers, and 11% Type III cement on the first day (Method 4), followed by
the VBC pretreated with pelletized quicklime and 1% RSC15 fibers and treated with 11% Type
III cement on the first day (Method 3), then the VBC pretreated with pelletized quicklime and
1% RSC15 fibers and then treated with 11% Type III cement on the second day (Method 2), and
finally the VBC pretreated with pelletized quicklime and then treated with 1% RSC15 fibers and
11% Type III cement on the second day (Method 1).
Dosage Rate of Pelletized Quicklime (%)
0.0 0.5 1.0 1.5 2.0 2.5 3.0 3.5 4.0
UC
Str
eng
th (
psi)
0
50
100
150
200
250
300
350
400
M1: Quicklime Pretreatment & 1% Fibers & 11% Cement on Day 2
M2: Quicklime & 1% Fibers Pretreatment & 11% Cement on Day 2
M3: Quicklime & 1% Fibers Pretreatment & 11% Cement on Day 1
M4: Quicklime, 1% Fibers, & 11% Cement on Day 1
Figure 6-8. Three-day UCS vs. dosage rate of pelletized quicklime for the four different
treatment methods using the indicated percentages of pelletized quicklime, 1% RSC15 fibers,
and 11% Type III cement. (1 psi = 6.89 kPa)
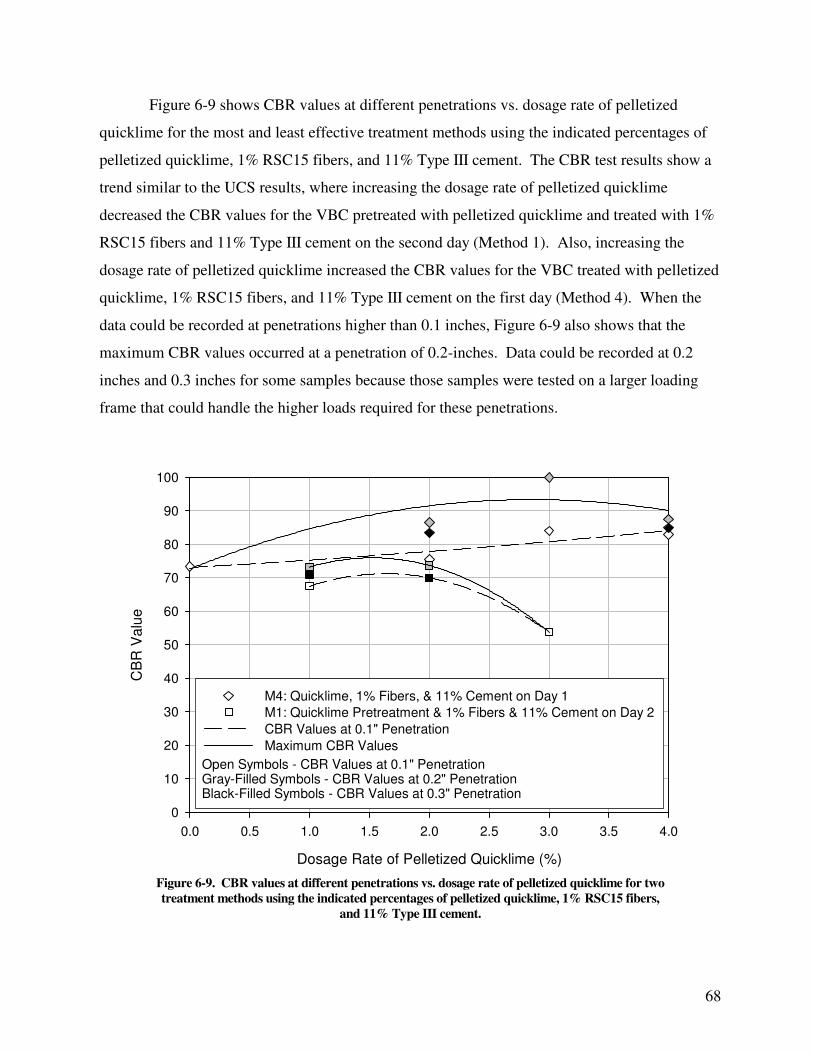
68
Figure 6-9 shows CBR values at different penetrations vs. dosage rate of pelletized
quicklime for the most and least effective treatment methods using the indicated percentages of
pelletized quicklime, 1% RSC15 fibers, and 11% Type III cement. The CBR test results show a
trend similar to the UCS results, where increasing the dosage rate of pelletized quicklime
decreased the CBR values for the VBC pretreated with pelletized quicklime and treated with 1%
RSC15 fibers and 11% Type III cement on the second day (Method 1). Also, increasing the
dosage rate of pelletized quicklime increased the CBR values for the VBC treated with pelletized
quicklime, 1% RSC15 fibers, and 11% Type III cement on the first day (Method 4). When the
data could be recorded at penetrations higher than 0.1 inches, Figure 6-9 also shows that the
maximum CBR values occurred at a penetration of 0.2-inches. Data could be recorded at 0.2
inches and 0.3 inches for some samples because those samples were tested on a larger loading
frame that could handle the higher loads required for these penetrations.
Dosage Rate of Pelletized Quicklime (%)
0.0 0.5 1.0 1.5 2.0 2.5 3.0 3.5 4.0
CB
R V
alu
e
0
10
20
30
40
50
60
70
80
90
100
M4: Quicklime, 1% Fibers, & 11% Cement on Day 1
M1: Quicklime Pretreatment & 1% Fibers & 11% Cement on Day 2
CBR Values at 0.1" Penetration
Maximum CBR Values
Open Symbols - CBR Values at 0.1" PenetrationGray-Filled Symbols - CBR Values at 0.2" PenetrationBlack-Filled Symbols - CBR Values at 0.3" Penetration
Figure 6-9. CBR values at different penetrations vs. dosage rate of pelletized quicklime for two
treatment methods using the indicated percentages of pelletized quicklime, 1% RSC15 fibers,
and 11% Type III cement.
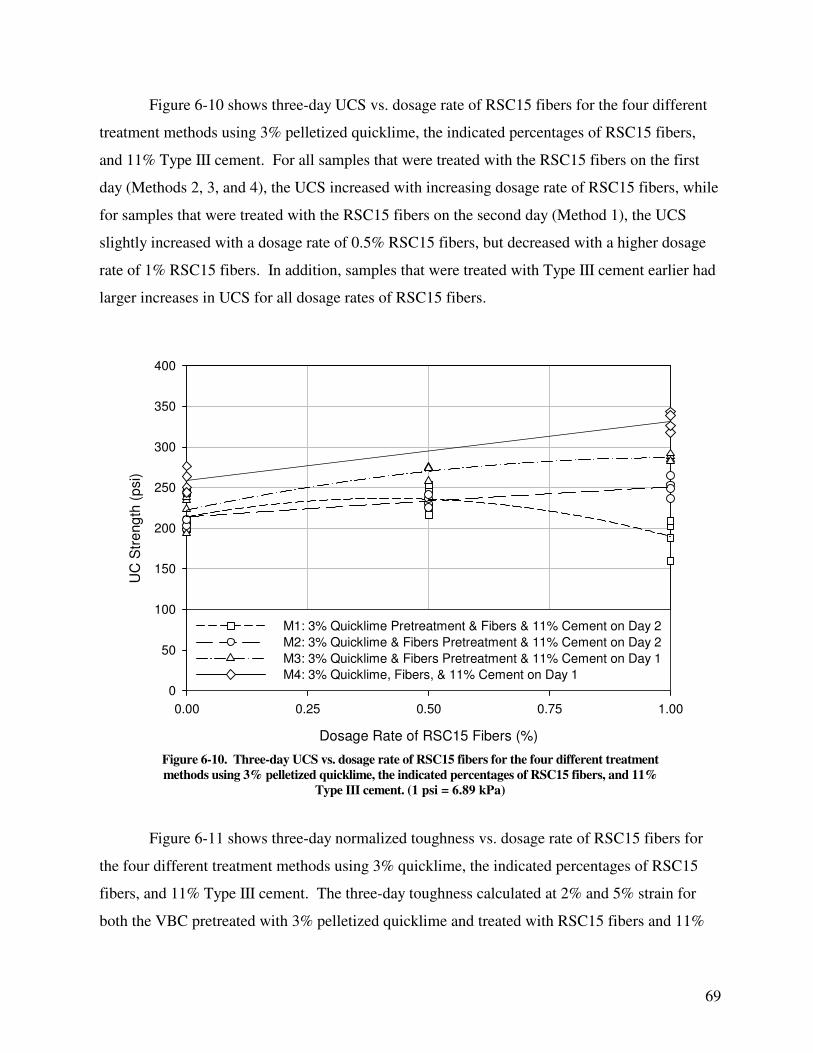
69
Figure 6-10 shows three-day UCS vs. dosage rate of RSC15 fibers for the four different
treatment methods using 3% pelletized quicklime, the indicated percentages of RSC15 fibers,
and 11% Type III cement. For all samples that were treated with the RSC15 fibers on the first
day (Methods 2, 3, and 4), the UCS increased with increasing dosage rate of RSC15 fibers, while
for samples that were treated with the RSC15 fibers on the second day (Method 1), the UCS
slightly increased with a dosage rate of 0.5% RSC15 fibers, but decreased with a higher dosage
rate of 1% RSC15 fibers. In addition, samples that were treated with Type III cement earlier had
larger increases in UCS for all dosage rates of RSC15 fibers.
Dosage Rate of RSC15 Fibers (%)
0.00 0.25 0.50 0.75 1.00
UC
Str
eng
th (
psi)
0
50
100
150
200
250
300
350
400
M1: 3% Quicklime Pretreatment & Fibers & 11% Cement on Day 2
M2: 3% Quicklime & Fibers Pretreatment & 11% Cement on Day 2
M3: 3% Quicklime & Fibers Pretreatment & 11% Cement on Day 1
M4: 3% Quicklime, Fibers, & 11% Cement on Day 1
Figure 6-10. Three-day UCS vs. dosage rate of RSC15 fibers for the four different treatment
methods using 3% pelletized quicklime, the indicated percentages of RSC15 fibers, and 11%
Type III cement. (1 psi = 6.89 kPa)
Figure 6-11 shows three-day normalized toughness vs. dosage rate of RSC15 fibers for
the four different treatment methods using 3% quicklime, the indicated percentages of RSC15
fibers, and 11% Type III cement. The three-day toughness calculated at 2% and 5% strain for
both the VBC pretreated with 3% pelletized quicklime and treated with RSC15 fibers and 11%
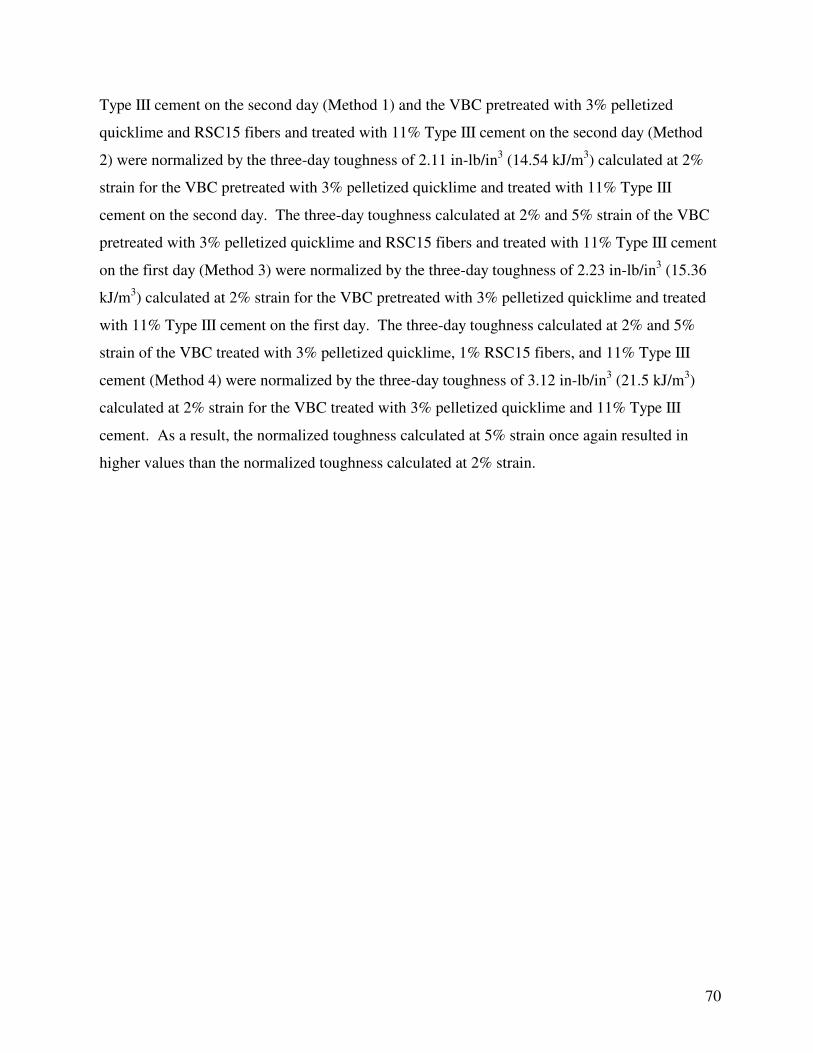
70
Type III cement on the second day (Method 1) and the VBC pretreated with 3% pelletized
quicklime and RSC15 fibers and treated with 11% Type III cement on the second day (Method
2) were normalized by the three-day toughness of 2.11 in-lb/in3 (14.54 kJ/m
3) calculated at 2%
strain for the VBC pretreated with 3% pelletized quicklime and treated with 11% Type III
cement on the second day. The three-day toughness calculated at 2% and 5% strain of the VBC
pretreated with 3% pelletized quicklime and RSC15 fibers and treated with 11% Type III cement
on the first day (Method 3) were normalized by the three-day toughness of 2.23 in-lb/in3 (15.36
kJ/m3) calculated at 2% strain for the VBC pretreated with 3% pelletized quicklime and treated
with 11% Type III cement on the first day. The three-day toughness calculated at 2% and 5%
strain of the VBC treated with 3% pelletized quicklime, 1% RSC15 fibers, and 11% Type III
cement (Method 4) were normalized by the three-day toughness of 3.12 in-lb/in3 (21.5 kJ/m
3)
calculated at 2% strain for the VBC treated with 3% pelletized quicklime and 11% Type III
cement. As a result, the normalized toughness calculated at 5% strain once again resulted in
higher values than the normalized toughness calculated at 2% strain.
71
Dosage Rate of RSC15 Fibers (%)
0.4 0.5 0.6 0.7 0.8 0.9 1.0 1.1
To
ug
hn
ess w
ith
ou
t F
ibe
rs
1.0
1.5
2.0
2.5
3.0
3.5
4.0
4.5
5.0
M1: 3% Quicklime Pretreatment & Fibers & 11% Cement on Day 2
M2: 3% Quicklime & Fibers Pretreatment & 11% Cement on Day 2
M3: 3% Quicklime & Fibers Pretreatment & 11% Cement on Day 1
M4: 3% Quicklime, 1% Fibers, & 11% Cement on Day 1
To
ug
hn
ess w
ith
Fib
ers
Open Symbols - Toughness at 2% StrainGray-Filled Symbol - Toughness at 5% Strain
Figure 6-11. Three-day normalized toughness vs. dosage rate of RSC15 fibers for the four
different treatment methods using 3% quicklime, the indicated percentages of RSC15 fibers,
and 11% Type III cement.
Except for the VBC pretreated with 3% pelletized quicklime and treated with RSC15
fibers and 11% Type III cement on the second day (Method 1), increasing the dosage rate of
RSC15 fibers increased the normalized toughness for toughness calculated at 5% strain and had
little effect on the normalized toughness for toughness calculated 2% strain. For the VBC
pretreated with 3% pelletized quicklime, and treated with RSC15 fibers and 11% Type III
cement on the second day (Method 1), increasing the dosage rate of RSC15 fibers may have
slightly decreased the normalized toughness, as previously discussed. Overall, the addition of
the RSC15 fibers increased the normalized toughness of the VBC pretreated with 3% pelletized
quicklime and RSC15 fibers and treated with 11% Type III cement on the first or second day
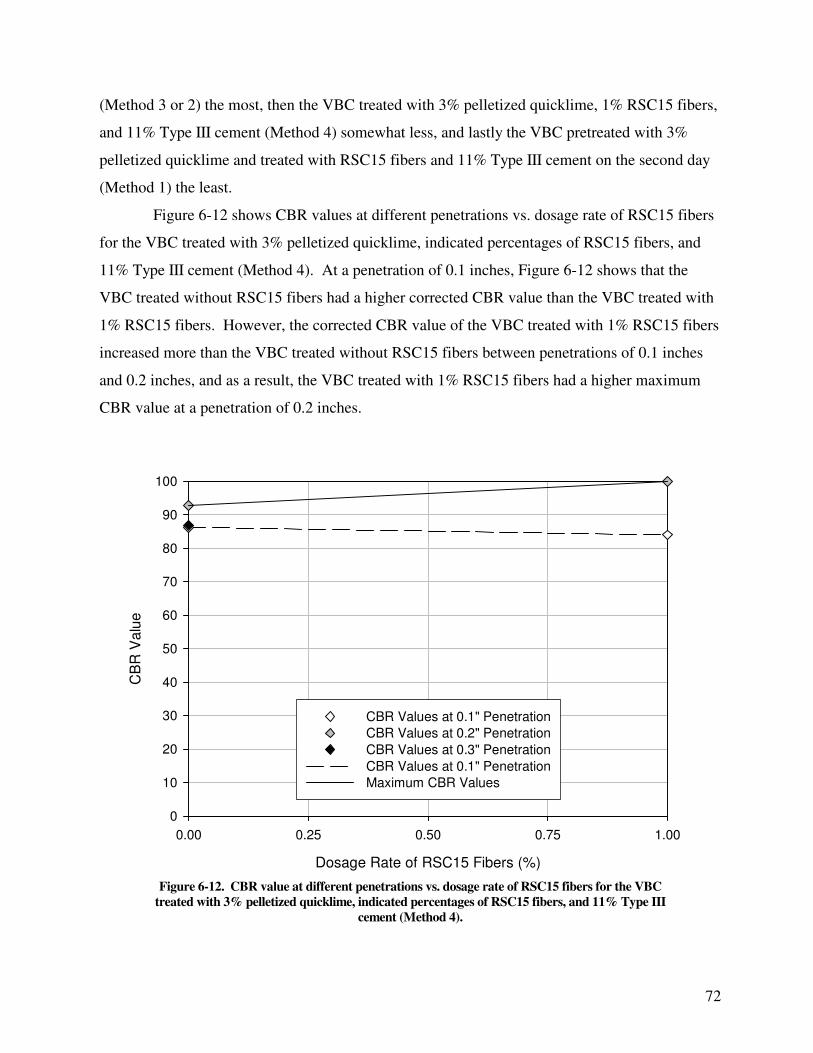
72
(Method 3 or 2) the most, then the VBC treated with 3% pelletized quicklime, 1% RSC15 fibers,
and 11% Type III cement (Method 4) somewhat less, and lastly the VBC pretreated with 3%
pelletized quicklime and treated with RSC15 fibers and 11% Type III cement on the second day
(Method 1) the least.
Figure 6-12 shows CBR values at different penetrations vs. dosage rate of RSC15 fibers
for the VBC treated with 3% pelletized quicklime, indicated percentages of RSC15 fibers, and
11% Type III cement (Method 4). At a penetration of 0.1 inches, Figure 6-12 shows that the
VBC treated without RSC15 fibers had a higher corrected CBR value than the VBC treated with
1% RSC15 fibers. However, the corrected CBR value of the VBC treated with 1% RSC15 fibers
increased more than the VBC treated without RSC15 fibers between penetrations of 0.1 inches
and 0.2 inches, and as a result, the VBC treated with 1% RSC15 fibers had a higher maximum
CBR value at a penetration of 0.2 inches.
Dosage Rate of RSC15 Fibers (%)
0.00 0.25 0.50 0.75 1.00
CB
R V
alu
e
0
10
20
30
40
50
60
70
80
90
100
CBR Values at 0.1" Penetration
CBR Values at 0.2" Penetration
CBR Values at 0.3" Penetration
CBR Values at 0.1" Penetration
Maximum CBR Values
Figure 6-12. CBR value at different penetrations vs. dosage rate of RSC15 fibers for the VBC
treated with 3% pelletized quicklime, indicated percentages of RSC15 fibers, and 11% Type III
cement (Method 4).
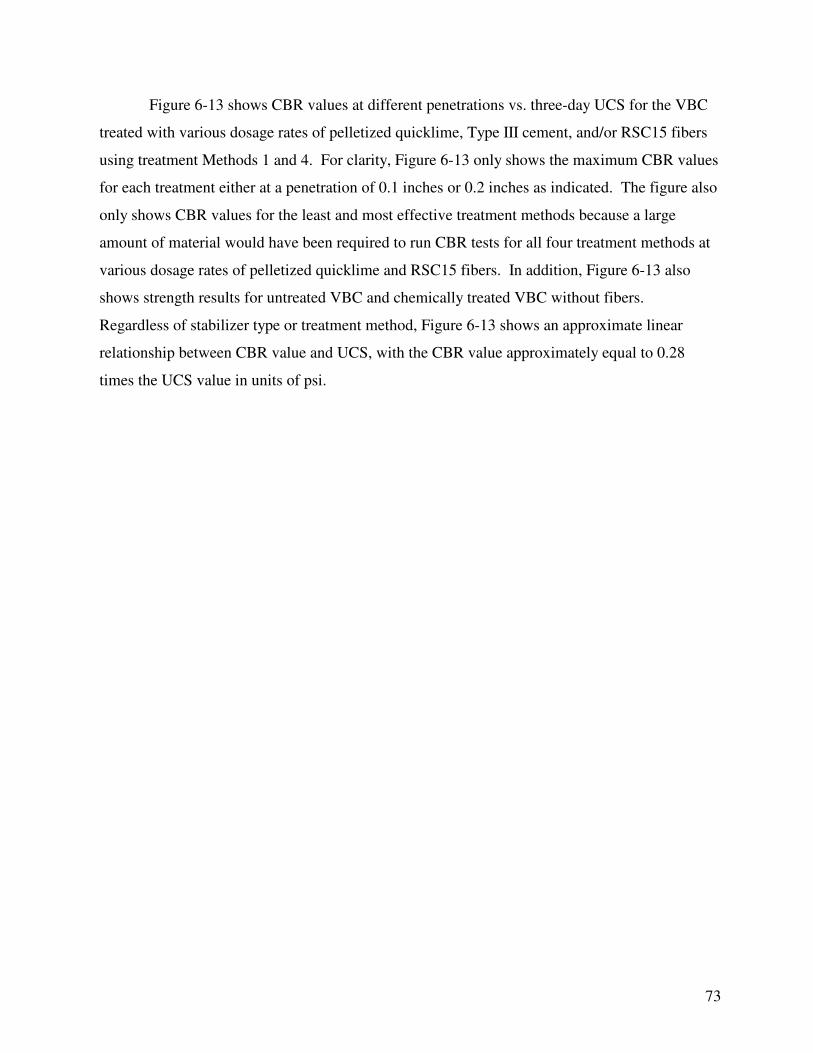
73
Figure 6-13 shows CBR values at different penetrations vs. three-day UCS for the VBC
treated with various dosage rates of pelletized quicklime, Type III cement, and/or RSC15 fibers
using treatment Methods 1 and 4. For clarity, Figure 6-13 only shows the maximum CBR values
for each treatment either at a penetration of 0.1 inches or 0.2 inches as indicated. The figure also
only shows CBR values for the least and most effective treatment methods because a large
amount of material would have been required to run CBR tests for all four treatment methods at
various dosage rates of pelletized quicklime and RSC15 fibers. In addition, Figure 6-13 also
shows strength results for untreated VBC and chemically treated VBC without fibers.
Regardless of stabilizer type or treatment method, Figure 6-13 shows an approximate linear
relationship between CBR value and UCS, with the CBR value approximately equal to 0.28
times the UCS value in units of psi.
74
UC Strength (psi)
0 50 100 150 200 250 300 350 400
CB
R V
alu
e
0
10
20
30
40
50
60
70
80
90
100
Untreated
Quicklime
Cement
Cement & 1% Fibers
M1: Quicklime Pretreatment & 1% Fibers & 11% Cement on Day 2
M4: Quicklime, 1% Fibers, & 11% Cement on Day 1
3% Quicklime & 11% Cement
Open Symbols - Max. CBR Value Occurred at 0.1" PenetrationGray-Filled Symbols - Max. CBR Value Occurred at 0.2" Penetration
Figure 6-13. Correlation of CBR values at different penetrations vs. three-day UCS for the
VBC treated with various dosage rates of pelletized quicklime, RSC15 fibers, and Type III
cement using treatment Methods 1 and 4. (1 psi = 6.89 kPa)
In addition to establishing a correlation between CBR values and UCS, Figure 6-13 also
clearly illustrates the beneficial effects of treating a soil with fibers. For most of the samples
treated with fibers, the maximum CBR value occurred at a penetration of 0.2 inches, while for
most of the samples treated without fibers, the maximum CBR value occurred at a penetration of
0.1 inches. The addition of fibers also tended to shift points in Figure 6-13 to the right,
indicating fibers were more beneficial in increasing UCS than CBR values.
75
6.4 Discussion of Results
6.4.1 Subbase Layer
Based on the maximum UCS and CBR values shown in Figures 6-1 and 6-2, the VBC has an
optimal dosage rate of approximately 5% pelletized quicklime, which should correspond to an
optimal dosage rate that can be independently approximated based on pH. According to ASTM
D 6276, the optimal dosage rate of lime for a particular soil corresponds to the lowest dosage
rate of lime used in a soil-lime slurry that achieves a pH of 12.4. However, if a pH of 12.4 is
never reached as the dosage rate of lime in a soil-lime slurry is incrementally increased, then the
optimal dosage rate of lime is the lower dosage rate of two successive pH readings of 12.3.
Based on the two successive readings of 12.30 shown in Figures 6-1 and 6-2, ASTM D 6276
approximates an optimal dosage rate of 5% pelletized quicklime for the VBC, which agrees with
the dosage rate of pelletized quicklime resulting in the maximum UCS and CBR values.
Furthermore, the Texas Procedure approximated this same optimal dosage rate for the VBC, as
previously discussed in section 5.4.1.
The required subbase layer strengths for almost any loading condition considered in the
design charts were satisfied with dosage rates ranging from 2% to 5% pelletized quicklime. Not
only were almost all of the strength requirements satisfied with reasonable dosage rates, but
mixing pelletized quicklime into the soil was also relatively easy, which will be essential for the
large depths of improvement that will be required for constructing an unsurfaced airfield on poor
subgrade conditions. In most circumstances, Type III cement should not be used to treat the soil
when pelletized quicklime can achieve the required strength, since the pelletized quicklime is
much easier to handle and mix into the soil.
6.4.2 Base Layer
For the VBC treated with or without 1% RSC15 fibers and with Type III cement, Figures 6-3
and 6-5 show that treating the VBC with the highest dosage rate of 11% Type III cement resulted
in the largest strength gain, since both UCS and CBR values increased approximately linearly
with increasing dosage rate of Type III cement. This increase was expected because cement
stabilization is mainly influence by the water-to-cement ratio, which decreased as the initial
water content of the soil was kept constant and the dosage rate of cement was increased.
Compared to the VBC treated only with Type III cement, the VBC treated with 1% RSC15
fibers and Type III cement had slightly higher UCS at higher dosage rates of Type III cement,
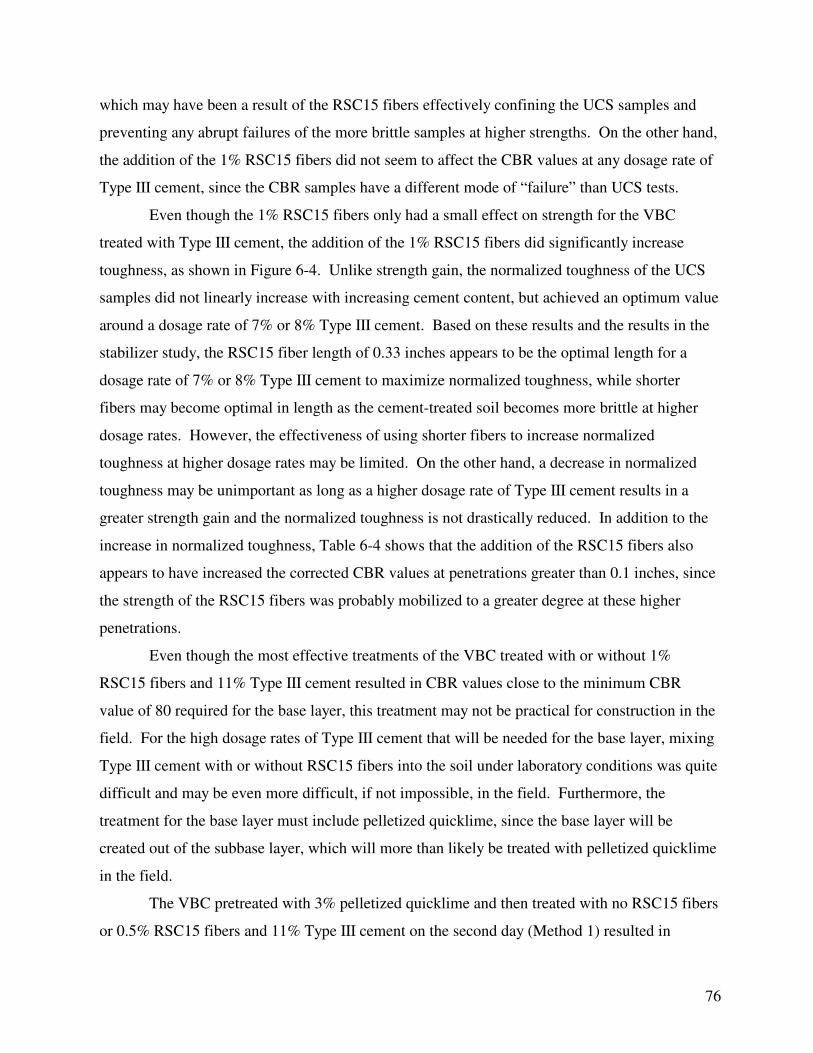
76
which may have been a result of the RSC15 fibers effectively confining the UCS samples and
preventing any abrupt failures of the more brittle samples at higher strengths. On the other hand,
the addition of the 1% RSC15 fibers did not seem to affect the CBR values at any dosage rate of
Type III cement, since the CBR samples have a different mode of “failure” than UCS tests.
Even though the 1% RSC15 fibers only had a small effect on strength for the VBC
treated with Type III cement, the addition of the 1% RSC15 fibers did significantly increase
toughness, as shown in Figure 6-4. Unlike strength gain, the normalized toughness of the UCS
samples did not linearly increase with increasing cement content, but achieved an optimum value
around a dosage rate of 7% or 8% Type III cement. Based on these results and the results in the
stabilizer study, the RSC15 fiber length of 0.33 inches appears to be the optimal length for a
dosage rate of 7% or 8% Type III cement to maximize normalized toughness, while shorter
fibers may become optimal in length as the cement-treated soil becomes more brittle at higher
dosage rates. However, the effectiveness of using shorter fibers to increase normalized
toughness at higher dosage rates may be limited. On the other hand, a decrease in normalized
toughness may be unimportant as long as a higher dosage rate of Type III cement results in a
greater strength gain and the normalized toughness is not drastically reduced. In addition to the
increase in normalized toughness, Table 6-4 shows that the addition of the RSC15 fibers also
appears to have increased the corrected CBR values at penetrations greater than 0.1 inches, since
the strength of the RSC15 fibers was probably mobilized to a greater degree at these higher
penetrations.
Even though the most effective treatments of the VBC treated with or without 1%
RSC15 fibers and 11% Type III cement resulted in CBR values close to the minimum CBR
value of 80 required for the base layer, this treatment may not be practical for construction in the
field. For the high dosage rates of Type III cement that will be needed for the base layer, mixing
Type III cement with or without RSC15 fibers into the soil under laboratory conditions was quite
difficult and may be even more difficult, if not impossible, in the field. Furthermore, the
treatment for the base layer must include pelletized quicklime, since the base layer will be
created out of the subbase layer, which will more than likely be treated with pelletized quicklime
in the field.
The VBC pretreated with 3% pelletized quicklime and then treated with no RSC15 fibers
or 0.5% RSC15 fibers and 11% Type III cement on the second day (Method 1) resulted in
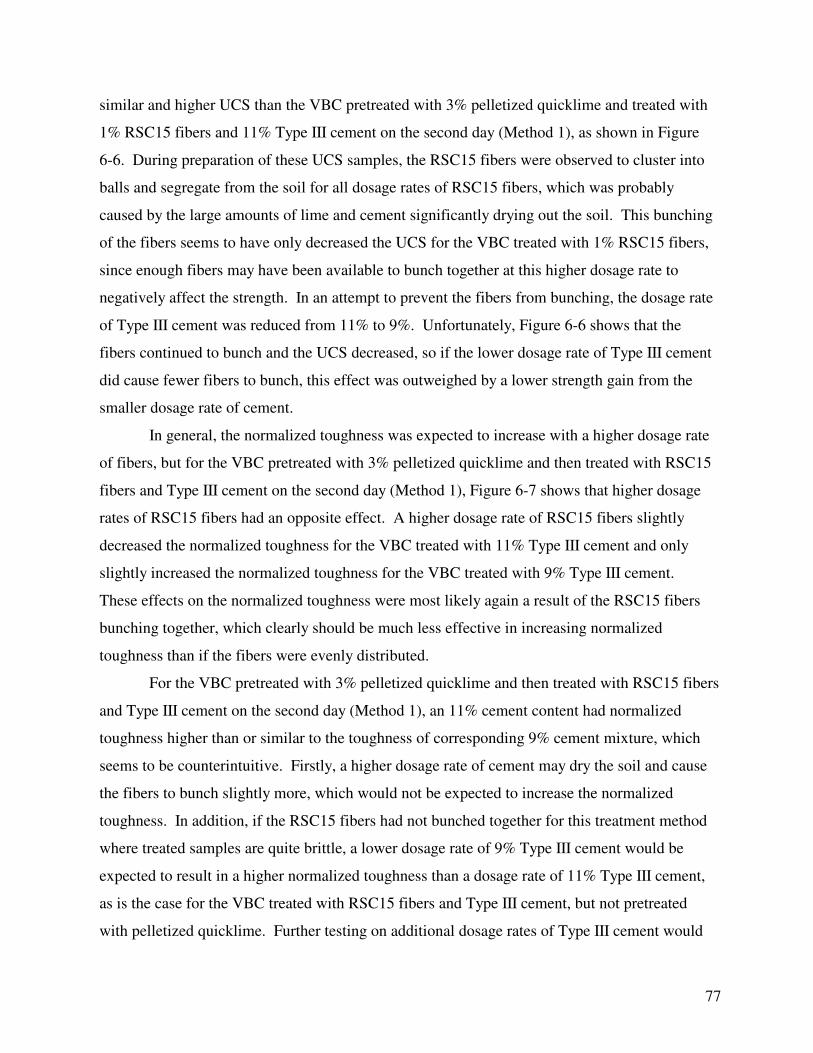
77
similar and higher UCS than the VBC pretreated with 3% pelletized quicklime and treated with
1% RSC15 fibers and 11% Type III cement on the second day (Method 1), as shown in Figure
6-6. During preparation of these UCS samples, the RSC15 fibers were observed to cluster into
balls and segregate from the soil for all dosage rates of RSC15 fibers, which was probably
caused by the large amounts of lime and cement significantly drying out the soil. This bunching
of the fibers seems to have only decreased the UCS for the VBC treated with 1% RSC15 fibers,
since enough fibers may have been available to bunch together at this higher dosage rate to
negatively affect the strength. In an attempt to prevent the fibers from bunching, the dosage rate
of Type III cement was reduced from 11% to 9%. Unfortunately, Figure 6-6 shows that the
fibers continued to bunch and the UCS decreased, so if the lower dosage rate of Type III cement
did cause fewer fibers to bunch, this effect was outweighed by a lower strength gain from the
smaller dosage rate of cement.
In general, the normalized toughness was expected to increase with a higher dosage rate
of fibers, but for the VBC pretreated with 3% pelletized quicklime and then treated with RSC15
fibers and Type III cement on the second day (Method 1), Figure 6-7 shows that higher dosage
rates of RSC15 fibers had an opposite effect. A higher dosage rate of RSC15 fibers slightly
decreased the normalized toughness for the VBC treated with 11% Type III cement and only
slightly increased the normalized toughness for the VBC treated with 9% Type III cement.
These effects on the normalized toughness were most likely again a result of the RSC15 fibers
bunching together, which clearly should be much less effective in increasing normalized
toughness than if the fibers were evenly distributed.
For the VBC pretreated with 3% pelletized quicklime and then treated with RSC15 fibers
and Type III cement on the second day (Method 1), an 11% cement content had normalized
toughness higher than or similar to the toughness of corresponding 9% cement mixture, which
seems to be counterintuitive. Firstly, a higher dosage rate of cement may dry the soil and cause
the fibers to bunch slightly more, which would not be expected to increase the normalized
toughness. In addition, if the RSC15 fibers had not bunched together for this treatment method
where treated samples are quite brittle, a lower dosage rate of 9% Type III cement would be
expected to result in a higher normalized toughness than a dosage rate of 11% Type III cement,
as is the case for the VBC treated with RSC15 fibers and Type III cement, but not pretreated
with pelletized quicklime. Further testing on additional dosage rates of Type III cement would
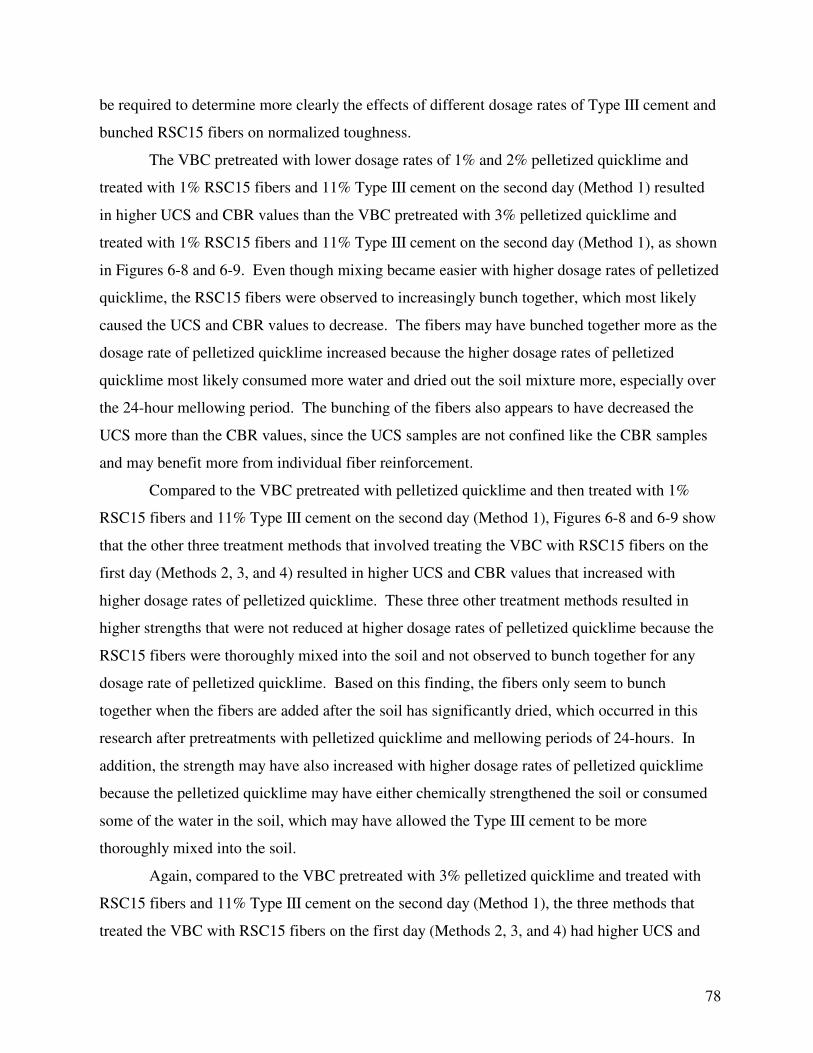
78
be required to determine more clearly the effects of different dosage rates of Type III cement and
bunched RSC15 fibers on normalized toughness.
The VBC pretreated with lower dosage rates of 1% and 2% pelletized quicklime and
treated with 1% RSC15 fibers and 11% Type III cement on the second day (Method 1) resulted
in higher UCS and CBR values than the VBC pretreated with 3% pelletized quicklime and
treated with 1% RSC15 fibers and 11% Type III cement on the second day (Method 1), as shown
in Figures 6-8 and 6-9. Even though mixing became easier with higher dosage rates of pelletized
quicklime, the RSC15 fibers were observed to increasingly bunch together, which most likely
caused the UCS and CBR values to decrease. The fibers may have bunched together more as the
dosage rate of pelletized quicklime increased because the higher dosage rates of pelletized
quicklime most likely consumed more water and dried out the soil mixture more, especially over
the 24-hour mellowing period. The bunching of the fibers also appears to have decreased the
UCS more than the CBR values, since the UCS samples are not confined like the CBR samples
and may benefit more from individual fiber reinforcement.
Compared to the VBC pretreated with pelletized quicklime and then treated with 1%
RSC15 fibers and 11% Type III cement on the second day (Method 1), Figures 6-8 and 6-9 show
that the other three treatment methods that involved treating the VBC with RSC15 fibers on the
first day (Methods 2, 3, and 4) resulted in higher UCS and CBR values that increased with
higher dosage rates of pelletized quicklime. These three other treatment methods resulted in
higher strengths that were not reduced at higher dosage rates of pelletized quicklime because the
RSC15 fibers were thoroughly mixed into the soil and not observed to bunch together for any
dosage rate of pelletized quicklime. Based on this finding, the fibers only seem to bunch
together when the fibers are added after the soil has significantly dried, which occurred in this
research after pretreatments with pelletized quicklime and mellowing periods of 24-hours. In
addition, the strength may have also increased with higher dosage rates of pelletized quicklime
because the pelletized quicklime may have either chemically strengthened the soil or consumed
some of the water in the soil, which may have allowed the Type III cement to be more
thoroughly mixed into the soil.
Again, compared to the VBC pretreated with 3% pelletized quicklime and treated with
RSC15 fibers and 11% Type III cement on the second day (Method 1), the three methods that
treated the VBC with RSC15 fibers on the first day (Methods 2, 3, and 4) had higher UCS and
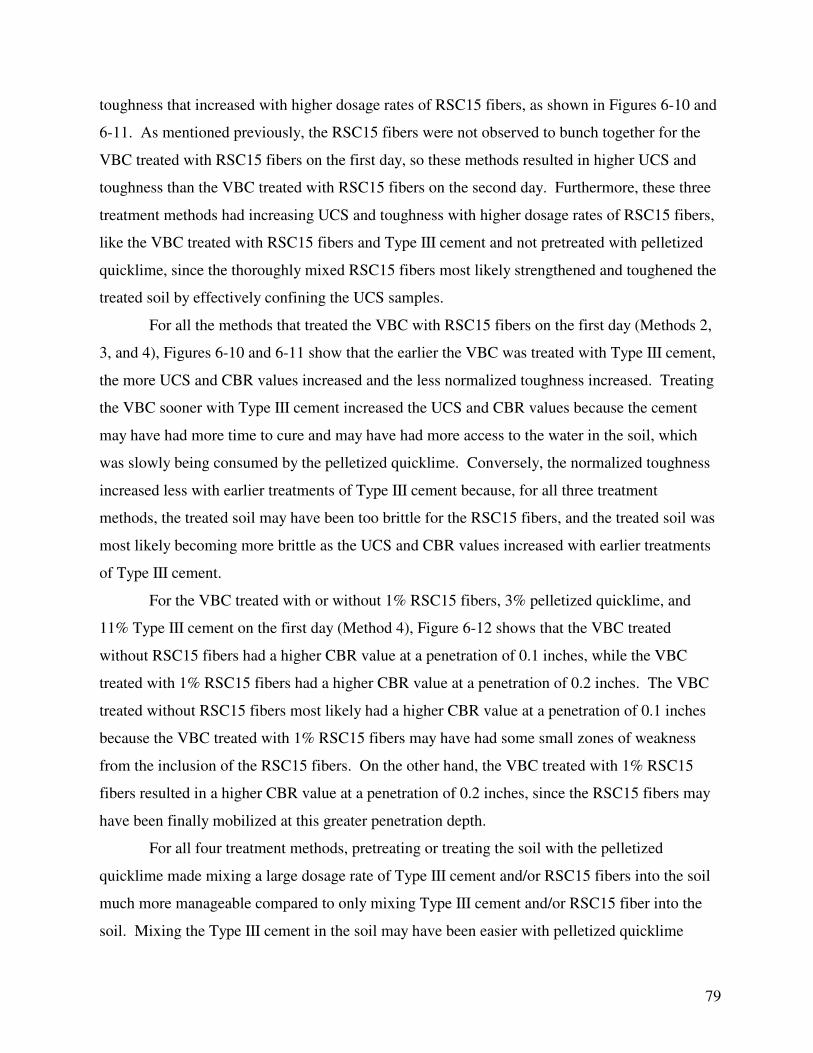
79
toughness that increased with higher dosage rates of RSC15 fibers, as shown in Figures 6-10 and
6-11. As mentioned previously, the RSC15 fibers were not observed to bunch together for the
VBC treated with RSC15 fibers on the first day, so these methods resulted in higher UCS and
toughness than the VBC treated with RSC15 fibers on the second day. Furthermore, these three
treatment methods had increasing UCS and toughness with higher dosage rates of RSC15 fibers,
like the VBC treated with RSC15 fibers and Type III cement and not pretreated with pelletized
quicklime, since the thoroughly mixed RSC15 fibers most likely strengthened and toughened the
treated soil by effectively confining the UCS samples.
For all the methods that treated the VBC with RSC15 fibers on the first day (Methods 2,
3, and 4), Figures 6-10 and 6-11 show that the earlier the VBC was treated with Type III cement,
the more UCS and CBR values increased and the less normalized toughness increased. Treating
the VBC sooner with Type III cement increased the UCS and CBR values because the cement
may have had more time to cure and may have had more access to the water in the soil, which
was slowly being consumed by the pelletized quicklime. Conversely, the normalized toughness
increased less with earlier treatments of Type III cement because, for all three treatment
methods, the treated soil may have been too brittle for the RSC15 fibers, and the treated soil was
most likely becoming more brittle as the UCS and CBR values increased with earlier treatments
of Type III cement.
For the VBC treated with or without 1% RSC15 fibers, 3% pelletized quicklime, and
11% Type III cement on the first day (Method 4), Figure 6-12 shows that the VBC treated
without RSC15 fibers had a higher CBR value at a penetration of 0.1 inches, while the VBC
treated with 1% RSC15 fibers had a higher CBR value at a penetration of 0.2 inches. The VBC
treated without RSC15 fibers most likely had a higher CBR value at a penetration of 0.1 inches
because the VBC treated with 1% RSC15 fibers may have had some small zones of weakness
from the inclusion of the RSC15 fibers. On the other hand, the VBC treated with 1% RSC15
fibers resulted in a higher CBR value at a penetration of 0.2 inches, since the RSC15 fibers may
have been finally mobilized at this greater penetration depth.
For all four treatment methods, pretreating or treating the soil with the pelletized
quicklime made mixing a large dosage rate of Type III cement and/or RSC15 fibers into the soil
much more manageable compared to only mixing Type III cement and/or RSC15 fiber into the
soil. Mixing the Type III cement in the soil may have been easier with pelletized quicklime
80
because the pelletized quicklime may have quickly decreased plasticity and consumed water, and
as a result, the initial wet soil mass was rapidly broken down into drier individual soil particles.
For the three treatment methods that involved pretreating the soil with pelletized quicklime
and/or RSC15 fibers (Methods 1, 2, and 3), mixing the Type III cement into the soil was slightly
difficult at a dosage rate of 2% pelletized quicklime, but became easier with dosage rates greater
than 2%, as plasticity was decreased further and more water was consumed by the pelletized
quicklime. For the fourth treatment method that involved treating the soil with pelletized
quicklime, Type III cement, and RSC15 fibers at the same time (Method 4), mixing was slightly
more difficult at all dosage rates of pelletized quicklime than the other three methods, since the
pelletized quicklime did not have any time to decrease plasticity or consume water before the
Type III cement was added. Like the three other treatment methods, mixing also became easier
at higher dosage rates of pelletized quicklime.
Even though treating the VBC at the same time with all of the stabilizers was the most
effective treatment method (Method 4), mixing all three stabilizers into the soil at once may not
be logistically possible in the field. If fibers are to be used, they should be added as quickly as
possible after pretreatment with the pelletized quicklime, so that the fibers do not bunch together
and significantly decrease the three-day strength. Not only will the fibers bunching decrease the
three-day strength, but the long-term strength will also decrease, since the strength loss to the
bunching of the fibers is non-recoverable. On the other hand, the Type III cement may be added
the next day, since a mellowing time will not greatly affect the strength of a soil treated with
pelletized quicklime and fibers. However, the cement should still be added as quickly as
possible, so that it has as much time as possible to react with the soil water and cure. Unlike
strength loss due to the fibers bunching, adding the cement on the second day only results in a
reduction of the short-term strength and should have little, if any, effect on long-term strength.
Lastly, if the resulting strength is slightly lower than the required strength, then the dosage rate
of Type III cement could be increased above 11%, although increasing cement content will
continue to increase cost. If this resulting cost is too high to achieve a specified strength, the
dosage rate of fibers could be decreased to reduce cost, since fibers do not contribute
significantly to strength, and may not be locally available like cement or lime in foreign
locations. Nonetheless, the soil should still be treated with enough fibers such that the fibers still
increase toughness and prevent sudden cracking and failure of the treated soil.
81
Regardless of stabilizer and treatment type, Figure 6-13 establishes a linear relationship
between CBR and UCS values. This relationship is somewhat surprising because the treated
soils would be expected to have different properties and have essentially become different soil
types depending on the method of treatment, which Maclean (1956) has found to have
significantly different correlated CBR and UCS values, where soils with higher friction angles
and lower clay contents tend to have higher CBR values for a given UCS. It is possible that a
difference in the CBR and UCS correlation may exist between untreated and treated soils, where
treated soils may also tend to have higher CBR values for a given UCS, but in Figure 6-13, the
strength of the untreated soil is so low that any difference cannot be determined from this
research. On the other hand, the different stabilizer treatments seem to have changed the soil
properties similarly, as Figure 6-13 shows relatively little scatter in the trend, which may be
mostly due to normal scatter in the data instead of different stabilizer treatments.
Figure 6-13 also shows that at higher strengths, the maximum CBR values occurred more
often at a penetration of 0.2 inches with or without fibers. Mitchell et al. (1972) found that at
low strengths, CBR samples tended to fail locally around the piston by punching failure, but at
high strengths, CBR samples tended to fail generally after fully mobilizing the soil strength.
This phenomenon may explain why at higher strengths, the maximum CBR values occurred
more often at a penetration of 0.2 inches, since a larger penetration may be required to mobilize
the full strength of the soil and cause a general failure.
All four treatment methods could not be included in the CBR and UCS correlation due to
the large amount of soil needed for CBR tests. After the effectiveness of all four treatment
methods were evaluated with UCS tests, CBR tests were only performed on the most and least
effective treatment methods (Methods 4 and 1), so that a representative trend line shown in
Figure 6-13 could be established for all treatment methods. Using this trend line, intermediate
CBR values can be inferred for the remaining treatment methods that were not evaluated with
CBR tests. Based on the test results and the established trend line, only the two treatment
methods that involved treating the VBC with stabilizers only on the first day (Methods 3 and 4)
may be able to achieve the minimum CBR value of 80 required for the base layer.
Figure 6-14 shows published correlations of CBR values vs. UCS, as well as the trend
line determined from this research. Black (1961) and Hopkins (1991) developed similar
correlations based on both theoretical and empirical relationships. Black (1961) combined a
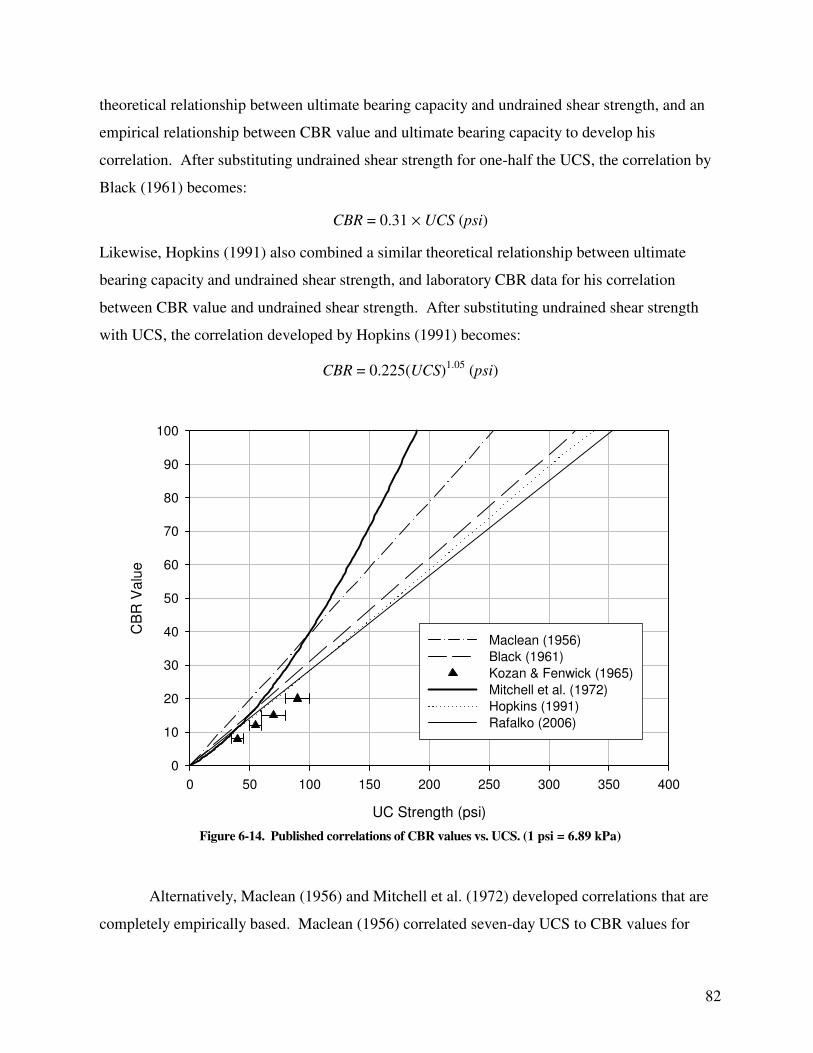
82
theoretical relationship between ultimate bearing capacity and undrained shear strength, and an
empirical relationship between CBR value and ultimate bearing capacity to develop his
correlation. After substituting undrained shear strength for one-half the UCS, the correlation by
Black (1961) becomes:
CBR = 0.31 × UCS (psi)
Likewise, Hopkins (1991) also combined a similar theoretical relationship between ultimate
bearing capacity and undrained shear strength, and laboratory CBR data for his correlation
between CBR value and undrained shear strength. After substituting undrained shear strength
with UCS, the correlation developed by Hopkins (1991) becomes:
CBR = 0.225(UCS)1.05
(psi)
UC Strength (psi)
0 50 100 150 200 250 300 350 400
CB
R V
alu
e
0
10
20
30
40
50
60
70
80
90
100
Maclean (1956)
Black (1961)
Kozan & Fenwick (1965)
Mitchell et al. (1972)
Hopkins (1991)
Rafalko (2006)
Figure 6-14. Published correlations of CBR values vs. UCS. (1 psi = 6.89 kPa)
Alternatively, Maclean (1956) and Mitchell et al. (1972) developed correlations that are
completely empirically based. Maclean (1956) correlated seven-day UCS to CBR values for
83
various types of soils treated with cement, although the correlation shown in Figure 6-14 is only
for a cement-stabilized heavy clay. Mitchell et al. (1972), also treated Vicksburg silty clay with
cement and correlated the seven-day UCS to unsoaked CBR values, which may explain the
higher CBR values at higher strengths. Mitchell (1976) developed the following correlation
based on the laboratory data from Mitchell et al. (1972):
CBR = 0.055(UCS)1.431
(psi)
Kozan and Fenwick (1965) did not provide the details of their correlation, and only
provided the approximate equivalent ranges of UCS to CBR values to determine if they had
achieved required CBR values for a specific pavement application from 24-hour UCS results for
a lean and fat clay treated with various types of Portland cements, limes, phosphoric acid
compounds, and sodium silicates.
Curing time and fiber reinforcement are the main differences between the correlation
developed from this research and the other published empirical correlations. Most of the
published empirical correlations relate seven-day UCS to CBR values, since the criteria used in
pavement design is based on seven-day UCS, as previously discussed in section 3.1. Based on
the data from the stabilizer study, the percent strength increase from three days of curing to
seven days of curing was approximately 11% for the VBC treated with 5% pelletized quicklime,
approximately 8% for the VBC treated with 5% Type III cement, and approximately 10% for the
VBC treated with 5% Type III cement and 1% RSC15 fibers. The increase in UCS from four
additional days of curing cannot be determined with certainty for the treatments used in this
study, since only three-day UCS were evaluated. Since three-day UCS were used in this
research, the CBR values most likely correlated to lower UCS compared to the other published
correlations that used seven-day UCS. Furthermore, none of the other correlations used fiber
reinforcement, which in this research may have resulted in CBR values correlating to higher
UCS. This shorter curing time and additional treatment with fibers may have had roughly
counteracting effects on UCS, which may explain why the data from this research plotted so
similarly to the other published data.
From the discussion of these published correlations, it is apparent that many factors can
influence the correlation between UCS and CBR values, such as curing time, soaked vs.
unsoaked samples, compaction energy, soil type, fiber reinforcement, and perhaps to a lesser
extent, stabilizer type and treatment method. Because the correlation between UCS and CBR
84
values may be influenced by multiple factors, a relationship should be established for each
unique situation. Once a reasonable correlation between UCS and CBR values has been
established, the appropriate stabilizer type and dosage rate may be determined in the laboratory
with UCS tests by achieving UCS that are equivalent to the CBR values required for design.
6.5 Conclusions
6.5.1 Subbase Layer
Treating the VBC with 2% to 5% pelletized quicklime satisfied most of the required CBR values
for potential subbase layers considered in the design charts in Appendix D for different loading
conditions. pH tests and the Texas Procedure also identified the same optimum dosage rate of
pelletized quicklime for maximum strength gain as obtained from UCS and CBR tests.
Pelletized quicklime is preferred over Type III cement for the subbase layer because pelletized
quicklime is much easier than Type III cement to mix into the soil.
6.5.2 Base Layer
Based on the dosage rate and treatment study results, treating the VBC all at once with 3%
pelletized quicklime, 1% RSC15 fibers, and 11% Type III cement was the most effective
treatment method for a potential base layer. The minimum required CBR value of 80 was
exceeded with this treatment method, although treating the soil with all these stabilizers at once
may be difficult, if not impossible, in the field. As a result, another treatment method may be
needed that is more reasonable for field construction. Other key findings from the dosage rate
study are as follows:
• The VBC treated with or without RSC15 fibers and with Type III cement resulted in
strengths that increased approximately linearly with increasing cement content due to a
corresponding decrease in the water-to-cement ratio. On the other hand, the treatment had a
maximum normalized toughness at a dosage rate of about 7% or 8% Type III cement, most
likely due to the length of the RSC15 fibers and the brittleness of the cement-treated soil.
• Even though the VBC treated with or without RSC15 fibers and with 11% Type III
cement had CBR values close to the minimum CBR value required for the base layer, the
treatment was determined to be difficult for field applications, as the site will be pretreated with
85
pelletized quicklime and the Type III cement will be difficult to mix into the soil with or with
RSC15 fibers.
• The strength of the VBC pretreated with pelletized quicklime and treated with RSC15
fibers and Type III cement on the second day (Method 1) decreased with increasing dosage rates
of RSC15 fibers and pelletized quicklime due to the bunching of the RSC15 fibers, which was
most likely caused by the pelletized quicklime drying out the soil during the 24-hour mellowing
period.
• The normalized toughness of the VBC pretreated with pelletized quicklime and treated
with RSC15 fibers and Type III cement on the second day (Method 1) also decreased with
increasing dosage rate of RSC15 fibers due to the bunching of the fibers, but increased with
dosage rate of Type III cement. Because the effect of cement content on normalized toughness
seems to be counterintuitive and a limited number of tests were performed, further testing may
be required to determine more clearly the effects of different dosage rates of Type III cement and
bunched RSC15 fibers on normalized toughness.
• Compared to the method that involved treating the VBC with fibers on the second day
(Method 1), the three other methods that involved treating the VBC with RSC15 fibers on the
first day (Methods 2, 3, and 4) had higher strengths and toughness that increased with increasing
dosage rates of both the RSC15 fibers and pelletized quicklime. This may have been due to fact
that the RSC15 fibers did not bunch and the pelletized quicklime may have chemically
strengthened the soil or dried the soil, so that the Type III cement was mixed more thoroughly
into the soil.
• The three methods that involved treating the VBC with fibers on the first day (Methods 2,
3, and 4) also had increasingly higher strengths the earlier 11% Type III cement was added to the
soil mixture, since the cement had more time to cure and more access to water. Conversely, the
earlier the 11% Type III cement was added to the soil mixture, the more the normalized
toughness decreased, since the soil became more brittle the earlier the Type III cement was
added.
• The VBC treated with 1% RSC15 fibers, 3% pelletized quicklime, and 11% Type III
cement (Method 4) had a lower CBR value at a penetration of 0.1 inches, but a higher CBR
value at a penetration of 0.2 inches compared to the VBC treated with 3% pelletized quicklime
and 11% Type III cement. The RSC15 fibers may have introduced small zones of weakness that
86
reduced the CBR value at smaller penetrations, and were probably not mobilized until the higher
penetration, when they finally increased the CBR value.
• Pretreatment with pelletized quicklime made mixing the Type III cement into the soil
much more manageable by reducing plasticity and consuming water, which broke down the soil
into individual soil particles. As this dosage rate of pelletized quicklime and mellowing time
were increased, mixing the stabilizers into the soil became easier.
• If treating the soil with all the stabilizers at once is not reasonable in the field and another
treatment method must be used, the RSC15 fibers should be added to the soil as quickly as
possible after the pretreatment with pelletized quicklime to prevent the fibers from bunching, as
bunching would decrease the strength significantly and the strength loss would be non-recoverable.
On the other hand, Type III cement could be added the next day if needed, since the strength loss
would be less and would not affect the long-term strength.
• Based on the data collected in this research, the correlation between three-day UCS and
soaked CBR values resulted in a linear relationship regardless of stabilizer type or treatment
method, since different stabilizers apparently caused similar changes in soil properties.
• In this research, the maximum CBR values occurred more often at a penetration of 0.2
inches at higher strengths, which seems to agree with past research. Mitchell et al. (1972) found
that at higher strengths, the CBR sample had a general failure after the full strength of the soil
had been mobilized, which would most likely occur at larger penetrations.
• Based on the laboratory results and the trend line established between CBR and UCS,
only two treatment methods that involved treating the VBC with stabilizers on the first day
(Methods 3 and 4), succeeded in reaching the minimum CBR value of 80 required for the base
layer.
• Compared to the other published empirical correlations, samples were cured for a shorter
period of time and soil was treated with fibers in this research. These two differences may have
had roughly counteracting decreases and increases in UCS, which may explain why the trend
line shown in Figure 6-13 is so close to the other published data.
• The correlation between CBR values and UCS should be independently established for
each unique situation, since many factors can effect this correlation.
87
7.0 Summary and Conclusions
Generally, the results of the stabilizer study showed that traditional stabilizers like cement and
lime were the most effective in stabilizing the soil, while nontraditional stabilizers, such as
microfine cement, sodium silicate, super absorbent polymers, superplasticizers, and accelerators,
were not as effective. Out of all the primary stabilizers, Type III cement, Type I/II cement,
pelletized quicklime, pulverized quicklime, and calcium carbide were all found to be effective in
stabilizing the soil. However, the one nontraditional stabilizer, calcium carbide, may not be
appropriate for soil stabilization in the field because treating the soil with calcium carbide may
be quite dangerous and calcium carbide also costs more than the traditional stabilizers.
Compared to the multiple traditional primary stabilizers that were successful, reinforcing fibers
were the only nontraditional secondary stabilizers that were determined to be effective, as a
result of their ability to increase toughness and durability of the treated soil.
Based on the dosage rate and treatment study results, stabilizing the VBC with an initial
CBR value of 2 for a potential subbase and/or base layer in an unsurfaced, aggregate-surfaced, or
matted airfield should be possible. For a potential subbase layer, treating the VBC with 2% to
5% pelletized quicklime achieved CBR values up to 30, which satisfies most of the required
CBR values in the design charts. The treatment for this potential subbase layer only failed to
achieve the required strengths for a light mat in area B with more than 7,000 passes and in area
A with more than 5,000 passes, which require CBR values of about 37 in area B and 47 in area A
at 10,000 passes. For a potential base layer, treating the VBC all at once with 3% pelletized
quicklime, 1% RSC15 fibers, and 11% Type III cement exceeded the required CBR value of 80,
and pretreating the VBC with 3% pelletized quicklime and 1% RSC15 fibers and then
immediately treating the VBC with 11% Type III cement may also achieve a CBR value of 80.
Even though this research may have proven that most of the layer strength requirements
can be satisfied, the layer thickness requirements may be difficult to achieve in some cases.
While the base layer has a small required minimum thickness of 6 inches (15 cm), the subbase
layer may require a thickness ranging anywhere from 0 to 65 inches (0 to 165 cm) for all the
loading conditions considered in the design charts in Appendix D. However, newly developed
construction equipment should be able to construct these deeper pavement design sections.
Construction equipment developed by the J. H. Becker Company has been able to mix stabilizers
into soil down to approximately six feet deep and ten feet wide. This depth of treatment would
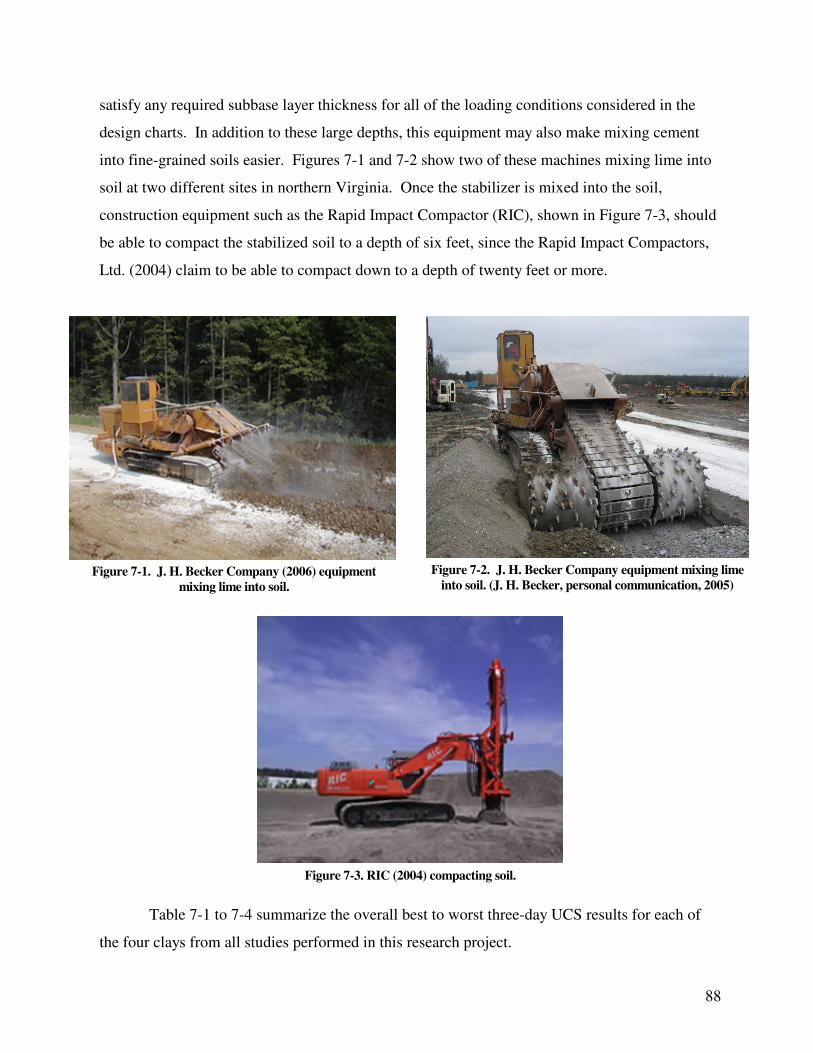
88
satisfy any required subbase layer thickness for all of the loading conditions considered in the
design charts. In addition to these large depths, this equipment may also make mixing cement
into fine-grained soils easier. Figures 7-1 and 7-2 show two of these machines mixing lime into
soil at two different sites in northern Virginia. Once the stabilizer is mixed into the soil,
construction equipment such as the Rapid Impact Compactor (RIC), shown in Figure 7-3, should
be able to compact the stabilized soil to a depth of six feet, since the Rapid Impact Compactors,
Ltd. (2004) claim to be able to compact down to a depth of twenty feet or more.
Figure 7-1. J. H. Becker Company (2006) equipment
mixing lime into soil.
Figure 7-2. J. H. Becker Company equipment mixing lime
into soil. (J. H. Becker, personal communication, 2005)
Figure 7-3. RIC (2004) compacting soil.
Table 7-1 to 7-4 summarize the overall best to worst three-day UCS results for each of
the four clays from all studies performed in this research project.
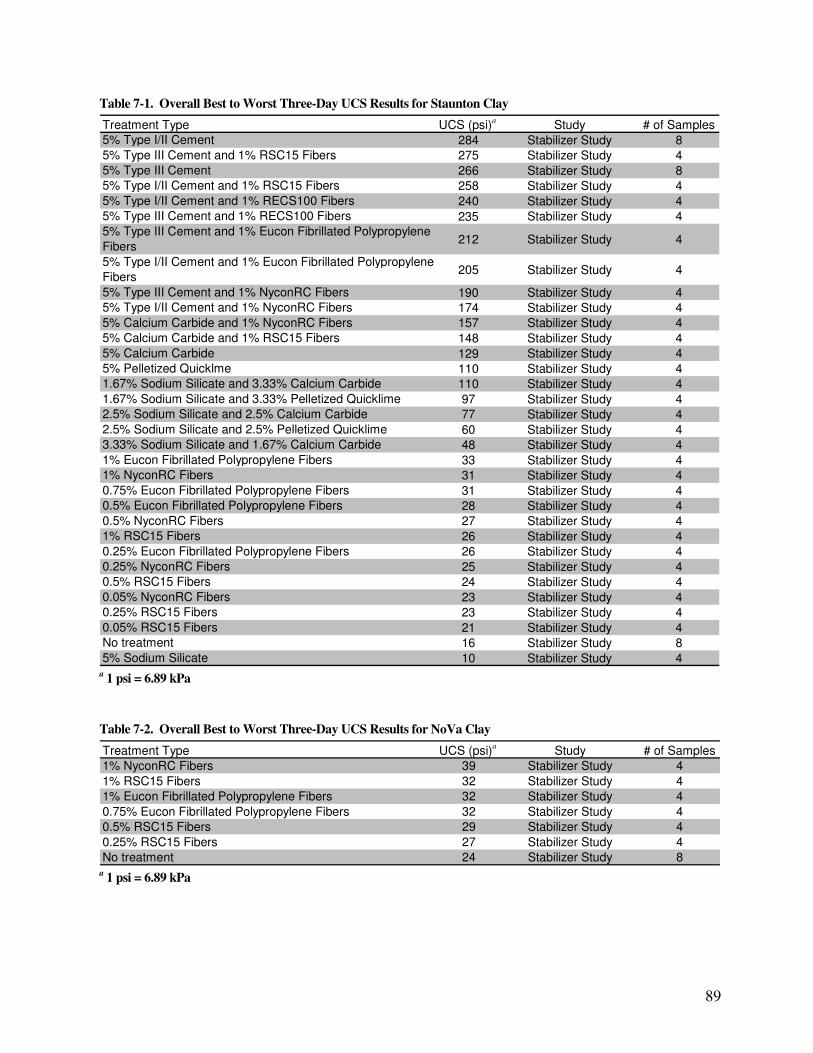
89
Table 7-1. Overall Best to Worst Three-Day UCS Results for Staunton Clay
Treatment Type UCS (psi)a
Study # of Samples
5% Type I/II Cement 284 Stabilizer Study 8
5% Type III Cement and 1% RSC15 Fibers 275 Stabilizer Study 4
5% Type III Cement 266 Stabilizer Study 8
5% Type I/II Cement and 1% RSC15 Fibers 258 Stabilizer Study 4
5% Type I/II Cement and 1% RECS100 Fibers 240 Stabilizer Study 4
5% Type III Cement and 1% RECS100 Fibers 235 Stabilizer Study 4
5% Type III Cement and 1% Eucon Fibrillated Polypropylene
Fibers212 Stabilizer Study 4
5% Type I/II Cement and 1% Eucon Fibrillated Polypropylene
Fibers205 Stabilizer Study 4
5% Type III Cement and 1% NyconRC Fibers 190 Stabilizer Study 4
5% Type I/II Cement and 1% NyconRC Fibers 174 Stabilizer Study 4
5% Calcium Carbide and 1% NyconRC Fibers 157 Stabilizer Study 4
5% Calcium Carbide and 1% RSC15 Fibers 148 Stabilizer Study 4
5% Calcium Carbide 129 Stabilizer Study 4
5% Pelletized Quicklme 110 Stabilizer Study 4
1.67% Sodium Silicate and 3.33% Calcium Carbide 110 Stabilizer Study 4
1.67% Sodium Silicate and 3.33% Pelletized Quicklime 97 Stabilizer Study 4
2.5% Sodium Silicate and 2.5% Calcium Carbide 77 Stabilizer Study 4
2.5% Sodium Silicate and 2.5% Pelletized Quicklime 60 Stabilizer Study 4
3.33% Sodium Silicate and 1.67% Calcium Carbide 48 Stabilizer Study 4
1% Eucon Fibrillated Polypropylene Fibers 33 Stabilizer Study 4
1% NyconRC Fibers 31 Stabilizer Study 4
0.75% Eucon Fibrillated Polypropylene Fibers 31 Stabilizer Study 4
0.5% Eucon Fibrillated Polypropylene Fibers 28 Stabilizer Study 4
0.5% NyconRC Fibers 27 Stabilizer Study 4
1% RSC15 Fibers 26 Stabilizer Study 4
0.25% Eucon Fibrillated Polypropylene Fibers 26 Stabilizer Study 4
0.25% NyconRC Fibers 25 Stabilizer Study 4
0.5% RSC15 Fibers 24 Stabilizer Study 4
0.05% NyconRC Fibers 23 Stabilizer Study 4
0.25% RSC15 Fibers 23 Stabilizer Study 4
0.05% RSC15 Fibers 21 Stabilizer Study 4
No treatment 16 Stabilizer Study 8
5% Sodium Silicate 10 Stabilizer Study 4 a 1 psi = 6.89 kPa
Table 7-2. Overall Best to Worst Three-Day UCS Results for NoVa Clay
Treatment Type UCS (psi)a
Study # of Samples
1% NyconRC Fibers 39 Stabilizer Study 4
1% RSC15 Fibers 32 Stabilizer Study 4
1% Eucon Fibrillated Polypropylene Fibers 32 Stabilizer Study 4
0.75% Eucon Fibrillated Polypropylene Fibers 32 Stabilizer Study 4
0.5% RSC15 Fibers 29 Stabilizer Study 4
0.25% RSC15 Fibers 27 Stabilizer Study 4
No treatment 24 Stabilizer Study 8 a 1 psi = 6.89 kPa
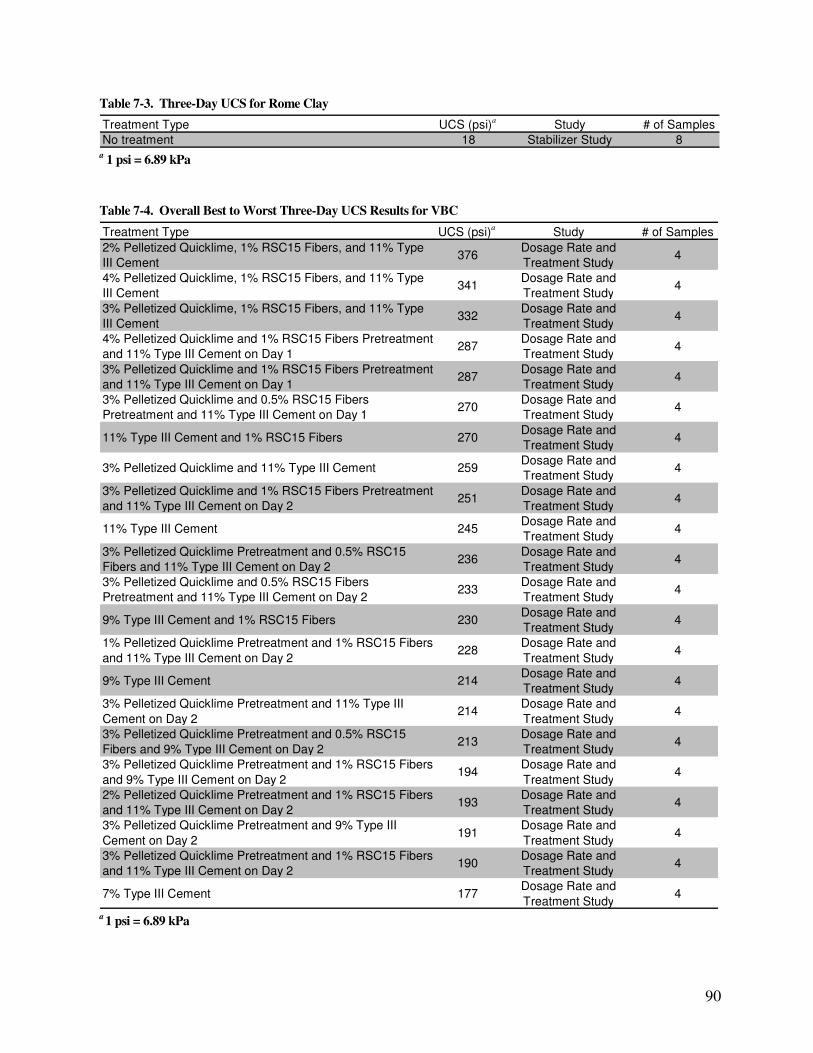
90
Table 7-3. Three-Day UCS for Rome Clay
Treatment Type UCS (psi)a
Study # of Samples
No treatment 18 Stabilizer Study 8 a 1 psi = 6.89 kPa
Table 7-4. Overall Best to Worst Three-Day UCS Results for VBC
Treatment Type UCS (psi)a
Study # of Samples
2% Pelletized Quicklime, 1% RSC15 Fibers, and 11% Type
III Cement376
Dosage Rate and
Treatment Study4
4% Pelletized Quicklime, 1% RSC15 Fibers, and 11% Type
III Cement341
Dosage Rate and
Treatment Study4
3% Pelletized Quicklime, 1% RSC15 Fibers, and 11% Type
III Cement332
Dosage Rate and
Treatment Study4
4% Pelletized Quicklime and 1% RSC15 Fibers Pretreatment
and 11% Type III Cement on Day 1287
Dosage Rate and
Treatment Study4
3% Pelletized Quicklime and 1% RSC15 Fibers Pretreatment
and 11% Type III Cement on Day 1287
Dosage Rate and
Treatment Study4
3% Pelletized Quicklime and 0.5% RSC15 Fibers
Pretreatment and 11% Type III Cement on Day 1270
Dosage Rate and
Treatment Study4
11% Type III Cement and 1% RSC15 Fibers 270Dosage Rate and
Treatment Study4
3% Pelletized Quicklime and 11% Type III Cement 259Dosage Rate and
Treatment Study4
3% Pelletized Quicklime and 1% RSC15 Fibers Pretreatment
and 11% Type III Cement on Day 2251
Dosage Rate and
Treatment Study4
11% Type III Cement 245Dosage Rate and
Treatment Study4
3% Pelletized Quicklime Pretreatment and 0.5% RSC15
Fibers and 11% Type III Cement on Day 2236
Dosage Rate and
Treatment Study4
3% Pelletized Quicklime and 0.5% RSC15 Fibers
Pretreatment and 11% Type III Cement on Day 2233
Dosage Rate and
Treatment Study4
9% Type III Cement and 1% RSC15 Fibers 230Dosage Rate and
Treatment Study4
1% Pelletized Quicklime Pretreatment and 1% RSC15 Fibers
and 11% Type III Cement on Day 2228
Dosage Rate and
Treatment Study4
9% Type III Cement 214Dosage Rate and
Treatment Study4
3% Pelletized Quicklime Pretreatment and 11% Type III
Cement on Day 2214
Dosage Rate and
Treatment Study4
3% Pelletized Quicklime Pretreatment and 0.5% RSC15
Fibers and 9% Type III Cement on Day 2213
Dosage Rate and
Treatment Study4
3% Pelletized Quicklime Pretreatment and 1% RSC15 Fibers
and 9% Type III Cement on Day 2194
Dosage Rate and
Treatment Study4
2% Pelletized Quicklime Pretreatment and 1% RSC15 Fibers
and 11% Type III Cement on Day 2193
Dosage Rate and
Treatment Study4
3% Pelletized Quicklime Pretreatment and 9% Type III
Cement on Day 2191
Dosage Rate and
Treatment Study4
3% Pelletized Quicklime Pretreatment and 1% RSC15 Fibers
and 11% Type III Cement on Day 2190
Dosage Rate and
Treatment Study4
7% Type III Cement 177Dosage Rate and
Treatment Study4
a 1 psi = 6.89 kPa
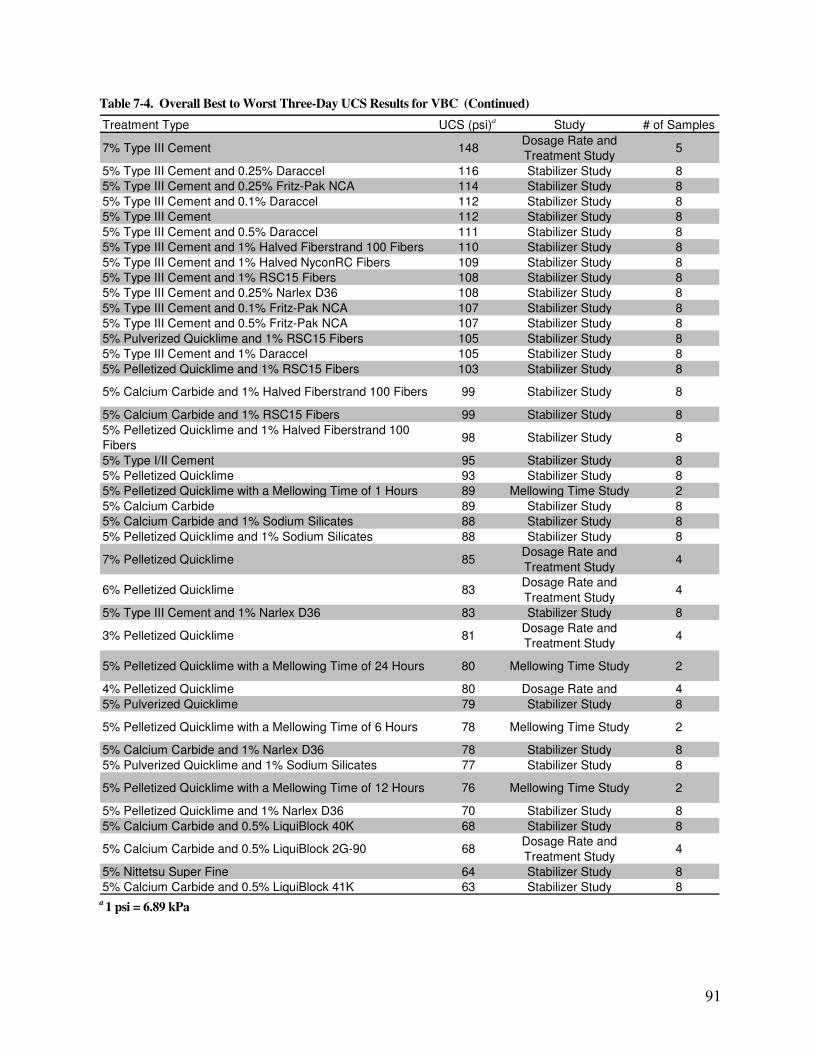
91
Table 7-4. Overall Best to Worst Three-Day UCS Results for VBC (Continued)
Treatment Type UCS (psi)a
Study # of Samples
7% Type III Cement 148Dosage Rate and
Treatment Study5
5% Type III Cement and 0.25% Daraccel 116 Stabilizer Study 8
5% Type III Cement and 0.25% Fritz-Pak NCA 114 Stabilizer Study 8
5% Type III Cement and 0.1% Daraccel 112 Stabilizer Study 8
5% Type III Cement 112 Stabilizer Study 8
5% Type III Cement and 0.5% Daraccel 111 Stabilizer Study 8
5% Type III Cement and 1% Halved Fiberstrand 100 Fibers 110 Stabilizer Study 8
5% Type III Cement and 1% Halved NyconRC Fibers 109 Stabilizer Study 8
5% Type III Cement and 1% RSC15 Fibers 108 Stabilizer Study 8
5% Type III Cement and 0.25% Narlex D36 108 Stabilizer Study 8
5% Type III Cement and 0.1% Fritz-Pak NCA 107 Stabilizer Study 8
5% Type III Cement and 0.5% Fritz-Pak NCA 107 Stabilizer Study 8
5% Pulverized Quicklime and 1% RSC15 Fibers 105 Stabilizer Study 8
5% Type III Cement and 1% Daraccel 105 Stabilizer Study 8
5% Pelletized Quicklime and 1% RSC15 Fibers 103 Stabilizer Study 8
5% Calcium Carbide and 1% Halved Fiberstrand 100 Fibers 99 Stabilizer Study 8
5% Calcium Carbide and 1% RSC15 Fibers 99 Stabilizer Study 8
5% Pelletized Quicklime and 1% Halved Fiberstrand 100
Fibers98 Stabilizer Study 8
5% Type I/II Cement 95 Stabilizer Study 8
5% Pelletized Quicklime 93 Stabilizer Study 8
5% Pelletized Quicklime with a Mellowing Time of 1 Hours 89 Mellowing Time Study 2
5% Calcium Carbide 89 Stabilizer Study 8
5% Calcium Carbide and 1% Sodium Silicates 88 Stabilizer Study 8
5% Pelletized Quicklime and 1% Sodium Silicates 88 Stabilizer Study 8
7% Pelletized Quicklime 85Dosage Rate and
Treatment Study4
6% Pelletized Quicklime 83Dosage Rate and
Treatment Study4
5% Type III Cement and 1% Narlex D36 83 Stabilizer Study 8
3% Pelletized Quicklime 81Dosage Rate and
Treatment Study4
5% Pelletized Quicklime with a Mellowing Time of 24 Hours 80 Mellowing Time Study 2
4% Pelletized Quicklime 80 Dosage Rate and 4
5% Pulverized Quicklime 79 Stabilizer Study 8
5% Pelletized Quicklime with a Mellowing Time of 6 Hours 78 Mellowing Time Study 2
5% Calcium Carbide and 1% Narlex D36 78 Stabilizer Study 8
5% Pulverized Quicklime and 1% Sodium Silicates 77 Stabilizer Study 8
5% Pelletized Quicklime with a Mellowing Time of 12 Hours 76 Mellowing Time Study 2
5% Pelletized Quicklime and 1% Narlex D36 70 Stabilizer Study 8
5% Calcium Carbide and 0.5% LiquiBlock 40K 68 Stabilizer Study 8
5% Calcium Carbide and 0.5% LiquiBlock 2G-90 68Dosage Rate and
Treatment Study4
5% Nittetsu Super Fine 64 Stabilizer Study 8
5% Calcium Carbide and 0.5% LiquiBlock 41K 63 Stabilizer Study 8 a 1 psi = 6.89 kPa
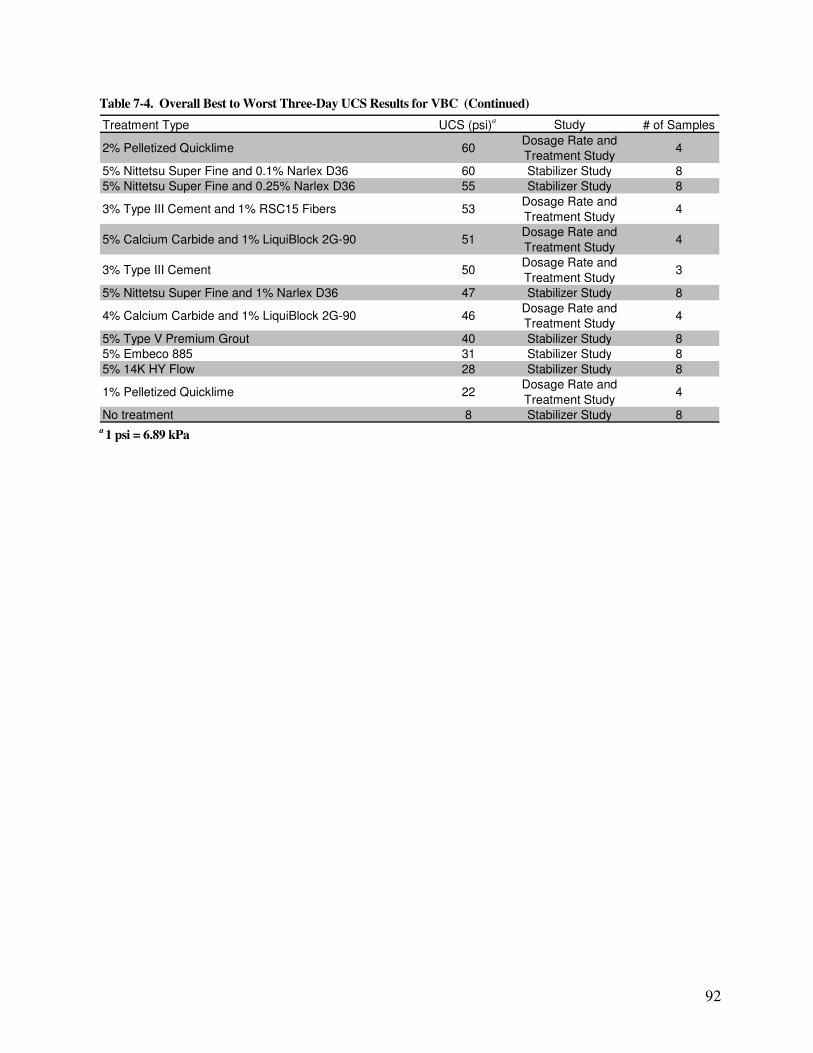
92
Table 7-4. Overall Best to Worst Three-Day UCS Results for VBC (Continued)
Treatment Type UCS (psi)a
Study # of Samples
2% Pelletized Quicklime 60Dosage Rate and
Treatment Study4
5% Nittetsu Super Fine and 0.1% Narlex D36 60 Stabilizer Study 8
5% Nittetsu Super Fine and 0.25% Narlex D36 55 Stabilizer Study 8
3% Type III Cement and 1% RSC15 Fibers 53Dosage Rate and
Treatment Study4
5% Calcium Carbide and 1% LiquiBlock 2G-90 51Dosage Rate and
Treatment Study4
3% Type III Cement 50Dosage Rate and
Treatment Study3
5% Nittetsu Super Fine and 1% Narlex D36 47 Stabilizer Study 8
4% Calcium Carbide and 1% LiquiBlock 2G-90 46Dosage Rate and
Treatment Study4
5% Type V Premium Grout 40 Stabilizer Study 8
5% Embeco 885 31 Stabilizer Study 8
5% 14K HY Flow 28 Stabilizer Study 8
1% Pelletized Quicklime 22Dosage Rate and
Treatment Study4
No treatment 8 Stabilizer Study 8 a 1 psi = 6.89 kPa
93
8.0 Recommendations
This section provides recommendations for additional soil stabilization methods, laboratory tests,
in-situ tests, and a more theoretical pavement design method.
8.1 Soil Stabilization
Promising new stabilizers should be tested as they become available. Many of the treatments
discussed in this research could be refined to further improve their ability to strengthen soils, as
discussed below:
8.1.1 Polymerization of Acetylene Gas
If possible, determining an effective method to polymerize the acetylene gas produced from the
chemical reaction between calcium carbide and the soil water is recommended, since calcium
carbide stabilization without polymerization of the acetylene gas was reasonably effective and
comparable to quicklime stabilization. Polymerization of the acetylene gas will be challenging
even with a good understanding of chemistry due to the difficulty of capturing the acetylene gas,
initiating polymerization, polymerizing the acetylene gas into a strong material, and applying the
method safely in the field.
8.1.2 Enhancement of Traditional Stabilizers
Since traditional primary stabilizers have consistently proven to be the most effective in
increasing the strength of a soil, determining secondary stabilizers that will contribute an
additional effect or further increase the strength of a soil is recommended. Fibers were the only
effective secondary stabilizers found in this research that significantly increased toughness and
in some situations, slightly increased strength.
8.1.3 Treatment with Lime and Cement
Determining factors controlling strength gain for a soil treated with the pelletized quicklime and
Type III cement is recommended, since this combination was the most effective treatment in the
dosage rate study and the factors controlling strength gain were not clearly determined. If the
interaction is better understood, then the combination treatment of the pelletized quicklime and
Type III cement could be even more effective. Further testing could be conducted with different
94
initial water contents, different dosage rates of the pelletized quicklime and Type III cement,
and/or different mellowing times for the pelletized quicklime.
8.2 Laboratory Tests
8.2.1 Resilient Modulus
The Resilient Modulus Test (AASHTO T-294 or SHRP Protocol P46) is also recommended for
evaluating the stabilized soil because resilient modulus tests are beginning to replace CBR tests
in pavement design. CBR tests are being replaced because they do not reflect real loading
conditions, and pavement design using CBR values is empirically based. The resilient modulus
test more closely simulates the dynamic and repeated loading conditions that the pavement might
actually experience, and it is also being used in mechanistic pavement design methods.
8.2.2 Shrink/Swell
Since untreated clays can significantly shrink or swell, evaluating the potential shrink and swell
of a clay after stabilization is recommended. Potential shrinkage can be evaluated using the Test
Method for Shrinkage Factors of Soils (ASTM D 427), and potential swell can be evaluated
using the Test Methods for One-Dimensional Swell or Settlement Potential of Cohesive Soils
(ASTM D 4546) or Test Method for Expansion Index of Soils (ASTM D 4829).
8.2.3 Durability
Not only is evaluating the durability of a treated soil recommended, but the Joint Departments of
the Army and Air Force (1994) require that cement- or lime-stabilized soils meet certain
durability requirements. The Test Methods for Wetting-and-Drying Compacted Soil-Cement
Mixtures (ASTM D 559) and Test Methods for Freezing-and-Thawing Compacted Soil-Cement
Mixtures (ASTM D 560) are two available methods to evaluate durability.
8.2.4 Index Properties
The Joint Departments of the Army and Air Force (1994) also require that soils have a certain
gradation (ASTM D 422) after stabilization with cement or lime. In addition, performing
Atterberg limits (ASTM D 4318) and evaluating the soil mineralogy and composition after
stabilization is also recommended to determine any chemical changes in the soil properties.
95
8.2.5 Erodibility
Erodibility should also be a concern for unsurfaced airfields because of the dynamic loading
conditions, so evaluating the erodibility of a stabilized clay with the Test Method for Erodibility
Determination of Soil and Rock in the Field or in the Laboratory by the Jet Index Method
(ASTM D 5852) or the standardized “brush” test (Jones 2003) is recommended.
8.3 In-Situ and Field Tests
In addition to a general site investigation for a potential airfield, a dynamic cone penetrometer
(DCP) is recommended to test the strength of the untreated soil in the field. The DCP is
specifically recommended because the test is relatively inexpensive and the DCP index has been
correlated to both UCS and CBR values. Webster et al. (1992) provides guidance on how to use
the DCP in the field, and also correlates the DCP index to CBR strengths required for unsurfaced
roadways and airfields.
Because pavement design is not an exact science and the initial subgrade soil conditions
considered for this research are so poor, a field study is also highly recommended and already in
development. This field study, in which Craney Island is currently being considered as a
potential site, will be a continuation of this research for the Air Force Research Laboratory.
8.4 Pavement Design
The development of a more theoretical pavement design method than the CBR method is
recommended for unsurfaced, aggregate-surfaced, and matted airfields, since this should increase
the quality of the pavement design. However, developing such a theoretical model for these
airfields will be very challenging, since the properties of stabilized soil will range significantly
based on soil and stabilizer type. Different theoretical models may have to be developed for
different combinations of soil and stabilizer type, which in all likelihood will be traditional
stabilizers. In addition, another test should also be used to evaluate the strength of the stabilized
soil instead of the CBR test that better simulates the loading conditions in the field, such as the
resilient modulus or cyclic triaxial test. As previously mentioned, the researchers at ERDC are
already in the process of developing a theoretical design model based on cement-stabilized soil
for unsurfaced airfields.
96
References
(1994). "Planning and Design of Roads, Airfields, and Heliports in the Theater of Operations--
Airfield and Heliport Design." FM 5-430-00-2/AFJPAM 82-8013 Vol. II, Departments of
the Army and Air Force, Washington, D.C.
(1994). "Soil Stabilization for Pavements." TM 5-822-14/AFMAN 32-1019, Joint Departments of
the Army and Air Force, USA.
(1997). "Criteria and Guidance for C-17 Contingency and Training Operations on Semi-Prepared
Airfields." ETL 97-9, Air Force Civil Engineer Support Agency/Engineering Support
Directorate, Tyndall Air Force Base, FL.
(1999). "Accelerating." Materials Group, Federal Highway Administration, U.S. Department of
Transportation, <http://www.fhwa.dot.gov/infrastructure/materialsgrp/acclerat.htm>
(July 9, 2006).
(2000). "C-130 Hercules." Naval Historical Center,
<http://www.history.navy.mil/planes/c130.htm> (August 21, 2006).
(2000). Standard Specifications for Transportation Material and Methods of Sampling and
Testing: Part II - Tests, AASHTO, Washington D.C.
(2001). "Airfield Pavement Evaluation." UFC 3-260-03, U.S. Army Corps of Engineers,
Washington, D.C.
(2001). "Pavement Design for Airfields." UFC 3-260-2, U.S. Army Corps of Engineers,
Washington, D.C.
(2003). Annual Book of ASTM Standards, ASTM, West Conshohocken, PA.
(2004). Annual Book of ASTM Standards, ASTM, West Conshohocken, PA.
(2004). "Rapid Impact Compactor." Rapid Impact Compactors, Ltd.,
<http://www.rapidimpact.ca/index.htm> (August 11, 2006).
(2006). "Soil Modification/Stabilization." J. H. Becker Company,
<http://www.jhbecker.com/modification.htm> (August 11, 2006).
(2006). "Specifications - C-17 Globemaster III Tactical Transport Aircraft." airforce-
technology.com, <http://www.airforce-technology.com/projects/c17/specs.html> (August
21, 2006).
Alexander, M. L., Smith, R. E., and Sherman, G. B. (1972). "Relative Stabilizing Effect of
Various Limes on Clayey Soils." Highway Research Record, (38), 27-36.
97
Anderton, G. L. (2005). "Joint Rapid Airfield Construction." JRAC,
<https://jrac.erdc.usace.army.mil/documents/jracbriefing.pdf> (August 16, 2006).
Black, W. P. M. (1961). "Calculation of Laboratory and In-Situ Values of California Bearing
Ratio from Bearing Capacity Data." Geotechnique, 11(1), 14-21.
de Bussetti, S. G., and Ferreiro, E. A. (2004). "Adsorption of Poly(vinyl alcohol) on
Montmorillonite." Clays and Clay Minerals, 52(3), 334-340.
Ding, R., Qui, Z., and Li, J. (1996). "Soluble-Silicate Mud Additives Inhibit Unstable Clays." Oil
& Gas Journal, 94(14), 66-68.
ERDC. (1999). "Pavement-Transportation Computer Assisted Structural Engineering."
Vicksburg, MS.
Fletcher, C. S., and Humphries, W. K. (1991). "California Bearing Ratio Improvement of
Remolded Soils by the Addition of Polypropylene Fiber Reinforcement." Transportation
Research Record, (1295), 80-86.
Gallagher, P. M. (2000). "Passive Site Remediation for Mitigation of Liquefaction Risk," thesis,
presented to Virginia Polytechnic Institute and State University, at Blacksburg, VA in
partial fulfillment of the requirements for the degree of Doctor of Philosophy.
Geiman, C. M. (2005). "Stabilization of Soft Clay Subgrades in Virginia: Phase I Laboratory
Study," thesis, presented to Virginia Polytechnic Institute and State University, at
Blacksburg, VA in partial fulfillment of the requirements for the degree of Master of
Science.
Grogan, W. P., and Tingle, J. S. (1999). "Evaluation of Unsurfaced Airfield Criteria for
Operation of C-17 Aircraft." Journal of Transportation Engineering, 125(1), 67-74.
Herzog, A., and Mitchell, J. K. (1963). "Reactions Accompanying Stabilization of Clay with
Cement." Highway Research Record, (36), 146-171.
Hopkins, T. C. (1991). "Bearing Capacity Analysis of Pavements." KTC-91-8, University of
Kentucky Transportation Center, College of Engineering, Lexington, KY.
Hurley, C. H., and Thornburn, T. H. (1972). "Sodium Silicate Stabilization of Soils: A Review of
the Literature." Highway Research Record, (381), 46-79.
Jones, D. (2003). "Toward Fit-for-Purpose Certification of Road Additives." Eighth
International Conference on Low-Volume Roads, Transportation Research Board, Reno,
NV, 208-217.
Kanda, T., and Li, V. C. (1998). "Interface Property and Apparent Strength of High-Strength
Hydrophilic Fiber in Cement Matrix." Journal of Materials in Civil Engineering, 10(1),
5-13.
98
Karol, R. H. (2003). Chemical Grouting and Soil Stabilization, Marcel Dekker, Inc., New York,
NY.
Kozan, G. R., and Fenwick, W. B. (1965). "Soil Stabilization -- Laboratory Investigation of Soil
Stabilizing Systems for Military Purposes." Report No. 3-455, U.S. Army Corps of
Engineers, Waterways Experiment Station.
Krizek, R. J., and Pepper, S. F. (2004). "Slurries in Geotechnical Engineering." The Twelfth
Spencer J. Buchanan Lecture, Texas A&M University, College Station, Texas, 69.
Lambe, T. W. (1951). "Stabilization of Soils with Calcium Acrylate." Boston Society of Civil
Engineers, 38(2), 127-154.
Little, D. N. (1995). Handbook for Stabilization of Pavement Subgrades and Base Courses with
Lime, Kendall/Hunt Publishing Company, Dubuque, Iowa.
Maclean, D. J. (1956). "Considerations Affecting the Design and Construction of Stabilized-soil
Road Bases." The Institute of Highway Engineers, 3(9), 16-33.
Maher, M. H., and Ho, Y. C. (1994). "Mechanical Properties of Kaolinite/Fiber Soil Composite."
ASCE Journal of Geotechnical Engineering, 120(8), 1381-1393.
Mamlouk, M. S., and Zaniewski, J. P. (1999). Materials for Civil and Construction Engineers,
Addison Wesley Longman, Inc., Menlo Park, California.
Mitchell, J. K. (1976). "The Properties of Cement-Stabilized Soils." Workshop on Materials and
Methods for Low Cost Road, Rail and Reclamation Works, Leura, Australia, 365-404.
Mitchell, J. K., Ueng, T.-S., and Monismith, C. L. (1972). "Behavior of Stabilized Soils Under
Repeated Loading -- Report 5: Performance Evaluation of Cement-Stabilized Soil Layers
and its Relationship to Pavement Design." Report No. 3-145, U.S. Army Engineer
Waterways Experiment Station, Vicksburg, MS.
Miura, N., Horpibulsuk, S., and Nagaraj, T. S. (2001). "Engineering Behavior of Cement
Stabilized Clay at High Water Content." Soils and Foundations, Japanese Geotechnical
Society, 41(5), 33-45.
Naudts, A., Landry, E., Hooey, S., and Naudts, W. (2002). "Additives and Admixtures in
Cement-based Grouts." ECO Grouting Specialists Ltd.,
<http://www.ecogrout.com/AdditivesAdmixtures.pdf> (July 6, 2006).
Newman, J. K. (2005). "Rapid Soil Stabilization Technologies." JRAC,
<https://jrac.erdc.usace.army.mil> (August 16, 2006).
Prusinski, J. R., and Bhattacharja, S. (1999). "Effectiveness of Portland Cement and Lime in
Stabilizing Clay Soils." Transportation Research Record, (1652), 215-227.
99
Ruff, C. G., and Davidson, D. T. (1961). "Lime and Sodium Silicate Stabilization of
Montmorillonite Clay Soil." Highway Research Record, (304), 76-92.
Santoni, R. L., Tingle, J. S., and Webster, S. L. (2001). "Engineering Properties of Sand-Fiber
Mixtures for Road Construction." Journal of Geotechnical and Geoenvironmental
Engineering, 127(3), 258-268.
Tingle, J. S., and Grogan, W. P. (1999). "Behavior of Unsurfaced Airfields Supporting
Operations of C-17 Aircraft." Journal of Transportation Engineering, 125(1), 75-84.
Tingle, J. S., and Santoni, R. L. (2003). "Stabilization of Clay Soils with Nontraditional
Additives." Transportation Research Record, (1819), 72-84.
Webster, S. L., Grau, R. H., and Williams, T. P. (1992). "Description and Application of Dual
Mass Dynamic Cone Penetrometer." Report No. GL-92-3, U.S. Army Corps of
Engineers, Waterways Experiment Station, Vicksburg, MS.
Zellers, B., and Cruso, R. (2002). "Nycon Nylon Fibers Add to Hydration Efficiency of
Cement." Nycon, Inc., <http://www.nycon.com/pdf/hydration.pdf> (July 6, 2006).
100
Appendix A
Laboratory Procedure for Unconfined Compressive Strength Tests
101
The following lab procedure is an updated version of a continually revised document that details
the methods used for UCS testing of stabilized soils in the Virginia Tech geotechnical
laboratories.
Mold Fabrication
The standard plastic mold typically used for UCS testing has been modified for this research
project. The standard plastic mold is a thin-walled plastic cylinder with one open end and has an
internal diameter of 2 inches (50 mm) and height of 4 inches (100 mm). Plastic lids are available
that fit over the one open end to completely seal the sample once compacted. In previous related
research projects, after the sample had cured, a cutting tool was used to cut the mold into
sections so the mold could be pulled away from the sample. Often, the cutting blade would cut
into the sample and destroy part of the sample. This type of behavior was common when
extracting very brittle samples. In order to reduce the chance of damaging the soil sample during
extraction, the molds are modified in several steps.
1. The bottom end of the mold is first removed with a cutting device that is capable of
making a near right angle cut through the cylinder. In this research project, a power
compound miter saw fitted with a masonry blade was used. A steel or carbide tipped
blade will gum up with molten plastic after several cuts, whereas the masonry blade has a
long lifetime when used to cut through plastic.
2. Before proceeding to the next step, any excess molten plastic from the cut end of the
cylinder is removed. This is typically done by hand or with a sharp knife.
3. A lathe, shown in Figure A-1, is used to square the bottom of the cylinder. The plastic
cylinder is placed in the chuck of the lathe as square as possible. The chuck is hand-
tightened until the cylinder is held securely in place, making sure the cylinder walls are not
damaged by over-tightening. A sharp tool bit is placed in the tool post such that when
the carriage is advanced, the plastic cylinder is cut at a right angle to the cylinder. The
lathe speed is set to around 600 RPM. As the cutting bit nears the cylinder, the carriage
is advanced very slowly. The plastic cylinder is cut into slowly until a smooth cut is
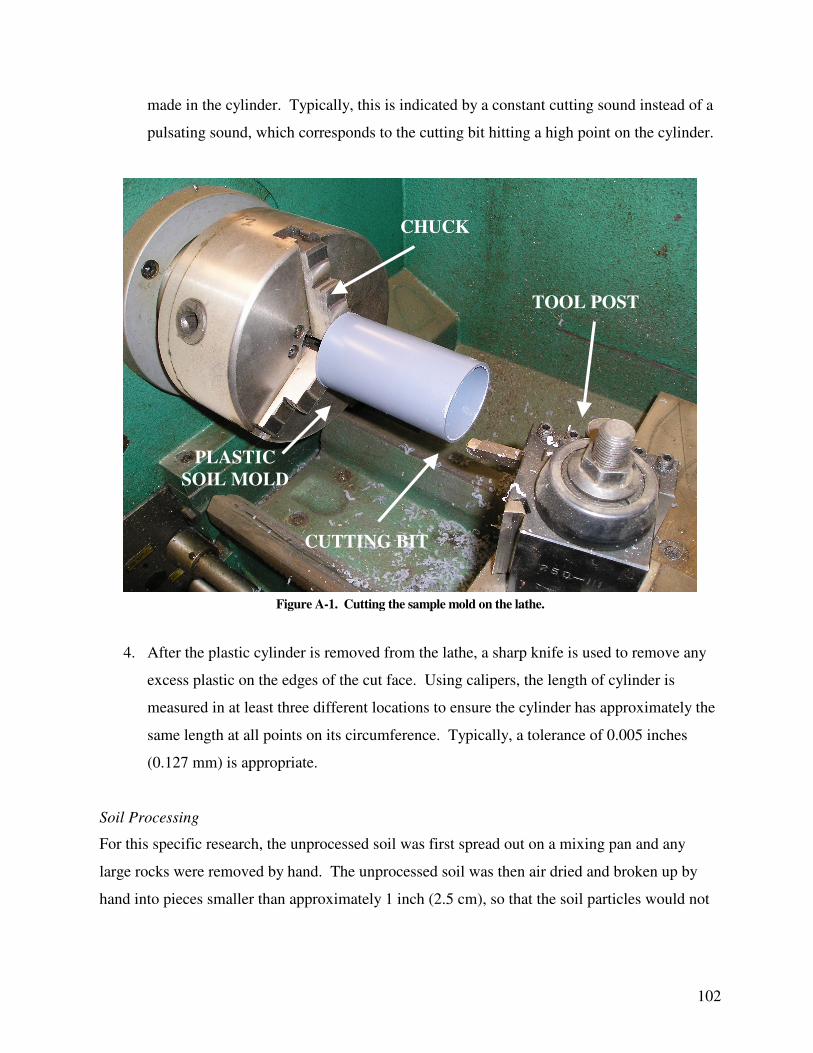
102
made in the cylinder. Typically, this is indicated by a constant cutting sound instead of a
pulsating sound, which corresponds to the cutting bit hitting a high point on the cylinder.
Figure A-1. Cutting the sample mold on the lathe.
4. After the plastic cylinder is removed from the lathe, a sharp knife is used to remove any
excess plastic on the edges of the cut face. Using calipers, the length of cylinder is
measured in at least three different locations to ensure the cylinder has approximately the
same length at all points on its circumference. Typically, a tolerance of 0.005 inches
(0.127 mm) is appropriate.
Soil Processing
For this specific research, the unprocessed soil was first spread out on a mixing pan and any
large rocks were removed by hand. The unprocessed soil was then air dried and broken up by
hand into pieces smaller than approximately 1 inch (2.5 cm), so that the soil particles would not
TOOL POST
CHUCK
CUTTING BIT
PLASTIC
SOIL MOLD
103
jam up the soil mill. Once the soil was dry, the soil was ground down to particle sizes that could
pass through a #4 sieve using an electric soil mill.
Geiman (2005) has found that air drying the soil may cause a slight decrease in liquid
limit and plasticity index. In this research, the ability to consistently compare the effects of each
stabilizer on the soil was determined to be more important than maintaining the original soil
properties, so changes in original soil properties were insignificant as long as all of the processed
soil had a consistent decrease in liquid limit and plasticity index. Although in other research or
applications, this change in original soil properties may be important and a qualified engineer
should determine if the soil should be processed in this way.
Sample Preparation
1. Before the soil is used, it is mixed to the desired water content, so the current water
content of the soil is first determined. The soil is spread out and mixed on a mixing pan
to obtain a representative sample and then the water content is determined according to
ASTM D 4643, Standard Test Method for Determination of Water Content of Soil by the
Microwave Oven Heating. The current water content is calculated with the following
equation:
w = WW/WDRY = (WWET – WDRY)/WDRY
w = water content WW = weight of water
WWET = wet weight of soil WDRY = dry weight of soil
a. If the current water content of the soil is lower than the desired water content, the
amount of water to be added is determined. First, the dry weight of the soil of the
soil to be hydrated is calculated with the following equation: WDRY = WWET/(1 +
w). Then after calculating the dry weight of soil, the proper amount of water to
be added is calculated with the following equation: WW = WDRY(wdesired – w),
where wdesired is the desired water content.
This calculated amount of water is then added with a spray bottle to the
soil, which ensures that the water is distributed as evenly as possible. The water
is added in approximately 100 mL portions at a time for large samples. The soil
is mixed by hand for few minutes after each addition of water until the water
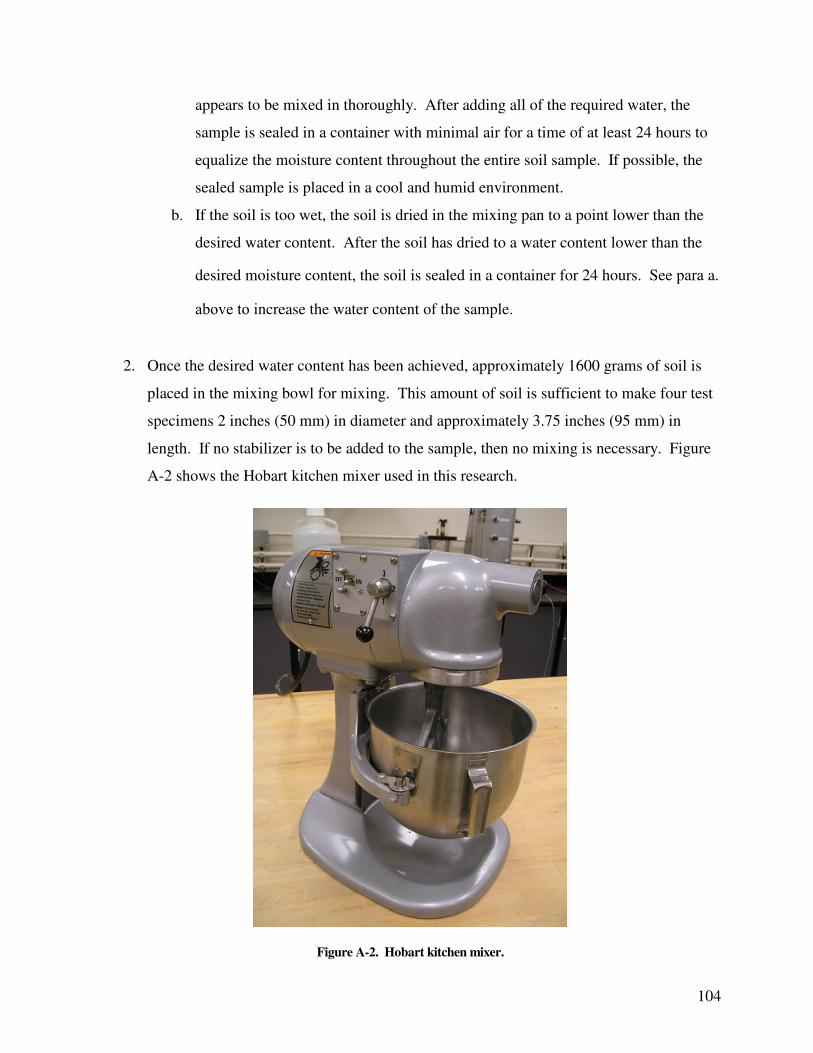
104
appears to be mixed in thoroughly. After adding all of the required water, the
sample is sealed in a container with minimal air for a time of at least 24 hours to
equalize the moisture content throughout the entire soil sample. If possible, the
sealed sample is placed in a cool and humid environment.
b. If the soil is too wet, the soil is dried in the mixing pan to a point lower than the
desired water content. After the soil has dried to a water content lower than the
desired moisture content, the soil is sealed in a container for 24 hours. See para a.
above to increase the water content of the sample.
2. Once the desired water content has been achieved, approximately 1600 grams of soil is
placed in the mixing bowl for mixing. This amount of soil is sufficient to make four test
specimens 2 inches (50 mm) in diameter and approximately 3.75 inches (95 mm) in
length. If no stabilizer is to be added to the sample, then no mixing is necessary. Figure
A-2 shows the Hobart kitchen mixer used in this research.
Figure A-2. Hobart kitchen mixer.
105
3. If a stabilizer is to be added, the appropriate amount of stabilizer is measured out
according to the desired percentage by dry weight necessary for the test regimen, which
is calculated using the following equation:
WS = PS × WDRY
WS = weight of stabilizer PS = percent stabilizer
The stabilizer is immediately added to the soil after the mixer is started and mixed with
the soil for a total of ten minutes, which was determined from a mixing time study
describe in Appendix B. The mixer is stopped as often as needed so that any soil packed
onto the bottom of the bowl is scraped off to achieve thorough mixing of the stabilizer
and soil. During mixing, the sides of the bowl are also continuously scraped to keep the
soil from adhering to the sides of the bowl.
4. Some of the treated soil may still be clumped together after mixing, which often occurs
when cement and/or fibers are added to the soil. If this occurs, the larger pieces of soil
are broken up by hand so that the largest dimension of any piece is less than 0.5 inches
(12.7 mm). This size allows the pieces to fit more easily into the compaction mold.
Mellowing Time
Based on the results of a mellowing time study that is discussed in Appendix C, a mellowing
time was not allowed for any of the treated samples, except a few treated samples in the dosage
rate and treatment study that were allowed a mellowing time of 24 hours to approximate field
conditions. However, if a soil is to be mellowed, the soil is immediately placed in a container
after treatment and sealed for the entire length of the mellowing time period, so that the treated
soil reacts with its surrounding environment as little as possible. The treated soil is sealed not
only to keep the water content unaffected by the environment, but also to reduce any chemical
reactions with the air, so the size of the container must match the amount of treated soil to reduce
the amount of air within the container.
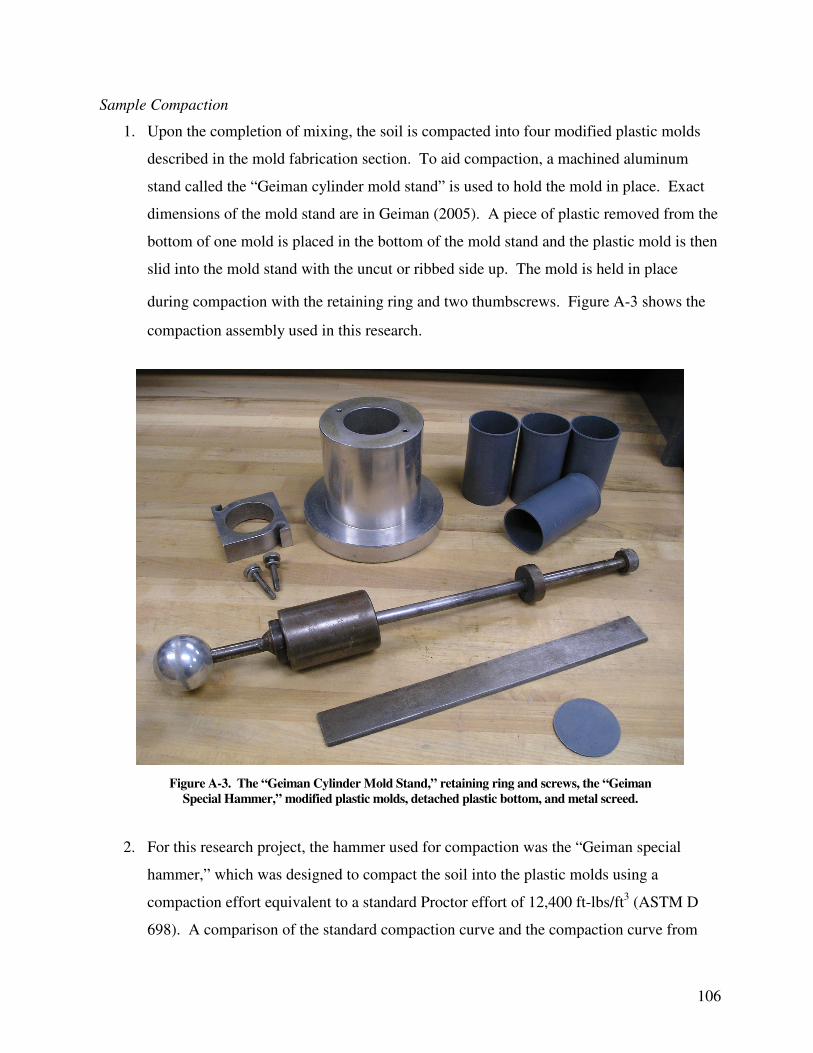
106
Sample Compaction
1. Upon the completion of mixing, the soil is compacted into four modified plastic molds
described in the mold fabrication section. To aid compaction, a machined aluminum
stand called the “Geiman cylinder mold stand” is used to hold the mold in place. Exact
dimensions of the mold stand are in Geiman (2005). A piece of plastic removed from the
bottom of one mold is placed in the bottom of the mold stand and the plastic mold is then
slid into the mold stand with the uncut or ribbed side up. The mold is held in place
during compaction with the retaining ring and two thumbscrews. Figure A-3 shows the
compaction assembly used in this research.
Figure A-3. The “Geiman Cylinder Mold Stand,” retaining ring and screws, the “Geiman
Special Hammer,” modified plastic molds, detached plastic bottom, and metal screed.
2. For this research project, the hammer used for compaction was the “Geiman special
hammer,” which was designed to compact the soil into the plastic molds using a
compaction effort equivalent to a standard Proctor effort of 12,400 ft-lbs/ft3 (ASTM D
698). A comparison of the standard compaction curve and the compaction curve from
107
this research, showed that a greater apparent compactive effort of 20,700 ft-lbs/ft3 was
required to match the standard compaction curve. This greater compactive energy is
achieved by compacting the soil into the molds in 5 layers of equal thickness using 20
blows of the hammer per layer. The required greater amount of energy is thought to be
necessary due to three sources of energy loss: (1) energy transfer between the hammer
and anvil, (2) friction between the donut hammer and rod, and (3) side wall friction in the
small plastic molds, which have a much greater length-to-diameter ratio than the 4-inch
Proctor molds. All “good compaction practices” described in ASTM D 698 are
observed.
3. After compaction, the soil and plastic mold is removed from the mold stand, and the top
and bottom of the sample are leveled along the top and bottom edge of the plastic mold
using a metal screed.
4. If the sample is cured prior to testing, then both ends are capped with a plastic lid and
then sealed using electrical tape to prevent any additional drying of the sample. The
sample is marked with soil type, stabilizer type, and stabilizer dosage rate, and then
stored in a safe humid area to further prevent disturbance or drying. In this research
project, the samples were stored on a wire rack in the bottom of a large plastic container
with approximately 1.5 inches of water in the bottom to provide a high level of humidity.
Sample Extrusion and Measuring
1. The soil sample is extruded from the mold using a jacking device specially machined to
the dimensions of the plastic mold such that the sample is not damaged during extrusion.
Figure A-4 shows the extruder used in this research project.
PLASTIC MOLDS
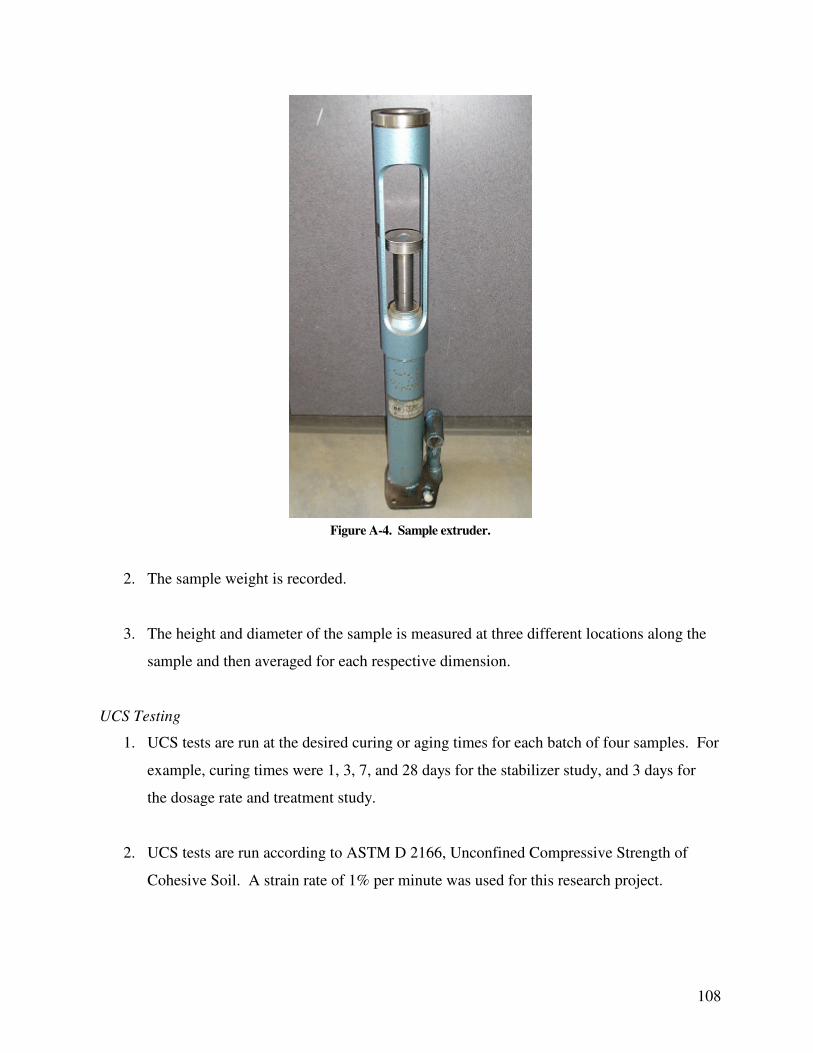
108
Figure A-4. Sample extruder.
2. The sample weight is recorded.
3. The height and diameter of the sample is measured at three different locations along the
sample and then averaged for each respective dimension.
UCS Testing
1. UCS tests are run at the desired curing or aging times for each batch of four samples. For
example, curing times were 1, 3, 7, and 28 days for the stabilizer study, and 3 days for
the dosage rate and treatment study.
2. UCS tests are run according to ASTM D 2166, Unconfined Compressive Strength of
Cohesive Soil. A strain rate of 1% per minute was used for this research project.
109
3. After the sample has been tested, a sample of the soil is tested for moisture content
according to ASTM D 2216.
Data Reduction
Data reduction is carried out according to ASTM D 2166, Unconfined Compressive Strength of
Cohesive Soil. For this research project, the TT:UU software package by GEOCOMP
Corporation was used to monitor the results of the unconfined compressive strength test, and the
output file of this program was then used in Microsoft Excel to reduce the test data.
110
Appendix B
Mixing Study
111
A mixing study was performed on the VBC to evaluate the thoroughness of mixing, as a result of
the highly variable and lower-than-expected UCS results from the NoVa clay. Originally, the
stabilizers were mixed into the Staunton clay and NoVa clay with a KitchenAid mixer for a total
of five minutes. For this mixing study, 5% Type I/II cement by dry weight of soil was mixed
into the VBC with a KitchenAid and Hobart mixer using mixing times of five, ten, fifteen, and
twenty minutes. The Hobart mixer is a more powerful mixer and was evaluated because the
KitchenAid mixer would often jam when mixing stabilizers into the Staunton and NoVa clay,
especially when using fibers or cement.
Figure B-1 shows the graph of UCS vs. mixing time for the VBC using the KitchenAid
and Hobart mixer. Even though both mixers had comparable results, the Hobart mixer was
determine to be more effective because it did not jam during mixing, and as a result, most likely
mixed the soil more thoroughly. However, the clay clumped significantly more to the sides of
the bowl of the Hobart mixer, so continuous scraping of the sides of the bowl became part of the
mixing procedure as a precaution against poorly mixed samples.
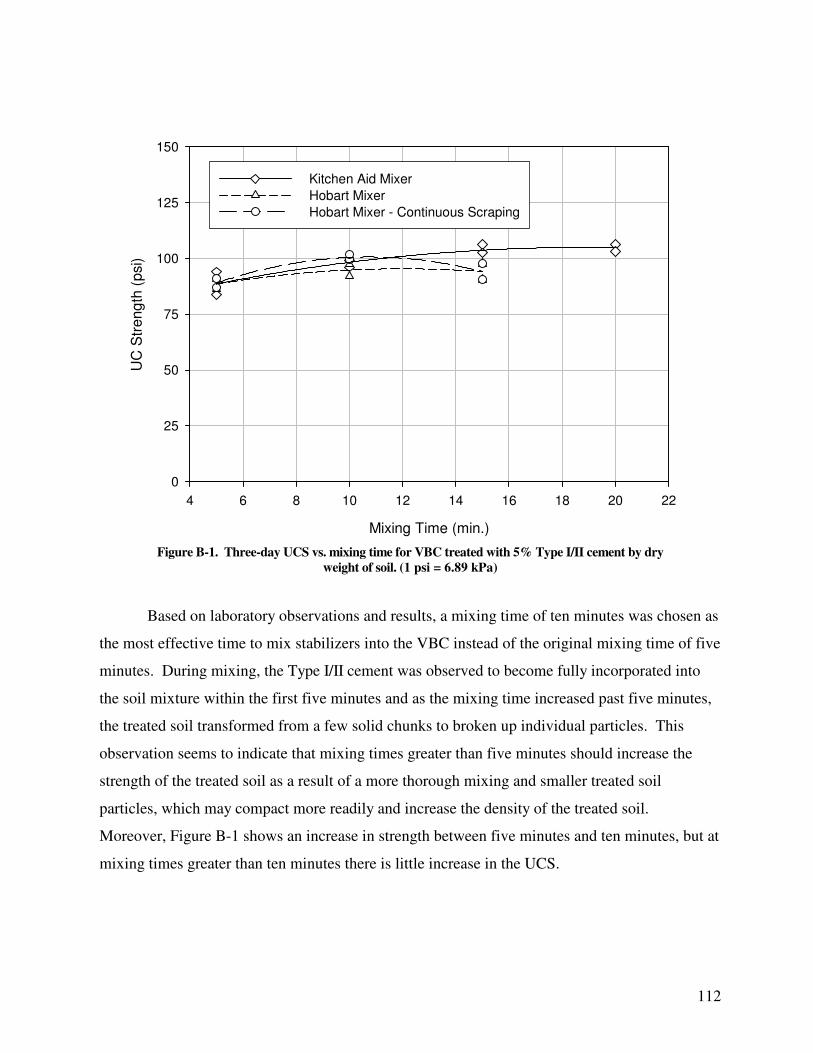
112
Mixing Time (min.)
4 6 8 10 12 14 16 18 20 22
UC
Str
en
gth
(p
si)
0
25
50
75
100
125
150
Kitchen Aid Mixer
Hobart Mixer
Hobart Mixer - Continuous Scraping
Figure B-1. Three-day UCS vs. mixing time for VBC treated with 5% Type I/II cement by dry
weight of soil. (1 psi = 6.89 kPa)
Based on laboratory observations and results, a mixing time of ten minutes was chosen as
the most effective time to mix stabilizers into the VBC instead of the original mixing time of five
minutes. During mixing, the Type I/II cement was observed to become fully incorporated into
the soil mixture within the first five minutes and as the mixing time increased past five minutes,
the treated soil transformed from a few solid chunks to broken up individual particles. This
observation seems to indicate that mixing times greater than five minutes should increase the
strength of the treated soil as a result of a more thorough mixing and smaller treated soil
particles, which may compact more readily and increase the density of the treated soil.
Moreover, Figure B-1 shows an increase in strength between five minutes and ten minutes, but at
mixing times greater than ten minutes there is little increase in the UCS.
113
Appendix C
Mellowing Time Study
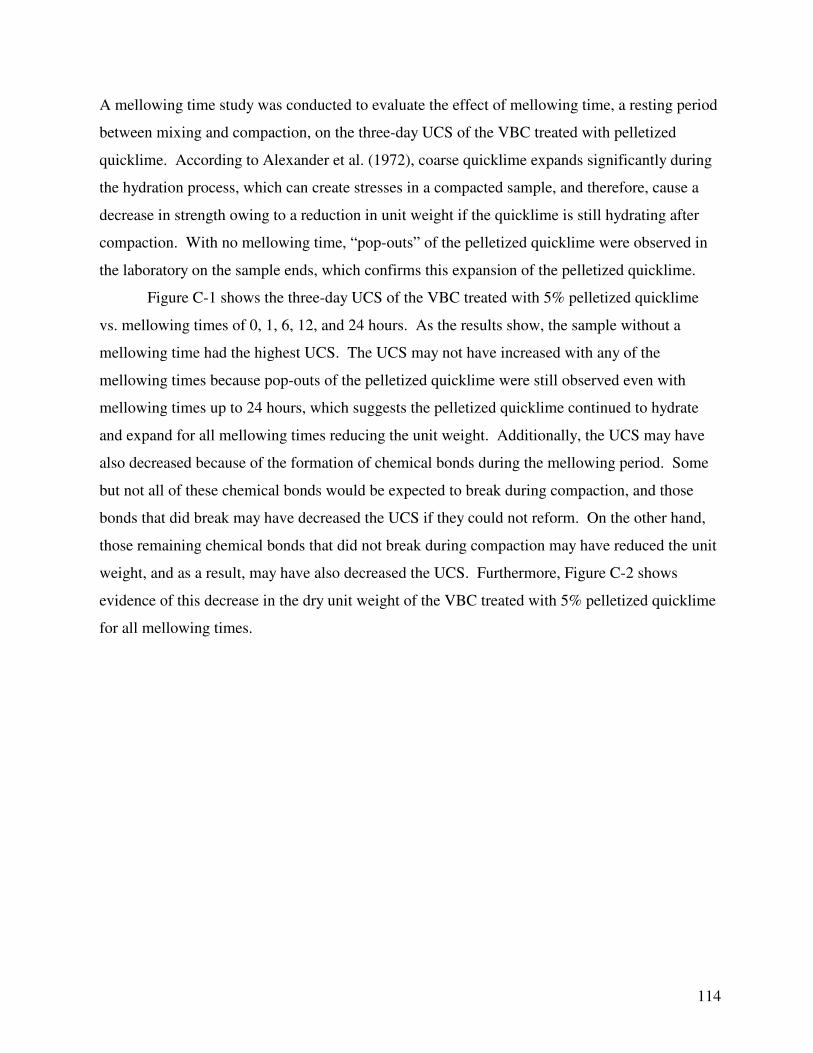
114
A mellowing time study was conducted to evaluate the effect of mellowing time, a resting period
between mixing and compaction, on the three-day UCS of the VBC treated with pelletized
quicklime. According to Alexander et al. (1972), coarse quicklime expands significantly during
the hydration process, which can create stresses in a compacted sample, and therefore, cause a
decrease in strength owing to a reduction in unit weight if the quicklime is still hydrating after
compaction. With no mellowing time, “pop-outs” of the pelletized quicklime were observed in
the laboratory on the sample ends, which confirms this expansion of the pelletized quicklime.
Figure C-1 shows the three-day UCS of the VBC treated with 5% pelletized quicklime
vs. mellowing times of 0, 1, 6, 12, and 24 hours. As the results show, the sample without a
mellowing time had the highest UCS. The UCS may not have increased with any of the
mellowing times because pop-outs of the pelletized quicklime were still observed even with
mellowing times up to 24 hours, which suggests the pelletized quicklime continued to hydrate
and expand for all mellowing times reducing the unit weight. Additionally, the UCS may have
also decreased because of the formation of chemical bonds during the mellowing period. Some
but not all of these chemical bonds would be expected to break during compaction, and those
bonds that did break may have decreased the UCS if they could not reform. On the other hand,
those remaining chemical bonds that did not break during compaction may have reduced the unit
weight, and as a result, may have also decreased the UCS. Furthermore, Figure C-2 shows
evidence of this decrease in the dry unit weight of the VBC treated with 5% pelletized quicklime
for all mellowing times.
115
Mellowing Time (hours)
0 4 8 12 16 20 24
UC
Str
en
gth
(p
si)
0
25
50
75
100
125
150
Figure C-1. Three-day UCS vs. mellowing time for VBC treated with 5% pelletized quicklime
by dry weight of soil. (1 psi = 6.89 kPa)
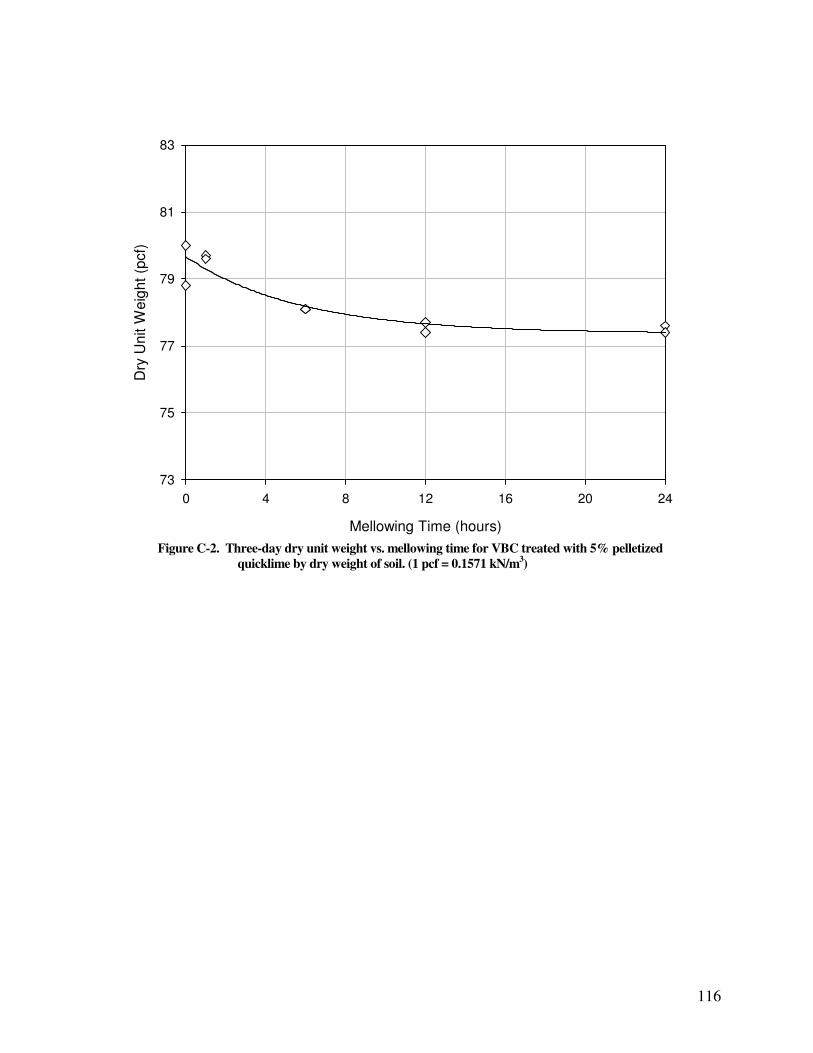
116
Mellowing Time (hours)
0 4 8 12 16 20 24
Dry
Un
it W
eig
ht
(pcf)
73
75
77
79
81
83
Figure C-2. Three-day dry unit weight vs. mellowing time for VBC treated with 5% pelletized
quicklime by dry weight of soil. (1 pcf = 0.1571 kN/m3)
117
Appendix D
PCASE: Pavement Design Charts for a Contingency C-17
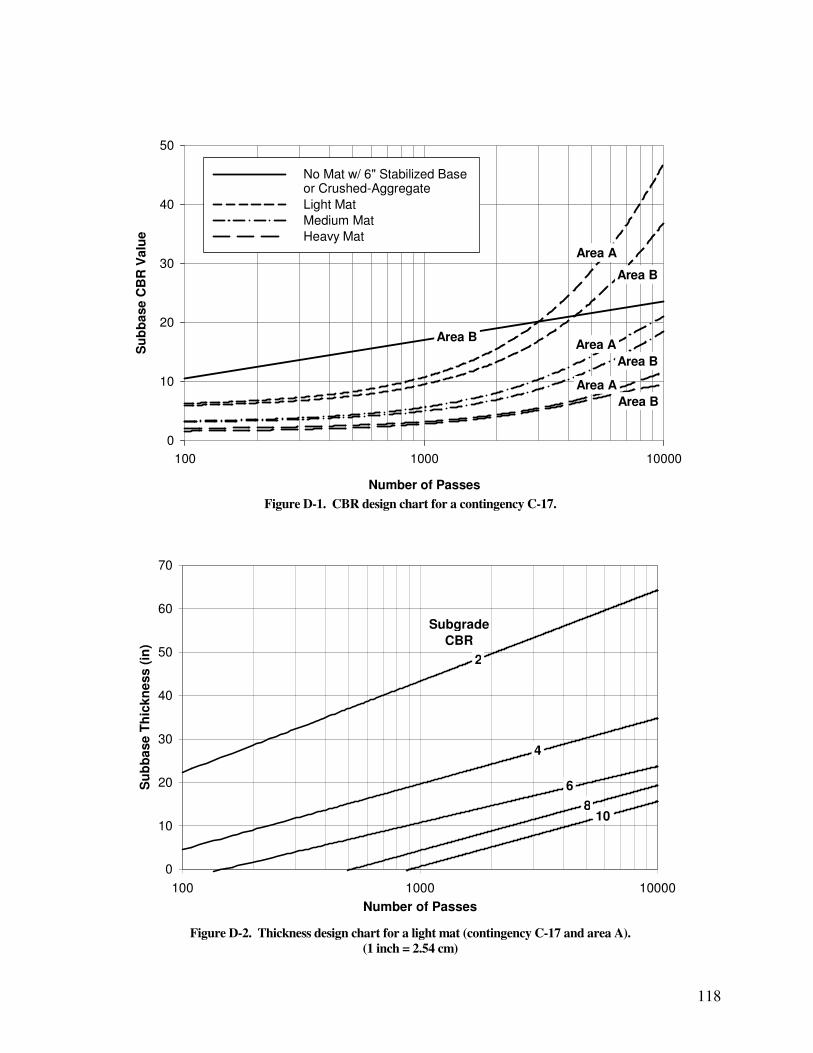
118
Number of Passes
100 1000 10000
Su
bb
ase
CB
R V
alu
e
0
10
20
30
40
50
No Mat w/ 6" Stabilized Base or Crushed-Aggregate
Light Mat
Medium Mat
Heavy Mat
Area A
Area A
Area A
Area B
Area B
Area B
Area B
Figure D-1. CBR design chart for a contingency C-17.
0
10
20
30
40
50
60
70
100 1000 10000
Number of Passes
Su
bb
ase
Th
ickn
ess (
in)
Subgrade
CBR
108
6
4
2
Figure D-2. Thickness design chart for a light mat (contingency C-17 and area A).
(1 inch = 2.54 cm)
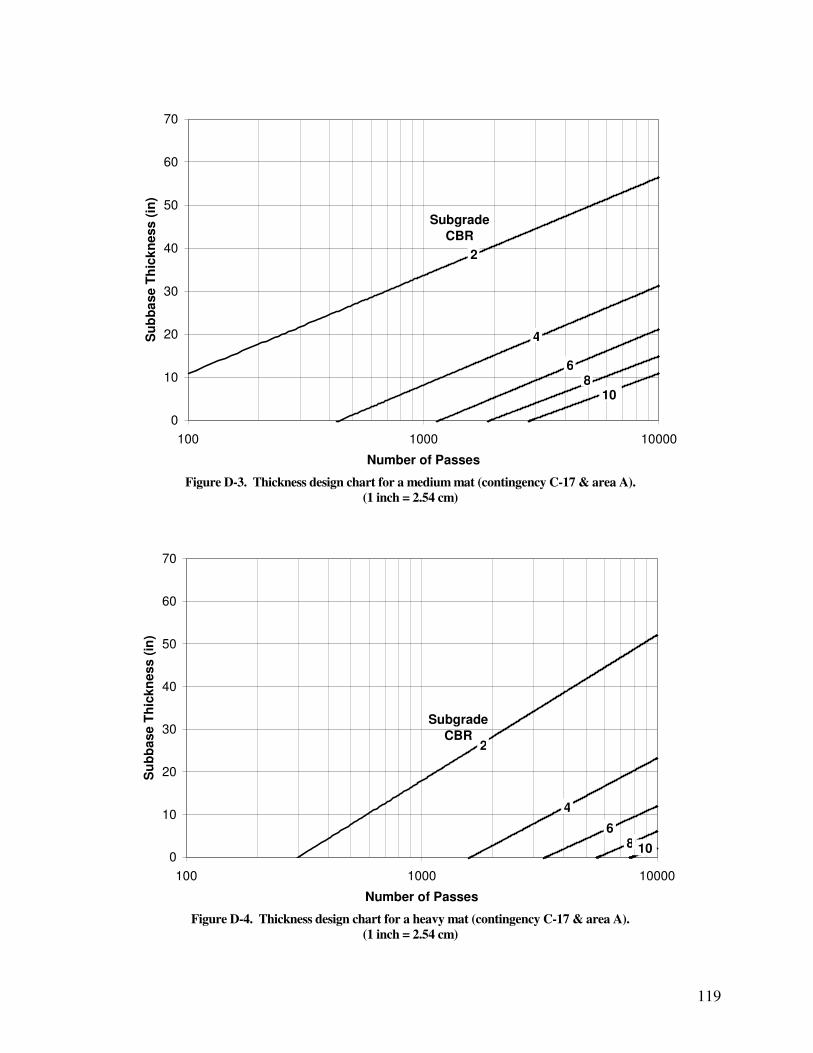
119
0
10
20
30
40
50
60
70
100 1000 10000
Number of Passes
Su
bb
ase T
hic
kn
ess
(in
)
2
86
4
10
Subgrade
CBR
Figure D-3. Thickness design chart for a medium mat (contingency C-17 & area A).
(1 inch = 2.54 cm)
0
10
20
30
40
50
60
70
100 1000 10000
Number of Passes
Su
bb
ase T
hic
kn
ess (
in)
2
4
68 10
Subgrade
CBR
Figure D-4. Thickness design chart for a heavy mat (contingency C-17 & area A).
(1 inch = 2.54 cm)
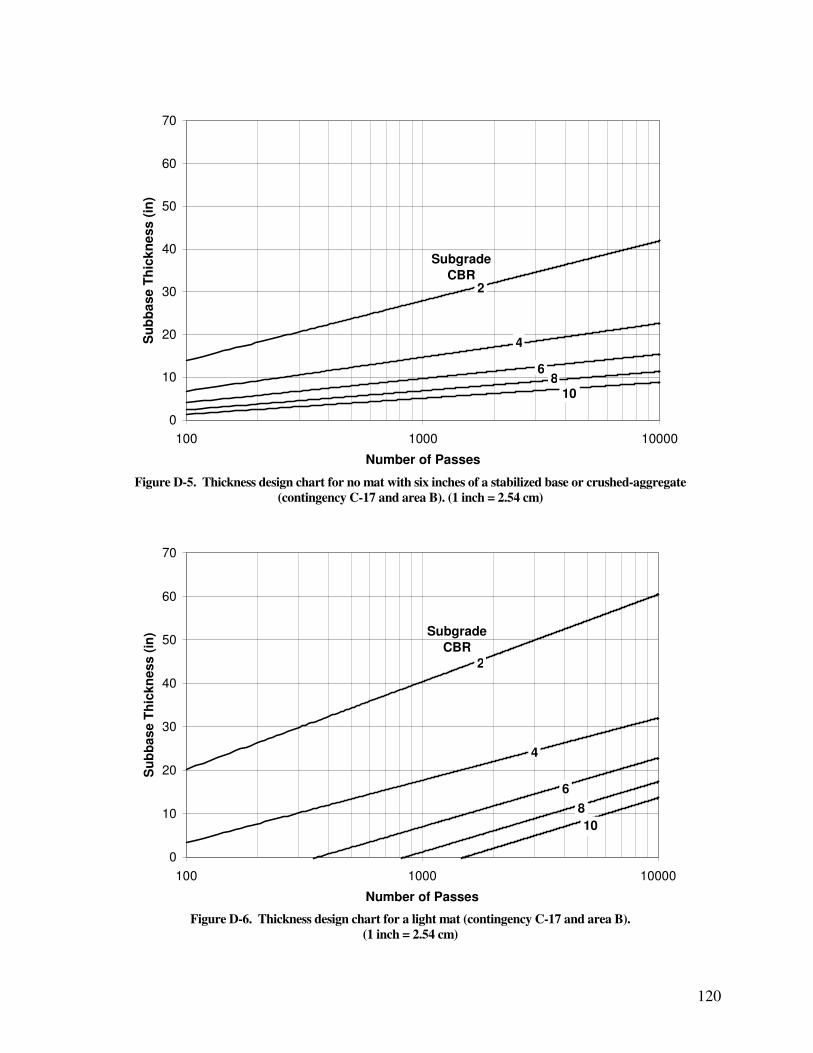
120
0
10
20
30
40
50
60
70
100 1000 10000
Number of Passes
Su
bb
as
e T
hic
kn
es
s (
in)
Subgrade
CBR2
4
68
10
Figure D-5. Thickness design chart for no mat with six inches of a stabilized base or crushed-aggregate
(contingency C-17 and area B). (1 inch = 2.54 cm)
0
10
20
30
40
50
60
70
100 1000 10000
Number of Passes
Su
bb
as
e T
hic
kn
ess (
in) Subgrade
CBR
10
8
6
4
2
Figure D-6. Thickness design chart for a light mat (contingency C-17 and area B).
(1 inch = 2.54 cm)
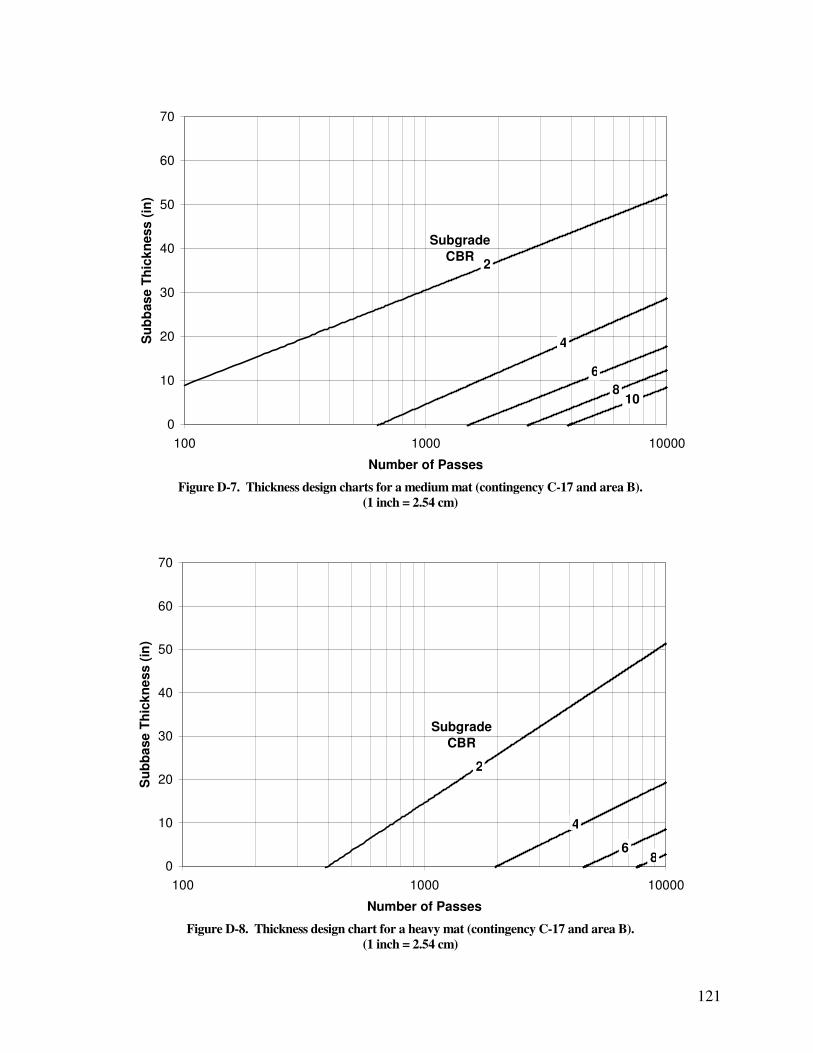
121
0
10
20
30
40
50
60
70
100 1000 10000
Number of Passes
Su
bb
as
e T
hic
kn
es
s (
in)
2
8
6
4
10
Subgrade
CBR
Figure D-7. Thickness design charts for a medium mat (contingency C-17 and area B).
(1 inch = 2.54 cm)
0
10
20
30
40
50
60
70
100 1000 10000
Number of Passes
Su
bb
ase
Th
ick
ne
ss (
in)
2
4
68
Subgrade
CBR
Figure D-8. Thickness design chart for a heavy mat (contingency C-17 and area B).
(1 inch = 2.54 cm)


![Fundamentals of soil stabilization - Springer · Fundamentals of soil stabilization ... [5453].Zulkieyetal.[, 55] ... however,thePIshouldnotbegreaterthan25.Soils](https://img.pdfslide.net/doc/110x75/5b60a3d07f8b9a3b488b8193/fundamentals-of-soil-stabilization-springer-fundamentals-of-soil-stabilization.jpg)