Embed Size (px)
Citation preview

ArticleRev Bras Cienc Solo 2016;40:e0150413
1DOI: 10.1590/18069657rbcs20150413
* Corresponding author: E-mail: [email protected]
Received: October 24, 2015Approved: May 16, 2016
How to cite: Silva YJAB, Nascimento CWA, Silva YJAB, Biondi CM, Silva CMCAC. Rare Earth Element Concentrations in Brazilian Benchmark Soils. Rev Bras Cienc Solo. 2016;40:e0150413.
Copyright: This is an open-access article distributed under the terms of the Creative Commons Attribution License, which permits unrestricted use, distribution, and reproduction in any medium, provided that the original author and source are credited.
Rare Earth Element Concentrations in Brazilian Benchmark SoilsYgor Jacques Agra Bezerra da Silva(1), Clístenes Williams Araújo do Nascimento(1)*, Yuri Jacques Agra Bezerra da Silva(2), Caroline Miranda Biondi(1) and Cinthia Maria Cordeiro Atanázio Cruz Silva(1)
(1) Universidade Federal Rural de Pernambuco, Departamento de Agronomia, Recife, Pernambuco, Brasil.(2) Universidade Federal do Piaui, Departamento de Ciência do Solo, Bom Jesus, Piaui, Brasil.
ABSTRACT: Studies regarding background concentrations of rare earth elements (REEs) are scarce and have mainly focused on a limited number of soil types from the northern hemisphere. The aim of this study was to determine REE concentrations in thirty-five benchmark soils of Brazil. Composite soil samples were taken from areas under native vegetation or with minimal anthropogenic influence. Concentrations of La, Ce, Pr, Nd, Sm, Eu, Gd, Yb, Lu, Dy, Er, Ho, Tb, Tm, Y, Sc, and Fe were determined by ICP-OES using a cyclonic spray chamber/nebulizer system after microwave acid digestion. Results were assessed by descriptive statistics, Pearson correlation, and principal component analysis (PCA). Regression analyses among Fe, organic carbon, and REEs were performed to provide a tool for estimating REE concentrations in soils. The REE concentrations in the Brazilian benchmark soils were in the following order: Ce > La > Nd > Pr > Y > Sm > Gd > Sc > Dy > Yb > Eu > Er > Tb > Ho > Lu > Tm. The clear decoupling between light and heavy rare earth elements in soils, indicated by multivariate analysis, is mainly related to differences in parent material. The lowest REE concentrations were found in sandy sediments, whereas the highest REE concentrations were observed in basalt, biotite gneiss, and clayey sediments. The organic carbon and Fe concentrations can properly predict REE concentrations in soils; such a finding can assist in estimating REE concentrations in soils not only in Brazil but also in similar soils developed under tropical conditions.
Keywords: lanthanides, scandium, yttrium, metals, trace elements.
Division – Soil Use and Management | Commission – Soil Pollution, Remediation and Reclamation of Degraded Areas
Silva et al. Rare Earth Element Concentrations in Brazilian Benchmark Soils
2Rev Bras Cienc Solo 2016;40:e0150413
INTRODUCTIONRare earth elements (REEs) are a group of metals comprised of yttrium (Y), scandium (Sc), and 14 elements of the lanthanide series (lanthanum to lutetium). These last 14 elements are generally divided into two groups: light (lanthanum to europium) and heavy (gadolinium to lutetium) elements (Hu et al., 2006; Du and Graedel, 2011; Sadeghi et al., 2013). The denomination “rare” might lead to misunderstandings since they can be as abundant in the Earth’s crust as copper, nickel, or lead (Haxel et al., 2002). For instance, cerium (Ce) is the 25th most abundant element in the Earth’s crust and its concentration in soil is often similar to that of Zn (Tyler, 2004). In addition, REEs are found in more than 200 minerals, mainly phosphates, carbonates, silicates, and Fe- and Mn-oxides (Henderson, 1984).
Given their unique physical and chemical properties, REEs are widely used for multiple purposes, such as industrial production of technological devices (Strauch et al., 2008; Long et al., 2010; Robert and David, 2012) and agricultural fertilizers (Pang et al., 2002; Kobayashi et al., 2007). These and other technical innovations will strongly increase REE demand in the near future; hence, accumulation of these elements in the soil may become an environmental concern (Zeng et al., 2006; D’Aquino et al., 2009; Du and Graedel, 2011).
Data on soil background concentrations of trace (Salonen and Korkka-Niemi, 2007; Biondi et al., 2011; Preston et al., 2014; Alfaro et al., 2015) and major elements (Montserrat and Camarero, 2010; Hannan and Tanguma, 2012; Dantu, 2014) are easily found in the literature. However, data regarding REEs are comparatively scarce and have mainly focused on determination of REEs in a limited number of soil types (Turra et al., 2011; Damascena et al., 2015). Given that REE concentrations are influenced by soil parent materials and pedogenesis processes, such studies are not able to estimate the variability of REE concentrations expected in soils. Thus, the study of benchmark soils can yield a set of REE data that covers a wide range of pedogeological conditions and might be used in estimation of REEs on a more national or global scale. A benchmark soil is one of large extent within one or more major land resource areas, one that holds a key position in the soil classification system, one for which there is a large amount of data, one that has special importance for one or more significant land uses, or one that is of significant ecological importance (USDA, 2004).
Geochemical associations between trace elements and Fe concentrations in soils are often reported (Hamon et al., 2004; Alfaro et al., 2015); therefore, regression equations may predict trace element concentrations in soils based on such correlations. This can avoid costly sampling and analysis when levels of potentially toxic elements need to be known for a great number of soil samples (Alfaro et al., 2015). Likewise, high correlations between Fe and REE concentrations can be useful for estimating the concentrations of REEs in soils.
Taking into account the growing global economic importance of REEs, the use of these elements in several Earth science fields (Laveuf and Cornu, 2009; Li et al., 2013; Chen et al., 2014; Abbott et al., 2015; Pagano et al., 2015), and the scarcity of data available for Brazil (Pérez et al., 1997; Paye et al., 2016) and other tropical regions, this study was carried out to determine the REE concentrations in soils of a Brazilian benchmark collection that represents all the soil orders found in the country. Additionally, we demonstrate that a geochemical association exists between Fe and REEs in these soils. Such a finding can aid in estimating and tracing REE concentrations in soils.
MATERIALS AND METHODS
Sampling and sample preparation
The study area extends from the coastal region to the semiarid zone of the state of Pernambuco, Brazil (Figure 1), and covers sites with different soil and geological settings.

Silva et al. Rare Earth Element Concentrations in Brazilian Benchmark Soils
3Rev Bras Cienc Solo 2016;40:e0150413
Annual average rainfall ranges from 500 mm to 2,200 mm and air temperature ranges from 24 °C to 28 °C for semiarid and coastal regions, respectively. In the coastal zone, soils are often developed upon tertiary sediments or crystalline rocks – usually deep and highly weathered – with relief ranging from slightly to strongly rolling; vegetation is mainly composed of evergreen broad-leaf tropical forest. In the semiarid region, soils are generally shallow owing to the long dry season, which in turn decreases the chemical weathering and leaching process; vegetation is mainly deciduous forest, known locally as hypoxerophilous caatinga, and dense tree-shrub deciduous vegetation, classified locally as hyperxerophilous caatinga, somewhat similar to a dry season deciduous thornbush savannah (Nascimento et al., 2006).
A total of 35 composite topsoil samples were taken from areas covered by native vegetation or with minimal anthropogenic influence, representing a wide diversity of soil classes and parent materials (Table 1). Consequently, the soils also exhibit wide variability regarding physical and chemical properties (Table 2). Soil samples were air dried and passed through a 2-mm mesh nylon sieve, ground in an agate mortar, and passed through a stainless steel 0.3-mm mesh sieve (ABNT No. 50).
Quality control and quality assurance (QC/QA)
For REE and Fe determination, 1.000 g of soil was digested in Teflon vessels with 9 mL of HNO3 and 3 mL of HCl in a microwave oven (USEPA, 1998). This method is recommended by the Brazilian Council for the Environment to assess potentially toxic concentrations of elements in soil (Conama, 2009). All the extracts were transferred to 25 mL certified flasks (NBR ISO/IEC) filled with ultrapure water (Millipore Direct-Q System) and filtered through slow filter paper (Macherey Nagel®). High purity acids were used in the analysis (Merck PA).
Calibration curves for REE and Fe determination were prepared from standard 1,000 mg L-1 (Titrisol®, Merck). Analysis was performed only when the coefficient of determination (R2) of the calibration curve was higher than 0.999. Analytical data quality and standard operational procedures such as curve recalibration and analyses of blanks and the standard reference materials SRM 2710a Montana I Soil and SRM 2709 San Joaquin soil (NIST, 2002) were performed. All analyses were carried out in duplicate. Concentrations of La, Ce, Pr, Nd, Sm, Eu, Gd, Yb, Lu, Dy, Er, Ho, Tb, Tm, Y, Sc, and Fe were determined by inductively coupled
Figure 1. Distribution of soil sampling sites in the state of Pernambuco, Brazil.

Silva et al. Rare Earth Element Concentrations in Brazilian Benchmark Soils
4Rev Bras Cienc Solo 2016;40:e0150413
plasma (ICP-OES/Optima 7000, Perkin Elmer); in order to improve both sensitivity and stability for REE measurements, a cyclonic spray chamber/nebulizer system was coupled to the ICP.
Statistical analysis
Results were assessed by descriptive statistics, Pearson correlation, and principal component analysis (PCA). Principal component analysis has been widely used for studying geochemical data (Carranza, 2008; Sadeghi et al., 2013; Agnan et al., 2014; Silva et al., 2015) and consists of converting the original group of variables into a new uncorrelated group of equal dimension. Such groups are known as principal components – linear combination of the original variables – which aim to explain the maximum level of total variability associated with
Sample Soil class(Soil Taxonomy)
Soil class(Brazilian System of Soil
Classification)Parent material Location
1 Ustic Kandihumult Argissolo Vermelho-Amarelo Gneisses 07°25’22”S / 35°10’54”W2 Acrudoxic Kandiudult Argissolo Amarelo Sandy/clayey sediments 07°37’30”S / 34°57’30”W3 Typic Haplorthod Espodossolo Humilúvico Sandy sediments 07°38’41”S / 34°56’44”W4 Typic Kandiudult Argissolo Vermelho-Amarelo Gneisses and migmatites 08°01’42”S / 34°51’42”W5 Udic Argiustoll Chernossolo Argilúvico Gneisses 07°44’32”S / 35°14’04”W6 Xanthic Hapludox Latossolo Amarelo Clayey/sandy sediments 08°38’39”S / 35°09’15”W7 Rhodic Kandiudult Nitossolo Vermelho Basalt/trachytes 08°18’00”S / 34°59’00”W8 Rhodic Kandiustalf Argissolo Vermelho Gneisses 07°25’17”S / 35°16’23”W9 Typic Plinthudult Plintossolo Argilúvico Clayey/sandy sediments 07°37’30”S / 34°57’30”W10 Fragic Kandiustult Argissolo Amarelo Sandy sediments 07°36’20”S / 35°08’43”W11 Fibric Tropohemist Organossolo Háplico Organic deposits (Holocene) 08°27’37”S / 35°04’48”W12 Typic Endoaquent Gleissolo Háplico Clayey/sandy sediments 08°25’22”S / 35°01’14”W13 Typic Ustortent Neossolo Regolítico Biotite-gneisses 08°21’42”S / 36°10’26”W14 Arenic Albaqualf Planossolo Háplico Biotite-gneisses 08°21’28”S / 36°10’20”W15 Typic Albaqualf Planossolo Háplico Diorites 08°27’26”S / 36°12’49”W16 Kanhaplic Haplustalf Argissolo Vermelho Biotite-gneisses 08°10’21”S / 25°54’35”W17 Typic Ustortent Neossolo Regolítico Biotite-gneisses 08°13’54”S / 35°55’15”W18 Typic Plinthustult Argissolo Amarelo Biotite-muscovite-quartzite 07°52’47”S / 31°55’18”W19 Typic Natraqualf Planossolo Nátrico Biotite-gneisses 07°58’22”S / 36°11’02”W20 Humic Hapludox Latossolo Vermelho-Amarelo Titanite-amphibole-biotite 08°14’19”S / 36°10’28”W21 Grossarenic Kandiustalf Argissolo Vermelho-Amarelo Biotite-muscovite-gneisses 08°42’45”S / 36°25’00”W22 Ustic Kandihumult Argissolo Amarelo Clayey sediments 09°03’00”S / 36°29’00”W23 Lithic Ustortent Neossolo Litólico Granite 08°04’19”S / 36°03’22”W24 Aridic Plinthustalf Argissolo Amarelo Sandy/clayey sediments 09°03’46”S / 40°18’46”W25 Aquic Natrargid Planossolo Nátrico Sandy sediments 09°02’30”S / 40°15’07”W26 Typic Quarzipsament Neossolo Quartzarênico Sandy sediments 09°21’13”S / 40°28’37”W27 Typic Aquisalid Neossolo Flúvico Clayey sediments 08°43’18”S / 37°31’27”W28 Aridic Ustifluvent Neossolo Flúvico Sandy sediments 08°30’26”S / 37°37’24”W29 Typic Quartzipsament Neossolo Quartzarênico Arenite 08°38’19”S / 37°40’04”W30 Aridic Haplustalf Luvissolo Crômico Gneisses/schists/phyllites 08°30’10”S / 39°19’39”W31 Xanthic Haplustox Latossolo Amarelo Sandy/clayey sediments 07°44’33”S / 40°12’11”W32 Oxic Ustropept Cambissolo Háplico Syenite 07°48’29”S / 38°08’15”W33 Chromic Haplustert Vertisssolo Háplico Shale 07°37’44”S / 40°03’14”W34 Aridic Plinthustalf Argissolo Amarelo Sandy/clayey sediments 08°19’35”S / 40°16’36”W35 Lithic Ustortent Neossolo Litólico Biotite-schists 08°00’95”S / 38°53’39”W
Table 1. Soil class according to Soil Taxonomy and Brazilian System of Soil Classification, parent material, and locations of soils
Silva et al. Rare Earth Element Concentrations in Brazilian Benchmark Soils
5Rev Bras Cienc Solo 2016;40:e0150413
these independent variables (Manly, 2008). To extract the significant principal components while diminishing the contribution of variables with little importance, we employed Varimax rotation (Kaiser, 1958). Regression analyses among Fe, organic carbon (OC), and REEs were tested to provide a tool for estimating REE concentrations in soils.
RESULTS AND DISCUSSION
Quality control and quality assurance (QC/QA)
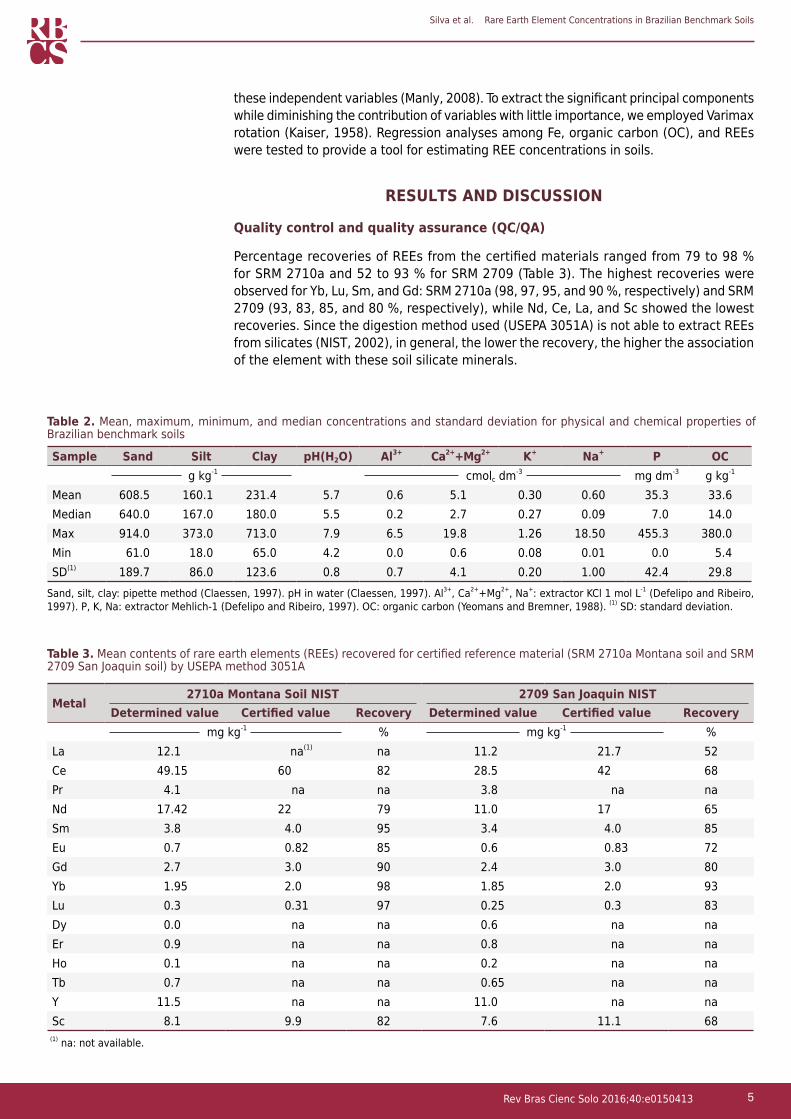
Percentage recoveries of REEs from the certified materials ranged from 79 to 98 % for SRM 2710a and 52 to 93 % for SRM 2709 (Table 3). The highest recoveries were observed for Yb, Lu, Sm, and Gd: SRM 2710a (98, 97, 95, and 90 %, respectively) and SRM 2709 (93, 83, 85, and 80 %, respectively), while Nd, Ce, La, and Sc showed the lowest recoveries. Since the digestion method used (USEPA 3051A) is not able to extract REEs from silicates (NIST, 2002), in general, the lower the recovery, the higher the association of the element with these soil silicate minerals.
Sample Sand Silt Clay pH(H2O) Al3+ Ca2++Mg2+ K+ Na+ P OC g kg-1 cmolc dm-3 mg dm-3 g kg-1
Mean 608.5 160.1 231.4 5.7 0.6 5.1 0.30 0.60 35.3 33.6Median 640.0 167.0 180.0 5.5 0.2 2.7 0.27 0.09 7.0 14.0Max 914.0 373.0 713.0 7.9 6.5 19.8 1.26 18.50 455.3 380.0Min 61.0 18.0 65.0 4.2 0.0 0.6 0.08 0.01 0.0 5.4SD(1) 189.7 86.0 123.6 0.8 0.7 4.1 0.20 1.00 42.4 29.8
Table 2. Mean, maximum, minimum, and median concentrations and standard deviation for physical and chemical properties of Brazilian benchmark soils
Sand, silt, clay: pipette method (Claessen, 1997). pH in water (Claessen, 1997). Al3+, Ca2++Mg2+, Na+: extractor KCl 1 mol L-1 (Defelipo and Ribeiro, 1997). P, K, Na: extractor Mehlich-1 (Defelipo and Ribeiro, 1997). OC: organic carbon (Yeomans and Bremner, 1988). (1) SD: standard deviation.
Table 3. Mean contents of rare earth elements (REEs) recovered for certified reference material (SRM 2710a Montana soil and SRM 2709 San Joaquin soil) by USEPA method 3051A
Metal2710a Montana Soil NIST 2709 San Joaquin NIST
Determined value Certified value Recovery Determined value Certified value Recovery mg kg-1 % mg kg-1 %
La 12.1 na(1) na 11.2 21.7 52Ce 49.15 60 82 28.5 42 68Pr 4.1 na na 3.8 na naNd 17.42 22 79 11.0 17 65Sm 3.8 4.0 95 3.4 4.0 85Eu 0.7 0.82 85 0.6 0.83 72Gd 2.7 3.0 90 2.4 3.0 80Yb 1.95 2.0 98 1.85 2.0 93Lu 0.3 0.31 97 0.25 0.3 83Dy 0.0 na na 0.6 na naEr 0.9 na na 0.8 na naHo 0.1 na na 0.2 na naTb 0.7 na na 0.65 na naY 11.5 na na 11.0 na naSc 8.1 9.9 82 7.6 11.1 68
(1) na: not available.

Silva et al. Rare Earth Element Concentrations in Brazilian Benchmark Soils
6Rev Bras Cienc Solo 2016;40:e0150413
REEs concentration in soils
Average REE concentrations in soils were in the following order: Ce > La > Nd > Pr > Y > Sm > Gd > Sc > Dy > Yb > Eu > Er > Tb > Ho > Lu > Tm (Figure 2). The REE concentrations in the soil is mainly governed by parent materials (Liu, 1988; Hu et al., 2006), but weathering conditions, organic matter, and clay concentrations are also important to determine these levels (Tyler, 2004). The abundance of REEs found here is very similar to that reported for soils of Brazil (Paye et al., 2016) and other countries (Wei et al., 1991; Yoshida et al., 1998; Tyler and Olsson, 2002; Sadeghi et al., 2013) and follows the Oddo-Harkins rule, which holds that elements with an even atomic number (such as Ce) are more common than elements with an odd atomic number (such as La).
The average Ce and La concentrations (43.48 and 20.79 mg kg-1, respectively) were higher than those for Zn and Cu (19.61 and 9.25 mg kg-1); Pr and Nd (9.61 and 17.70 mg kg-1) were also found in higher concentrations than trace elements (Ni and Co) measured in the same soils (Biondi et al., 2011). In addition, the average Gd concentration was greater than the average Cd concentration generally found in Brazilian soils (Paye et al., 2010; Santos and Alleoni, 2013; Preston et al., 2014). Tm, Lu, Ho, and Tb were the least abundant heavy rare earth elements (HREEs) in soils; their values are comparable to those often reported for Mo and are related to the very low concentration in primary minerals.
The lowest sum of REEs occurred in soils derived from sandy sediments: profiles 28 (9.26 mg kg-1), 25 (9.54 mg kg-1), 3 (13.31 mg kg-1), and 10 (14.84 mg kg-1) (Table 1). Studying REE distribution in Sweden, Sadeghi et al. (2013) also observed the lowest contents in sandstones. The highest REE concentrations in Brazilian benchmark soils were derived from basalt, biotite gneiss, and clayey sediments, profiles 7 (549 mg kg-1), 16 (525 mg kg-1), and 12 (410 mg kg-1), respectively. The sum of light rare earth elements (LREEs) in soils was equal to 95.56 mg kg-1. The maximum LREE concentrations were observed for the soil with the highest clay content (Figure 2). These values are much higher than the average in the Earth’s crust and indicate that LREE enrichment took place in these soils. Several authors report LREE accumulation in clayey soils (Minarik et al., 1998; Dong et al., 2001; Kanazawa and Kamitani, 2006; Prudêncio et al., 2011; Ahn et al., 2014).
The sum of REEs in soils of Brazil was 107.54 mg kg-1; this value is slightly higher than the average concentrations in Japan and Sweden, but lower than those in China and Europe
Figure 2. Data on the concentrations of light rare earth elements (LREE) (a) and heavy rare earth elements (HREE) (b) in Brazilian benchmark soils.
0La
20
LREE
s (m
g kg
-1)
Ce Pr Nd Sm Eu
40
60
80
100
120
280(a)
0YbGd Lu Dy Er Ho TmTb Y Sc
14
12
6
4
2
20(b)
Min-MaxMedian 25-75 % Extremes
HREE
s (m
g kg
-1)

Silva et al. Rare Earth Element Concentrations in Brazilian Benchmark Soils
7Rev Bras Cienc Solo 2016;40:e0150413
(Table 4). The higher REE concentration in China is due to rich soil parent materials that comprise 23 % of the world’s proven reserves (18.59 Mt, in 2009) (TSCIOPRC, 2012).
Correlation matrix
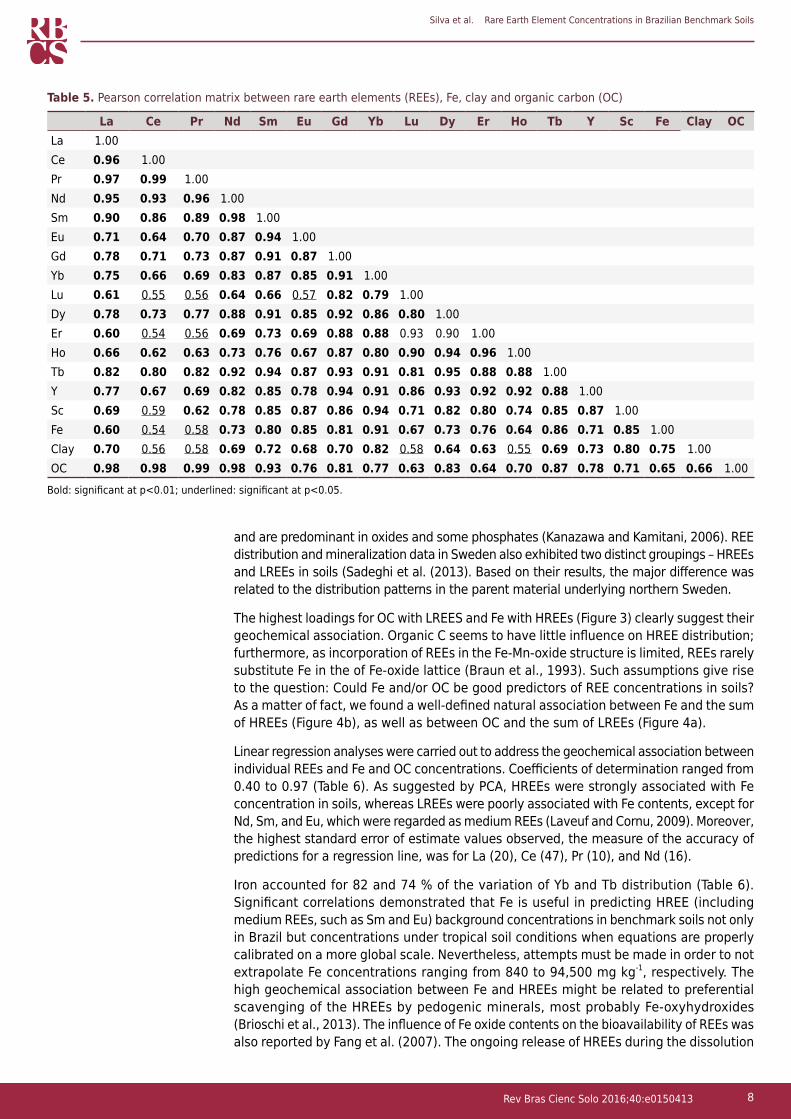
Significant positive correlations among REEs were observed (Table 5). The correlation coefficients ranged from 0.54 (Ce-Er) to 0.99 (Ce-Pr), at p<0.05 and p<0.01, respectively. The highest correlations were observed among the following LREEs: La-Ce (0.96), La-Pr (0.97), Ce-Pr (0.99), and Pr-Nd (0.96), and the HREEs: Gd-Y (0.94), Dy-Ho (0.94), Dy-Tb (0.95), and Er-Ho (0.96). High correlations among REEs serve as useful tracers in the environment. Organic C and Fe contents play an important role in LREE and HREE distribution, respectively; however, a clear relationship between clay content and LREEs and HREEs was not observed in the matrix correlation; therefore, multivariate statistical analysis was used to further address this relationship.
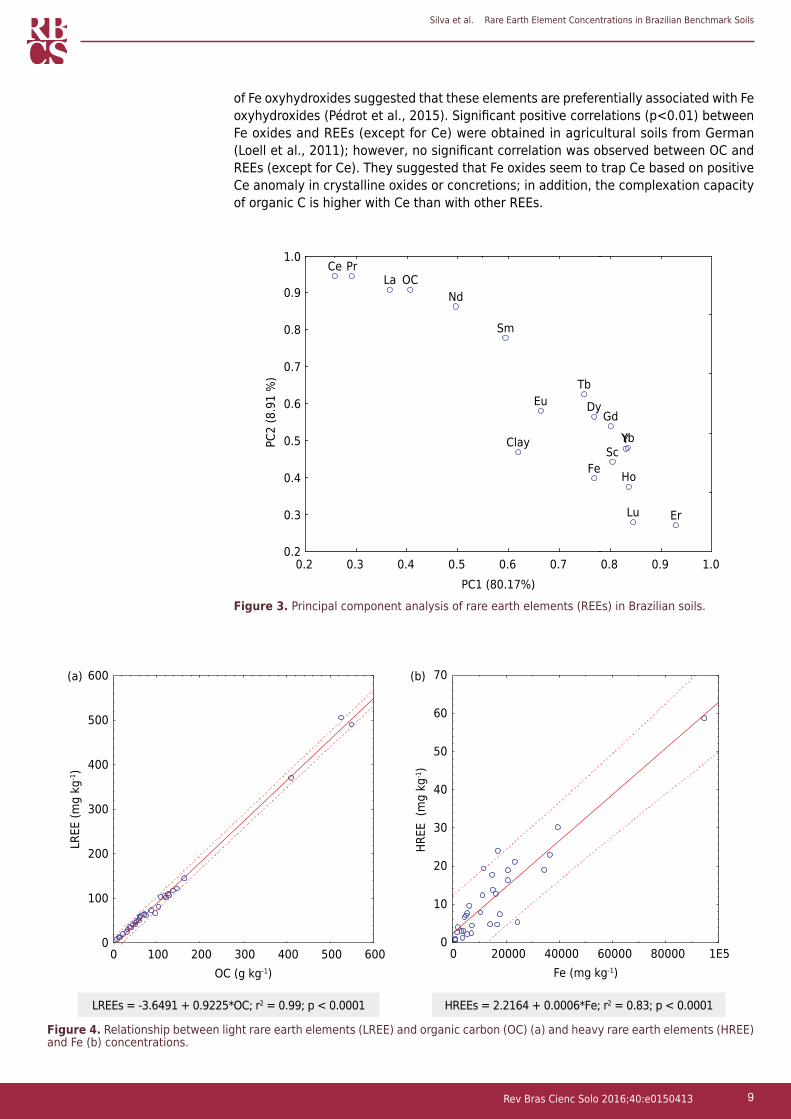
Principal component analysis
Principal component analysis (PCA) was carried out based on the strong positive correlation among REEs and their multivariate normal distribution. The entire data set showed principal components (PC) with eigenvalues higher than unity and explained roughly 89 % of the total variance of REE distribution. PC1 and PC2 accounted for 80 and 8.9 % of total variance, respectively (Figure 3). PC1 had the highest loadings for Eu (0.66), Gd (0.80), Yb (0.83), Lu (0.84), Dy (0.77), Er (0.92), Ho (0.83), Tb (0.74), Y (0.83), Sc (0.80), Fe (0.76), and Clay (0.61), whereas PC2 was mainly correlated with La (0.90), Ce (0.94), Pr (0.94), Nd (0.86), Sm (0.77), and organic carbon (OC) (0.90). The clear decoupling between LREEs (PC2) and HREEs (PC1 – except for Eu) in soils is mainly related to differences in parent material, atomic weight, ionic radii, coordination numbers (c.n.), and electronegativity (Henderson, 1984; Laveuf and Cornu, 2009). For instance, LREEs often occupy the larger sites of 8-10 c.n. and concentrate in carbonates and phosphates, whereas HREEs usually occupy 6-8 c.n. sites
Table 4. Mean concentrations of rare earth elements (REEs) in soils of Brazil compared to international soil data and Earth’s crust
Element Brazil Japan China Sweden European average Earth’s crustmg kg-1
La 20.79 18.00 37.4 17.42 25.90 35.00Ce 43.48 40.00 64.7 37.67 52.2 66.00Pr 9.61 4.50 6.67 4.10 6.02 9.10Nd 17.70 18.00 25.1 15.14 22.40 40.00Sm 3.37 3.70 4.94 2.98 4.28 7.00Eu 0.6 1.0 0.98 0.65 0.85 2.1Gd 2.32 3.70 4.38 3.07 4.20 6.10Yb 0.67 2.00 2.32 2.01 2.09 3.10Lu 0.05 0.3 0.35 0.30 0.30 0.80Dy 0.93 3.3 3.93 2.95 3.58 4.5Er 0.59 2.0 2.42 1.88 2.1 3.5Ho 0.17 0.7 0.83 0.61 0.72 1.3Tb 0.5 1.2 0.58 0.49 0.64 1.2Y 4.45 na(1) na na na 31.00Sc 2.31 na na na na na∑LREE 95.56 85.2 139.79 77.96 111.65 159.2∑HREE 11.99 13.2 14.81 11.31 13.63 51.5∑REE 107.54 98.4 154.6 89.27 125.28 210.7
Reference This study Yoshida et al. (1998)
Wei et al. (1991)
Sadeghi et al. (2013)
Sadeghi et al. (2013)
Tyler and Olsson (2002)
(1) na: not available.
Silva et al. Rare Earth Element Concentrations in Brazilian Benchmark Soils
8Rev Bras Cienc Solo 2016;40:e0150413
and are predominant in oxides and some phosphates (Kanazawa and Kamitani, 2006). REE distribution and mineralization data in Sweden also exhibited two distinct groupings – HREEs and LREEs in soils (Sadeghi et al. (2013). Based on their results, the major difference was related to the distribution patterns in the parent material underlying northern Sweden.
The highest loadings for OC with LREES and Fe with HREEs (Figure 3) clearly suggest their geochemical association. Organic C seems to have little influence on HREE distribution; furthermore, as incorporation of REEs in the Fe-Mn-oxide structure is limited, REEs rarely substitute Fe in the of Fe-oxide lattice (Braun et al., 1993). Such assumptions give rise to the question: Could Fe and/or OC be good predictors of REE concentrations in soils? As a matter of fact, we found a well-defined natural association between Fe and the sum of HREEs (Figure 4b), as well as between OC and the sum of LREEs (Figure 4a).
Linear regression analyses were carried out to address the geochemical association between individual REEs and Fe and OC concentrations. Coefficients of determination ranged from 0.40 to 0.97 (Table 6). As suggested by PCA, HREEs were strongly associated with Fe concentration in soils, whereas LREEs were poorly associated with Fe contents, except for Nd, Sm, and Eu, which were regarded as medium REEs (Laveuf and Cornu, 2009). Moreover, the highest standard error of estimate values observed, the measure of the accuracy of predictions for a regression line, was for La (20), Ce (47), Pr (10), and Nd (16).
Iron accounted for 82 and 74 % of the variation of Yb and Tb distribution (Table 6). Significant correlations demonstrated that Fe is useful in predicting HREE (including medium REEs, such as Sm and Eu) background concentrations in benchmark soils not only in Brazil but concentrations under tropical soil conditions when equations are properly calibrated on a more global scale. Nevertheless, attempts must be made in order to not extrapolate Fe concentrations ranging from 840 to 94,500 mg kg-1, respectively. The high geochemical association between Fe and HREEs might be related to preferential scavenging of the HREEs by pedogenic minerals, most probably Fe-oxyhydroxides (Brioschi et al., 2013). The influence of Fe oxide contents on the bioavailability of REEs was also reported by Fang et al. (2007). The ongoing release of HREEs during the dissolution
La Ce Pr Nd Sm Eu Gd Yb Lu Dy Er Ho Tb Y Sc Fe Clay OCLa 1.00Ce 0.96 1.00Pr 0.97 0.99 1.00Nd 0.95 0.93 0.96 1.00Sm 0.90 0.86 0.89 0.98 1.00Eu 0.71 0.64 0.70 0.87 0.94 1.00Gd 0.78 0.71 0.73 0.87 0.91 0.87 1.00Yb 0.75 0.66 0.69 0.83 0.87 0.85 0.91 1.00Lu 0.61 0.55 0.56 0.64 0.66 0.57 0.82 0.79 1.00Dy 0.78 0.73 0.77 0.88 0.91 0.85 0.92 0.86 0.80 1.00Er 0.60 0.54 0.56 0.69 0.73 0.69 0.88 0.88 0.93 0.90 1.00Ho 0.66 0.62 0.63 0.73 0.76 0.67 0.87 0.80 0.90 0.94 0.96 1.00Tb 0.82 0.80 0.82 0.92 0.94 0.87 0.93 0.91 0.81 0.95 0.88 0.88 1.00Y 0.77 0.67 0.69 0.82 0.85 0.78 0.94 0.91 0.86 0.93 0.92 0.92 0.88 1.00Sc 0.69 0.59 0.62 0.78 0.85 0.87 0.86 0.94 0.71 0.82 0.80 0.74 0.85 0.87 1.00Fe 0.60 0.54 0.58 0.73 0.80 0.85 0.81 0.91 0.67 0.73 0.76 0.64 0.86 0.71 0.85 1.00Clay 0.70 0.56 0.58 0.69 0.72 0.68 0.70 0.82 0.58 0.64 0.63 0.55 0.69 0.73 0.80 0.75 1.00OC 0.98 0.98 0.99 0.98 0.93 0.76 0.81 0.77 0.63 0.83 0.64 0.70 0.87 0.78 0.71 0.65 0.66 1.00
Bold: significant at p<0.01; underlined: significant at p<0.05.
Table 5. Pearson correlation matrix between rare earth elements (REEs), Fe, clay and organic carbon (OC)
Silva et al. Rare Earth Element Concentrations in Brazilian Benchmark Soils
9Rev Bras Cienc Solo 2016;40:e0150413
of Fe oxyhydroxides suggested that these elements are preferentially associated with Fe oxyhydroxides (Pédrot et al., 2015). Significant positive correlations (p<0.01) between Fe oxides and REEs (except for Ce) were obtained in agricultural soils from German (Loell et al., 2011); however, no significant correlation was observed between OC and REEs (except for Ce). They suggested that Fe oxides seem to trap Ce based on positive Ce anomaly in crystalline oxides or concretions; in addition, the complexation capacity of organic C is higher with Ce than with other REEs.
0 100 200 300 400 500 600OC (g kg-1)
0
100
200
300
400
500
600
LREE
(mg
kg-1)
(a) (b)
0 20000 40000 60000 80000 1E5Fe (mg kg-1)
0
10
20
30
40
50
60
70
HREE
(m
g kg
-1)
LREEs = -3.6491 + 0.9225*OC; r2 = 0.99; p < 0.0001 HREEs = 2.2164 + 0.0006*Fe; r2 = 0.83; p < 0.0001
Figure 4. Relationship between light rare earth elements (LREE) and organic carbon (OC) (a) and heavy rare earth elements (HREE) and Fe (b) concentrations.
Figure 3. Principal component analysis of rare earth elements (REEs) in Brazilian soils.
0.20.2
0.3
0.4
0.5
0.6
0.7
0.8
0.9
Ce PrLa OC
Nd
Sm
EuTb
DyGd
ScYYb
Fe
Clay
Ho
Lu Er
1.0
0.3 0.4 0.5 0.6 0.7 0.8 0.9 1.0PC1 (80.17%)
PC2
(8.9
1 %
)

Silva et al. Rare Earth Element Concentrations in Brazilian Benchmark Soils
10Rev Bras Cienc Solo 2016;40:e0150413
CONCLUSIONS
Average REE concentrations in benchmark soils of Brazil were in the following order: Ce > La > Nd > Pr > Y > Sm > Gd > Sc > Dy > Yb > Eu > Er > Tb > Ho > Lu > Tm and were related to underlying parent material. The lowest REE concentrations were found in sandy sediments, whereas the highest REE concentrations were observed in basalt, biotite gneiss, and clayey sediments.
Organic carbon and Fe concentrations can properly predict REE concentrations in the soils studied; this finding can assist in estimating REE concentrations in soils not only in Brazil but in similar soils developed under tropical conditions.
REFERENCESAbbott AN, Haley BA, McManus J, Reimers CE. The sedimentary flux of dissolved rare earth elements to the ocean. Geochim Cosmochim Acta. 2015;154:186-200. doi:10.1016/j.gca.2015.01.010
Agnan Y, Delmas NS, Probst A. Origin and distribution of rare earth elements in various lichen and moss species over the last century in France. Sci Total Environ. 2014;487:1-12. doi:10.1016/j.scitotenv.2014.03.132
Ahn JS, Youm J, Cho YC, Shin SC, Cho WH. Geochemical survey of rare earth elements (REEs) in the concealed ore body of Hongcheon, Korea. Environ Earth Sci. 2014;72:2153-61.
Alfaro MR, Montero A, Ugarte OM, Nascimento CWA, Accioly AMA, Biondi CM, Silva YJAB. Background concentrations and reference values for heavy metals in soils of Cuba. Environ Monit Assess. 2015;187:4198-207. doi:10.1007/s10661-014-4198-3
Biondi CM, Nascimento CWA, Fabricio Neta AB, Ribeiro MR. Teores de Fe, Mn, Zn, Cu, Ni e Co em solos de referência de Pernambuco. Rev Bras Cienc Solo. 2011;35:1057-66. doi:10.1590/S0100-06832011000300039
Table 6. Regression parameters for the association between rare earth elements (REEs) and concentrations of organic carbon (OC) and Fe in soils
Element Slope coefficient Constant SEE r r2 pOC
La 0.19 0.47 4.31 0.98 0.97 0.0001Ce 0.42 -2.08 10.87 0.98 0.96 0.0001Pr 0.09 -0.45 1.85 0.98 0.97 0.0001Nd 0.17 -1.43 4.57 0.98 0.96 0.0001Sm 0.03 -0.02 1.57 0.93 0.87 0.0001
FeEu 0.000054 -0.28 0.61 0.85 0.72 0.0001Gd 0.0001 0.26 1.69 0.80 0.65 0.0001Yb 0.000032 0.14 0.27 0.90 0.82 0.0001Lu 0.0000019 0.016 0.039 0.67 0.44 0.0001Dy 0.000037 0.32 0.63 0.73 0.53 0.0001Er 0.00002 0.25 0.32 0.75 0.57 0.0001Ho 0.0000057 0.08 0.12 0.63 0.40 0.0001Tb 0.000021 0.14 0.23 0.86 0.74 0.0001Y 0.0002 1.38 3.42 0.71 0.50 0.0001Sc 0.0001 0.40 1.35 0.84 0.71 0.0001
SEE: standard error of estimate; r: correlation coefficient; r2: regression coefficient.

Silva et al. Rare Earth Element Concentrations in Brazilian Benchmark Soils
11Rev Bras Cienc Solo 2016;40:e0150413
Braun JJ, Pagel M, Herbillon A, Rosin C. Mobilization and redistribution of REEs and Thorium in a syenitic lateritic profile: A mass-balance study. Geochim Cosmochim Acta. 1993;57:4419-34. doi:10.1016/0016-7037(93)90492-F
Brioschi L, Steinmann M, Lucot E, Pierret MC, Stille P, Prunier J, Badot PM. Transfer of rare earth elements (REE) from natural soil to plant systems: implications for the environmental availability of anthropogenic REE. Plant Soil. 2013;366:143-63. doi:10.1007/s11104-012-1407-0
Carranza EJM. Geochemical anomaly and mineral prospectivity mapping in GIS. Handbook of Exploration and Environmental Geochemistry. Amsterdam: Elsevier; 2008. v.11.
Chen LM, Zhang GL, Jin ZD. Rare earth elements of a 1000-year paddy soil chronosequence: Implications for sediment provenances, parent material uniformity and pedological changes. Geoderma. 2014;230/231:274-9. doi:10.1016/j.geoderma.2014.03.023
Claessen MEC, organizador. Manual de métodos de análise de solo. 2a ed. Rio de Janeiro: Centro Nacional de Pesquisa de Solos; 1997.
Conselho Nacional do Meio Ambiente - Conama. Resolução nº 420, de 28 de dez. de 2009. Dispõe sobre critérios e valores orientadores de qualidade do solo quanto à presença de substâncias químicas e estabelece diretrizes para o gerenciamento ambiental de áreas contaminadas por essas substâncias em decorrência de atividades antrópicas. Brasília, DF. [acesso: 12 ago 2015]. Disponível em: http://www.mma.gov.br/port/conama/legiabre.cfm?codlegi0620.
Damascena KFR, Amaral RS, Santos Júnior JA, Genezini FA, Silva AA, Menezes RSC. Rare-earth elements in uranium deposits in the municipality of Pedra, Pernambuco, Brazil. J Radioanal Nucl Chem. 2015;304:1053-8. doi:10.1007/s10967-015-3934-7
Dantu S. Spatial distribution and geochemical baselines of major/trace elements in soils of Medak district, Andhra Pradesh, India. Environ Earth Sci. 2014;72:955-81. doi:10.1007/s12665-013-3014-7
D’Aquino L, Pinto MC, Nardi L, Morgana M, Tommasi F. Effect of some light rare earth elements on seed germination, seedling growth and antioxidante metabolism in Triticum durum. Chemosphere. 2009;75:900-5. doi:10.1016/j.chemosphere.2009.01.026
Defelipo BV, Ribeiro AC. Análise química do solo, metodologia. 2a ed. Viçosa, MG: Universidade Federal de Viçosa; 1997.
Dong WM, Wang XK, Bian XY, Wang AX, Du JZ, Tao ZY. Comparative study on sorption/desorption of radioeuropium on alumina, bentonite and red earth: effects of pH, ionic strength, fulvic acid, and iron oxides in red earth. Appl Radiat Isotopes. 2001;54:603-10. doi:10.1016/S0969-8043(00)00311-0
Du X, Graedel TE. Global in-use stocks of the rare earth elements: a first estimate. Environ Sci Technol. 2011;45:4096-101. doi:10.1021/es102836s
Fang J, Wen B, Xiao-Quan S, Huan-Hua W, Jin-Ming L, Shuzhen Z. Evaluation of bioavailability of light rare earth elements to wheat (Triticum aestivum L.) under field conditions. Geoderma. 2007;141:53-9. doi:10.1016/j.geoderma.2007.05.014
Hamon RE, Mclaughlin MJ, Gilkes RJ, Rate AW, Zarcinas B, Robertson A, Cozens G, Radford N, Bettenay L. Geochemical indices allow estimation of heavy metal background concentrations in soils. Global Biogeochem Cycles. 2004;18:1-6. doi:10.1029/2003GB002063
Hannan MA, Tanguma J. Concentrations of trace and major elements in Mission–Progresso (Texas) soils. J Radioanal Nucl Chem. 2012;291:745-51. doi:10.1007/s10967-011-1545-5
Haxel GB, Hedrick JB, Orris GJ. Rare earth elements - critical resources for high technology. USGS Fact Sheet 087-02. Washington, DC: U.S. Geological Survey; 2002.
Henderson P. Rare earth element geochemistry: Developments in geochemistry. Amsterdam: Elsevier; 1984. v.2.
Hu Z, Haneklaus S, Sparovek G, Schnug E. Rare earth elements in soils. Commun Soil Sci Plant Anal. 2006;37:1381-420. doi:10.1080/00103620600628680

Silva et al. Rare Earth Element Concentrations in Brazilian Benchmark Soils
12Rev Bras Cienc Solo 2016;40:e0150413
Kaiser HF. The varimax criterion for analytic rotation in factor analysis. Psychometrika. 1958;23:187-200. doi:10.1007/BF02289233
Kanazawa Y, Kamitani M. Rare earth minerals and resources in the world. J Alloys Comp. 2006;408/412:1339-43. doi:10.1016/j.jallcom.2005.04.033
Kobayashi Y, Ikka T, Kimura K, Yasuda O, Koyama H. Characterization of lanthanum toxicity for root growth of Arabidopsis thaliana from the aspect of natural genetic variation. Funct Plant Biol. 2007;34:984-94. doi:10.1071/FP07133
Laveuf C, Cornu S. A review on the potentiality of rare earth elements to trace pedogenetic processes. Geoderma. 2009;154:1-12. doi:10.1016/j.geoderma.2009.10.002
Li X, Chen Z, Chen Z, Zhang Y. A human health risk assessment of rare earth elements in soil and vegetables from a mining area in Fujian Province, Southeast China. Chemosphere. 2013;93:1240-6. doi:10.1016/j.chemosphere.2013.06.085
Liu Z. Rare earth elements in soil. In: Guo BS, Zhu WM, Xiong BK, Ji YJ, Liu Z, Wu ZM, editors. Rare earth elements in agriculture (in Chinese). Beijing: China Agricultural Science and Technology Press; 1988. p.22-44.
Loell M, Reiher W, Henningsen PF. Contents and bioavailability of rare earth elements in agricultural soils in Hesse (Germany). J Plant Nutr Soil Sci. 2011;174:644-54. doi:10.1002/jpln.201000265
Long KR, van Gosen BS, Foley NK, Cordier D. The principal rare earth elements deposits of the United States - a summary of domestic deposits and a global perspective. Virginia U.S. Geological Survey; 2010. (Scientific Investigations Report, 2010-5220).
Manly BJF. Métodos estatísticos multivariados: uma introdução. 3a ed. Porto Alegre: Bookman; 2008.
Minarik L, Zigova A, Bendl J, Skrivan P, St’astny M. The behaviour of rare earth elements and Y during the rock weathering and soil formation in the Ricany granite massif, Central Bohemia. Sci Total Environ. 1998;215:101-11. doi:10.1016/j.still.2010.09.007
Montserrat B, Camarero L. Major and trace elements in soils in the Central Pyrenees: high altitude soils as a cumulative record of background atmospheric contamination over SW Europe. Environ Sci Pollut Res. 2010;17:1606-21. doi:10.1007/s11356-010-0349-4
Nascimento CWA, Oliveira AB, Ribeiro MR, Melo ÉEC. Distribution and availability of zinc and copper in benchmark soils of Brazil. Commun Soil Sci Plant Anal. 2006;37:109-25. doi:10.1080/00103620500403895
National Institute Of Standards and Technology - NIST. Standard Reference Materials - SRM 2709, 2710 and 2711Addendum Issue Date: 18 January 2002. [accessed on May 21, 2015]. Available at: http://ts.nist.gov/MeasurementServices/ReferenceMaterials/archived_certificates.
Pagano G, Guida M, Tommasi F, Oral R. Health effects and toxicity mechanisms of rare Earth elements - Knowledge gaps and research prospects. Ecotoxicol Environ Saf. 2015;115:40-8. doi:10.1016/j.ecoenv.2015.01.030
Pang X, Li D, Peng A. Application of rare-earth elements in the agriculture of China and its environmental behavior in soil. Environ Sci Pollut Res. 2002;9:143-8. doi:10.1007/BF02987718
Paye HS, Mello JWV, Abrahão WAP, Fernandes Filho EI, Dias LCP, Castro MLO, Melo SB, França MM. Valores de referência de qualidade para metais pesados em solos no estado do Espírito Santo. Rev Bras Cienc Solo. 2010;34:2041-51. doi:10.1590/S0100-06832010000600028
Paye HS, Mello JWV, Mascarenhas GRLM, Gasparon M. Distribution and fractionation of the rare earth elements in Brazilian soils. J Geoch Exp. 2016;161:27-41. doi:10.1016/j.gexplo.2015.09.003
Pédrot M, Dia A, Davranche M, Gruau G. Upper soil horizons control the rare earth element patterns in shallow groundwater. Geoderma. 2015;239/240:84-96. doi:10.1016/j.geoderma.2014.09.023
Pérez DV, Saldanha MFC, Meneguelli NA, Moreira JC, Vaitsman DS. Geoquímica de alguns solos brasileiros. Rio de Janeiro: Embrapa Solos; 1997. (Boletim Informativo).

Silva et al. Rare Earth Element Concentrations in Brazilian Benchmark Soils
13Rev Bras Cienc Solo 2016;40:e0150413
Preston W, Nascimento CWA, Biondi CM, Souza Júnior VS, Silva WR, Ferreira HA. Valores de referência de qualidade para metais pesados em solos do Rio Grande do Norte. Rev Bras Cienc Solo. 2014;38:1028-37. doi:10.1590/S0100-06832014000300035
Prudêncio MI, Dias MI, Waerenborgh JC, Ruiz F, Trindade MJ, Abad M. Rare earth and other trace and major elemental distribution in a pedogenic calcrete profile (Slimene, NE Tunisia). Catena. 2011;87:147-56. doi:10.1016/j.catena.2011.05.018
Robert JW, David JR. United States Environmental Protection Agency - USEPA. Rare earth elements: a review of production, processing, recycling, and associated environmental issues. Washington, DC: 2012. (EPA600/R-12/572).
Sadeghi M, Morris GA, Carranza EJM, Ladenberger A, Andersson M. Rare earth element distribution and mineralization in Sweden: An application of principal component analysis to FOREGS soil geochemistry. J Geochem Explor. 2013;133:160-75. doi:10.1016/j.gexplo.2012.10.015
Salonen VP, Korkka-Niemi K. Influence of parent sediments on the concentration of heavy metals in urban and suburban soils in Turku, Finland. Appl Geochem. 2007;22:906-18. doi:10.1016/j.apgeochem.2007.02.003.
Santos SN, Alleoni LRF. Reference values for heavy metals in soils of the Brazilian agricultural frontier in Southwestern Amazônia. Environ Monit Assess. 2013;185:5737-48. doi:10.1007/s10661-012-2980-7
Silva YJAB, Cantalice JRB, Singh VP, Nascimento CWA, Piscoya VC, Guerra SMS. Trace element fluxes in sediments an environmentally impacted river from a coastal zone of Brazil. Environ Sci Pollut Res. 2015;22:14755-66. doi:10.1007/s11356-015-4670-9
Situation and policy of China’s rare earth industry, white paper (English Version). The State Council Information Office of the People’s Republic of China; 2012. [accessed on: June 10, 2015]. Available at: http:// www.scio.gov.cn/zfbps/ndhf/2012/Document/1175419/ 1175419.htm; 2012.
Strauch G, Moder M, Wennrich R, Osenbruck K, Glaser HR, Schladitz T, Muller C, Schirmer K, Reinstorf F, Schirmer M. Indicators for assessing anthropogenic impact on urban surface and groundwater. J Soils Sedim. 2008;8:23-33. doi:10.1065/jss2007.06.234
The State Council Information Office of the People's Republic of China - TSCIOPRC. Situation and policy of China's rare earth industry, white paper (English Version). 2012. [accessed on: June 10, 2015]. Available at: http://www.scio.gov.cn/zfbps/ndhf/2012/Document/1175419/1175419.htm;2012.
Turra C, Fernandes EAN, Bacchi MA. Evaluation on rare earth elements of Brazilian agricultural supplies. J Environ Chem Ecotoxicol. 2011;3:86-92.
Tyler G, Olsson T. Conditions related to solubility of rare and minor elements in forest soils. J Plant Nutr Soil Sci. 2002;165:594-601. doi:10.1002/1522-2624(200210)165:5<594::AID-JPLN594>3.0.CO;2-K
Tyler G. Rare earth elements in soil and plant systems - A review. Plant Soil. 2004;276:191-206. doi:10.1007/s11104-005-4888-2
United States Department of Agriculture - USDA. National Engineering Handbook: Part 630-Hydrology. Washington, DC: USDA Soil Conservation Service. [accessed: Jul 2004]. Available at: http://www.soils.usda.gov/technical/handbook/contents/part630.html.
United States Environmental Protection Agency - USEPA. Method 3051a - Microwave assisted acid digestion of sediments, sludges, soils, and oils. 1998. Revision Feb 1st 2007. [Accessed on: Jun 16, 2015]. Available at: http:// www.epa.gov/epawaste/hazard/testmethods/sw846/pdfs/ 3051a.pdf.
Wei FS, Zheng CJ, Chen JS, Wu YY. Study on the background contents on 61 elements of soils in China. J Environ Sci. 1991;12:12-20.
Yeomans JC, Bremner JM. A rapid and precise method for routine determination of organic carbon in soil. Commun Soil Sci Plant Anal. 1988;19:1467-76. doi:10.1080/00103628809368027
Yoshida S, Maramutsu Y, Tagami K, Uchida S. Concentrations of lanthanide elements, Th, and U in 77 Japanese surface soils. Environ Int. 1998;24:275-86. doi:10.1016/S0160-4120(98)00006-3
Zeng Q, Zhu JG, Cheng HL, Xie ZB, Chu HY. Phytotoxicity of lanthanum in rice in Haplic Acrisols and Cambisols. Ecotoxicol Environ Saf. 2006;64:226-33. doi:10.1016/j.ecoenv.2005.03.016