Embed Size (px)
Citation preview
Building Concepts: Ratios and Rational Numbers
TEACHER NOTES
©2015 Texas Instruments Incorporated 1 education.ti.com
Lesson Overview
In this TI-Nspire™ lesson, students compare the graphs of different
collections of ratios and begin to make conjectures about slope and
how to compare slopes in terms of differences in rates of change.
Students build tables of ratios using pairs of rational number entries
and find associated unit rates.
Learning Goals
1. Use and interpret equivalent
ratios when the original ratio
is a rational number;
2. use and interpret unit rates for
ratios given as rational numbers;
3. identify the graph of a
collection of equivalent ratios
as a ray through the origin;
4. compare the graphs of
collections of different
equivalent ratios.
The points associated with collections of equivalent ratios lie
on the graph of the same straight line.
Prerequisite Knowledge Vocabulary
Ratios and Rational Numbers is the ninth lesson in a series of
lessons that explore the concepts of ratios and proportional
reasoning. The lesson builds on students’ prior knowledge of
plotting points on a coordinate grid by associating a ratio with an
ordered pair of values. Prior to working on this lesson students
should have completed Ratio Tables, Comparing Ratios, and
Connecting Ratios to Graphs. Students should understand:
• the concept of ordered pairs;
• how to plot points on a coordinate grid;
• how to complete a ratio table;
• the concept of rational numbers.
rational number: any number
that can be written as a fraction
a/b, where a and b are integers
and b ≠ 0.
Lesson Pacing
This lesson should take 50–90 minutes to complete with students, though you may choose to extend, as
needed.
Lesson Materials
Compatible TI Technologies:
TI-Nspire CX Handhelds, TI-Nspire Apps for iPad®, TI-Nspire Software
Ratios and Rational Numbers_Student.pdf
Ratios and Rational Numbers _Student.doc
Ratios and Rational Numbers.tns
Ratios and Rational Numbers_Teacher Notes
To download the TI-Nspire lesson (TNS file) and Student Activity sheet, go to http://education.ti.com/go/buildingconcepts.
Building Concepts: Ratios and Rational Numbers
TEACHER NOTES
©2015 Texas Instruments Incorporated 2 education.ti.com
Class Instruction Key
The following question types are included throughout the lesson to assist you in guiding students in their
exploration of the concept:
Class Discussion: Use these questions to help students communicate their understanding of the
lesson. Encourage students to refer to the TNS lesson as they explain their reasoning. Have students
listen to your instructions. Look for student answers to reflect an understanding of the concept. Listen for
opportunities to address understanding or misconceptions in student answers.
Student Activity: Have students break into small groups and work together to find answers to the
student activity questions. Observe students as they work and guide them in addressing the learning goals
of each lesson. Have students record their answers on their student activity sheet. Once students have
finished, have groups discuss and/or present their findings. The student activity sheet can also be
completed as a larger group activity, depending on the technology available in the classroom.
Additional Discussion: These questions are provided for additional student practice, and to
faciliate a deeper understanding and exploration of the content. Encourage students to explain what they
are doing and to share their reasoning.
Mathematical Background
In this TI-Nspire™ lesson, students compare the graphs of different collections of ratios and begin to make
conjectures about slope and how to compare slopes in terms of differences in rates of change. Building
Concepts: Ratios and Proportional Relationships, lessons 3 through 8 primarily focused on situations
where the initial ratios were whole numbers. In lesson 3, Building a Table of Ratios, students created table
of ratios that involved whole number entries. In this lesson, Ratios and Rational Numbers, students build
tables of ratios using pairs of rational number entries and find associated unit rates. Ratios and Rational
Numbers also builds on the concept developed in lesson 8, Connecting Ratios to Graphs, where the points
associated with collections of equivalent ratios lie on the graph of the same straight line.
Building Concepts: Ratios and Rational Numbers
TEACHER NOTES
©2015 Texas Instruments Incorporated 3 education.ti.com
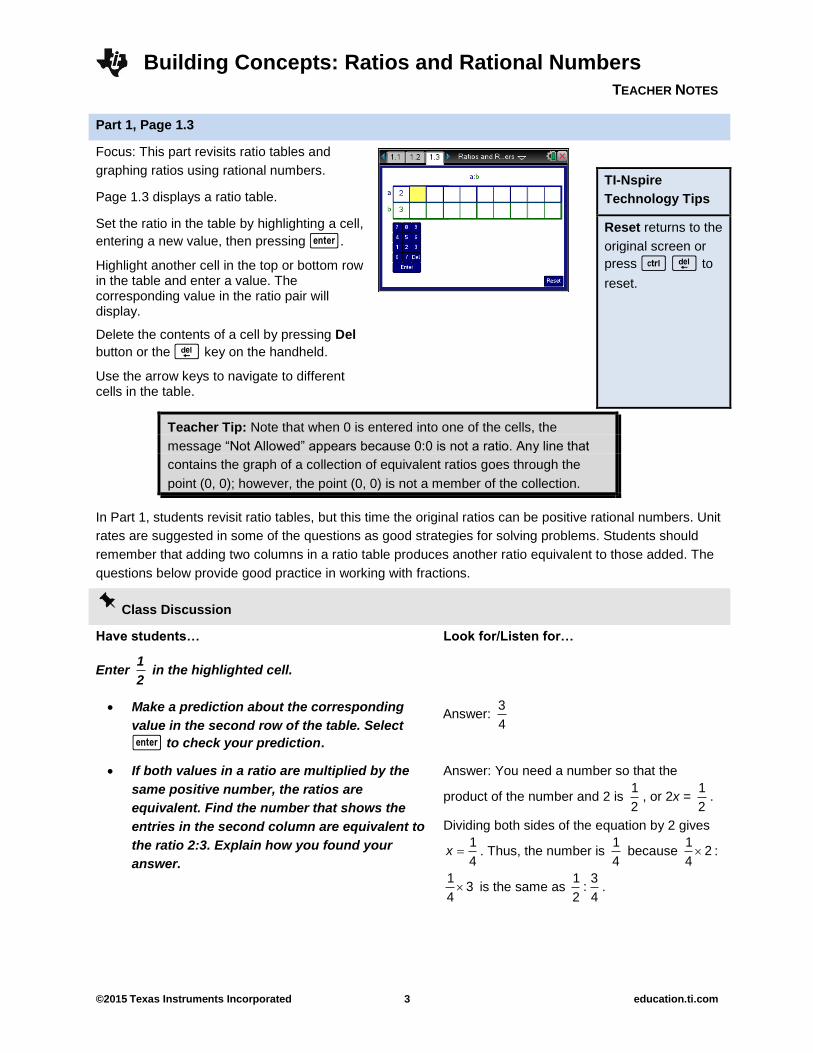
Part 1, Page 1.3
Focus: This part revisits ratio tables and
graphing ratios using rational numbers.
Page 1.3 displays a ratio table.
Set the ratio in the table by highlighting a cell,
entering a new value, then pressing ·.
Highlight another cell in the top or bottom row in the table and enter a value. The corresponding value in the ratio pair will display.
Delete the contents of a cell by pressing Del
button or the . key on the handheld.
Use the arrow keys to navigate to different cells in the table.
TI-Nspire
Technology Tips
Reset returns to the
original screen or
press / . to
reset.
Teacher Tip: Note that when 0 is entered into one of the cells, the
message “Not Allowed” appears because 0:0 is not a ratio. Any line that
contains the graph of a collection of equivalent ratios goes through the
point (0, 0); however, the point (0, 0) is not a member of the collection.
In Part 1, students revisit ratio tables, but this time the original ratios can be positive rational numbers. Unit
rates are suggested in some of the questions as good strategies for solving problems. Students should
remember that adding two columns in a ratio table produces another ratio equivalent to those added. The
questions below provide good practice in working with fractions.
Class Discussion
Have students… Look for/Listen for…
Enter 1
2 in the highlighted cell.
Make a prediction about the corresponding
value in the second row of the table. Select
· to check your prediction.
Answer: 3
4
If both values in a ratio are multiplied by the
same positive number, the ratios are
equivalent. Find the number that shows the
entries in the second column are equivalent to
the ratio 2:3. Explain how you found your
answer.
Answer: You need a number so that the
product of the number and 2 is 1
2, or 2x =
1
2.
Dividing both sides of the equation by 2 gives
1
4x . Thus, the number is
1
4 because
12
4 :
13
4 is the same as
1 3:
2 4.
Building Concepts: Ratios and Rational Numbers
TEACHER NOTES
©2015 Texas Instruments Incorporated 4 education.ti.com
Class Discussion (continued)
Have students… Look for/Listen for…
Enter 1
2 in the second row of the third
column. Explain why the values in the third
column are also equivalent to the ratio 2:3.
Answer: multiplying both values in the ratio by
1
6produces the ratio
1 1:
3 2.
Reset the TNS lesson and use it to help you answer the
following questions.
A recipe calls for 3
4 cup of flour for every
1
2 stick of
butter.
Find a whole number ratio equivalent to the
ratio in the recipe. Explain your reasoning.
Answer: 3:2, 6:4, or any other whole number
multiple of 3 and 2. The denominators of each
fraction in the ratios are 4 and 2, so using a
common denominator as a multiplier for the
values in the ratios will replace the fractions
with whole numbers, i.e., 3
4 34
and
14 2
2 .
How much of each would you need for 6
batches of the recipe? Answer: Multiply both values by 6 to get
9
2 or
14
2 cups of flour to 3 sticks of butter.
What is the unit rate of flour per 1 stick of
butter? Explain how you can find the answer,
and then check using the TNS lesson.
Answer: You could multiply both values by 2
because you know you need a 1 in a unit rate
instead of 1
2, which would make
3
2 to 1.
Therefore, the recipe calls for 1
12
cups of flour
per 1 stick of butter. To see this using the TNS
lesson, enter 1 in the second row of any
column.
Building Concepts: Ratios and Rational Numbers
TEACHER NOTES
©2015 Texas Instruments Incorporated 5 education.ti.com
Class Discussion (continued)
Have students… Look for/Listen for…
TJ walks 1
2 mile every
1
4 hour. Which of the
following strategies can you use to find how many
miles he walks per hour? Explain why each is or is
not a good method. Check your answer using the
TNS lesson.
a. Multiply both values by 4.
b. Divide both values by 1
4.
c. Multiply both values by 2.
d. Divide both values by 2.
e. Reason that if he walked 1
2 mile every
1
4 of
an hour, how far would he go in 1
2 hour,
then in 3
4 hour, and then in 1 hour?
Answer: Either a, b, or e will give you the right
answer, 2 miles per hour. Explanations will
vary.
Student Activity Questions—Activity 1
1. A recipe for salad dressing calls for 2 tablespoons of vinegar and 3 tablespoons of olive oil.
a. Using the ratio 2:3 on page 1.3, enter the numbers 1 to 9 in the top row and find the
corresponding values in the second row. What do the numbers in the column starting with
7 mean in terms of the vinegar and olive oil?
Answer: 7 tablespoons of vinegar for 21
2 or
110
2 tablespoons of olive oil.
b. Jenny claims she can use the columns for 3 tablespoons of vinegar, 1 tablespoon of
vinegar, and 7 tablespoons of vinegar to find the number of tablespoons of olive oil for 11
tablespoons of vinegar. Do you agree with Jenny? Why or why not?
Answer: I agree because if you add equivalent ratios, you get an equivalent ratio. So you could
add the 7 + 1 + 3 for the vinegar and the corresponding values 3 9 21
2 2 2 to get the ratio 11
tablespoons of vinegar to 33
2 or
116
2 tablespoons of olive oil.
Building Concepts: Ratios and Rational Numbers
TEACHER NOTES
©2015 Texas Instruments Incorporated 6 education.ti.com
Student Activity Questions—Activity 1 (continued)
c. Use the table in at least two ways to help you figure out how much olive oil you would need
for 2
53
cup of vinegar. Describe each of the ways.
Answer: You can set the vinegar at 5 and again at 2
3, and then add the corresponding values for
olive oil. 15
12 , which is
17 1
2 or
18
2 tablespoons. Another way would be to write
25
3 as
17
3.
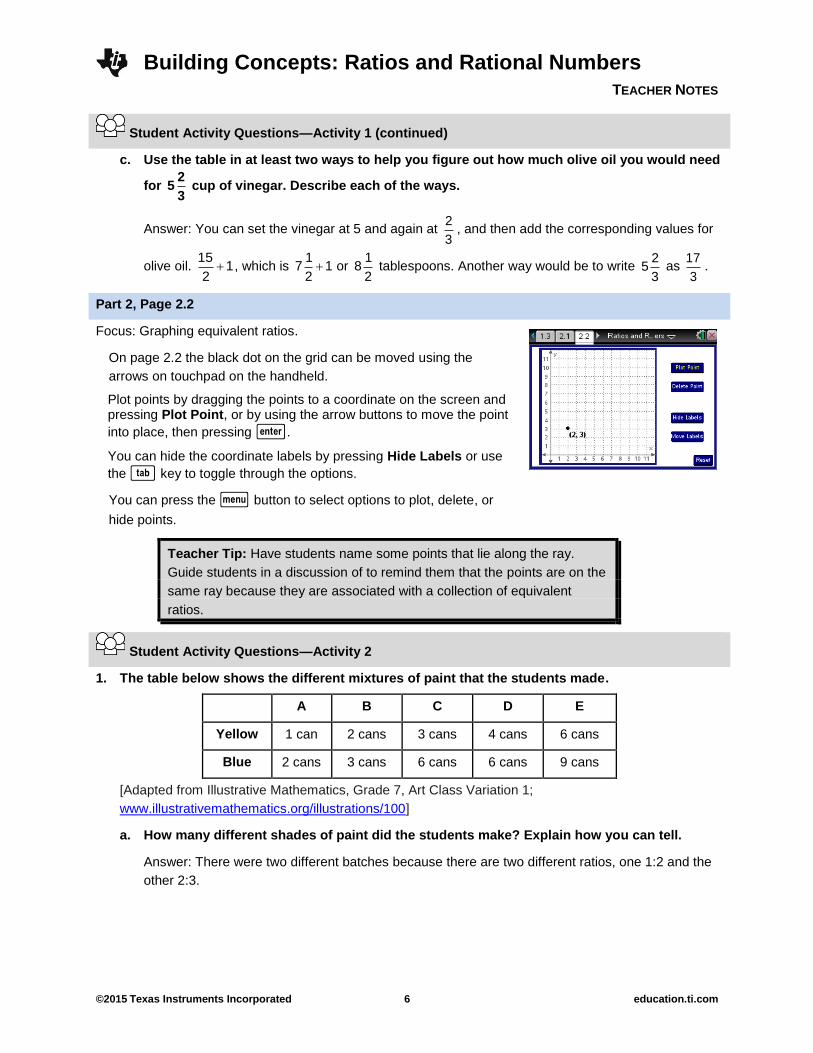
Part 2, Page 2.2
Focus: Graphing equivalent ratios.
On page 2.2 the black dot on the grid can be moved using the
arrows on touchpad on the handheld.
Plot points by dragging the points to a coordinate on the screen and pressing Plot Point, or by using the arrow buttons to move the point
into place, then pressing ·.
You can hide the coordinate labels by pressing Hide Labels or use
the e key to toggle through the options.
You can press the b button to select options to plot, delete, or
hide points.
Teacher Tip: Have students name some points that lie along the ray.
Guide students in a discussion of to remind them that the points are on the
same ray because they are associated with a collection of equivalent
ratios.
Student Activity Questions—Activity 2
1. The table below shows the different mixtures of paint that the students made.
A B C D E
Yellow 1 can 2 cans 3 cans 4 cans 6 cans
Blue 2 cans 3 cans 6 cans 6 cans 9 cans
[Adapted from Illustrative Mathematics, Grade 7, Art Class Variation 1;
www.illustrativemathematics.org/illustrations/100]
a. How many different shades of paint did the students make? Explain how you can tell.
Answer: There were two different batches because there are two different ratios, one 1:2 and the
other 2:3.
Building Concepts: Ratios and Rational Numbers
TEACHER NOTES
©2015 Texas Instruments Incorporated 7 education.ti.com
Student Activity Questions—Activity 2 (continued)
b. Plot the points (yellow, blue) for the mixtures. What do you notice about the points? Select
the points and draw the segment to check your prediction.
Answer: The points lie on two different lines, each going through the origin.
c. Some of the shades of paint were bluer than others. Which mixture(s) were bluer? Show
your work or explain how you know.
Answer: When there were 6 cans of blue paint, one mixture had 3 cans of yellow and the other
had 4 cans of yellow, so the first and third mixtures are bluer.
d. How does the graph help you think about which of the mixtures is the bluer?
Possible answer: The graph of points representing the mixtures equivalent to 1:2 is above the
graph of the points representing the mixtures equivalent to 2:3. You can also see from the graph
that for every 1 can of yellow paint there is about 3
2 can of blue paint for the mixtures equivalent
to 2:3, while for the mixtures equivalent to 1:2, there is 1 can of yellow for 2 cans of blue.
2. Three students are reading the same book for English class. On average, Jenn can read 5
pages in 3 minutes, Silvia can read 11 pages in 4 minutes, and Loren can read 3 pages in 1
32
minutes. Use the TNS lesson to graph (number of pages, minutes).
a. Explain how to use the graph to estimate the time it would take each of the students to read
4 pages.
Answer: You can look at the horizontal axis for 4 pages and draw an imaginary vertical line
through the point (4, 0). Finding the corresponding time for the points (4, t), where t represents
time in minutes, on each of the three lines shows that Silvia takes about 1
12
minutes, Jenn 1
22
minutes, and Loren almost 5 minutes to read 4 pages.
b. Who will read the most number of pages in 15 minutes? How many pages will that person
read? Explain your thinking.
Answer: Using the estimates from part a, Silvia will read the most pages in 15 minutes. Possible
explanation: She reads 4 pages in 1
12
minutes so she reads 8 pages in 3 minutes. So multiplying
by 5, she would read 40 pages in 15 minutes.
Building Concepts: Ratios and Rational Numbers
TEACHER NOTES
©2015 Texas Instruments Incorporated 8 education.ti.com
Student Activity Questions—Activity 2 (continued)
c. How could you use the graph to find how many pages each student could read in 1
minute?
Answer: Think about a horizontal line parallel to the horizontal axis going through time equals 1 on
the vertical axis. The points where this line intersects each of the lines representing the equivalent
ratios pages: time for each student will give an estimate of the number of pages each student can
read in 1 minute. Silvia reads almost 3 pages per minute, Jenn reads a bit more than 1
12
page per
minute (2
13
pages), and Loren reads a little less than 1 page per minute.
3. The science class built some solar-powered robots and raced them in the school parking lot.
The table shows the distance, d, in meters each of three robots traveled after time, t.
Robot A Robot B Robot C
Time (seconds) 1 6 5
Distance (meters) 5 9 2
(Adapted from Illustrative Mathematics, Grade 7, Robot Races,
www.illustrativemathematics.org/illustrations/181)
a. If each robot traveled at a constant speed, find other values for the time and distance for
each robot. Plot the points (time, distance) and display the lines for each robot.
Possible answer: Robot A: 2 seconds for 10 meters; Robot B: 2 seconds for 3 meters; Robot C: 10
seconds for 4 meters.
b. Use the graph to find which of the three robots was moving the fastest. Explain your
thinking.
Possible answer: The graph for Robot A is the steepest. In 2 seconds, Robot A went 10 meters,
Robot B went 3 meters, and Robot C less than 1 meter, so Robot A went the fastest.
c. Suppose there is a Robot D. Find a ratio of time to distance for Robot D that would make
Robot D faster than Robot B but not as fast as Robot A. Explain your reasoning. Then,
check your work using the TNS lesson.
Possible answer: Robot D could go anywhere between 3 and 10 meters in 2 seconds.
Building Concepts: Ratios and Rational Numbers
TEACHER NOTES
©2015 Texas Instruments Incorporated 9 education.ti.com
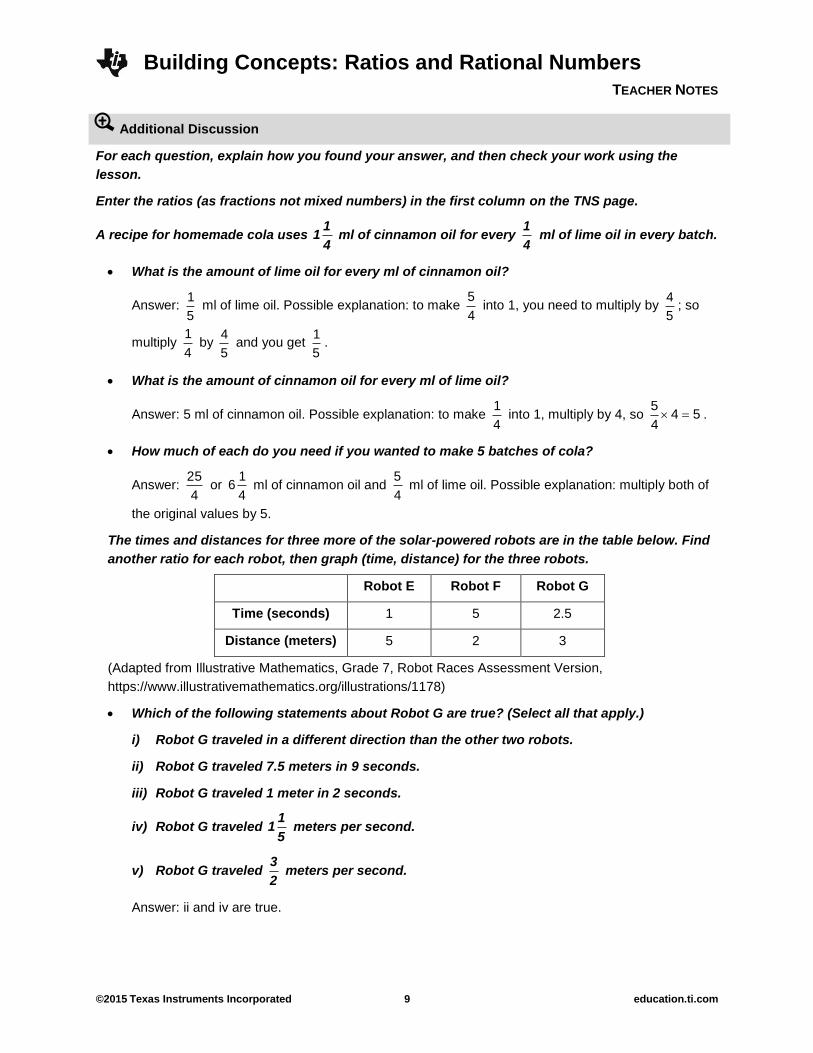
Additional Discussion
For each question, explain how you found your answer, and then check your work using the
lesson.
Enter the ratios (as fractions not mixed numbers) in the first column on the TNS page.
A recipe for homemade cola uses 1
14
ml of cinnamon oil for every 1
4 ml of lime oil in every batch.
What is the amount of lime oil for every ml of cinnamon oil?
Answer: 1
5 ml of lime oil. Possible explanation: to make
5
4 into 1, you need to multiply by
4
5; so
multiply 1
4 by
4
5 and you get
1
5.
What is the amount of cinnamon oil for every ml of lime oil?
Answer: 5 ml of cinnamon oil. Possible explanation: to make 1
4 into 1, multiply by 4, so
54 5
4 .
How much of each do you need if you wanted to make 5 batches of cola?
Answer: 25
4 or
16
4 ml of cinnamon oil and
5
4 ml of lime oil. Possible explanation: multiply both of
the original values by 5.
The times and distances for three more of the solar-powered robots are in the table below. Find
another ratio for each robot, then graph (time, distance) for the three robots.
Robot E Robot F Robot G
Time (seconds) 1 5 2.5
Distance (meters) 5 2 3
(Adapted from Illustrative Mathematics, Grade 7, Robot Races Assessment Version,
https://www.illustrativemathematics.org/illustrations/1178)
Which of the following statements about Robot G are true? (Select all that apply.)
i) Robot G traveled in a different direction than the other two robots.
ii) Robot G traveled 7.5 meters in 9 seconds.
iii) Robot G traveled 1 meter in 2 seconds.
iv) Robot G traveled 1
15
meters per second.
v) Robot G traveled 3
2 meters per second.
Answer: ii and iv are true.
Building Concepts: Ratios and Rational Numbers
TEACHER NOTES
©2015 Texas Instruments Incorporated 10 education.ti.com
Additional Discussion (continued)
How do the speeds of the robots compare?
i) The Robots all traveled at the same speed but left at different times.
ii) Robot E is the fastest and Robot F is the slowest.
iii) There is not enough information given to compare how fast the robots traveled.
Answer: ii is true.
Building Concepts: Ratios and Rational Numbers
TEACHER NOTES
©2015 Texas Instruments Incorporated 11 education.ti.com
Sample Assessment Items
After completing the lesson, students should be able to answer the following types of questions. If
students understand the concepts involved in the lesson, they should be able to answer the following
questions without using the TNS lesson.
1. Mark and Steve bike at the same rate. If it takes Steve 1
4 hour to bike 6 miles, how long will it take
Mark to bike 8 miles? Answer: 1
3 hour
2. The ratio of soy sauce to olive oil in a salad dressing is 1
10 ml to
3
5 ml. How much soy sauce do you
need for 1 ml of olive oil? Answer: 1
6 ml
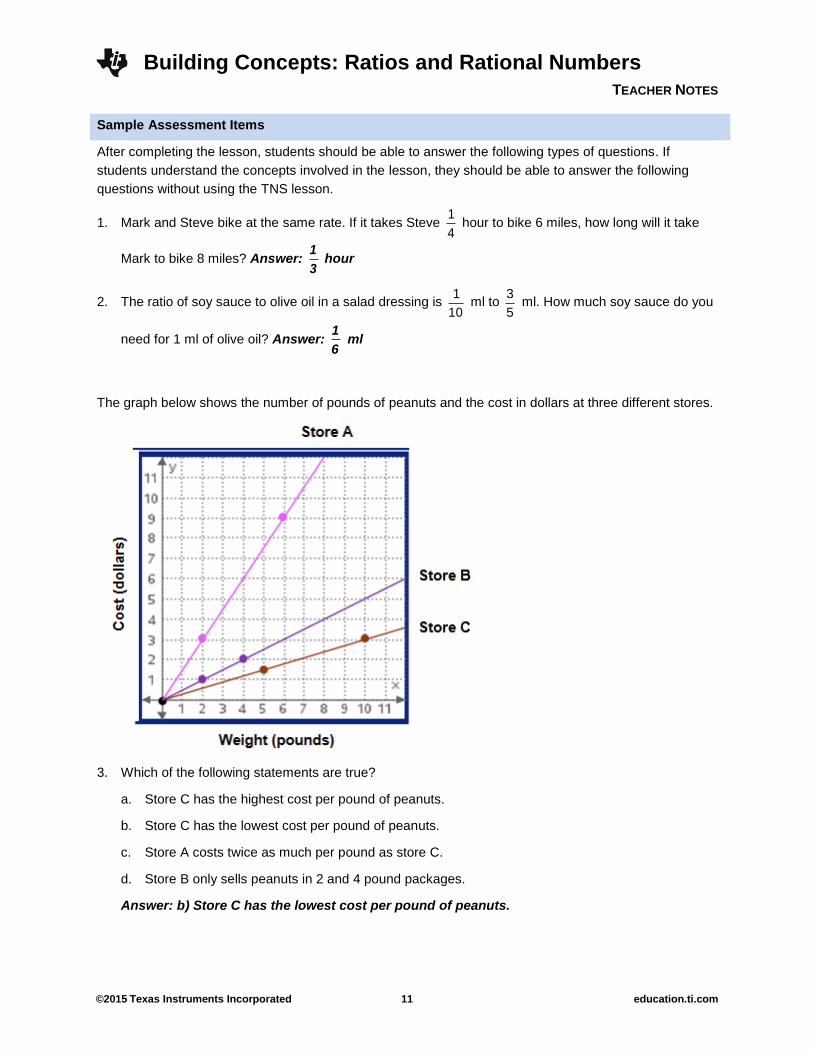
The graph below shows the number of pounds of peanuts and the cost in dollars at three different stores.
3. Which of the following statements are true?
a. Store C has the highest cost per pound of peanuts.
b. Store C has the lowest cost per pound of peanuts.
c. Store A costs twice as much per pound as store C.
d. Store B only sells peanuts in 2 and 4 pound packages.
Answer: b) Store C has the lowest cost per pound of peanuts.
Building Concepts: Ratios and Rational Numbers
TEACHER NOTES
©2015 Texas Instruments Incorporated 12 education.ti.com
Sample Assessment Items (continued)
4. What is the price per pound of peanuts at Store A? Answer: $1.50 per pound.
5. On one trip, Helen rode 1
2 km in the first 2 minutes and then
3
4 km in the next 3 minutes. Which one
of the following statements is correct?
a. Helen’s average speed was greater in the first 2 minutes than in the next 3 minutes.
b. Helen’s average speed was the same in the first 2 minutes and in the next 3 minutes.
c. Helen’s average speed was less in the first 2 minutes than in the next 3 minutes.
d. It is not possible to tell anything about Helen’s average speed from the information given.
(PISA, 2013)
Answer: b) Helen’s average speed was the same in the first 2 minutes and in the next 3
minutes.
Building Concepts: Ratios and Rational Numbers
TEACHER NOTES
©2015 Texas Instruments Incorporated 13 education.ti.com
Student Activity Solutions
In these activities you will work together to interpret ratios as rational numbers and graph equivalent ratios.
After completing each activity, discuss and/or present your findings to the rest of the class.
Activity 1 [Page 1.3]
1. A recipe for salad dressing calls for 2 tablespoons of vinegar and 3 tablespoons of olive oil.
a. Using the ratio 2:3 on page 1.3, enter the numbers 1 to 9 in the top row and find the corresponding
values in the second row. What do the numbers in the column starting with 7 mean in terms of the
vinegar and olive oil?
Answer: 7 tablespoons of vinegar for 21
2 or
110
2 tablespoons of olive oil.
b. Jenny claims she can use the columns for 3 tablespoons of vinegar, 1 tablespoon of vinegar, and
7 tablespoons of vinegar to find the number of tablespoons of olive oil for 11 tablespoons of
vinegar. Do you agree with Jenny? Why or why not?
Answer: I agree because if you add equivalent ratios, you get an equivalent ratio. So you could
add the 7 + 1 + 3 for the vinegar and the corresponding values 3 9 21
2 2 2 to get the ratio 11
tablespoons of vinegar to 33
2 or
116
2 tablespoons of olive oil.
c. Use the table in at least two ways to help you figure out how much olive oil you would need for 2
53
cup of vinegar. Describe each of the ways.
Answer: You can set the vinegar at 5 and again at 2
3, and then add the corresponding values for
olive oil. 15
12
, which is 1
7 12 or
18
2 tablespoons. Another way would be to write
25
3 as
17
3.
Activity 2 [Page 2.2]
1. The table below shows the different mixtures of paint that the students made.
A B C D E
Yellow 1 can 2 cans 3 cans 4 cans 6 cans
Blue 2 cans 3 cans 6 cans 6 cans 9 cans
a. How many different shades of paint did the students make? Explain how you can tell.
Answer: There were two different batches because there are two different ratios, 1:2 and 2:3.
b. Plot the points (yellow, blue) for the mixtures. What do you notice about the points? Select the
points and draw the segment to check your prediction.
Answer: The points lie on two different lines, each going through the origin.
Building Concepts: Ratios and Rational Numbers
TEACHER NOTES
©2015 Texas Instruments Incorporated 14 education.ti.com
c. Some of the shades of paint were bluer than others. Which mixture(s) were bluer? Show your work
or explain how you know.
Answer: When there were 6 cans of blue paint, one mixture had 3 cans of yellow and the other had
4 cans of yellow, so the first and third mixtures are bluer.
d. How does the graph help you think about which of the mixtures is the bluer?
Possible answer: The graph of points representing the mixtures equivalent to 1:2 is above the
graph of the points representing the mixtures equivalent to 2:3. You can also see from the graph
that for every 1 can of yellow paint there is about 3
2 can of blue paint for the mixtures equivalent to
2:3, while for the mixtures equivalent to 1:2, there is 1 can of yellow for 2 cans of blue.
2. Three students are reading the same book for English class. On average, Jenn can read 5 pages in 3
minutes, Silvia can read 11 pages in 4 minutes, and Loren can read 3 pages in 1
32
minutes. Use the
TNS lesson to graph (number of pages, minutes).
a. Explain how to use the graph to estimate the time it would take each of the students to read 4
pages.
Answer: You can look at the horizontal axis for 4 pages and draw an imaginary vertical line
through the point (4, 0). Finding the corresponding time for the points (4, t), where t represents
time in minutes, on each of the three lines shows that Silvia takes about 1
12
minutes, Jenn 1
22
minutes, and Loren almost 5 minutes to read 4 pages.
b. Who will read the most number of pages in 15 minutes? How many pages will that person read?
Explain your thinking.
Answer: Using the estimates from part a, Silvia will read the most pages in 15 minutes. Possible
explanation: She reads 4 pages in 1
12
minutes so she reads 8 pages in 3 minutes. So multiplying
by 5, she would read 40 pages in 15 minutes.
c. How could you use the graph to find how many pages each student could read in 1 minute?
Answer: Think about a horizontal line parallel to the horizontal axis going through time equals 1 on
the vertical axis. The points where this line intersects each of the lines representing the equivalent
ratios pages: time for each student will give an estimate of the number of pages each student can
read in 1 minute. Silvia reads almost 3 pages per minute, Jenn reads a bit more than 1
12
page per
minute (2
13
pages), and Loren reads a little less than 1 page per minute.
Building Concepts: Ratios and Rational Numbers
TEACHER NOTES
©2015 Texas Instruments Incorporated 15 education.ti.com
3. The science class built some solar-powered rockets and raced them in the school parking lot. The
table shows the distance, d, in meters each of three robots traveled after time, t.
Robot A Robot B Robot C
Time (seconds) 1 6 5
Distance (meters) Distance (meters) 5 9 2
a. If each robot traveled at a constant speed, find other values for the time and distance for each
robot. Plot the points (time, distance) and display the lines for each robot.
Possible answer: Robot A: 2 seconds for 10 meters; Robot B: 2 seconds for 3 meters; Robot C: 10
seconds for 4 meters.
b. Use the graph to find which of the three robots was moving the fastest. Explain your thinking.
Possible answer: The graph for Robot A is the steepest. In 2 seconds, Robot A went 10 meters,
Robot B went 3 meters, and Robot C less than 1 meter, so Robot A went the fastest.
c. Suppose there is a Robot D. Find a ratio of time to distance for Robot D that would make Robot D
faster than Robot B but not as fast as Robot A. Explain your reasoning. Then, check your work
using the TNS lesson.
Possible answer: Robot D could go anywhere between 3 and 10 meters in 2 seconds.