Embed Size (px)
Citation preview
ECONOMIC COMMENTARY | PUBLISHED BYRAYMOND JAMES & ASSOCIATES
Scott J. Brown, Ph.D. | (727) 567-2603 | [email protected] DECEMBER 4, 2020 | 3:19 PM EST
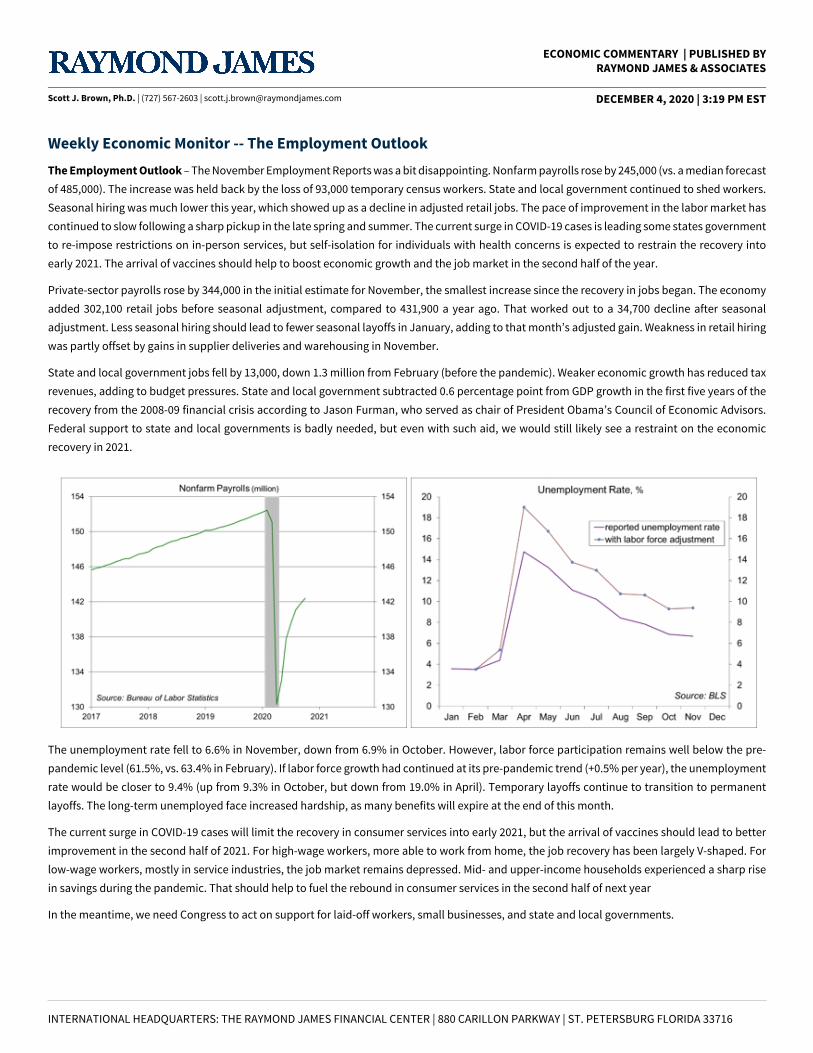
Weekly Economic Monitor -- The Employment OutlookThe Employment Outlook – The November Employment Reports was a bit disappointing. Nonfarm payrolls rose by 245,000 (vs. a median forecastof 485,000). The increase was held back by the loss of 93,000 temporary census workers. State and local government continued to shed workers.Seasonal hiring was much lower this year, which showed up as a decline in adjusted retail jobs. The pace of improvement in the labor market hascontinued to slow following a sharp pickup in the late spring and summer. The current surge in COVID-19 cases is leading some states governmentto re-impose restrictions on in-person services, but self-isolation for individuals with health concerns is expected to restrain the recovery intoearly 2021. The arrival of vaccines should help to boost economic growth and the job market in the second half of the year.
Private-sector payrolls rose by 344,000 in the initial estimate for November, the smallest increase since the recovery in jobs began. The economyadded 302,100 retail jobs before seasonal adjustment, compared to 431,900 a year ago. That worked out to a 34,700 decline after seasonaladjustment. Less seasonal hiring should lead to fewer seasonal layoffs in January, adding to that month’s adjusted gain. Weakness in retail hiringwas partly offset by gains in supplier deliveries and warehousing in November.
State and local government jobs fell by 13,000, down 1.3 million from February (before the pandemic). Weaker economic growth has reduced taxrevenues, adding to budget pressures. State and local government subtracted 0.6 percentage point from GDP growth in the first five years of therecovery from the 2008-09 financial crisis according to Jason Furman, who served as chair of President Obama’s Council of Economic Advisors.Federal support to state and local governments is badly needed, but even with such aid, we would still likely see a restraint on the economicrecovery in 2021.
.
The unemployment rate fell to 6.6% in November, down from 6.9% in October. However, labor force participation remains well below the pre-pandemic level (61.5%, vs. 63.4% in February). If labor force growth had continued at its pre-pandemic trend (+0.5% per year), the unemploymentrate would be closer to 9.4% (up from 9.3% in October, but down from 19.0% in April). Temporary layoffs continue to transition to permanentlayoffs. The long-term unemployed face increased hardship, as many benefits will expire at the end of this month.
The current surge in COVID-19 cases will limit the recovery in consumer services into early 2021, but the arrival of vaccines should lead to betterimprovement in the second half of 2021. For high-wage workers, more able to work from home, the job recovery has been largely V-shaped. Forlow-wage workers, mostly in service industries, the job market remains depressed. Mid- and upper-income households experienced a sharp risein savings during the pandemic. That should help to fuel the rebound in consumer services in the second half of next year
In the meantime, we need Congress to act on support for laid-off workers, small businesses, and state and local governments.
INTERNATIONAL HEADQUARTERS: THE RAYMOND JAMES FINANCIAL CENTER | 880 CARILLON PARKWAY | ST. PETERSBURG FLORIDA 33716
Recent Economic Data
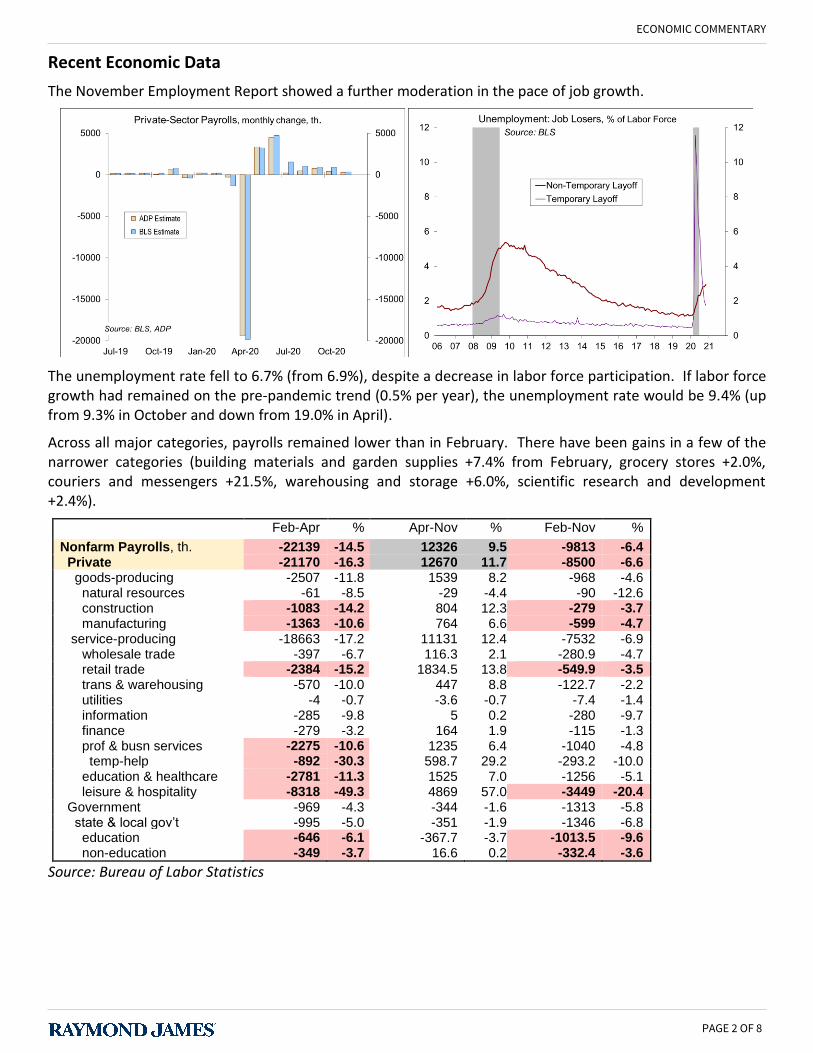
The November Employment Report showed a further moderation in the pace of job growth.
The unemployment rate fell to 6.7% (from 6.9%), despite a decrease in labor force participation. If labor force growth had remained on the pre-pandemic trend (0.5% per year), the unemployment rate would be 9.4% (up from 9.3% in October and down from 19.0% in April).
Across all major categories, payrolls remained lower than in February. There have been gains in a few of the narrower categories (building materials and garden supplies +7.4% from February, grocery stores +2.0%, couriers and messengers +21.5%, warehousing and storage +6.0%, scientific research and development +2.4%).
Feb-Apr % Apr-Nov % Feb-Nov %
Nonfarm Payrolls, th. -22139 -14.5 12326 9.5 -9813 -6.4 Private -21170 -16.3 12670 11.7 -8500 -6.6 goods-producing -2507 -11.8 1539 8.2 -968 -4.6 natural resources -61 -8.5 -29 -4.4 -90 -12.6 construction -1083 -14.2 804 12.3 -279 -3.7 manufacturing -1363 -10.6 764 6.6 -599 -4.7 service-producing -18663 -17.2 11131 12.4 -7532 -6.9 wholesale trade -397 -6.7 116.3 2.1 -280.9 -4.7 retail trade -2384 -15.2 1834.5 13.8 -549.9 -3.5 trans & warehousing -570 -10.0 447 8.8 -122.7 -2.2 utilities -4 -0.7 -3.6 -0.7 -7.4 -1.4 information -285 -9.8 5 0.2 -280 -9.7 finance -279 -3.2 164 1.9 -115 -1.3 prof & busn services -2275 -10.6 1235 6.4 -1040 -4.8 temp-help -892 -30.3 598.7 29.2 -293.2 -10.0 education & healthcare -2781 -11.3 1525 7.0 -1256 -5.1 leisure & hospitality -8318 -49.3 4869 57.0 -3449 -20.4 Government -969 -4.3 -344 -1.6 -1313 -5.8 state & local gov’t -995 -5.0 -351 -1.9 -1346 -6.8 education -646 -6.1 -367.7 -3.7 -1013.5 -9.6 non-education -349 -3.7 16.6 0.2 -332.4 -3.6
Source: Bureau of Labor Statistics
PAGE 2 OF 8
ECONOMIC COMMENTARY
The Fed Beige Book described the economic expansion as “modest to moderate in most areas of the country. Banking contacts reported some deterioration of loan portfolios, particularly for commercial lending into the retail and leisure and hospitality sectors. An increase in delinquencies in 2021 is more widely anticipated. Employment rose, “but for most, the pace was slow, at best, and the recovery remained incomplete.” Firms that were hiring continued to report difficulties in attracting and retaining workers.
The ISM Manufacturing Index fell to 57.5 in November, from 59.3 in October, reflecting continued strength in new orders and production. The employment gauge fell below the breakeven, as firms reported COVID-19 disruptions and difficulties in finding skilled labor. The ISM Non-Manufacturing Index edged down to 55.9 in November, from 56.6 in October. Business activity and new orders remained strong, but a bit slower. Both reports noted pandemic-related increases in input costs and concerns about the surge in COVID-19 cases.
Factory orders rose 1.0% in October. Shipments also rose 1.0%, with nondefense capital goods ex-aircraft up 2.3%, implying a strong start for business fixed investment in 4Q20.
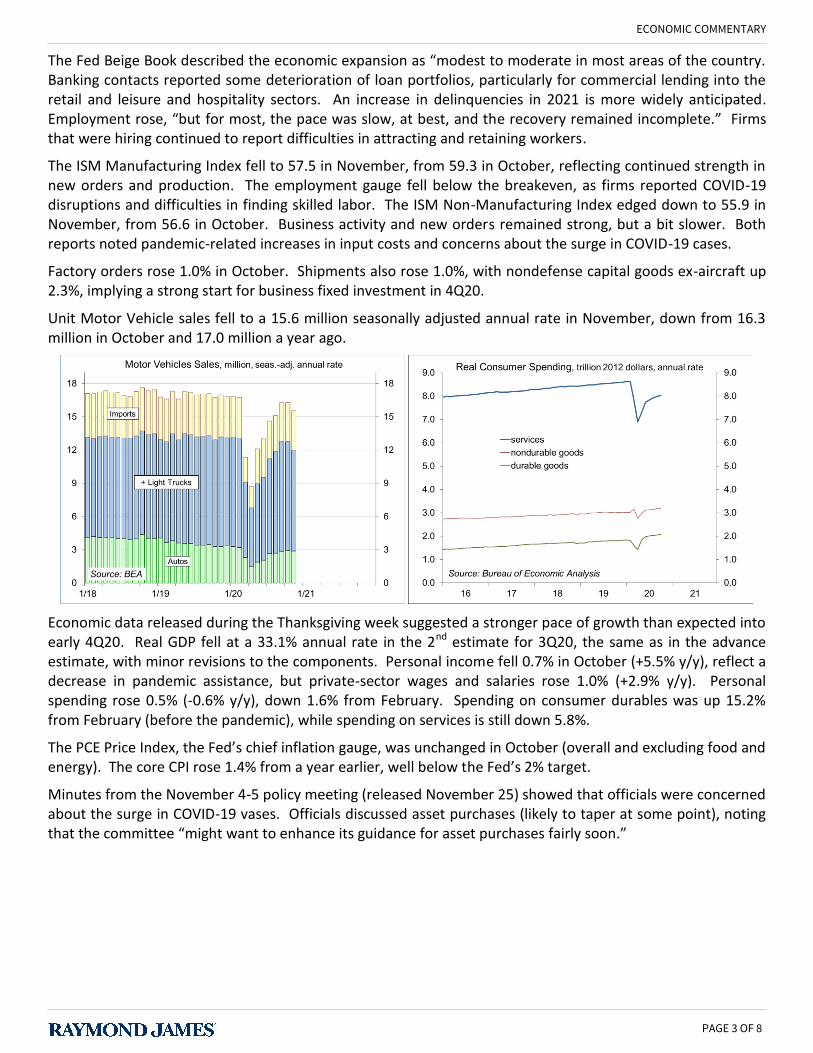
Unit Motor Vehicle sales fell to a 15.6 million seasonally adjusted annual rate in November, down from 16.3 million in October and 17.0 million a year ago.
Economic data released during the Thanksgiving week suggested a stronger pace of growth than expected into early 4Q20. Real GDP fell at a 33.1% annual rate in the 2nd estimate for 3Q20, the same as in the advance estimate, with minor revisions to the components. Personal income fell 0.7% in October (+5.5% y/y), reflect a decrease in pandemic assistance, but private-sector wages and salaries rose 1.0% (+2.9% y/y). Personal spending rose 0.5% (-0.6% y/y), down 1.6% from February. Spending on consumer durables was up 15.2% from February (before the pandemic), while spending on services is still down 5.8%.
The PCE Price Index, the Fed’s chief inflation gauge, was unchanged in October (overall and excluding food and energy). The core CPI rose 1.4% from a year earlier, well below the Fed’s 2% target.
Minutes from the November 4-5 policy meeting (released November 25) showed that officials were concerned about the surge in COVID-19 vases. Officials discussed asset purchases (likely to taper at some point), noting that the committee “might want to enhance its guidance for asset purchases fairly soon.”
PAGE 3 OF 8
ECONOMIC COMMENTARY

Gauging the Recovery
The number of new daily COVID-19 cases has continued to surge (the Thanksgiving dip reflected reporting issues). Increased social distancing, whether state mandated or voluntary, should slow the pace (and the economy), but we are likely to see family get-togethers for Thanksgiving add to the problem the near term.
The New York Fed’s Weekly Economic Index edged up to -2.31% for the week of November 28, up from -2.87% a week earlier (revised from -2.68%) and a low of -11.45% at the end of April, consistent with a moderate pace of growth in the near term. The WEI is scaled to four-quarter GDP growth (for example, if the WEI reads -2% and the current level of the WEI persists for an entire quarter, we would expect, on average, GDP that quarter to be 2% lower than a year previously). Note that the weekly figures are subject to revision.
Jobless claims, a leading economic indicator, fell to 712,000 in the week ending November 28, down from the previous week’s total of 787,000. Figures tend to be choppy around Thanksgiving. The four-week average was 739,500 – still elevated. The General Accounting Office noted that the claims figures are exaggerated due to multiple fillings. Continuing claims (for regular state unemployment insurance programs) fell by 569,000 (week ending November 21) to 5,520,000.
The University of Michigan’s Consumer Sentiment Index fell to 76.9 in the full-month assessment for November (the survey covered October 30 to November 21), vs. 77.0 at mid-month and 81.8 in October. The report noted that the November data were less optimistic than last month due to the resurgence in COVID-19 infections and deaths as well as partisan shifts due to the outcome of the presidential election.
PAGE 4 OF 8
ECONOMIC COMMENTARY
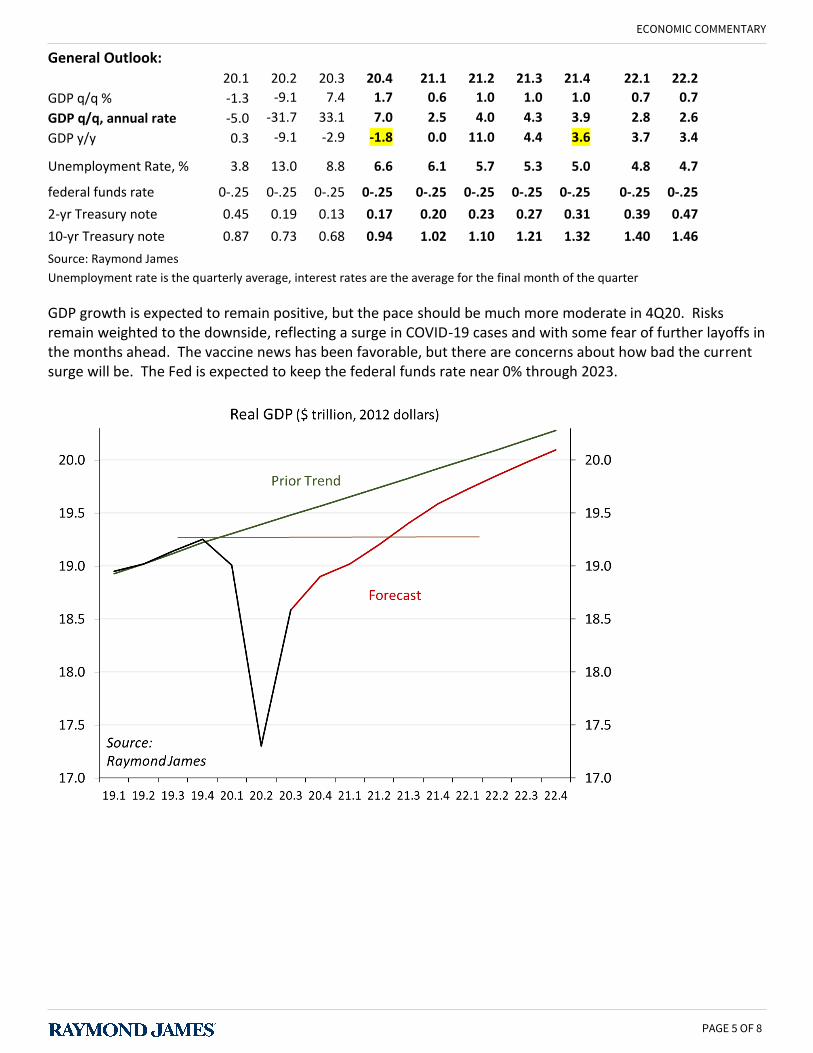
General Outlook:
20.1 20.2 20.3 20.4 21.1 21.2 21.3 21.4 22.1 22.2
GDP q/q % -1.3 -9.1 7.4 1.7 0.6 1.0 1.0 1.0 0.7 0.7
GDP q/q, annual rate -5.0 -31.7 33.1 7.0 2.5 4.0 4.3 3.9 2.8 2.6
GDP y/y 0.3 -9.1 -2.9 -1.8 0.0 11.0 4.4 3.6 3.7 3.4
Unemployment Rate, % 3.8 13.0 8.8 6.6 6.1 5.7 5.3 5.0 4.8 4.7
federal funds rate 0-.25 0-.25 0-.25 0-.25 0-.25 0-.25 0-.25 0-.25 0-.25 0-.25
2-yr Treasury note 0.45 0.19 0.13 0.17 0.20 0.23 0.27 0.31 0.39 0.47
10-yr Treasury note 0.87 0.73 0.68 0.94 1.02 1.10 1.21 1.32 1.40 1.46
Source: Raymond James
Unemployment rate is the quarterly average, interest rates are the average for the final month of the quarter
GDP growth is expected to remain positive, but the pace should be much more moderate in 4Q20. Risks remain weighted to the downside, reflecting a surge in COVID-19 cases and with some fear of further layoffs in the months ahead. The vaccine news has been favorable, but there are concerns about how bad the current surge will be. The Fed is expected to keep the federal funds rate near 0% through 2023.
PAGE 5 OF 8
ECONOMIC COMMENTARY

This Week – The economic calendar thins and investors will be more focused on COVID-19 and the prospects for federal fiscal support. The Consumer Price Index is expected to reflect a dip in gasoline prices (which normally rise in November). Core inflation should be moderate. Virus-related supply chain issues have added to input costs, but there appears to be little pass-through to the consumer. The majority of the CPI is services, which remain under pressure. Home prices are rising, but the Bureau of Labor Statistics measures the service not the asset value. That means the equivalent rent, which is rising more slowly in the pandemic. Pipeline pressures may be more noticeable in the PPI report. (M20-3357644)
This Week: forecast last last –1 comments
Monday 12/07 no significant economic data my dad was on the USS Maryland in ‘41
Tuesday 12/08 6:00 Small Business Optimism Nov NF 104.0 104.0 likely to soften 8:30 NF Productivity (revised) 3Q20 +5.0% +10.6% -0.3% +4.9% in the preliminary estimate Unit Labor Costs -8.8% +8.5% +9.6% -8.9% in the preliminary estimate
Wednesday 12/090
10:00 JOLTS data Oct improving before COVID-19 surge
Thursday 12/10 8:30 Jobless Claims, th. 12/05 730 712 787 noisy before and after holidays 8:30 Consumer Price Index Nov +0.1% 0.0% +0.2% lower gasoline prices year-over-year +1.1% +1.2% +1.4% still mild ex-food & energy +0.2% 0.0% +0.2% mixed components year-over-year +1.6% +1.6% +1.7% still low 8:30 Real Hourly Earnings Nov +0.2% +0.1% -0.3% nominal earnings rose 0.3% year-over-year +3.2% +3.2% +3.3% distorted by compositional changes
Friday 12/11 8:30 Producer Price Index Nov +0.2% +0.3% +0.4% moderate ex-food, energy, trade serv +0.2% +0.2% +0.4% mixed pipeline pressures 10:00 UM Consumer Sentiment m-Dec 74.8 76.9 77.0 seen lower on COVID-19 news
Next Week:
Monday 12/14 no significant economic data
Tuesday 12/15 8:30 Import Prices Nov NF -0.1% +0.2% no significant pressure ex- food & fuels NF +0.0% +0.6% little inflation in finished goods 9:15 Industrial Production Nov +0.3% +1.1% -0.4% a lackluster gain Manufacturing Output +0.2% +1.0% 0.0% aggregate hours were flat Capacity Utilization 72.9% 72.8% 72.0% roughly steady
Wednesday 12/16 8:30 Retail Sales Nov +0.2% +0.3% +1.6% unit autos sales fell ex-autos +0.3% +0.2% +1.2% lower gasoline prices core sales +0.4% +0.3% +1.3% moderate otherwise 10:00 Business Inventories Oct +0.6%
7% +0.7% +0.3% seen higher in 4Q20
10:00 Homebuilder Sentiment Dec 88 90 85 likely to remain elevated 2:00 FOMC Policy Decision rates steady, too soon for QE change 2:00 Summary of Econ Proj includes a new dot plot 2:30 Powell Press Conference putting the onus on fiscal policy
Thursday 12/17 8:30 Jobless Claims, th. 12/12 720 730 712 the holiday adds uncertainty 8:30 Building Permits, th. Nov 1550 1544 1545 likely to remain strong % change +0.4 -0.1 +4.7 but starts figures are erratic Housing Permits 1520 1530 1459 still strong % change -0.7 +4.9 +6.3 healthy demand
Friday 12/18 8:30 Current Account, $bln 3Q20 -199.9 -170.5 -111.5 wider 10:00 Leading Econ Indicators Nov +0.6% +0.7% +0.7% most components were positive
Coming Events and Data Releases
December 22 CB Consumer Confidence (December)
December 23 Personal Income and Spending (November)
December 24 Durable Goods Orders (November)
December 25 Christmas Holiday (markets closed)
January 1 New Year’s Day (markets closed)
January 5 Georgia runoff elections
January 8 Employment Report (December)
January 18 MLK Day (markets closed)
PAGE 6 OF 8
ECONOMIC COMMENTARY

IMPORTANT INVESTOR DISCLOSURESThis material is being provided for informational purposes only. Expressions of opinion are provided as of the date above and subject to change.Any information should not be deemed a recommendation to buy, hold or sell any security. Certain information has been obtained from third-partysources we consider reliable, but we do not guarantee that such information is accurate or complete. This report is not a complete description ofthe securities, markets, or developments referred to in this material and does not include all available data necessary for making an investmentdecision. Prior to making an investment decision, please consult with your financial advisor about your individual situation. Investing involvesrisk and you may incur a profit or loss regardless of strategy selected. There is no guarantee that the statements, opinions or forecasts providedherein will prove to be correct.
Sector investments are companies engaged in business related to a specific sector. They are subject to fierce competition and their productsand services may be subject to rapid obsolescence. There are additional risks associated with investing in an individual sector, including limiteddiversification.
Commodities and currencies investing are generally considered speculative because of the significant potential for investment loss. Their marketsare likely to be volatile and there may be sharp price fluctuations even during periods when prices overall are rising.
Links to third-party websites are being provided for informational purposes only. Raymond James is not affiliated with and does not endorse,authorize, or sponsor any of the listed websites or their respective sponsors. Raymond James is not responsible for the content of any third-partywebsite or the collection or use of information regarding any websites users and/or members.
This report is provided to clients of Raymond James only for your personal, noncommercial use. Except as expressly authorized by RaymondJames, you may not copy, reproduce, transmit, sell, display, distribute, publish, broadcast, circulate, modify, disseminate, or commercially exploitthe information contained in this report, in printed, electronic, or any other form, in any manner, without the prior express written consent ofRaymond James. You also agree not to use the information provided in this report for any unlawful purpose. This report and its contents are theproperty of Raymond James and are protected by applicable copyright, trade secret, or other intellectual property laws (of the United States andother countries). United States law, 17 U.S.C. Sec. 501 et seq, provides for civil and criminal penalties for copyright infringement. No copyrightclaimed in incorporated U.S. government works.
Index Definitions
The S&P 500 is an unmanaged index of 500 widely held stocks that is generally considered representative of the U.S. stock market.
The Dow Jones Industrial Average (DJIA) is a price-weighted average of 30 significant stocks traded on the New York Stock Exchange (NYSE)and the NASDAQ.
The NASDAQ Composite is a stock market index of the common stocks and similar securities listed on the NASDAQ stock market.
The MSCI World All Cap Index captures large, mid, small and micro-cap representation across 23 Developed Markets (DM) countries. With 11,732constituents, the index is comprehensive, covering approximately 99% of the free float-adjusted market capitalization in each country.
The MSCI EAFE (Europe, Australasia, and Far East) is a free float-adjusted market capitalization index that is designed to measure developedmarket equity performance, excluding the United States & Canada. The EAFE consists of the country indices of 21 developed nations.
The MSCI Emerging Markets Index is designed to measure equity market performance in 23 emerging market countries. The index's three largestindustries are materials, energy, and banks.
The Russell 2000 index is an index measuring the performance of approximately 2,000 smallest-cap American companies in the Russell 3000Index, which is made up of 3,000 of the largest U.S. stocks.
The NYSE Alerian MLP is the leading gauge of energy infrastructure Master Limited Partnerships (MLPs). The capped, float-adjusted,capitalization-weighted index, whose constituents earn the majority of their cash flow from midstream activities involving energy commodities,is disseminated real-time on a price-return basis (AMZ) and on a total-return basis (AMZX).
The Barclays Intermediate Government/Credit Bond index measures the performance of U.S. Dollar denominated U.S. Treasuries, government-related and investment grade U.S. corporate securities that have a remaining maturity of greater than one year and less than ten years.
The Euro Stoxx 50 Index is a market capitalization weighted stock index of 50 large, blue-chip European companies operating within Eurozonenations. Components are selected from the Euro STOXX Index which includes large-, mid- and small-cap stocks in the Eurozone.
The China CSI 300 is a capitalization-weighted stock market index designed to replicate the performance of top 300 stocks traded in the Shanghaiand Shenzhen stock exchanges. It had a sub-indexes CSI 100 Index and CSI 200 Index.
The S&P 500 Futures is a capitalization-weighted index of 500 stocks. The index is designed to measure performance of the broad domesticeconomy through changes in the aggregate market value of 500 stocks representing all major industries.
The DJIA Futures is a stock market index futures contract traded on the Chicago Mercantile Exchange`s Globex electronic trading platform. Dow
PAGE 7 OF 8
ECONOMIC COMMENTARY
Futures is based off the Dow 30 stock index.
The Nasdaq 100 Futures is a modified capitalization-weighted index of the 100 largest and most active non-financial domestic and internationalcompanies listed on the NASDAQ.
Europe: DAX (Deutscher Aktienindex (German stock index)) is a blue chip stock market index consisting of the 30 major German companies tradingon the Frankfurt Stock Exchange.
Asia: Nikkei is short for Japan's Nikkei 225 Stock Average, the leading and most-respected index of Japanese stocks. It is a price-weighted indexcomposed of Japan's top 225 blue-chip companies traded on the Tokyo Stock Exchange.
Keep in mind that individuals cannot invest directly in any index, and index performance does not include transaction costs or other fees, whichwill affect actual investment performance. Individual investor's results will vary. Past performance does not guarantee future results. Futureinvestment performance cannot be guaranteed, investment yields will fluctuate with market conditions.
International Disclosures
For�clients�in�the�United�Kingdom:
For clients of Raymond James Financial International Limited (RJFI): This document and any investment to which this document relates isintended for the sole use of the persons to whom it is addressed, being persons who are Eligible Counterparties or Professional Clients as describedin the FCA rules or persons described in Articles 19(5) (Investment professionals) or 49(2) (high net worth companies, unincorporated associations,etc.) of the Financial Services and Markets Act 2000 (Financial Promotion) Order 2005 (as amended)or any other person to whom this promotionmay lawfully be directed. It is not intended to be distributed or passed on, directly or indirectly, to any other class of persons and may not be reliedupon by such persons and is, therefore, not intended for private individuals or those who would be classified as Retail Clients.
For clients of Raymond James Investment Services, Ltd.: This document is for the use of professional investment advisers and managers andis not intended for use by clients.
For�clients�in�France:
This document and any investment to which this document relates is intended for the sole use of the persons to whom it is addressed, beingpersons who are Eligible Counterparties or Professional Clients as described in "Code Monetaire et Financier" and Reglement General de l'Autoritedes marches Financiers. It is not intended to be distributed or passed on, directly or indirectly, to any other class of persons and may not be reliedupon by such persons and is, therefore, not intended for private individuals or those who would be classified as Retail Clients.
For clients of Raymond James Euro Equities: Raymond James Euro Equities is authorised and regulated by the Autorite de Controle Prudentielet de Resolution and the Autorite des Marches Financiers.
For�institutional�clients�in�the�European�Economic�rea�(EE�)�outside�of�the�United�Kingdom:
This document (and any attachments or exhibits hereto) is intended only for EEA institutional clients or others to whom it may lawfully besubmitted.
For�Canadian�clients:
This document is not prepared subject to Canadian disclosure requirements, unless a Canadian has contributed to the content of the document.In the case where there is Canadian contribution, the document meets all applicable IIROC disclosure requirements.
Broker Dealer Disclosures
Securities are: NOT Deposits • NOT Insured by FDIC or any other government agency • NOT GUARANTEED by the bank • Subject to risk and maylose value
Raymond James & Associates, Inc., member New York Stock Exchange/SIPC. Raymond James Financial Services, Inc., member FINRA/SIPC.Raymond James® is a registered trademark of Raymond James Financial, Inc.
PAGE 8 OF 8
ECONOMIC COMMENTARY