Embed Size (px)
Citation preview
ERC Equipoise Ltd 6th Floor Stephenson House 2 Cherry Orchard Road Croydon CR0 6BA Tel +44 (0)20 8256 1150 Registered England No 3807074 Registered Office Eastbourne House 2 Saxbys Lane Lingfield Surrey RH7 6DN
25th June 2013
The Directors African Petroleum Corporation Ltd Stratton House 5 Stratton Street London W1J 8LA
Dear Sirs
Re Review of Exploration Acreage African Petroleum Corporation Ltd
Introduction
In accordance with your instructions ERC Equipoise Ltd (ldquoERCErdquo) has reviewed the prospectivity of the petroleum exploration interests of African Petroleum Corporation Limited and its associated companies (ldquoAPCLrdquo) in Blocks 8 amp 9 offshore Liberia Blocks A1 and A4 offshore Gambia Licences CI-509 and CI-513 offshore Cote drsquoIvoire and Block SL-03 offshore Sierra Leone and we have prepared estimates as of todayrsquos date of the prospective petroleum resources associated with the following high-graded prospects Barbet Sunbird Lovebird Wildbird and Night Heron in Liberia the Alhamdulilah prospect and Prospect M in the Gambia the Ayame Ayame West Sassandra Leraba and Cavella prospects in Cote drsquoIvoire and the Altair prospect in Sierra Leone We have used information and data available up to 31st May 2013
For the prospective resources we have included an assessment of the geological chance of success This dimension of risk does not incorporate the consideration of economic uncertainty and commerciality In presenting prospective resources ERCE assumes that the Operator of licences in which such prospective resources exist will behave in a competent manner and execute any work programme designed to test such prospective resources in a timely and safe manner during the term specified for the licence
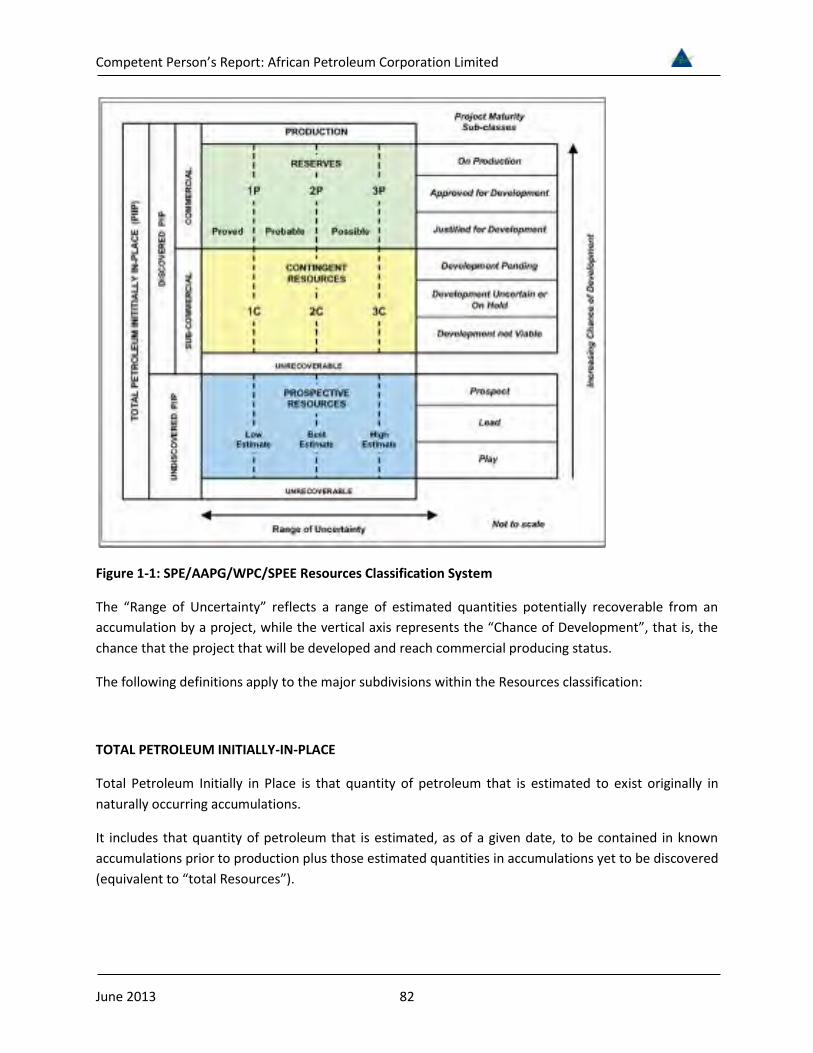
We have carried out this work using the March 2007 SPEWPCAAPGSPEE Petroleum Resources Management System (PRMS) as the standard for classification and reporting A summary of the PRMS is found in Appendix 1
This letter is for the sole use of APCL and financial advisors It may not be disclosed to any other person or used for any other purpose without the prior written approval of a director of ldquoERCErdquo
Competent Personrsquos Report African Petroleum Corporation Ltd
The Licences
APCL holds a 100 per cent contractor interest in a Production Sharing Contract (ldquoPSCrdquo) covering Blocks 8 amp 9 offshore Liberia Our independent Best Estimate (P50) of prospective oil resources for the five prospects we have assessed (Table 1) in aggregate is 1875 MMstb unrisked net attributable to APCL is 1815 MMstb unrisked and 289 MMstb risked Our independent Mean estimate of prospective oil resources for the five prospects in aggregate is 3155 MMstb unrisked net is 3046 MMstb unrisked and 473 MMstb net risked
Both blocks are in their second exploration period which began on 12th June 2012 and lasts for two years Commitments during the second phase are a single exploration well (to a minimum depth of 2000 meters) within Block 9 and two exploration wells (to a minimum depth of 2000 meters) in Block 8 as a well commitment from the first exploration phase has been carried into the second phase in Block 8 The minimum spend for each block in the second exploration period is US$ 10 MM The drilling of Well Bee Eater-1 has fulfilled the commitments in the second exploration period in Block 9
For each block there is one further optional exploration period of two years that can be entered into with a further well (to a minimum of 2000 metres) being required in each block in each period At the end of the third period all areas not retained for appraisal and development are to be relinquished There are also provisions for an appraisal period and an exploitation period of 25 years (with an additional term of 10 years if necessary) for each development area
APCL holds a 60 contractor interest in PSCs covering Blocks A1 and A4 offshore Gambia with Buried Hill Gambia BV holding the remaining 40 The contracts were signed on 8th September 2006 with an effective date of 31st December 2007 and following two extensions they are still currently in the first exploration period which runs through to 31 December 2013 Our independent Best Estimate (P50) of prospective oil resources for the Alhamdulilah prospect and Prospect M (Table 2) in aggregate is 459 MMstb unrisked net attributable to APCL is 275 MMstb unrisked and 411 MMstb net risked Our independent Mean estimate of prospective oil resources for the prospect is 593 MMstb unrisked net is 356 MMstb unrisked and 526 MMstb net risked
The commitment during the first period comprises 1000 km2 of 3D seismic data in Block A1 750 km2 of 3D seismic data in Block A4 and one well which may be drilled in either block The seismic commitment has already been met
APCL holds a 90 contractor interest in PSCs covering Blocks CI-509 and CI-513 offshore Cote DrsquoIvoire Petroci has the remaining 10 as a carried interest The licences were awarded on 16th March 2012 and 19th December 2011 for CI-509 and CI-513 respectively For CI-509 the licence consists of three terms of three three and two years respectively with a 25 relinquishment after each of the first and second terms For CI-513 the licence consists of three exploration terms of three two and two years respectively with a 25 relinquishment after each of the first and second terms Our independent Best Estimate (P50) of prospective oil resources for the five reviewed prospects (Table 3) in aggregate is 999 MMstb unrisked net attributable to APCL is 863 MMstb unrisked and 1164 MMstb net risked Our
Competent Personrsquos Report African Petroleum Corporation Ltd
independent Mean estimate of prospective oil resources for the prospects is 1808 MMstb unrisked net is 1560 MMstb unrisked and 2094 MMstb net risked
The commitment during the first period of licence CI-509 is to purchase existing 2D seismic acquire 1091 km2 3D seismic data perform geological and geophysical studies and drill one exploration well to a depth of 100 m into the Albian with a minimum financial commitment of US $60 MM The seismic commitment has already been met The commitment during the first period of licence CI-513 is to purchase existing 2D seismic data acquire 1446 km2 3D data perform geological and geophysical studies and drill one exploration well to a depth of 100 m into the Albian with a minimum financial commitment of US $60 MM The seismic commitment has already been met
APCL holds a 100 contractor interest in a PSC covering Block SL-03 offshore Sierra Leone through its wholly owned subsidiary European Hydrocarbons Ltd The licence was ratified by the government on 22nd February 2011 The licence has a duration of thirty years the first seven of which are termed the exploration period which is further subdivided into an initial period of three years followed by two extension periods of two years each The licence is currently in the initial exploration period
Work commitments during the initial period for Block SL-03 are to purchase and interpret the existing 2D seismic data over the licence and acquire a minimum of 500 km2 of 3D seismic data APCL has purchased the 2D seismic data and has acquired 2535 km2 of multi-client 3D seismic data over Block SL-03 fulfilling the seismic commitment for the initial phase The first and second extension periods require the drilling of one exploration well to a minimum depth (below mud line) of 1300 m or a minimum equivalent investment of US$ 30 MM Entry to the first extension period requires a 50 relinquishment of the licence area and a further 25 of the initial licence area must be relinquished on entry to the second extension period The area of the licence is 3860 km2 and water depth varies from 100 m to over 4000 m with the south-western half of the block being at water depths greater than 3000 m
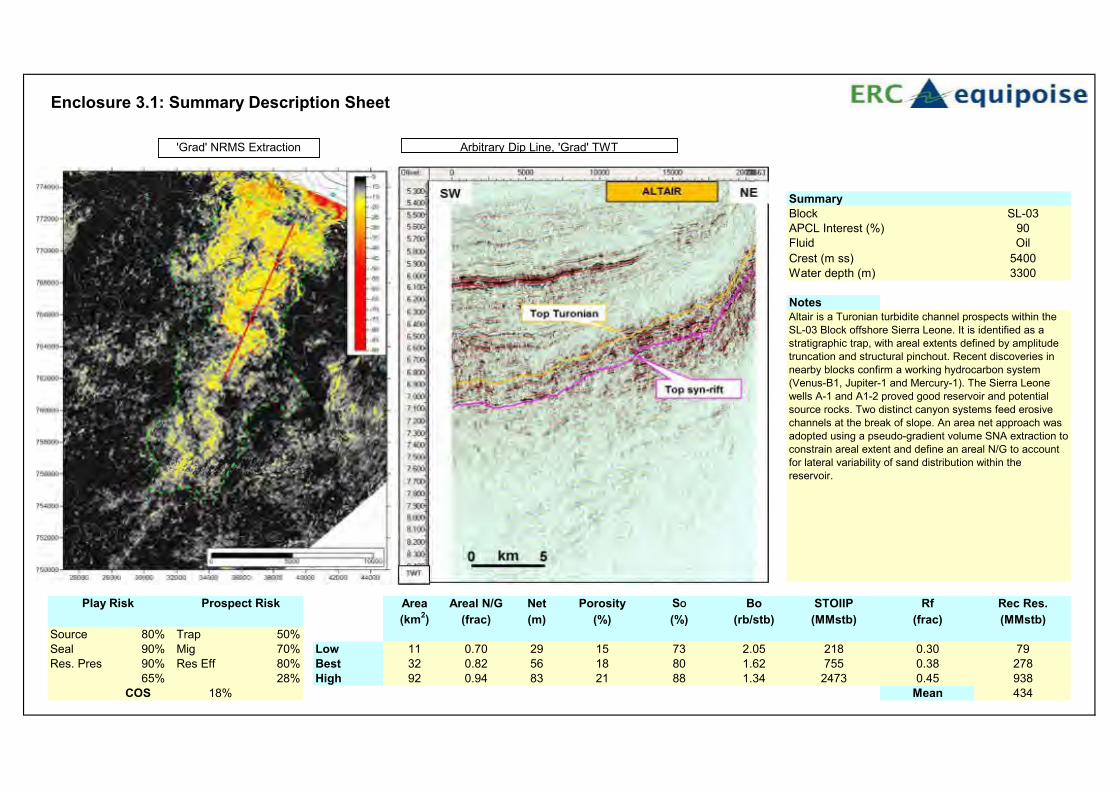
Our independent Best Estimate (P50) of prospective oil resources for the Altair prospect in Block SL-03 (Table 4) is 278 MMstb (gross and net) unrisked and 504 MMstb net risked Our independent Mean estimate of prospective oil resources for the prospect is 434 MMstb (gross and net) unrisked and 788 MMstb net risked
Work Done
In carrying out our evaluation of the interests we have relied upon information provided by APCL which comprised details of APCLrsquos licence interests offset well data and associated analysis seismic data including interpretation basic exploration data technical reports and volumetric estimates where appropriate
Our approach has been to commence our investigations with the most recent technical reports and interpreted data From these we have been able to identify those items of basic data which require re-assessment Where only basic data have been available or where previous interpretations of data have
Competent Personrsquos Report African Petroleum Corporation Ltd
been considered incomplete we have undertaken our own interpretation A site visit was not undertaken
In estimating petroleum in place and recoverable we have used the standard techniques of prospect analysis These techniques combine geophysical and geological knowledge with assessments of porosity and permeability distributions fluid characteristics and reservoir pressure There is uncertainty in the measurement and interpretation of basic data We have estimated the degree of this uncertainty and have used statistical methods to calculate the range of petroleum initially in place and recoverable
We have estimated the chance of success for drilling the identified exploration prospects using the industry standard approach of assessing the likelihood of source rock charge reservoir trap and seal The result is the chance or probability of discovering hydrocarbons in sufficient quantity and which test at a sufficient rate to permit consideration for subsequent appraisal and development
The nomenclature used in this report is presented in Appendix 2
Professional Qualifications
ERC Equipoise is an independent consultancy specialising in petroleum reservoir evaluation Except for the provision of professional services on a fee basis ERC Equipoise has no commercial arrangement with any other person or company involved in the interests that are the subject of this report
The work has been supervised by Dr Adam Law Geoscience Director of ERCE a post-graduate in Geology a Fellow of the Geological Society and a member of the Society of Petroleum Evaluation Engineers He has 18 years relevant experience in the evaluation of oil and gas fields and exploration acreage preparation of development plans and assessment of reserves and resources
Yours faithfully
ERC Equipoise Limited
Adam Law
Geoscience Director
Competent Personrsquos Report African Petroleum Corporation Ltd
Table 1 STOIIP and Prospective Oil Resources Liberia Blocks 8 and 9
Table 2 STOIIP and Prospective Oil Resources - Alhamdulilah and Prospect M - Gambia
APCL Interest
Prospect Risk
Play Risk
Low Best High Mean Low Best High Mean () Low Best High Mean () () Low Best High MeanBarbet Turonian 166 500 1479 718 60 186 558 270 100 60 186 558 270 22 1 22 13 41 123 59
Campanian 177 461 1187 609 63 172 448 229 100 63 172 448 229 27 1 27 17 46 122 62Turonian 107 307 863 429 39 115 327 162 100 39 115 327 162 19 1 19 7 22 62 31
Cenomanian 91 264 779 376 33 99 294 141 100 33 99 294 141 18 1 18 6 18 53 25Blue Horizon 68 293 1218 536 25 109 456 201 100 25 109 456 201 20 1 20 5 22 91 40Pink Horizon 59 262 1066 474 22 96 400 178 100 22 96 1070 178 20 1 20 4 19 214 36
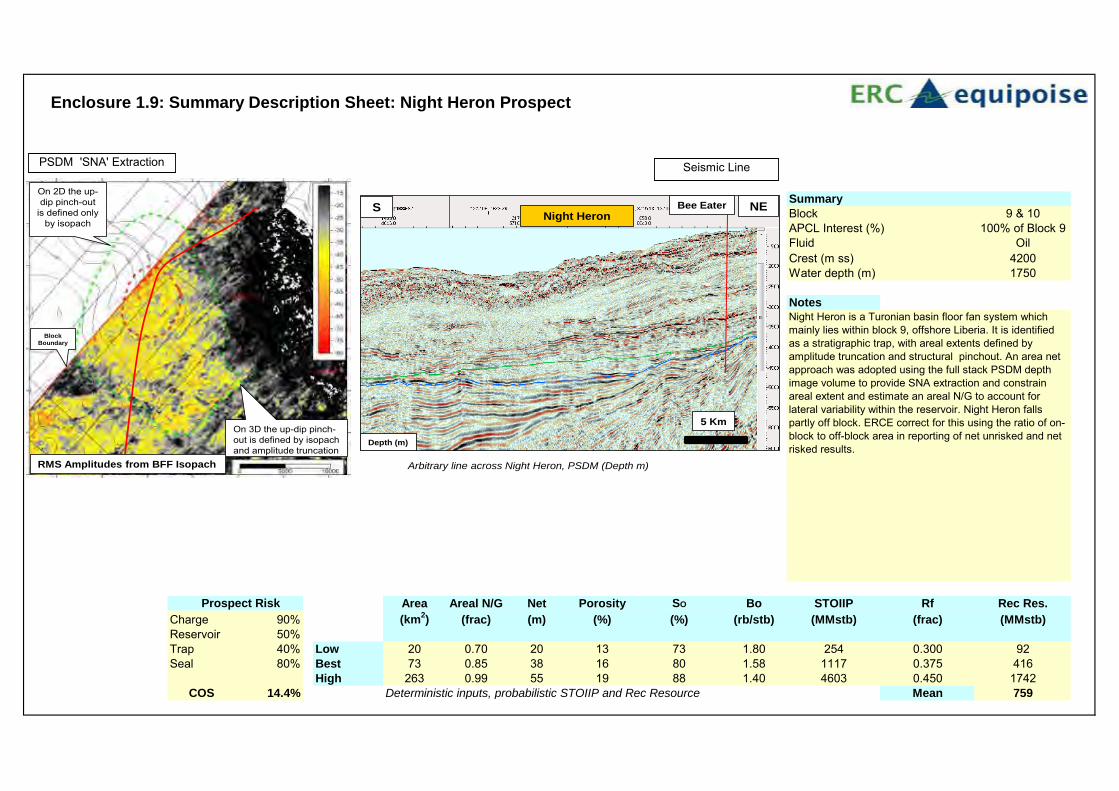
Green Horizon 48 210 896 399 18 78 337 150 100 18 78 337 150 20 1 20 4 16 67 30Night Heron Turonian 254 1117 4603 1904 92 416 1742 759 100 87 356 1338 650 144 1 144 13 51 193 94
Wildbird Light Blue Horizon 552 2289 8700 3946 144 605 2377 1065 100 144 605 2377 1065 38 24 9 13 54 214 96Total 1522 5704 20791 9392 497 1875 6940 3155 492 1815 7205 3046 82 289 1139 473
ReservoirProspect
Sunbird
Unrisked Prospective Resource (MMstb)STOIIP (MMStb) Net Unrisked Prospective Resource (MMstb) COS () Net Risked Prospective Resource (MMstb)
Lovebird (Isopach)
Low Best High Low Best High Mean Low Best High Mean Low Best High Mean
(MMstb) (MMstb) (MMstb) (MMstb) (MMstb) (MMstb) (MMstb) (MMstb) (MMstb) (MMstb) (MMstb) (MMstb) (MMstb) (MMstb) (MMstb)
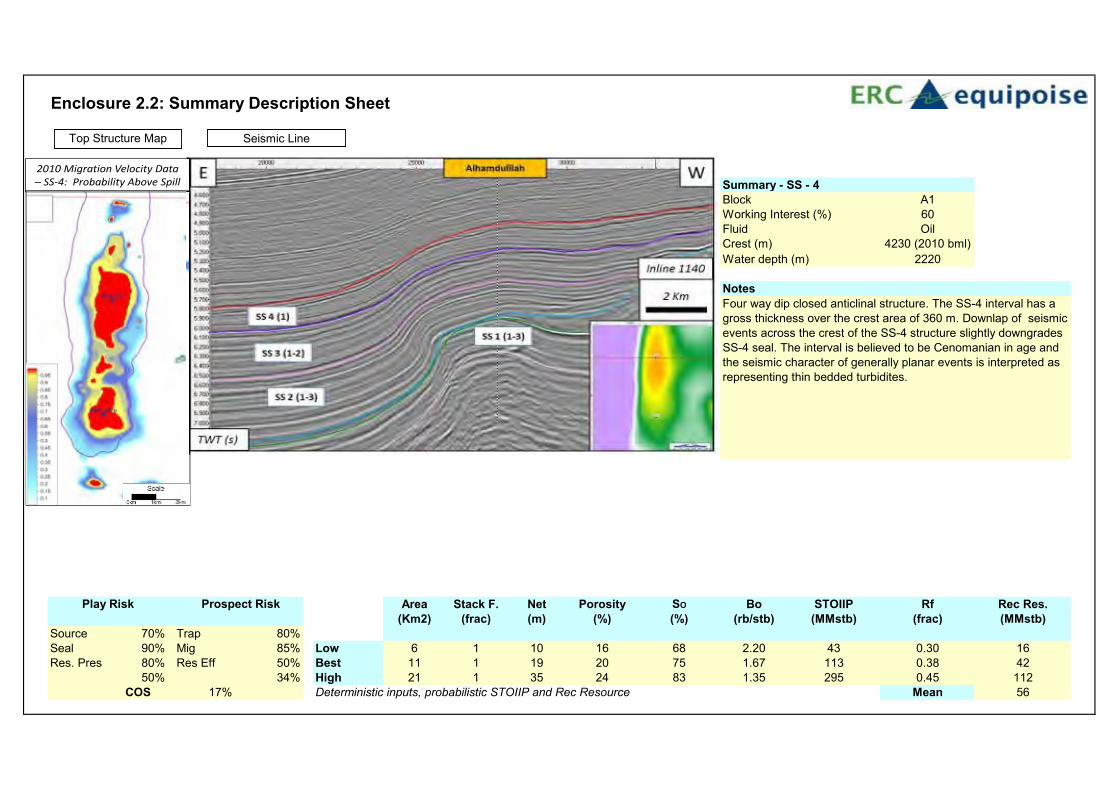
A1 SS4 Cretaceous 43 113 295 16 42 112 56 60 9 25 67 34 50 34 17 16 43 115 58
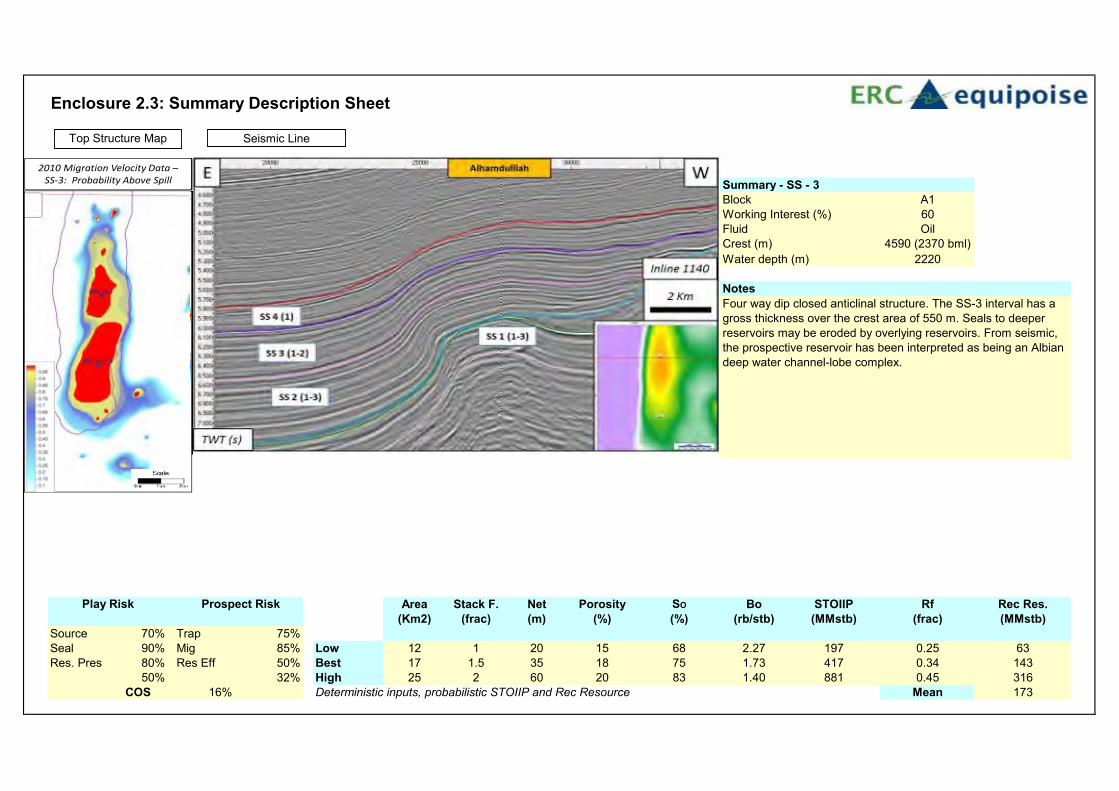
A1 SS3 Cretaceous 197 417 881 63 143 316 173 60 38 86 189 104 50 32 16 60 138 304 167
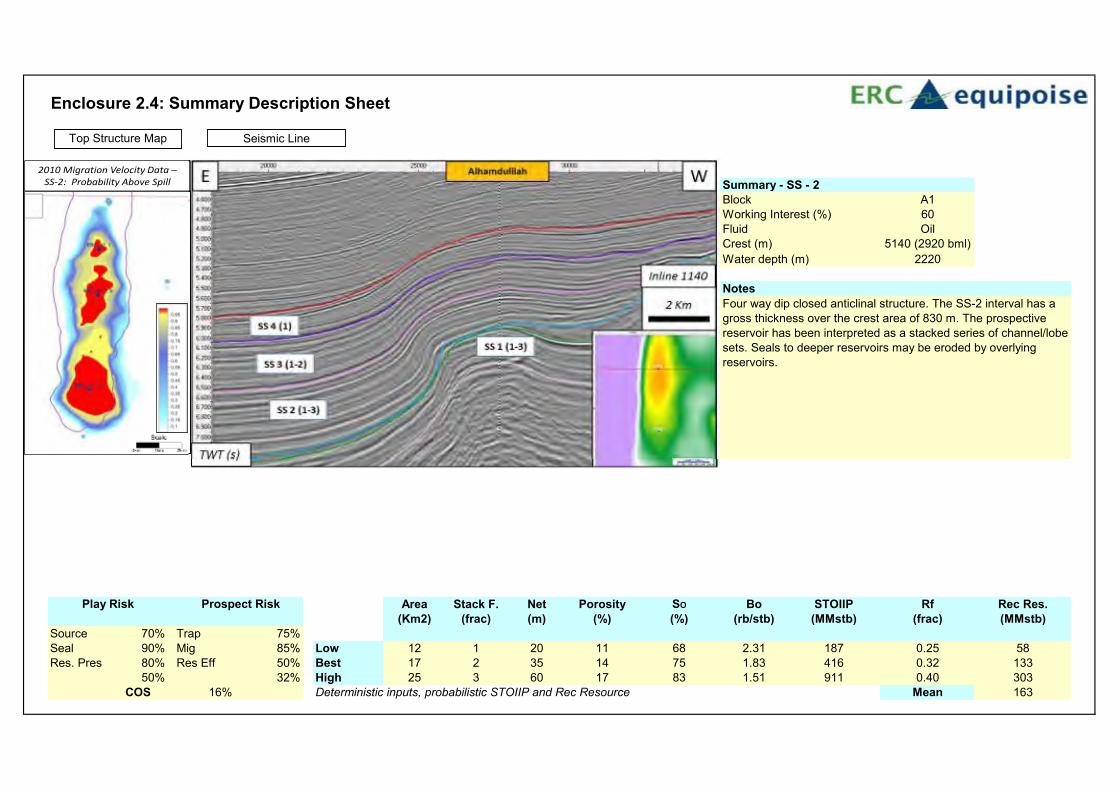
A1 SS2 Cretaceous 187 416 911 58 133 303 163 60 35 80 182 98 50 32 16 56 128 292 157
A1 SS1 Jurassic 158 399 997 34 98 276 135 60 21 59 166 81 50 26 13 27 77 217 106
A1 M Aptian 82 231 629 13 43 141 66 60 8 26 85 40 28 35 10 07 25 82 38
666 1577 3713 183 459 1148 593 110 275 689 356 17 411 1010 526 Total
Net Risked Prospective Resource APCL
Interest ()
Net Unrisked Prospective Resource Prospect
RiskPlay Risk Block Prospect Reservoir
STOIIP Unrisked Prospective Resource
COS ()
Competent Personrsquos Report African Petroleum Corporation Ltd
Table 3 STOIIP and Prospective Oil Resources ndash Cote DrsquoIvoire
Table 4 STOIIP and Prospective Oil Resources - Sierra Leone
Low Best High Low Best High Mean Low Best High Mean Low Best High Mean
(MMstb) (MMstb) (MMstb) (MMstb) (MMstb) (MMstb) (MMstb) (MMstb) (MMstb) (MMstb) (MMstb) (MMstb) (MMstb) (MMstb) (MMstb)
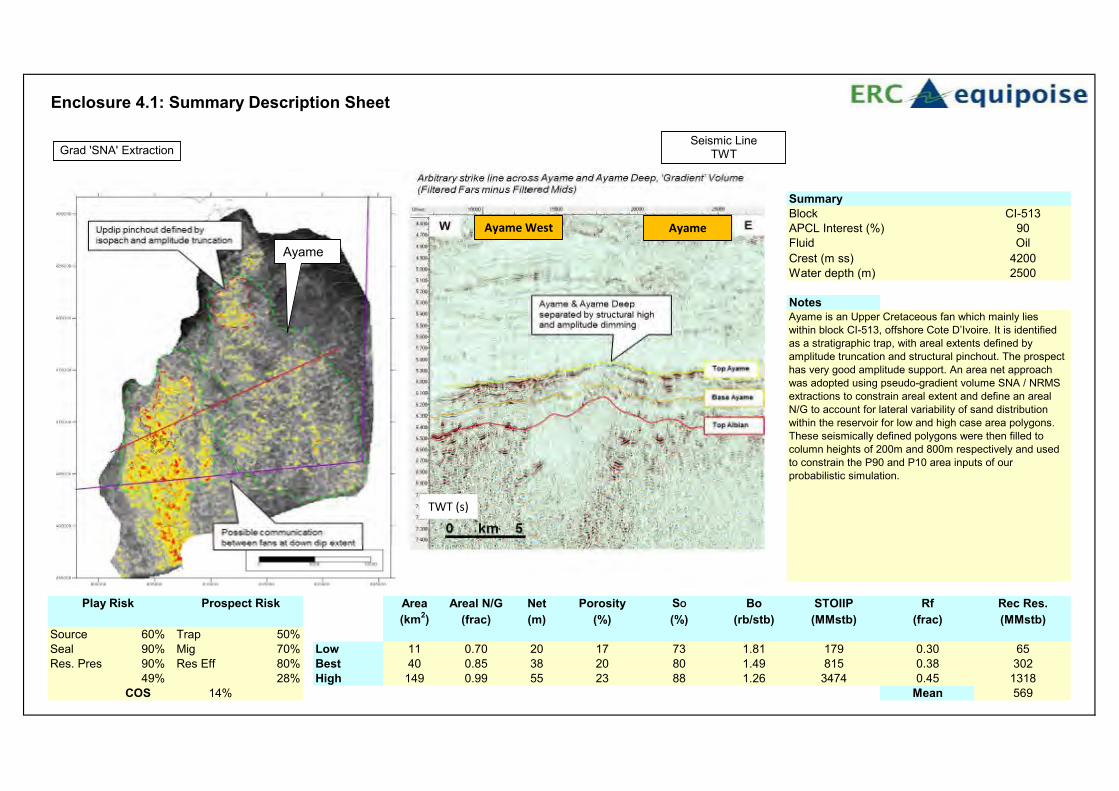
CI-513 AyameUpper
Cretaceous179 815 3474 65 302 1318 569 90 58 267 1138 502 49 28 14 80 363 1549 683
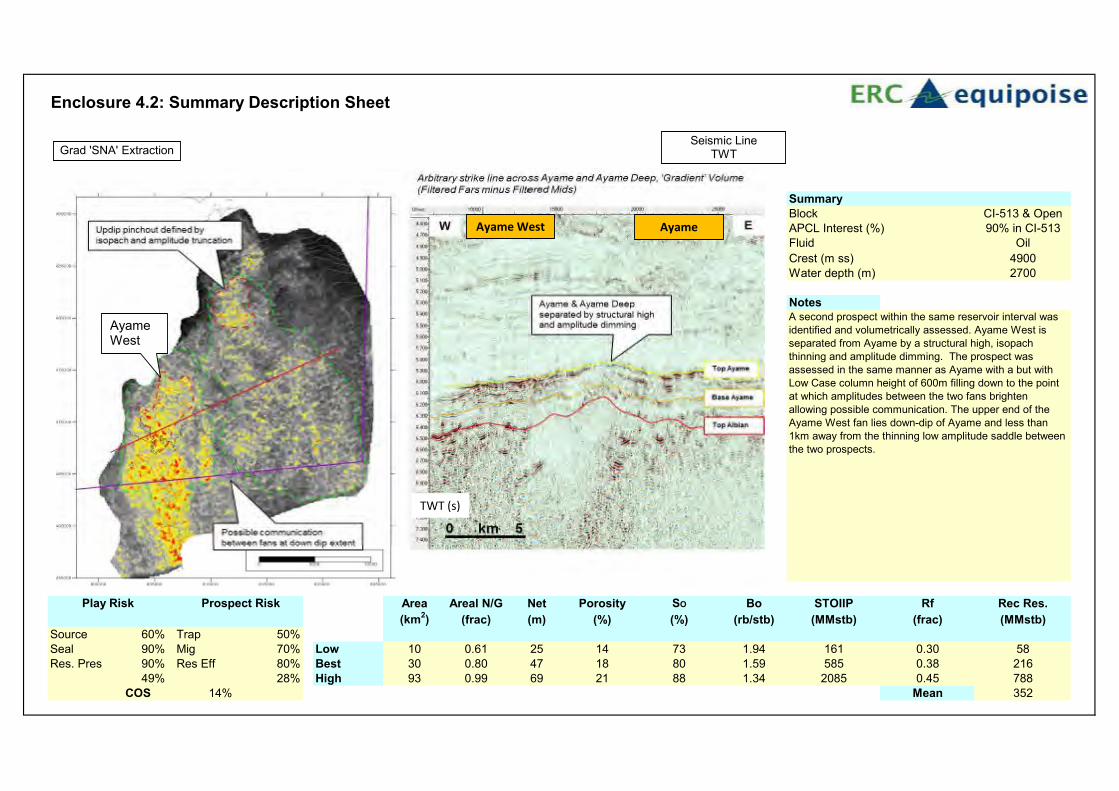
CI-513 Ayame WestUpper
Cretaceous161 585 2085 58 216 788 352 90 52 183 626 298 49 28 14 71 249 852 406
CI-513 Sassandra Upper
Cretaceous71 320 1408 26 118 521 237 90 23 87 300 175 49 20 10 22 83 286 166
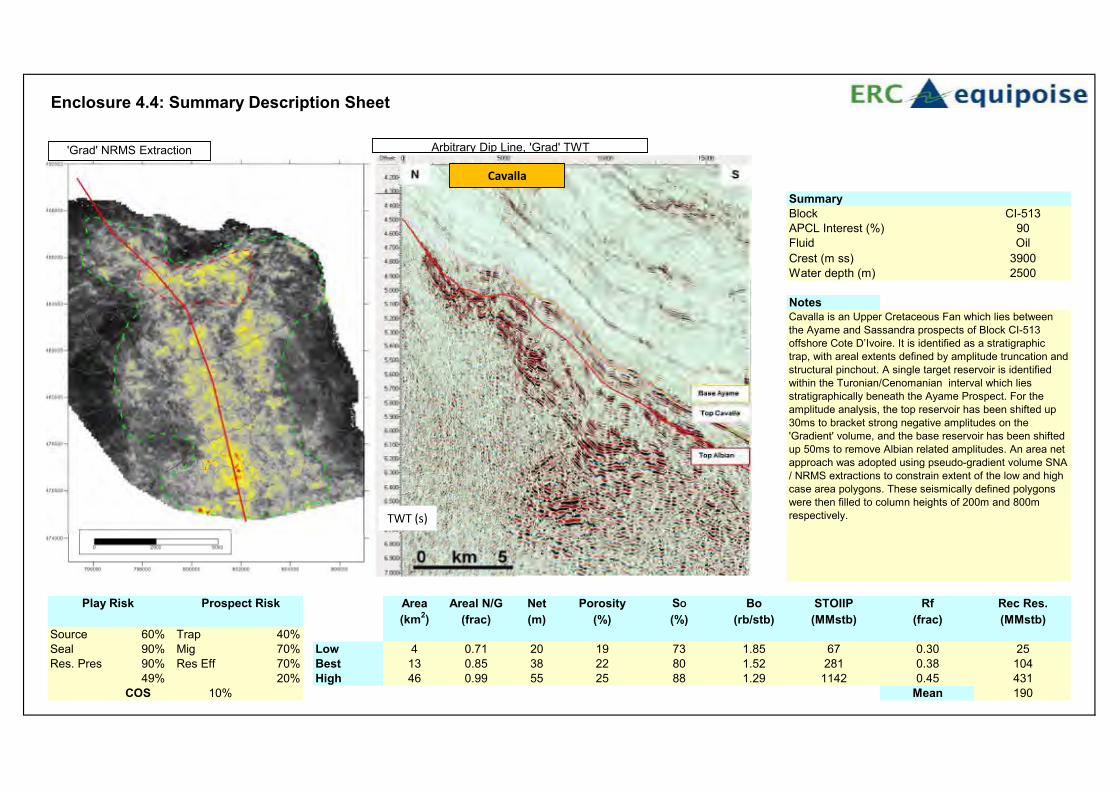
CI-513 CavallaUpper
Cretaceous67 281 1142 25 104 431 190 90 22 93 388 171 49 20 10 21 89 370 163
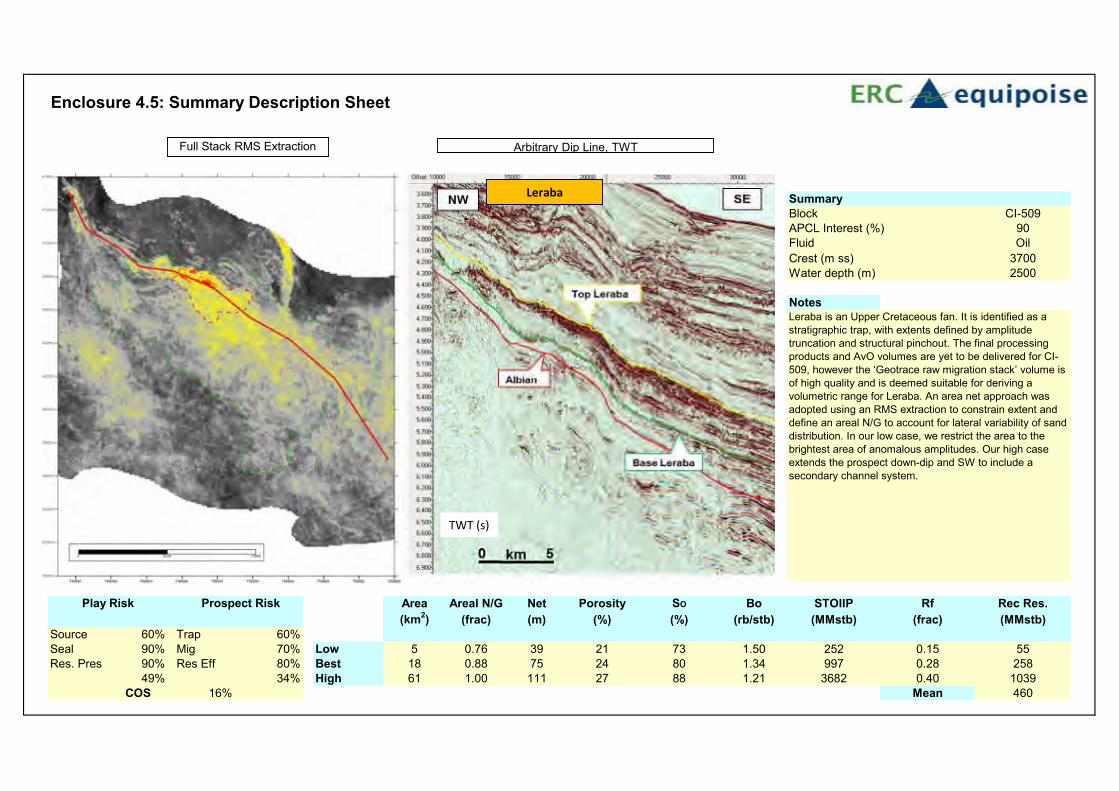
CI-509 LerabaUpper
Cretaceous252 997 3682 55 258 1039 460 90 50 232 935 414 49 34 16 82 380 1527 676
731 2998 11792 229 999 4097 1808 206 863 3387 1560 275 1164 4583 2094TOTAL
COS ()
Net Risked Prospective Resource
Interest ()
Net Unrisked Prospective Resource
Block Prospect Reservoir
STOIIP Unrisked Prospective ResourcePlay Risk
()Prospect Risk ()
Low Best High Low Best High Mean Low Best High Mean Low Best High Mean
(MMstb) (MMstb) (MMstb) (MMstb) (MMstb) (MMstb) (MMstb) (MMstb) (MMstb) (MMstb) (MMstb) (MMstb) (MMstb) (MMstb) (MMstb)
SL-03 AltairUpper
Cretaceous218 755 2473 79 278 938 434 100 79 278 938 434 65 28 18 144 504 1702 788
Table 4 STOIIP and Prospective Oil Resources - Sierra Leone
Block Prospect Reservoir
STOIIP Unrisked Prospective ResourcePlay Risk
()Prospect Risk ()
COS ()
Net Risked Prospective Resource
Interest ()
Net Unrisked Prospective Resource
Competent Personrsquos Report
African Petroleum Corporation Limited
PREPARED FOR African Petroleum Corporation Limited
BY ERC Equipoise Limited
June 2013
Competent Personrsquos Report African Petroleum Corporation Limited
June 2013
Authors Adam Law Michael Braim Glyn Pugh Kate Overy Don Munn
Approved by Simon McDonald
Date released to client June 25 2013
ERC Equipoise Limited (ldquoERC13 Equipoiserdquo13 or13 ldquoERCErdquo) has made every effort to ensure that the interpretations conclusions and recommendations presented herein are accurate and reliable in accordance with good industry practice ERC Equipoise does not however guarantee the correctness of any such interpretations and shall not be liable or responsible for any loss costs damages or expenses incurred or sustained by anyone resulting from any interpretation or recommendation made by any of its officers agents or employees
Competent Personrsquos Report African Petroleum Corporation Limited
June 2013
Table of Contents 1 Introduction 14
11 Liberia PSC Overview 16
12 Gambia PSC Review 17
13 Senegal PSC Review 18
14 Sierra Leone PSC Review 19
15 Cote drsquoIvoire PSC Review 21
16 Evaluation Methodology Prospective Resources 22
2 Liberia Prospectivity and Plays 26
21 Introduction 26
22 Well and Seismic Database 27
23 Plays and Petroleum Geology Blocks 8 and 9 29
24 Play and Prospect Risk Liberia Blocks 8 and 9 31
25 Liberia Blocks 8 and 9 Leads and Prospects 33
251 Barbet Prospect 34
252 Sunbird Canyon Prospect 36
253 Night Heron 39
254 Lovebird Prospect 42
255 Wildbird Prospect 44
3 Gambia Prospectivity and Plays 47
31 Introduction 47
32 Well and Seismic Database 48
33 Plays and Petroleum Geology Blocks A1 and A4 49
34 Play Risk 51
35 Gambia Leads and Prospects 53
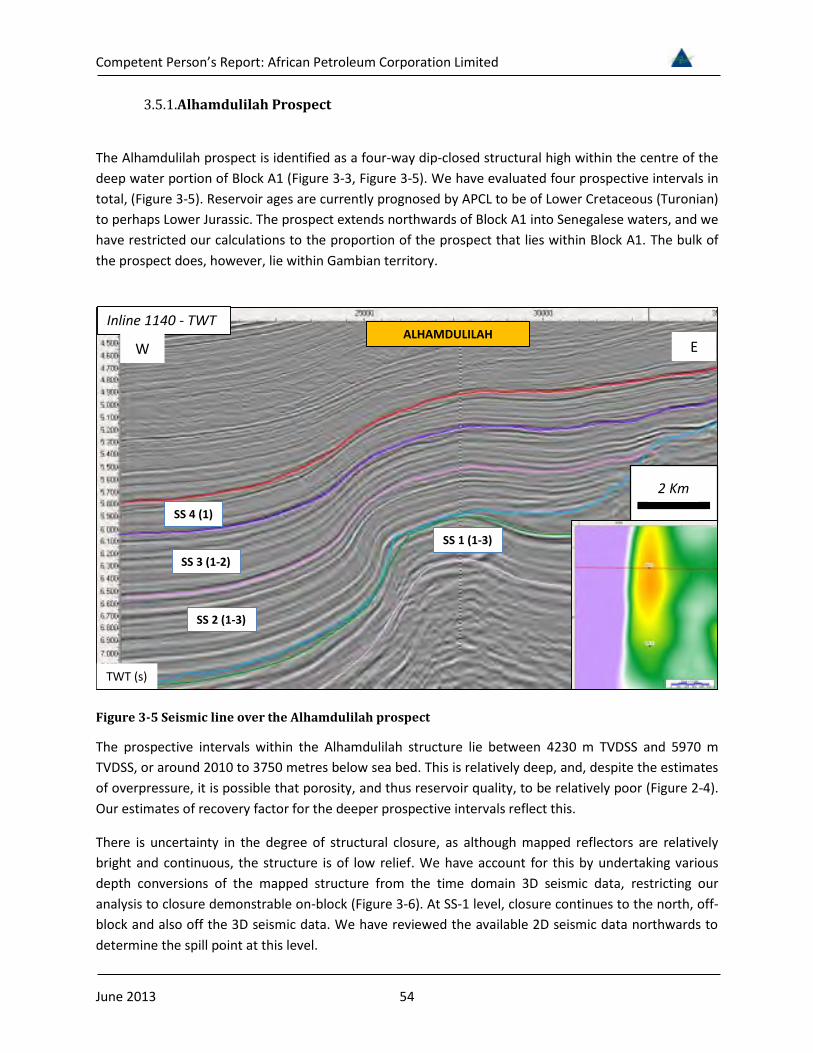
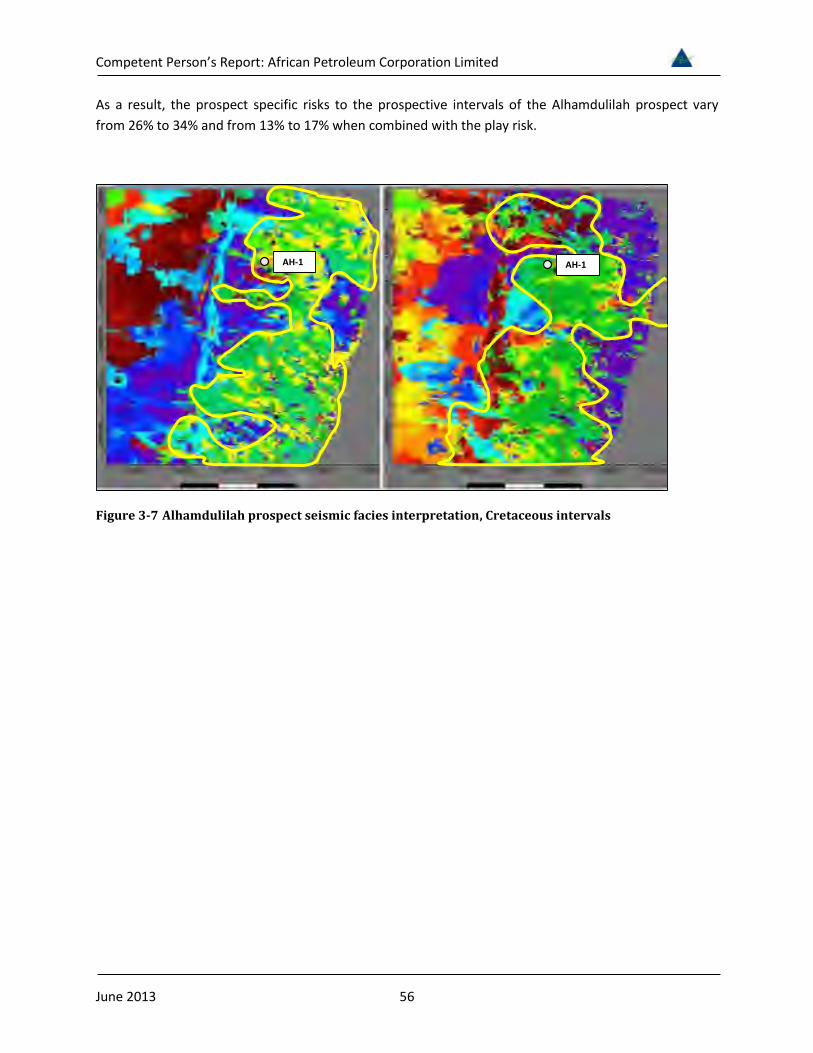
351 Alhamdulilah Prospect 54
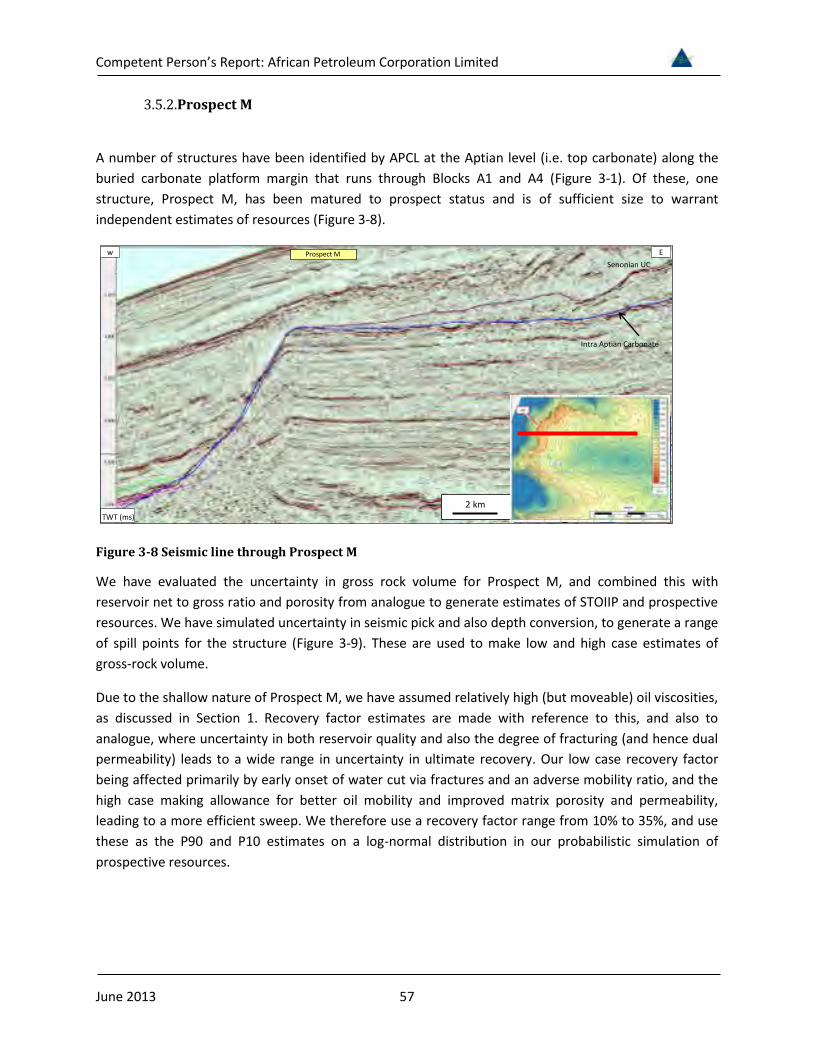
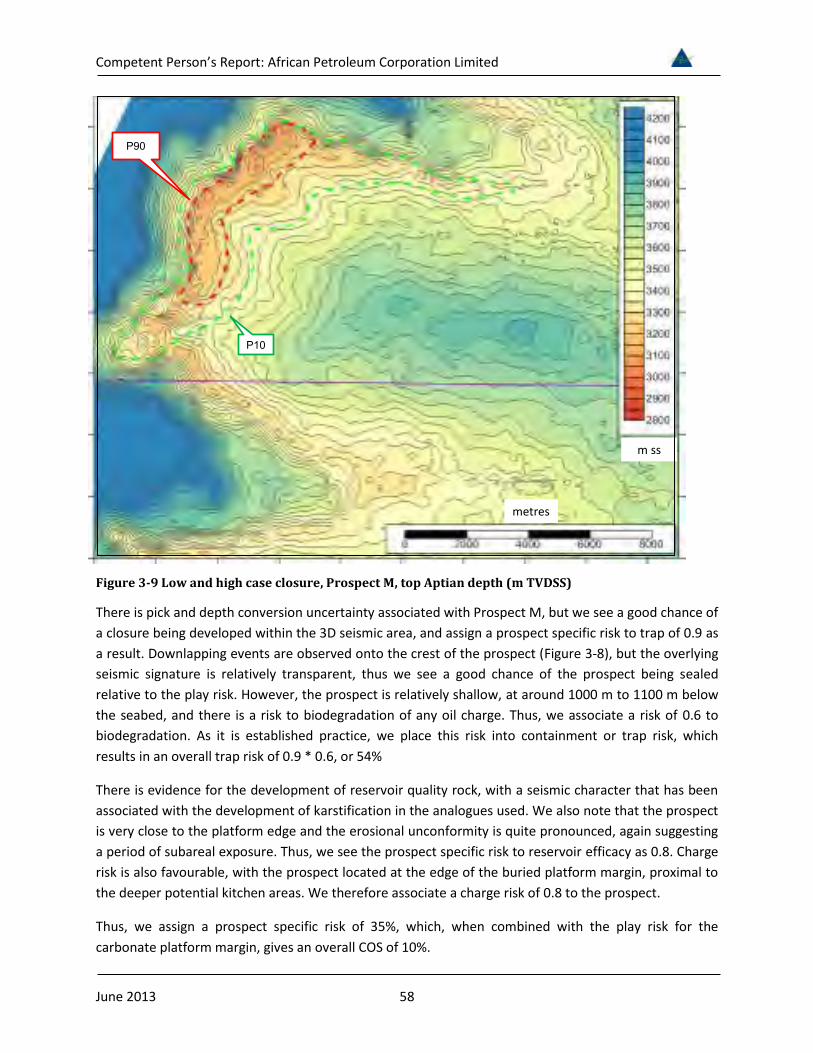
352 Prospect M 57
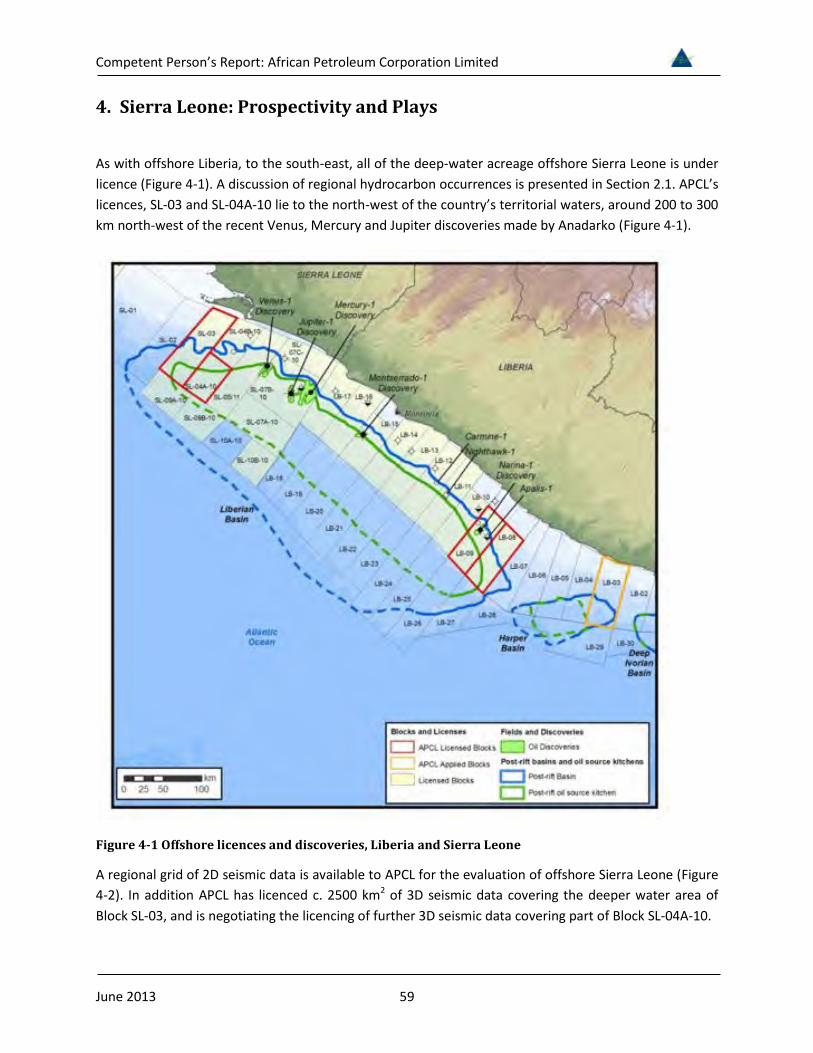
4 Sierra Leone Prospectivity and Plays 59
41 Play Risk 62
41 Sierra Leone Leads and Prospects 62
Competent Personrsquos Report African Petroleum Corporation Limited
June 2013
411 Altair 62
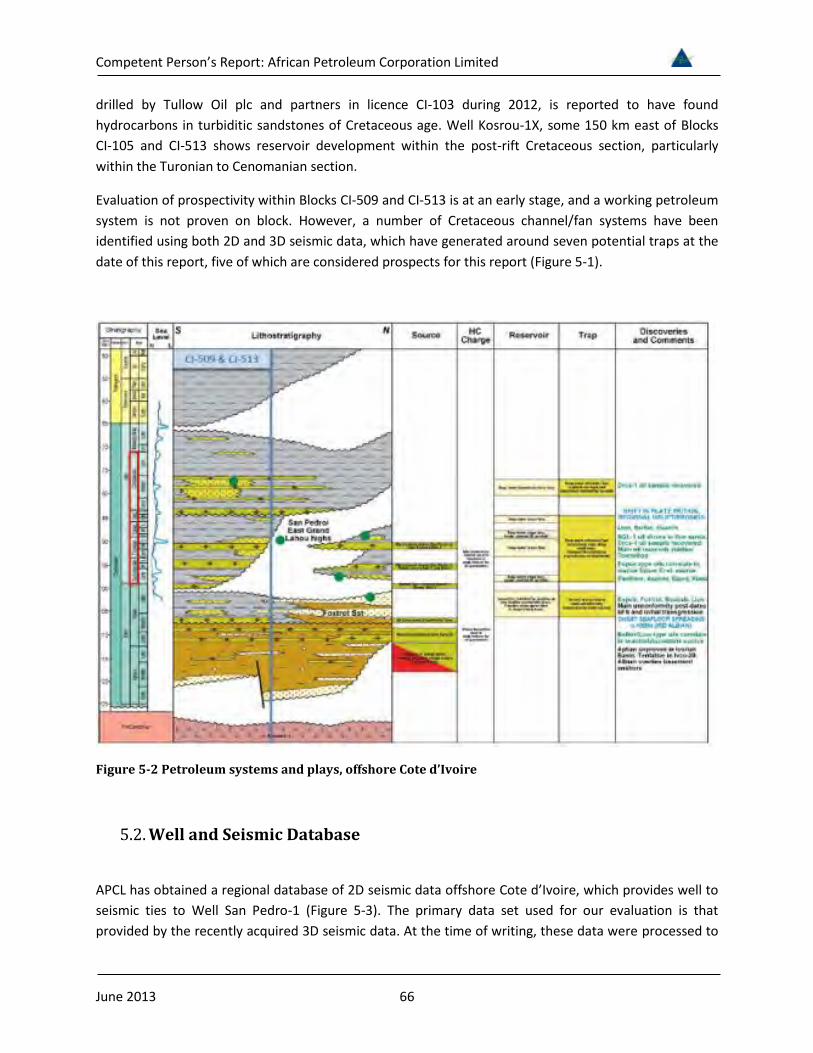
5 Cote drsquoIvoire Prospectivity and Plays 65
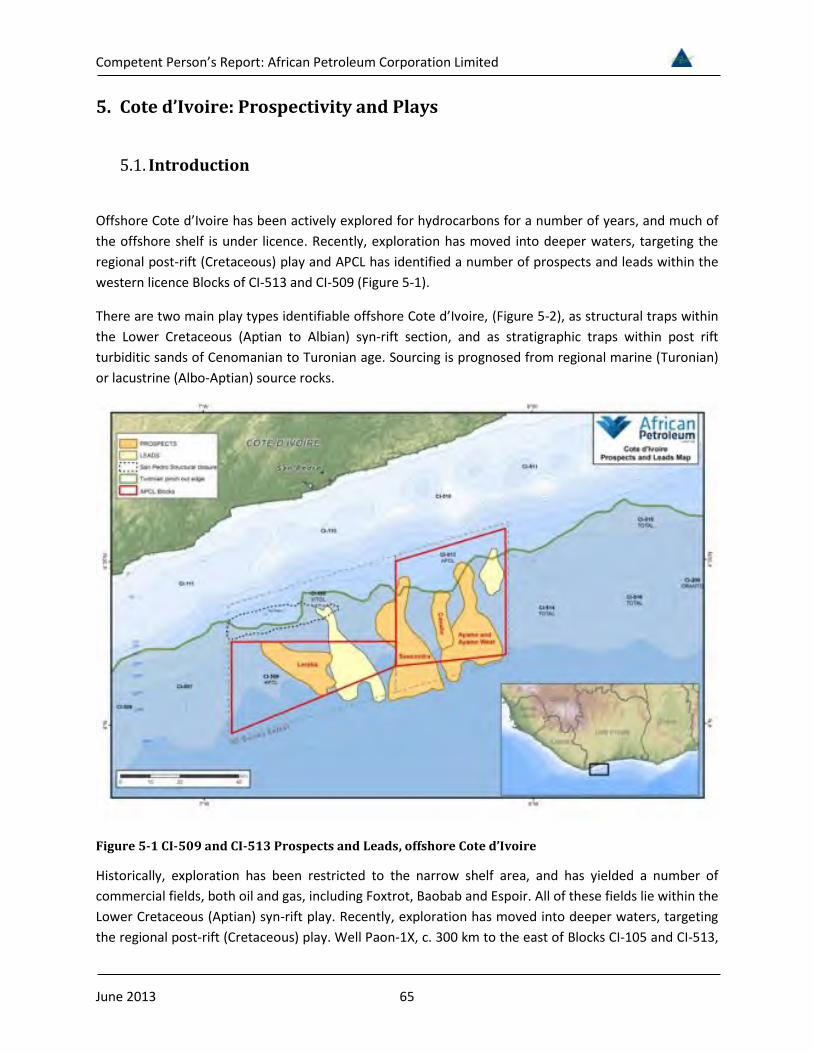
51 Introduction 65
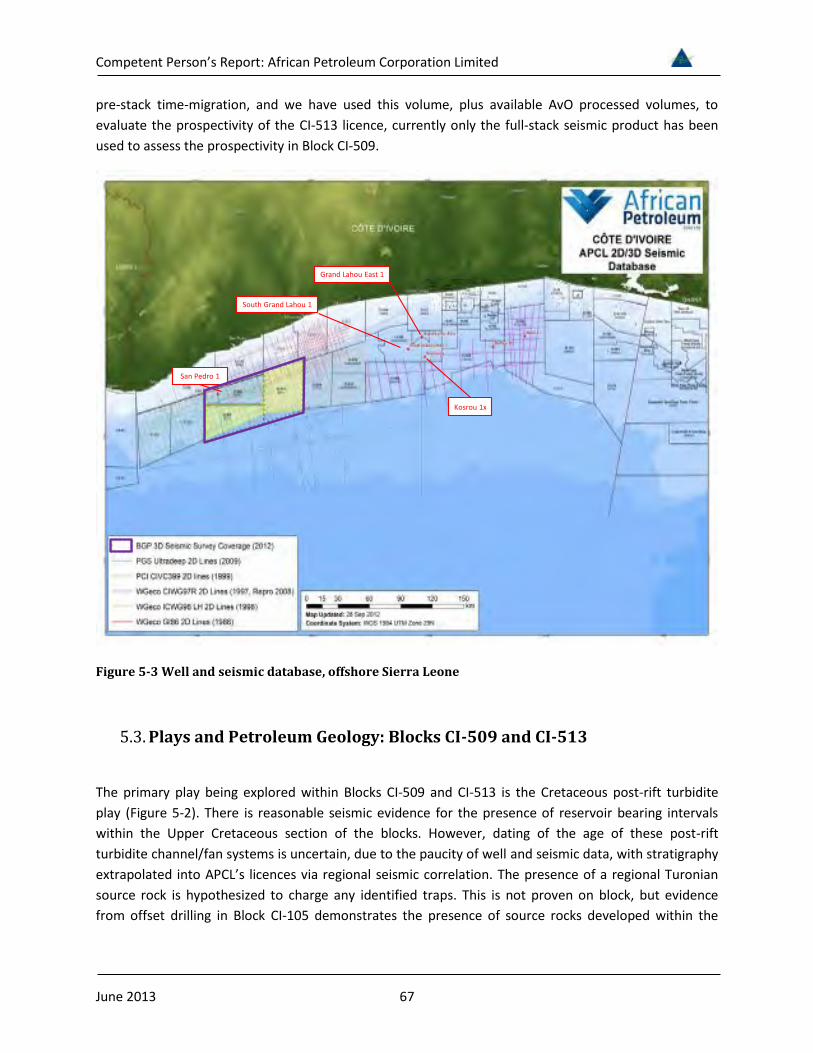
52 Well and Seismic Database 66
53 Plays and Petroleum Geology Blocks CI-509 and CI-513 67
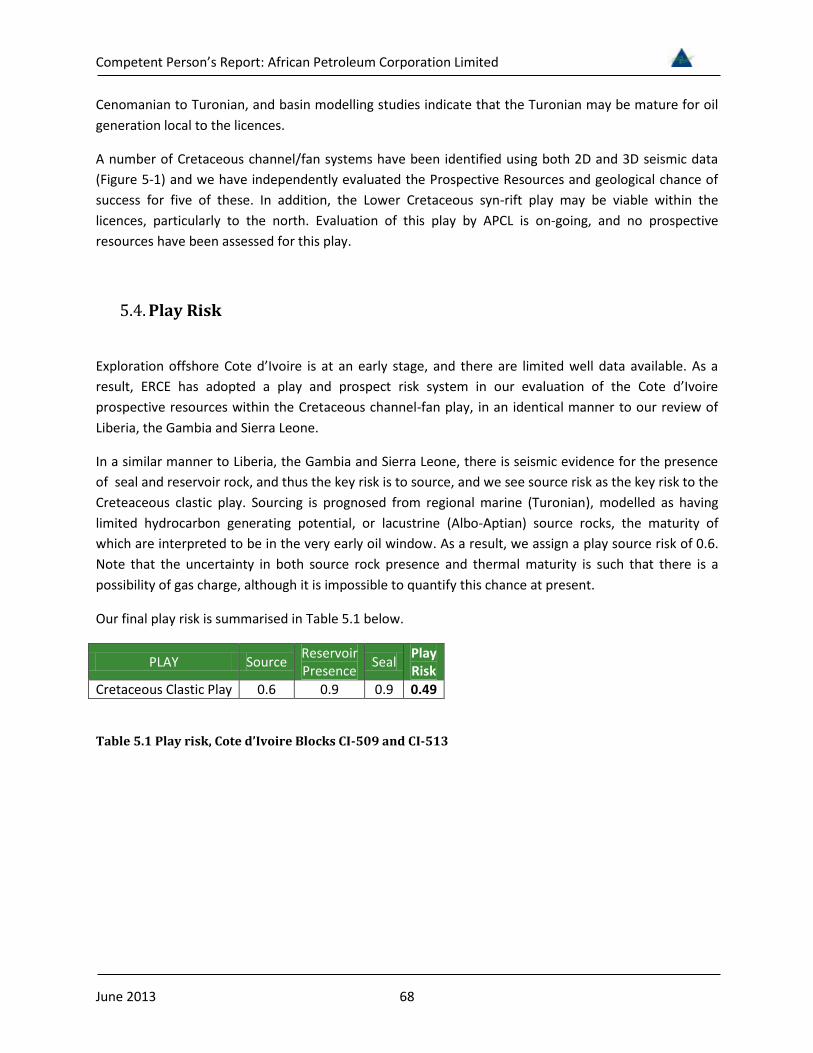
54 Play Risk 68
55 Cote drsquoIvoire Blocks CI-509 and CI-503 Leads and Prospects 69
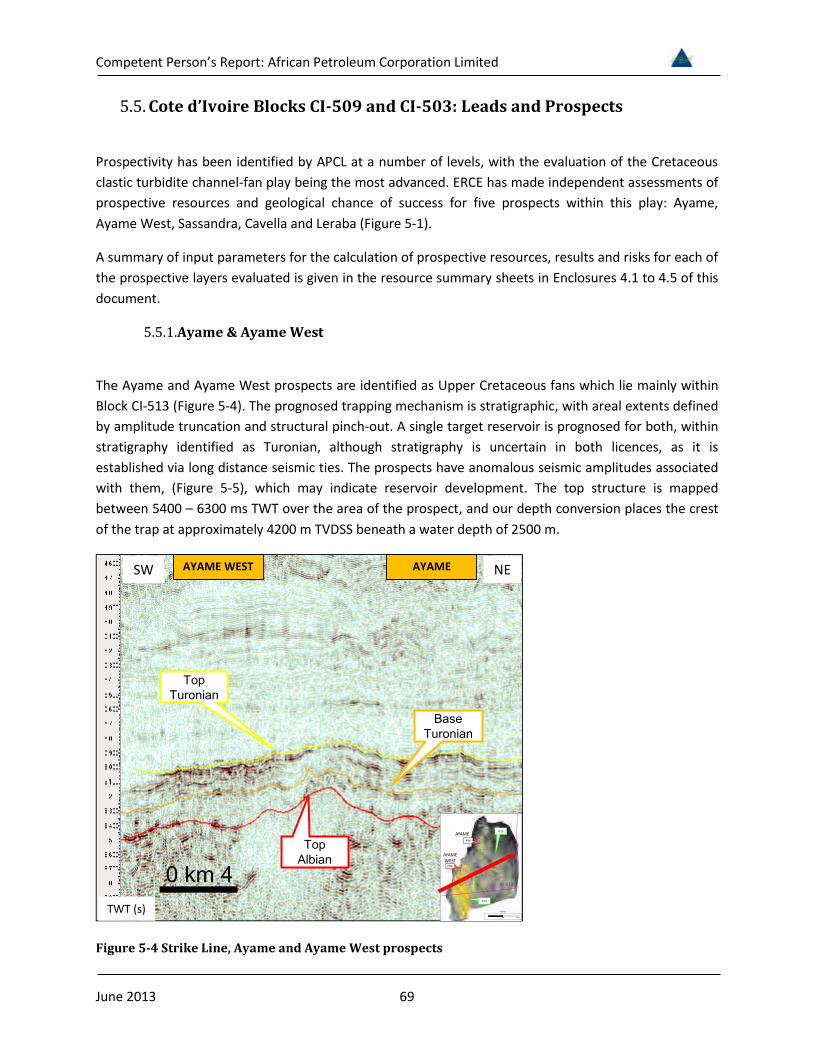
551 Ayame amp Ayame West 69
552 Sassandra 71
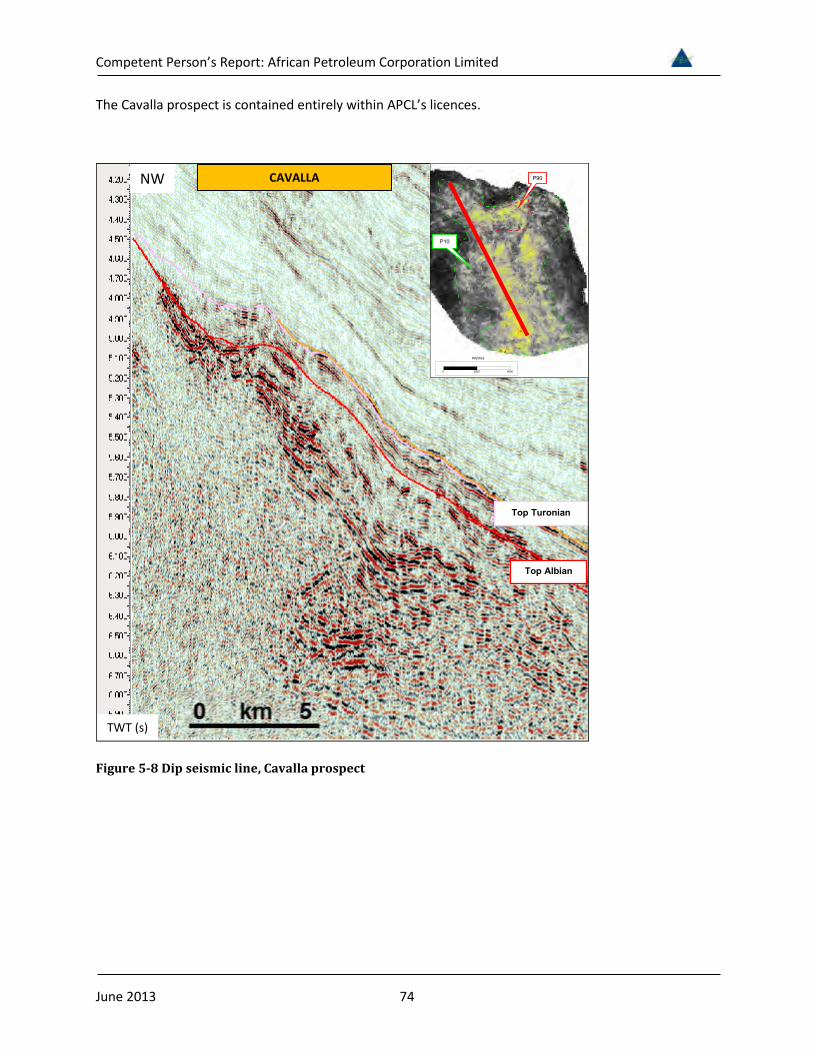
553 Cavalla 73
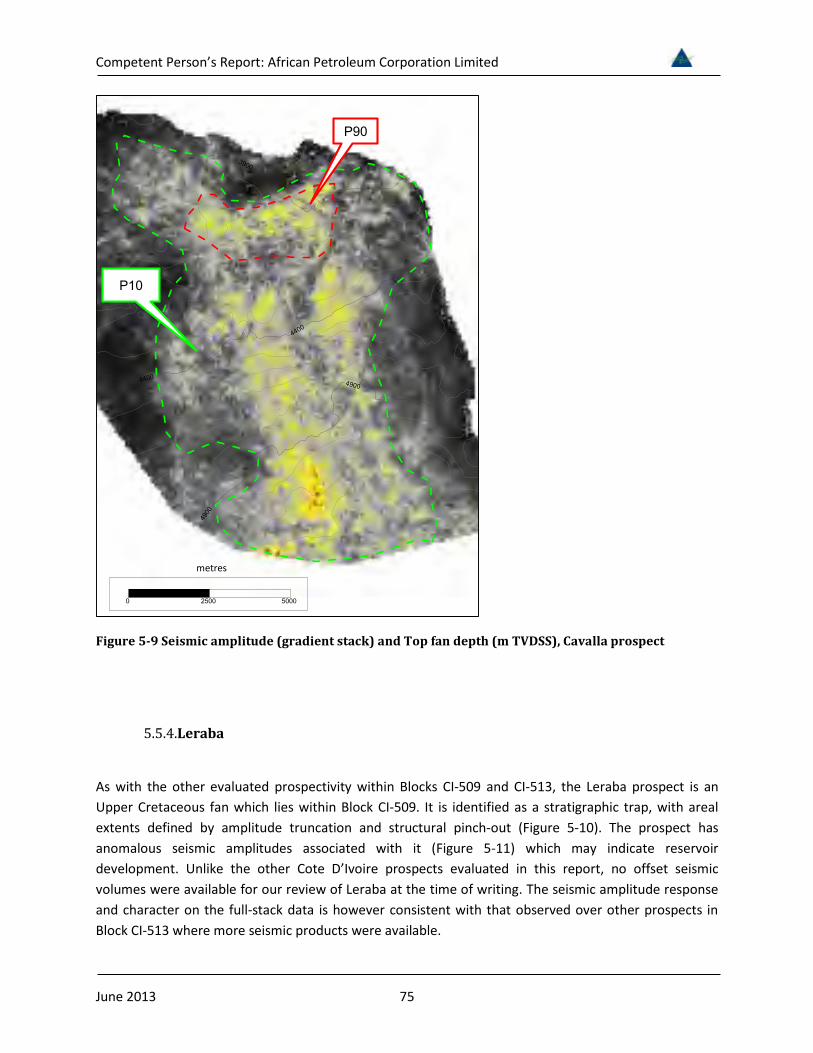
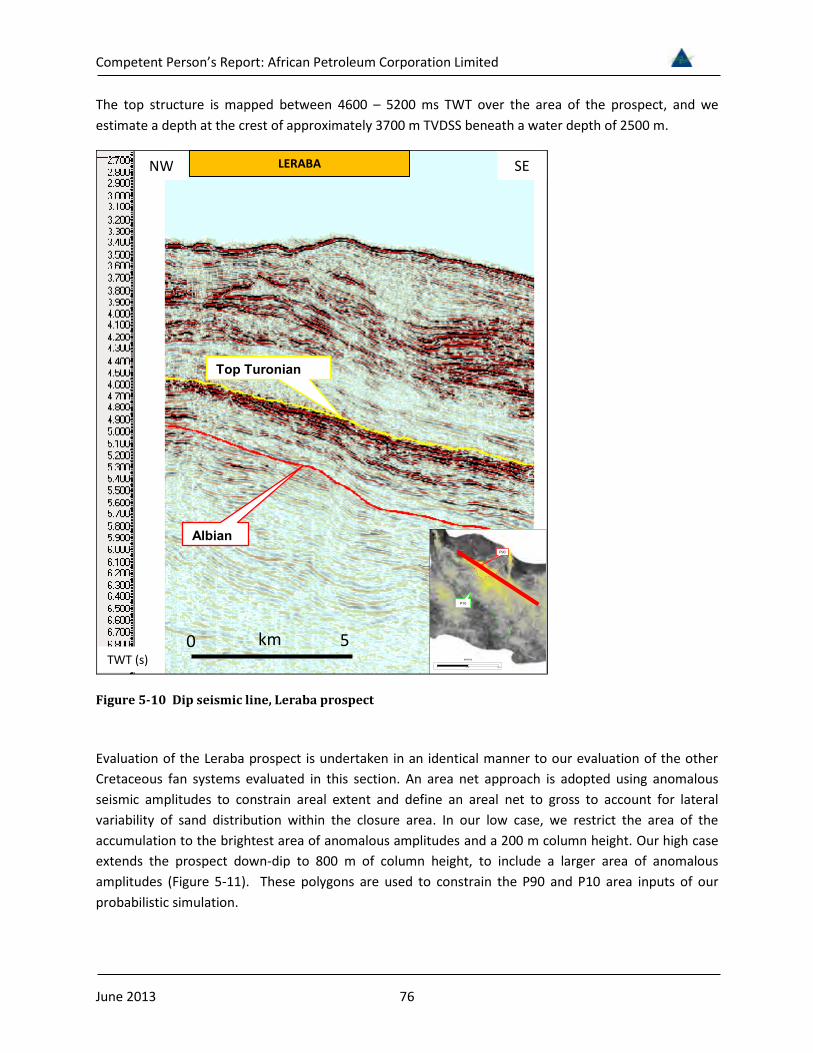
554 Leraba 75
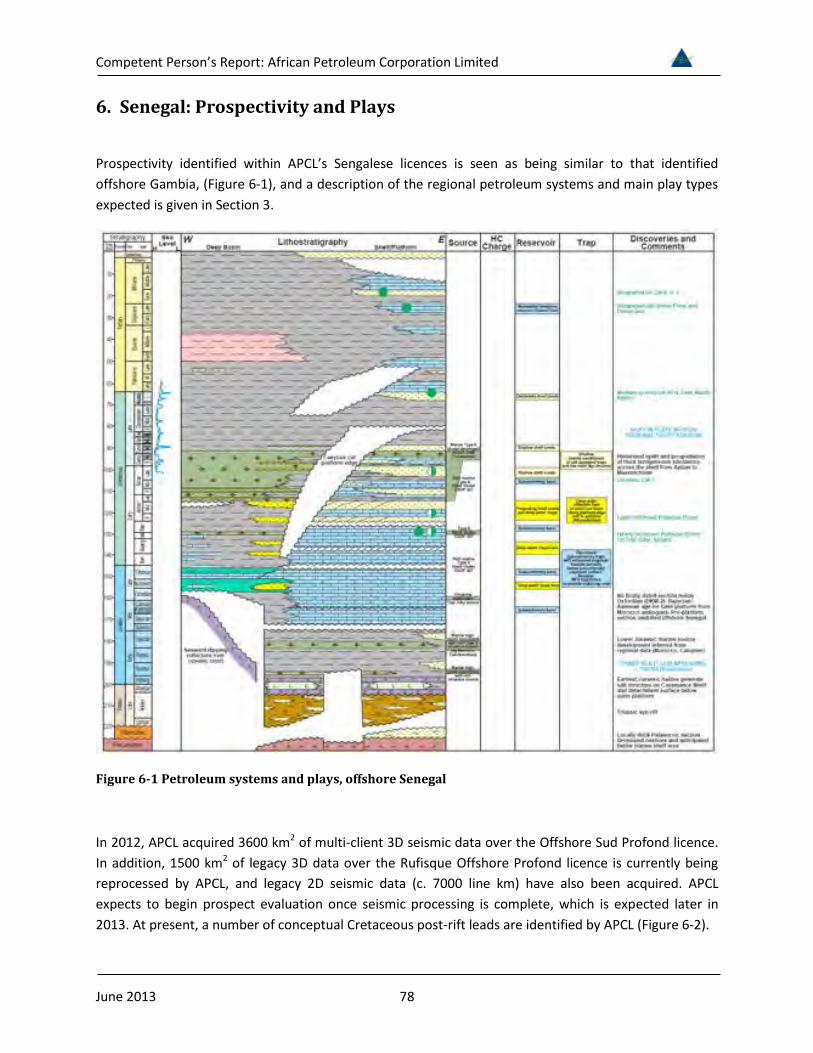
6 Senegal Prospectivity and Plays 78
7 Appendix 1 SPE PRMS Guidelines 80
8 Appendix 2 Nomenclature 89
81 Units 89
82 Reserves and Resources Classifications 89
83 Abbreviations 89
Enclosures Resource Summary Sheets 91
Competent Personrsquos Report African Petroleum Corporation Limited
June 2013
List of Tables Table 11 Licence Summary Table 15 Table 12 Estimated oil recovery factors from producing Atlantic Margin fields 24 Table 13 Play and prospect risk system 24 Table 21 Play risk Cretaceous carbonate play Liberia Blocks 8 and 9 32 Table 31 Play risk Gambia Blocks A1 and A4 52 Table 41 Play risk Sierra Leone Block SL-03 62 Table 51 Play risk Cote drsquoIvoire Blocks CI-509 and CI-513 68
Competent Personrsquos Report African Petroleum Corporation Limited
June 2013
List of Figures Figure 1-1 Location of APCL licences West Africa 14 Figure 1-2 Location of Liberia Blocks 8 and 9 16 Figure 1-3 Location of Gambia Blocks A1 and A4 17 Figure 1-4 Location of Senegal ROP and SOSP Licences 18 Figure 1-5 Location of Blocks SL-03 and SL-04A 20 Figure 1-6 Location of Blocks CI-509 and CI-513 21 Figure 2-1 Notable discoveries West Africa offshore 27 Figure 2-2 Well and seismic database Liberia Blocks 8 and 9 28 Figure 2-3 Petroleum systems and plays Liberia Blocks 8 and 9 30 Figure 2-4 Porositydepth trend published West Africa turbidite reservoirs 31 Figure 2-5 Leads and Prospects Liberia Blocks 8 and 9 33 Figure 2-6 Seismic line (depth) over the Barbet prospect 34 Figure 2-7 Barbet far offset amplitudes with Top Turonian depth contours (m TVDSS) 35 Figure 2-8 Regional seismic line along axis of the Sunbird canyon system 36 Figure 2-9 Sunbird Campanian far offset amplitudes with Cenomanian depth contours (m TVDSS) 37 Figure 2-10 Sunbird Turonian far offset amplitudes with Top Turonian depth contours (m TVDSS) 38 Figure 2-11 Sunbird Cenomanian far offset amplitudes with Cenomanian depth contours (m TVDSS) 39 Figure 2-12 Arbitrary line across Night Heron PSDM (Depth m) 40 Figure 2-14 SNA from Basin Floor Fan Isopach (m) - PSDM 41 Figure 2-15 Seismic line over the Lovebird prospect 42 Figure 2-16 Lovebird prospect Top Pink horizon depth (mss) high case 43 Figure 2-17 Seismic line and prospect geo-seismic sketch Wildbird prospect 45 Figure 2-18 Wildbird Top Reservoir depth map (m TVDSS) Spill point - green contour 46 Figure 3-1 Plays Gambia Blocks A1 and A4 47 Figure 3-2 Wells 2D and 3D seismic data (red outline) Gambia Blocks A1 and A4 48 Figure 3-3 Well to seismic tie ndash Well Jammah-1 to the Alhamdulilah prospect 50 Figure 3-4 Leads and prospects identified by APCL in Gambia Blocks A1 and A4 53 Figure 3-5 Seismic line over the Alhamdulilah prospect 54 Figure 3-6 Area of closure Alhamdulilah prospect layers SS1 to SS4 55 Figure 3-7Alhamdulilah prospect seismic facies interpretation Cretaceous intervals 56 Figure 3-8 Seismic line through Prospect M 57 Figure 3-9 Low and high case closure Prospect M top Aptian depth (m TVDSS) 58 Figure 4-1 Offshore licences and discoveries Liberia and Sierra Leone 59 Figure 4-2 Well and seismic database offshore Sierra Leone 60 Figure 4-3 Leads Sierra Leone Block SL-03 61 Figure 4-4 Dip seismic line (full offsets) Altair prospect 63 Figure 4-5 Seismic amplitude (gradient stack) and Top Turonian depth (m TVDSS) Altair prospect 64 Figure 5-1 CI-509 and CI-513 Prospects and Leads offshore Cote drsquoIvoire 65
Competent Personrsquos Report African Petroleum Corporation Limited
June 2013
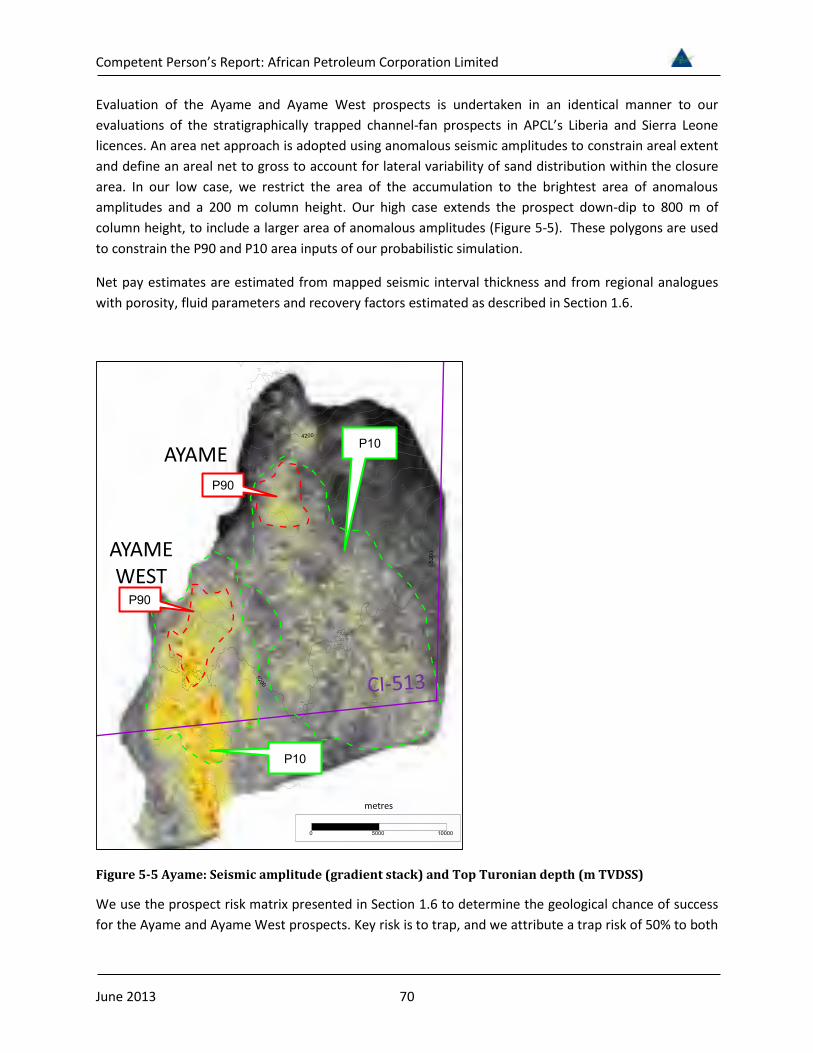
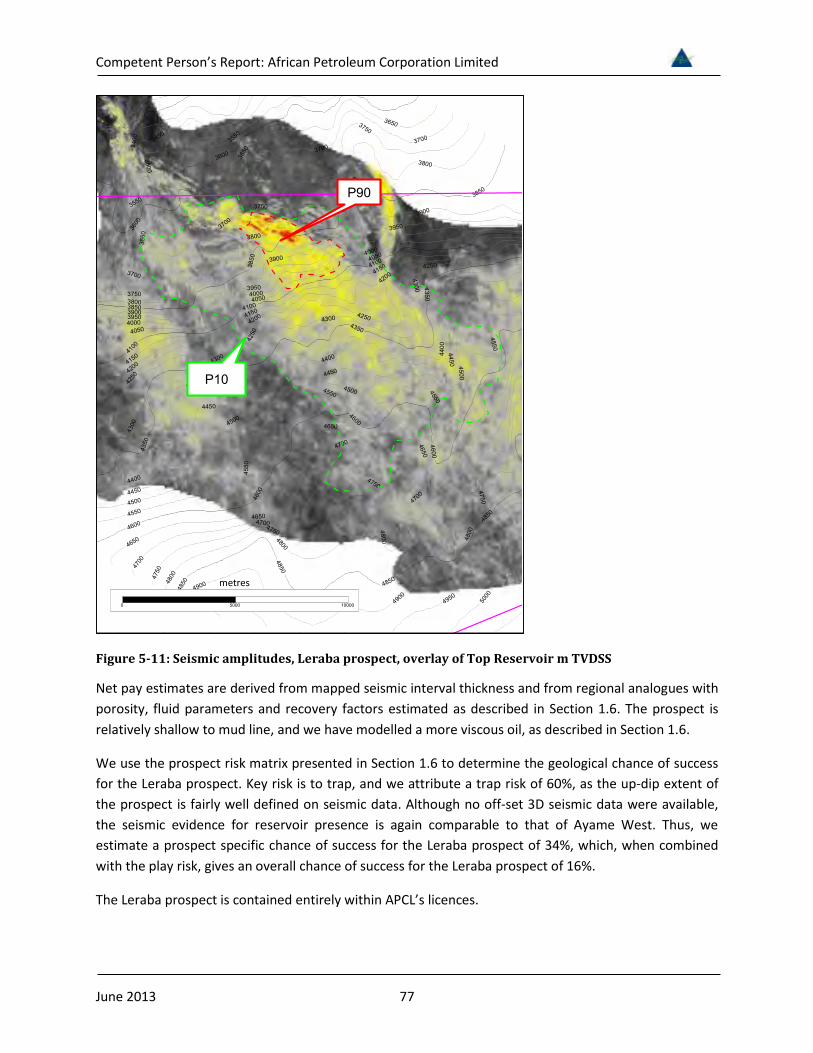
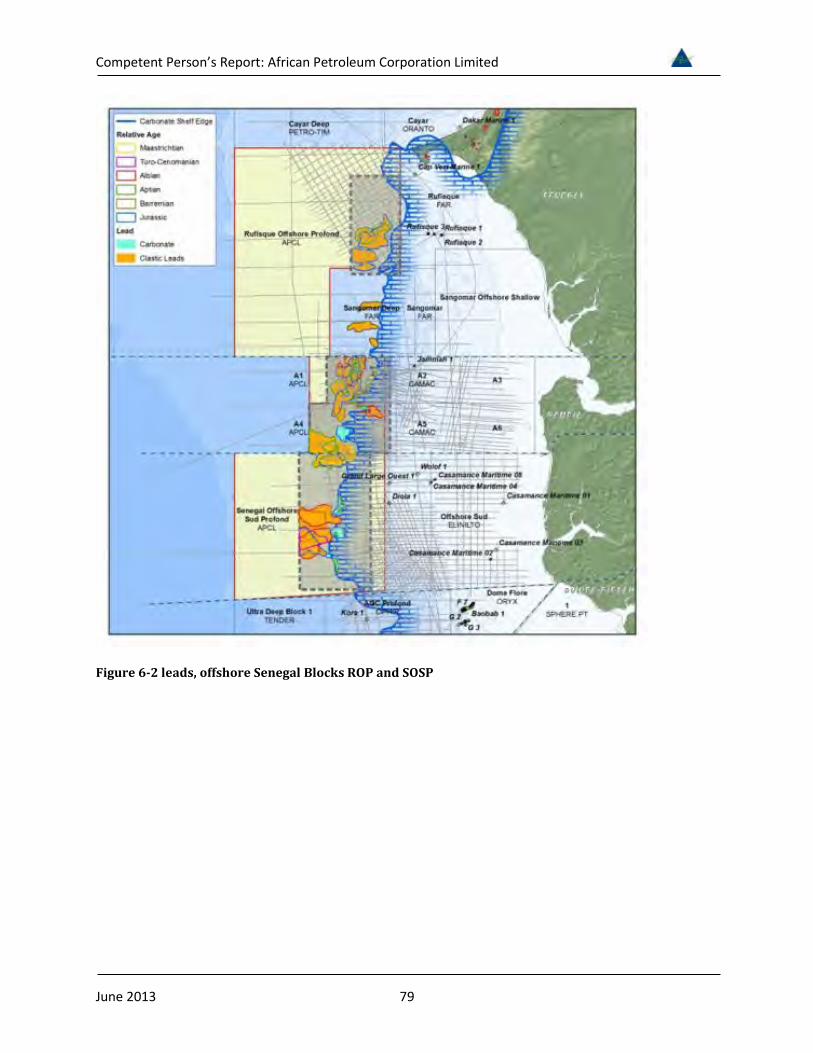
Figure 5-2 Petroleum systems and plays offshore Cote drsquoIvoire 66 Figure 5-3 Well and seismic database offshore Sierra Leone 67 Figure 5-4 Strike Line Ayame and Ayame West prospects 69 Figure 5-5 Ayame Seismic amplitude (gradient stack) and Top Turonian depth (m TVDSS) 70 Figure 5-6 Dip seismic line Sassandra prospect 71 Figure 5-7 Sassandra prospect Seismic amplitude and Top Turonian depth (m TVDSS) 72 Figure 5-8 Dip seismic line Cavalla prospect 74 Figure 5-9 Seismic amplitude (gradient stack) and Top fan depth (m TVDSS) Cavalla prospect 75 Figure 5-10 Dip seismic line Leraba prospect 76 Figure 5-11 Seismic amplitudes Leraba prospect 77 Figure 6-1 Petroleum systems and plays offshore Senegal 78 Figure 6-2 leads offshore Senegal Blocks ROP and SOSP 79
Competent Personrsquos Report African Petroleum Corporation Limited
June 2013 14
1 Introduction
At the time of writing African Petroleum Corporation Limited (APCL) holds interests in and operates exploration licences offshore West Africa within the territorial waters of Senegal the Gambia Sierra Leone Liberia and Cote drsquoIvoire (Figure 1-1) The status of these licences is summarised in Table 11 below ERC Equipoise Ltd (ERCE) has reviewed the prospectivity of these licences using data as of 31st May 2013
Figure 1-1 Location of APCL licences West Africa
Currently prospective resources are identified by APCL within the Liberia Gambia Sierra Leone and Cote drsquoIvoire licences We have made independent estimates of prospective resources and geological chance of success for certain prospects within these countries which are identified by APCL as near-term drilling opportunities The evaluation of the offshore Senegal licences is on-going and no prospects have been identified as of the date of this report We summarise qualitatively the prospectivity of the licences held by APCL in this country
Competent Personrsquos Report African Petroleum Corporation Limited
June 2013 15
Country Block Licence
Operator APCL () Status
Licence
Area (km2)
Outstanding Commitment in this Phase
Start of Current Phase
End of Current Phase
Liberia 8 APCL 100 Expl June 2012
June 2014
2717 Two
Exploration wells
Liberia 9 APCL 100 Expl June 2012
June 2014
2634 None
Gambia A1 APCL 60 Expl Dec
2007 Dec
2013 1296
One Exploration
well 1
Gambia A4 APCL 60 Expl Dec
2007 Dec
2013 1376 (see A1)
Senegal Rufisque Offshore Profond
APCL 90 Expl Oct
2011 Oct
2015 10357
One exploration
well
Senegal
Senegal Offshore
Sud Profond
APCL 90 Expl Oct
2011 Oct
2014 7920 None
Sierra Leone
SL-03 APCL 100 Expl Feb
2011 Feb
2014 3860 None
Sierra Leone
SL-04A APCL 100 Expl Sept 2012
Sept 2015
1995 One
exploration well 2
Cote drsquoIvoire
CI-509 APCL 90 Expl March 2012
March 2015
1091 One
exploration well
Cote drsquoIvoire
CI-513 APCL 90 Expl Dec
2011 Dec
2014 1446
One exploration
well
1) Transferrable to Block A4 if necessary 2) Contingent on results of 3D and that technology is available to drill in such water depths
Table 11 Licence Summary Table
Competent Personrsquos Report African Petroleum Corporation Limited
June 2013 16
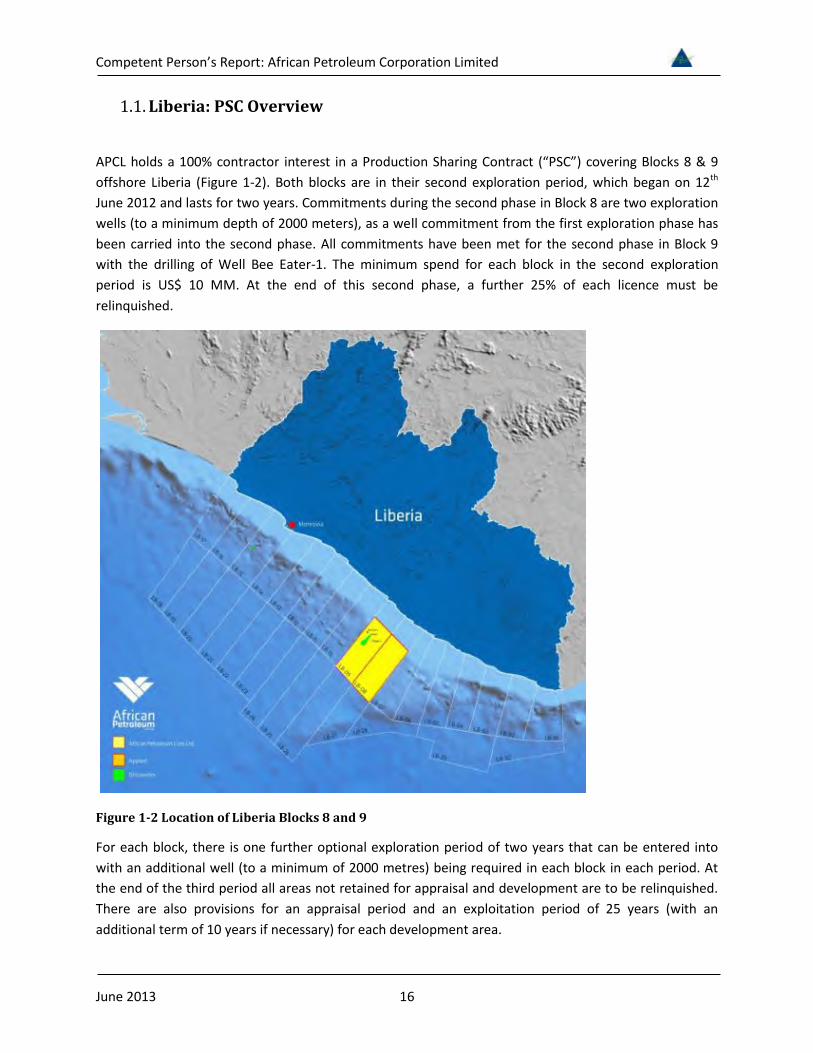
11Liberia PSC Overview
APCL holds a 100 contractor interest in a Production Sharing Contract (ldquoPSCrdquo) covering Blocks 8 amp 9 offshore Liberia (Figure 1-2) Both blocks are in their second exploration period which began on 12th June 2012 and lasts for two years Commitments during the second phase in Block 8 are two exploration wells (to a minimum depth of 2000 meters) as a well commitment from the first exploration phase has been carried into the second phase All commitments have been met for the second phase in Block 9 with the drilling of Well Bee Eater-1 The minimum spend for each block in the second exploration period is US$ 10 MM At the end of this second phase a further 25 of each licence must be relinquished
Figure 1-2 Location of Liberia Blocks 8 and 9
For each block there is one further optional exploration period of two years that can be entered into with an additional well (to a minimum of 2000 metres) being required in each block in each period At the end of the third period all areas not retained for appraisal and development are to be relinquished There are also provisions for an appraisal period and an exploitation period of 25 years (with an additional term of 10 years if necessary) for each development area
Competent Personrsquos Report African Petroleum Corporation Limited
June 2013 17
Following a 25 relinquishment at the end of the first exploration phase Block 8 comprises an area of 2717 km2 and Block 9 comprises 2634 km2 Water depths range from less than 100 m to over 3000 m Most of the block areas lie in water depths greater than 500 m
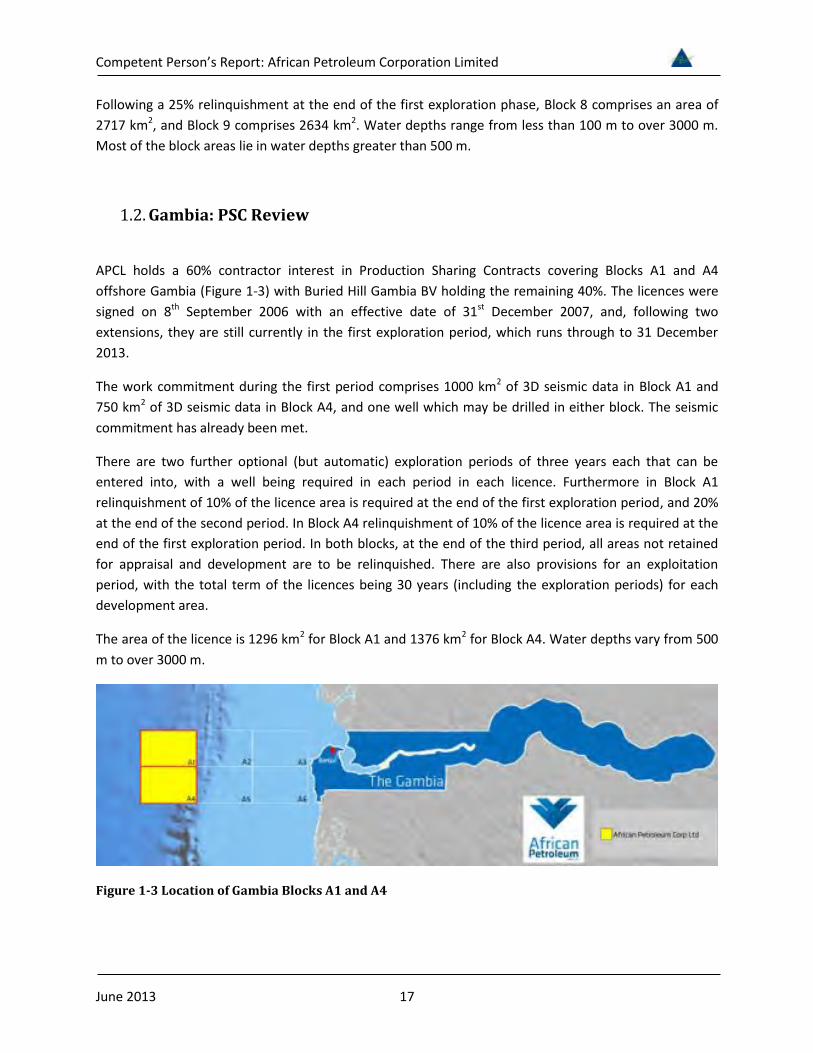
12Gambia PSC Review
APCL holds a 60 contractor interest in Production Sharing Contracts covering Blocks A1 and A4 offshore Gambia (Figure 1-3) with Buried Hill Gambia BV holding the remaining 40 The licences were signed on 8th September 2006 with an effective date of 31st December 2007 and following two extensions they are still currently in the first exploration period which runs through to 31 December 2013
The work commitment during the first period comprises 1000 km2 of 3D seismic data in Block A1 and 750 km2 of 3D seismic data in Block A4 and one well which may be drilled in either block The seismic commitment has already been met
There are two further optional (but automatic) exploration periods of three years each that can be entered into with a well being required in each period in each licence Furthermore in Block A1 relinquishment of 10 of the licence area is required at the end of the first exploration period and 20 at the end of the second period In Block A4 relinquishment of 10 of the licence area is required at the end of the first exploration period In both blocks at the end of the third period all areas not retained for appraisal and development are to be relinquished There are also provisions for an exploitation period with the total term of the licences being 30 years (including the exploration periods) for each development area
The area of the licence is 1296 km2 for Block A1 and 1376 km2 for Block A4 Water depths vary from 500 m to over 3000 m
Figure 1-3 Location of Gambia Blocks A1 and A4
Competent Personrsquos Report African Petroleum Corporation Limited
June 2013 18
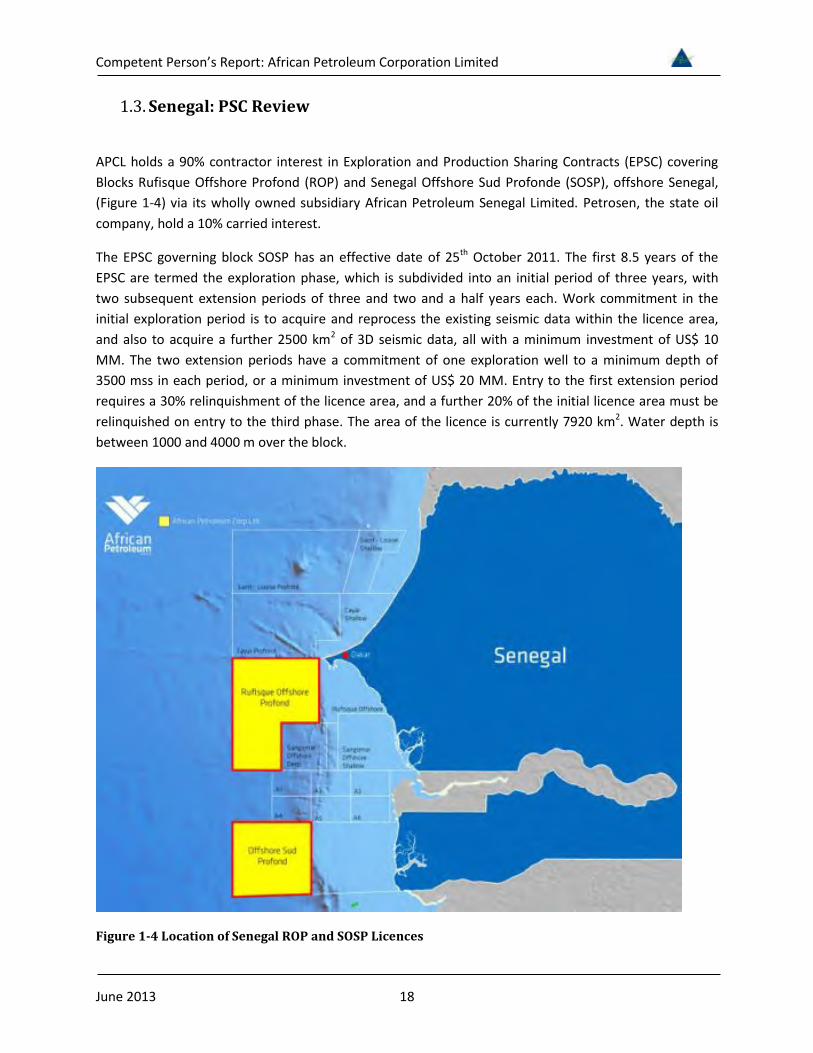
13Senegal PSC Review
APCL holds a 90 contractor interest in Exploration and Production Sharing Contracts (EPSC) covering Blocks Rufisque Offshore Profond (ROP) and Senegal Offshore Sud Profonde (SOSP) offshore Senegal (Figure 1-4) via its wholly owned subsidiary African Petroleum Senegal Limited Petrosen the state oil company hold a 10 carried interest
The EPSC governing block SOSP has an effective date of 25th October 2011 The first 85 years of the EPSC are termed the exploration phase which is subdivided into an initial period of three years with two subsequent extension periods of three and two and a half years each Work commitment in the initial exploration period is to acquire and reprocess the existing seismic data within the licence area and also to acquire a further 2500 km2 of 3D seismic data all with a minimum investment of US$ 10 MM The two extension periods have a commitment of one exploration well to a minimum depth of 3500 mss in each period or a minimum investment of US$ 20 MM Entry to the first extension period requires a 30 relinquishment of the licence area and a further 20 of the initial licence area must be relinquished on entry to the third phase The area of the licence is currently 7920 km2 Water depth is between 1000 and 4000 m over the block
Figure 1-4 Location of Senegal ROP and SOSP Licences
Competent Personrsquos Report African Petroleum Corporation Limited
June 2013 19
The EPSC governing Block ROP is of similar structure to that governing Block SOSP It has an effective date of 25th October 2011 The first eight years of the EPSC are termed the exploration phase which is subdivided into an initial period of four years with two subsequent extension periods of two years each Work commitment in the initial exploration period is to acquire the existing seismic data within the licence area for a minimum of US$ 2 MM and drill one exploration well to a minimum depth of 3500 m TVDSS or a minimum investment of US$ 20 MM The two extension periods have a further commitment of one exploration well to a minimum depth of 3500 m TVDSS in each period or a minimum investment of US$ 20 MM Entry to the first extension period requires a 30 relinquishment of the licence area and a further 20 of the initial licence area must be relinquished on entry to the third period The area of the licence is currently 10357 km2 Water depth is between 1500 and 3000 m over the block
APCL has met the seismic commitment of the first exploration period
Petrosen has a back-in right if an exploitation period is authorised for up to 20 of the licence subject to contribution of its share of forward costs (excluding training) The duration of an exploitation period is 25 years from authorisation with option for two ten year extensions at the discretion of the state
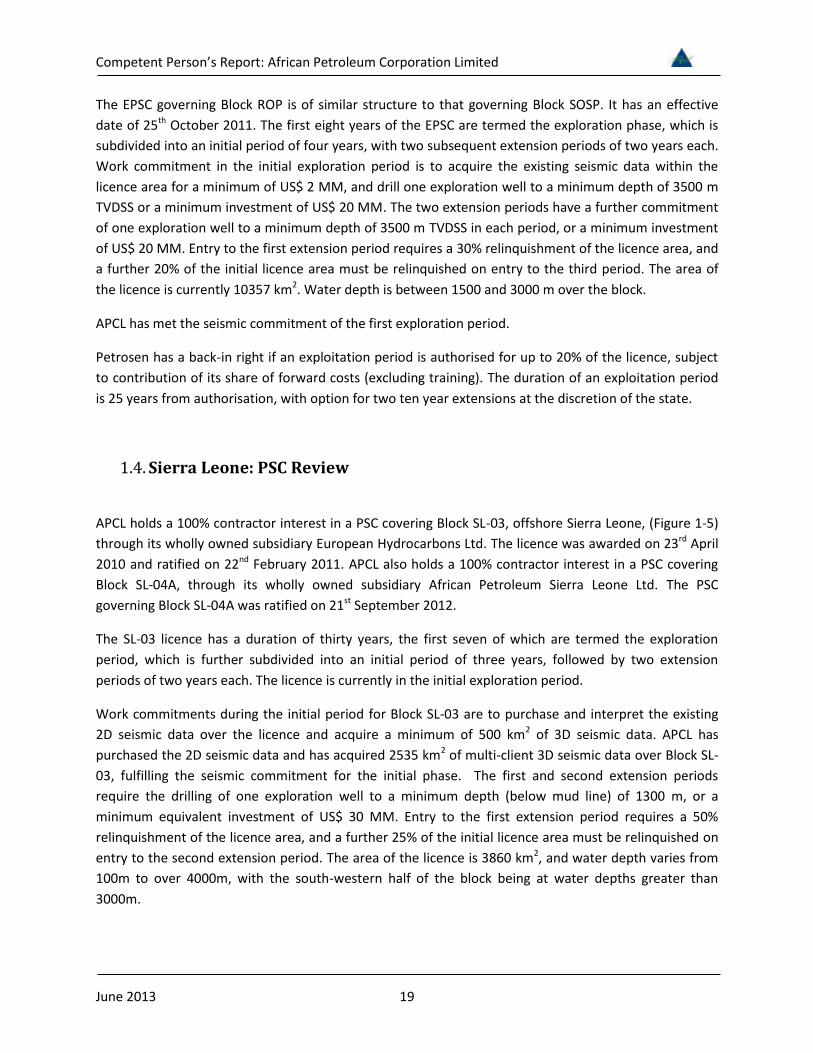
14Sierra Leone PSC Review
APCL holds a 100 contractor interest in a PSC covering Block SL-03 offshore Sierra Leone (Figure 1-5) through its wholly owned subsidiary European Hydrocarbons Ltd The licence was awarded on 23rd April 2010 and ratified on 22nd February 2011 APCL also holds a 100 contractor interest in a PSC covering Block SL-04A through its wholly owned subsidiary African Petroleum Sierra Leone Ltd The PSC governing Block SL-04A was ratified on 21st September 2012
The SL-03 licence has a duration of thirty years the first seven of which are termed the exploration period which is further subdivided into an initial period of three years followed by two extension periods of two years each The licence is currently in the initial exploration period
Work commitments during the initial period for Block SL-03 are to purchase and interpret the existing 2D seismic data over the licence and acquire a minimum of 500 km2 of 3D seismic data APCL has purchased the 2D seismic data and has acquired 2535 km2 of multi-client 3D seismic data over Block SL-03 fulfilling the seismic commitment for the initial phase The first and second extension periods require the drilling of one exploration well to a minimum depth (below mud line) of 1300 m or a minimum equivalent investment of US$ 30 MM Entry to the first extension period requires a 50 relinquishment of the licence area and a further 25 of the initial licence area must be relinquished on entry to the second extension period The area of the licence is 3860 km2 and water depth varies from 100m to over 4000m with the south-western half of the block being at water depths greater than 3000m
Competent Personrsquos Report African Petroleum Corporation Limited
June 2013 20
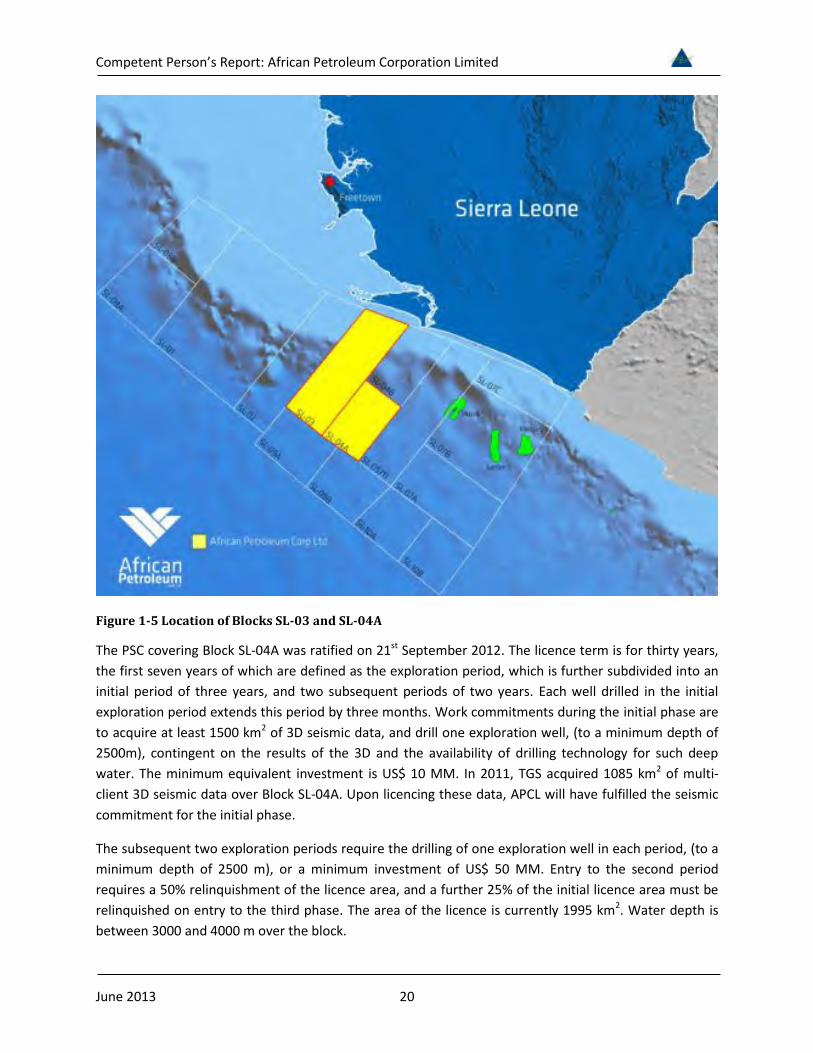
Figure 1-5 Location of Blocks SL-03 and SL-04A
The PSC covering Block SL-04A was ratified on 21st September 2012 The licence term is for thirty years the first seven years of which are defined as the exploration period which is further subdivided into an initial period of three years and two subsequent periods of two years Each well drilled in the initial exploration period extends this period by three months Work commitments during the initial phase are to acquire at least 1500 km2 of 3D seismic data and drill one exploration well (to a minimum depth of 2500m) contingent on the results of the 3D and the availability of drilling technology for such deep water The minimum equivalent investment is US$ 10 MM In 2011 TGS acquired 1085 km2 of multi-client 3D seismic data over Block SL-04A Upon licencing these data APCL will have fulfilled the seismic commitment for the initial phase
The subsequent two exploration periods require the drilling of one exploration well in each period (to a minimum depth of 2500 m) or a minimum investment of US$ 50 MM Entry to the second period requires a 50 relinquishment of the licence area and a further 25 of the initial licence area must be relinquished on entry to the third phase The area of the licence is currently 1995 km2 Water depth is between 3000 and 4000 m over the block
Competent Personrsquos Report African Petroleum Corporation Limited
June 2013 21
The state retains the right to a 10 carried interest during any development phase in both licences with the option to acquire a further 5 by covering an equivalent proportion of any development costs
15Cote13 drsquoIvoire13 PSC13 Review
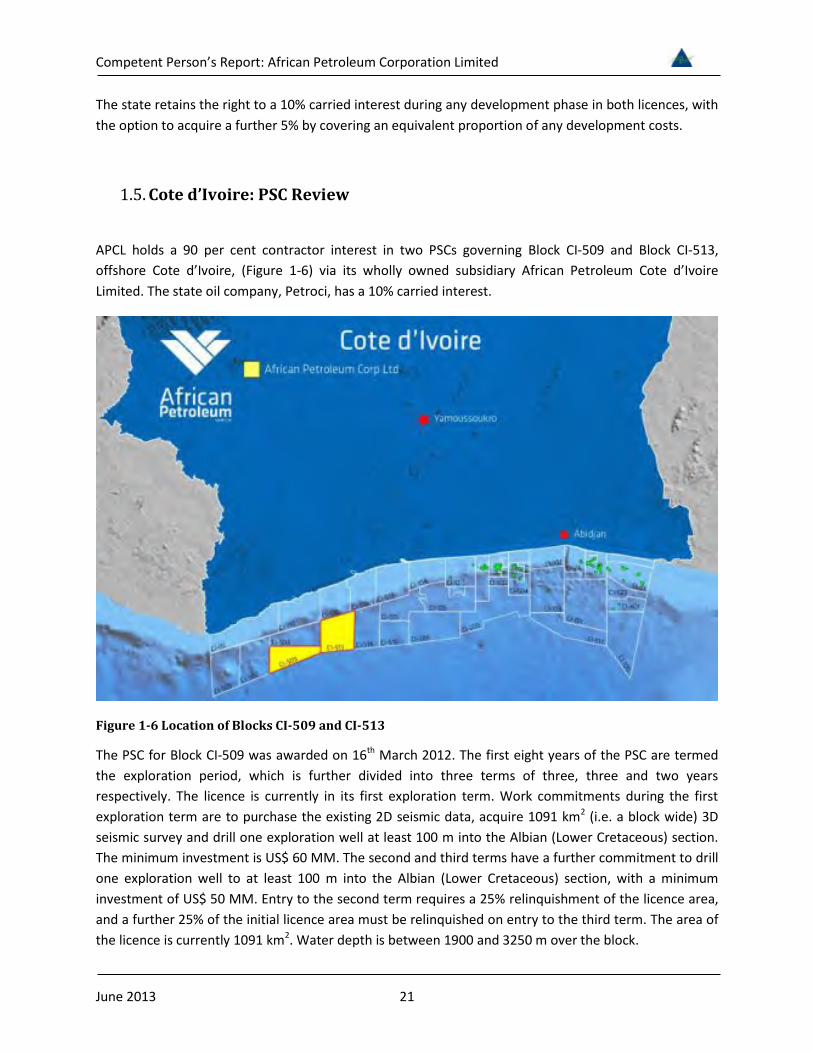
APCL holds a 90 per cent contractor interest in two PSCs governing Block CI-509 and Block CI-513 offshore Cote drsquoIvoire (Figure 1-6) via its wholly owned subsidiary African Petroleum Cote drsquoIvoire Limited The state oil company Petroci has a 10 carried interest
Figure 1-6 Location of Blocks CI-509 and CI-513
The PSC for Block CI-509 was awarded on 16th March 2012 The first eight years of the PSC are termed the exploration period which is further divided into three terms of three three and two years respectively The licence is currently in its first exploration term Work commitments during the first exploration term are to purchase the existing 2D seismic data acquire 1091 km2 (ie a block wide) 3D seismic survey and drill one exploration well at least 100 m into the Albian (Lower Cretaceous) section The minimum investment is US$ 60 MM The second and third terms have a further commitment to drill one exploration well to at least 100 m into the Albian (Lower Cretaceous) section with a minimum investment of US$ 50 MM Entry to the second term requires a 25 relinquishment of the licence area and a further 25 of the initial licence area must be relinquished on entry to the third term The area of the licence is currently 1091 km2 Water depth is between 1900 and 3250 m over the block
Competent Personrsquos Report African Petroleum Corporation Limited
June 2013 22
The PSC covering Block CI-513 has an effective date of 19th December 2011 It has a similar structure to that governing Block CI-509 The first seven years are termed the exploration period subdivided into three terms of three two and two years The licence is currently in its first exploration term Work commitments during the first exploration term are to purchase the existing 2D seismic data acquire 1446 km2 (ie a block wide) 3D seismic survey and drill one exploration well at least 100 m into the Albian (Lower Cretaceous) section The minimum investment is US$ 60 MM The second and third terms have a further commitment to drill one exploration well to at least 100 m into the Albian (Lower Cretaceous) section with a minimum investment of US$ 50 MM Entry to the second term requires a 25 relinquishment of the licence area and a further 25 of the initial licence area must be relinquished on entry to the third term The area under licence is currently 1446 km2 Water depth is between 900 and 3100 m over the block
The exploitation period of both licences is for 25 years subject to successful award in the event of a commercial discovery On development Petroci has the right to acquire an interest of up to 20 in each licence subject to payment of its portion of future costs
In October 2012 APCL completed acquisition of 4200 km2 of 3D seismic data covering blocks CI-508 CI-509 and CI-513 fulfilling the seismic work commitments of the first exploration phase of both PSCs APCL is planning a two well drilling programme for the licences during 2014
16Evaluation Methodology Prospective Resources
We have used probabilistic methods to evaluate selected prospects within Liberia Blocks 8 and 9 Gambia Blocks A1 and A4 Sierra Leone Block SL-03 and Cote drsquoIvoire Blocks CI-513 and CI-509 We classify the results of our simulation as Low Best and High estimates of prospective resources following the Petroleum Resources Management System or PRMS (Appendix 1) We have assigned geological chance of success to each of the prospects using the methodology described below Estimates are made for oil only although we recognise that due to the significant uncertainties in the available geological information that there is a possibility of gas charge in all licences We present a summary of input estimates output STOIIP and gross resources and geological chance of success as a resource summary sheet for each prospective interval investigated These can be found in the enclosures 11 to 45 in this document
Inputs to our probabilistic simulation are evaluated in a consistent manner For the structurally trapped prospective intervals in Liberia (the Lovebird and Wildbird prospects) and the Alhamdulilah prospect in Gambia we have made a low and high deterministic estimate of closing contour for each trap to reflect the uncertainty in both mapping and depth conversion For Liberia we use the gross-rock volume (GRV) derived in this manner to constrain the P90 and P10 of our GRV distribution in our probabilistic simulation For Gambia we have used the areal extents of the low and high cases as inputs to an area times net calculation
Competent Personrsquos Report African Petroleum Corporation Limited
June 2013 23
For the stratigraphically trapped prospects in Liberia (Barbet Night Heron and Sunbird) Cote drsquoIvoire (Sassandra Ayame Ayame West Cavalla and Leraba) and Sierra Leone (Altair) we have made low and high estimates of area of closure using both structural and amplitude support where possible We have then made low and high estimates of gross reservoir thickness derived from regional observations calibrated against seismic data where possible As such depositional systems also have laterally variable sand distributions often supported by seismic data we employ the concept of an areal net to gross ratio varying the percentage of sand areally within the overall stratigraphic trap based on the uncertainty in seismic amplitude strength Where appropriate a geological shape factor is used depending on trap shape and structural relief relative to reservoir thickness
Estimates of reservoir porosity and net to gross ratio are made with reference to regional data offset wells including recent drilling by APCL in Liberia and account for compaction and a degree of overpressure (Figure 2-4) We make low mid and high deterministic estimates and use these to constrain the P90 P50 and P10 inputs to a probabilistic simulation Inputs for hydrocarbon saturation are constrained in a similar manner with reference to regional porosity and permeability trends calibrated to APCLrsquos recent drilling results in Liberia
We have estimated oil formation volume factors for a range of gas oil ratios (GOR) (from an appropriate minimum to fully saturated) for each of the prospective intervals assuming 4oC at the mudline (seabed) and geothermal gradients between 25 and 35oC per 100 m consistent with regional observation and the available well data We assume that the minimum GOR will increase with depth below the mudline Our estimates are calibrated against the oil samples in Well Narina-1 when estimating resources for the Liberian prospects
Some degree of overpressure is accounted for as it has been in our estimates of porosity but by reference to offset discoveries we assume that it is unlikely to exceed 500 psi over the depth range investigated
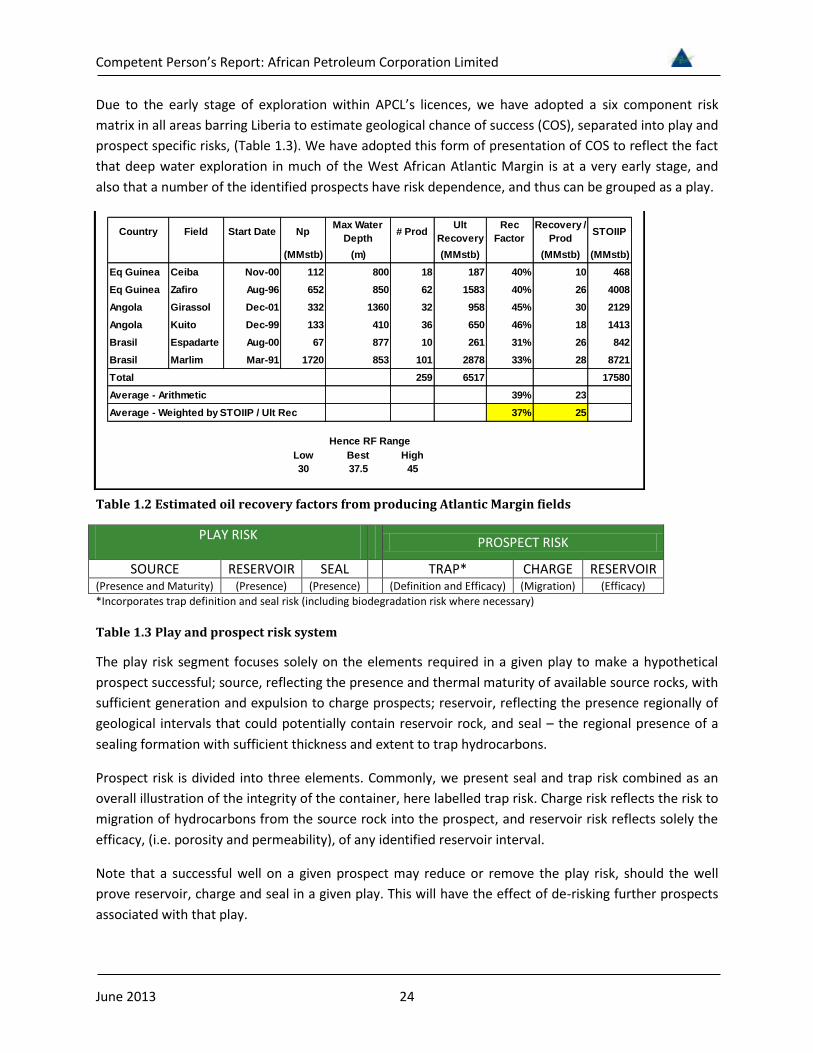
Recovery factors for the clastic reservoirs are estimated with reference to published information from discoveries in similar reservoir types examples of which are tabulated below (Table 12) Based on this table we estimate low best and high recovery factors of 30 375 and 45 respectively Again these are used to constrain the P90 P50 and P10 of our input distribution during probabilistic simulation
Some prospects are deep relative to mud line and we expect reservoir quality to be reduced despite overpressure We reduce our recovery factor estimates accordingly where this is the case Some prospects are relatively shallow to mud line Where this is the case we model a more viscous oil (prospects materially less than 1500m below sea bed) and have reduced our low best and high recovery factor range to 15 275 and 40 respectively In all cases we assume that a development is able to effectively dispose of any associated gas
Recovery factors for the carbonate reservoirs of the Wildbird prospect in Liberia and Prospect M in the Gambia are estimated by reference to more regional analogues and are discussed in the relevant sections
Competent Personrsquos Report African Petroleum Corporation Limited
June 2013 24
Due to the early stage of exploration within APCLrsquos licences we have adopted a six component risk matrix in all areas barring Liberia to estimate geological chance of success (COS) separated into play and prospect specific risks (Table 13) We have adopted this form of presentation of COS to reflect the fact that deep water exploration in much of the West African Atlantic Margin is at a very early stage and also that a number of the identified prospects have risk dependence and thus can be grouped as a play
Table 12 Estimated oil recovery factors from producing Atlantic Margin fields
PLAY RISK PROSPECT RISK
SOURCE RESERVOIR SEAL TRAP CHARGE RESERVOIR (Presence and Maturity) (Presence) (Presence) (Definition and Efficacy) (Migration) (Efficacy) Incorporates trap definition and seal risk (including biodegradation risk where necessary)
Table 13 Play and prospect risk system
The play risk segment focuses solely on the elements required in a given play to make a hypothetical prospect successful source reflecting the presence and thermal maturity of available source rocks with sufficient generation and expulsion to charge prospects reservoir reflecting the presence regionally of geological intervals that could potentially contain reservoir rock and seal ndash the regional presence of a sealing formation with sufficient thickness and extent to trap hydrocarbons
Prospect risk is divided into three elements Commonly we present seal and trap risk combined as an overall illustration of the integrity of the container here labelled trap risk Charge risk reflects the risk to migration of hydrocarbons from the source rock into the prospect and reservoir risk reflects solely the efficacy (ie porosity and permeability) of any identified reservoir interval
Note that a successful well on a given prospect may reduce or remove the play risk should the well prove reservoir charge and seal in a given play This will have the effect of de-risking further prospects associated with that play
Country Field Start Date Np Max Water Depth Prod Ult
RecoveryRec
FactorRecovery
Prod STOIIP
(MMstb) (m) (MMstb) (MMstb) (MMstb)Eq Guinea Ceiba Nov-00 112 800 18 187 40 10 468Eq Guinea Zafiro Aug-96 652 850 62 1583 40 26 4008Angola Girassol Dec-01 332 1360 32 958 45 30 2129Angola Kuito Dec-99 133 410 36 650 46 18 1413Brasil Espadarte Aug-00 67 877 10 261 31 26 842Brasil Marlim Mar-91 1720 853 101 2878 33 28 8721Total 259 6517 17580Average - Arithmetic 39 23Average - Weighted by STOIIP Ult Rec 37 25
Low Best High30 375 45
Fields on Atlantic Margin with significant production
Hence RF Range
Competent Personrsquos Report African Petroleum Corporation Limited
June 2013 25
Recent drilling within Liberia Blocks 8 and 9 has de-risked the play As a result we adopt prospect specific risking alone as source reservoir trap and seal with the same definitions as described above (Table 13)
Competent Personrsquos Report African Petroleum Corporation Limited
June 2013 26
2 Liberia Prospectivity and Plays
21Introduction
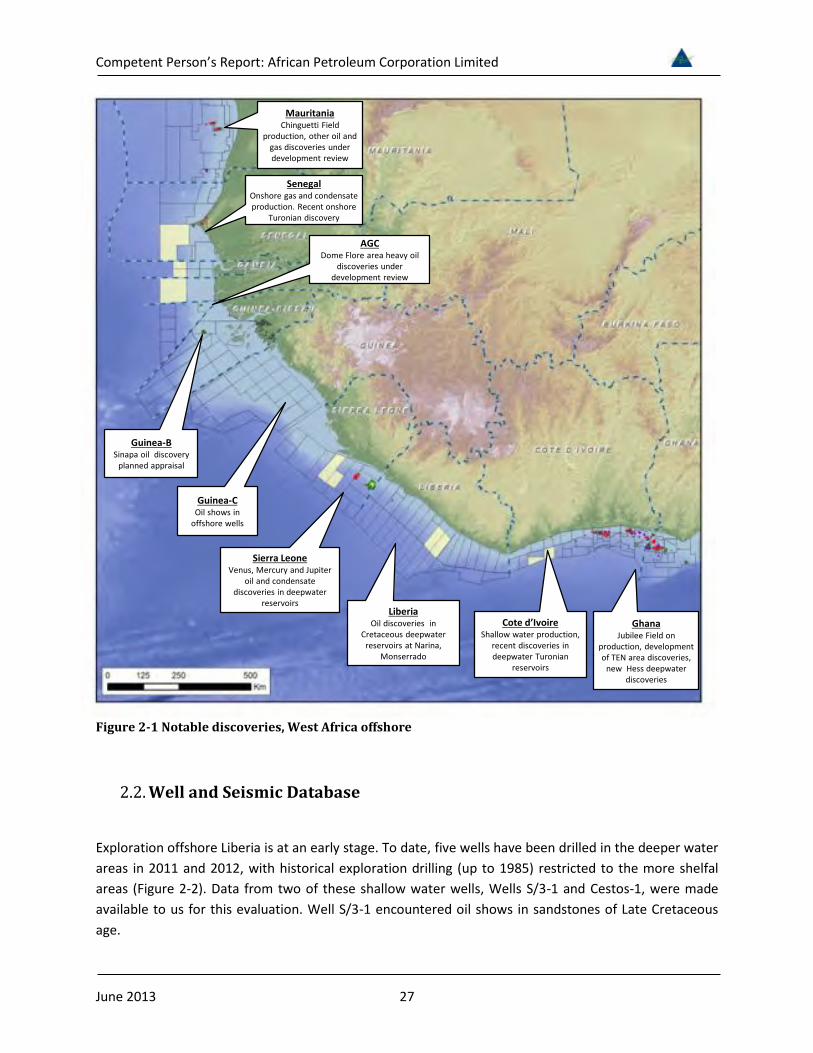
All of the available deep-water acreage offshore Liberia-Sierra Leone basin is under licence (Figure 1-2) Regionally hydrocarbons have been discovered within sandstones at a number of stratigraphic levels from the pre-rift to early syn-rift Albian in Cote drsquoIvoire (Espoir Foxtrot fields and a number of other discoveries) to turbiditic sandstones that have Late Cretaceous (CenomanianTuronian MaastrichtianConiacian) to early Tertiary (Palaeocene to Eocene) ages Recent drilling offshore Ghana has yielded a number of discoveries within these Upper Cretaceous sandstones such as the Jubilee oil field and the Enyenra Tweneboa and Odum oil and gascondensate discoveries In the Liberia-Sierra Leone basin recent drilling has yielded six hydrocarbon discoveries (Bee Eater Narina Monterrado Mercury Venus and Jupiter) but as yet none has been declared commercial (Figure 2-1) Although reservoir quality in the Albian sandstones is variable reservoir quality in the Upper Cretaceous and Tertiary sandstones is often good Successful trap types encountered regionally are both structural and stratigraphic
Of significance to the evaluation of the petroleum systems of Blocks 8 and 9 APCL have drilled three wells within the deeper water parts of the blocks Wells Apalis-1 Narina-1 and Bee Eater-1 Well Apalis-1 found source rock intervals of Albian to Cenomanian age but failed to find the prognosed reservoir Well Narina-1 found light oil within deep-marine sandstones of Cretaceous age The sandstones were of variable reservoir quality as the well appears to have been drilled on the edge of a fan system which can be interpreted from seismic data The extent of the Turonian hydrocarbon bearing interval around Well Narina-1 is currently under investigation by APCL who are working with CGGV to reprocess the 3D multi-client seismic with the hope of identifying areas of favourable reservoir within closure
Well Bee Eater-1 completed in February 2013 also discovered hydrocarbons within similar sandstones of Cretaceous age However the oil bearing Turonian reservoir at Bee Eater is interpreted as being of very low permeability and hence non-commercial APCL interprets that Well Bee Eater-1 was drilled in a canyon system that may have been largely bypassed by sediment input
Both wells demonstrate the viability of Cretaceous petroleum systems within the licence area
Competent Personrsquos Report African Petroleum Corporation Limited
June 2013 27
Figure 2-1 Notable discoveries West Africa offshore
22Well and Seismic Database
Exploration offshore Liberia is at an early stage To date five wells have been drilled in the deeper water areas in 2011 and 2012 with historical exploration drilling (up to 1985) restricted to the more shelfal areas (Figure 2-2) Data from two of these shallow water wells Wells S3-1 and Cestos-1 were made available to us for this evaluation Well S3-1 encountered oil shows in sandstones of Late Cretaceous age
GhanaJubilee Field on
production development of TEN area discoveries
new Hess deepwater discoveries
Cote drsquoIvoireShallow water production
recent discoveries in deepwater Turonian
reservoirs
LiberiaOil discoveries in
Cretaceous deepwater reservoirs at Narina
Monserrado
Sierra LeoneVenus Mercury and Jupiter
oil and condensate discoveries in deepwater
reservoirs
Guinea-COil shows in
offshore wells
Guinea-BSinapa oil discovery
planned appraisal
AGCDome Flore area heavy oil
discoveries under development review
SenegalOnshore gas and condensate production Recent onshore
Turonian discovery
MauritaniaChinguetti Field
production other oil and gas discoveries under development review
Competent Personrsquos Report African Petroleum Corporation Limited
June 2013 28
Figure 2-2 Well and seismic database Liberia Blocks 8 and 9
APCL has drilled three exploration wells offshore Liberia in the deep water part of Block 9 Wells Narina-1 Bee Eater 1 and Apalis-1 (Figure 1-2 Figure 2-2) Well Apalis-1 was drilled in 2011 targeting a four-way dip-closed structure with possible AvO support The well found traces of hydrocarbons plus source rock intervals but the prognosed reservoir sands were absent at target depth and the well was plugged and abandoned
Well Narina-1 was drilled by APCL in 2012 and found 16 to 21 m of net pay (light oil) within sandstones of Turonian (Cretaceous) age Hydrocarbons were also discovered in the underlying Albian Oil samples were collected but no drill-stem testing was undertaken Analysis of the oil samples indicates an API
3D Seismic Area
Competent Personrsquos Report African Petroleum Corporation Limited
June 2013 29
gravity for the Turonian oil of about 38 degrees and about 45 degrees for the Albian hydrocarbons Mobilities from formation pressure measurements and permeability from side-wall core measurements show the reservoir to be of relatively low permeability at this location
Well Bee Eater-1 was drilled by APCL in January and February 2013 The well found oil-bearing sandstones of Cretaceous age but of very low permeability and hence the well is considered non-commercial Post-drill interpretation of the seismic data has helped APCL revise the depositional model for this Turonian fan system The Bee Eater-1 well is interpreted to have encountered a bypass zone in both the Turonian and Cenomanian with immature sandstones that are poorly sorted and tight Post-well mapping of key seismic events tied to Well Bee Eater-1 reveals the possibility of finding better quality sandstones in lsquobasin-floor fanrsquo units down-dip Potentially sealing shale units and source rock units were also found in the Bee-Eater-1 well
Well Apalis-1 and in particular Wells Bee Eater-1 and Narina-1 help de-risk seal and hydrocarbon charge for the Cretaceous play on-block
The primary seismic dataset for our evaluation was the recently acquired 5170 km2 of 3D seismic data over the deeper water area of Blocks 8 and 9 including certain products to review amplitude versus offset (AvO) effects These seismic data cover both recently drilled deep water wells In addition a grid of 2D seismic data was also made available with average line spacing of around 45 km These data provide a tie to Well S3-1 although the well lies some 200m from the nearest seismic line In general the data quality of the 3D volume is good and of suitable fidelity to enable us to undertake our review of identified prospectivity However local complexity in the shallow geology causes the signal to degrade considerably at the prospective levels in certain areas APCL are currently reprocessing these data in an attempt to improve signal quality APCL intend to utilise this dataset to update the CPR in the next 3-6 months It is hoped that these data will support maturation of additional prospects and further clarification of risk and volumes for prospects within this CPR
23Plays and Petroleum Geology Blocks 8 and 9
APCL has identified a number of plays within Blocks 8 and 9 at similar stratigraphic levels to those proven successful elsewhere along the West African margin (Figure 2-3) Recent drilling within Blocks 8 and 9 has demonstrated a working petroleum system within the mid to lower Cretaceous with drilling finding light oil within deep marine sandstones of Turonian age and also in sandstones of Albo-Aptian age
Competent Personrsquos Report African Petroleum Corporation Limited
June 2013 30
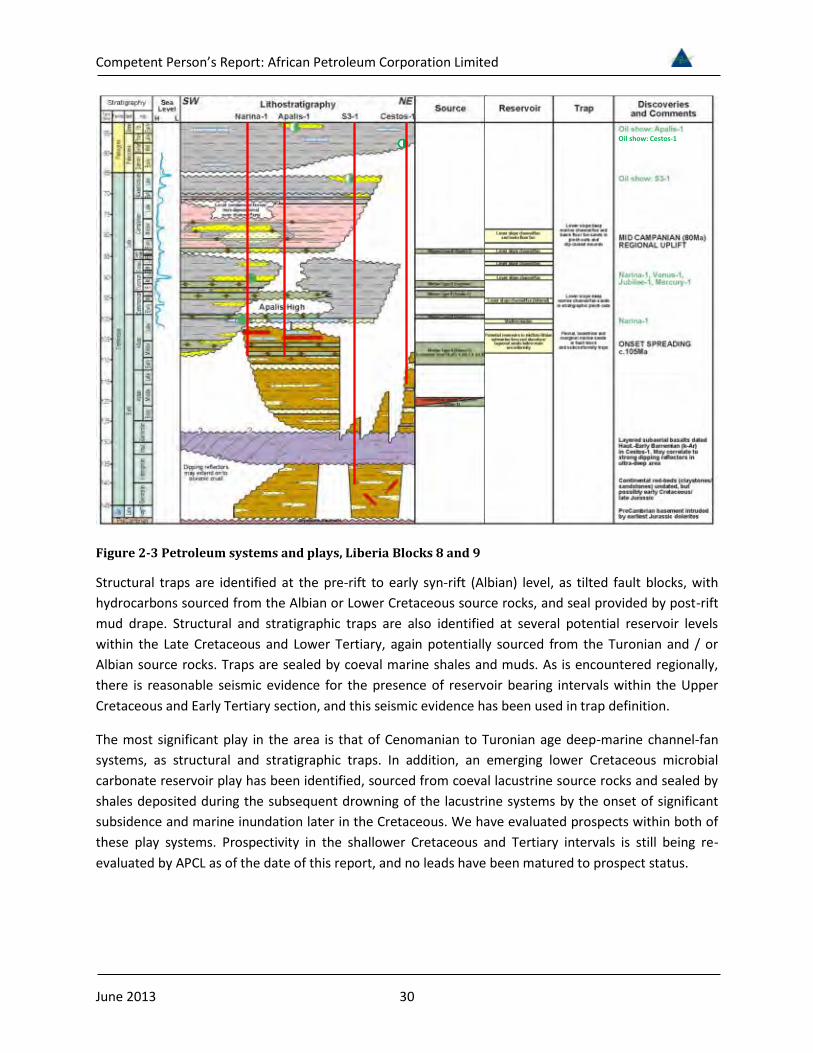
Figure 2-3 Petroleum systems and plays Liberia Blocks 8 and 9
Structural traps are identified at the pre-rift to early syn-rift (Albian) level as tilted fault blocks with hydrocarbons sourced from the Albian or Lower Cretaceous source rocks and seal provided by post-rift mud drape Structural and stratigraphic traps are also identified at several potential reservoir levels within the Late Cretaceous and Lower Tertiary again potentially sourced from the Turonian and or Albian source rocks Traps are sealed by coeval marine shales and muds As is encountered regionally there is reasonable seismic evidence for the presence of reservoir bearing intervals within the Upper Cretaceous and Early Tertiary section and this seismic evidence has been used in trap definition
The most significant play in the area is that of Cenomanian to Turonian age deep-marine channel-fan systems as structural and stratigraphic traps In addition an emerging lower Cretaceous microbial carbonate reservoir play has been identified sourced from coeval lacustrine source rocks and sealed by shales deposited during the subsequent drowning of the lacustrine systems by the onset of significant subsidence and marine inundation later in the Cretaceous We have evaluated prospects within both of these play systems Prospectivity in the shallower Cretaceous and Tertiary intervals is still being re-evaluated by APCL as of the date of this report and no leads have been matured to prospect status
Oil show Cestos-1
Competent Personrsquos Report African Petroleum Corporation Limited
June 2013 31
Figure 2-4 Porositydepth trend published West Africa turbidite reservoirs
24Play and Prospect Risk Liberia Blocks 8 and 9
Of the prospects reviewed all but the Wildbird prospect fall within the Cenomanian to Turonian channelfan play In our opinion recent drilling has de-risked source and reservoir presence for this play However reservoir quality in recent wells is variable In our risking of Cenomanian to Turonian prospectivity (Barbet Sunbird Lovebird and Night Heron prospects) we have removed the play element to our risking matrix and see a low risk to hydrocarbon charge for individual prospects Key risk is therefore to trap integrity and reservoir quality We use a four component risk matrix as outlined in Section 16 to define geological chance of success for these prospects
The Wildbird prospect has been recently identified by APCL as part of its review of further play fairways within the Liberian licences The play concept is of early Aptian bio-constructed carbonate build-ups within the restricted lacustrine environment that existed at this time Porosity and permeability within the bioclastic microbial limestones is potentially enhanced by hydrothermal activity resulting from the early rifting Later post-rift subsidence and drowning by marine conditions provides the top seal via the
0
500
1000
1500
2000
2500
3000
3500
4000
0 01 02 03 04m
Bel
ow S
eabe
dPorosity (fraction)
Porosity versus Depth Trend
Regional West AfricaTurbidite Data
Competent Personrsquos Report African Petroleum Corporation Limited
June 2013 32
deposition of Cretaceous marine muds It is envisaged that the play is charged or by Aptian source rocks deposited in the offset lagoonal facies with possible charge from later (but on-lapping) Cretaceous marine source rocks (as other plays on the blocks) Both potential source rocks provide lateral seal (Figure 2-16) Regionally lacustrine microbial carbonate reservoirs can be found in Congo and Angola where there is some production but also in the Campos and Santos basins in Brazil
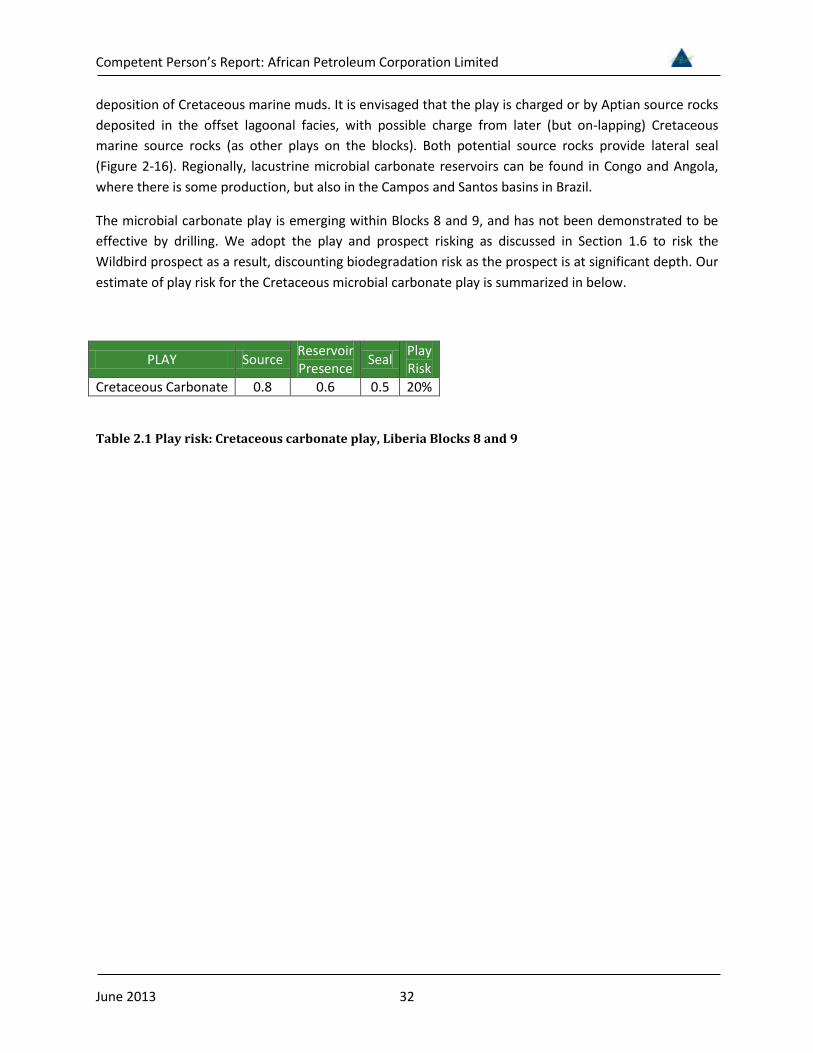
The microbial carbonate play is emerging within Blocks 8 and 9 and has not been demonstrated to be effective by drilling We adopt the play and prospect risking as discussed in Section 16 to risk the Wildbird prospect as a result discounting biodegradation risk as the prospect is at significant depth Our estimate of play risk for the Cretaceous microbial carbonate play is summarized in below
PLAY Source Reservoir Presence Seal Play
Risk Cretaceous Carbonate 08 06 05 20
Table 21 Play risk Cretaceous carbonate play Liberia Blocks 8 and 9
Competent Personrsquos Report African Petroleum Corporation Limited
June 2013 33
25Liberia Blocks 8 and 9 Leads and Prospects
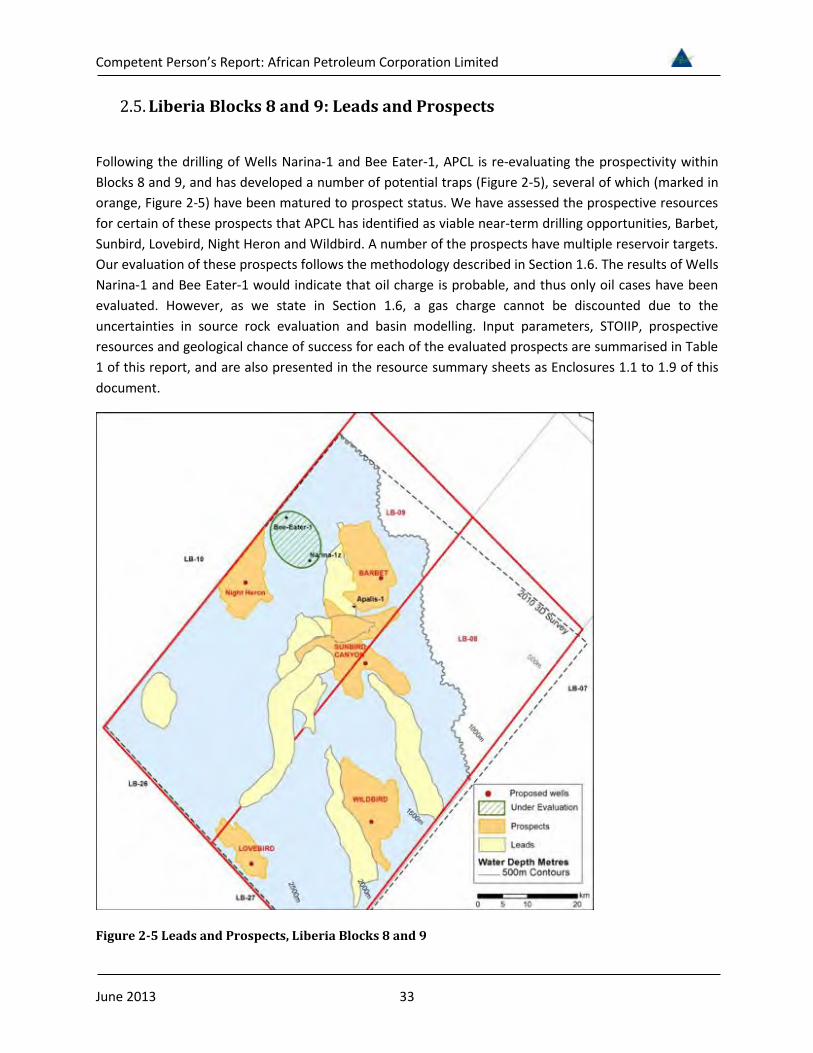
Following the drilling of Wells Narina-1 and Bee Eater-1 APCL is re-evaluating the prospectivity within Blocks 8 and 9 and has developed a number of potential traps (Figure 2-5) several of which (marked in orange Figure 2-5) have been matured to prospect status We have assessed the prospective resources for certain of these prospects that APCL has identified as viable near-term drilling opportunities Barbet Sunbird Lovebird Night Heron and Wildbird A number of the prospects have multiple reservoir targets Our evaluation of these prospects follows the methodology described in Section 16 The results of Wells Narina-1 and Bee Eater-1 would indicate that oil charge is probable and thus only oil cases have been evaluated However as we state in Section 16 a gas charge cannot be discounted due to the uncertainties in source rock evaluation and basin modelling Input parameters STOIIP prospective resources and geological chance of success for each of the evaluated prospects are summarised in Table 1 of this report and are also presented in the resource summary sheets as Enclosures 11 to 19 of this document
Figure 2-5 Leads and Prospects Liberia Blocks 8 and 9
Competent Personrsquos Report African Petroleum Corporation Limited
June 2013 34
ʹǤͷǤͳǤ Barbet Prospect
The Barbet prospect is identified as a stratigraphic trap around 14 km to the east of and up-dip from Well Narina-1 within Block 9 (Figure 2-6) A single target reservoir is mapped within the Turonian Seismic amplitude anomalies are also identified within the area of the trap that may provide support for reservoir development The Turonian is mapped at between 3000 and 3600 m TVDSS over the area of the prospect in a water depth of around 750 to 770 m
Figure 2-6 Seismic line - depth (m TVDSS) over the Barbet prospect
We have used an areanet pay methodology to estimate prospective resources for the Barbet prospect In our low case we restrict the area of the accumulation to the brightest area of anomalous amplitudes on the far offsets Our high case extends the prospect down-dip to include a larger area of anomalous amplitudes above an observed amplitude shut-off (Figure 2-7) These are used to constrain the P90 and P10 inputs of our probabilistic simulation These polygons approximate to an oil column height of 200 and 700 m respectively
Amplitudes are variable within the area of closure and we apply an areal net to gross ratio to better constrain sand distribution within the trap Gross reservoir thickness estimates are computed from the mapped seismic interval net to gross ratio from regional analogue and porosity from a regional porositydepth trend (Figure 2-4) Fluid parameters and recovery factors are estimated as described in Section 16
Narina-1 Barbet
Top Turonian
Top Cenomanian
Top Albian
Lwr Turonian (BFF)
Top Turonian
Narina-1
Apalis-1
Albian UC
0 km 2(mss)
W E
Competent Personrsquos Report African Petroleum Corporation Limited
June 2013 35
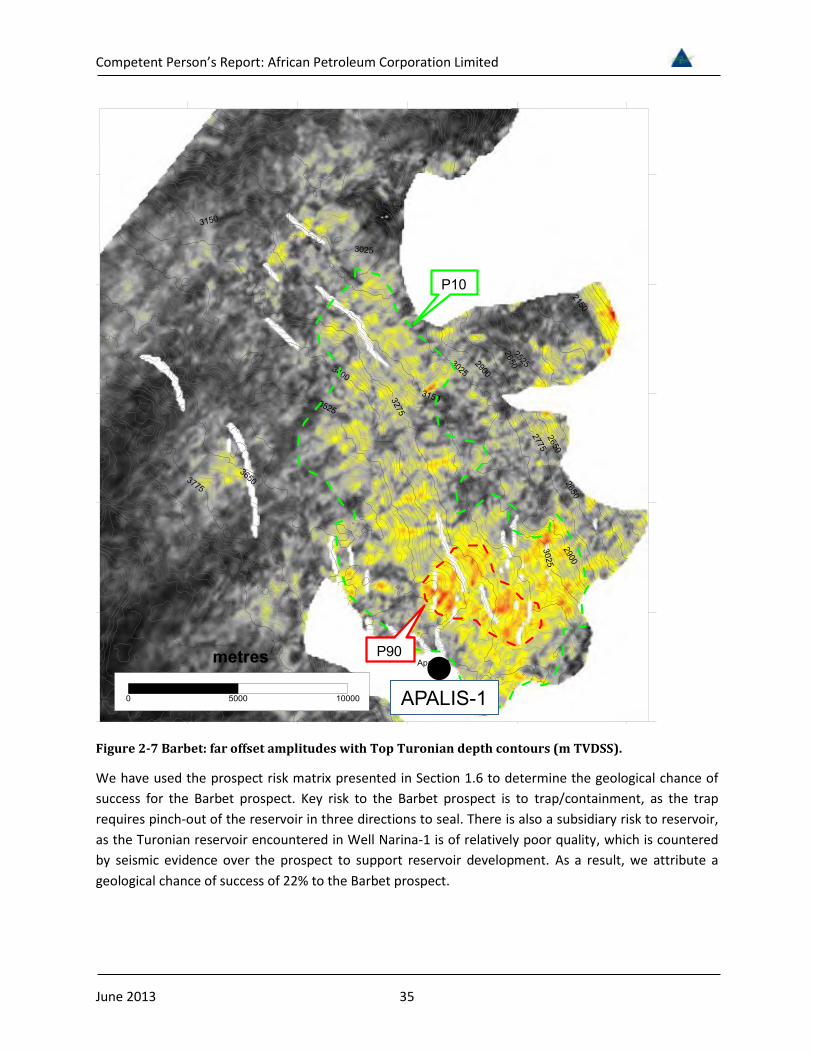
Figure 2-7 Barbet far offset amplitudes with Top Turonian depth contours (m TVDSS)
We have used the prospect risk matrix presented in Section 16 to determine the geological chance of success for the Barbet prospect Key risk to the Barbet prospect is to trapcontainment as the trap requires pinch-out of the reservoir in three directions to seal There is also a subsidiary risk to reservoir as the Turonian reservoir encountered in Well Narina-1 is of relatively poor quality which is countered by seismic evidence over the prospect to support reservoir development As a result we attribute a geological chance of success of 22 to the Barbet prospect
metres
P10
P90metres
APALIS-1
Competent Personrsquos Report African Petroleum Corporation Limited
June 2013 36
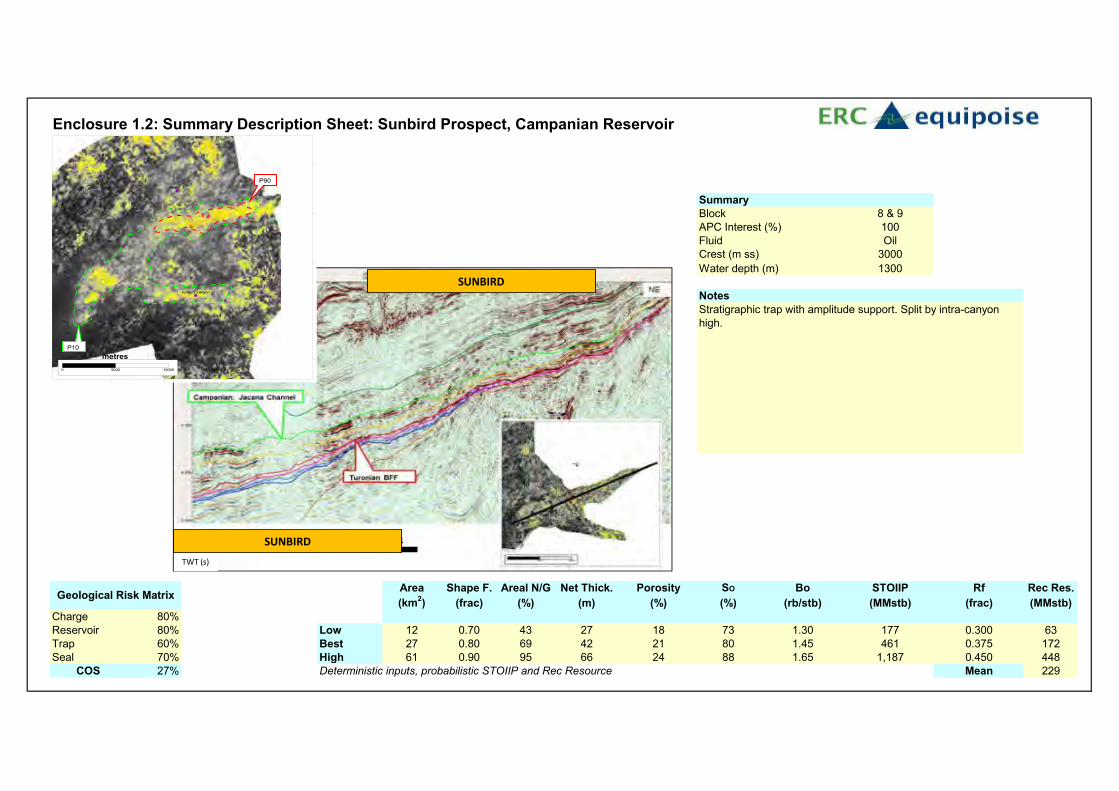
ʹǤͷǤʹǤ Sunbird Canyon Prospect
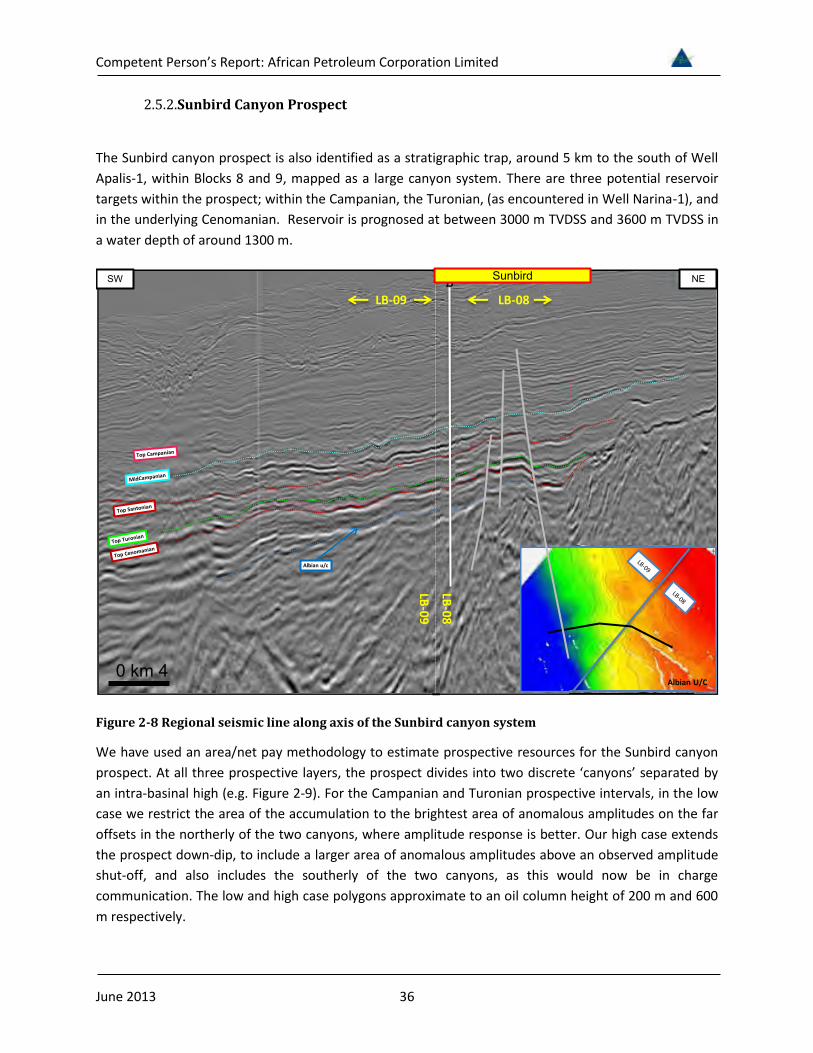
The Sunbird canyon prospect is also identified as a stratigraphic trap around 5 km to the south of Well Apalis-1 within Blocks 8 and 9 mapped as a large canyon system There are three potential reservoir targets within the prospect within the Campanian the Turonian (as encountered in Well Narina-1) and in the underlying Cenomanian Reservoir is prognosed at between 3000 m TVDSS and 3600 m TVDSS in a water depth of around 1300 m
Figure 2-8 Regional seismic line along axis of the Sunbird canyon system
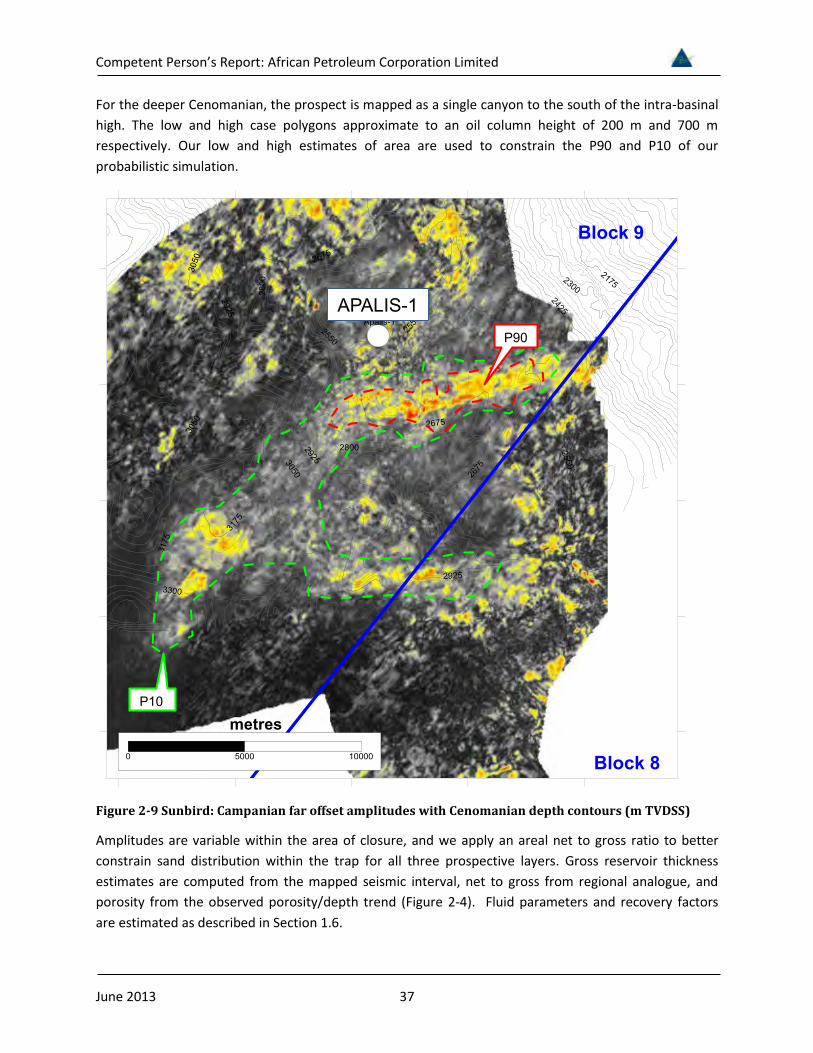
We have used an areanet pay methodology to estimate prospective resources for the Sunbird canyon prospect At all three prospective layers the prospect divides into two discrete lsquocanyonsrsquo separated by an intra-basinal high (eg Figure 2-9) For the Campanian and Turonian prospective intervals in the low case we restrict the area of the accumulation to the brightest area of anomalous amplitudes on the far offsets in the northerly of the two canyons where amplitude response is better Our high case extends the prospect down-dip to include a larger area of anomalous amplitudes above an observed amplitude shut-off and also includes the southerly of the two canyons as this would now be in charge communication The low and high case polygons approximate to an oil column height of 200 m and 600 m respectively
Albian uc
LB-08LB-09
LB-08
LB-09
Albian UC
Sunbird
0 km 4
NESW
Competent Personrsquos Report African Petroleum Corporation Limited
June 2013 37
For the deeper Cenomanian the prospect is mapped as a single canyon to the south of the intra-basinal high The low and high case polygons approximate to an oil column height of 200 m and 700 m respectively Our low and high estimates of area are used to constrain the P90 and P10 of our probabilistic simulation
Figure 2-9 Sunbird Campanian far offset amplitudes with Cenomanian depth contours (m TVDSS)
Amplitudes are variable within the area of closure and we apply an areal net to gross ratio to better constrain sand distribution within the trap for all three prospective layers Gross reservoir thickness estimates are computed from the mapped seismic interval net to gross from regional analogue and porosity from the observed porositydepth trend (Figure 2-4) Fluid parameters and recovery factors are estimated as described in Section 16
metres
P90
P10
Block 9
Block 8
APALIS-1
Competent Personrsquos Report African Petroleum Corporation Limited
June 2013 38
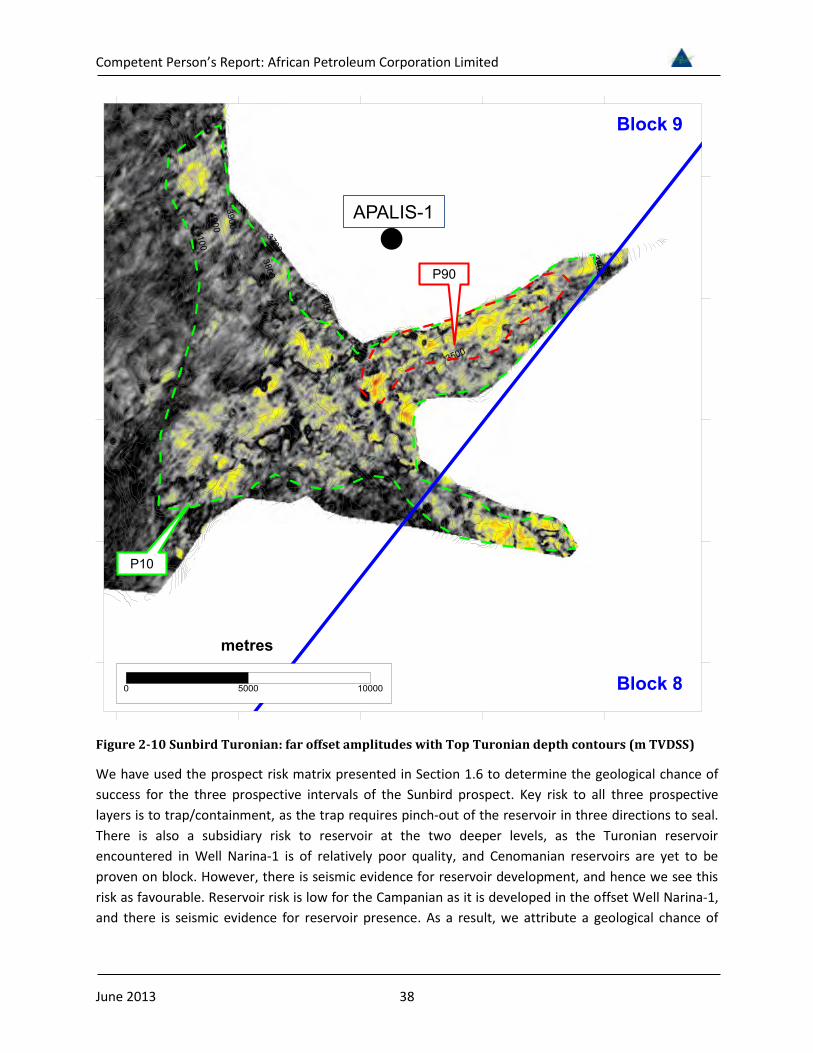
Figure 2-10 Sunbird Turonian far offset amplitudes with Top Turonian depth contours (m TVDSS)
We have used the prospect risk matrix presented in Section 16 to determine the geological chance of success for the three prospective intervals of the Sunbird prospect Key risk to all three prospective layers is to trapcontainment as the trap requires pinch-out of the reservoir in three directions to seal There is also a subsidiary risk to reservoir at the two deeper levels as the Turonian reservoir encountered in Well Narina-1 is of relatively poor quality and Cenomanian reservoirs are yet to be proven on block However there is seismic evidence for reservoir development and hence we see this risk as favourable Reservoir risk is low for the Campanian as it is developed in the offset Well Narina-1 and there is seismic evidence for reservoir presence As a result we attribute a geological chance of
P90
P10
metres
Block 9
Block 8
APALIS-1
Competent Personrsquos Report African Petroleum Corporation Limited
June 2013 39
success of 27 19 and 18 to the Campanian Turonian and Cenomanian prospective intervals of the Sunbird canyon prospect
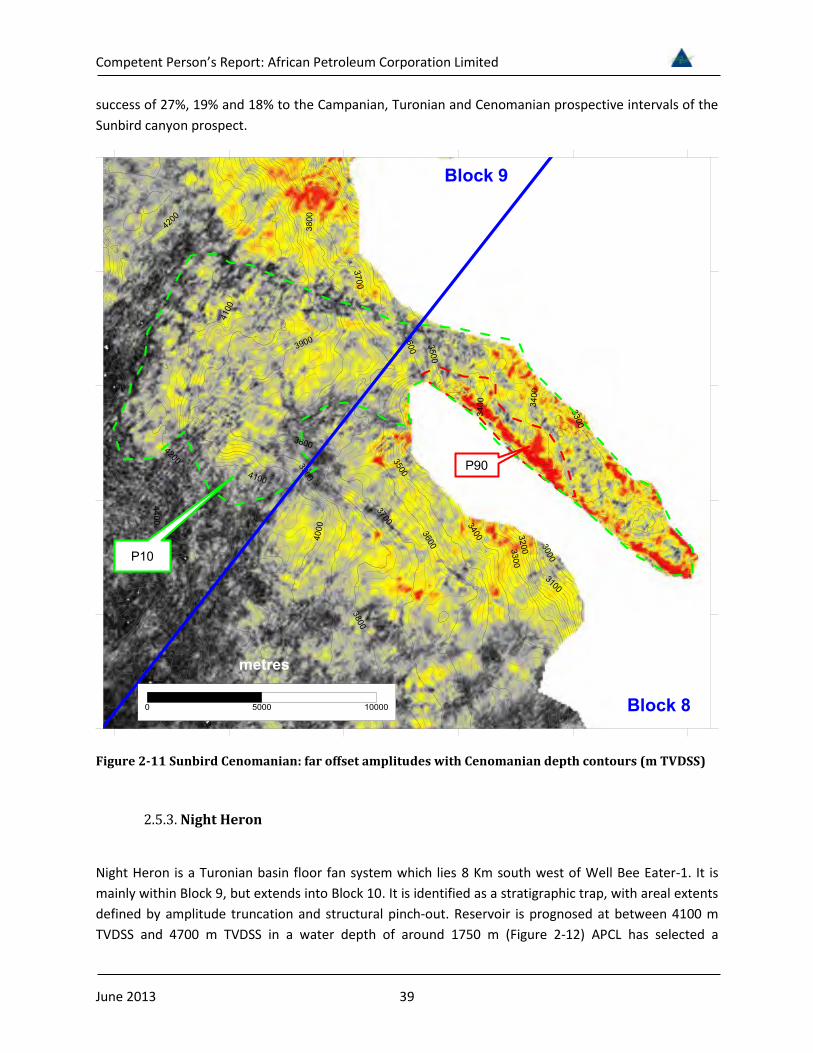
Figure 2-11 Sunbird Cenomanian far offset amplitudes with Cenomanian depth contours (m TVDSS)
ʹǤͷǤ͵Ǥ Night Heron
Night Heron is a Turonian basin floor fan system which lies 8 Km south west of Well Bee Eater-1 It is mainly within Block 9 but extends into Block 10 It is identified as a stratigraphic trap with areal extents defined by amplitude truncation and structural pinch-out Reservoir is prognosed at between 4100 m TVDSS and 4700 m TVDSS in a water depth of around 1750 m (Figure 2-12) APCL has selected a
P90
P10
metres
Block 9
Block 8
Competent Personrsquos Report African Petroleum Corporation Limited
June 2013 40
provisional well location which lies on the 3D survey location ndash In-line 1098 X-line 6103 They are currently seeking partners to drill the Night Heron well in early 2014
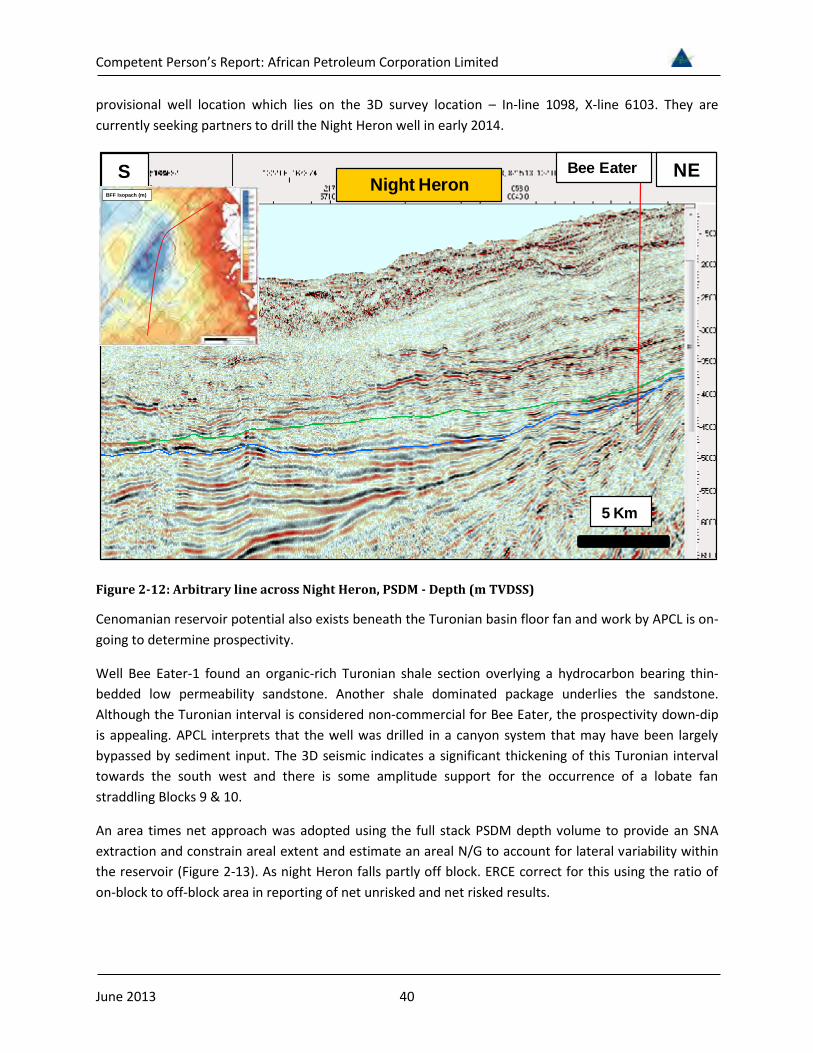
Figure 2-12 Arbitrary line across Night Heron PSDM - Depth (m TVDSS)
Cenomanian reservoir potential also exists beneath the Turonian basin floor fan and work by APCL is on-going to determine prospectivity
Well Bee Eater-1 found an organic-rich Turonian shale section overlying a hydrocarbon bearing thin-bedded low permeability sandstone Another shale dominated package underlies the sandstone Although the Turonian interval is considered non-commercial for Bee Eater the prospectivity down-dip is appealing APCL interprets that the well was drilled in a canyon system that may have been largely bypassed by sediment input The 3D seismic indicates a significant thickening of this Turonian interval towards the south west and there is some amplitude support for the occurrence of a lobate fan straddling Blocks 9 amp 10
An area times net approach was adopted using the full stack PSDM depth volume to provide an SNA extraction and constrain areal extent and estimate an areal NG to account for lateral variability within the reservoir (Figure 2-13) As night Heron falls partly off block ERCE correct for this using the ratio of on-block to off-block area in reporting of net unrisked and net risked results
S NEBee EaterNight Heron
5 Km
BFF Isopach (m)
Competent Personrsquos Report African Petroleum Corporation Limited
June 2013 41
Figure 2-13 SNA from Basin Floor Fan Isopach (m) - PSDM
We have used the prospect risk matrix presented in Section 16 to determine the geological chance of success for the Turonian interval of the Night Heron prospect Recent drilling results suggest that there is a low risk to hydrocarbon charge The observations at Bee Eater-1 also indicate that shale seals are also likely at a coeval interval Reservoir is a significant risk due to the poor Turonian reservoir development in Well Bee Eater-1 The Turonian reservoir encountered in Well Narina-1 is also of relatively poor quality However there is seismic evidence on the 3D survey for a possible improvement in reservoir development over the prospective area The definition of the trap is the key risk as the seismic evidence for closurereservoir pinch-out is ambiguous over the 2D data in Block 10 There appears to be evidence of the reservoir interval thinning in the critical north westerly direction but 3D data would be required to reduce trap risk any further As a result we attribute a geological chance of success of 144 to the Night Heron prospect
3
3
SNA from BFF Isopach
Block Boundary
Competent Personrsquos Report African Petroleum Corporation Limited
June 2013 42
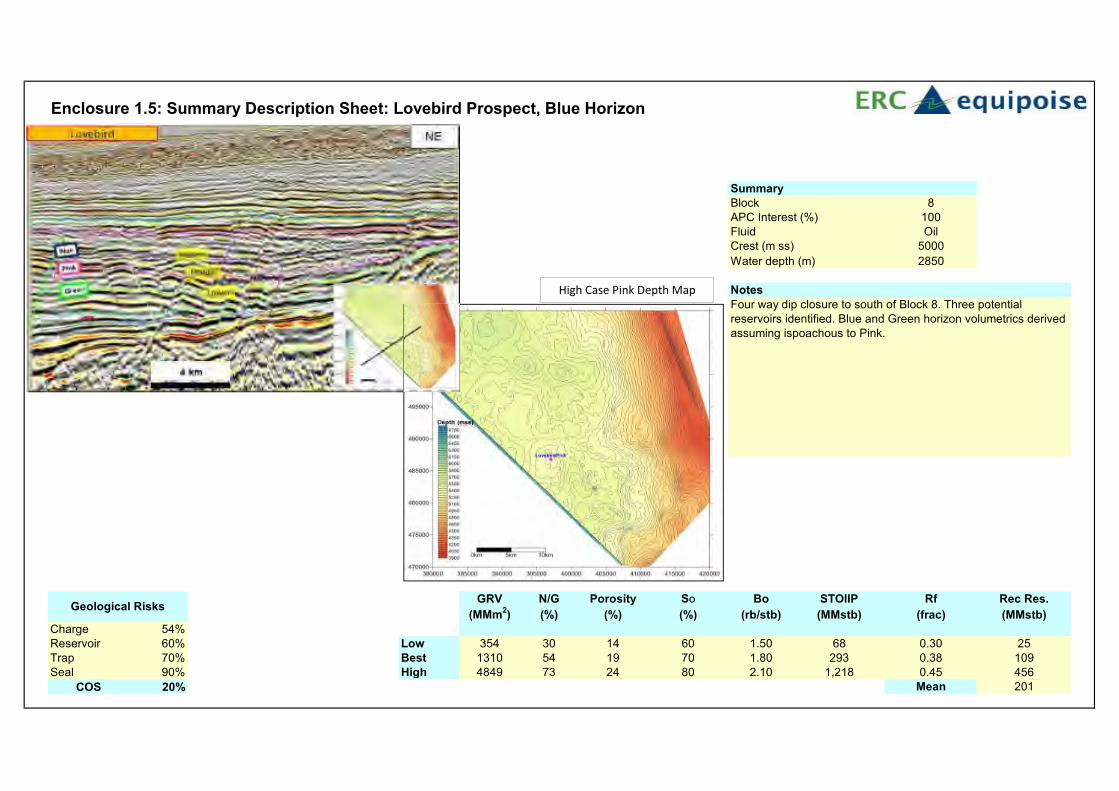
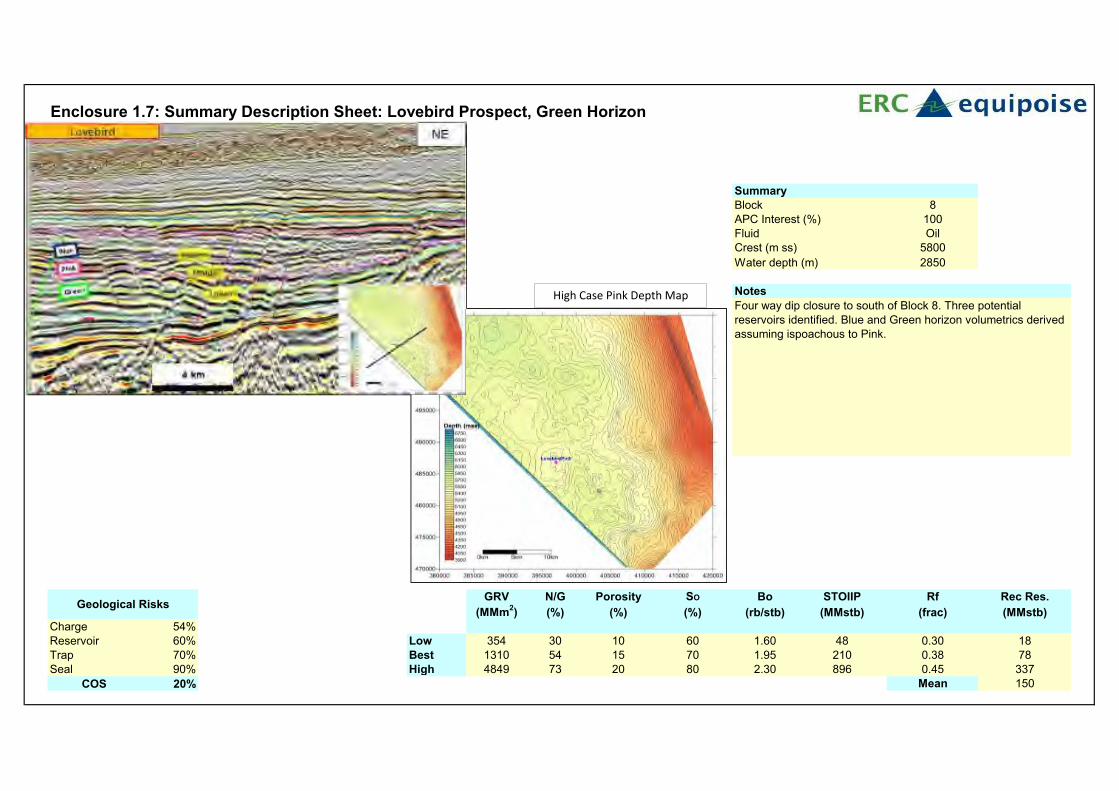
ʹǤͷǤͶǤ Lovebird Prospect
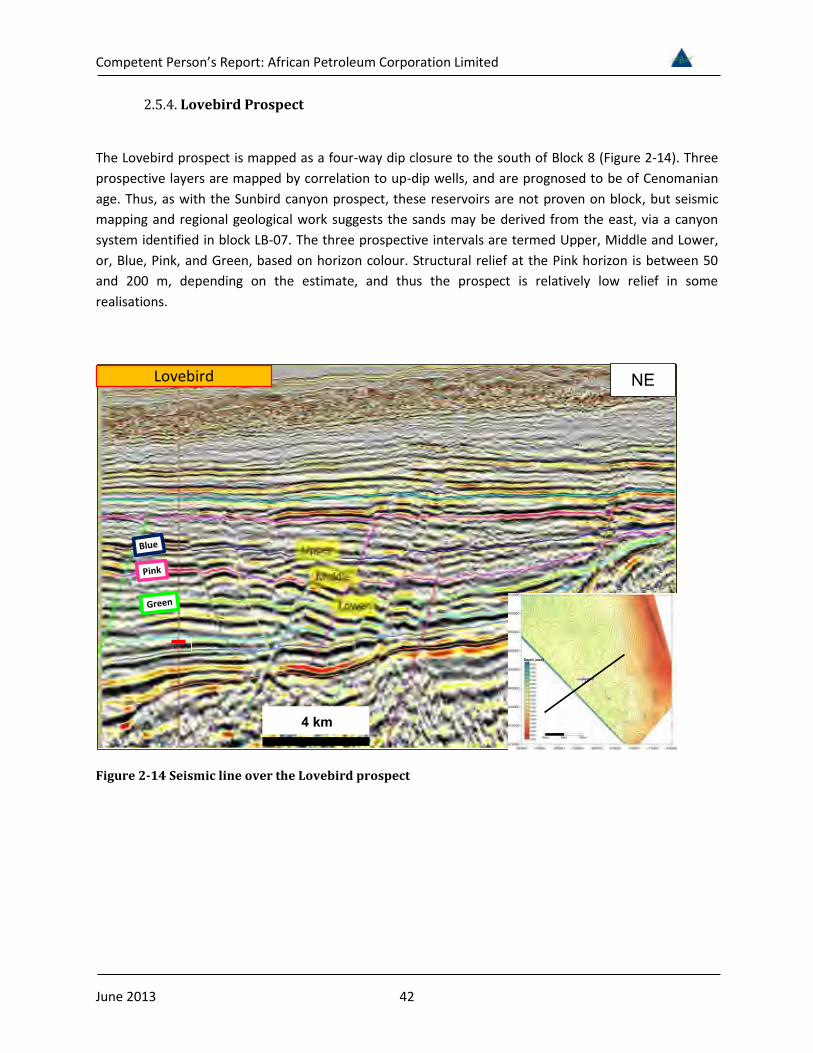
The Lovebird prospect is mapped as a four-way dip closure to the south of Block 8 (Figure 2-14) Three prospective layers are mapped by correlation to up-dip wells and are prognosed to be of Cenomanian age Thus as with the Sunbird canyon prospect these reservoirs are not proven on block but seismic mapping and regional geological work suggests the sands may be derived from the east via a canyon system identified in block LB-07 The three prospective intervals are termed Upper Middle and Lower or Blue Pink and Green based on horizon colour Structural relief at the Pink horizon is between 50 and 200 m depending on the estimate and thus the prospect is relatively low relief in some realisations
Figure 2-14 Seismic line over the Lovebird prospect
Lovebird
Depth (mss)
4 km
NE
Competent Personrsquos Report African Petroleum Corporation Limited
June 2013 43
Figure 2-15 Lovebird prospect Top Pink horizon depth (m TVDSS) high case
The prospect is mapped to the edge of the available 3D (Figure 2-15) which coincides with the southern boundary of Block 8 but closure can be mapped south of the 3D area on the available 2D lines Reservoir depth is prognosed at between 5000 and 5900 m TVDSS in a water depth of 2850 m at the prospect crest Thus reservoir rock if present will be at comparable depths below mud line to the Barbet prospect
We use a gross-rock volumenet to gross methodology to estimate prospective resources for the Lovebird prospect APCLrsquos evaluation of the Lovebird prospect is on-going and of the three interpreted horizons the Pink horizon is the best defined We review pick depth conversion and thickness uncertainty for this interval to generate a range of gross-rock volumes for this interval with the
m ss
metres
Block 9
Block 8
Competent Personrsquos Report African Petroleum Corporation Limited
June 2013 44
prospect full to spill (Figure 2-15) Assuming the Pink horizon provides an accurate representation of the Blue and Green horizons we then estimate gross-rock volumes for these two intervals by isopach
Reservoir thickness and net to gross ratio estimates are derived from regional analogues with reservoir porosity derived from our regional porositydepth trend (Figure 2-4) Fluid properties and recovery factors are estimated as described in Section 16 Our volumetrics are restricted to the portion of the Lovebird prospect on Block 8 We would expect a further evaluation of the prospective resources of the Lovebird prospect to occur subsequent to the completion of the APCL evaluation and the prospective resources associated with the prospect in this report may therefore be subject to change
The key risks to the Lovebird prospect are to the development of reservoir at the prognosed Cenomanian intervals as they are not proved in wells elsewhere on the block and to source as the prospect requires a source rock deeper than that proven by drilling There is also risk to trapcontainment as the structure is not fully defined by the 3D seismic data volume and is of low relief in some realisations We assign a geological chance of success to the Lovebird prospect of 20 as a result
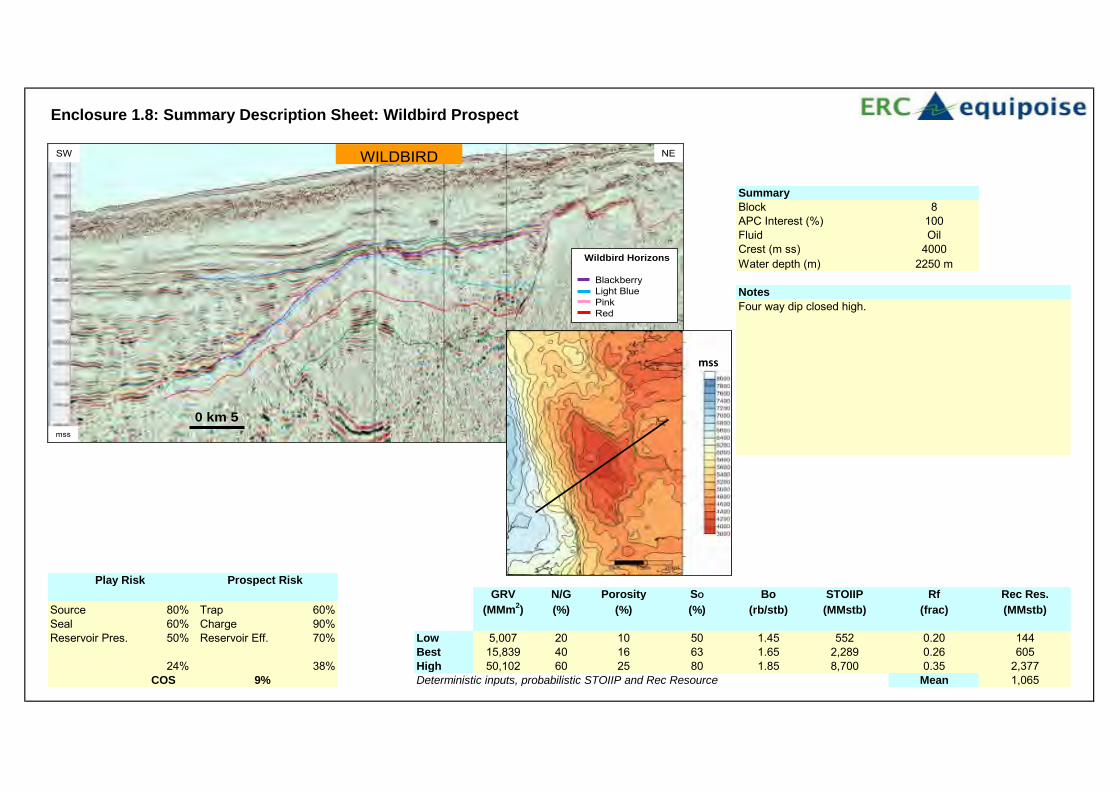
255Wildbird Prospect
The Wildbird prospect is mapped on 3D seismic data towards the south of Block 8 as a large four-way dip-closed high (Figure 2-17) at a depth of between 4000 to 4600 m TVDSS in a water depth of around 2000 m Structural relief is up to 600 m and area of closure up to 170 km2 The conceptual geological model is discussed above but is that the prognosed microbial carbonate reservoir of Albian age is developed between the mapped lsquoredrsquo and lsquolight bluersquo seismic events (Figure 2-16) with lateral seal developed to the north-east of the prospect within contemporaneous lagoonal facies which also provide the primary source rock This lateral seal is required to close the prospect Basin modelling undertaken by APCL suggests that the Albian lagoonal and later Cretaceous source rocks would be mature for oil generation
We have accepted this model as a geological concept and have used it to make estimates of prospective resources for the Wildbird prospect We then risk the model accordingly
Competent Personrsquos Report African Petroleum Corporation Limited
June 2013 45
Figure 2-16 Seismic line and prospect geo-seismic sketch Wildbird prospect
5
0 km 5
SWN
E
mss
Wildbird
Horizons
BlackberryLight BlueRoseRed
Competent Personrsquos Report African Petroleum Corporation Limited
June 2013 46
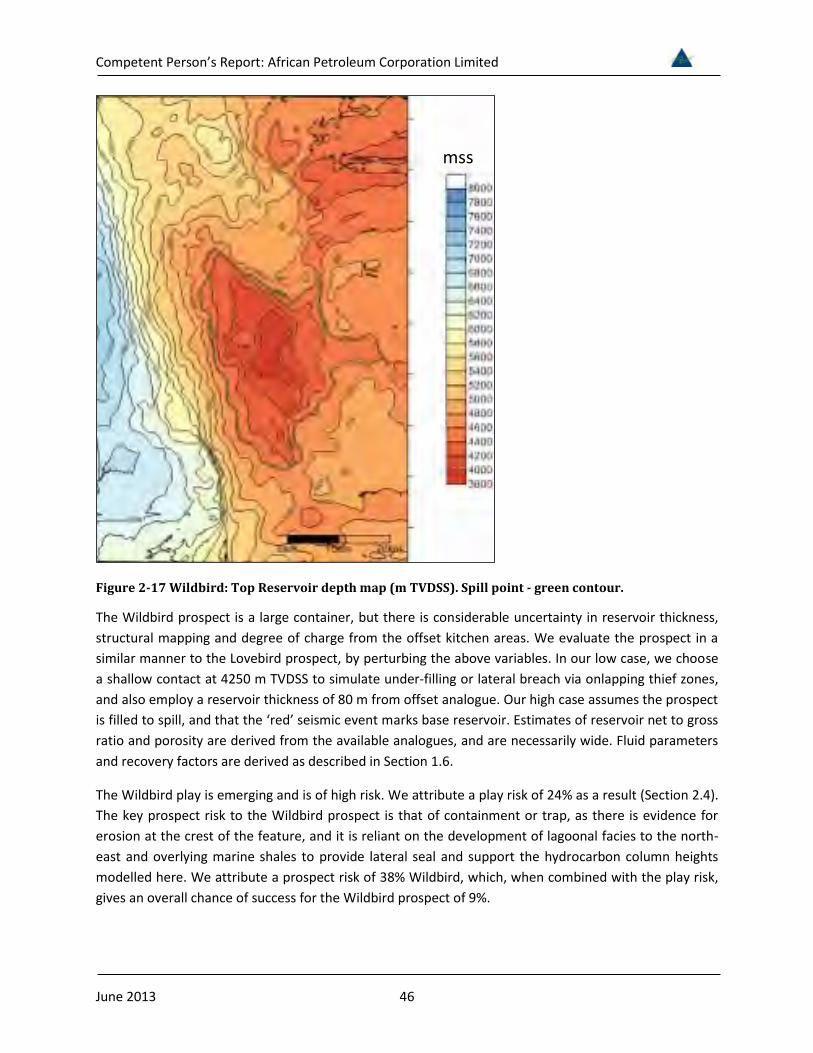
Figure 2-17 Wildbird Top Reservoir depth map (m TVDSS) Spill point - green contour
The Wildbird prospect is a large container but there is considerable uncertainty in reservoir thickness structural mapping and degree of charge from the offset kitchen areas We evaluate the prospect in a similar manner to the Lovebird prospect by perturbing the above variables In our low case we choose a shallow contact at 4250 m TVDSS to simulate under-filling or lateral breach via onlapping thief zones and also employ a reservoir thickness of 80 m from offset analogue Our high case assumes the prospect is filled to spill and that the lsquoredrsquo seismic event marks base reservoir Estimates of reservoir net to gross ratio and porosity are derived from the available analogues and are necessarily wide Fluid parameters and recovery factors are derived as described in Section 16
The Wildbird play is emerging and is of high risk We attribute a play risk of 24 as a result (Section 24) The key prospect risk to the Wildbird prospect is that of containment or trap as there is evidence for erosion at the crest of the feature and it is reliant on the development of lagoonal facies to the north-east and overlying marine shales to provide lateral seal and support the hydrocarbon column heights modelled here We attribute a prospect risk of 38 Wildbird which when combined with the play risk gives an overall chance of success for the Wildbird prospect of 9
mss
Competent Personrsquos Report African Petroleum Corporation Limited
June 2013 47
3 Gambia Prospectivity and Plays
͵ǤͳǤ Introduction
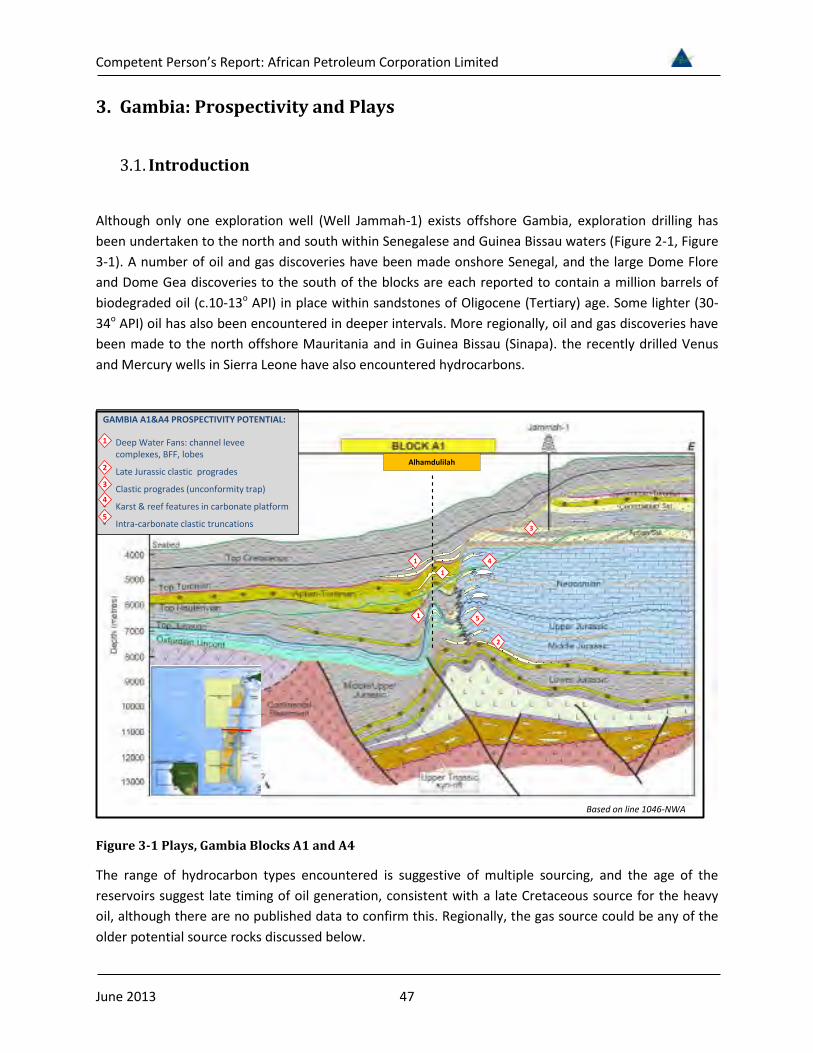
Although only one exploration well (Well Jammah-1) exists offshore Gambia exploration drilling has been undertaken to the north and south within Senegalese and Guinea Bissau waters (Figure 2-1 Figure 3-1) A number of oil and gas discoveries have been made onshore Senegal and the large Dome Flore and Dome Gea discoveries to the south of the blocks are each reported to contain a million barrels of biodegraded oil (c10-13o API) in place within sandstones of Oligocene (Tertiary) age Some lighter (30-34o API) oil has also been encountered in deeper intervals More regionally oil and gas discoveries have been made to the north offshore Mauritania and in Guinea Bissau (Sinapa) the recently drilled Venus and Mercury wells in Sierra Leone have also encountered hydrocarbons
Figure 3-1 Plays Gambia Blocks A1 and A4
The range of hydrocarbon types encountered is suggestive of multiple sourcing and the age of the reservoirs suggest late timing of oil generation consistent with a late Cretaceous source for the heavy oil although there are no published data to confirm this Regionally the gas source could be any of the older potential source rocks discussed below
Alhamdulilah
GAMBIA A1ampA4 PROSPECTIVITY POTENTIAL
Deep Water Fans channel levee complexes BFF lobes
Late Jurassic clastic progrades
Clastic progrades (unconformity trap)
Karst amp reef features in carbonate platform
Intra-carbonate clastic truncations
Based on line 1046-NWA
1
2
3
1
51
14
2
3
4
5
Competent Personrsquos Report African Petroleum Corporation Limited
June 2013 48
32Well and Seismic Database
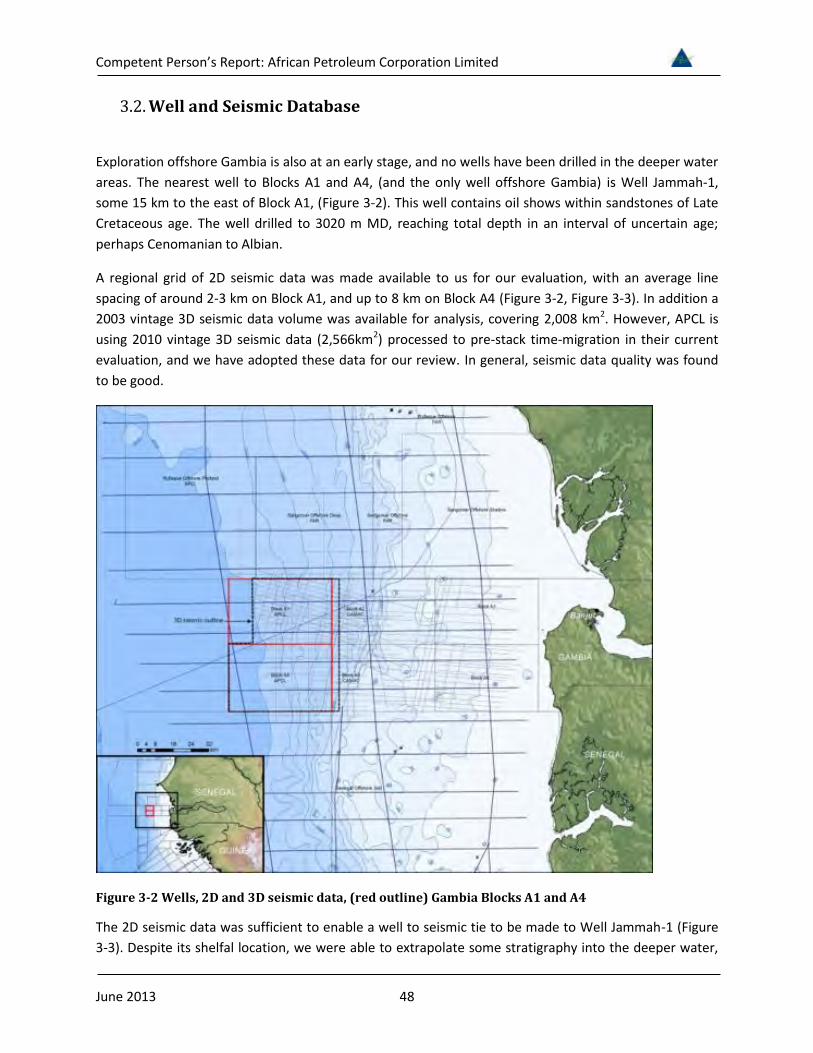
Exploration offshore Gambia is also at an early stage and no wells have been drilled in the deeper water areas The nearest well to Blocks A1 and A4 (and the only well offshore Gambia) is Well Jammah-1 some 15 km to the east of Block A1 (Figure 3-2) This well contains oil shows within sandstones of Late Cretaceous age The well drilled to 3020 m MD reaching total depth in an interval of uncertain age perhaps Cenomanian to Albian
A regional grid of 2D seismic data was made available to us for our evaluation with an average line spacing of around 2-3 km on Block A1 and up to 8 km on Block A4 (Figure 3-2 Figure 3-3) In addition a 2003 vintage 3D seismic data volume was available for analysis covering 2008 km2 However APCL is using 2010 vintage 3D seismic data (2566km2) processed to pre-stack time-migration in their current evaluation and we have adopted these data for our review In general seismic data quality was found to be good
Figure 3-2 Wells 2D and 3D seismic data (red outline) Gambia Blocks A1 and A4
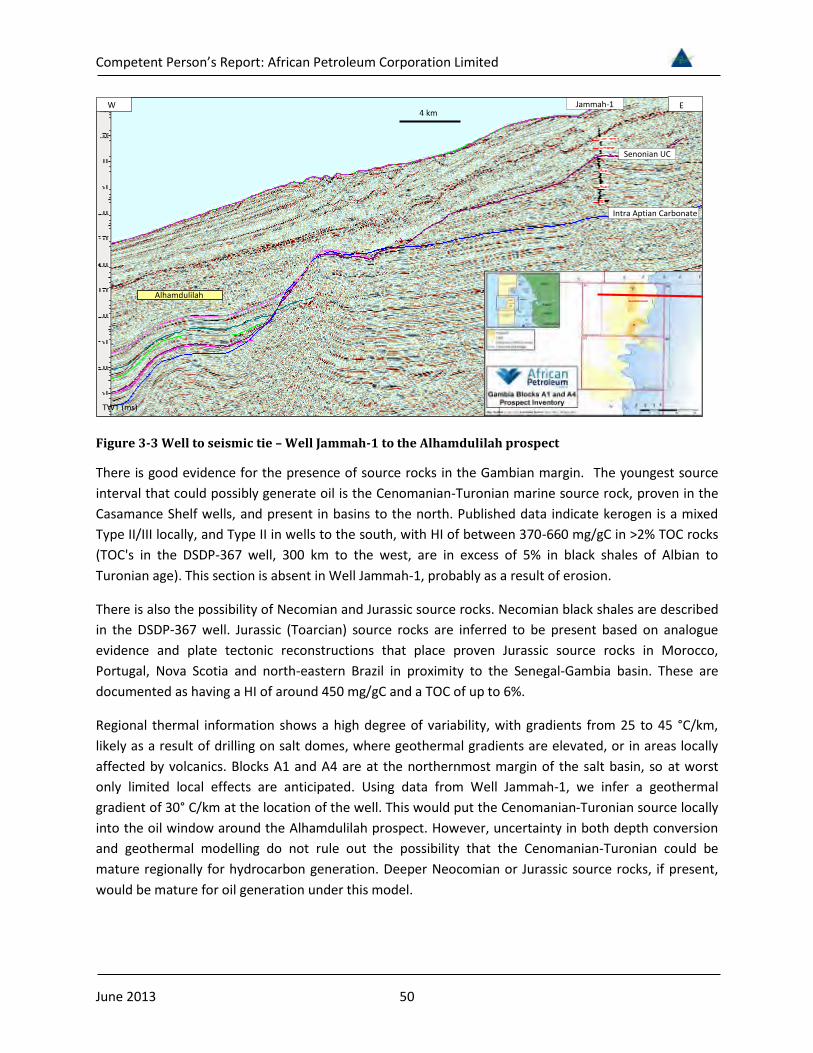
The 2D seismic data was sufficient to enable a well to seismic tie to be made to Well Jammah-1 (Figure 3-3) Despite its shelfal location we were able to extrapolate some stratigraphy into the deeper water
Competent Personrsquos Report African Petroleum Corporation Limited
June 2013 49
although the key Upper Cretaceous section is not sampled adequately by the well leading to uncertainty in the age of the deeper clastic section that forms the potential reservoir interval for the Alhamdulilah prospect
33Plays and Petroleum Geology Blocks A1 and A4
Some of the plays identified by APCL offshore Gambia are similar to those described for Liberia in Section 23 above with structural and stratigraphic traps identified at a number of Cretaceous intervals (Figure 3-1) and reservoirs prognosed as being of deep marine turbidites or other mass transport systems However plate tectonic reconstructions suggest that rifting occurred earlier along the Senegalese and Gambian margin beginning in the Lower Jurassic Thus there is the potential for deeper Jurassic age source and reservoir in the area
There is some seismic evidence for the presence of reservoir intervals as is common regionally although evidence is less compelling in the deeper intervals (Figure 3-5) Of the identified traps in this play fairway only one has currently been matured to prospect status by APCL the Alhamdulilah prospect
Regionally reservoirs within the Cretaceous are associated with a deep marine depositional environment and are generally expected to be of good to excellent quality with the possibility of some overpressure A similar depositional environment is prognosed for the deeper Jurassic age reservoirs with possible fan-delta like geometries identifiable on seismic landward (eastward) of the Alhamdululah prospect (Figure 3-7)
In addition to the Jurassic and Cretaceous clastic plays APCL has identified a number of closures along the margin of a carbonate platform of Jurassic to Aptian age partially penetrated by Well Jammah-1 (Figure 3-3 Figure 3-4) These closures are currently being evaluated by APCL and only one Prospect M has been evaluated to prospect status and we assess the prospective resources for Prospect M in this section
Competent Personrsquos Report African Petroleum Corporation Limited
June 2013 50
Figure 3-3 Well to seismic tie ndash Well Jammah-1 to the Alhamdulilah prospect
There is good evidence for the presence of source rocks in the Gambian margin The youngest source interval that could possibly generate oil is the Cenomanian-Turonian marine source rock proven in the Casamance Shelf wells and present in basins to the north Published data indicate kerogen is a mixed Type IIIII locally and Type II in wells to the south with HI of between 370-660 mggC in gt2 TOC rocks (TOCs in the DSDP-367 well 300 km to the west are in excess of 5 in black shales of Albian to Turonian age) This section is absent in Well Jammah-1 probably as a result of erosion
There is also the possibility of Necomian and Jurassic source rocks Necomian black shales are described in the DSDP-367 well Jurassic (Toarcian) source rocks are inferred to be present based on analogue evidence and plate tectonic reconstructions that place proven Jurassic source rocks in Morocco Portugal Nova Scotia and north-eastern Brazil in proximity to the Senegal-Gambia basin These are documented as having a HI of around 450 mggC and a TOC of up to 6
Regional thermal information shows a high degree of variability with gradients from 25 to 45 degCkm likely as a result of drilling on salt domes where geothermal gradients are elevated or in areas locally affected by volcanics Blocks A1 and A4 are at the northernmost margin of the salt basin so at worst only limited local effects are anticipated Using data from Well Jammah-1 we infer a geothermal gradient of 30deg Ckm at the location of the well This would put the Cenomanian-Turonian source locally into the oil window around the Alhamdulilah prospect However uncertainty in both depth conversion and geothermal modelling do not rule out the possibility that the Cenomanian-Turonian could be mature regionally for hydrocarbon generation Deeper Neocomian or Jurassic source rocks if present would be mature for oil generation under this model
ALHAMDULILAH
M
Senonian UC
W E4 km
Jammah-1
Alhamdulilah
Intra Aptian Carbonate
TWT (ms)
Competent Personrsquos Report African Petroleum Corporation Limited
June 2013 51
34Play Risk
In our evaluation of APCLrsquos Gambian blocks we note that a number of the prospective plays require further definition to mature the identified leads to prospect status As a result our evaluation is limited to the determination of independent estimates of prospective resource for the Alhamdulilah prospect and Prospect M We have used play and prospect risk for both prospects to allow for consistency in comparison between our evaluations where a play risk is appropriate
Based on the review above we see source risk as the key risk to the Lower Cretaceous and Jurassic clastic play Although a number of source rock intervals are present regionally only those within the Cretaceous are demonstrated to be present proximal to Blocks A1 and A4 Data are limited but modelling would suggest that those within the Cenomanian-Turonian could be immature for oil generation in all but a small area of the blocks As a result we assign a source risk of 07 Note that the uncertainty in both source rock presence and thermal data is such that there is a possibility of gas charge although like Liberia Sierra Leone and Cote drsquoIvoire it is impossible to quantify this chance at present
We see seal risk for this play to be relatively low as there is seismic evidence similar to that interpreted regionally for the presence of seal Seal risks for the multiple stacked sands prognosed for the Alhamdulilah prospect are handled as a prospect specific risk The inferred depositional environment for this interval would also suggest that sealing intervals would be developed We have therefore assigned a seal risk of 09 to this play
Seismic evidence for the presence of reservoir is also good but less convincing than that observed regionally and in our evaluation of Liberia Blocks 8 and 9 However we assign a reservoir presence risk of 08 It is possible that the younger Cretaceous reservoirs identified could be locally sourced via exhumation of the coeval carbonate platform to the east and thus be composed of detrital carbonate material This is reflected in the reservoir risk for the Alhamdulilah prospect itself
For the carbonate platform play the key risk is that of top seal Seismic reflectivity is highly variable above the top of the platform carbonates (Figure 3-3) as the event is a strong regional unconformity In places the overlying clastic section can be interpreted immediately above this unconformity Although the latter is factored into prospect specific risk to top seal the seismic evidence for the presence of a regional seal above the unconformity is not compelling The top seal is provided by a down-lapping carbonate prone Aptian-Albian section where the Senonian unconformity is not immediately above the reservoir section Analogues suggest there is a general lack of support for intra-formational seals in similar settings and therefore we assign a risk to the carbonate platform play seal of 05 as a result
The presence of a strong angular unconformity at the top of the carbonate platform structures is however likely to have enhanced reservoir quality within the carbonates themselves as a result of subareal exposure and karstification Thus we assign a risk of 09 to the reservoir presence element of the carbonate platform play and review the prospect specific reservoir efficacy risk on a prospect by prospect basis dependent on the seismic evidence for erosion
Competent Personrsquos Report African Petroleum Corporation Limited
June 2013 52
A number of the identified structures along the buried carbonate platform margin are relatively shallow to mudline and thus biodegradation of any oil charge is possible However as we have only estimated prospective resources for Prospect M we have not carried a play risk to biodegradation
Our final play risks for the Lower Cretaceous clastic and the buried carbonate platform plays are summarised in Table 31 below
PLAY Source Reservoir Presence Seal Play
Risk Cretaceous to Jurassic Clastic Play 07 08 09 50
Carbonate Platform Margin 07 09 05 28
Table 31 Play risk Gambia Blocks A1 and A4
Competent Personrsquos Report African Petroleum Corporation Limited
June 2013 53
35Gambia Leads and Prospects
In all 13 leads and prospects have been identified by APCL within Blocks A1 and A4 with areas of closure varying from around 4 km2 to 63 km2 (Figure 3-4) Of the identified prospective intervals a number are best classified as leads and require further technical work to mature them to prospect status (yellow Figure 3-4) Structural closure is identified within the Lower Cretaceous and a number of slope fans can be identified as seismic amplitude anomalies within the Upper Cretaceous section In addition a number of closures are mapped along the edge of the buried carbonate platform margin at Top Aptian level and APCL are currently evaluating the potential for a deeper Barremian age seal which might provide further prospectivity within the carbonate platform play
Figure 3-4 Leads and prospects identified by APCL in Gambia Blocks A1 and A4
In this section we briefly describe our evaluation of the Alhamdulilah prospect and Prospect M A summary of input parameters for the calculation of prospective resources results and risks for each of the prospective layers evaluated is given in the resource summary sheets in Enclosures 21 to 25 of this document
In 2010 APCL acquired a further 2566 km2 of 3D data over both blocks A re-evaluation of the identified leads and prospects is on-going using these data with the evaluation of the Alhamdulilah prospect and Prospect M completed
ALHAMDULILAH
M
Competent Personrsquos Report African Petroleum Corporation Limited
June 2013 54
351Alhamdulilah Prospect
The Alhamdulilah prospect is identified as a four-way dip-closed structural high within the centre of the deep water portion of Block A1 (Figure 3-3 Figure 3-5) We have evaluated four prospective intervals in total (Figure 3-5) Reservoir ages are currently prognosed by APCL to be of Lower Cretaceous (Turonian) to perhaps Lower Jurassic The prospect extends northwards of Block A1 into Senegalese waters and we have restricted our calculations to the proportion of the prospect that lies within Block A1 The bulk of the prospect does however lie within Gambian territory
Figure 3-5 Seismic line over the Alhamdulilah prospect
The prospective intervals within the Alhamdulilah structure lie between 4230 m TVDSS and 5970 m TVDSS or around 2010 to 3750 metres below sea bed This is relatively deep and despite the estimates of overpressure it is possible that porosity and thus reservoir quality to be relatively poor (Figure 2-4) Our estimates of recovery factor for the deeper prospective intervals reflect this
There is uncertainty in the degree of structural closure as although mapped reflectors are relatively bright and continuous the structure is of low relief We have account for this by undertaking various depth conversions of the mapped structure from the time domain 3D seismic data restricting our analysis to closure demonstrable on-block (Figure 3-6) At SS-1 level closure continues to the north off-block and also off the 3D seismic data We have reviewed the available 2D seismic data northwards to determine the spill point at this level
SS 4 (1)
SS 3 (1-2)
SS 2 (1-3)
SS 1 (1-3)
2 Km
Inline 1140 - TWT ALHAMDULILAH
TWT (s)
W E
Competent Personrsquos Report African Petroleum Corporation Limited
June 2013 55
Where seismic facies analysis suggests the potential for stacked pay intervals these have been modelled probabilistically Estimates of gross rock volume derived in this way are combined with the estimates of net reservoir thickness based on mapped seismic thicknesses and porosity and fluid information are derived as described in Section 16 to compute probabilistic estimates of resources for each reservoir interval
Figure 3-6 Area of closure Alhamdulilah prospect layers SS1 to SS4
Recovery factors used are as described in Section 16 of this report but modified to reflect the depth of burial of the deeper prospective intervals
We have reviewed the prospect specific risk for each of the prospective intervals independently Although the Alhamdulilah trap is a four-way dip-closed feature the time closure is subtle and the prospect is relatively deep There is also seabed canyoning which may cause uncertainty in the imaging and thus trap closure
Seismic evidence for seal is relatively good over the Alhamdulilah trap However there is evidence for downcuttingerosion between layers and above the prospect there is also evidence for downlapping events onto the topmost reflector
The key risk to the Alhamdulilah prospect is that of reservoir efficacy There are indications of fan-like geometries within the 3D seismic data (Figure 3-7) and some events can be mapped for the shallower reservoir layers However the Cretaceous reservoirs may alternatively comprise the eroded talus from the coeval carbonate platform to the east and reservoir quality rock may not be developed as a result Finally our estimate of overpressure may be incorrect and any sandstones present may have the reservoir quality sufficiently degraded via compaction to render them non-reservoir
SS-1 Low and High Case AreasSS-4 Low and High Case Areas SS-3 Low and High Case Areas SS-2 Low and High Case Areas
Competent Personrsquos Report African Petroleum Corporation Limited
June 2013 56
As a result the prospect specific risks to the prospective intervals of the Alhamdulilah prospect vary from 26 to 34 and from 13 to 17 when combined with the play risk
Figure 3-7Alhamdulilah prospect seismic facies interpretation Cretaceous intervals
AH-1 AH-1
Competent Personrsquos Report African Petroleum Corporation Limited
June 2013 57
352Prospect M
A number of structures have been identified by APCL at the Aptian level (ie top carbonate) along the buried carbonate platform margin that runs through Blocks A1 and A4 (Figure 3-1) Of these one structure Prospect M has been matured to prospect status and is of sufficient size to warrant independent estimates of resources (Figure 3-8)
Figure 3-8 Seismic line through Prospect M
We have evaluated the uncertainty in gross rock volume for Prospect M and combined this with reservoir net to gross ratio and porosity from analogue to generate estimates of STOIIP and prospective resources We have simulated uncertainty in seismic pick and also depth conversion to generate a range of spill points for the structure (Figure 3-9) These are used to make low and high case estimates of gross-rock volume
Due to the shallow nature of Prospect M we have assumed relatively high (but moveable) oil viscosities as discussed in Section 1 Recovery factor estimates are made with reference to this and also to analogue where uncertainty in both reservoir quality and also the degree of fracturing (and hence dual permeability) leads to a wide range in uncertainty in ultimate recovery Our low case recovery factor being affected primarily by early onset of water cut via fractures and an adverse mobility ratio and the high case making allowance for better oil mobility and improved matrix porosity and permeability leading to a more efficient sweep We therefore use a recovery factor range from 10 to 35 and use these as the P90 and P10 estimates on a log-normal distribution in our probabilistic simulation of prospective resources
Senonian UC
Intra Aptian Carbonate
TWT (ms)2 km
w EProspect M
Competent Personrsquos Report African Petroleum Corporation Limited
June 2013 58
Figure 3-9 Low and high case closure Prospect M top Aptian depth (m TVDSS)
There is pick and depth conversion uncertainty associated with Prospect M but we see a good chance of a closure being developed within the 3D seismic area and assign a prospect specific risk to trap of 09 as a result Downlapping events are observed onto the crest of the prospect (Figure 3-8) but the overlying seismic signature is relatively transparent thus we see a good chance of the prospect being sealed relative to the play risk However the prospect is relatively shallow at around 1000 m to 1100 m below the seabed and there is a risk to biodegradation of any oil charge Thus we associate a risk of 06 to biodegradation As it is established practice we place this risk into containment or trap risk which results in an overall trap risk of 09 06 or 54
There is evidence for the development of reservoir quality rock with a seismic character that has been associated with the development of karstification in the analogues used We also note that the prospect is very close to the platform edge and the erosional unconformity is quite pronounced again suggesting a period of subareal exposure Thus we see the prospect specific risk to reservoir efficacy as 08 Charge risk is also favourable with the prospect located at the edge of the buried platform margin proximal to the deeper potential kitchen areas We therefore associate a charge risk of 08 to the prospect
Thus we assign a prospect specific risk of 35 which when combined with the play risk for the carbonate platform margin gives an overall COS of 10
3
3
m ss
metres
Competent Personrsquos Report African Petroleum Corporation Limited
June 2013 59
4 Sierra Leone Prospectivity and Plays
As with offshore Liberia to the south-east all of the deep-water acreage offshore Sierra Leone is under licence (Figure 4-1) A discussion of regional hydrocarbon occurrences is presented in Section 21 APCLrsquos licences SL-03 and SL-04A-10 lie to the north-west of the countryrsquos territorial waters around 200 to 300 km north-west of the recent Venus Mercury and Jupiter discoveries made by Anadarko (Figure 4-1)
Figure 4-1 Offshore licences and discoveries Liberia and Sierra Leone
A regional grid of 2D seismic data is available to APCL for the evaluation of offshore Sierra Leone (Figure 4-2) In addition APCL has licenced c 2500 km2 of 3D seismic data covering the deeper water area of Block SL-03 and is negotiating the licencing of further 3D seismic data covering part of Block SL-04A-10
Competent Personrsquos Report African Petroleum Corporation Limited
June 2013 60
Well data offshore Sierra Leone are sparse Historical exploration was restricted to the shelf and resulted in the drilling of two exploration wells (Wells A-1 and A-1-2) which were plugged and abandoned as dry holes Data from both wells are available to APCL Recent drilling by Anadarko in the deeper waters of licence SL-07B-10 has yielded a number of discoveries (Wells Jupiter-1 Venus-1 and Mercury-1) but these well data are not available to APCL
Figure 4-2 Well and seismic database offshore Sierra Leone
The play fairways identified offshore Sierra Leone are very similar to those identified offshore Liberia (Figure 2-3) as structural traps within the Lower Cretaceous syn-rift section and primarily as stratigraphic traps within turbiditic sands of Cretaceous age (Campanian Cenomanian and Turonian) Sourcing from regional marine (Cenomanian) or lacustrine (Albo-Aptian) source rocks is hypothesized For the syn-rift structural play the presence of Albo-Aptian reservoirs is demonstrated by the shallow water Wells A-1 and A-1-2 which also had indications of the development of source rocks within the
Competent Personrsquos Report African Petroleum Corporation Limited
June 2013 61
Cretaceous syn-rift section Although the data are not available the recent Anadarko wells are publically documented as having found hydrocarbons within post-rift Cretaceous turbidites potentially de-risking this play
Blocks SL-03 and SL-04A-10 are towards the north-western edge of the seismically identified Cretaceous basin immediately adjacent to a large structural lineament the Sierra Leone Transform System Submarine canyon development is therefore prognosed to occur to the south and east of this lineament providing sediment input into the blocks during Cretaceous time As is encountered regionally there is reasonable seismic evidence for the presence of reservoir bearing intervals within the Upper Cretaceous section in the blocks
APCLrsquos evaluation of the recently licenced 3D seismic data is on-going and as yet only one prospect Altair has been matured to drillable prospect status However a number of other Cretaceous channelfan systems have been identified within Block SL- 03 (Figure 4-3)
Figure 4-3 Leads Sierra Leone Block SL-03
Competent Personrsquos Report African Petroleum Corporation Limited
June 2013 62
41Play Risk
Although there has been recent drilling along strike of APCLrsquos Sierra Leone licences these wells lie some 100 km to the east We have therefore attributed a play risk albeit favourable to Cretaceous channel-fan prospectivity within Blocks SL-03 and SL-04A-10 As with our review of Liberia there is strong seismic evidence for reservoir and seal rocks being present and offset drilling would indicate the same from the limited published information However there is as yet no proven source rock within APCLrsquos licences and we see this as the key risk to play The reported results of offset drilling and APCLrsquos own basin modelling would suggest that source risk would be favourable
Our final play risk for the Cretaceous channel-fan systems in APCLrsquos Sierra Leone licences is summarised in Table 31 below
PLAY Source Reservoir Presence Seal Play
Risk Cretaceous Play 08 09 09 65
Table 41 Play risk Sierra Leone Block SL-03
41Sierra Leone Leads and Prospects
APCL is currently evaluating the recently licenced 3D seismic data over Block SL-03 and has identified a number of Cretaceous channel-fan systems varying in areal extent from 20 km2 to 150 km2 Of the mapped channel fan systems one Altair has been matured to prospect status by APCL and we have made independent estimates of prospective resources and risks for this prospect
A summary of input parameters for the calculation of prospective resources results and risks for the Altair prospect is given in the resource summary sheet in Enclosure 31 of this document
411Altair
The Altair prospect is a turbidite channel prospect mapped at a seismic event described as Turonian by APCL (Figure 4-4) There is however uncertainty in this stratigraphy as it is established by jump correlation using regional seismic data due to the lack of deep water wells on block It is a stratigraphic trap with areal extents defined by amplitude truncation and structural pinch-out in a similar manner to prospectivity within APCLrsquos Liberia and Cote drsquoIvoire acreage A single target reservoir is identified within the trapped area The prospect has anomalous seismic amplitudes associated with it (Figure 4-5) which may indicate reservoir development The top structure is mapped between 6200 ndash 6800 ms TWT over the area of the prospect Our depth conversion indicates a crestal depth of approximately 5400 m TVDSS beneath a water depth of 3300 m giving 2100 m of sediment above top reservoir
Competent Personrsquos Report African Petroleum Corporation Limited
June 2013 63
Figure 4-4 Dip seismic line (full offsets) Altair prospect
The seismic image suggests that Altair is a turbidite channel constrained in the north east by a well-defined canyon Two distinct canyon systems feed erosive channels at the break of slope A south west trending fault which is almost perpendicular to the main canyon feeders alters bathymetric relief and diverts the Altair channel southwards
ERCE has made estimates of prospective resources for the Altair prospect using an identical methodology to our evaluation of Liberian prospectivity An area net approach was adopted using optimized seismic amplitudes to constrain areal extent and define an areal net to gross to account for lateral variability of sand distribution within the reservoir In our low case we restrict the area of the accumulation to the brightest area of anomalous amplitudes and a column height of 200 m Our high case extends the prospect down-dip to a column height of 800 m and laterally to incorporate weaker amplitude responses (Figure 4-5) These polygons were used to constrain the P90 and P10 area inputs of our probabilistic simulation
SW NE
Top Turonian
Top syn-rift
0 5kmTWT (s)
ALTAIR
3
3
metres
Competent Personrsquos Report African Petroleum Corporation Limited
June 2013 64
Figure 4-5 Seismic amplitude (gradient stack) and Top Turonian depth (m TVDSS) Altair prospect
Net pay is estimated from the mapped seismic interval and regional analogue with porosities and fluid properties estimated as described in Section 16
We have used the prospect risk matrix presented in Section 16 to determine the geological chance of success for the Altair prospect Key risk is to trap integrity due to the coalescing of a number of mapped fan systems up dip towards the pinch-out of Altair with subsidiary risk to charge as this is as yet unproven on block This gives a prospect specific risk of 28 which when combined with the play risk gives an overall chance of success of 18 for the Altair prospect
3
3
metres
Competent Personrsquos Report African Petroleum Corporation Limited
June 2013 65
5 Cote13 drsquoIvoire13 Prospectivity13 and Plays
51Introduction
Offshore Cote drsquoIvoire has been actively explored for hydrocarbons for a number of years and much of the offshore shelf is under licence Recently exploration has moved into deeper waters targeting the regional post-rift (Cretaceous) play and APCL has identified a number of prospects and leads within the western licence Blocks of CI-513 and CI-509 (Figure 5-1)
There are two main play types identifiable offshore Cote drsquoIvoire (Figure 5-2) as structural traps within the Lower Cretaceous (Aptian to Albian) syn-rift section and as stratigraphic traps within post rift turbiditic sands of Cenomanian to Turonian age Sourcing is prognosed from regional marine (Turonian) or lacustrine (Albo-Aptian) source rocks
Figure 5-1 CI-509 and CI-513 Prospects and Leads13 offshore13 Cote13 drsquoIvoire
Historically exploration has been restricted to the narrow shelf area and has yielded a number of commercial fields both oil and gas including Foxtrot Baobab and Espoir All of these fields lie within the Lower Cretaceous (Aptian) syn-rift play Recently exploration has moved into deeper waters targeting the regional post-rift (Cretaceous) play Well Paon-1X c 300 km to the east of Blocks CI-105 and CI-513
Competent Personrsquos Report African Petroleum Corporation Limited
June 2013 66
drilled by Tullow Oil plc and partners in licence CI-103 during 2012 is reported to have found hydrocarbons in turbiditic sandstones of Cretaceous age Well Kosrou-1X some 150 km east of Blocks CI-105 and CI-513 shows reservoir development within the post-rift Cretaceous section particularly within the Turonian to Cenomanian section
Evaluation of prospectivity within Blocks CI-509 and CI-513 is at an early stage and a working petroleum system is not proven on block However a number of Cretaceous channelfan systems have been identified using both 2D and 3D seismic data which have generated around seven potential traps at the date of this report five of which are considered prospects for this report (Figure 5-1)
Figure 5-2 Petroleum13 systems13 and13 plays13 offshore13 Cote13 drsquoIvoire
52Well and Seismic Database
APCL has obtained a regional database of 2D seismic data offshore Cote drsquoIvoire which provides well to seismic ties to Well San Pedro-1 (Figure 5-3) The primary data set used for our evaluation is that provided by the recently acquired 3D seismic data At the time of writing these data were processed to
Competent Personrsquos Report African Petroleum Corporation Limited
June 2013 67
pre-stack time-migration and we have used this volume plus available AvO processed volumes to evaluate the prospectivity of the CI-513 licence currently only the full-stack seismic product has been used to assess the prospectivity in Block CI-509
Figure 5-3 Well and seismic database offshore Sierra Leone
53Plays and Petroleum Geology Blocks CI-509 and CI-513
The primary play being explored within Blocks CI-509 and CI-513 is the Cretaceous post-rift turbidite play (Figure 5-2) There is reasonable seismic evidence for the presence of reservoir bearing intervals within the Upper Cretaceous section of the blocks However dating of the age of these post-rift turbidite channelfan systems is uncertain due to the paucity of well and seismic data with stratigraphy extrapolated into APCLrsquos licences via regional seismic correlation The presence of a regional Turonian source rock is hypothesized to charge any identified traps This is not proven on block but evidence from offset drilling in Block CI-105 demonstrates the presence of source rocks developed within the
Grand Lahou East 1
Kosrou 1x
San Pedro 1
South Grand Lahou 1
Competent Personrsquos Report African Petroleum Corporation Limited
June 2013 68
Cenomanian to Turonian and basin modelling studies indicate that the Turonian may be mature for oil generation local to the licences
A number of Cretaceous channelfan systems have been identified using both 2D and 3D seismic data (Figure 5-1) and we have independently evaluated the Prospective Resources and geological chance of success for five of these In addition the Lower Cretaceous syn-rift play may be viable within the licences particularly to the north Evaluation of this play by APCL is on-going and no prospective resources have been assessed for this play
54Play Risk
Exploration offshore Cote drsquoIvoire is at an early stage and there are limited well data available As a result ERCE has adopted a play and prospect risk system in our evaluation of the Cote drsquoIvoire prospective resources within the Cretaceous channel-fan play in an identical manner to our review of Liberia the Gambia and Sierra Leone
In a similar manner to Liberia the Gambia and Sierra Leone there is seismic evidence for the presence of seal and reservoir rock and thus the key risk is to source and we see source risk as the key risk to the Creteaceous clastic play Sourcing is prognosed from regional marine (Turonian) modelled as having limited hydrocarbon generating potential or lacustrine (Albo-Aptian) source rocks the maturity of which are interpreted to be in the very early oil window As a result we assign a play source risk of 06 Note that the uncertainty in both source rock presence and thermal maturity is such that there is a possibility of gas charge although it is impossible to quantify this chance at present
Our final play risk is summarised in Table 51 below
PLAY Source Reservoir Presence Seal Play
Risk Cretaceous Clastic Play 06 09 09 049
Table 51 Play13 risk13 Cote13 drsquoIvoire13 Blocks13 CI-509 and CI-513
Competent Personrsquos Report African Petroleum Corporation Limited
June 2013 69
ͷǤͷǤ Cote13 drsquoIvoire13 Blocks13 CI-509 and CI-503 Leads and Prospects
Prospectivity has been identified by APCL at a number of levels with the evaluation of the Cretaceous clastic turbidite channel-fan play being the most advanced ERCE has made independent assessments of prospective resources and geological chance of success for five prospects within this play Ayame Ayame West Sassandra Cavella and Leraba (Figure 5-1)
A summary of input parameters for the calculation of prospective resources results and risks for each of the prospective layers evaluated is given in the resource summary sheets in Enclosures 41 to 45 of this document
ͷǤͷǤͳǤ Ayame amp Ayame West
The Ayame and Ayame West prospects are identified as Upper Cretaceous fans which lie mainly within Block CI-513 (Figure 5-4) The prognosed trapping mechanism is stratigraphic with areal extents defined by amplitude truncation and structural pinch-out A single target reservoir is prognosed for both within stratigraphy identified as Turonian although stratigraphy is uncertain in both licences as it is established via long distance seismic ties The prospects have anomalous seismic amplitudes associated with them (Figure 5-5) which may indicate reservoir development The top structure is mapped between 5400 ndash 6300 ms TWT over the area of the prospect and our depth conversion places the crest of the trap at approximately 4200 m TVDSS beneath a water depth of 2500 m
Figure 5-4 Strike Line Ayame and Ayame West prospects
NE
0 km 4
TWT (s)
Top
Turonian
Base
Turonian
Top
Albian
AYAMEAYAME WESTSW
P90
P10
metres
P90
P10
AYAME
AYAMEWEST
Competent Personrsquos Report African Petroleum Corporation Limited
June 2013 70
Evaluation of the Ayame and Ayame West prospects is undertaken in an identical manner to our evaluations of the stratigraphically trapped channel-fan prospects in APCLrsquos Liberia and Sierra Leone licences An area net approach is adopted using anomalous seismic amplitudes to constrain areal extent and define an areal net to gross to account for lateral variability of sand distribution within the closure area In our low case we restrict the area of the accumulation to the brightest area of anomalous amplitudes and a 200 m column height Our high case extends the prospect down-dip to 800 m of column height to include a larger area of anomalous amplitudes (Figure 5-5) These polygons are used to constrain the P90 and P10 area inputs of our probabilistic simulation
Net pay estimates are estimated from mapped seismic interval thickness and from regional analogues with porosity fluid parameters and recovery factors estimated as described in Section 16
Figure 5-5 Ayame Seismic amplitude (gradient stack) and Top Turonian depth (m TVDSS)
We use the prospect risk matrix presented in Section 16 to determine the geological chance of success for the Ayame and Ayame West prospects Key risk is to trap and we attribute a trap risk of 50 to both
P90
P10
metres
P90
P10
AYAME
AYAMEWEST
Competent Personrsquos Report African Petroleum Corporation Limited
June 2013 71
prospects giving a prospect specific chance of success of 28 for both prospects When combined with the play risk this gives an overall chance of success of 14
A proportion of the closure areas for both the Ayame and Ayame West prospects fall outside Block CI-513 in our high case (6 km2 and 11 km2 respectively) This is corrected for in our summary tables of net risked and unrisked prospective resources at the beginning of this document by computing the area of the prospect off-block at P90 P50 and P10 and scaling accordingly
ͷǤͷǤʹǤ Sassandra
The Sassandra prospect is mapped as a deep-water fan system at Top Turonian level and lies within Blocks CI-513 and CI-509 approximately 20km west along strike from the Ayame prospect It is a stratigraphic trap with areal extents defined by amplitude truncation and structural pinch-out (Figure 5-6) A single target reservoir is prognosed within the Turonian and as with other prospects on block has similar uncertainty in the stratigraphic age of the prospective interval The prospect has anomalous amplitudes associated with it (Figure 5-7) which may indicate reservoir development The top structure is mapped between 5000 ndash 6000 ms TWT over the area of the prospect and our depth conversion predicts a crestal depth of approximately 4400 m TVDSS beneath a water depth of 2500 m
Figure 5-6 Dip seismic line Sassandra prospect
Top Turonian
Base Turonian
Top Albian
N S
TWT (s)
SASSANDRA
P90 P10
metres
CI-509
Competent Personrsquos Report African Petroleum Corporation Limited
June 2013 72
Evaluation of the Sassandra prospect is undertaken in an identical manner to our evaluation of the Ayame and Ayame West prospects An area net approach is adopted using anomalous seismic amplitudes to constrain areal extent and define an areal net to gross to account for lateral variability of sand distribution within the closure area In our low case we restrict the area of the accumulation to the brightest area of anomalous amplitudes and a 200 m column height Our high case extends the prospect down-dip to 800 m of column height to include a larger area of anomalous amplitudes (Figure 5-7) These polygons are used to constrain the P90 and P10 area inputs of our probabilistic simulation As far offset data are only available for CI-513 (at the time of writing) we have used amplitudes from the full-stack volume to map the extent of the prospect to the west off block (Figure 5-7)
Net pay estimates are estimated from mapped seismic interval thickness and from regional analogues with porosity fluid parameters and recovery factors estimated as described in Section 16
Figure 5-7 Sassandra prospect Seismic amplitude and Top Turonian depth (m TVDSS)
We use the prospect risk matrix presented in Section 16 to determine the geological chance of success for the Sassandra prospect Key risk is to trap and we attribute a trap risk of 40 This is a lower value
33
metres
CI-509
Competent Personrsquos Report African Petroleum Corporation Limited
June 2013 73
than our estimates for the Ayame and Ayame West prospects as the up-dip termination of the trap is less well defined and requires a larger area for pinch-out or bypass Seismic amplitude support for reservoir presence is less over the Sassandra prospect relative to Ayame Thus we estimate a prospect specific chance of success for the Sassandra prospect of 20 which when combined with the play risk gives an overall chance of success for the Sassandra prospect of 10
A proportion of the closure area for the Sassandra prospect falls outside Blocks CI-513 and CI-509 in our high case (33 km2) This is corrected for in our summary tables of net risked and unrisked prospective resources at the beginning of this document by computing the area of the prospect off-block at P90 P50 and P10 and scaling accordingly
553Cavalla
The Cavalla prospect is an Upper Cretaceous Fan which lies between the Ayame and Sassandra prospects within Block CI-513 It is identified as a stratigraphic trap with areal extents defined by amplitude truncation and structural pinch-out (Figure 5-8) A single target reservoir is prognosed within the TuronianCenomanian interval (with similar stratigraphic uncertainty to other prospects on block) which lies stratigraphically beneath the Ayame prospect The prospect has anomalous seismic amplitudes associated with it (Figure 5-9) which may indicate reservoir development The top structure is mapped between 4600 ndash 5900 ms TWT over the area of the prospect and we estimate a crestal depth of approximately 3900 m TVDSS beneath a water depth of 2500 m The prospect is more steeply dipping than other fan systems mapped on block
Evaluation of the Cavalla prospect is undertaken in an identical manner to our evaluation of the Ayame Ayame West and Sassandra prospects An area net approach is adopted using anomalous seismic amplitudes to constrain areal extent and define an areal net to gross to account for lateral variability of sand distribution within the closure area In our low case we restrict the area of the accumulation to the brightest area of anomalous amplitudes and a 200 m column height Our high case extends the prospect down-dip to 800 m of column height to include a larger area of anomalous amplitudes (Figure 5-9) These polygons are used to constrain the P90 and P10 area inputs of our probabilistic simulation
Net pay estimates are estimated from mapped seismic interval thickness and from regional analogues with porosity fluid parameters and recovery factors estimated as described in Section 16
We use the prospect risk matrix presented in Section 16 to determine the geological chance of success for the Cavella prospect Key risk is to trap and we attribute a trap risk of 40 As with the Sassandra prospect this is a lower value than our estimates for the Ayame and Ayame West prospects as the up-dip termination of the trap is less well defined and requires a larger area for pinch-out or bypass Seismic amplitude support for reservoir presence is less over the Cavella prospect relative to Ayame Thus we estimate a prospect specific chance of success for the Cavella prospect of 20 which when combined with the play risk gives an overall chance of success for the Cavella prospect of 10
Competent Personrsquos Report African Petroleum Corporation Limited
June 2013 74
The Cavalla prospect is contained entirely within APCLrsquos licences
Figure 5-8 Dip seismic line Cavalla prospect
Top Turonian
Top Albian
TWT (s)
CAVALLANW SEP90
P10
metres
Competent Personrsquos Report African Petroleum Corporation Limited
June 2013 75
Figure 5-9 Seismic amplitude (gradient stack) and Top fan depth (m TVDSS) Cavalla prospect
ͷǤͷǤͶǤ Leraba
As with the other evaluated prospectivity within Blocks CI-509 and CI-513 the Leraba prospect is an Upper Cretaceous fan which lies within Block CI-509 It is identified as a stratigraphic trap with areal extents defined by amplitude truncation and structural pinch-out (Figure 5-10) The prospect has anomalous seismic amplitudes associated with it (Figure 5-11) which may indicate reservoir development Unlike the other Cote DrsquoIvoire prospects evaluated in this report no offset seismic volumes were available for our review of Leraba at the time of writing The seismic amplitude response and character on the full-stack data is however consistent with that observed over other prospects in Block CI-513 where more seismic products were available
P90
P10
metres
Competent Personrsquos Report African Petroleum Corporation Limited
June 2013 76
The top structure is mapped between 4600 ndash 5200 ms TWT over the area of the prospect and we estimate a depth at the crest of approximately 3700 m TVDSS beneath a water depth of 2500 m
Figure 5-10 Dip seismic line Leraba prospect
Evaluation of the Leraba prospect is undertaken in an identical manner to our evaluation of the other Cretaceous fan systems evaluated in this section An area net approach is adopted using anomalous seismic amplitudes to constrain areal extent and define an areal net to gross to account for lateral variability of sand distribution within the closure area In our low case we restrict the area of the accumulation to the brightest area of anomalous amplitudes and a 200 m column height Our high case extends the prospect down-dip to 800 m of column height to include a larger area of anomalous amplitudes (Figure 5-11) These polygons are used to constrain the P90 and P10 area inputs of our probabilistic simulation
P90
P10
metresTWT (s)
LERABANW SE
Top Turonian
Albian
0 5km
Competent Personrsquos Report African Petroleum Corporation Limited
June 2013 77
Figure 5-11 Seismic amplitudes Leraba prospect overlay of Top Reservoir m TVDSS
Net pay estimates are derived from mapped seismic interval thickness and from regional analogues with porosity fluid parameters and recovery factors estimated as described in Section 16 The prospect is relatively shallow to mud line and we have modelled a more viscous oil as described in Section 16
We use the prospect risk matrix presented in Section 16 to determine the geological chance of success for the Leraba prospect Key risk is to trap and we attribute a trap risk of 60 as the up-dip extent of the prospect is fairly well defined on seismic data Although no off-set 3D seismic data were available the seismic evidence for reservoir presence is again comparable to that of Ayame West Thus we estimate a prospect specific chance of success for the Leraba prospect of 34 which when combined with the play risk gives an overall chance of success for the Leraba prospect of 16
The Leraba prospect is contained entirely within APCLrsquos licences
P90
P10
metres
Competent Personrsquos Report African Petroleum Corporation Limited
June 2013 78
6 Senegal Prospectivity and Plays
Prospectivity identified within APCLrsquos Sengalese licences is seen as being similar to that identified offshore Gambia (Figure 6-1) and a description of the regional petroleum systems and main play types expected is given in Section 3
Figure 6-1 Petroleum systems and plays offshore Senegal
In 2012 APCL acquired 3600 km2 of multi-client 3D seismic data over the Offshore Sud Profond licence In addition 1500 km2 of legacy 3D data over the Rufisque Offshore Profond licence is currently being reprocessed by APCL and legacy 2D seismic data (c 7000 line km) have also been acquired APCL expects to begin prospect evaluation once seismic processing is complete which is expected later in 2013 At present a number of conceptual Cretaceous post-rift leads are identified by APCL (Figure 6-2)
Competent Personrsquos Report African Petroleum Corporation Limited
June 2013 79
Figure 6-2 leads offshore Senegal Blocks ROP and SOSP
Competent Personrsquos Report African Petroleum Corporation Limited
June 2013 80
7 Appendix 1 SPE PRMS Guidelines
SPEWPCAAPGSPEE Petroleum Reserves and Resources Classification System and Definitions
The Petroleum Resources Management System
Preamble
Petroleum Resources are the estimated quantities of hydrocarbons naturally occurring on or within the Earthrsquos crust Resource assessments estimate total quantities in known and yet-to-be-discovered accumulations Resources evaluations are focused on those quantities that can potentially be recovered and marketed by commercial projects A petroleum Resources managements system provides a consistent approach to estimating petroleum quantities evaluating development projects and presenting results within a comprehensive classification framework
International efforts to standardize the definitions of petroleum Resources and how they are estimated began in the 1930s Early guidance focused on Proved Reserves Building on work initiated by the Society of Petroleum Evaluation Engineers (SPEE) SPE published definitions for all Reserves categories in 1987 In the same year the World Petroleum Council (WPC then known as the World Petroleum Congress) working independently published Reserves definitions that were strikingly similar In 1997 the two organizations jointly released a single set of definitions for Reserves that could be used worldwide In 2000 the American Association of Petroleum Geologists (AAPG) SPE and WPC jointly developed a classification system for all petroleum Resources This was followed by additional supporting documents supplemental application evaluation guidelines (2001) and a glossary of terms utilized in Resources definitions (2005) SPE also published standards for estimating and auditing Reserves information (revised 2007)
These definitions and the related classification system are now in common use internationally within the petroleum industry They provide a measure of comparability and reduce the subjective nature of Resources estimation However the technologies employed in petroleum exploration development production and processing continue to evolve and improve The SPE Oil and Gas Reserves Committee works closely with other organizations to maintain the definitions and issues periodic revisions to keep current with evolving technologies and changing commercial opportunities
The SPE-PRMS consolidates builds on and replaces guidance previously contained in the 1997 Petroleum Reserves Definitions the 2000 Petroleum Resources Classification and Definitions publications and the 2001 ldquoGuidelines for the Evaluation of Petroleum Reserves and Resourcesrdquo the latter document remains a valuable source of more detailed background information
These definitions and guidelines are designed to provide a common reference for the international petroleum industry including national reporting and regulatory disclosure agencies and to support petroleum project and portfolio management requirements They are intended to improve clarity in
Competent Personrsquos Report African Petroleum Corporation Limited
June 2013 81
global communications regarding petroleum Resources It is expected that the SPE-PRMS will be supplemented with industry education programs and application guides addressing their implementation in a wide spectrum of technical andor commercial settings
It is understood that these definitions and guidelines allow flexibility for users and agencies to tailor application for their particular needs however any modifications to the guidance contained herein should be clearly identified The definitions and guidelines contained in this document must not be construed as modifying the interpretation or application of any existing regulatory reporting requirements
The full text of the SPEWPCAAPGSPEE Petroleum Resources Management System document hereinafter referred to as the SPE-PRMS can be viewed at
wwwspeorgspecmabinaryfiles6859916Petroleum_Resources_Management_System_2007pdf
Overview and Summary of Definitions
The estimation of petroleum resource quantities involves the interpretation of volumes and values that have an inherent degree of uncertainty These quantities are associated with development projects at various stages of design and implementation Use of a consistent classification system enhances comparisons between projects groups of projects and total company portfolios according to forecast production profiles and recoveries Such a system must consider both technical and commercial factors that impact the projectrsquos economic feasibility its productive life and its related cash flows
Petroleum is defined as a naturally occurring mixture consisting of hydrocarbons in the gaseous liquid or solid phase Petroleum may also contain non-hydrocarbons common examples of which are carbon dioxide nitrogen hydrogen sulphide and sulphur In rare cases non-hydrocarbon content could be greater than 50
The term ldquoResourcesrdquo as used herein is intended to encompass all quantities of petroleum naturally occurring on or within the Earthrsquos crust discovered and undiscovered (recoverable and unrecoverable) plus those quantities already produced Further it includes all types of petroleum whether currently considered conventionalrdquo or ldquounconventionalrdquo
Figure 1-1 is a graphical representation of the SPEWPCAAPGSPEE Resources classification system The system defines the major recoverable Resources classes Production Reserves Contingent Resources and Prospective Resources as well as Unrecoverable petroleum
Competent Personrsquos Report African Petroleum Corporation Limited
June 2013 82
Figure 1-1 SPEAAPGWPCSPEE Resources Classification System
The ldquoRange of Uncertaintyrdquo reflects a range of estimated quantities potentially recoverable from an accumulation by a project while the vertical axis represents the ldquoChance of Developmentrdquo that is the chance that the project that will be developed and reach commercial producing status
The following definitions apply to the major subdivisions within the Resources classification
TOTAL PETROLEUM INITIALLY-IN-PLACE
Total Petroleum Initially in Place is that quantity of petroleum that is estimated to exist originally in naturally occurring accumulations
It includes that quantity of petroleum that is estimated as of a given date to be contained in known accumulations prior to production plus those estimated quantities in accumulations yet to be discovered (equivalent to ldquototal Resourcesrdquo)
Competent Personrsquos Report African Petroleum Corporation Limited
June 2013 83
DISCOVERED PETROLEUM INITIALLY-IN-PLACE
Discovered Petroleum Initially in Place is that quantity of petroleum that is estimated as of a given date to be contained in known accumulations prior to production
PRODUCTION
Production is the cumulative quantity of petroleum that has been recovered at a given date
Multiple development projects may be applied to each known accumulation and each project will recover an estimated portion of the initially-in-place quantities The projects shall be subdivided into Commercial and Sub-Commercial with the estimated recoverable quantities being classified as Reserves and Contingent Resources respectively as defined below
RESERVES
Reserves are those quantities of petroleum anticipated to be commercially recoverable by application of development projects to known accumulations from a given date forward under defined conditions
Reserves must satisfy four criteria they must be discovered recoverable commercial and remaining based on the development project(s) applied Reserves are further subdivided in accordance with the level of certainty associated with the estimates and may be sub-classified based on project maturity andor characterized by their development and production status To be included in the Reserves class a project must be sufficiently defined to establish its commercial viability There must be a reasonable expectation that all required internal and external approvals will be forthcoming and there is evidence of firm intention to proceed with development within a reasonable time frame A reasonable time frame for the initiation of development depends on the specific circumstances and varies according to the scope of the project While five years is recommended as a benchmark a longer time frame could be applied where for example development of economic projects are deferred at the option of the producer for among other things market-related reasons or to meet contractual or strategic objectives
In all cases the justification for classification as Reserves should be clearly documented To be included in the Reserves class there must be a high confidence in the commercial producibility of the reservoir as supported by actual production or formation tests In certain cases Reserves may be assigned on the basis of well logs andor core analysis that indicate that the subject reservoir is hydrocarbon-bearing and is analogous to reservoirs in the same area that are producing or have demonstrated the ability to produce on formation tests
Proved Reserves
Proved Reserves are those quantities of petroleum which by analysis of geoscience and engineering data can be estimated with reasonable certainty to be commercially recoverable from a given date forward from known reservoirs and under defined economic conditions operating methods and government regulations
Competent Personrsquos Report African Petroleum Corporation Limited
June 2013 84
If deterministic methods are used the term reasonable certainty is intended to express a high degree of confidence that the quantities will be recovered If probabilistic methods are used there should be at least a 90 probability that the quantities actually recovered will equal or exceed the estimate The area of the reservoir considered as Proved includes
the area delineated by drilling and defined by fluid contacts if any and adjacent undrilled portions of the reservoir that can reasonably be judged as continuous with it and commercially productive on the basis of available geoscience and engineering data
In the absence of data on fluid contacts Proved quantities in a reservoir are limited by the lowest known hydrocarbon (LKH) as seen in a well penetration unless otherwise indicated by definitive geoscience engineering or performance data Such definitive information may include pressure gradient analysis and seismic indicators Seismic data alone may not be sufficient to define fluid contacts for Proved Reserves (see ldquo2001 Supplemental Guidelinesrdquo Chapter 8) Reserves in undeveloped locations may be classified as Proved provided that the locations are in undrilled areas of the reservoir that can be judged with reasonable certainty to be commercially productive and interpretations of available geoscience and engineering data indicate with reasonable certainty that the objective formation is laterally continuous with drilled Proved locations
For Proved Reserves the recovery efficiency applied to these reservoirs should be defined based on a range of possibilities supported by analogs and sound engineering judgment considering the characteristics of the Proved area and the applied development program
Probable Reserves
Probable Reserves are those additional Reserves which analysis of geoscience and engineering data indicate are less likely to be recovered than Proved Reserves but more certain to be recovered than Possible Reserves
It is equally likely that actual remaining quantities recovered will be greater than or less than the sum of the estimated Proved plus Probable Reserves (2P) In this context when probabilistic methods are used there should be at least a 50 probability that the actual quantities recovered will equal or exceed the 2P estimate
Probable Reserves may be assigned to areas of a reservoir adjacent to Proved where data control or interpretations of available data are less certain The interpreted reservoir continuity may not meet the reasonable certainty criteria Probable estimates also include incremental recoveries associated with project recovery efficiencies beyond that assumed for Proved
Possible Reserves
Possible Reserves are those additional Reserves which analysis of geoscience and engineering data indicate are less likely to be recoverable than Probable Reserves
Competent Personrsquos Report African Petroleum Corporation Limited
June 2013 85
The total quantities ultimately recovered from the project have a low probability to exceed the sum of Proved plus Probable plus Possible (3P) which is equivalent to the high estimate scenario When probabilistic methods are used there should be at least a 10 probability that the actual quantities recovered will equal or exceed the 3P estimate
Possible Reserves may be assigned to areas of a reservoir adjacent to Probable where data control and interpretations of available data are progressively less certain Frequently this may be in areas where geoscience and engineering data are unable to clearly define the area and vertical reservoir limits of commercial production from the reservoir by a defined project
Possible estimates also include incremental quantities associated with project recovery efficiencies beyond that assumed for Probable
Probable and Possible Reserves
(See above for separate criteria for Probable Reserves and Possible Reserves)
The 2P and 3P estimates may be based on reasonable alternative technical and commercial interpretations within the reservoir andor subject project that are clearly documented including comparisons to results in successful similar projects
In conventional accumulations Probable andor Possible Reserves may be assigned where geoscience and engineering data identify directly adjacent portions of a reservoir within the same accumulation that may be separated from Proved areas by minor faulting or other geological discontinuities and have not been penetrated by a wellbore but are interpreted to be in communication with the known (Proved) reservoir Probable or Possible Reserves may be assigned to areas that are structurally higher than the Proved area Possible (and in some cases Probable) Reserves may be assigned to areas that are structurally lower than the adjacent Proved or 2P area
Caution should be exercised in assigning Reserves to adjacent reservoirs isolated by major potentially sealing faults until this reservoir is penetrated and evaluated as commercially productive Justification for assigning Reserves in such cases should be clearly documented Reserves should not be assigned to areas that are clearly separated from a known accumulation by non-productive reservoir (ie absence of reservoir structurally low reservoir or negative test results) such areas may contain Prospective Resources
In conventional accumulations where drilling has defined a highest known oil (HKO) elevation and there exists the potential for an associated gas cap Proved oil Reserves should only be assigned in the structurally higher portions of the reservoir if there is reasonable certainty that such portions are initially above bubble point pressure based on documented engineering analyses Reservoir portions that do not meet this certainty may be assigned as Probable and Possible oil andor gas based on reservoir fluid properties and pressure gradient interpretations
Competent Personrsquos Report African Petroleum Corporation Limited
June 2013 86
CONTINGENT RESOURCES
Contingent Resources are those quantities of petroleum estimated as of a given date to be potentially recoverable from known accumulations by application of development projects but which are not currently considered to be commercially recoverable due to one or more contingencies
Contingent Resources may include for example projects for which there are currently no viable markets or where commercial recovery is dependent on technology under development or where evaluation of the accumulation is insufficient to clearly assess commerciality Contingent Resources are further categorized in accordance with the level of certainty associated with the estimates and may be sub-classified based on project maturity andor characterized by their economic status
UNDISCOVERED PETROLEUM INITIALLY-IN-PLACE
Undiscovered Petroleum Initially in Place is that quantity of petroleum that is estimated as of a given date to be contained within accumulations yet to be discovered
PROSPECTIVE RESOURCES
Prospective Resources are those quantities of petroleum which are estimated as of a given date to be potentially recoverable from undiscovered accumulations
Potential accumulations are evaluated according to their chance of discovery and assuming a discovery the estimated quantities that would be recoverable under defined development projects It is recognized that the development programs will be of significantly less detail and depend more heavily on analog developments in the earlier phases of exploration
Prospect
A project associated with a potential accumulation that is sufficiently well defined to represent a viable drilling target
Project activities are focused on assessing the chance of discovery and assuming discovery the range of potential recoverable quantities under a commercial development program
Lead
A project associated with a potential accumulation that is currently poorly defined and requires more data acquisition andor evaluation in order to be classified as a prospect
Project activities are focused on acquiring additional data andor undertaking further evaluation designed to confirm whether or not the lead can be matured into a prospect Such evaluation includes the assessment of the chance of discovery and assuming discovery the range of potential recovery under feasible development scenarios
Play
Competent Personrsquos Report African Petroleum Corporation Limited
June 2013 87
A project associated with a prospective trend of potential prospects but which requires more data acquisition andor evaluation in order to define specific leads or prospects
Project activities are focused on acquiring additional data andor undertaking further evaluation designed to define specific leads or prospects for more detailed analysis of their chance of discovery and assuming discovery the range of potential recovery under hypothetical development scenarios
The range of uncertainty of the recoverable andor potentially recoverable volumes may be represented by either deterministic scenarios or by a probability distribution When the range of uncertainty is represented by a probability distribution a low best and high estimate shall be provided such that
bull There should be at least a 90 probability (P90) that the quantities actually recovered will equal or exceed the low estimate
bull There should be at least a 50 probability (P50) that the quantities actually recovered will equal or exceed the best estimate
bull There should be at least a 10 probability (P10) that the quantities actually recovered will equal or exceed the high estimate
When using the deterministic scenario method typically there should also be low best and high estimates where such estimates are based on qualitative assessments of relative uncertainty using consistent interpretation guidelines Under the deterministic incremental (risk-based) approach quantities at each level of uncertainty are estimated discretely and separately
These same approaches to describing uncertainty may be applied to Reserves Contingent Resources and Prospective Resources While there may be significant risk that sub-commercial and undiscovered accumulations will not achieve commercial production it useful to consider the range of potentially recoverable quantities independently of such a risk or consideration of the resource class to which the quantities will be assigned
Evaluators may assess recoverable quantities and categorize results by uncertainty using the deterministic incremental (risk-based) approach the deterministic scenario (cumulative) approach or probabilistic methods (see ldquo2001 Supplemental Guidelinesrdquo Chapter 25) In many cases a combination of approaches is used
Use of consistent terminology (Figure 11) promotes clarity in communication of evaluation results For Reserves the general cumulative terms lowbesthigh estimates are denoted as 1P2P3P respectively The associated incremental quantities are termed Proved Probable and Possible Reserves are a subset of and must be viewed within context of the complete Resources classification system While the categorization criteria are proposed specifically for Reserves in most cases they can be equally applied to Contingent and Prospective Resources conditional upon their satisfying the criteria for discovery andor development
Competent Personrsquos Report African Petroleum Corporation Limited
June 2013 88
For Contingent Resources the general cumulative terms lowbesthigh estimates are denoted as 1C2C3C respectively For Prospective Resources the general cumulative terms lowbesthigh estimates still apply No specific terms are defined for incremental quantities within Contingent and Prospective Resources
Without new technical information there should be no change in the distribution of technically recoverable volumes and their categorization boundaries when conditions are satisfied sufficiently to reclassify a project from Contingent Resources to Reserves All evaluations require application of a consistent set of forecast conditions including assumed future costs and prices for both classification of projects and categorization of estimated quantities recovered by each project
Competent Personrsquos Report African Petroleum Corporation Limited
June 2013 89
8 Appendix 2 Nomenclature
81 Units degC degrees Celsius
degF degrees Fahrenheit
bbl barrel
cp centipoises
ft feet
ftMDRKB feet below Kelly Bushing
ftTVDSS feet subsea
km kilometres
m metres
M or MM thousands and millions respectively
ms metres per second
md millidarcy
mTVDSS metres subsea
psia pounds per square inch absolute
psig pounds per square inch gauge
pu porosity unit
rb reservoir barrels
stb a stock tank barrel which is 42 US gallons measured at 147 pounds per square inch and 60 degrees Fahrenheit
82 Reserves and Resources Classifications
Low Low estimate of Prospective Resources as defined in SPE PRMS 2007
Best Best estimate of Prospective Resources as defined in SPE PRMS 2007
High High estimate of Prospective Resources as defined in SPE PRMS 2007
COS Geological Chance of Success associated with Prospective Resources
P10 10 per cent probability = Proved + Probable + Possible or 3P
P50 50 per cent probability = Proved + Probable or 2P
P90 90 per cent probability = Proved or 1P
83 Abbreviations AvO amplitude variation with offset
Bo oil shrinkage factor or formation volume factor in rbstb
Competent Personrsquos Report African Petroleum Corporation Limited
June 2013 90
CPI computer processed information log
FVF formation volume factor
FWL free water level
GRV gross rock volume
GWC gas water contact
KB kelly bushing
kh permeability thickness
MD measured depth
MSL mean sea level
NG net to gross ratio
OWC oil water contact
Phi porosity
PSC production sharing contract
PSDM post stack depth migration
PSTM post stack time migration
PVT pressure volume temperature experiment
RFT repeat formation tester
So oil saturation
Soi initial oil saturation
SS Subsea
STOIIP stock tank oil initially in place
Sw water saturation
Swc connate water saturation
TD total depth
TOC total organic carbon
TVD true vertical depth
TWT two way time
Vsh shale volume
Competent Personrsquos Report African Petroleum Corporation Limited
June 2013 91
Enclosures Resource Summary Sheets
Enclosure 11 Summary Description Sheet Barbet Prospect
SummaryBlock 9
APC Interest () 100
Fluid Oil
Crest (m ss) 3000
Water depth (m) 750
Notes
Area Shape F Areal NG Net Thick Porosity SO Bo STOIIP Rf Rec Res(km2) (frac) () (m) () () (rbstb) (MMstb) (frac) (MMstb)
Charge 90
Reservoir 70 Low 14 085 62 22 13 73 135 166 0300 60
Trap 50 Best 37 090 80 34 17 80 150 500 0375 186
Seal 70 High 98 095 98 53 20 88 165 1479 0450 558
COS 22 Deterministic inputs probabilistic STOIIP and Rec Resource Mean 270
Stratigraphic trap with amplitude support
Geological Risk Matrix
P10
P90metres
BARBET
dtdƐͿ
ϬŬŵϰ
Enclosure 12 Summary Description Sheet Sunbird Prospect Campanian Reservoir
SummaryBlock 8 amp 9
APC Interest () 100
Fluid Oil
Crest (m ss) 3000
Water depth (m) 1300
Notes
Area Shape F Areal NG Net Thick Porosity SO Bo STOIIP Rf Rec Res(km2) (frac) () (m) () () (rbstb) (MMstb) (frac) (MMstb)
Charge 80
Reservoir 80 Low 12 070 43 27 18 73 130 177 0300 63
Trap 60 Best 27 080 69 42 21 80 145 461 0375 172
Seal 70 High 61 090 95 66 24 88 165 1187 0450 448
COS 27 Deterministic inputs probabilistic STOIIP and Rec Resource Mean 229
Stratigraphic trap with amplitude support Split by intra-canyon
high
Geological Risk Matrix
P90
P10
metres
SUNBIRD
dtdƐͿ
ϬŬŵϰSUNBIRD
Enclosure 13 Summary Description Sheet Sunbird prospect Turonian Reservoir
SummaryBlock 8 amp 9
APC Interest () 100
Fluid Oil
Crest (m ss) 3300
Water depth (m) 1300
Notes
Area Shape F Areal NG Net Thick Porosity SO Bo STOIIP Rf Rec Res(km2) (frac) () (m) () () (rbstb) (MMstb) (frac) (MMstb)
Charge 90
Reservoir 60 Low 8 085 65 24 14 73 140 107 0300 39
Trap 50 Best 21 090 80 37 17 80 158 307 0375 115
Seal 70 High 53 095 94 58 20 88 175 863 0450 327
COS 19 Deterministic inputs probabilistic STOIIP and Rec Resource Mean 162
Stratigraphic trap with amplitude support Split by intra-canyon
high
Geological Risk Matrix
SW NE
Campanian Jacana Channel
Turonian BFF
P90
P10
metres
SUNBIRD
ϬŬŵϰ
Enclosure 14 Summary Description Sheet Sunbird Prospect Cenomanian Reservoir
SummaryBlock 8 amp 9
APC Interest () 100
Fluid Oil
Crest (m ss) 3500
Water depth (m) 1300
Notes
Area Shape F Areal NG Net Thick Porosity SO Bo STOIIP Rf Rec Res(km2) (frac) () (m) () () (rbstb) (MMstb) (frac) (MMstb)
Charge 100
Reservoir 50 Low 10 060 71 21 14 73 140 91 0300 33
Trap 60 Best 25 070 85 33 17 80 158 264 0375 99
Seal 60 High 65 080 99 51 20 88 175 779 0450 294
COS 18 Deterministic inputs probabilistic STOIIP and Rec Resource Mean 141
Stratigraphic trap with amplitude support Split by intra-canyon
high
Geological Risk Matrix
P90
P10
metres
SUNBIRD
dtdƐͿ
ϬŬŵϮ
Enclosure 15 Summary Description Sheet Lovebird Prospect Blue Horizon
SummaryBlock 8
APC Interest () 100
Fluid Oil
Crest (m ss) 5000
Water depth (m) 2850
Notes
GRV NG Porosity SO Bo STOIIP Rf Rec Res(MMm2) () () () (rbstb) (MMstb) (frac) (MMstb)
Charge 54
Reservoir 60 Low 354 30 14 60 150 68 030 25
Trap 70 Best 1310 54 19 70 180 293 038 109
Seal 90 High 4849 73 24 80 210 1218 045 456
COS 20 Mean 201
Four way dip closure to south of Block 8 Three potential
reservoirs identified Blue and Green horizon volumetrics derived
assuming ispoachous to Pink
Geological Risks
ŝŐŚĂƐĞWŝŶŬĞƉƚŚDĂƉ
Enclosure 16 Summary Description Sheet Lovebird Prospect Pink Horizon
SummaryBlock 8
APC Interest () 100
Fluid Oil
Crest (m ss) 5400
Water depth (m) 2850
Notes
GRV NG Porosity SO Bo STOIIP Rf Rec Res(MMm2) () () () (rbstb) (MMstb) (frac) (MMstb)
Charge 54
Reservoir 60 Low 354 30 12 60 155 59 030 22
Trap 70 Best 1310 54 17 70 188 262 038 96
Seal 90 High 4849 73 22 80 220 1066 045 400
COS 20 Mean 178
Four way dip closure to south of Block 8 Three potential
reservoirs identified Blue and Green horizon volumetrics derived
assuming ispoachous to Pink
Geological Risks
ŝŐŚĂƐĞWŝŶŬĞƉƚŚDĂƉ
Enclosure 17 Summary Description Sheet Lovebird Prospect Green Horizon
SummaryBlock 8
APC Interest () 100
Fluid Oil
Crest (m ss) 5800
Water depth (m) 2850
Notes
GRV NG Porosity SO Bo STOIIP Rf Rec Res(MMm2) () () () (rbstb) (MMstb) (frac) (MMstb)
Charge 54
Reservoir 60 Low 354 30 10 60 160 48 030 18
Trap 70 Best 1310 54 15 70 195 210 038 78
Seal 90 High 4849 73 20 80 230 896 045 337
COS 20 Mean 150
Four way dip closure to south of Block 8 Three potential
reservoirs identified Blue and Green horizon volumetrics derived
assuming ispoachous to Pink
Geological Risks
ŝŐŚĂƐĞWŝŶŬĞƉƚŚDĂƉ
Enclosure 18 Summary Description Sheet Wildbird Prospect
SummaryORFN $3ampQWHUHVW )OXLG 2LOampUHVWPVV DWHUGHSWKP P
Notes
Play Risk Prospect RiskGRV NG Porosity SO Bo STOIIP Rf Rec Res
6RXUFH 7UDS (MMm2) () () () (rbstb) (MMstb) (frac) (MMstb)6HDO ampKDUJH 5HVHUYRLU3UHV 5HVHUYRLU(II Low
Best High
COS 9 Deterministic inputs probabilistic STOIIP and Rec Resource Mean
)RXUZDGLSFORVHGKLJK
5
0 km 5
6 1(
PVV
Wildbird Horizons
ODFNEHUULJKWOXH3LQN5HG
mss
Enclosure 19 Summary Description Sheet Night Heron Prospect
SummaryORFN $3ampQWHUHVW RIORFN)OXLG 2LOampUHVWPVV DWHUGHSWKP
Notes
Prospect Risk Area Areal NG Net Porosity SO Bo STOIIP Rf Rec ResampKDUJH (km2) (frac) (m) () () (rbstb) (MMstb) (frac) (MMstb)5HVHUYRLU 7UDS Low 6HDO Best
High COS 144 Deterministic inputs probabilistic STOIIP and Rec Resource Mean 759
1LJKW+HURQLVD7XURQLDQEDVLQIORRUIDQVVWHPZKLFKPDLQOOLHVZLWKLQEORFNRIIVKRUHLEHULDWLVLGHQWLILHGDVDVWUDWLJUDSKLFWUDSZLWKDUHDOH[WHQWVGHILQHGEDPSOLWXGHWUXQFDWLRQDQGVWUXFWXUDOSLQFKRXW$QDUHDQHWDSSURDFKZDVDGRSWHGXVLQJWKHIXOOVWDFN360GHSWKLPDJHYROXPHWRSURYLGH61$H[WUDFWLRQDQGFRQVWUDLQDUHDOH[WHQWDQGHVWLPDWHDQDUHDO1WRDFFRXQWIRUODWHUDOYDULDELOLWZLWKLQWKHUHVHUYRLU1LJKW+HURQIDOOVSDUWORIIEORFN(5amp(FRUUHFWIRUWKLVXVLQJWKHUDWLRRIRQEORFNWRRIIEORFNDUHDLQUHSRUWLQJRIQHWXQULVNHGDQGQHWULVNHGUHVXOWV
6HLVPLFLQH36061$([WUDFWLRQ
Arbitrary line across Night Heron PSDM (Depth m)
S NE
2QWKHXSGLSSLQFKRXWLVGHILQHGELVRSDFKDQGDPSOLWXGHWUXQFDWLRQ
2QWKHXSGLSSLQFKRXWLVGHILQHGRQOELVRSDFK
Bee EaterNight Heron
5 Km
RMS Amplitudes from BFF Isopach
Depth (m)
Block Boundary
Enclosure 21 Summary Description Sheet
Summary - M - CretBlock A1
Working Interest () 60
Fluid Oil
Crest (m) 3130 (1070 bml)
Water depth (m) 2220
Notes
Play Risk Prospect Risk Area Stack F Net Porosity SO Bo STOIIP Rf Rec Res(Km2) (frac) (m) () () (rbstb) (MMstb) (frac) (MMstb)
Source 70 Trap 54
Seal 50 Mig 80 Low 8 1 15 10 55 125 82 010 13
Res Pres 80 Res Eff 80 Best 14 1 30 16 65 117 231 023 43
28 35 High 26 1 60 22 75 110 629 035 141
COS 10 Deterministic inputs probabilistic STOIIP and Rec Resource Mean 66
Structural high along edge of buried carbonate platform margin of
probable Lower Cretaceous and Jurassic age Seismic evidence
favourable for reservoir development Lower Bo model used to
reflect relatively shallow nature of prospect The prospect is close
to the shelf margin and so is well placed for charging The strong
rugose seismic events are interpreted as Karstified Limestones
Seismic Line Top Structure Map
WƌŽƐƉĞĐƚD
ĞƉƚŚŵ
Ϳ
Enclosure 22 Summary Description Sheet
Summary - SS - 4Block A1
Working Interest () 60
Fluid Oil
Crest (m) 4230 (2010 bml)
Water depth (m) 2220
Notes
Play Risk Prospect Risk Area Stack F Net Porosity SO Bo STOIIP Rf Rec Res(Km2) (frac) (m) () () (rbstb) (MMstb) (frac) (MMstb)
Source 70 Trap 80
Seal 90 Mig 85 Low 6 1 10 16 68 220 43 030 16
Res Pres 80 Res Eff 50 Best 11 1 19 20 75 167 113 038 42
50 34 High 21 1 35 24 83 135 295 045 112
COS 17 Deterministic inputs probabilistic STOIIP and Rec Resource Mean 56
Four way dip closed anticlinal structure The SS-4 interval has a
gross thickness over the crest area of 360 m Downlap of seismic
events across the crest of the SS-4 structure slightly downgrades
SS-4 seal The interval is believed to be Cenomanian in age and
the seismic character of generally planar events is interpreted as
representing thin bedded turbidites
Seismic Line Top Structure Map
2010 Migration Velocity Data ndash SS-4 Probability Above Spill
Enclosure 23 Summary Description Sheet
Summary - SS - 3Block A1
Working Interest () 60
Fluid Oil
Crest (m) 4590 (2370 bml)
Water depth (m) 2220
Notes
Play Risk Prospect Risk Area Stack F Net Porosity SO Bo STOIIP Rf Rec Res(Km2) (frac) (m) () () (rbstb) (MMstb) (frac) (MMstb)
Source 70 Trap 75
Seal 90 Mig 85 Low 12 1 20 15 68 227 197 025 63
Res Pres 80 Res Eff 50 Best 17 15 35 18 75 173 417 034 143
50 32 High 25 2 60 20 83 140 881 045 316
COS 16 Deterministic inputs probabilistic STOIIP and Rec Resource Mean 173
Four way dip closed anticlinal structure The SS-3 interval has a
gross thickness over the crest area of 550 m Seals to deeper
reservoirs may be eroded by overlying reservoirs From seismic
the prospective reservoir has been interpreted as being an Albian
deep water channel-lobe complex
Seismic Line Top Structure Map
2010 Migration Velocity Data ndashSS-3 Probability Above Spill
Enclosure 24 Summary Description Sheet
Summary - SS - 2Block A1
Working Interest () 60
Fluid Oil
Crest (m) 5140 (2920 bml)
Water depth (m) 2220
Notes
Play Risk Prospect Risk Area Stack F Net Porosity SO Bo STOIIP Rf Rec Res(Km2) (frac) (m) () () (rbstb) (MMstb) (frac) (MMstb)
Source 70 Trap 75
Seal 90 Mig 85 Low 12 1 20 11 68 231 187 025 58
Res Pres 80 Res Eff 50 Best 17 2 35 14 75 183 416 032 133
50 32 High 25 3 60 17 83 151 911 040 303
COS 16 Deterministic inputs probabilistic STOIIP and Rec Resource Mean 163
Four way dip closed anticlinal structure The SS-2 interval has a
gross thickness over the crest area of 830 m The prospective
reservoir has been interpreted as a stacked series of channellobe
sets Seals to deeper reservoirs may be eroded by overlying
reservoirs
Seismic Line Top Structure Map
2010 Migration Velocity Data ndashSS-2 Probability Above Spill
Enclosure 25 Summary Description Sheet
Summary - SS - 1Block A1
Working Interest () 60
Fluid Oil
Crest (m) 5970 (3750 bml)
Water depth (m) 2220
Notes
Play Risk Prospect Risk Area Stack F Net Porosity SO Bo STOIIP Rf Rec Res(Km2) (frac) (m) () () (rbstb) (MMstb) (frac) (MMstb)
Source 70 Trap 65
Seal 90 Mig 80 Low 17 1 20 8 50 249 158 015 34
Res Pres 80 Res Eff 50 Best 30 2 35 11 60 196 399 024 98
50 26 High 54 3 60 13 70 162 997 040 276
COS 13 Deterministic inputs probabilistic STOIIP and Rec Resource Mean 135
Four way dip closed anticlinal structureThe SS-1 interval has a
gross thickness over the crest area of 890 m The prospective
reservoir lies under an unconformity and is believed to be Jurassic
in age its seismic character suggests a channel amp channel-levee
complex Regional porosity trends indicate low porosities are likely
to be encountered if hydrostatic pressures are assumed
Seismic Line Top Structure Map
2010 Migration Velocity Data ndash SS-1 Probability Above Spill
Enclosure 31 Summary Description Sheet
SummaryBlock SL-03
APCL Interest () 90
Fluid Oil
Crest (m ss) 5400
Water depth (m) 3300
Notes
Play Risk Prospect Risk Area Areal NG Net Porosity SO Bo STOIIP Rf Rec Res(km2) (frac) (m) () () (rbstb) (MMstb) (frac) (MMstb)
Source 80 Trap 50
Seal 90 Mig 70 Low 11 070 29 15 73 205 218 030 79
Res Pres 90 Res Eff 80 Best 32 082 56 18 80 162 755 038 278
65 28 High 92 094 83 21 88 134 2473 045 938
COS 18 Mean 434
Altair is a Turonian turbidite channel prospects within the
SL-03 Block offshore Sierra Leone It is identified as a
stratigraphic trap with areal extents defined by amplitude
truncation and structural pinchout Recent discoveries in
nearby blocks confirm a working hydrocarbon system
(Venus-B1 Jupiter-1 and Mercury-1) The Sierra Leone
wells A-1 and A1-2 proved good reservoir and potential
source rocks Two distinct canyon systems feed erosive
channels at the break of slope An area net approach was
adopted using a pseudo-gradient volume SNA extraction to
constrain areal extent and define an areal NG to account
for lateral variability of sand distribution within the
reservoir
Arbitrary Dip Line Grad TWTGrad NRMS Extraction
Enclosure 41 Summary Description Sheet
SummaryBlock CI-513
APCL Interest () 90
Fluid Oil
Crest (m ss) 4200
Water depth (m) 2500
Notes
Play Risk Prospect Risk Area Areal NG Net Porosity SO Bo STOIIP Rf Rec Res(km2) (frac) (m) () () (rbstb) (MMstb) (frac) (MMstb)
Source 60 Trap 50
Seal 90 Mig 70 Low 11 070 20 17 73 181 179 030 65
Res Pres 90 Res Eff 80 Best 40 085 38 20 80 149 815 038 302
49 28 High 149 099 55 23 88 126 3474 045 1318
COS 14 Mean 569
Ayame is an Upper Cretaceous fan which mainly lies
ZLWKLQEORFNampRIIVKRUHampRWHparaYRLUHWLVLGHQWLILHGas a stratigraphic trap with areal extents defined by
amplitude truncation and structural pinchout The prospect
has very good amplitude support An area net approach
was adopted using pseudo-gradient volume SNA NRMS
extractions to constrain areal extent and define an areal
NG to account for lateral variability of sand distribution
within the reservoir for low and high case area polygons
These seismically defined polygons were then filled to
column heights of 200m and 800m respectively and used
to constrain the P90 and P10 area inputs of our
probabilistic simulation
Seismic Line
TWT Grad SNA Extraction
Ayame
Ayame West
dtdƐͿ
Ayame
Enclosure 42 Summary Description Sheet
SummaryBlock CI-513 amp Open
APCL Interest () 90 in CI-513
Fluid Oil
Crest (m ss) 4900
Water depth (m) 2700
Notes
Play Risk Prospect Risk Area Areal NG Net Porosity SO Bo STOIIP Rf Rec Res(km2) (frac) (m) () () (rbstb) (MMstb) (frac) (MMstb)
Source 60 Trap 50
Seal 90 Mig 70 Low 10 061 25 14 73 194 161 030 58
Res Pres 90 Res Eff 80 Best 30 080 47 18 80 159 585 038 216
49 28 High 93 099 69 21 88 134 2085 045 788
COS 14 Mean 352
A second prospect within the same reservoir interval was
identified and volumetrically assessed Ayame West is
separated from Ayame by a structural high isopach
thinning and amplitude dimming The prospect was
assessed in the same manner as Ayame with a but with
Low Case column height of 600m filling down to the point
at which amplitudes between the two fans brighten
allowing possible communication The upper end of the
Ayame West fan lies down-dip of Ayame and less than
1km away from the thinning low amplitude saddle between
the two prospects
Seismic Line
TWT Grad SNA Extraction
Ayame
West
Ayame West
dtdƐͿ
Ayame
Enclosure 43 Summary Description Sheet
SummaryBlock CI-513 CI-509
APCL Interest () 90 of CI-513
Fluid Oil
Crest (m ss) 4400
Water depth (m) 2500
Notes
Play Risk Prospect Risk Area Areal NG Net Porosity SO Bo STOIIP Rf Rec Res(km2) (frac) (m) () () (rbstb) (MMstb) (frac) (MMstb)
Source 60 Trap 40
Seal 90 Mig 70 Low 6 070 15 16 73 185 71 030 26
Res Pres 90 Res Eff 70 Best 23 084 28 19 80 152 320 038 118
49 20 High 92 098 42 22 88 129 1408 045 521
COS 10 Mean 237
This sheet refers to volumes associated with Blocks 513 and CI-509 Sassandra is an Upper Cretaceous fan
which straddles blocks CI-513 and CI-509 It is identified
as a stratigraphic trap with areal extents defined by
amplitude truncation and structural pinchout A single
target reservoir is identified within the Turonian The
prospect has good amplitude support An area times net
approach was adopted using a pseudo-gradient volume
NRMS extraction to constrain prospect size Angle stacks
were not available outside of Block CI-513 so an RMS
extraction on the full stack volume was used to determine
NW extent In our low case we restrict the area of the
accumulation to the brightest area of anomalous
amplitudes Our high case extends the prospect down-dip
Arbitrary Dip Line Grad TWT
Full Stack - RMS Extraction
Sassandra
dtdƐͿ
Enclosure 44 Summary Description Sheet
SummaryBlock CI-513
APCL Interest () 90
Fluid Oil
Crest (m ss) 3900
Water depth (m) 2500
Notes
Play Risk Prospect Risk Area Areal NG Net Porosity SO Bo STOIIP Rf Rec Res(km2) (frac) (m) () () (rbstb) (MMstb) (frac) (MMstb)
Source 60 Trap 40
Seal 90 Mig 70 Low 4 071 20 19 73 185 67 030 25
Res Pres 90 Res Eff 70 Best 13 085 38 22 80 152 281 038 104
49 20 High 46 099 55 25 88 129 1142 045 431
COS 10 Mean 190
Cavalla is an Upper Cretaceous Fan which lies between
the Ayame and Sassandra prospects of Block CI-513
RIIVKRUHampRWHparaYRLUHWLVLGHQWLILHGDVDVWUDWLJUDSKLFtrap with areal extents defined by amplitude truncation and
structural pinchout A single target reservoir is identified
within the TuronianCenomanian interval which lies
stratigraphically beneath the Ayame Prospect For the
amplitude analysis the top reservoir has been shifted up
30ms to bracket strong negative amplitudes on the
Gradient volume and the base reservoir has been shifted
up 50ms to remove Albian related amplitudes An area net
approach was adopted using pseudo-gradient volume SNA
NRMS extractions to constrain extent of the low and high
case area polygons These seismically defined polygons
were then filled to column heights of 200m and 800m
respectively
Arbitrary Dip Line Grad TWT Grad NRMS Extraction
Cavalla
dtdƐͿ
Enclosure 45 Summary Description Sheet
SummaryBlock CI-509
APCL Interest () 90
Fluid Oil
Crest (m ss) 3700
Water depth (m) 2500
Notes
Play Risk Prospect Risk Area Areal NG Net Porosity SO Bo STOIIP Rf Rec Res(km2) (frac) (m) () () (rbstb) (MMstb) (frac) (MMstb)
Source 60 Trap 60
Seal 90 Mig 70 Low 5 076 39 21 73 150 252 015 55
Res Pres 90 Res Eff 80 Best 18 088 75 24 80 134 997 028 258
49 34 High 61 100 111 27 88 121 3682 040 1039
COS 16 Mean 460
Leraba is an Upper Cretaceous fan It is identified as a
stratigraphic trap with extents defined by amplitude
truncation and structural pinchout The final processing
products and AvO volumes are yet to be delivered for CI-
KRZHYHUWKHmicroHRWUDFHUDZPLJUDWLRQVWDFNparaYROXPHLVof high quality and is deemed suitable for deriving a
volumetric range for Leraba An area net approach was
adopted using an RMS extraction to constrain extent and
define an areal NG to account for lateral variability of sand
distribution In our low case we restrict the area to the
brightest area of anomalous amplitudes Our high case
extends the prospect down-dip and SW to include a
secondary channel system
Arbitrary Dip Line TWT Full Stack RMS Extraction
Leraba
dtdƐͿ

Competent Personrsquos Report African Petroleum Corporation Ltd
The Licences
APCL holds a 100 per cent contractor interest in a Production Sharing Contract (ldquoPSCrdquo) covering Blocks 8 amp 9 offshore Liberia Our independent Best Estimate (P50) of prospective oil resources for the five prospects we have assessed (Table 1) in aggregate is 1875 MMstb unrisked net attributable to APCL is 1815 MMstb unrisked and 289 MMstb risked Our independent Mean estimate of prospective oil resources for the five prospects in aggregate is 3155 MMstb unrisked net is 3046 MMstb unrisked and 473 MMstb net risked
Both blocks are in their second exploration period which began on 12th June 2012 and lasts for two years Commitments during the second phase are a single exploration well (to a minimum depth of 2000 meters) within Block 9 and two exploration wells (to a minimum depth of 2000 meters) in Block 8 as a well commitment from the first exploration phase has been carried into the second phase in Block 8 The minimum spend for each block in the second exploration period is US$ 10 MM The drilling of Well Bee Eater-1 has fulfilled the commitments in the second exploration period in Block 9
For each block there is one further optional exploration period of two years that can be entered into with a further well (to a minimum of 2000 metres) being required in each block in each period At the end of the third period all areas not retained for appraisal and development are to be relinquished There are also provisions for an appraisal period and an exploitation period of 25 years (with an additional term of 10 years if necessary) for each development area
APCL holds a 60 contractor interest in PSCs covering Blocks A1 and A4 offshore Gambia with Buried Hill Gambia BV holding the remaining 40 The contracts were signed on 8th September 2006 with an effective date of 31st December 2007 and following two extensions they are still currently in the first exploration period which runs through to 31 December 2013 Our independent Best Estimate (P50) of prospective oil resources for the Alhamdulilah prospect and Prospect M (Table 2) in aggregate is 459 MMstb unrisked net attributable to APCL is 275 MMstb unrisked and 411 MMstb net risked Our independent Mean estimate of prospective oil resources for the prospect is 593 MMstb unrisked net is 356 MMstb unrisked and 526 MMstb net risked
The commitment during the first period comprises 1000 km2 of 3D seismic data in Block A1 750 km2 of 3D seismic data in Block A4 and one well which may be drilled in either block The seismic commitment has already been met
APCL holds a 90 contractor interest in PSCs covering Blocks CI-509 and CI-513 offshore Cote DrsquoIvoire Petroci has the remaining 10 as a carried interest The licences were awarded on 16th March 2012 and 19th December 2011 for CI-509 and CI-513 respectively For CI-509 the licence consists of three terms of three three and two years respectively with a 25 relinquishment after each of the first and second terms For CI-513 the licence consists of three exploration terms of three two and two years respectively with a 25 relinquishment after each of the first and second terms Our independent Best Estimate (P50) of prospective oil resources for the five reviewed prospects (Table 3) in aggregate is 999 MMstb unrisked net attributable to APCL is 863 MMstb unrisked and 1164 MMstb net risked Our
Competent Personrsquos Report African Petroleum Corporation Ltd
independent Mean estimate of prospective oil resources for the prospects is 1808 MMstb unrisked net is 1560 MMstb unrisked and 2094 MMstb net risked
The commitment during the first period of licence CI-509 is to purchase existing 2D seismic acquire 1091 km2 3D seismic data perform geological and geophysical studies and drill one exploration well to a depth of 100 m into the Albian with a minimum financial commitment of US $60 MM The seismic commitment has already been met The commitment during the first period of licence CI-513 is to purchase existing 2D seismic data acquire 1446 km2 3D data perform geological and geophysical studies and drill one exploration well to a depth of 100 m into the Albian with a minimum financial commitment of US $60 MM The seismic commitment has already been met
APCL holds a 100 contractor interest in a PSC covering Block SL-03 offshore Sierra Leone through its wholly owned subsidiary European Hydrocarbons Ltd The licence was ratified by the government on 22nd February 2011 The licence has a duration of thirty years the first seven of which are termed the exploration period which is further subdivided into an initial period of three years followed by two extension periods of two years each The licence is currently in the initial exploration period
Work commitments during the initial period for Block SL-03 are to purchase and interpret the existing 2D seismic data over the licence and acquire a minimum of 500 km2 of 3D seismic data APCL has purchased the 2D seismic data and has acquired 2535 km2 of multi-client 3D seismic data over Block SL-03 fulfilling the seismic commitment for the initial phase The first and second extension periods require the drilling of one exploration well to a minimum depth (below mud line) of 1300 m or a minimum equivalent investment of US$ 30 MM Entry to the first extension period requires a 50 relinquishment of the licence area and a further 25 of the initial licence area must be relinquished on entry to the second extension period The area of the licence is 3860 km2 and water depth varies from 100 m to over 4000 m with the south-western half of the block being at water depths greater than 3000 m
Our independent Best Estimate (P50) of prospective oil resources for the Altair prospect in Block SL-03 (Table 4) is 278 MMstb (gross and net) unrisked and 504 MMstb net risked Our independent Mean estimate of prospective oil resources for the prospect is 434 MMstb (gross and net) unrisked and 788 MMstb net risked
Work Done
In carrying out our evaluation of the interests we have relied upon information provided by APCL which comprised details of APCLrsquos licence interests offset well data and associated analysis seismic data including interpretation basic exploration data technical reports and volumetric estimates where appropriate
Our approach has been to commence our investigations with the most recent technical reports and interpreted data From these we have been able to identify those items of basic data which require re-assessment Where only basic data have been available or where previous interpretations of data have
Competent Personrsquos Report African Petroleum Corporation Ltd
been considered incomplete we have undertaken our own interpretation A site visit was not undertaken
In estimating petroleum in place and recoverable we have used the standard techniques of prospect analysis These techniques combine geophysical and geological knowledge with assessments of porosity and permeability distributions fluid characteristics and reservoir pressure There is uncertainty in the measurement and interpretation of basic data We have estimated the degree of this uncertainty and have used statistical methods to calculate the range of petroleum initially in place and recoverable
We have estimated the chance of success for drilling the identified exploration prospects using the industry standard approach of assessing the likelihood of source rock charge reservoir trap and seal The result is the chance or probability of discovering hydrocarbons in sufficient quantity and which test at a sufficient rate to permit consideration for subsequent appraisal and development
The nomenclature used in this report is presented in Appendix 2
Professional Qualifications
ERC Equipoise is an independent consultancy specialising in petroleum reservoir evaluation Except for the provision of professional services on a fee basis ERC Equipoise has no commercial arrangement with any other person or company involved in the interests that are the subject of this report
The work has been supervised by Dr Adam Law Geoscience Director of ERCE a post-graduate in Geology a Fellow of the Geological Society and a member of the Society of Petroleum Evaluation Engineers He has 18 years relevant experience in the evaluation of oil and gas fields and exploration acreage preparation of development plans and assessment of reserves and resources
Yours faithfully
ERC Equipoise Limited
Adam Law
Geoscience Director
Competent Personrsquos Report African Petroleum Corporation Ltd
Table 1 STOIIP and Prospective Oil Resources Liberia Blocks 8 and 9
Table 2 STOIIP and Prospective Oil Resources - Alhamdulilah and Prospect M - Gambia
APCL Interest
Prospect Risk
Play Risk
Low Best High Mean Low Best High Mean () Low Best High Mean () () Low Best High MeanBarbet Turonian 166 500 1479 718 60 186 558 270 100 60 186 558 270 22 1 22 13 41 123 59
Campanian 177 461 1187 609 63 172 448 229 100 63 172 448 229 27 1 27 17 46 122 62Turonian 107 307 863 429 39 115 327 162 100 39 115 327 162 19 1 19 7 22 62 31
Cenomanian 91 264 779 376 33 99 294 141 100 33 99 294 141 18 1 18 6 18 53 25Blue Horizon 68 293 1218 536 25 109 456 201 100 25 109 456 201 20 1 20 5 22 91 40Pink Horizon 59 262 1066 474 22 96 400 178 100 22 96 1070 178 20 1 20 4 19 214 36
Green Horizon 48 210 896 399 18 78 337 150 100 18 78 337 150 20 1 20 4 16 67 30Night Heron Turonian 254 1117 4603 1904 92 416 1742 759 100 87 356 1338 650 144 1 144 13 51 193 94
Wildbird Light Blue Horizon 552 2289 8700 3946 144 605 2377 1065 100 144 605 2377 1065 38 24 9 13 54 214 96Total 1522 5704 20791 9392 497 1875 6940 3155 492 1815 7205 3046 82 289 1139 473
ReservoirProspect
Sunbird
Unrisked Prospective Resource (MMstb)STOIIP (MMStb) Net Unrisked Prospective Resource (MMstb) COS () Net Risked Prospective Resource (MMstb)
Lovebird (Isopach)
Low Best High Low Best High Mean Low Best High Mean Low Best High Mean
(MMstb) (MMstb) (MMstb) (MMstb) (MMstb) (MMstb) (MMstb) (MMstb) (MMstb) (MMstb) (MMstb) (MMstb) (MMstb) (MMstb) (MMstb)
A1 SS4 Cretaceous 43 113 295 16 42 112 56 60 9 25 67 34 50 34 17 16 43 115 58
A1 SS3 Cretaceous 197 417 881 63 143 316 173 60 38 86 189 104 50 32 16 60 138 304 167
A1 SS2 Cretaceous 187 416 911 58 133 303 163 60 35 80 182 98 50 32 16 56 128 292 157
A1 SS1 Jurassic 158 399 997 34 98 276 135 60 21 59 166 81 50 26 13 27 77 217 106
A1 M Aptian 82 231 629 13 43 141 66 60 8 26 85 40 28 35 10 07 25 82 38
666 1577 3713 183 459 1148 593 110 275 689 356 17 411 1010 526 Total
Net Risked Prospective Resource APCL
Interest ()
Net Unrisked Prospective Resource Prospect
RiskPlay Risk Block Prospect Reservoir
STOIIP Unrisked Prospective Resource
COS ()
Competent Personrsquos Report African Petroleum Corporation Ltd
Table 3 STOIIP and Prospective Oil Resources ndash Cote DrsquoIvoire
Table 4 STOIIP and Prospective Oil Resources - Sierra Leone
Low Best High Low Best High Mean Low Best High Mean Low Best High Mean
(MMstb) (MMstb) (MMstb) (MMstb) (MMstb) (MMstb) (MMstb) (MMstb) (MMstb) (MMstb) (MMstb) (MMstb) (MMstb) (MMstb) (MMstb)
CI-513 AyameUpper
Cretaceous179 815 3474 65 302 1318 569 90 58 267 1138 502 49 28 14 80 363 1549 683
CI-513 Ayame WestUpper
Cretaceous161 585 2085 58 216 788 352 90 52 183 626 298 49 28 14 71 249 852 406
CI-513 Sassandra Upper
Cretaceous71 320 1408 26 118 521 237 90 23 87 300 175 49 20 10 22 83 286 166
CI-513 CavallaUpper
Cretaceous67 281 1142 25 104 431 190 90 22 93 388 171 49 20 10 21 89 370 163
CI-509 LerabaUpper
Cretaceous252 997 3682 55 258 1039 460 90 50 232 935 414 49 34 16 82 380 1527 676
731 2998 11792 229 999 4097 1808 206 863 3387 1560 275 1164 4583 2094TOTAL
COS ()
Net Risked Prospective Resource
Interest ()
Net Unrisked Prospective Resource
Block Prospect Reservoir
STOIIP Unrisked Prospective ResourcePlay Risk
()Prospect Risk ()
Low Best High Low Best High Mean Low Best High Mean Low Best High Mean
(MMstb) (MMstb) (MMstb) (MMstb) (MMstb) (MMstb) (MMstb) (MMstb) (MMstb) (MMstb) (MMstb) (MMstb) (MMstb) (MMstb) (MMstb)
SL-03 AltairUpper
Cretaceous218 755 2473 79 278 938 434 100 79 278 938 434 65 28 18 144 504 1702 788
Table 4 STOIIP and Prospective Oil Resources - Sierra Leone
Block Prospect Reservoir
STOIIP Unrisked Prospective ResourcePlay Risk
()Prospect Risk ()
COS ()
Net Risked Prospective Resource
Interest ()
Net Unrisked Prospective Resource
Competent Personrsquos Report
African Petroleum Corporation Limited
PREPARED FOR African Petroleum Corporation Limited
BY ERC Equipoise Limited
June 2013
Competent Personrsquos Report African Petroleum Corporation Limited
June 2013
Authors Adam Law Michael Braim Glyn Pugh Kate Overy Don Munn
Approved by Simon McDonald
Date released to client June 25 2013
ERC Equipoise Limited (ldquoERC13 Equipoiserdquo13 or13 ldquoERCErdquo) has made every effort to ensure that the interpretations conclusions and recommendations presented herein are accurate and reliable in accordance with good industry practice ERC Equipoise does not however guarantee the correctness of any such interpretations and shall not be liable or responsible for any loss costs damages or expenses incurred or sustained by anyone resulting from any interpretation or recommendation made by any of its officers agents or employees
Competent Personrsquos Report African Petroleum Corporation Limited
June 2013
Table of Contents 1 Introduction 14
11 Liberia PSC Overview 16
12 Gambia PSC Review 17
13 Senegal PSC Review 18
14 Sierra Leone PSC Review 19
15 Cote drsquoIvoire PSC Review 21
16 Evaluation Methodology Prospective Resources 22
2 Liberia Prospectivity and Plays 26
21 Introduction 26
22 Well and Seismic Database 27
23 Plays and Petroleum Geology Blocks 8 and 9 29
24 Play and Prospect Risk Liberia Blocks 8 and 9 31
25 Liberia Blocks 8 and 9 Leads and Prospects 33
251 Barbet Prospect 34
252 Sunbird Canyon Prospect 36
253 Night Heron 39
254 Lovebird Prospect 42
255 Wildbird Prospect 44
3 Gambia Prospectivity and Plays 47
31 Introduction 47
32 Well and Seismic Database 48
33 Plays and Petroleum Geology Blocks A1 and A4 49
34 Play Risk 51
35 Gambia Leads and Prospects 53
351 Alhamdulilah Prospect 54
352 Prospect M 57
4 Sierra Leone Prospectivity and Plays 59
41 Play Risk 62
41 Sierra Leone Leads and Prospects 62
Competent Personrsquos Report African Petroleum Corporation Limited
June 2013
411 Altair 62
5 Cote drsquoIvoire Prospectivity and Plays 65
51 Introduction 65
52 Well and Seismic Database 66
53 Plays and Petroleum Geology Blocks CI-509 and CI-513 67
54 Play Risk 68
55 Cote drsquoIvoire Blocks CI-509 and CI-503 Leads and Prospects 69
551 Ayame amp Ayame West 69
552 Sassandra 71
553 Cavalla 73
554 Leraba 75
6 Senegal Prospectivity and Plays 78
7 Appendix 1 SPE PRMS Guidelines 80
8 Appendix 2 Nomenclature 89
81 Units 89
82 Reserves and Resources Classifications 89
83 Abbreviations 89
Enclosures Resource Summary Sheets 91
Competent Personrsquos Report African Petroleum Corporation Limited
June 2013
List of Tables Table 11 Licence Summary Table 15 Table 12 Estimated oil recovery factors from producing Atlantic Margin fields 24 Table 13 Play and prospect risk system 24 Table 21 Play risk Cretaceous carbonate play Liberia Blocks 8 and 9 32 Table 31 Play risk Gambia Blocks A1 and A4 52 Table 41 Play risk Sierra Leone Block SL-03 62 Table 51 Play risk Cote drsquoIvoire Blocks CI-509 and CI-513 68
Competent Personrsquos Report African Petroleum Corporation Limited
June 2013
List of Figures Figure 1-1 Location of APCL licences West Africa 14 Figure 1-2 Location of Liberia Blocks 8 and 9 16 Figure 1-3 Location of Gambia Blocks A1 and A4 17 Figure 1-4 Location of Senegal ROP and SOSP Licences 18 Figure 1-5 Location of Blocks SL-03 and SL-04A 20 Figure 1-6 Location of Blocks CI-509 and CI-513 21 Figure 2-1 Notable discoveries West Africa offshore 27 Figure 2-2 Well and seismic database Liberia Blocks 8 and 9 28 Figure 2-3 Petroleum systems and plays Liberia Blocks 8 and 9 30 Figure 2-4 Porositydepth trend published West Africa turbidite reservoirs 31 Figure 2-5 Leads and Prospects Liberia Blocks 8 and 9 33 Figure 2-6 Seismic line (depth) over the Barbet prospect 34 Figure 2-7 Barbet far offset amplitudes with Top Turonian depth contours (m TVDSS) 35 Figure 2-8 Regional seismic line along axis of the Sunbird canyon system 36 Figure 2-9 Sunbird Campanian far offset amplitudes with Cenomanian depth contours (m TVDSS) 37 Figure 2-10 Sunbird Turonian far offset amplitudes with Top Turonian depth contours (m TVDSS) 38 Figure 2-11 Sunbird Cenomanian far offset amplitudes with Cenomanian depth contours (m TVDSS) 39 Figure 2-12 Arbitrary line across Night Heron PSDM (Depth m) 40 Figure 2-14 SNA from Basin Floor Fan Isopach (m) - PSDM 41 Figure 2-15 Seismic line over the Lovebird prospect 42 Figure 2-16 Lovebird prospect Top Pink horizon depth (mss) high case 43 Figure 2-17 Seismic line and prospect geo-seismic sketch Wildbird prospect 45 Figure 2-18 Wildbird Top Reservoir depth map (m TVDSS) Spill point - green contour 46 Figure 3-1 Plays Gambia Blocks A1 and A4 47 Figure 3-2 Wells 2D and 3D seismic data (red outline) Gambia Blocks A1 and A4 48 Figure 3-3 Well to seismic tie ndash Well Jammah-1 to the Alhamdulilah prospect 50 Figure 3-4 Leads and prospects identified by APCL in Gambia Blocks A1 and A4 53 Figure 3-5 Seismic line over the Alhamdulilah prospect 54 Figure 3-6 Area of closure Alhamdulilah prospect layers SS1 to SS4 55 Figure 3-7Alhamdulilah prospect seismic facies interpretation Cretaceous intervals 56 Figure 3-8 Seismic line through Prospect M 57 Figure 3-9 Low and high case closure Prospect M top Aptian depth (m TVDSS) 58 Figure 4-1 Offshore licences and discoveries Liberia and Sierra Leone 59 Figure 4-2 Well and seismic database offshore Sierra Leone 60 Figure 4-3 Leads Sierra Leone Block SL-03 61 Figure 4-4 Dip seismic line (full offsets) Altair prospect 63 Figure 4-5 Seismic amplitude (gradient stack) and Top Turonian depth (m TVDSS) Altair prospect 64 Figure 5-1 CI-509 and CI-513 Prospects and Leads offshore Cote drsquoIvoire 65
Competent Personrsquos Report African Petroleum Corporation Limited
June 2013
Figure 5-2 Petroleum systems and plays offshore Cote drsquoIvoire 66 Figure 5-3 Well and seismic database offshore Sierra Leone 67 Figure 5-4 Strike Line Ayame and Ayame West prospects 69 Figure 5-5 Ayame Seismic amplitude (gradient stack) and Top Turonian depth (m TVDSS) 70 Figure 5-6 Dip seismic line Sassandra prospect 71 Figure 5-7 Sassandra prospect Seismic amplitude and Top Turonian depth (m TVDSS) 72 Figure 5-8 Dip seismic line Cavalla prospect 74 Figure 5-9 Seismic amplitude (gradient stack) and Top fan depth (m TVDSS) Cavalla prospect 75 Figure 5-10 Dip seismic line Leraba prospect 76 Figure 5-11 Seismic amplitudes Leraba prospect 77 Figure 6-1 Petroleum systems and plays offshore Senegal 78 Figure 6-2 leads offshore Senegal Blocks ROP and SOSP 79
Competent Personrsquos Report African Petroleum Corporation Limited
June 2013 14
1 Introduction
At the time of writing African Petroleum Corporation Limited (APCL) holds interests in and operates exploration licences offshore West Africa within the territorial waters of Senegal the Gambia Sierra Leone Liberia and Cote drsquoIvoire (Figure 1-1) The status of these licences is summarised in Table 11 below ERC Equipoise Ltd (ERCE) has reviewed the prospectivity of these licences using data as of 31st May 2013
Figure 1-1 Location of APCL licences West Africa
Currently prospective resources are identified by APCL within the Liberia Gambia Sierra Leone and Cote drsquoIvoire licences We have made independent estimates of prospective resources and geological chance of success for certain prospects within these countries which are identified by APCL as near-term drilling opportunities The evaluation of the offshore Senegal licences is on-going and no prospects have been identified as of the date of this report We summarise qualitatively the prospectivity of the licences held by APCL in this country
Competent Personrsquos Report African Petroleum Corporation Limited
June 2013 15
Country Block Licence
Operator APCL () Status
Licence
Area (km2)
Outstanding Commitment in this Phase
Start of Current Phase
End of Current Phase
Liberia 8 APCL 100 Expl June 2012
June 2014
2717 Two
Exploration wells
Liberia 9 APCL 100 Expl June 2012
June 2014
2634 None
Gambia A1 APCL 60 Expl Dec
2007 Dec
2013 1296
One Exploration
well 1
Gambia A4 APCL 60 Expl Dec
2007 Dec
2013 1376 (see A1)
Senegal Rufisque Offshore Profond
APCL 90 Expl Oct
2011 Oct
2015 10357
One exploration
well
Senegal
Senegal Offshore
Sud Profond
APCL 90 Expl Oct
2011 Oct
2014 7920 None
Sierra Leone
SL-03 APCL 100 Expl Feb
2011 Feb
2014 3860 None
Sierra Leone
SL-04A APCL 100 Expl Sept 2012
Sept 2015
1995 One
exploration well 2
Cote drsquoIvoire
CI-509 APCL 90 Expl March 2012
March 2015
1091 One
exploration well
Cote drsquoIvoire
CI-513 APCL 90 Expl Dec
2011 Dec
2014 1446
One exploration
well
1) Transferrable to Block A4 if necessary 2) Contingent on results of 3D and that technology is available to drill in such water depths
Table 11 Licence Summary Table
Competent Personrsquos Report African Petroleum Corporation Limited
June 2013 16
11Liberia PSC Overview
APCL holds a 100 contractor interest in a Production Sharing Contract (ldquoPSCrdquo) covering Blocks 8 amp 9 offshore Liberia (Figure 1-2) Both blocks are in their second exploration period which began on 12th June 2012 and lasts for two years Commitments during the second phase in Block 8 are two exploration wells (to a minimum depth of 2000 meters) as a well commitment from the first exploration phase has been carried into the second phase All commitments have been met for the second phase in Block 9 with the drilling of Well Bee Eater-1 The minimum spend for each block in the second exploration period is US$ 10 MM At the end of this second phase a further 25 of each licence must be relinquished
Figure 1-2 Location of Liberia Blocks 8 and 9
For each block there is one further optional exploration period of two years that can be entered into with an additional well (to a minimum of 2000 metres) being required in each block in each period At the end of the third period all areas not retained for appraisal and development are to be relinquished There are also provisions for an appraisal period and an exploitation period of 25 years (with an additional term of 10 years if necessary) for each development area
Competent Personrsquos Report African Petroleum Corporation Limited
June 2013 17
Following a 25 relinquishment at the end of the first exploration phase Block 8 comprises an area of 2717 km2 and Block 9 comprises 2634 km2 Water depths range from less than 100 m to over 3000 m Most of the block areas lie in water depths greater than 500 m
12Gambia PSC Review
APCL holds a 60 contractor interest in Production Sharing Contracts covering Blocks A1 and A4 offshore Gambia (Figure 1-3) with Buried Hill Gambia BV holding the remaining 40 The licences were signed on 8th September 2006 with an effective date of 31st December 2007 and following two extensions they are still currently in the first exploration period which runs through to 31 December 2013
The work commitment during the first period comprises 1000 km2 of 3D seismic data in Block A1 and 750 km2 of 3D seismic data in Block A4 and one well which may be drilled in either block The seismic commitment has already been met
There are two further optional (but automatic) exploration periods of three years each that can be entered into with a well being required in each period in each licence Furthermore in Block A1 relinquishment of 10 of the licence area is required at the end of the first exploration period and 20 at the end of the second period In Block A4 relinquishment of 10 of the licence area is required at the end of the first exploration period In both blocks at the end of the third period all areas not retained for appraisal and development are to be relinquished There are also provisions for an exploitation period with the total term of the licences being 30 years (including the exploration periods) for each development area
The area of the licence is 1296 km2 for Block A1 and 1376 km2 for Block A4 Water depths vary from 500 m to over 3000 m
Figure 1-3 Location of Gambia Blocks A1 and A4
Competent Personrsquos Report African Petroleum Corporation Limited
June 2013 18
13Senegal PSC Review
APCL holds a 90 contractor interest in Exploration and Production Sharing Contracts (EPSC) covering Blocks Rufisque Offshore Profond (ROP) and Senegal Offshore Sud Profonde (SOSP) offshore Senegal (Figure 1-4) via its wholly owned subsidiary African Petroleum Senegal Limited Petrosen the state oil company hold a 10 carried interest
The EPSC governing block SOSP has an effective date of 25th October 2011 The first 85 years of the EPSC are termed the exploration phase which is subdivided into an initial period of three years with two subsequent extension periods of three and two and a half years each Work commitment in the initial exploration period is to acquire and reprocess the existing seismic data within the licence area and also to acquire a further 2500 km2 of 3D seismic data all with a minimum investment of US$ 10 MM The two extension periods have a commitment of one exploration well to a minimum depth of 3500 mss in each period or a minimum investment of US$ 20 MM Entry to the first extension period requires a 30 relinquishment of the licence area and a further 20 of the initial licence area must be relinquished on entry to the third phase The area of the licence is currently 7920 km2 Water depth is between 1000 and 4000 m over the block
Figure 1-4 Location of Senegal ROP and SOSP Licences
Competent Personrsquos Report African Petroleum Corporation Limited
June 2013 19
The EPSC governing Block ROP is of similar structure to that governing Block SOSP It has an effective date of 25th October 2011 The first eight years of the EPSC are termed the exploration phase which is subdivided into an initial period of four years with two subsequent extension periods of two years each Work commitment in the initial exploration period is to acquire the existing seismic data within the licence area for a minimum of US$ 2 MM and drill one exploration well to a minimum depth of 3500 m TVDSS or a minimum investment of US$ 20 MM The two extension periods have a further commitment of one exploration well to a minimum depth of 3500 m TVDSS in each period or a minimum investment of US$ 20 MM Entry to the first extension period requires a 30 relinquishment of the licence area and a further 20 of the initial licence area must be relinquished on entry to the third period The area of the licence is currently 10357 km2 Water depth is between 1500 and 3000 m over the block
APCL has met the seismic commitment of the first exploration period
Petrosen has a back-in right if an exploitation period is authorised for up to 20 of the licence subject to contribution of its share of forward costs (excluding training) The duration of an exploitation period is 25 years from authorisation with option for two ten year extensions at the discretion of the state
14Sierra Leone PSC Review
APCL holds a 100 contractor interest in a PSC covering Block SL-03 offshore Sierra Leone (Figure 1-5) through its wholly owned subsidiary European Hydrocarbons Ltd The licence was awarded on 23rd April 2010 and ratified on 22nd February 2011 APCL also holds a 100 contractor interest in a PSC covering Block SL-04A through its wholly owned subsidiary African Petroleum Sierra Leone Ltd The PSC governing Block SL-04A was ratified on 21st September 2012
The SL-03 licence has a duration of thirty years the first seven of which are termed the exploration period which is further subdivided into an initial period of three years followed by two extension periods of two years each The licence is currently in the initial exploration period
Work commitments during the initial period for Block SL-03 are to purchase and interpret the existing 2D seismic data over the licence and acquire a minimum of 500 km2 of 3D seismic data APCL has purchased the 2D seismic data and has acquired 2535 km2 of multi-client 3D seismic data over Block SL-03 fulfilling the seismic commitment for the initial phase The first and second extension periods require the drilling of one exploration well to a minimum depth (below mud line) of 1300 m or a minimum equivalent investment of US$ 30 MM Entry to the first extension period requires a 50 relinquishment of the licence area and a further 25 of the initial licence area must be relinquished on entry to the second extension period The area of the licence is 3860 km2 and water depth varies from 100m to over 4000m with the south-western half of the block being at water depths greater than 3000m
Competent Personrsquos Report African Petroleum Corporation Limited
June 2013 20
Figure 1-5 Location of Blocks SL-03 and SL-04A
The PSC covering Block SL-04A was ratified on 21st September 2012 The licence term is for thirty years the first seven years of which are defined as the exploration period which is further subdivided into an initial period of three years and two subsequent periods of two years Each well drilled in the initial exploration period extends this period by three months Work commitments during the initial phase are to acquire at least 1500 km2 of 3D seismic data and drill one exploration well (to a minimum depth of 2500m) contingent on the results of the 3D and the availability of drilling technology for such deep water The minimum equivalent investment is US$ 10 MM In 2011 TGS acquired 1085 km2 of multi-client 3D seismic data over Block SL-04A Upon licencing these data APCL will have fulfilled the seismic commitment for the initial phase
The subsequent two exploration periods require the drilling of one exploration well in each period (to a minimum depth of 2500 m) or a minimum investment of US$ 50 MM Entry to the second period requires a 50 relinquishment of the licence area and a further 25 of the initial licence area must be relinquished on entry to the third phase The area of the licence is currently 1995 km2 Water depth is between 3000 and 4000 m over the block
Competent Personrsquos Report African Petroleum Corporation Limited
June 2013 21
The state retains the right to a 10 carried interest during any development phase in both licences with the option to acquire a further 5 by covering an equivalent proportion of any development costs
15Cote13 drsquoIvoire13 PSC13 Review
APCL holds a 90 per cent contractor interest in two PSCs governing Block CI-509 and Block CI-513 offshore Cote drsquoIvoire (Figure 1-6) via its wholly owned subsidiary African Petroleum Cote drsquoIvoire Limited The state oil company Petroci has a 10 carried interest
Figure 1-6 Location of Blocks CI-509 and CI-513
The PSC for Block CI-509 was awarded on 16th March 2012 The first eight years of the PSC are termed the exploration period which is further divided into three terms of three three and two years respectively The licence is currently in its first exploration term Work commitments during the first exploration term are to purchase the existing 2D seismic data acquire 1091 km2 (ie a block wide) 3D seismic survey and drill one exploration well at least 100 m into the Albian (Lower Cretaceous) section The minimum investment is US$ 60 MM The second and third terms have a further commitment to drill one exploration well to at least 100 m into the Albian (Lower Cretaceous) section with a minimum investment of US$ 50 MM Entry to the second term requires a 25 relinquishment of the licence area and a further 25 of the initial licence area must be relinquished on entry to the third term The area of the licence is currently 1091 km2 Water depth is between 1900 and 3250 m over the block
Competent Personrsquos Report African Petroleum Corporation Limited
June 2013 22
The PSC covering Block CI-513 has an effective date of 19th December 2011 It has a similar structure to that governing Block CI-509 The first seven years are termed the exploration period subdivided into three terms of three two and two years The licence is currently in its first exploration term Work commitments during the first exploration term are to purchase the existing 2D seismic data acquire 1446 km2 (ie a block wide) 3D seismic survey and drill one exploration well at least 100 m into the Albian (Lower Cretaceous) section The minimum investment is US$ 60 MM The second and third terms have a further commitment to drill one exploration well to at least 100 m into the Albian (Lower Cretaceous) section with a minimum investment of US$ 50 MM Entry to the second term requires a 25 relinquishment of the licence area and a further 25 of the initial licence area must be relinquished on entry to the third term The area under licence is currently 1446 km2 Water depth is between 900 and 3100 m over the block
The exploitation period of both licences is for 25 years subject to successful award in the event of a commercial discovery On development Petroci has the right to acquire an interest of up to 20 in each licence subject to payment of its portion of future costs
In October 2012 APCL completed acquisition of 4200 km2 of 3D seismic data covering blocks CI-508 CI-509 and CI-513 fulfilling the seismic work commitments of the first exploration phase of both PSCs APCL is planning a two well drilling programme for the licences during 2014
16Evaluation Methodology Prospective Resources
We have used probabilistic methods to evaluate selected prospects within Liberia Blocks 8 and 9 Gambia Blocks A1 and A4 Sierra Leone Block SL-03 and Cote drsquoIvoire Blocks CI-513 and CI-509 We classify the results of our simulation as Low Best and High estimates of prospective resources following the Petroleum Resources Management System or PRMS (Appendix 1) We have assigned geological chance of success to each of the prospects using the methodology described below Estimates are made for oil only although we recognise that due to the significant uncertainties in the available geological information that there is a possibility of gas charge in all licences We present a summary of input estimates output STOIIP and gross resources and geological chance of success as a resource summary sheet for each prospective interval investigated These can be found in the enclosures 11 to 45 in this document
Inputs to our probabilistic simulation are evaluated in a consistent manner For the structurally trapped prospective intervals in Liberia (the Lovebird and Wildbird prospects) and the Alhamdulilah prospect in Gambia we have made a low and high deterministic estimate of closing contour for each trap to reflect the uncertainty in both mapping and depth conversion For Liberia we use the gross-rock volume (GRV) derived in this manner to constrain the P90 and P10 of our GRV distribution in our probabilistic simulation For Gambia we have used the areal extents of the low and high cases as inputs to an area times net calculation
Competent Personrsquos Report African Petroleum Corporation Limited
June 2013 23
For the stratigraphically trapped prospects in Liberia (Barbet Night Heron and Sunbird) Cote drsquoIvoire (Sassandra Ayame Ayame West Cavalla and Leraba) and Sierra Leone (Altair) we have made low and high estimates of area of closure using both structural and amplitude support where possible We have then made low and high estimates of gross reservoir thickness derived from regional observations calibrated against seismic data where possible As such depositional systems also have laterally variable sand distributions often supported by seismic data we employ the concept of an areal net to gross ratio varying the percentage of sand areally within the overall stratigraphic trap based on the uncertainty in seismic amplitude strength Where appropriate a geological shape factor is used depending on trap shape and structural relief relative to reservoir thickness
Estimates of reservoir porosity and net to gross ratio are made with reference to regional data offset wells including recent drilling by APCL in Liberia and account for compaction and a degree of overpressure (Figure 2-4) We make low mid and high deterministic estimates and use these to constrain the P90 P50 and P10 inputs to a probabilistic simulation Inputs for hydrocarbon saturation are constrained in a similar manner with reference to regional porosity and permeability trends calibrated to APCLrsquos recent drilling results in Liberia
We have estimated oil formation volume factors for a range of gas oil ratios (GOR) (from an appropriate minimum to fully saturated) for each of the prospective intervals assuming 4oC at the mudline (seabed) and geothermal gradients between 25 and 35oC per 100 m consistent with regional observation and the available well data We assume that the minimum GOR will increase with depth below the mudline Our estimates are calibrated against the oil samples in Well Narina-1 when estimating resources for the Liberian prospects
Some degree of overpressure is accounted for as it has been in our estimates of porosity but by reference to offset discoveries we assume that it is unlikely to exceed 500 psi over the depth range investigated
Recovery factors for the clastic reservoirs are estimated with reference to published information from discoveries in similar reservoir types examples of which are tabulated below (Table 12) Based on this table we estimate low best and high recovery factors of 30 375 and 45 respectively Again these are used to constrain the P90 P50 and P10 of our input distribution during probabilistic simulation
Some prospects are deep relative to mud line and we expect reservoir quality to be reduced despite overpressure We reduce our recovery factor estimates accordingly where this is the case Some prospects are relatively shallow to mud line Where this is the case we model a more viscous oil (prospects materially less than 1500m below sea bed) and have reduced our low best and high recovery factor range to 15 275 and 40 respectively In all cases we assume that a development is able to effectively dispose of any associated gas
Recovery factors for the carbonate reservoirs of the Wildbird prospect in Liberia and Prospect M in the Gambia are estimated by reference to more regional analogues and are discussed in the relevant sections
Competent Personrsquos Report African Petroleum Corporation Limited
June 2013 24
Due to the early stage of exploration within APCLrsquos licences we have adopted a six component risk matrix in all areas barring Liberia to estimate geological chance of success (COS) separated into play and prospect specific risks (Table 13) We have adopted this form of presentation of COS to reflect the fact that deep water exploration in much of the West African Atlantic Margin is at a very early stage and also that a number of the identified prospects have risk dependence and thus can be grouped as a play
Table 12 Estimated oil recovery factors from producing Atlantic Margin fields
PLAY RISK PROSPECT RISK
SOURCE RESERVOIR SEAL TRAP CHARGE RESERVOIR (Presence and Maturity) (Presence) (Presence) (Definition and Efficacy) (Migration) (Efficacy) Incorporates trap definition and seal risk (including biodegradation risk where necessary)
Table 13 Play and prospect risk system
The play risk segment focuses solely on the elements required in a given play to make a hypothetical prospect successful source reflecting the presence and thermal maturity of available source rocks with sufficient generation and expulsion to charge prospects reservoir reflecting the presence regionally of geological intervals that could potentially contain reservoir rock and seal ndash the regional presence of a sealing formation with sufficient thickness and extent to trap hydrocarbons
Prospect risk is divided into three elements Commonly we present seal and trap risk combined as an overall illustration of the integrity of the container here labelled trap risk Charge risk reflects the risk to migration of hydrocarbons from the source rock into the prospect and reservoir risk reflects solely the efficacy (ie porosity and permeability) of any identified reservoir interval
Note that a successful well on a given prospect may reduce or remove the play risk should the well prove reservoir charge and seal in a given play This will have the effect of de-risking further prospects associated with that play
Country Field Start Date Np Max Water Depth Prod Ult
RecoveryRec
FactorRecovery
Prod STOIIP
(MMstb) (m) (MMstb) (MMstb) (MMstb)Eq Guinea Ceiba Nov-00 112 800 18 187 40 10 468Eq Guinea Zafiro Aug-96 652 850 62 1583 40 26 4008Angola Girassol Dec-01 332 1360 32 958 45 30 2129Angola Kuito Dec-99 133 410 36 650 46 18 1413Brasil Espadarte Aug-00 67 877 10 261 31 26 842Brasil Marlim Mar-91 1720 853 101 2878 33 28 8721Total 259 6517 17580Average - Arithmetic 39 23Average - Weighted by STOIIP Ult Rec 37 25
Low Best High30 375 45
Fields on Atlantic Margin with significant production
Hence RF Range
Competent Personrsquos Report African Petroleum Corporation Limited
June 2013 25
Recent drilling within Liberia Blocks 8 and 9 has de-risked the play As a result we adopt prospect specific risking alone as source reservoir trap and seal with the same definitions as described above (Table 13)
Competent Personrsquos Report African Petroleum Corporation Limited
June 2013 26
2 Liberia Prospectivity and Plays
21Introduction
All of the available deep-water acreage offshore Liberia-Sierra Leone basin is under licence (Figure 1-2) Regionally hydrocarbons have been discovered within sandstones at a number of stratigraphic levels from the pre-rift to early syn-rift Albian in Cote drsquoIvoire (Espoir Foxtrot fields and a number of other discoveries) to turbiditic sandstones that have Late Cretaceous (CenomanianTuronian MaastrichtianConiacian) to early Tertiary (Palaeocene to Eocene) ages Recent drilling offshore Ghana has yielded a number of discoveries within these Upper Cretaceous sandstones such as the Jubilee oil field and the Enyenra Tweneboa and Odum oil and gascondensate discoveries In the Liberia-Sierra Leone basin recent drilling has yielded six hydrocarbon discoveries (Bee Eater Narina Monterrado Mercury Venus and Jupiter) but as yet none has been declared commercial (Figure 2-1) Although reservoir quality in the Albian sandstones is variable reservoir quality in the Upper Cretaceous and Tertiary sandstones is often good Successful trap types encountered regionally are both structural and stratigraphic
Of significance to the evaluation of the petroleum systems of Blocks 8 and 9 APCL have drilled three wells within the deeper water parts of the blocks Wells Apalis-1 Narina-1 and Bee Eater-1 Well Apalis-1 found source rock intervals of Albian to Cenomanian age but failed to find the prognosed reservoir Well Narina-1 found light oil within deep-marine sandstones of Cretaceous age The sandstones were of variable reservoir quality as the well appears to have been drilled on the edge of a fan system which can be interpreted from seismic data The extent of the Turonian hydrocarbon bearing interval around Well Narina-1 is currently under investigation by APCL who are working with CGGV to reprocess the 3D multi-client seismic with the hope of identifying areas of favourable reservoir within closure
Well Bee Eater-1 completed in February 2013 also discovered hydrocarbons within similar sandstones of Cretaceous age However the oil bearing Turonian reservoir at Bee Eater is interpreted as being of very low permeability and hence non-commercial APCL interprets that Well Bee Eater-1 was drilled in a canyon system that may have been largely bypassed by sediment input
Both wells demonstrate the viability of Cretaceous petroleum systems within the licence area
Competent Personrsquos Report African Petroleum Corporation Limited
June 2013 27
Figure 2-1 Notable discoveries West Africa offshore
22Well and Seismic Database
Exploration offshore Liberia is at an early stage To date five wells have been drilled in the deeper water areas in 2011 and 2012 with historical exploration drilling (up to 1985) restricted to the more shelfal areas (Figure 2-2) Data from two of these shallow water wells Wells S3-1 and Cestos-1 were made available to us for this evaluation Well S3-1 encountered oil shows in sandstones of Late Cretaceous age
GhanaJubilee Field on
production development of TEN area discoveries
new Hess deepwater discoveries
Cote drsquoIvoireShallow water production
recent discoveries in deepwater Turonian
reservoirs
LiberiaOil discoveries in
Cretaceous deepwater reservoirs at Narina
Monserrado
Sierra LeoneVenus Mercury and Jupiter
oil and condensate discoveries in deepwater
reservoirs
Guinea-COil shows in
offshore wells
Guinea-BSinapa oil discovery
planned appraisal
AGCDome Flore area heavy oil
discoveries under development review
SenegalOnshore gas and condensate production Recent onshore
Turonian discovery
MauritaniaChinguetti Field
production other oil and gas discoveries under development review
Competent Personrsquos Report African Petroleum Corporation Limited
June 2013 28
Figure 2-2 Well and seismic database Liberia Blocks 8 and 9
APCL has drilled three exploration wells offshore Liberia in the deep water part of Block 9 Wells Narina-1 Bee Eater 1 and Apalis-1 (Figure 1-2 Figure 2-2) Well Apalis-1 was drilled in 2011 targeting a four-way dip-closed structure with possible AvO support The well found traces of hydrocarbons plus source rock intervals but the prognosed reservoir sands were absent at target depth and the well was plugged and abandoned
Well Narina-1 was drilled by APCL in 2012 and found 16 to 21 m of net pay (light oil) within sandstones of Turonian (Cretaceous) age Hydrocarbons were also discovered in the underlying Albian Oil samples were collected but no drill-stem testing was undertaken Analysis of the oil samples indicates an API
3D Seismic Area
Competent Personrsquos Report African Petroleum Corporation Limited
June 2013 29
gravity for the Turonian oil of about 38 degrees and about 45 degrees for the Albian hydrocarbons Mobilities from formation pressure measurements and permeability from side-wall core measurements show the reservoir to be of relatively low permeability at this location
Well Bee Eater-1 was drilled by APCL in January and February 2013 The well found oil-bearing sandstones of Cretaceous age but of very low permeability and hence the well is considered non-commercial Post-drill interpretation of the seismic data has helped APCL revise the depositional model for this Turonian fan system The Bee Eater-1 well is interpreted to have encountered a bypass zone in both the Turonian and Cenomanian with immature sandstones that are poorly sorted and tight Post-well mapping of key seismic events tied to Well Bee Eater-1 reveals the possibility of finding better quality sandstones in lsquobasin-floor fanrsquo units down-dip Potentially sealing shale units and source rock units were also found in the Bee-Eater-1 well
Well Apalis-1 and in particular Wells Bee Eater-1 and Narina-1 help de-risk seal and hydrocarbon charge for the Cretaceous play on-block
The primary seismic dataset for our evaluation was the recently acquired 5170 km2 of 3D seismic data over the deeper water area of Blocks 8 and 9 including certain products to review amplitude versus offset (AvO) effects These seismic data cover both recently drilled deep water wells In addition a grid of 2D seismic data was also made available with average line spacing of around 45 km These data provide a tie to Well S3-1 although the well lies some 200m from the nearest seismic line In general the data quality of the 3D volume is good and of suitable fidelity to enable us to undertake our review of identified prospectivity However local complexity in the shallow geology causes the signal to degrade considerably at the prospective levels in certain areas APCL are currently reprocessing these data in an attempt to improve signal quality APCL intend to utilise this dataset to update the CPR in the next 3-6 months It is hoped that these data will support maturation of additional prospects and further clarification of risk and volumes for prospects within this CPR
23Plays and Petroleum Geology Blocks 8 and 9
APCL has identified a number of plays within Blocks 8 and 9 at similar stratigraphic levels to those proven successful elsewhere along the West African margin (Figure 2-3) Recent drilling within Blocks 8 and 9 has demonstrated a working petroleum system within the mid to lower Cretaceous with drilling finding light oil within deep marine sandstones of Turonian age and also in sandstones of Albo-Aptian age
Competent Personrsquos Report African Petroleum Corporation Limited
June 2013 30
Figure 2-3 Petroleum systems and plays Liberia Blocks 8 and 9
Structural traps are identified at the pre-rift to early syn-rift (Albian) level as tilted fault blocks with hydrocarbons sourced from the Albian or Lower Cretaceous source rocks and seal provided by post-rift mud drape Structural and stratigraphic traps are also identified at several potential reservoir levels within the Late Cretaceous and Lower Tertiary again potentially sourced from the Turonian and or Albian source rocks Traps are sealed by coeval marine shales and muds As is encountered regionally there is reasonable seismic evidence for the presence of reservoir bearing intervals within the Upper Cretaceous and Early Tertiary section and this seismic evidence has been used in trap definition
The most significant play in the area is that of Cenomanian to Turonian age deep-marine channel-fan systems as structural and stratigraphic traps In addition an emerging lower Cretaceous microbial carbonate reservoir play has been identified sourced from coeval lacustrine source rocks and sealed by shales deposited during the subsequent drowning of the lacustrine systems by the onset of significant subsidence and marine inundation later in the Cretaceous We have evaluated prospects within both of these play systems Prospectivity in the shallower Cretaceous and Tertiary intervals is still being re-evaluated by APCL as of the date of this report and no leads have been matured to prospect status
Oil show Cestos-1
Competent Personrsquos Report African Petroleum Corporation Limited
June 2013 31
Figure 2-4 Porositydepth trend published West Africa turbidite reservoirs
24Play and Prospect Risk Liberia Blocks 8 and 9
Of the prospects reviewed all but the Wildbird prospect fall within the Cenomanian to Turonian channelfan play In our opinion recent drilling has de-risked source and reservoir presence for this play However reservoir quality in recent wells is variable In our risking of Cenomanian to Turonian prospectivity (Barbet Sunbird Lovebird and Night Heron prospects) we have removed the play element to our risking matrix and see a low risk to hydrocarbon charge for individual prospects Key risk is therefore to trap integrity and reservoir quality We use a four component risk matrix as outlined in Section 16 to define geological chance of success for these prospects
The Wildbird prospect has been recently identified by APCL as part of its review of further play fairways within the Liberian licences The play concept is of early Aptian bio-constructed carbonate build-ups within the restricted lacustrine environment that existed at this time Porosity and permeability within the bioclastic microbial limestones is potentially enhanced by hydrothermal activity resulting from the early rifting Later post-rift subsidence and drowning by marine conditions provides the top seal via the
0
500
1000
1500
2000
2500
3000
3500
4000
0 01 02 03 04m
Bel
ow S
eabe
dPorosity (fraction)
Porosity versus Depth Trend
Regional West AfricaTurbidite Data
Competent Personrsquos Report African Petroleum Corporation Limited
June 2013 32
deposition of Cretaceous marine muds It is envisaged that the play is charged or by Aptian source rocks deposited in the offset lagoonal facies with possible charge from later (but on-lapping) Cretaceous marine source rocks (as other plays on the blocks) Both potential source rocks provide lateral seal (Figure 2-16) Regionally lacustrine microbial carbonate reservoirs can be found in Congo and Angola where there is some production but also in the Campos and Santos basins in Brazil
The microbial carbonate play is emerging within Blocks 8 and 9 and has not been demonstrated to be effective by drilling We adopt the play and prospect risking as discussed in Section 16 to risk the Wildbird prospect as a result discounting biodegradation risk as the prospect is at significant depth Our estimate of play risk for the Cretaceous microbial carbonate play is summarized in below
PLAY Source Reservoir Presence Seal Play
Risk Cretaceous Carbonate 08 06 05 20
Table 21 Play risk Cretaceous carbonate play Liberia Blocks 8 and 9
Competent Personrsquos Report African Petroleum Corporation Limited
June 2013 33
25Liberia Blocks 8 and 9 Leads and Prospects
Following the drilling of Wells Narina-1 and Bee Eater-1 APCL is re-evaluating the prospectivity within Blocks 8 and 9 and has developed a number of potential traps (Figure 2-5) several of which (marked in orange Figure 2-5) have been matured to prospect status We have assessed the prospective resources for certain of these prospects that APCL has identified as viable near-term drilling opportunities Barbet Sunbird Lovebird Night Heron and Wildbird A number of the prospects have multiple reservoir targets Our evaluation of these prospects follows the methodology described in Section 16 The results of Wells Narina-1 and Bee Eater-1 would indicate that oil charge is probable and thus only oil cases have been evaluated However as we state in Section 16 a gas charge cannot be discounted due to the uncertainties in source rock evaluation and basin modelling Input parameters STOIIP prospective resources and geological chance of success for each of the evaluated prospects are summarised in Table 1 of this report and are also presented in the resource summary sheets as Enclosures 11 to 19 of this document
Figure 2-5 Leads and Prospects Liberia Blocks 8 and 9
Competent Personrsquos Report African Petroleum Corporation Limited
June 2013 34
ʹǤͷǤͳǤ Barbet Prospect
The Barbet prospect is identified as a stratigraphic trap around 14 km to the east of and up-dip from Well Narina-1 within Block 9 (Figure 2-6) A single target reservoir is mapped within the Turonian Seismic amplitude anomalies are also identified within the area of the trap that may provide support for reservoir development The Turonian is mapped at between 3000 and 3600 m TVDSS over the area of the prospect in a water depth of around 750 to 770 m
Figure 2-6 Seismic line - depth (m TVDSS) over the Barbet prospect
We have used an areanet pay methodology to estimate prospective resources for the Barbet prospect In our low case we restrict the area of the accumulation to the brightest area of anomalous amplitudes on the far offsets Our high case extends the prospect down-dip to include a larger area of anomalous amplitudes above an observed amplitude shut-off (Figure 2-7) These are used to constrain the P90 and P10 inputs of our probabilistic simulation These polygons approximate to an oil column height of 200 and 700 m respectively
Amplitudes are variable within the area of closure and we apply an areal net to gross ratio to better constrain sand distribution within the trap Gross reservoir thickness estimates are computed from the mapped seismic interval net to gross ratio from regional analogue and porosity from a regional porositydepth trend (Figure 2-4) Fluid parameters and recovery factors are estimated as described in Section 16
Narina-1 Barbet
Top Turonian
Top Cenomanian
Top Albian
Lwr Turonian (BFF)
Top Turonian
Narina-1
Apalis-1
Albian UC
0 km 2(mss)
W E
Competent Personrsquos Report African Petroleum Corporation Limited
June 2013 35
Figure 2-7 Barbet far offset amplitudes with Top Turonian depth contours (m TVDSS)
We have used the prospect risk matrix presented in Section 16 to determine the geological chance of success for the Barbet prospect Key risk to the Barbet prospect is to trapcontainment as the trap requires pinch-out of the reservoir in three directions to seal There is also a subsidiary risk to reservoir as the Turonian reservoir encountered in Well Narina-1 is of relatively poor quality which is countered by seismic evidence over the prospect to support reservoir development As a result we attribute a geological chance of success of 22 to the Barbet prospect
metres
P10
P90metres
APALIS-1
Competent Personrsquos Report African Petroleum Corporation Limited
June 2013 36
ʹǤͷǤʹǤ Sunbird Canyon Prospect
The Sunbird canyon prospect is also identified as a stratigraphic trap around 5 km to the south of Well Apalis-1 within Blocks 8 and 9 mapped as a large canyon system There are three potential reservoir targets within the prospect within the Campanian the Turonian (as encountered in Well Narina-1) and in the underlying Cenomanian Reservoir is prognosed at between 3000 m TVDSS and 3600 m TVDSS in a water depth of around 1300 m
Figure 2-8 Regional seismic line along axis of the Sunbird canyon system
We have used an areanet pay methodology to estimate prospective resources for the Sunbird canyon prospect At all three prospective layers the prospect divides into two discrete lsquocanyonsrsquo separated by an intra-basinal high (eg Figure 2-9) For the Campanian and Turonian prospective intervals in the low case we restrict the area of the accumulation to the brightest area of anomalous amplitudes on the far offsets in the northerly of the two canyons where amplitude response is better Our high case extends the prospect down-dip to include a larger area of anomalous amplitudes above an observed amplitude shut-off and also includes the southerly of the two canyons as this would now be in charge communication The low and high case polygons approximate to an oil column height of 200 m and 600 m respectively
Albian uc
LB-08LB-09
LB-08
LB-09
Albian UC
Sunbird
0 km 4
NESW
Competent Personrsquos Report African Petroleum Corporation Limited
June 2013 37
For the deeper Cenomanian the prospect is mapped as a single canyon to the south of the intra-basinal high The low and high case polygons approximate to an oil column height of 200 m and 700 m respectively Our low and high estimates of area are used to constrain the P90 and P10 of our probabilistic simulation
Figure 2-9 Sunbird Campanian far offset amplitudes with Cenomanian depth contours (m TVDSS)
Amplitudes are variable within the area of closure and we apply an areal net to gross ratio to better constrain sand distribution within the trap for all three prospective layers Gross reservoir thickness estimates are computed from the mapped seismic interval net to gross from regional analogue and porosity from the observed porositydepth trend (Figure 2-4) Fluid parameters and recovery factors are estimated as described in Section 16
metres
P90
P10
Block 9
Block 8
APALIS-1
Competent Personrsquos Report African Petroleum Corporation Limited
June 2013 38
Figure 2-10 Sunbird Turonian far offset amplitudes with Top Turonian depth contours (m TVDSS)
We have used the prospect risk matrix presented in Section 16 to determine the geological chance of success for the three prospective intervals of the Sunbird prospect Key risk to all three prospective layers is to trapcontainment as the trap requires pinch-out of the reservoir in three directions to seal There is also a subsidiary risk to reservoir at the two deeper levels as the Turonian reservoir encountered in Well Narina-1 is of relatively poor quality and Cenomanian reservoirs are yet to be proven on block However there is seismic evidence for reservoir development and hence we see this risk as favourable Reservoir risk is low for the Campanian as it is developed in the offset Well Narina-1 and there is seismic evidence for reservoir presence As a result we attribute a geological chance of
P90
P10
metres
Block 9
Block 8
APALIS-1
Competent Personrsquos Report African Petroleum Corporation Limited
June 2013 39
success of 27 19 and 18 to the Campanian Turonian and Cenomanian prospective intervals of the Sunbird canyon prospect
Figure 2-11 Sunbird Cenomanian far offset amplitudes with Cenomanian depth contours (m TVDSS)
ʹǤͷǤ͵Ǥ Night Heron
Night Heron is a Turonian basin floor fan system which lies 8 Km south west of Well Bee Eater-1 It is mainly within Block 9 but extends into Block 10 It is identified as a stratigraphic trap with areal extents defined by amplitude truncation and structural pinch-out Reservoir is prognosed at between 4100 m TVDSS and 4700 m TVDSS in a water depth of around 1750 m (Figure 2-12) APCL has selected a
P90
P10
metres
Block 9
Block 8
Competent Personrsquos Report African Petroleum Corporation Limited
June 2013 40
provisional well location which lies on the 3D survey location ndash In-line 1098 X-line 6103 They are currently seeking partners to drill the Night Heron well in early 2014
Figure 2-12 Arbitrary line across Night Heron PSDM - Depth (m TVDSS)
Cenomanian reservoir potential also exists beneath the Turonian basin floor fan and work by APCL is on-going to determine prospectivity
Well Bee Eater-1 found an organic-rich Turonian shale section overlying a hydrocarbon bearing thin-bedded low permeability sandstone Another shale dominated package underlies the sandstone Although the Turonian interval is considered non-commercial for Bee Eater the prospectivity down-dip is appealing APCL interprets that the well was drilled in a canyon system that may have been largely bypassed by sediment input The 3D seismic indicates a significant thickening of this Turonian interval towards the south west and there is some amplitude support for the occurrence of a lobate fan straddling Blocks 9 amp 10
An area times net approach was adopted using the full stack PSDM depth volume to provide an SNA extraction and constrain areal extent and estimate an areal NG to account for lateral variability within the reservoir (Figure 2-13) As night Heron falls partly off block ERCE correct for this using the ratio of on-block to off-block area in reporting of net unrisked and net risked results
S NEBee EaterNight Heron
5 Km
BFF Isopach (m)
Competent Personrsquos Report African Petroleum Corporation Limited
June 2013 41
Figure 2-13 SNA from Basin Floor Fan Isopach (m) - PSDM
We have used the prospect risk matrix presented in Section 16 to determine the geological chance of success for the Turonian interval of the Night Heron prospect Recent drilling results suggest that there is a low risk to hydrocarbon charge The observations at Bee Eater-1 also indicate that shale seals are also likely at a coeval interval Reservoir is a significant risk due to the poor Turonian reservoir development in Well Bee Eater-1 The Turonian reservoir encountered in Well Narina-1 is also of relatively poor quality However there is seismic evidence on the 3D survey for a possible improvement in reservoir development over the prospective area The definition of the trap is the key risk as the seismic evidence for closurereservoir pinch-out is ambiguous over the 2D data in Block 10 There appears to be evidence of the reservoir interval thinning in the critical north westerly direction but 3D data would be required to reduce trap risk any further As a result we attribute a geological chance of success of 144 to the Night Heron prospect
3
3
SNA from BFF Isopach
Block Boundary
Competent Personrsquos Report African Petroleum Corporation Limited
June 2013 42
ʹǤͷǤͶǤ Lovebird Prospect
The Lovebird prospect is mapped as a four-way dip closure to the south of Block 8 (Figure 2-14) Three prospective layers are mapped by correlation to up-dip wells and are prognosed to be of Cenomanian age Thus as with the Sunbird canyon prospect these reservoirs are not proven on block but seismic mapping and regional geological work suggests the sands may be derived from the east via a canyon system identified in block LB-07 The three prospective intervals are termed Upper Middle and Lower or Blue Pink and Green based on horizon colour Structural relief at the Pink horizon is between 50 and 200 m depending on the estimate and thus the prospect is relatively low relief in some realisations
Figure 2-14 Seismic line over the Lovebird prospect
Lovebird
Depth (mss)
4 km
NE
Competent Personrsquos Report African Petroleum Corporation Limited
June 2013 43
Figure 2-15 Lovebird prospect Top Pink horizon depth (m TVDSS) high case
The prospect is mapped to the edge of the available 3D (Figure 2-15) which coincides with the southern boundary of Block 8 but closure can be mapped south of the 3D area on the available 2D lines Reservoir depth is prognosed at between 5000 and 5900 m TVDSS in a water depth of 2850 m at the prospect crest Thus reservoir rock if present will be at comparable depths below mud line to the Barbet prospect
We use a gross-rock volumenet to gross methodology to estimate prospective resources for the Lovebird prospect APCLrsquos evaluation of the Lovebird prospect is on-going and of the three interpreted horizons the Pink horizon is the best defined We review pick depth conversion and thickness uncertainty for this interval to generate a range of gross-rock volumes for this interval with the
m ss
metres
Block 9
Block 8
Competent Personrsquos Report African Petroleum Corporation Limited
June 2013 44
prospect full to spill (Figure 2-15) Assuming the Pink horizon provides an accurate representation of the Blue and Green horizons we then estimate gross-rock volumes for these two intervals by isopach
Reservoir thickness and net to gross ratio estimates are derived from regional analogues with reservoir porosity derived from our regional porositydepth trend (Figure 2-4) Fluid properties and recovery factors are estimated as described in Section 16 Our volumetrics are restricted to the portion of the Lovebird prospect on Block 8 We would expect a further evaluation of the prospective resources of the Lovebird prospect to occur subsequent to the completion of the APCL evaluation and the prospective resources associated with the prospect in this report may therefore be subject to change
The key risks to the Lovebird prospect are to the development of reservoir at the prognosed Cenomanian intervals as they are not proved in wells elsewhere on the block and to source as the prospect requires a source rock deeper than that proven by drilling There is also risk to trapcontainment as the structure is not fully defined by the 3D seismic data volume and is of low relief in some realisations We assign a geological chance of success to the Lovebird prospect of 20 as a result
255Wildbird Prospect
The Wildbird prospect is mapped on 3D seismic data towards the south of Block 8 as a large four-way dip-closed high (Figure 2-17) at a depth of between 4000 to 4600 m TVDSS in a water depth of around 2000 m Structural relief is up to 600 m and area of closure up to 170 km2 The conceptual geological model is discussed above but is that the prognosed microbial carbonate reservoir of Albian age is developed between the mapped lsquoredrsquo and lsquolight bluersquo seismic events (Figure 2-16) with lateral seal developed to the north-east of the prospect within contemporaneous lagoonal facies which also provide the primary source rock This lateral seal is required to close the prospect Basin modelling undertaken by APCL suggests that the Albian lagoonal and later Cretaceous source rocks would be mature for oil generation
We have accepted this model as a geological concept and have used it to make estimates of prospective resources for the Wildbird prospect We then risk the model accordingly
Competent Personrsquos Report African Petroleum Corporation Limited
June 2013 45
Figure 2-16 Seismic line and prospect geo-seismic sketch Wildbird prospect
5
0 km 5
SWN
E
mss
Wildbird
Horizons
BlackberryLight BlueRoseRed
Competent Personrsquos Report African Petroleum Corporation Limited
June 2013 46
Figure 2-17 Wildbird Top Reservoir depth map (m TVDSS) Spill point - green contour
The Wildbird prospect is a large container but there is considerable uncertainty in reservoir thickness structural mapping and degree of charge from the offset kitchen areas We evaluate the prospect in a similar manner to the Lovebird prospect by perturbing the above variables In our low case we choose a shallow contact at 4250 m TVDSS to simulate under-filling or lateral breach via onlapping thief zones and also employ a reservoir thickness of 80 m from offset analogue Our high case assumes the prospect is filled to spill and that the lsquoredrsquo seismic event marks base reservoir Estimates of reservoir net to gross ratio and porosity are derived from the available analogues and are necessarily wide Fluid parameters and recovery factors are derived as described in Section 16
The Wildbird play is emerging and is of high risk We attribute a play risk of 24 as a result (Section 24) The key prospect risk to the Wildbird prospect is that of containment or trap as there is evidence for erosion at the crest of the feature and it is reliant on the development of lagoonal facies to the north-east and overlying marine shales to provide lateral seal and support the hydrocarbon column heights modelled here We attribute a prospect risk of 38 Wildbird which when combined with the play risk gives an overall chance of success for the Wildbird prospect of 9
mss
Competent Personrsquos Report African Petroleum Corporation Limited
June 2013 47
3 Gambia Prospectivity and Plays
͵ǤͳǤ Introduction
Although only one exploration well (Well Jammah-1) exists offshore Gambia exploration drilling has been undertaken to the north and south within Senegalese and Guinea Bissau waters (Figure 2-1 Figure 3-1) A number of oil and gas discoveries have been made onshore Senegal and the large Dome Flore and Dome Gea discoveries to the south of the blocks are each reported to contain a million barrels of biodegraded oil (c10-13o API) in place within sandstones of Oligocene (Tertiary) age Some lighter (30-34o API) oil has also been encountered in deeper intervals More regionally oil and gas discoveries have been made to the north offshore Mauritania and in Guinea Bissau (Sinapa) the recently drilled Venus and Mercury wells in Sierra Leone have also encountered hydrocarbons
Figure 3-1 Plays Gambia Blocks A1 and A4
The range of hydrocarbon types encountered is suggestive of multiple sourcing and the age of the reservoirs suggest late timing of oil generation consistent with a late Cretaceous source for the heavy oil although there are no published data to confirm this Regionally the gas source could be any of the older potential source rocks discussed below
Alhamdulilah
GAMBIA A1ampA4 PROSPECTIVITY POTENTIAL
Deep Water Fans channel levee complexes BFF lobes
Late Jurassic clastic progrades
Clastic progrades (unconformity trap)
Karst amp reef features in carbonate platform
Intra-carbonate clastic truncations
Based on line 1046-NWA
1
2
3
1
51
14
2
3
4
5
Competent Personrsquos Report African Petroleum Corporation Limited
June 2013 48
32Well and Seismic Database
Exploration offshore Gambia is also at an early stage and no wells have been drilled in the deeper water areas The nearest well to Blocks A1 and A4 (and the only well offshore Gambia) is Well Jammah-1 some 15 km to the east of Block A1 (Figure 3-2) This well contains oil shows within sandstones of Late Cretaceous age The well drilled to 3020 m MD reaching total depth in an interval of uncertain age perhaps Cenomanian to Albian
A regional grid of 2D seismic data was made available to us for our evaluation with an average line spacing of around 2-3 km on Block A1 and up to 8 km on Block A4 (Figure 3-2 Figure 3-3) In addition a 2003 vintage 3D seismic data volume was available for analysis covering 2008 km2 However APCL is using 2010 vintage 3D seismic data (2566km2) processed to pre-stack time-migration in their current evaluation and we have adopted these data for our review In general seismic data quality was found to be good
Figure 3-2 Wells 2D and 3D seismic data (red outline) Gambia Blocks A1 and A4
The 2D seismic data was sufficient to enable a well to seismic tie to be made to Well Jammah-1 (Figure 3-3) Despite its shelfal location we were able to extrapolate some stratigraphy into the deeper water
Competent Personrsquos Report African Petroleum Corporation Limited
June 2013 49
although the key Upper Cretaceous section is not sampled adequately by the well leading to uncertainty in the age of the deeper clastic section that forms the potential reservoir interval for the Alhamdulilah prospect
33Plays and Petroleum Geology Blocks A1 and A4
Some of the plays identified by APCL offshore Gambia are similar to those described for Liberia in Section 23 above with structural and stratigraphic traps identified at a number of Cretaceous intervals (Figure 3-1) and reservoirs prognosed as being of deep marine turbidites or other mass transport systems However plate tectonic reconstructions suggest that rifting occurred earlier along the Senegalese and Gambian margin beginning in the Lower Jurassic Thus there is the potential for deeper Jurassic age source and reservoir in the area
There is some seismic evidence for the presence of reservoir intervals as is common regionally although evidence is less compelling in the deeper intervals (Figure 3-5) Of the identified traps in this play fairway only one has currently been matured to prospect status by APCL the Alhamdulilah prospect
Regionally reservoirs within the Cretaceous are associated with a deep marine depositional environment and are generally expected to be of good to excellent quality with the possibility of some overpressure A similar depositional environment is prognosed for the deeper Jurassic age reservoirs with possible fan-delta like geometries identifiable on seismic landward (eastward) of the Alhamdululah prospect (Figure 3-7)
In addition to the Jurassic and Cretaceous clastic plays APCL has identified a number of closures along the margin of a carbonate platform of Jurassic to Aptian age partially penetrated by Well Jammah-1 (Figure 3-3 Figure 3-4) These closures are currently being evaluated by APCL and only one Prospect M has been evaluated to prospect status and we assess the prospective resources for Prospect M in this section
Competent Personrsquos Report African Petroleum Corporation Limited
June 2013 50
Figure 3-3 Well to seismic tie ndash Well Jammah-1 to the Alhamdulilah prospect
There is good evidence for the presence of source rocks in the Gambian margin The youngest source interval that could possibly generate oil is the Cenomanian-Turonian marine source rock proven in the Casamance Shelf wells and present in basins to the north Published data indicate kerogen is a mixed Type IIIII locally and Type II in wells to the south with HI of between 370-660 mggC in gt2 TOC rocks (TOCs in the DSDP-367 well 300 km to the west are in excess of 5 in black shales of Albian to Turonian age) This section is absent in Well Jammah-1 probably as a result of erosion
There is also the possibility of Necomian and Jurassic source rocks Necomian black shales are described in the DSDP-367 well Jurassic (Toarcian) source rocks are inferred to be present based on analogue evidence and plate tectonic reconstructions that place proven Jurassic source rocks in Morocco Portugal Nova Scotia and north-eastern Brazil in proximity to the Senegal-Gambia basin These are documented as having a HI of around 450 mggC and a TOC of up to 6
Regional thermal information shows a high degree of variability with gradients from 25 to 45 degCkm likely as a result of drilling on salt domes where geothermal gradients are elevated or in areas locally affected by volcanics Blocks A1 and A4 are at the northernmost margin of the salt basin so at worst only limited local effects are anticipated Using data from Well Jammah-1 we infer a geothermal gradient of 30deg Ckm at the location of the well This would put the Cenomanian-Turonian source locally into the oil window around the Alhamdulilah prospect However uncertainty in both depth conversion and geothermal modelling do not rule out the possibility that the Cenomanian-Turonian could be mature regionally for hydrocarbon generation Deeper Neocomian or Jurassic source rocks if present would be mature for oil generation under this model
ALHAMDULILAH
M
Senonian UC
W E4 km
Jammah-1
Alhamdulilah
Intra Aptian Carbonate
TWT (ms)
Competent Personrsquos Report African Petroleum Corporation Limited
June 2013 51
34Play Risk
In our evaluation of APCLrsquos Gambian blocks we note that a number of the prospective plays require further definition to mature the identified leads to prospect status As a result our evaluation is limited to the determination of independent estimates of prospective resource for the Alhamdulilah prospect and Prospect M We have used play and prospect risk for both prospects to allow for consistency in comparison between our evaluations where a play risk is appropriate
Based on the review above we see source risk as the key risk to the Lower Cretaceous and Jurassic clastic play Although a number of source rock intervals are present regionally only those within the Cretaceous are demonstrated to be present proximal to Blocks A1 and A4 Data are limited but modelling would suggest that those within the Cenomanian-Turonian could be immature for oil generation in all but a small area of the blocks As a result we assign a source risk of 07 Note that the uncertainty in both source rock presence and thermal data is such that there is a possibility of gas charge although like Liberia Sierra Leone and Cote drsquoIvoire it is impossible to quantify this chance at present
We see seal risk for this play to be relatively low as there is seismic evidence similar to that interpreted regionally for the presence of seal Seal risks for the multiple stacked sands prognosed for the Alhamdulilah prospect are handled as a prospect specific risk The inferred depositional environment for this interval would also suggest that sealing intervals would be developed We have therefore assigned a seal risk of 09 to this play
Seismic evidence for the presence of reservoir is also good but less convincing than that observed regionally and in our evaluation of Liberia Blocks 8 and 9 However we assign a reservoir presence risk of 08 It is possible that the younger Cretaceous reservoirs identified could be locally sourced via exhumation of the coeval carbonate platform to the east and thus be composed of detrital carbonate material This is reflected in the reservoir risk for the Alhamdulilah prospect itself
For the carbonate platform play the key risk is that of top seal Seismic reflectivity is highly variable above the top of the platform carbonates (Figure 3-3) as the event is a strong regional unconformity In places the overlying clastic section can be interpreted immediately above this unconformity Although the latter is factored into prospect specific risk to top seal the seismic evidence for the presence of a regional seal above the unconformity is not compelling The top seal is provided by a down-lapping carbonate prone Aptian-Albian section where the Senonian unconformity is not immediately above the reservoir section Analogues suggest there is a general lack of support for intra-formational seals in similar settings and therefore we assign a risk to the carbonate platform play seal of 05 as a result
The presence of a strong angular unconformity at the top of the carbonate platform structures is however likely to have enhanced reservoir quality within the carbonates themselves as a result of subareal exposure and karstification Thus we assign a risk of 09 to the reservoir presence element of the carbonate platform play and review the prospect specific reservoir efficacy risk on a prospect by prospect basis dependent on the seismic evidence for erosion
Competent Personrsquos Report African Petroleum Corporation Limited
June 2013 52
A number of the identified structures along the buried carbonate platform margin are relatively shallow to mudline and thus biodegradation of any oil charge is possible However as we have only estimated prospective resources for Prospect M we have not carried a play risk to biodegradation
Our final play risks for the Lower Cretaceous clastic and the buried carbonate platform plays are summarised in Table 31 below
PLAY Source Reservoir Presence Seal Play
Risk Cretaceous to Jurassic Clastic Play 07 08 09 50
Carbonate Platform Margin 07 09 05 28
Table 31 Play risk Gambia Blocks A1 and A4
Competent Personrsquos Report African Petroleum Corporation Limited
June 2013 53
35Gambia Leads and Prospects
In all 13 leads and prospects have been identified by APCL within Blocks A1 and A4 with areas of closure varying from around 4 km2 to 63 km2 (Figure 3-4) Of the identified prospective intervals a number are best classified as leads and require further technical work to mature them to prospect status (yellow Figure 3-4) Structural closure is identified within the Lower Cretaceous and a number of slope fans can be identified as seismic amplitude anomalies within the Upper Cretaceous section In addition a number of closures are mapped along the edge of the buried carbonate platform margin at Top Aptian level and APCL are currently evaluating the potential for a deeper Barremian age seal which might provide further prospectivity within the carbonate platform play
Figure 3-4 Leads and prospects identified by APCL in Gambia Blocks A1 and A4
In this section we briefly describe our evaluation of the Alhamdulilah prospect and Prospect M A summary of input parameters for the calculation of prospective resources results and risks for each of the prospective layers evaluated is given in the resource summary sheets in Enclosures 21 to 25 of this document
In 2010 APCL acquired a further 2566 km2 of 3D data over both blocks A re-evaluation of the identified leads and prospects is on-going using these data with the evaluation of the Alhamdulilah prospect and Prospect M completed
ALHAMDULILAH
M
Competent Personrsquos Report African Petroleum Corporation Limited
June 2013 54
351Alhamdulilah Prospect
The Alhamdulilah prospect is identified as a four-way dip-closed structural high within the centre of the deep water portion of Block A1 (Figure 3-3 Figure 3-5) We have evaluated four prospective intervals in total (Figure 3-5) Reservoir ages are currently prognosed by APCL to be of Lower Cretaceous (Turonian) to perhaps Lower Jurassic The prospect extends northwards of Block A1 into Senegalese waters and we have restricted our calculations to the proportion of the prospect that lies within Block A1 The bulk of the prospect does however lie within Gambian territory
Figure 3-5 Seismic line over the Alhamdulilah prospect
The prospective intervals within the Alhamdulilah structure lie between 4230 m TVDSS and 5970 m TVDSS or around 2010 to 3750 metres below sea bed This is relatively deep and despite the estimates of overpressure it is possible that porosity and thus reservoir quality to be relatively poor (Figure 2-4) Our estimates of recovery factor for the deeper prospective intervals reflect this
There is uncertainty in the degree of structural closure as although mapped reflectors are relatively bright and continuous the structure is of low relief We have account for this by undertaking various depth conversions of the mapped structure from the time domain 3D seismic data restricting our analysis to closure demonstrable on-block (Figure 3-6) At SS-1 level closure continues to the north off-block and also off the 3D seismic data We have reviewed the available 2D seismic data northwards to determine the spill point at this level
SS 4 (1)
SS 3 (1-2)
SS 2 (1-3)
SS 1 (1-3)
2 Km
Inline 1140 - TWT ALHAMDULILAH
TWT (s)
W E
Competent Personrsquos Report African Petroleum Corporation Limited
June 2013 55
Where seismic facies analysis suggests the potential for stacked pay intervals these have been modelled probabilistically Estimates of gross rock volume derived in this way are combined with the estimates of net reservoir thickness based on mapped seismic thicknesses and porosity and fluid information are derived as described in Section 16 to compute probabilistic estimates of resources for each reservoir interval
Figure 3-6 Area of closure Alhamdulilah prospect layers SS1 to SS4
Recovery factors used are as described in Section 16 of this report but modified to reflect the depth of burial of the deeper prospective intervals
We have reviewed the prospect specific risk for each of the prospective intervals independently Although the Alhamdulilah trap is a four-way dip-closed feature the time closure is subtle and the prospect is relatively deep There is also seabed canyoning which may cause uncertainty in the imaging and thus trap closure
Seismic evidence for seal is relatively good over the Alhamdulilah trap However there is evidence for downcuttingerosion between layers and above the prospect there is also evidence for downlapping events onto the topmost reflector
The key risk to the Alhamdulilah prospect is that of reservoir efficacy There are indications of fan-like geometries within the 3D seismic data (Figure 3-7) and some events can be mapped for the shallower reservoir layers However the Cretaceous reservoirs may alternatively comprise the eroded talus from the coeval carbonate platform to the east and reservoir quality rock may not be developed as a result Finally our estimate of overpressure may be incorrect and any sandstones present may have the reservoir quality sufficiently degraded via compaction to render them non-reservoir
SS-1 Low and High Case AreasSS-4 Low and High Case Areas SS-3 Low and High Case Areas SS-2 Low and High Case Areas
Competent Personrsquos Report African Petroleum Corporation Limited
June 2013 56
As a result the prospect specific risks to the prospective intervals of the Alhamdulilah prospect vary from 26 to 34 and from 13 to 17 when combined with the play risk
Figure 3-7Alhamdulilah prospect seismic facies interpretation Cretaceous intervals
AH-1 AH-1
Competent Personrsquos Report African Petroleum Corporation Limited
June 2013 57
352Prospect M
A number of structures have been identified by APCL at the Aptian level (ie top carbonate) along the buried carbonate platform margin that runs through Blocks A1 and A4 (Figure 3-1) Of these one structure Prospect M has been matured to prospect status and is of sufficient size to warrant independent estimates of resources (Figure 3-8)
Figure 3-8 Seismic line through Prospect M
We have evaluated the uncertainty in gross rock volume for Prospect M and combined this with reservoir net to gross ratio and porosity from analogue to generate estimates of STOIIP and prospective resources We have simulated uncertainty in seismic pick and also depth conversion to generate a range of spill points for the structure (Figure 3-9) These are used to make low and high case estimates of gross-rock volume
Due to the shallow nature of Prospect M we have assumed relatively high (but moveable) oil viscosities as discussed in Section 1 Recovery factor estimates are made with reference to this and also to analogue where uncertainty in both reservoir quality and also the degree of fracturing (and hence dual permeability) leads to a wide range in uncertainty in ultimate recovery Our low case recovery factor being affected primarily by early onset of water cut via fractures and an adverse mobility ratio and the high case making allowance for better oil mobility and improved matrix porosity and permeability leading to a more efficient sweep We therefore use a recovery factor range from 10 to 35 and use these as the P90 and P10 estimates on a log-normal distribution in our probabilistic simulation of prospective resources
Senonian UC
Intra Aptian Carbonate
TWT (ms)2 km
w EProspect M
Competent Personrsquos Report African Petroleum Corporation Limited
June 2013 58
Figure 3-9 Low and high case closure Prospect M top Aptian depth (m TVDSS)
There is pick and depth conversion uncertainty associated with Prospect M but we see a good chance of a closure being developed within the 3D seismic area and assign a prospect specific risk to trap of 09 as a result Downlapping events are observed onto the crest of the prospect (Figure 3-8) but the overlying seismic signature is relatively transparent thus we see a good chance of the prospect being sealed relative to the play risk However the prospect is relatively shallow at around 1000 m to 1100 m below the seabed and there is a risk to biodegradation of any oil charge Thus we associate a risk of 06 to biodegradation As it is established practice we place this risk into containment or trap risk which results in an overall trap risk of 09 06 or 54
There is evidence for the development of reservoir quality rock with a seismic character that has been associated with the development of karstification in the analogues used We also note that the prospect is very close to the platform edge and the erosional unconformity is quite pronounced again suggesting a period of subareal exposure Thus we see the prospect specific risk to reservoir efficacy as 08 Charge risk is also favourable with the prospect located at the edge of the buried platform margin proximal to the deeper potential kitchen areas We therefore associate a charge risk of 08 to the prospect
Thus we assign a prospect specific risk of 35 which when combined with the play risk for the carbonate platform margin gives an overall COS of 10
3
3
m ss
metres
Competent Personrsquos Report African Petroleum Corporation Limited
June 2013 59
4 Sierra Leone Prospectivity and Plays
As with offshore Liberia to the south-east all of the deep-water acreage offshore Sierra Leone is under licence (Figure 4-1) A discussion of regional hydrocarbon occurrences is presented in Section 21 APCLrsquos licences SL-03 and SL-04A-10 lie to the north-west of the countryrsquos territorial waters around 200 to 300 km north-west of the recent Venus Mercury and Jupiter discoveries made by Anadarko (Figure 4-1)
Figure 4-1 Offshore licences and discoveries Liberia and Sierra Leone
A regional grid of 2D seismic data is available to APCL for the evaluation of offshore Sierra Leone (Figure 4-2) In addition APCL has licenced c 2500 km2 of 3D seismic data covering the deeper water area of Block SL-03 and is negotiating the licencing of further 3D seismic data covering part of Block SL-04A-10
Competent Personrsquos Report African Petroleum Corporation Limited
June 2013 60
Well data offshore Sierra Leone are sparse Historical exploration was restricted to the shelf and resulted in the drilling of two exploration wells (Wells A-1 and A-1-2) which were plugged and abandoned as dry holes Data from both wells are available to APCL Recent drilling by Anadarko in the deeper waters of licence SL-07B-10 has yielded a number of discoveries (Wells Jupiter-1 Venus-1 and Mercury-1) but these well data are not available to APCL
Figure 4-2 Well and seismic database offshore Sierra Leone
The play fairways identified offshore Sierra Leone are very similar to those identified offshore Liberia (Figure 2-3) as structural traps within the Lower Cretaceous syn-rift section and primarily as stratigraphic traps within turbiditic sands of Cretaceous age (Campanian Cenomanian and Turonian) Sourcing from regional marine (Cenomanian) or lacustrine (Albo-Aptian) source rocks is hypothesized For the syn-rift structural play the presence of Albo-Aptian reservoirs is demonstrated by the shallow water Wells A-1 and A-1-2 which also had indications of the development of source rocks within the
Competent Personrsquos Report African Petroleum Corporation Limited
June 2013 61
Cretaceous syn-rift section Although the data are not available the recent Anadarko wells are publically documented as having found hydrocarbons within post-rift Cretaceous turbidites potentially de-risking this play
Blocks SL-03 and SL-04A-10 are towards the north-western edge of the seismically identified Cretaceous basin immediately adjacent to a large structural lineament the Sierra Leone Transform System Submarine canyon development is therefore prognosed to occur to the south and east of this lineament providing sediment input into the blocks during Cretaceous time As is encountered regionally there is reasonable seismic evidence for the presence of reservoir bearing intervals within the Upper Cretaceous section in the blocks
APCLrsquos evaluation of the recently licenced 3D seismic data is on-going and as yet only one prospect Altair has been matured to drillable prospect status However a number of other Cretaceous channelfan systems have been identified within Block SL- 03 (Figure 4-3)
Figure 4-3 Leads Sierra Leone Block SL-03
Competent Personrsquos Report African Petroleum Corporation Limited
June 2013 62
41Play Risk
Although there has been recent drilling along strike of APCLrsquos Sierra Leone licences these wells lie some 100 km to the east We have therefore attributed a play risk albeit favourable to Cretaceous channel-fan prospectivity within Blocks SL-03 and SL-04A-10 As with our review of Liberia there is strong seismic evidence for reservoir and seal rocks being present and offset drilling would indicate the same from the limited published information However there is as yet no proven source rock within APCLrsquos licences and we see this as the key risk to play The reported results of offset drilling and APCLrsquos own basin modelling would suggest that source risk would be favourable
Our final play risk for the Cretaceous channel-fan systems in APCLrsquos Sierra Leone licences is summarised in Table 31 below
PLAY Source Reservoir Presence Seal Play
Risk Cretaceous Play 08 09 09 65
Table 41 Play risk Sierra Leone Block SL-03
41Sierra Leone Leads and Prospects
APCL is currently evaluating the recently licenced 3D seismic data over Block SL-03 and has identified a number of Cretaceous channel-fan systems varying in areal extent from 20 km2 to 150 km2 Of the mapped channel fan systems one Altair has been matured to prospect status by APCL and we have made independent estimates of prospective resources and risks for this prospect
A summary of input parameters for the calculation of prospective resources results and risks for the Altair prospect is given in the resource summary sheet in Enclosure 31 of this document
411Altair
The Altair prospect is a turbidite channel prospect mapped at a seismic event described as Turonian by APCL (Figure 4-4) There is however uncertainty in this stratigraphy as it is established by jump correlation using regional seismic data due to the lack of deep water wells on block It is a stratigraphic trap with areal extents defined by amplitude truncation and structural pinch-out in a similar manner to prospectivity within APCLrsquos Liberia and Cote drsquoIvoire acreage A single target reservoir is identified within the trapped area The prospect has anomalous seismic amplitudes associated with it (Figure 4-5) which may indicate reservoir development The top structure is mapped between 6200 ndash 6800 ms TWT over the area of the prospect Our depth conversion indicates a crestal depth of approximately 5400 m TVDSS beneath a water depth of 3300 m giving 2100 m of sediment above top reservoir
Competent Personrsquos Report African Petroleum Corporation Limited
June 2013 63
Figure 4-4 Dip seismic line (full offsets) Altair prospect
The seismic image suggests that Altair is a turbidite channel constrained in the north east by a well-defined canyon Two distinct canyon systems feed erosive channels at the break of slope A south west trending fault which is almost perpendicular to the main canyon feeders alters bathymetric relief and diverts the Altair channel southwards
ERCE has made estimates of prospective resources for the Altair prospect using an identical methodology to our evaluation of Liberian prospectivity An area net approach was adopted using optimized seismic amplitudes to constrain areal extent and define an areal net to gross to account for lateral variability of sand distribution within the reservoir In our low case we restrict the area of the accumulation to the brightest area of anomalous amplitudes and a column height of 200 m Our high case extends the prospect down-dip to a column height of 800 m and laterally to incorporate weaker amplitude responses (Figure 4-5) These polygons were used to constrain the P90 and P10 area inputs of our probabilistic simulation
SW NE
Top Turonian
Top syn-rift
0 5kmTWT (s)
ALTAIR
3
3
metres
Competent Personrsquos Report African Petroleum Corporation Limited
June 2013 64
Figure 4-5 Seismic amplitude (gradient stack) and Top Turonian depth (m TVDSS) Altair prospect
Net pay is estimated from the mapped seismic interval and regional analogue with porosities and fluid properties estimated as described in Section 16
We have used the prospect risk matrix presented in Section 16 to determine the geological chance of success for the Altair prospect Key risk is to trap integrity due to the coalescing of a number of mapped fan systems up dip towards the pinch-out of Altair with subsidiary risk to charge as this is as yet unproven on block This gives a prospect specific risk of 28 which when combined with the play risk gives an overall chance of success of 18 for the Altair prospect
3
3
metres
Competent Personrsquos Report African Petroleum Corporation Limited
June 2013 65
5 Cote13 drsquoIvoire13 Prospectivity13 and Plays
51Introduction
Offshore Cote drsquoIvoire has been actively explored for hydrocarbons for a number of years and much of the offshore shelf is under licence Recently exploration has moved into deeper waters targeting the regional post-rift (Cretaceous) play and APCL has identified a number of prospects and leads within the western licence Blocks of CI-513 and CI-509 (Figure 5-1)
There are two main play types identifiable offshore Cote drsquoIvoire (Figure 5-2) as structural traps within the Lower Cretaceous (Aptian to Albian) syn-rift section and as stratigraphic traps within post rift turbiditic sands of Cenomanian to Turonian age Sourcing is prognosed from regional marine (Turonian) or lacustrine (Albo-Aptian) source rocks
Figure 5-1 CI-509 and CI-513 Prospects and Leads13 offshore13 Cote13 drsquoIvoire
Historically exploration has been restricted to the narrow shelf area and has yielded a number of commercial fields both oil and gas including Foxtrot Baobab and Espoir All of these fields lie within the Lower Cretaceous (Aptian) syn-rift play Recently exploration has moved into deeper waters targeting the regional post-rift (Cretaceous) play Well Paon-1X c 300 km to the east of Blocks CI-105 and CI-513
Competent Personrsquos Report African Petroleum Corporation Limited
June 2013 66
drilled by Tullow Oil plc and partners in licence CI-103 during 2012 is reported to have found hydrocarbons in turbiditic sandstones of Cretaceous age Well Kosrou-1X some 150 km east of Blocks CI-105 and CI-513 shows reservoir development within the post-rift Cretaceous section particularly within the Turonian to Cenomanian section
Evaluation of prospectivity within Blocks CI-509 and CI-513 is at an early stage and a working petroleum system is not proven on block However a number of Cretaceous channelfan systems have been identified using both 2D and 3D seismic data which have generated around seven potential traps at the date of this report five of which are considered prospects for this report (Figure 5-1)
Figure 5-2 Petroleum13 systems13 and13 plays13 offshore13 Cote13 drsquoIvoire
52Well and Seismic Database
APCL has obtained a regional database of 2D seismic data offshore Cote drsquoIvoire which provides well to seismic ties to Well San Pedro-1 (Figure 5-3) The primary data set used for our evaluation is that provided by the recently acquired 3D seismic data At the time of writing these data were processed to
Competent Personrsquos Report African Petroleum Corporation Limited
June 2013 67
pre-stack time-migration and we have used this volume plus available AvO processed volumes to evaluate the prospectivity of the CI-513 licence currently only the full-stack seismic product has been used to assess the prospectivity in Block CI-509
Figure 5-3 Well and seismic database offshore Sierra Leone
53Plays and Petroleum Geology Blocks CI-509 and CI-513
The primary play being explored within Blocks CI-509 and CI-513 is the Cretaceous post-rift turbidite play (Figure 5-2) There is reasonable seismic evidence for the presence of reservoir bearing intervals within the Upper Cretaceous section of the blocks However dating of the age of these post-rift turbidite channelfan systems is uncertain due to the paucity of well and seismic data with stratigraphy extrapolated into APCLrsquos licences via regional seismic correlation The presence of a regional Turonian source rock is hypothesized to charge any identified traps This is not proven on block but evidence from offset drilling in Block CI-105 demonstrates the presence of source rocks developed within the
Grand Lahou East 1
Kosrou 1x
San Pedro 1
South Grand Lahou 1
Competent Personrsquos Report African Petroleum Corporation Limited
June 2013 68
Cenomanian to Turonian and basin modelling studies indicate that the Turonian may be mature for oil generation local to the licences
A number of Cretaceous channelfan systems have been identified using both 2D and 3D seismic data (Figure 5-1) and we have independently evaluated the Prospective Resources and geological chance of success for five of these In addition the Lower Cretaceous syn-rift play may be viable within the licences particularly to the north Evaluation of this play by APCL is on-going and no prospective resources have been assessed for this play
54Play Risk
Exploration offshore Cote drsquoIvoire is at an early stage and there are limited well data available As a result ERCE has adopted a play and prospect risk system in our evaluation of the Cote drsquoIvoire prospective resources within the Cretaceous channel-fan play in an identical manner to our review of Liberia the Gambia and Sierra Leone
In a similar manner to Liberia the Gambia and Sierra Leone there is seismic evidence for the presence of seal and reservoir rock and thus the key risk is to source and we see source risk as the key risk to the Creteaceous clastic play Sourcing is prognosed from regional marine (Turonian) modelled as having limited hydrocarbon generating potential or lacustrine (Albo-Aptian) source rocks the maturity of which are interpreted to be in the very early oil window As a result we assign a play source risk of 06 Note that the uncertainty in both source rock presence and thermal maturity is such that there is a possibility of gas charge although it is impossible to quantify this chance at present
Our final play risk is summarised in Table 51 below
PLAY Source Reservoir Presence Seal Play
Risk Cretaceous Clastic Play 06 09 09 049
Table 51 Play13 risk13 Cote13 drsquoIvoire13 Blocks13 CI-509 and CI-513
Competent Personrsquos Report African Petroleum Corporation Limited
June 2013 69
ͷǤͷǤ Cote13 drsquoIvoire13 Blocks13 CI-509 and CI-503 Leads and Prospects
Prospectivity has been identified by APCL at a number of levels with the evaluation of the Cretaceous clastic turbidite channel-fan play being the most advanced ERCE has made independent assessments of prospective resources and geological chance of success for five prospects within this play Ayame Ayame West Sassandra Cavella and Leraba (Figure 5-1)
A summary of input parameters for the calculation of prospective resources results and risks for each of the prospective layers evaluated is given in the resource summary sheets in Enclosures 41 to 45 of this document
ͷǤͷǤͳǤ Ayame amp Ayame West
The Ayame and Ayame West prospects are identified as Upper Cretaceous fans which lie mainly within Block CI-513 (Figure 5-4) The prognosed trapping mechanism is stratigraphic with areal extents defined by amplitude truncation and structural pinch-out A single target reservoir is prognosed for both within stratigraphy identified as Turonian although stratigraphy is uncertain in both licences as it is established via long distance seismic ties The prospects have anomalous seismic amplitudes associated with them (Figure 5-5) which may indicate reservoir development The top structure is mapped between 5400 ndash 6300 ms TWT over the area of the prospect and our depth conversion places the crest of the trap at approximately 4200 m TVDSS beneath a water depth of 2500 m
Figure 5-4 Strike Line Ayame and Ayame West prospects
NE
0 km 4
TWT (s)
Top
Turonian
Base
Turonian
Top
Albian
AYAMEAYAME WESTSW
P90
P10
metres
P90
P10
AYAME
AYAMEWEST
Competent Personrsquos Report African Petroleum Corporation Limited
June 2013 70
Evaluation of the Ayame and Ayame West prospects is undertaken in an identical manner to our evaluations of the stratigraphically trapped channel-fan prospects in APCLrsquos Liberia and Sierra Leone licences An area net approach is adopted using anomalous seismic amplitudes to constrain areal extent and define an areal net to gross to account for lateral variability of sand distribution within the closure area In our low case we restrict the area of the accumulation to the brightest area of anomalous amplitudes and a 200 m column height Our high case extends the prospect down-dip to 800 m of column height to include a larger area of anomalous amplitudes (Figure 5-5) These polygons are used to constrain the P90 and P10 area inputs of our probabilistic simulation
Net pay estimates are estimated from mapped seismic interval thickness and from regional analogues with porosity fluid parameters and recovery factors estimated as described in Section 16
Figure 5-5 Ayame Seismic amplitude (gradient stack) and Top Turonian depth (m TVDSS)
We use the prospect risk matrix presented in Section 16 to determine the geological chance of success for the Ayame and Ayame West prospects Key risk is to trap and we attribute a trap risk of 50 to both
P90
P10
metres
P90
P10
AYAME
AYAMEWEST
Competent Personrsquos Report African Petroleum Corporation Limited
June 2013 71
prospects giving a prospect specific chance of success of 28 for both prospects When combined with the play risk this gives an overall chance of success of 14
A proportion of the closure areas for both the Ayame and Ayame West prospects fall outside Block CI-513 in our high case (6 km2 and 11 km2 respectively) This is corrected for in our summary tables of net risked and unrisked prospective resources at the beginning of this document by computing the area of the prospect off-block at P90 P50 and P10 and scaling accordingly
ͷǤͷǤʹǤ Sassandra
The Sassandra prospect is mapped as a deep-water fan system at Top Turonian level and lies within Blocks CI-513 and CI-509 approximately 20km west along strike from the Ayame prospect It is a stratigraphic trap with areal extents defined by amplitude truncation and structural pinch-out (Figure 5-6) A single target reservoir is prognosed within the Turonian and as with other prospects on block has similar uncertainty in the stratigraphic age of the prospective interval The prospect has anomalous amplitudes associated with it (Figure 5-7) which may indicate reservoir development The top structure is mapped between 5000 ndash 6000 ms TWT over the area of the prospect and our depth conversion predicts a crestal depth of approximately 4400 m TVDSS beneath a water depth of 2500 m
Figure 5-6 Dip seismic line Sassandra prospect
Top Turonian
Base Turonian
Top Albian
N S
TWT (s)
SASSANDRA
P90 P10
metres
CI-509
Competent Personrsquos Report African Petroleum Corporation Limited
June 2013 72
Evaluation of the Sassandra prospect is undertaken in an identical manner to our evaluation of the Ayame and Ayame West prospects An area net approach is adopted using anomalous seismic amplitudes to constrain areal extent and define an areal net to gross to account for lateral variability of sand distribution within the closure area In our low case we restrict the area of the accumulation to the brightest area of anomalous amplitudes and a 200 m column height Our high case extends the prospect down-dip to 800 m of column height to include a larger area of anomalous amplitudes (Figure 5-7) These polygons are used to constrain the P90 and P10 area inputs of our probabilistic simulation As far offset data are only available for CI-513 (at the time of writing) we have used amplitudes from the full-stack volume to map the extent of the prospect to the west off block (Figure 5-7)
Net pay estimates are estimated from mapped seismic interval thickness and from regional analogues with porosity fluid parameters and recovery factors estimated as described in Section 16
Figure 5-7 Sassandra prospect Seismic amplitude and Top Turonian depth (m TVDSS)
We use the prospect risk matrix presented in Section 16 to determine the geological chance of success for the Sassandra prospect Key risk is to trap and we attribute a trap risk of 40 This is a lower value
33
metres
CI-509
Competent Personrsquos Report African Petroleum Corporation Limited
June 2013 73
than our estimates for the Ayame and Ayame West prospects as the up-dip termination of the trap is less well defined and requires a larger area for pinch-out or bypass Seismic amplitude support for reservoir presence is less over the Sassandra prospect relative to Ayame Thus we estimate a prospect specific chance of success for the Sassandra prospect of 20 which when combined with the play risk gives an overall chance of success for the Sassandra prospect of 10
A proportion of the closure area for the Sassandra prospect falls outside Blocks CI-513 and CI-509 in our high case (33 km2) This is corrected for in our summary tables of net risked and unrisked prospective resources at the beginning of this document by computing the area of the prospect off-block at P90 P50 and P10 and scaling accordingly
553Cavalla
The Cavalla prospect is an Upper Cretaceous Fan which lies between the Ayame and Sassandra prospects within Block CI-513 It is identified as a stratigraphic trap with areal extents defined by amplitude truncation and structural pinch-out (Figure 5-8) A single target reservoir is prognosed within the TuronianCenomanian interval (with similar stratigraphic uncertainty to other prospects on block) which lies stratigraphically beneath the Ayame prospect The prospect has anomalous seismic amplitudes associated with it (Figure 5-9) which may indicate reservoir development The top structure is mapped between 4600 ndash 5900 ms TWT over the area of the prospect and we estimate a crestal depth of approximately 3900 m TVDSS beneath a water depth of 2500 m The prospect is more steeply dipping than other fan systems mapped on block
Evaluation of the Cavalla prospect is undertaken in an identical manner to our evaluation of the Ayame Ayame West and Sassandra prospects An area net approach is adopted using anomalous seismic amplitudes to constrain areal extent and define an areal net to gross to account for lateral variability of sand distribution within the closure area In our low case we restrict the area of the accumulation to the brightest area of anomalous amplitudes and a 200 m column height Our high case extends the prospect down-dip to 800 m of column height to include a larger area of anomalous amplitudes (Figure 5-9) These polygons are used to constrain the P90 and P10 area inputs of our probabilistic simulation
Net pay estimates are estimated from mapped seismic interval thickness and from regional analogues with porosity fluid parameters and recovery factors estimated as described in Section 16
We use the prospect risk matrix presented in Section 16 to determine the geological chance of success for the Cavella prospect Key risk is to trap and we attribute a trap risk of 40 As with the Sassandra prospect this is a lower value than our estimates for the Ayame and Ayame West prospects as the up-dip termination of the trap is less well defined and requires a larger area for pinch-out or bypass Seismic amplitude support for reservoir presence is less over the Cavella prospect relative to Ayame Thus we estimate a prospect specific chance of success for the Cavella prospect of 20 which when combined with the play risk gives an overall chance of success for the Cavella prospect of 10
Competent Personrsquos Report African Petroleum Corporation Limited
June 2013 74
The Cavalla prospect is contained entirely within APCLrsquos licences
Figure 5-8 Dip seismic line Cavalla prospect
Top Turonian
Top Albian
TWT (s)
CAVALLANW SEP90
P10
metres
Competent Personrsquos Report African Petroleum Corporation Limited
June 2013 75
Figure 5-9 Seismic amplitude (gradient stack) and Top fan depth (m TVDSS) Cavalla prospect
ͷǤͷǤͶǤ Leraba
As with the other evaluated prospectivity within Blocks CI-509 and CI-513 the Leraba prospect is an Upper Cretaceous fan which lies within Block CI-509 It is identified as a stratigraphic trap with areal extents defined by amplitude truncation and structural pinch-out (Figure 5-10) The prospect has anomalous seismic amplitudes associated with it (Figure 5-11) which may indicate reservoir development Unlike the other Cote DrsquoIvoire prospects evaluated in this report no offset seismic volumes were available for our review of Leraba at the time of writing The seismic amplitude response and character on the full-stack data is however consistent with that observed over other prospects in Block CI-513 where more seismic products were available
P90
P10
metres
Competent Personrsquos Report African Petroleum Corporation Limited
June 2013 76
The top structure is mapped between 4600 ndash 5200 ms TWT over the area of the prospect and we estimate a depth at the crest of approximately 3700 m TVDSS beneath a water depth of 2500 m
Figure 5-10 Dip seismic line Leraba prospect
Evaluation of the Leraba prospect is undertaken in an identical manner to our evaluation of the other Cretaceous fan systems evaluated in this section An area net approach is adopted using anomalous seismic amplitudes to constrain areal extent and define an areal net to gross to account for lateral variability of sand distribution within the closure area In our low case we restrict the area of the accumulation to the brightest area of anomalous amplitudes and a 200 m column height Our high case extends the prospect down-dip to 800 m of column height to include a larger area of anomalous amplitudes (Figure 5-11) These polygons are used to constrain the P90 and P10 area inputs of our probabilistic simulation
P90
P10
metresTWT (s)
LERABANW SE
Top Turonian
Albian
0 5km
Competent Personrsquos Report African Petroleum Corporation Limited
June 2013 77
Figure 5-11 Seismic amplitudes Leraba prospect overlay of Top Reservoir m TVDSS
Net pay estimates are derived from mapped seismic interval thickness and from regional analogues with porosity fluid parameters and recovery factors estimated as described in Section 16 The prospect is relatively shallow to mud line and we have modelled a more viscous oil as described in Section 16
We use the prospect risk matrix presented in Section 16 to determine the geological chance of success for the Leraba prospect Key risk is to trap and we attribute a trap risk of 60 as the up-dip extent of the prospect is fairly well defined on seismic data Although no off-set 3D seismic data were available the seismic evidence for reservoir presence is again comparable to that of Ayame West Thus we estimate a prospect specific chance of success for the Leraba prospect of 34 which when combined with the play risk gives an overall chance of success for the Leraba prospect of 16
The Leraba prospect is contained entirely within APCLrsquos licences
P90
P10
metres
Competent Personrsquos Report African Petroleum Corporation Limited
June 2013 78
6 Senegal Prospectivity and Plays
Prospectivity identified within APCLrsquos Sengalese licences is seen as being similar to that identified offshore Gambia (Figure 6-1) and a description of the regional petroleum systems and main play types expected is given in Section 3
Figure 6-1 Petroleum systems and plays offshore Senegal
In 2012 APCL acquired 3600 km2 of multi-client 3D seismic data over the Offshore Sud Profond licence In addition 1500 km2 of legacy 3D data over the Rufisque Offshore Profond licence is currently being reprocessed by APCL and legacy 2D seismic data (c 7000 line km) have also been acquired APCL expects to begin prospect evaluation once seismic processing is complete which is expected later in 2013 At present a number of conceptual Cretaceous post-rift leads are identified by APCL (Figure 6-2)
Competent Personrsquos Report African Petroleum Corporation Limited
June 2013 79
Figure 6-2 leads offshore Senegal Blocks ROP and SOSP
Competent Personrsquos Report African Petroleum Corporation Limited
June 2013 80
7 Appendix 1 SPE PRMS Guidelines
SPEWPCAAPGSPEE Petroleum Reserves and Resources Classification System and Definitions
The Petroleum Resources Management System
Preamble
Petroleum Resources are the estimated quantities of hydrocarbons naturally occurring on or within the Earthrsquos crust Resource assessments estimate total quantities in known and yet-to-be-discovered accumulations Resources evaluations are focused on those quantities that can potentially be recovered and marketed by commercial projects A petroleum Resources managements system provides a consistent approach to estimating petroleum quantities evaluating development projects and presenting results within a comprehensive classification framework
International efforts to standardize the definitions of petroleum Resources and how they are estimated began in the 1930s Early guidance focused on Proved Reserves Building on work initiated by the Society of Petroleum Evaluation Engineers (SPEE) SPE published definitions for all Reserves categories in 1987 In the same year the World Petroleum Council (WPC then known as the World Petroleum Congress) working independently published Reserves definitions that were strikingly similar In 1997 the two organizations jointly released a single set of definitions for Reserves that could be used worldwide In 2000 the American Association of Petroleum Geologists (AAPG) SPE and WPC jointly developed a classification system for all petroleum Resources This was followed by additional supporting documents supplemental application evaluation guidelines (2001) and a glossary of terms utilized in Resources definitions (2005) SPE also published standards for estimating and auditing Reserves information (revised 2007)
These definitions and the related classification system are now in common use internationally within the petroleum industry They provide a measure of comparability and reduce the subjective nature of Resources estimation However the technologies employed in petroleum exploration development production and processing continue to evolve and improve The SPE Oil and Gas Reserves Committee works closely with other organizations to maintain the definitions and issues periodic revisions to keep current with evolving technologies and changing commercial opportunities
The SPE-PRMS consolidates builds on and replaces guidance previously contained in the 1997 Petroleum Reserves Definitions the 2000 Petroleum Resources Classification and Definitions publications and the 2001 ldquoGuidelines for the Evaluation of Petroleum Reserves and Resourcesrdquo the latter document remains a valuable source of more detailed background information
These definitions and guidelines are designed to provide a common reference for the international petroleum industry including national reporting and regulatory disclosure agencies and to support petroleum project and portfolio management requirements They are intended to improve clarity in
Competent Personrsquos Report African Petroleum Corporation Limited
June 2013 81
global communications regarding petroleum Resources It is expected that the SPE-PRMS will be supplemented with industry education programs and application guides addressing their implementation in a wide spectrum of technical andor commercial settings
It is understood that these definitions and guidelines allow flexibility for users and agencies to tailor application for their particular needs however any modifications to the guidance contained herein should be clearly identified The definitions and guidelines contained in this document must not be construed as modifying the interpretation or application of any existing regulatory reporting requirements
The full text of the SPEWPCAAPGSPEE Petroleum Resources Management System document hereinafter referred to as the SPE-PRMS can be viewed at
wwwspeorgspecmabinaryfiles6859916Petroleum_Resources_Management_System_2007pdf
Overview and Summary of Definitions
The estimation of petroleum resource quantities involves the interpretation of volumes and values that have an inherent degree of uncertainty These quantities are associated with development projects at various stages of design and implementation Use of a consistent classification system enhances comparisons between projects groups of projects and total company portfolios according to forecast production profiles and recoveries Such a system must consider both technical and commercial factors that impact the projectrsquos economic feasibility its productive life and its related cash flows
Petroleum is defined as a naturally occurring mixture consisting of hydrocarbons in the gaseous liquid or solid phase Petroleum may also contain non-hydrocarbons common examples of which are carbon dioxide nitrogen hydrogen sulphide and sulphur In rare cases non-hydrocarbon content could be greater than 50
The term ldquoResourcesrdquo as used herein is intended to encompass all quantities of petroleum naturally occurring on or within the Earthrsquos crust discovered and undiscovered (recoverable and unrecoverable) plus those quantities already produced Further it includes all types of petroleum whether currently considered conventionalrdquo or ldquounconventionalrdquo
Figure 1-1 is a graphical representation of the SPEWPCAAPGSPEE Resources classification system The system defines the major recoverable Resources classes Production Reserves Contingent Resources and Prospective Resources as well as Unrecoverable petroleum
Competent Personrsquos Report African Petroleum Corporation Limited
June 2013 82
Figure 1-1 SPEAAPGWPCSPEE Resources Classification System
The ldquoRange of Uncertaintyrdquo reflects a range of estimated quantities potentially recoverable from an accumulation by a project while the vertical axis represents the ldquoChance of Developmentrdquo that is the chance that the project that will be developed and reach commercial producing status
The following definitions apply to the major subdivisions within the Resources classification
TOTAL PETROLEUM INITIALLY-IN-PLACE
Total Petroleum Initially in Place is that quantity of petroleum that is estimated to exist originally in naturally occurring accumulations
It includes that quantity of petroleum that is estimated as of a given date to be contained in known accumulations prior to production plus those estimated quantities in accumulations yet to be discovered (equivalent to ldquototal Resourcesrdquo)
Competent Personrsquos Report African Petroleum Corporation Limited
June 2013 83
DISCOVERED PETROLEUM INITIALLY-IN-PLACE
Discovered Petroleum Initially in Place is that quantity of petroleum that is estimated as of a given date to be contained in known accumulations prior to production
PRODUCTION
Production is the cumulative quantity of petroleum that has been recovered at a given date
Multiple development projects may be applied to each known accumulation and each project will recover an estimated portion of the initially-in-place quantities The projects shall be subdivided into Commercial and Sub-Commercial with the estimated recoverable quantities being classified as Reserves and Contingent Resources respectively as defined below
RESERVES
Reserves are those quantities of petroleum anticipated to be commercially recoverable by application of development projects to known accumulations from a given date forward under defined conditions
Reserves must satisfy four criteria they must be discovered recoverable commercial and remaining based on the development project(s) applied Reserves are further subdivided in accordance with the level of certainty associated with the estimates and may be sub-classified based on project maturity andor characterized by their development and production status To be included in the Reserves class a project must be sufficiently defined to establish its commercial viability There must be a reasonable expectation that all required internal and external approvals will be forthcoming and there is evidence of firm intention to proceed with development within a reasonable time frame A reasonable time frame for the initiation of development depends on the specific circumstances and varies according to the scope of the project While five years is recommended as a benchmark a longer time frame could be applied where for example development of economic projects are deferred at the option of the producer for among other things market-related reasons or to meet contractual or strategic objectives
In all cases the justification for classification as Reserves should be clearly documented To be included in the Reserves class there must be a high confidence in the commercial producibility of the reservoir as supported by actual production or formation tests In certain cases Reserves may be assigned on the basis of well logs andor core analysis that indicate that the subject reservoir is hydrocarbon-bearing and is analogous to reservoirs in the same area that are producing or have demonstrated the ability to produce on formation tests
Proved Reserves
Proved Reserves are those quantities of petroleum which by analysis of geoscience and engineering data can be estimated with reasonable certainty to be commercially recoverable from a given date forward from known reservoirs and under defined economic conditions operating methods and government regulations
Competent Personrsquos Report African Petroleum Corporation Limited
June 2013 84
If deterministic methods are used the term reasonable certainty is intended to express a high degree of confidence that the quantities will be recovered If probabilistic methods are used there should be at least a 90 probability that the quantities actually recovered will equal or exceed the estimate The area of the reservoir considered as Proved includes
the area delineated by drilling and defined by fluid contacts if any and adjacent undrilled portions of the reservoir that can reasonably be judged as continuous with it and commercially productive on the basis of available geoscience and engineering data
In the absence of data on fluid contacts Proved quantities in a reservoir are limited by the lowest known hydrocarbon (LKH) as seen in a well penetration unless otherwise indicated by definitive geoscience engineering or performance data Such definitive information may include pressure gradient analysis and seismic indicators Seismic data alone may not be sufficient to define fluid contacts for Proved Reserves (see ldquo2001 Supplemental Guidelinesrdquo Chapter 8) Reserves in undeveloped locations may be classified as Proved provided that the locations are in undrilled areas of the reservoir that can be judged with reasonable certainty to be commercially productive and interpretations of available geoscience and engineering data indicate with reasonable certainty that the objective formation is laterally continuous with drilled Proved locations
For Proved Reserves the recovery efficiency applied to these reservoirs should be defined based on a range of possibilities supported by analogs and sound engineering judgment considering the characteristics of the Proved area and the applied development program
Probable Reserves
Probable Reserves are those additional Reserves which analysis of geoscience and engineering data indicate are less likely to be recovered than Proved Reserves but more certain to be recovered than Possible Reserves
It is equally likely that actual remaining quantities recovered will be greater than or less than the sum of the estimated Proved plus Probable Reserves (2P) In this context when probabilistic methods are used there should be at least a 50 probability that the actual quantities recovered will equal or exceed the 2P estimate
Probable Reserves may be assigned to areas of a reservoir adjacent to Proved where data control or interpretations of available data are less certain The interpreted reservoir continuity may not meet the reasonable certainty criteria Probable estimates also include incremental recoveries associated with project recovery efficiencies beyond that assumed for Proved
Possible Reserves
Possible Reserves are those additional Reserves which analysis of geoscience and engineering data indicate are less likely to be recoverable than Probable Reserves
Competent Personrsquos Report African Petroleum Corporation Limited
June 2013 85
The total quantities ultimately recovered from the project have a low probability to exceed the sum of Proved plus Probable plus Possible (3P) which is equivalent to the high estimate scenario When probabilistic methods are used there should be at least a 10 probability that the actual quantities recovered will equal or exceed the 3P estimate
Possible Reserves may be assigned to areas of a reservoir adjacent to Probable where data control and interpretations of available data are progressively less certain Frequently this may be in areas where geoscience and engineering data are unable to clearly define the area and vertical reservoir limits of commercial production from the reservoir by a defined project
Possible estimates also include incremental quantities associated with project recovery efficiencies beyond that assumed for Probable
Probable and Possible Reserves
(See above for separate criteria for Probable Reserves and Possible Reserves)
The 2P and 3P estimates may be based on reasonable alternative technical and commercial interpretations within the reservoir andor subject project that are clearly documented including comparisons to results in successful similar projects
In conventional accumulations Probable andor Possible Reserves may be assigned where geoscience and engineering data identify directly adjacent portions of a reservoir within the same accumulation that may be separated from Proved areas by minor faulting or other geological discontinuities and have not been penetrated by a wellbore but are interpreted to be in communication with the known (Proved) reservoir Probable or Possible Reserves may be assigned to areas that are structurally higher than the Proved area Possible (and in some cases Probable) Reserves may be assigned to areas that are structurally lower than the adjacent Proved or 2P area
Caution should be exercised in assigning Reserves to adjacent reservoirs isolated by major potentially sealing faults until this reservoir is penetrated and evaluated as commercially productive Justification for assigning Reserves in such cases should be clearly documented Reserves should not be assigned to areas that are clearly separated from a known accumulation by non-productive reservoir (ie absence of reservoir structurally low reservoir or negative test results) such areas may contain Prospective Resources
In conventional accumulations where drilling has defined a highest known oil (HKO) elevation and there exists the potential for an associated gas cap Proved oil Reserves should only be assigned in the structurally higher portions of the reservoir if there is reasonable certainty that such portions are initially above bubble point pressure based on documented engineering analyses Reservoir portions that do not meet this certainty may be assigned as Probable and Possible oil andor gas based on reservoir fluid properties and pressure gradient interpretations
Competent Personrsquos Report African Petroleum Corporation Limited
June 2013 86
CONTINGENT RESOURCES
Contingent Resources are those quantities of petroleum estimated as of a given date to be potentially recoverable from known accumulations by application of development projects but which are not currently considered to be commercially recoverable due to one or more contingencies
Contingent Resources may include for example projects for which there are currently no viable markets or where commercial recovery is dependent on technology under development or where evaluation of the accumulation is insufficient to clearly assess commerciality Contingent Resources are further categorized in accordance with the level of certainty associated with the estimates and may be sub-classified based on project maturity andor characterized by their economic status
UNDISCOVERED PETROLEUM INITIALLY-IN-PLACE
Undiscovered Petroleum Initially in Place is that quantity of petroleum that is estimated as of a given date to be contained within accumulations yet to be discovered
PROSPECTIVE RESOURCES
Prospective Resources are those quantities of petroleum which are estimated as of a given date to be potentially recoverable from undiscovered accumulations
Potential accumulations are evaluated according to their chance of discovery and assuming a discovery the estimated quantities that would be recoverable under defined development projects It is recognized that the development programs will be of significantly less detail and depend more heavily on analog developments in the earlier phases of exploration
Prospect
A project associated with a potential accumulation that is sufficiently well defined to represent a viable drilling target
Project activities are focused on assessing the chance of discovery and assuming discovery the range of potential recoverable quantities under a commercial development program
Lead
A project associated with a potential accumulation that is currently poorly defined and requires more data acquisition andor evaluation in order to be classified as a prospect
Project activities are focused on acquiring additional data andor undertaking further evaluation designed to confirm whether or not the lead can be matured into a prospect Such evaluation includes the assessment of the chance of discovery and assuming discovery the range of potential recovery under feasible development scenarios
Play
Competent Personrsquos Report African Petroleum Corporation Limited
June 2013 87
A project associated with a prospective trend of potential prospects but which requires more data acquisition andor evaluation in order to define specific leads or prospects
Project activities are focused on acquiring additional data andor undertaking further evaluation designed to define specific leads or prospects for more detailed analysis of their chance of discovery and assuming discovery the range of potential recovery under hypothetical development scenarios
The range of uncertainty of the recoverable andor potentially recoverable volumes may be represented by either deterministic scenarios or by a probability distribution When the range of uncertainty is represented by a probability distribution a low best and high estimate shall be provided such that
bull There should be at least a 90 probability (P90) that the quantities actually recovered will equal or exceed the low estimate
bull There should be at least a 50 probability (P50) that the quantities actually recovered will equal or exceed the best estimate
bull There should be at least a 10 probability (P10) that the quantities actually recovered will equal or exceed the high estimate
When using the deterministic scenario method typically there should also be low best and high estimates where such estimates are based on qualitative assessments of relative uncertainty using consistent interpretation guidelines Under the deterministic incremental (risk-based) approach quantities at each level of uncertainty are estimated discretely and separately
These same approaches to describing uncertainty may be applied to Reserves Contingent Resources and Prospective Resources While there may be significant risk that sub-commercial and undiscovered accumulations will not achieve commercial production it useful to consider the range of potentially recoverable quantities independently of such a risk or consideration of the resource class to which the quantities will be assigned
Evaluators may assess recoverable quantities and categorize results by uncertainty using the deterministic incremental (risk-based) approach the deterministic scenario (cumulative) approach or probabilistic methods (see ldquo2001 Supplemental Guidelinesrdquo Chapter 25) In many cases a combination of approaches is used
Use of consistent terminology (Figure 11) promotes clarity in communication of evaluation results For Reserves the general cumulative terms lowbesthigh estimates are denoted as 1P2P3P respectively The associated incremental quantities are termed Proved Probable and Possible Reserves are a subset of and must be viewed within context of the complete Resources classification system While the categorization criteria are proposed specifically for Reserves in most cases they can be equally applied to Contingent and Prospective Resources conditional upon their satisfying the criteria for discovery andor development
Competent Personrsquos Report African Petroleum Corporation Limited
June 2013 88
For Contingent Resources the general cumulative terms lowbesthigh estimates are denoted as 1C2C3C respectively For Prospective Resources the general cumulative terms lowbesthigh estimates still apply No specific terms are defined for incremental quantities within Contingent and Prospective Resources
Without new technical information there should be no change in the distribution of technically recoverable volumes and their categorization boundaries when conditions are satisfied sufficiently to reclassify a project from Contingent Resources to Reserves All evaluations require application of a consistent set of forecast conditions including assumed future costs and prices for both classification of projects and categorization of estimated quantities recovered by each project
Competent Personrsquos Report African Petroleum Corporation Limited
June 2013 89
8 Appendix 2 Nomenclature
81 Units degC degrees Celsius
degF degrees Fahrenheit
bbl barrel
cp centipoises
ft feet
ftMDRKB feet below Kelly Bushing
ftTVDSS feet subsea
km kilometres
m metres
M or MM thousands and millions respectively
ms metres per second
md millidarcy
mTVDSS metres subsea
psia pounds per square inch absolute
psig pounds per square inch gauge
pu porosity unit
rb reservoir barrels
stb a stock tank barrel which is 42 US gallons measured at 147 pounds per square inch and 60 degrees Fahrenheit
82 Reserves and Resources Classifications
Low Low estimate of Prospective Resources as defined in SPE PRMS 2007
Best Best estimate of Prospective Resources as defined in SPE PRMS 2007
High High estimate of Prospective Resources as defined in SPE PRMS 2007
COS Geological Chance of Success associated with Prospective Resources
P10 10 per cent probability = Proved + Probable + Possible or 3P
P50 50 per cent probability = Proved + Probable or 2P
P90 90 per cent probability = Proved or 1P
83 Abbreviations AvO amplitude variation with offset
Bo oil shrinkage factor or formation volume factor in rbstb
Competent Personrsquos Report African Petroleum Corporation Limited
June 2013 90
CPI computer processed information log
FVF formation volume factor
FWL free water level
GRV gross rock volume
GWC gas water contact
KB kelly bushing
kh permeability thickness
MD measured depth
MSL mean sea level
NG net to gross ratio
OWC oil water contact
Phi porosity
PSC production sharing contract
PSDM post stack depth migration
PSTM post stack time migration
PVT pressure volume temperature experiment
RFT repeat formation tester
So oil saturation
Soi initial oil saturation
SS Subsea
STOIIP stock tank oil initially in place
Sw water saturation
Swc connate water saturation
TD total depth
TOC total organic carbon
TVD true vertical depth
TWT two way time
Vsh shale volume
Competent Personrsquos Report African Petroleum Corporation Limited
June 2013 91
Enclosures Resource Summary Sheets
Enclosure 11 Summary Description Sheet Barbet Prospect
SummaryBlock 9
APC Interest () 100
Fluid Oil
Crest (m ss) 3000
Water depth (m) 750
Notes
Area Shape F Areal NG Net Thick Porosity SO Bo STOIIP Rf Rec Res(km2) (frac) () (m) () () (rbstb) (MMstb) (frac) (MMstb)
Charge 90
Reservoir 70 Low 14 085 62 22 13 73 135 166 0300 60
Trap 50 Best 37 090 80 34 17 80 150 500 0375 186
Seal 70 High 98 095 98 53 20 88 165 1479 0450 558
COS 22 Deterministic inputs probabilistic STOIIP and Rec Resource Mean 270
Stratigraphic trap with amplitude support
Geological Risk Matrix
P10
P90metres
BARBET
dtdƐͿ
ϬŬŵϰ
Enclosure 12 Summary Description Sheet Sunbird Prospect Campanian Reservoir
SummaryBlock 8 amp 9
APC Interest () 100
Fluid Oil
Crest (m ss) 3000
Water depth (m) 1300
Notes
Area Shape F Areal NG Net Thick Porosity SO Bo STOIIP Rf Rec Res(km2) (frac) () (m) () () (rbstb) (MMstb) (frac) (MMstb)
Charge 80
Reservoir 80 Low 12 070 43 27 18 73 130 177 0300 63
Trap 60 Best 27 080 69 42 21 80 145 461 0375 172
Seal 70 High 61 090 95 66 24 88 165 1187 0450 448
COS 27 Deterministic inputs probabilistic STOIIP and Rec Resource Mean 229
Stratigraphic trap with amplitude support Split by intra-canyon
high
Geological Risk Matrix
P90
P10
metres
SUNBIRD
dtdƐͿ
ϬŬŵϰSUNBIRD
Enclosure 13 Summary Description Sheet Sunbird prospect Turonian Reservoir
SummaryBlock 8 amp 9
APC Interest () 100
Fluid Oil
Crest (m ss) 3300
Water depth (m) 1300
Notes
Area Shape F Areal NG Net Thick Porosity SO Bo STOIIP Rf Rec Res(km2) (frac) () (m) () () (rbstb) (MMstb) (frac) (MMstb)
Charge 90
Reservoir 60 Low 8 085 65 24 14 73 140 107 0300 39
Trap 50 Best 21 090 80 37 17 80 158 307 0375 115
Seal 70 High 53 095 94 58 20 88 175 863 0450 327
COS 19 Deterministic inputs probabilistic STOIIP and Rec Resource Mean 162
Stratigraphic trap with amplitude support Split by intra-canyon
high
Geological Risk Matrix
SW NE
Campanian Jacana Channel
Turonian BFF
P90
P10
metres
SUNBIRD
ϬŬŵϰ
Enclosure 14 Summary Description Sheet Sunbird Prospect Cenomanian Reservoir
SummaryBlock 8 amp 9
APC Interest () 100
Fluid Oil
Crest (m ss) 3500
Water depth (m) 1300
Notes
Area Shape F Areal NG Net Thick Porosity SO Bo STOIIP Rf Rec Res(km2) (frac) () (m) () () (rbstb) (MMstb) (frac) (MMstb)
Charge 100
Reservoir 50 Low 10 060 71 21 14 73 140 91 0300 33
Trap 60 Best 25 070 85 33 17 80 158 264 0375 99
Seal 60 High 65 080 99 51 20 88 175 779 0450 294
COS 18 Deterministic inputs probabilistic STOIIP and Rec Resource Mean 141
Stratigraphic trap with amplitude support Split by intra-canyon
high
Geological Risk Matrix
P90
P10
metres
SUNBIRD
dtdƐͿ
ϬŬŵϮ
Enclosure 15 Summary Description Sheet Lovebird Prospect Blue Horizon
SummaryBlock 8
APC Interest () 100
Fluid Oil
Crest (m ss) 5000
Water depth (m) 2850
Notes
GRV NG Porosity SO Bo STOIIP Rf Rec Res(MMm2) () () () (rbstb) (MMstb) (frac) (MMstb)
Charge 54
Reservoir 60 Low 354 30 14 60 150 68 030 25
Trap 70 Best 1310 54 19 70 180 293 038 109
Seal 90 High 4849 73 24 80 210 1218 045 456
COS 20 Mean 201
Four way dip closure to south of Block 8 Three potential
reservoirs identified Blue and Green horizon volumetrics derived
assuming ispoachous to Pink
Geological Risks
ŝŐŚĂƐĞWŝŶŬĞƉƚŚDĂƉ
Enclosure 16 Summary Description Sheet Lovebird Prospect Pink Horizon
SummaryBlock 8
APC Interest () 100
Fluid Oil
Crest (m ss) 5400
Water depth (m) 2850
Notes
GRV NG Porosity SO Bo STOIIP Rf Rec Res(MMm2) () () () (rbstb) (MMstb) (frac) (MMstb)
Charge 54
Reservoir 60 Low 354 30 12 60 155 59 030 22
Trap 70 Best 1310 54 17 70 188 262 038 96
Seal 90 High 4849 73 22 80 220 1066 045 400
COS 20 Mean 178
Four way dip closure to south of Block 8 Three potential
reservoirs identified Blue and Green horizon volumetrics derived
assuming ispoachous to Pink
Geological Risks
ŝŐŚĂƐĞWŝŶŬĞƉƚŚDĂƉ
Enclosure 17 Summary Description Sheet Lovebird Prospect Green Horizon
SummaryBlock 8
APC Interest () 100
Fluid Oil
Crest (m ss) 5800
Water depth (m) 2850
Notes
GRV NG Porosity SO Bo STOIIP Rf Rec Res(MMm2) () () () (rbstb) (MMstb) (frac) (MMstb)
Charge 54
Reservoir 60 Low 354 30 10 60 160 48 030 18
Trap 70 Best 1310 54 15 70 195 210 038 78
Seal 90 High 4849 73 20 80 230 896 045 337
COS 20 Mean 150
Four way dip closure to south of Block 8 Three potential
reservoirs identified Blue and Green horizon volumetrics derived
assuming ispoachous to Pink
Geological Risks
ŝŐŚĂƐĞWŝŶŬĞƉƚŚDĂƉ
Enclosure 18 Summary Description Sheet Wildbird Prospect
SummaryORFN $3ampQWHUHVW )OXLG 2LOampUHVWPVV DWHUGHSWKP P
Notes
Play Risk Prospect RiskGRV NG Porosity SO Bo STOIIP Rf Rec Res
6RXUFH 7UDS (MMm2) () () () (rbstb) (MMstb) (frac) (MMstb)6HDO ampKDUJH 5HVHUYRLU3UHV 5HVHUYRLU(II Low
Best High
COS 9 Deterministic inputs probabilistic STOIIP and Rec Resource Mean
)RXUZDGLSFORVHGKLJK
5
0 km 5
6 1(
PVV
Wildbird Horizons
ODFNEHUULJKWOXH3LQN5HG
mss
Enclosure 19 Summary Description Sheet Night Heron Prospect
SummaryORFN $3ampQWHUHVW RIORFN)OXLG 2LOampUHVWPVV DWHUGHSWKP
Notes
Prospect Risk Area Areal NG Net Porosity SO Bo STOIIP Rf Rec ResampKDUJH (km2) (frac) (m) () () (rbstb) (MMstb) (frac) (MMstb)5HVHUYRLU 7UDS Low 6HDO Best
High COS 144 Deterministic inputs probabilistic STOIIP and Rec Resource Mean 759
1LJKW+HURQLVD7XURQLDQEDVLQIORRUIDQVVWHPZKLFKPDLQOOLHVZLWKLQEORFNRIIVKRUHLEHULDWLVLGHQWLILHGDVDVWUDWLJUDSKLFWUDSZLWKDUHDOH[WHQWVGHILQHGEDPSOLWXGHWUXQFDWLRQDQGVWUXFWXUDOSLQFKRXW$QDUHDQHWDSSURDFKZDVDGRSWHGXVLQJWKHIXOOVWDFN360GHSWKLPDJHYROXPHWRSURYLGH61$H[WUDFWLRQDQGFRQVWUDLQDUHDOH[WHQWDQGHVWLPDWHDQDUHDO1WRDFFRXQWIRUODWHUDOYDULDELOLWZLWKLQWKHUHVHUYRLU1LJKW+HURQIDOOVSDUWORIIEORFN(5amp(FRUUHFWIRUWKLVXVLQJWKHUDWLRRIRQEORFNWRRIIEORFNDUHDLQUHSRUWLQJRIQHWXQULVNHGDQGQHWULVNHGUHVXOWV
6HLVPLFLQH36061$([WUDFWLRQ
Arbitrary line across Night Heron PSDM (Depth m)
S NE
2QWKHXSGLSSLQFKRXWLVGHILQHGELVRSDFKDQGDPSOLWXGHWUXQFDWLRQ
2QWKHXSGLSSLQFKRXWLVGHILQHGRQOELVRSDFK
Bee EaterNight Heron
5 Km
RMS Amplitudes from BFF Isopach
Depth (m)
Block Boundary
Enclosure 21 Summary Description Sheet
Summary - M - CretBlock A1
Working Interest () 60
Fluid Oil
Crest (m) 3130 (1070 bml)
Water depth (m) 2220
Notes
Play Risk Prospect Risk Area Stack F Net Porosity SO Bo STOIIP Rf Rec Res(Km2) (frac) (m) () () (rbstb) (MMstb) (frac) (MMstb)
Source 70 Trap 54
Seal 50 Mig 80 Low 8 1 15 10 55 125 82 010 13
Res Pres 80 Res Eff 80 Best 14 1 30 16 65 117 231 023 43
28 35 High 26 1 60 22 75 110 629 035 141
COS 10 Deterministic inputs probabilistic STOIIP and Rec Resource Mean 66
Structural high along edge of buried carbonate platform margin of
probable Lower Cretaceous and Jurassic age Seismic evidence
favourable for reservoir development Lower Bo model used to
reflect relatively shallow nature of prospect The prospect is close
to the shelf margin and so is well placed for charging The strong
rugose seismic events are interpreted as Karstified Limestones
Seismic Line Top Structure Map
WƌŽƐƉĞĐƚD
ĞƉƚŚŵ
Ϳ
Enclosure 22 Summary Description Sheet
Summary - SS - 4Block A1
Working Interest () 60
Fluid Oil
Crest (m) 4230 (2010 bml)
Water depth (m) 2220
Notes
Play Risk Prospect Risk Area Stack F Net Porosity SO Bo STOIIP Rf Rec Res(Km2) (frac) (m) () () (rbstb) (MMstb) (frac) (MMstb)
Source 70 Trap 80
Seal 90 Mig 85 Low 6 1 10 16 68 220 43 030 16
Res Pres 80 Res Eff 50 Best 11 1 19 20 75 167 113 038 42
50 34 High 21 1 35 24 83 135 295 045 112
COS 17 Deterministic inputs probabilistic STOIIP and Rec Resource Mean 56
Four way dip closed anticlinal structure The SS-4 interval has a
gross thickness over the crest area of 360 m Downlap of seismic
events across the crest of the SS-4 structure slightly downgrades
SS-4 seal The interval is believed to be Cenomanian in age and
the seismic character of generally planar events is interpreted as
representing thin bedded turbidites
Seismic Line Top Structure Map
2010 Migration Velocity Data ndash SS-4 Probability Above Spill
Enclosure 23 Summary Description Sheet
Summary - SS - 3Block A1
Working Interest () 60
Fluid Oil
Crest (m) 4590 (2370 bml)
Water depth (m) 2220
Notes
Play Risk Prospect Risk Area Stack F Net Porosity SO Bo STOIIP Rf Rec Res(Km2) (frac) (m) () () (rbstb) (MMstb) (frac) (MMstb)
Source 70 Trap 75
Seal 90 Mig 85 Low 12 1 20 15 68 227 197 025 63
Res Pres 80 Res Eff 50 Best 17 15 35 18 75 173 417 034 143
50 32 High 25 2 60 20 83 140 881 045 316
COS 16 Deterministic inputs probabilistic STOIIP and Rec Resource Mean 173
Four way dip closed anticlinal structure The SS-3 interval has a
gross thickness over the crest area of 550 m Seals to deeper
reservoirs may be eroded by overlying reservoirs From seismic
the prospective reservoir has been interpreted as being an Albian
deep water channel-lobe complex
Seismic Line Top Structure Map
2010 Migration Velocity Data ndashSS-3 Probability Above Spill
Enclosure 24 Summary Description Sheet
Summary - SS - 2Block A1
Working Interest () 60
Fluid Oil
Crest (m) 5140 (2920 bml)
Water depth (m) 2220
Notes
Play Risk Prospect Risk Area Stack F Net Porosity SO Bo STOIIP Rf Rec Res(Km2) (frac) (m) () () (rbstb) (MMstb) (frac) (MMstb)
Source 70 Trap 75
Seal 90 Mig 85 Low 12 1 20 11 68 231 187 025 58
Res Pres 80 Res Eff 50 Best 17 2 35 14 75 183 416 032 133
50 32 High 25 3 60 17 83 151 911 040 303
COS 16 Deterministic inputs probabilistic STOIIP and Rec Resource Mean 163
Four way dip closed anticlinal structure The SS-2 interval has a
gross thickness over the crest area of 830 m The prospective
reservoir has been interpreted as a stacked series of channellobe
sets Seals to deeper reservoirs may be eroded by overlying
reservoirs
Seismic Line Top Structure Map
2010 Migration Velocity Data ndashSS-2 Probability Above Spill
Enclosure 25 Summary Description Sheet
Summary - SS - 1Block A1
Working Interest () 60
Fluid Oil
Crest (m) 5970 (3750 bml)
Water depth (m) 2220
Notes
Play Risk Prospect Risk Area Stack F Net Porosity SO Bo STOIIP Rf Rec Res(Km2) (frac) (m) () () (rbstb) (MMstb) (frac) (MMstb)
Source 70 Trap 65
Seal 90 Mig 80 Low 17 1 20 8 50 249 158 015 34
Res Pres 80 Res Eff 50 Best 30 2 35 11 60 196 399 024 98
50 26 High 54 3 60 13 70 162 997 040 276
COS 13 Deterministic inputs probabilistic STOIIP and Rec Resource Mean 135
Four way dip closed anticlinal structureThe SS-1 interval has a
gross thickness over the crest area of 890 m The prospective
reservoir lies under an unconformity and is believed to be Jurassic
in age its seismic character suggests a channel amp channel-levee
complex Regional porosity trends indicate low porosities are likely
to be encountered if hydrostatic pressures are assumed
Seismic Line Top Structure Map
2010 Migration Velocity Data ndash SS-1 Probability Above Spill
Enclosure 31 Summary Description Sheet
SummaryBlock SL-03
APCL Interest () 90
Fluid Oil
Crest (m ss) 5400
Water depth (m) 3300
Notes
Play Risk Prospect Risk Area Areal NG Net Porosity SO Bo STOIIP Rf Rec Res(km2) (frac) (m) () () (rbstb) (MMstb) (frac) (MMstb)
Source 80 Trap 50
Seal 90 Mig 70 Low 11 070 29 15 73 205 218 030 79
Res Pres 90 Res Eff 80 Best 32 082 56 18 80 162 755 038 278
65 28 High 92 094 83 21 88 134 2473 045 938
COS 18 Mean 434
Altair is a Turonian turbidite channel prospects within the
SL-03 Block offshore Sierra Leone It is identified as a
stratigraphic trap with areal extents defined by amplitude
truncation and structural pinchout Recent discoveries in
nearby blocks confirm a working hydrocarbon system
(Venus-B1 Jupiter-1 and Mercury-1) The Sierra Leone
wells A-1 and A1-2 proved good reservoir and potential
source rocks Two distinct canyon systems feed erosive
channels at the break of slope An area net approach was
adopted using a pseudo-gradient volume SNA extraction to
constrain areal extent and define an areal NG to account
for lateral variability of sand distribution within the
reservoir
Arbitrary Dip Line Grad TWTGrad NRMS Extraction
Enclosure 41 Summary Description Sheet
SummaryBlock CI-513
APCL Interest () 90
Fluid Oil
Crest (m ss) 4200
Water depth (m) 2500
Notes
Play Risk Prospect Risk Area Areal NG Net Porosity SO Bo STOIIP Rf Rec Res(km2) (frac) (m) () () (rbstb) (MMstb) (frac) (MMstb)
Source 60 Trap 50
Seal 90 Mig 70 Low 11 070 20 17 73 181 179 030 65
Res Pres 90 Res Eff 80 Best 40 085 38 20 80 149 815 038 302
49 28 High 149 099 55 23 88 126 3474 045 1318
COS 14 Mean 569
Ayame is an Upper Cretaceous fan which mainly lies
ZLWKLQEORFNampRIIVKRUHampRWHparaYRLUHWLVLGHQWLILHGas a stratigraphic trap with areal extents defined by
amplitude truncation and structural pinchout The prospect
has very good amplitude support An area net approach
was adopted using pseudo-gradient volume SNA NRMS
extractions to constrain areal extent and define an areal
NG to account for lateral variability of sand distribution
within the reservoir for low and high case area polygons
These seismically defined polygons were then filled to
column heights of 200m and 800m respectively and used
to constrain the P90 and P10 area inputs of our
probabilistic simulation
Seismic Line
TWT Grad SNA Extraction
Ayame
Ayame West
dtdƐͿ
Ayame
Enclosure 42 Summary Description Sheet
SummaryBlock CI-513 amp Open
APCL Interest () 90 in CI-513
Fluid Oil
Crest (m ss) 4900
Water depth (m) 2700
Notes
Play Risk Prospect Risk Area Areal NG Net Porosity SO Bo STOIIP Rf Rec Res(km2) (frac) (m) () () (rbstb) (MMstb) (frac) (MMstb)
Source 60 Trap 50
Seal 90 Mig 70 Low 10 061 25 14 73 194 161 030 58
Res Pres 90 Res Eff 80 Best 30 080 47 18 80 159 585 038 216
49 28 High 93 099 69 21 88 134 2085 045 788
COS 14 Mean 352
A second prospect within the same reservoir interval was
identified and volumetrically assessed Ayame West is
separated from Ayame by a structural high isopach
thinning and amplitude dimming The prospect was
assessed in the same manner as Ayame with a but with
Low Case column height of 600m filling down to the point
at which amplitudes between the two fans brighten
allowing possible communication The upper end of the
Ayame West fan lies down-dip of Ayame and less than
1km away from the thinning low amplitude saddle between
the two prospects
Seismic Line
TWT Grad SNA Extraction
Ayame
West
Ayame West
dtdƐͿ
Ayame
Enclosure 43 Summary Description Sheet
SummaryBlock CI-513 CI-509
APCL Interest () 90 of CI-513
Fluid Oil
Crest (m ss) 4400
Water depth (m) 2500
Notes
Play Risk Prospect Risk Area Areal NG Net Porosity SO Bo STOIIP Rf Rec Res(km2) (frac) (m) () () (rbstb) (MMstb) (frac) (MMstb)
Source 60 Trap 40
Seal 90 Mig 70 Low 6 070 15 16 73 185 71 030 26
Res Pres 90 Res Eff 70 Best 23 084 28 19 80 152 320 038 118
49 20 High 92 098 42 22 88 129 1408 045 521
COS 10 Mean 237
This sheet refers to volumes associated with Blocks 513 and CI-509 Sassandra is an Upper Cretaceous fan
which straddles blocks CI-513 and CI-509 It is identified
as a stratigraphic trap with areal extents defined by
amplitude truncation and structural pinchout A single
target reservoir is identified within the Turonian The
prospect has good amplitude support An area times net
approach was adopted using a pseudo-gradient volume
NRMS extraction to constrain prospect size Angle stacks
were not available outside of Block CI-513 so an RMS
extraction on the full stack volume was used to determine
NW extent In our low case we restrict the area of the
accumulation to the brightest area of anomalous
amplitudes Our high case extends the prospect down-dip
Arbitrary Dip Line Grad TWT
Full Stack - RMS Extraction
Sassandra
dtdƐͿ
Enclosure 44 Summary Description Sheet
SummaryBlock CI-513
APCL Interest () 90
Fluid Oil
Crest (m ss) 3900
Water depth (m) 2500
Notes
Play Risk Prospect Risk Area Areal NG Net Porosity SO Bo STOIIP Rf Rec Res(km2) (frac) (m) () () (rbstb) (MMstb) (frac) (MMstb)
Source 60 Trap 40
Seal 90 Mig 70 Low 4 071 20 19 73 185 67 030 25
Res Pres 90 Res Eff 70 Best 13 085 38 22 80 152 281 038 104
49 20 High 46 099 55 25 88 129 1142 045 431
COS 10 Mean 190
Cavalla is an Upper Cretaceous Fan which lies between
the Ayame and Sassandra prospects of Block CI-513
RIIVKRUHampRWHparaYRLUHWLVLGHQWLILHGDVDVWUDWLJUDSKLFtrap with areal extents defined by amplitude truncation and
structural pinchout A single target reservoir is identified
within the TuronianCenomanian interval which lies
stratigraphically beneath the Ayame Prospect For the
amplitude analysis the top reservoir has been shifted up
30ms to bracket strong negative amplitudes on the
Gradient volume and the base reservoir has been shifted
up 50ms to remove Albian related amplitudes An area net
approach was adopted using pseudo-gradient volume SNA
NRMS extractions to constrain extent of the low and high
case area polygons These seismically defined polygons
were then filled to column heights of 200m and 800m
respectively
Arbitrary Dip Line Grad TWT Grad NRMS Extraction
Cavalla
dtdƐͿ
Enclosure 45 Summary Description Sheet
SummaryBlock CI-509
APCL Interest () 90
Fluid Oil
Crest (m ss) 3700
Water depth (m) 2500
Notes
Play Risk Prospect Risk Area Areal NG Net Porosity SO Bo STOIIP Rf Rec Res(km2) (frac) (m) () () (rbstb) (MMstb) (frac) (MMstb)
Source 60 Trap 60
Seal 90 Mig 70 Low 5 076 39 21 73 150 252 015 55
Res Pres 90 Res Eff 80 Best 18 088 75 24 80 134 997 028 258
49 34 High 61 100 111 27 88 121 3682 040 1039
COS 16 Mean 460
Leraba is an Upper Cretaceous fan It is identified as a
stratigraphic trap with extents defined by amplitude
truncation and structural pinchout The final processing
products and AvO volumes are yet to be delivered for CI-
KRZHYHUWKHmicroHRWUDFHUDZPLJUDWLRQVWDFNparaYROXPHLVof high quality and is deemed suitable for deriving a
volumetric range for Leraba An area net approach was
adopted using an RMS extraction to constrain extent and
define an areal NG to account for lateral variability of sand
distribution In our low case we restrict the area to the
brightest area of anomalous amplitudes Our high case
extends the prospect down-dip and SW to include a
secondary channel system
Arbitrary Dip Line TWT Full Stack RMS Extraction
Leraba
dtdƐͿ
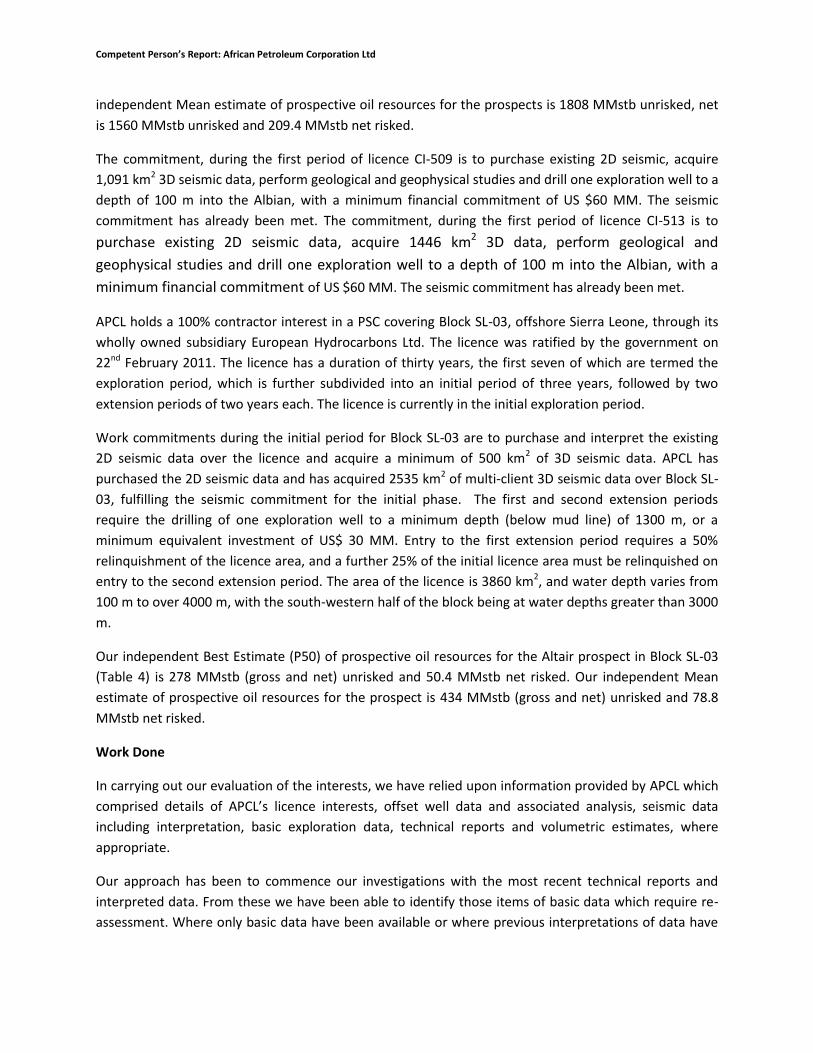
Competent Personrsquos Report African Petroleum Corporation Ltd
been considered incomplete we have undertaken our own interpretation A site visit was not undertaken
In estimating petroleum in place and recoverable we have used the standard techniques of prospect analysis These techniques combine geophysical and geological knowledge with assessments of porosity and permeability distributions fluid characteristics and reservoir pressure There is uncertainty in the measurement and interpretation of basic data We have estimated the degree of this uncertainty and have used statistical methods to calculate the range of petroleum initially in place and recoverable
We have estimated the chance of success for drilling the identified exploration prospects using the industry standard approach of assessing the likelihood of source rock charge reservoir trap and seal The result is the chance or probability of discovering hydrocarbons in sufficient quantity and which test at a sufficient rate to permit consideration for subsequent appraisal and development
The nomenclature used in this report is presented in Appendix 2
Professional Qualifications
ERC Equipoise is an independent consultancy specialising in petroleum reservoir evaluation Except for the provision of professional services on a fee basis ERC Equipoise has no commercial arrangement with any other person or company involved in the interests that are the subject of this report
The work has been supervised by Dr Adam Law Geoscience Director of ERCE a post-graduate in Geology a Fellow of the Geological Society and a member of the Society of Petroleum Evaluation Engineers He has 18 years relevant experience in the evaluation of oil and gas fields and exploration acreage preparation of development plans and assessment of reserves and resources
Yours faithfully
ERC Equipoise Limited
Adam Law
Geoscience Director
Competent Personrsquos Report African Petroleum Corporation Ltd
Table 1 STOIIP and Prospective Oil Resources Liberia Blocks 8 and 9
Table 2 STOIIP and Prospective Oil Resources - Alhamdulilah and Prospect M - Gambia
APCL Interest
Prospect Risk
Play Risk
Low Best High Mean Low Best High Mean () Low Best High Mean () () Low Best High MeanBarbet Turonian 166 500 1479 718 60 186 558 270 100 60 186 558 270 22 1 22 13 41 123 59
Campanian 177 461 1187 609 63 172 448 229 100 63 172 448 229 27 1 27 17 46 122 62Turonian 107 307 863 429 39 115 327 162 100 39 115 327 162 19 1 19 7 22 62 31
Cenomanian 91 264 779 376 33 99 294 141 100 33 99 294 141 18 1 18 6 18 53 25Blue Horizon 68 293 1218 536 25 109 456 201 100 25 109 456 201 20 1 20 5 22 91 40Pink Horizon 59 262 1066 474 22 96 400 178 100 22 96 1070 178 20 1 20 4 19 214 36
Green Horizon 48 210 896 399 18 78 337 150 100 18 78 337 150 20 1 20 4 16 67 30Night Heron Turonian 254 1117 4603 1904 92 416 1742 759 100 87 356 1338 650 144 1 144 13 51 193 94
Wildbird Light Blue Horizon 552 2289 8700 3946 144 605 2377 1065 100 144 605 2377 1065 38 24 9 13 54 214 96Total 1522 5704 20791 9392 497 1875 6940 3155 492 1815 7205 3046 82 289 1139 473
ReservoirProspect
Sunbird
Unrisked Prospective Resource (MMstb)STOIIP (MMStb) Net Unrisked Prospective Resource (MMstb) COS () Net Risked Prospective Resource (MMstb)
Lovebird (Isopach)
Low Best High Low Best High Mean Low Best High Mean Low Best High Mean
(MMstb) (MMstb) (MMstb) (MMstb) (MMstb) (MMstb) (MMstb) (MMstb) (MMstb) (MMstb) (MMstb) (MMstb) (MMstb) (MMstb) (MMstb)
A1 SS4 Cretaceous 43 113 295 16 42 112 56 60 9 25 67 34 50 34 17 16 43 115 58
A1 SS3 Cretaceous 197 417 881 63 143 316 173 60 38 86 189 104 50 32 16 60 138 304 167
A1 SS2 Cretaceous 187 416 911 58 133 303 163 60 35 80 182 98 50 32 16 56 128 292 157
A1 SS1 Jurassic 158 399 997 34 98 276 135 60 21 59 166 81 50 26 13 27 77 217 106
A1 M Aptian 82 231 629 13 43 141 66 60 8 26 85 40 28 35 10 07 25 82 38
666 1577 3713 183 459 1148 593 110 275 689 356 17 411 1010 526 Total
Net Risked Prospective Resource APCL
Interest ()
Net Unrisked Prospective Resource Prospect
RiskPlay Risk Block Prospect Reservoir
STOIIP Unrisked Prospective Resource
COS ()
Competent Personrsquos Report African Petroleum Corporation Ltd
Table 3 STOIIP and Prospective Oil Resources ndash Cote DrsquoIvoire
Table 4 STOIIP and Prospective Oil Resources - Sierra Leone
Low Best High Low Best High Mean Low Best High Mean Low Best High Mean
(MMstb) (MMstb) (MMstb) (MMstb) (MMstb) (MMstb) (MMstb) (MMstb) (MMstb) (MMstb) (MMstb) (MMstb) (MMstb) (MMstb) (MMstb)
CI-513 AyameUpper
Cretaceous179 815 3474 65 302 1318 569 90 58 267 1138 502 49 28 14 80 363 1549 683
CI-513 Ayame WestUpper
Cretaceous161 585 2085 58 216 788 352 90 52 183 626 298 49 28 14 71 249 852 406
CI-513 Sassandra Upper
Cretaceous71 320 1408 26 118 521 237 90 23 87 300 175 49 20 10 22 83 286 166
CI-513 CavallaUpper
Cretaceous67 281 1142 25 104 431 190 90 22 93 388 171 49 20 10 21 89 370 163
CI-509 LerabaUpper
Cretaceous252 997 3682 55 258 1039 460 90 50 232 935 414 49 34 16 82 380 1527 676
731 2998 11792 229 999 4097 1808 206 863 3387 1560 275 1164 4583 2094TOTAL
COS ()
Net Risked Prospective Resource
Interest ()
Net Unrisked Prospective Resource
Block Prospect Reservoir
STOIIP Unrisked Prospective ResourcePlay Risk
()Prospect Risk ()
Low Best High Low Best High Mean Low Best High Mean Low Best High Mean
(MMstb) (MMstb) (MMstb) (MMstb) (MMstb) (MMstb) (MMstb) (MMstb) (MMstb) (MMstb) (MMstb) (MMstb) (MMstb) (MMstb) (MMstb)
SL-03 AltairUpper
Cretaceous218 755 2473 79 278 938 434 100 79 278 938 434 65 28 18 144 504 1702 788
Table 4 STOIIP and Prospective Oil Resources - Sierra Leone
Block Prospect Reservoir
STOIIP Unrisked Prospective ResourcePlay Risk
()Prospect Risk ()
COS ()
Net Risked Prospective Resource
Interest ()
Net Unrisked Prospective Resource
Competent Personrsquos Report
African Petroleum Corporation Limited
PREPARED FOR African Petroleum Corporation Limited
BY ERC Equipoise Limited
June 2013
Competent Personrsquos Report African Petroleum Corporation Limited
June 2013
Authors Adam Law Michael Braim Glyn Pugh Kate Overy Don Munn
Approved by Simon McDonald
Date released to client June 25 2013
ERC Equipoise Limited (ldquoERC13 Equipoiserdquo13 or13 ldquoERCErdquo) has made every effort to ensure that the interpretations conclusions and recommendations presented herein are accurate and reliable in accordance with good industry practice ERC Equipoise does not however guarantee the correctness of any such interpretations and shall not be liable or responsible for any loss costs damages or expenses incurred or sustained by anyone resulting from any interpretation or recommendation made by any of its officers agents or employees
Competent Personrsquos Report African Petroleum Corporation Limited
June 2013
Table of Contents 1 Introduction 14
11 Liberia PSC Overview 16
12 Gambia PSC Review 17
13 Senegal PSC Review 18
14 Sierra Leone PSC Review 19
15 Cote drsquoIvoire PSC Review 21
16 Evaluation Methodology Prospective Resources 22
2 Liberia Prospectivity and Plays 26
21 Introduction 26
22 Well and Seismic Database 27
23 Plays and Petroleum Geology Blocks 8 and 9 29
24 Play and Prospect Risk Liberia Blocks 8 and 9 31
25 Liberia Blocks 8 and 9 Leads and Prospects 33
251 Barbet Prospect 34
252 Sunbird Canyon Prospect 36
253 Night Heron 39
254 Lovebird Prospect 42
255 Wildbird Prospect 44
3 Gambia Prospectivity and Plays 47
31 Introduction 47
32 Well and Seismic Database 48
33 Plays and Petroleum Geology Blocks A1 and A4 49
34 Play Risk 51
35 Gambia Leads and Prospects 53
351 Alhamdulilah Prospect 54
352 Prospect M 57
4 Sierra Leone Prospectivity and Plays 59
41 Play Risk 62
41 Sierra Leone Leads and Prospects 62
Competent Personrsquos Report African Petroleum Corporation Limited
June 2013
411 Altair 62
5 Cote drsquoIvoire Prospectivity and Plays 65
51 Introduction 65
52 Well and Seismic Database 66
53 Plays and Petroleum Geology Blocks CI-509 and CI-513 67
54 Play Risk 68
55 Cote drsquoIvoire Blocks CI-509 and CI-503 Leads and Prospects 69
551 Ayame amp Ayame West 69
552 Sassandra 71
553 Cavalla 73
554 Leraba 75
6 Senegal Prospectivity and Plays 78
7 Appendix 1 SPE PRMS Guidelines 80
8 Appendix 2 Nomenclature 89
81 Units 89
82 Reserves and Resources Classifications 89
83 Abbreviations 89
Enclosures Resource Summary Sheets 91
Competent Personrsquos Report African Petroleum Corporation Limited
June 2013
List of Tables Table 11 Licence Summary Table 15 Table 12 Estimated oil recovery factors from producing Atlantic Margin fields 24 Table 13 Play and prospect risk system 24 Table 21 Play risk Cretaceous carbonate play Liberia Blocks 8 and 9 32 Table 31 Play risk Gambia Blocks A1 and A4 52 Table 41 Play risk Sierra Leone Block SL-03 62 Table 51 Play risk Cote drsquoIvoire Blocks CI-509 and CI-513 68
Competent Personrsquos Report African Petroleum Corporation Limited
June 2013
List of Figures Figure 1-1 Location of APCL licences West Africa 14 Figure 1-2 Location of Liberia Blocks 8 and 9 16 Figure 1-3 Location of Gambia Blocks A1 and A4 17 Figure 1-4 Location of Senegal ROP and SOSP Licences 18 Figure 1-5 Location of Blocks SL-03 and SL-04A 20 Figure 1-6 Location of Blocks CI-509 and CI-513 21 Figure 2-1 Notable discoveries West Africa offshore 27 Figure 2-2 Well and seismic database Liberia Blocks 8 and 9 28 Figure 2-3 Petroleum systems and plays Liberia Blocks 8 and 9 30 Figure 2-4 Porositydepth trend published West Africa turbidite reservoirs 31 Figure 2-5 Leads and Prospects Liberia Blocks 8 and 9 33 Figure 2-6 Seismic line (depth) over the Barbet prospect 34 Figure 2-7 Barbet far offset amplitudes with Top Turonian depth contours (m TVDSS) 35 Figure 2-8 Regional seismic line along axis of the Sunbird canyon system 36 Figure 2-9 Sunbird Campanian far offset amplitudes with Cenomanian depth contours (m TVDSS) 37 Figure 2-10 Sunbird Turonian far offset amplitudes with Top Turonian depth contours (m TVDSS) 38 Figure 2-11 Sunbird Cenomanian far offset amplitudes with Cenomanian depth contours (m TVDSS) 39 Figure 2-12 Arbitrary line across Night Heron PSDM (Depth m) 40 Figure 2-14 SNA from Basin Floor Fan Isopach (m) - PSDM 41 Figure 2-15 Seismic line over the Lovebird prospect 42 Figure 2-16 Lovebird prospect Top Pink horizon depth (mss) high case 43 Figure 2-17 Seismic line and prospect geo-seismic sketch Wildbird prospect 45 Figure 2-18 Wildbird Top Reservoir depth map (m TVDSS) Spill point - green contour 46 Figure 3-1 Plays Gambia Blocks A1 and A4 47 Figure 3-2 Wells 2D and 3D seismic data (red outline) Gambia Blocks A1 and A4 48 Figure 3-3 Well to seismic tie ndash Well Jammah-1 to the Alhamdulilah prospect 50 Figure 3-4 Leads and prospects identified by APCL in Gambia Blocks A1 and A4 53 Figure 3-5 Seismic line over the Alhamdulilah prospect 54 Figure 3-6 Area of closure Alhamdulilah prospect layers SS1 to SS4 55 Figure 3-7Alhamdulilah prospect seismic facies interpretation Cretaceous intervals 56 Figure 3-8 Seismic line through Prospect M 57 Figure 3-9 Low and high case closure Prospect M top Aptian depth (m TVDSS) 58 Figure 4-1 Offshore licences and discoveries Liberia and Sierra Leone 59 Figure 4-2 Well and seismic database offshore Sierra Leone 60 Figure 4-3 Leads Sierra Leone Block SL-03 61 Figure 4-4 Dip seismic line (full offsets) Altair prospect 63 Figure 4-5 Seismic amplitude (gradient stack) and Top Turonian depth (m TVDSS) Altair prospect 64 Figure 5-1 CI-509 and CI-513 Prospects and Leads offshore Cote drsquoIvoire 65
Competent Personrsquos Report African Petroleum Corporation Limited
June 2013
Figure 5-2 Petroleum systems and plays offshore Cote drsquoIvoire 66 Figure 5-3 Well and seismic database offshore Sierra Leone 67 Figure 5-4 Strike Line Ayame and Ayame West prospects 69 Figure 5-5 Ayame Seismic amplitude (gradient stack) and Top Turonian depth (m TVDSS) 70 Figure 5-6 Dip seismic line Sassandra prospect 71 Figure 5-7 Sassandra prospect Seismic amplitude and Top Turonian depth (m TVDSS) 72 Figure 5-8 Dip seismic line Cavalla prospect 74 Figure 5-9 Seismic amplitude (gradient stack) and Top fan depth (m TVDSS) Cavalla prospect 75 Figure 5-10 Dip seismic line Leraba prospect 76 Figure 5-11 Seismic amplitudes Leraba prospect 77 Figure 6-1 Petroleum systems and plays offshore Senegal 78 Figure 6-2 leads offshore Senegal Blocks ROP and SOSP 79
Competent Personrsquos Report African Petroleum Corporation Limited
June 2013 14
1 Introduction
At the time of writing African Petroleum Corporation Limited (APCL) holds interests in and operates exploration licences offshore West Africa within the territorial waters of Senegal the Gambia Sierra Leone Liberia and Cote drsquoIvoire (Figure 1-1) The status of these licences is summarised in Table 11 below ERC Equipoise Ltd (ERCE) has reviewed the prospectivity of these licences using data as of 31st May 2013
Figure 1-1 Location of APCL licences West Africa
Currently prospective resources are identified by APCL within the Liberia Gambia Sierra Leone and Cote drsquoIvoire licences We have made independent estimates of prospective resources and geological chance of success for certain prospects within these countries which are identified by APCL as near-term drilling opportunities The evaluation of the offshore Senegal licences is on-going and no prospects have been identified as of the date of this report We summarise qualitatively the prospectivity of the licences held by APCL in this country
Competent Personrsquos Report African Petroleum Corporation Limited
June 2013 15
Country Block Licence
Operator APCL () Status
Licence
Area (km2)
Outstanding Commitment in this Phase
Start of Current Phase
End of Current Phase
Liberia 8 APCL 100 Expl June 2012
June 2014
2717 Two
Exploration wells
Liberia 9 APCL 100 Expl June 2012
June 2014
2634 None
Gambia A1 APCL 60 Expl Dec
2007 Dec
2013 1296
One Exploration
well 1
Gambia A4 APCL 60 Expl Dec
2007 Dec
2013 1376 (see A1)
Senegal Rufisque Offshore Profond
APCL 90 Expl Oct
2011 Oct
2015 10357
One exploration
well
Senegal
Senegal Offshore
Sud Profond
APCL 90 Expl Oct
2011 Oct
2014 7920 None
Sierra Leone
SL-03 APCL 100 Expl Feb
2011 Feb
2014 3860 None
Sierra Leone
SL-04A APCL 100 Expl Sept 2012
Sept 2015
1995 One
exploration well 2
Cote drsquoIvoire
CI-509 APCL 90 Expl March 2012
March 2015
1091 One
exploration well
Cote drsquoIvoire
CI-513 APCL 90 Expl Dec
2011 Dec
2014 1446
One exploration
well
1) Transferrable to Block A4 if necessary 2) Contingent on results of 3D and that technology is available to drill in such water depths
Table 11 Licence Summary Table
Competent Personrsquos Report African Petroleum Corporation Limited
June 2013 16
11Liberia PSC Overview
APCL holds a 100 contractor interest in a Production Sharing Contract (ldquoPSCrdquo) covering Blocks 8 amp 9 offshore Liberia (Figure 1-2) Both blocks are in their second exploration period which began on 12th June 2012 and lasts for two years Commitments during the second phase in Block 8 are two exploration wells (to a minimum depth of 2000 meters) as a well commitment from the first exploration phase has been carried into the second phase All commitments have been met for the second phase in Block 9 with the drilling of Well Bee Eater-1 The minimum spend for each block in the second exploration period is US$ 10 MM At the end of this second phase a further 25 of each licence must be relinquished
Figure 1-2 Location of Liberia Blocks 8 and 9
For each block there is one further optional exploration period of two years that can be entered into with an additional well (to a minimum of 2000 metres) being required in each block in each period At the end of the third period all areas not retained for appraisal and development are to be relinquished There are also provisions for an appraisal period and an exploitation period of 25 years (with an additional term of 10 years if necessary) for each development area
Competent Personrsquos Report African Petroleum Corporation Limited
June 2013 17
Following a 25 relinquishment at the end of the first exploration phase Block 8 comprises an area of 2717 km2 and Block 9 comprises 2634 km2 Water depths range from less than 100 m to over 3000 m Most of the block areas lie in water depths greater than 500 m
12Gambia PSC Review
APCL holds a 60 contractor interest in Production Sharing Contracts covering Blocks A1 and A4 offshore Gambia (Figure 1-3) with Buried Hill Gambia BV holding the remaining 40 The licences were signed on 8th September 2006 with an effective date of 31st December 2007 and following two extensions they are still currently in the first exploration period which runs through to 31 December 2013
The work commitment during the first period comprises 1000 km2 of 3D seismic data in Block A1 and 750 km2 of 3D seismic data in Block A4 and one well which may be drilled in either block The seismic commitment has already been met
There are two further optional (but automatic) exploration periods of three years each that can be entered into with a well being required in each period in each licence Furthermore in Block A1 relinquishment of 10 of the licence area is required at the end of the first exploration period and 20 at the end of the second period In Block A4 relinquishment of 10 of the licence area is required at the end of the first exploration period In both blocks at the end of the third period all areas not retained for appraisal and development are to be relinquished There are also provisions for an exploitation period with the total term of the licences being 30 years (including the exploration periods) for each development area
The area of the licence is 1296 km2 for Block A1 and 1376 km2 for Block A4 Water depths vary from 500 m to over 3000 m
Figure 1-3 Location of Gambia Blocks A1 and A4
Competent Personrsquos Report African Petroleum Corporation Limited
June 2013 18
13Senegal PSC Review
APCL holds a 90 contractor interest in Exploration and Production Sharing Contracts (EPSC) covering Blocks Rufisque Offshore Profond (ROP) and Senegal Offshore Sud Profonde (SOSP) offshore Senegal (Figure 1-4) via its wholly owned subsidiary African Petroleum Senegal Limited Petrosen the state oil company hold a 10 carried interest
The EPSC governing block SOSP has an effective date of 25th October 2011 The first 85 years of the EPSC are termed the exploration phase which is subdivided into an initial period of three years with two subsequent extension periods of three and two and a half years each Work commitment in the initial exploration period is to acquire and reprocess the existing seismic data within the licence area and also to acquire a further 2500 km2 of 3D seismic data all with a minimum investment of US$ 10 MM The two extension periods have a commitment of one exploration well to a minimum depth of 3500 mss in each period or a minimum investment of US$ 20 MM Entry to the first extension period requires a 30 relinquishment of the licence area and a further 20 of the initial licence area must be relinquished on entry to the third phase The area of the licence is currently 7920 km2 Water depth is between 1000 and 4000 m over the block
Figure 1-4 Location of Senegal ROP and SOSP Licences
Competent Personrsquos Report African Petroleum Corporation Limited
June 2013 19
The EPSC governing Block ROP is of similar structure to that governing Block SOSP It has an effective date of 25th October 2011 The first eight years of the EPSC are termed the exploration phase which is subdivided into an initial period of four years with two subsequent extension periods of two years each Work commitment in the initial exploration period is to acquire the existing seismic data within the licence area for a minimum of US$ 2 MM and drill one exploration well to a minimum depth of 3500 m TVDSS or a minimum investment of US$ 20 MM The two extension periods have a further commitment of one exploration well to a minimum depth of 3500 m TVDSS in each period or a minimum investment of US$ 20 MM Entry to the first extension period requires a 30 relinquishment of the licence area and a further 20 of the initial licence area must be relinquished on entry to the third period The area of the licence is currently 10357 km2 Water depth is between 1500 and 3000 m over the block
APCL has met the seismic commitment of the first exploration period
Petrosen has a back-in right if an exploitation period is authorised for up to 20 of the licence subject to contribution of its share of forward costs (excluding training) The duration of an exploitation period is 25 years from authorisation with option for two ten year extensions at the discretion of the state
14Sierra Leone PSC Review
APCL holds a 100 contractor interest in a PSC covering Block SL-03 offshore Sierra Leone (Figure 1-5) through its wholly owned subsidiary European Hydrocarbons Ltd The licence was awarded on 23rd April 2010 and ratified on 22nd February 2011 APCL also holds a 100 contractor interest in a PSC covering Block SL-04A through its wholly owned subsidiary African Petroleum Sierra Leone Ltd The PSC governing Block SL-04A was ratified on 21st September 2012
The SL-03 licence has a duration of thirty years the first seven of which are termed the exploration period which is further subdivided into an initial period of three years followed by two extension periods of two years each The licence is currently in the initial exploration period
Work commitments during the initial period for Block SL-03 are to purchase and interpret the existing 2D seismic data over the licence and acquire a minimum of 500 km2 of 3D seismic data APCL has purchased the 2D seismic data and has acquired 2535 km2 of multi-client 3D seismic data over Block SL-03 fulfilling the seismic commitment for the initial phase The first and second extension periods require the drilling of one exploration well to a minimum depth (below mud line) of 1300 m or a minimum equivalent investment of US$ 30 MM Entry to the first extension period requires a 50 relinquishment of the licence area and a further 25 of the initial licence area must be relinquished on entry to the second extension period The area of the licence is 3860 km2 and water depth varies from 100m to over 4000m with the south-western half of the block being at water depths greater than 3000m
Competent Personrsquos Report African Petroleum Corporation Limited
June 2013 20
Figure 1-5 Location of Blocks SL-03 and SL-04A
The PSC covering Block SL-04A was ratified on 21st September 2012 The licence term is for thirty years the first seven years of which are defined as the exploration period which is further subdivided into an initial period of three years and two subsequent periods of two years Each well drilled in the initial exploration period extends this period by three months Work commitments during the initial phase are to acquire at least 1500 km2 of 3D seismic data and drill one exploration well (to a minimum depth of 2500m) contingent on the results of the 3D and the availability of drilling technology for such deep water The minimum equivalent investment is US$ 10 MM In 2011 TGS acquired 1085 km2 of multi-client 3D seismic data over Block SL-04A Upon licencing these data APCL will have fulfilled the seismic commitment for the initial phase
The subsequent two exploration periods require the drilling of one exploration well in each period (to a minimum depth of 2500 m) or a minimum investment of US$ 50 MM Entry to the second period requires a 50 relinquishment of the licence area and a further 25 of the initial licence area must be relinquished on entry to the third phase The area of the licence is currently 1995 km2 Water depth is between 3000 and 4000 m over the block
Competent Personrsquos Report African Petroleum Corporation Limited
June 2013 21
The state retains the right to a 10 carried interest during any development phase in both licences with the option to acquire a further 5 by covering an equivalent proportion of any development costs
15Cote13 drsquoIvoire13 PSC13 Review
APCL holds a 90 per cent contractor interest in two PSCs governing Block CI-509 and Block CI-513 offshore Cote drsquoIvoire (Figure 1-6) via its wholly owned subsidiary African Petroleum Cote drsquoIvoire Limited The state oil company Petroci has a 10 carried interest
Figure 1-6 Location of Blocks CI-509 and CI-513
The PSC for Block CI-509 was awarded on 16th March 2012 The first eight years of the PSC are termed the exploration period which is further divided into three terms of three three and two years respectively The licence is currently in its first exploration term Work commitments during the first exploration term are to purchase the existing 2D seismic data acquire 1091 km2 (ie a block wide) 3D seismic survey and drill one exploration well at least 100 m into the Albian (Lower Cretaceous) section The minimum investment is US$ 60 MM The second and third terms have a further commitment to drill one exploration well to at least 100 m into the Albian (Lower Cretaceous) section with a minimum investment of US$ 50 MM Entry to the second term requires a 25 relinquishment of the licence area and a further 25 of the initial licence area must be relinquished on entry to the third term The area of the licence is currently 1091 km2 Water depth is between 1900 and 3250 m over the block
Competent Personrsquos Report African Petroleum Corporation Limited
June 2013 22
The PSC covering Block CI-513 has an effective date of 19th December 2011 It has a similar structure to that governing Block CI-509 The first seven years are termed the exploration period subdivided into three terms of three two and two years The licence is currently in its first exploration term Work commitments during the first exploration term are to purchase the existing 2D seismic data acquire 1446 km2 (ie a block wide) 3D seismic survey and drill one exploration well at least 100 m into the Albian (Lower Cretaceous) section The minimum investment is US$ 60 MM The second and third terms have a further commitment to drill one exploration well to at least 100 m into the Albian (Lower Cretaceous) section with a minimum investment of US$ 50 MM Entry to the second term requires a 25 relinquishment of the licence area and a further 25 of the initial licence area must be relinquished on entry to the third term The area under licence is currently 1446 km2 Water depth is between 900 and 3100 m over the block
The exploitation period of both licences is for 25 years subject to successful award in the event of a commercial discovery On development Petroci has the right to acquire an interest of up to 20 in each licence subject to payment of its portion of future costs
In October 2012 APCL completed acquisition of 4200 km2 of 3D seismic data covering blocks CI-508 CI-509 and CI-513 fulfilling the seismic work commitments of the first exploration phase of both PSCs APCL is planning a two well drilling programme for the licences during 2014
16Evaluation Methodology Prospective Resources
We have used probabilistic methods to evaluate selected prospects within Liberia Blocks 8 and 9 Gambia Blocks A1 and A4 Sierra Leone Block SL-03 and Cote drsquoIvoire Blocks CI-513 and CI-509 We classify the results of our simulation as Low Best and High estimates of prospective resources following the Petroleum Resources Management System or PRMS (Appendix 1) We have assigned geological chance of success to each of the prospects using the methodology described below Estimates are made for oil only although we recognise that due to the significant uncertainties in the available geological information that there is a possibility of gas charge in all licences We present a summary of input estimates output STOIIP and gross resources and geological chance of success as a resource summary sheet for each prospective interval investigated These can be found in the enclosures 11 to 45 in this document
Inputs to our probabilistic simulation are evaluated in a consistent manner For the structurally trapped prospective intervals in Liberia (the Lovebird and Wildbird prospects) and the Alhamdulilah prospect in Gambia we have made a low and high deterministic estimate of closing contour for each trap to reflect the uncertainty in both mapping and depth conversion For Liberia we use the gross-rock volume (GRV) derived in this manner to constrain the P90 and P10 of our GRV distribution in our probabilistic simulation For Gambia we have used the areal extents of the low and high cases as inputs to an area times net calculation
Competent Personrsquos Report African Petroleum Corporation Limited
June 2013 23
For the stratigraphically trapped prospects in Liberia (Barbet Night Heron and Sunbird) Cote drsquoIvoire (Sassandra Ayame Ayame West Cavalla and Leraba) and Sierra Leone (Altair) we have made low and high estimates of area of closure using both structural and amplitude support where possible We have then made low and high estimates of gross reservoir thickness derived from regional observations calibrated against seismic data where possible As such depositional systems also have laterally variable sand distributions often supported by seismic data we employ the concept of an areal net to gross ratio varying the percentage of sand areally within the overall stratigraphic trap based on the uncertainty in seismic amplitude strength Where appropriate a geological shape factor is used depending on trap shape and structural relief relative to reservoir thickness
Estimates of reservoir porosity and net to gross ratio are made with reference to regional data offset wells including recent drilling by APCL in Liberia and account for compaction and a degree of overpressure (Figure 2-4) We make low mid and high deterministic estimates and use these to constrain the P90 P50 and P10 inputs to a probabilistic simulation Inputs for hydrocarbon saturation are constrained in a similar manner with reference to regional porosity and permeability trends calibrated to APCLrsquos recent drilling results in Liberia
We have estimated oil formation volume factors for a range of gas oil ratios (GOR) (from an appropriate minimum to fully saturated) for each of the prospective intervals assuming 4oC at the mudline (seabed) and geothermal gradients between 25 and 35oC per 100 m consistent with regional observation and the available well data We assume that the minimum GOR will increase with depth below the mudline Our estimates are calibrated against the oil samples in Well Narina-1 when estimating resources for the Liberian prospects
Some degree of overpressure is accounted for as it has been in our estimates of porosity but by reference to offset discoveries we assume that it is unlikely to exceed 500 psi over the depth range investigated
Recovery factors for the clastic reservoirs are estimated with reference to published information from discoveries in similar reservoir types examples of which are tabulated below (Table 12) Based on this table we estimate low best and high recovery factors of 30 375 and 45 respectively Again these are used to constrain the P90 P50 and P10 of our input distribution during probabilistic simulation
Some prospects are deep relative to mud line and we expect reservoir quality to be reduced despite overpressure We reduce our recovery factor estimates accordingly where this is the case Some prospects are relatively shallow to mud line Where this is the case we model a more viscous oil (prospects materially less than 1500m below sea bed) and have reduced our low best and high recovery factor range to 15 275 and 40 respectively In all cases we assume that a development is able to effectively dispose of any associated gas
Recovery factors for the carbonate reservoirs of the Wildbird prospect in Liberia and Prospect M in the Gambia are estimated by reference to more regional analogues and are discussed in the relevant sections
Competent Personrsquos Report African Petroleum Corporation Limited
June 2013 24
Due to the early stage of exploration within APCLrsquos licences we have adopted a six component risk matrix in all areas barring Liberia to estimate geological chance of success (COS) separated into play and prospect specific risks (Table 13) We have adopted this form of presentation of COS to reflect the fact that deep water exploration in much of the West African Atlantic Margin is at a very early stage and also that a number of the identified prospects have risk dependence and thus can be grouped as a play
Table 12 Estimated oil recovery factors from producing Atlantic Margin fields
PLAY RISK PROSPECT RISK
SOURCE RESERVOIR SEAL TRAP CHARGE RESERVOIR (Presence and Maturity) (Presence) (Presence) (Definition and Efficacy) (Migration) (Efficacy) Incorporates trap definition and seal risk (including biodegradation risk where necessary)
Table 13 Play and prospect risk system
The play risk segment focuses solely on the elements required in a given play to make a hypothetical prospect successful source reflecting the presence and thermal maturity of available source rocks with sufficient generation and expulsion to charge prospects reservoir reflecting the presence regionally of geological intervals that could potentially contain reservoir rock and seal ndash the regional presence of a sealing formation with sufficient thickness and extent to trap hydrocarbons
Prospect risk is divided into three elements Commonly we present seal and trap risk combined as an overall illustration of the integrity of the container here labelled trap risk Charge risk reflects the risk to migration of hydrocarbons from the source rock into the prospect and reservoir risk reflects solely the efficacy (ie porosity and permeability) of any identified reservoir interval
Note that a successful well on a given prospect may reduce or remove the play risk should the well prove reservoir charge and seal in a given play This will have the effect of de-risking further prospects associated with that play
Country Field Start Date Np Max Water Depth Prod Ult
RecoveryRec
FactorRecovery
Prod STOIIP
(MMstb) (m) (MMstb) (MMstb) (MMstb)Eq Guinea Ceiba Nov-00 112 800 18 187 40 10 468Eq Guinea Zafiro Aug-96 652 850 62 1583 40 26 4008Angola Girassol Dec-01 332 1360 32 958 45 30 2129Angola Kuito Dec-99 133 410 36 650 46 18 1413Brasil Espadarte Aug-00 67 877 10 261 31 26 842Brasil Marlim Mar-91 1720 853 101 2878 33 28 8721Total 259 6517 17580Average - Arithmetic 39 23Average - Weighted by STOIIP Ult Rec 37 25
Low Best High30 375 45
Fields on Atlantic Margin with significant production
Hence RF Range
Competent Personrsquos Report African Petroleum Corporation Limited
June 2013 25
Recent drilling within Liberia Blocks 8 and 9 has de-risked the play As a result we adopt prospect specific risking alone as source reservoir trap and seal with the same definitions as described above (Table 13)
Competent Personrsquos Report African Petroleum Corporation Limited
June 2013 26
2 Liberia Prospectivity and Plays
21Introduction
All of the available deep-water acreage offshore Liberia-Sierra Leone basin is under licence (Figure 1-2) Regionally hydrocarbons have been discovered within sandstones at a number of stratigraphic levels from the pre-rift to early syn-rift Albian in Cote drsquoIvoire (Espoir Foxtrot fields and a number of other discoveries) to turbiditic sandstones that have Late Cretaceous (CenomanianTuronian MaastrichtianConiacian) to early Tertiary (Palaeocene to Eocene) ages Recent drilling offshore Ghana has yielded a number of discoveries within these Upper Cretaceous sandstones such as the Jubilee oil field and the Enyenra Tweneboa and Odum oil and gascondensate discoveries In the Liberia-Sierra Leone basin recent drilling has yielded six hydrocarbon discoveries (Bee Eater Narina Monterrado Mercury Venus and Jupiter) but as yet none has been declared commercial (Figure 2-1) Although reservoir quality in the Albian sandstones is variable reservoir quality in the Upper Cretaceous and Tertiary sandstones is often good Successful trap types encountered regionally are both structural and stratigraphic
Of significance to the evaluation of the petroleum systems of Blocks 8 and 9 APCL have drilled three wells within the deeper water parts of the blocks Wells Apalis-1 Narina-1 and Bee Eater-1 Well Apalis-1 found source rock intervals of Albian to Cenomanian age but failed to find the prognosed reservoir Well Narina-1 found light oil within deep-marine sandstones of Cretaceous age The sandstones were of variable reservoir quality as the well appears to have been drilled on the edge of a fan system which can be interpreted from seismic data The extent of the Turonian hydrocarbon bearing interval around Well Narina-1 is currently under investigation by APCL who are working with CGGV to reprocess the 3D multi-client seismic with the hope of identifying areas of favourable reservoir within closure
Well Bee Eater-1 completed in February 2013 also discovered hydrocarbons within similar sandstones of Cretaceous age However the oil bearing Turonian reservoir at Bee Eater is interpreted as being of very low permeability and hence non-commercial APCL interprets that Well Bee Eater-1 was drilled in a canyon system that may have been largely bypassed by sediment input
Both wells demonstrate the viability of Cretaceous petroleum systems within the licence area
Competent Personrsquos Report African Petroleum Corporation Limited
June 2013 27
Figure 2-1 Notable discoveries West Africa offshore
22Well and Seismic Database
Exploration offshore Liberia is at an early stage To date five wells have been drilled in the deeper water areas in 2011 and 2012 with historical exploration drilling (up to 1985) restricted to the more shelfal areas (Figure 2-2) Data from two of these shallow water wells Wells S3-1 and Cestos-1 were made available to us for this evaluation Well S3-1 encountered oil shows in sandstones of Late Cretaceous age
GhanaJubilee Field on
production development of TEN area discoveries
new Hess deepwater discoveries
Cote drsquoIvoireShallow water production
recent discoveries in deepwater Turonian
reservoirs
LiberiaOil discoveries in
Cretaceous deepwater reservoirs at Narina
Monserrado
Sierra LeoneVenus Mercury and Jupiter
oil and condensate discoveries in deepwater
reservoirs
Guinea-COil shows in
offshore wells
Guinea-BSinapa oil discovery
planned appraisal
AGCDome Flore area heavy oil
discoveries under development review
SenegalOnshore gas and condensate production Recent onshore
Turonian discovery
MauritaniaChinguetti Field
production other oil and gas discoveries under development review
Competent Personrsquos Report African Petroleum Corporation Limited
June 2013 28
Figure 2-2 Well and seismic database Liberia Blocks 8 and 9
APCL has drilled three exploration wells offshore Liberia in the deep water part of Block 9 Wells Narina-1 Bee Eater 1 and Apalis-1 (Figure 1-2 Figure 2-2) Well Apalis-1 was drilled in 2011 targeting a four-way dip-closed structure with possible AvO support The well found traces of hydrocarbons plus source rock intervals but the prognosed reservoir sands were absent at target depth and the well was plugged and abandoned
Well Narina-1 was drilled by APCL in 2012 and found 16 to 21 m of net pay (light oil) within sandstones of Turonian (Cretaceous) age Hydrocarbons were also discovered in the underlying Albian Oil samples were collected but no drill-stem testing was undertaken Analysis of the oil samples indicates an API
3D Seismic Area
Competent Personrsquos Report African Petroleum Corporation Limited
June 2013 29
gravity for the Turonian oil of about 38 degrees and about 45 degrees for the Albian hydrocarbons Mobilities from formation pressure measurements and permeability from side-wall core measurements show the reservoir to be of relatively low permeability at this location
Well Bee Eater-1 was drilled by APCL in January and February 2013 The well found oil-bearing sandstones of Cretaceous age but of very low permeability and hence the well is considered non-commercial Post-drill interpretation of the seismic data has helped APCL revise the depositional model for this Turonian fan system The Bee Eater-1 well is interpreted to have encountered a bypass zone in both the Turonian and Cenomanian with immature sandstones that are poorly sorted and tight Post-well mapping of key seismic events tied to Well Bee Eater-1 reveals the possibility of finding better quality sandstones in lsquobasin-floor fanrsquo units down-dip Potentially sealing shale units and source rock units were also found in the Bee-Eater-1 well
Well Apalis-1 and in particular Wells Bee Eater-1 and Narina-1 help de-risk seal and hydrocarbon charge for the Cretaceous play on-block
The primary seismic dataset for our evaluation was the recently acquired 5170 km2 of 3D seismic data over the deeper water area of Blocks 8 and 9 including certain products to review amplitude versus offset (AvO) effects These seismic data cover both recently drilled deep water wells In addition a grid of 2D seismic data was also made available with average line spacing of around 45 km These data provide a tie to Well S3-1 although the well lies some 200m from the nearest seismic line In general the data quality of the 3D volume is good and of suitable fidelity to enable us to undertake our review of identified prospectivity However local complexity in the shallow geology causes the signal to degrade considerably at the prospective levels in certain areas APCL are currently reprocessing these data in an attempt to improve signal quality APCL intend to utilise this dataset to update the CPR in the next 3-6 months It is hoped that these data will support maturation of additional prospects and further clarification of risk and volumes for prospects within this CPR
23Plays and Petroleum Geology Blocks 8 and 9
APCL has identified a number of plays within Blocks 8 and 9 at similar stratigraphic levels to those proven successful elsewhere along the West African margin (Figure 2-3) Recent drilling within Blocks 8 and 9 has demonstrated a working petroleum system within the mid to lower Cretaceous with drilling finding light oil within deep marine sandstones of Turonian age and also in sandstones of Albo-Aptian age
Competent Personrsquos Report African Petroleum Corporation Limited
June 2013 30
Figure 2-3 Petroleum systems and plays Liberia Blocks 8 and 9
Structural traps are identified at the pre-rift to early syn-rift (Albian) level as tilted fault blocks with hydrocarbons sourced from the Albian or Lower Cretaceous source rocks and seal provided by post-rift mud drape Structural and stratigraphic traps are also identified at several potential reservoir levels within the Late Cretaceous and Lower Tertiary again potentially sourced from the Turonian and or Albian source rocks Traps are sealed by coeval marine shales and muds As is encountered regionally there is reasonable seismic evidence for the presence of reservoir bearing intervals within the Upper Cretaceous and Early Tertiary section and this seismic evidence has been used in trap definition
The most significant play in the area is that of Cenomanian to Turonian age deep-marine channel-fan systems as structural and stratigraphic traps In addition an emerging lower Cretaceous microbial carbonate reservoir play has been identified sourced from coeval lacustrine source rocks and sealed by shales deposited during the subsequent drowning of the lacustrine systems by the onset of significant subsidence and marine inundation later in the Cretaceous We have evaluated prospects within both of these play systems Prospectivity in the shallower Cretaceous and Tertiary intervals is still being re-evaluated by APCL as of the date of this report and no leads have been matured to prospect status
Oil show Cestos-1
Competent Personrsquos Report African Petroleum Corporation Limited
June 2013 31
Figure 2-4 Porositydepth trend published West Africa turbidite reservoirs
24Play and Prospect Risk Liberia Blocks 8 and 9
Of the prospects reviewed all but the Wildbird prospect fall within the Cenomanian to Turonian channelfan play In our opinion recent drilling has de-risked source and reservoir presence for this play However reservoir quality in recent wells is variable In our risking of Cenomanian to Turonian prospectivity (Barbet Sunbird Lovebird and Night Heron prospects) we have removed the play element to our risking matrix and see a low risk to hydrocarbon charge for individual prospects Key risk is therefore to trap integrity and reservoir quality We use a four component risk matrix as outlined in Section 16 to define geological chance of success for these prospects
The Wildbird prospect has been recently identified by APCL as part of its review of further play fairways within the Liberian licences The play concept is of early Aptian bio-constructed carbonate build-ups within the restricted lacustrine environment that existed at this time Porosity and permeability within the bioclastic microbial limestones is potentially enhanced by hydrothermal activity resulting from the early rifting Later post-rift subsidence and drowning by marine conditions provides the top seal via the
0
500
1000
1500
2000
2500
3000
3500
4000
0 01 02 03 04m
Bel
ow S
eabe
dPorosity (fraction)
Porosity versus Depth Trend
Regional West AfricaTurbidite Data
Competent Personrsquos Report African Petroleum Corporation Limited
June 2013 32
deposition of Cretaceous marine muds It is envisaged that the play is charged or by Aptian source rocks deposited in the offset lagoonal facies with possible charge from later (but on-lapping) Cretaceous marine source rocks (as other plays on the blocks) Both potential source rocks provide lateral seal (Figure 2-16) Regionally lacustrine microbial carbonate reservoirs can be found in Congo and Angola where there is some production but also in the Campos and Santos basins in Brazil
The microbial carbonate play is emerging within Blocks 8 and 9 and has not been demonstrated to be effective by drilling We adopt the play and prospect risking as discussed in Section 16 to risk the Wildbird prospect as a result discounting biodegradation risk as the prospect is at significant depth Our estimate of play risk for the Cretaceous microbial carbonate play is summarized in below
PLAY Source Reservoir Presence Seal Play
Risk Cretaceous Carbonate 08 06 05 20
Table 21 Play risk Cretaceous carbonate play Liberia Blocks 8 and 9
Competent Personrsquos Report African Petroleum Corporation Limited
June 2013 33
25Liberia Blocks 8 and 9 Leads and Prospects
Following the drilling of Wells Narina-1 and Bee Eater-1 APCL is re-evaluating the prospectivity within Blocks 8 and 9 and has developed a number of potential traps (Figure 2-5) several of which (marked in orange Figure 2-5) have been matured to prospect status We have assessed the prospective resources for certain of these prospects that APCL has identified as viable near-term drilling opportunities Barbet Sunbird Lovebird Night Heron and Wildbird A number of the prospects have multiple reservoir targets Our evaluation of these prospects follows the methodology described in Section 16 The results of Wells Narina-1 and Bee Eater-1 would indicate that oil charge is probable and thus only oil cases have been evaluated However as we state in Section 16 a gas charge cannot be discounted due to the uncertainties in source rock evaluation and basin modelling Input parameters STOIIP prospective resources and geological chance of success for each of the evaluated prospects are summarised in Table 1 of this report and are also presented in the resource summary sheets as Enclosures 11 to 19 of this document
Figure 2-5 Leads and Prospects Liberia Blocks 8 and 9
Competent Personrsquos Report African Petroleum Corporation Limited
June 2013 34
ʹǤͷǤͳǤ Barbet Prospect
The Barbet prospect is identified as a stratigraphic trap around 14 km to the east of and up-dip from Well Narina-1 within Block 9 (Figure 2-6) A single target reservoir is mapped within the Turonian Seismic amplitude anomalies are also identified within the area of the trap that may provide support for reservoir development The Turonian is mapped at between 3000 and 3600 m TVDSS over the area of the prospect in a water depth of around 750 to 770 m
Figure 2-6 Seismic line - depth (m TVDSS) over the Barbet prospect
We have used an areanet pay methodology to estimate prospective resources for the Barbet prospect In our low case we restrict the area of the accumulation to the brightest area of anomalous amplitudes on the far offsets Our high case extends the prospect down-dip to include a larger area of anomalous amplitudes above an observed amplitude shut-off (Figure 2-7) These are used to constrain the P90 and P10 inputs of our probabilistic simulation These polygons approximate to an oil column height of 200 and 700 m respectively
Amplitudes are variable within the area of closure and we apply an areal net to gross ratio to better constrain sand distribution within the trap Gross reservoir thickness estimates are computed from the mapped seismic interval net to gross ratio from regional analogue and porosity from a regional porositydepth trend (Figure 2-4) Fluid parameters and recovery factors are estimated as described in Section 16
Narina-1 Barbet
Top Turonian
Top Cenomanian
Top Albian
Lwr Turonian (BFF)
Top Turonian
Narina-1
Apalis-1
Albian UC
0 km 2(mss)
W E
Competent Personrsquos Report African Petroleum Corporation Limited
June 2013 35
Figure 2-7 Barbet far offset amplitudes with Top Turonian depth contours (m TVDSS)
We have used the prospect risk matrix presented in Section 16 to determine the geological chance of success for the Barbet prospect Key risk to the Barbet prospect is to trapcontainment as the trap requires pinch-out of the reservoir in three directions to seal There is also a subsidiary risk to reservoir as the Turonian reservoir encountered in Well Narina-1 is of relatively poor quality which is countered by seismic evidence over the prospect to support reservoir development As a result we attribute a geological chance of success of 22 to the Barbet prospect
metres
P10
P90metres
APALIS-1
Competent Personrsquos Report African Petroleum Corporation Limited
June 2013 36
ʹǤͷǤʹǤ Sunbird Canyon Prospect
The Sunbird canyon prospect is also identified as a stratigraphic trap around 5 km to the south of Well Apalis-1 within Blocks 8 and 9 mapped as a large canyon system There are three potential reservoir targets within the prospect within the Campanian the Turonian (as encountered in Well Narina-1) and in the underlying Cenomanian Reservoir is prognosed at between 3000 m TVDSS and 3600 m TVDSS in a water depth of around 1300 m
Figure 2-8 Regional seismic line along axis of the Sunbird canyon system
We have used an areanet pay methodology to estimate prospective resources for the Sunbird canyon prospect At all three prospective layers the prospect divides into two discrete lsquocanyonsrsquo separated by an intra-basinal high (eg Figure 2-9) For the Campanian and Turonian prospective intervals in the low case we restrict the area of the accumulation to the brightest area of anomalous amplitudes on the far offsets in the northerly of the two canyons where amplitude response is better Our high case extends the prospect down-dip to include a larger area of anomalous amplitudes above an observed amplitude shut-off and also includes the southerly of the two canyons as this would now be in charge communication The low and high case polygons approximate to an oil column height of 200 m and 600 m respectively
Albian uc
LB-08LB-09
LB-08
LB-09
Albian UC
Sunbird
0 km 4
NESW
Competent Personrsquos Report African Petroleum Corporation Limited
June 2013 37
For the deeper Cenomanian the prospect is mapped as a single canyon to the south of the intra-basinal high The low and high case polygons approximate to an oil column height of 200 m and 700 m respectively Our low and high estimates of area are used to constrain the P90 and P10 of our probabilistic simulation
Figure 2-9 Sunbird Campanian far offset amplitudes with Cenomanian depth contours (m TVDSS)
Amplitudes are variable within the area of closure and we apply an areal net to gross ratio to better constrain sand distribution within the trap for all three prospective layers Gross reservoir thickness estimates are computed from the mapped seismic interval net to gross from regional analogue and porosity from the observed porositydepth trend (Figure 2-4) Fluid parameters and recovery factors are estimated as described in Section 16
metres
P90
P10
Block 9
Block 8
APALIS-1
Competent Personrsquos Report African Petroleum Corporation Limited
June 2013 38
Figure 2-10 Sunbird Turonian far offset amplitudes with Top Turonian depth contours (m TVDSS)
We have used the prospect risk matrix presented in Section 16 to determine the geological chance of success for the three prospective intervals of the Sunbird prospect Key risk to all three prospective layers is to trapcontainment as the trap requires pinch-out of the reservoir in three directions to seal There is also a subsidiary risk to reservoir at the two deeper levels as the Turonian reservoir encountered in Well Narina-1 is of relatively poor quality and Cenomanian reservoirs are yet to be proven on block However there is seismic evidence for reservoir development and hence we see this risk as favourable Reservoir risk is low for the Campanian as it is developed in the offset Well Narina-1 and there is seismic evidence for reservoir presence As a result we attribute a geological chance of
P90
P10
metres
Block 9
Block 8
APALIS-1
Competent Personrsquos Report African Petroleum Corporation Limited
June 2013 39
success of 27 19 and 18 to the Campanian Turonian and Cenomanian prospective intervals of the Sunbird canyon prospect
Figure 2-11 Sunbird Cenomanian far offset amplitudes with Cenomanian depth contours (m TVDSS)
ʹǤͷǤ͵Ǥ Night Heron
Night Heron is a Turonian basin floor fan system which lies 8 Km south west of Well Bee Eater-1 It is mainly within Block 9 but extends into Block 10 It is identified as a stratigraphic trap with areal extents defined by amplitude truncation and structural pinch-out Reservoir is prognosed at between 4100 m TVDSS and 4700 m TVDSS in a water depth of around 1750 m (Figure 2-12) APCL has selected a
P90
P10
metres
Block 9
Block 8
Competent Personrsquos Report African Petroleum Corporation Limited
June 2013 40
provisional well location which lies on the 3D survey location ndash In-line 1098 X-line 6103 They are currently seeking partners to drill the Night Heron well in early 2014
Figure 2-12 Arbitrary line across Night Heron PSDM - Depth (m TVDSS)
Cenomanian reservoir potential also exists beneath the Turonian basin floor fan and work by APCL is on-going to determine prospectivity
Well Bee Eater-1 found an organic-rich Turonian shale section overlying a hydrocarbon bearing thin-bedded low permeability sandstone Another shale dominated package underlies the sandstone Although the Turonian interval is considered non-commercial for Bee Eater the prospectivity down-dip is appealing APCL interprets that the well was drilled in a canyon system that may have been largely bypassed by sediment input The 3D seismic indicates a significant thickening of this Turonian interval towards the south west and there is some amplitude support for the occurrence of a lobate fan straddling Blocks 9 amp 10
An area times net approach was adopted using the full stack PSDM depth volume to provide an SNA extraction and constrain areal extent and estimate an areal NG to account for lateral variability within the reservoir (Figure 2-13) As night Heron falls partly off block ERCE correct for this using the ratio of on-block to off-block area in reporting of net unrisked and net risked results
S NEBee EaterNight Heron
5 Km
BFF Isopach (m)
Competent Personrsquos Report African Petroleum Corporation Limited
June 2013 41
Figure 2-13 SNA from Basin Floor Fan Isopach (m) - PSDM
We have used the prospect risk matrix presented in Section 16 to determine the geological chance of success for the Turonian interval of the Night Heron prospect Recent drilling results suggest that there is a low risk to hydrocarbon charge The observations at Bee Eater-1 also indicate that shale seals are also likely at a coeval interval Reservoir is a significant risk due to the poor Turonian reservoir development in Well Bee Eater-1 The Turonian reservoir encountered in Well Narina-1 is also of relatively poor quality However there is seismic evidence on the 3D survey for a possible improvement in reservoir development over the prospective area The definition of the trap is the key risk as the seismic evidence for closurereservoir pinch-out is ambiguous over the 2D data in Block 10 There appears to be evidence of the reservoir interval thinning in the critical north westerly direction but 3D data would be required to reduce trap risk any further As a result we attribute a geological chance of success of 144 to the Night Heron prospect
3
3
SNA from BFF Isopach
Block Boundary
Competent Personrsquos Report African Petroleum Corporation Limited
June 2013 42
ʹǤͷǤͶǤ Lovebird Prospect
The Lovebird prospect is mapped as a four-way dip closure to the south of Block 8 (Figure 2-14) Three prospective layers are mapped by correlation to up-dip wells and are prognosed to be of Cenomanian age Thus as with the Sunbird canyon prospect these reservoirs are not proven on block but seismic mapping and regional geological work suggests the sands may be derived from the east via a canyon system identified in block LB-07 The three prospective intervals are termed Upper Middle and Lower or Blue Pink and Green based on horizon colour Structural relief at the Pink horizon is between 50 and 200 m depending on the estimate and thus the prospect is relatively low relief in some realisations
Figure 2-14 Seismic line over the Lovebird prospect
Lovebird
Depth (mss)
4 km
NE
Competent Personrsquos Report African Petroleum Corporation Limited
June 2013 43
Figure 2-15 Lovebird prospect Top Pink horizon depth (m TVDSS) high case
The prospect is mapped to the edge of the available 3D (Figure 2-15) which coincides with the southern boundary of Block 8 but closure can be mapped south of the 3D area on the available 2D lines Reservoir depth is prognosed at between 5000 and 5900 m TVDSS in a water depth of 2850 m at the prospect crest Thus reservoir rock if present will be at comparable depths below mud line to the Barbet prospect
We use a gross-rock volumenet to gross methodology to estimate prospective resources for the Lovebird prospect APCLrsquos evaluation of the Lovebird prospect is on-going and of the three interpreted horizons the Pink horizon is the best defined We review pick depth conversion and thickness uncertainty for this interval to generate a range of gross-rock volumes for this interval with the
m ss
metres
Block 9
Block 8
Competent Personrsquos Report African Petroleum Corporation Limited
June 2013 44
prospect full to spill (Figure 2-15) Assuming the Pink horizon provides an accurate representation of the Blue and Green horizons we then estimate gross-rock volumes for these two intervals by isopach
Reservoir thickness and net to gross ratio estimates are derived from regional analogues with reservoir porosity derived from our regional porositydepth trend (Figure 2-4) Fluid properties and recovery factors are estimated as described in Section 16 Our volumetrics are restricted to the portion of the Lovebird prospect on Block 8 We would expect a further evaluation of the prospective resources of the Lovebird prospect to occur subsequent to the completion of the APCL evaluation and the prospective resources associated with the prospect in this report may therefore be subject to change
The key risks to the Lovebird prospect are to the development of reservoir at the prognosed Cenomanian intervals as they are not proved in wells elsewhere on the block and to source as the prospect requires a source rock deeper than that proven by drilling There is also risk to trapcontainment as the structure is not fully defined by the 3D seismic data volume and is of low relief in some realisations We assign a geological chance of success to the Lovebird prospect of 20 as a result
255Wildbird Prospect
The Wildbird prospect is mapped on 3D seismic data towards the south of Block 8 as a large four-way dip-closed high (Figure 2-17) at a depth of between 4000 to 4600 m TVDSS in a water depth of around 2000 m Structural relief is up to 600 m and area of closure up to 170 km2 The conceptual geological model is discussed above but is that the prognosed microbial carbonate reservoir of Albian age is developed between the mapped lsquoredrsquo and lsquolight bluersquo seismic events (Figure 2-16) with lateral seal developed to the north-east of the prospect within contemporaneous lagoonal facies which also provide the primary source rock This lateral seal is required to close the prospect Basin modelling undertaken by APCL suggests that the Albian lagoonal and later Cretaceous source rocks would be mature for oil generation
We have accepted this model as a geological concept and have used it to make estimates of prospective resources for the Wildbird prospect We then risk the model accordingly
Competent Personrsquos Report African Petroleum Corporation Limited
June 2013 45
Figure 2-16 Seismic line and prospect geo-seismic sketch Wildbird prospect
5
0 km 5
SWN
E
mss
Wildbird
Horizons
BlackberryLight BlueRoseRed
Competent Personrsquos Report African Petroleum Corporation Limited
June 2013 46
Figure 2-17 Wildbird Top Reservoir depth map (m TVDSS) Spill point - green contour
The Wildbird prospect is a large container but there is considerable uncertainty in reservoir thickness structural mapping and degree of charge from the offset kitchen areas We evaluate the prospect in a similar manner to the Lovebird prospect by perturbing the above variables In our low case we choose a shallow contact at 4250 m TVDSS to simulate under-filling or lateral breach via onlapping thief zones and also employ a reservoir thickness of 80 m from offset analogue Our high case assumes the prospect is filled to spill and that the lsquoredrsquo seismic event marks base reservoir Estimates of reservoir net to gross ratio and porosity are derived from the available analogues and are necessarily wide Fluid parameters and recovery factors are derived as described in Section 16
The Wildbird play is emerging and is of high risk We attribute a play risk of 24 as a result (Section 24) The key prospect risk to the Wildbird prospect is that of containment or trap as there is evidence for erosion at the crest of the feature and it is reliant on the development of lagoonal facies to the north-east and overlying marine shales to provide lateral seal and support the hydrocarbon column heights modelled here We attribute a prospect risk of 38 Wildbird which when combined with the play risk gives an overall chance of success for the Wildbird prospect of 9
mss
Competent Personrsquos Report African Petroleum Corporation Limited
June 2013 47
3 Gambia Prospectivity and Plays
͵ǤͳǤ Introduction
Although only one exploration well (Well Jammah-1) exists offshore Gambia exploration drilling has been undertaken to the north and south within Senegalese and Guinea Bissau waters (Figure 2-1 Figure 3-1) A number of oil and gas discoveries have been made onshore Senegal and the large Dome Flore and Dome Gea discoveries to the south of the blocks are each reported to contain a million barrels of biodegraded oil (c10-13o API) in place within sandstones of Oligocene (Tertiary) age Some lighter (30-34o API) oil has also been encountered in deeper intervals More regionally oil and gas discoveries have been made to the north offshore Mauritania and in Guinea Bissau (Sinapa) the recently drilled Venus and Mercury wells in Sierra Leone have also encountered hydrocarbons
Figure 3-1 Plays Gambia Blocks A1 and A4
The range of hydrocarbon types encountered is suggestive of multiple sourcing and the age of the reservoirs suggest late timing of oil generation consistent with a late Cretaceous source for the heavy oil although there are no published data to confirm this Regionally the gas source could be any of the older potential source rocks discussed below
Alhamdulilah
GAMBIA A1ampA4 PROSPECTIVITY POTENTIAL
Deep Water Fans channel levee complexes BFF lobes
Late Jurassic clastic progrades
Clastic progrades (unconformity trap)
Karst amp reef features in carbonate platform
Intra-carbonate clastic truncations
Based on line 1046-NWA
1
2
3
1
51
14
2
3
4
5
Competent Personrsquos Report African Petroleum Corporation Limited
June 2013 48
32Well and Seismic Database
Exploration offshore Gambia is also at an early stage and no wells have been drilled in the deeper water areas The nearest well to Blocks A1 and A4 (and the only well offshore Gambia) is Well Jammah-1 some 15 km to the east of Block A1 (Figure 3-2) This well contains oil shows within sandstones of Late Cretaceous age The well drilled to 3020 m MD reaching total depth in an interval of uncertain age perhaps Cenomanian to Albian
A regional grid of 2D seismic data was made available to us for our evaluation with an average line spacing of around 2-3 km on Block A1 and up to 8 km on Block A4 (Figure 3-2 Figure 3-3) In addition a 2003 vintage 3D seismic data volume was available for analysis covering 2008 km2 However APCL is using 2010 vintage 3D seismic data (2566km2) processed to pre-stack time-migration in their current evaluation and we have adopted these data for our review In general seismic data quality was found to be good
Figure 3-2 Wells 2D and 3D seismic data (red outline) Gambia Blocks A1 and A4
The 2D seismic data was sufficient to enable a well to seismic tie to be made to Well Jammah-1 (Figure 3-3) Despite its shelfal location we were able to extrapolate some stratigraphy into the deeper water
Competent Personrsquos Report African Petroleum Corporation Limited
June 2013 49
although the key Upper Cretaceous section is not sampled adequately by the well leading to uncertainty in the age of the deeper clastic section that forms the potential reservoir interval for the Alhamdulilah prospect
33Plays and Petroleum Geology Blocks A1 and A4
Some of the plays identified by APCL offshore Gambia are similar to those described for Liberia in Section 23 above with structural and stratigraphic traps identified at a number of Cretaceous intervals (Figure 3-1) and reservoirs prognosed as being of deep marine turbidites or other mass transport systems However plate tectonic reconstructions suggest that rifting occurred earlier along the Senegalese and Gambian margin beginning in the Lower Jurassic Thus there is the potential for deeper Jurassic age source and reservoir in the area
There is some seismic evidence for the presence of reservoir intervals as is common regionally although evidence is less compelling in the deeper intervals (Figure 3-5) Of the identified traps in this play fairway only one has currently been matured to prospect status by APCL the Alhamdulilah prospect
Regionally reservoirs within the Cretaceous are associated with a deep marine depositional environment and are generally expected to be of good to excellent quality with the possibility of some overpressure A similar depositional environment is prognosed for the deeper Jurassic age reservoirs with possible fan-delta like geometries identifiable on seismic landward (eastward) of the Alhamdululah prospect (Figure 3-7)
In addition to the Jurassic and Cretaceous clastic plays APCL has identified a number of closures along the margin of a carbonate platform of Jurassic to Aptian age partially penetrated by Well Jammah-1 (Figure 3-3 Figure 3-4) These closures are currently being evaluated by APCL and only one Prospect M has been evaluated to prospect status and we assess the prospective resources for Prospect M in this section
Competent Personrsquos Report African Petroleum Corporation Limited
June 2013 50
Figure 3-3 Well to seismic tie ndash Well Jammah-1 to the Alhamdulilah prospect
There is good evidence for the presence of source rocks in the Gambian margin The youngest source interval that could possibly generate oil is the Cenomanian-Turonian marine source rock proven in the Casamance Shelf wells and present in basins to the north Published data indicate kerogen is a mixed Type IIIII locally and Type II in wells to the south with HI of between 370-660 mggC in gt2 TOC rocks (TOCs in the DSDP-367 well 300 km to the west are in excess of 5 in black shales of Albian to Turonian age) This section is absent in Well Jammah-1 probably as a result of erosion
There is also the possibility of Necomian and Jurassic source rocks Necomian black shales are described in the DSDP-367 well Jurassic (Toarcian) source rocks are inferred to be present based on analogue evidence and plate tectonic reconstructions that place proven Jurassic source rocks in Morocco Portugal Nova Scotia and north-eastern Brazil in proximity to the Senegal-Gambia basin These are documented as having a HI of around 450 mggC and a TOC of up to 6
Regional thermal information shows a high degree of variability with gradients from 25 to 45 degCkm likely as a result of drilling on salt domes where geothermal gradients are elevated or in areas locally affected by volcanics Blocks A1 and A4 are at the northernmost margin of the salt basin so at worst only limited local effects are anticipated Using data from Well Jammah-1 we infer a geothermal gradient of 30deg Ckm at the location of the well This would put the Cenomanian-Turonian source locally into the oil window around the Alhamdulilah prospect However uncertainty in both depth conversion and geothermal modelling do not rule out the possibility that the Cenomanian-Turonian could be mature regionally for hydrocarbon generation Deeper Neocomian or Jurassic source rocks if present would be mature for oil generation under this model
ALHAMDULILAH
M
Senonian UC
W E4 km
Jammah-1
Alhamdulilah
Intra Aptian Carbonate
TWT (ms)
Competent Personrsquos Report African Petroleum Corporation Limited
June 2013 51
34Play Risk
In our evaluation of APCLrsquos Gambian blocks we note that a number of the prospective plays require further definition to mature the identified leads to prospect status As a result our evaluation is limited to the determination of independent estimates of prospective resource for the Alhamdulilah prospect and Prospect M We have used play and prospect risk for both prospects to allow for consistency in comparison between our evaluations where a play risk is appropriate
Based on the review above we see source risk as the key risk to the Lower Cretaceous and Jurassic clastic play Although a number of source rock intervals are present regionally only those within the Cretaceous are demonstrated to be present proximal to Blocks A1 and A4 Data are limited but modelling would suggest that those within the Cenomanian-Turonian could be immature for oil generation in all but a small area of the blocks As a result we assign a source risk of 07 Note that the uncertainty in both source rock presence and thermal data is such that there is a possibility of gas charge although like Liberia Sierra Leone and Cote drsquoIvoire it is impossible to quantify this chance at present
We see seal risk for this play to be relatively low as there is seismic evidence similar to that interpreted regionally for the presence of seal Seal risks for the multiple stacked sands prognosed for the Alhamdulilah prospect are handled as a prospect specific risk The inferred depositional environment for this interval would also suggest that sealing intervals would be developed We have therefore assigned a seal risk of 09 to this play
Seismic evidence for the presence of reservoir is also good but less convincing than that observed regionally and in our evaluation of Liberia Blocks 8 and 9 However we assign a reservoir presence risk of 08 It is possible that the younger Cretaceous reservoirs identified could be locally sourced via exhumation of the coeval carbonate platform to the east and thus be composed of detrital carbonate material This is reflected in the reservoir risk for the Alhamdulilah prospect itself
For the carbonate platform play the key risk is that of top seal Seismic reflectivity is highly variable above the top of the platform carbonates (Figure 3-3) as the event is a strong regional unconformity In places the overlying clastic section can be interpreted immediately above this unconformity Although the latter is factored into prospect specific risk to top seal the seismic evidence for the presence of a regional seal above the unconformity is not compelling The top seal is provided by a down-lapping carbonate prone Aptian-Albian section where the Senonian unconformity is not immediately above the reservoir section Analogues suggest there is a general lack of support for intra-formational seals in similar settings and therefore we assign a risk to the carbonate platform play seal of 05 as a result
The presence of a strong angular unconformity at the top of the carbonate platform structures is however likely to have enhanced reservoir quality within the carbonates themselves as a result of subareal exposure and karstification Thus we assign a risk of 09 to the reservoir presence element of the carbonate platform play and review the prospect specific reservoir efficacy risk on a prospect by prospect basis dependent on the seismic evidence for erosion
Competent Personrsquos Report African Petroleum Corporation Limited
June 2013 52
A number of the identified structures along the buried carbonate platform margin are relatively shallow to mudline and thus biodegradation of any oil charge is possible However as we have only estimated prospective resources for Prospect M we have not carried a play risk to biodegradation
Our final play risks for the Lower Cretaceous clastic and the buried carbonate platform plays are summarised in Table 31 below
PLAY Source Reservoir Presence Seal Play
Risk Cretaceous to Jurassic Clastic Play 07 08 09 50
Carbonate Platform Margin 07 09 05 28
Table 31 Play risk Gambia Blocks A1 and A4
Competent Personrsquos Report African Petroleum Corporation Limited
June 2013 53
35Gambia Leads and Prospects
In all 13 leads and prospects have been identified by APCL within Blocks A1 and A4 with areas of closure varying from around 4 km2 to 63 km2 (Figure 3-4) Of the identified prospective intervals a number are best classified as leads and require further technical work to mature them to prospect status (yellow Figure 3-4) Structural closure is identified within the Lower Cretaceous and a number of slope fans can be identified as seismic amplitude anomalies within the Upper Cretaceous section In addition a number of closures are mapped along the edge of the buried carbonate platform margin at Top Aptian level and APCL are currently evaluating the potential for a deeper Barremian age seal which might provide further prospectivity within the carbonate platform play
Figure 3-4 Leads and prospects identified by APCL in Gambia Blocks A1 and A4
In this section we briefly describe our evaluation of the Alhamdulilah prospect and Prospect M A summary of input parameters for the calculation of prospective resources results and risks for each of the prospective layers evaluated is given in the resource summary sheets in Enclosures 21 to 25 of this document
In 2010 APCL acquired a further 2566 km2 of 3D data over both blocks A re-evaluation of the identified leads and prospects is on-going using these data with the evaluation of the Alhamdulilah prospect and Prospect M completed
ALHAMDULILAH
M
Competent Personrsquos Report African Petroleum Corporation Limited
June 2013 54
351Alhamdulilah Prospect
The Alhamdulilah prospect is identified as a four-way dip-closed structural high within the centre of the deep water portion of Block A1 (Figure 3-3 Figure 3-5) We have evaluated four prospective intervals in total (Figure 3-5) Reservoir ages are currently prognosed by APCL to be of Lower Cretaceous (Turonian) to perhaps Lower Jurassic The prospect extends northwards of Block A1 into Senegalese waters and we have restricted our calculations to the proportion of the prospect that lies within Block A1 The bulk of the prospect does however lie within Gambian territory
Figure 3-5 Seismic line over the Alhamdulilah prospect
The prospective intervals within the Alhamdulilah structure lie between 4230 m TVDSS and 5970 m TVDSS or around 2010 to 3750 metres below sea bed This is relatively deep and despite the estimates of overpressure it is possible that porosity and thus reservoir quality to be relatively poor (Figure 2-4) Our estimates of recovery factor for the deeper prospective intervals reflect this
There is uncertainty in the degree of structural closure as although mapped reflectors are relatively bright and continuous the structure is of low relief We have account for this by undertaking various depth conversions of the mapped structure from the time domain 3D seismic data restricting our analysis to closure demonstrable on-block (Figure 3-6) At SS-1 level closure continues to the north off-block and also off the 3D seismic data We have reviewed the available 2D seismic data northwards to determine the spill point at this level
SS 4 (1)
SS 3 (1-2)
SS 2 (1-3)
SS 1 (1-3)
2 Km
Inline 1140 - TWT ALHAMDULILAH
TWT (s)
W E
Competent Personrsquos Report African Petroleum Corporation Limited
June 2013 55
Where seismic facies analysis suggests the potential for stacked pay intervals these have been modelled probabilistically Estimates of gross rock volume derived in this way are combined with the estimates of net reservoir thickness based on mapped seismic thicknesses and porosity and fluid information are derived as described in Section 16 to compute probabilistic estimates of resources for each reservoir interval
Figure 3-6 Area of closure Alhamdulilah prospect layers SS1 to SS4
Recovery factors used are as described in Section 16 of this report but modified to reflect the depth of burial of the deeper prospective intervals
We have reviewed the prospect specific risk for each of the prospective intervals independently Although the Alhamdulilah trap is a four-way dip-closed feature the time closure is subtle and the prospect is relatively deep There is also seabed canyoning which may cause uncertainty in the imaging and thus trap closure
Seismic evidence for seal is relatively good over the Alhamdulilah trap However there is evidence for downcuttingerosion between layers and above the prospect there is also evidence for downlapping events onto the topmost reflector
The key risk to the Alhamdulilah prospect is that of reservoir efficacy There are indications of fan-like geometries within the 3D seismic data (Figure 3-7) and some events can be mapped for the shallower reservoir layers However the Cretaceous reservoirs may alternatively comprise the eroded talus from the coeval carbonate platform to the east and reservoir quality rock may not be developed as a result Finally our estimate of overpressure may be incorrect and any sandstones present may have the reservoir quality sufficiently degraded via compaction to render them non-reservoir
SS-1 Low and High Case AreasSS-4 Low and High Case Areas SS-3 Low and High Case Areas SS-2 Low and High Case Areas
Competent Personrsquos Report African Petroleum Corporation Limited
June 2013 56
As a result the prospect specific risks to the prospective intervals of the Alhamdulilah prospect vary from 26 to 34 and from 13 to 17 when combined with the play risk
Figure 3-7Alhamdulilah prospect seismic facies interpretation Cretaceous intervals
AH-1 AH-1
Competent Personrsquos Report African Petroleum Corporation Limited
June 2013 57
352Prospect M
A number of structures have been identified by APCL at the Aptian level (ie top carbonate) along the buried carbonate platform margin that runs through Blocks A1 and A4 (Figure 3-1) Of these one structure Prospect M has been matured to prospect status and is of sufficient size to warrant independent estimates of resources (Figure 3-8)
Figure 3-8 Seismic line through Prospect M
We have evaluated the uncertainty in gross rock volume for Prospect M and combined this with reservoir net to gross ratio and porosity from analogue to generate estimates of STOIIP and prospective resources We have simulated uncertainty in seismic pick and also depth conversion to generate a range of spill points for the structure (Figure 3-9) These are used to make low and high case estimates of gross-rock volume
Due to the shallow nature of Prospect M we have assumed relatively high (but moveable) oil viscosities as discussed in Section 1 Recovery factor estimates are made with reference to this and also to analogue where uncertainty in both reservoir quality and also the degree of fracturing (and hence dual permeability) leads to a wide range in uncertainty in ultimate recovery Our low case recovery factor being affected primarily by early onset of water cut via fractures and an adverse mobility ratio and the high case making allowance for better oil mobility and improved matrix porosity and permeability leading to a more efficient sweep We therefore use a recovery factor range from 10 to 35 and use these as the P90 and P10 estimates on a log-normal distribution in our probabilistic simulation of prospective resources
Senonian UC
Intra Aptian Carbonate
TWT (ms)2 km
w EProspect M
Competent Personrsquos Report African Petroleum Corporation Limited
June 2013 58
Figure 3-9 Low and high case closure Prospect M top Aptian depth (m TVDSS)
There is pick and depth conversion uncertainty associated with Prospect M but we see a good chance of a closure being developed within the 3D seismic area and assign a prospect specific risk to trap of 09 as a result Downlapping events are observed onto the crest of the prospect (Figure 3-8) but the overlying seismic signature is relatively transparent thus we see a good chance of the prospect being sealed relative to the play risk However the prospect is relatively shallow at around 1000 m to 1100 m below the seabed and there is a risk to biodegradation of any oil charge Thus we associate a risk of 06 to biodegradation As it is established practice we place this risk into containment or trap risk which results in an overall trap risk of 09 06 or 54
There is evidence for the development of reservoir quality rock with a seismic character that has been associated with the development of karstification in the analogues used We also note that the prospect is very close to the platform edge and the erosional unconformity is quite pronounced again suggesting a period of subareal exposure Thus we see the prospect specific risk to reservoir efficacy as 08 Charge risk is also favourable with the prospect located at the edge of the buried platform margin proximal to the deeper potential kitchen areas We therefore associate a charge risk of 08 to the prospect
Thus we assign a prospect specific risk of 35 which when combined with the play risk for the carbonate platform margin gives an overall COS of 10
3
3
m ss
metres
Competent Personrsquos Report African Petroleum Corporation Limited
June 2013 59
4 Sierra Leone Prospectivity and Plays
As with offshore Liberia to the south-east all of the deep-water acreage offshore Sierra Leone is under licence (Figure 4-1) A discussion of regional hydrocarbon occurrences is presented in Section 21 APCLrsquos licences SL-03 and SL-04A-10 lie to the north-west of the countryrsquos territorial waters around 200 to 300 km north-west of the recent Venus Mercury and Jupiter discoveries made by Anadarko (Figure 4-1)
Figure 4-1 Offshore licences and discoveries Liberia and Sierra Leone
A regional grid of 2D seismic data is available to APCL for the evaluation of offshore Sierra Leone (Figure 4-2) In addition APCL has licenced c 2500 km2 of 3D seismic data covering the deeper water area of Block SL-03 and is negotiating the licencing of further 3D seismic data covering part of Block SL-04A-10
Competent Personrsquos Report African Petroleum Corporation Limited
June 2013 60
Well data offshore Sierra Leone are sparse Historical exploration was restricted to the shelf and resulted in the drilling of two exploration wells (Wells A-1 and A-1-2) which were plugged and abandoned as dry holes Data from both wells are available to APCL Recent drilling by Anadarko in the deeper waters of licence SL-07B-10 has yielded a number of discoveries (Wells Jupiter-1 Venus-1 and Mercury-1) but these well data are not available to APCL
Figure 4-2 Well and seismic database offshore Sierra Leone
The play fairways identified offshore Sierra Leone are very similar to those identified offshore Liberia (Figure 2-3) as structural traps within the Lower Cretaceous syn-rift section and primarily as stratigraphic traps within turbiditic sands of Cretaceous age (Campanian Cenomanian and Turonian) Sourcing from regional marine (Cenomanian) or lacustrine (Albo-Aptian) source rocks is hypothesized For the syn-rift structural play the presence of Albo-Aptian reservoirs is demonstrated by the shallow water Wells A-1 and A-1-2 which also had indications of the development of source rocks within the
Competent Personrsquos Report African Petroleum Corporation Limited
June 2013 61
Cretaceous syn-rift section Although the data are not available the recent Anadarko wells are publically documented as having found hydrocarbons within post-rift Cretaceous turbidites potentially de-risking this play
Blocks SL-03 and SL-04A-10 are towards the north-western edge of the seismically identified Cretaceous basin immediately adjacent to a large structural lineament the Sierra Leone Transform System Submarine canyon development is therefore prognosed to occur to the south and east of this lineament providing sediment input into the blocks during Cretaceous time As is encountered regionally there is reasonable seismic evidence for the presence of reservoir bearing intervals within the Upper Cretaceous section in the blocks
APCLrsquos evaluation of the recently licenced 3D seismic data is on-going and as yet only one prospect Altair has been matured to drillable prospect status However a number of other Cretaceous channelfan systems have been identified within Block SL- 03 (Figure 4-3)
Figure 4-3 Leads Sierra Leone Block SL-03
Competent Personrsquos Report African Petroleum Corporation Limited
June 2013 62
41Play Risk
Although there has been recent drilling along strike of APCLrsquos Sierra Leone licences these wells lie some 100 km to the east We have therefore attributed a play risk albeit favourable to Cretaceous channel-fan prospectivity within Blocks SL-03 and SL-04A-10 As with our review of Liberia there is strong seismic evidence for reservoir and seal rocks being present and offset drilling would indicate the same from the limited published information However there is as yet no proven source rock within APCLrsquos licences and we see this as the key risk to play The reported results of offset drilling and APCLrsquos own basin modelling would suggest that source risk would be favourable
Our final play risk for the Cretaceous channel-fan systems in APCLrsquos Sierra Leone licences is summarised in Table 31 below
PLAY Source Reservoir Presence Seal Play
Risk Cretaceous Play 08 09 09 65
Table 41 Play risk Sierra Leone Block SL-03
41Sierra Leone Leads and Prospects
APCL is currently evaluating the recently licenced 3D seismic data over Block SL-03 and has identified a number of Cretaceous channel-fan systems varying in areal extent from 20 km2 to 150 km2 Of the mapped channel fan systems one Altair has been matured to prospect status by APCL and we have made independent estimates of prospective resources and risks for this prospect
A summary of input parameters for the calculation of prospective resources results and risks for the Altair prospect is given in the resource summary sheet in Enclosure 31 of this document
411Altair
The Altair prospect is a turbidite channel prospect mapped at a seismic event described as Turonian by APCL (Figure 4-4) There is however uncertainty in this stratigraphy as it is established by jump correlation using regional seismic data due to the lack of deep water wells on block It is a stratigraphic trap with areal extents defined by amplitude truncation and structural pinch-out in a similar manner to prospectivity within APCLrsquos Liberia and Cote drsquoIvoire acreage A single target reservoir is identified within the trapped area The prospect has anomalous seismic amplitudes associated with it (Figure 4-5) which may indicate reservoir development The top structure is mapped between 6200 ndash 6800 ms TWT over the area of the prospect Our depth conversion indicates a crestal depth of approximately 5400 m TVDSS beneath a water depth of 3300 m giving 2100 m of sediment above top reservoir
Competent Personrsquos Report African Petroleum Corporation Limited
June 2013 63
Figure 4-4 Dip seismic line (full offsets) Altair prospect
The seismic image suggests that Altair is a turbidite channel constrained in the north east by a well-defined canyon Two distinct canyon systems feed erosive channels at the break of slope A south west trending fault which is almost perpendicular to the main canyon feeders alters bathymetric relief and diverts the Altair channel southwards
ERCE has made estimates of prospective resources for the Altair prospect using an identical methodology to our evaluation of Liberian prospectivity An area net approach was adopted using optimized seismic amplitudes to constrain areal extent and define an areal net to gross to account for lateral variability of sand distribution within the reservoir In our low case we restrict the area of the accumulation to the brightest area of anomalous amplitudes and a column height of 200 m Our high case extends the prospect down-dip to a column height of 800 m and laterally to incorporate weaker amplitude responses (Figure 4-5) These polygons were used to constrain the P90 and P10 area inputs of our probabilistic simulation
SW NE
Top Turonian
Top syn-rift
0 5kmTWT (s)
ALTAIR
3
3
metres
Competent Personrsquos Report African Petroleum Corporation Limited
June 2013 64
Figure 4-5 Seismic amplitude (gradient stack) and Top Turonian depth (m TVDSS) Altair prospect
Net pay is estimated from the mapped seismic interval and regional analogue with porosities and fluid properties estimated as described in Section 16
We have used the prospect risk matrix presented in Section 16 to determine the geological chance of success for the Altair prospect Key risk is to trap integrity due to the coalescing of a number of mapped fan systems up dip towards the pinch-out of Altair with subsidiary risk to charge as this is as yet unproven on block This gives a prospect specific risk of 28 which when combined with the play risk gives an overall chance of success of 18 for the Altair prospect
3
3
metres
Competent Personrsquos Report African Petroleum Corporation Limited
June 2013 65
5 Cote13 drsquoIvoire13 Prospectivity13 and Plays
51Introduction
Offshore Cote drsquoIvoire has been actively explored for hydrocarbons for a number of years and much of the offshore shelf is under licence Recently exploration has moved into deeper waters targeting the regional post-rift (Cretaceous) play and APCL has identified a number of prospects and leads within the western licence Blocks of CI-513 and CI-509 (Figure 5-1)
There are two main play types identifiable offshore Cote drsquoIvoire (Figure 5-2) as structural traps within the Lower Cretaceous (Aptian to Albian) syn-rift section and as stratigraphic traps within post rift turbiditic sands of Cenomanian to Turonian age Sourcing is prognosed from regional marine (Turonian) or lacustrine (Albo-Aptian) source rocks
Figure 5-1 CI-509 and CI-513 Prospects and Leads13 offshore13 Cote13 drsquoIvoire
Historically exploration has been restricted to the narrow shelf area and has yielded a number of commercial fields both oil and gas including Foxtrot Baobab and Espoir All of these fields lie within the Lower Cretaceous (Aptian) syn-rift play Recently exploration has moved into deeper waters targeting the regional post-rift (Cretaceous) play Well Paon-1X c 300 km to the east of Blocks CI-105 and CI-513
Competent Personrsquos Report African Petroleum Corporation Limited
June 2013 66
drilled by Tullow Oil plc and partners in licence CI-103 during 2012 is reported to have found hydrocarbons in turbiditic sandstones of Cretaceous age Well Kosrou-1X some 150 km east of Blocks CI-105 and CI-513 shows reservoir development within the post-rift Cretaceous section particularly within the Turonian to Cenomanian section
Evaluation of prospectivity within Blocks CI-509 and CI-513 is at an early stage and a working petroleum system is not proven on block However a number of Cretaceous channelfan systems have been identified using both 2D and 3D seismic data which have generated around seven potential traps at the date of this report five of which are considered prospects for this report (Figure 5-1)
Figure 5-2 Petroleum13 systems13 and13 plays13 offshore13 Cote13 drsquoIvoire
52Well and Seismic Database
APCL has obtained a regional database of 2D seismic data offshore Cote drsquoIvoire which provides well to seismic ties to Well San Pedro-1 (Figure 5-3) The primary data set used for our evaluation is that provided by the recently acquired 3D seismic data At the time of writing these data were processed to
Competent Personrsquos Report African Petroleum Corporation Limited
June 2013 67
pre-stack time-migration and we have used this volume plus available AvO processed volumes to evaluate the prospectivity of the CI-513 licence currently only the full-stack seismic product has been used to assess the prospectivity in Block CI-509
Figure 5-3 Well and seismic database offshore Sierra Leone
53Plays and Petroleum Geology Blocks CI-509 and CI-513
The primary play being explored within Blocks CI-509 and CI-513 is the Cretaceous post-rift turbidite play (Figure 5-2) There is reasonable seismic evidence for the presence of reservoir bearing intervals within the Upper Cretaceous section of the blocks However dating of the age of these post-rift turbidite channelfan systems is uncertain due to the paucity of well and seismic data with stratigraphy extrapolated into APCLrsquos licences via regional seismic correlation The presence of a regional Turonian source rock is hypothesized to charge any identified traps This is not proven on block but evidence from offset drilling in Block CI-105 demonstrates the presence of source rocks developed within the
Grand Lahou East 1
Kosrou 1x
San Pedro 1
South Grand Lahou 1
Competent Personrsquos Report African Petroleum Corporation Limited
June 2013 68
Cenomanian to Turonian and basin modelling studies indicate that the Turonian may be mature for oil generation local to the licences
A number of Cretaceous channelfan systems have been identified using both 2D and 3D seismic data (Figure 5-1) and we have independently evaluated the Prospective Resources and geological chance of success for five of these In addition the Lower Cretaceous syn-rift play may be viable within the licences particularly to the north Evaluation of this play by APCL is on-going and no prospective resources have been assessed for this play
54Play Risk
Exploration offshore Cote drsquoIvoire is at an early stage and there are limited well data available As a result ERCE has adopted a play and prospect risk system in our evaluation of the Cote drsquoIvoire prospective resources within the Cretaceous channel-fan play in an identical manner to our review of Liberia the Gambia and Sierra Leone
In a similar manner to Liberia the Gambia and Sierra Leone there is seismic evidence for the presence of seal and reservoir rock and thus the key risk is to source and we see source risk as the key risk to the Creteaceous clastic play Sourcing is prognosed from regional marine (Turonian) modelled as having limited hydrocarbon generating potential or lacustrine (Albo-Aptian) source rocks the maturity of which are interpreted to be in the very early oil window As a result we assign a play source risk of 06 Note that the uncertainty in both source rock presence and thermal maturity is such that there is a possibility of gas charge although it is impossible to quantify this chance at present
Our final play risk is summarised in Table 51 below
PLAY Source Reservoir Presence Seal Play
Risk Cretaceous Clastic Play 06 09 09 049
Table 51 Play13 risk13 Cote13 drsquoIvoire13 Blocks13 CI-509 and CI-513
Competent Personrsquos Report African Petroleum Corporation Limited
June 2013 69
ͷǤͷǤ Cote13 drsquoIvoire13 Blocks13 CI-509 and CI-503 Leads and Prospects
Prospectivity has been identified by APCL at a number of levels with the evaluation of the Cretaceous clastic turbidite channel-fan play being the most advanced ERCE has made independent assessments of prospective resources and geological chance of success for five prospects within this play Ayame Ayame West Sassandra Cavella and Leraba (Figure 5-1)
A summary of input parameters for the calculation of prospective resources results and risks for each of the prospective layers evaluated is given in the resource summary sheets in Enclosures 41 to 45 of this document
ͷǤͷǤͳǤ Ayame amp Ayame West
The Ayame and Ayame West prospects are identified as Upper Cretaceous fans which lie mainly within Block CI-513 (Figure 5-4) The prognosed trapping mechanism is stratigraphic with areal extents defined by amplitude truncation and structural pinch-out A single target reservoir is prognosed for both within stratigraphy identified as Turonian although stratigraphy is uncertain in both licences as it is established via long distance seismic ties The prospects have anomalous seismic amplitudes associated with them (Figure 5-5) which may indicate reservoir development The top structure is mapped between 5400 ndash 6300 ms TWT over the area of the prospect and our depth conversion places the crest of the trap at approximately 4200 m TVDSS beneath a water depth of 2500 m
Figure 5-4 Strike Line Ayame and Ayame West prospects
NE
0 km 4
TWT (s)
Top
Turonian
Base
Turonian
Top
Albian
AYAMEAYAME WESTSW
P90
P10
metres
P90
P10
AYAME
AYAMEWEST
Competent Personrsquos Report African Petroleum Corporation Limited
June 2013 70
Evaluation of the Ayame and Ayame West prospects is undertaken in an identical manner to our evaluations of the stratigraphically trapped channel-fan prospects in APCLrsquos Liberia and Sierra Leone licences An area net approach is adopted using anomalous seismic amplitudes to constrain areal extent and define an areal net to gross to account for lateral variability of sand distribution within the closure area In our low case we restrict the area of the accumulation to the brightest area of anomalous amplitudes and a 200 m column height Our high case extends the prospect down-dip to 800 m of column height to include a larger area of anomalous amplitudes (Figure 5-5) These polygons are used to constrain the P90 and P10 area inputs of our probabilistic simulation
Net pay estimates are estimated from mapped seismic interval thickness and from regional analogues with porosity fluid parameters and recovery factors estimated as described in Section 16
Figure 5-5 Ayame Seismic amplitude (gradient stack) and Top Turonian depth (m TVDSS)
We use the prospect risk matrix presented in Section 16 to determine the geological chance of success for the Ayame and Ayame West prospects Key risk is to trap and we attribute a trap risk of 50 to both
P90
P10
metres
P90
P10
AYAME
AYAMEWEST
Competent Personrsquos Report African Petroleum Corporation Limited
June 2013 71
prospects giving a prospect specific chance of success of 28 for both prospects When combined with the play risk this gives an overall chance of success of 14
A proportion of the closure areas for both the Ayame and Ayame West prospects fall outside Block CI-513 in our high case (6 km2 and 11 km2 respectively) This is corrected for in our summary tables of net risked and unrisked prospective resources at the beginning of this document by computing the area of the prospect off-block at P90 P50 and P10 and scaling accordingly
ͷǤͷǤʹǤ Sassandra
The Sassandra prospect is mapped as a deep-water fan system at Top Turonian level and lies within Blocks CI-513 and CI-509 approximately 20km west along strike from the Ayame prospect It is a stratigraphic trap with areal extents defined by amplitude truncation and structural pinch-out (Figure 5-6) A single target reservoir is prognosed within the Turonian and as with other prospects on block has similar uncertainty in the stratigraphic age of the prospective interval The prospect has anomalous amplitudes associated with it (Figure 5-7) which may indicate reservoir development The top structure is mapped between 5000 ndash 6000 ms TWT over the area of the prospect and our depth conversion predicts a crestal depth of approximately 4400 m TVDSS beneath a water depth of 2500 m
Figure 5-6 Dip seismic line Sassandra prospect
Top Turonian
Base Turonian
Top Albian
N S
TWT (s)
SASSANDRA
P90 P10
metres
CI-509
Competent Personrsquos Report African Petroleum Corporation Limited
June 2013 72
Evaluation of the Sassandra prospect is undertaken in an identical manner to our evaluation of the Ayame and Ayame West prospects An area net approach is adopted using anomalous seismic amplitudes to constrain areal extent and define an areal net to gross to account for lateral variability of sand distribution within the closure area In our low case we restrict the area of the accumulation to the brightest area of anomalous amplitudes and a 200 m column height Our high case extends the prospect down-dip to 800 m of column height to include a larger area of anomalous amplitudes (Figure 5-7) These polygons are used to constrain the P90 and P10 area inputs of our probabilistic simulation As far offset data are only available for CI-513 (at the time of writing) we have used amplitudes from the full-stack volume to map the extent of the prospect to the west off block (Figure 5-7)
Net pay estimates are estimated from mapped seismic interval thickness and from regional analogues with porosity fluid parameters and recovery factors estimated as described in Section 16
Figure 5-7 Sassandra prospect Seismic amplitude and Top Turonian depth (m TVDSS)
We use the prospect risk matrix presented in Section 16 to determine the geological chance of success for the Sassandra prospect Key risk is to trap and we attribute a trap risk of 40 This is a lower value
33
metres
CI-509
Competent Personrsquos Report African Petroleum Corporation Limited
June 2013 73
than our estimates for the Ayame and Ayame West prospects as the up-dip termination of the trap is less well defined and requires a larger area for pinch-out or bypass Seismic amplitude support for reservoir presence is less over the Sassandra prospect relative to Ayame Thus we estimate a prospect specific chance of success for the Sassandra prospect of 20 which when combined with the play risk gives an overall chance of success for the Sassandra prospect of 10
A proportion of the closure area for the Sassandra prospect falls outside Blocks CI-513 and CI-509 in our high case (33 km2) This is corrected for in our summary tables of net risked and unrisked prospective resources at the beginning of this document by computing the area of the prospect off-block at P90 P50 and P10 and scaling accordingly
553Cavalla
The Cavalla prospect is an Upper Cretaceous Fan which lies between the Ayame and Sassandra prospects within Block CI-513 It is identified as a stratigraphic trap with areal extents defined by amplitude truncation and structural pinch-out (Figure 5-8) A single target reservoir is prognosed within the TuronianCenomanian interval (with similar stratigraphic uncertainty to other prospects on block) which lies stratigraphically beneath the Ayame prospect The prospect has anomalous seismic amplitudes associated with it (Figure 5-9) which may indicate reservoir development The top structure is mapped between 4600 ndash 5900 ms TWT over the area of the prospect and we estimate a crestal depth of approximately 3900 m TVDSS beneath a water depth of 2500 m The prospect is more steeply dipping than other fan systems mapped on block
Evaluation of the Cavalla prospect is undertaken in an identical manner to our evaluation of the Ayame Ayame West and Sassandra prospects An area net approach is adopted using anomalous seismic amplitudes to constrain areal extent and define an areal net to gross to account for lateral variability of sand distribution within the closure area In our low case we restrict the area of the accumulation to the brightest area of anomalous amplitudes and a 200 m column height Our high case extends the prospect down-dip to 800 m of column height to include a larger area of anomalous amplitudes (Figure 5-9) These polygons are used to constrain the P90 and P10 area inputs of our probabilistic simulation
Net pay estimates are estimated from mapped seismic interval thickness and from regional analogues with porosity fluid parameters and recovery factors estimated as described in Section 16
We use the prospect risk matrix presented in Section 16 to determine the geological chance of success for the Cavella prospect Key risk is to trap and we attribute a trap risk of 40 As with the Sassandra prospect this is a lower value than our estimates for the Ayame and Ayame West prospects as the up-dip termination of the trap is less well defined and requires a larger area for pinch-out or bypass Seismic amplitude support for reservoir presence is less over the Cavella prospect relative to Ayame Thus we estimate a prospect specific chance of success for the Cavella prospect of 20 which when combined with the play risk gives an overall chance of success for the Cavella prospect of 10
Competent Personrsquos Report African Petroleum Corporation Limited
June 2013 74
The Cavalla prospect is contained entirely within APCLrsquos licences
Figure 5-8 Dip seismic line Cavalla prospect
Top Turonian
Top Albian
TWT (s)
CAVALLANW SEP90
P10
metres
Competent Personrsquos Report African Petroleum Corporation Limited
June 2013 75
Figure 5-9 Seismic amplitude (gradient stack) and Top fan depth (m TVDSS) Cavalla prospect
ͷǤͷǤͶǤ Leraba
As with the other evaluated prospectivity within Blocks CI-509 and CI-513 the Leraba prospect is an Upper Cretaceous fan which lies within Block CI-509 It is identified as a stratigraphic trap with areal extents defined by amplitude truncation and structural pinch-out (Figure 5-10) The prospect has anomalous seismic amplitudes associated with it (Figure 5-11) which may indicate reservoir development Unlike the other Cote DrsquoIvoire prospects evaluated in this report no offset seismic volumes were available for our review of Leraba at the time of writing The seismic amplitude response and character on the full-stack data is however consistent with that observed over other prospects in Block CI-513 where more seismic products were available
P90
P10
metres
Competent Personrsquos Report African Petroleum Corporation Limited
June 2013 76
The top structure is mapped between 4600 ndash 5200 ms TWT over the area of the prospect and we estimate a depth at the crest of approximately 3700 m TVDSS beneath a water depth of 2500 m
Figure 5-10 Dip seismic line Leraba prospect
Evaluation of the Leraba prospect is undertaken in an identical manner to our evaluation of the other Cretaceous fan systems evaluated in this section An area net approach is adopted using anomalous seismic amplitudes to constrain areal extent and define an areal net to gross to account for lateral variability of sand distribution within the closure area In our low case we restrict the area of the accumulation to the brightest area of anomalous amplitudes and a 200 m column height Our high case extends the prospect down-dip to 800 m of column height to include a larger area of anomalous amplitudes (Figure 5-11) These polygons are used to constrain the P90 and P10 area inputs of our probabilistic simulation
P90
P10
metresTWT (s)
LERABANW SE
Top Turonian
Albian
0 5km
Competent Personrsquos Report African Petroleum Corporation Limited
June 2013 77
Figure 5-11 Seismic amplitudes Leraba prospect overlay of Top Reservoir m TVDSS
Net pay estimates are derived from mapped seismic interval thickness and from regional analogues with porosity fluid parameters and recovery factors estimated as described in Section 16 The prospect is relatively shallow to mud line and we have modelled a more viscous oil as described in Section 16
We use the prospect risk matrix presented in Section 16 to determine the geological chance of success for the Leraba prospect Key risk is to trap and we attribute a trap risk of 60 as the up-dip extent of the prospect is fairly well defined on seismic data Although no off-set 3D seismic data were available the seismic evidence for reservoir presence is again comparable to that of Ayame West Thus we estimate a prospect specific chance of success for the Leraba prospect of 34 which when combined with the play risk gives an overall chance of success for the Leraba prospect of 16
The Leraba prospect is contained entirely within APCLrsquos licences
P90
P10
metres
Competent Personrsquos Report African Petroleum Corporation Limited
June 2013 78
6 Senegal Prospectivity and Plays
Prospectivity identified within APCLrsquos Sengalese licences is seen as being similar to that identified offshore Gambia (Figure 6-1) and a description of the regional petroleum systems and main play types expected is given in Section 3
Figure 6-1 Petroleum systems and plays offshore Senegal
In 2012 APCL acquired 3600 km2 of multi-client 3D seismic data over the Offshore Sud Profond licence In addition 1500 km2 of legacy 3D data over the Rufisque Offshore Profond licence is currently being reprocessed by APCL and legacy 2D seismic data (c 7000 line km) have also been acquired APCL expects to begin prospect evaluation once seismic processing is complete which is expected later in 2013 At present a number of conceptual Cretaceous post-rift leads are identified by APCL (Figure 6-2)
Competent Personrsquos Report African Petroleum Corporation Limited
June 2013 79
Figure 6-2 leads offshore Senegal Blocks ROP and SOSP
Competent Personrsquos Report African Petroleum Corporation Limited
June 2013 80
7 Appendix 1 SPE PRMS Guidelines
SPEWPCAAPGSPEE Petroleum Reserves and Resources Classification System and Definitions
The Petroleum Resources Management System
Preamble
Petroleum Resources are the estimated quantities of hydrocarbons naturally occurring on or within the Earthrsquos crust Resource assessments estimate total quantities in known and yet-to-be-discovered accumulations Resources evaluations are focused on those quantities that can potentially be recovered and marketed by commercial projects A petroleum Resources managements system provides a consistent approach to estimating petroleum quantities evaluating development projects and presenting results within a comprehensive classification framework
International efforts to standardize the definitions of petroleum Resources and how they are estimated began in the 1930s Early guidance focused on Proved Reserves Building on work initiated by the Society of Petroleum Evaluation Engineers (SPEE) SPE published definitions for all Reserves categories in 1987 In the same year the World Petroleum Council (WPC then known as the World Petroleum Congress) working independently published Reserves definitions that were strikingly similar In 1997 the two organizations jointly released a single set of definitions for Reserves that could be used worldwide In 2000 the American Association of Petroleum Geologists (AAPG) SPE and WPC jointly developed a classification system for all petroleum Resources This was followed by additional supporting documents supplemental application evaluation guidelines (2001) and a glossary of terms utilized in Resources definitions (2005) SPE also published standards for estimating and auditing Reserves information (revised 2007)
These definitions and the related classification system are now in common use internationally within the petroleum industry They provide a measure of comparability and reduce the subjective nature of Resources estimation However the technologies employed in petroleum exploration development production and processing continue to evolve and improve The SPE Oil and Gas Reserves Committee works closely with other organizations to maintain the definitions and issues periodic revisions to keep current with evolving technologies and changing commercial opportunities
The SPE-PRMS consolidates builds on and replaces guidance previously contained in the 1997 Petroleum Reserves Definitions the 2000 Petroleum Resources Classification and Definitions publications and the 2001 ldquoGuidelines for the Evaluation of Petroleum Reserves and Resourcesrdquo the latter document remains a valuable source of more detailed background information
These definitions and guidelines are designed to provide a common reference for the international petroleum industry including national reporting and regulatory disclosure agencies and to support petroleum project and portfolio management requirements They are intended to improve clarity in
Competent Personrsquos Report African Petroleum Corporation Limited
June 2013 81
global communications regarding petroleum Resources It is expected that the SPE-PRMS will be supplemented with industry education programs and application guides addressing their implementation in a wide spectrum of technical andor commercial settings
It is understood that these definitions and guidelines allow flexibility for users and agencies to tailor application for their particular needs however any modifications to the guidance contained herein should be clearly identified The definitions and guidelines contained in this document must not be construed as modifying the interpretation or application of any existing regulatory reporting requirements
The full text of the SPEWPCAAPGSPEE Petroleum Resources Management System document hereinafter referred to as the SPE-PRMS can be viewed at
wwwspeorgspecmabinaryfiles6859916Petroleum_Resources_Management_System_2007pdf
Overview and Summary of Definitions
The estimation of petroleum resource quantities involves the interpretation of volumes and values that have an inherent degree of uncertainty These quantities are associated with development projects at various stages of design and implementation Use of a consistent classification system enhances comparisons between projects groups of projects and total company portfolios according to forecast production profiles and recoveries Such a system must consider both technical and commercial factors that impact the projectrsquos economic feasibility its productive life and its related cash flows
Petroleum is defined as a naturally occurring mixture consisting of hydrocarbons in the gaseous liquid or solid phase Petroleum may also contain non-hydrocarbons common examples of which are carbon dioxide nitrogen hydrogen sulphide and sulphur In rare cases non-hydrocarbon content could be greater than 50
The term ldquoResourcesrdquo as used herein is intended to encompass all quantities of petroleum naturally occurring on or within the Earthrsquos crust discovered and undiscovered (recoverable and unrecoverable) plus those quantities already produced Further it includes all types of petroleum whether currently considered conventionalrdquo or ldquounconventionalrdquo
Figure 1-1 is a graphical representation of the SPEWPCAAPGSPEE Resources classification system The system defines the major recoverable Resources classes Production Reserves Contingent Resources and Prospective Resources as well as Unrecoverable petroleum
Competent Personrsquos Report African Petroleum Corporation Limited
June 2013 82
Figure 1-1 SPEAAPGWPCSPEE Resources Classification System
The ldquoRange of Uncertaintyrdquo reflects a range of estimated quantities potentially recoverable from an accumulation by a project while the vertical axis represents the ldquoChance of Developmentrdquo that is the chance that the project that will be developed and reach commercial producing status
The following definitions apply to the major subdivisions within the Resources classification
TOTAL PETROLEUM INITIALLY-IN-PLACE
Total Petroleum Initially in Place is that quantity of petroleum that is estimated to exist originally in naturally occurring accumulations
It includes that quantity of petroleum that is estimated as of a given date to be contained in known accumulations prior to production plus those estimated quantities in accumulations yet to be discovered (equivalent to ldquototal Resourcesrdquo)
Competent Personrsquos Report African Petroleum Corporation Limited
June 2013 83
DISCOVERED PETROLEUM INITIALLY-IN-PLACE
Discovered Petroleum Initially in Place is that quantity of petroleum that is estimated as of a given date to be contained in known accumulations prior to production
PRODUCTION
Production is the cumulative quantity of petroleum that has been recovered at a given date
Multiple development projects may be applied to each known accumulation and each project will recover an estimated portion of the initially-in-place quantities The projects shall be subdivided into Commercial and Sub-Commercial with the estimated recoverable quantities being classified as Reserves and Contingent Resources respectively as defined below
RESERVES
Reserves are those quantities of petroleum anticipated to be commercially recoverable by application of development projects to known accumulations from a given date forward under defined conditions
Reserves must satisfy four criteria they must be discovered recoverable commercial and remaining based on the development project(s) applied Reserves are further subdivided in accordance with the level of certainty associated with the estimates and may be sub-classified based on project maturity andor characterized by their development and production status To be included in the Reserves class a project must be sufficiently defined to establish its commercial viability There must be a reasonable expectation that all required internal and external approvals will be forthcoming and there is evidence of firm intention to proceed with development within a reasonable time frame A reasonable time frame for the initiation of development depends on the specific circumstances and varies according to the scope of the project While five years is recommended as a benchmark a longer time frame could be applied where for example development of economic projects are deferred at the option of the producer for among other things market-related reasons or to meet contractual or strategic objectives
In all cases the justification for classification as Reserves should be clearly documented To be included in the Reserves class there must be a high confidence in the commercial producibility of the reservoir as supported by actual production or formation tests In certain cases Reserves may be assigned on the basis of well logs andor core analysis that indicate that the subject reservoir is hydrocarbon-bearing and is analogous to reservoirs in the same area that are producing or have demonstrated the ability to produce on formation tests
Proved Reserves
Proved Reserves are those quantities of petroleum which by analysis of geoscience and engineering data can be estimated with reasonable certainty to be commercially recoverable from a given date forward from known reservoirs and under defined economic conditions operating methods and government regulations
Competent Personrsquos Report African Petroleum Corporation Limited
June 2013 84
If deterministic methods are used the term reasonable certainty is intended to express a high degree of confidence that the quantities will be recovered If probabilistic methods are used there should be at least a 90 probability that the quantities actually recovered will equal or exceed the estimate The area of the reservoir considered as Proved includes
the area delineated by drilling and defined by fluid contacts if any and adjacent undrilled portions of the reservoir that can reasonably be judged as continuous with it and commercially productive on the basis of available geoscience and engineering data
In the absence of data on fluid contacts Proved quantities in a reservoir are limited by the lowest known hydrocarbon (LKH) as seen in a well penetration unless otherwise indicated by definitive geoscience engineering or performance data Such definitive information may include pressure gradient analysis and seismic indicators Seismic data alone may not be sufficient to define fluid contacts for Proved Reserves (see ldquo2001 Supplemental Guidelinesrdquo Chapter 8) Reserves in undeveloped locations may be classified as Proved provided that the locations are in undrilled areas of the reservoir that can be judged with reasonable certainty to be commercially productive and interpretations of available geoscience and engineering data indicate with reasonable certainty that the objective formation is laterally continuous with drilled Proved locations
For Proved Reserves the recovery efficiency applied to these reservoirs should be defined based on a range of possibilities supported by analogs and sound engineering judgment considering the characteristics of the Proved area and the applied development program
Probable Reserves
Probable Reserves are those additional Reserves which analysis of geoscience and engineering data indicate are less likely to be recovered than Proved Reserves but more certain to be recovered than Possible Reserves
It is equally likely that actual remaining quantities recovered will be greater than or less than the sum of the estimated Proved plus Probable Reserves (2P) In this context when probabilistic methods are used there should be at least a 50 probability that the actual quantities recovered will equal or exceed the 2P estimate
Probable Reserves may be assigned to areas of a reservoir adjacent to Proved where data control or interpretations of available data are less certain The interpreted reservoir continuity may not meet the reasonable certainty criteria Probable estimates also include incremental recoveries associated with project recovery efficiencies beyond that assumed for Proved
Possible Reserves
Possible Reserves are those additional Reserves which analysis of geoscience and engineering data indicate are less likely to be recoverable than Probable Reserves
Competent Personrsquos Report African Petroleum Corporation Limited
June 2013 85
The total quantities ultimately recovered from the project have a low probability to exceed the sum of Proved plus Probable plus Possible (3P) which is equivalent to the high estimate scenario When probabilistic methods are used there should be at least a 10 probability that the actual quantities recovered will equal or exceed the 3P estimate
Possible Reserves may be assigned to areas of a reservoir adjacent to Probable where data control and interpretations of available data are progressively less certain Frequently this may be in areas where geoscience and engineering data are unable to clearly define the area and vertical reservoir limits of commercial production from the reservoir by a defined project
Possible estimates also include incremental quantities associated with project recovery efficiencies beyond that assumed for Probable
Probable and Possible Reserves
(See above for separate criteria for Probable Reserves and Possible Reserves)
The 2P and 3P estimates may be based on reasonable alternative technical and commercial interpretations within the reservoir andor subject project that are clearly documented including comparisons to results in successful similar projects
In conventional accumulations Probable andor Possible Reserves may be assigned where geoscience and engineering data identify directly adjacent portions of a reservoir within the same accumulation that may be separated from Proved areas by minor faulting or other geological discontinuities and have not been penetrated by a wellbore but are interpreted to be in communication with the known (Proved) reservoir Probable or Possible Reserves may be assigned to areas that are structurally higher than the Proved area Possible (and in some cases Probable) Reserves may be assigned to areas that are structurally lower than the adjacent Proved or 2P area
Caution should be exercised in assigning Reserves to adjacent reservoirs isolated by major potentially sealing faults until this reservoir is penetrated and evaluated as commercially productive Justification for assigning Reserves in such cases should be clearly documented Reserves should not be assigned to areas that are clearly separated from a known accumulation by non-productive reservoir (ie absence of reservoir structurally low reservoir or negative test results) such areas may contain Prospective Resources
In conventional accumulations where drilling has defined a highest known oil (HKO) elevation and there exists the potential for an associated gas cap Proved oil Reserves should only be assigned in the structurally higher portions of the reservoir if there is reasonable certainty that such portions are initially above bubble point pressure based on documented engineering analyses Reservoir portions that do not meet this certainty may be assigned as Probable and Possible oil andor gas based on reservoir fluid properties and pressure gradient interpretations
Competent Personrsquos Report African Petroleum Corporation Limited
June 2013 86
CONTINGENT RESOURCES
Contingent Resources are those quantities of petroleum estimated as of a given date to be potentially recoverable from known accumulations by application of development projects but which are not currently considered to be commercially recoverable due to one or more contingencies
Contingent Resources may include for example projects for which there are currently no viable markets or where commercial recovery is dependent on technology under development or where evaluation of the accumulation is insufficient to clearly assess commerciality Contingent Resources are further categorized in accordance with the level of certainty associated with the estimates and may be sub-classified based on project maturity andor characterized by their economic status
UNDISCOVERED PETROLEUM INITIALLY-IN-PLACE
Undiscovered Petroleum Initially in Place is that quantity of petroleum that is estimated as of a given date to be contained within accumulations yet to be discovered
PROSPECTIVE RESOURCES
Prospective Resources are those quantities of petroleum which are estimated as of a given date to be potentially recoverable from undiscovered accumulations
Potential accumulations are evaluated according to their chance of discovery and assuming a discovery the estimated quantities that would be recoverable under defined development projects It is recognized that the development programs will be of significantly less detail and depend more heavily on analog developments in the earlier phases of exploration
Prospect
A project associated with a potential accumulation that is sufficiently well defined to represent a viable drilling target
Project activities are focused on assessing the chance of discovery and assuming discovery the range of potential recoverable quantities under a commercial development program
Lead
A project associated with a potential accumulation that is currently poorly defined and requires more data acquisition andor evaluation in order to be classified as a prospect
Project activities are focused on acquiring additional data andor undertaking further evaluation designed to confirm whether or not the lead can be matured into a prospect Such evaluation includes the assessment of the chance of discovery and assuming discovery the range of potential recovery under feasible development scenarios
Play
Competent Personrsquos Report African Petroleum Corporation Limited
June 2013 87
A project associated with a prospective trend of potential prospects but which requires more data acquisition andor evaluation in order to define specific leads or prospects
Project activities are focused on acquiring additional data andor undertaking further evaluation designed to define specific leads or prospects for more detailed analysis of their chance of discovery and assuming discovery the range of potential recovery under hypothetical development scenarios
The range of uncertainty of the recoverable andor potentially recoverable volumes may be represented by either deterministic scenarios or by a probability distribution When the range of uncertainty is represented by a probability distribution a low best and high estimate shall be provided such that
bull There should be at least a 90 probability (P90) that the quantities actually recovered will equal or exceed the low estimate
bull There should be at least a 50 probability (P50) that the quantities actually recovered will equal or exceed the best estimate
bull There should be at least a 10 probability (P10) that the quantities actually recovered will equal or exceed the high estimate
When using the deterministic scenario method typically there should also be low best and high estimates where such estimates are based on qualitative assessments of relative uncertainty using consistent interpretation guidelines Under the deterministic incremental (risk-based) approach quantities at each level of uncertainty are estimated discretely and separately
These same approaches to describing uncertainty may be applied to Reserves Contingent Resources and Prospective Resources While there may be significant risk that sub-commercial and undiscovered accumulations will not achieve commercial production it useful to consider the range of potentially recoverable quantities independently of such a risk or consideration of the resource class to which the quantities will be assigned
Evaluators may assess recoverable quantities and categorize results by uncertainty using the deterministic incremental (risk-based) approach the deterministic scenario (cumulative) approach or probabilistic methods (see ldquo2001 Supplemental Guidelinesrdquo Chapter 25) In many cases a combination of approaches is used
Use of consistent terminology (Figure 11) promotes clarity in communication of evaluation results For Reserves the general cumulative terms lowbesthigh estimates are denoted as 1P2P3P respectively The associated incremental quantities are termed Proved Probable and Possible Reserves are a subset of and must be viewed within context of the complete Resources classification system While the categorization criteria are proposed specifically for Reserves in most cases they can be equally applied to Contingent and Prospective Resources conditional upon their satisfying the criteria for discovery andor development
Competent Personrsquos Report African Petroleum Corporation Limited
June 2013 88
For Contingent Resources the general cumulative terms lowbesthigh estimates are denoted as 1C2C3C respectively For Prospective Resources the general cumulative terms lowbesthigh estimates still apply No specific terms are defined for incremental quantities within Contingent and Prospective Resources
Without new technical information there should be no change in the distribution of technically recoverable volumes and their categorization boundaries when conditions are satisfied sufficiently to reclassify a project from Contingent Resources to Reserves All evaluations require application of a consistent set of forecast conditions including assumed future costs and prices for both classification of projects and categorization of estimated quantities recovered by each project
Competent Personrsquos Report African Petroleum Corporation Limited
June 2013 89
8 Appendix 2 Nomenclature
81 Units degC degrees Celsius
degF degrees Fahrenheit
bbl barrel
cp centipoises
ft feet
ftMDRKB feet below Kelly Bushing
ftTVDSS feet subsea
km kilometres
m metres
M or MM thousands and millions respectively
ms metres per second
md millidarcy
mTVDSS metres subsea
psia pounds per square inch absolute
psig pounds per square inch gauge
pu porosity unit
rb reservoir barrels
stb a stock tank barrel which is 42 US gallons measured at 147 pounds per square inch and 60 degrees Fahrenheit
82 Reserves and Resources Classifications
Low Low estimate of Prospective Resources as defined in SPE PRMS 2007
Best Best estimate of Prospective Resources as defined in SPE PRMS 2007
High High estimate of Prospective Resources as defined in SPE PRMS 2007
COS Geological Chance of Success associated with Prospective Resources
P10 10 per cent probability = Proved + Probable + Possible or 3P
P50 50 per cent probability = Proved + Probable or 2P
P90 90 per cent probability = Proved or 1P
83 Abbreviations AvO amplitude variation with offset
Bo oil shrinkage factor or formation volume factor in rbstb
Competent Personrsquos Report African Petroleum Corporation Limited
June 2013 90
CPI computer processed information log
FVF formation volume factor
FWL free water level
GRV gross rock volume
GWC gas water contact
KB kelly bushing
kh permeability thickness
MD measured depth
MSL mean sea level
NG net to gross ratio
OWC oil water contact
Phi porosity
PSC production sharing contract
PSDM post stack depth migration
PSTM post stack time migration
PVT pressure volume temperature experiment
RFT repeat formation tester
So oil saturation
Soi initial oil saturation
SS Subsea
STOIIP stock tank oil initially in place
Sw water saturation
Swc connate water saturation
TD total depth
TOC total organic carbon
TVD true vertical depth
TWT two way time
Vsh shale volume
Competent Personrsquos Report African Petroleum Corporation Limited
June 2013 91
Enclosures Resource Summary Sheets
Enclosure 11 Summary Description Sheet Barbet Prospect
SummaryBlock 9
APC Interest () 100
Fluid Oil
Crest (m ss) 3000
Water depth (m) 750
Notes
Area Shape F Areal NG Net Thick Porosity SO Bo STOIIP Rf Rec Res(km2) (frac) () (m) () () (rbstb) (MMstb) (frac) (MMstb)
Charge 90
Reservoir 70 Low 14 085 62 22 13 73 135 166 0300 60
Trap 50 Best 37 090 80 34 17 80 150 500 0375 186
Seal 70 High 98 095 98 53 20 88 165 1479 0450 558
COS 22 Deterministic inputs probabilistic STOIIP and Rec Resource Mean 270
Stratigraphic trap with amplitude support
Geological Risk Matrix
P10
P90metres
BARBET
dtdƐͿ
ϬŬŵϰ
Enclosure 12 Summary Description Sheet Sunbird Prospect Campanian Reservoir
SummaryBlock 8 amp 9
APC Interest () 100
Fluid Oil
Crest (m ss) 3000
Water depth (m) 1300
Notes
Area Shape F Areal NG Net Thick Porosity SO Bo STOIIP Rf Rec Res(km2) (frac) () (m) () () (rbstb) (MMstb) (frac) (MMstb)
Charge 80
Reservoir 80 Low 12 070 43 27 18 73 130 177 0300 63
Trap 60 Best 27 080 69 42 21 80 145 461 0375 172
Seal 70 High 61 090 95 66 24 88 165 1187 0450 448
COS 27 Deterministic inputs probabilistic STOIIP and Rec Resource Mean 229
Stratigraphic trap with amplitude support Split by intra-canyon
high
Geological Risk Matrix
P90
P10
metres
SUNBIRD
dtdƐͿ
ϬŬŵϰSUNBIRD
Enclosure 13 Summary Description Sheet Sunbird prospect Turonian Reservoir
SummaryBlock 8 amp 9
APC Interest () 100
Fluid Oil
Crest (m ss) 3300
Water depth (m) 1300
Notes
Area Shape F Areal NG Net Thick Porosity SO Bo STOIIP Rf Rec Res(km2) (frac) () (m) () () (rbstb) (MMstb) (frac) (MMstb)
Charge 90
Reservoir 60 Low 8 085 65 24 14 73 140 107 0300 39
Trap 50 Best 21 090 80 37 17 80 158 307 0375 115
Seal 70 High 53 095 94 58 20 88 175 863 0450 327
COS 19 Deterministic inputs probabilistic STOIIP and Rec Resource Mean 162
Stratigraphic trap with amplitude support Split by intra-canyon
high
Geological Risk Matrix
SW NE
Campanian Jacana Channel
Turonian BFF
P90
P10
metres
SUNBIRD
ϬŬŵϰ
Enclosure 14 Summary Description Sheet Sunbird Prospect Cenomanian Reservoir
SummaryBlock 8 amp 9
APC Interest () 100
Fluid Oil
Crest (m ss) 3500
Water depth (m) 1300
Notes
Area Shape F Areal NG Net Thick Porosity SO Bo STOIIP Rf Rec Res(km2) (frac) () (m) () () (rbstb) (MMstb) (frac) (MMstb)
Charge 100
Reservoir 50 Low 10 060 71 21 14 73 140 91 0300 33
Trap 60 Best 25 070 85 33 17 80 158 264 0375 99
Seal 60 High 65 080 99 51 20 88 175 779 0450 294
COS 18 Deterministic inputs probabilistic STOIIP and Rec Resource Mean 141
Stratigraphic trap with amplitude support Split by intra-canyon
high
Geological Risk Matrix
P90
P10
metres
SUNBIRD
dtdƐͿ
ϬŬŵϮ
Enclosure 15 Summary Description Sheet Lovebird Prospect Blue Horizon
SummaryBlock 8
APC Interest () 100
Fluid Oil
Crest (m ss) 5000
Water depth (m) 2850
Notes
GRV NG Porosity SO Bo STOIIP Rf Rec Res(MMm2) () () () (rbstb) (MMstb) (frac) (MMstb)
Charge 54
Reservoir 60 Low 354 30 14 60 150 68 030 25
Trap 70 Best 1310 54 19 70 180 293 038 109
Seal 90 High 4849 73 24 80 210 1218 045 456
COS 20 Mean 201
Four way dip closure to south of Block 8 Three potential
reservoirs identified Blue and Green horizon volumetrics derived
assuming ispoachous to Pink
Geological Risks
ŝŐŚĂƐĞWŝŶŬĞƉƚŚDĂƉ
Enclosure 16 Summary Description Sheet Lovebird Prospect Pink Horizon
SummaryBlock 8
APC Interest () 100
Fluid Oil
Crest (m ss) 5400
Water depth (m) 2850
Notes
GRV NG Porosity SO Bo STOIIP Rf Rec Res(MMm2) () () () (rbstb) (MMstb) (frac) (MMstb)
Charge 54
Reservoir 60 Low 354 30 12 60 155 59 030 22
Trap 70 Best 1310 54 17 70 188 262 038 96
Seal 90 High 4849 73 22 80 220 1066 045 400
COS 20 Mean 178
Four way dip closure to south of Block 8 Three potential
reservoirs identified Blue and Green horizon volumetrics derived
assuming ispoachous to Pink
Geological Risks
ŝŐŚĂƐĞWŝŶŬĞƉƚŚDĂƉ
Enclosure 17 Summary Description Sheet Lovebird Prospect Green Horizon
SummaryBlock 8
APC Interest () 100
Fluid Oil
Crest (m ss) 5800
Water depth (m) 2850
Notes
GRV NG Porosity SO Bo STOIIP Rf Rec Res(MMm2) () () () (rbstb) (MMstb) (frac) (MMstb)
Charge 54
Reservoir 60 Low 354 30 10 60 160 48 030 18
Trap 70 Best 1310 54 15 70 195 210 038 78
Seal 90 High 4849 73 20 80 230 896 045 337
COS 20 Mean 150
Four way dip closure to south of Block 8 Three potential
reservoirs identified Blue and Green horizon volumetrics derived
assuming ispoachous to Pink
Geological Risks
ŝŐŚĂƐĞWŝŶŬĞƉƚŚDĂƉ
Enclosure 18 Summary Description Sheet Wildbird Prospect
SummaryORFN $3ampQWHUHVW )OXLG 2LOampUHVWPVV DWHUGHSWKP P
Notes
Play Risk Prospect RiskGRV NG Porosity SO Bo STOIIP Rf Rec Res
6RXUFH 7UDS (MMm2) () () () (rbstb) (MMstb) (frac) (MMstb)6HDO ampKDUJH 5HVHUYRLU3UHV 5HVHUYRLU(II Low
Best High
COS 9 Deterministic inputs probabilistic STOIIP and Rec Resource Mean
)RXUZDGLSFORVHGKLJK
5
0 km 5
6 1(
PVV
Wildbird Horizons
ODFNEHUULJKWOXH3LQN5HG
mss
Enclosure 19 Summary Description Sheet Night Heron Prospect
SummaryORFN $3ampQWHUHVW RIORFN)OXLG 2LOampUHVWPVV DWHUGHSWKP
Notes
Prospect Risk Area Areal NG Net Porosity SO Bo STOIIP Rf Rec ResampKDUJH (km2) (frac) (m) () () (rbstb) (MMstb) (frac) (MMstb)5HVHUYRLU 7UDS Low 6HDO Best
High COS 144 Deterministic inputs probabilistic STOIIP and Rec Resource Mean 759
1LJKW+HURQLVD7XURQLDQEDVLQIORRUIDQVVWHPZKLFKPDLQOOLHVZLWKLQEORFNRIIVKRUHLEHULDWLVLGHQWLILHGDVDVWUDWLJUDSKLFWUDSZLWKDUHDOH[WHQWVGHILQHGEDPSOLWXGHWUXQFDWLRQDQGVWUXFWXUDOSLQFKRXW$QDUHDQHWDSSURDFKZDVDGRSWHGXVLQJWKHIXOOVWDFN360GHSWKLPDJHYROXPHWRSURYLGH61$H[WUDFWLRQDQGFRQVWUDLQDUHDOH[WHQWDQGHVWLPDWHDQDUHDO1WRDFFRXQWIRUODWHUDOYDULDELOLWZLWKLQWKHUHVHUYRLU1LJKW+HURQIDOOVSDUWORIIEORFN(5amp(FRUUHFWIRUWKLVXVLQJWKHUDWLRRIRQEORFNWRRIIEORFNDUHDLQUHSRUWLQJRIQHWXQULVNHGDQGQHWULVNHGUHVXOWV
6HLVPLFLQH36061$([WUDFWLRQ
Arbitrary line across Night Heron PSDM (Depth m)
S NE
2QWKHXSGLSSLQFKRXWLVGHILQHGELVRSDFKDQGDPSOLWXGHWUXQFDWLRQ
2QWKHXSGLSSLQFKRXWLVGHILQHGRQOELVRSDFK
Bee EaterNight Heron
5 Km
RMS Amplitudes from BFF Isopach
Depth (m)
Block Boundary
Enclosure 21 Summary Description Sheet
Summary - M - CretBlock A1
Working Interest () 60
Fluid Oil
Crest (m) 3130 (1070 bml)
Water depth (m) 2220
Notes
Play Risk Prospect Risk Area Stack F Net Porosity SO Bo STOIIP Rf Rec Res(Km2) (frac) (m) () () (rbstb) (MMstb) (frac) (MMstb)
Source 70 Trap 54
Seal 50 Mig 80 Low 8 1 15 10 55 125 82 010 13
Res Pres 80 Res Eff 80 Best 14 1 30 16 65 117 231 023 43
28 35 High 26 1 60 22 75 110 629 035 141
COS 10 Deterministic inputs probabilistic STOIIP and Rec Resource Mean 66
Structural high along edge of buried carbonate platform margin of
probable Lower Cretaceous and Jurassic age Seismic evidence
favourable for reservoir development Lower Bo model used to
reflect relatively shallow nature of prospect The prospect is close
to the shelf margin and so is well placed for charging The strong
rugose seismic events are interpreted as Karstified Limestones
Seismic Line Top Structure Map
WƌŽƐƉĞĐƚD
ĞƉƚŚŵ
Ϳ
Enclosure 22 Summary Description Sheet
Summary - SS - 4Block A1
Working Interest () 60
Fluid Oil
Crest (m) 4230 (2010 bml)
Water depth (m) 2220
Notes
Play Risk Prospect Risk Area Stack F Net Porosity SO Bo STOIIP Rf Rec Res(Km2) (frac) (m) () () (rbstb) (MMstb) (frac) (MMstb)
Source 70 Trap 80
Seal 90 Mig 85 Low 6 1 10 16 68 220 43 030 16
Res Pres 80 Res Eff 50 Best 11 1 19 20 75 167 113 038 42
50 34 High 21 1 35 24 83 135 295 045 112
COS 17 Deterministic inputs probabilistic STOIIP and Rec Resource Mean 56
Four way dip closed anticlinal structure The SS-4 interval has a
gross thickness over the crest area of 360 m Downlap of seismic
events across the crest of the SS-4 structure slightly downgrades
SS-4 seal The interval is believed to be Cenomanian in age and
the seismic character of generally planar events is interpreted as
representing thin bedded turbidites
Seismic Line Top Structure Map
2010 Migration Velocity Data ndash SS-4 Probability Above Spill
Enclosure 23 Summary Description Sheet
Summary - SS - 3Block A1
Working Interest () 60
Fluid Oil
Crest (m) 4590 (2370 bml)
Water depth (m) 2220
Notes
Play Risk Prospect Risk Area Stack F Net Porosity SO Bo STOIIP Rf Rec Res(Km2) (frac) (m) () () (rbstb) (MMstb) (frac) (MMstb)
Source 70 Trap 75
Seal 90 Mig 85 Low 12 1 20 15 68 227 197 025 63
Res Pres 80 Res Eff 50 Best 17 15 35 18 75 173 417 034 143
50 32 High 25 2 60 20 83 140 881 045 316
COS 16 Deterministic inputs probabilistic STOIIP and Rec Resource Mean 173
Four way dip closed anticlinal structure The SS-3 interval has a
gross thickness over the crest area of 550 m Seals to deeper
reservoirs may be eroded by overlying reservoirs From seismic
the prospective reservoir has been interpreted as being an Albian
deep water channel-lobe complex
Seismic Line Top Structure Map
2010 Migration Velocity Data ndashSS-3 Probability Above Spill
Enclosure 24 Summary Description Sheet
Summary - SS - 2Block A1
Working Interest () 60
Fluid Oil
Crest (m) 5140 (2920 bml)
Water depth (m) 2220
Notes
Play Risk Prospect Risk Area Stack F Net Porosity SO Bo STOIIP Rf Rec Res(Km2) (frac) (m) () () (rbstb) (MMstb) (frac) (MMstb)
Source 70 Trap 75
Seal 90 Mig 85 Low 12 1 20 11 68 231 187 025 58
Res Pres 80 Res Eff 50 Best 17 2 35 14 75 183 416 032 133
50 32 High 25 3 60 17 83 151 911 040 303
COS 16 Deterministic inputs probabilistic STOIIP and Rec Resource Mean 163
Four way dip closed anticlinal structure The SS-2 interval has a
gross thickness over the crest area of 830 m The prospective
reservoir has been interpreted as a stacked series of channellobe
sets Seals to deeper reservoirs may be eroded by overlying
reservoirs
Seismic Line Top Structure Map
2010 Migration Velocity Data ndashSS-2 Probability Above Spill
Enclosure 25 Summary Description Sheet
Summary - SS - 1Block A1
Working Interest () 60
Fluid Oil
Crest (m) 5970 (3750 bml)
Water depth (m) 2220
Notes
Play Risk Prospect Risk Area Stack F Net Porosity SO Bo STOIIP Rf Rec Res(Km2) (frac) (m) () () (rbstb) (MMstb) (frac) (MMstb)
Source 70 Trap 65
Seal 90 Mig 80 Low 17 1 20 8 50 249 158 015 34
Res Pres 80 Res Eff 50 Best 30 2 35 11 60 196 399 024 98
50 26 High 54 3 60 13 70 162 997 040 276
COS 13 Deterministic inputs probabilistic STOIIP and Rec Resource Mean 135
Four way dip closed anticlinal structureThe SS-1 interval has a
gross thickness over the crest area of 890 m The prospective
reservoir lies under an unconformity and is believed to be Jurassic
in age its seismic character suggests a channel amp channel-levee
complex Regional porosity trends indicate low porosities are likely
to be encountered if hydrostatic pressures are assumed
Seismic Line Top Structure Map
2010 Migration Velocity Data ndash SS-1 Probability Above Spill
Enclosure 31 Summary Description Sheet
SummaryBlock SL-03
APCL Interest () 90
Fluid Oil
Crest (m ss) 5400
Water depth (m) 3300
Notes
Play Risk Prospect Risk Area Areal NG Net Porosity SO Bo STOIIP Rf Rec Res(km2) (frac) (m) () () (rbstb) (MMstb) (frac) (MMstb)
Source 80 Trap 50
Seal 90 Mig 70 Low 11 070 29 15 73 205 218 030 79
Res Pres 90 Res Eff 80 Best 32 082 56 18 80 162 755 038 278
65 28 High 92 094 83 21 88 134 2473 045 938
COS 18 Mean 434
Altair is a Turonian turbidite channel prospects within the
SL-03 Block offshore Sierra Leone It is identified as a
stratigraphic trap with areal extents defined by amplitude
truncation and structural pinchout Recent discoveries in
nearby blocks confirm a working hydrocarbon system
(Venus-B1 Jupiter-1 and Mercury-1) The Sierra Leone
wells A-1 and A1-2 proved good reservoir and potential
source rocks Two distinct canyon systems feed erosive
channels at the break of slope An area net approach was
adopted using a pseudo-gradient volume SNA extraction to
constrain areal extent and define an areal NG to account
for lateral variability of sand distribution within the
reservoir
Arbitrary Dip Line Grad TWTGrad NRMS Extraction
Enclosure 41 Summary Description Sheet
SummaryBlock CI-513
APCL Interest () 90
Fluid Oil
Crest (m ss) 4200
Water depth (m) 2500
Notes
Play Risk Prospect Risk Area Areal NG Net Porosity SO Bo STOIIP Rf Rec Res(km2) (frac) (m) () () (rbstb) (MMstb) (frac) (MMstb)
Source 60 Trap 50
Seal 90 Mig 70 Low 11 070 20 17 73 181 179 030 65
Res Pres 90 Res Eff 80 Best 40 085 38 20 80 149 815 038 302
49 28 High 149 099 55 23 88 126 3474 045 1318
COS 14 Mean 569
Ayame is an Upper Cretaceous fan which mainly lies
ZLWKLQEORFNampRIIVKRUHampRWHparaYRLUHWLVLGHQWLILHGas a stratigraphic trap with areal extents defined by
amplitude truncation and structural pinchout The prospect
has very good amplitude support An area net approach
was adopted using pseudo-gradient volume SNA NRMS
extractions to constrain areal extent and define an areal
NG to account for lateral variability of sand distribution
within the reservoir for low and high case area polygons
These seismically defined polygons were then filled to
column heights of 200m and 800m respectively and used
to constrain the P90 and P10 area inputs of our
probabilistic simulation
Seismic Line
TWT Grad SNA Extraction
Ayame
Ayame West
dtdƐͿ
Ayame
Enclosure 42 Summary Description Sheet
SummaryBlock CI-513 amp Open
APCL Interest () 90 in CI-513
Fluid Oil
Crest (m ss) 4900
Water depth (m) 2700
Notes
Play Risk Prospect Risk Area Areal NG Net Porosity SO Bo STOIIP Rf Rec Res(km2) (frac) (m) () () (rbstb) (MMstb) (frac) (MMstb)
Source 60 Trap 50
Seal 90 Mig 70 Low 10 061 25 14 73 194 161 030 58
Res Pres 90 Res Eff 80 Best 30 080 47 18 80 159 585 038 216
49 28 High 93 099 69 21 88 134 2085 045 788
COS 14 Mean 352
A second prospect within the same reservoir interval was
identified and volumetrically assessed Ayame West is
separated from Ayame by a structural high isopach
thinning and amplitude dimming The prospect was
assessed in the same manner as Ayame with a but with
Low Case column height of 600m filling down to the point
at which amplitudes between the two fans brighten
allowing possible communication The upper end of the
Ayame West fan lies down-dip of Ayame and less than
1km away from the thinning low amplitude saddle between
the two prospects
Seismic Line
TWT Grad SNA Extraction
Ayame
West
Ayame West
dtdƐͿ
Ayame
Enclosure 43 Summary Description Sheet
SummaryBlock CI-513 CI-509
APCL Interest () 90 of CI-513
Fluid Oil
Crest (m ss) 4400
Water depth (m) 2500
Notes
Play Risk Prospect Risk Area Areal NG Net Porosity SO Bo STOIIP Rf Rec Res(km2) (frac) (m) () () (rbstb) (MMstb) (frac) (MMstb)
Source 60 Trap 40
Seal 90 Mig 70 Low 6 070 15 16 73 185 71 030 26
Res Pres 90 Res Eff 70 Best 23 084 28 19 80 152 320 038 118
49 20 High 92 098 42 22 88 129 1408 045 521
COS 10 Mean 237
This sheet refers to volumes associated with Blocks 513 and CI-509 Sassandra is an Upper Cretaceous fan
which straddles blocks CI-513 and CI-509 It is identified
as a stratigraphic trap with areal extents defined by
amplitude truncation and structural pinchout A single
target reservoir is identified within the Turonian The
prospect has good amplitude support An area times net
approach was adopted using a pseudo-gradient volume
NRMS extraction to constrain prospect size Angle stacks
were not available outside of Block CI-513 so an RMS
extraction on the full stack volume was used to determine
NW extent In our low case we restrict the area of the
accumulation to the brightest area of anomalous
amplitudes Our high case extends the prospect down-dip
Arbitrary Dip Line Grad TWT
Full Stack - RMS Extraction
Sassandra
dtdƐͿ
Enclosure 44 Summary Description Sheet
SummaryBlock CI-513
APCL Interest () 90
Fluid Oil
Crest (m ss) 3900
Water depth (m) 2500
Notes
Play Risk Prospect Risk Area Areal NG Net Porosity SO Bo STOIIP Rf Rec Res(km2) (frac) (m) () () (rbstb) (MMstb) (frac) (MMstb)
Source 60 Trap 40
Seal 90 Mig 70 Low 4 071 20 19 73 185 67 030 25
Res Pres 90 Res Eff 70 Best 13 085 38 22 80 152 281 038 104
49 20 High 46 099 55 25 88 129 1142 045 431
COS 10 Mean 190
Cavalla is an Upper Cretaceous Fan which lies between
the Ayame and Sassandra prospects of Block CI-513
RIIVKRUHampRWHparaYRLUHWLVLGHQWLILHGDVDVWUDWLJUDSKLFtrap with areal extents defined by amplitude truncation and
structural pinchout A single target reservoir is identified
within the TuronianCenomanian interval which lies
stratigraphically beneath the Ayame Prospect For the
amplitude analysis the top reservoir has been shifted up
30ms to bracket strong negative amplitudes on the
Gradient volume and the base reservoir has been shifted
up 50ms to remove Albian related amplitudes An area net
approach was adopted using pseudo-gradient volume SNA
NRMS extractions to constrain extent of the low and high
case area polygons These seismically defined polygons
were then filled to column heights of 200m and 800m
respectively
Arbitrary Dip Line Grad TWT Grad NRMS Extraction
Cavalla
dtdƐͿ
Enclosure 45 Summary Description Sheet
SummaryBlock CI-509
APCL Interest () 90
Fluid Oil
Crest (m ss) 3700
Water depth (m) 2500
Notes
Play Risk Prospect Risk Area Areal NG Net Porosity SO Bo STOIIP Rf Rec Res(km2) (frac) (m) () () (rbstb) (MMstb) (frac) (MMstb)
Source 60 Trap 60
Seal 90 Mig 70 Low 5 076 39 21 73 150 252 015 55
Res Pres 90 Res Eff 80 Best 18 088 75 24 80 134 997 028 258
49 34 High 61 100 111 27 88 121 3682 040 1039
COS 16 Mean 460
Leraba is an Upper Cretaceous fan It is identified as a
stratigraphic trap with extents defined by amplitude
truncation and structural pinchout The final processing
products and AvO volumes are yet to be delivered for CI-
KRZHYHUWKHmicroHRWUDFHUDZPLJUDWLRQVWDFNparaYROXPHLVof high quality and is deemed suitable for deriving a
volumetric range for Leraba An area net approach was
adopted using an RMS extraction to constrain extent and
define an areal NG to account for lateral variability of sand
distribution In our low case we restrict the area to the
brightest area of anomalous amplitudes Our high case
extends the prospect down-dip and SW to include a
secondary channel system
Arbitrary Dip Line TWT Full Stack RMS Extraction
Leraba
dtdƐͿ
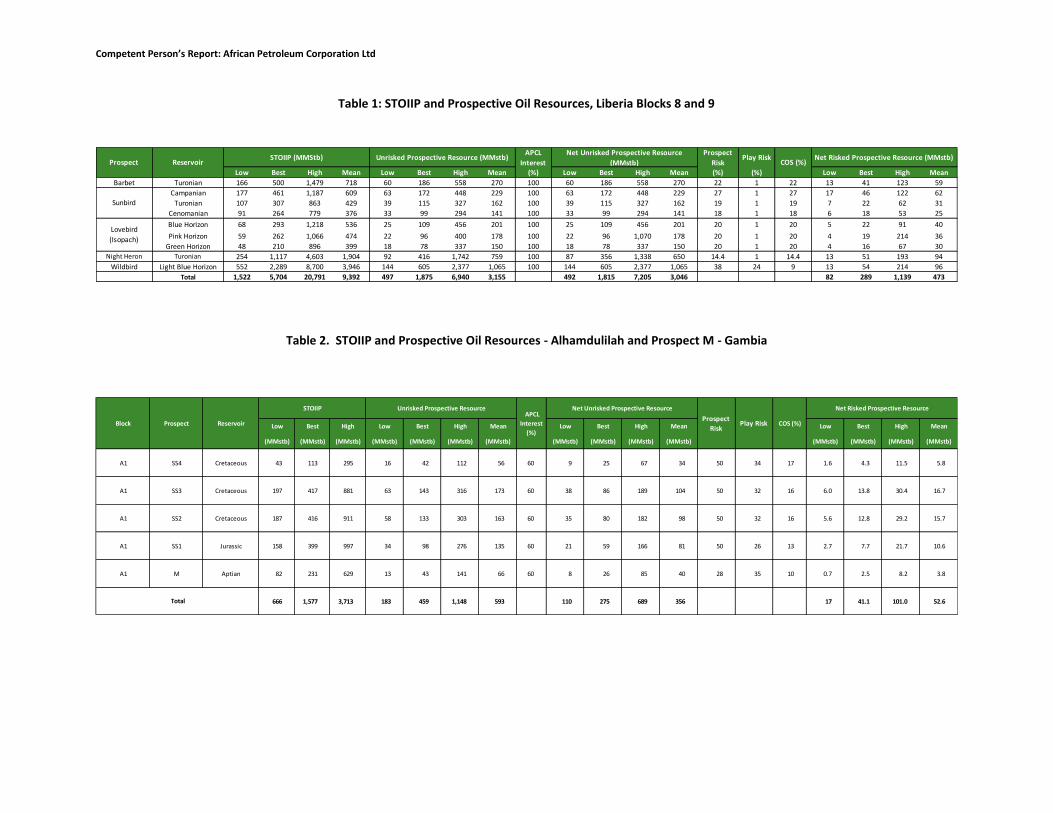
Competent Personrsquos Report African Petroleum Corporation Ltd
Table 1 STOIIP and Prospective Oil Resources Liberia Blocks 8 and 9
Table 2 STOIIP and Prospective Oil Resources - Alhamdulilah and Prospect M - Gambia
APCL Interest
Prospect Risk
Play Risk
Low Best High Mean Low Best High Mean () Low Best High Mean () () Low Best High MeanBarbet Turonian 166 500 1479 718 60 186 558 270 100 60 186 558 270 22 1 22 13 41 123 59
Campanian 177 461 1187 609 63 172 448 229 100 63 172 448 229 27 1 27 17 46 122 62Turonian 107 307 863 429 39 115 327 162 100 39 115 327 162 19 1 19 7 22 62 31
Cenomanian 91 264 779 376 33 99 294 141 100 33 99 294 141 18 1 18 6 18 53 25Blue Horizon 68 293 1218 536 25 109 456 201 100 25 109 456 201 20 1 20 5 22 91 40Pink Horizon 59 262 1066 474 22 96 400 178 100 22 96 1070 178 20 1 20 4 19 214 36
Green Horizon 48 210 896 399 18 78 337 150 100 18 78 337 150 20 1 20 4 16 67 30Night Heron Turonian 254 1117 4603 1904 92 416 1742 759 100 87 356 1338 650 144 1 144 13 51 193 94
Wildbird Light Blue Horizon 552 2289 8700 3946 144 605 2377 1065 100 144 605 2377 1065 38 24 9 13 54 214 96Total 1522 5704 20791 9392 497 1875 6940 3155 492 1815 7205 3046 82 289 1139 473
ReservoirProspect
Sunbird
Unrisked Prospective Resource (MMstb)STOIIP (MMStb) Net Unrisked Prospective Resource (MMstb) COS () Net Risked Prospective Resource (MMstb)
Lovebird (Isopach)
Low Best High Low Best High Mean Low Best High Mean Low Best High Mean
(MMstb) (MMstb) (MMstb) (MMstb) (MMstb) (MMstb) (MMstb) (MMstb) (MMstb) (MMstb) (MMstb) (MMstb) (MMstb) (MMstb) (MMstb)
A1 SS4 Cretaceous 43 113 295 16 42 112 56 60 9 25 67 34 50 34 17 16 43 115 58
A1 SS3 Cretaceous 197 417 881 63 143 316 173 60 38 86 189 104 50 32 16 60 138 304 167
A1 SS2 Cretaceous 187 416 911 58 133 303 163 60 35 80 182 98 50 32 16 56 128 292 157
A1 SS1 Jurassic 158 399 997 34 98 276 135 60 21 59 166 81 50 26 13 27 77 217 106
A1 M Aptian 82 231 629 13 43 141 66 60 8 26 85 40 28 35 10 07 25 82 38
666 1577 3713 183 459 1148 593 110 275 689 356 17 411 1010 526 Total
Net Risked Prospective Resource APCL
Interest ()
Net Unrisked Prospective Resource Prospect
RiskPlay Risk Block Prospect Reservoir
STOIIP Unrisked Prospective Resource
COS ()
Competent Personrsquos Report African Petroleum Corporation Ltd
Table 3 STOIIP and Prospective Oil Resources ndash Cote DrsquoIvoire
Table 4 STOIIP and Prospective Oil Resources - Sierra Leone
Low Best High Low Best High Mean Low Best High Mean Low Best High Mean
(MMstb) (MMstb) (MMstb) (MMstb) (MMstb) (MMstb) (MMstb) (MMstb) (MMstb) (MMstb) (MMstb) (MMstb) (MMstb) (MMstb) (MMstb)
CI-513 AyameUpper
Cretaceous179 815 3474 65 302 1318 569 90 58 267 1138 502 49 28 14 80 363 1549 683
CI-513 Ayame WestUpper
Cretaceous161 585 2085 58 216 788 352 90 52 183 626 298 49 28 14 71 249 852 406
CI-513 Sassandra Upper
Cretaceous71 320 1408 26 118 521 237 90 23 87 300 175 49 20 10 22 83 286 166
CI-513 CavallaUpper
Cretaceous67 281 1142 25 104 431 190 90 22 93 388 171 49 20 10 21 89 370 163
CI-509 LerabaUpper
Cretaceous252 997 3682 55 258 1039 460 90 50 232 935 414 49 34 16 82 380 1527 676
731 2998 11792 229 999 4097 1808 206 863 3387 1560 275 1164 4583 2094TOTAL
COS ()
Net Risked Prospective Resource
Interest ()
Net Unrisked Prospective Resource
Block Prospect Reservoir
STOIIP Unrisked Prospective ResourcePlay Risk
()Prospect Risk ()
Low Best High Low Best High Mean Low Best High Mean Low Best High Mean
(MMstb) (MMstb) (MMstb) (MMstb) (MMstb) (MMstb) (MMstb) (MMstb) (MMstb) (MMstb) (MMstb) (MMstb) (MMstb) (MMstb) (MMstb)
SL-03 AltairUpper
Cretaceous218 755 2473 79 278 938 434 100 79 278 938 434 65 28 18 144 504 1702 788
Table 4 STOIIP and Prospective Oil Resources - Sierra Leone
Block Prospect Reservoir
STOIIP Unrisked Prospective ResourcePlay Risk
()Prospect Risk ()
COS ()
Net Risked Prospective Resource
Interest ()
Net Unrisked Prospective Resource
Competent Personrsquos Report
African Petroleum Corporation Limited
PREPARED FOR African Petroleum Corporation Limited
BY ERC Equipoise Limited
June 2013
Competent Personrsquos Report African Petroleum Corporation Limited
June 2013
Authors Adam Law Michael Braim Glyn Pugh Kate Overy Don Munn
Approved by Simon McDonald
Date released to client June 25 2013
ERC Equipoise Limited (ldquoERC13 Equipoiserdquo13 or13 ldquoERCErdquo) has made every effort to ensure that the interpretations conclusions and recommendations presented herein are accurate and reliable in accordance with good industry practice ERC Equipoise does not however guarantee the correctness of any such interpretations and shall not be liable or responsible for any loss costs damages or expenses incurred or sustained by anyone resulting from any interpretation or recommendation made by any of its officers agents or employees
Competent Personrsquos Report African Petroleum Corporation Limited
June 2013
Table of Contents 1 Introduction 14
11 Liberia PSC Overview 16
12 Gambia PSC Review 17
13 Senegal PSC Review 18
14 Sierra Leone PSC Review 19
15 Cote drsquoIvoire PSC Review 21
16 Evaluation Methodology Prospective Resources 22
2 Liberia Prospectivity and Plays 26
21 Introduction 26
22 Well and Seismic Database 27
23 Plays and Petroleum Geology Blocks 8 and 9 29
24 Play and Prospect Risk Liberia Blocks 8 and 9 31
25 Liberia Blocks 8 and 9 Leads and Prospects 33
251 Barbet Prospect 34
252 Sunbird Canyon Prospect 36
253 Night Heron 39
254 Lovebird Prospect 42
255 Wildbird Prospect 44
3 Gambia Prospectivity and Plays 47
31 Introduction 47
32 Well and Seismic Database 48
33 Plays and Petroleum Geology Blocks A1 and A4 49
34 Play Risk 51
35 Gambia Leads and Prospects 53
351 Alhamdulilah Prospect 54
352 Prospect M 57
4 Sierra Leone Prospectivity and Plays 59
41 Play Risk 62
41 Sierra Leone Leads and Prospects 62
Competent Personrsquos Report African Petroleum Corporation Limited
June 2013
411 Altair 62
5 Cote drsquoIvoire Prospectivity and Plays 65
51 Introduction 65
52 Well and Seismic Database 66
53 Plays and Petroleum Geology Blocks CI-509 and CI-513 67
54 Play Risk 68
55 Cote drsquoIvoire Blocks CI-509 and CI-503 Leads and Prospects 69
551 Ayame amp Ayame West 69
552 Sassandra 71
553 Cavalla 73
554 Leraba 75
6 Senegal Prospectivity and Plays 78
7 Appendix 1 SPE PRMS Guidelines 80
8 Appendix 2 Nomenclature 89
81 Units 89
82 Reserves and Resources Classifications 89
83 Abbreviations 89
Enclosures Resource Summary Sheets 91
Competent Personrsquos Report African Petroleum Corporation Limited
June 2013
List of Tables Table 11 Licence Summary Table 15 Table 12 Estimated oil recovery factors from producing Atlantic Margin fields 24 Table 13 Play and prospect risk system 24 Table 21 Play risk Cretaceous carbonate play Liberia Blocks 8 and 9 32 Table 31 Play risk Gambia Blocks A1 and A4 52 Table 41 Play risk Sierra Leone Block SL-03 62 Table 51 Play risk Cote drsquoIvoire Blocks CI-509 and CI-513 68
Competent Personrsquos Report African Petroleum Corporation Limited
June 2013
List of Figures Figure 1-1 Location of APCL licences West Africa 14 Figure 1-2 Location of Liberia Blocks 8 and 9 16 Figure 1-3 Location of Gambia Blocks A1 and A4 17 Figure 1-4 Location of Senegal ROP and SOSP Licences 18 Figure 1-5 Location of Blocks SL-03 and SL-04A 20 Figure 1-6 Location of Blocks CI-509 and CI-513 21 Figure 2-1 Notable discoveries West Africa offshore 27 Figure 2-2 Well and seismic database Liberia Blocks 8 and 9 28 Figure 2-3 Petroleum systems and plays Liberia Blocks 8 and 9 30 Figure 2-4 Porositydepth trend published West Africa turbidite reservoirs 31 Figure 2-5 Leads and Prospects Liberia Blocks 8 and 9 33 Figure 2-6 Seismic line (depth) over the Barbet prospect 34 Figure 2-7 Barbet far offset amplitudes with Top Turonian depth contours (m TVDSS) 35 Figure 2-8 Regional seismic line along axis of the Sunbird canyon system 36 Figure 2-9 Sunbird Campanian far offset amplitudes with Cenomanian depth contours (m TVDSS) 37 Figure 2-10 Sunbird Turonian far offset amplitudes with Top Turonian depth contours (m TVDSS) 38 Figure 2-11 Sunbird Cenomanian far offset amplitudes with Cenomanian depth contours (m TVDSS) 39 Figure 2-12 Arbitrary line across Night Heron PSDM (Depth m) 40 Figure 2-14 SNA from Basin Floor Fan Isopach (m) - PSDM 41 Figure 2-15 Seismic line over the Lovebird prospect 42 Figure 2-16 Lovebird prospect Top Pink horizon depth (mss) high case 43 Figure 2-17 Seismic line and prospect geo-seismic sketch Wildbird prospect 45 Figure 2-18 Wildbird Top Reservoir depth map (m TVDSS) Spill point - green contour 46 Figure 3-1 Plays Gambia Blocks A1 and A4 47 Figure 3-2 Wells 2D and 3D seismic data (red outline) Gambia Blocks A1 and A4 48 Figure 3-3 Well to seismic tie ndash Well Jammah-1 to the Alhamdulilah prospect 50 Figure 3-4 Leads and prospects identified by APCL in Gambia Blocks A1 and A4 53 Figure 3-5 Seismic line over the Alhamdulilah prospect 54 Figure 3-6 Area of closure Alhamdulilah prospect layers SS1 to SS4 55 Figure 3-7Alhamdulilah prospect seismic facies interpretation Cretaceous intervals 56 Figure 3-8 Seismic line through Prospect M 57 Figure 3-9 Low and high case closure Prospect M top Aptian depth (m TVDSS) 58 Figure 4-1 Offshore licences and discoveries Liberia and Sierra Leone 59 Figure 4-2 Well and seismic database offshore Sierra Leone 60 Figure 4-3 Leads Sierra Leone Block SL-03 61 Figure 4-4 Dip seismic line (full offsets) Altair prospect 63 Figure 4-5 Seismic amplitude (gradient stack) and Top Turonian depth (m TVDSS) Altair prospect 64 Figure 5-1 CI-509 and CI-513 Prospects and Leads offshore Cote drsquoIvoire 65
Competent Personrsquos Report African Petroleum Corporation Limited
June 2013
Figure 5-2 Petroleum systems and plays offshore Cote drsquoIvoire 66 Figure 5-3 Well and seismic database offshore Sierra Leone 67 Figure 5-4 Strike Line Ayame and Ayame West prospects 69 Figure 5-5 Ayame Seismic amplitude (gradient stack) and Top Turonian depth (m TVDSS) 70 Figure 5-6 Dip seismic line Sassandra prospect 71 Figure 5-7 Sassandra prospect Seismic amplitude and Top Turonian depth (m TVDSS) 72 Figure 5-8 Dip seismic line Cavalla prospect 74 Figure 5-9 Seismic amplitude (gradient stack) and Top fan depth (m TVDSS) Cavalla prospect 75 Figure 5-10 Dip seismic line Leraba prospect 76 Figure 5-11 Seismic amplitudes Leraba prospect 77 Figure 6-1 Petroleum systems and plays offshore Senegal 78 Figure 6-2 leads offshore Senegal Blocks ROP and SOSP 79
Competent Personrsquos Report African Petroleum Corporation Limited
June 2013 14
1 Introduction
At the time of writing African Petroleum Corporation Limited (APCL) holds interests in and operates exploration licences offshore West Africa within the territorial waters of Senegal the Gambia Sierra Leone Liberia and Cote drsquoIvoire (Figure 1-1) The status of these licences is summarised in Table 11 below ERC Equipoise Ltd (ERCE) has reviewed the prospectivity of these licences using data as of 31st May 2013
Figure 1-1 Location of APCL licences West Africa
Currently prospective resources are identified by APCL within the Liberia Gambia Sierra Leone and Cote drsquoIvoire licences We have made independent estimates of prospective resources and geological chance of success for certain prospects within these countries which are identified by APCL as near-term drilling opportunities The evaluation of the offshore Senegal licences is on-going and no prospects have been identified as of the date of this report We summarise qualitatively the prospectivity of the licences held by APCL in this country
Competent Personrsquos Report African Petroleum Corporation Limited
June 2013 15
Country Block Licence
Operator APCL () Status
Licence
Area (km2)
Outstanding Commitment in this Phase
Start of Current Phase
End of Current Phase
Liberia 8 APCL 100 Expl June 2012
June 2014
2717 Two
Exploration wells
Liberia 9 APCL 100 Expl June 2012
June 2014
2634 None
Gambia A1 APCL 60 Expl Dec
2007 Dec
2013 1296
One Exploration
well 1
Gambia A4 APCL 60 Expl Dec
2007 Dec
2013 1376 (see A1)
Senegal Rufisque Offshore Profond
APCL 90 Expl Oct
2011 Oct
2015 10357
One exploration
well
Senegal
Senegal Offshore
Sud Profond
APCL 90 Expl Oct
2011 Oct
2014 7920 None
Sierra Leone
SL-03 APCL 100 Expl Feb
2011 Feb
2014 3860 None
Sierra Leone
SL-04A APCL 100 Expl Sept 2012
Sept 2015
1995 One
exploration well 2
Cote drsquoIvoire
CI-509 APCL 90 Expl March 2012
March 2015
1091 One
exploration well
Cote drsquoIvoire
CI-513 APCL 90 Expl Dec
2011 Dec
2014 1446
One exploration
well
1) Transferrable to Block A4 if necessary 2) Contingent on results of 3D and that technology is available to drill in such water depths
Table 11 Licence Summary Table
Competent Personrsquos Report African Petroleum Corporation Limited
June 2013 16
11Liberia PSC Overview
APCL holds a 100 contractor interest in a Production Sharing Contract (ldquoPSCrdquo) covering Blocks 8 amp 9 offshore Liberia (Figure 1-2) Both blocks are in their second exploration period which began on 12th June 2012 and lasts for two years Commitments during the second phase in Block 8 are two exploration wells (to a minimum depth of 2000 meters) as a well commitment from the first exploration phase has been carried into the second phase All commitments have been met for the second phase in Block 9 with the drilling of Well Bee Eater-1 The minimum spend for each block in the second exploration period is US$ 10 MM At the end of this second phase a further 25 of each licence must be relinquished
Figure 1-2 Location of Liberia Blocks 8 and 9
For each block there is one further optional exploration period of two years that can be entered into with an additional well (to a minimum of 2000 metres) being required in each block in each period At the end of the third period all areas not retained for appraisal and development are to be relinquished There are also provisions for an appraisal period and an exploitation period of 25 years (with an additional term of 10 years if necessary) for each development area
Competent Personrsquos Report African Petroleum Corporation Limited
June 2013 17
Following a 25 relinquishment at the end of the first exploration phase Block 8 comprises an area of 2717 km2 and Block 9 comprises 2634 km2 Water depths range from less than 100 m to over 3000 m Most of the block areas lie in water depths greater than 500 m
12Gambia PSC Review
APCL holds a 60 contractor interest in Production Sharing Contracts covering Blocks A1 and A4 offshore Gambia (Figure 1-3) with Buried Hill Gambia BV holding the remaining 40 The licences were signed on 8th September 2006 with an effective date of 31st December 2007 and following two extensions they are still currently in the first exploration period which runs through to 31 December 2013
The work commitment during the first period comprises 1000 km2 of 3D seismic data in Block A1 and 750 km2 of 3D seismic data in Block A4 and one well which may be drilled in either block The seismic commitment has already been met
There are two further optional (but automatic) exploration periods of three years each that can be entered into with a well being required in each period in each licence Furthermore in Block A1 relinquishment of 10 of the licence area is required at the end of the first exploration period and 20 at the end of the second period In Block A4 relinquishment of 10 of the licence area is required at the end of the first exploration period In both blocks at the end of the third period all areas not retained for appraisal and development are to be relinquished There are also provisions for an exploitation period with the total term of the licences being 30 years (including the exploration periods) for each development area
The area of the licence is 1296 km2 for Block A1 and 1376 km2 for Block A4 Water depths vary from 500 m to over 3000 m
Figure 1-3 Location of Gambia Blocks A1 and A4
Competent Personrsquos Report African Petroleum Corporation Limited
June 2013 18
13Senegal PSC Review
APCL holds a 90 contractor interest in Exploration and Production Sharing Contracts (EPSC) covering Blocks Rufisque Offshore Profond (ROP) and Senegal Offshore Sud Profonde (SOSP) offshore Senegal (Figure 1-4) via its wholly owned subsidiary African Petroleum Senegal Limited Petrosen the state oil company hold a 10 carried interest
The EPSC governing block SOSP has an effective date of 25th October 2011 The first 85 years of the EPSC are termed the exploration phase which is subdivided into an initial period of three years with two subsequent extension periods of three and two and a half years each Work commitment in the initial exploration period is to acquire and reprocess the existing seismic data within the licence area and also to acquire a further 2500 km2 of 3D seismic data all with a minimum investment of US$ 10 MM The two extension periods have a commitment of one exploration well to a minimum depth of 3500 mss in each period or a minimum investment of US$ 20 MM Entry to the first extension period requires a 30 relinquishment of the licence area and a further 20 of the initial licence area must be relinquished on entry to the third phase The area of the licence is currently 7920 km2 Water depth is between 1000 and 4000 m over the block
Figure 1-4 Location of Senegal ROP and SOSP Licences
Competent Personrsquos Report African Petroleum Corporation Limited
June 2013 19
The EPSC governing Block ROP is of similar structure to that governing Block SOSP It has an effective date of 25th October 2011 The first eight years of the EPSC are termed the exploration phase which is subdivided into an initial period of four years with two subsequent extension periods of two years each Work commitment in the initial exploration period is to acquire the existing seismic data within the licence area for a minimum of US$ 2 MM and drill one exploration well to a minimum depth of 3500 m TVDSS or a minimum investment of US$ 20 MM The two extension periods have a further commitment of one exploration well to a minimum depth of 3500 m TVDSS in each period or a minimum investment of US$ 20 MM Entry to the first extension period requires a 30 relinquishment of the licence area and a further 20 of the initial licence area must be relinquished on entry to the third period The area of the licence is currently 10357 km2 Water depth is between 1500 and 3000 m over the block
APCL has met the seismic commitment of the first exploration period
Petrosen has a back-in right if an exploitation period is authorised for up to 20 of the licence subject to contribution of its share of forward costs (excluding training) The duration of an exploitation period is 25 years from authorisation with option for two ten year extensions at the discretion of the state
14Sierra Leone PSC Review
APCL holds a 100 contractor interest in a PSC covering Block SL-03 offshore Sierra Leone (Figure 1-5) through its wholly owned subsidiary European Hydrocarbons Ltd The licence was awarded on 23rd April 2010 and ratified on 22nd February 2011 APCL also holds a 100 contractor interest in a PSC covering Block SL-04A through its wholly owned subsidiary African Petroleum Sierra Leone Ltd The PSC governing Block SL-04A was ratified on 21st September 2012
The SL-03 licence has a duration of thirty years the first seven of which are termed the exploration period which is further subdivided into an initial period of three years followed by two extension periods of two years each The licence is currently in the initial exploration period
Work commitments during the initial period for Block SL-03 are to purchase and interpret the existing 2D seismic data over the licence and acquire a minimum of 500 km2 of 3D seismic data APCL has purchased the 2D seismic data and has acquired 2535 km2 of multi-client 3D seismic data over Block SL-03 fulfilling the seismic commitment for the initial phase The first and second extension periods require the drilling of one exploration well to a minimum depth (below mud line) of 1300 m or a minimum equivalent investment of US$ 30 MM Entry to the first extension period requires a 50 relinquishment of the licence area and a further 25 of the initial licence area must be relinquished on entry to the second extension period The area of the licence is 3860 km2 and water depth varies from 100m to over 4000m with the south-western half of the block being at water depths greater than 3000m
Competent Personrsquos Report African Petroleum Corporation Limited
June 2013 20
Figure 1-5 Location of Blocks SL-03 and SL-04A
The PSC covering Block SL-04A was ratified on 21st September 2012 The licence term is for thirty years the first seven years of which are defined as the exploration period which is further subdivided into an initial period of three years and two subsequent periods of two years Each well drilled in the initial exploration period extends this period by three months Work commitments during the initial phase are to acquire at least 1500 km2 of 3D seismic data and drill one exploration well (to a minimum depth of 2500m) contingent on the results of the 3D and the availability of drilling technology for such deep water The minimum equivalent investment is US$ 10 MM In 2011 TGS acquired 1085 km2 of multi-client 3D seismic data over Block SL-04A Upon licencing these data APCL will have fulfilled the seismic commitment for the initial phase
The subsequent two exploration periods require the drilling of one exploration well in each period (to a minimum depth of 2500 m) or a minimum investment of US$ 50 MM Entry to the second period requires a 50 relinquishment of the licence area and a further 25 of the initial licence area must be relinquished on entry to the third phase The area of the licence is currently 1995 km2 Water depth is between 3000 and 4000 m over the block
Competent Personrsquos Report African Petroleum Corporation Limited
June 2013 21
The state retains the right to a 10 carried interest during any development phase in both licences with the option to acquire a further 5 by covering an equivalent proportion of any development costs
15Cote13 drsquoIvoire13 PSC13 Review
APCL holds a 90 per cent contractor interest in two PSCs governing Block CI-509 and Block CI-513 offshore Cote drsquoIvoire (Figure 1-6) via its wholly owned subsidiary African Petroleum Cote drsquoIvoire Limited The state oil company Petroci has a 10 carried interest
Figure 1-6 Location of Blocks CI-509 and CI-513
The PSC for Block CI-509 was awarded on 16th March 2012 The first eight years of the PSC are termed the exploration period which is further divided into three terms of three three and two years respectively The licence is currently in its first exploration term Work commitments during the first exploration term are to purchase the existing 2D seismic data acquire 1091 km2 (ie a block wide) 3D seismic survey and drill one exploration well at least 100 m into the Albian (Lower Cretaceous) section The minimum investment is US$ 60 MM The second and third terms have a further commitment to drill one exploration well to at least 100 m into the Albian (Lower Cretaceous) section with a minimum investment of US$ 50 MM Entry to the second term requires a 25 relinquishment of the licence area and a further 25 of the initial licence area must be relinquished on entry to the third term The area of the licence is currently 1091 km2 Water depth is between 1900 and 3250 m over the block
Competent Personrsquos Report African Petroleum Corporation Limited
June 2013 22
The PSC covering Block CI-513 has an effective date of 19th December 2011 It has a similar structure to that governing Block CI-509 The first seven years are termed the exploration period subdivided into three terms of three two and two years The licence is currently in its first exploration term Work commitments during the first exploration term are to purchase the existing 2D seismic data acquire 1446 km2 (ie a block wide) 3D seismic survey and drill one exploration well at least 100 m into the Albian (Lower Cretaceous) section The minimum investment is US$ 60 MM The second and third terms have a further commitment to drill one exploration well to at least 100 m into the Albian (Lower Cretaceous) section with a minimum investment of US$ 50 MM Entry to the second term requires a 25 relinquishment of the licence area and a further 25 of the initial licence area must be relinquished on entry to the third term The area under licence is currently 1446 km2 Water depth is between 900 and 3100 m over the block
The exploitation period of both licences is for 25 years subject to successful award in the event of a commercial discovery On development Petroci has the right to acquire an interest of up to 20 in each licence subject to payment of its portion of future costs
In October 2012 APCL completed acquisition of 4200 km2 of 3D seismic data covering blocks CI-508 CI-509 and CI-513 fulfilling the seismic work commitments of the first exploration phase of both PSCs APCL is planning a two well drilling programme for the licences during 2014
16Evaluation Methodology Prospective Resources
We have used probabilistic methods to evaluate selected prospects within Liberia Blocks 8 and 9 Gambia Blocks A1 and A4 Sierra Leone Block SL-03 and Cote drsquoIvoire Blocks CI-513 and CI-509 We classify the results of our simulation as Low Best and High estimates of prospective resources following the Petroleum Resources Management System or PRMS (Appendix 1) We have assigned geological chance of success to each of the prospects using the methodology described below Estimates are made for oil only although we recognise that due to the significant uncertainties in the available geological information that there is a possibility of gas charge in all licences We present a summary of input estimates output STOIIP and gross resources and geological chance of success as a resource summary sheet for each prospective interval investigated These can be found in the enclosures 11 to 45 in this document
Inputs to our probabilistic simulation are evaluated in a consistent manner For the structurally trapped prospective intervals in Liberia (the Lovebird and Wildbird prospects) and the Alhamdulilah prospect in Gambia we have made a low and high deterministic estimate of closing contour for each trap to reflect the uncertainty in both mapping and depth conversion For Liberia we use the gross-rock volume (GRV) derived in this manner to constrain the P90 and P10 of our GRV distribution in our probabilistic simulation For Gambia we have used the areal extents of the low and high cases as inputs to an area times net calculation
Competent Personrsquos Report African Petroleum Corporation Limited
June 2013 23
For the stratigraphically trapped prospects in Liberia (Barbet Night Heron and Sunbird) Cote drsquoIvoire (Sassandra Ayame Ayame West Cavalla and Leraba) and Sierra Leone (Altair) we have made low and high estimates of area of closure using both structural and amplitude support where possible We have then made low and high estimates of gross reservoir thickness derived from regional observations calibrated against seismic data where possible As such depositional systems also have laterally variable sand distributions often supported by seismic data we employ the concept of an areal net to gross ratio varying the percentage of sand areally within the overall stratigraphic trap based on the uncertainty in seismic amplitude strength Where appropriate a geological shape factor is used depending on trap shape and structural relief relative to reservoir thickness
Estimates of reservoir porosity and net to gross ratio are made with reference to regional data offset wells including recent drilling by APCL in Liberia and account for compaction and a degree of overpressure (Figure 2-4) We make low mid and high deterministic estimates and use these to constrain the P90 P50 and P10 inputs to a probabilistic simulation Inputs for hydrocarbon saturation are constrained in a similar manner with reference to regional porosity and permeability trends calibrated to APCLrsquos recent drilling results in Liberia
We have estimated oil formation volume factors for a range of gas oil ratios (GOR) (from an appropriate minimum to fully saturated) for each of the prospective intervals assuming 4oC at the mudline (seabed) and geothermal gradients between 25 and 35oC per 100 m consistent with regional observation and the available well data We assume that the minimum GOR will increase with depth below the mudline Our estimates are calibrated against the oil samples in Well Narina-1 when estimating resources for the Liberian prospects
Some degree of overpressure is accounted for as it has been in our estimates of porosity but by reference to offset discoveries we assume that it is unlikely to exceed 500 psi over the depth range investigated
Recovery factors for the clastic reservoirs are estimated with reference to published information from discoveries in similar reservoir types examples of which are tabulated below (Table 12) Based on this table we estimate low best and high recovery factors of 30 375 and 45 respectively Again these are used to constrain the P90 P50 and P10 of our input distribution during probabilistic simulation
Some prospects are deep relative to mud line and we expect reservoir quality to be reduced despite overpressure We reduce our recovery factor estimates accordingly where this is the case Some prospects are relatively shallow to mud line Where this is the case we model a more viscous oil (prospects materially less than 1500m below sea bed) and have reduced our low best and high recovery factor range to 15 275 and 40 respectively In all cases we assume that a development is able to effectively dispose of any associated gas
Recovery factors for the carbonate reservoirs of the Wildbird prospect in Liberia and Prospect M in the Gambia are estimated by reference to more regional analogues and are discussed in the relevant sections
Competent Personrsquos Report African Petroleum Corporation Limited
June 2013 24
Due to the early stage of exploration within APCLrsquos licences we have adopted a six component risk matrix in all areas barring Liberia to estimate geological chance of success (COS) separated into play and prospect specific risks (Table 13) We have adopted this form of presentation of COS to reflect the fact that deep water exploration in much of the West African Atlantic Margin is at a very early stage and also that a number of the identified prospects have risk dependence and thus can be grouped as a play
Table 12 Estimated oil recovery factors from producing Atlantic Margin fields
PLAY RISK PROSPECT RISK
SOURCE RESERVOIR SEAL TRAP CHARGE RESERVOIR (Presence and Maturity) (Presence) (Presence) (Definition and Efficacy) (Migration) (Efficacy) Incorporates trap definition and seal risk (including biodegradation risk where necessary)
Table 13 Play and prospect risk system
The play risk segment focuses solely on the elements required in a given play to make a hypothetical prospect successful source reflecting the presence and thermal maturity of available source rocks with sufficient generation and expulsion to charge prospects reservoir reflecting the presence regionally of geological intervals that could potentially contain reservoir rock and seal ndash the regional presence of a sealing formation with sufficient thickness and extent to trap hydrocarbons
Prospect risk is divided into three elements Commonly we present seal and trap risk combined as an overall illustration of the integrity of the container here labelled trap risk Charge risk reflects the risk to migration of hydrocarbons from the source rock into the prospect and reservoir risk reflects solely the efficacy (ie porosity and permeability) of any identified reservoir interval
Note that a successful well on a given prospect may reduce or remove the play risk should the well prove reservoir charge and seal in a given play This will have the effect of de-risking further prospects associated with that play
Country Field Start Date Np Max Water Depth Prod Ult
RecoveryRec
FactorRecovery
Prod STOIIP
(MMstb) (m) (MMstb) (MMstb) (MMstb)Eq Guinea Ceiba Nov-00 112 800 18 187 40 10 468Eq Guinea Zafiro Aug-96 652 850 62 1583 40 26 4008Angola Girassol Dec-01 332 1360 32 958 45 30 2129Angola Kuito Dec-99 133 410 36 650 46 18 1413Brasil Espadarte Aug-00 67 877 10 261 31 26 842Brasil Marlim Mar-91 1720 853 101 2878 33 28 8721Total 259 6517 17580Average - Arithmetic 39 23Average - Weighted by STOIIP Ult Rec 37 25
Low Best High30 375 45
Fields on Atlantic Margin with significant production
Hence RF Range
Competent Personrsquos Report African Petroleum Corporation Limited
June 2013 25
Recent drilling within Liberia Blocks 8 and 9 has de-risked the play As a result we adopt prospect specific risking alone as source reservoir trap and seal with the same definitions as described above (Table 13)
Competent Personrsquos Report African Petroleum Corporation Limited
June 2013 26
2 Liberia Prospectivity and Plays
21Introduction
All of the available deep-water acreage offshore Liberia-Sierra Leone basin is under licence (Figure 1-2) Regionally hydrocarbons have been discovered within sandstones at a number of stratigraphic levels from the pre-rift to early syn-rift Albian in Cote drsquoIvoire (Espoir Foxtrot fields and a number of other discoveries) to turbiditic sandstones that have Late Cretaceous (CenomanianTuronian MaastrichtianConiacian) to early Tertiary (Palaeocene to Eocene) ages Recent drilling offshore Ghana has yielded a number of discoveries within these Upper Cretaceous sandstones such as the Jubilee oil field and the Enyenra Tweneboa and Odum oil and gascondensate discoveries In the Liberia-Sierra Leone basin recent drilling has yielded six hydrocarbon discoveries (Bee Eater Narina Monterrado Mercury Venus and Jupiter) but as yet none has been declared commercial (Figure 2-1) Although reservoir quality in the Albian sandstones is variable reservoir quality in the Upper Cretaceous and Tertiary sandstones is often good Successful trap types encountered regionally are both structural and stratigraphic
Of significance to the evaluation of the petroleum systems of Blocks 8 and 9 APCL have drilled three wells within the deeper water parts of the blocks Wells Apalis-1 Narina-1 and Bee Eater-1 Well Apalis-1 found source rock intervals of Albian to Cenomanian age but failed to find the prognosed reservoir Well Narina-1 found light oil within deep-marine sandstones of Cretaceous age The sandstones were of variable reservoir quality as the well appears to have been drilled on the edge of a fan system which can be interpreted from seismic data The extent of the Turonian hydrocarbon bearing interval around Well Narina-1 is currently under investigation by APCL who are working with CGGV to reprocess the 3D multi-client seismic with the hope of identifying areas of favourable reservoir within closure
Well Bee Eater-1 completed in February 2013 also discovered hydrocarbons within similar sandstones of Cretaceous age However the oil bearing Turonian reservoir at Bee Eater is interpreted as being of very low permeability and hence non-commercial APCL interprets that Well Bee Eater-1 was drilled in a canyon system that may have been largely bypassed by sediment input
Both wells demonstrate the viability of Cretaceous petroleum systems within the licence area
Competent Personrsquos Report African Petroleum Corporation Limited
June 2013 27
Figure 2-1 Notable discoveries West Africa offshore
22Well and Seismic Database
Exploration offshore Liberia is at an early stage To date five wells have been drilled in the deeper water areas in 2011 and 2012 with historical exploration drilling (up to 1985) restricted to the more shelfal areas (Figure 2-2) Data from two of these shallow water wells Wells S3-1 and Cestos-1 were made available to us for this evaluation Well S3-1 encountered oil shows in sandstones of Late Cretaceous age
GhanaJubilee Field on
production development of TEN area discoveries
new Hess deepwater discoveries
Cote drsquoIvoireShallow water production
recent discoveries in deepwater Turonian
reservoirs
LiberiaOil discoveries in
Cretaceous deepwater reservoirs at Narina
Monserrado
Sierra LeoneVenus Mercury and Jupiter
oil and condensate discoveries in deepwater
reservoirs
Guinea-COil shows in
offshore wells
Guinea-BSinapa oil discovery
planned appraisal
AGCDome Flore area heavy oil
discoveries under development review
SenegalOnshore gas and condensate production Recent onshore
Turonian discovery
MauritaniaChinguetti Field
production other oil and gas discoveries under development review
Competent Personrsquos Report African Petroleum Corporation Limited
June 2013 28
Figure 2-2 Well and seismic database Liberia Blocks 8 and 9
APCL has drilled three exploration wells offshore Liberia in the deep water part of Block 9 Wells Narina-1 Bee Eater 1 and Apalis-1 (Figure 1-2 Figure 2-2) Well Apalis-1 was drilled in 2011 targeting a four-way dip-closed structure with possible AvO support The well found traces of hydrocarbons plus source rock intervals but the prognosed reservoir sands were absent at target depth and the well was plugged and abandoned
Well Narina-1 was drilled by APCL in 2012 and found 16 to 21 m of net pay (light oil) within sandstones of Turonian (Cretaceous) age Hydrocarbons were also discovered in the underlying Albian Oil samples were collected but no drill-stem testing was undertaken Analysis of the oil samples indicates an API
3D Seismic Area
Competent Personrsquos Report African Petroleum Corporation Limited
June 2013 29
gravity for the Turonian oil of about 38 degrees and about 45 degrees for the Albian hydrocarbons Mobilities from formation pressure measurements and permeability from side-wall core measurements show the reservoir to be of relatively low permeability at this location
Well Bee Eater-1 was drilled by APCL in January and February 2013 The well found oil-bearing sandstones of Cretaceous age but of very low permeability and hence the well is considered non-commercial Post-drill interpretation of the seismic data has helped APCL revise the depositional model for this Turonian fan system The Bee Eater-1 well is interpreted to have encountered a bypass zone in both the Turonian and Cenomanian with immature sandstones that are poorly sorted and tight Post-well mapping of key seismic events tied to Well Bee Eater-1 reveals the possibility of finding better quality sandstones in lsquobasin-floor fanrsquo units down-dip Potentially sealing shale units and source rock units were also found in the Bee-Eater-1 well
Well Apalis-1 and in particular Wells Bee Eater-1 and Narina-1 help de-risk seal and hydrocarbon charge for the Cretaceous play on-block
The primary seismic dataset for our evaluation was the recently acquired 5170 km2 of 3D seismic data over the deeper water area of Blocks 8 and 9 including certain products to review amplitude versus offset (AvO) effects These seismic data cover both recently drilled deep water wells In addition a grid of 2D seismic data was also made available with average line spacing of around 45 km These data provide a tie to Well S3-1 although the well lies some 200m from the nearest seismic line In general the data quality of the 3D volume is good and of suitable fidelity to enable us to undertake our review of identified prospectivity However local complexity in the shallow geology causes the signal to degrade considerably at the prospective levels in certain areas APCL are currently reprocessing these data in an attempt to improve signal quality APCL intend to utilise this dataset to update the CPR in the next 3-6 months It is hoped that these data will support maturation of additional prospects and further clarification of risk and volumes for prospects within this CPR
23Plays and Petroleum Geology Blocks 8 and 9
APCL has identified a number of plays within Blocks 8 and 9 at similar stratigraphic levels to those proven successful elsewhere along the West African margin (Figure 2-3) Recent drilling within Blocks 8 and 9 has demonstrated a working petroleum system within the mid to lower Cretaceous with drilling finding light oil within deep marine sandstones of Turonian age and also in sandstones of Albo-Aptian age
Competent Personrsquos Report African Petroleum Corporation Limited
June 2013 30
Figure 2-3 Petroleum systems and plays Liberia Blocks 8 and 9
Structural traps are identified at the pre-rift to early syn-rift (Albian) level as tilted fault blocks with hydrocarbons sourced from the Albian or Lower Cretaceous source rocks and seal provided by post-rift mud drape Structural and stratigraphic traps are also identified at several potential reservoir levels within the Late Cretaceous and Lower Tertiary again potentially sourced from the Turonian and or Albian source rocks Traps are sealed by coeval marine shales and muds As is encountered regionally there is reasonable seismic evidence for the presence of reservoir bearing intervals within the Upper Cretaceous and Early Tertiary section and this seismic evidence has been used in trap definition
The most significant play in the area is that of Cenomanian to Turonian age deep-marine channel-fan systems as structural and stratigraphic traps In addition an emerging lower Cretaceous microbial carbonate reservoir play has been identified sourced from coeval lacustrine source rocks and sealed by shales deposited during the subsequent drowning of the lacustrine systems by the onset of significant subsidence and marine inundation later in the Cretaceous We have evaluated prospects within both of these play systems Prospectivity in the shallower Cretaceous and Tertiary intervals is still being re-evaluated by APCL as of the date of this report and no leads have been matured to prospect status
Oil show Cestos-1
Competent Personrsquos Report African Petroleum Corporation Limited
June 2013 31
Figure 2-4 Porositydepth trend published West Africa turbidite reservoirs
24Play and Prospect Risk Liberia Blocks 8 and 9
Of the prospects reviewed all but the Wildbird prospect fall within the Cenomanian to Turonian channelfan play In our opinion recent drilling has de-risked source and reservoir presence for this play However reservoir quality in recent wells is variable In our risking of Cenomanian to Turonian prospectivity (Barbet Sunbird Lovebird and Night Heron prospects) we have removed the play element to our risking matrix and see a low risk to hydrocarbon charge for individual prospects Key risk is therefore to trap integrity and reservoir quality We use a four component risk matrix as outlined in Section 16 to define geological chance of success for these prospects
The Wildbird prospect has been recently identified by APCL as part of its review of further play fairways within the Liberian licences The play concept is of early Aptian bio-constructed carbonate build-ups within the restricted lacustrine environment that existed at this time Porosity and permeability within the bioclastic microbial limestones is potentially enhanced by hydrothermal activity resulting from the early rifting Later post-rift subsidence and drowning by marine conditions provides the top seal via the
0
500
1000
1500
2000
2500
3000
3500
4000
0 01 02 03 04m
Bel
ow S
eabe
dPorosity (fraction)
Porosity versus Depth Trend
Regional West AfricaTurbidite Data
Competent Personrsquos Report African Petroleum Corporation Limited
June 2013 32
deposition of Cretaceous marine muds It is envisaged that the play is charged or by Aptian source rocks deposited in the offset lagoonal facies with possible charge from later (but on-lapping) Cretaceous marine source rocks (as other plays on the blocks) Both potential source rocks provide lateral seal (Figure 2-16) Regionally lacustrine microbial carbonate reservoirs can be found in Congo and Angola where there is some production but also in the Campos and Santos basins in Brazil
The microbial carbonate play is emerging within Blocks 8 and 9 and has not been demonstrated to be effective by drilling We adopt the play and prospect risking as discussed in Section 16 to risk the Wildbird prospect as a result discounting biodegradation risk as the prospect is at significant depth Our estimate of play risk for the Cretaceous microbial carbonate play is summarized in below
PLAY Source Reservoir Presence Seal Play
Risk Cretaceous Carbonate 08 06 05 20
Table 21 Play risk Cretaceous carbonate play Liberia Blocks 8 and 9
Competent Personrsquos Report African Petroleum Corporation Limited
June 2013 33
25Liberia Blocks 8 and 9 Leads and Prospects
Following the drilling of Wells Narina-1 and Bee Eater-1 APCL is re-evaluating the prospectivity within Blocks 8 and 9 and has developed a number of potential traps (Figure 2-5) several of which (marked in orange Figure 2-5) have been matured to prospect status We have assessed the prospective resources for certain of these prospects that APCL has identified as viable near-term drilling opportunities Barbet Sunbird Lovebird Night Heron and Wildbird A number of the prospects have multiple reservoir targets Our evaluation of these prospects follows the methodology described in Section 16 The results of Wells Narina-1 and Bee Eater-1 would indicate that oil charge is probable and thus only oil cases have been evaluated However as we state in Section 16 a gas charge cannot be discounted due to the uncertainties in source rock evaluation and basin modelling Input parameters STOIIP prospective resources and geological chance of success for each of the evaluated prospects are summarised in Table 1 of this report and are also presented in the resource summary sheets as Enclosures 11 to 19 of this document
Figure 2-5 Leads and Prospects Liberia Blocks 8 and 9
Competent Personrsquos Report African Petroleum Corporation Limited
June 2013 34
ʹǤͷǤͳǤ Barbet Prospect
The Barbet prospect is identified as a stratigraphic trap around 14 km to the east of and up-dip from Well Narina-1 within Block 9 (Figure 2-6) A single target reservoir is mapped within the Turonian Seismic amplitude anomalies are also identified within the area of the trap that may provide support for reservoir development The Turonian is mapped at between 3000 and 3600 m TVDSS over the area of the prospect in a water depth of around 750 to 770 m
Figure 2-6 Seismic line - depth (m TVDSS) over the Barbet prospect
We have used an areanet pay methodology to estimate prospective resources for the Barbet prospect In our low case we restrict the area of the accumulation to the brightest area of anomalous amplitudes on the far offsets Our high case extends the prospect down-dip to include a larger area of anomalous amplitudes above an observed amplitude shut-off (Figure 2-7) These are used to constrain the P90 and P10 inputs of our probabilistic simulation These polygons approximate to an oil column height of 200 and 700 m respectively
Amplitudes are variable within the area of closure and we apply an areal net to gross ratio to better constrain sand distribution within the trap Gross reservoir thickness estimates are computed from the mapped seismic interval net to gross ratio from regional analogue and porosity from a regional porositydepth trend (Figure 2-4) Fluid parameters and recovery factors are estimated as described in Section 16
Narina-1 Barbet
Top Turonian
Top Cenomanian
Top Albian
Lwr Turonian (BFF)
Top Turonian
Narina-1
Apalis-1
Albian UC
0 km 2(mss)
W E
Competent Personrsquos Report African Petroleum Corporation Limited
June 2013 35
Figure 2-7 Barbet far offset amplitudes with Top Turonian depth contours (m TVDSS)
We have used the prospect risk matrix presented in Section 16 to determine the geological chance of success for the Barbet prospect Key risk to the Barbet prospect is to trapcontainment as the trap requires pinch-out of the reservoir in three directions to seal There is also a subsidiary risk to reservoir as the Turonian reservoir encountered in Well Narina-1 is of relatively poor quality which is countered by seismic evidence over the prospect to support reservoir development As a result we attribute a geological chance of success of 22 to the Barbet prospect
metres
P10
P90metres
APALIS-1
Competent Personrsquos Report African Petroleum Corporation Limited
June 2013 36
ʹǤͷǤʹǤ Sunbird Canyon Prospect
The Sunbird canyon prospect is also identified as a stratigraphic trap around 5 km to the south of Well Apalis-1 within Blocks 8 and 9 mapped as a large canyon system There are three potential reservoir targets within the prospect within the Campanian the Turonian (as encountered in Well Narina-1) and in the underlying Cenomanian Reservoir is prognosed at between 3000 m TVDSS and 3600 m TVDSS in a water depth of around 1300 m
Figure 2-8 Regional seismic line along axis of the Sunbird canyon system
We have used an areanet pay methodology to estimate prospective resources for the Sunbird canyon prospect At all three prospective layers the prospect divides into two discrete lsquocanyonsrsquo separated by an intra-basinal high (eg Figure 2-9) For the Campanian and Turonian prospective intervals in the low case we restrict the area of the accumulation to the brightest area of anomalous amplitudes on the far offsets in the northerly of the two canyons where amplitude response is better Our high case extends the prospect down-dip to include a larger area of anomalous amplitudes above an observed amplitude shut-off and also includes the southerly of the two canyons as this would now be in charge communication The low and high case polygons approximate to an oil column height of 200 m and 600 m respectively
Albian uc
LB-08LB-09
LB-08
LB-09
Albian UC
Sunbird
0 km 4
NESW
Competent Personrsquos Report African Petroleum Corporation Limited
June 2013 37
For the deeper Cenomanian the prospect is mapped as a single canyon to the south of the intra-basinal high The low and high case polygons approximate to an oil column height of 200 m and 700 m respectively Our low and high estimates of area are used to constrain the P90 and P10 of our probabilistic simulation
Figure 2-9 Sunbird Campanian far offset amplitudes with Cenomanian depth contours (m TVDSS)
Amplitudes are variable within the area of closure and we apply an areal net to gross ratio to better constrain sand distribution within the trap for all three prospective layers Gross reservoir thickness estimates are computed from the mapped seismic interval net to gross from regional analogue and porosity from the observed porositydepth trend (Figure 2-4) Fluid parameters and recovery factors are estimated as described in Section 16
metres
P90
P10
Block 9
Block 8
APALIS-1
Competent Personrsquos Report African Petroleum Corporation Limited
June 2013 38
Figure 2-10 Sunbird Turonian far offset amplitudes with Top Turonian depth contours (m TVDSS)
We have used the prospect risk matrix presented in Section 16 to determine the geological chance of success for the three prospective intervals of the Sunbird prospect Key risk to all three prospective layers is to trapcontainment as the trap requires pinch-out of the reservoir in three directions to seal There is also a subsidiary risk to reservoir at the two deeper levels as the Turonian reservoir encountered in Well Narina-1 is of relatively poor quality and Cenomanian reservoirs are yet to be proven on block However there is seismic evidence for reservoir development and hence we see this risk as favourable Reservoir risk is low for the Campanian as it is developed in the offset Well Narina-1 and there is seismic evidence for reservoir presence As a result we attribute a geological chance of
P90
P10
metres
Block 9
Block 8
APALIS-1
Competent Personrsquos Report African Petroleum Corporation Limited
June 2013 39
success of 27 19 and 18 to the Campanian Turonian and Cenomanian prospective intervals of the Sunbird canyon prospect
Figure 2-11 Sunbird Cenomanian far offset amplitudes with Cenomanian depth contours (m TVDSS)
ʹǤͷǤ͵Ǥ Night Heron
Night Heron is a Turonian basin floor fan system which lies 8 Km south west of Well Bee Eater-1 It is mainly within Block 9 but extends into Block 10 It is identified as a stratigraphic trap with areal extents defined by amplitude truncation and structural pinch-out Reservoir is prognosed at between 4100 m TVDSS and 4700 m TVDSS in a water depth of around 1750 m (Figure 2-12) APCL has selected a
P90
P10
metres
Block 9
Block 8
Competent Personrsquos Report African Petroleum Corporation Limited
June 2013 40
provisional well location which lies on the 3D survey location ndash In-line 1098 X-line 6103 They are currently seeking partners to drill the Night Heron well in early 2014
Figure 2-12 Arbitrary line across Night Heron PSDM - Depth (m TVDSS)
Cenomanian reservoir potential also exists beneath the Turonian basin floor fan and work by APCL is on-going to determine prospectivity
Well Bee Eater-1 found an organic-rich Turonian shale section overlying a hydrocarbon bearing thin-bedded low permeability sandstone Another shale dominated package underlies the sandstone Although the Turonian interval is considered non-commercial for Bee Eater the prospectivity down-dip is appealing APCL interprets that the well was drilled in a canyon system that may have been largely bypassed by sediment input The 3D seismic indicates a significant thickening of this Turonian interval towards the south west and there is some amplitude support for the occurrence of a lobate fan straddling Blocks 9 amp 10
An area times net approach was adopted using the full stack PSDM depth volume to provide an SNA extraction and constrain areal extent and estimate an areal NG to account for lateral variability within the reservoir (Figure 2-13) As night Heron falls partly off block ERCE correct for this using the ratio of on-block to off-block area in reporting of net unrisked and net risked results
S NEBee EaterNight Heron
5 Km
BFF Isopach (m)
Competent Personrsquos Report African Petroleum Corporation Limited
June 2013 41
Figure 2-13 SNA from Basin Floor Fan Isopach (m) - PSDM
We have used the prospect risk matrix presented in Section 16 to determine the geological chance of success for the Turonian interval of the Night Heron prospect Recent drilling results suggest that there is a low risk to hydrocarbon charge The observations at Bee Eater-1 also indicate that shale seals are also likely at a coeval interval Reservoir is a significant risk due to the poor Turonian reservoir development in Well Bee Eater-1 The Turonian reservoir encountered in Well Narina-1 is also of relatively poor quality However there is seismic evidence on the 3D survey for a possible improvement in reservoir development over the prospective area The definition of the trap is the key risk as the seismic evidence for closurereservoir pinch-out is ambiguous over the 2D data in Block 10 There appears to be evidence of the reservoir interval thinning in the critical north westerly direction but 3D data would be required to reduce trap risk any further As a result we attribute a geological chance of success of 144 to the Night Heron prospect
3
3
SNA from BFF Isopach
Block Boundary
Competent Personrsquos Report African Petroleum Corporation Limited
June 2013 42
ʹǤͷǤͶǤ Lovebird Prospect
The Lovebird prospect is mapped as a four-way dip closure to the south of Block 8 (Figure 2-14) Three prospective layers are mapped by correlation to up-dip wells and are prognosed to be of Cenomanian age Thus as with the Sunbird canyon prospect these reservoirs are not proven on block but seismic mapping and regional geological work suggests the sands may be derived from the east via a canyon system identified in block LB-07 The three prospective intervals are termed Upper Middle and Lower or Blue Pink and Green based on horizon colour Structural relief at the Pink horizon is between 50 and 200 m depending on the estimate and thus the prospect is relatively low relief in some realisations
Figure 2-14 Seismic line over the Lovebird prospect
Lovebird
Depth (mss)
4 km
NE
Competent Personrsquos Report African Petroleum Corporation Limited
June 2013 43
Figure 2-15 Lovebird prospect Top Pink horizon depth (m TVDSS) high case
The prospect is mapped to the edge of the available 3D (Figure 2-15) which coincides with the southern boundary of Block 8 but closure can be mapped south of the 3D area on the available 2D lines Reservoir depth is prognosed at between 5000 and 5900 m TVDSS in a water depth of 2850 m at the prospect crest Thus reservoir rock if present will be at comparable depths below mud line to the Barbet prospect
We use a gross-rock volumenet to gross methodology to estimate prospective resources for the Lovebird prospect APCLrsquos evaluation of the Lovebird prospect is on-going and of the three interpreted horizons the Pink horizon is the best defined We review pick depth conversion and thickness uncertainty for this interval to generate a range of gross-rock volumes for this interval with the
m ss
metres
Block 9
Block 8
Competent Personrsquos Report African Petroleum Corporation Limited
June 2013 44
prospect full to spill (Figure 2-15) Assuming the Pink horizon provides an accurate representation of the Blue and Green horizons we then estimate gross-rock volumes for these two intervals by isopach
Reservoir thickness and net to gross ratio estimates are derived from regional analogues with reservoir porosity derived from our regional porositydepth trend (Figure 2-4) Fluid properties and recovery factors are estimated as described in Section 16 Our volumetrics are restricted to the portion of the Lovebird prospect on Block 8 We would expect a further evaluation of the prospective resources of the Lovebird prospect to occur subsequent to the completion of the APCL evaluation and the prospective resources associated with the prospect in this report may therefore be subject to change
The key risks to the Lovebird prospect are to the development of reservoir at the prognosed Cenomanian intervals as they are not proved in wells elsewhere on the block and to source as the prospect requires a source rock deeper than that proven by drilling There is also risk to trapcontainment as the structure is not fully defined by the 3D seismic data volume and is of low relief in some realisations We assign a geological chance of success to the Lovebird prospect of 20 as a result
255Wildbird Prospect
The Wildbird prospect is mapped on 3D seismic data towards the south of Block 8 as a large four-way dip-closed high (Figure 2-17) at a depth of between 4000 to 4600 m TVDSS in a water depth of around 2000 m Structural relief is up to 600 m and area of closure up to 170 km2 The conceptual geological model is discussed above but is that the prognosed microbial carbonate reservoir of Albian age is developed between the mapped lsquoredrsquo and lsquolight bluersquo seismic events (Figure 2-16) with lateral seal developed to the north-east of the prospect within contemporaneous lagoonal facies which also provide the primary source rock This lateral seal is required to close the prospect Basin modelling undertaken by APCL suggests that the Albian lagoonal and later Cretaceous source rocks would be mature for oil generation
We have accepted this model as a geological concept and have used it to make estimates of prospective resources for the Wildbird prospect We then risk the model accordingly
Competent Personrsquos Report African Petroleum Corporation Limited
June 2013 45
Figure 2-16 Seismic line and prospect geo-seismic sketch Wildbird prospect
5
0 km 5
SWN
E
mss
Wildbird
Horizons
BlackberryLight BlueRoseRed
Competent Personrsquos Report African Petroleum Corporation Limited
June 2013 46
Figure 2-17 Wildbird Top Reservoir depth map (m TVDSS) Spill point - green contour
The Wildbird prospect is a large container but there is considerable uncertainty in reservoir thickness structural mapping and degree of charge from the offset kitchen areas We evaluate the prospect in a similar manner to the Lovebird prospect by perturbing the above variables In our low case we choose a shallow contact at 4250 m TVDSS to simulate under-filling or lateral breach via onlapping thief zones and also employ a reservoir thickness of 80 m from offset analogue Our high case assumes the prospect is filled to spill and that the lsquoredrsquo seismic event marks base reservoir Estimates of reservoir net to gross ratio and porosity are derived from the available analogues and are necessarily wide Fluid parameters and recovery factors are derived as described in Section 16
The Wildbird play is emerging and is of high risk We attribute a play risk of 24 as a result (Section 24) The key prospect risk to the Wildbird prospect is that of containment or trap as there is evidence for erosion at the crest of the feature and it is reliant on the development of lagoonal facies to the north-east and overlying marine shales to provide lateral seal and support the hydrocarbon column heights modelled here We attribute a prospect risk of 38 Wildbird which when combined with the play risk gives an overall chance of success for the Wildbird prospect of 9
mss
Competent Personrsquos Report African Petroleum Corporation Limited
June 2013 47
3 Gambia Prospectivity and Plays
͵ǤͳǤ Introduction
Although only one exploration well (Well Jammah-1) exists offshore Gambia exploration drilling has been undertaken to the north and south within Senegalese and Guinea Bissau waters (Figure 2-1 Figure 3-1) A number of oil and gas discoveries have been made onshore Senegal and the large Dome Flore and Dome Gea discoveries to the south of the blocks are each reported to contain a million barrels of biodegraded oil (c10-13o API) in place within sandstones of Oligocene (Tertiary) age Some lighter (30-34o API) oil has also been encountered in deeper intervals More regionally oil and gas discoveries have been made to the north offshore Mauritania and in Guinea Bissau (Sinapa) the recently drilled Venus and Mercury wells in Sierra Leone have also encountered hydrocarbons
Figure 3-1 Plays Gambia Blocks A1 and A4
The range of hydrocarbon types encountered is suggestive of multiple sourcing and the age of the reservoirs suggest late timing of oil generation consistent with a late Cretaceous source for the heavy oil although there are no published data to confirm this Regionally the gas source could be any of the older potential source rocks discussed below
Alhamdulilah
GAMBIA A1ampA4 PROSPECTIVITY POTENTIAL
Deep Water Fans channel levee complexes BFF lobes
Late Jurassic clastic progrades
Clastic progrades (unconformity trap)
Karst amp reef features in carbonate platform
Intra-carbonate clastic truncations
Based on line 1046-NWA
1
2
3
1
51
14
2
3
4
5
Competent Personrsquos Report African Petroleum Corporation Limited
June 2013 48
32Well and Seismic Database
Exploration offshore Gambia is also at an early stage and no wells have been drilled in the deeper water areas The nearest well to Blocks A1 and A4 (and the only well offshore Gambia) is Well Jammah-1 some 15 km to the east of Block A1 (Figure 3-2) This well contains oil shows within sandstones of Late Cretaceous age The well drilled to 3020 m MD reaching total depth in an interval of uncertain age perhaps Cenomanian to Albian
A regional grid of 2D seismic data was made available to us for our evaluation with an average line spacing of around 2-3 km on Block A1 and up to 8 km on Block A4 (Figure 3-2 Figure 3-3) In addition a 2003 vintage 3D seismic data volume was available for analysis covering 2008 km2 However APCL is using 2010 vintage 3D seismic data (2566km2) processed to pre-stack time-migration in their current evaluation and we have adopted these data for our review In general seismic data quality was found to be good
Figure 3-2 Wells 2D and 3D seismic data (red outline) Gambia Blocks A1 and A4
The 2D seismic data was sufficient to enable a well to seismic tie to be made to Well Jammah-1 (Figure 3-3) Despite its shelfal location we were able to extrapolate some stratigraphy into the deeper water
Competent Personrsquos Report African Petroleum Corporation Limited
June 2013 49
although the key Upper Cretaceous section is not sampled adequately by the well leading to uncertainty in the age of the deeper clastic section that forms the potential reservoir interval for the Alhamdulilah prospect
33Plays and Petroleum Geology Blocks A1 and A4
Some of the plays identified by APCL offshore Gambia are similar to those described for Liberia in Section 23 above with structural and stratigraphic traps identified at a number of Cretaceous intervals (Figure 3-1) and reservoirs prognosed as being of deep marine turbidites or other mass transport systems However plate tectonic reconstructions suggest that rifting occurred earlier along the Senegalese and Gambian margin beginning in the Lower Jurassic Thus there is the potential for deeper Jurassic age source and reservoir in the area
There is some seismic evidence for the presence of reservoir intervals as is common regionally although evidence is less compelling in the deeper intervals (Figure 3-5) Of the identified traps in this play fairway only one has currently been matured to prospect status by APCL the Alhamdulilah prospect
Regionally reservoirs within the Cretaceous are associated with a deep marine depositional environment and are generally expected to be of good to excellent quality with the possibility of some overpressure A similar depositional environment is prognosed for the deeper Jurassic age reservoirs with possible fan-delta like geometries identifiable on seismic landward (eastward) of the Alhamdululah prospect (Figure 3-7)
In addition to the Jurassic and Cretaceous clastic plays APCL has identified a number of closures along the margin of a carbonate platform of Jurassic to Aptian age partially penetrated by Well Jammah-1 (Figure 3-3 Figure 3-4) These closures are currently being evaluated by APCL and only one Prospect M has been evaluated to prospect status and we assess the prospective resources for Prospect M in this section
Competent Personrsquos Report African Petroleum Corporation Limited
June 2013 50
Figure 3-3 Well to seismic tie ndash Well Jammah-1 to the Alhamdulilah prospect
There is good evidence for the presence of source rocks in the Gambian margin The youngest source interval that could possibly generate oil is the Cenomanian-Turonian marine source rock proven in the Casamance Shelf wells and present in basins to the north Published data indicate kerogen is a mixed Type IIIII locally and Type II in wells to the south with HI of between 370-660 mggC in gt2 TOC rocks (TOCs in the DSDP-367 well 300 km to the west are in excess of 5 in black shales of Albian to Turonian age) This section is absent in Well Jammah-1 probably as a result of erosion
There is also the possibility of Necomian and Jurassic source rocks Necomian black shales are described in the DSDP-367 well Jurassic (Toarcian) source rocks are inferred to be present based on analogue evidence and plate tectonic reconstructions that place proven Jurassic source rocks in Morocco Portugal Nova Scotia and north-eastern Brazil in proximity to the Senegal-Gambia basin These are documented as having a HI of around 450 mggC and a TOC of up to 6
Regional thermal information shows a high degree of variability with gradients from 25 to 45 degCkm likely as a result of drilling on salt domes where geothermal gradients are elevated or in areas locally affected by volcanics Blocks A1 and A4 are at the northernmost margin of the salt basin so at worst only limited local effects are anticipated Using data from Well Jammah-1 we infer a geothermal gradient of 30deg Ckm at the location of the well This would put the Cenomanian-Turonian source locally into the oil window around the Alhamdulilah prospect However uncertainty in both depth conversion and geothermal modelling do not rule out the possibility that the Cenomanian-Turonian could be mature regionally for hydrocarbon generation Deeper Neocomian or Jurassic source rocks if present would be mature for oil generation under this model
ALHAMDULILAH
M
Senonian UC
W E4 km
Jammah-1
Alhamdulilah
Intra Aptian Carbonate
TWT (ms)
Competent Personrsquos Report African Petroleum Corporation Limited
June 2013 51
34Play Risk
In our evaluation of APCLrsquos Gambian blocks we note that a number of the prospective plays require further definition to mature the identified leads to prospect status As a result our evaluation is limited to the determination of independent estimates of prospective resource for the Alhamdulilah prospect and Prospect M We have used play and prospect risk for both prospects to allow for consistency in comparison between our evaluations where a play risk is appropriate
Based on the review above we see source risk as the key risk to the Lower Cretaceous and Jurassic clastic play Although a number of source rock intervals are present regionally only those within the Cretaceous are demonstrated to be present proximal to Blocks A1 and A4 Data are limited but modelling would suggest that those within the Cenomanian-Turonian could be immature for oil generation in all but a small area of the blocks As a result we assign a source risk of 07 Note that the uncertainty in both source rock presence and thermal data is such that there is a possibility of gas charge although like Liberia Sierra Leone and Cote drsquoIvoire it is impossible to quantify this chance at present
We see seal risk for this play to be relatively low as there is seismic evidence similar to that interpreted regionally for the presence of seal Seal risks for the multiple stacked sands prognosed for the Alhamdulilah prospect are handled as a prospect specific risk The inferred depositional environment for this interval would also suggest that sealing intervals would be developed We have therefore assigned a seal risk of 09 to this play
Seismic evidence for the presence of reservoir is also good but less convincing than that observed regionally and in our evaluation of Liberia Blocks 8 and 9 However we assign a reservoir presence risk of 08 It is possible that the younger Cretaceous reservoirs identified could be locally sourced via exhumation of the coeval carbonate platform to the east and thus be composed of detrital carbonate material This is reflected in the reservoir risk for the Alhamdulilah prospect itself
For the carbonate platform play the key risk is that of top seal Seismic reflectivity is highly variable above the top of the platform carbonates (Figure 3-3) as the event is a strong regional unconformity In places the overlying clastic section can be interpreted immediately above this unconformity Although the latter is factored into prospect specific risk to top seal the seismic evidence for the presence of a regional seal above the unconformity is not compelling The top seal is provided by a down-lapping carbonate prone Aptian-Albian section where the Senonian unconformity is not immediately above the reservoir section Analogues suggest there is a general lack of support for intra-formational seals in similar settings and therefore we assign a risk to the carbonate platform play seal of 05 as a result
The presence of a strong angular unconformity at the top of the carbonate platform structures is however likely to have enhanced reservoir quality within the carbonates themselves as a result of subareal exposure and karstification Thus we assign a risk of 09 to the reservoir presence element of the carbonate platform play and review the prospect specific reservoir efficacy risk on a prospect by prospect basis dependent on the seismic evidence for erosion
Competent Personrsquos Report African Petroleum Corporation Limited
June 2013 52
A number of the identified structures along the buried carbonate platform margin are relatively shallow to mudline and thus biodegradation of any oil charge is possible However as we have only estimated prospective resources for Prospect M we have not carried a play risk to biodegradation
Our final play risks for the Lower Cretaceous clastic and the buried carbonate platform plays are summarised in Table 31 below
PLAY Source Reservoir Presence Seal Play
Risk Cretaceous to Jurassic Clastic Play 07 08 09 50
Carbonate Platform Margin 07 09 05 28
Table 31 Play risk Gambia Blocks A1 and A4
Competent Personrsquos Report African Petroleum Corporation Limited
June 2013 53
35Gambia Leads and Prospects
In all 13 leads and prospects have been identified by APCL within Blocks A1 and A4 with areas of closure varying from around 4 km2 to 63 km2 (Figure 3-4) Of the identified prospective intervals a number are best classified as leads and require further technical work to mature them to prospect status (yellow Figure 3-4) Structural closure is identified within the Lower Cretaceous and a number of slope fans can be identified as seismic amplitude anomalies within the Upper Cretaceous section In addition a number of closures are mapped along the edge of the buried carbonate platform margin at Top Aptian level and APCL are currently evaluating the potential for a deeper Barremian age seal which might provide further prospectivity within the carbonate platform play
Figure 3-4 Leads and prospects identified by APCL in Gambia Blocks A1 and A4
In this section we briefly describe our evaluation of the Alhamdulilah prospect and Prospect M A summary of input parameters for the calculation of prospective resources results and risks for each of the prospective layers evaluated is given in the resource summary sheets in Enclosures 21 to 25 of this document
In 2010 APCL acquired a further 2566 km2 of 3D data over both blocks A re-evaluation of the identified leads and prospects is on-going using these data with the evaluation of the Alhamdulilah prospect and Prospect M completed
ALHAMDULILAH
M
Competent Personrsquos Report African Petroleum Corporation Limited
June 2013 54
351Alhamdulilah Prospect
The Alhamdulilah prospect is identified as a four-way dip-closed structural high within the centre of the deep water portion of Block A1 (Figure 3-3 Figure 3-5) We have evaluated four prospective intervals in total (Figure 3-5) Reservoir ages are currently prognosed by APCL to be of Lower Cretaceous (Turonian) to perhaps Lower Jurassic The prospect extends northwards of Block A1 into Senegalese waters and we have restricted our calculations to the proportion of the prospect that lies within Block A1 The bulk of the prospect does however lie within Gambian territory
Figure 3-5 Seismic line over the Alhamdulilah prospect
The prospective intervals within the Alhamdulilah structure lie between 4230 m TVDSS and 5970 m TVDSS or around 2010 to 3750 metres below sea bed This is relatively deep and despite the estimates of overpressure it is possible that porosity and thus reservoir quality to be relatively poor (Figure 2-4) Our estimates of recovery factor for the deeper prospective intervals reflect this
There is uncertainty in the degree of structural closure as although mapped reflectors are relatively bright and continuous the structure is of low relief We have account for this by undertaking various depth conversions of the mapped structure from the time domain 3D seismic data restricting our analysis to closure demonstrable on-block (Figure 3-6) At SS-1 level closure continues to the north off-block and also off the 3D seismic data We have reviewed the available 2D seismic data northwards to determine the spill point at this level
SS 4 (1)
SS 3 (1-2)
SS 2 (1-3)
SS 1 (1-3)
2 Km
Inline 1140 - TWT ALHAMDULILAH
TWT (s)
W E
Competent Personrsquos Report African Petroleum Corporation Limited
June 2013 55
Where seismic facies analysis suggests the potential for stacked pay intervals these have been modelled probabilistically Estimates of gross rock volume derived in this way are combined with the estimates of net reservoir thickness based on mapped seismic thicknesses and porosity and fluid information are derived as described in Section 16 to compute probabilistic estimates of resources for each reservoir interval
Figure 3-6 Area of closure Alhamdulilah prospect layers SS1 to SS4
Recovery factors used are as described in Section 16 of this report but modified to reflect the depth of burial of the deeper prospective intervals
We have reviewed the prospect specific risk for each of the prospective intervals independently Although the Alhamdulilah trap is a four-way dip-closed feature the time closure is subtle and the prospect is relatively deep There is also seabed canyoning which may cause uncertainty in the imaging and thus trap closure
Seismic evidence for seal is relatively good over the Alhamdulilah trap However there is evidence for downcuttingerosion between layers and above the prospect there is also evidence for downlapping events onto the topmost reflector
The key risk to the Alhamdulilah prospect is that of reservoir efficacy There are indications of fan-like geometries within the 3D seismic data (Figure 3-7) and some events can be mapped for the shallower reservoir layers However the Cretaceous reservoirs may alternatively comprise the eroded talus from the coeval carbonate platform to the east and reservoir quality rock may not be developed as a result Finally our estimate of overpressure may be incorrect and any sandstones present may have the reservoir quality sufficiently degraded via compaction to render them non-reservoir
SS-1 Low and High Case AreasSS-4 Low and High Case Areas SS-3 Low and High Case Areas SS-2 Low and High Case Areas
Competent Personrsquos Report African Petroleum Corporation Limited
June 2013 56
As a result the prospect specific risks to the prospective intervals of the Alhamdulilah prospect vary from 26 to 34 and from 13 to 17 when combined with the play risk
Figure 3-7Alhamdulilah prospect seismic facies interpretation Cretaceous intervals
AH-1 AH-1
Competent Personrsquos Report African Petroleum Corporation Limited
June 2013 57
352Prospect M
A number of structures have been identified by APCL at the Aptian level (ie top carbonate) along the buried carbonate platform margin that runs through Blocks A1 and A4 (Figure 3-1) Of these one structure Prospect M has been matured to prospect status and is of sufficient size to warrant independent estimates of resources (Figure 3-8)
Figure 3-8 Seismic line through Prospect M
We have evaluated the uncertainty in gross rock volume for Prospect M and combined this with reservoir net to gross ratio and porosity from analogue to generate estimates of STOIIP and prospective resources We have simulated uncertainty in seismic pick and also depth conversion to generate a range of spill points for the structure (Figure 3-9) These are used to make low and high case estimates of gross-rock volume
Due to the shallow nature of Prospect M we have assumed relatively high (but moveable) oil viscosities as discussed in Section 1 Recovery factor estimates are made with reference to this and also to analogue where uncertainty in both reservoir quality and also the degree of fracturing (and hence dual permeability) leads to a wide range in uncertainty in ultimate recovery Our low case recovery factor being affected primarily by early onset of water cut via fractures and an adverse mobility ratio and the high case making allowance for better oil mobility and improved matrix porosity and permeability leading to a more efficient sweep We therefore use a recovery factor range from 10 to 35 and use these as the P90 and P10 estimates on a log-normal distribution in our probabilistic simulation of prospective resources
Senonian UC
Intra Aptian Carbonate
TWT (ms)2 km
w EProspect M
Competent Personrsquos Report African Petroleum Corporation Limited
June 2013 58
Figure 3-9 Low and high case closure Prospect M top Aptian depth (m TVDSS)
There is pick and depth conversion uncertainty associated with Prospect M but we see a good chance of a closure being developed within the 3D seismic area and assign a prospect specific risk to trap of 09 as a result Downlapping events are observed onto the crest of the prospect (Figure 3-8) but the overlying seismic signature is relatively transparent thus we see a good chance of the prospect being sealed relative to the play risk However the prospect is relatively shallow at around 1000 m to 1100 m below the seabed and there is a risk to biodegradation of any oil charge Thus we associate a risk of 06 to biodegradation As it is established practice we place this risk into containment or trap risk which results in an overall trap risk of 09 06 or 54
There is evidence for the development of reservoir quality rock with a seismic character that has been associated with the development of karstification in the analogues used We also note that the prospect is very close to the platform edge and the erosional unconformity is quite pronounced again suggesting a period of subareal exposure Thus we see the prospect specific risk to reservoir efficacy as 08 Charge risk is also favourable with the prospect located at the edge of the buried platform margin proximal to the deeper potential kitchen areas We therefore associate a charge risk of 08 to the prospect
Thus we assign a prospect specific risk of 35 which when combined with the play risk for the carbonate platform margin gives an overall COS of 10
3
3
m ss
metres
Competent Personrsquos Report African Petroleum Corporation Limited
June 2013 59
4 Sierra Leone Prospectivity and Plays
As with offshore Liberia to the south-east all of the deep-water acreage offshore Sierra Leone is under licence (Figure 4-1) A discussion of regional hydrocarbon occurrences is presented in Section 21 APCLrsquos licences SL-03 and SL-04A-10 lie to the north-west of the countryrsquos territorial waters around 200 to 300 km north-west of the recent Venus Mercury and Jupiter discoveries made by Anadarko (Figure 4-1)
Figure 4-1 Offshore licences and discoveries Liberia and Sierra Leone
A regional grid of 2D seismic data is available to APCL for the evaluation of offshore Sierra Leone (Figure 4-2) In addition APCL has licenced c 2500 km2 of 3D seismic data covering the deeper water area of Block SL-03 and is negotiating the licencing of further 3D seismic data covering part of Block SL-04A-10
Competent Personrsquos Report African Petroleum Corporation Limited
June 2013 60
Well data offshore Sierra Leone are sparse Historical exploration was restricted to the shelf and resulted in the drilling of two exploration wells (Wells A-1 and A-1-2) which were plugged and abandoned as dry holes Data from both wells are available to APCL Recent drilling by Anadarko in the deeper waters of licence SL-07B-10 has yielded a number of discoveries (Wells Jupiter-1 Venus-1 and Mercury-1) but these well data are not available to APCL
Figure 4-2 Well and seismic database offshore Sierra Leone
The play fairways identified offshore Sierra Leone are very similar to those identified offshore Liberia (Figure 2-3) as structural traps within the Lower Cretaceous syn-rift section and primarily as stratigraphic traps within turbiditic sands of Cretaceous age (Campanian Cenomanian and Turonian) Sourcing from regional marine (Cenomanian) or lacustrine (Albo-Aptian) source rocks is hypothesized For the syn-rift structural play the presence of Albo-Aptian reservoirs is demonstrated by the shallow water Wells A-1 and A-1-2 which also had indications of the development of source rocks within the
Competent Personrsquos Report African Petroleum Corporation Limited
June 2013 61
Cretaceous syn-rift section Although the data are not available the recent Anadarko wells are publically documented as having found hydrocarbons within post-rift Cretaceous turbidites potentially de-risking this play
Blocks SL-03 and SL-04A-10 are towards the north-western edge of the seismically identified Cretaceous basin immediately adjacent to a large structural lineament the Sierra Leone Transform System Submarine canyon development is therefore prognosed to occur to the south and east of this lineament providing sediment input into the blocks during Cretaceous time As is encountered regionally there is reasonable seismic evidence for the presence of reservoir bearing intervals within the Upper Cretaceous section in the blocks
APCLrsquos evaluation of the recently licenced 3D seismic data is on-going and as yet only one prospect Altair has been matured to drillable prospect status However a number of other Cretaceous channelfan systems have been identified within Block SL- 03 (Figure 4-3)
Figure 4-3 Leads Sierra Leone Block SL-03
Competent Personrsquos Report African Petroleum Corporation Limited
June 2013 62
41Play Risk
Although there has been recent drilling along strike of APCLrsquos Sierra Leone licences these wells lie some 100 km to the east We have therefore attributed a play risk albeit favourable to Cretaceous channel-fan prospectivity within Blocks SL-03 and SL-04A-10 As with our review of Liberia there is strong seismic evidence for reservoir and seal rocks being present and offset drilling would indicate the same from the limited published information However there is as yet no proven source rock within APCLrsquos licences and we see this as the key risk to play The reported results of offset drilling and APCLrsquos own basin modelling would suggest that source risk would be favourable
Our final play risk for the Cretaceous channel-fan systems in APCLrsquos Sierra Leone licences is summarised in Table 31 below
PLAY Source Reservoir Presence Seal Play
Risk Cretaceous Play 08 09 09 65
Table 41 Play risk Sierra Leone Block SL-03
41Sierra Leone Leads and Prospects
APCL is currently evaluating the recently licenced 3D seismic data over Block SL-03 and has identified a number of Cretaceous channel-fan systems varying in areal extent from 20 km2 to 150 km2 Of the mapped channel fan systems one Altair has been matured to prospect status by APCL and we have made independent estimates of prospective resources and risks for this prospect
A summary of input parameters for the calculation of prospective resources results and risks for the Altair prospect is given in the resource summary sheet in Enclosure 31 of this document
411Altair
The Altair prospect is a turbidite channel prospect mapped at a seismic event described as Turonian by APCL (Figure 4-4) There is however uncertainty in this stratigraphy as it is established by jump correlation using regional seismic data due to the lack of deep water wells on block It is a stratigraphic trap with areal extents defined by amplitude truncation and structural pinch-out in a similar manner to prospectivity within APCLrsquos Liberia and Cote drsquoIvoire acreage A single target reservoir is identified within the trapped area The prospect has anomalous seismic amplitudes associated with it (Figure 4-5) which may indicate reservoir development The top structure is mapped between 6200 ndash 6800 ms TWT over the area of the prospect Our depth conversion indicates a crestal depth of approximately 5400 m TVDSS beneath a water depth of 3300 m giving 2100 m of sediment above top reservoir
Competent Personrsquos Report African Petroleum Corporation Limited
June 2013 63
Figure 4-4 Dip seismic line (full offsets) Altair prospect
The seismic image suggests that Altair is a turbidite channel constrained in the north east by a well-defined canyon Two distinct canyon systems feed erosive channels at the break of slope A south west trending fault which is almost perpendicular to the main canyon feeders alters bathymetric relief and diverts the Altair channel southwards
ERCE has made estimates of prospective resources for the Altair prospect using an identical methodology to our evaluation of Liberian prospectivity An area net approach was adopted using optimized seismic amplitudes to constrain areal extent and define an areal net to gross to account for lateral variability of sand distribution within the reservoir In our low case we restrict the area of the accumulation to the brightest area of anomalous amplitudes and a column height of 200 m Our high case extends the prospect down-dip to a column height of 800 m and laterally to incorporate weaker amplitude responses (Figure 4-5) These polygons were used to constrain the P90 and P10 area inputs of our probabilistic simulation
SW NE
Top Turonian
Top syn-rift
0 5kmTWT (s)
ALTAIR
3
3
metres
Competent Personrsquos Report African Petroleum Corporation Limited
June 2013 64
Figure 4-5 Seismic amplitude (gradient stack) and Top Turonian depth (m TVDSS) Altair prospect
Net pay is estimated from the mapped seismic interval and regional analogue with porosities and fluid properties estimated as described in Section 16
We have used the prospect risk matrix presented in Section 16 to determine the geological chance of success for the Altair prospect Key risk is to trap integrity due to the coalescing of a number of mapped fan systems up dip towards the pinch-out of Altair with subsidiary risk to charge as this is as yet unproven on block This gives a prospect specific risk of 28 which when combined with the play risk gives an overall chance of success of 18 for the Altair prospect
3
3
metres
Competent Personrsquos Report African Petroleum Corporation Limited
June 2013 65
5 Cote13 drsquoIvoire13 Prospectivity13 and Plays
51Introduction
Offshore Cote drsquoIvoire has been actively explored for hydrocarbons for a number of years and much of the offshore shelf is under licence Recently exploration has moved into deeper waters targeting the regional post-rift (Cretaceous) play and APCL has identified a number of prospects and leads within the western licence Blocks of CI-513 and CI-509 (Figure 5-1)
There are two main play types identifiable offshore Cote drsquoIvoire (Figure 5-2) as structural traps within the Lower Cretaceous (Aptian to Albian) syn-rift section and as stratigraphic traps within post rift turbiditic sands of Cenomanian to Turonian age Sourcing is prognosed from regional marine (Turonian) or lacustrine (Albo-Aptian) source rocks
Figure 5-1 CI-509 and CI-513 Prospects and Leads13 offshore13 Cote13 drsquoIvoire
Historically exploration has been restricted to the narrow shelf area and has yielded a number of commercial fields both oil and gas including Foxtrot Baobab and Espoir All of these fields lie within the Lower Cretaceous (Aptian) syn-rift play Recently exploration has moved into deeper waters targeting the regional post-rift (Cretaceous) play Well Paon-1X c 300 km to the east of Blocks CI-105 and CI-513
Competent Personrsquos Report African Petroleum Corporation Limited
June 2013 66
drilled by Tullow Oil plc and partners in licence CI-103 during 2012 is reported to have found hydrocarbons in turbiditic sandstones of Cretaceous age Well Kosrou-1X some 150 km east of Blocks CI-105 and CI-513 shows reservoir development within the post-rift Cretaceous section particularly within the Turonian to Cenomanian section
Evaluation of prospectivity within Blocks CI-509 and CI-513 is at an early stage and a working petroleum system is not proven on block However a number of Cretaceous channelfan systems have been identified using both 2D and 3D seismic data which have generated around seven potential traps at the date of this report five of which are considered prospects for this report (Figure 5-1)
Figure 5-2 Petroleum13 systems13 and13 plays13 offshore13 Cote13 drsquoIvoire
52Well and Seismic Database
APCL has obtained a regional database of 2D seismic data offshore Cote drsquoIvoire which provides well to seismic ties to Well San Pedro-1 (Figure 5-3) The primary data set used for our evaluation is that provided by the recently acquired 3D seismic data At the time of writing these data were processed to
Competent Personrsquos Report African Petroleum Corporation Limited
June 2013 67
pre-stack time-migration and we have used this volume plus available AvO processed volumes to evaluate the prospectivity of the CI-513 licence currently only the full-stack seismic product has been used to assess the prospectivity in Block CI-509
Figure 5-3 Well and seismic database offshore Sierra Leone
53Plays and Petroleum Geology Blocks CI-509 and CI-513
The primary play being explored within Blocks CI-509 and CI-513 is the Cretaceous post-rift turbidite play (Figure 5-2) There is reasonable seismic evidence for the presence of reservoir bearing intervals within the Upper Cretaceous section of the blocks However dating of the age of these post-rift turbidite channelfan systems is uncertain due to the paucity of well and seismic data with stratigraphy extrapolated into APCLrsquos licences via regional seismic correlation The presence of a regional Turonian source rock is hypothesized to charge any identified traps This is not proven on block but evidence from offset drilling in Block CI-105 demonstrates the presence of source rocks developed within the
Grand Lahou East 1
Kosrou 1x
San Pedro 1
South Grand Lahou 1
Competent Personrsquos Report African Petroleum Corporation Limited
June 2013 68
Cenomanian to Turonian and basin modelling studies indicate that the Turonian may be mature for oil generation local to the licences
A number of Cretaceous channelfan systems have been identified using both 2D and 3D seismic data (Figure 5-1) and we have independently evaluated the Prospective Resources and geological chance of success for five of these In addition the Lower Cretaceous syn-rift play may be viable within the licences particularly to the north Evaluation of this play by APCL is on-going and no prospective resources have been assessed for this play
54Play Risk
Exploration offshore Cote drsquoIvoire is at an early stage and there are limited well data available As a result ERCE has adopted a play and prospect risk system in our evaluation of the Cote drsquoIvoire prospective resources within the Cretaceous channel-fan play in an identical manner to our review of Liberia the Gambia and Sierra Leone
In a similar manner to Liberia the Gambia and Sierra Leone there is seismic evidence for the presence of seal and reservoir rock and thus the key risk is to source and we see source risk as the key risk to the Creteaceous clastic play Sourcing is prognosed from regional marine (Turonian) modelled as having limited hydrocarbon generating potential or lacustrine (Albo-Aptian) source rocks the maturity of which are interpreted to be in the very early oil window As a result we assign a play source risk of 06 Note that the uncertainty in both source rock presence and thermal maturity is such that there is a possibility of gas charge although it is impossible to quantify this chance at present
Our final play risk is summarised in Table 51 below
PLAY Source Reservoir Presence Seal Play
Risk Cretaceous Clastic Play 06 09 09 049
Table 51 Play13 risk13 Cote13 drsquoIvoire13 Blocks13 CI-509 and CI-513
Competent Personrsquos Report African Petroleum Corporation Limited
June 2013 69
ͷǤͷǤ Cote13 drsquoIvoire13 Blocks13 CI-509 and CI-503 Leads and Prospects
Prospectivity has been identified by APCL at a number of levels with the evaluation of the Cretaceous clastic turbidite channel-fan play being the most advanced ERCE has made independent assessments of prospective resources and geological chance of success for five prospects within this play Ayame Ayame West Sassandra Cavella and Leraba (Figure 5-1)
A summary of input parameters for the calculation of prospective resources results and risks for each of the prospective layers evaluated is given in the resource summary sheets in Enclosures 41 to 45 of this document
ͷǤͷǤͳǤ Ayame amp Ayame West
The Ayame and Ayame West prospects are identified as Upper Cretaceous fans which lie mainly within Block CI-513 (Figure 5-4) The prognosed trapping mechanism is stratigraphic with areal extents defined by amplitude truncation and structural pinch-out A single target reservoir is prognosed for both within stratigraphy identified as Turonian although stratigraphy is uncertain in both licences as it is established via long distance seismic ties The prospects have anomalous seismic amplitudes associated with them (Figure 5-5) which may indicate reservoir development The top structure is mapped between 5400 ndash 6300 ms TWT over the area of the prospect and our depth conversion places the crest of the trap at approximately 4200 m TVDSS beneath a water depth of 2500 m
Figure 5-4 Strike Line Ayame and Ayame West prospects
NE
0 km 4
TWT (s)
Top
Turonian
Base
Turonian
Top
Albian
AYAMEAYAME WESTSW
P90
P10
metres
P90
P10
AYAME
AYAMEWEST
Competent Personrsquos Report African Petroleum Corporation Limited
June 2013 70
Evaluation of the Ayame and Ayame West prospects is undertaken in an identical manner to our evaluations of the stratigraphically trapped channel-fan prospects in APCLrsquos Liberia and Sierra Leone licences An area net approach is adopted using anomalous seismic amplitudes to constrain areal extent and define an areal net to gross to account for lateral variability of sand distribution within the closure area In our low case we restrict the area of the accumulation to the brightest area of anomalous amplitudes and a 200 m column height Our high case extends the prospect down-dip to 800 m of column height to include a larger area of anomalous amplitudes (Figure 5-5) These polygons are used to constrain the P90 and P10 area inputs of our probabilistic simulation
Net pay estimates are estimated from mapped seismic interval thickness and from regional analogues with porosity fluid parameters and recovery factors estimated as described in Section 16
Figure 5-5 Ayame Seismic amplitude (gradient stack) and Top Turonian depth (m TVDSS)
We use the prospect risk matrix presented in Section 16 to determine the geological chance of success for the Ayame and Ayame West prospects Key risk is to trap and we attribute a trap risk of 50 to both
P90
P10
metres
P90
P10
AYAME
AYAMEWEST
Competent Personrsquos Report African Petroleum Corporation Limited
June 2013 71
prospects giving a prospect specific chance of success of 28 for both prospects When combined with the play risk this gives an overall chance of success of 14
A proportion of the closure areas for both the Ayame and Ayame West prospects fall outside Block CI-513 in our high case (6 km2 and 11 km2 respectively) This is corrected for in our summary tables of net risked and unrisked prospective resources at the beginning of this document by computing the area of the prospect off-block at P90 P50 and P10 and scaling accordingly
ͷǤͷǤʹǤ Sassandra
The Sassandra prospect is mapped as a deep-water fan system at Top Turonian level and lies within Blocks CI-513 and CI-509 approximately 20km west along strike from the Ayame prospect It is a stratigraphic trap with areal extents defined by amplitude truncation and structural pinch-out (Figure 5-6) A single target reservoir is prognosed within the Turonian and as with other prospects on block has similar uncertainty in the stratigraphic age of the prospective interval The prospect has anomalous amplitudes associated with it (Figure 5-7) which may indicate reservoir development The top structure is mapped between 5000 ndash 6000 ms TWT over the area of the prospect and our depth conversion predicts a crestal depth of approximately 4400 m TVDSS beneath a water depth of 2500 m
Figure 5-6 Dip seismic line Sassandra prospect
Top Turonian
Base Turonian
Top Albian
N S
TWT (s)
SASSANDRA
P90 P10
metres
CI-509
Competent Personrsquos Report African Petroleum Corporation Limited
June 2013 72
Evaluation of the Sassandra prospect is undertaken in an identical manner to our evaluation of the Ayame and Ayame West prospects An area net approach is adopted using anomalous seismic amplitudes to constrain areal extent and define an areal net to gross to account for lateral variability of sand distribution within the closure area In our low case we restrict the area of the accumulation to the brightest area of anomalous amplitudes and a 200 m column height Our high case extends the prospect down-dip to 800 m of column height to include a larger area of anomalous amplitudes (Figure 5-7) These polygons are used to constrain the P90 and P10 area inputs of our probabilistic simulation As far offset data are only available for CI-513 (at the time of writing) we have used amplitudes from the full-stack volume to map the extent of the prospect to the west off block (Figure 5-7)
Net pay estimates are estimated from mapped seismic interval thickness and from regional analogues with porosity fluid parameters and recovery factors estimated as described in Section 16
Figure 5-7 Sassandra prospect Seismic amplitude and Top Turonian depth (m TVDSS)
We use the prospect risk matrix presented in Section 16 to determine the geological chance of success for the Sassandra prospect Key risk is to trap and we attribute a trap risk of 40 This is a lower value
33
metres
CI-509
Competent Personrsquos Report African Petroleum Corporation Limited
June 2013 73
than our estimates for the Ayame and Ayame West prospects as the up-dip termination of the trap is less well defined and requires a larger area for pinch-out or bypass Seismic amplitude support for reservoir presence is less over the Sassandra prospect relative to Ayame Thus we estimate a prospect specific chance of success for the Sassandra prospect of 20 which when combined with the play risk gives an overall chance of success for the Sassandra prospect of 10
A proportion of the closure area for the Sassandra prospect falls outside Blocks CI-513 and CI-509 in our high case (33 km2) This is corrected for in our summary tables of net risked and unrisked prospective resources at the beginning of this document by computing the area of the prospect off-block at P90 P50 and P10 and scaling accordingly
553Cavalla
The Cavalla prospect is an Upper Cretaceous Fan which lies between the Ayame and Sassandra prospects within Block CI-513 It is identified as a stratigraphic trap with areal extents defined by amplitude truncation and structural pinch-out (Figure 5-8) A single target reservoir is prognosed within the TuronianCenomanian interval (with similar stratigraphic uncertainty to other prospects on block) which lies stratigraphically beneath the Ayame prospect The prospect has anomalous seismic amplitudes associated with it (Figure 5-9) which may indicate reservoir development The top structure is mapped between 4600 ndash 5900 ms TWT over the area of the prospect and we estimate a crestal depth of approximately 3900 m TVDSS beneath a water depth of 2500 m The prospect is more steeply dipping than other fan systems mapped on block
Evaluation of the Cavalla prospect is undertaken in an identical manner to our evaluation of the Ayame Ayame West and Sassandra prospects An area net approach is adopted using anomalous seismic amplitudes to constrain areal extent and define an areal net to gross to account for lateral variability of sand distribution within the closure area In our low case we restrict the area of the accumulation to the brightest area of anomalous amplitudes and a 200 m column height Our high case extends the prospect down-dip to 800 m of column height to include a larger area of anomalous amplitudes (Figure 5-9) These polygons are used to constrain the P90 and P10 area inputs of our probabilistic simulation
Net pay estimates are estimated from mapped seismic interval thickness and from regional analogues with porosity fluid parameters and recovery factors estimated as described in Section 16
We use the prospect risk matrix presented in Section 16 to determine the geological chance of success for the Cavella prospect Key risk is to trap and we attribute a trap risk of 40 As with the Sassandra prospect this is a lower value than our estimates for the Ayame and Ayame West prospects as the up-dip termination of the trap is less well defined and requires a larger area for pinch-out or bypass Seismic amplitude support for reservoir presence is less over the Cavella prospect relative to Ayame Thus we estimate a prospect specific chance of success for the Cavella prospect of 20 which when combined with the play risk gives an overall chance of success for the Cavella prospect of 10
Competent Personrsquos Report African Petroleum Corporation Limited
June 2013 74
The Cavalla prospect is contained entirely within APCLrsquos licences
Figure 5-8 Dip seismic line Cavalla prospect
Top Turonian
Top Albian
TWT (s)
CAVALLANW SEP90
P10
metres
Competent Personrsquos Report African Petroleum Corporation Limited
June 2013 75
Figure 5-9 Seismic amplitude (gradient stack) and Top fan depth (m TVDSS) Cavalla prospect
ͷǤͷǤͶǤ Leraba
As with the other evaluated prospectivity within Blocks CI-509 and CI-513 the Leraba prospect is an Upper Cretaceous fan which lies within Block CI-509 It is identified as a stratigraphic trap with areal extents defined by amplitude truncation and structural pinch-out (Figure 5-10) The prospect has anomalous seismic amplitudes associated with it (Figure 5-11) which may indicate reservoir development Unlike the other Cote DrsquoIvoire prospects evaluated in this report no offset seismic volumes were available for our review of Leraba at the time of writing The seismic amplitude response and character on the full-stack data is however consistent with that observed over other prospects in Block CI-513 where more seismic products were available
P90
P10
metres
Competent Personrsquos Report African Petroleum Corporation Limited
June 2013 76
The top structure is mapped between 4600 ndash 5200 ms TWT over the area of the prospect and we estimate a depth at the crest of approximately 3700 m TVDSS beneath a water depth of 2500 m
Figure 5-10 Dip seismic line Leraba prospect
Evaluation of the Leraba prospect is undertaken in an identical manner to our evaluation of the other Cretaceous fan systems evaluated in this section An area net approach is adopted using anomalous seismic amplitudes to constrain areal extent and define an areal net to gross to account for lateral variability of sand distribution within the closure area In our low case we restrict the area of the accumulation to the brightest area of anomalous amplitudes and a 200 m column height Our high case extends the prospect down-dip to 800 m of column height to include a larger area of anomalous amplitudes (Figure 5-11) These polygons are used to constrain the P90 and P10 area inputs of our probabilistic simulation
P90
P10
metresTWT (s)
LERABANW SE
Top Turonian
Albian
0 5km
Competent Personrsquos Report African Petroleum Corporation Limited
June 2013 77
Figure 5-11 Seismic amplitudes Leraba prospect overlay of Top Reservoir m TVDSS
Net pay estimates are derived from mapped seismic interval thickness and from regional analogues with porosity fluid parameters and recovery factors estimated as described in Section 16 The prospect is relatively shallow to mud line and we have modelled a more viscous oil as described in Section 16
We use the prospect risk matrix presented in Section 16 to determine the geological chance of success for the Leraba prospect Key risk is to trap and we attribute a trap risk of 60 as the up-dip extent of the prospect is fairly well defined on seismic data Although no off-set 3D seismic data were available the seismic evidence for reservoir presence is again comparable to that of Ayame West Thus we estimate a prospect specific chance of success for the Leraba prospect of 34 which when combined with the play risk gives an overall chance of success for the Leraba prospect of 16
The Leraba prospect is contained entirely within APCLrsquos licences
P90
P10
metres
Competent Personrsquos Report African Petroleum Corporation Limited
June 2013 78
6 Senegal Prospectivity and Plays
Prospectivity identified within APCLrsquos Sengalese licences is seen as being similar to that identified offshore Gambia (Figure 6-1) and a description of the regional petroleum systems and main play types expected is given in Section 3
Figure 6-1 Petroleum systems and plays offshore Senegal
In 2012 APCL acquired 3600 km2 of multi-client 3D seismic data over the Offshore Sud Profond licence In addition 1500 km2 of legacy 3D data over the Rufisque Offshore Profond licence is currently being reprocessed by APCL and legacy 2D seismic data (c 7000 line km) have also been acquired APCL expects to begin prospect evaluation once seismic processing is complete which is expected later in 2013 At present a number of conceptual Cretaceous post-rift leads are identified by APCL (Figure 6-2)
Competent Personrsquos Report African Petroleum Corporation Limited
June 2013 79
Figure 6-2 leads offshore Senegal Blocks ROP and SOSP
Competent Personrsquos Report African Petroleum Corporation Limited
June 2013 80
7 Appendix 1 SPE PRMS Guidelines
SPEWPCAAPGSPEE Petroleum Reserves and Resources Classification System and Definitions
The Petroleum Resources Management System
Preamble
Petroleum Resources are the estimated quantities of hydrocarbons naturally occurring on or within the Earthrsquos crust Resource assessments estimate total quantities in known and yet-to-be-discovered accumulations Resources evaluations are focused on those quantities that can potentially be recovered and marketed by commercial projects A petroleum Resources managements system provides a consistent approach to estimating petroleum quantities evaluating development projects and presenting results within a comprehensive classification framework
International efforts to standardize the definitions of petroleum Resources and how they are estimated began in the 1930s Early guidance focused on Proved Reserves Building on work initiated by the Society of Petroleum Evaluation Engineers (SPEE) SPE published definitions for all Reserves categories in 1987 In the same year the World Petroleum Council (WPC then known as the World Petroleum Congress) working independently published Reserves definitions that were strikingly similar In 1997 the two organizations jointly released a single set of definitions for Reserves that could be used worldwide In 2000 the American Association of Petroleum Geologists (AAPG) SPE and WPC jointly developed a classification system for all petroleum Resources This was followed by additional supporting documents supplemental application evaluation guidelines (2001) and a glossary of terms utilized in Resources definitions (2005) SPE also published standards for estimating and auditing Reserves information (revised 2007)
These definitions and the related classification system are now in common use internationally within the petroleum industry They provide a measure of comparability and reduce the subjective nature of Resources estimation However the technologies employed in petroleum exploration development production and processing continue to evolve and improve The SPE Oil and Gas Reserves Committee works closely with other organizations to maintain the definitions and issues periodic revisions to keep current with evolving technologies and changing commercial opportunities
The SPE-PRMS consolidates builds on and replaces guidance previously contained in the 1997 Petroleum Reserves Definitions the 2000 Petroleum Resources Classification and Definitions publications and the 2001 ldquoGuidelines for the Evaluation of Petroleum Reserves and Resourcesrdquo the latter document remains a valuable source of more detailed background information
These definitions and guidelines are designed to provide a common reference for the international petroleum industry including national reporting and regulatory disclosure agencies and to support petroleum project and portfolio management requirements They are intended to improve clarity in
Competent Personrsquos Report African Petroleum Corporation Limited
June 2013 81
global communications regarding petroleum Resources It is expected that the SPE-PRMS will be supplemented with industry education programs and application guides addressing their implementation in a wide spectrum of technical andor commercial settings
It is understood that these definitions and guidelines allow flexibility for users and agencies to tailor application for their particular needs however any modifications to the guidance contained herein should be clearly identified The definitions and guidelines contained in this document must not be construed as modifying the interpretation or application of any existing regulatory reporting requirements
The full text of the SPEWPCAAPGSPEE Petroleum Resources Management System document hereinafter referred to as the SPE-PRMS can be viewed at
wwwspeorgspecmabinaryfiles6859916Petroleum_Resources_Management_System_2007pdf
Overview and Summary of Definitions
The estimation of petroleum resource quantities involves the interpretation of volumes and values that have an inherent degree of uncertainty These quantities are associated with development projects at various stages of design and implementation Use of a consistent classification system enhances comparisons between projects groups of projects and total company portfolios according to forecast production profiles and recoveries Such a system must consider both technical and commercial factors that impact the projectrsquos economic feasibility its productive life and its related cash flows
Petroleum is defined as a naturally occurring mixture consisting of hydrocarbons in the gaseous liquid or solid phase Petroleum may also contain non-hydrocarbons common examples of which are carbon dioxide nitrogen hydrogen sulphide and sulphur In rare cases non-hydrocarbon content could be greater than 50
The term ldquoResourcesrdquo as used herein is intended to encompass all quantities of petroleum naturally occurring on or within the Earthrsquos crust discovered and undiscovered (recoverable and unrecoverable) plus those quantities already produced Further it includes all types of petroleum whether currently considered conventionalrdquo or ldquounconventionalrdquo
Figure 1-1 is a graphical representation of the SPEWPCAAPGSPEE Resources classification system The system defines the major recoverable Resources classes Production Reserves Contingent Resources and Prospective Resources as well as Unrecoverable petroleum
Competent Personrsquos Report African Petroleum Corporation Limited
June 2013 82
Figure 1-1 SPEAAPGWPCSPEE Resources Classification System
The ldquoRange of Uncertaintyrdquo reflects a range of estimated quantities potentially recoverable from an accumulation by a project while the vertical axis represents the ldquoChance of Developmentrdquo that is the chance that the project that will be developed and reach commercial producing status
The following definitions apply to the major subdivisions within the Resources classification
TOTAL PETROLEUM INITIALLY-IN-PLACE
Total Petroleum Initially in Place is that quantity of petroleum that is estimated to exist originally in naturally occurring accumulations
It includes that quantity of petroleum that is estimated as of a given date to be contained in known accumulations prior to production plus those estimated quantities in accumulations yet to be discovered (equivalent to ldquototal Resourcesrdquo)
Competent Personrsquos Report African Petroleum Corporation Limited
June 2013 83
DISCOVERED PETROLEUM INITIALLY-IN-PLACE
Discovered Petroleum Initially in Place is that quantity of petroleum that is estimated as of a given date to be contained in known accumulations prior to production
PRODUCTION
Production is the cumulative quantity of petroleum that has been recovered at a given date
Multiple development projects may be applied to each known accumulation and each project will recover an estimated portion of the initially-in-place quantities The projects shall be subdivided into Commercial and Sub-Commercial with the estimated recoverable quantities being classified as Reserves and Contingent Resources respectively as defined below
RESERVES
Reserves are those quantities of petroleum anticipated to be commercially recoverable by application of development projects to known accumulations from a given date forward under defined conditions
Reserves must satisfy four criteria they must be discovered recoverable commercial and remaining based on the development project(s) applied Reserves are further subdivided in accordance with the level of certainty associated with the estimates and may be sub-classified based on project maturity andor characterized by their development and production status To be included in the Reserves class a project must be sufficiently defined to establish its commercial viability There must be a reasonable expectation that all required internal and external approvals will be forthcoming and there is evidence of firm intention to proceed with development within a reasonable time frame A reasonable time frame for the initiation of development depends on the specific circumstances and varies according to the scope of the project While five years is recommended as a benchmark a longer time frame could be applied where for example development of economic projects are deferred at the option of the producer for among other things market-related reasons or to meet contractual or strategic objectives
In all cases the justification for classification as Reserves should be clearly documented To be included in the Reserves class there must be a high confidence in the commercial producibility of the reservoir as supported by actual production or formation tests In certain cases Reserves may be assigned on the basis of well logs andor core analysis that indicate that the subject reservoir is hydrocarbon-bearing and is analogous to reservoirs in the same area that are producing or have demonstrated the ability to produce on formation tests
Proved Reserves
Proved Reserves are those quantities of petroleum which by analysis of geoscience and engineering data can be estimated with reasonable certainty to be commercially recoverable from a given date forward from known reservoirs and under defined economic conditions operating methods and government regulations
Competent Personrsquos Report African Petroleum Corporation Limited
June 2013 84
If deterministic methods are used the term reasonable certainty is intended to express a high degree of confidence that the quantities will be recovered If probabilistic methods are used there should be at least a 90 probability that the quantities actually recovered will equal or exceed the estimate The area of the reservoir considered as Proved includes
the area delineated by drilling and defined by fluid contacts if any and adjacent undrilled portions of the reservoir that can reasonably be judged as continuous with it and commercially productive on the basis of available geoscience and engineering data
In the absence of data on fluid contacts Proved quantities in a reservoir are limited by the lowest known hydrocarbon (LKH) as seen in a well penetration unless otherwise indicated by definitive geoscience engineering or performance data Such definitive information may include pressure gradient analysis and seismic indicators Seismic data alone may not be sufficient to define fluid contacts for Proved Reserves (see ldquo2001 Supplemental Guidelinesrdquo Chapter 8) Reserves in undeveloped locations may be classified as Proved provided that the locations are in undrilled areas of the reservoir that can be judged with reasonable certainty to be commercially productive and interpretations of available geoscience and engineering data indicate with reasonable certainty that the objective formation is laterally continuous with drilled Proved locations
For Proved Reserves the recovery efficiency applied to these reservoirs should be defined based on a range of possibilities supported by analogs and sound engineering judgment considering the characteristics of the Proved area and the applied development program
Probable Reserves
Probable Reserves are those additional Reserves which analysis of geoscience and engineering data indicate are less likely to be recovered than Proved Reserves but more certain to be recovered than Possible Reserves
It is equally likely that actual remaining quantities recovered will be greater than or less than the sum of the estimated Proved plus Probable Reserves (2P) In this context when probabilistic methods are used there should be at least a 50 probability that the actual quantities recovered will equal or exceed the 2P estimate
Probable Reserves may be assigned to areas of a reservoir adjacent to Proved where data control or interpretations of available data are less certain The interpreted reservoir continuity may not meet the reasonable certainty criteria Probable estimates also include incremental recoveries associated with project recovery efficiencies beyond that assumed for Proved
Possible Reserves
Possible Reserves are those additional Reserves which analysis of geoscience and engineering data indicate are less likely to be recoverable than Probable Reserves
Competent Personrsquos Report African Petroleum Corporation Limited
June 2013 85
The total quantities ultimately recovered from the project have a low probability to exceed the sum of Proved plus Probable plus Possible (3P) which is equivalent to the high estimate scenario When probabilistic methods are used there should be at least a 10 probability that the actual quantities recovered will equal or exceed the 3P estimate
Possible Reserves may be assigned to areas of a reservoir adjacent to Probable where data control and interpretations of available data are progressively less certain Frequently this may be in areas where geoscience and engineering data are unable to clearly define the area and vertical reservoir limits of commercial production from the reservoir by a defined project
Possible estimates also include incremental quantities associated with project recovery efficiencies beyond that assumed for Probable
Probable and Possible Reserves
(See above for separate criteria for Probable Reserves and Possible Reserves)
The 2P and 3P estimates may be based on reasonable alternative technical and commercial interpretations within the reservoir andor subject project that are clearly documented including comparisons to results in successful similar projects
In conventional accumulations Probable andor Possible Reserves may be assigned where geoscience and engineering data identify directly adjacent portions of a reservoir within the same accumulation that may be separated from Proved areas by minor faulting or other geological discontinuities and have not been penetrated by a wellbore but are interpreted to be in communication with the known (Proved) reservoir Probable or Possible Reserves may be assigned to areas that are structurally higher than the Proved area Possible (and in some cases Probable) Reserves may be assigned to areas that are structurally lower than the adjacent Proved or 2P area
Caution should be exercised in assigning Reserves to adjacent reservoirs isolated by major potentially sealing faults until this reservoir is penetrated and evaluated as commercially productive Justification for assigning Reserves in such cases should be clearly documented Reserves should not be assigned to areas that are clearly separated from a known accumulation by non-productive reservoir (ie absence of reservoir structurally low reservoir or negative test results) such areas may contain Prospective Resources
In conventional accumulations where drilling has defined a highest known oil (HKO) elevation and there exists the potential for an associated gas cap Proved oil Reserves should only be assigned in the structurally higher portions of the reservoir if there is reasonable certainty that such portions are initially above bubble point pressure based on documented engineering analyses Reservoir portions that do not meet this certainty may be assigned as Probable and Possible oil andor gas based on reservoir fluid properties and pressure gradient interpretations
Competent Personrsquos Report African Petroleum Corporation Limited
June 2013 86
CONTINGENT RESOURCES
Contingent Resources are those quantities of petroleum estimated as of a given date to be potentially recoverable from known accumulations by application of development projects but which are not currently considered to be commercially recoverable due to one or more contingencies
Contingent Resources may include for example projects for which there are currently no viable markets or where commercial recovery is dependent on technology under development or where evaluation of the accumulation is insufficient to clearly assess commerciality Contingent Resources are further categorized in accordance with the level of certainty associated with the estimates and may be sub-classified based on project maturity andor characterized by their economic status
UNDISCOVERED PETROLEUM INITIALLY-IN-PLACE
Undiscovered Petroleum Initially in Place is that quantity of petroleum that is estimated as of a given date to be contained within accumulations yet to be discovered
PROSPECTIVE RESOURCES
Prospective Resources are those quantities of petroleum which are estimated as of a given date to be potentially recoverable from undiscovered accumulations
Potential accumulations are evaluated according to their chance of discovery and assuming a discovery the estimated quantities that would be recoverable under defined development projects It is recognized that the development programs will be of significantly less detail and depend more heavily on analog developments in the earlier phases of exploration
Prospect
A project associated with a potential accumulation that is sufficiently well defined to represent a viable drilling target
Project activities are focused on assessing the chance of discovery and assuming discovery the range of potential recoverable quantities under a commercial development program
Lead
A project associated with a potential accumulation that is currently poorly defined and requires more data acquisition andor evaluation in order to be classified as a prospect
Project activities are focused on acquiring additional data andor undertaking further evaluation designed to confirm whether or not the lead can be matured into a prospect Such evaluation includes the assessment of the chance of discovery and assuming discovery the range of potential recovery under feasible development scenarios
Play
Competent Personrsquos Report African Petroleum Corporation Limited
June 2013 87
A project associated with a prospective trend of potential prospects but which requires more data acquisition andor evaluation in order to define specific leads or prospects
Project activities are focused on acquiring additional data andor undertaking further evaluation designed to define specific leads or prospects for more detailed analysis of their chance of discovery and assuming discovery the range of potential recovery under hypothetical development scenarios
The range of uncertainty of the recoverable andor potentially recoverable volumes may be represented by either deterministic scenarios or by a probability distribution When the range of uncertainty is represented by a probability distribution a low best and high estimate shall be provided such that
bull There should be at least a 90 probability (P90) that the quantities actually recovered will equal or exceed the low estimate
bull There should be at least a 50 probability (P50) that the quantities actually recovered will equal or exceed the best estimate
bull There should be at least a 10 probability (P10) that the quantities actually recovered will equal or exceed the high estimate
When using the deterministic scenario method typically there should also be low best and high estimates where such estimates are based on qualitative assessments of relative uncertainty using consistent interpretation guidelines Under the deterministic incremental (risk-based) approach quantities at each level of uncertainty are estimated discretely and separately
These same approaches to describing uncertainty may be applied to Reserves Contingent Resources and Prospective Resources While there may be significant risk that sub-commercial and undiscovered accumulations will not achieve commercial production it useful to consider the range of potentially recoverable quantities independently of such a risk or consideration of the resource class to which the quantities will be assigned
Evaluators may assess recoverable quantities and categorize results by uncertainty using the deterministic incremental (risk-based) approach the deterministic scenario (cumulative) approach or probabilistic methods (see ldquo2001 Supplemental Guidelinesrdquo Chapter 25) In many cases a combination of approaches is used
Use of consistent terminology (Figure 11) promotes clarity in communication of evaluation results For Reserves the general cumulative terms lowbesthigh estimates are denoted as 1P2P3P respectively The associated incremental quantities are termed Proved Probable and Possible Reserves are a subset of and must be viewed within context of the complete Resources classification system While the categorization criteria are proposed specifically for Reserves in most cases they can be equally applied to Contingent and Prospective Resources conditional upon their satisfying the criteria for discovery andor development
Competent Personrsquos Report African Petroleum Corporation Limited
June 2013 88
For Contingent Resources the general cumulative terms lowbesthigh estimates are denoted as 1C2C3C respectively For Prospective Resources the general cumulative terms lowbesthigh estimates still apply No specific terms are defined for incremental quantities within Contingent and Prospective Resources
Without new technical information there should be no change in the distribution of technically recoverable volumes and their categorization boundaries when conditions are satisfied sufficiently to reclassify a project from Contingent Resources to Reserves All evaluations require application of a consistent set of forecast conditions including assumed future costs and prices for both classification of projects and categorization of estimated quantities recovered by each project
Competent Personrsquos Report African Petroleum Corporation Limited
June 2013 89
8 Appendix 2 Nomenclature
81 Units degC degrees Celsius
degF degrees Fahrenheit
bbl barrel
cp centipoises
ft feet
ftMDRKB feet below Kelly Bushing
ftTVDSS feet subsea
km kilometres
m metres
M or MM thousands and millions respectively
ms metres per second
md millidarcy
mTVDSS metres subsea
psia pounds per square inch absolute
psig pounds per square inch gauge
pu porosity unit
rb reservoir barrels
stb a stock tank barrel which is 42 US gallons measured at 147 pounds per square inch and 60 degrees Fahrenheit
82 Reserves and Resources Classifications
Low Low estimate of Prospective Resources as defined in SPE PRMS 2007
Best Best estimate of Prospective Resources as defined in SPE PRMS 2007
High High estimate of Prospective Resources as defined in SPE PRMS 2007
COS Geological Chance of Success associated with Prospective Resources
P10 10 per cent probability = Proved + Probable + Possible or 3P
P50 50 per cent probability = Proved + Probable or 2P
P90 90 per cent probability = Proved or 1P
83 Abbreviations AvO amplitude variation with offset
Bo oil shrinkage factor or formation volume factor in rbstb
Competent Personrsquos Report African Petroleum Corporation Limited
June 2013 90
CPI computer processed information log
FVF formation volume factor
FWL free water level
GRV gross rock volume
GWC gas water contact
KB kelly bushing
kh permeability thickness
MD measured depth
MSL mean sea level
NG net to gross ratio
OWC oil water contact
Phi porosity
PSC production sharing contract
PSDM post stack depth migration
PSTM post stack time migration
PVT pressure volume temperature experiment
RFT repeat formation tester
So oil saturation
Soi initial oil saturation
SS Subsea
STOIIP stock tank oil initially in place
Sw water saturation
Swc connate water saturation
TD total depth
TOC total organic carbon
TVD true vertical depth
TWT two way time
Vsh shale volume
Competent Personrsquos Report African Petroleum Corporation Limited
June 2013 91
Enclosures Resource Summary Sheets
Enclosure 11 Summary Description Sheet Barbet Prospect
SummaryBlock 9
APC Interest () 100
Fluid Oil
Crest (m ss) 3000
Water depth (m) 750
Notes
Area Shape F Areal NG Net Thick Porosity SO Bo STOIIP Rf Rec Res(km2) (frac) () (m) () () (rbstb) (MMstb) (frac) (MMstb)
Charge 90
Reservoir 70 Low 14 085 62 22 13 73 135 166 0300 60
Trap 50 Best 37 090 80 34 17 80 150 500 0375 186
Seal 70 High 98 095 98 53 20 88 165 1479 0450 558
COS 22 Deterministic inputs probabilistic STOIIP and Rec Resource Mean 270
Stratigraphic trap with amplitude support
Geological Risk Matrix
P10
P90metres
BARBET
dtdƐͿ
ϬŬŵϰ
Enclosure 12 Summary Description Sheet Sunbird Prospect Campanian Reservoir
SummaryBlock 8 amp 9
APC Interest () 100
Fluid Oil
Crest (m ss) 3000
Water depth (m) 1300
Notes
Area Shape F Areal NG Net Thick Porosity SO Bo STOIIP Rf Rec Res(km2) (frac) () (m) () () (rbstb) (MMstb) (frac) (MMstb)
Charge 80
Reservoir 80 Low 12 070 43 27 18 73 130 177 0300 63
Trap 60 Best 27 080 69 42 21 80 145 461 0375 172
Seal 70 High 61 090 95 66 24 88 165 1187 0450 448
COS 27 Deterministic inputs probabilistic STOIIP and Rec Resource Mean 229
Stratigraphic trap with amplitude support Split by intra-canyon
high
Geological Risk Matrix
P90
P10
metres
SUNBIRD
dtdƐͿ
ϬŬŵϰSUNBIRD
Enclosure 13 Summary Description Sheet Sunbird prospect Turonian Reservoir
SummaryBlock 8 amp 9
APC Interest () 100
Fluid Oil
Crest (m ss) 3300
Water depth (m) 1300
Notes
Area Shape F Areal NG Net Thick Porosity SO Bo STOIIP Rf Rec Res(km2) (frac) () (m) () () (rbstb) (MMstb) (frac) (MMstb)
Charge 90
Reservoir 60 Low 8 085 65 24 14 73 140 107 0300 39
Trap 50 Best 21 090 80 37 17 80 158 307 0375 115
Seal 70 High 53 095 94 58 20 88 175 863 0450 327
COS 19 Deterministic inputs probabilistic STOIIP and Rec Resource Mean 162
Stratigraphic trap with amplitude support Split by intra-canyon
high
Geological Risk Matrix
SW NE
Campanian Jacana Channel
Turonian BFF
P90
P10
metres
SUNBIRD
ϬŬŵϰ
Enclosure 14 Summary Description Sheet Sunbird Prospect Cenomanian Reservoir
SummaryBlock 8 amp 9
APC Interest () 100
Fluid Oil
Crest (m ss) 3500
Water depth (m) 1300
Notes
Area Shape F Areal NG Net Thick Porosity SO Bo STOIIP Rf Rec Res(km2) (frac) () (m) () () (rbstb) (MMstb) (frac) (MMstb)
Charge 100
Reservoir 50 Low 10 060 71 21 14 73 140 91 0300 33
Trap 60 Best 25 070 85 33 17 80 158 264 0375 99
Seal 60 High 65 080 99 51 20 88 175 779 0450 294
COS 18 Deterministic inputs probabilistic STOIIP and Rec Resource Mean 141
Stratigraphic trap with amplitude support Split by intra-canyon
high
Geological Risk Matrix
P90
P10
metres
SUNBIRD
dtdƐͿ
ϬŬŵϮ
Enclosure 15 Summary Description Sheet Lovebird Prospect Blue Horizon
SummaryBlock 8
APC Interest () 100
Fluid Oil
Crest (m ss) 5000
Water depth (m) 2850
Notes
GRV NG Porosity SO Bo STOIIP Rf Rec Res(MMm2) () () () (rbstb) (MMstb) (frac) (MMstb)
Charge 54
Reservoir 60 Low 354 30 14 60 150 68 030 25
Trap 70 Best 1310 54 19 70 180 293 038 109
Seal 90 High 4849 73 24 80 210 1218 045 456
COS 20 Mean 201
Four way dip closure to south of Block 8 Three potential
reservoirs identified Blue and Green horizon volumetrics derived
assuming ispoachous to Pink
Geological Risks
ŝŐŚĂƐĞWŝŶŬĞƉƚŚDĂƉ
Enclosure 16 Summary Description Sheet Lovebird Prospect Pink Horizon
SummaryBlock 8
APC Interest () 100
Fluid Oil
Crest (m ss) 5400
Water depth (m) 2850
Notes
GRV NG Porosity SO Bo STOIIP Rf Rec Res(MMm2) () () () (rbstb) (MMstb) (frac) (MMstb)
Charge 54
Reservoir 60 Low 354 30 12 60 155 59 030 22
Trap 70 Best 1310 54 17 70 188 262 038 96
Seal 90 High 4849 73 22 80 220 1066 045 400
COS 20 Mean 178
Four way dip closure to south of Block 8 Three potential
reservoirs identified Blue and Green horizon volumetrics derived
assuming ispoachous to Pink
Geological Risks
ŝŐŚĂƐĞWŝŶŬĞƉƚŚDĂƉ
Enclosure 17 Summary Description Sheet Lovebird Prospect Green Horizon
SummaryBlock 8
APC Interest () 100
Fluid Oil
Crest (m ss) 5800
Water depth (m) 2850
Notes
GRV NG Porosity SO Bo STOIIP Rf Rec Res(MMm2) () () () (rbstb) (MMstb) (frac) (MMstb)
Charge 54
Reservoir 60 Low 354 30 10 60 160 48 030 18
Trap 70 Best 1310 54 15 70 195 210 038 78
Seal 90 High 4849 73 20 80 230 896 045 337
COS 20 Mean 150
Four way dip closure to south of Block 8 Three potential
reservoirs identified Blue and Green horizon volumetrics derived
assuming ispoachous to Pink
Geological Risks
ŝŐŚĂƐĞWŝŶŬĞƉƚŚDĂƉ
Enclosure 18 Summary Description Sheet Wildbird Prospect
SummaryORFN $3ampQWHUHVW )OXLG 2LOampUHVWPVV DWHUGHSWKP P
Notes
Play Risk Prospect RiskGRV NG Porosity SO Bo STOIIP Rf Rec Res
6RXUFH 7UDS (MMm2) () () () (rbstb) (MMstb) (frac) (MMstb)6HDO ampKDUJH 5HVHUYRLU3UHV 5HVHUYRLU(II Low
Best High
COS 9 Deterministic inputs probabilistic STOIIP and Rec Resource Mean
)RXUZDGLSFORVHGKLJK
5
0 km 5
6 1(
PVV
Wildbird Horizons
ODFNEHUULJKWOXH3LQN5HG
mss
Enclosure 19 Summary Description Sheet Night Heron Prospect
SummaryORFN $3ampQWHUHVW RIORFN)OXLG 2LOampUHVWPVV DWHUGHSWKP
Notes
Prospect Risk Area Areal NG Net Porosity SO Bo STOIIP Rf Rec ResampKDUJH (km2) (frac) (m) () () (rbstb) (MMstb) (frac) (MMstb)5HVHUYRLU 7UDS Low 6HDO Best
High COS 144 Deterministic inputs probabilistic STOIIP and Rec Resource Mean 759
1LJKW+HURQLVD7XURQLDQEDVLQIORRUIDQVVWHPZKLFKPDLQOOLHVZLWKLQEORFNRIIVKRUHLEHULDWLVLGHQWLILHGDVDVWUDWLJUDSKLFWUDSZLWKDUHDOH[WHQWVGHILQHGEDPSOLWXGHWUXQFDWLRQDQGVWUXFWXUDOSLQFKRXW$QDUHDQHWDSSURDFKZDVDGRSWHGXVLQJWKHIXOOVWDFN360GHSWKLPDJHYROXPHWRSURYLGH61$H[WUDFWLRQDQGFRQVWUDLQDUHDOH[WHQWDQGHVWLPDWHDQDUHDO1WRDFFRXQWIRUODWHUDOYDULDELOLWZLWKLQWKHUHVHUYRLU1LJKW+HURQIDOOVSDUWORIIEORFN(5amp(FRUUHFWIRUWKLVXVLQJWKHUDWLRRIRQEORFNWRRIIEORFNDUHDLQUHSRUWLQJRIQHWXQULVNHGDQGQHWULVNHGUHVXOWV
6HLVPLFLQH36061$([WUDFWLRQ
Arbitrary line across Night Heron PSDM (Depth m)
S NE
2QWKHXSGLSSLQFKRXWLVGHILQHGELVRSDFKDQGDPSOLWXGHWUXQFDWLRQ
2QWKHXSGLSSLQFKRXWLVGHILQHGRQOELVRSDFK
Bee EaterNight Heron
5 Km
RMS Amplitudes from BFF Isopach
Depth (m)
Block Boundary
Enclosure 21 Summary Description Sheet
Summary - M - CretBlock A1
Working Interest () 60
Fluid Oil
Crest (m) 3130 (1070 bml)
Water depth (m) 2220
Notes
Play Risk Prospect Risk Area Stack F Net Porosity SO Bo STOIIP Rf Rec Res(Km2) (frac) (m) () () (rbstb) (MMstb) (frac) (MMstb)
Source 70 Trap 54
Seal 50 Mig 80 Low 8 1 15 10 55 125 82 010 13
Res Pres 80 Res Eff 80 Best 14 1 30 16 65 117 231 023 43
28 35 High 26 1 60 22 75 110 629 035 141
COS 10 Deterministic inputs probabilistic STOIIP and Rec Resource Mean 66
Structural high along edge of buried carbonate platform margin of
probable Lower Cretaceous and Jurassic age Seismic evidence
favourable for reservoir development Lower Bo model used to
reflect relatively shallow nature of prospect The prospect is close
to the shelf margin and so is well placed for charging The strong
rugose seismic events are interpreted as Karstified Limestones
Seismic Line Top Structure Map
WƌŽƐƉĞĐƚD
ĞƉƚŚŵ
Ϳ
Enclosure 22 Summary Description Sheet
Summary - SS - 4Block A1
Working Interest () 60
Fluid Oil
Crest (m) 4230 (2010 bml)
Water depth (m) 2220
Notes
Play Risk Prospect Risk Area Stack F Net Porosity SO Bo STOIIP Rf Rec Res(Km2) (frac) (m) () () (rbstb) (MMstb) (frac) (MMstb)
Source 70 Trap 80
Seal 90 Mig 85 Low 6 1 10 16 68 220 43 030 16
Res Pres 80 Res Eff 50 Best 11 1 19 20 75 167 113 038 42
50 34 High 21 1 35 24 83 135 295 045 112
COS 17 Deterministic inputs probabilistic STOIIP and Rec Resource Mean 56
Four way dip closed anticlinal structure The SS-4 interval has a
gross thickness over the crest area of 360 m Downlap of seismic
events across the crest of the SS-4 structure slightly downgrades
SS-4 seal The interval is believed to be Cenomanian in age and
the seismic character of generally planar events is interpreted as
representing thin bedded turbidites
Seismic Line Top Structure Map
2010 Migration Velocity Data ndash SS-4 Probability Above Spill
Enclosure 23 Summary Description Sheet
Summary - SS - 3Block A1
Working Interest () 60
Fluid Oil
Crest (m) 4590 (2370 bml)
Water depth (m) 2220
Notes
Play Risk Prospect Risk Area Stack F Net Porosity SO Bo STOIIP Rf Rec Res(Km2) (frac) (m) () () (rbstb) (MMstb) (frac) (MMstb)
Source 70 Trap 75
Seal 90 Mig 85 Low 12 1 20 15 68 227 197 025 63
Res Pres 80 Res Eff 50 Best 17 15 35 18 75 173 417 034 143
50 32 High 25 2 60 20 83 140 881 045 316
COS 16 Deterministic inputs probabilistic STOIIP and Rec Resource Mean 173
Four way dip closed anticlinal structure The SS-3 interval has a
gross thickness over the crest area of 550 m Seals to deeper
reservoirs may be eroded by overlying reservoirs From seismic
the prospective reservoir has been interpreted as being an Albian
deep water channel-lobe complex
Seismic Line Top Structure Map
2010 Migration Velocity Data ndashSS-3 Probability Above Spill
Enclosure 24 Summary Description Sheet
Summary - SS - 2Block A1
Working Interest () 60
Fluid Oil
Crest (m) 5140 (2920 bml)
Water depth (m) 2220
Notes
Play Risk Prospect Risk Area Stack F Net Porosity SO Bo STOIIP Rf Rec Res(Km2) (frac) (m) () () (rbstb) (MMstb) (frac) (MMstb)
Source 70 Trap 75
Seal 90 Mig 85 Low 12 1 20 11 68 231 187 025 58
Res Pres 80 Res Eff 50 Best 17 2 35 14 75 183 416 032 133
50 32 High 25 3 60 17 83 151 911 040 303
COS 16 Deterministic inputs probabilistic STOIIP and Rec Resource Mean 163
Four way dip closed anticlinal structure The SS-2 interval has a
gross thickness over the crest area of 830 m The prospective
reservoir has been interpreted as a stacked series of channellobe
sets Seals to deeper reservoirs may be eroded by overlying
reservoirs
Seismic Line Top Structure Map
2010 Migration Velocity Data ndashSS-2 Probability Above Spill
Enclosure 25 Summary Description Sheet
Summary - SS - 1Block A1
Working Interest () 60
Fluid Oil
Crest (m) 5970 (3750 bml)
Water depth (m) 2220
Notes
Play Risk Prospect Risk Area Stack F Net Porosity SO Bo STOIIP Rf Rec Res(Km2) (frac) (m) () () (rbstb) (MMstb) (frac) (MMstb)
Source 70 Trap 65
Seal 90 Mig 80 Low 17 1 20 8 50 249 158 015 34
Res Pres 80 Res Eff 50 Best 30 2 35 11 60 196 399 024 98
50 26 High 54 3 60 13 70 162 997 040 276
COS 13 Deterministic inputs probabilistic STOIIP and Rec Resource Mean 135
Four way dip closed anticlinal structureThe SS-1 interval has a
gross thickness over the crest area of 890 m The prospective
reservoir lies under an unconformity and is believed to be Jurassic
in age its seismic character suggests a channel amp channel-levee
complex Regional porosity trends indicate low porosities are likely
to be encountered if hydrostatic pressures are assumed
Seismic Line Top Structure Map
2010 Migration Velocity Data ndash SS-1 Probability Above Spill
Enclosure 31 Summary Description Sheet
SummaryBlock SL-03
APCL Interest () 90
Fluid Oil
Crest (m ss) 5400
Water depth (m) 3300
Notes
Play Risk Prospect Risk Area Areal NG Net Porosity SO Bo STOIIP Rf Rec Res(km2) (frac) (m) () () (rbstb) (MMstb) (frac) (MMstb)
Source 80 Trap 50
Seal 90 Mig 70 Low 11 070 29 15 73 205 218 030 79
Res Pres 90 Res Eff 80 Best 32 082 56 18 80 162 755 038 278
65 28 High 92 094 83 21 88 134 2473 045 938
COS 18 Mean 434
Altair is a Turonian turbidite channel prospects within the
SL-03 Block offshore Sierra Leone It is identified as a
stratigraphic trap with areal extents defined by amplitude
truncation and structural pinchout Recent discoveries in
nearby blocks confirm a working hydrocarbon system
(Venus-B1 Jupiter-1 and Mercury-1) The Sierra Leone
wells A-1 and A1-2 proved good reservoir and potential
source rocks Two distinct canyon systems feed erosive
channels at the break of slope An area net approach was
adopted using a pseudo-gradient volume SNA extraction to
constrain areal extent and define an areal NG to account
for lateral variability of sand distribution within the
reservoir
Arbitrary Dip Line Grad TWTGrad NRMS Extraction
Enclosure 41 Summary Description Sheet
SummaryBlock CI-513
APCL Interest () 90
Fluid Oil
Crest (m ss) 4200
Water depth (m) 2500
Notes
Play Risk Prospect Risk Area Areal NG Net Porosity SO Bo STOIIP Rf Rec Res(km2) (frac) (m) () () (rbstb) (MMstb) (frac) (MMstb)
Source 60 Trap 50
Seal 90 Mig 70 Low 11 070 20 17 73 181 179 030 65
Res Pres 90 Res Eff 80 Best 40 085 38 20 80 149 815 038 302
49 28 High 149 099 55 23 88 126 3474 045 1318
COS 14 Mean 569
Ayame is an Upper Cretaceous fan which mainly lies
ZLWKLQEORFNampRIIVKRUHampRWHparaYRLUHWLVLGHQWLILHGas a stratigraphic trap with areal extents defined by
amplitude truncation and structural pinchout The prospect
has very good amplitude support An area net approach
was adopted using pseudo-gradient volume SNA NRMS
extractions to constrain areal extent and define an areal
NG to account for lateral variability of sand distribution
within the reservoir for low and high case area polygons
These seismically defined polygons were then filled to
column heights of 200m and 800m respectively and used
to constrain the P90 and P10 area inputs of our
probabilistic simulation
Seismic Line
TWT Grad SNA Extraction
Ayame
Ayame West
dtdƐͿ
Ayame
Enclosure 42 Summary Description Sheet
SummaryBlock CI-513 amp Open
APCL Interest () 90 in CI-513
Fluid Oil
Crest (m ss) 4900
Water depth (m) 2700
Notes
Play Risk Prospect Risk Area Areal NG Net Porosity SO Bo STOIIP Rf Rec Res(km2) (frac) (m) () () (rbstb) (MMstb) (frac) (MMstb)
Source 60 Trap 50
Seal 90 Mig 70 Low 10 061 25 14 73 194 161 030 58
Res Pres 90 Res Eff 80 Best 30 080 47 18 80 159 585 038 216
49 28 High 93 099 69 21 88 134 2085 045 788
COS 14 Mean 352
A second prospect within the same reservoir interval was
identified and volumetrically assessed Ayame West is
separated from Ayame by a structural high isopach
thinning and amplitude dimming The prospect was
assessed in the same manner as Ayame with a but with
Low Case column height of 600m filling down to the point
at which amplitudes between the two fans brighten
allowing possible communication The upper end of the
Ayame West fan lies down-dip of Ayame and less than
1km away from the thinning low amplitude saddle between
the two prospects
Seismic Line
TWT Grad SNA Extraction
Ayame
West
Ayame West
dtdƐͿ
Ayame
Enclosure 43 Summary Description Sheet
SummaryBlock CI-513 CI-509
APCL Interest () 90 of CI-513
Fluid Oil
Crest (m ss) 4400
Water depth (m) 2500
Notes
Play Risk Prospect Risk Area Areal NG Net Porosity SO Bo STOIIP Rf Rec Res(km2) (frac) (m) () () (rbstb) (MMstb) (frac) (MMstb)
Source 60 Trap 40
Seal 90 Mig 70 Low 6 070 15 16 73 185 71 030 26
Res Pres 90 Res Eff 70 Best 23 084 28 19 80 152 320 038 118
49 20 High 92 098 42 22 88 129 1408 045 521
COS 10 Mean 237
This sheet refers to volumes associated with Blocks 513 and CI-509 Sassandra is an Upper Cretaceous fan
which straddles blocks CI-513 and CI-509 It is identified
as a stratigraphic trap with areal extents defined by
amplitude truncation and structural pinchout A single
target reservoir is identified within the Turonian The
prospect has good amplitude support An area times net
approach was adopted using a pseudo-gradient volume
NRMS extraction to constrain prospect size Angle stacks
were not available outside of Block CI-513 so an RMS
extraction on the full stack volume was used to determine
NW extent In our low case we restrict the area of the
accumulation to the brightest area of anomalous
amplitudes Our high case extends the prospect down-dip
Arbitrary Dip Line Grad TWT
Full Stack - RMS Extraction
Sassandra
dtdƐͿ
Enclosure 44 Summary Description Sheet
SummaryBlock CI-513
APCL Interest () 90
Fluid Oil
Crest (m ss) 3900
Water depth (m) 2500
Notes
Play Risk Prospect Risk Area Areal NG Net Porosity SO Bo STOIIP Rf Rec Res(km2) (frac) (m) () () (rbstb) (MMstb) (frac) (MMstb)
Source 60 Trap 40
Seal 90 Mig 70 Low 4 071 20 19 73 185 67 030 25
Res Pres 90 Res Eff 70 Best 13 085 38 22 80 152 281 038 104
49 20 High 46 099 55 25 88 129 1142 045 431
COS 10 Mean 190
Cavalla is an Upper Cretaceous Fan which lies between
the Ayame and Sassandra prospects of Block CI-513
RIIVKRUHampRWHparaYRLUHWLVLGHQWLILHGDVDVWUDWLJUDSKLFtrap with areal extents defined by amplitude truncation and
structural pinchout A single target reservoir is identified
within the TuronianCenomanian interval which lies
stratigraphically beneath the Ayame Prospect For the
amplitude analysis the top reservoir has been shifted up
30ms to bracket strong negative amplitudes on the
Gradient volume and the base reservoir has been shifted
up 50ms to remove Albian related amplitudes An area net
approach was adopted using pseudo-gradient volume SNA
NRMS extractions to constrain extent of the low and high
case area polygons These seismically defined polygons
were then filled to column heights of 200m and 800m
respectively
Arbitrary Dip Line Grad TWT Grad NRMS Extraction
Cavalla
dtdƐͿ
Enclosure 45 Summary Description Sheet
SummaryBlock CI-509
APCL Interest () 90
Fluid Oil
Crest (m ss) 3700
Water depth (m) 2500
Notes
Play Risk Prospect Risk Area Areal NG Net Porosity SO Bo STOIIP Rf Rec Res(km2) (frac) (m) () () (rbstb) (MMstb) (frac) (MMstb)
Source 60 Trap 60
Seal 90 Mig 70 Low 5 076 39 21 73 150 252 015 55
Res Pres 90 Res Eff 80 Best 18 088 75 24 80 134 997 028 258
49 34 High 61 100 111 27 88 121 3682 040 1039
COS 16 Mean 460
Leraba is an Upper Cretaceous fan It is identified as a
stratigraphic trap with extents defined by amplitude
truncation and structural pinchout The final processing
products and AvO volumes are yet to be delivered for CI-
KRZHYHUWKHmicroHRWUDFHUDZPLJUDWLRQVWDFNparaYROXPHLVof high quality and is deemed suitable for deriving a
volumetric range for Leraba An area net approach was
adopted using an RMS extraction to constrain extent and
define an areal NG to account for lateral variability of sand
distribution In our low case we restrict the area to the
brightest area of anomalous amplitudes Our high case
extends the prospect down-dip and SW to include a
secondary channel system
Arbitrary Dip Line TWT Full Stack RMS Extraction
Leraba
dtdƐͿ
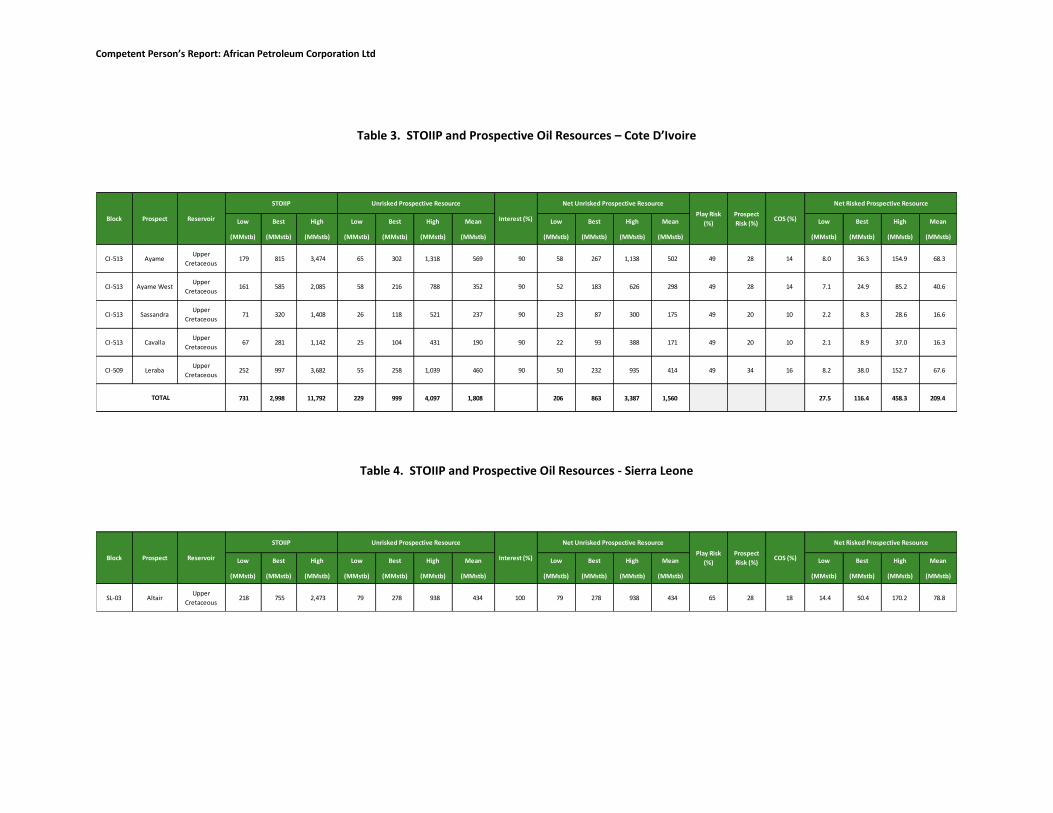
Competent Personrsquos Report African Petroleum Corporation Ltd
Table 3 STOIIP and Prospective Oil Resources ndash Cote DrsquoIvoire
Table 4 STOIIP and Prospective Oil Resources - Sierra Leone
Low Best High Low Best High Mean Low Best High Mean Low Best High Mean
(MMstb) (MMstb) (MMstb) (MMstb) (MMstb) (MMstb) (MMstb) (MMstb) (MMstb) (MMstb) (MMstb) (MMstb) (MMstb) (MMstb) (MMstb)
CI-513 AyameUpper
Cretaceous179 815 3474 65 302 1318 569 90 58 267 1138 502 49 28 14 80 363 1549 683
CI-513 Ayame WestUpper
Cretaceous161 585 2085 58 216 788 352 90 52 183 626 298 49 28 14 71 249 852 406
CI-513 Sassandra Upper
Cretaceous71 320 1408 26 118 521 237 90 23 87 300 175 49 20 10 22 83 286 166
CI-513 CavallaUpper
Cretaceous67 281 1142 25 104 431 190 90 22 93 388 171 49 20 10 21 89 370 163
CI-509 LerabaUpper
Cretaceous252 997 3682 55 258 1039 460 90 50 232 935 414 49 34 16 82 380 1527 676
731 2998 11792 229 999 4097 1808 206 863 3387 1560 275 1164 4583 2094TOTAL
COS ()
Net Risked Prospective Resource
Interest ()
Net Unrisked Prospective Resource
Block Prospect Reservoir
STOIIP Unrisked Prospective ResourcePlay Risk
()Prospect Risk ()
Low Best High Low Best High Mean Low Best High Mean Low Best High Mean
(MMstb) (MMstb) (MMstb) (MMstb) (MMstb) (MMstb) (MMstb) (MMstb) (MMstb) (MMstb) (MMstb) (MMstb) (MMstb) (MMstb) (MMstb)
SL-03 AltairUpper
Cretaceous218 755 2473 79 278 938 434 100 79 278 938 434 65 28 18 144 504 1702 788
Table 4 STOIIP and Prospective Oil Resources - Sierra Leone
Block Prospect Reservoir
STOIIP Unrisked Prospective ResourcePlay Risk
()Prospect Risk ()
COS ()
Net Risked Prospective Resource
Interest ()
Net Unrisked Prospective Resource
Competent Personrsquos Report
African Petroleum Corporation Limited
PREPARED FOR African Petroleum Corporation Limited
BY ERC Equipoise Limited
June 2013
Competent Personrsquos Report African Petroleum Corporation Limited
June 2013
Authors Adam Law Michael Braim Glyn Pugh Kate Overy Don Munn
Approved by Simon McDonald
Date released to client June 25 2013
ERC Equipoise Limited (ldquoERC13 Equipoiserdquo13 or13 ldquoERCErdquo) has made every effort to ensure that the interpretations conclusions and recommendations presented herein are accurate and reliable in accordance with good industry practice ERC Equipoise does not however guarantee the correctness of any such interpretations and shall not be liable or responsible for any loss costs damages or expenses incurred or sustained by anyone resulting from any interpretation or recommendation made by any of its officers agents or employees
Competent Personrsquos Report African Petroleum Corporation Limited
June 2013
Table of Contents 1 Introduction 14
11 Liberia PSC Overview 16
12 Gambia PSC Review 17
13 Senegal PSC Review 18
14 Sierra Leone PSC Review 19
15 Cote drsquoIvoire PSC Review 21
16 Evaluation Methodology Prospective Resources 22
2 Liberia Prospectivity and Plays 26
21 Introduction 26
22 Well and Seismic Database 27
23 Plays and Petroleum Geology Blocks 8 and 9 29
24 Play and Prospect Risk Liberia Blocks 8 and 9 31
25 Liberia Blocks 8 and 9 Leads and Prospects 33
251 Barbet Prospect 34
252 Sunbird Canyon Prospect 36
253 Night Heron 39
254 Lovebird Prospect 42
255 Wildbird Prospect 44
3 Gambia Prospectivity and Plays 47
31 Introduction 47
32 Well and Seismic Database 48
33 Plays and Petroleum Geology Blocks A1 and A4 49
34 Play Risk 51
35 Gambia Leads and Prospects 53
351 Alhamdulilah Prospect 54
352 Prospect M 57
4 Sierra Leone Prospectivity and Plays 59
41 Play Risk 62
41 Sierra Leone Leads and Prospects 62
Competent Personrsquos Report African Petroleum Corporation Limited
June 2013
411 Altair 62
5 Cote drsquoIvoire Prospectivity and Plays 65
51 Introduction 65
52 Well and Seismic Database 66
53 Plays and Petroleum Geology Blocks CI-509 and CI-513 67
54 Play Risk 68
55 Cote drsquoIvoire Blocks CI-509 and CI-503 Leads and Prospects 69
551 Ayame amp Ayame West 69
552 Sassandra 71
553 Cavalla 73
554 Leraba 75
6 Senegal Prospectivity and Plays 78
7 Appendix 1 SPE PRMS Guidelines 80
8 Appendix 2 Nomenclature 89
81 Units 89
82 Reserves and Resources Classifications 89
83 Abbreviations 89
Enclosures Resource Summary Sheets 91
Competent Personrsquos Report African Petroleum Corporation Limited
June 2013
List of Tables Table 11 Licence Summary Table 15 Table 12 Estimated oil recovery factors from producing Atlantic Margin fields 24 Table 13 Play and prospect risk system 24 Table 21 Play risk Cretaceous carbonate play Liberia Blocks 8 and 9 32 Table 31 Play risk Gambia Blocks A1 and A4 52 Table 41 Play risk Sierra Leone Block SL-03 62 Table 51 Play risk Cote drsquoIvoire Blocks CI-509 and CI-513 68
Competent Personrsquos Report African Petroleum Corporation Limited
June 2013
List of Figures Figure 1-1 Location of APCL licences West Africa 14 Figure 1-2 Location of Liberia Blocks 8 and 9 16 Figure 1-3 Location of Gambia Blocks A1 and A4 17 Figure 1-4 Location of Senegal ROP and SOSP Licences 18 Figure 1-5 Location of Blocks SL-03 and SL-04A 20 Figure 1-6 Location of Blocks CI-509 and CI-513 21 Figure 2-1 Notable discoveries West Africa offshore 27 Figure 2-2 Well and seismic database Liberia Blocks 8 and 9 28 Figure 2-3 Petroleum systems and plays Liberia Blocks 8 and 9 30 Figure 2-4 Porositydepth trend published West Africa turbidite reservoirs 31 Figure 2-5 Leads and Prospects Liberia Blocks 8 and 9 33 Figure 2-6 Seismic line (depth) over the Barbet prospect 34 Figure 2-7 Barbet far offset amplitudes with Top Turonian depth contours (m TVDSS) 35 Figure 2-8 Regional seismic line along axis of the Sunbird canyon system 36 Figure 2-9 Sunbird Campanian far offset amplitudes with Cenomanian depth contours (m TVDSS) 37 Figure 2-10 Sunbird Turonian far offset amplitudes with Top Turonian depth contours (m TVDSS) 38 Figure 2-11 Sunbird Cenomanian far offset amplitudes with Cenomanian depth contours (m TVDSS) 39 Figure 2-12 Arbitrary line across Night Heron PSDM (Depth m) 40 Figure 2-14 SNA from Basin Floor Fan Isopach (m) - PSDM 41 Figure 2-15 Seismic line over the Lovebird prospect 42 Figure 2-16 Lovebird prospect Top Pink horizon depth (mss) high case 43 Figure 2-17 Seismic line and prospect geo-seismic sketch Wildbird prospect 45 Figure 2-18 Wildbird Top Reservoir depth map (m TVDSS) Spill point - green contour 46 Figure 3-1 Plays Gambia Blocks A1 and A4 47 Figure 3-2 Wells 2D and 3D seismic data (red outline) Gambia Blocks A1 and A4 48 Figure 3-3 Well to seismic tie ndash Well Jammah-1 to the Alhamdulilah prospect 50 Figure 3-4 Leads and prospects identified by APCL in Gambia Blocks A1 and A4 53 Figure 3-5 Seismic line over the Alhamdulilah prospect 54 Figure 3-6 Area of closure Alhamdulilah prospect layers SS1 to SS4 55 Figure 3-7Alhamdulilah prospect seismic facies interpretation Cretaceous intervals 56 Figure 3-8 Seismic line through Prospect M 57 Figure 3-9 Low and high case closure Prospect M top Aptian depth (m TVDSS) 58 Figure 4-1 Offshore licences and discoveries Liberia and Sierra Leone 59 Figure 4-2 Well and seismic database offshore Sierra Leone 60 Figure 4-3 Leads Sierra Leone Block SL-03 61 Figure 4-4 Dip seismic line (full offsets) Altair prospect 63 Figure 4-5 Seismic amplitude (gradient stack) and Top Turonian depth (m TVDSS) Altair prospect 64 Figure 5-1 CI-509 and CI-513 Prospects and Leads offshore Cote drsquoIvoire 65
Competent Personrsquos Report African Petroleum Corporation Limited
June 2013
Figure 5-2 Petroleum systems and plays offshore Cote drsquoIvoire 66 Figure 5-3 Well and seismic database offshore Sierra Leone 67 Figure 5-4 Strike Line Ayame and Ayame West prospects 69 Figure 5-5 Ayame Seismic amplitude (gradient stack) and Top Turonian depth (m TVDSS) 70 Figure 5-6 Dip seismic line Sassandra prospect 71 Figure 5-7 Sassandra prospect Seismic amplitude and Top Turonian depth (m TVDSS) 72 Figure 5-8 Dip seismic line Cavalla prospect 74 Figure 5-9 Seismic amplitude (gradient stack) and Top fan depth (m TVDSS) Cavalla prospect 75 Figure 5-10 Dip seismic line Leraba prospect 76 Figure 5-11 Seismic amplitudes Leraba prospect 77 Figure 6-1 Petroleum systems and plays offshore Senegal 78 Figure 6-2 leads offshore Senegal Blocks ROP and SOSP 79
Competent Personrsquos Report African Petroleum Corporation Limited
June 2013 14
1 Introduction
At the time of writing African Petroleum Corporation Limited (APCL) holds interests in and operates exploration licences offshore West Africa within the territorial waters of Senegal the Gambia Sierra Leone Liberia and Cote drsquoIvoire (Figure 1-1) The status of these licences is summarised in Table 11 below ERC Equipoise Ltd (ERCE) has reviewed the prospectivity of these licences using data as of 31st May 2013
Figure 1-1 Location of APCL licences West Africa
Currently prospective resources are identified by APCL within the Liberia Gambia Sierra Leone and Cote drsquoIvoire licences We have made independent estimates of prospective resources and geological chance of success for certain prospects within these countries which are identified by APCL as near-term drilling opportunities The evaluation of the offshore Senegal licences is on-going and no prospects have been identified as of the date of this report We summarise qualitatively the prospectivity of the licences held by APCL in this country
Competent Personrsquos Report African Petroleum Corporation Limited
June 2013 15
Country Block Licence
Operator APCL () Status
Licence
Area (km2)
Outstanding Commitment in this Phase
Start of Current Phase
End of Current Phase
Liberia 8 APCL 100 Expl June 2012
June 2014
2717 Two
Exploration wells
Liberia 9 APCL 100 Expl June 2012
June 2014
2634 None
Gambia A1 APCL 60 Expl Dec
2007 Dec
2013 1296
One Exploration
well 1
Gambia A4 APCL 60 Expl Dec
2007 Dec
2013 1376 (see A1)
Senegal Rufisque Offshore Profond
APCL 90 Expl Oct
2011 Oct
2015 10357
One exploration
well
Senegal
Senegal Offshore
Sud Profond
APCL 90 Expl Oct
2011 Oct
2014 7920 None
Sierra Leone
SL-03 APCL 100 Expl Feb
2011 Feb
2014 3860 None
Sierra Leone
SL-04A APCL 100 Expl Sept 2012
Sept 2015
1995 One
exploration well 2
Cote drsquoIvoire
CI-509 APCL 90 Expl March 2012
March 2015
1091 One
exploration well
Cote drsquoIvoire
CI-513 APCL 90 Expl Dec
2011 Dec
2014 1446
One exploration
well
1) Transferrable to Block A4 if necessary 2) Contingent on results of 3D and that technology is available to drill in such water depths
Table 11 Licence Summary Table
Competent Personrsquos Report African Petroleum Corporation Limited
June 2013 16
11Liberia PSC Overview
APCL holds a 100 contractor interest in a Production Sharing Contract (ldquoPSCrdquo) covering Blocks 8 amp 9 offshore Liberia (Figure 1-2) Both blocks are in their second exploration period which began on 12th June 2012 and lasts for two years Commitments during the second phase in Block 8 are two exploration wells (to a minimum depth of 2000 meters) as a well commitment from the first exploration phase has been carried into the second phase All commitments have been met for the second phase in Block 9 with the drilling of Well Bee Eater-1 The minimum spend for each block in the second exploration period is US$ 10 MM At the end of this second phase a further 25 of each licence must be relinquished
Figure 1-2 Location of Liberia Blocks 8 and 9
For each block there is one further optional exploration period of two years that can be entered into with an additional well (to a minimum of 2000 metres) being required in each block in each period At the end of the third period all areas not retained for appraisal and development are to be relinquished There are also provisions for an appraisal period and an exploitation period of 25 years (with an additional term of 10 years if necessary) for each development area
Competent Personrsquos Report African Petroleum Corporation Limited
June 2013 17
Following a 25 relinquishment at the end of the first exploration phase Block 8 comprises an area of 2717 km2 and Block 9 comprises 2634 km2 Water depths range from less than 100 m to over 3000 m Most of the block areas lie in water depths greater than 500 m
12Gambia PSC Review
APCL holds a 60 contractor interest in Production Sharing Contracts covering Blocks A1 and A4 offshore Gambia (Figure 1-3) with Buried Hill Gambia BV holding the remaining 40 The licences were signed on 8th September 2006 with an effective date of 31st December 2007 and following two extensions they are still currently in the first exploration period which runs through to 31 December 2013
The work commitment during the first period comprises 1000 km2 of 3D seismic data in Block A1 and 750 km2 of 3D seismic data in Block A4 and one well which may be drilled in either block The seismic commitment has already been met
There are two further optional (but automatic) exploration periods of three years each that can be entered into with a well being required in each period in each licence Furthermore in Block A1 relinquishment of 10 of the licence area is required at the end of the first exploration period and 20 at the end of the second period In Block A4 relinquishment of 10 of the licence area is required at the end of the first exploration period In both blocks at the end of the third period all areas not retained for appraisal and development are to be relinquished There are also provisions for an exploitation period with the total term of the licences being 30 years (including the exploration periods) for each development area
The area of the licence is 1296 km2 for Block A1 and 1376 km2 for Block A4 Water depths vary from 500 m to over 3000 m
Figure 1-3 Location of Gambia Blocks A1 and A4
Competent Personrsquos Report African Petroleum Corporation Limited
June 2013 18
13Senegal PSC Review
APCL holds a 90 contractor interest in Exploration and Production Sharing Contracts (EPSC) covering Blocks Rufisque Offshore Profond (ROP) and Senegal Offshore Sud Profonde (SOSP) offshore Senegal (Figure 1-4) via its wholly owned subsidiary African Petroleum Senegal Limited Petrosen the state oil company hold a 10 carried interest
The EPSC governing block SOSP has an effective date of 25th October 2011 The first 85 years of the EPSC are termed the exploration phase which is subdivided into an initial period of three years with two subsequent extension periods of three and two and a half years each Work commitment in the initial exploration period is to acquire and reprocess the existing seismic data within the licence area and also to acquire a further 2500 km2 of 3D seismic data all with a minimum investment of US$ 10 MM The two extension periods have a commitment of one exploration well to a minimum depth of 3500 mss in each period or a minimum investment of US$ 20 MM Entry to the first extension period requires a 30 relinquishment of the licence area and a further 20 of the initial licence area must be relinquished on entry to the third phase The area of the licence is currently 7920 km2 Water depth is between 1000 and 4000 m over the block
Figure 1-4 Location of Senegal ROP and SOSP Licences
Competent Personrsquos Report African Petroleum Corporation Limited
June 2013 19
The EPSC governing Block ROP is of similar structure to that governing Block SOSP It has an effective date of 25th October 2011 The first eight years of the EPSC are termed the exploration phase which is subdivided into an initial period of four years with two subsequent extension periods of two years each Work commitment in the initial exploration period is to acquire the existing seismic data within the licence area for a minimum of US$ 2 MM and drill one exploration well to a minimum depth of 3500 m TVDSS or a minimum investment of US$ 20 MM The two extension periods have a further commitment of one exploration well to a minimum depth of 3500 m TVDSS in each period or a minimum investment of US$ 20 MM Entry to the first extension period requires a 30 relinquishment of the licence area and a further 20 of the initial licence area must be relinquished on entry to the third period The area of the licence is currently 10357 km2 Water depth is between 1500 and 3000 m over the block
APCL has met the seismic commitment of the first exploration period
Petrosen has a back-in right if an exploitation period is authorised for up to 20 of the licence subject to contribution of its share of forward costs (excluding training) The duration of an exploitation period is 25 years from authorisation with option for two ten year extensions at the discretion of the state
14Sierra Leone PSC Review
APCL holds a 100 contractor interest in a PSC covering Block SL-03 offshore Sierra Leone (Figure 1-5) through its wholly owned subsidiary European Hydrocarbons Ltd The licence was awarded on 23rd April 2010 and ratified on 22nd February 2011 APCL also holds a 100 contractor interest in a PSC covering Block SL-04A through its wholly owned subsidiary African Petroleum Sierra Leone Ltd The PSC governing Block SL-04A was ratified on 21st September 2012
The SL-03 licence has a duration of thirty years the first seven of which are termed the exploration period which is further subdivided into an initial period of three years followed by two extension periods of two years each The licence is currently in the initial exploration period
Work commitments during the initial period for Block SL-03 are to purchase and interpret the existing 2D seismic data over the licence and acquire a minimum of 500 km2 of 3D seismic data APCL has purchased the 2D seismic data and has acquired 2535 km2 of multi-client 3D seismic data over Block SL-03 fulfilling the seismic commitment for the initial phase The first and second extension periods require the drilling of one exploration well to a minimum depth (below mud line) of 1300 m or a minimum equivalent investment of US$ 30 MM Entry to the first extension period requires a 50 relinquishment of the licence area and a further 25 of the initial licence area must be relinquished on entry to the second extension period The area of the licence is 3860 km2 and water depth varies from 100m to over 4000m with the south-western half of the block being at water depths greater than 3000m
Competent Personrsquos Report African Petroleum Corporation Limited
June 2013 20
Figure 1-5 Location of Blocks SL-03 and SL-04A
The PSC covering Block SL-04A was ratified on 21st September 2012 The licence term is for thirty years the first seven years of which are defined as the exploration period which is further subdivided into an initial period of three years and two subsequent periods of two years Each well drilled in the initial exploration period extends this period by three months Work commitments during the initial phase are to acquire at least 1500 km2 of 3D seismic data and drill one exploration well (to a minimum depth of 2500m) contingent on the results of the 3D and the availability of drilling technology for such deep water The minimum equivalent investment is US$ 10 MM In 2011 TGS acquired 1085 km2 of multi-client 3D seismic data over Block SL-04A Upon licencing these data APCL will have fulfilled the seismic commitment for the initial phase
The subsequent two exploration periods require the drilling of one exploration well in each period (to a minimum depth of 2500 m) or a minimum investment of US$ 50 MM Entry to the second period requires a 50 relinquishment of the licence area and a further 25 of the initial licence area must be relinquished on entry to the third phase The area of the licence is currently 1995 km2 Water depth is between 3000 and 4000 m over the block
Competent Personrsquos Report African Petroleum Corporation Limited
June 2013 21
The state retains the right to a 10 carried interest during any development phase in both licences with the option to acquire a further 5 by covering an equivalent proportion of any development costs
15Cote13 drsquoIvoire13 PSC13 Review
APCL holds a 90 per cent contractor interest in two PSCs governing Block CI-509 and Block CI-513 offshore Cote drsquoIvoire (Figure 1-6) via its wholly owned subsidiary African Petroleum Cote drsquoIvoire Limited The state oil company Petroci has a 10 carried interest
Figure 1-6 Location of Blocks CI-509 and CI-513
The PSC for Block CI-509 was awarded on 16th March 2012 The first eight years of the PSC are termed the exploration period which is further divided into three terms of three three and two years respectively The licence is currently in its first exploration term Work commitments during the first exploration term are to purchase the existing 2D seismic data acquire 1091 km2 (ie a block wide) 3D seismic survey and drill one exploration well at least 100 m into the Albian (Lower Cretaceous) section The minimum investment is US$ 60 MM The second and third terms have a further commitment to drill one exploration well to at least 100 m into the Albian (Lower Cretaceous) section with a minimum investment of US$ 50 MM Entry to the second term requires a 25 relinquishment of the licence area and a further 25 of the initial licence area must be relinquished on entry to the third term The area of the licence is currently 1091 km2 Water depth is between 1900 and 3250 m over the block
Competent Personrsquos Report African Petroleum Corporation Limited
June 2013 22
The PSC covering Block CI-513 has an effective date of 19th December 2011 It has a similar structure to that governing Block CI-509 The first seven years are termed the exploration period subdivided into three terms of three two and two years The licence is currently in its first exploration term Work commitments during the first exploration term are to purchase the existing 2D seismic data acquire 1446 km2 (ie a block wide) 3D seismic survey and drill one exploration well at least 100 m into the Albian (Lower Cretaceous) section The minimum investment is US$ 60 MM The second and third terms have a further commitment to drill one exploration well to at least 100 m into the Albian (Lower Cretaceous) section with a minimum investment of US$ 50 MM Entry to the second term requires a 25 relinquishment of the licence area and a further 25 of the initial licence area must be relinquished on entry to the third term The area under licence is currently 1446 km2 Water depth is between 900 and 3100 m over the block
The exploitation period of both licences is for 25 years subject to successful award in the event of a commercial discovery On development Petroci has the right to acquire an interest of up to 20 in each licence subject to payment of its portion of future costs
In October 2012 APCL completed acquisition of 4200 km2 of 3D seismic data covering blocks CI-508 CI-509 and CI-513 fulfilling the seismic work commitments of the first exploration phase of both PSCs APCL is planning a two well drilling programme for the licences during 2014
16Evaluation Methodology Prospective Resources
We have used probabilistic methods to evaluate selected prospects within Liberia Blocks 8 and 9 Gambia Blocks A1 and A4 Sierra Leone Block SL-03 and Cote drsquoIvoire Blocks CI-513 and CI-509 We classify the results of our simulation as Low Best and High estimates of prospective resources following the Petroleum Resources Management System or PRMS (Appendix 1) We have assigned geological chance of success to each of the prospects using the methodology described below Estimates are made for oil only although we recognise that due to the significant uncertainties in the available geological information that there is a possibility of gas charge in all licences We present a summary of input estimates output STOIIP and gross resources and geological chance of success as a resource summary sheet for each prospective interval investigated These can be found in the enclosures 11 to 45 in this document
Inputs to our probabilistic simulation are evaluated in a consistent manner For the structurally trapped prospective intervals in Liberia (the Lovebird and Wildbird prospects) and the Alhamdulilah prospect in Gambia we have made a low and high deterministic estimate of closing contour for each trap to reflect the uncertainty in both mapping and depth conversion For Liberia we use the gross-rock volume (GRV) derived in this manner to constrain the P90 and P10 of our GRV distribution in our probabilistic simulation For Gambia we have used the areal extents of the low and high cases as inputs to an area times net calculation
Competent Personrsquos Report African Petroleum Corporation Limited
June 2013 23
For the stratigraphically trapped prospects in Liberia (Barbet Night Heron and Sunbird) Cote drsquoIvoire (Sassandra Ayame Ayame West Cavalla and Leraba) and Sierra Leone (Altair) we have made low and high estimates of area of closure using both structural and amplitude support where possible We have then made low and high estimates of gross reservoir thickness derived from regional observations calibrated against seismic data where possible As such depositional systems also have laterally variable sand distributions often supported by seismic data we employ the concept of an areal net to gross ratio varying the percentage of sand areally within the overall stratigraphic trap based on the uncertainty in seismic amplitude strength Where appropriate a geological shape factor is used depending on trap shape and structural relief relative to reservoir thickness
Estimates of reservoir porosity and net to gross ratio are made with reference to regional data offset wells including recent drilling by APCL in Liberia and account for compaction and a degree of overpressure (Figure 2-4) We make low mid and high deterministic estimates and use these to constrain the P90 P50 and P10 inputs to a probabilistic simulation Inputs for hydrocarbon saturation are constrained in a similar manner with reference to regional porosity and permeability trends calibrated to APCLrsquos recent drilling results in Liberia
We have estimated oil formation volume factors for a range of gas oil ratios (GOR) (from an appropriate minimum to fully saturated) for each of the prospective intervals assuming 4oC at the mudline (seabed) and geothermal gradients between 25 and 35oC per 100 m consistent with regional observation and the available well data We assume that the minimum GOR will increase with depth below the mudline Our estimates are calibrated against the oil samples in Well Narina-1 when estimating resources for the Liberian prospects
Some degree of overpressure is accounted for as it has been in our estimates of porosity but by reference to offset discoveries we assume that it is unlikely to exceed 500 psi over the depth range investigated
Recovery factors for the clastic reservoirs are estimated with reference to published information from discoveries in similar reservoir types examples of which are tabulated below (Table 12) Based on this table we estimate low best and high recovery factors of 30 375 and 45 respectively Again these are used to constrain the P90 P50 and P10 of our input distribution during probabilistic simulation
Some prospects are deep relative to mud line and we expect reservoir quality to be reduced despite overpressure We reduce our recovery factor estimates accordingly where this is the case Some prospects are relatively shallow to mud line Where this is the case we model a more viscous oil (prospects materially less than 1500m below sea bed) and have reduced our low best and high recovery factor range to 15 275 and 40 respectively In all cases we assume that a development is able to effectively dispose of any associated gas
Recovery factors for the carbonate reservoirs of the Wildbird prospect in Liberia and Prospect M in the Gambia are estimated by reference to more regional analogues and are discussed in the relevant sections
Competent Personrsquos Report African Petroleum Corporation Limited
June 2013 24
Due to the early stage of exploration within APCLrsquos licences we have adopted a six component risk matrix in all areas barring Liberia to estimate geological chance of success (COS) separated into play and prospect specific risks (Table 13) We have adopted this form of presentation of COS to reflect the fact that deep water exploration in much of the West African Atlantic Margin is at a very early stage and also that a number of the identified prospects have risk dependence and thus can be grouped as a play
Table 12 Estimated oil recovery factors from producing Atlantic Margin fields
PLAY RISK PROSPECT RISK
SOURCE RESERVOIR SEAL TRAP CHARGE RESERVOIR (Presence and Maturity) (Presence) (Presence) (Definition and Efficacy) (Migration) (Efficacy) Incorporates trap definition and seal risk (including biodegradation risk where necessary)
Table 13 Play and prospect risk system
The play risk segment focuses solely on the elements required in a given play to make a hypothetical prospect successful source reflecting the presence and thermal maturity of available source rocks with sufficient generation and expulsion to charge prospects reservoir reflecting the presence regionally of geological intervals that could potentially contain reservoir rock and seal ndash the regional presence of a sealing formation with sufficient thickness and extent to trap hydrocarbons
Prospect risk is divided into three elements Commonly we present seal and trap risk combined as an overall illustration of the integrity of the container here labelled trap risk Charge risk reflects the risk to migration of hydrocarbons from the source rock into the prospect and reservoir risk reflects solely the efficacy (ie porosity and permeability) of any identified reservoir interval
Note that a successful well on a given prospect may reduce or remove the play risk should the well prove reservoir charge and seal in a given play This will have the effect of de-risking further prospects associated with that play
Country Field Start Date Np Max Water Depth Prod Ult
RecoveryRec
FactorRecovery
Prod STOIIP
(MMstb) (m) (MMstb) (MMstb) (MMstb)Eq Guinea Ceiba Nov-00 112 800 18 187 40 10 468Eq Guinea Zafiro Aug-96 652 850 62 1583 40 26 4008Angola Girassol Dec-01 332 1360 32 958 45 30 2129Angola Kuito Dec-99 133 410 36 650 46 18 1413Brasil Espadarte Aug-00 67 877 10 261 31 26 842Brasil Marlim Mar-91 1720 853 101 2878 33 28 8721Total 259 6517 17580Average - Arithmetic 39 23Average - Weighted by STOIIP Ult Rec 37 25
Low Best High30 375 45
Fields on Atlantic Margin with significant production
Hence RF Range
Competent Personrsquos Report African Petroleum Corporation Limited
June 2013 25
Recent drilling within Liberia Blocks 8 and 9 has de-risked the play As a result we adopt prospect specific risking alone as source reservoir trap and seal with the same definitions as described above (Table 13)
Competent Personrsquos Report African Petroleum Corporation Limited
June 2013 26
2 Liberia Prospectivity and Plays
21Introduction
All of the available deep-water acreage offshore Liberia-Sierra Leone basin is under licence (Figure 1-2) Regionally hydrocarbons have been discovered within sandstones at a number of stratigraphic levels from the pre-rift to early syn-rift Albian in Cote drsquoIvoire (Espoir Foxtrot fields and a number of other discoveries) to turbiditic sandstones that have Late Cretaceous (CenomanianTuronian MaastrichtianConiacian) to early Tertiary (Palaeocene to Eocene) ages Recent drilling offshore Ghana has yielded a number of discoveries within these Upper Cretaceous sandstones such as the Jubilee oil field and the Enyenra Tweneboa and Odum oil and gascondensate discoveries In the Liberia-Sierra Leone basin recent drilling has yielded six hydrocarbon discoveries (Bee Eater Narina Monterrado Mercury Venus and Jupiter) but as yet none has been declared commercial (Figure 2-1) Although reservoir quality in the Albian sandstones is variable reservoir quality in the Upper Cretaceous and Tertiary sandstones is often good Successful trap types encountered regionally are both structural and stratigraphic
Of significance to the evaluation of the petroleum systems of Blocks 8 and 9 APCL have drilled three wells within the deeper water parts of the blocks Wells Apalis-1 Narina-1 and Bee Eater-1 Well Apalis-1 found source rock intervals of Albian to Cenomanian age but failed to find the prognosed reservoir Well Narina-1 found light oil within deep-marine sandstones of Cretaceous age The sandstones were of variable reservoir quality as the well appears to have been drilled on the edge of a fan system which can be interpreted from seismic data The extent of the Turonian hydrocarbon bearing interval around Well Narina-1 is currently under investigation by APCL who are working with CGGV to reprocess the 3D multi-client seismic with the hope of identifying areas of favourable reservoir within closure
Well Bee Eater-1 completed in February 2013 also discovered hydrocarbons within similar sandstones of Cretaceous age However the oil bearing Turonian reservoir at Bee Eater is interpreted as being of very low permeability and hence non-commercial APCL interprets that Well Bee Eater-1 was drilled in a canyon system that may have been largely bypassed by sediment input
Both wells demonstrate the viability of Cretaceous petroleum systems within the licence area
Competent Personrsquos Report African Petroleum Corporation Limited
June 2013 27
Figure 2-1 Notable discoveries West Africa offshore
22Well and Seismic Database
Exploration offshore Liberia is at an early stage To date five wells have been drilled in the deeper water areas in 2011 and 2012 with historical exploration drilling (up to 1985) restricted to the more shelfal areas (Figure 2-2) Data from two of these shallow water wells Wells S3-1 and Cestos-1 were made available to us for this evaluation Well S3-1 encountered oil shows in sandstones of Late Cretaceous age
GhanaJubilee Field on
production development of TEN area discoveries
new Hess deepwater discoveries
Cote drsquoIvoireShallow water production
recent discoveries in deepwater Turonian
reservoirs
LiberiaOil discoveries in
Cretaceous deepwater reservoirs at Narina
Monserrado
Sierra LeoneVenus Mercury and Jupiter
oil and condensate discoveries in deepwater
reservoirs
Guinea-COil shows in
offshore wells
Guinea-BSinapa oil discovery
planned appraisal
AGCDome Flore area heavy oil
discoveries under development review
SenegalOnshore gas and condensate production Recent onshore
Turonian discovery
MauritaniaChinguetti Field
production other oil and gas discoveries under development review
Competent Personrsquos Report African Petroleum Corporation Limited
June 2013 28
Figure 2-2 Well and seismic database Liberia Blocks 8 and 9
APCL has drilled three exploration wells offshore Liberia in the deep water part of Block 9 Wells Narina-1 Bee Eater 1 and Apalis-1 (Figure 1-2 Figure 2-2) Well Apalis-1 was drilled in 2011 targeting a four-way dip-closed structure with possible AvO support The well found traces of hydrocarbons plus source rock intervals but the prognosed reservoir sands were absent at target depth and the well was plugged and abandoned
Well Narina-1 was drilled by APCL in 2012 and found 16 to 21 m of net pay (light oil) within sandstones of Turonian (Cretaceous) age Hydrocarbons were also discovered in the underlying Albian Oil samples were collected but no drill-stem testing was undertaken Analysis of the oil samples indicates an API
3D Seismic Area
Competent Personrsquos Report African Petroleum Corporation Limited
June 2013 29
gravity for the Turonian oil of about 38 degrees and about 45 degrees for the Albian hydrocarbons Mobilities from formation pressure measurements and permeability from side-wall core measurements show the reservoir to be of relatively low permeability at this location
Well Bee Eater-1 was drilled by APCL in January and February 2013 The well found oil-bearing sandstones of Cretaceous age but of very low permeability and hence the well is considered non-commercial Post-drill interpretation of the seismic data has helped APCL revise the depositional model for this Turonian fan system The Bee Eater-1 well is interpreted to have encountered a bypass zone in both the Turonian and Cenomanian with immature sandstones that are poorly sorted and tight Post-well mapping of key seismic events tied to Well Bee Eater-1 reveals the possibility of finding better quality sandstones in lsquobasin-floor fanrsquo units down-dip Potentially sealing shale units and source rock units were also found in the Bee-Eater-1 well
Well Apalis-1 and in particular Wells Bee Eater-1 and Narina-1 help de-risk seal and hydrocarbon charge for the Cretaceous play on-block
The primary seismic dataset for our evaluation was the recently acquired 5170 km2 of 3D seismic data over the deeper water area of Blocks 8 and 9 including certain products to review amplitude versus offset (AvO) effects These seismic data cover both recently drilled deep water wells In addition a grid of 2D seismic data was also made available with average line spacing of around 45 km These data provide a tie to Well S3-1 although the well lies some 200m from the nearest seismic line In general the data quality of the 3D volume is good and of suitable fidelity to enable us to undertake our review of identified prospectivity However local complexity in the shallow geology causes the signal to degrade considerably at the prospective levels in certain areas APCL are currently reprocessing these data in an attempt to improve signal quality APCL intend to utilise this dataset to update the CPR in the next 3-6 months It is hoped that these data will support maturation of additional prospects and further clarification of risk and volumes for prospects within this CPR
23Plays and Petroleum Geology Blocks 8 and 9
APCL has identified a number of plays within Blocks 8 and 9 at similar stratigraphic levels to those proven successful elsewhere along the West African margin (Figure 2-3) Recent drilling within Blocks 8 and 9 has demonstrated a working petroleum system within the mid to lower Cretaceous with drilling finding light oil within deep marine sandstones of Turonian age and also in sandstones of Albo-Aptian age
Competent Personrsquos Report African Petroleum Corporation Limited
June 2013 30
Figure 2-3 Petroleum systems and plays Liberia Blocks 8 and 9
Structural traps are identified at the pre-rift to early syn-rift (Albian) level as tilted fault blocks with hydrocarbons sourced from the Albian or Lower Cretaceous source rocks and seal provided by post-rift mud drape Structural and stratigraphic traps are also identified at several potential reservoir levels within the Late Cretaceous and Lower Tertiary again potentially sourced from the Turonian and or Albian source rocks Traps are sealed by coeval marine shales and muds As is encountered regionally there is reasonable seismic evidence for the presence of reservoir bearing intervals within the Upper Cretaceous and Early Tertiary section and this seismic evidence has been used in trap definition
The most significant play in the area is that of Cenomanian to Turonian age deep-marine channel-fan systems as structural and stratigraphic traps In addition an emerging lower Cretaceous microbial carbonate reservoir play has been identified sourced from coeval lacustrine source rocks and sealed by shales deposited during the subsequent drowning of the lacustrine systems by the onset of significant subsidence and marine inundation later in the Cretaceous We have evaluated prospects within both of these play systems Prospectivity in the shallower Cretaceous and Tertiary intervals is still being re-evaluated by APCL as of the date of this report and no leads have been matured to prospect status
Oil show Cestos-1
Competent Personrsquos Report African Petroleum Corporation Limited
June 2013 31
Figure 2-4 Porositydepth trend published West Africa turbidite reservoirs
24Play and Prospect Risk Liberia Blocks 8 and 9
Of the prospects reviewed all but the Wildbird prospect fall within the Cenomanian to Turonian channelfan play In our opinion recent drilling has de-risked source and reservoir presence for this play However reservoir quality in recent wells is variable In our risking of Cenomanian to Turonian prospectivity (Barbet Sunbird Lovebird and Night Heron prospects) we have removed the play element to our risking matrix and see a low risk to hydrocarbon charge for individual prospects Key risk is therefore to trap integrity and reservoir quality We use a four component risk matrix as outlined in Section 16 to define geological chance of success for these prospects
The Wildbird prospect has been recently identified by APCL as part of its review of further play fairways within the Liberian licences The play concept is of early Aptian bio-constructed carbonate build-ups within the restricted lacustrine environment that existed at this time Porosity and permeability within the bioclastic microbial limestones is potentially enhanced by hydrothermal activity resulting from the early rifting Later post-rift subsidence and drowning by marine conditions provides the top seal via the
0
500
1000
1500
2000
2500
3000
3500
4000
0 01 02 03 04m
Bel
ow S
eabe
dPorosity (fraction)
Porosity versus Depth Trend
Regional West AfricaTurbidite Data
Competent Personrsquos Report African Petroleum Corporation Limited
June 2013 32
deposition of Cretaceous marine muds It is envisaged that the play is charged or by Aptian source rocks deposited in the offset lagoonal facies with possible charge from later (but on-lapping) Cretaceous marine source rocks (as other plays on the blocks) Both potential source rocks provide lateral seal (Figure 2-16) Regionally lacustrine microbial carbonate reservoirs can be found in Congo and Angola where there is some production but also in the Campos and Santos basins in Brazil
The microbial carbonate play is emerging within Blocks 8 and 9 and has not been demonstrated to be effective by drilling We adopt the play and prospect risking as discussed in Section 16 to risk the Wildbird prospect as a result discounting biodegradation risk as the prospect is at significant depth Our estimate of play risk for the Cretaceous microbial carbonate play is summarized in below
PLAY Source Reservoir Presence Seal Play
Risk Cretaceous Carbonate 08 06 05 20
Table 21 Play risk Cretaceous carbonate play Liberia Blocks 8 and 9
Competent Personrsquos Report African Petroleum Corporation Limited
June 2013 33
25Liberia Blocks 8 and 9 Leads and Prospects
Following the drilling of Wells Narina-1 and Bee Eater-1 APCL is re-evaluating the prospectivity within Blocks 8 and 9 and has developed a number of potential traps (Figure 2-5) several of which (marked in orange Figure 2-5) have been matured to prospect status We have assessed the prospective resources for certain of these prospects that APCL has identified as viable near-term drilling opportunities Barbet Sunbird Lovebird Night Heron and Wildbird A number of the prospects have multiple reservoir targets Our evaluation of these prospects follows the methodology described in Section 16 The results of Wells Narina-1 and Bee Eater-1 would indicate that oil charge is probable and thus only oil cases have been evaluated However as we state in Section 16 a gas charge cannot be discounted due to the uncertainties in source rock evaluation and basin modelling Input parameters STOIIP prospective resources and geological chance of success for each of the evaluated prospects are summarised in Table 1 of this report and are also presented in the resource summary sheets as Enclosures 11 to 19 of this document
Figure 2-5 Leads and Prospects Liberia Blocks 8 and 9
Competent Personrsquos Report African Petroleum Corporation Limited
June 2013 34
ʹǤͷǤͳǤ Barbet Prospect
The Barbet prospect is identified as a stratigraphic trap around 14 km to the east of and up-dip from Well Narina-1 within Block 9 (Figure 2-6) A single target reservoir is mapped within the Turonian Seismic amplitude anomalies are also identified within the area of the trap that may provide support for reservoir development The Turonian is mapped at between 3000 and 3600 m TVDSS over the area of the prospect in a water depth of around 750 to 770 m
Figure 2-6 Seismic line - depth (m TVDSS) over the Barbet prospect
We have used an areanet pay methodology to estimate prospective resources for the Barbet prospect In our low case we restrict the area of the accumulation to the brightest area of anomalous amplitudes on the far offsets Our high case extends the prospect down-dip to include a larger area of anomalous amplitudes above an observed amplitude shut-off (Figure 2-7) These are used to constrain the P90 and P10 inputs of our probabilistic simulation These polygons approximate to an oil column height of 200 and 700 m respectively
Amplitudes are variable within the area of closure and we apply an areal net to gross ratio to better constrain sand distribution within the trap Gross reservoir thickness estimates are computed from the mapped seismic interval net to gross ratio from regional analogue and porosity from a regional porositydepth trend (Figure 2-4) Fluid parameters and recovery factors are estimated as described in Section 16
Narina-1 Barbet
Top Turonian
Top Cenomanian
Top Albian
Lwr Turonian (BFF)
Top Turonian
Narina-1
Apalis-1
Albian UC
0 km 2(mss)
W E
Competent Personrsquos Report African Petroleum Corporation Limited
June 2013 35
Figure 2-7 Barbet far offset amplitudes with Top Turonian depth contours (m TVDSS)
We have used the prospect risk matrix presented in Section 16 to determine the geological chance of success for the Barbet prospect Key risk to the Barbet prospect is to trapcontainment as the trap requires pinch-out of the reservoir in three directions to seal There is also a subsidiary risk to reservoir as the Turonian reservoir encountered in Well Narina-1 is of relatively poor quality which is countered by seismic evidence over the prospect to support reservoir development As a result we attribute a geological chance of success of 22 to the Barbet prospect
metres
P10
P90metres
APALIS-1
Competent Personrsquos Report African Petroleum Corporation Limited
June 2013 36
ʹǤͷǤʹǤ Sunbird Canyon Prospect
The Sunbird canyon prospect is also identified as a stratigraphic trap around 5 km to the south of Well Apalis-1 within Blocks 8 and 9 mapped as a large canyon system There are three potential reservoir targets within the prospect within the Campanian the Turonian (as encountered in Well Narina-1) and in the underlying Cenomanian Reservoir is prognosed at between 3000 m TVDSS and 3600 m TVDSS in a water depth of around 1300 m
Figure 2-8 Regional seismic line along axis of the Sunbird canyon system
We have used an areanet pay methodology to estimate prospective resources for the Sunbird canyon prospect At all three prospective layers the prospect divides into two discrete lsquocanyonsrsquo separated by an intra-basinal high (eg Figure 2-9) For the Campanian and Turonian prospective intervals in the low case we restrict the area of the accumulation to the brightest area of anomalous amplitudes on the far offsets in the northerly of the two canyons where amplitude response is better Our high case extends the prospect down-dip to include a larger area of anomalous amplitudes above an observed amplitude shut-off and also includes the southerly of the two canyons as this would now be in charge communication The low and high case polygons approximate to an oil column height of 200 m and 600 m respectively
Albian uc
LB-08LB-09
LB-08
LB-09
Albian UC
Sunbird
0 km 4
NESW
Competent Personrsquos Report African Petroleum Corporation Limited
June 2013 37
For the deeper Cenomanian the prospect is mapped as a single canyon to the south of the intra-basinal high The low and high case polygons approximate to an oil column height of 200 m and 700 m respectively Our low and high estimates of area are used to constrain the P90 and P10 of our probabilistic simulation
Figure 2-9 Sunbird Campanian far offset amplitudes with Cenomanian depth contours (m TVDSS)
Amplitudes are variable within the area of closure and we apply an areal net to gross ratio to better constrain sand distribution within the trap for all three prospective layers Gross reservoir thickness estimates are computed from the mapped seismic interval net to gross from regional analogue and porosity from the observed porositydepth trend (Figure 2-4) Fluid parameters and recovery factors are estimated as described in Section 16
metres
P90
P10
Block 9
Block 8
APALIS-1
Competent Personrsquos Report African Petroleum Corporation Limited
June 2013 38
Figure 2-10 Sunbird Turonian far offset amplitudes with Top Turonian depth contours (m TVDSS)
We have used the prospect risk matrix presented in Section 16 to determine the geological chance of success for the three prospective intervals of the Sunbird prospect Key risk to all three prospective layers is to trapcontainment as the trap requires pinch-out of the reservoir in three directions to seal There is also a subsidiary risk to reservoir at the two deeper levels as the Turonian reservoir encountered in Well Narina-1 is of relatively poor quality and Cenomanian reservoirs are yet to be proven on block However there is seismic evidence for reservoir development and hence we see this risk as favourable Reservoir risk is low for the Campanian as it is developed in the offset Well Narina-1 and there is seismic evidence for reservoir presence As a result we attribute a geological chance of
P90
P10
metres
Block 9
Block 8
APALIS-1
Competent Personrsquos Report African Petroleum Corporation Limited
June 2013 39
success of 27 19 and 18 to the Campanian Turonian and Cenomanian prospective intervals of the Sunbird canyon prospect
Figure 2-11 Sunbird Cenomanian far offset amplitudes with Cenomanian depth contours (m TVDSS)
ʹǤͷǤ͵Ǥ Night Heron
Night Heron is a Turonian basin floor fan system which lies 8 Km south west of Well Bee Eater-1 It is mainly within Block 9 but extends into Block 10 It is identified as a stratigraphic trap with areal extents defined by amplitude truncation and structural pinch-out Reservoir is prognosed at between 4100 m TVDSS and 4700 m TVDSS in a water depth of around 1750 m (Figure 2-12) APCL has selected a
P90
P10
metres
Block 9
Block 8
Competent Personrsquos Report African Petroleum Corporation Limited
June 2013 40
provisional well location which lies on the 3D survey location ndash In-line 1098 X-line 6103 They are currently seeking partners to drill the Night Heron well in early 2014
Figure 2-12 Arbitrary line across Night Heron PSDM - Depth (m TVDSS)
Cenomanian reservoir potential also exists beneath the Turonian basin floor fan and work by APCL is on-going to determine prospectivity
Well Bee Eater-1 found an organic-rich Turonian shale section overlying a hydrocarbon bearing thin-bedded low permeability sandstone Another shale dominated package underlies the sandstone Although the Turonian interval is considered non-commercial for Bee Eater the prospectivity down-dip is appealing APCL interprets that the well was drilled in a canyon system that may have been largely bypassed by sediment input The 3D seismic indicates a significant thickening of this Turonian interval towards the south west and there is some amplitude support for the occurrence of a lobate fan straddling Blocks 9 amp 10
An area times net approach was adopted using the full stack PSDM depth volume to provide an SNA extraction and constrain areal extent and estimate an areal NG to account for lateral variability within the reservoir (Figure 2-13) As night Heron falls partly off block ERCE correct for this using the ratio of on-block to off-block area in reporting of net unrisked and net risked results
S NEBee EaterNight Heron
5 Km
BFF Isopach (m)
Competent Personrsquos Report African Petroleum Corporation Limited
June 2013 41
Figure 2-13 SNA from Basin Floor Fan Isopach (m) - PSDM
We have used the prospect risk matrix presented in Section 16 to determine the geological chance of success for the Turonian interval of the Night Heron prospect Recent drilling results suggest that there is a low risk to hydrocarbon charge The observations at Bee Eater-1 also indicate that shale seals are also likely at a coeval interval Reservoir is a significant risk due to the poor Turonian reservoir development in Well Bee Eater-1 The Turonian reservoir encountered in Well Narina-1 is also of relatively poor quality However there is seismic evidence on the 3D survey for a possible improvement in reservoir development over the prospective area The definition of the trap is the key risk as the seismic evidence for closurereservoir pinch-out is ambiguous over the 2D data in Block 10 There appears to be evidence of the reservoir interval thinning in the critical north westerly direction but 3D data would be required to reduce trap risk any further As a result we attribute a geological chance of success of 144 to the Night Heron prospect
3
3
SNA from BFF Isopach
Block Boundary
Competent Personrsquos Report African Petroleum Corporation Limited
June 2013 42
ʹǤͷǤͶǤ Lovebird Prospect
The Lovebird prospect is mapped as a four-way dip closure to the south of Block 8 (Figure 2-14) Three prospective layers are mapped by correlation to up-dip wells and are prognosed to be of Cenomanian age Thus as with the Sunbird canyon prospect these reservoirs are not proven on block but seismic mapping and regional geological work suggests the sands may be derived from the east via a canyon system identified in block LB-07 The three prospective intervals are termed Upper Middle and Lower or Blue Pink and Green based on horizon colour Structural relief at the Pink horizon is between 50 and 200 m depending on the estimate and thus the prospect is relatively low relief in some realisations
Figure 2-14 Seismic line over the Lovebird prospect
Lovebird
Depth (mss)
4 km
NE
Competent Personrsquos Report African Petroleum Corporation Limited
June 2013 43
Figure 2-15 Lovebird prospect Top Pink horizon depth (m TVDSS) high case
The prospect is mapped to the edge of the available 3D (Figure 2-15) which coincides with the southern boundary of Block 8 but closure can be mapped south of the 3D area on the available 2D lines Reservoir depth is prognosed at between 5000 and 5900 m TVDSS in a water depth of 2850 m at the prospect crest Thus reservoir rock if present will be at comparable depths below mud line to the Barbet prospect
We use a gross-rock volumenet to gross methodology to estimate prospective resources for the Lovebird prospect APCLrsquos evaluation of the Lovebird prospect is on-going and of the three interpreted horizons the Pink horizon is the best defined We review pick depth conversion and thickness uncertainty for this interval to generate a range of gross-rock volumes for this interval with the
m ss
metres
Block 9
Block 8
Competent Personrsquos Report African Petroleum Corporation Limited
June 2013 44
prospect full to spill (Figure 2-15) Assuming the Pink horizon provides an accurate representation of the Blue and Green horizons we then estimate gross-rock volumes for these two intervals by isopach
Reservoir thickness and net to gross ratio estimates are derived from regional analogues with reservoir porosity derived from our regional porositydepth trend (Figure 2-4) Fluid properties and recovery factors are estimated as described in Section 16 Our volumetrics are restricted to the portion of the Lovebird prospect on Block 8 We would expect a further evaluation of the prospective resources of the Lovebird prospect to occur subsequent to the completion of the APCL evaluation and the prospective resources associated with the prospect in this report may therefore be subject to change
The key risks to the Lovebird prospect are to the development of reservoir at the prognosed Cenomanian intervals as they are not proved in wells elsewhere on the block and to source as the prospect requires a source rock deeper than that proven by drilling There is also risk to trapcontainment as the structure is not fully defined by the 3D seismic data volume and is of low relief in some realisations We assign a geological chance of success to the Lovebird prospect of 20 as a result
255Wildbird Prospect
The Wildbird prospect is mapped on 3D seismic data towards the south of Block 8 as a large four-way dip-closed high (Figure 2-17) at a depth of between 4000 to 4600 m TVDSS in a water depth of around 2000 m Structural relief is up to 600 m and area of closure up to 170 km2 The conceptual geological model is discussed above but is that the prognosed microbial carbonate reservoir of Albian age is developed between the mapped lsquoredrsquo and lsquolight bluersquo seismic events (Figure 2-16) with lateral seal developed to the north-east of the prospect within contemporaneous lagoonal facies which also provide the primary source rock This lateral seal is required to close the prospect Basin modelling undertaken by APCL suggests that the Albian lagoonal and later Cretaceous source rocks would be mature for oil generation
We have accepted this model as a geological concept and have used it to make estimates of prospective resources for the Wildbird prospect We then risk the model accordingly
Competent Personrsquos Report African Petroleum Corporation Limited
June 2013 45
Figure 2-16 Seismic line and prospect geo-seismic sketch Wildbird prospect
5
0 km 5
SWN
E
mss
Wildbird
Horizons
BlackberryLight BlueRoseRed
Competent Personrsquos Report African Petroleum Corporation Limited
June 2013 46
Figure 2-17 Wildbird Top Reservoir depth map (m TVDSS) Spill point - green contour
The Wildbird prospect is a large container but there is considerable uncertainty in reservoir thickness structural mapping and degree of charge from the offset kitchen areas We evaluate the prospect in a similar manner to the Lovebird prospect by perturbing the above variables In our low case we choose a shallow contact at 4250 m TVDSS to simulate under-filling or lateral breach via onlapping thief zones and also employ a reservoir thickness of 80 m from offset analogue Our high case assumes the prospect is filled to spill and that the lsquoredrsquo seismic event marks base reservoir Estimates of reservoir net to gross ratio and porosity are derived from the available analogues and are necessarily wide Fluid parameters and recovery factors are derived as described in Section 16
The Wildbird play is emerging and is of high risk We attribute a play risk of 24 as a result (Section 24) The key prospect risk to the Wildbird prospect is that of containment or trap as there is evidence for erosion at the crest of the feature and it is reliant on the development of lagoonal facies to the north-east and overlying marine shales to provide lateral seal and support the hydrocarbon column heights modelled here We attribute a prospect risk of 38 Wildbird which when combined with the play risk gives an overall chance of success for the Wildbird prospect of 9
mss
Competent Personrsquos Report African Petroleum Corporation Limited
June 2013 47
3 Gambia Prospectivity and Plays
͵ǤͳǤ Introduction
Although only one exploration well (Well Jammah-1) exists offshore Gambia exploration drilling has been undertaken to the north and south within Senegalese and Guinea Bissau waters (Figure 2-1 Figure 3-1) A number of oil and gas discoveries have been made onshore Senegal and the large Dome Flore and Dome Gea discoveries to the south of the blocks are each reported to contain a million barrels of biodegraded oil (c10-13o API) in place within sandstones of Oligocene (Tertiary) age Some lighter (30-34o API) oil has also been encountered in deeper intervals More regionally oil and gas discoveries have been made to the north offshore Mauritania and in Guinea Bissau (Sinapa) the recently drilled Venus and Mercury wells in Sierra Leone have also encountered hydrocarbons
Figure 3-1 Plays Gambia Blocks A1 and A4
The range of hydrocarbon types encountered is suggestive of multiple sourcing and the age of the reservoirs suggest late timing of oil generation consistent with a late Cretaceous source for the heavy oil although there are no published data to confirm this Regionally the gas source could be any of the older potential source rocks discussed below
Alhamdulilah
GAMBIA A1ampA4 PROSPECTIVITY POTENTIAL
Deep Water Fans channel levee complexes BFF lobes
Late Jurassic clastic progrades
Clastic progrades (unconformity trap)
Karst amp reef features in carbonate platform
Intra-carbonate clastic truncations
Based on line 1046-NWA
1
2
3
1
51
14
2
3
4
5
Competent Personrsquos Report African Petroleum Corporation Limited
June 2013 48
32Well and Seismic Database
Exploration offshore Gambia is also at an early stage and no wells have been drilled in the deeper water areas The nearest well to Blocks A1 and A4 (and the only well offshore Gambia) is Well Jammah-1 some 15 km to the east of Block A1 (Figure 3-2) This well contains oil shows within sandstones of Late Cretaceous age The well drilled to 3020 m MD reaching total depth in an interval of uncertain age perhaps Cenomanian to Albian
A regional grid of 2D seismic data was made available to us for our evaluation with an average line spacing of around 2-3 km on Block A1 and up to 8 km on Block A4 (Figure 3-2 Figure 3-3) In addition a 2003 vintage 3D seismic data volume was available for analysis covering 2008 km2 However APCL is using 2010 vintage 3D seismic data (2566km2) processed to pre-stack time-migration in their current evaluation and we have adopted these data for our review In general seismic data quality was found to be good
Figure 3-2 Wells 2D and 3D seismic data (red outline) Gambia Blocks A1 and A4
The 2D seismic data was sufficient to enable a well to seismic tie to be made to Well Jammah-1 (Figure 3-3) Despite its shelfal location we were able to extrapolate some stratigraphy into the deeper water
Competent Personrsquos Report African Petroleum Corporation Limited
June 2013 49
although the key Upper Cretaceous section is not sampled adequately by the well leading to uncertainty in the age of the deeper clastic section that forms the potential reservoir interval for the Alhamdulilah prospect
33Plays and Petroleum Geology Blocks A1 and A4
Some of the plays identified by APCL offshore Gambia are similar to those described for Liberia in Section 23 above with structural and stratigraphic traps identified at a number of Cretaceous intervals (Figure 3-1) and reservoirs prognosed as being of deep marine turbidites or other mass transport systems However plate tectonic reconstructions suggest that rifting occurred earlier along the Senegalese and Gambian margin beginning in the Lower Jurassic Thus there is the potential for deeper Jurassic age source and reservoir in the area
There is some seismic evidence for the presence of reservoir intervals as is common regionally although evidence is less compelling in the deeper intervals (Figure 3-5) Of the identified traps in this play fairway only one has currently been matured to prospect status by APCL the Alhamdulilah prospect
Regionally reservoirs within the Cretaceous are associated with a deep marine depositional environment and are generally expected to be of good to excellent quality with the possibility of some overpressure A similar depositional environment is prognosed for the deeper Jurassic age reservoirs with possible fan-delta like geometries identifiable on seismic landward (eastward) of the Alhamdululah prospect (Figure 3-7)
In addition to the Jurassic and Cretaceous clastic plays APCL has identified a number of closures along the margin of a carbonate platform of Jurassic to Aptian age partially penetrated by Well Jammah-1 (Figure 3-3 Figure 3-4) These closures are currently being evaluated by APCL and only one Prospect M has been evaluated to prospect status and we assess the prospective resources for Prospect M in this section
Competent Personrsquos Report African Petroleum Corporation Limited
June 2013 50
Figure 3-3 Well to seismic tie ndash Well Jammah-1 to the Alhamdulilah prospect
There is good evidence for the presence of source rocks in the Gambian margin The youngest source interval that could possibly generate oil is the Cenomanian-Turonian marine source rock proven in the Casamance Shelf wells and present in basins to the north Published data indicate kerogen is a mixed Type IIIII locally and Type II in wells to the south with HI of between 370-660 mggC in gt2 TOC rocks (TOCs in the DSDP-367 well 300 km to the west are in excess of 5 in black shales of Albian to Turonian age) This section is absent in Well Jammah-1 probably as a result of erosion
There is also the possibility of Necomian and Jurassic source rocks Necomian black shales are described in the DSDP-367 well Jurassic (Toarcian) source rocks are inferred to be present based on analogue evidence and plate tectonic reconstructions that place proven Jurassic source rocks in Morocco Portugal Nova Scotia and north-eastern Brazil in proximity to the Senegal-Gambia basin These are documented as having a HI of around 450 mggC and a TOC of up to 6
Regional thermal information shows a high degree of variability with gradients from 25 to 45 degCkm likely as a result of drilling on salt domes where geothermal gradients are elevated or in areas locally affected by volcanics Blocks A1 and A4 are at the northernmost margin of the salt basin so at worst only limited local effects are anticipated Using data from Well Jammah-1 we infer a geothermal gradient of 30deg Ckm at the location of the well This would put the Cenomanian-Turonian source locally into the oil window around the Alhamdulilah prospect However uncertainty in both depth conversion and geothermal modelling do not rule out the possibility that the Cenomanian-Turonian could be mature regionally for hydrocarbon generation Deeper Neocomian or Jurassic source rocks if present would be mature for oil generation under this model
ALHAMDULILAH
M
Senonian UC
W E4 km
Jammah-1
Alhamdulilah
Intra Aptian Carbonate
TWT (ms)
Competent Personrsquos Report African Petroleum Corporation Limited
June 2013 51
34Play Risk
In our evaluation of APCLrsquos Gambian blocks we note that a number of the prospective plays require further definition to mature the identified leads to prospect status As a result our evaluation is limited to the determination of independent estimates of prospective resource for the Alhamdulilah prospect and Prospect M We have used play and prospect risk for both prospects to allow for consistency in comparison between our evaluations where a play risk is appropriate
Based on the review above we see source risk as the key risk to the Lower Cretaceous and Jurassic clastic play Although a number of source rock intervals are present regionally only those within the Cretaceous are demonstrated to be present proximal to Blocks A1 and A4 Data are limited but modelling would suggest that those within the Cenomanian-Turonian could be immature for oil generation in all but a small area of the blocks As a result we assign a source risk of 07 Note that the uncertainty in both source rock presence and thermal data is such that there is a possibility of gas charge although like Liberia Sierra Leone and Cote drsquoIvoire it is impossible to quantify this chance at present
We see seal risk for this play to be relatively low as there is seismic evidence similar to that interpreted regionally for the presence of seal Seal risks for the multiple stacked sands prognosed for the Alhamdulilah prospect are handled as a prospect specific risk The inferred depositional environment for this interval would also suggest that sealing intervals would be developed We have therefore assigned a seal risk of 09 to this play
Seismic evidence for the presence of reservoir is also good but less convincing than that observed regionally and in our evaluation of Liberia Blocks 8 and 9 However we assign a reservoir presence risk of 08 It is possible that the younger Cretaceous reservoirs identified could be locally sourced via exhumation of the coeval carbonate platform to the east and thus be composed of detrital carbonate material This is reflected in the reservoir risk for the Alhamdulilah prospect itself
For the carbonate platform play the key risk is that of top seal Seismic reflectivity is highly variable above the top of the platform carbonates (Figure 3-3) as the event is a strong regional unconformity In places the overlying clastic section can be interpreted immediately above this unconformity Although the latter is factored into prospect specific risk to top seal the seismic evidence for the presence of a regional seal above the unconformity is not compelling The top seal is provided by a down-lapping carbonate prone Aptian-Albian section where the Senonian unconformity is not immediately above the reservoir section Analogues suggest there is a general lack of support for intra-formational seals in similar settings and therefore we assign a risk to the carbonate platform play seal of 05 as a result
The presence of a strong angular unconformity at the top of the carbonate platform structures is however likely to have enhanced reservoir quality within the carbonates themselves as a result of subareal exposure and karstification Thus we assign a risk of 09 to the reservoir presence element of the carbonate platform play and review the prospect specific reservoir efficacy risk on a prospect by prospect basis dependent on the seismic evidence for erosion
Competent Personrsquos Report African Petroleum Corporation Limited
June 2013 52
A number of the identified structures along the buried carbonate platform margin are relatively shallow to mudline and thus biodegradation of any oil charge is possible However as we have only estimated prospective resources for Prospect M we have not carried a play risk to biodegradation
Our final play risks for the Lower Cretaceous clastic and the buried carbonate platform plays are summarised in Table 31 below
PLAY Source Reservoir Presence Seal Play
Risk Cretaceous to Jurassic Clastic Play 07 08 09 50
Carbonate Platform Margin 07 09 05 28
Table 31 Play risk Gambia Blocks A1 and A4
Competent Personrsquos Report African Petroleum Corporation Limited
June 2013 53
35Gambia Leads and Prospects
In all 13 leads and prospects have been identified by APCL within Blocks A1 and A4 with areas of closure varying from around 4 km2 to 63 km2 (Figure 3-4) Of the identified prospective intervals a number are best classified as leads and require further technical work to mature them to prospect status (yellow Figure 3-4) Structural closure is identified within the Lower Cretaceous and a number of slope fans can be identified as seismic amplitude anomalies within the Upper Cretaceous section In addition a number of closures are mapped along the edge of the buried carbonate platform margin at Top Aptian level and APCL are currently evaluating the potential for a deeper Barremian age seal which might provide further prospectivity within the carbonate platform play
Figure 3-4 Leads and prospects identified by APCL in Gambia Blocks A1 and A4
In this section we briefly describe our evaluation of the Alhamdulilah prospect and Prospect M A summary of input parameters for the calculation of prospective resources results and risks for each of the prospective layers evaluated is given in the resource summary sheets in Enclosures 21 to 25 of this document
In 2010 APCL acquired a further 2566 km2 of 3D data over both blocks A re-evaluation of the identified leads and prospects is on-going using these data with the evaluation of the Alhamdulilah prospect and Prospect M completed
ALHAMDULILAH
M
Competent Personrsquos Report African Petroleum Corporation Limited
June 2013 54
351Alhamdulilah Prospect
The Alhamdulilah prospect is identified as a four-way dip-closed structural high within the centre of the deep water portion of Block A1 (Figure 3-3 Figure 3-5) We have evaluated four prospective intervals in total (Figure 3-5) Reservoir ages are currently prognosed by APCL to be of Lower Cretaceous (Turonian) to perhaps Lower Jurassic The prospect extends northwards of Block A1 into Senegalese waters and we have restricted our calculations to the proportion of the prospect that lies within Block A1 The bulk of the prospect does however lie within Gambian territory
Figure 3-5 Seismic line over the Alhamdulilah prospect
The prospective intervals within the Alhamdulilah structure lie between 4230 m TVDSS and 5970 m TVDSS or around 2010 to 3750 metres below sea bed This is relatively deep and despite the estimates of overpressure it is possible that porosity and thus reservoir quality to be relatively poor (Figure 2-4) Our estimates of recovery factor for the deeper prospective intervals reflect this
There is uncertainty in the degree of structural closure as although mapped reflectors are relatively bright and continuous the structure is of low relief We have account for this by undertaking various depth conversions of the mapped structure from the time domain 3D seismic data restricting our analysis to closure demonstrable on-block (Figure 3-6) At SS-1 level closure continues to the north off-block and also off the 3D seismic data We have reviewed the available 2D seismic data northwards to determine the spill point at this level
SS 4 (1)
SS 3 (1-2)
SS 2 (1-3)
SS 1 (1-3)
2 Km
Inline 1140 - TWT ALHAMDULILAH
TWT (s)
W E
Competent Personrsquos Report African Petroleum Corporation Limited
June 2013 55
Where seismic facies analysis suggests the potential for stacked pay intervals these have been modelled probabilistically Estimates of gross rock volume derived in this way are combined with the estimates of net reservoir thickness based on mapped seismic thicknesses and porosity and fluid information are derived as described in Section 16 to compute probabilistic estimates of resources for each reservoir interval
Figure 3-6 Area of closure Alhamdulilah prospect layers SS1 to SS4
Recovery factors used are as described in Section 16 of this report but modified to reflect the depth of burial of the deeper prospective intervals
We have reviewed the prospect specific risk for each of the prospective intervals independently Although the Alhamdulilah trap is a four-way dip-closed feature the time closure is subtle and the prospect is relatively deep There is also seabed canyoning which may cause uncertainty in the imaging and thus trap closure
Seismic evidence for seal is relatively good over the Alhamdulilah trap However there is evidence for downcuttingerosion between layers and above the prospect there is also evidence for downlapping events onto the topmost reflector
The key risk to the Alhamdulilah prospect is that of reservoir efficacy There are indications of fan-like geometries within the 3D seismic data (Figure 3-7) and some events can be mapped for the shallower reservoir layers However the Cretaceous reservoirs may alternatively comprise the eroded talus from the coeval carbonate platform to the east and reservoir quality rock may not be developed as a result Finally our estimate of overpressure may be incorrect and any sandstones present may have the reservoir quality sufficiently degraded via compaction to render them non-reservoir
SS-1 Low and High Case AreasSS-4 Low and High Case Areas SS-3 Low and High Case Areas SS-2 Low and High Case Areas
Competent Personrsquos Report African Petroleum Corporation Limited
June 2013 56
As a result the prospect specific risks to the prospective intervals of the Alhamdulilah prospect vary from 26 to 34 and from 13 to 17 when combined with the play risk
Figure 3-7Alhamdulilah prospect seismic facies interpretation Cretaceous intervals
AH-1 AH-1
Competent Personrsquos Report African Petroleum Corporation Limited
June 2013 57
352Prospect M
A number of structures have been identified by APCL at the Aptian level (ie top carbonate) along the buried carbonate platform margin that runs through Blocks A1 and A4 (Figure 3-1) Of these one structure Prospect M has been matured to prospect status and is of sufficient size to warrant independent estimates of resources (Figure 3-8)
Figure 3-8 Seismic line through Prospect M
We have evaluated the uncertainty in gross rock volume for Prospect M and combined this with reservoir net to gross ratio and porosity from analogue to generate estimates of STOIIP and prospective resources We have simulated uncertainty in seismic pick and also depth conversion to generate a range of spill points for the structure (Figure 3-9) These are used to make low and high case estimates of gross-rock volume
Due to the shallow nature of Prospect M we have assumed relatively high (but moveable) oil viscosities as discussed in Section 1 Recovery factor estimates are made with reference to this and also to analogue where uncertainty in both reservoir quality and also the degree of fracturing (and hence dual permeability) leads to a wide range in uncertainty in ultimate recovery Our low case recovery factor being affected primarily by early onset of water cut via fractures and an adverse mobility ratio and the high case making allowance for better oil mobility and improved matrix porosity and permeability leading to a more efficient sweep We therefore use a recovery factor range from 10 to 35 and use these as the P90 and P10 estimates on a log-normal distribution in our probabilistic simulation of prospective resources
Senonian UC
Intra Aptian Carbonate
TWT (ms)2 km
w EProspect M
Competent Personrsquos Report African Petroleum Corporation Limited
June 2013 58
Figure 3-9 Low and high case closure Prospect M top Aptian depth (m TVDSS)
There is pick and depth conversion uncertainty associated with Prospect M but we see a good chance of a closure being developed within the 3D seismic area and assign a prospect specific risk to trap of 09 as a result Downlapping events are observed onto the crest of the prospect (Figure 3-8) but the overlying seismic signature is relatively transparent thus we see a good chance of the prospect being sealed relative to the play risk However the prospect is relatively shallow at around 1000 m to 1100 m below the seabed and there is a risk to biodegradation of any oil charge Thus we associate a risk of 06 to biodegradation As it is established practice we place this risk into containment or trap risk which results in an overall trap risk of 09 06 or 54
There is evidence for the development of reservoir quality rock with a seismic character that has been associated with the development of karstification in the analogues used We also note that the prospect is very close to the platform edge and the erosional unconformity is quite pronounced again suggesting a period of subareal exposure Thus we see the prospect specific risk to reservoir efficacy as 08 Charge risk is also favourable with the prospect located at the edge of the buried platform margin proximal to the deeper potential kitchen areas We therefore associate a charge risk of 08 to the prospect
Thus we assign a prospect specific risk of 35 which when combined with the play risk for the carbonate platform margin gives an overall COS of 10
3
3
m ss
metres
Competent Personrsquos Report African Petroleum Corporation Limited
June 2013 59
4 Sierra Leone Prospectivity and Plays
As with offshore Liberia to the south-east all of the deep-water acreage offshore Sierra Leone is under licence (Figure 4-1) A discussion of regional hydrocarbon occurrences is presented in Section 21 APCLrsquos licences SL-03 and SL-04A-10 lie to the north-west of the countryrsquos territorial waters around 200 to 300 km north-west of the recent Venus Mercury and Jupiter discoveries made by Anadarko (Figure 4-1)
Figure 4-1 Offshore licences and discoveries Liberia and Sierra Leone
A regional grid of 2D seismic data is available to APCL for the evaluation of offshore Sierra Leone (Figure 4-2) In addition APCL has licenced c 2500 km2 of 3D seismic data covering the deeper water area of Block SL-03 and is negotiating the licencing of further 3D seismic data covering part of Block SL-04A-10
Competent Personrsquos Report African Petroleum Corporation Limited
June 2013 60
Well data offshore Sierra Leone are sparse Historical exploration was restricted to the shelf and resulted in the drilling of two exploration wells (Wells A-1 and A-1-2) which were plugged and abandoned as dry holes Data from both wells are available to APCL Recent drilling by Anadarko in the deeper waters of licence SL-07B-10 has yielded a number of discoveries (Wells Jupiter-1 Venus-1 and Mercury-1) but these well data are not available to APCL
Figure 4-2 Well and seismic database offshore Sierra Leone
The play fairways identified offshore Sierra Leone are very similar to those identified offshore Liberia (Figure 2-3) as structural traps within the Lower Cretaceous syn-rift section and primarily as stratigraphic traps within turbiditic sands of Cretaceous age (Campanian Cenomanian and Turonian) Sourcing from regional marine (Cenomanian) or lacustrine (Albo-Aptian) source rocks is hypothesized For the syn-rift structural play the presence of Albo-Aptian reservoirs is demonstrated by the shallow water Wells A-1 and A-1-2 which also had indications of the development of source rocks within the
Competent Personrsquos Report African Petroleum Corporation Limited
June 2013 61
Cretaceous syn-rift section Although the data are not available the recent Anadarko wells are publically documented as having found hydrocarbons within post-rift Cretaceous turbidites potentially de-risking this play
Blocks SL-03 and SL-04A-10 are towards the north-western edge of the seismically identified Cretaceous basin immediately adjacent to a large structural lineament the Sierra Leone Transform System Submarine canyon development is therefore prognosed to occur to the south and east of this lineament providing sediment input into the blocks during Cretaceous time As is encountered regionally there is reasonable seismic evidence for the presence of reservoir bearing intervals within the Upper Cretaceous section in the blocks
APCLrsquos evaluation of the recently licenced 3D seismic data is on-going and as yet only one prospect Altair has been matured to drillable prospect status However a number of other Cretaceous channelfan systems have been identified within Block SL- 03 (Figure 4-3)
Figure 4-3 Leads Sierra Leone Block SL-03
Competent Personrsquos Report African Petroleum Corporation Limited
June 2013 62
41Play Risk
Although there has been recent drilling along strike of APCLrsquos Sierra Leone licences these wells lie some 100 km to the east We have therefore attributed a play risk albeit favourable to Cretaceous channel-fan prospectivity within Blocks SL-03 and SL-04A-10 As with our review of Liberia there is strong seismic evidence for reservoir and seal rocks being present and offset drilling would indicate the same from the limited published information However there is as yet no proven source rock within APCLrsquos licences and we see this as the key risk to play The reported results of offset drilling and APCLrsquos own basin modelling would suggest that source risk would be favourable
Our final play risk for the Cretaceous channel-fan systems in APCLrsquos Sierra Leone licences is summarised in Table 31 below
PLAY Source Reservoir Presence Seal Play
Risk Cretaceous Play 08 09 09 65
Table 41 Play risk Sierra Leone Block SL-03
41Sierra Leone Leads and Prospects
APCL is currently evaluating the recently licenced 3D seismic data over Block SL-03 and has identified a number of Cretaceous channel-fan systems varying in areal extent from 20 km2 to 150 km2 Of the mapped channel fan systems one Altair has been matured to prospect status by APCL and we have made independent estimates of prospective resources and risks for this prospect
A summary of input parameters for the calculation of prospective resources results and risks for the Altair prospect is given in the resource summary sheet in Enclosure 31 of this document
411Altair
The Altair prospect is a turbidite channel prospect mapped at a seismic event described as Turonian by APCL (Figure 4-4) There is however uncertainty in this stratigraphy as it is established by jump correlation using regional seismic data due to the lack of deep water wells on block It is a stratigraphic trap with areal extents defined by amplitude truncation and structural pinch-out in a similar manner to prospectivity within APCLrsquos Liberia and Cote drsquoIvoire acreage A single target reservoir is identified within the trapped area The prospect has anomalous seismic amplitudes associated with it (Figure 4-5) which may indicate reservoir development The top structure is mapped between 6200 ndash 6800 ms TWT over the area of the prospect Our depth conversion indicates a crestal depth of approximately 5400 m TVDSS beneath a water depth of 3300 m giving 2100 m of sediment above top reservoir
Competent Personrsquos Report African Petroleum Corporation Limited
June 2013 63
Figure 4-4 Dip seismic line (full offsets) Altair prospect
The seismic image suggests that Altair is a turbidite channel constrained in the north east by a well-defined canyon Two distinct canyon systems feed erosive channels at the break of slope A south west trending fault which is almost perpendicular to the main canyon feeders alters bathymetric relief and diverts the Altair channel southwards
ERCE has made estimates of prospective resources for the Altair prospect using an identical methodology to our evaluation of Liberian prospectivity An area net approach was adopted using optimized seismic amplitudes to constrain areal extent and define an areal net to gross to account for lateral variability of sand distribution within the reservoir In our low case we restrict the area of the accumulation to the brightest area of anomalous amplitudes and a column height of 200 m Our high case extends the prospect down-dip to a column height of 800 m and laterally to incorporate weaker amplitude responses (Figure 4-5) These polygons were used to constrain the P90 and P10 area inputs of our probabilistic simulation
SW NE
Top Turonian
Top syn-rift
0 5kmTWT (s)
ALTAIR
3
3
metres
Competent Personrsquos Report African Petroleum Corporation Limited
June 2013 64
Figure 4-5 Seismic amplitude (gradient stack) and Top Turonian depth (m TVDSS) Altair prospect
Net pay is estimated from the mapped seismic interval and regional analogue with porosities and fluid properties estimated as described in Section 16
We have used the prospect risk matrix presented in Section 16 to determine the geological chance of success for the Altair prospect Key risk is to trap integrity due to the coalescing of a number of mapped fan systems up dip towards the pinch-out of Altair with subsidiary risk to charge as this is as yet unproven on block This gives a prospect specific risk of 28 which when combined with the play risk gives an overall chance of success of 18 for the Altair prospect
3
3
metres
Competent Personrsquos Report African Petroleum Corporation Limited
June 2013 65
5 Cote13 drsquoIvoire13 Prospectivity13 and Plays
51Introduction
Offshore Cote drsquoIvoire has been actively explored for hydrocarbons for a number of years and much of the offshore shelf is under licence Recently exploration has moved into deeper waters targeting the regional post-rift (Cretaceous) play and APCL has identified a number of prospects and leads within the western licence Blocks of CI-513 and CI-509 (Figure 5-1)
There are two main play types identifiable offshore Cote drsquoIvoire (Figure 5-2) as structural traps within the Lower Cretaceous (Aptian to Albian) syn-rift section and as stratigraphic traps within post rift turbiditic sands of Cenomanian to Turonian age Sourcing is prognosed from regional marine (Turonian) or lacustrine (Albo-Aptian) source rocks
Figure 5-1 CI-509 and CI-513 Prospects and Leads13 offshore13 Cote13 drsquoIvoire
Historically exploration has been restricted to the narrow shelf area and has yielded a number of commercial fields both oil and gas including Foxtrot Baobab and Espoir All of these fields lie within the Lower Cretaceous (Aptian) syn-rift play Recently exploration has moved into deeper waters targeting the regional post-rift (Cretaceous) play Well Paon-1X c 300 km to the east of Blocks CI-105 and CI-513
Competent Personrsquos Report African Petroleum Corporation Limited
June 2013 66
drilled by Tullow Oil plc and partners in licence CI-103 during 2012 is reported to have found hydrocarbons in turbiditic sandstones of Cretaceous age Well Kosrou-1X some 150 km east of Blocks CI-105 and CI-513 shows reservoir development within the post-rift Cretaceous section particularly within the Turonian to Cenomanian section
Evaluation of prospectivity within Blocks CI-509 and CI-513 is at an early stage and a working petroleum system is not proven on block However a number of Cretaceous channelfan systems have been identified using both 2D and 3D seismic data which have generated around seven potential traps at the date of this report five of which are considered prospects for this report (Figure 5-1)
Figure 5-2 Petroleum13 systems13 and13 plays13 offshore13 Cote13 drsquoIvoire
52Well and Seismic Database
APCL has obtained a regional database of 2D seismic data offshore Cote drsquoIvoire which provides well to seismic ties to Well San Pedro-1 (Figure 5-3) The primary data set used for our evaluation is that provided by the recently acquired 3D seismic data At the time of writing these data were processed to
Competent Personrsquos Report African Petroleum Corporation Limited
June 2013 67
pre-stack time-migration and we have used this volume plus available AvO processed volumes to evaluate the prospectivity of the CI-513 licence currently only the full-stack seismic product has been used to assess the prospectivity in Block CI-509
Figure 5-3 Well and seismic database offshore Sierra Leone
53Plays and Petroleum Geology Blocks CI-509 and CI-513
The primary play being explored within Blocks CI-509 and CI-513 is the Cretaceous post-rift turbidite play (Figure 5-2) There is reasonable seismic evidence for the presence of reservoir bearing intervals within the Upper Cretaceous section of the blocks However dating of the age of these post-rift turbidite channelfan systems is uncertain due to the paucity of well and seismic data with stratigraphy extrapolated into APCLrsquos licences via regional seismic correlation The presence of a regional Turonian source rock is hypothesized to charge any identified traps This is not proven on block but evidence from offset drilling in Block CI-105 demonstrates the presence of source rocks developed within the
Grand Lahou East 1
Kosrou 1x
San Pedro 1
South Grand Lahou 1
Competent Personrsquos Report African Petroleum Corporation Limited
June 2013 68
Cenomanian to Turonian and basin modelling studies indicate that the Turonian may be mature for oil generation local to the licences
A number of Cretaceous channelfan systems have been identified using both 2D and 3D seismic data (Figure 5-1) and we have independently evaluated the Prospective Resources and geological chance of success for five of these In addition the Lower Cretaceous syn-rift play may be viable within the licences particularly to the north Evaluation of this play by APCL is on-going and no prospective resources have been assessed for this play
54Play Risk
Exploration offshore Cote drsquoIvoire is at an early stage and there are limited well data available As a result ERCE has adopted a play and prospect risk system in our evaluation of the Cote drsquoIvoire prospective resources within the Cretaceous channel-fan play in an identical manner to our review of Liberia the Gambia and Sierra Leone
In a similar manner to Liberia the Gambia and Sierra Leone there is seismic evidence for the presence of seal and reservoir rock and thus the key risk is to source and we see source risk as the key risk to the Creteaceous clastic play Sourcing is prognosed from regional marine (Turonian) modelled as having limited hydrocarbon generating potential or lacustrine (Albo-Aptian) source rocks the maturity of which are interpreted to be in the very early oil window As a result we assign a play source risk of 06 Note that the uncertainty in both source rock presence and thermal maturity is such that there is a possibility of gas charge although it is impossible to quantify this chance at present
Our final play risk is summarised in Table 51 below
PLAY Source Reservoir Presence Seal Play
Risk Cretaceous Clastic Play 06 09 09 049
Table 51 Play13 risk13 Cote13 drsquoIvoire13 Blocks13 CI-509 and CI-513
Competent Personrsquos Report African Petroleum Corporation Limited
June 2013 69
ͷǤͷǤ Cote13 drsquoIvoire13 Blocks13 CI-509 and CI-503 Leads and Prospects
Prospectivity has been identified by APCL at a number of levels with the evaluation of the Cretaceous clastic turbidite channel-fan play being the most advanced ERCE has made independent assessments of prospective resources and geological chance of success for five prospects within this play Ayame Ayame West Sassandra Cavella and Leraba (Figure 5-1)
A summary of input parameters for the calculation of prospective resources results and risks for each of the prospective layers evaluated is given in the resource summary sheets in Enclosures 41 to 45 of this document
ͷǤͷǤͳǤ Ayame amp Ayame West
The Ayame and Ayame West prospects are identified as Upper Cretaceous fans which lie mainly within Block CI-513 (Figure 5-4) The prognosed trapping mechanism is stratigraphic with areal extents defined by amplitude truncation and structural pinch-out A single target reservoir is prognosed for both within stratigraphy identified as Turonian although stratigraphy is uncertain in both licences as it is established via long distance seismic ties The prospects have anomalous seismic amplitudes associated with them (Figure 5-5) which may indicate reservoir development The top structure is mapped between 5400 ndash 6300 ms TWT over the area of the prospect and our depth conversion places the crest of the trap at approximately 4200 m TVDSS beneath a water depth of 2500 m
Figure 5-4 Strike Line Ayame and Ayame West prospects
NE
0 km 4
TWT (s)
Top
Turonian
Base
Turonian
Top
Albian
AYAMEAYAME WESTSW
P90
P10
metres
P90
P10
AYAME
AYAMEWEST
Competent Personrsquos Report African Petroleum Corporation Limited
June 2013 70
Evaluation of the Ayame and Ayame West prospects is undertaken in an identical manner to our evaluations of the stratigraphically trapped channel-fan prospects in APCLrsquos Liberia and Sierra Leone licences An area net approach is adopted using anomalous seismic amplitudes to constrain areal extent and define an areal net to gross to account for lateral variability of sand distribution within the closure area In our low case we restrict the area of the accumulation to the brightest area of anomalous amplitudes and a 200 m column height Our high case extends the prospect down-dip to 800 m of column height to include a larger area of anomalous amplitudes (Figure 5-5) These polygons are used to constrain the P90 and P10 area inputs of our probabilistic simulation
Net pay estimates are estimated from mapped seismic interval thickness and from regional analogues with porosity fluid parameters and recovery factors estimated as described in Section 16
Figure 5-5 Ayame Seismic amplitude (gradient stack) and Top Turonian depth (m TVDSS)
We use the prospect risk matrix presented in Section 16 to determine the geological chance of success for the Ayame and Ayame West prospects Key risk is to trap and we attribute a trap risk of 50 to both
P90
P10
metres
P90
P10
AYAME
AYAMEWEST
Competent Personrsquos Report African Petroleum Corporation Limited
June 2013 71
prospects giving a prospect specific chance of success of 28 for both prospects When combined with the play risk this gives an overall chance of success of 14
A proportion of the closure areas for both the Ayame and Ayame West prospects fall outside Block CI-513 in our high case (6 km2 and 11 km2 respectively) This is corrected for in our summary tables of net risked and unrisked prospective resources at the beginning of this document by computing the area of the prospect off-block at P90 P50 and P10 and scaling accordingly
ͷǤͷǤʹǤ Sassandra
The Sassandra prospect is mapped as a deep-water fan system at Top Turonian level and lies within Blocks CI-513 and CI-509 approximately 20km west along strike from the Ayame prospect It is a stratigraphic trap with areal extents defined by amplitude truncation and structural pinch-out (Figure 5-6) A single target reservoir is prognosed within the Turonian and as with other prospects on block has similar uncertainty in the stratigraphic age of the prospective interval The prospect has anomalous amplitudes associated with it (Figure 5-7) which may indicate reservoir development The top structure is mapped between 5000 ndash 6000 ms TWT over the area of the prospect and our depth conversion predicts a crestal depth of approximately 4400 m TVDSS beneath a water depth of 2500 m
Figure 5-6 Dip seismic line Sassandra prospect
Top Turonian
Base Turonian
Top Albian
N S
TWT (s)
SASSANDRA
P90 P10
metres
CI-509
Competent Personrsquos Report African Petroleum Corporation Limited
June 2013 72
Evaluation of the Sassandra prospect is undertaken in an identical manner to our evaluation of the Ayame and Ayame West prospects An area net approach is adopted using anomalous seismic amplitudes to constrain areal extent and define an areal net to gross to account for lateral variability of sand distribution within the closure area In our low case we restrict the area of the accumulation to the brightest area of anomalous amplitudes and a 200 m column height Our high case extends the prospect down-dip to 800 m of column height to include a larger area of anomalous amplitudes (Figure 5-7) These polygons are used to constrain the P90 and P10 area inputs of our probabilistic simulation As far offset data are only available for CI-513 (at the time of writing) we have used amplitudes from the full-stack volume to map the extent of the prospect to the west off block (Figure 5-7)
Net pay estimates are estimated from mapped seismic interval thickness and from regional analogues with porosity fluid parameters and recovery factors estimated as described in Section 16
Figure 5-7 Sassandra prospect Seismic amplitude and Top Turonian depth (m TVDSS)
We use the prospect risk matrix presented in Section 16 to determine the geological chance of success for the Sassandra prospect Key risk is to trap and we attribute a trap risk of 40 This is a lower value
33
metres
CI-509
Competent Personrsquos Report African Petroleum Corporation Limited
June 2013 73
than our estimates for the Ayame and Ayame West prospects as the up-dip termination of the trap is less well defined and requires a larger area for pinch-out or bypass Seismic amplitude support for reservoir presence is less over the Sassandra prospect relative to Ayame Thus we estimate a prospect specific chance of success for the Sassandra prospect of 20 which when combined with the play risk gives an overall chance of success for the Sassandra prospect of 10
A proportion of the closure area for the Sassandra prospect falls outside Blocks CI-513 and CI-509 in our high case (33 km2) This is corrected for in our summary tables of net risked and unrisked prospective resources at the beginning of this document by computing the area of the prospect off-block at P90 P50 and P10 and scaling accordingly
553Cavalla
The Cavalla prospect is an Upper Cretaceous Fan which lies between the Ayame and Sassandra prospects within Block CI-513 It is identified as a stratigraphic trap with areal extents defined by amplitude truncation and structural pinch-out (Figure 5-8) A single target reservoir is prognosed within the TuronianCenomanian interval (with similar stratigraphic uncertainty to other prospects on block) which lies stratigraphically beneath the Ayame prospect The prospect has anomalous seismic amplitudes associated with it (Figure 5-9) which may indicate reservoir development The top structure is mapped between 4600 ndash 5900 ms TWT over the area of the prospect and we estimate a crestal depth of approximately 3900 m TVDSS beneath a water depth of 2500 m The prospect is more steeply dipping than other fan systems mapped on block
Evaluation of the Cavalla prospect is undertaken in an identical manner to our evaluation of the Ayame Ayame West and Sassandra prospects An area net approach is adopted using anomalous seismic amplitudes to constrain areal extent and define an areal net to gross to account for lateral variability of sand distribution within the closure area In our low case we restrict the area of the accumulation to the brightest area of anomalous amplitudes and a 200 m column height Our high case extends the prospect down-dip to 800 m of column height to include a larger area of anomalous amplitudes (Figure 5-9) These polygons are used to constrain the P90 and P10 area inputs of our probabilistic simulation
Net pay estimates are estimated from mapped seismic interval thickness and from regional analogues with porosity fluid parameters and recovery factors estimated as described in Section 16
We use the prospect risk matrix presented in Section 16 to determine the geological chance of success for the Cavella prospect Key risk is to trap and we attribute a trap risk of 40 As with the Sassandra prospect this is a lower value than our estimates for the Ayame and Ayame West prospects as the up-dip termination of the trap is less well defined and requires a larger area for pinch-out or bypass Seismic amplitude support for reservoir presence is less over the Cavella prospect relative to Ayame Thus we estimate a prospect specific chance of success for the Cavella prospect of 20 which when combined with the play risk gives an overall chance of success for the Cavella prospect of 10
Competent Personrsquos Report African Petroleum Corporation Limited
June 2013 74
The Cavalla prospect is contained entirely within APCLrsquos licences
Figure 5-8 Dip seismic line Cavalla prospect
Top Turonian
Top Albian
TWT (s)
CAVALLANW SEP90
P10
metres
Competent Personrsquos Report African Petroleum Corporation Limited
June 2013 75
Figure 5-9 Seismic amplitude (gradient stack) and Top fan depth (m TVDSS) Cavalla prospect
ͷǤͷǤͶǤ Leraba
As with the other evaluated prospectivity within Blocks CI-509 and CI-513 the Leraba prospect is an Upper Cretaceous fan which lies within Block CI-509 It is identified as a stratigraphic trap with areal extents defined by amplitude truncation and structural pinch-out (Figure 5-10) The prospect has anomalous seismic amplitudes associated with it (Figure 5-11) which may indicate reservoir development Unlike the other Cote DrsquoIvoire prospects evaluated in this report no offset seismic volumes were available for our review of Leraba at the time of writing The seismic amplitude response and character on the full-stack data is however consistent with that observed over other prospects in Block CI-513 where more seismic products were available
P90
P10
metres
Competent Personrsquos Report African Petroleum Corporation Limited
June 2013 76
The top structure is mapped between 4600 ndash 5200 ms TWT over the area of the prospect and we estimate a depth at the crest of approximately 3700 m TVDSS beneath a water depth of 2500 m
Figure 5-10 Dip seismic line Leraba prospect
Evaluation of the Leraba prospect is undertaken in an identical manner to our evaluation of the other Cretaceous fan systems evaluated in this section An area net approach is adopted using anomalous seismic amplitudes to constrain areal extent and define an areal net to gross to account for lateral variability of sand distribution within the closure area In our low case we restrict the area of the accumulation to the brightest area of anomalous amplitudes and a 200 m column height Our high case extends the prospect down-dip to 800 m of column height to include a larger area of anomalous amplitudes (Figure 5-11) These polygons are used to constrain the P90 and P10 area inputs of our probabilistic simulation
P90
P10
metresTWT (s)
LERABANW SE
Top Turonian
Albian
0 5km
Competent Personrsquos Report African Petroleum Corporation Limited
June 2013 77
Figure 5-11 Seismic amplitudes Leraba prospect overlay of Top Reservoir m TVDSS
Net pay estimates are derived from mapped seismic interval thickness and from regional analogues with porosity fluid parameters and recovery factors estimated as described in Section 16 The prospect is relatively shallow to mud line and we have modelled a more viscous oil as described in Section 16
We use the prospect risk matrix presented in Section 16 to determine the geological chance of success for the Leraba prospect Key risk is to trap and we attribute a trap risk of 60 as the up-dip extent of the prospect is fairly well defined on seismic data Although no off-set 3D seismic data were available the seismic evidence for reservoir presence is again comparable to that of Ayame West Thus we estimate a prospect specific chance of success for the Leraba prospect of 34 which when combined with the play risk gives an overall chance of success for the Leraba prospect of 16
The Leraba prospect is contained entirely within APCLrsquos licences
P90
P10
metres
Competent Personrsquos Report African Petroleum Corporation Limited
June 2013 78
6 Senegal Prospectivity and Plays
Prospectivity identified within APCLrsquos Sengalese licences is seen as being similar to that identified offshore Gambia (Figure 6-1) and a description of the regional petroleum systems and main play types expected is given in Section 3
Figure 6-1 Petroleum systems and plays offshore Senegal
In 2012 APCL acquired 3600 km2 of multi-client 3D seismic data over the Offshore Sud Profond licence In addition 1500 km2 of legacy 3D data over the Rufisque Offshore Profond licence is currently being reprocessed by APCL and legacy 2D seismic data (c 7000 line km) have also been acquired APCL expects to begin prospect evaluation once seismic processing is complete which is expected later in 2013 At present a number of conceptual Cretaceous post-rift leads are identified by APCL (Figure 6-2)
Competent Personrsquos Report African Petroleum Corporation Limited
June 2013 79
Figure 6-2 leads offshore Senegal Blocks ROP and SOSP
Competent Personrsquos Report African Petroleum Corporation Limited
June 2013 80
7 Appendix 1 SPE PRMS Guidelines
SPEWPCAAPGSPEE Petroleum Reserves and Resources Classification System and Definitions
The Petroleum Resources Management System
Preamble
Petroleum Resources are the estimated quantities of hydrocarbons naturally occurring on or within the Earthrsquos crust Resource assessments estimate total quantities in known and yet-to-be-discovered accumulations Resources evaluations are focused on those quantities that can potentially be recovered and marketed by commercial projects A petroleum Resources managements system provides a consistent approach to estimating petroleum quantities evaluating development projects and presenting results within a comprehensive classification framework
International efforts to standardize the definitions of petroleum Resources and how they are estimated began in the 1930s Early guidance focused on Proved Reserves Building on work initiated by the Society of Petroleum Evaluation Engineers (SPEE) SPE published definitions for all Reserves categories in 1987 In the same year the World Petroleum Council (WPC then known as the World Petroleum Congress) working independently published Reserves definitions that were strikingly similar In 1997 the two organizations jointly released a single set of definitions for Reserves that could be used worldwide In 2000 the American Association of Petroleum Geologists (AAPG) SPE and WPC jointly developed a classification system for all petroleum Resources This was followed by additional supporting documents supplemental application evaluation guidelines (2001) and a glossary of terms utilized in Resources definitions (2005) SPE also published standards for estimating and auditing Reserves information (revised 2007)
These definitions and the related classification system are now in common use internationally within the petroleum industry They provide a measure of comparability and reduce the subjective nature of Resources estimation However the technologies employed in petroleum exploration development production and processing continue to evolve and improve The SPE Oil and Gas Reserves Committee works closely with other organizations to maintain the definitions and issues periodic revisions to keep current with evolving technologies and changing commercial opportunities
The SPE-PRMS consolidates builds on and replaces guidance previously contained in the 1997 Petroleum Reserves Definitions the 2000 Petroleum Resources Classification and Definitions publications and the 2001 ldquoGuidelines for the Evaluation of Petroleum Reserves and Resourcesrdquo the latter document remains a valuable source of more detailed background information
These definitions and guidelines are designed to provide a common reference for the international petroleum industry including national reporting and regulatory disclosure agencies and to support petroleum project and portfolio management requirements They are intended to improve clarity in
Competent Personrsquos Report African Petroleum Corporation Limited
June 2013 81
global communications regarding petroleum Resources It is expected that the SPE-PRMS will be supplemented with industry education programs and application guides addressing their implementation in a wide spectrum of technical andor commercial settings
It is understood that these definitions and guidelines allow flexibility for users and agencies to tailor application for their particular needs however any modifications to the guidance contained herein should be clearly identified The definitions and guidelines contained in this document must not be construed as modifying the interpretation or application of any existing regulatory reporting requirements
The full text of the SPEWPCAAPGSPEE Petroleum Resources Management System document hereinafter referred to as the SPE-PRMS can be viewed at
wwwspeorgspecmabinaryfiles6859916Petroleum_Resources_Management_System_2007pdf
Overview and Summary of Definitions
The estimation of petroleum resource quantities involves the interpretation of volumes and values that have an inherent degree of uncertainty These quantities are associated with development projects at various stages of design and implementation Use of a consistent classification system enhances comparisons between projects groups of projects and total company portfolios according to forecast production profiles and recoveries Such a system must consider both technical and commercial factors that impact the projectrsquos economic feasibility its productive life and its related cash flows
Petroleum is defined as a naturally occurring mixture consisting of hydrocarbons in the gaseous liquid or solid phase Petroleum may also contain non-hydrocarbons common examples of which are carbon dioxide nitrogen hydrogen sulphide and sulphur In rare cases non-hydrocarbon content could be greater than 50
The term ldquoResourcesrdquo as used herein is intended to encompass all quantities of petroleum naturally occurring on or within the Earthrsquos crust discovered and undiscovered (recoverable and unrecoverable) plus those quantities already produced Further it includes all types of petroleum whether currently considered conventionalrdquo or ldquounconventionalrdquo
Figure 1-1 is a graphical representation of the SPEWPCAAPGSPEE Resources classification system The system defines the major recoverable Resources classes Production Reserves Contingent Resources and Prospective Resources as well as Unrecoverable petroleum
Competent Personrsquos Report African Petroleum Corporation Limited
June 2013 82
Figure 1-1 SPEAAPGWPCSPEE Resources Classification System
The ldquoRange of Uncertaintyrdquo reflects a range of estimated quantities potentially recoverable from an accumulation by a project while the vertical axis represents the ldquoChance of Developmentrdquo that is the chance that the project that will be developed and reach commercial producing status
The following definitions apply to the major subdivisions within the Resources classification
TOTAL PETROLEUM INITIALLY-IN-PLACE
Total Petroleum Initially in Place is that quantity of petroleum that is estimated to exist originally in naturally occurring accumulations
It includes that quantity of petroleum that is estimated as of a given date to be contained in known accumulations prior to production plus those estimated quantities in accumulations yet to be discovered (equivalent to ldquototal Resourcesrdquo)
Competent Personrsquos Report African Petroleum Corporation Limited
June 2013 83
DISCOVERED PETROLEUM INITIALLY-IN-PLACE
Discovered Petroleum Initially in Place is that quantity of petroleum that is estimated as of a given date to be contained in known accumulations prior to production
PRODUCTION
Production is the cumulative quantity of petroleum that has been recovered at a given date
Multiple development projects may be applied to each known accumulation and each project will recover an estimated portion of the initially-in-place quantities The projects shall be subdivided into Commercial and Sub-Commercial with the estimated recoverable quantities being classified as Reserves and Contingent Resources respectively as defined below
RESERVES
Reserves are those quantities of petroleum anticipated to be commercially recoverable by application of development projects to known accumulations from a given date forward under defined conditions
Reserves must satisfy four criteria they must be discovered recoverable commercial and remaining based on the development project(s) applied Reserves are further subdivided in accordance with the level of certainty associated with the estimates and may be sub-classified based on project maturity andor characterized by their development and production status To be included in the Reserves class a project must be sufficiently defined to establish its commercial viability There must be a reasonable expectation that all required internal and external approvals will be forthcoming and there is evidence of firm intention to proceed with development within a reasonable time frame A reasonable time frame for the initiation of development depends on the specific circumstances and varies according to the scope of the project While five years is recommended as a benchmark a longer time frame could be applied where for example development of economic projects are deferred at the option of the producer for among other things market-related reasons or to meet contractual or strategic objectives
In all cases the justification for classification as Reserves should be clearly documented To be included in the Reserves class there must be a high confidence in the commercial producibility of the reservoir as supported by actual production or formation tests In certain cases Reserves may be assigned on the basis of well logs andor core analysis that indicate that the subject reservoir is hydrocarbon-bearing and is analogous to reservoirs in the same area that are producing or have demonstrated the ability to produce on formation tests
Proved Reserves
Proved Reserves are those quantities of petroleum which by analysis of geoscience and engineering data can be estimated with reasonable certainty to be commercially recoverable from a given date forward from known reservoirs and under defined economic conditions operating methods and government regulations
Competent Personrsquos Report African Petroleum Corporation Limited
June 2013 84
If deterministic methods are used the term reasonable certainty is intended to express a high degree of confidence that the quantities will be recovered If probabilistic methods are used there should be at least a 90 probability that the quantities actually recovered will equal or exceed the estimate The area of the reservoir considered as Proved includes
the area delineated by drilling and defined by fluid contacts if any and adjacent undrilled portions of the reservoir that can reasonably be judged as continuous with it and commercially productive on the basis of available geoscience and engineering data
In the absence of data on fluid contacts Proved quantities in a reservoir are limited by the lowest known hydrocarbon (LKH) as seen in a well penetration unless otherwise indicated by definitive geoscience engineering or performance data Such definitive information may include pressure gradient analysis and seismic indicators Seismic data alone may not be sufficient to define fluid contacts for Proved Reserves (see ldquo2001 Supplemental Guidelinesrdquo Chapter 8) Reserves in undeveloped locations may be classified as Proved provided that the locations are in undrilled areas of the reservoir that can be judged with reasonable certainty to be commercially productive and interpretations of available geoscience and engineering data indicate with reasonable certainty that the objective formation is laterally continuous with drilled Proved locations
For Proved Reserves the recovery efficiency applied to these reservoirs should be defined based on a range of possibilities supported by analogs and sound engineering judgment considering the characteristics of the Proved area and the applied development program
Probable Reserves
Probable Reserves are those additional Reserves which analysis of geoscience and engineering data indicate are less likely to be recovered than Proved Reserves but more certain to be recovered than Possible Reserves
It is equally likely that actual remaining quantities recovered will be greater than or less than the sum of the estimated Proved plus Probable Reserves (2P) In this context when probabilistic methods are used there should be at least a 50 probability that the actual quantities recovered will equal or exceed the 2P estimate
Probable Reserves may be assigned to areas of a reservoir adjacent to Proved where data control or interpretations of available data are less certain The interpreted reservoir continuity may not meet the reasonable certainty criteria Probable estimates also include incremental recoveries associated with project recovery efficiencies beyond that assumed for Proved
Possible Reserves
Possible Reserves are those additional Reserves which analysis of geoscience and engineering data indicate are less likely to be recoverable than Probable Reserves
Competent Personrsquos Report African Petroleum Corporation Limited
June 2013 85
The total quantities ultimately recovered from the project have a low probability to exceed the sum of Proved plus Probable plus Possible (3P) which is equivalent to the high estimate scenario When probabilistic methods are used there should be at least a 10 probability that the actual quantities recovered will equal or exceed the 3P estimate
Possible Reserves may be assigned to areas of a reservoir adjacent to Probable where data control and interpretations of available data are progressively less certain Frequently this may be in areas where geoscience and engineering data are unable to clearly define the area and vertical reservoir limits of commercial production from the reservoir by a defined project
Possible estimates also include incremental quantities associated with project recovery efficiencies beyond that assumed for Probable
Probable and Possible Reserves
(See above for separate criteria for Probable Reserves and Possible Reserves)
The 2P and 3P estimates may be based on reasonable alternative technical and commercial interpretations within the reservoir andor subject project that are clearly documented including comparisons to results in successful similar projects
In conventional accumulations Probable andor Possible Reserves may be assigned where geoscience and engineering data identify directly adjacent portions of a reservoir within the same accumulation that may be separated from Proved areas by minor faulting or other geological discontinuities and have not been penetrated by a wellbore but are interpreted to be in communication with the known (Proved) reservoir Probable or Possible Reserves may be assigned to areas that are structurally higher than the Proved area Possible (and in some cases Probable) Reserves may be assigned to areas that are structurally lower than the adjacent Proved or 2P area
Caution should be exercised in assigning Reserves to adjacent reservoirs isolated by major potentially sealing faults until this reservoir is penetrated and evaluated as commercially productive Justification for assigning Reserves in such cases should be clearly documented Reserves should not be assigned to areas that are clearly separated from a known accumulation by non-productive reservoir (ie absence of reservoir structurally low reservoir or negative test results) such areas may contain Prospective Resources
In conventional accumulations where drilling has defined a highest known oil (HKO) elevation and there exists the potential for an associated gas cap Proved oil Reserves should only be assigned in the structurally higher portions of the reservoir if there is reasonable certainty that such portions are initially above bubble point pressure based on documented engineering analyses Reservoir portions that do not meet this certainty may be assigned as Probable and Possible oil andor gas based on reservoir fluid properties and pressure gradient interpretations
Competent Personrsquos Report African Petroleum Corporation Limited
June 2013 86
CONTINGENT RESOURCES
Contingent Resources are those quantities of petroleum estimated as of a given date to be potentially recoverable from known accumulations by application of development projects but which are not currently considered to be commercially recoverable due to one or more contingencies
Contingent Resources may include for example projects for which there are currently no viable markets or where commercial recovery is dependent on technology under development or where evaluation of the accumulation is insufficient to clearly assess commerciality Contingent Resources are further categorized in accordance with the level of certainty associated with the estimates and may be sub-classified based on project maturity andor characterized by their economic status
UNDISCOVERED PETROLEUM INITIALLY-IN-PLACE
Undiscovered Petroleum Initially in Place is that quantity of petroleum that is estimated as of a given date to be contained within accumulations yet to be discovered
PROSPECTIVE RESOURCES
Prospective Resources are those quantities of petroleum which are estimated as of a given date to be potentially recoverable from undiscovered accumulations
Potential accumulations are evaluated according to their chance of discovery and assuming a discovery the estimated quantities that would be recoverable under defined development projects It is recognized that the development programs will be of significantly less detail and depend more heavily on analog developments in the earlier phases of exploration
Prospect
A project associated with a potential accumulation that is sufficiently well defined to represent a viable drilling target
Project activities are focused on assessing the chance of discovery and assuming discovery the range of potential recoverable quantities under a commercial development program
Lead
A project associated with a potential accumulation that is currently poorly defined and requires more data acquisition andor evaluation in order to be classified as a prospect
Project activities are focused on acquiring additional data andor undertaking further evaluation designed to confirm whether or not the lead can be matured into a prospect Such evaluation includes the assessment of the chance of discovery and assuming discovery the range of potential recovery under feasible development scenarios
Play
Competent Personrsquos Report African Petroleum Corporation Limited
June 2013 87
A project associated with a prospective trend of potential prospects but which requires more data acquisition andor evaluation in order to define specific leads or prospects
Project activities are focused on acquiring additional data andor undertaking further evaluation designed to define specific leads or prospects for more detailed analysis of their chance of discovery and assuming discovery the range of potential recovery under hypothetical development scenarios
The range of uncertainty of the recoverable andor potentially recoverable volumes may be represented by either deterministic scenarios or by a probability distribution When the range of uncertainty is represented by a probability distribution a low best and high estimate shall be provided such that
bull There should be at least a 90 probability (P90) that the quantities actually recovered will equal or exceed the low estimate
bull There should be at least a 50 probability (P50) that the quantities actually recovered will equal or exceed the best estimate
bull There should be at least a 10 probability (P10) that the quantities actually recovered will equal or exceed the high estimate
When using the deterministic scenario method typically there should also be low best and high estimates where such estimates are based on qualitative assessments of relative uncertainty using consistent interpretation guidelines Under the deterministic incremental (risk-based) approach quantities at each level of uncertainty are estimated discretely and separately
These same approaches to describing uncertainty may be applied to Reserves Contingent Resources and Prospective Resources While there may be significant risk that sub-commercial and undiscovered accumulations will not achieve commercial production it useful to consider the range of potentially recoverable quantities independently of such a risk or consideration of the resource class to which the quantities will be assigned
Evaluators may assess recoverable quantities and categorize results by uncertainty using the deterministic incremental (risk-based) approach the deterministic scenario (cumulative) approach or probabilistic methods (see ldquo2001 Supplemental Guidelinesrdquo Chapter 25) In many cases a combination of approaches is used
Use of consistent terminology (Figure 11) promotes clarity in communication of evaluation results For Reserves the general cumulative terms lowbesthigh estimates are denoted as 1P2P3P respectively The associated incremental quantities are termed Proved Probable and Possible Reserves are a subset of and must be viewed within context of the complete Resources classification system While the categorization criteria are proposed specifically for Reserves in most cases they can be equally applied to Contingent and Prospective Resources conditional upon their satisfying the criteria for discovery andor development
Competent Personrsquos Report African Petroleum Corporation Limited
June 2013 88
For Contingent Resources the general cumulative terms lowbesthigh estimates are denoted as 1C2C3C respectively For Prospective Resources the general cumulative terms lowbesthigh estimates still apply No specific terms are defined for incremental quantities within Contingent and Prospective Resources
Without new technical information there should be no change in the distribution of technically recoverable volumes and their categorization boundaries when conditions are satisfied sufficiently to reclassify a project from Contingent Resources to Reserves All evaluations require application of a consistent set of forecast conditions including assumed future costs and prices for both classification of projects and categorization of estimated quantities recovered by each project
Competent Personrsquos Report African Petroleum Corporation Limited
June 2013 89
8 Appendix 2 Nomenclature
81 Units degC degrees Celsius
degF degrees Fahrenheit
bbl barrel
cp centipoises
ft feet
ftMDRKB feet below Kelly Bushing
ftTVDSS feet subsea
km kilometres
m metres
M or MM thousands and millions respectively
ms metres per second
md millidarcy
mTVDSS metres subsea
psia pounds per square inch absolute
psig pounds per square inch gauge
pu porosity unit
rb reservoir barrels
stb a stock tank barrel which is 42 US gallons measured at 147 pounds per square inch and 60 degrees Fahrenheit
82 Reserves and Resources Classifications
Low Low estimate of Prospective Resources as defined in SPE PRMS 2007
Best Best estimate of Prospective Resources as defined in SPE PRMS 2007
High High estimate of Prospective Resources as defined in SPE PRMS 2007
COS Geological Chance of Success associated with Prospective Resources
P10 10 per cent probability = Proved + Probable + Possible or 3P
P50 50 per cent probability = Proved + Probable or 2P
P90 90 per cent probability = Proved or 1P
83 Abbreviations AvO amplitude variation with offset
Bo oil shrinkage factor or formation volume factor in rbstb
Competent Personrsquos Report African Petroleum Corporation Limited
June 2013 90
CPI computer processed information log
FVF formation volume factor
FWL free water level
GRV gross rock volume
GWC gas water contact
KB kelly bushing
kh permeability thickness
MD measured depth
MSL mean sea level
NG net to gross ratio
OWC oil water contact
Phi porosity
PSC production sharing contract
PSDM post stack depth migration
PSTM post stack time migration
PVT pressure volume temperature experiment
RFT repeat formation tester
So oil saturation
Soi initial oil saturation
SS Subsea
STOIIP stock tank oil initially in place
Sw water saturation
Swc connate water saturation
TD total depth
TOC total organic carbon
TVD true vertical depth
TWT two way time
Vsh shale volume
Competent Personrsquos Report African Petroleum Corporation Limited
June 2013 91
Enclosures Resource Summary Sheets
Enclosure 11 Summary Description Sheet Barbet Prospect
SummaryBlock 9
APC Interest () 100
Fluid Oil
Crest (m ss) 3000
Water depth (m) 750
Notes
Area Shape F Areal NG Net Thick Porosity SO Bo STOIIP Rf Rec Res(km2) (frac) () (m) () () (rbstb) (MMstb) (frac) (MMstb)
Charge 90
Reservoir 70 Low 14 085 62 22 13 73 135 166 0300 60
Trap 50 Best 37 090 80 34 17 80 150 500 0375 186
Seal 70 High 98 095 98 53 20 88 165 1479 0450 558
COS 22 Deterministic inputs probabilistic STOIIP and Rec Resource Mean 270
Stratigraphic trap with amplitude support
Geological Risk Matrix
P10
P90metres
BARBET
dtdƐͿ
ϬŬŵϰ
Enclosure 12 Summary Description Sheet Sunbird Prospect Campanian Reservoir
SummaryBlock 8 amp 9
APC Interest () 100
Fluid Oil
Crest (m ss) 3000
Water depth (m) 1300
Notes
Area Shape F Areal NG Net Thick Porosity SO Bo STOIIP Rf Rec Res(km2) (frac) () (m) () () (rbstb) (MMstb) (frac) (MMstb)
Charge 80
Reservoir 80 Low 12 070 43 27 18 73 130 177 0300 63
Trap 60 Best 27 080 69 42 21 80 145 461 0375 172
Seal 70 High 61 090 95 66 24 88 165 1187 0450 448
COS 27 Deterministic inputs probabilistic STOIIP and Rec Resource Mean 229
Stratigraphic trap with amplitude support Split by intra-canyon
high
Geological Risk Matrix
P90
P10
metres
SUNBIRD
dtdƐͿ
ϬŬŵϰSUNBIRD
Enclosure 13 Summary Description Sheet Sunbird prospect Turonian Reservoir
SummaryBlock 8 amp 9
APC Interest () 100
Fluid Oil
Crest (m ss) 3300
Water depth (m) 1300
Notes
Area Shape F Areal NG Net Thick Porosity SO Bo STOIIP Rf Rec Res(km2) (frac) () (m) () () (rbstb) (MMstb) (frac) (MMstb)
Charge 90
Reservoir 60 Low 8 085 65 24 14 73 140 107 0300 39
Trap 50 Best 21 090 80 37 17 80 158 307 0375 115
Seal 70 High 53 095 94 58 20 88 175 863 0450 327
COS 19 Deterministic inputs probabilistic STOIIP and Rec Resource Mean 162
Stratigraphic trap with amplitude support Split by intra-canyon
high
Geological Risk Matrix
SW NE
Campanian Jacana Channel
Turonian BFF
P90
P10
metres
SUNBIRD
ϬŬŵϰ
Enclosure 14 Summary Description Sheet Sunbird Prospect Cenomanian Reservoir
SummaryBlock 8 amp 9
APC Interest () 100
Fluid Oil
Crest (m ss) 3500
Water depth (m) 1300
Notes
Area Shape F Areal NG Net Thick Porosity SO Bo STOIIP Rf Rec Res(km2) (frac) () (m) () () (rbstb) (MMstb) (frac) (MMstb)
Charge 100
Reservoir 50 Low 10 060 71 21 14 73 140 91 0300 33
Trap 60 Best 25 070 85 33 17 80 158 264 0375 99
Seal 60 High 65 080 99 51 20 88 175 779 0450 294
COS 18 Deterministic inputs probabilistic STOIIP and Rec Resource Mean 141
Stratigraphic trap with amplitude support Split by intra-canyon
high
Geological Risk Matrix
P90
P10
metres
SUNBIRD
dtdƐͿ
ϬŬŵϮ
Enclosure 15 Summary Description Sheet Lovebird Prospect Blue Horizon
SummaryBlock 8
APC Interest () 100
Fluid Oil
Crest (m ss) 5000
Water depth (m) 2850
Notes
GRV NG Porosity SO Bo STOIIP Rf Rec Res(MMm2) () () () (rbstb) (MMstb) (frac) (MMstb)
Charge 54
Reservoir 60 Low 354 30 14 60 150 68 030 25
Trap 70 Best 1310 54 19 70 180 293 038 109
Seal 90 High 4849 73 24 80 210 1218 045 456
COS 20 Mean 201
Four way dip closure to south of Block 8 Three potential
reservoirs identified Blue and Green horizon volumetrics derived
assuming ispoachous to Pink
Geological Risks
ŝŐŚĂƐĞWŝŶŬĞƉƚŚDĂƉ
Enclosure 16 Summary Description Sheet Lovebird Prospect Pink Horizon
SummaryBlock 8
APC Interest () 100
Fluid Oil
Crest (m ss) 5400
Water depth (m) 2850
Notes
GRV NG Porosity SO Bo STOIIP Rf Rec Res(MMm2) () () () (rbstb) (MMstb) (frac) (MMstb)
Charge 54
Reservoir 60 Low 354 30 12 60 155 59 030 22
Trap 70 Best 1310 54 17 70 188 262 038 96
Seal 90 High 4849 73 22 80 220 1066 045 400
COS 20 Mean 178
Four way dip closure to south of Block 8 Three potential
reservoirs identified Blue and Green horizon volumetrics derived
assuming ispoachous to Pink
Geological Risks
ŝŐŚĂƐĞWŝŶŬĞƉƚŚDĂƉ
Enclosure 17 Summary Description Sheet Lovebird Prospect Green Horizon
SummaryBlock 8
APC Interest () 100
Fluid Oil
Crest (m ss) 5800
Water depth (m) 2850
Notes
GRV NG Porosity SO Bo STOIIP Rf Rec Res(MMm2) () () () (rbstb) (MMstb) (frac) (MMstb)
Charge 54
Reservoir 60 Low 354 30 10 60 160 48 030 18
Trap 70 Best 1310 54 15 70 195 210 038 78
Seal 90 High 4849 73 20 80 230 896 045 337
COS 20 Mean 150
Four way dip closure to south of Block 8 Three potential
reservoirs identified Blue and Green horizon volumetrics derived
assuming ispoachous to Pink
Geological Risks
ŝŐŚĂƐĞWŝŶŬĞƉƚŚDĂƉ
Enclosure 18 Summary Description Sheet Wildbird Prospect
SummaryORFN $3ampQWHUHVW )OXLG 2LOampUHVWPVV DWHUGHSWKP P
Notes
Play Risk Prospect RiskGRV NG Porosity SO Bo STOIIP Rf Rec Res
6RXUFH 7UDS (MMm2) () () () (rbstb) (MMstb) (frac) (MMstb)6HDO ampKDUJH 5HVHUYRLU3UHV 5HVHUYRLU(II Low
Best High
COS 9 Deterministic inputs probabilistic STOIIP and Rec Resource Mean
)RXUZDGLSFORVHGKLJK
5
0 km 5
6 1(
PVV
Wildbird Horizons
ODFNEHUULJKWOXH3LQN5HG
mss
Enclosure 19 Summary Description Sheet Night Heron Prospect
SummaryORFN $3ampQWHUHVW RIORFN)OXLG 2LOampUHVWPVV DWHUGHSWKP
Notes
Prospect Risk Area Areal NG Net Porosity SO Bo STOIIP Rf Rec ResampKDUJH (km2) (frac) (m) () () (rbstb) (MMstb) (frac) (MMstb)5HVHUYRLU 7UDS Low 6HDO Best
High COS 144 Deterministic inputs probabilistic STOIIP and Rec Resource Mean 759
1LJKW+HURQLVD7XURQLDQEDVLQIORRUIDQVVWHPZKLFKPDLQOOLHVZLWKLQEORFNRIIVKRUHLEHULDWLVLGHQWLILHGDVDVWUDWLJUDSKLFWUDSZLWKDUHDOH[WHQWVGHILQHGEDPSOLWXGHWUXQFDWLRQDQGVWUXFWXUDOSLQFKRXW$QDUHDQHWDSSURDFKZDVDGRSWHGXVLQJWKHIXOOVWDFN360GHSWKLPDJHYROXPHWRSURYLGH61$H[WUDFWLRQDQGFRQVWUDLQDUHDOH[WHQWDQGHVWLPDWHDQDUHDO1WRDFFRXQWIRUODWHUDOYDULDELOLWZLWKLQWKHUHVHUYRLU1LJKW+HURQIDOOVSDUWORIIEORFN(5amp(FRUUHFWIRUWKLVXVLQJWKHUDWLRRIRQEORFNWRRIIEORFNDUHDLQUHSRUWLQJRIQHWXQULVNHGDQGQHWULVNHGUHVXOWV
6HLVPLFLQH36061$([WUDFWLRQ
Arbitrary line across Night Heron PSDM (Depth m)
S NE
2QWKHXSGLSSLQFKRXWLVGHILQHGELVRSDFKDQGDPSOLWXGHWUXQFDWLRQ
2QWKHXSGLSSLQFKRXWLVGHILQHGRQOELVRSDFK
Bee EaterNight Heron
5 Km
RMS Amplitudes from BFF Isopach
Depth (m)
Block Boundary
Enclosure 21 Summary Description Sheet
Summary - M - CretBlock A1
Working Interest () 60
Fluid Oil
Crest (m) 3130 (1070 bml)
Water depth (m) 2220
Notes
Play Risk Prospect Risk Area Stack F Net Porosity SO Bo STOIIP Rf Rec Res(Km2) (frac) (m) () () (rbstb) (MMstb) (frac) (MMstb)
Source 70 Trap 54
Seal 50 Mig 80 Low 8 1 15 10 55 125 82 010 13
Res Pres 80 Res Eff 80 Best 14 1 30 16 65 117 231 023 43
28 35 High 26 1 60 22 75 110 629 035 141
COS 10 Deterministic inputs probabilistic STOIIP and Rec Resource Mean 66
Structural high along edge of buried carbonate platform margin of
probable Lower Cretaceous and Jurassic age Seismic evidence
favourable for reservoir development Lower Bo model used to
reflect relatively shallow nature of prospect The prospect is close
to the shelf margin and so is well placed for charging The strong
rugose seismic events are interpreted as Karstified Limestones
Seismic Line Top Structure Map
WƌŽƐƉĞĐƚD
ĞƉƚŚŵ
Ϳ
Enclosure 22 Summary Description Sheet
Summary - SS - 4Block A1
Working Interest () 60
Fluid Oil
Crest (m) 4230 (2010 bml)
Water depth (m) 2220
Notes
Play Risk Prospect Risk Area Stack F Net Porosity SO Bo STOIIP Rf Rec Res(Km2) (frac) (m) () () (rbstb) (MMstb) (frac) (MMstb)
Source 70 Trap 80
Seal 90 Mig 85 Low 6 1 10 16 68 220 43 030 16
Res Pres 80 Res Eff 50 Best 11 1 19 20 75 167 113 038 42
50 34 High 21 1 35 24 83 135 295 045 112
COS 17 Deterministic inputs probabilistic STOIIP and Rec Resource Mean 56
Four way dip closed anticlinal structure The SS-4 interval has a
gross thickness over the crest area of 360 m Downlap of seismic
events across the crest of the SS-4 structure slightly downgrades
SS-4 seal The interval is believed to be Cenomanian in age and
the seismic character of generally planar events is interpreted as
representing thin bedded turbidites
Seismic Line Top Structure Map
2010 Migration Velocity Data ndash SS-4 Probability Above Spill
Enclosure 23 Summary Description Sheet
Summary - SS - 3Block A1
Working Interest () 60
Fluid Oil
Crest (m) 4590 (2370 bml)
Water depth (m) 2220
Notes
Play Risk Prospect Risk Area Stack F Net Porosity SO Bo STOIIP Rf Rec Res(Km2) (frac) (m) () () (rbstb) (MMstb) (frac) (MMstb)
Source 70 Trap 75
Seal 90 Mig 85 Low 12 1 20 15 68 227 197 025 63
Res Pres 80 Res Eff 50 Best 17 15 35 18 75 173 417 034 143
50 32 High 25 2 60 20 83 140 881 045 316
COS 16 Deterministic inputs probabilistic STOIIP and Rec Resource Mean 173
Four way dip closed anticlinal structure The SS-3 interval has a
gross thickness over the crest area of 550 m Seals to deeper
reservoirs may be eroded by overlying reservoirs From seismic
the prospective reservoir has been interpreted as being an Albian
deep water channel-lobe complex
Seismic Line Top Structure Map
2010 Migration Velocity Data ndashSS-3 Probability Above Spill
Enclosure 24 Summary Description Sheet
Summary - SS - 2Block A1
Working Interest () 60
Fluid Oil
Crest (m) 5140 (2920 bml)
Water depth (m) 2220
Notes
Play Risk Prospect Risk Area Stack F Net Porosity SO Bo STOIIP Rf Rec Res(Km2) (frac) (m) () () (rbstb) (MMstb) (frac) (MMstb)
Source 70 Trap 75
Seal 90 Mig 85 Low 12 1 20 11 68 231 187 025 58
Res Pres 80 Res Eff 50 Best 17 2 35 14 75 183 416 032 133
50 32 High 25 3 60 17 83 151 911 040 303
COS 16 Deterministic inputs probabilistic STOIIP and Rec Resource Mean 163
Four way dip closed anticlinal structure The SS-2 interval has a
gross thickness over the crest area of 830 m The prospective
reservoir has been interpreted as a stacked series of channellobe
sets Seals to deeper reservoirs may be eroded by overlying
reservoirs
Seismic Line Top Structure Map
2010 Migration Velocity Data ndashSS-2 Probability Above Spill
Enclosure 25 Summary Description Sheet
Summary - SS - 1Block A1
Working Interest () 60
Fluid Oil
Crest (m) 5970 (3750 bml)
Water depth (m) 2220
Notes
Play Risk Prospect Risk Area Stack F Net Porosity SO Bo STOIIP Rf Rec Res(Km2) (frac) (m) () () (rbstb) (MMstb) (frac) (MMstb)
Source 70 Trap 65
Seal 90 Mig 80 Low 17 1 20 8 50 249 158 015 34
Res Pres 80 Res Eff 50 Best 30 2 35 11 60 196 399 024 98
50 26 High 54 3 60 13 70 162 997 040 276
COS 13 Deterministic inputs probabilistic STOIIP and Rec Resource Mean 135
Four way dip closed anticlinal structureThe SS-1 interval has a
gross thickness over the crest area of 890 m The prospective
reservoir lies under an unconformity and is believed to be Jurassic
in age its seismic character suggests a channel amp channel-levee
complex Regional porosity trends indicate low porosities are likely
to be encountered if hydrostatic pressures are assumed
Seismic Line Top Structure Map
2010 Migration Velocity Data ndash SS-1 Probability Above Spill
Enclosure 31 Summary Description Sheet
SummaryBlock SL-03
APCL Interest () 90
Fluid Oil
Crest (m ss) 5400
Water depth (m) 3300
Notes
Play Risk Prospect Risk Area Areal NG Net Porosity SO Bo STOIIP Rf Rec Res(km2) (frac) (m) () () (rbstb) (MMstb) (frac) (MMstb)
Source 80 Trap 50
Seal 90 Mig 70 Low 11 070 29 15 73 205 218 030 79
Res Pres 90 Res Eff 80 Best 32 082 56 18 80 162 755 038 278
65 28 High 92 094 83 21 88 134 2473 045 938
COS 18 Mean 434
Altair is a Turonian turbidite channel prospects within the
SL-03 Block offshore Sierra Leone It is identified as a
stratigraphic trap with areal extents defined by amplitude
truncation and structural pinchout Recent discoveries in
nearby blocks confirm a working hydrocarbon system
(Venus-B1 Jupiter-1 and Mercury-1) The Sierra Leone
wells A-1 and A1-2 proved good reservoir and potential
source rocks Two distinct canyon systems feed erosive
channels at the break of slope An area net approach was
adopted using a pseudo-gradient volume SNA extraction to
constrain areal extent and define an areal NG to account
for lateral variability of sand distribution within the
reservoir
Arbitrary Dip Line Grad TWTGrad NRMS Extraction
Enclosure 41 Summary Description Sheet
SummaryBlock CI-513
APCL Interest () 90
Fluid Oil
Crest (m ss) 4200
Water depth (m) 2500
Notes
Play Risk Prospect Risk Area Areal NG Net Porosity SO Bo STOIIP Rf Rec Res(km2) (frac) (m) () () (rbstb) (MMstb) (frac) (MMstb)
Source 60 Trap 50
Seal 90 Mig 70 Low 11 070 20 17 73 181 179 030 65
Res Pres 90 Res Eff 80 Best 40 085 38 20 80 149 815 038 302
49 28 High 149 099 55 23 88 126 3474 045 1318
COS 14 Mean 569
Ayame is an Upper Cretaceous fan which mainly lies
ZLWKLQEORFNampRIIVKRUHampRWHparaYRLUHWLVLGHQWLILHGas a stratigraphic trap with areal extents defined by
amplitude truncation and structural pinchout The prospect
has very good amplitude support An area net approach
was adopted using pseudo-gradient volume SNA NRMS
extractions to constrain areal extent and define an areal
NG to account for lateral variability of sand distribution
within the reservoir for low and high case area polygons
These seismically defined polygons were then filled to
column heights of 200m and 800m respectively and used
to constrain the P90 and P10 area inputs of our
probabilistic simulation
Seismic Line
TWT Grad SNA Extraction
Ayame
Ayame West
dtdƐͿ
Ayame
Enclosure 42 Summary Description Sheet
SummaryBlock CI-513 amp Open
APCL Interest () 90 in CI-513
Fluid Oil
Crest (m ss) 4900
Water depth (m) 2700
Notes
Play Risk Prospect Risk Area Areal NG Net Porosity SO Bo STOIIP Rf Rec Res(km2) (frac) (m) () () (rbstb) (MMstb) (frac) (MMstb)
Source 60 Trap 50
Seal 90 Mig 70 Low 10 061 25 14 73 194 161 030 58
Res Pres 90 Res Eff 80 Best 30 080 47 18 80 159 585 038 216
49 28 High 93 099 69 21 88 134 2085 045 788
COS 14 Mean 352
A second prospect within the same reservoir interval was
identified and volumetrically assessed Ayame West is
separated from Ayame by a structural high isopach
thinning and amplitude dimming The prospect was
assessed in the same manner as Ayame with a but with
Low Case column height of 600m filling down to the point
at which amplitudes between the two fans brighten
allowing possible communication The upper end of the
Ayame West fan lies down-dip of Ayame and less than
1km away from the thinning low amplitude saddle between
the two prospects
Seismic Line
TWT Grad SNA Extraction
Ayame
West
Ayame West
dtdƐͿ
Ayame
Enclosure 43 Summary Description Sheet
SummaryBlock CI-513 CI-509
APCL Interest () 90 of CI-513
Fluid Oil
Crest (m ss) 4400
Water depth (m) 2500
Notes
Play Risk Prospect Risk Area Areal NG Net Porosity SO Bo STOIIP Rf Rec Res(km2) (frac) (m) () () (rbstb) (MMstb) (frac) (MMstb)
Source 60 Trap 40
Seal 90 Mig 70 Low 6 070 15 16 73 185 71 030 26
Res Pres 90 Res Eff 70 Best 23 084 28 19 80 152 320 038 118
49 20 High 92 098 42 22 88 129 1408 045 521
COS 10 Mean 237
This sheet refers to volumes associated with Blocks 513 and CI-509 Sassandra is an Upper Cretaceous fan
which straddles blocks CI-513 and CI-509 It is identified
as a stratigraphic trap with areal extents defined by
amplitude truncation and structural pinchout A single
target reservoir is identified within the Turonian The
prospect has good amplitude support An area times net
approach was adopted using a pseudo-gradient volume
NRMS extraction to constrain prospect size Angle stacks
were not available outside of Block CI-513 so an RMS
extraction on the full stack volume was used to determine
NW extent In our low case we restrict the area of the
accumulation to the brightest area of anomalous
amplitudes Our high case extends the prospect down-dip
Arbitrary Dip Line Grad TWT
Full Stack - RMS Extraction
Sassandra
dtdƐͿ
Enclosure 44 Summary Description Sheet
SummaryBlock CI-513
APCL Interest () 90
Fluid Oil
Crest (m ss) 3900
Water depth (m) 2500
Notes
Play Risk Prospect Risk Area Areal NG Net Porosity SO Bo STOIIP Rf Rec Res(km2) (frac) (m) () () (rbstb) (MMstb) (frac) (MMstb)
Source 60 Trap 40
Seal 90 Mig 70 Low 4 071 20 19 73 185 67 030 25
Res Pres 90 Res Eff 70 Best 13 085 38 22 80 152 281 038 104
49 20 High 46 099 55 25 88 129 1142 045 431
COS 10 Mean 190
Cavalla is an Upper Cretaceous Fan which lies between
the Ayame and Sassandra prospects of Block CI-513
RIIVKRUHampRWHparaYRLUHWLVLGHQWLILHGDVDVWUDWLJUDSKLFtrap with areal extents defined by amplitude truncation and
structural pinchout A single target reservoir is identified
within the TuronianCenomanian interval which lies
stratigraphically beneath the Ayame Prospect For the
amplitude analysis the top reservoir has been shifted up
30ms to bracket strong negative amplitudes on the
Gradient volume and the base reservoir has been shifted
up 50ms to remove Albian related amplitudes An area net
approach was adopted using pseudo-gradient volume SNA
NRMS extractions to constrain extent of the low and high
case area polygons These seismically defined polygons
were then filled to column heights of 200m and 800m
respectively
Arbitrary Dip Line Grad TWT Grad NRMS Extraction
Cavalla
dtdƐͿ
Enclosure 45 Summary Description Sheet
SummaryBlock CI-509
APCL Interest () 90
Fluid Oil
Crest (m ss) 3700
Water depth (m) 2500
Notes
Play Risk Prospect Risk Area Areal NG Net Porosity SO Bo STOIIP Rf Rec Res(km2) (frac) (m) () () (rbstb) (MMstb) (frac) (MMstb)
Source 60 Trap 60
Seal 90 Mig 70 Low 5 076 39 21 73 150 252 015 55
Res Pres 90 Res Eff 80 Best 18 088 75 24 80 134 997 028 258
49 34 High 61 100 111 27 88 121 3682 040 1039
COS 16 Mean 460
Leraba is an Upper Cretaceous fan It is identified as a
stratigraphic trap with extents defined by amplitude
truncation and structural pinchout The final processing
products and AvO volumes are yet to be delivered for CI-
KRZHYHUWKHmicroHRWUDFHUDZPLJUDWLRQVWDFNparaYROXPHLVof high quality and is deemed suitable for deriving a
volumetric range for Leraba An area net approach was
adopted using an RMS extraction to constrain extent and
define an areal NG to account for lateral variability of sand
distribution In our low case we restrict the area to the
brightest area of anomalous amplitudes Our high case
extends the prospect down-dip and SW to include a
secondary channel system
Arbitrary Dip Line TWT Full Stack RMS Extraction
Leraba
dtdƐͿ

Competent Personrsquos Report African Petroleum Corporation Limited
June 2013
Table of Contents 1 Introduction 14
11 Liberia PSC Overview 16
12 Gambia PSC Review 17
13 Senegal PSC Review 18
14 Sierra Leone PSC Review 19
15 Cote drsquoIvoire PSC Review 21
16 Evaluation Methodology Prospective Resources 22
2 Liberia Prospectivity and Plays 26
21 Introduction 26
22 Well and Seismic Database 27
23 Plays and Petroleum Geology Blocks 8 and 9 29
24 Play and Prospect Risk Liberia Blocks 8 and 9 31
25 Liberia Blocks 8 and 9 Leads and Prospects 33
251 Barbet Prospect 34
252 Sunbird Canyon Prospect 36
253 Night Heron 39
254 Lovebird Prospect 42
255 Wildbird Prospect 44
3 Gambia Prospectivity and Plays 47
31 Introduction 47
32 Well and Seismic Database 48
33 Plays and Petroleum Geology Blocks A1 and A4 49
34 Play Risk 51
35 Gambia Leads and Prospects 53
351 Alhamdulilah Prospect 54
352 Prospect M 57
4 Sierra Leone Prospectivity and Plays 59
41 Play Risk 62
41 Sierra Leone Leads and Prospects 62
Competent Personrsquos Report African Petroleum Corporation Limited
June 2013
411 Altair 62
5 Cote drsquoIvoire Prospectivity and Plays 65
51 Introduction 65
52 Well and Seismic Database 66
53 Plays and Petroleum Geology Blocks CI-509 and CI-513 67
54 Play Risk 68
55 Cote drsquoIvoire Blocks CI-509 and CI-503 Leads and Prospects 69
551 Ayame amp Ayame West 69
552 Sassandra 71
553 Cavalla 73
554 Leraba 75
6 Senegal Prospectivity and Plays 78
7 Appendix 1 SPE PRMS Guidelines 80
8 Appendix 2 Nomenclature 89
81 Units 89
82 Reserves and Resources Classifications 89
83 Abbreviations 89
Enclosures Resource Summary Sheets 91
Competent Personrsquos Report African Petroleum Corporation Limited
June 2013
List of Tables Table 11 Licence Summary Table 15 Table 12 Estimated oil recovery factors from producing Atlantic Margin fields 24 Table 13 Play and prospect risk system 24 Table 21 Play risk Cretaceous carbonate play Liberia Blocks 8 and 9 32 Table 31 Play risk Gambia Blocks A1 and A4 52 Table 41 Play risk Sierra Leone Block SL-03 62 Table 51 Play risk Cote drsquoIvoire Blocks CI-509 and CI-513 68
Competent Personrsquos Report African Petroleum Corporation Limited
June 2013
List of Figures Figure 1-1 Location of APCL licences West Africa 14 Figure 1-2 Location of Liberia Blocks 8 and 9 16 Figure 1-3 Location of Gambia Blocks A1 and A4 17 Figure 1-4 Location of Senegal ROP and SOSP Licences 18 Figure 1-5 Location of Blocks SL-03 and SL-04A 20 Figure 1-6 Location of Blocks CI-509 and CI-513 21 Figure 2-1 Notable discoveries West Africa offshore 27 Figure 2-2 Well and seismic database Liberia Blocks 8 and 9 28 Figure 2-3 Petroleum systems and plays Liberia Blocks 8 and 9 30 Figure 2-4 Porositydepth trend published West Africa turbidite reservoirs 31 Figure 2-5 Leads and Prospects Liberia Blocks 8 and 9 33 Figure 2-6 Seismic line (depth) over the Barbet prospect 34 Figure 2-7 Barbet far offset amplitudes with Top Turonian depth contours (m TVDSS) 35 Figure 2-8 Regional seismic line along axis of the Sunbird canyon system 36 Figure 2-9 Sunbird Campanian far offset amplitudes with Cenomanian depth contours (m TVDSS) 37 Figure 2-10 Sunbird Turonian far offset amplitudes with Top Turonian depth contours (m TVDSS) 38 Figure 2-11 Sunbird Cenomanian far offset amplitudes with Cenomanian depth contours (m TVDSS) 39 Figure 2-12 Arbitrary line across Night Heron PSDM (Depth m) 40 Figure 2-14 SNA from Basin Floor Fan Isopach (m) - PSDM 41 Figure 2-15 Seismic line over the Lovebird prospect 42 Figure 2-16 Lovebird prospect Top Pink horizon depth (mss) high case 43 Figure 2-17 Seismic line and prospect geo-seismic sketch Wildbird prospect 45 Figure 2-18 Wildbird Top Reservoir depth map (m TVDSS) Spill point - green contour 46 Figure 3-1 Plays Gambia Blocks A1 and A4 47 Figure 3-2 Wells 2D and 3D seismic data (red outline) Gambia Blocks A1 and A4 48 Figure 3-3 Well to seismic tie ndash Well Jammah-1 to the Alhamdulilah prospect 50 Figure 3-4 Leads and prospects identified by APCL in Gambia Blocks A1 and A4 53 Figure 3-5 Seismic line over the Alhamdulilah prospect 54 Figure 3-6 Area of closure Alhamdulilah prospect layers SS1 to SS4 55 Figure 3-7Alhamdulilah prospect seismic facies interpretation Cretaceous intervals 56 Figure 3-8 Seismic line through Prospect M 57 Figure 3-9 Low and high case closure Prospect M top Aptian depth (m TVDSS) 58 Figure 4-1 Offshore licences and discoveries Liberia and Sierra Leone 59 Figure 4-2 Well and seismic database offshore Sierra Leone 60 Figure 4-3 Leads Sierra Leone Block SL-03 61 Figure 4-4 Dip seismic line (full offsets) Altair prospect 63 Figure 4-5 Seismic amplitude (gradient stack) and Top Turonian depth (m TVDSS) Altair prospect 64 Figure 5-1 CI-509 and CI-513 Prospects and Leads offshore Cote drsquoIvoire 65
Competent Personrsquos Report African Petroleum Corporation Limited
June 2013
Figure 5-2 Petroleum systems and plays offshore Cote drsquoIvoire 66 Figure 5-3 Well and seismic database offshore Sierra Leone 67 Figure 5-4 Strike Line Ayame and Ayame West prospects 69 Figure 5-5 Ayame Seismic amplitude (gradient stack) and Top Turonian depth (m TVDSS) 70 Figure 5-6 Dip seismic line Sassandra prospect 71 Figure 5-7 Sassandra prospect Seismic amplitude and Top Turonian depth (m TVDSS) 72 Figure 5-8 Dip seismic line Cavalla prospect 74 Figure 5-9 Seismic amplitude (gradient stack) and Top fan depth (m TVDSS) Cavalla prospect 75 Figure 5-10 Dip seismic line Leraba prospect 76 Figure 5-11 Seismic amplitudes Leraba prospect 77 Figure 6-1 Petroleum systems and plays offshore Senegal 78 Figure 6-2 leads offshore Senegal Blocks ROP and SOSP 79
Competent Personrsquos Report African Petroleum Corporation Limited
June 2013 14
1 Introduction
At the time of writing African Petroleum Corporation Limited (APCL) holds interests in and operates exploration licences offshore West Africa within the territorial waters of Senegal the Gambia Sierra Leone Liberia and Cote drsquoIvoire (Figure 1-1) The status of these licences is summarised in Table 11 below ERC Equipoise Ltd (ERCE) has reviewed the prospectivity of these licences using data as of 31st May 2013
Figure 1-1 Location of APCL licences West Africa
Currently prospective resources are identified by APCL within the Liberia Gambia Sierra Leone and Cote drsquoIvoire licences We have made independent estimates of prospective resources and geological chance of success for certain prospects within these countries which are identified by APCL as near-term drilling opportunities The evaluation of the offshore Senegal licences is on-going and no prospects have been identified as of the date of this report We summarise qualitatively the prospectivity of the licences held by APCL in this country
Competent Personrsquos Report African Petroleum Corporation Limited
June 2013 15
Country Block Licence
Operator APCL () Status
Licence
Area (km2)
Outstanding Commitment in this Phase
Start of Current Phase
End of Current Phase
Liberia 8 APCL 100 Expl June 2012
June 2014
2717 Two
Exploration wells
Liberia 9 APCL 100 Expl June 2012
June 2014
2634 None
Gambia A1 APCL 60 Expl Dec
2007 Dec
2013 1296
One Exploration
well 1
Gambia A4 APCL 60 Expl Dec
2007 Dec
2013 1376 (see A1)
Senegal Rufisque Offshore Profond
APCL 90 Expl Oct
2011 Oct
2015 10357
One exploration
well
Senegal
Senegal Offshore
Sud Profond
APCL 90 Expl Oct
2011 Oct
2014 7920 None
Sierra Leone
SL-03 APCL 100 Expl Feb
2011 Feb
2014 3860 None
Sierra Leone
SL-04A APCL 100 Expl Sept 2012
Sept 2015
1995 One
exploration well 2
Cote drsquoIvoire
CI-509 APCL 90 Expl March 2012
March 2015
1091 One
exploration well
Cote drsquoIvoire
CI-513 APCL 90 Expl Dec
2011 Dec
2014 1446
One exploration
well
1) Transferrable to Block A4 if necessary 2) Contingent on results of 3D and that technology is available to drill in such water depths
Table 11 Licence Summary Table
Competent Personrsquos Report African Petroleum Corporation Limited
June 2013 16
11Liberia PSC Overview
APCL holds a 100 contractor interest in a Production Sharing Contract (ldquoPSCrdquo) covering Blocks 8 amp 9 offshore Liberia (Figure 1-2) Both blocks are in their second exploration period which began on 12th June 2012 and lasts for two years Commitments during the second phase in Block 8 are two exploration wells (to a minimum depth of 2000 meters) as a well commitment from the first exploration phase has been carried into the second phase All commitments have been met for the second phase in Block 9 with the drilling of Well Bee Eater-1 The minimum spend for each block in the second exploration period is US$ 10 MM At the end of this second phase a further 25 of each licence must be relinquished
Figure 1-2 Location of Liberia Blocks 8 and 9
For each block there is one further optional exploration period of two years that can be entered into with an additional well (to a minimum of 2000 metres) being required in each block in each period At the end of the third period all areas not retained for appraisal and development are to be relinquished There are also provisions for an appraisal period and an exploitation period of 25 years (with an additional term of 10 years if necessary) for each development area
Competent Personrsquos Report African Petroleum Corporation Limited
June 2013 17
Following a 25 relinquishment at the end of the first exploration phase Block 8 comprises an area of 2717 km2 and Block 9 comprises 2634 km2 Water depths range from less than 100 m to over 3000 m Most of the block areas lie in water depths greater than 500 m
12Gambia PSC Review
APCL holds a 60 contractor interest in Production Sharing Contracts covering Blocks A1 and A4 offshore Gambia (Figure 1-3) with Buried Hill Gambia BV holding the remaining 40 The licences were signed on 8th September 2006 with an effective date of 31st December 2007 and following two extensions they are still currently in the first exploration period which runs through to 31 December 2013
The work commitment during the first period comprises 1000 km2 of 3D seismic data in Block A1 and 750 km2 of 3D seismic data in Block A4 and one well which may be drilled in either block The seismic commitment has already been met
There are two further optional (but automatic) exploration periods of three years each that can be entered into with a well being required in each period in each licence Furthermore in Block A1 relinquishment of 10 of the licence area is required at the end of the first exploration period and 20 at the end of the second period In Block A4 relinquishment of 10 of the licence area is required at the end of the first exploration period In both blocks at the end of the third period all areas not retained for appraisal and development are to be relinquished There are also provisions for an exploitation period with the total term of the licences being 30 years (including the exploration periods) for each development area
The area of the licence is 1296 km2 for Block A1 and 1376 km2 for Block A4 Water depths vary from 500 m to over 3000 m
Figure 1-3 Location of Gambia Blocks A1 and A4
Competent Personrsquos Report African Petroleum Corporation Limited
June 2013 18
13Senegal PSC Review
APCL holds a 90 contractor interest in Exploration and Production Sharing Contracts (EPSC) covering Blocks Rufisque Offshore Profond (ROP) and Senegal Offshore Sud Profonde (SOSP) offshore Senegal (Figure 1-4) via its wholly owned subsidiary African Petroleum Senegal Limited Petrosen the state oil company hold a 10 carried interest
The EPSC governing block SOSP has an effective date of 25th October 2011 The first 85 years of the EPSC are termed the exploration phase which is subdivided into an initial period of three years with two subsequent extension periods of three and two and a half years each Work commitment in the initial exploration period is to acquire and reprocess the existing seismic data within the licence area and also to acquire a further 2500 km2 of 3D seismic data all with a minimum investment of US$ 10 MM The two extension periods have a commitment of one exploration well to a minimum depth of 3500 mss in each period or a minimum investment of US$ 20 MM Entry to the first extension period requires a 30 relinquishment of the licence area and a further 20 of the initial licence area must be relinquished on entry to the third phase The area of the licence is currently 7920 km2 Water depth is between 1000 and 4000 m over the block
Figure 1-4 Location of Senegal ROP and SOSP Licences
Competent Personrsquos Report African Petroleum Corporation Limited
June 2013 19
The EPSC governing Block ROP is of similar structure to that governing Block SOSP It has an effective date of 25th October 2011 The first eight years of the EPSC are termed the exploration phase which is subdivided into an initial period of four years with two subsequent extension periods of two years each Work commitment in the initial exploration period is to acquire the existing seismic data within the licence area for a minimum of US$ 2 MM and drill one exploration well to a minimum depth of 3500 m TVDSS or a minimum investment of US$ 20 MM The two extension periods have a further commitment of one exploration well to a minimum depth of 3500 m TVDSS in each period or a minimum investment of US$ 20 MM Entry to the first extension period requires a 30 relinquishment of the licence area and a further 20 of the initial licence area must be relinquished on entry to the third period The area of the licence is currently 10357 km2 Water depth is between 1500 and 3000 m over the block
APCL has met the seismic commitment of the first exploration period
Petrosen has a back-in right if an exploitation period is authorised for up to 20 of the licence subject to contribution of its share of forward costs (excluding training) The duration of an exploitation period is 25 years from authorisation with option for two ten year extensions at the discretion of the state
14Sierra Leone PSC Review
APCL holds a 100 contractor interest in a PSC covering Block SL-03 offshore Sierra Leone (Figure 1-5) through its wholly owned subsidiary European Hydrocarbons Ltd The licence was awarded on 23rd April 2010 and ratified on 22nd February 2011 APCL also holds a 100 contractor interest in a PSC covering Block SL-04A through its wholly owned subsidiary African Petroleum Sierra Leone Ltd The PSC governing Block SL-04A was ratified on 21st September 2012
The SL-03 licence has a duration of thirty years the first seven of which are termed the exploration period which is further subdivided into an initial period of three years followed by two extension periods of two years each The licence is currently in the initial exploration period
Work commitments during the initial period for Block SL-03 are to purchase and interpret the existing 2D seismic data over the licence and acquire a minimum of 500 km2 of 3D seismic data APCL has purchased the 2D seismic data and has acquired 2535 km2 of multi-client 3D seismic data over Block SL-03 fulfilling the seismic commitment for the initial phase The first and second extension periods require the drilling of one exploration well to a minimum depth (below mud line) of 1300 m or a minimum equivalent investment of US$ 30 MM Entry to the first extension period requires a 50 relinquishment of the licence area and a further 25 of the initial licence area must be relinquished on entry to the second extension period The area of the licence is 3860 km2 and water depth varies from 100m to over 4000m with the south-western half of the block being at water depths greater than 3000m
Competent Personrsquos Report African Petroleum Corporation Limited
June 2013 20
Figure 1-5 Location of Blocks SL-03 and SL-04A
The PSC covering Block SL-04A was ratified on 21st September 2012 The licence term is for thirty years the first seven years of which are defined as the exploration period which is further subdivided into an initial period of three years and two subsequent periods of two years Each well drilled in the initial exploration period extends this period by three months Work commitments during the initial phase are to acquire at least 1500 km2 of 3D seismic data and drill one exploration well (to a minimum depth of 2500m) contingent on the results of the 3D and the availability of drilling technology for such deep water The minimum equivalent investment is US$ 10 MM In 2011 TGS acquired 1085 km2 of multi-client 3D seismic data over Block SL-04A Upon licencing these data APCL will have fulfilled the seismic commitment for the initial phase
The subsequent two exploration periods require the drilling of one exploration well in each period (to a minimum depth of 2500 m) or a minimum investment of US$ 50 MM Entry to the second period requires a 50 relinquishment of the licence area and a further 25 of the initial licence area must be relinquished on entry to the third phase The area of the licence is currently 1995 km2 Water depth is between 3000 and 4000 m over the block
Competent Personrsquos Report African Petroleum Corporation Limited
June 2013 21
The state retains the right to a 10 carried interest during any development phase in both licences with the option to acquire a further 5 by covering an equivalent proportion of any development costs
15Cote13 drsquoIvoire13 PSC13 Review
APCL holds a 90 per cent contractor interest in two PSCs governing Block CI-509 and Block CI-513 offshore Cote drsquoIvoire (Figure 1-6) via its wholly owned subsidiary African Petroleum Cote drsquoIvoire Limited The state oil company Petroci has a 10 carried interest
Figure 1-6 Location of Blocks CI-509 and CI-513
The PSC for Block CI-509 was awarded on 16th March 2012 The first eight years of the PSC are termed the exploration period which is further divided into three terms of three three and two years respectively The licence is currently in its first exploration term Work commitments during the first exploration term are to purchase the existing 2D seismic data acquire 1091 km2 (ie a block wide) 3D seismic survey and drill one exploration well at least 100 m into the Albian (Lower Cretaceous) section The minimum investment is US$ 60 MM The second and third terms have a further commitment to drill one exploration well to at least 100 m into the Albian (Lower Cretaceous) section with a minimum investment of US$ 50 MM Entry to the second term requires a 25 relinquishment of the licence area and a further 25 of the initial licence area must be relinquished on entry to the third term The area of the licence is currently 1091 km2 Water depth is between 1900 and 3250 m over the block
Competent Personrsquos Report African Petroleum Corporation Limited
June 2013 22
The PSC covering Block CI-513 has an effective date of 19th December 2011 It has a similar structure to that governing Block CI-509 The first seven years are termed the exploration period subdivided into three terms of three two and two years The licence is currently in its first exploration term Work commitments during the first exploration term are to purchase the existing 2D seismic data acquire 1446 km2 (ie a block wide) 3D seismic survey and drill one exploration well at least 100 m into the Albian (Lower Cretaceous) section The minimum investment is US$ 60 MM The second and third terms have a further commitment to drill one exploration well to at least 100 m into the Albian (Lower Cretaceous) section with a minimum investment of US$ 50 MM Entry to the second term requires a 25 relinquishment of the licence area and a further 25 of the initial licence area must be relinquished on entry to the third term The area under licence is currently 1446 km2 Water depth is between 900 and 3100 m over the block
The exploitation period of both licences is for 25 years subject to successful award in the event of a commercial discovery On development Petroci has the right to acquire an interest of up to 20 in each licence subject to payment of its portion of future costs
In October 2012 APCL completed acquisition of 4200 km2 of 3D seismic data covering blocks CI-508 CI-509 and CI-513 fulfilling the seismic work commitments of the first exploration phase of both PSCs APCL is planning a two well drilling programme for the licences during 2014
16Evaluation Methodology Prospective Resources
We have used probabilistic methods to evaluate selected prospects within Liberia Blocks 8 and 9 Gambia Blocks A1 and A4 Sierra Leone Block SL-03 and Cote drsquoIvoire Blocks CI-513 and CI-509 We classify the results of our simulation as Low Best and High estimates of prospective resources following the Petroleum Resources Management System or PRMS (Appendix 1) We have assigned geological chance of success to each of the prospects using the methodology described below Estimates are made for oil only although we recognise that due to the significant uncertainties in the available geological information that there is a possibility of gas charge in all licences We present a summary of input estimates output STOIIP and gross resources and geological chance of success as a resource summary sheet for each prospective interval investigated These can be found in the enclosures 11 to 45 in this document
Inputs to our probabilistic simulation are evaluated in a consistent manner For the structurally trapped prospective intervals in Liberia (the Lovebird and Wildbird prospects) and the Alhamdulilah prospect in Gambia we have made a low and high deterministic estimate of closing contour for each trap to reflect the uncertainty in both mapping and depth conversion For Liberia we use the gross-rock volume (GRV) derived in this manner to constrain the P90 and P10 of our GRV distribution in our probabilistic simulation For Gambia we have used the areal extents of the low and high cases as inputs to an area times net calculation
Competent Personrsquos Report African Petroleum Corporation Limited
June 2013 23
For the stratigraphically trapped prospects in Liberia (Barbet Night Heron and Sunbird) Cote drsquoIvoire (Sassandra Ayame Ayame West Cavalla and Leraba) and Sierra Leone (Altair) we have made low and high estimates of area of closure using both structural and amplitude support where possible We have then made low and high estimates of gross reservoir thickness derived from regional observations calibrated against seismic data where possible As such depositional systems also have laterally variable sand distributions often supported by seismic data we employ the concept of an areal net to gross ratio varying the percentage of sand areally within the overall stratigraphic trap based on the uncertainty in seismic amplitude strength Where appropriate a geological shape factor is used depending on trap shape and structural relief relative to reservoir thickness
Estimates of reservoir porosity and net to gross ratio are made with reference to regional data offset wells including recent drilling by APCL in Liberia and account for compaction and a degree of overpressure (Figure 2-4) We make low mid and high deterministic estimates and use these to constrain the P90 P50 and P10 inputs to a probabilistic simulation Inputs for hydrocarbon saturation are constrained in a similar manner with reference to regional porosity and permeability trends calibrated to APCLrsquos recent drilling results in Liberia
We have estimated oil formation volume factors for a range of gas oil ratios (GOR) (from an appropriate minimum to fully saturated) for each of the prospective intervals assuming 4oC at the mudline (seabed) and geothermal gradients between 25 and 35oC per 100 m consistent with regional observation and the available well data We assume that the minimum GOR will increase with depth below the mudline Our estimates are calibrated against the oil samples in Well Narina-1 when estimating resources for the Liberian prospects
Some degree of overpressure is accounted for as it has been in our estimates of porosity but by reference to offset discoveries we assume that it is unlikely to exceed 500 psi over the depth range investigated
Recovery factors for the clastic reservoirs are estimated with reference to published information from discoveries in similar reservoir types examples of which are tabulated below (Table 12) Based on this table we estimate low best and high recovery factors of 30 375 and 45 respectively Again these are used to constrain the P90 P50 and P10 of our input distribution during probabilistic simulation
Some prospects are deep relative to mud line and we expect reservoir quality to be reduced despite overpressure We reduce our recovery factor estimates accordingly where this is the case Some prospects are relatively shallow to mud line Where this is the case we model a more viscous oil (prospects materially less than 1500m below sea bed) and have reduced our low best and high recovery factor range to 15 275 and 40 respectively In all cases we assume that a development is able to effectively dispose of any associated gas
Recovery factors for the carbonate reservoirs of the Wildbird prospect in Liberia and Prospect M in the Gambia are estimated by reference to more regional analogues and are discussed in the relevant sections
Competent Personrsquos Report African Petroleum Corporation Limited
June 2013 24
Due to the early stage of exploration within APCLrsquos licences we have adopted a six component risk matrix in all areas barring Liberia to estimate geological chance of success (COS) separated into play and prospect specific risks (Table 13) We have adopted this form of presentation of COS to reflect the fact that deep water exploration in much of the West African Atlantic Margin is at a very early stage and also that a number of the identified prospects have risk dependence and thus can be grouped as a play
Table 12 Estimated oil recovery factors from producing Atlantic Margin fields
PLAY RISK PROSPECT RISK
SOURCE RESERVOIR SEAL TRAP CHARGE RESERVOIR (Presence and Maturity) (Presence) (Presence) (Definition and Efficacy) (Migration) (Efficacy) Incorporates trap definition and seal risk (including biodegradation risk where necessary)
Table 13 Play and prospect risk system
The play risk segment focuses solely on the elements required in a given play to make a hypothetical prospect successful source reflecting the presence and thermal maturity of available source rocks with sufficient generation and expulsion to charge prospects reservoir reflecting the presence regionally of geological intervals that could potentially contain reservoir rock and seal ndash the regional presence of a sealing formation with sufficient thickness and extent to trap hydrocarbons
Prospect risk is divided into three elements Commonly we present seal and trap risk combined as an overall illustration of the integrity of the container here labelled trap risk Charge risk reflects the risk to migration of hydrocarbons from the source rock into the prospect and reservoir risk reflects solely the efficacy (ie porosity and permeability) of any identified reservoir interval
Note that a successful well on a given prospect may reduce or remove the play risk should the well prove reservoir charge and seal in a given play This will have the effect of de-risking further prospects associated with that play
Country Field Start Date Np Max Water Depth Prod Ult
RecoveryRec
FactorRecovery
Prod STOIIP
(MMstb) (m) (MMstb) (MMstb) (MMstb)Eq Guinea Ceiba Nov-00 112 800 18 187 40 10 468Eq Guinea Zafiro Aug-96 652 850 62 1583 40 26 4008Angola Girassol Dec-01 332 1360 32 958 45 30 2129Angola Kuito Dec-99 133 410 36 650 46 18 1413Brasil Espadarte Aug-00 67 877 10 261 31 26 842Brasil Marlim Mar-91 1720 853 101 2878 33 28 8721Total 259 6517 17580Average - Arithmetic 39 23Average - Weighted by STOIIP Ult Rec 37 25
Low Best High30 375 45
Fields on Atlantic Margin with significant production
Hence RF Range
Competent Personrsquos Report African Petroleum Corporation Limited
June 2013 25
Recent drilling within Liberia Blocks 8 and 9 has de-risked the play As a result we adopt prospect specific risking alone as source reservoir trap and seal with the same definitions as described above (Table 13)
Competent Personrsquos Report African Petroleum Corporation Limited
June 2013 26
2 Liberia Prospectivity and Plays
21Introduction
All of the available deep-water acreage offshore Liberia-Sierra Leone basin is under licence (Figure 1-2) Regionally hydrocarbons have been discovered within sandstones at a number of stratigraphic levels from the pre-rift to early syn-rift Albian in Cote drsquoIvoire (Espoir Foxtrot fields and a number of other discoveries) to turbiditic sandstones that have Late Cretaceous (CenomanianTuronian MaastrichtianConiacian) to early Tertiary (Palaeocene to Eocene) ages Recent drilling offshore Ghana has yielded a number of discoveries within these Upper Cretaceous sandstones such as the Jubilee oil field and the Enyenra Tweneboa and Odum oil and gascondensate discoveries In the Liberia-Sierra Leone basin recent drilling has yielded six hydrocarbon discoveries (Bee Eater Narina Monterrado Mercury Venus and Jupiter) but as yet none has been declared commercial (Figure 2-1) Although reservoir quality in the Albian sandstones is variable reservoir quality in the Upper Cretaceous and Tertiary sandstones is often good Successful trap types encountered regionally are both structural and stratigraphic
Of significance to the evaluation of the petroleum systems of Blocks 8 and 9 APCL have drilled three wells within the deeper water parts of the blocks Wells Apalis-1 Narina-1 and Bee Eater-1 Well Apalis-1 found source rock intervals of Albian to Cenomanian age but failed to find the prognosed reservoir Well Narina-1 found light oil within deep-marine sandstones of Cretaceous age The sandstones were of variable reservoir quality as the well appears to have been drilled on the edge of a fan system which can be interpreted from seismic data The extent of the Turonian hydrocarbon bearing interval around Well Narina-1 is currently under investigation by APCL who are working with CGGV to reprocess the 3D multi-client seismic with the hope of identifying areas of favourable reservoir within closure
Well Bee Eater-1 completed in February 2013 also discovered hydrocarbons within similar sandstones of Cretaceous age However the oil bearing Turonian reservoir at Bee Eater is interpreted as being of very low permeability and hence non-commercial APCL interprets that Well Bee Eater-1 was drilled in a canyon system that may have been largely bypassed by sediment input
Both wells demonstrate the viability of Cretaceous petroleum systems within the licence area
Competent Personrsquos Report African Petroleum Corporation Limited
June 2013 27
Figure 2-1 Notable discoveries West Africa offshore
22Well and Seismic Database
Exploration offshore Liberia is at an early stage To date five wells have been drilled in the deeper water areas in 2011 and 2012 with historical exploration drilling (up to 1985) restricted to the more shelfal areas (Figure 2-2) Data from two of these shallow water wells Wells S3-1 and Cestos-1 were made available to us for this evaluation Well S3-1 encountered oil shows in sandstones of Late Cretaceous age
GhanaJubilee Field on
production development of TEN area discoveries
new Hess deepwater discoveries
Cote drsquoIvoireShallow water production
recent discoveries in deepwater Turonian
reservoirs
LiberiaOil discoveries in
Cretaceous deepwater reservoirs at Narina
Monserrado
Sierra LeoneVenus Mercury and Jupiter
oil and condensate discoveries in deepwater
reservoirs
Guinea-COil shows in
offshore wells
Guinea-BSinapa oil discovery
planned appraisal
AGCDome Flore area heavy oil
discoveries under development review
SenegalOnshore gas and condensate production Recent onshore
Turonian discovery
MauritaniaChinguetti Field
production other oil and gas discoveries under development review
Competent Personrsquos Report African Petroleum Corporation Limited
June 2013 28
Figure 2-2 Well and seismic database Liberia Blocks 8 and 9
APCL has drilled three exploration wells offshore Liberia in the deep water part of Block 9 Wells Narina-1 Bee Eater 1 and Apalis-1 (Figure 1-2 Figure 2-2) Well Apalis-1 was drilled in 2011 targeting a four-way dip-closed structure with possible AvO support The well found traces of hydrocarbons plus source rock intervals but the prognosed reservoir sands were absent at target depth and the well was plugged and abandoned
Well Narina-1 was drilled by APCL in 2012 and found 16 to 21 m of net pay (light oil) within sandstones of Turonian (Cretaceous) age Hydrocarbons were also discovered in the underlying Albian Oil samples were collected but no drill-stem testing was undertaken Analysis of the oil samples indicates an API
3D Seismic Area
Competent Personrsquos Report African Petroleum Corporation Limited
June 2013 29
gravity for the Turonian oil of about 38 degrees and about 45 degrees for the Albian hydrocarbons Mobilities from formation pressure measurements and permeability from side-wall core measurements show the reservoir to be of relatively low permeability at this location
Well Bee Eater-1 was drilled by APCL in January and February 2013 The well found oil-bearing sandstones of Cretaceous age but of very low permeability and hence the well is considered non-commercial Post-drill interpretation of the seismic data has helped APCL revise the depositional model for this Turonian fan system The Bee Eater-1 well is interpreted to have encountered a bypass zone in both the Turonian and Cenomanian with immature sandstones that are poorly sorted and tight Post-well mapping of key seismic events tied to Well Bee Eater-1 reveals the possibility of finding better quality sandstones in lsquobasin-floor fanrsquo units down-dip Potentially sealing shale units and source rock units were also found in the Bee-Eater-1 well
Well Apalis-1 and in particular Wells Bee Eater-1 and Narina-1 help de-risk seal and hydrocarbon charge for the Cretaceous play on-block
The primary seismic dataset for our evaluation was the recently acquired 5170 km2 of 3D seismic data over the deeper water area of Blocks 8 and 9 including certain products to review amplitude versus offset (AvO) effects These seismic data cover both recently drilled deep water wells In addition a grid of 2D seismic data was also made available with average line spacing of around 45 km These data provide a tie to Well S3-1 although the well lies some 200m from the nearest seismic line In general the data quality of the 3D volume is good and of suitable fidelity to enable us to undertake our review of identified prospectivity However local complexity in the shallow geology causes the signal to degrade considerably at the prospective levels in certain areas APCL are currently reprocessing these data in an attempt to improve signal quality APCL intend to utilise this dataset to update the CPR in the next 3-6 months It is hoped that these data will support maturation of additional prospects and further clarification of risk and volumes for prospects within this CPR
23Plays and Petroleum Geology Blocks 8 and 9
APCL has identified a number of plays within Blocks 8 and 9 at similar stratigraphic levels to those proven successful elsewhere along the West African margin (Figure 2-3) Recent drilling within Blocks 8 and 9 has demonstrated a working petroleum system within the mid to lower Cretaceous with drilling finding light oil within deep marine sandstones of Turonian age and also in sandstones of Albo-Aptian age
Competent Personrsquos Report African Petroleum Corporation Limited
June 2013 30
Figure 2-3 Petroleum systems and plays Liberia Blocks 8 and 9
Structural traps are identified at the pre-rift to early syn-rift (Albian) level as tilted fault blocks with hydrocarbons sourced from the Albian or Lower Cretaceous source rocks and seal provided by post-rift mud drape Structural and stratigraphic traps are also identified at several potential reservoir levels within the Late Cretaceous and Lower Tertiary again potentially sourced from the Turonian and or Albian source rocks Traps are sealed by coeval marine shales and muds As is encountered regionally there is reasonable seismic evidence for the presence of reservoir bearing intervals within the Upper Cretaceous and Early Tertiary section and this seismic evidence has been used in trap definition
The most significant play in the area is that of Cenomanian to Turonian age deep-marine channel-fan systems as structural and stratigraphic traps In addition an emerging lower Cretaceous microbial carbonate reservoir play has been identified sourced from coeval lacustrine source rocks and sealed by shales deposited during the subsequent drowning of the lacustrine systems by the onset of significant subsidence and marine inundation later in the Cretaceous We have evaluated prospects within both of these play systems Prospectivity in the shallower Cretaceous and Tertiary intervals is still being re-evaluated by APCL as of the date of this report and no leads have been matured to prospect status
Oil show Cestos-1
Competent Personrsquos Report African Petroleum Corporation Limited
June 2013 31
Figure 2-4 Porositydepth trend published West Africa turbidite reservoirs
24Play and Prospect Risk Liberia Blocks 8 and 9
Of the prospects reviewed all but the Wildbird prospect fall within the Cenomanian to Turonian channelfan play In our opinion recent drilling has de-risked source and reservoir presence for this play However reservoir quality in recent wells is variable In our risking of Cenomanian to Turonian prospectivity (Barbet Sunbird Lovebird and Night Heron prospects) we have removed the play element to our risking matrix and see a low risk to hydrocarbon charge for individual prospects Key risk is therefore to trap integrity and reservoir quality We use a four component risk matrix as outlined in Section 16 to define geological chance of success for these prospects
The Wildbird prospect has been recently identified by APCL as part of its review of further play fairways within the Liberian licences The play concept is of early Aptian bio-constructed carbonate build-ups within the restricted lacustrine environment that existed at this time Porosity and permeability within the bioclastic microbial limestones is potentially enhanced by hydrothermal activity resulting from the early rifting Later post-rift subsidence and drowning by marine conditions provides the top seal via the
0
500
1000
1500
2000
2500
3000
3500
4000
0 01 02 03 04m
Bel
ow S
eabe
dPorosity (fraction)
Porosity versus Depth Trend
Regional West AfricaTurbidite Data
Competent Personrsquos Report African Petroleum Corporation Limited
June 2013 32
deposition of Cretaceous marine muds It is envisaged that the play is charged or by Aptian source rocks deposited in the offset lagoonal facies with possible charge from later (but on-lapping) Cretaceous marine source rocks (as other plays on the blocks) Both potential source rocks provide lateral seal (Figure 2-16) Regionally lacustrine microbial carbonate reservoirs can be found in Congo and Angola where there is some production but also in the Campos and Santos basins in Brazil
The microbial carbonate play is emerging within Blocks 8 and 9 and has not been demonstrated to be effective by drilling We adopt the play and prospect risking as discussed in Section 16 to risk the Wildbird prospect as a result discounting biodegradation risk as the prospect is at significant depth Our estimate of play risk for the Cretaceous microbial carbonate play is summarized in below
PLAY Source Reservoir Presence Seal Play
Risk Cretaceous Carbonate 08 06 05 20
Table 21 Play risk Cretaceous carbonate play Liberia Blocks 8 and 9
Competent Personrsquos Report African Petroleum Corporation Limited
June 2013 33
25Liberia Blocks 8 and 9 Leads and Prospects
Following the drilling of Wells Narina-1 and Bee Eater-1 APCL is re-evaluating the prospectivity within Blocks 8 and 9 and has developed a number of potential traps (Figure 2-5) several of which (marked in orange Figure 2-5) have been matured to prospect status We have assessed the prospective resources for certain of these prospects that APCL has identified as viable near-term drilling opportunities Barbet Sunbird Lovebird Night Heron and Wildbird A number of the prospects have multiple reservoir targets Our evaluation of these prospects follows the methodology described in Section 16 The results of Wells Narina-1 and Bee Eater-1 would indicate that oil charge is probable and thus only oil cases have been evaluated However as we state in Section 16 a gas charge cannot be discounted due to the uncertainties in source rock evaluation and basin modelling Input parameters STOIIP prospective resources and geological chance of success for each of the evaluated prospects are summarised in Table 1 of this report and are also presented in the resource summary sheets as Enclosures 11 to 19 of this document
Figure 2-5 Leads and Prospects Liberia Blocks 8 and 9
Competent Personrsquos Report African Petroleum Corporation Limited
June 2013 34
ʹǤͷǤͳǤ Barbet Prospect
The Barbet prospect is identified as a stratigraphic trap around 14 km to the east of and up-dip from Well Narina-1 within Block 9 (Figure 2-6) A single target reservoir is mapped within the Turonian Seismic amplitude anomalies are also identified within the area of the trap that may provide support for reservoir development The Turonian is mapped at between 3000 and 3600 m TVDSS over the area of the prospect in a water depth of around 750 to 770 m
Figure 2-6 Seismic line - depth (m TVDSS) over the Barbet prospect
We have used an areanet pay methodology to estimate prospective resources for the Barbet prospect In our low case we restrict the area of the accumulation to the brightest area of anomalous amplitudes on the far offsets Our high case extends the prospect down-dip to include a larger area of anomalous amplitudes above an observed amplitude shut-off (Figure 2-7) These are used to constrain the P90 and P10 inputs of our probabilistic simulation These polygons approximate to an oil column height of 200 and 700 m respectively
Amplitudes are variable within the area of closure and we apply an areal net to gross ratio to better constrain sand distribution within the trap Gross reservoir thickness estimates are computed from the mapped seismic interval net to gross ratio from regional analogue and porosity from a regional porositydepth trend (Figure 2-4) Fluid parameters and recovery factors are estimated as described in Section 16
Narina-1 Barbet
Top Turonian
Top Cenomanian
Top Albian
Lwr Turonian (BFF)
Top Turonian
Narina-1
Apalis-1
Albian UC
0 km 2(mss)
W E
Competent Personrsquos Report African Petroleum Corporation Limited
June 2013 35
Figure 2-7 Barbet far offset amplitudes with Top Turonian depth contours (m TVDSS)
We have used the prospect risk matrix presented in Section 16 to determine the geological chance of success for the Barbet prospect Key risk to the Barbet prospect is to trapcontainment as the trap requires pinch-out of the reservoir in three directions to seal There is also a subsidiary risk to reservoir as the Turonian reservoir encountered in Well Narina-1 is of relatively poor quality which is countered by seismic evidence over the prospect to support reservoir development As a result we attribute a geological chance of success of 22 to the Barbet prospect
metres
P10
P90metres
APALIS-1
Competent Personrsquos Report African Petroleum Corporation Limited
June 2013 36
ʹǤͷǤʹǤ Sunbird Canyon Prospect
The Sunbird canyon prospect is also identified as a stratigraphic trap around 5 km to the south of Well Apalis-1 within Blocks 8 and 9 mapped as a large canyon system There are three potential reservoir targets within the prospect within the Campanian the Turonian (as encountered in Well Narina-1) and in the underlying Cenomanian Reservoir is prognosed at between 3000 m TVDSS and 3600 m TVDSS in a water depth of around 1300 m
Figure 2-8 Regional seismic line along axis of the Sunbird canyon system
We have used an areanet pay methodology to estimate prospective resources for the Sunbird canyon prospect At all three prospective layers the prospect divides into two discrete lsquocanyonsrsquo separated by an intra-basinal high (eg Figure 2-9) For the Campanian and Turonian prospective intervals in the low case we restrict the area of the accumulation to the brightest area of anomalous amplitudes on the far offsets in the northerly of the two canyons where amplitude response is better Our high case extends the prospect down-dip to include a larger area of anomalous amplitudes above an observed amplitude shut-off and also includes the southerly of the two canyons as this would now be in charge communication The low and high case polygons approximate to an oil column height of 200 m and 600 m respectively
Albian uc
LB-08LB-09
LB-08
LB-09
Albian UC
Sunbird
0 km 4
NESW
Competent Personrsquos Report African Petroleum Corporation Limited
June 2013 37
For the deeper Cenomanian the prospect is mapped as a single canyon to the south of the intra-basinal high The low and high case polygons approximate to an oil column height of 200 m and 700 m respectively Our low and high estimates of area are used to constrain the P90 and P10 of our probabilistic simulation
Figure 2-9 Sunbird Campanian far offset amplitudes with Cenomanian depth contours (m TVDSS)
Amplitudes are variable within the area of closure and we apply an areal net to gross ratio to better constrain sand distribution within the trap for all three prospective layers Gross reservoir thickness estimates are computed from the mapped seismic interval net to gross from regional analogue and porosity from the observed porositydepth trend (Figure 2-4) Fluid parameters and recovery factors are estimated as described in Section 16
metres
P90
P10
Block 9
Block 8
APALIS-1
Competent Personrsquos Report African Petroleum Corporation Limited
June 2013 38
Figure 2-10 Sunbird Turonian far offset amplitudes with Top Turonian depth contours (m TVDSS)
We have used the prospect risk matrix presented in Section 16 to determine the geological chance of success for the three prospective intervals of the Sunbird prospect Key risk to all three prospective layers is to trapcontainment as the trap requires pinch-out of the reservoir in three directions to seal There is also a subsidiary risk to reservoir at the two deeper levels as the Turonian reservoir encountered in Well Narina-1 is of relatively poor quality and Cenomanian reservoirs are yet to be proven on block However there is seismic evidence for reservoir development and hence we see this risk as favourable Reservoir risk is low for the Campanian as it is developed in the offset Well Narina-1 and there is seismic evidence for reservoir presence As a result we attribute a geological chance of
P90
P10
metres
Block 9
Block 8
APALIS-1
Competent Personrsquos Report African Petroleum Corporation Limited
June 2013 39
success of 27 19 and 18 to the Campanian Turonian and Cenomanian prospective intervals of the Sunbird canyon prospect
Figure 2-11 Sunbird Cenomanian far offset amplitudes with Cenomanian depth contours (m TVDSS)
ʹǤͷǤ͵Ǥ Night Heron
Night Heron is a Turonian basin floor fan system which lies 8 Km south west of Well Bee Eater-1 It is mainly within Block 9 but extends into Block 10 It is identified as a stratigraphic trap with areal extents defined by amplitude truncation and structural pinch-out Reservoir is prognosed at between 4100 m TVDSS and 4700 m TVDSS in a water depth of around 1750 m (Figure 2-12) APCL has selected a
P90
P10
metres
Block 9
Block 8
Competent Personrsquos Report African Petroleum Corporation Limited
June 2013 40
provisional well location which lies on the 3D survey location ndash In-line 1098 X-line 6103 They are currently seeking partners to drill the Night Heron well in early 2014
Figure 2-12 Arbitrary line across Night Heron PSDM - Depth (m TVDSS)
Cenomanian reservoir potential also exists beneath the Turonian basin floor fan and work by APCL is on-going to determine prospectivity
Well Bee Eater-1 found an organic-rich Turonian shale section overlying a hydrocarbon bearing thin-bedded low permeability sandstone Another shale dominated package underlies the sandstone Although the Turonian interval is considered non-commercial for Bee Eater the prospectivity down-dip is appealing APCL interprets that the well was drilled in a canyon system that may have been largely bypassed by sediment input The 3D seismic indicates a significant thickening of this Turonian interval towards the south west and there is some amplitude support for the occurrence of a lobate fan straddling Blocks 9 amp 10
An area times net approach was adopted using the full stack PSDM depth volume to provide an SNA extraction and constrain areal extent and estimate an areal NG to account for lateral variability within the reservoir (Figure 2-13) As night Heron falls partly off block ERCE correct for this using the ratio of on-block to off-block area in reporting of net unrisked and net risked results
S NEBee EaterNight Heron
5 Km
BFF Isopach (m)
Competent Personrsquos Report African Petroleum Corporation Limited
June 2013 41
Figure 2-13 SNA from Basin Floor Fan Isopach (m) - PSDM
We have used the prospect risk matrix presented in Section 16 to determine the geological chance of success for the Turonian interval of the Night Heron prospect Recent drilling results suggest that there is a low risk to hydrocarbon charge The observations at Bee Eater-1 also indicate that shale seals are also likely at a coeval interval Reservoir is a significant risk due to the poor Turonian reservoir development in Well Bee Eater-1 The Turonian reservoir encountered in Well Narina-1 is also of relatively poor quality However there is seismic evidence on the 3D survey for a possible improvement in reservoir development over the prospective area The definition of the trap is the key risk as the seismic evidence for closurereservoir pinch-out is ambiguous over the 2D data in Block 10 There appears to be evidence of the reservoir interval thinning in the critical north westerly direction but 3D data would be required to reduce trap risk any further As a result we attribute a geological chance of success of 144 to the Night Heron prospect
3
3
SNA from BFF Isopach
Block Boundary
Competent Personrsquos Report African Petroleum Corporation Limited
June 2013 42
ʹǤͷǤͶǤ Lovebird Prospect
The Lovebird prospect is mapped as a four-way dip closure to the south of Block 8 (Figure 2-14) Three prospective layers are mapped by correlation to up-dip wells and are prognosed to be of Cenomanian age Thus as with the Sunbird canyon prospect these reservoirs are not proven on block but seismic mapping and regional geological work suggests the sands may be derived from the east via a canyon system identified in block LB-07 The three prospective intervals are termed Upper Middle and Lower or Blue Pink and Green based on horizon colour Structural relief at the Pink horizon is between 50 and 200 m depending on the estimate and thus the prospect is relatively low relief in some realisations
Figure 2-14 Seismic line over the Lovebird prospect
Lovebird
Depth (mss)
4 km
NE
Competent Personrsquos Report African Petroleum Corporation Limited
June 2013 43
Figure 2-15 Lovebird prospect Top Pink horizon depth (m TVDSS) high case
The prospect is mapped to the edge of the available 3D (Figure 2-15) which coincides with the southern boundary of Block 8 but closure can be mapped south of the 3D area on the available 2D lines Reservoir depth is prognosed at between 5000 and 5900 m TVDSS in a water depth of 2850 m at the prospect crest Thus reservoir rock if present will be at comparable depths below mud line to the Barbet prospect
We use a gross-rock volumenet to gross methodology to estimate prospective resources for the Lovebird prospect APCLrsquos evaluation of the Lovebird prospect is on-going and of the three interpreted horizons the Pink horizon is the best defined We review pick depth conversion and thickness uncertainty for this interval to generate a range of gross-rock volumes for this interval with the
m ss
metres
Block 9
Block 8
Competent Personrsquos Report African Petroleum Corporation Limited
June 2013 44
prospect full to spill (Figure 2-15) Assuming the Pink horizon provides an accurate representation of the Blue and Green horizons we then estimate gross-rock volumes for these two intervals by isopach
Reservoir thickness and net to gross ratio estimates are derived from regional analogues with reservoir porosity derived from our regional porositydepth trend (Figure 2-4) Fluid properties and recovery factors are estimated as described in Section 16 Our volumetrics are restricted to the portion of the Lovebird prospect on Block 8 We would expect a further evaluation of the prospective resources of the Lovebird prospect to occur subsequent to the completion of the APCL evaluation and the prospective resources associated with the prospect in this report may therefore be subject to change
The key risks to the Lovebird prospect are to the development of reservoir at the prognosed Cenomanian intervals as they are not proved in wells elsewhere on the block and to source as the prospect requires a source rock deeper than that proven by drilling There is also risk to trapcontainment as the structure is not fully defined by the 3D seismic data volume and is of low relief in some realisations We assign a geological chance of success to the Lovebird prospect of 20 as a result
255Wildbird Prospect
The Wildbird prospect is mapped on 3D seismic data towards the south of Block 8 as a large four-way dip-closed high (Figure 2-17) at a depth of between 4000 to 4600 m TVDSS in a water depth of around 2000 m Structural relief is up to 600 m and area of closure up to 170 km2 The conceptual geological model is discussed above but is that the prognosed microbial carbonate reservoir of Albian age is developed between the mapped lsquoredrsquo and lsquolight bluersquo seismic events (Figure 2-16) with lateral seal developed to the north-east of the prospect within contemporaneous lagoonal facies which also provide the primary source rock This lateral seal is required to close the prospect Basin modelling undertaken by APCL suggests that the Albian lagoonal and later Cretaceous source rocks would be mature for oil generation
We have accepted this model as a geological concept and have used it to make estimates of prospective resources for the Wildbird prospect We then risk the model accordingly
Competent Personrsquos Report African Petroleum Corporation Limited
June 2013 45
Figure 2-16 Seismic line and prospect geo-seismic sketch Wildbird prospect
5
0 km 5
SWN
E
mss
Wildbird
Horizons
BlackberryLight BlueRoseRed
Competent Personrsquos Report African Petroleum Corporation Limited
June 2013 46
Figure 2-17 Wildbird Top Reservoir depth map (m TVDSS) Spill point - green contour
The Wildbird prospect is a large container but there is considerable uncertainty in reservoir thickness structural mapping and degree of charge from the offset kitchen areas We evaluate the prospect in a similar manner to the Lovebird prospect by perturbing the above variables In our low case we choose a shallow contact at 4250 m TVDSS to simulate under-filling or lateral breach via onlapping thief zones and also employ a reservoir thickness of 80 m from offset analogue Our high case assumes the prospect is filled to spill and that the lsquoredrsquo seismic event marks base reservoir Estimates of reservoir net to gross ratio and porosity are derived from the available analogues and are necessarily wide Fluid parameters and recovery factors are derived as described in Section 16
The Wildbird play is emerging and is of high risk We attribute a play risk of 24 as a result (Section 24) The key prospect risk to the Wildbird prospect is that of containment or trap as there is evidence for erosion at the crest of the feature and it is reliant on the development of lagoonal facies to the north-east and overlying marine shales to provide lateral seal and support the hydrocarbon column heights modelled here We attribute a prospect risk of 38 Wildbird which when combined with the play risk gives an overall chance of success for the Wildbird prospect of 9
mss
Competent Personrsquos Report African Petroleum Corporation Limited
June 2013 47
3 Gambia Prospectivity and Plays
͵ǤͳǤ Introduction
Although only one exploration well (Well Jammah-1) exists offshore Gambia exploration drilling has been undertaken to the north and south within Senegalese and Guinea Bissau waters (Figure 2-1 Figure 3-1) A number of oil and gas discoveries have been made onshore Senegal and the large Dome Flore and Dome Gea discoveries to the south of the blocks are each reported to contain a million barrels of biodegraded oil (c10-13o API) in place within sandstones of Oligocene (Tertiary) age Some lighter (30-34o API) oil has also been encountered in deeper intervals More regionally oil and gas discoveries have been made to the north offshore Mauritania and in Guinea Bissau (Sinapa) the recently drilled Venus and Mercury wells in Sierra Leone have also encountered hydrocarbons
Figure 3-1 Plays Gambia Blocks A1 and A4
The range of hydrocarbon types encountered is suggestive of multiple sourcing and the age of the reservoirs suggest late timing of oil generation consistent with a late Cretaceous source for the heavy oil although there are no published data to confirm this Regionally the gas source could be any of the older potential source rocks discussed below
Alhamdulilah
GAMBIA A1ampA4 PROSPECTIVITY POTENTIAL
Deep Water Fans channel levee complexes BFF lobes
Late Jurassic clastic progrades
Clastic progrades (unconformity trap)
Karst amp reef features in carbonate platform
Intra-carbonate clastic truncations
Based on line 1046-NWA
1
2
3
1
51
14
2
3
4
5
Competent Personrsquos Report African Petroleum Corporation Limited
June 2013 48
32Well and Seismic Database
Exploration offshore Gambia is also at an early stage and no wells have been drilled in the deeper water areas The nearest well to Blocks A1 and A4 (and the only well offshore Gambia) is Well Jammah-1 some 15 km to the east of Block A1 (Figure 3-2) This well contains oil shows within sandstones of Late Cretaceous age The well drilled to 3020 m MD reaching total depth in an interval of uncertain age perhaps Cenomanian to Albian
A regional grid of 2D seismic data was made available to us for our evaluation with an average line spacing of around 2-3 km on Block A1 and up to 8 km on Block A4 (Figure 3-2 Figure 3-3) In addition a 2003 vintage 3D seismic data volume was available for analysis covering 2008 km2 However APCL is using 2010 vintage 3D seismic data (2566km2) processed to pre-stack time-migration in their current evaluation and we have adopted these data for our review In general seismic data quality was found to be good
Figure 3-2 Wells 2D and 3D seismic data (red outline) Gambia Blocks A1 and A4
The 2D seismic data was sufficient to enable a well to seismic tie to be made to Well Jammah-1 (Figure 3-3) Despite its shelfal location we were able to extrapolate some stratigraphy into the deeper water
Competent Personrsquos Report African Petroleum Corporation Limited
June 2013 49
although the key Upper Cretaceous section is not sampled adequately by the well leading to uncertainty in the age of the deeper clastic section that forms the potential reservoir interval for the Alhamdulilah prospect
33Plays and Petroleum Geology Blocks A1 and A4
Some of the plays identified by APCL offshore Gambia are similar to those described for Liberia in Section 23 above with structural and stratigraphic traps identified at a number of Cretaceous intervals (Figure 3-1) and reservoirs prognosed as being of deep marine turbidites or other mass transport systems However plate tectonic reconstructions suggest that rifting occurred earlier along the Senegalese and Gambian margin beginning in the Lower Jurassic Thus there is the potential for deeper Jurassic age source and reservoir in the area
There is some seismic evidence for the presence of reservoir intervals as is common regionally although evidence is less compelling in the deeper intervals (Figure 3-5) Of the identified traps in this play fairway only one has currently been matured to prospect status by APCL the Alhamdulilah prospect
Regionally reservoirs within the Cretaceous are associated with a deep marine depositional environment and are generally expected to be of good to excellent quality with the possibility of some overpressure A similar depositional environment is prognosed for the deeper Jurassic age reservoirs with possible fan-delta like geometries identifiable on seismic landward (eastward) of the Alhamdululah prospect (Figure 3-7)
In addition to the Jurassic and Cretaceous clastic plays APCL has identified a number of closures along the margin of a carbonate platform of Jurassic to Aptian age partially penetrated by Well Jammah-1 (Figure 3-3 Figure 3-4) These closures are currently being evaluated by APCL and only one Prospect M has been evaluated to prospect status and we assess the prospective resources for Prospect M in this section
Competent Personrsquos Report African Petroleum Corporation Limited
June 2013 50
Figure 3-3 Well to seismic tie ndash Well Jammah-1 to the Alhamdulilah prospect
There is good evidence for the presence of source rocks in the Gambian margin The youngest source interval that could possibly generate oil is the Cenomanian-Turonian marine source rock proven in the Casamance Shelf wells and present in basins to the north Published data indicate kerogen is a mixed Type IIIII locally and Type II in wells to the south with HI of between 370-660 mggC in gt2 TOC rocks (TOCs in the DSDP-367 well 300 km to the west are in excess of 5 in black shales of Albian to Turonian age) This section is absent in Well Jammah-1 probably as a result of erosion
There is also the possibility of Necomian and Jurassic source rocks Necomian black shales are described in the DSDP-367 well Jurassic (Toarcian) source rocks are inferred to be present based on analogue evidence and plate tectonic reconstructions that place proven Jurassic source rocks in Morocco Portugal Nova Scotia and north-eastern Brazil in proximity to the Senegal-Gambia basin These are documented as having a HI of around 450 mggC and a TOC of up to 6
Regional thermal information shows a high degree of variability with gradients from 25 to 45 degCkm likely as a result of drilling on salt domes where geothermal gradients are elevated or in areas locally affected by volcanics Blocks A1 and A4 are at the northernmost margin of the salt basin so at worst only limited local effects are anticipated Using data from Well Jammah-1 we infer a geothermal gradient of 30deg Ckm at the location of the well This would put the Cenomanian-Turonian source locally into the oil window around the Alhamdulilah prospect However uncertainty in both depth conversion and geothermal modelling do not rule out the possibility that the Cenomanian-Turonian could be mature regionally for hydrocarbon generation Deeper Neocomian or Jurassic source rocks if present would be mature for oil generation under this model
ALHAMDULILAH
M
Senonian UC
W E4 km
Jammah-1
Alhamdulilah
Intra Aptian Carbonate
TWT (ms)
Competent Personrsquos Report African Petroleum Corporation Limited
June 2013 51
34Play Risk
In our evaluation of APCLrsquos Gambian blocks we note that a number of the prospective plays require further definition to mature the identified leads to prospect status As a result our evaluation is limited to the determination of independent estimates of prospective resource for the Alhamdulilah prospect and Prospect M We have used play and prospect risk for both prospects to allow for consistency in comparison between our evaluations where a play risk is appropriate
Based on the review above we see source risk as the key risk to the Lower Cretaceous and Jurassic clastic play Although a number of source rock intervals are present regionally only those within the Cretaceous are demonstrated to be present proximal to Blocks A1 and A4 Data are limited but modelling would suggest that those within the Cenomanian-Turonian could be immature for oil generation in all but a small area of the blocks As a result we assign a source risk of 07 Note that the uncertainty in both source rock presence and thermal data is such that there is a possibility of gas charge although like Liberia Sierra Leone and Cote drsquoIvoire it is impossible to quantify this chance at present
We see seal risk for this play to be relatively low as there is seismic evidence similar to that interpreted regionally for the presence of seal Seal risks for the multiple stacked sands prognosed for the Alhamdulilah prospect are handled as a prospect specific risk The inferred depositional environment for this interval would also suggest that sealing intervals would be developed We have therefore assigned a seal risk of 09 to this play
Seismic evidence for the presence of reservoir is also good but less convincing than that observed regionally and in our evaluation of Liberia Blocks 8 and 9 However we assign a reservoir presence risk of 08 It is possible that the younger Cretaceous reservoirs identified could be locally sourced via exhumation of the coeval carbonate platform to the east and thus be composed of detrital carbonate material This is reflected in the reservoir risk for the Alhamdulilah prospect itself
For the carbonate platform play the key risk is that of top seal Seismic reflectivity is highly variable above the top of the platform carbonates (Figure 3-3) as the event is a strong regional unconformity In places the overlying clastic section can be interpreted immediately above this unconformity Although the latter is factored into prospect specific risk to top seal the seismic evidence for the presence of a regional seal above the unconformity is not compelling The top seal is provided by a down-lapping carbonate prone Aptian-Albian section where the Senonian unconformity is not immediately above the reservoir section Analogues suggest there is a general lack of support for intra-formational seals in similar settings and therefore we assign a risk to the carbonate platform play seal of 05 as a result
The presence of a strong angular unconformity at the top of the carbonate platform structures is however likely to have enhanced reservoir quality within the carbonates themselves as a result of subareal exposure and karstification Thus we assign a risk of 09 to the reservoir presence element of the carbonate platform play and review the prospect specific reservoir efficacy risk on a prospect by prospect basis dependent on the seismic evidence for erosion
Competent Personrsquos Report African Petroleum Corporation Limited
June 2013 52
A number of the identified structures along the buried carbonate platform margin are relatively shallow to mudline and thus biodegradation of any oil charge is possible However as we have only estimated prospective resources for Prospect M we have not carried a play risk to biodegradation
Our final play risks for the Lower Cretaceous clastic and the buried carbonate platform plays are summarised in Table 31 below
PLAY Source Reservoir Presence Seal Play
Risk Cretaceous to Jurassic Clastic Play 07 08 09 50
Carbonate Platform Margin 07 09 05 28
Table 31 Play risk Gambia Blocks A1 and A4
Competent Personrsquos Report African Petroleum Corporation Limited
June 2013 53
35Gambia Leads and Prospects
In all 13 leads and prospects have been identified by APCL within Blocks A1 and A4 with areas of closure varying from around 4 km2 to 63 km2 (Figure 3-4) Of the identified prospective intervals a number are best classified as leads and require further technical work to mature them to prospect status (yellow Figure 3-4) Structural closure is identified within the Lower Cretaceous and a number of slope fans can be identified as seismic amplitude anomalies within the Upper Cretaceous section In addition a number of closures are mapped along the edge of the buried carbonate platform margin at Top Aptian level and APCL are currently evaluating the potential for a deeper Barremian age seal which might provide further prospectivity within the carbonate platform play
Figure 3-4 Leads and prospects identified by APCL in Gambia Blocks A1 and A4
In this section we briefly describe our evaluation of the Alhamdulilah prospect and Prospect M A summary of input parameters for the calculation of prospective resources results and risks for each of the prospective layers evaluated is given in the resource summary sheets in Enclosures 21 to 25 of this document
In 2010 APCL acquired a further 2566 km2 of 3D data over both blocks A re-evaluation of the identified leads and prospects is on-going using these data with the evaluation of the Alhamdulilah prospect and Prospect M completed
ALHAMDULILAH
M
Competent Personrsquos Report African Petroleum Corporation Limited
June 2013 54
351Alhamdulilah Prospect
The Alhamdulilah prospect is identified as a four-way dip-closed structural high within the centre of the deep water portion of Block A1 (Figure 3-3 Figure 3-5) We have evaluated four prospective intervals in total (Figure 3-5) Reservoir ages are currently prognosed by APCL to be of Lower Cretaceous (Turonian) to perhaps Lower Jurassic The prospect extends northwards of Block A1 into Senegalese waters and we have restricted our calculations to the proportion of the prospect that lies within Block A1 The bulk of the prospect does however lie within Gambian territory
Figure 3-5 Seismic line over the Alhamdulilah prospect
The prospective intervals within the Alhamdulilah structure lie between 4230 m TVDSS and 5970 m TVDSS or around 2010 to 3750 metres below sea bed This is relatively deep and despite the estimates of overpressure it is possible that porosity and thus reservoir quality to be relatively poor (Figure 2-4) Our estimates of recovery factor for the deeper prospective intervals reflect this
There is uncertainty in the degree of structural closure as although mapped reflectors are relatively bright and continuous the structure is of low relief We have account for this by undertaking various depth conversions of the mapped structure from the time domain 3D seismic data restricting our analysis to closure demonstrable on-block (Figure 3-6) At SS-1 level closure continues to the north off-block and also off the 3D seismic data We have reviewed the available 2D seismic data northwards to determine the spill point at this level
SS 4 (1)
SS 3 (1-2)
SS 2 (1-3)
SS 1 (1-3)
2 Km
Inline 1140 - TWT ALHAMDULILAH
TWT (s)
W E
Competent Personrsquos Report African Petroleum Corporation Limited
June 2013 55
Where seismic facies analysis suggests the potential for stacked pay intervals these have been modelled probabilistically Estimates of gross rock volume derived in this way are combined with the estimates of net reservoir thickness based on mapped seismic thicknesses and porosity and fluid information are derived as described in Section 16 to compute probabilistic estimates of resources for each reservoir interval
Figure 3-6 Area of closure Alhamdulilah prospect layers SS1 to SS4
Recovery factors used are as described in Section 16 of this report but modified to reflect the depth of burial of the deeper prospective intervals
We have reviewed the prospect specific risk for each of the prospective intervals independently Although the Alhamdulilah trap is a four-way dip-closed feature the time closure is subtle and the prospect is relatively deep There is also seabed canyoning which may cause uncertainty in the imaging and thus trap closure
Seismic evidence for seal is relatively good over the Alhamdulilah trap However there is evidence for downcuttingerosion between layers and above the prospect there is also evidence for downlapping events onto the topmost reflector
The key risk to the Alhamdulilah prospect is that of reservoir efficacy There are indications of fan-like geometries within the 3D seismic data (Figure 3-7) and some events can be mapped for the shallower reservoir layers However the Cretaceous reservoirs may alternatively comprise the eroded talus from the coeval carbonate platform to the east and reservoir quality rock may not be developed as a result Finally our estimate of overpressure may be incorrect and any sandstones present may have the reservoir quality sufficiently degraded via compaction to render them non-reservoir
SS-1 Low and High Case AreasSS-4 Low and High Case Areas SS-3 Low and High Case Areas SS-2 Low and High Case Areas
Competent Personrsquos Report African Petroleum Corporation Limited
June 2013 56
As a result the prospect specific risks to the prospective intervals of the Alhamdulilah prospect vary from 26 to 34 and from 13 to 17 when combined with the play risk
Figure 3-7Alhamdulilah prospect seismic facies interpretation Cretaceous intervals
AH-1 AH-1
Competent Personrsquos Report African Petroleum Corporation Limited
June 2013 57
352Prospect M
A number of structures have been identified by APCL at the Aptian level (ie top carbonate) along the buried carbonate platform margin that runs through Blocks A1 and A4 (Figure 3-1) Of these one structure Prospect M has been matured to prospect status and is of sufficient size to warrant independent estimates of resources (Figure 3-8)
Figure 3-8 Seismic line through Prospect M
We have evaluated the uncertainty in gross rock volume for Prospect M and combined this with reservoir net to gross ratio and porosity from analogue to generate estimates of STOIIP and prospective resources We have simulated uncertainty in seismic pick and also depth conversion to generate a range of spill points for the structure (Figure 3-9) These are used to make low and high case estimates of gross-rock volume
Due to the shallow nature of Prospect M we have assumed relatively high (but moveable) oil viscosities as discussed in Section 1 Recovery factor estimates are made with reference to this and also to analogue where uncertainty in both reservoir quality and also the degree of fracturing (and hence dual permeability) leads to a wide range in uncertainty in ultimate recovery Our low case recovery factor being affected primarily by early onset of water cut via fractures and an adverse mobility ratio and the high case making allowance for better oil mobility and improved matrix porosity and permeability leading to a more efficient sweep We therefore use a recovery factor range from 10 to 35 and use these as the P90 and P10 estimates on a log-normal distribution in our probabilistic simulation of prospective resources
Senonian UC
Intra Aptian Carbonate
TWT (ms)2 km
w EProspect M
Competent Personrsquos Report African Petroleum Corporation Limited
June 2013 58
Figure 3-9 Low and high case closure Prospect M top Aptian depth (m TVDSS)
There is pick and depth conversion uncertainty associated with Prospect M but we see a good chance of a closure being developed within the 3D seismic area and assign a prospect specific risk to trap of 09 as a result Downlapping events are observed onto the crest of the prospect (Figure 3-8) but the overlying seismic signature is relatively transparent thus we see a good chance of the prospect being sealed relative to the play risk However the prospect is relatively shallow at around 1000 m to 1100 m below the seabed and there is a risk to biodegradation of any oil charge Thus we associate a risk of 06 to biodegradation As it is established practice we place this risk into containment or trap risk which results in an overall trap risk of 09 06 or 54
There is evidence for the development of reservoir quality rock with a seismic character that has been associated with the development of karstification in the analogues used We also note that the prospect is very close to the platform edge and the erosional unconformity is quite pronounced again suggesting a period of subareal exposure Thus we see the prospect specific risk to reservoir efficacy as 08 Charge risk is also favourable with the prospect located at the edge of the buried platform margin proximal to the deeper potential kitchen areas We therefore associate a charge risk of 08 to the prospect
Thus we assign a prospect specific risk of 35 which when combined with the play risk for the carbonate platform margin gives an overall COS of 10
3
3
m ss
metres
Competent Personrsquos Report African Petroleum Corporation Limited
June 2013 59
4 Sierra Leone Prospectivity and Plays
As with offshore Liberia to the south-east all of the deep-water acreage offshore Sierra Leone is under licence (Figure 4-1) A discussion of regional hydrocarbon occurrences is presented in Section 21 APCLrsquos licences SL-03 and SL-04A-10 lie to the north-west of the countryrsquos territorial waters around 200 to 300 km north-west of the recent Venus Mercury and Jupiter discoveries made by Anadarko (Figure 4-1)
Figure 4-1 Offshore licences and discoveries Liberia and Sierra Leone
A regional grid of 2D seismic data is available to APCL for the evaluation of offshore Sierra Leone (Figure 4-2) In addition APCL has licenced c 2500 km2 of 3D seismic data covering the deeper water area of Block SL-03 and is negotiating the licencing of further 3D seismic data covering part of Block SL-04A-10
Competent Personrsquos Report African Petroleum Corporation Limited
June 2013 60
Well data offshore Sierra Leone are sparse Historical exploration was restricted to the shelf and resulted in the drilling of two exploration wells (Wells A-1 and A-1-2) which were plugged and abandoned as dry holes Data from both wells are available to APCL Recent drilling by Anadarko in the deeper waters of licence SL-07B-10 has yielded a number of discoveries (Wells Jupiter-1 Venus-1 and Mercury-1) but these well data are not available to APCL
Figure 4-2 Well and seismic database offshore Sierra Leone
The play fairways identified offshore Sierra Leone are very similar to those identified offshore Liberia (Figure 2-3) as structural traps within the Lower Cretaceous syn-rift section and primarily as stratigraphic traps within turbiditic sands of Cretaceous age (Campanian Cenomanian and Turonian) Sourcing from regional marine (Cenomanian) or lacustrine (Albo-Aptian) source rocks is hypothesized For the syn-rift structural play the presence of Albo-Aptian reservoirs is demonstrated by the shallow water Wells A-1 and A-1-2 which also had indications of the development of source rocks within the
Competent Personrsquos Report African Petroleum Corporation Limited
June 2013 61
Cretaceous syn-rift section Although the data are not available the recent Anadarko wells are publically documented as having found hydrocarbons within post-rift Cretaceous turbidites potentially de-risking this play
Blocks SL-03 and SL-04A-10 are towards the north-western edge of the seismically identified Cretaceous basin immediately adjacent to a large structural lineament the Sierra Leone Transform System Submarine canyon development is therefore prognosed to occur to the south and east of this lineament providing sediment input into the blocks during Cretaceous time As is encountered regionally there is reasonable seismic evidence for the presence of reservoir bearing intervals within the Upper Cretaceous section in the blocks
APCLrsquos evaluation of the recently licenced 3D seismic data is on-going and as yet only one prospect Altair has been matured to drillable prospect status However a number of other Cretaceous channelfan systems have been identified within Block SL- 03 (Figure 4-3)
Figure 4-3 Leads Sierra Leone Block SL-03
Competent Personrsquos Report African Petroleum Corporation Limited
June 2013 62
41Play Risk
Although there has been recent drilling along strike of APCLrsquos Sierra Leone licences these wells lie some 100 km to the east We have therefore attributed a play risk albeit favourable to Cretaceous channel-fan prospectivity within Blocks SL-03 and SL-04A-10 As with our review of Liberia there is strong seismic evidence for reservoir and seal rocks being present and offset drilling would indicate the same from the limited published information However there is as yet no proven source rock within APCLrsquos licences and we see this as the key risk to play The reported results of offset drilling and APCLrsquos own basin modelling would suggest that source risk would be favourable
Our final play risk for the Cretaceous channel-fan systems in APCLrsquos Sierra Leone licences is summarised in Table 31 below
PLAY Source Reservoir Presence Seal Play
Risk Cretaceous Play 08 09 09 65
Table 41 Play risk Sierra Leone Block SL-03
41Sierra Leone Leads and Prospects
APCL is currently evaluating the recently licenced 3D seismic data over Block SL-03 and has identified a number of Cretaceous channel-fan systems varying in areal extent from 20 km2 to 150 km2 Of the mapped channel fan systems one Altair has been matured to prospect status by APCL and we have made independent estimates of prospective resources and risks for this prospect
A summary of input parameters for the calculation of prospective resources results and risks for the Altair prospect is given in the resource summary sheet in Enclosure 31 of this document
411Altair
The Altair prospect is a turbidite channel prospect mapped at a seismic event described as Turonian by APCL (Figure 4-4) There is however uncertainty in this stratigraphy as it is established by jump correlation using regional seismic data due to the lack of deep water wells on block It is a stratigraphic trap with areal extents defined by amplitude truncation and structural pinch-out in a similar manner to prospectivity within APCLrsquos Liberia and Cote drsquoIvoire acreage A single target reservoir is identified within the trapped area The prospect has anomalous seismic amplitudes associated with it (Figure 4-5) which may indicate reservoir development The top structure is mapped between 6200 ndash 6800 ms TWT over the area of the prospect Our depth conversion indicates a crestal depth of approximately 5400 m TVDSS beneath a water depth of 3300 m giving 2100 m of sediment above top reservoir
Competent Personrsquos Report African Petroleum Corporation Limited
June 2013 63
Figure 4-4 Dip seismic line (full offsets) Altair prospect
The seismic image suggests that Altair is a turbidite channel constrained in the north east by a well-defined canyon Two distinct canyon systems feed erosive channels at the break of slope A south west trending fault which is almost perpendicular to the main canyon feeders alters bathymetric relief and diverts the Altair channel southwards
ERCE has made estimates of prospective resources for the Altair prospect using an identical methodology to our evaluation of Liberian prospectivity An area net approach was adopted using optimized seismic amplitudes to constrain areal extent and define an areal net to gross to account for lateral variability of sand distribution within the reservoir In our low case we restrict the area of the accumulation to the brightest area of anomalous amplitudes and a column height of 200 m Our high case extends the prospect down-dip to a column height of 800 m and laterally to incorporate weaker amplitude responses (Figure 4-5) These polygons were used to constrain the P90 and P10 area inputs of our probabilistic simulation
SW NE
Top Turonian
Top syn-rift
0 5kmTWT (s)
ALTAIR
3
3
metres
Competent Personrsquos Report African Petroleum Corporation Limited
June 2013 64
Figure 4-5 Seismic amplitude (gradient stack) and Top Turonian depth (m TVDSS) Altair prospect
Net pay is estimated from the mapped seismic interval and regional analogue with porosities and fluid properties estimated as described in Section 16
We have used the prospect risk matrix presented in Section 16 to determine the geological chance of success for the Altair prospect Key risk is to trap integrity due to the coalescing of a number of mapped fan systems up dip towards the pinch-out of Altair with subsidiary risk to charge as this is as yet unproven on block This gives a prospect specific risk of 28 which when combined with the play risk gives an overall chance of success of 18 for the Altair prospect
3
3
metres
Competent Personrsquos Report African Petroleum Corporation Limited
June 2013 65
5 Cote13 drsquoIvoire13 Prospectivity13 and Plays
51Introduction
Offshore Cote drsquoIvoire has been actively explored for hydrocarbons for a number of years and much of the offshore shelf is under licence Recently exploration has moved into deeper waters targeting the regional post-rift (Cretaceous) play and APCL has identified a number of prospects and leads within the western licence Blocks of CI-513 and CI-509 (Figure 5-1)
There are two main play types identifiable offshore Cote drsquoIvoire (Figure 5-2) as structural traps within the Lower Cretaceous (Aptian to Albian) syn-rift section and as stratigraphic traps within post rift turbiditic sands of Cenomanian to Turonian age Sourcing is prognosed from regional marine (Turonian) or lacustrine (Albo-Aptian) source rocks
Figure 5-1 CI-509 and CI-513 Prospects and Leads13 offshore13 Cote13 drsquoIvoire
Historically exploration has been restricted to the narrow shelf area and has yielded a number of commercial fields both oil and gas including Foxtrot Baobab and Espoir All of these fields lie within the Lower Cretaceous (Aptian) syn-rift play Recently exploration has moved into deeper waters targeting the regional post-rift (Cretaceous) play Well Paon-1X c 300 km to the east of Blocks CI-105 and CI-513
Competent Personrsquos Report African Petroleum Corporation Limited
June 2013 66
drilled by Tullow Oil plc and partners in licence CI-103 during 2012 is reported to have found hydrocarbons in turbiditic sandstones of Cretaceous age Well Kosrou-1X some 150 km east of Blocks CI-105 and CI-513 shows reservoir development within the post-rift Cretaceous section particularly within the Turonian to Cenomanian section
Evaluation of prospectivity within Blocks CI-509 and CI-513 is at an early stage and a working petroleum system is not proven on block However a number of Cretaceous channelfan systems have been identified using both 2D and 3D seismic data which have generated around seven potential traps at the date of this report five of which are considered prospects for this report (Figure 5-1)
Figure 5-2 Petroleum13 systems13 and13 plays13 offshore13 Cote13 drsquoIvoire
52Well and Seismic Database
APCL has obtained a regional database of 2D seismic data offshore Cote drsquoIvoire which provides well to seismic ties to Well San Pedro-1 (Figure 5-3) The primary data set used for our evaluation is that provided by the recently acquired 3D seismic data At the time of writing these data were processed to
Competent Personrsquos Report African Petroleum Corporation Limited
June 2013 67
pre-stack time-migration and we have used this volume plus available AvO processed volumes to evaluate the prospectivity of the CI-513 licence currently only the full-stack seismic product has been used to assess the prospectivity in Block CI-509
Figure 5-3 Well and seismic database offshore Sierra Leone
53Plays and Petroleum Geology Blocks CI-509 and CI-513
The primary play being explored within Blocks CI-509 and CI-513 is the Cretaceous post-rift turbidite play (Figure 5-2) There is reasonable seismic evidence for the presence of reservoir bearing intervals within the Upper Cretaceous section of the blocks However dating of the age of these post-rift turbidite channelfan systems is uncertain due to the paucity of well and seismic data with stratigraphy extrapolated into APCLrsquos licences via regional seismic correlation The presence of a regional Turonian source rock is hypothesized to charge any identified traps This is not proven on block but evidence from offset drilling in Block CI-105 demonstrates the presence of source rocks developed within the
Grand Lahou East 1
Kosrou 1x
San Pedro 1
South Grand Lahou 1
Competent Personrsquos Report African Petroleum Corporation Limited
June 2013 68
Cenomanian to Turonian and basin modelling studies indicate that the Turonian may be mature for oil generation local to the licences
A number of Cretaceous channelfan systems have been identified using both 2D and 3D seismic data (Figure 5-1) and we have independently evaluated the Prospective Resources and geological chance of success for five of these In addition the Lower Cretaceous syn-rift play may be viable within the licences particularly to the north Evaluation of this play by APCL is on-going and no prospective resources have been assessed for this play
54Play Risk
Exploration offshore Cote drsquoIvoire is at an early stage and there are limited well data available As a result ERCE has adopted a play and prospect risk system in our evaluation of the Cote drsquoIvoire prospective resources within the Cretaceous channel-fan play in an identical manner to our review of Liberia the Gambia and Sierra Leone
In a similar manner to Liberia the Gambia and Sierra Leone there is seismic evidence for the presence of seal and reservoir rock and thus the key risk is to source and we see source risk as the key risk to the Creteaceous clastic play Sourcing is prognosed from regional marine (Turonian) modelled as having limited hydrocarbon generating potential or lacustrine (Albo-Aptian) source rocks the maturity of which are interpreted to be in the very early oil window As a result we assign a play source risk of 06 Note that the uncertainty in both source rock presence and thermal maturity is such that there is a possibility of gas charge although it is impossible to quantify this chance at present
Our final play risk is summarised in Table 51 below
PLAY Source Reservoir Presence Seal Play
Risk Cretaceous Clastic Play 06 09 09 049
Table 51 Play13 risk13 Cote13 drsquoIvoire13 Blocks13 CI-509 and CI-513
Competent Personrsquos Report African Petroleum Corporation Limited
June 2013 69
ͷǤͷǤ Cote13 drsquoIvoire13 Blocks13 CI-509 and CI-503 Leads and Prospects
Prospectivity has been identified by APCL at a number of levels with the evaluation of the Cretaceous clastic turbidite channel-fan play being the most advanced ERCE has made independent assessments of prospective resources and geological chance of success for five prospects within this play Ayame Ayame West Sassandra Cavella and Leraba (Figure 5-1)
A summary of input parameters for the calculation of prospective resources results and risks for each of the prospective layers evaluated is given in the resource summary sheets in Enclosures 41 to 45 of this document
ͷǤͷǤͳǤ Ayame amp Ayame West
The Ayame and Ayame West prospects are identified as Upper Cretaceous fans which lie mainly within Block CI-513 (Figure 5-4) The prognosed trapping mechanism is stratigraphic with areal extents defined by amplitude truncation and structural pinch-out A single target reservoir is prognosed for both within stratigraphy identified as Turonian although stratigraphy is uncertain in both licences as it is established via long distance seismic ties The prospects have anomalous seismic amplitudes associated with them (Figure 5-5) which may indicate reservoir development The top structure is mapped between 5400 ndash 6300 ms TWT over the area of the prospect and our depth conversion places the crest of the trap at approximately 4200 m TVDSS beneath a water depth of 2500 m
Figure 5-4 Strike Line Ayame and Ayame West prospects
NE
0 km 4
TWT (s)
Top
Turonian
Base
Turonian
Top
Albian
AYAMEAYAME WESTSW
P90
P10
metres
P90
P10
AYAME
AYAMEWEST
Competent Personrsquos Report African Petroleum Corporation Limited
June 2013 70
Evaluation of the Ayame and Ayame West prospects is undertaken in an identical manner to our evaluations of the stratigraphically trapped channel-fan prospects in APCLrsquos Liberia and Sierra Leone licences An area net approach is adopted using anomalous seismic amplitudes to constrain areal extent and define an areal net to gross to account for lateral variability of sand distribution within the closure area In our low case we restrict the area of the accumulation to the brightest area of anomalous amplitudes and a 200 m column height Our high case extends the prospect down-dip to 800 m of column height to include a larger area of anomalous amplitudes (Figure 5-5) These polygons are used to constrain the P90 and P10 area inputs of our probabilistic simulation
Net pay estimates are estimated from mapped seismic interval thickness and from regional analogues with porosity fluid parameters and recovery factors estimated as described in Section 16
Figure 5-5 Ayame Seismic amplitude (gradient stack) and Top Turonian depth (m TVDSS)
We use the prospect risk matrix presented in Section 16 to determine the geological chance of success for the Ayame and Ayame West prospects Key risk is to trap and we attribute a trap risk of 50 to both
P90
P10
metres
P90
P10
AYAME
AYAMEWEST
Competent Personrsquos Report African Petroleum Corporation Limited
June 2013 71
prospects giving a prospect specific chance of success of 28 for both prospects When combined with the play risk this gives an overall chance of success of 14
A proportion of the closure areas for both the Ayame and Ayame West prospects fall outside Block CI-513 in our high case (6 km2 and 11 km2 respectively) This is corrected for in our summary tables of net risked and unrisked prospective resources at the beginning of this document by computing the area of the prospect off-block at P90 P50 and P10 and scaling accordingly
ͷǤͷǤʹǤ Sassandra
The Sassandra prospect is mapped as a deep-water fan system at Top Turonian level and lies within Blocks CI-513 and CI-509 approximately 20km west along strike from the Ayame prospect It is a stratigraphic trap with areal extents defined by amplitude truncation and structural pinch-out (Figure 5-6) A single target reservoir is prognosed within the Turonian and as with other prospects on block has similar uncertainty in the stratigraphic age of the prospective interval The prospect has anomalous amplitudes associated with it (Figure 5-7) which may indicate reservoir development The top structure is mapped between 5000 ndash 6000 ms TWT over the area of the prospect and our depth conversion predicts a crestal depth of approximately 4400 m TVDSS beneath a water depth of 2500 m
Figure 5-6 Dip seismic line Sassandra prospect
Top Turonian
Base Turonian
Top Albian
N S
TWT (s)
SASSANDRA
P90 P10
metres
CI-509
Competent Personrsquos Report African Petroleum Corporation Limited
June 2013 72
Evaluation of the Sassandra prospect is undertaken in an identical manner to our evaluation of the Ayame and Ayame West prospects An area net approach is adopted using anomalous seismic amplitudes to constrain areal extent and define an areal net to gross to account for lateral variability of sand distribution within the closure area In our low case we restrict the area of the accumulation to the brightest area of anomalous amplitudes and a 200 m column height Our high case extends the prospect down-dip to 800 m of column height to include a larger area of anomalous amplitudes (Figure 5-7) These polygons are used to constrain the P90 and P10 area inputs of our probabilistic simulation As far offset data are only available for CI-513 (at the time of writing) we have used amplitudes from the full-stack volume to map the extent of the prospect to the west off block (Figure 5-7)
Net pay estimates are estimated from mapped seismic interval thickness and from regional analogues with porosity fluid parameters and recovery factors estimated as described in Section 16
Figure 5-7 Sassandra prospect Seismic amplitude and Top Turonian depth (m TVDSS)
We use the prospect risk matrix presented in Section 16 to determine the geological chance of success for the Sassandra prospect Key risk is to trap and we attribute a trap risk of 40 This is a lower value
33
metres
CI-509
Competent Personrsquos Report African Petroleum Corporation Limited
June 2013 73
than our estimates for the Ayame and Ayame West prospects as the up-dip termination of the trap is less well defined and requires a larger area for pinch-out or bypass Seismic amplitude support for reservoir presence is less over the Sassandra prospect relative to Ayame Thus we estimate a prospect specific chance of success for the Sassandra prospect of 20 which when combined with the play risk gives an overall chance of success for the Sassandra prospect of 10
A proportion of the closure area for the Sassandra prospect falls outside Blocks CI-513 and CI-509 in our high case (33 km2) This is corrected for in our summary tables of net risked and unrisked prospective resources at the beginning of this document by computing the area of the prospect off-block at P90 P50 and P10 and scaling accordingly
553Cavalla
The Cavalla prospect is an Upper Cretaceous Fan which lies between the Ayame and Sassandra prospects within Block CI-513 It is identified as a stratigraphic trap with areal extents defined by amplitude truncation and structural pinch-out (Figure 5-8) A single target reservoir is prognosed within the TuronianCenomanian interval (with similar stratigraphic uncertainty to other prospects on block) which lies stratigraphically beneath the Ayame prospect The prospect has anomalous seismic amplitudes associated with it (Figure 5-9) which may indicate reservoir development The top structure is mapped between 4600 ndash 5900 ms TWT over the area of the prospect and we estimate a crestal depth of approximately 3900 m TVDSS beneath a water depth of 2500 m The prospect is more steeply dipping than other fan systems mapped on block
Evaluation of the Cavalla prospect is undertaken in an identical manner to our evaluation of the Ayame Ayame West and Sassandra prospects An area net approach is adopted using anomalous seismic amplitudes to constrain areal extent and define an areal net to gross to account for lateral variability of sand distribution within the closure area In our low case we restrict the area of the accumulation to the brightest area of anomalous amplitudes and a 200 m column height Our high case extends the prospect down-dip to 800 m of column height to include a larger area of anomalous amplitudes (Figure 5-9) These polygons are used to constrain the P90 and P10 area inputs of our probabilistic simulation
Net pay estimates are estimated from mapped seismic interval thickness and from regional analogues with porosity fluid parameters and recovery factors estimated as described in Section 16
We use the prospect risk matrix presented in Section 16 to determine the geological chance of success for the Cavella prospect Key risk is to trap and we attribute a trap risk of 40 As with the Sassandra prospect this is a lower value than our estimates for the Ayame and Ayame West prospects as the up-dip termination of the trap is less well defined and requires a larger area for pinch-out or bypass Seismic amplitude support for reservoir presence is less over the Cavella prospect relative to Ayame Thus we estimate a prospect specific chance of success for the Cavella prospect of 20 which when combined with the play risk gives an overall chance of success for the Cavella prospect of 10
Competent Personrsquos Report African Petroleum Corporation Limited
June 2013 74
The Cavalla prospect is contained entirely within APCLrsquos licences
Figure 5-8 Dip seismic line Cavalla prospect
Top Turonian
Top Albian
TWT (s)
CAVALLANW SEP90
P10
metres
Competent Personrsquos Report African Petroleum Corporation Limited
June 2013 75
Figure 5-9 Seismic amplitude (gradient stack) and Top fan depth (m TVDSS) Cavalla prospect
ͷǤͷǤͶǤ Leraba
As with the other evaluated prospectivity within Blocks CI-509 and CI-513 the Leraba prospect is an Upper Cretaceous fan which lies within Block CI-509 It is identified as a stratigraphic trap with areal extents defined by amplitude truncation and structural pinch-out (Figure 5-10) The prospect has anomalous seismic amplitudes associated with it (Figure 5-11) which may indicate reservoir development Unlike the other Cote DrsquoIvoire prospects evaluated in this report no offset seismic volumes were available for our review of Leraba at the time of writing The seismic amplitude response and character on the full-stack data is however consistent with that observed over other prospects in Block CI-513 where more seismic products were available
P90
P10
metres
Competent Personrsquos Report African Petroleum Corporation Limited
June 2013 76
The top structure is mapped between 4600 ndash 5200 ms TWT over the area of the prospect and we estimate a depth at the crest of approximately 3700 m TVDSS beneath a water depth of 2500 m
Figure 5-10 Dip seismic line Leraba prospect
Evaluation of the Leraba prospect is undertaken in an identical manner to our evaluation of the other Cretaceous fan systems evaluated in this section An area net approach is adopted using anomalous seismic amplitudes to constrain areal extent and define an areal net to gross to account for lateral variability of sand distribution within the closure area In our low case we restrict the area of the accumulation to the brightest area of anomalous amplitudes and a 200 m column height Our high case extends the prospect down-dip to 800 m of column height to include a larger area of anomalous amplitudes (Figure 5-11) These polygons are used to constrain the P90 and P10 area inputs of our probabilistic simulation
P90
P10
metresTWT (s)
LERABANW SE
Top Turonian
Albian
0 5km
Competent Personrsquos Report African Petroleum Corporation Limited
June 2013 77
Figure 5-11 Seismic amplitudes Leraba prospect overlay of Top Reservoir m TVDSS
Net pay estimates are derived from mapped seismic interval thickness and from regional analogues with porosity fluid parameters and recovery factors estimated as described in Section 16 The prospect is relatively shallow to mud line and we have modelled a more viscous oil as described in Section 16
We use the prospect risk matrix presented in Section 16 to determine the geological chance of success for the Leraba prospect Key risk is to trap and we attribute a trap risk of 60 as the up-dip extent of the prospect is fairly well defined on seismic data Although no off-set 3D seismic data were available the seismic evidence for reservoir presence is again comparable to that of Ayame West Thus we estimate a prospect specific chance of success for the Leraba prospect of 34 which when combined with the play risk gives an overall chance of success for the Leraba prospect of 16
The Leraba prospect is contained entirely within APCLrsquos licences
P90
P10
metres
Competent Personrsquos Report African Petroleum Corporation Limited
June 2013 78
6 Senegal Prospectivity and Plays
Prospectivity identified within APCLrsquos Sengalese licences is seen as being similar to that identified offshore Gambia (Figure 6-1) and a description of the regional petroleum systems and main play types expected is given in Section 3
Figure 6-1 Petroleum systems and plays offshore Senegal
In 2012 APCL acquired 3600 km2 of multi-client 3D seismic data over the Offshore Sud Profond licence In addition 1500 km2 of legacy 3D data over the Rufisque Offshore Profond licence is currently being reprocessed by APCL and legacy 2D seismic data (c 7000 line km) have also been acquired APCL expects to begin prospect evaluation once seismic processing is complete which is expected later in 2013 At present a number of conceptual Cretaceous post-rift leads are identified by APCL (Figure 6-2)
Competent Personrsquos Report African Petroleum Corporation Limited
June 2013 79
Figure 6-2 leads offshore Senegal Blocks ROP and SOSP
Competent Personrsquos Report African Petroleum Corporation Limited
June 2013 80
7 Appendix 1 SPE PRMS Guidelines
SPEWPCAAPGSPEE Petroleum Reserves and Resources Classification System and Definitions
The Petroleum Resources Management System
Preamble
Petroleum Resources are the estimated quantities of hydrocarbons naturally occurring on or within the Earthrsquos crust Resource assessments estimate total quantities in known and yet-to-be-discovered accumulations Resources evaluations are focused on those quantities that can potentially be recovered and marketed by commercial projects A petroleum Resources managements system provides a consistent approach to estimating petroleum quantities evaluating development projects and presenting results within a comprehensive classification framework
International efforts to standardize the definitions of petroleum Resources and how they are estimated began in the 1930s Early guidance focused on Proved Reserves Building on work initiated by the Society of Petroleum Evaluation Engineers (SPEE) SPE published definitions for all Reserves categories in 1987 In the same year the World Petroleum Council (WPC then known as the World Petroleum Congress) working independently published Reserves definitions that were strikingly similar In 1997 the two organizations jointly released a single set of definitions for Reserves that could be used worldwide In 2000 the American Association of Petroleum Geologists (AAPG) SPE and WPC jointly developed a classification system for all petroleum Resources This was followed by additional supporting documents supplemental application evaluation guidelines (2001) and a glossary of terms utilized in Resources definitions (2005) SPE also published standards for estimating and auditing Reserves information (revised 2007)
These definitions and the related classification system are now in common use internationally within the petroleum industry They provide a measure of comparability and reduce the subjective nature of Resources estimation However the technologies employed in petroleum exploration development production and processing continue to evolve and improve The SPE Oil and Gas Reserves Committee works closely with other organizations to maintain the definitions and issues periodic revisions to keep current with evolving technologies and changing commercial opportunities
The SPE-PRMS consolidates builds on and replaces guidance previously contained in the 1997 Petroleum Reserves Definitions the 2000 Petroleum Resources Classification and Definitions publications and the 2001 ldquoGuidelines for the Evaluation of Petroleum Reserves and Resourcesrdquo the latter document remains a valuable source of more detailed background information
These definitions and guidelines are designed to provide a common reference for the international petroleum industry including national reporting and regulatory disclosure agencies and to support petroleum project and portfolio management requirements They are intended to improve clarity in
Competent Personrsquos Report African Petroleum Corporation Limited
June 2013 81
global communications regarding petroleum Resources It is expected that the SPE-PRMS will be supplemented with industry education programs and application guides addressing their implementation in a wide spectrum of technical andor commercial settings
It is understood that these definitions and guidelines allow flexibility for users and agencies to tailor application for their particular needs however any modifications to the guidance contained herein should be clearly identified The definitions and guidelines contained in this document must not be construed as modifying the interpretation or application of any existing regulatory reporting requirements
The full text of the SPEWPCAAPGSPEE Petroleum Resources Management System document hereinafter referred to as the SPE-PRMS can be viewed at
wwwspeorgspecmabinaryfiles6859916Petroleum_Resources_Management_System_2007pdf
Overview and Summary of Definitions
The estimation of petroleum resource quantities involves the interpretation of volumes and values that have an inherent degree of uncertainty These quantities are associated with development projects at various stages of design and implementation Use of a consistent classification system enhances comparisons between projects groups of projects and total company portfolios according to forecast production profiles and recoveries Such a system must consider both technical and commercial factors that impact the projectrsquos economic feasibility its productive life and its related cash flows
Petroleum is defined as a naturally occurring mixture consisting of hydrocarbons in the gaseous liquid or solid phase Petroleum may also contain non-hydrocarbons common examples of which are carbon dioxide nitrogen hydrogen sulphide and sulphur In rare cases non-hydrocarbon content could be greater than 50
The term ldquoResourcesrdquo as used herein is intended to encompass all quantities of petroleum naturally occurring on or within the Earthrsquos crust discovered and undiscovered (recoverable and unrecoverable) plus those quantities already produced Further it includes all types of petroleum whether currently considered conventionalrdquo or ldquounconventionalrdquo
Figure 1-1 is a graphical representation of the SPEWPCAAPGSPEE Resources classification system The system defines the major recoverable Resources classes Production Reserves Contingent Resources and Prospective Resources as well as Unrecoverable petroleum
Competent Personrsquos Report African Petroleum Corporation Limited
June 2013 82
Figure 1-1 SPEAAPGWPCSPEE Resources Classification System
The ldquoRange of Uncertaintyrdquo reflects a range of estimated quantities potentially recoverable from an accumulation by a project while the vertical axis represents the ldquoChance of Developmentrdquo that is the chance that the project that will be developed and reach commercial producing status
The following definitions apply to the major subdivisions within the Resources classification
TOTAL PETROLEUM INITIALLY-IN-PLACE
Total Petroleum Initially in Place is that quantity of petroleum that is estimated to exist originally in naturally occurring accumulations
It includes that quantity of petroleum that is estimated as of a given date to be contained in known accumulations prior to production plus those estimated quantities in accumulations yet to be discovered (equivalent to ldquototal Resourcesrdquo)
Competent Personrsquos Report African Petroleum Corporation Limited
June 2013 83
DISCOVERED PETROLEUM INITIALLY-IN-PLACE
Discovered Petroleum Initially in Place is that quantity of petroleum that is estimated as of a given date to be contained in known accumulations prior to production
PRODUCTION
Production is the cumulative quantity of petroleum that has been recovered at a given date
Multiple development projects may be applied to each known accumulation and each project will recover an estimated portion of the initially-in-place quantities The projects shall be subdivided into Commercial and Sub-Commercial with the estimated recoverable quantities being classified as Reserves and Contingent Resources respectively as defined below
RESERVES
Reserves are those quantities of petroleum anticipated to be commercially recoverable by application of development projects to known accumulations from a given date forward under defined conditions
Reserves must satisfy four criteria they must be discovered recoverable commercial and remaining based on the development project(s) applied Reserves are further subdivided in accordance with the level of certainty associated with the estimates and may be sub-classified based on project maturity andor characterized by their development and production status To be included in the Reserves class a project must be sufficiently defined to establish its commercial viability There must be a reasonable expectation that all required internal and external approvals will be forthcoming and there is evidence of firm intention to proceed with development within a reasonable time frame A reasonable time frame for the initiation of development depends on the specific circumstances and varies according to the scope of the project While five years is recommended as a benchmark a longer time frame could be applied where for example development of economic projects are deferred at the option of the producer for among other things market-related reasons or to meet contractual or strategic objectives
In all cases the justification for classification as Reserves should be clearly documented To be included in the Reserves class there must be a high confidence in the commercial producibility of the reservoir as supported by actual production or formation tests In certain cases Reserves may be assigned on the basis of well logs andor core analysis that indicate that the subject reservoir is hydrocarbon-bearing and is analogous to reservoirs in the same area that are producing or have demonstrated the ability to produce on formation tests
Proved Reserves
Proved Reserves are those quantities of petroleum which by analysis of geoscience and engineering data can be estimated with reasonable certainty to be commercially recoverable from a given date forward from known reservoirs and under defined economic conditions operating methods and government regulations
Competent Personrsquos Report African Petroleum Corporation Limited
June 2013 84
If deterministic methods are used the term reasonable certainty is intended to express a high degree of confidence that the quantities will be recovered If probabilistic methods are used there should be at least a 90 probability that the quantities actually recovered will equal or exceed the estimate The area of the reservoir considered as Proved includes
the area delineated by drilling and defined by fluid contacts if any and adjacent undrilled portions of the reservoir that can reasonably be judged as continuous with it and commercially productive on the basis of available geoscience and engineering data
In the absence of data on fluid contacts Proved quantities in a reservoir are limited by the lowest known hydrocarbon (LKH) as seen in a well penetration unless otherwise indicated by definitive geoscience engineering or performance data Such definitive information may include pressure gradient analysis and seismic indicators Seismic data alone may not be sufficient to define fluid contacts for Proved Reserves (see ldquo2001 Supplemental Guidelinesrdquo Chapter 8) Reserves in undeveloped locations may be classified as Proved provided that the locations are in undrilled areas of the reservoir that can be judged with reasonable certainty to be commercially productive and interpretations of available geoscience and engineering data indicate with reasonable certainty that the objective formation is laterally continuous with drilled Proved locations
For Proved Reserves the recovery efficiency applied to these reservoirs should be defined based on a range of possibilities supported by analogs and sound engineering judgment considering the characteristics of the Proved area and the applied development program
Probable Reserves
Probable Reserves are those additional Reserves which analysis of geoscience and engineering data indicate are less likely to be recovered than Proved Reserves but more certain to be recovered than Possible Reserves
It is equally likely that actual remaining quantities recovered will be greater than or less than the sum of the estimated Proved plus Probable Reserves (2P) In this context when probabilistic methods are used there should be at least a 50 probability that the actual quantities recovered will equal or exceed the 2P estimate
Probable Reserves may be assigned to areas of a reservoir adjacent to Proved where data control or interpretations of available data are less certain The interpreted reservoir continuity may not meet the reasonable certainty criteria Probable estimates also include incremental recoveries associated with project recovery efficiencies beyond that assumed for Proved
Possible Reserves
Possible Reserves are those additional Reserves which analysis of geoscience and engineering data indicate are less likely to be recoverable than Probable Reserves
Competent Personrsquos Report African Petroleum Corporation Limited
June 2013 85
The total quantities ultimately recovered from the project have a low probability to exceed the sum of Proved plus Probable plus Possible (3P) which is equivalent to the high estimate scenario When probabilistic methods are used there should be at least a 10 probability that the actual quantities recovered will equal or exceed the 3P estimate
Possible Reserves may be assigned to areas of a reservoir adjacent to Probable where data control and interpretations of available data are progressively less certain Frequently this may be in areas where geoscience and engineering data are unable to clearly define the area and vertical reservoir limits of commercial production from the reservoir by a defined project
Possible estimates also include incremental quantities associated with project recovery efficiencies beyond that assumed for Probable
Probable and Possible Reserves
(See above for separate criteria for Probable Reserves and Possible Reserves)
The 2P and 3P estimates may be based on reasonable alternative technical and commercial interpretations within the reservoir andor subject project that are clearly documented including comparisons to results in successful similar projects
In conventional accumulations Probable andor Possible Reserves may be assigned where geoscience and engineering data identify directly adjacent portions of a reservoir within the same accumulation that may be separated from Proved areas by minor faulting or other geological discontinuities and have not been penetrated by a wellbore but are interpreted to be in communication with the known (Proved) reservoir Probable or Possible Reserves may be assigned to areas that are structurally higher than the Proved area Possible (and in some cases Probable) Reserves may be assigned to areas that are structurally lower than the adjacent Proved or 2P area
Caution should be exercised in assigning Reserves to adjacent reservoirs isolated by major potentially sealing faults until this reservoir is penetrated and evaluated as commercially productive Justification for assigning Reserves in such cases should be clearly documented Reserves should not be assigned to areas that are clearly separated from a known accumulation by non-productive reservoir (ie absence of reservoir structurally low reservoir or negative test results) such areas may contain Prospective Resources
In conventional accumulations where drilling has defined a highest known oil (HKO) elevation and there exists the potential for an associated gas cap Proved oil Reserves should only be assigned in the structurally higher portions of the reservoir if there is reasonable certainty that such portions are initially above bubble point pressure based on documented engineering analyses Reservoir portions that do not meet this certainty may be assigned as Probable and Possible oil andor gas based on reservoir fluid properties and pressure gradient interpretations
Competent Personrsquos Report African Petroleum Corporation Limited
June 2013 86
CONTINGENT RESOURCES
Contingent Resources are those quantities of petroleum estimated as of a given date to be potentially recoverable from known accumulations by application of development projects but which are not currently considered to be commercially recoverable due to one or more contingencies
Contingent Resources may include for example projects for which there are currently no viable markets or where commercial recovery is dependent on technology under development or where evaluation of the accumulation is insufficient to clearly assess commerciality Contingent Resources are further categorized in accordance with the level of certainty associated with the estimates and may be sub-classified based on project maturity andor characterized by their economic status
UNDISCOVERED PETROLEUM INITIALLY-IN-PLACE
Undiscovered Petroleum Initially in Place is that quantity of petroleum that is estimated as of a given date to be contained within accumulations yet to be discovered
PROSPECTIVE RESOURCES
Prospective Resources are those quantities of petroleum which are estimated as of a given date to be potentially recoverable from undiscovered accumulations
Potential accumulations are evaluated according to their chance of discovery and assuming a discovery the estimated quantities that would be recoverable under defined development projects It is recognized that the development programs will be of significantly less detail and depend more heavily on analog developments in the earlier phases of exploration
Prospect
A project associated with a potential accumulation that is sufficiently well defined to represent a viable drilling target
Project activities are focused on assessing the chance of discovery and assuming discovery the range of potential recoverable quantities under a commercial development program
Lead
A project associated with a potential accumulation that is currently poorly defined and requires more data acquisition andor evaluation in order to be classified as a prospect
Project activities are focused on acquiring additional data andor undertaking further evaluation designed to confirm whether or not the lead can be matured into a prospect Such evaluation includes the assessment of the chance of discovery and assuming discovery the range of potential recovery under feasible development scenarios
Play
Competent Personrsquos Report African Petroleum Corporation Limited
June 2013 87
A project associated with a prospective trend of potential prospects but which requires more data acquisition andor evaluation in order to define specific leads or prospects
Project activities are focused on acquiring additional data andor undertaking further evaluation designed to define specific leads or prospects for more detailed analysis of their chance of discovery and assuming discovery the range of potential recovery under hypothetical development scenarios
The range of uncertainty of the recoverable andor potentially recoverable volumes may be represented by either deterministic scenarios or by a probability distribution When the range of uncertainty is represented by a probability distribution a low best and high estimate shall be provided such that
bull There should be at least a 90 probability (P90) that the quantities actually recovered will equal or exceed the low estimate
bull There should be at least a 50 probability (P50) that the quantities actually recovered will equal or exceed the best estimate
bull There should be at least a 10 probability (P10) that the quantities actually recovered will equal or exceed the high estimate
When using the deterministic scenario method typically there should also be low best and high estimates where such estimates are based on qualitative assessments of relative uncertainty using consistent interpretation guidelines Under the deterministic incremental (risk-based) approach quantities at each level of uncertainty are estimated discretely and separately
These same approaches to describing uncertainty may be applied to Reserves Contingent Resources and Prospective Resources While there may be significant risk that sub-commercial and undiscovered accumulations will not achieve commercial production it useful to consider the range of potentially recoverable quantities independently of such a risk or consideration of the resource class to which the quantities will be assigned
Evaluators may assess recoverable quantities and categorize results by uncertainty using the deterministic incremental (risk-based) approach the deterministic scenario (cumulative) approach or probabilistic methods (see ldquo2001 Supplemental Guidelinesrdquo Chapter 25) In many cases a combination of approaches is used
Use of consistent terminology (Figure 11) promotes clarity in communication of evaluation results For Reserves the general cumulative terms lowbesthigh estimates are denoted as 1P2P3P respectively The associated incremental quantities are termed Proved Probable and Possible Reserves are a subset of and must be viewed within context of the complete Resources classification system While the categorization criteria are proposed specifically for Reserves in most cases they can be equally applied to Contingent and Prospective Resources conditional upon their satisfying the criteria for discovery andor development
Competent Personrsquos Report African Petroleum Corporation Limited
June 2013 88
For Contingent Resources the general cumulative terms lowbesthigh estimates are denoted as 1C2C3C respectively For Prospective Resources the general cumulative terms lowbesthigh estimates still apply No specific terms are defined for incremental quantities within Contingent and Prospective Resources
Without new technical information there should be no change in the distribution of technically recoverable volumes and their categorization boundaries when conditions are satisfied sufficiently to reclassify a project from Contingent Resources to Reserves All evaluations require application of a consistent set of forecast conditions including assumed future costs and prices for both classification of projects and categorization of estimated quantities recovered by each project
Competent Personrsquos Report African Petroleum Corporation Limited
June 2013 89
8 Appendix 2 Nomenclature
81 Units degC degrees Celsius
degF degrees Fahrenheit
bbl barrel
cp centipoises
ft feet
ftMDRKB feet below Kelly Bushing
ftTVDSS feet subsea
km kilometres
m metres
M or MM thousands and millions respectively
ms metres per second
md millidarcy
mTVDSS metres subsea
psia pounds per square inch absolute
psig pounds per square inch gauge
pu porosity unit
rb reservoir barrels
stb a stock tank barrel which is 42 US gallons measured at 147 pounds per square inch and 60 degrees Fahrenheit
82 Reserves and Resources Classifications
Low Low estimate of Prospective Resources as defined in SPE PRMS 2007
Best Best estimate of Prospective Resources as defined in SPE PRMS 2007
High High estimate of Prospective Resources as defined in SPE PRMS 2007
COS Geological Chance of Success associated with Prospective Resources
P10 10 per cent probability = Proved + Probable + Possible or 3P
P50 50 per cent probability = Proved + Probable or 2P
P90 90 per cent probability = Proved or 1P
83 Abbreviations AvO amplitude variation with offset
Bo oil shrinkage factor or formation volume factor in rbstb
Competent Personrsquos Report African Petroleum Corporation Limited
June 2013 90
CPI computer processed information log
FVF formation volume factor
FWL free water level
GRV gross rock volume
GWC gas water contact
KB kelly bushing
kh permeability thickness
MD measured depth
MSL mean sea level
NG net to gross ratio
OWC oil water contact
Phi porosity
PSC production sharing contract
PSDM post stack depth migration
PSTM post stack time migration
PVT pressure volume temperature experiment
RFT repeat formation tester
So oil saturation
Soi initial oil saturation
SS Subsea
STOIIP stock tank oil initially in place
Sw water saturation
Swc connate water saturation
TD total depth
TOC total organic carbon
TVD true vertical depth
TWT two way time
Vsh shale volume
Competent Personrsquos Report African Petroleum Corporation Limited
June 2013 91
Enclosures Resource Summary Sheets
Enclosure 11 Summary Description Sheet Barbet Prospect
SummaryBlock 9
APC Interest () 100
Fluid Oil
Crest (m ss) 3000
Water depth (m) 750
Notes
Area Shape F Areal NG Net Thick Porosity SO Bo STOIIP Rf Rec Res(km2) (frac) () (m) () () (rbstb) (MMstb) (frac) (MMstb)
Charge 90
Reservoir 70 Low 14 085 62 22 13 73 135 166 0300 60
Trap 50 Best 37 090 80 34 17 80 150 500 0375 186
Seal 70 High 98 095 98 53 20 88 165 1479 0450 558
COS 22 Deterministic inputs probabilistic STOIIP and Rec Resource Mean 270
Stratigraphic trap with amplitude support
Geological Risk Matrix
P10
P90metres
BARBET
dtdƐͿ
ϬŬŵϰ
Enclosure 12 Summary Description Sheet Sunbird Prospect Campanian Reservoir
SummaryBlock 8 amp 9
APC Interest () 100
Fluid Oil
Crest (m ss) 3000
Water depth (m) 1300
Notes
Area Shape F Areal NG Net Thick Porosity SO Bo STOIIP Rf Rec Res(km2) (frac) () (m) () () (rbstb) (MMstb) (frac) (MMstb)
Charge 80
Reservoir 80 Low 12 070 43 27 18 73 130 177 0300 63
Trap 60 Best 27 080 69 42 21 80 145 461 0375 172
Seal 70 High 61 090 95 66 24 88 165 1187 0450 448
COS 27 Deterministic inputs probabilistic STOIIP and Rec Resource Mean 229
Stratigraphic trap with amplitude support Split by intra-canyon
high
Geological Risk Matrix
P90
P10
metres
SUNBIRD
dtdƐͿ
ϬŬŵϰSUNBIRD
Enclosure 13 Summary Description Sheet Sunbird prospect Turonian Reservoir
SummaryBlock 8 amp 9
APC Interest () 100
Fluid Oil
Crest (m ss) 3300
Water depth (m) 1300
Notes
Area Shape F Areal NG Net Thick Porosity SO Bo STOIIP Rf Rec Res(km2) (frac) () (m) () () (rbstb) (MMstb) (frac) (MMstb)
Charge 90
Reservoir 60 Low 8 085 65 24 14 73 140 107 0300 39
Trap 50 Best 21 090 80 37 17 80 158 307 0375 115
Seal 70 High 53 095 94 58 20 88 175 863 0450 327
COS 19 Deterministic inputs probabilistic STOIIP and Rec Resource Mean 162
Stratigraphic trap with amplitude support Split by intra-canyon
high
Geological Risk Matrix
SW NE
Campanian Jacana Channel
Turonian BFF
P90
P10
metres
SUNBIRD
ϬŬŵϰ
Enclosure 14 Summary Description Sheet Sunbird Prospect Cenomanian Reservoir
SummaryBlock 8 amp 9
APC Interest () 100
Fluid Oil
Crest (m ss) 3500
Water depth (m) 1300
Notes
Area Shape F Areal NG Net Thick Porosity SO Bo STOIIP Rf Rec Res(km2) (frac) () (m) () () (rbstb) (MMstb) (frac) (MMstb)
Charge 100
Reservoir 50 Low 10 060 71 21 14 73 140 91 0300 33
Trap 60 Best 25 070 85 33 17 80 158 264 0375 99
Seal 60 High 65 080 99 51 20 88 175 779 0450 294
COS 18 Deterministic inputs probabilistic STOIIP and Rec Resource Mean 141
Stratigraphic trap with amplitude support Split by intra-canyon
high
Geological Risk Matrix
P90
P10
metres
SUNBIRD
dtdƐͿ
ϬŬŵϮ
Enclosure 15 Summary Description Sheet Lovebird Prospect Blue Horizon
SummaryBlock 8
APC Interest () 100
Fluid Oil
Crest (m ss) 5000
Water depth (m) 2850
Notes
GRV NG Porosity SO Bo STOIIP Rf Rec Res(MMm2) () () () (rbstb) (MMstb) (frac) (MMstb)
Charge 54
Reservoir 60 Low 354 30 14 60 150 68 030 25
Trap 70 Best 1310 54 19 70 180 293 038 109
Seal 90 High 4849 73 24 80 210 1218 045 456
COS 20 Mean 201
Four way dip closure to south of Block 8 Three potential
reservoirs identified Blue and Green horizon volumetrics derived
assuming ispoachous to Pink
Geological Risks
ŝŐŚĂƐĞWŝŶŬĞƉƚŚDĂƉ
Enclosure 16 Summary Description Sheet Lovebird Prospect Pink Horizon
SummaryBlock 8
APC Interest () 100
Fluid Oil
Crest (m ss) 5400
Water depth (m) 2850
Notes
GRV NG Porosity SO Bo STOIIP Rf Rec Res(MMm2) () () () (rbstb) (MMstb) (frac) (MMstb)
Charge 54
Reservoir 60 Low 354 30 12 60 155 59 030 22
Trap 70 Best 1310 54 17 70 188 262 038 96
Seal 90 High 4849 73 22 80 220 1066 045 400
COS 20 Mean 178
Four way dip closure to south of Block 8 Three potential
reservoirs identified Blue and Green horizon volumetrics derived
assuming ispoachous to Pink
Geological Risks
ŝŐŚĂƐĞWŝŶŬĞƉƚŚDĂƉ
Enclosure 17 Summary Description Sheet Lovebird Prospect Green Horizon
SummaryBlock 8
APC Interest () 100
Fluid Oil
Crest (m ss) 5800
Water depth (m) 2850
Notes
GRV NG Porosity SO Bo STOIIP Rf Rec Res(MMm2) () () () (rbstb) (MMstb) (frac) (MMstb)
Charge 54
Reservoir 60 Low 354 30 10 60 160 48 030 18
Trap 70 Best 1310 54 15 70 195 210 038 78
Seal 90 High 4849 73 20 80 230 896 045 337
COS 20 Mean 150
Four way dip closure to south of Block 8 Three potential
reservoirs identified Blue and Green horizon volumetrics derived
assuming ispoachous to Pink
Geological Risks
ŝŐŚĂƐĞWŝŶŬĞƉƚŚDĂƉ
Enclosure 18 Summary Description Sheet Wildbird Prospect
SummaryORFN $3ampQWHUHVW )OXLG 2LOampUHVWPVV DWHUGHSWKP P
Notes
Play Risk Prospect RiskGRV NG Porosity SO Bo STOIIP Rf Rec Res
6RXUFH 7UDS (MMm2) () () () (rbstb) (MMstb) (frac) (MMstb)6HDO ampKDUJH 5HVHUYRLU3UHV 5HVHUYRLU(II Low
Best High
COS 9 Deterministic inputs probabilistic STOIIP and Rec Resource Mean
)RXUZDGLSFORVHGKLJK
5
0 km 5
6 1(
PVV
Wildbird Horizons
ODFNEHUULJKWOXH3LQN5HG
mss
Enclosure 19 Summary Description Sheet Night Heron Prospect
SummaryORFN $3ampQWHUHVW RIORFN)OXLG 2LOampUHVWPVV DWHUGHSWKP
Notes
Prospect Risk Area Areal NG Net Porosity SO Bo STOIIP Rf Rec ResampKDUJH (km2) (frac) (m) () () (rbstb) (MMstb) (frac) (MMstb)5HVHUYRLU 7UDS Low 6HDO Best
High COS 144 Deterministic inputs probabilistic STOIIP and Rec Resource Mean 759
1LJKW+HURQLVD7XURQLDQEDVLQIORRUIDQVVWHPZKLFKPDLQOOLHVZLWKLQEORFNRIIVKRUHLEHULDWLVLGHQWLILHGDVDVWUDWLJUDSKLFWUDSZLWKDUHDOH[WHQWVGHILQHGEDPSOLWXGHWUXQFDWLRQDQGVWUXFWXUDOSLQFKRXW$QDUHDQHWDSSURDFKZDVDGRSWHGXVLQJWKHIXOOVWDFN360GHSWKLPDJHYROXPHWRSURYLGH61$H[WUDFWLRQDQGFRQVWUDLQDUHDOH[WHQWDQGHVWLPDWHDQDUHDO1WRDFFRXQWIRUODWHUDOYDULDELOLWZLWKLQWKHUHVHUYRLU1LJKW+HURQIDOOVSDUWORIIEORFN(5amp(FRUUHFWIRUWKLVXVLQJWKHUDWLRRIRQEORFNWRRIIEORFNDUHDLQUHSRUWLQJRIQHWXQULVNHGDQGQHWULVNHGUHVXOWV
6HLVPLFLQH36061$([WUDFWLRQ
Arbitrary line across Night Heron PSDM (Depth m)
S NE
2QWKHXSGLSSLQFKRXWLVGHILQHGELVRSDFKDQGDPSOLWXGHWUXQFDWLRQ
2QWKHXSGLSSLQFKRXWLVGHILQHGRQOELVRSDFK
Bee EaterNight Heron
5 Km
RMS Amplitudes from BFF Isopach
Depth (m)
Block Boundary
Enclosure 21 Summary Description Sheet
Summary - M - CretBlock A1
Working Interest () 60
Fluid Oil
Crest (m) 3130 (1070 bml)
Water depth (m) 2220
Notes
Play Risk Prospect Risk Area Stack F Net Porosity SO Bo STOIIP Rf Rec Res(Km2) (frac) (m) () () (rbstb) (MMstb) (frac) (MMstb)
Source 70 Trap 54
Seal 50 Mig 80 Low 8 1 15 10 55 125 82 010 13
Res Pres 80 Res Eff 80 Best 14 1 30 16 65 117 231 023 43
28 35 High 26 1 60 22 75 110 629 035 141
COS 10 Deterministic inputs probabilistic STOIIP and Rec Resource Mean 66
Structural high along edge of buried carbonate platform margin of
probable Lower Cretaceous and Jurassic age Seismic evidence
favourable for reservoir development Lower Bo model used to
reflect relatively shallow nature of prospect The prospect is close
to the shelf margin and so is well placed for charging The strong
rugose seismic events are interpreted as Karstified Limestones
Seismic Line Top Structure Map
WƌŽƐƉĞĐƚD
ĞƉƚŚŵ
Ϳ
Enclosure 22 Summary Description Sheet
Summary - SS - 4Block A1
Working Interest () 60
Fluid Oil
Crest (m) 4230 (2010 bml)
Water depth (m) 2220
Notes
Play Risk Prospect Risk Area Stack F Net Porosity SO Bo STOIIP Rf Rec Res(Km2) (frac) (m) () () (rbstb) (MMstb) (frac) (MMstb)
Source 70 Trap 80
Seal 90 Mig 85 Low 6 1 10 16 68 220 43 030 16
Res Pres 80 Res Eff 50 Best 11 1 19 20 75 167 113 038 42
50 34 High 21 1 35 24 83 135 295 045 112
COS 17 Deterministic inputs probabilistic STOIIP and Rec Resource Mean 56
Four way dip closed anticlinal structure The SS-4 interval has a
gross thickness over the crest area of 360 m Downlap of seismic
events across the crest of the SS-4 structure slightly downgrades
SS-4 seal The interval is believed to be Cenomanian in age and
the seismic character of generally planar events is interpreted as
representing thin bedded turbidites
Seismic Line Top Structure Map
2010 Migration Velocity Data ndash SS-4 Probability Above Spill
Enclosure 23 Summary Description Sheet
Summary - SS - 3Block A1
Working Interest () 60
Fluid Oil
Crest (m) 4590 (2370 bml)
Water depth (m) 2220
Notes
Play Risk Prospect Risk Area Stack F Net Porosity SO Bo STOIIP Rf Rec Res(Km2) (frac) (m) () () (rbstb) (MMstb) (frac) (MMstb)
Source 70 Trap 75
Seal 90 Mig 85 Low 12 1 20 15 68 227 197 025 63
Res Pres 80 Res Eff 50 Best 17 15 35 18 75 173 417 034 143
50 32 High 25 2 60 20 83 140 881 045 316
COS 16 Deterministic inputs probabilistic STOIIP and Rec Resource Mean 173
Four way dip closed anticlinal structure The SS-3 interval has a
gross thickness over the crest area of 550 m Seals to deeper
reservoirs may be eroded by overlying reservoirs From seismic
the prospective reservoir has been interpreted as being an Albian
deep water channel-lobe complex
Seismic Line Top Structure Map
2010 Migration Velocity Data ndashSS-3 Probability Above Spill
Enclosure 24 Summary Description Sheet
Summary - SS - 2Block A1
Working Interest () 60
Fluid Oil
Crest (m) 5140 (2920 bml)
Water depth (m) 2220
Notes
Play Risk Prospect Risk Area Stack F Net Porosity SO Bo STOIIP Rf Rec Res(Km2) (frac) (m) () () (rbstb) (MMstb) (frac) (MMstb)
Source 70 Trap 75
Seal 90 Mig 85 Low 12 1 20 11 68 231 187 025 58
Res Pres 80 Res Eff 50 Best 17 2 35 14 75 183 416 032 133
50 32 High 25 3 60 17 83 151 911 040 303
COS 16 Deterministic inputs probabilistic STOIIP and Rec Resource Mean 163
Four way dip closed anticlinal structure The SS-2 interval has a
gross thickness over the crest area of 830 m The prospective
reservoir has been interpreted as a stacked series of channellobe
sets Seals to deeper reservoirs may be eroded by overlying
reservoirs
Seismic Line Top Structure Map
2010 Migration Velocity Data ndashSS-2 Probability Above Spill
Enclosure 25 Summary Description Sheet
Summary - SS - 1Block A1
Working Interest () 60
Fluid Oil
Crest (m) 5970 (3750 bml)
Water depth (m) 2220
Notes
Play Risk Prospect Risk Area Stack F Net Porosity SO Bo STOIIP Rf Rec Res(Km2) (frac) (m) () () (rbstb) (MMstb) (frac) (MMstb)
Source 70 Trap 65
Seal 90 Mig 80 Low 17 1 20 8 50 249 158 015 34
Res Pres 80 Res Eff 50 Best 30 2 35 11 60 196 399 024 98
50 26 High 54 3 60 13 70 162 997 040 276
COS 13 Deterministic inputs probabilistic STOIIP and Rec Resource Mean 135
Four way dip closed anticlinal structureThe SS-1 interval has a
gross thickness over the crest area of 890 m The prospective
reservoir lies under an unconformity and is believed to be Jurassic
in age its seismic character suggests a channel amp channel-levee
complex Regional porosity trends indicate low porosities are likely
to be encountered if hydrostatic pressures are assumed
Seismic Line Top Structure Map
2010 Migration Velocity Data ndash SS-1 Probability Above Spill
Enclosure 31 Summary Description Sheet
SummaryBlock SL-03
APCL Interest () 90
Fluid Oil
Crest (m ss) 5400
Water depth (m) 3300
Notes
Play Risk Prospect Risk Area Areal NG Net Porosity SO Bo STOIIP Rf Rec Res(km2) (frac) (m) () () (rbstb) (MMstb) (frac) (MMstb)
Source 80 Trap 50
Seal 90 Mig 70 Low 11 070 29 15 73 205 218 030 79
Res Pres 90 Res Eff 80 Best 32 082 56 18 80 162 755 038 278
65 28 High 92 094 83 21 88 134 2473 045 938
COS 18 Mean 434
Altair is a Turonian turbidite channel prospects within the
SL-03 Block offshore Sierra Leone It is identified as a
stratigraphic trap with areal extents defined by amplitude
truncation and structural pinchout Recent discoveries in
nearby blocks confirm a working hydrocarbon system
(Venus-B1 Jupiter-1 and Mercury-1) The Sierra Leone
wells A-1 and A1-2 proved good reservoir and potential
source rocks Two distinct canyon systems feed erosive
channels at the break of slope An area net approach was
adopted using a pseudo-gradient volume SNA extraction to
constrain areal extent and define an areal NG to account
for lateral variability of sand distribution within the
reservoir
Arbitrary Dip Line Grad TWTGrad NRMS Extraction
Enclosure 41 Summary Description Sheet
SummaryBlock CI-513
APCL Interest () 90
Fluid Oil
Crest (m ss) 4200
Water depth (m) 2500
Notes
Play Risk Prospect Risk Area Areal NG Net Porosity SO Bo STOIIP Rf Rec Res(km2) (frac) (m) () () (rbstb) (MMstb) (frac) (MMstb)
Source 60 Trap 50
Seal 90 Mig 70 Low 11 070 20 17 73 181 179 030 65
Res Pres 90 Res Eff 80 Best 40 085 38 20 80 149 815 038 302
49 28 High 149 099 55 23 88 126 3474 045 1318
COS 14 Mean 569
Ayame is an Upper Cretaceous fan which mainly lies
ZLWKLQEORFNampRIIVKRUHampRWHparaYRLUHWLVLGHQWLILHGas a stratigraphic trap with areal extents defined by
amplitude truncation and structural pinchout The prospect
has very good amplitude support An area net approach
was adopted using pseudo-gradient volume SNA NRMS
extractions to constrain areal extent and define an areal
NG to account for lateral variability of sand distribution
within the reservoir for low and high case area polygons
These seismically defined polygons were then filled to
column heights of 200m and 800m respectively and used
to constrain the P90 and P10 area inputs of our
probabilistic simulation
Seismic Line
TWT Grad SNA Extraction
Ayame
Ayame West
dtdƐͿ
Ayame
Enclosure 42 Summary Description Sheet
SummaryBlock CI-513 amp Open
APCL Interest () 90 in CI-513
Fluid Oil
Crest (m ss) 4900
Water depth (m) 2700
Notes
Play Risk Prospect Risk Area Areal NG Net Porosity SO Bo STOIIP Rf Rec Res(km2) (frac) (m) () () (rbstb) (MMstb) (frac) (MMstb)
Source 60 Trap 50
Seal 90 Mig 70 Low 10 061 25 14 73 194 161 030 58
Res Pres 90 Res Eff 80 Best 30 080 47 18 80 159 585 038 216
49 28 High 93 099 69 21 88 134 2085 045 788
COS 14 Mean 352
A second prospect within the same reservoir interval was
identified and volumetrically assessed Ayame West is
separated from Ayame by a structural high isopach
thinning and amplitude dimming The prospect was
assessed in the same manner as Ayame with a but with
Low Case column height of 600m filling down to the point
at which amplitudes between the two fans brighten
allowing possible communication The upper end of the
Ayame West fan lies down-dip of Ayame and less than
1km away from the thinning low amplitude saddle between
the two prospects
Seismic Line
TWT Grad SNA Extraction
Ayame
West
Ayame West
dtdƐͿ
Ayame
Enclosure 43 Summary Description Sheet
SummaryBlock CI-513 CI-509
APCL Interest () 90 of CI-513
Fluid Oil
Crest (m ss) 4400
Water depth (m) 2500
Notes
Play Risk Prospect Risk Area Areal NG Net Porosity SO Bo STOIIP Rf Rec Res(km2) (frac) (m) () () (rbstb) (MMstb) (frac) (MMstb)
Source 60 Trap 40
Seal 90 Mig 70 Low 6 070 15 16 73 185 71 030 26
Res Pres 90 Res Eff 70 Best 23 084 28 19 80 152 320 038 118
49 20 High 92 098 42 22 88 129 1408 045 521
COS 10 Mean 237
This sheet refers to volumes associated with Blocks 513 and CI-509 Sassandra is an Upper Cretaceous fan
which straddles blocks CI-513 and CI-509 It is identified
as a stratigraphic trap with areal extents defined by
amplitude truncation and structural pinchout A single
target reservoir is identified within the Turonian The
prospect has good amplitude support An area times net
approach was adopted using a pseudo-gradient volume
NRMS extraction to constrain prospect size Angle stacks
were not available outside of Block CI-513 so an RMS
extraction on the full stack volume was used to determine
NW extent In our low case we restrict the area of the
accumulation to the brightest area of anomalous
amplitudes Our high case extends the prospect down-dip
Arbitrary Dip Line Grad TWT
Full Stack - RMS Extraction
Sassandra
dtdƐͿ
Enclosure 44 Summary Description Sheet
SummaryBlock CI-513
APCL Interest () 90
Fluid Oil
Crest (m ss) 3900
Water depth (m) 2500
Notes
Play Risk Prospect Risk Area Areal NG Net Porosity SO Bo STOIIP Rf Rec Res(km2) (frac) (m) () () (rbstb) (MMstb) (frac) (MMstb)
Source 60 Trap 40
Seal 90 Mig 70 Low 4 071 20 19 73 185 67 030 25
Res Pres 90 Res Eff 70 Best 13 085 38 22 80 152 281 038 104
49 20 High 46 099 55 25 88 129 1142 045 431
COS 10 Mean 190
Cavalla is an Upper Cretaceous Fan which lies between
the Ayame and Sassandra prospects of Block CI-513
RIIVKRUHampRWHparaYRLUHWLVLGHQWLILHGDVDVWUDWLJUDSKLFtrap with areal extents defined by amplitude truncation and
structural pinchout A single target reservoir is identified
within the TuronianCenomanian interval which lies
stratigraphically beneath the Ayame Prospect For the
amplitude analysis the top reservoir has been shifted up
30ms to bracket strong negative amplitudes on the
Gradient volume and the base reservoir has been shifted
up 50ms to remove Albian related amplitudes An area net
approach was adopted using pseudo-gradient volume SNA
NRMS extractions to constrain extent of the low and high
case area polygons These seismically defined polygons
were then filled to column heights of 200m and 800m
respectively
Arbitrary Dip Line Grad TWT Grad NRMS Extraction
Cavalla
dtdƐͿ
Enclosure 45 Summary Description Sheet
SummaryBlock CI-509
APCL Interest () 90
Fluid Oil
Crest (m ss) 3700
Water depth (m) 2500
Notes
Play Risk Prospect Risk Area Areal NG Net Porosity SO Bo STOIIP Rf Rec Res(km2) (frac) (m) () () (rbstb) (MMstb) (frac) (MMstb)
Source 60 Trap 60
Seal 90 Mig 70 Low 5 076 39 21 73 150 252 015 55
Res Pres 90 Res Eff 80 Best 18 088 75 24 80 134 997 028 258
49 34 High 61 100 111 27 88 121 3682 040 1039
COS 16 Mean 460
Leraba is an Upper Cretaceous fan It is identified as a
stratigraphic trap with extents defined by amplitude
truncation and structural pinchout The final processing
products and AvO volumes are yet to be delivered for CI-
KRZHYHUWKHmicroHRWUDFHUDZPLJUDWLRQVWDFNparaYROXPHLVof high quality and is deemed suitable for deriving a
volumetric range for Leraba An area net approach was
adopted using an RMS extraction to constrain extent and
define an areal NG to account for lateral variability of sand
distribution In our low case we restrict the area to the
brightest area of anomalous amplitudes Our high case
extends the prospect down-dip and SW to include a
secondary channel system
Arbitrary Dip Line TWT Full Stack RMS Extraction
Leraba
dtdƐͿ
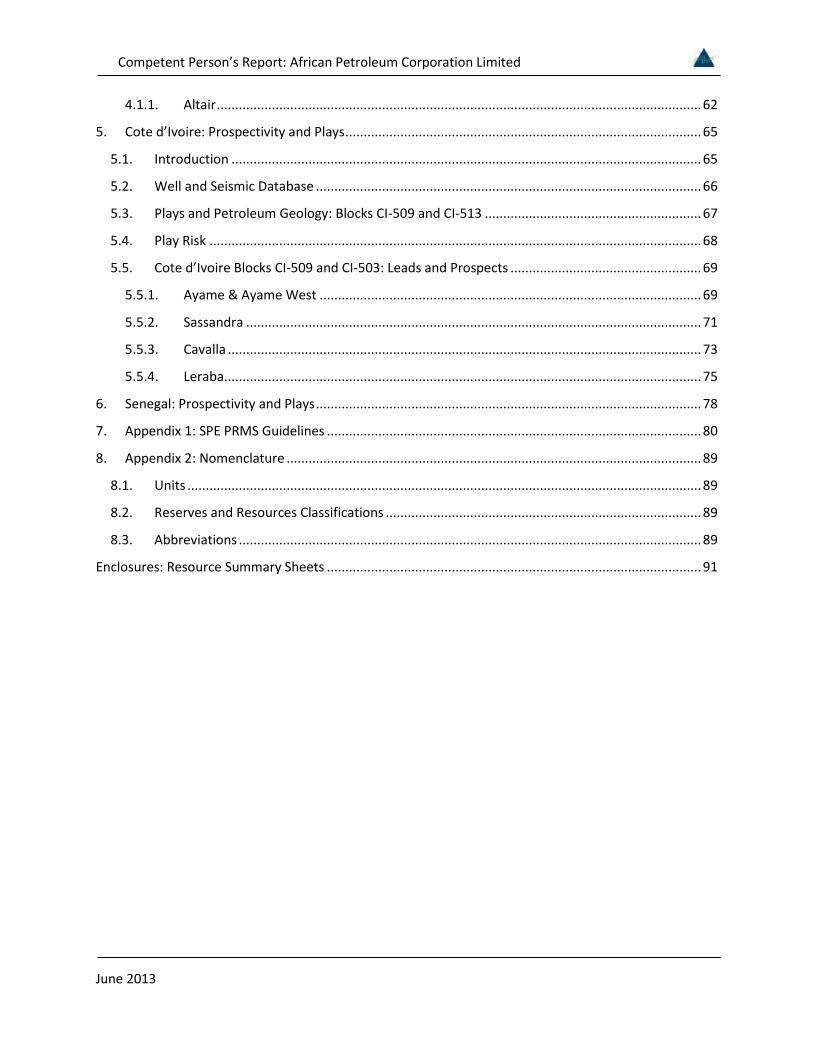
Competent Personrsquos Report African Petroleum Corporation Limited
June 2013
411 Altair 62
5 Cote drsquoIvoire Prospectivity and Plays 65
51 Introduction 65
52 Well and Seismic Database 66
53 Plays and Petroleum Geology Blocks CI-509 and CI-513 67
54 Play Risk 68
55 Cote drsquoIvoire Blocks CI-509 and CI-503 Leads and Prospects 69
551 Ayame amp Ayame West 69
552 Sassandra 71
553 Cavalla 73
554 Leraba 75
6 Senegal Prospectivity and Plays 78
7 Appendix 1 SPE PRMS Guidelines 80
8 Appendix 2 Nomenclature 89
81 Units 89
82 Reserves and Resources Classifications 89
83 Abbreviations 89
Enclosures Resource Summary Sheets 91
Competent Personrsquos Report African Petroleum Corporation Limited
June 2013
List of Tables Table 11 Licence Summary Table 15 Table 12 Estimated oil recovery factors from producing Atlantic Margin fields 24 Table 13 Play and prospect risk system 24 Table 21 Play risk Cretaceous carbonate play Liberia Blocks 8 and 9 32 Table 31 Play risk Gambia Blocks A1 and A4 52 Table 41 Play risk Sierra Leone Block SL-03 62 Table 51 Play risk Cote drsquoIvoire Blocks CI-509 and CI-513 68
Competent Personrsquos Report African Petroleum Corporation Limited
June 2013
List of Figures Figure 1-1 Location of APCL licences West Africa 14 Figure 1-2 Location of Liberia Blocks 8 and 9 16 Figure 1-3 Location of Gambia Blocks A1 and A4 17 Figure 1-4 Location of Senegal ROP and SOSP Licences 18 Figure 1-5 Location of Blocks SL-03 and SL-04A 20 Figure 1-6 Location of Blocks CI-509 and CI-513 21 Figure 2-1 Notable discoveries West Africa offshore 27 Figure 2-2 Well and seismic database Liberia Blocks 8 and 9 28 Figure 2-3 Petroleum systems and plays Liberia Blocks 8 and 9 30 Figure 2-4 Porositydepth trend published West Africa turbidite reservoirs 31 Figure 2-5 Leads and Prospects Liberia Blocks 8 and 9 33 Figure 2-6 Seismic line (depth) over the Barbet prospect 34 Figure 2-7 Barbet far offset amplitudes with Top Turonian depth contours (m TVDSS) 35 Figure 2-8 Regional seismic line along axis of the Sunbird canyon system 36 Figure 2-9 Sunbird Campanian far offset amplitudes with Cenomanian depth contours (m TVDSS) 37 Figure 2-10 Sunbird Turonian far offset amplitudes with Top Turonian depth contours (m TVDSS) 38 Figure 2-11 Sunbird Cenomanian far offset amplitudes with Cenomanian depth contours (m TVDSS) 39 Figure 2-12 Arbitrary line across Night Heron PSDM (Depth m) 40 Figure 2-14 SNA from Basin Floor Fan Isopach (m) - PSDM 41 Figure 2-15 Seismic line over the Lovebird prospect 42 Figure 2-16 Lovebird prospect Top Pink horizon depth (mss) high case 43 Figure 2-17 Seismic line and prospect geo-seismic sketch Wildbird prospect 45 Figure 2-18 Wildbird Top Reservoir depth map (m TVDSS) Spill point - green contour 46 Figure 3-1 Plays Gambia Blocks A1 and A4 47 Figure 3-2 Wells 2D and 3D seismic data (red outline) Gambia Blocks A1 and A4 48 Figure 3-3 Well to seismic tie ndash Well Jammah-1 to the Alhamdulilah prospect 50 Figure 3-4 Leads and prospects identified by APCL in Gambia Blocks A1 and A4 53 Figure 3-5 Seismic line over the Alhamdulilah prospect 54 Figure 3-6 Area of closure Alhamdulilah prospect layers SS1 to SS4 55 Figure 3-7Alhamdulilah prospect seismic facies interpretation Cretaceous intervals 56 Figure 3-8 Seismic line through Prospect M 57 Figure 3-9 Low and high case closure Prospect M top Aptian depth (m TVDSS) 58 Figure 4-1 Offshore licences and discoveries Liberia and Sierra Leone 59 Figure 4-2 Well and seismic database offshore Sierra Leone 60 Figure 4-3 Leads Sierra Leone Block SL-03 61 Figure 4-4 Dip seismic line (full offsets) Altair prospect 63 Figure 4-5 Seismic amplitude (gradient stack) and Top Turonian depth (m TVDSS) Altair prospect 64 Figure 5-1 CI-509 and CI-513 Prospects and Leads offshore Cote drsquoIvoire 65
Competent Personrsquos Report African Petroleum Corporation Limited
June 2013
Figure 5-2 Petroleum systems and plays offshore Cote drsquoIvoire 66 Figure 5-3 Well and seismic database offshore Sierra Leone 67 Figure 5-4 Strike Line Ayame and Ayame West prospects 69 Figure 5-5 Ayame Seismic amplitude (gradient stack) and Top Turonian depth (m TVDSS) 70 Figure 5-6 Dip seismic line Sassandra prospect 71 Figure 5-7 Sassandra prospect Seismic amplitude and Top Turonian depth (m TVDSS) 72 Figure 5-8 Dip seismic line Cavalla prospect 74 Figure 5-9 Seismic amplitude (gradient stack) and Top fan depth (m TVDSS) Cavalla prospect 75 Figure 5-10 Dip seismic line Leraba prospect 76 Figure 5-11 Seismic amplitudes Leraba prospect 77 Figure 6-1 Petroleum systems and plays offshore Senegal 78 Figure 6-2 leads offshore Senegal Blocks ROP and SOSP 79
Competent Personrsquos Report African Petroleum Corporation Limited
June 2013 14
1 Introduction
At the time of writing African Petroleum Corporation Limited (APCL) holds interests in and operates exploration licences offshore West Africa within the territorial waters of Senegal the Gambia Sierra Leone Liberia and Cote drsquoIvoire (Figure 1-1) The status of these licences is summarised in Table 11 below ERC Equipoise Ltd (ERCE) has reviewed the prospectivity of these licences using data as of 31st May 2013
Figure 1-1 Location of APCL licences West Africa
Currently prospective resources are identified by APCL within the Liberia Gambia Sierra Leone and Cote drsquoIvoire licences We have made independent estimates of prospective resources and geological chance of success for certain prospects within these countries which are identified by APCL as near-term drilling opportunities The evaluation of the offshore Senegal licences is on-going and no prospects have been identified as of the date of this report We summarise qualitatively the prospectivity of the licences held by APCL in this country
Competent Personrsquos Report African Petroleum Corporation Limited
June 2013 15
Country Block Licence
Operator APCL () Status
Licence
Area (km2)
Outstanding Commitment in this Phase
Start of Current Phase
End of Current Phase
Liberia 8 APCL 100 Expl June 2012
June 2014
2717 Two
Exploration wells
Liberia 9 APCL 100 Expl June 2012
June 2014
2634 None
Gambia A1 APCL 60 Expl Dec
2007 Dec
2013 1296
One Exploration
well 1
Gambia A4 APCL 60 Expl Dec
2007 Dec
2013 1376 (see A1)
Senegal Rufisque Offshore Profond
APCL 90 Expl Oct
2011 Oct
2015 10357
One exploration
well
Senegal
Senegal Offshore
Sud Profond
APCL 90 Expl Oct
2011 Oct
2014 7920 None
Sierra Leone
SL-03 APCL 100 Expl Feb
2011 Feb
2014 3860 None
Sierra Leone
SL-04A APCL 100 Expl Sept 2012
Sept 2015
1995 One
exploration well 2
Cote drsquoIvoire
CI-509 APCL 90 Expl March 2012
March 2015
1091 One
exploration well
Cote drsquoIvoire
CI-513 APCL 90 Expl Dec
2011 Dec
2014 1446
One exploration
well
1) Transferrable to Block A4 if necessary 2) Contingent on results of 3D and that technology is available to drill in such water depths
Table 11 Licence Summary Table
Competent Personrsquos Report African Petroleum Corporation Limited
June 2013 16
11Liberia PSC Overview
APCL holds a 100 contractor interest in a Production Sharing Contract (ldquoPSCrdquo) covering Blocks 8 amp 9 offshore Liberia (Figure 1-2) Both blocks are in their second exploration period which began on 12th June 2012 and lasts for two years Commitments during the second phase in Block 8 are two exploration wells (to a minimum depth of 2000 meters) as a well commitment from the first exploration phase has been carried into the second phase All commitments have been met for the second phase in Block 9 with the drilling of Well Bee Eater-1 The minimum spend for each block in the second exploration period is US$ 10 MM At the end of this second phase a further 25 of each licence must be relinquished
Figure 1-2 Location of Liberia Blocks 8 and 9
For each block there is one further optional exploration period of two years that can be entered into with an additional well (to a minimum of 2000 metres) being required in each block in each period At the end of the third period all areas not retained for appraisal and development are to be relinquished There are also provisions for an appraisal period and an exploitation period of 25 years (with an additional term of 10 years if necessary) for each development area
Competent Personrsquos Report African Petroleum Corporation Limited
June 2013 17
Following a 25 relinquishment at the end of the first exploration phase Block 8 comprises an area of 2717 km2 and Block 9 comprises 2634 km2 Water depths range from less than 100 m to over 3000 m Most of the block areas lie in water depths greater than 500 m
12Gambia PSC Review
APCL holds a 60 contractor interest in Production Sharing Contracts covering Blocks A1 and A4 offshore Gambia (Figure 1-3) with Buried Hill Gambia BV holding the remaining 40 The licences were signed on 8th September 2006 with an effective date of 31st December 2007 and following two extensions they are still currently in the first exploration period which runs through to 31 December 2013
The work commitment during the first period comprises 1000 km2 of 3D seismic data in Block A1 and 750 km2 of 3D seismic data in Block A4 and one well which may be drilled in either block The seismic commitment has already been met
There are two further optional (but automatic) exploration periods of three years each that can be entered into with a well being required in each period in each licence Furthermore in Block A1 relinquishment of 10 of the licence area is required at the end of the first exploration period and 20 at the end of the second period In Block A4 relinquishment of 10 of the licence area is required at the end of the first exploration period In both blocks at the end of the third period all areas not retained for appraisal and development are to be relinquished There are also provisions for an exploitation period with the total term of the licences being 30 years (including the exploration periods) for each development area
The area of the licence is 1296 km2 for Block A1 and 1376 km2 for Block A4 Water depths vary from 500 m to over 3000 m
Figure 1-3 Location of Gambia Blocks A1 and A4
Competent Personrsquos Report African Petroleum Corporation Limited
June 2013 18
13Senegal PSC Review
APCL holds a 90 contractor interest in Exploration and Production Sharing Contracts (EPSC) covering Blocks Rufisque Offshore Profond (ROP) and Senegal Offshore Sud Profonde (SOSP) offshore Senegal (Figure 1-4) via its wholly owned subsidiary African Petroleum Senegal Limited Petrosen the state oil company hold a 10 carried interest
The EPSC governing block SOSP has an effective date of 25th October 2011 The first 85 years of the EPSC are termed the exploration phase which is subdivided into an initial period of three years with two subsequent extension periods of three and two and a half years each Work commitment in the initial exploration period is to acquire and reprocess the existing seismic data within the licence area and also to acquire a further 2500 km2 of 3D seismic data all with a minimum investment of US$ 10 MM The two extension periods have a commitment of one exploration well to a minimum depth of 3500 mss in each period or a minimum investment of US$ 20 MM Entry to the first extension period requires a 30 relinquishment of the licence area and a further 20 of the initial licence area must be relinquished on entry to the third phase The area of the licence is currently 7920 km2 Water depth is between 1000 and 4000 m over the block
Figure 1-4 Location of Senegal ROP and SOSP Licences
Competent Personrsquos Report African Petroleum Corporation Limited
June 2013 19
The EPSC governing Block ROP is of similar structure to that governing Block SOSP It has an effective date of 25th October 2011 The first eight years of the EPSC are termed the exploration phase which is subdivided into an initial period of four years with two subsequent extension periods of two years each Work commitment in the initial exploration period is to acquire the existing seismic data within the licence area for a minimum of US$ 2 MM and drill one exploration well to a minimum depth of 3500 m TVDSS or a minimum investment of US$ 20 MM The two extension periods have a further commitment of one exploration well to a minimum depth of 3500 m TVDSS in each period or a minimum investment of US$ 20 MM Entry to the first extension period requires a 30 relinquishment of the licence area and a further 20 of the initial licence area must be relinquished on entry to the third period The area of the licence is currently 10357 km2 Water depth is between 1500 and 3000 m over the block
APCL has met the seismic commitment of the first exploration period
Petrosen has a back-in right if an exploitation period is authorised for up to 20 of the licence subject to contribution of its share of forward costs (excluding training) The duration of an exploitation period is 25 years from authorisation with option for two ten year extensions at the discretion of the state
14Sierra Leone PSC Review
APCL holds a 100 contractor interest in a PSC covering Block SL-03 offshore Sierra Leone (Figure 1-5) through its wholly owned subsidiary European Hydrocarbons Ltd The licence was awarded on 23rd April 2010 and ratified on 22nd February 2011 APCL also holds a 100 contractor interest in a PSC covering Block SL-04A through its wholly owned subsidiary African Petroleum Sierra Leone Ltd The PSC governing Block SL-04A was ratified on 21st September 2012
The SL-03 licence has a duration of thirty years the first seven of which are termed the exploration period which is further subdivided into an initial period of three years followed by two extension periods of two years each The licence is currently in the initial exploration period
Work commitments during the initial period for Block SL-03 are to purchase and interpret the existing 2D seismic data over the licence and acquire a minimum of 500 km2 of 3D seismic data APCL has purchased the 2D seismic data and has acquired 2535 km2 of multi-client 3D seismic data over Block SL-03 fulfilling the seismic commitment for the initial phase The first and second extension periods require the drilling of one exploration well to a minimum depth (below mud line) of 1300 m or a minimum equivalent investment of US$ 30 MM Entry to the first extension period requires a 50 relinquishment of the licence area and a further 25 of the initial licence area must be relinquished on entry to the second extension period The area of the licence is 3860 km2 and water depth varies from 100m to over 4000m with the south-western half of the block being at water depths greater than 3000m
Competent Personrsquos Report African Petroleum Corporation Limited
June 2013 20
Figure 1-5 Location of Blocks SL-03 and SL-04A
The PSC covering Block SL-04A was ratified on 21st September 2012 The licence term is for thirty years the first seven years of which are defined as the exploration period which is further subdivided into an initial period of three years and two subsequent periods of two years Each well drilled in the initial exploration period extends this period by three months Work commitments during the initial phase are to acquire at least 1500 km2 of 3D seismic data and drill one exploration well (to a minimum depth of 2500m) contingent on the results of the 3D and the availability of drilling technology for such deep water The minimum equivalent investment is US$ 10 MM In 2011 TGS acquired 1085 km2 of multi-client 3D seismic data over Block SL-04A Upon licencing these data APCL will have fulfilled the seismic commitment for the initial phase
The subsequent two exploration periods require the drilling of one exploration well in each period (to a minimum depth of 2500 m) or a minimum investment of US$ 50 MM Entry to the second period requires a 50 relinquishment of the licence area and a further 25 of the initial licence area must be relinquished on entry to the third phase The area of the licence is currently 1995 km2 Water depth is between 3000 and 4000 m over the block
Competent Personrsquos Report African Petroleum Corporation Limited
June 2013 21
The state retains the right to a 10 carried interest during any development phase in both licences with the option to acquire a further 5 by covering an equivalent proportion of any development costs
15Cote13 drsquoIvoire13 PSC13 Review
APCL holds a 90 per cent contractor interest in two PSCs governing Block CI-509 and Block CI-513 offshore Cote drsquoIvoire (Figure 1-6) via its wholly owned subsidiary African Petroleum Cote drsquoIvoire Limited The state oil company Petroci has a 10 carried interest
Figure 1-6 Location of Blocks CI-509 and CI-513
The PSC for Block CI-509 was awarded on 16th March 2012 The first eight years of the PSC are termed the exploration period which is further divided into three terms of three three and two years respectively The licence is currently in its first exploration term Work commitments during the first exploration term are to purchase the existing 2D seismic data acquire 1091 km2 (ie a block wide) 3D seismic survey and drill one exploration well at least 100 m into the Albian (Lower Cretaceous) section The minimum investment is US$ 60 MM The second and third terms have a further commitment to drill one exploration well to at least 100 m into the Albian (Lower Cretaceous) section with a minimum investment of US$ 50 MM Entry to the second term requires a 25 relinquishment of the licence area and a further 25 of the initial licence area must be relinquished on entry to the third term The area of the licence is currently 1091 km2 Water depth is between 1900 and 3250 m over the block
Competent Personrsquos Report African Petroleum Corporation Limited
June 2013 22
The PSC covering Block CI-513 has an effective date of 19th December 2011 It has a similar structure to that governing Block CI-509 The first seven years are termed the exploration period subdivided into three terms of three two and two years The licence is currently in its first exploration term Work commitments during the first exploration term are to purchase the existing 2D seismic data acquire 1446 km2 (ie a block wide) 3D seismic survey and drill one exploration well at least 100 m into the Albian (Lower Cretaceous) section The minimum investment is US$ 60 MM The second and third terms have a further commitment to drill one exploration well to at least 100 m into the Albian (Lower Cretaceous) section with a minimum investment of US$ 50 MM Entry to the second term requires a 25 relinquishment of the licence area and a further 25 of the initial licence area must be relinquished on entry to the third term The area under licence is currently 1446 km2 Water depth is between 900 and 3100 m over the block
The exploitation period of both licences is for 25 years subject to successful award in the event of a commercial discovery On development Petroci has the right to acquire an interest of up to 20 in each licence subject to payment of its portion of future costs
In October 2012 APCL completed acquisition of 4200 km2 of 3D seismic data covering blocks CI-508 CI-509 and CI-513 fulfilling the seismic work commitments of the first exploration phase of both PSCs APCL is planning a two well drilling programme for the licences during 2014
16Evaluation Methodology Prospective Resources
We have used probabilistic methods to evaluate selected prospects within Liberia Blocks 8 and 9 Gambia Blocks A1 and A4 Sierra Leone Block SL-03 and Cote drsquoIvoire Blocks CI-513 and CI-509 We classify the results of our simulation as Low Best and High estimates of prospective resources following the Petroleum Resources Management System or PRMS (Appendix 1) We have assigned geological chance of success to each of the prospects using the methodology described below Estimates are made for oil only although we recognise that due to the significant uncertainties in the available geological information that there is a possibility of gas charge in all licences We present a summary of input estimates output STOIIP and gross resources and geological chance of success as a resource summary sheet for each prospective interval investigated These can be found in the enclosures 11 to 45 in this document
Inputs to our probabilistic simulation are evaluated in a consistent manner For the structurally trapped prospective intervals in Liberia (the Lovebird and Wildbird prospects) and the Alhamdulilah prospect in Gambia we have made a low and high deterministic estimate of closing contour for each trap to reflect the uncertainty in both mapping and depth conversion For Liberia we use the gross-rock volume (GRV) derived in this manner to constrain the P90 and P10 of our GRV distribution in our probabilistic simulation For Gambia we have used the areal extents of the low and high cases as inputs to an area times net calculation
Competent Personrsquos Report African Petroleum Corporation Limited
June 2013 23
For the stratigraphically trapped prospects in Liberia (Barbet Night Heron and Sunbird) Cote drsquoIvoire (Sassandra Ayame Ayame West Cavalla and Leraba) and Sierra Leone (Altair) we have made low and high estimates of area of closure using both structural and amplitude support where possible We have then made low and high estimates of gross reservoir thickness derived from regional observations calibrated against seismic data where possible As such depositional systems also have laterally variable sand distributions often supported by seismic data we employ the concept of an areal net to gross ratio varying the percentage of sand areally within the overall stratigraphic trap based on the uncertainty in seismic amplitude strength Where appropriate a geological shape factor is used depending on trap shape and structural relief relative to reservoir thickness
Estimates of reservoir porosity and net to gross ratio are made with reference to regional data offset wells including recent drilling by APCL in Liberia and account for compaction and a degree of overpressure (Figure 2-4) We make low mid and high deterministic estimates and use these to constrain the P90 P50 and P10 inputs to a probabilistic simulation Inputs for hydrocarbon saturation are constrained in a similar manner with reference to regional porosity and permeability trends calibrated to APCLrsquos recent drilling results in Liberia
We have estimated oil formation volume factors for a range of gas oil ratios (GOR) (from an appropriate minimum to fully saturated) for each of the prospective intervals assuming 4oC at the mudline (seabed) and geothermal gradients between 25 and 35oC per 100 m consistent with regional observation and the available well data We assume that the minimum GOR will increase with depth below the mudline Our estimates are calibrated against the oil samples in Well Narina-1 when estimating resources for the Liberian prospects
Some degree of overpressure is accounted for as it has been in our estimates of porosity but by reference to offset discoveries we assume that it is unlikely to exceed 500 psi over the depth range investigated
Recovery factors for the clastic reservoirs are estimated with reference to published information from discoveries in similar reservoir types examples of which are tabulated below (Table 12) Based on this table we estimate low best and high recovery factors of 30 375 and 45 respectively Again these are used to constrain the P90 P50 and P10 of our input distribution during probabilistic simulation
Some prospects are deep relative to mud line and we expect reservoir quality to be reduced despite overpressure We reduce our recovery factor estimates accordingly where this is the case Some prospects are relatively shallow to mud line Where this is the case we model a more viscous oil (prospects materially less than 1500m below sea bed) and have reduced our low best and high recovery factor range to 15 275 and 40 respectively In all cases we assume that a development is able to effectively dispose of any associated gas
Recovery factors for the carbonate reservoirs of the Wildbird prospect in Liberia and Prospect M in the Gambia are estimated by reference to more regional analogues and are discussed in the relevant sections
Competent Personrsquos Report African Petroleum Corporation Limited
June 2013 24
Due to the early stage of exploration within APCLrsquos licences we have adopted a six component risk matrix in all areas barring Liberia to estimate geological chance of success (COS) separated into play and prospect specific risks (Table 13) We have adopted this form of presentation of COS to reflect the fact that deep water exploration in much of the West African Atlantic Margin is at a very early stage and also that a number of the identified prospects have risk dependence and thus can be grouped as a play
Table 12 Estimated oil recovery factors from producing Atlantic Margin fields
PLAY RISK PROSPECT RISK
SOURCE RESERVOIR SEAL TRAP CHARGE RESERVOIR (Presence and Maturity) (Presence) (Presence) (Definition and Efficacy) (Migration) (Efficacy) Incorporates trap definition and seal risk (including biodegradation risk where necessary)
Table 13 Play and prospect risk system
The play risk segment focuses solely on the elements required in a given play to make a hypothetical prospect successful source reflecting the presence and thermal maturity of available source rocks with sufficient generation and expulsion to charge prospects reservoir reflecting the presence regionally of geological intervals that could potentially contain reservoir rock and seal ndash the regional presence of a sealing formation with sufficient thickness and extent to trap hydrocarbons
Prospect risk is divided into three elements Commonly we present seal and trap risk combined as an overall illustration of the integrity of the container here labelled trap risk Charge risk reflects the risk to migration of hydrocarbons from the source rock into the prospect and reservoir risk reflects solely the efficacy (ie porosity and permeability) of any identified reservoir interval
Note that a successful well on a given prospect may reduce or remove the play risk should the well prove reservoir charge and seal in a given play This will have the effect of de-risking further prospects associated with that play
Country Field Start Date Np Max Water Depth Prod Ult
RecoveryRec
FactorRecovery
Prod STOIIP
(MMstb) (m) (MMstb) (MMstb) (MMstb)Eq Guinea Ceiba Nov-00 112 800 18 187 40 10 468Eq Guinea Zafiro Aug-96 652 850 62 1583 40 26 4008Angola Girassol Dec-01 332 1360 32 958 45 30 2129Angola Kuito Dec-99 133 410 36 650 46 18 1413Brasil Espadarte Aug-00 67 877 10 261 31 26 842Brasil Marlim Mar-91 1720 853 101 2878 33 28 8721Total 259 6517 17580Average - Arithmetic 39 23Average - Weighted by STOIIP Ult Rec 37 25
Low Best High30 375 45
Fields on Atlantic Margin with significant production
Hence RF Range
Competent Personrsquos Report African Petroleum Corporation Limited
June 2013 25
Recent drilling within Liberia Blocks 8 and 9 has de-risked the play As a result we adopt prospect specific risking alone as source reservoir trap and seal with the same definitions as described above (Table 13)
Competent Personrsquos Report African Petroleum Corporation Limited
June 2013 26
2 Liberia Prospectivity and Plays
21Introduction
All of the available deep-water acreage offshore Liberia-Sierra Leone basin is under licence (Figure 1-2) Regionally hydrocarbons have been discovered within sandstones at a number of stratigraphic levels from the pre-rift to early syn-rift Albian in Cote drsquoIvoire (Espoir Foxtrot fields and a number of other discoveries) to turbiditic sandstones that have Late Cretaceous (CenomanianTuronian MaastrichtianConiacian) to early Tertiary (Palaeocene to Eocene) ages Recent drilling offshore Ghana has yielded a number of discoveries within these Upper Cretaceous sandstones such as the Jubilee oil field and the Enyenra Tweneboa and Odum oil and gascondensate discoveries In the Liberia-Sierra Leone basin recent drilling has yielded six hydrocarbon discoveries (Bee Eater Narina Monterrado Mercury Venus and Jupiter) but as yet none has been declared commercial (Figure 2-1) Although reservoir quality in the Albian sandstones is variable reservoir quality in the Upper Cretaceous and Tertiary sandstones is often good Successful trap types encountered regionally are both structural and stratigraphic
Of significance to the evaluation of the petroleum systems of Blocks 8 and 9 APCL have drilled three wells within the deeper water parts of the blocks Wells Apalis-1 Narina-1 and Bee Eater-1 Well Apalis-1 found source rock intervals of Albian to Cenomanian age but failed to find the prognosed reservoir Well Narina-1 found light oil within deep-marine sandstones of Cretaceous age The sandstones were of variable reservoir quality as the well appears to have been drilled on the edge of a fan system which can be interpreted from seismic data The extent of the Turonian hydrocarbon bearing interval around Well Narina-1 is currently under investigation by APCL who are working with CGGV to reprocess the 3D multi-client seismic with the hope of identifying areas of favourable reservoir within closure
Well Bee Eater-1 completed in February 2013 also discovered hydrocarbons within similar sandstones of Cretaceous age However the oil bearing Turonian reservoir at Bee Eater is interpreted as being of very low permeability and hence non-commercial APCL interprets that Well Bee Eater-1 was drilled in a canyon system that may have been largely bypassed by sediment input
Both wells demonstrate the viability of Cretaceous petroleum systems within the licence area
Competent Personrsquos Report African Petroleum Corporation Limited
June 2013 27
Figure 2-1 Notable discoveries West Africa offshore
22Well and Seismic Database
Exploration offshore Liberia is at an early stage To date five wells have been drilled in the deeper water areas in 2011 and 2012 with historical exploration drilling (up to 1985) restricted to the more shelfal areas (Figure 2-2) Data from two of these shallow water wells Wells S3-1 and Cestos-1 were made available to us for this evaluation Well S3-1 encountered oil shows in sandstones of Late Cretaceous age
GhanaJubilee Field on
production development of TEN area discoveries
new Hess deepwater discoveries
Cote drsquoIvoireShallow water production
recent discoveries in deepwater Turonian
reservoirs
LiberiaOil discoveries in
Cretaceous deepwater reservoirs at Narina
Monserrado
Sierra LeoneVenus Mercury and Jupiter
oil and condensate discoveries in deepwater
reservoirs
Guinea-COil shows in
offshore wells
Guinea-BSinapa oil discovery
planned appraisal
AGCDome Flore area heavy oil
discoveries under development review
SenegalOnshore gas and condensate production Recent onshore
Turonian discovery
MauritaniaChinguetti Field
production other oil and gas discoveries under development review
Competent Personrsquos Report African Petroleum Corporation Limited
June 2013 28
Figure 2-2 Well and seismic database Liberia Blocks 8 and 9
APCL has drilled three exploration wells offshore Liberia in the deep water part of Block 9 Wells Narina-1 Bee Eater 1 and Apalis-1 (Figure 1-2 Figure 2-2) Well Apalis-1 was drilled in 2011 targeting a four-way dip-closed structure with possible AvO support The well found traces of hydrocarbons plus source rock intervals but the prognosed reservoir sands were absent at target depth and the well was plugged and abandoned
Well Narina-1 was drilled by APCL in 2012 and found 16 to 21 m of net pay (light oil) within sandstones of Turonian (Cretaceous) age Hydrocarbons were also discovered in the underlying Albian Oil samples were collected but no drill-stem testing was undertaken Analysis of the oil samples indicates an API
3D Seismic Area
Competent Personrsquos Report African Petroleum Corporation Limited
June 2013 29
gravity for the Turonian oil of about 38 degrees and about 45 degrees for the Albian hydrocarbons Mobilities from formation pressure measurements and permeability from side-wall core measurements show the reservoir to be of relatively low permeability at this location
Well Bee Eater-1 was drilled by APCL in January and February 2013 The well found oil-bearing sandstones of Cretaceous age but of very low permeability and hence the well is considered non-commercial Post-drill interpretation of the seismic data has helped APCL revise the depositional model for this Turonian fan system The Bee Eater-1 well is interpreted to have encountered a bypass zone in both the Turonian and Cenomanian with immature sandstones that are poorly sorted and tight Post-well mapping of key seismic events tied to Well Bee Eater-1 reveals the possibility of finding better quality sandstones in lsquobasin-floor fanrsquo units down-dip Potentially sealing shale units and source rock units were also found in the Bee-Eater-1 well
Well Apalis-1 and in particular Wells Bee Eater-1 and Narina-1 help de-risk seal and hydrocarbon charge for the Cretaceous play on-block
The primary seismic dataset for our evaluation was the recently acquired 5170 km2 of 3D seismic data over the deeper water area of Blocks 8 and 9 including certain products to review amplitude versus offset (AvO) effects These seismic data cover both recently drilled deep water wells In addition a grid of 2D seismic data was also made available with average line spacing of around 45 km These data provide a tie to Well S3-1 although the well lies some 200m from the nearest seismic line In general the data quality of the 3D volume is good and of suitable fidelity to enable us to undertake our review of identified prospectivity However local complexity in the shallow geology causes the signal to degrade considerably at the prospective levels in certain areas APCL are currently reprocessing these data in an attempt to improve signal quality APCL intend to utilise this dataset to update the CPR in the next 3-6 months It is hoped that these data will support maturation of additional prospects and further clarification of risk and volumes for prospects within this CPR
23Plays and Petroleum Geology Blocks 8 and 9
APCL has identified a number of plays within Blocks 8 and 9 at similar stratigraphic levels to those proven successful elsewhere along the West African margin (Figure 2-3) Recent drilling within Blocks 8 and 9 has demonstrated a working petroleum system within the mid to lower Cretaceous with drilling finding light oil within deep marine sandstones of Turonian age and also in sandstones of Albo-Aptian age
Competent Personrsquos Report African Petroleum Corporation Limited
June 2013 30
Figure 2-3 Petroleum systems and plays Liberia Blocks 8 and 9
Structural traps are identified at the pre-rift to early syn-rift (Albian) level as tilted fault blocks with hydrocarbons sourced from the Albian or Lower Cretaceous source rocks and seal provided by post-rift mud drape Structural and stratigraphic traps are also identified at several potential reservoir levels within the Late Cretaceous and Lower Tertiary again potentially sourced from the Turonian and or Albian source rocks Traps are sealed by coeval marine shales and muds As is encountered regionally there is reasonable seismic evidence for the presence of reservoir bearing intervals within the Upper Cretaceous and Early Tertiary section and this seismic evidence has been used in trap definition
The most significant play in the area is that of Cenomanian to Turonian age deep-marine channel-fan systems as structural and stratigraphic traps In addition an emerging lower Cretaceous microbial carbonate reservoir play has been identified sourced from coeval lacustrine source rocks and sealed by shales deposited during the subsequent drowning of the lacustrine systems by the onset of significant subsidence and marine inundation later in the Cretaceous We have evaluated prospects within both of these play systems Prospectivity in the shallower Cretaceous and Tertiary intervals is still being re-evaluated by APCL as of the date of this report and no leads have been matured to prospect status
Oil show Cestos-1
Competent Personrsquos Report African Petroleum Corporation Limited
June 2013 31
Figure 2-4 Porositydepth trend published West Africa turbidite reservoirs
24Play and Prospect Risk Liberia Blocks 8 and 9
Of the prospects reviewed all but the Wildbird prospect fall within the Cenomanian to Turonian channelfan play In our opinion recent drilling has de-risked source and reservoir presence for this play However reservoir quality in recent wells is variable In our risking of Cenomanian to Turonian prospectivity (Barbet Sunbird Lovebird and Night Heron prospects) we have removed the play element to our risking matrix and see a low risk to hydrocarbon charge for individual prospects Key risk is therefore to trap integrity and reservoir quality We use a four component risk matrix as outlined in Section 16 to define geological chance of success for these prospects
The Wildbird prospect has been recently identified by APCL as part of its review of further play fairways within the Liberian licences The play concept is of early Aptian bio-constructed carbonate build-ups within the restricted lacustrine environment that existed at this time Porosity and permeability within the bioclastic microbial limestones is potentially enhanced by hydrothermal activity resulting from the early rifting Later post-rift subsidence and drowning by marine conditions provides the top seal via the
0
500
1000
1500
2000
2500
3000
3500
4000
0 01 02 03 04m
Bel
ow S
eabe
dPorosity (fraction)
Porosity versus Depth Trend
Regional West AfricaTurbidite Data
Competent Personrsquos Report African Petroleum Corporation Limited
June 2013 32
deposition of Cretaceous marine muds It is envisaged that the play is charged or by Aptian source rocks deposited in the offset lagoonal facies with possible charge from later (but on-lapping) Cretaceous marine source rocks (as other plays on the blocks) Both potential source rocks provide lateral seal (Figure 2-16) Regionally lacustrine microbial carbonate reservoirs can be found in Congo and Angola where there is some production but also in the Campos and Santos basins in Brazil
The microbial carbonate play is emerging within Blocks 8 and 9 and has not been demonstrated to be effective by drilling We adopt the play and prospect risking as discussed in Section 16 to risk the Wildbird prospect as a result discounting biodegradation risk as the prospect is at significant depth Our estimate of play risk for the Cretaceous microbial carbonate play is summarized in below
PLAY Source Reservoir Presence Seal Play
Risk Cretaceous Carbonate 08 06 05 20
Table 21 Play risk Cretaceous carbonate play Liberia Blocks 8 and 9
Competent Personrsquos Report African Petroleum Corporation Limited
June 2013 33
25Liberia Blocks 8 and 9 Leads and Prospects
Following the drilling of Wells Narina-1 and Bee Eater-1 APCL is re-evaluating the prospectivity within Blocks 8 and 9 and has developed a number of potential traps (Figure 2-5) several of which (marked in orange Figure 2-5) have been matured to prospect status We have assessed the prospective resources for certain of these prospects that APCL has identified as viable near-term drilling opportunities Barbet Sunbird Lovebird Night Heron and Wildbird A number of the prospects have multiple reservoir targets Our evaluation of these prospects follows the methodology described in Section 16 The results of Wells Narina-1 and Bee Eater-1 would indicate that oil charge is probable and thus only oil cases have been evaluated However as we state in Section 16 a gas charge cannot be discounted due to the uncertainties in source rock evaluation and basin modelling Input parameters STOIIP prospective resources and geological chance of success for each of the evaluated prospects are summarised in Table 1 of this report and are also presented in the resource summary sheets as Enclosures 11 to 19 of this document
Figure 2-5 Leads and Prospects Liberia Blocks 8 and 9
Competent Personrsquos Report African Petroleum Corporation Limited
June 2013 34
ʹǤͷǤͳǤ Barbet Prospect
The Barbet prospect is identified as a stratigraphic trap around 14 km to the east of and up-dip from Well Narina-1 within Block 9 (Figure 2-6) A single target reservoir is mapped within the Turonian Seismic amplitude anomalies are also identified within the area of the trap that may provide support for reservoir development The Turonian is mapped at between 3000 and 3600 m TVDSS over the area of the prospect in a water depth of around 750 to 770 m
Figure 2-6 Seismic line - depth (m TVDSS) over the Barbet prospect
We have used an areanet pay methodology to estimate prospective resources for the Barbet prospect In our low case we restrict the area of the accumulation to the brightest area of anomalous amplitudes on the far offsets Our high case extends the prospect down-dip to include a larger area of anomalous amplitudes above an observed amplitude shut-off (Figure 2-7) These are used to constrain the P90 and P10 inputs of our probabilistic simulation These polygons approximate to an oil column height of 200 and 700 m respectively
Amplitudes are variable within the area of closure and we apply an areal net to gross ratio to better constrain sand distribution within the trap Gross reservoir thickness estimates are computed from the mapped seismic interval net to gross ratio from regional analogue and porosity from a regional porositydepth trend (Figure 2-4) Fluid parameters and recovery factors are estimated as described in Section 16
Narina-1 Barbet
Top Turonian
Top Cenomanian
Top Albian
Lwr Turonian (BFF)
Top Turonian
Narina-1
Apalis-1
Albian UC
0 km 2(mss)
W E
Competent Personrsquos Report African Petroleum Corporation Limited
June 2013 35
Figure 2-7 Barbet far offset amplitudes with Top Turonian depth contours (m TVDSS)
We have used the prospect risk matrix presented in Section 16 to determine the geological chance of success for the Barbet prospect Key risk to the Barbet prospect is to trapcontainment as the trap requires pinch-out of the reservoir in three directions to seal There is also a subsidiary risk to reservoir as the Turonian reservoir encountered in Well Narina-1 is of relatively poor quality which is countered by seismic evidence over the prospect to support reservoir development As a result we attribute a geological chance of success of 22 to the Barbet prospect
metres
P10
P90metres
APALIS-1
Competent Personrsquos Report African Petroleum Corporation Limited
June 2013 36
ʹǤͷǤʹǤ Sunbird Canyon Prospect
The Sunbird canyon prospect is also identified as a stratigraphic trap around 5 km to the south of Well Apalis-1 within Blocks 8 and 9 mapped as a large canyon system There are three potential reservoir targets within the prospect within the Campanian the Turonian (as encountered in Well Narina-1) and in the underlying Cenomanian Reservoir is prognosed at between 3000 m TVDSS and 3600 m TVDSS in a water depth of around 1300 m
Figure 2-8 Regional seismic line along axis of the Sunbird canyon system
We have used an areanet pay methodology to estimate prospective resources for the Sunbird canyon prospect At all three prospective layers the prospect divides into two discrete lsquocanyonsrsquo separated by an intra-basinal high (eg Figure 2-9) For the Campanian and Turonian prospective intervals in the low case we restrict the area of the accumulation to the brightest area of anomalous amplitudes on the far offsets in the northerly of the two canyons where amplitude response is better Our high case extends the prospect down-dip to include a larger area of anomalous amplitudes above an observed amplitude shut-off and also includes the southerly of the two canyons as this would now be in charge communication The low and high case polygons approximate to an oil column height of 200 m and 600 m respectively
Albian uc
LB-08LB-09
LB-08
LB-09
Albian UC
Sunbird
0 km 4
NESW
Competent Personrsquos Report African Petroleum Corporation Limited
June 2013 37
For the deeper Cenomanian the prospect is mapped as a single canyon to the south of the intra-basinal high The low and high case polygons approximate to an oil column height of 200 m and 700 m respectively Our low and high estimates of area are used to constrain the P90 and P10 of our probabilistic simulation
Figure 2-9 Sunbird Campanian far offset amplitudes with Cenomanian depth contours (m TVDSS)
Amplitudes are variable within the area of closure and we apply an areal net to gross ratio to better constrain sand distribution within the trap for all three prospective layers Gross reservoir thickness estimates are computed from the mapped seismic interval net to gross from regional analogue and porosity from the observed porositydepth trend (Figure 2-4) Fluid parameters and recovery factors are estimated as described in Section 16
metres
P90
P10
Block 9
Block 8
APALIS-1
Competent Personrsquos Report African Petroleum Corporation Limited
June 2013 38
Figure 2-10 Sunbird Turonian far offset amplitudes with Top Turonian depth contours (m TVDSS)
We have used the prospect risk matrix presented in Section 16 to determine the geological chance of success for the three prospective intervals of the Sunbird prospect Key risk to all three prospective layers is to trapcontainment as the trap requires pinch-out of the reservoir in three directions to seal There is also a subsidiary risk to reservoir at the two deeper levels as the Turonian reservoir encountered in Well Narina-1 is of relatively poor quality and Cenomanian reservoirs are yet to be proven on block However there is seismic evidence for reservoir development and hence we see this risk as favourable Reservoir risk is low for the Campanian as it is developed in the offset Well Narina-1 and there is seismic evidence for reservoir presence As a result we attribute a geological chance of
P90
P10
metres
Block 9
Block 8
APALIS-1
Competent Personrsquos Report African Petroleum Corporation Limited
June 2013 39
success of 27 19 and 18 to the Campanian Turonian and Cenomanian prospective intervals of the Sunbird canyon prospect
Figure 2-11 Sunbird Cenomanian far offset amplitudes with Cenomanian depth contours (m TVDSS)
ʹǤͷǤ͵Ǥ Night Heron
Night Heron is a Turonian basin floor fan system which lies 8 Km south west of Well Bee Eater-1 It is mainly within Block 9 but extends into Block 10 It is identified as a stratigraphic trap with areal extents defined by amplitude truncation and structural pinch-out Reservoir is prognosed at between 4100 m TVDSS and 4700 m TVDSS in a water depth of around 1750 m (Figure 2-12) APCL has selected a
P90
P10
metres
Block 9
Block 8
Competent Personrsquos Report African Petroleum Corporation Limited
June 2013 40
provisional well location which lies on the 3D survey location ndash In-line 1098 X-line 6103 They are currently seeking partners to drill the Night Heron well in early 2014
Figure 2-12 Arbitrary line across Night Heron PSDM - Depth (m TVDSS)
Cenomanian reservoir potential also exists beneath the Turonian basin floor fan and work by APCL is on-going to determine prospectivity
Well Bee Eater-1 found an organic-rich Turonian shale section overlying a hydrocarbon bearing thin-bedded low permeability sandstone Another shale dominated package underlies the sandstone Although the Turonian interval is considered non-commercial for Bee Eater the prospectivity down-dip is appealing APCL interprets that the well was drilled in a canyon system that may have been largely bypassed by sediment input The 3D seismic indicates a significant thickening of this Turonian interval towards the south west and there is some amplitude support for the occurrence of a lobate fan straddling Blocks 9 amp 10
An area times net approach was adopted using the full stack PSDM depth volume to provide an SNA extraction and constrain areal extent and estimate an areal NG to account for lateral variability within the reservoir (Figure 2-13) As night Heron falls partly off block ERCE correct for this using the ratio of on-block to off-block area in reporting of net unrisked and net risked results
S NEBee EaterNight Heron
5 Km
BFF Isopach (m)
Competent Personrsquos Report African Petroleum Corporation Limited
June 2013 41
Figure 2-13 SNA from Basin Floor Fan Isopach (m) - PSDM
We have used the prospect risk matrix presented in Section 16 to determine the geological chance of success for the Turonian interval of the Night Heron prospect Recent drilling results suggest that there is a low risk to hydrocarbon charge The observations at Bee Eater-1 also indicate that shale seals are also likely at a coeval interval Reservoir is a significant risk due to the poor Turonian reservoir development in Well Bee Eater-1 The Turonian reservoir encountered in Well Narina-1 is also of relatively poor quality However there is seismic evidence on the 3D survey for a possible improvement in reservoir development over the prospective area The definition of the trap is the key risk as the seismic evidence for closurereservoir pinch-out is ambiguous over the 2D data in Block 10 There appears to be evidence of the reservoir interval thinning in the critical north westerly direction but 3D data would be required to reduce trap risk any further As a result we attribute a geological chance of success of 144 to the Night Heron prospect
3
3
SNA from BFF Isopach
Block Boundary
Competent Personrsquos Report African Petroleum Corporation Limited
June 2013 42
ʹǤͷǤͶǤ Lovebird Prospect
The Lovebird prospect is mapped as a four-way dip closure to the south of Block 8 (Figure 2-14) Three prospective layers are mapped by correlation to up-dip wells and are prognosed to be of Cenomanian age Thus as with the Sunbird canyon prospect these reservoirs are not proven on block but seismic mapping and regional geological work suggests the sands may be derived from the east via a canyon system identified in block LB-07 The three prospective intervals are termed Upper Middle and Lower or Blue Pink and Green based on horizon colour Structural relief at the Pink horizon is between 50 and 200 m depending on the estimate and thus the prospect is relatively low relief in some realisations
Figure 2-14 Seismic line over the Lovebird prospect
Lovebird
Depth (mss)
4 km
NE
Competent Personrsquos Report African Petroleum Corporation Limited
June 2013 43
Figure 2-15 Lovebird prospect Top Pink horizon depth (m TVDSS) high case
The prospect is mapped to the edge of the available 3D (Figure 2-15) which coincides with the southern boundary of Block 8 but closure can be mapped south of the 3D area on the available 2D lines Reservoir depth is prognosed at between 5000 and 5900 m TVDSS in a water depth of 2850 m at the prospect crest Thus reservoir rock if present will be at comparable depths below mud line to the Barbet prospect
We use a gross-rock volumenet to gross methodology to estimate prospective resources for the Lovebird prospect APCLrsquos evaluation of the Lovebird prospect is on-going and of the three interpreted horizons the Pink horizon is the best defined We review pick depth conversion and thickness uncertainty for this interval to generate a range of gross-rock volumes for this interval with the
m ss
metres
Block 9
Block 8
Competent Personrsquos Report African Petroleum Corporation Limited
June 2013 44
prospect full to spill (Figure 2-15) Assuming the Pink horizon provides an accurate representation of the Blue and Green horizons we then estimate gross-rock volumes for these two intervals by isopach
Reservoir thickness and net to gross ratio estimates are derived from regional analogues with reservoir porosity derived from our regional porositydepth trend (Figure 2-4) Fluid properties and recovery factors are estimated as described in Section 16 Our volumetrics are restricted to the portion of the Lovebird prospect on Block 8 We would expect a further evaluation of the prospective resources of the Lovebird prospect to occur subsequent to the completion of the APCL evaluation and the prospective resources associated with the prospect in this report may therefore be subject to change
The key risks to the Lovebird prospect are to the development of reservoir at the prognosed Cenomanian intervals as they are not proved in wells elsewhere on the block and to source as the prospect requires a source rock deeper than that proven by drilling There is also risk to trapcontainment as the structure is not fully defined by the 3D seismic data volume and is of low relief in some realisations We assign a geological chance of success to the Lovebird prospect of 20 as a result
255Wildbird Prospect
The Wildbird prospect is mapped on 3D seismic data towards the south of Block 8 as a large four-way dip-closed high (Figure 2-17) at a depth of between 4000 to 4600 m TVDSS in a water depth of around 2000 m Structural relief is up to 600 m and area of closure up to 170 km2 The conceptual geological model is discussed above but is that the prognosed microbial carbonate reservoir of Albian age is developed between the mapped lsquoredrsquo and lsquolight bluersquo seismic events (Figure 2-16) with lateral seal developed to the north-east of the prospect within contemporaneous lagoonal facies which also provide the primary source rock This lateral seal is required to close the prospect Basin modelling undertaken by APCL suggests that the Albian lagoonal and later Cretaceous source rocks would be mature for oil generation
We have accepted this model as a geological concept and have used it to make estimates of prospective resources for the Wildbird prospect We then risk the model accordingly
Competent Personrsquos Report African Petroleum Corporation Limited
June 2013 45
Figure 2-16 Seismic line and prospect geo-seismic sketch Wildbird prospect
5
0 km 5
SWN
E
mss
Wildbird
Horizons
BlackberryLight BlueRoseRed
Competent Personrsquos Report African Petroleum Corporation Limited
June 2013 46
Figure 2-17 Wildbird Top Reservoir depth map (m TVDSS) Spill point - green contour
The Wildbird prospect is a large container but there is considerable uncertainty in reservoir thickness structural mapping and degree of charge from the offset kitchen areas We evaluate the prospect in a similar manner to the Lovebird prospect by perturbing the above variables In our low case we choose a shallow contact at 4250 m TVDSS to simulate under-filling or lateral breach via onlapping thief zones and also employ a reservoir thickness of 80 m from offset analogue Our high case assumes the prospect is filled to spill and that the lsquoredrsquo seismic event marks base reservoir Estimates of reservoir net to gross ratio and porosity are derived from the available analogues and are necessarily wide Fluid parameters and recovery factors are derived as described in Section 16
The Wildbird play is emerging and is of high risk We attribute a play risk of 24 as a result (Section 24) The key prospect risk to the Wildbird prospect is that of containment or trap as there is evidence for erosion at the crest of the feature and it is reliant on the development of lagoonal facies to the north-east and overlying marine shales to provide lateral seal and support the hydrocarbon column heights modelled here We attribute a prospect risk of 38 Wildbird which when combined with the play risk gives an overall chance of success for the Wildbird prospect of 9
mss
Competent Personrsquos Report African Petroleum Corporation Limited
June 2013 47
3 Gambia Prospectivity and Plays
͵ǤͳǤ Introduction
Although only one exploration well (Well Jammah-1) exists offshore Gambia exploration drilling has been undertaken to the north and south within Senegalese and Guinea Bissau waters (Figure 2-1 Figure 3-1) A number of oil and gas discoveries have been made onshore Senegal and the large Dome Flore and Dome Gea discoveries to the south of the blocks are each reported to contain a million barrels of biodegraded oil (c10-13o API) in place within sandstones of Oligocene (Tertiary) age Some lighter (30-34o API) oil has also been encountered in deeper intervals More regionally oil and gas discoveries have been made to the north offshore Mauritania and in Guinea Bissau (Sinapa) the recently drilled Venus and Mercury wells in Sierra Leone have also encountered hydrocarbons
Figure 3-1 Plays Gambia Blocks A1 and A4
The range of hydrocarbon types encountered is suggestive of multiple sourcing and the age of the reservoirs suggest late timing of oil generation consistent with a late Cretaceous source for the heavy oil although there are no published data to confirm this Regionally the gas source could be any of the older potential source rocks discussed below
Alhamdulilah
GAMBIA A1ampA4 PROSPECTIVITY POTENTIAL
Deep Water Fans channel levee complexes BFF lobes
Late Jurassic clastic progrades
Clastic progrades (unconformity trap)
Karst amp reef features in carbonate platform
Intra-carbonate clastic truncations
Based on line 1046-NWA
1
2
3
1
51
14
2
3
4
5
Competent Personrsquos Report African Petroleum Corporation Limited
June 2013 48
32Well and Seismic Database
Exploration offshore Gambia is also at an early stage and no wells have been drilled in the deeper water areas The nearest well to Blocks A1 and A4 (and the only well offshore Gambia) is Well Jammah-1 some 15 km to the east of Block A1 (Figure 3-2) This well contains oil shows within sandstones of Late Cretaceous age The well drilled to 3020 m MD reaching total depth in an interval of uncertain age perhaps Cenomanian to Albian
A regional grid of 2D seismic data was made available to us for our evaluation with an average line spacing of around 2-3 km on Block A1 and up to 8 km on Block A4 (Figure 3-2 Figure 3-3) In addition a 2003 vintage 3D seismic data volume was available for analysis covering 2008 km2 However APCL is using 2010 vintage 3D seismic data (2566km2) processed to pre-stack time-migration in their current evaluation and we have adopted these data for our review In general seismic data quality was found to be good
Figure 3-2 Wells 2D and 3D seismic data (red outline) Gambia Blocks A1 and A4
The 2D seismic data was sufficient to enable a well to seismic tie to be made to Well Jammah-1 (Figure 3-3) Despite its shelfal location we were able to extrapolate some stratigraphy into the deeper water
Competent Personrsquos Report African Petroleum Corporation Limited
June 2013 49
although the key Upper Cretaceous section is not sampled adequately by the well leading to uncertainty in the age of the deeper clastic section that forms the potential reservoir interval for the Alhamdulilah prospect
33Plays and Petroleum Geology Blocks A1 and A4
Some of the plays identified by APCL offshore Gambia are similar to those described for Liberia in Section 23 above with structural and stratigraphic traps identified at a number of Cretaceous intervals (Figure 3-1) and reservoirs prognosed as being of deep marine turbidites or other mass transport systems However plate tectonic reconstructions suggest that rifting occurred earlier along the Senegalese and Gambian margin beginning in the Lower Jurassic Thus there is the potential for deeper Jurassic age source and reservoir in the area
There is some seismic evidence for the presence of reservoir intervals as is common regionally although evidence is less compelling in the deeper intervals (Figure 3-5) Of the identified traps in this play fairway only one has currently been matured to prospect status by APCL the Alhamdulilah prospect
Regionally reservoirs within the Cretaceous are associated with a deep marine depositional environment and are generally expected to be of good to excellent quality with the possibility of some overpressure A similar depositional environment is prognosed for the deeper Jurassic age reservoirs with possible fan-delta like geometries identifiable on seismic landward (eastward) of the Alhamdululah prospect (Figure 3-7)
In addition to the Jurassic and Cretaceous clastic plays APCL has identified a number of closures along the margin of a carbonate platform of Jurassic to Aptian age partially penetrated by Well Jammah-1 (Figure 3-3 Figure 3-4) These closures are currently being evaluated by APCL and only one Prospect M has been evaluated to prospect status and we assess the prospective resources for Prospect M in this section
Competent Personrsquos Report African Petroleum Corporation Limited
June 2013 50
Figure 3-3 Well to seismic tie ndash Well Jammah-1 to the Alhamdulilah prospect
There is good evidence for the presence of source rocks in the Gambian margin The youngest source interval that could possibly generate oil is the Cenomanian-Turonian marine source rock proven in the Casamance Shelf wells and present in basins to the north Published data indicate kerogen is a mixed Type IIIII locally and Type II in wells to the south with HI of between 370-660 mggC in gt2 TOC rocks (TOCs in the DSDP-367 well 300 km to the west are in excess of 5 in black shales of Albian to Turonian age) This section is absent in Well Jammah-1 probably as a result of erosion
There is also the possibility of Necomian and Jurassic source rocks Necomian black shales are described in the DSDP-367 well Jurassic (Toarcian) source rocks are inferred to be present based on analogue evidence and plate tectonic reconstructions that place proven Jurassic source rocks in Morocco Portugal Nova Scotia and north-eastern Brazil in proximity to the Senegal-Gambia basin These are documented as having a HI of around 450 mggC and a TOC of up to 6
Regional thermal information shows a high degree of variability with gradients from 25 to 45 degCkm likely as a result of drilling on salt domes where geothermal gradients are elevated or in areas locally affected by volcanics Blocks A1 and A4 are at the northernmost margin of the salt basin so at worst only limited local effects are anticipated Using data from Well Jammah-1 we infer a geothermal gradient of 30deg Ckm at the location of the well This would put the Cenomanian-Turonian source locally into the oil window around the Alhamdulilah prospect However uncertainty in both depth conversion and geothermal modelling do not rule out the possibility that the Cenomanian-Turonian could be mature regionally for hydrocarbon generation Deeper Neocomian or Jurassic source rocks if present would be mature for oil generation under this model
ALHAMDULILAH
M
Senonian UC
W E4 km
Jammah-1
Alhamdulilah
Intra Aptian Carbonate
TWT (ms)
Competent Personrsquos Report African Petroleum Corporation Limited
June 2013 51
34Play Risk
In our evaluation of APCLrsquos Gambian blocks we note that a number of the prospective plays require further definition to mature the identified leads to prospect status As a result our evaluation is limited to the determination of independent estimates of prospective resource for the Alhamdulilah prospect and Prospect M We have used play and prospect risk for both prospects to allow for consistency in comparison between our evaluations where a play risk is appropriate
Based on the review above we see source risk as the key risk to the Lower Cretaceous and Jurassic clastic play Although a number of source rock intervals are present regionally only those within the Cretaceous are demonstrated to be present proximal to Blocks A1 and A4 Data are limited but modelling would suggest that those within the Cenomanian-Turonian could be immature for oil generation in all but a small area of the blocks As a result we assign a source risk of 07 Note that the uncertainty in both source rock presence and thermal data is such that there is a possibility of gas charge although like Liberia Sierra Leone and Cote drsquoIvoire it is impossible to quantify this chance at present
We see seal risk for this play to be relatively low as there is seismic evidence similar to that interpreted regionally for the presence of seal Seal risks for the multiple stacked sands prognosed for the Alhamdulilah prospect are handled as a prospect specific risk The inferred depositional environment for this interval would also suggest that sealing intervals would be developed We have therefore assigned a seal risk of 09 to this play
Seismic evidence for the presence of reservoir is also good but less convincing than that observed regionally and in our evaluation of Liberia Blocks 8 and 9 However we assign a reservoir presence risk of 08 It is possible that the younger Cretaceous reservoirs identified could be locally sourced via exhumation of the coeval carbonate platform to the east and thus be composed of detrital carbonate material This is reflected in the reservoir risk for the Alhamdulilah prospect itself
For the carbonate platform play the key risk is that of top seal Seismic reflectivity is highly variable above the top of the platform carbonates (Figure 3-3) as the event is a strong regional unconformity In places the overlying clastic section can be interpreted immediately above this unconformity Although the latter is factored into prospect specific risk to top seal the seismic evidence for the presence of a regional seal above the unconformity is not compelling The top seal is provided by a down-lapping carbonate prone Aptian-Albian section where the Senonian unconformity is not immediately above the reservoir section Analogues suggest there is a general lack of support for intra-formational seals in similar settings and therefore we assign a risk to the carbonate platform play seal of 05 as a result
The presence of a strong angular unconformity at the top of the carbonate platform structures is however likely to have enhanced reservoir quality within the carbonates themselves as a result of subareal exposure and karstification Thus we assign a risk of 09 to the reservoir presence element of the carbonate platform play and review the prospect specific reservoir efficacy risk on a prospect by prospect basis dependent on the seismic evidence for erosion
Competent Personrsquos Report African Petroleum Corporation Limited
June 2013 52
A number of the identified structures along the buried carbonate platform margin are relatively shallow to mudline and thus biodegradation of any oil charge is possible However as we have only estimated prospective resources for Prospect M we have not carried a play risk to biodegradation
Our final play risks for the Lower Cretaceous clastic and the buried carbonate platform plays are summarised in Table 31 below
PLAY Source Reservoir Presence Seal Play
Risk Cretaceous to Jurassic Clastic Play 07 08 09 50
Carbonate Platform Margin 07 09 05 28
Table 31 Play risk Gambia Blocks A1 and A4
Competent Personrsquos Report African Petroleum Corporation Limited
June 2013 53
35Gambia Leads and Prospects
In all 13 leads and prospects have been identified by APCL within Blocks A1 and A4 with areas of closure varying from around 4 km2 to 63 km2 (Figure 3-4) Of the identified prospective intervals a number are best classified as leads and require further technical work to mature them to prospect status (yellow Figure 3-4) Structural closure is identified within the Lower Cretaceous and a number of slope fans can be identified as seismic amplitude anomalies within the Upper Cretaceous section In addition a number of closures are mapped along the edge of the buried carbonate platform margin at Top Aptian level and APCL are currently evaluating the potential for a deeper Barremian age seal which might provide further prospectivity within the carbonate platform play
Figure 3-4 Leads and prospects identified by APCL in Gambia Blocks A1 and A4
In this section we briefly describe our evaluation of the Alhamdulilah prospect and Prospect M A summary of input parameters for the calculation of prospective resources results and risks for each of the prospective layers evaluated is given in the resource summary sheets in Enclosures 21 to 25 of this document
In 2010 APCL acquired a further 2566 km2 of 3D data over both blocks A re-evaluation of the identified leads and prospects is on-going using these data with the evaluation of the Alhamdulilah prospect and Prospect M completed
ALHAMDULILAH
M
Competent Personrsquos Report African Petroleum Corporation Limited
June 2013 54
351Alhamdulilah Prospect
The Alhamdulilah prospect is identified as a four-way dip-closed structural high within the centre of the deep water portion of Block A1 (Figure 3-3 Figure 3-5) We have evaluated four prospective intervals in total (Figure 3-5) Reservoir ages are currently prognosed by APCL to be of Lower Cretaceous (Turonian) to perhaps Lower Jurassic The prospect extends northwards of Block A1 into Senegalese waters and we have restricted our calculations to the proportion of the prospect that lies within Block A1 The bulk of the prospect does however lie within Gambian territory
Figure 3-5 Seismic line over the Alhamdulilah prospect
The prospective intervals within the Alhamdulilah structure lie between 4230 m TVDSS and 5970 m TVDSS or around 2010 to 3750 metres below sea bed This is relatively deep and despite the estimates of overpressure it is possible that porosity and thus reservoir quality to be relatively poor (Figure 2-4) Our estimates of recovery factor for the deeper prospective intervals reflect this
There is uncertainty in the degree of structural closure as although mapped reflectors are relatively bright and continuous the structure is of low relief We have account for this by undertaking various depth conversions of the mapped structure from the time domain 3D seismic data restricting our analysis to closure demonstrable on-block (Figure 3-6) At SS-1 level closure continues to the north off-block and also off the 3D seismic data We have reviewed the available 2D seismic data northwards to determine the spill point at this level
SS 4 (1)
SS 3 (1-2)
SS 2 (1-3)
SS 1 (1-3)
2 Km
Inline 1140 - TWT ALHAMDULILAH
TWT (s)
W E
Competent Personrsquos Report African Petroleum Corporation Limited
June 2013 55
Where seismic facies analysis suggests the potential for stacked pay intervals these have been modelled probabilistically Estimates of gross rock volume derived in this way are combined with the estimates of net reservoir thickness based on mapped seismic thicknesses and porosity and fluid information are derived as described in Section 16 to compute probabilistic estimates of resources for each reservoir interval
Figure 3-6 Area of closure Alhamdulilah prospect layers SS1 to SS4
Recovery factors used are as described in Section 16 of this report but modified to reflect the depth of burial of the deeper prospective intervals
We have reviewed the prospect specific risk for each of the prospective intervals independently Although the Alhamdulilah trap is a four-way dip-closed feature the time closure is subtle and the prospect is relatively deep There is also seabed canyoning which may cause uncertainty in the imaging and thus trap closure
Seismic evidence for seal is relatively good over the Alhamdulilah trap However there is evidence for downcuttingerosion between layers and above the prospect there is also evidence for downlapping events onto the topmost reflector
The key risk to the Alhamdulilah prospect is that of reservoir efficacy There are indications of fan-like geometries within the 3D seismic data (Figure 3-7) and some events can be mapped for the shallower reservoir layers However the Cretaceous reservoirs may alternatively comprise the eroded talus from the coeval carbonate platform to the east and reservoir quality rock may not be developed as a result Finally our estimate of overpressure may be incorrect and any sandstones present may have the reservoir quality sufficiently degraded via compaction to render them non-reservoir
SS-1 Low and High Case AreasSS-4 Low and High Case Areas SS-3 Low and High Case Areas SS-2 Low and High Case Areas
Competent Personrsquos Report African Petroleum Corporation Limited
June 2013 56
As a result the prospect specific risks to the prospective intervals of the Alhamdulilah prospect vary from 26 to 34 and from 13 to 17 when combined with the play risk
Figure 3-7Alhamdulilah prospect seismic facies interpretation Cretaceous intervals
AH-1 AH-1
Competent Personrsquos Report African Petroleum Corporation Limited
June 2013 57
352Prospect M
A number of structures have been identified by APCL at the Aptian level (ie top carbonate) along the buried carbonate platform margin that runs through Blocks A1 and A4 (Figure 3-1) Of these one structure Prospect M has been matured to prospect status and is of sufficient size to warrant independent estimates of resources (Figure 3-8)
Figure 3-8 Seismic line through Prospect M
We have evaluated the uncertainty in gross rock volume for Prospect M and combined this with reservoir net to gross ratio and porosity from analogue to generate estimates of STOIIP and prospective resources We have simulated uncertainty in seismic pick and also depth conversion to generate a range of spill points for the structure (Figure 3-9) These are used to make low and high case estimates of gross-rock volume
Due to the shallow nature of Prospect M we have assumed relatively high (but moveable) oil viscosities as discussed in Section 1 Recovery factor estimates are made with reference to this and also to analogue where uncertainty in both reservoir quality and also the degree of fracturing (and hence dual permeability) leads to a wide range in uncertainty in ultimate recovery Our low case recovery factor being affected primarily by early onset of water cut via fractures and an adverse mobility ratio and the high case making allowance for better oil mobility and improved matrix porosity and permeability leading to a more efficient sweep We therefore use a recovery factor range from 10 to 35 and use these as the P90 and P10 estimates on a log-normal distribution in our probabilistic simulation of prospective resources
Senonian UC
Intra Aptian Carbonate
TWT (ms)2 km
w EProspect M
Competent Personrsquos Report African Petroleum Corporation Limited
June 2013 58
Figure 3-9 Low and high case closure Prospect M top Aptian depth (m TVDSS)
There is pick and depth conversion uncertainty associated with Prospect M but we see a good chance of a closure being developed within the 3D seismic area and assign a prospect specific risk to trap of 09 as a result Downlapping events are observed onto the crest of the prospect (Figure 3-8) but the overlying seismic signature is relatively transparent thus we see a good chance of the prospect being sealed relative to the play risk However the prospect is relatively shallow at around 1000 m to 1100 m below the seabed and there is a risk to biodegradation of any oil charge Thus we associate a risk of 06 to biodegradation As it is established practice we place this risk into containment or trap risk which results in an overall trap risk of 09 06 or 54
There is evidence for the development of reservoir quality rock with a seismic character that has been associated with the development of karstification in the analogues used We also note that the prospect is very close to the platform edge and the erosional unconformity is quite pronounced again suggesting a period of subareal exposure Thus we see the prospect specific risk to reservoir efficacy as 08 Charge risk is also favourable with the prospect located at the edge of the buried platform margin proximal to the deeper potential kitchen areas We therefore associate a charge risk of 08 to the prospect
Thus we assign a prospect specific risk of 35 which when combined with the play risk for the carbonate platform margin gives an overall COS of 10
3
3
m ss
metres
Competent Personrsquos Report African Petroleum Corporation Limited
June 2013 59
4 Sierra Leone Prospectivity and Plays
As with offshore Liberia to the south-east all of the deep-water acreage offshore Sierra Leone is under licence (Figure 4-1) A discussion of regional hydrocarbon occurrences is presented in Section 21 APCLrsquos licences SL-03 and SL-04A-10 lie to the north-west of the countryrsquos territorial waters around 200 to 300 km north-west of the recent Venus Mercury and Jupiter discoveries made by Anadarko (Figure 4-1)
Figure 4-1 Offshore licences and discoveries Liberia and Sierra Leone
A regional grid of 2D seismic data is available to APCL for the evaluation of offshore Sierra Leone (Figure 4-2) In addition APCL has licenced c 2500 km2 of 3D seismic data covering the deeper water area of Block SL-03 and is negotiating the licencing of further 3D seismic data covering part of Block SL-04A-10
Competent Personrsquos Report African Petroleum Corporation Limited
June 2013 60
Well data offshore Sierra Leone are sparse Historical exploration was restricted to the shelf and resulted in the drilling of two exploration wells (Wells A-1 and A-1-2) which were plugged and abandoned as dry holes Data from both wells are available to APCL Recent drilling by Anadarko in the deeper waters of licence SL-07B-10 has yielded a number of discoveries (Wells Jupiter-1 Venus-1 and Mercury-1) but these well data are not available to APCL
Figure 4-2 Well and seismic database offshore Sierra Leone
The play fairways identified offshore Sierra Leone are very similar to those identified offshore Liberia (Figure 2-3) as structural traps within the Lower Cretaceous syn-rift section and primarily as stratigraphic traps within turbiditic sands of Cretaceous age (Campanian Cenomanian and Turonian) Sourcing from regional marine (Cenomanian) or lacustrine (Albo-Aptian) source rocks is hypothesized For the syn-rift structural play the presence of Albo-Aptian reservoirs is demonstrated by the shallow water Wells A-1 and A-1-2 which also had indications of the development of source rocks within the
Competent Personrsquos Report African Petroleum Corporation Limited
June 2013 61
Cretaceous syn-rift section Although the data are not available the recent Anadarko wells are publically documented as having found hydrocarbons within post-rift Cretaceous turbidites potentially de-risking this play
Blocks SL-03 and SL-04A-10 are towards the north-western edge of the seismically identified Cretaceous basin immediately adjacent to a large structural lineament the Sierra Leone Transform System Submarine canyon development is therefore prognosed to occur to the south and east of this lineament providing sediment input into the blocks during Cretaceous time As is encountered regionally there is reasonable seismic evidence for the presence of reservoir bearing intervals within the Upper Cretaceous section in the blocks
APCLrsquos evaluation of the recently licenced 3D seismic data is on-going and as yet only one prospect Altair has been matured to drillable prospect status However a number of other Cretaceous channelfan systems have been identified within Block SL- 03 (Figure 4-3)
Figure 4-3 Leads Sierra Leone Block SL-03
Competent Personrsquos Report African Petroleum Corporation Limited
June 2013 62
41Play Risk
Although there has been recent drilling along strike of APCLrsquos Sierra Leone licences these wells lie some 100 km to the east We have therefore attributed a play risk albeit favourable to Cretaceous channel-fan prospectivity within Blocks SL-03 and SL-04A-10 As with our review of Liberia there is strong seismic evidence for reservoir and seal rocks being present and offset drilling would indicate the same from the limited published information However there is as yet no proven source rock within APCLrsquos licences and we see this as the key risk to play The reported results of offset drilling and APCLrsquos own basin modelling would suggest that source risk would be favourable
Our final play risk for the Cretaceous channel-fan systems in APCLrsquos Sierra Leone licences is summarised in Table 31 below
PLAY Source Reservoir Presence Seal Play
Risk Cretaceous Play 08 09 09 65
Table 41 Play risk Sierra Leone Block SL-03
41Sierra Leone Leads and Prospects
APCL is currently evaluating the recently licenced 3D seismic data over Block SL-03 and has identified a number of Cretaceous channel-fan systems varying in areal extent from 20 km2 to 150 km2 Of the mapped channel fan systems one Altair has been matured to prospect status by APCL and we have made independent estimates of prospective resources and risks for this prospect
A summary of input parameters for the calculation of prospective resources results and risks for the Altair prospect is given in the resource summary sheet in Enclosure 31 of this document
411Altair
The Altair prospect is a turbidite channel prospect mapped at a seismic event described as Turonian by APCL (Figure 4-4) There is however uncertainty in this stratigraphy as it is established by jump correlation using regional seismic data due to the lack of deep water wells on block It is a stratigraphic trap with areal extents defined by amplitude truncation and structural pinch-out in a similar manner to prospectivity within APCLrsquos Liberia and Cote drsquoIvoire acreage A single target reservoir is identified within the trapped area The prospect has anomalous seismic amplitudes associated with it (Figure 4-5) which may indicate reservoir development The top structure is mapped between 6200 ndash 6800 ms TWT over the area of the prospect Our depth conversion indicates a crestal depth of approximately 5400 m TVDSS beneath a water depth of 3300 m giving 2100 m of sediment above top reservoir
Competent Personrsquos Report African Petroleum Corporation Limited
June 2013 63
Figure 4-4 Dip seismic line (full offsets) Altair prospect
The seismic image suggests that Altair is a turbidite channel constrained in the north east by a well-defined canyon Two distinct canyon systems feed erosive channels at the break of slope A south west trending fault which is almost perpendicular to the main canyon feeders alters bathymetric relief and diverts the Altair channel southwards
ERCE has made estimates of prospective resources for the Altair prospect using an identical methodology to our evaluation of Liberian prospectivity An area net approach was adopted using optimized seismic amplitudes to constrain areal extent and define an areal net to gross to account for lateral variability of sand distribution within the reservoir In our low case we restrict the area of the accumulation to the brightest area of anomalous amplitudes and a column height of 200 m Our high case extends the prospect down-dip to a column height of 800 m and laterally to incorporate weaker amplitude responses (Figure 4-5) These polygons were used to constrain the P90 and P10 area inputs of our probabilistic simulation
SW NE
Top Turonian
Top syn-rift
0 5kmTWT (s)
ALTAIR
3
3
metres
Competent Personrsquos Report African Petroleum Corporation Limited
June 2013 64
Figure 4-5 Seismic amplitude (gradient stack) and Top Turonian depth (m TVDSS) Altair prospect
Net pay is estimated from the mapped seismic interval and regional analogue with porosities and fluid properties estimated as described in Section 16
We have used the prospect risk matrix presented in Section 16 to determine the geological chance of success for the Altair prospect Key risk is to trap integrity due to the coalescing of a number of mapped fan systems up dip towards the pinch-out of Altair with subsidiary risk to charge as this is as yet unproven on block This gives a prospect specific risk of 28 which when combined with the play risk gives an overall chance of success of 18 for the Altair prospect
3
3
metres
Competent Personrsquos Report African Petroleum Corporation Limited
June 2013 65
5 Cote13 drsquoIvoire13 Prospectivity13 and Plays
51Introduction
Offshore Cote drsquoIvoire has been actively explored for hydrocarbons for a number of years and much of the offshore shelf is under licence Recently exploration has moved into deeper waters targeting the regional post-rift (Cretaceous) play and APCL has identified a number of prospects and leads within the western licence Blocks of CI-513 and CI-509 (Figure 5-1)
There are two main play types identifiable offshore Cote drsquoIvoire (Figure 5-2) as structural traps within the Lower Cretaceous (Aptian to Albian) syn-rift section and as stratigraphic traps within post rift turbiditic sands of Cenomanian to Turonian age Sourcing is prognosed from regional marine (Turonian) or lacustrine (Albo-Aptian) source rocks
Figure 5-1 CI-509 and CI-513 Prospects and Leads13 offshore13 Cote13 drsquoIvoire
Historically exploration has been restricted to the narrow shelf area and has yielded a number of commercial fields both oil and gas including Foxtrot Baobab and Espoir All of these fields lie within the Lower Cretaceous (Aptian) syn-rift play Recently exploration has moved into deeper waters targeting the regional post-rift (Cretaceous) play Well Paon-1X c 300 km to the east of Blocks CI-105 and CI-513
Competent Personrsquos Report African Petroleum Corporation Limited
June 2013 66
drilled by Tullow Oil plc and partners in licence CI-103 during 2012 is reported to have found hydrocarbons in turbiditic sandstones of Cretaceous age Well Kosrou-1X some 150 km east of Blocks CI-105 and CI-513 shows reservoir development within the post-rift Cretaceous section particularly within the Turonian to Cenomanian section
Evaluation of prospectivity within Blocks CI-509 and CI-513 is at an early stage and a working petroleum system is not proven on block However a number of Cretaceous channelfan systems have been identified using both 2D and 3D seismic data which have generated around seven potential traps at the date of this report five of which are considered prospects for this report (Figure 5-1)
Figure 5-2 Petroleum13 systems13 and13 plays13 offshore13 Cote13 drsquoIvoire
52Well and Seismic Database
APCL has obtained a regional database of 2D seismic data offshore Cote drsquoIvoire which provides well to seismic ties to Well San Pedro-1 (Figure 5-3) The primary data set used for our evaluation is that provided by the recently acquired 3D seismic data At the time of writing these data were processed to
Competent Personrsquos Report African Petroleum Corporation Limited
June 2013 67
pre-stack time-migration and we have used this volume plus available AvO processed volumes to evaluate the prospectivity of the CI-513 licence currently only the full-stack seismic product has been used to assess the prospectivity in Block CI-509
Figure 5-3 Well and seismic database offshore Sierra Leone
53Plays and Petroleum Geology Blocks CI-509 and CI-513
The primary play being explored within Blocks CI-509 and CI-513 is the Cretaceous post-rift turbidite play (Figure 5-2) There is reasonable seismic evidence for the presence of reservoir bearing intervals within the Upper Cretaceous section of the blocks However dating of the age of these post-rift turbidite channelfan systems is uncertain due to the paucity of well and seismic data with stratigraphy extrapolated into APCLrsquos licences via regional seismic correlation The presence of a regional Turonian source rock is hypothesized to charge any identified traps This is not proven on block but evidence from offset drilling in Block CI-105 demonstrates the presence of source rocks developed within the
Grand Lahou East 1
Kosrou 1x
San Pedro 1
South Grand Lahou 1
Competent Personrsquos Report African Petroleum Corporation Limited
June 2013 68
Cenomanian to Turonian and basin modelling studies indicate that the Turonian may be mature for oil generation local to the licences
A number of Cretaceous channelfan systems have been identified using both 2D and 3D seismic data (Figure 5-1) and we have independently evaluated the Prospective Resources and geological chance of success for five of these In addition the Lower Cretaceous syn-rift play may be viable within the licences particularly to the north Evaluation of this play by APCL is on-going and no prospective resources have been assessed for this play
54Play Risk
Exploration offshore Cote drsquoIvoire is at an early stage and there are limited well data available As a result ERCE has adopted a play and prospect risk system in our evaluation of the Cote drsquoIvoire prospective resources within the Cretaceous channel-fan play in an identical manner to our review of Liberia the Gambia and Sierra Leone
In a similar manner to Liberia the Gambia and Sierra Leone there is seismic evidence for the presence of seal and reservoir rock and thus the key risk is to source and we see source risk as the key risk to the Creteaceous clastic play Sourcing is prognosed from regional marine (Turonian) modelled as having limited hydrocarbon generating potential or lacustrine (Albo-Aptian) source rocks the maturity of which are interpreted to be in the very early oil window As a result we assign a play source risk of 06 Note that the uncertainty in both source rock presence and thermal maturity is such that there is a possibility of gas charge although it is impossible to quantify this chance at present
Our final play risk is summarised in Table 51 below
PLAY Source Reservoir Presence Seal Play
Risk Cretaceous Clastic Play 06 09 09 049
Table 51 Play13 risk13 Cote13 drsquoIvoire13 Blocks13 CI-509 and CI-513
Competent Personrsquos Report African Petroleum Corporation Limited
June 2013 69
ͷǤͷǤ Cote13 drsquoIvoire13 Blocks13 CI-509 and CI-503 Leads and Prospects
Prospectivity has been identified by APCL at a number of levels with the evaluation of the Cretaceous clastic turbidite channel-fan play being the most advanced ERCE has made independent assessments of prospective resources and geological chance of success for five prospects within this play Ayame Ayame West Sassandra Cavella and Leraba (Figure 5-1)
A summary of input parameters for the calculation of prospective resources results and risks for each of the prospective layers evaluated is given in the resource summary sheets in Enclosures 41 to 45 of this document
ͷǤͷǤͳǤ Ayame amp Ayame West
The Ayame and Ayame West prospects are identified as Upper Cretaceous fans which lie mainly within Block CI-513 (Figure 5-4) The prognosed trapping mechanism is stratigraphic with areal extents defined by amplitude truncation and structural pinch-out A single target reservoir is prognosed for both within stratigraphy identified as Turonian although stratigraphy is uncertain in both licences as it is established via long distance seismic ties The prospects have anomalous seismic amplitudes associated with them (Figure 5-5) which may indicate reservoir development The top structure is mapped between 5400 ndash 6300 ms TWT over the area of the prospect and our depth conversion places the crest of the trap at approximately 4200 m TVDSS beneath a water depth of 2500 m
Figure 5-4 Strike Line Ayame and Ayame West prospects
NE
0 km 4
TWT (s)
Top
Turonian
Base
Turonian
Top
Albian
AYAMEAYAME WESTSW
P90
P10
metres
P90
P10
AYAME
AYAMEWEST
Competent Personrsquos Report African Petroleum Corporation Limited
June 2013 70
Evaluation of the Ayame and Ayame West prospects is undertaken in an identical manner to our evaluations of the stratigraphically trapped channel-fan prospects in APCLrsquos Liberia and Sierra Leone licences An area net approach is adopted using anomalous seismic amplitudes to constrain areal extent and define an areal net to gross to account for lateral variability of sand distribution within the closure area In our low case we restrict the area of the accumulation to the brightest area of anomalous amplitudes and a 200 m column height Our high case extends the prospect down-dip to 800 m of column height to include a larger area of anomalous amplitudes (Figure 5-5) These polygons are used to constrain the P90 and P10 area inputs of our probabilistic simulation
Net pay estimates are estimated from mapped seismic interval thickness and from regional analogues with porosity fluid parameters and recovery factors estimated as described in Section 16
Figure 5-5 Ayame Seismic amplitude (gradient stack) and Top Turonian depth (m TVDSS)
We use the prospect risk matrix presented in Section 16 to determine the geological chance of success for the Ayame and Ayame West prospects Key risk is to trap and we attribute a trap risk of 50 to both
P90
P10
metres
P90
P10
AYAME
AYAMEWEST
Competent Personrsquos Report African Petroleum Corporation Limited
June 2013 71
prospects giving a prospect specific chance of success of 28 for both prospects When combined with the play risk this gives an overall chance of success of 14
A proportion of the closure areas for both the Ayame and Ayame West prospects fall outside Block CI-513 in our high case (6 km2 and 11 km2 respectively) This is corrected for in our summary tables of net risked and unrisked prospective resources at the beginning of this document by computing the area of the prospect off-block at P90 P50 and P10 and scaling accordingly
ͷǤͷǤʹǤ Sassandra
The Sassandra prospect is mapped as a deep-water fan system at Top Turonian level and lies within Blocks CI-513 and CI-509 approximately 20km west along strike from the Ayame prospect It is a stratigraphic trap with areal extents defined by amplitude truncation and structural pinch-out (Figure 5-6) A single target reservoir is prognosed within the Turonian and as with other prospects on block has similar uncertainty in the stratigraphic age of the prospective interval The prospect has anomalous amplitudes associated with it (Figure 5-7) which may indicate reservoir development The top structure is mapped between 5000 ndash 6000 ms TWT over the area of the prospect and our depth conversion predicts a crestal depth of approximately 4400 m TVDSS beneath a water depth of 2500 m
Figure 5-6 Dip seismic line Sassandra prospect
Top Turonian
Base Turonian
Top Albian
N S
TWT (s)
SASSANDRA
P90 P10
metres
CI-509
Competent Personrsquos Report African Petroleum Corporation Limited
June 2013 72
Evaluation of the Sassandra prospect is undertaken in an identical manner to our evaluation of the Ayame and Ayame West prospects An area net approach is adopted using anomalous seismic amplitudes to constrain areal extent and define an areal net to gross to account for lateral variability of sand distribution within the closure area In our low case we restrict the area of the accumulation to the brightest area of anomalous amplitudes and a 200 m column height Our high case extends the prospect down-dip to 800 m of column height to include a larger area of anomalous amplitudes (Figure 5-7) These polygons are used to constrain the P90 and P10 area inputs of our probabilistic simulation As far offset data are only available for CI-513 (at the time of writing) we have used amplitudes from the full-stack volume to map the extent of the prospect to the west off block (Figure 5-7)
Net pay estimates are estimated from mapped seismic interval thickness and from regional analogues with porosity fluid parameters and recovery factors estimated as described in Section 16
Figure 5-7 Sassandra prospect Seismic amplitude and Top Turonian depth (m TVDSS)
We use the prospect risk matrix presented in Section 16 to determine the geological chance of success for the Sassandra prospect Key risk is to trap and we attribute a trap risk of 40 This is a lower value
33
metres
CI-509
Competent Personrsquos Report African Petroleum Corporation Limited
June 2013 73
than our estimates for the Ayame and Ayame West prospects as the up-dip termination of the trap is less well defined and requires a larger area for pinch-out or bypass Seismic amplitude support for reservoir presence is less over the Sassandra prospect relative to Ayame Thus we estimate a prospect specific chance of success for the Sassandra prospect of 20 which when combined with the play risk gives an overall chance of success for the Sassandra prospect of 10
A proportion of the closure area for the Sassandra prospect falls outside Blocks CI-513 and CI-509 in our high case (33 km2) This is corrected for in our summary tables of net risked and unrisked prospective resources at the beginning of this document by computing the area of the prospect off-block at P90 P50 and P10 and scaling accordingly
553Cavalla
The Cavalla prospect is an Upper Cretaceous Fan which lies between the Ayame and Sassandra prospects within Block CI-513 It is identified as a stratigraphic trap with areal extents defined by amplitude truncation and structural pinch-out (Figure 5-8) A single target reservoir is prognosed within the TuronianCenomanian interval (with similar stratigraphic uncertainty to other prospects on block) which lies stratigraphically beneath the Ayame prospect The prospect has anomalous seismic amplitudes associated with it (Figure 5-9) which may indicate reservoir development The top structure is mapped between 4600 ndash 5900 ms TWT over the area of the prospect and we estimate a crestal depth of approximately 3900 m TVDSS beneath a water depth of 2500 m The prospect is more steeply dipping than other fan systems mapped on block
Evaluation of the Cavalla prospect is undertaken in an identical manner to our evaluation of the Ayame Ayame West and Sassandra prospects An area net approach is adopted using anomalous seismic amplitudes to constrain areal extent and define an areal net to gross to account for lateral variability of sand distribution within the closure area In our low case we restrict the area of the accumulation to the brightest area of anomalous amplitudes and a 200 m column height Our high case extends the prospect down-dip to 800 m of column height to include a larger area of anomalous amplitudes (Figure 5-9) These polygons are used to constrain the P90 and P10 area inputs of our probabilistic simulation
Net pay estimates are estimated from mapped seismic interval thickness and from regional analogues with porosity fluid parameters and recovery factors estimated as described in Section 16
We use the prospect risk matrix presented in Section 16 to determine the geological chance of success for the Cavella prospect Key risk is to trap and we attribute a trap risk of 40 As with the Sassandra prospect this is a lower value than our estimates for the Ayame and Ayame West prospects as the up-dip termination of the trap is less well defined and requires a larger area for pinch-out or bypass Seismic amplitude support for reservoir presence is less over the Cavella prospect relative to Ayame Thus we estimate a prospect specific chance of success for the Cavella prospect of 20 which when combined with the play risk gives an overall chance of success for the Cavella prospect of 10
Competent Personrsquos Report African Petroleum Corporation Limited
June 2013 74
The Cavalla prospect is contained entirely within APCLrsquos licences
Figure 5-8 Dip seismic line Cavalla prospect
Top Turonian
Top Albian
TWT (s)
CAVALLANW SEP90
P10
metres
Competent Personrsquos Report African Petroleum Corporation Limited
June 2013 75
Figure 5-9 Seismic amplitude (gradient stack) and Top fan depth (m TVDSS) Cavalla prospect
ͷǤͷǤͶǤ Leraba
As with the other evaluated prospectivity within Blocks CI-509 and CI-513 the Leraba prospect is an Upper Cretaceous fan which lies within Block CI-509 It is identified as a stratigraphic trap with areal extents defined by amplitude truncation and structural pinch-out (Figure 5-10) The prospect has anomalous seismic amplitudes associated with it (Figure 5-11) which may indicate reservoir development Unlike the other Cote DrsquoIvoire prospects evaluated in this report no offset seismic volumes were available for our review of Leraba at the time of writing The seismic amplitude response and character on the full-stack data is however consistent with that observed over other prospects in Block CI-513 where more seismic products were available
P90
P10
metres
Competent Personrsquos Report African Petroleum Corporation Limited
June 2013 76
The top structure is mapped between 4600 ndash 5200 ms TWT over the area of the prospect and we estimate a depth at the crest of approximately 3700 m TVDSS beneath a water depth of 2500 m
Figure 5-10 Dip seismic line Leraba prospect
Evaluation of the Leraba prospect is undertaken in an identical manner to our evaluation of the other Cretaceous fan systems evaluated in this section An area net approach is adopted using anomalous seismic amplitudes to constrain areal extent and define an areal net to gross to account for lateral variability of sand distribution within the closure area In our low case we restrict the area of the accumulation to the brightest area of anomalous amplitudes and a 200 m column height Our high case extends the prospect down-dip to 800 m of column height to include a larger area of anomalous amplitudes (Figure 5-11) These polygons are used to constrain the P90 and P10 area inputs of our probabilistic simulation
P90
P10
metresTWT (s)
LERABANW SE
Top Turonian
Albian
0 5km
Competent Personrsquos Report African Petroleum Corporation Limited
June 2013 77
Figure 5-11 Seismic amplitudes Leraba prospect overlay of Top Reservoir m TVDSS
Net pay estimates are derived from mapped seismic interval thickness and from regional analogues with porosity fluid parameters and recovery factors estimated as described in Section 16 The prospect is relatively shallow to mud line and we have modelled a more viscous oil as described in Section 16
We use the prospect risk matrix presented in Section 16 to determine the geological chance of success for the Leraba prospect Key risk is to trap and we attribute a trap risk of 60 as the up-dip extent of the prospect is fairly well defined on seismic data Although no off-set 3D seismic data were available the seismic evidence for reservoir presence is again comparable to that of Ayame West Thus we estimate a prospect specific chance of success for the Leraba prospect of 34 which when combined with the play risk gives an overall chance of success for the Leraba prospect of 16
The Leraba prospect is contained entirely within APCLrsquos licences
P90
P10
metres
Competent Personrsquos Report African Petroleum Corporation Limited
June 2013 78
6 Senegal Prospectivity and Plays
Prospectivity identified within APCLrsquos Sengalese licences is seen as being similar to that identified offshore Gambia (Figure 6-1) and a description of the regional petroleum systems and main play types expected is given in Section 3
Figure 6-1 Petroleum systems and plays offshore Senegal
In 2012 APCL acquired 3600 km2 of multi-client 3D seismic data over the Offshore Sud Profond licence In addition 1500 km2 of legacy 3D data over the Rufisque Offshore Profond licence is currently being reprocessed by APCL and legacy 2D seismic data (c 7000 line km) have also been acquired APCL expects to begin prospect evaluation once seismic processing is complete which is expected later in 2013 At present a number of conceptual Cretaceous post-rift leads are identified by APCL (Figure 6-2)
Competent Personrsquos Report African Petroleum Corporation Limited
June 2013 79
Figure 6-2 leads offshore Senegal Blocks ROP and SOSP
Competent Personrsquos Report African Petroleum Corporation Limited
June 2013 80
7 Appendix 1 SPE PRMS Guidelines
SPEWPCAAPGSPEE Petroleum Reserves and Resources Classification System and Definitions
The Petroleum Resources Management System
Preamble
Petroleum Resources are the estimated quantities of hydrocarbons naturally occurring on or within the Earthrsquos crust Resource assessments estimate total quantities in known and yet-to-be-discovered accumulations Resources evaluations are focused on those quantities that can potentially be recovered and marketed by commercial projects A petroleum Resources managements system provides a consistent approach to estimating petroleum quantities evaluating development projects and presenting results within a comprehensive classification framework
International efforts to standardize the definitions of petroleum Resources and how they are estimated began in the 1930s Early guidance focused on Proved Reserves Building on work initiated by the Society of Petroleum Evaluation Engineers (SPEE) SPE published definitions for all Reserves categories in 1987 In the same year the World Petroleum Council (WPC then known as the World Petroleum Congress) working independently published Reserves definitions that were strikingly similar In 1997 the two organizations jointly released a single set of definitions for Reserves that could be used worldwide In 2000 the American Association of Petroleum Geologists (AAPG) SPE and WPC jointly developed a classification system for all petroleum Resources This was followed by additional supporting documents supplemental application evaluation guidelines (2001) and a glossary of terms utilized in Resources definitions (2005) SPE also published standards for estimating and auditing Reserves information (revised 2007)
These definitions and the related classification system are now in common use internationally within the petroleum industry They provide a measure of comparability and reduce the subjective nature of Resources estimation However the technologies employed in petroleum exploration development production and processing continue to evolve and improve The SPE Oil and Gas Reserves Committee works closely with other organizations to maintain the definitions and issues periodic revisions to keep current with evolving technologies and changing commercial opportunities
The SPE-PRMS consolidates builds on and replaces guidance previously contained in the 1997 Petroleum Reserves Definitions the 2000 Petroleum Resources Classification and Definitions publications and the 2001 ldquoGuidelines for the Evaluation of Petroleum Reserves and Resourcesrdquo the latter document remains a valuable source of more detailed background information
These definitions and guidelines are designed to provide a common reference for the international petroleum industry including national reporting and regulatory disclosure agencies and to support petroleum project and portfolio management requirements They are intended to improve clarity in
Competent Personrsquos Report African Petroleum Corporation Limited
June 2013 81
global communications regarding petroleum Resources It is expected that the SPE-PRMS will be supplemented with industry education programs and application guides addressing their implementation in a wide spectrum of technical andor commercial settings
It is understood that these definitions and guidelines allow flexibility for users and agencies to tailor application for their particular needs however any modifications to the guidance contained herein should be clearly identified The definitions and guidelines contained in this document must not be construed as modifying the interpretation or application of any existing regulatory reporting requirements
The full text of the SPEWPCAAPGSPEE Petroleum Resources Management System document hereinafter referred to as the SPE-PRMS can be viewed at
wwwspeorgspecmabinaryfiles6859916Petroleum_Resources_Management_System_2007pdf
Overview and Summary of Definitions
The estimation of petroleum resource quantities involves the interpretation of volumes and values that have an inherent degree of uncertainty These quantities are associated with development projects at various stages of design and implementation Use of a consistent classification system enhances comparisons between projects groups of projects and total company portfolios according to forecast production profiles and recoveries Such a system must consider both technical and commercial factors that impact the projectrsquos economic feasibility its productive life and its related cash flows
Petroleum is defined as a naturally occurring mixture consisting of hydrocarbons in the gaseous liquid or solid phase Petroleum may also contain non-hydrocarbons common examples of which are carbon dioxide nitrogen hydrogen sulphide and sulphur In rare cases non-hydrocarbon content could be greater than 50
The term ldquoResourcesrdquo as used herein is intended to encompass all quantities of petroleum naturally occurring on or within the Earthrsquos crust discovered and undiscovered (recoverable and unrecoverable) plus those quantities already produced Further it includes all types of petroleum whether currently considered conventionalrdquo or ldquounconventionalrdquo
Figure 1-1 is a graphical representation of the SPEWPCAAPGSPEE Resources classification system The system defines the major recoverable Resources classes Production Reserves Contingent Resources and Prospective Resources as well as Unrecoverable petroleum
Competent Personrsquos Report African Petroleum Corporation Limited
June 2013 82
Figure 1-1 SPEAAPGWPCSPEE Resources Classification System
The ldquoRange of Uncertaintyrdquo reflects a range of estimated quantities potentially recoverable from an accumulation by a project while the vertical axis represents the ldquoChance of Developmentrdquo that is the chance that the project that will be developed and reach commercial producing status
The following definitions apply to the major subdivisions within the Resources classification
TOTAL PETROLEUM INITIALLY-IN-PLACE
Total Petroleum Initially in Place is that quantity of petroleum that is estimated to exist originally in naturally occurring accumulations
It includes that quantity of petroleum that is estimated as of a given date to be contained in known accumulations prior to production plus those estimated quantities in accumulations yet to be discovered (equivalent to ldquototal Resourcesrdquo)
Competent Personrsquos Report African Petroleum Corporation Limited
June 2013 83
DISCOVERED PETROLEUM INITIALLY-IN-PLACE
Discovered Petroleum Initially in Place is that quantity of petroleum that is estimated as of a given date to be contained in known accumulations prior to production
PRODUCTION
Production is the cumulative quantity of petroleum that has been recovered at a given date
Multiple development projects may be applied to each known accumulation and each project will recover an estimated portion of the initially-in-place quantities The projects shall be subdivided into Commercial and Sub-Commercial with the estimated recoverable quantities being classified as Reserves and Contingent Resources respectively as defined below
RESERVES
Reserves are those quantities of petroleum anticipated to be commercially recoverable by application of development projects to known accumulations from a given date forward under defined conditions
Reserves must satisfy four criteria they must be discovered recoverable commercial and remaining based on the development project(s) applied Reserves are further subdivided in accordance with the level of certainty associated with the estimates and may be sub-classified based on project maturity andor characterized by their development and production status To be included in the Reserves class a project must be sufficiently defined to establish its commercial viability There must be a reasonable expectation that all required internal and external approvals will be forthcoming and there is evidence of firm intention to proceed with development within a reasonable time frame A reasonable time frame for the initiation of development depends on the specific circumstances and varies according to the scope of the project While five years is recommended as a benchmark a longer time frame could be applied where for example development of economic projects are deferred at the option of the producer for among other things market-related reasons or to meet contractual or strategic objectives
In all cases the justification for classification as Reserves should be clearly documented To be included in the Reserves class there must be a high confidence in the commercial producibility of the reservoir as supported by actual production or formation tests In certain cases Reserves may be assigned on the basis of well logs andor core analysis that indicate that the subject reservoir is hydrocarbon-bearing and is analogous to reservoirs in the same area that are producing or have demonstrated the ability to produce on formation tests
Proved Reserves
Proved Reserves are those quantities of petroleum which by analysis of geoscience and engineering data can be estimated with reasonable certainty to be commercially recoverable from a given date forward from known reservoirs and under defined economic conditions operating methods and government regulations
Competent Personrsquos Report African Petroleum Corporation Limited
June 2013 84
If deterministic methods are used the term reasonable certainty is intended to express a high degree of confidence that the quantities will be recovered If probabilistic methods are used there should be at least a 90 probability that the quantities actually recovered will equal or exceed the estimate The area of the reservoir considered as Proved includes
the area delineated by drilling and defined by fluid contacts if any and adjacent undrilled portions of the reservoir that can reasonably be judged as continuous with it and commercially productive on the basis of available geoscience and engineering data
In the absence of data on fluid contacts Proved quantities in a reservoir are limited by the lowest known hydrocarbon (LKH) as seen in a well penetration unless otherwise indicated by definitive geoscience engineering or performance data Such definitive information may include pressure gradient analysis and seismic indicators Seismic data alone may not be sufficient to define fluid contacts for Proved Reserves (see ldquo2001 Supplemental Guidelinesrdquo Chapter 8) Reserves in undeveloped locations may be classified as Proved provided that the locations are in undrilled areas of the reservoir that can be judged with reasonable certainty to be commercially productive and interpretations of available geoscience and engineering data indicate with reasonable certainty that the objective formation is laterally continuous with drilled Proved locations
For Proved Reserves the recovery efficiency applied to these reservoirs should be defined based on a range of possibilities supported by analogs and sound engineering judgment considering the characteristics of the Proved area and the applied development program
Probable Reserves
Probable Reserves are those additional Reserves which analysis of geoscience and engineering data indicate are less likely to be recovered than Proved Reserves but more certain to be recovered than Possible Reserves
It is equally likely that actual remaining quantities recovered will be greater than or less than the sum of the estimated Proved plus Probable Reserves (2P) In this context when probabilistic methods are used there should be at least a 50 probability that the actual quantities recovered will equal or exceed the 2P estimate
Probable Reserves may be assigned to areas of a reservoir adjacent to Proved where data control or interpretations of available data are less certain The interpreted reservoir continuity may not meet the reasonable certainty criteria Probable estimates also include incremental recoveries associated with project recovery efficiencies beyond that assumed for Proved
Possible Reserves
Possible Reserves are those additional Reserves which analysis of geoscience and engineering data indicate are less likely to be recoverable than Probable Reserves
Competent Personrsquos Report African Petroleum Corporation Limited
June 2013 85
The total quantities ultimately recovered from the project have a low probability to exceed the sum of Proved plus Probable plus Possible (3P) which is equivalent to the high estimate scenario When probabilistic methods are used there should be at least a 10 probability that the actual quantities recovered will equal or exceed the 3P estimate
Possible Reserves may be assigned to areas of a reservoir adjacent to Probable where data control and interpretations of available data are progressively less certain Frequently this may be in areas where geoscience and engineering data are unable to clearly define the area and vertical reservoir limits of commercial production from the reservoir by a defined project
Possible estimates also include incremental quantities associated with project recovery efficiencies beyond that assumed for Probable
Probable and Possible Reserves
(See above for separate criteria for Probable Reserves and Possible Reserves)
The 2P and 3P estimates may be based on reasonable alternative technical and commercial interpretations within the reservoir andor subject project that are clearly documented including comparisons to results in successful similar projects
In conventional accumulations Probable andor Possible Reserves may be assigned where geoscience and engineering data identify directly adjacent portions of a reservoir within the same accumulation that may be separated from Proved areas by minor faulting or other geological discontinuities and have not been penetrated by a wellbore but are interpreted to be in communication with the known (Proved) reservoir Probable or Possible Reserves may be assigned to areas that are structurally higher than the Proved area Possible (and in some cases Probable) Reserves may be assigned to areas that are structurally lower than the adjacent Proved or 2P area
Caution should be exercised in assigning Reserves to adjacent reservoirs isolated by major potentially sealing faults until this reservoir is penetrated and evaluated as commercially productive Justification for assigning Reserves in such cases should be clearly documented Reserves should not be assigned to areas that are clearly separated from a known accumulation by non-productive reservoir (ie absence of reservoir structurally low reservoir or negative test results) such areas may contain Prospective Resources
In conventional accumulations where drilling has defined a highest known oil (HKO) elevation and there exists the potential for an associated gas cap Proved oil Reserves should only be assigned in the structurally higher portions of the reservoir if there is reasonable certainty that such portions are initially above bubble point pressure based on documented engineering analyses Reservoir portions that do not meet this certainty may be assigned as Probable and Possible oil andor gas based on reservoir fluid properties and pressure gradient interpretations
Competent Personrsquos Report African Petroleum Corporation Limited
June 2013 86
CONTINGENT RESOURCES
Contingent Resources are those quantities of petroleum estimated as of a given date to be potentially recoverable from known accumulations by application of development projects but which are not currently considered to be commercially recoverable due to one or more contingencies
Contingent Resources may include for example projects for which there are currently no viable markets or where commercial recovery is dependent on technology under development or where evaluation of the accumulation is insufficient to clearly assess commerciality Contingent Resources are further categorized in accordance with the level of certainty associated with the estimates and may be sub-classified based on project maturity andor characterized by their economic status
UNDISCOVERED PETROLEUM INITIALLY-IN-PLACE
Undiscovered Petroleum Initially in Place is that quantity of petroleum that is estimated as of a given date to be contained within accumulations yet to be discovered
PROSPECTIVE RESOURCES
Prospective Resources are those quantities of petroleum which are estimated as of a given date to be potentially recoverable from undiscovered accumulations
Potential accumulations are evaluated according to their chance of discovery and assuming a discovery the estimated quantities that would be recoverable under defined development projects It is recognized that the development programs will be of significantly less detail and depend more heavily on analog developments in the earlier phases of exploration
Prospect
A project associated with a potential accumulation that is sufficiently well defined to represent a viable drilling target
Project activities are focused on assessing the chance of discovery and assuming discovery the range of potential recoverable quantities under a commercial development program
Lead
A project associated with a potential accumulation that is currently poorly defined and requires more data acquisition andor evaluation in order to be classified as a prospect
Project activities are focused on acquiring additional data andor undertaking further evaluation designed to confirm whether or not the lead can be matured into a prospect Such evaluation includes the assessment of the chance of discovery and assuming discovery the range of potential recovery under feasible development scenarios
Play
Competent Personrsquos Report African Petroleum Corporation Limited
June 2013 87
A project associated with a prospective trend of potential prospects but which requires more data acquisition andor evaluation in order to define specific leads or prospects
Project activities are focused on acquiring additional data andor undertaking further evaluation designed to define specific leads or prospects for more detailed analysis of their chance of discovery and assuming discovery the range of potential recovery under hypothetical development scenarios
The range of uncertainty of the recoverable andor potentially recoverable volumes may be represented by either deterministic scenarios or by a probability distribution When the range of uncertainty is represented by a probability distribution a low best and high estimate shall be provided such that
bull There should be at least a 90 probability (P90) that the quantities actually recovered will equal or exceed the low estimate
bull There should be at least a 50 probability (P50) that the quantities actually recovered will equal or exceed the best estimate
bull There should be at least a 10 probability (P10) that the quantities actually recovered will equal or exceed the high estimate
When using the deterministic scenario method typically there should also be low best and high estimates where such estimates are based on qualitative assessments of relative uncertainty using consistent interpretation guidelines Under the deterministic incremental (risk-based) approach quantities at each level of uncertainty are estimated discretely and separately
These same approaches to describing uncertainty may be applied to Reserves Contingent Resources and Prospective Resources While there may be significant risk that sub-commercial and undiscovered accumulations will not achieve commercial production it useful to consider the range of potentially recoverable quantities independently of such a risk or consideration of the resource class to which the quantities will be assigned
Evaluators may assess recoverable quantities and categorize results by uncertainty using the deterministic incremental (risk-based) approach the deterministic scenario (cumulative) approach or probabilistic methods (see ldquo2001 Supplemental Guidelinesrdquo Chapter 25) In many cases a combination of approaches is used
Use of consistent terminology (Figure 11) promotes clarity in communication of evaluation results For Reserves the general cumulative terms lowbesthigh estimates are denoted as 1P2P3P respectively The associated incremental quantities are termed Proved Probable and Possible Reserves are a subset of and must be viewed within context of the complete Resources classification system While the categorization criteria are proposed specifically for Reserves in most cases they can be equally applied to Contingent and Prospective Resources conditional upon their satisfying the criteria for discovery andor development
Competent Personrsquos Report African Petroleum Corporation Limited
June 2013 88
For Contingent Resources the general cumulative terms lowbesthigh estimates are denoted as 1C2C3C respectively For Prospective Resources the general cumulative terms lowbesthigh estimates still apply No specific terms are defined for incremental quantities within Contingent and Prospective Resources
Without new technical information there should be no change in the distribution of technically recoverable volumes and their categorization boundaries when conditions are satisfied sufficiently to reclassify a project from Contingent Resources to Reserves All evaluations require application of a consistent set of forecast conditions including assumed future costs and prices for both classification of projects and categorization of estimated quantities recovered by each project
Competent Personrsquos Report African Petroleum Corporation Limited
June 2013 89
8 Appendix 2 Nomenclature
81 Units degC degrees Celsius
degF degrees Fahrenheit
bbl barrel
cp centipoises
ft feet
ftMDRKB feet below Kelly Bushing
ftTVDSS feet subsea
km kilometres
m metres
M or MM thousands and millions respectively
ms metres per second
md millidarcy
mTVDSS metres subsea
psia pounds per square inch absolute
psig pounds per square inch gauge
pu porosity unit
rb reservoir barrels
stb a stock tank barrel which is 42 US gallons measured at 147 pounds per square inch and 60 degrees Fahrenheit
82 Reserves and Resources Classifications
Low Low estimate of Prospective Resources as defined in SPE PRMS 2007
Best Best estimate of Prospective Resources as defined in SPE PRMS 2007
High High estimate of Prospective Resources as defined in SPE PRMS 2007
COS Geological Chance of Success associated with Prospective Resources
P10 10 per cent probability = Proved + Probable + Possible or 3P
P50 50 per cent probability = Proved + Probable or 2P
P90 90 per cent probability = Proved or 1P
83 Abbreviations AvO amplitude variation with offset
Bo oil shrinkage factor or formation volume factor in rbstb
Competent Personrsquos Report African Petroleum Corporation Limited
June 2013 90
CPI computer processed information log
FVF formation volume factor
FWL free water level
GRV gross rock volume
GWC gas water contact
KB kelly bushing
kh permeability thickness
MD measured depth
MSL mean sea level
NG net to gross ratio
OWC oil water contact
Phi porosity
PSC production sharing contract
PSDM post stack depth migration
PSTM post stack time migration
PVT pressure volume temperature experiment
RFT repeat formation tester
So oil saturation
Soi initial oil saturation
SS Subsea
STOIIP stock tank oil initially in place
Sw water saturation
Swc connate water saturation
TD total depth
TOC total organic carbon
TVD true vertical depth
TWT two way time
Vsh shale volume
Competent Personrsquos Report African Petroleum Corporation Limited
June 2013 91
Enclosures Resource Summary Sheets
Enclosure 11 Summary Description Sheet Barbet Prospect
SummaryBlock 9
APC Interest () 100
Fluid Oil
Crest (m ss) 3000
Water depth (m) 750
Notes
Area Shape F Areal NG Net Thick Porosity SO Bo STOIIP Rf Rec Res(km2) (frac) () (m) () () (rbstb) (MMstb) (frac) (MMstb)
Charge 90
Reservoir 70 Low 14 085 62 22 13 73 135 166 0300 60
Trap 50 Best 37 090 80 34 17 80 150 500 0375 186
Seal 70 High 98 095 98 53 20 88 165 1479 0450 558
COS 22 Deterministic inputs probabilistic STOIIP and Rec Resource Mean 270
Stratigraphic trap with amplitude support
Geological Risk Matrix
P10
P90metres
BARBET
dtdƐͿ
ϬŬŵϰ
Enclosure 12 Summary Description Sheet Sunbird Prospect Campanian Reservoir
SummaryBlock 8 amp 9
APC Interest () 100
Fluid Oil
Crest (m ss) 3000
Water depth (m) 1300
Notes
Area Shape F Areal NG Net Thick Porosity SO Bo STOIIP Rf Rec Res(km2) (frac) () (m) () () (rbstb) (MMstb) (frac) (MMstb)
Charge 80
Reservoir 80 Low 12 070 43 27 18 73 130 177 0300 63
Trap 60 Best 27 080 69 42 21 80 145 461 0375 172
Seal 70 High 61 090 95 66 24 88 165 1187 0450 448
COS 27 Deterministic inputs probabilistic STOIIP and Rec Resource Mean 229
Stratigraphic trap with amplitude support Split by intra-canyon
high
Geological Risk Matrix
P90
P10
metres
SUNBIRD
dtdƐͿ
ϬŬŵϰSUNBIRD
Enclosure 13 Summary Description Sheet Sunbird prospect Turonian Reservoir
SummaryBlock 8 amp 9
APC Interest () 100
Fluid Oil
Crest (m ss) 3300
Water depth (m) 1300
Notes
Area Shape F Areal NG Net Thick Porosity SO Bo STOIIP Rf Rec Res(km2) (frac) () (m) () () (rbstb) (MMstb) (frac) (MMstb)
Charge 90
Reservoir 60 Low 8 085 65 24 14 73 140 107 0300 39
Trap 50 Best 21 090 80 37 17 80 158 307 0375 115
Seal 70 High 53 095 94 58 20 88 175 863 0450 327
COS 19 Deterministic inputs probabilistic STOIIP and Rec Resource Mean 162
Stratigraphic trap with amplitude support Split by intra-canyon
high
Geological Risk Matrix
SW NE
Campanian Jacana Channel
Turonian BFF
P90
P10
metres
SUNBIRD
ϬŬŵϰ
Enclosure 14 Summary Description Sheet Sunbird Prospect Cenomanian Reservoir
SummaryBlock 8 amp 9
APC Interest () 100
Fluid Oil
Crest (m ss) 3500
Water depth (m) 1300
Notes
Area Shape F Areal NG Net Thick Porosity SO Bo STOIIP Rf Rec Res(km2) (frac) () (m) () () (rbstb) (MMstb) (frac) (MMstb)
Charge 100
Reservoir 50 Low 10 060 71 21 14 73 140 91 0300 33
Trap 60 Best 25 070 85 33 17 80 158 264 0375 99
Seal 60 High 65 080 99 51 20 88 175 779 0450 294
COS 18 Deterministic inputs probabilistic STOIIP and Rec Resource Mean 141
Stratigraphic trap with amplitude support Split by intra-canyon
high
Geological Risk Matrix
P90
P10
metres
SUNBIRD
dtdƐͿ
ϬŬŵϮ
Enclosure 15 Summary Description Sheet Lovebird Prospect Blue Horizon
SummaryBlock 8
APC Interest () 100
Fluid Oil
Crest (m ss) 5000
Water depth (m) 2850
Notes
GRV NG Porosity SO Bo STOIIP Rf Rec Res(MMm2) () () () (rbstb) (MMstb) (frac) (MMstb)
Charge 54
Reservoir 60 Low 354 30 14 60 150 68 030 25
Trap 70 Best 1310 54 19 70 180 293 038 109
Seal 90 High 4849 73 24 80 210 1218 045 456
COS 20 Mean 201
Four way dip closure to south of Block 8 Three potential
reservoirs identified Blue and Green horizon volumetrics derived
assuming ispoachous to Pink
Geological Risks
ŝŐŚĂƐĞWŝŶŬĞƉƚŚDĂƉ
Enclosure 16 Summary Description Sheet Lovebird Prospect Pink Horizon
SummaryBlock 8
APC Interest () 100
Fluid Oil
Crest (m ss) 5400
Water depth (m) 2850
Notes
GRV NG Porosity SO Bo STOIIP Rf Rec Res(MMm2) () () () (rbstb) (MMstb) (frac) (MMstb)
Charge 54
Reservoir 60 Low 354 30 12 60 155 59 030 22
Trap 70 Best 1310 54 17 70 188 262 038 96
Seal 90 High 4849 73 22 80 220 1066 045 400
COS 20 Mean 178
Four way dip closure to south of Block 8 Three potential
reservoirs identified Blue and Green horizon volumetrics derived
assuming ispoachous to Pink
Geological Risks
ŝŐŚĂƐĞWŝŶŬĞƉƚŚDĂƉ
Enclosure 17 Summary Description Sheet Lovebird Prospect Green Horizon
SummaryBlock 8
APC Interest () 100
Fluid Oil
Crest (m ss) 5800
Water depth (m) 2850
Notes
GRV NG Porosity SO Bo STOIIP Rf Rec Res(MMm2) () () () (rbstb) (MMstb) (frac) (MMstb)
Charge 54
Reservoir 60 Low 354 30 10 60 160 48 030 18
Trap 70 Best 1310 54 15 70 195 210 038 78
Seal 90 High 4849 73 20 80 230 896 045 337
COS 20 Mean 150
Four way dip closure to south of Block 8 Three potential
reservoirs identified Blue and Green horizon volumetrics derived
assuming ispoachous to Pink
Geological Risks
ŝŐŚĂƐĞWŝŶŬĞƉƚŚDĂƉ
Enclosure 18 Summary Description Sheet Wildbird Prospect
SummaryORFN $3ampQWHUHVW )OXLG 2LOampUHVWPVV DWHUGHSWKP P
Notes
Play Risk Prospect RiskGRV NG Porosity SO Bo STOIIP Rf Rec Res
6RXUFH 7UDS (MMm2) () () () (rbstb) (MMstb) (frac) (MMstb)6HDO ampKDUJH 5HVHUYRLU3UHV 5HVHUYRLU(II Low
Best High
COS 9 Deterministic inputs probabilistic STOIIP and Rec Resource Mean
)RXUZDGLSFORVHGKLJK
5
0 km 5
6 1(
PVV
Wildbird Horizons
ODFNEHUULJKWOXH3LQN5HG
mss
Enclosure 19 Summary Description Sheet Night Heron Prospect
SummaryORFN $3ampQWHUHVW RIORFN)OXLG 2LOampUHVWPVV DWHUGHSWKP
Notes
Prospect Risk Area Areal NG Net Porosity SO Bo STOIIP Rf Rec ResampKDUJH (km2) (frac) (m) () () (rbstb) (MMstb) (frac) (MMstb)5HVHUYRLU 7UDS Low 6HDO Best
High COS 144 Deterministic inputs probabilistic STOIIP and Rec Resource Mean 759
1LJKW+HURQLVD7XURQLDQEDVLQIORRUIDQVVWHPZKLFKPDLQOOLHVZLWKLQEORFNRIIVKRUHLEHULDWLVLGHQWLILHGDVDVWUDWLJUDSKLFWUDSZLWKDUHDOH[WHQWVGHILQHGEDPSOLWXGHWUXQFDWLRQDQGVWUXFWXUDOSLQFKRXW$QDUHDQHWDSSURDFKZDVDGRSWHGXVLQJWKHIXOOVWDFN360GHSWKLPDJHYROXPHWRSURYLGH61$H[WUDFWLRQDQGFRQVWUDLQDUHDOH[WHQWDQGHVWLPDWHDQDUHDO1WRDFFRXQWIRUODWHUDOYDULDELOLWZLWKLQWKHUHVHUYRLU1LJKW+HURQIDOOVSDUWORIIEORFN(5amp(FRUUHFWIRUWKLVXVLQJWKHUDWLRRIRQEORFNWRRIIEORFNDUHDLQUHSRUWLQJRIQHWXQULVNHGDQGQHWULVNHGUHVXOWV
6HLVPLFLQH36061$([WUDFWLRQ
Arbitrary line across Night Heron PSDM (Depth m)
S NE
2QWKHXSGLSSLQFKRXWLVGHILQHGELVRSDFKDQGDPSOLWXGHWUXQFDWLRQ
2QWKHXSGLSSLQFKRXWLVGHILQHGRQOELVRSDFK
Bee EaterNight Heron
5 Km
RMS Amplitudes from BFF Isopach
Depth (m)
Block Boundary
Enclosure 21 Summary Description Sheet
Summary - M - CretBlock A1
Working Interest () 60
Fluid Oil
Crest (m) 3130 (1070 bml)
Water depth (m) 2220
Notes
Play Risk Prospect Risk Area Stack F Net Porosity SO Bo STOIIP Rf Rec Res(Km2) (frac) (m) () () (rbstb) (MMstb) (frac) (MMstb)
Source 70 Trap 54
Seal 50 Mig 80 Low 8 1 15 10 55 125 82 010 13
Res Pres 80 Res Eff 80 Best 14 1 30 16 65 117 231 023 43
28 35 High 26 1 60 22 75 110 629 035 141
COS 10 Deterministic inputs probabilistic STOIIP and Rec Resource Mean 66
Structural high along edge of buried carbonate platform margin of
probable Lower Cretaceous and Jurassic age Seismic evidence
favourable for reservoir development Lower Bo model used to
reflect relatively shallow nature of prospect The prospect is close
to the shelf margin and so is well placed for charging The strong
rugose seismic events are interpreted as Karstified Limestones
Seismic Line Top Structure Map
WƌŽƐƉĞĐƚD
ĞƉƚŚŵ
Ϳ
Enclosure 22 Summary Description Sheet
Summary - SS - 4Block A1
Working Interest () 60
Fluid Oil
Crest (m) 4230 (2010 bml)
Water depth (m) 2220
Notes
Play Risk Prospect Risk Area Stack F Net Porosity SO Bo STOIIP Rf Rec Res(Km2) (frac) (m) () () (rbstb) (MMstb) (frac) (MMstb)
Source 70 Trap 80
Seal 90 Mig 85 Low 6 1 10 16 68 220 43 030 16
Res Pres 80 Res Eff 50 Best 11 1 19 20 75 167 113 038 42
50 34 High 21 1 35 24 83 135 295 045 112
COS 17 Deterministic inputs probabilistic STOIIP and Rec Resource Mean 56
Four way dip closed anticlinal structure The SS-4 interval has a
gross thickness over the crest area of 360 m Downlap of seismic
events across the crest of the SS-4 structure slightly downgrades
SS-4 seal The interval is believed to be Cenomanian in age and
the seismic character of generally planar events is interpreted as
representing thin bedded turbidites
Seismic Line Top Structure Map
2010 Migration Velocity Data ndash SS-4 Probability Above Spill
Enclosure 23 Summary Description Sheet
Summary - SS - 3Block A1
Working Interest () 60
Fluid Oil
Crest (m) 4590 (2370 bml)
Water depth (m) 2220
Notes
Play Risk Prospect Risk Area Stack F Net Porosity SO Bo STOIIP Rf Rec Res(Km2) (frac) (m) () () (rbstb) (MMstb) (frac) (MMstb)
Source 70 Trap 75
Seal 90 Mig 85 Low 12 1 20 15 68 227 197 025 63
Res Pres 80 Res Eff 50 Best 17 15 35 18 75 173 417 034 143
50 32 High 25 2 60 20 83 140 881 045 316
COS 16 Deterministic inputs probabilistic STOIIP and Rec Resource Mean 173
Four way dip closed anticlinal structure The SS-3 interval has a
gross thickness over the crest area of 550 m Seals to deeper
reservoirs may be eroded by overlying reservoirs From seismic
the prospective reservoir has been interpreted as being an Albian
deep water channel-lobe complex
Seismic Line Top Structure Map
2010 Migration Velocity Data ndashSS-3 Probability Above Spill
Enclosure 24 Summary Description Sheet
Summary - SS - 2Block A1
Working Interest () 60
Fluid Oil
Crest (m) 5140 (2920 bml)
Water depth (m) 2220
Notes
Play Risk Prospect Risk Area Stack F Net Porosity SO Bo STOIIP Rf Rec Res(Km2) (frac) (m) () () (rbstb) (MMstb) (frac) (MMstb)
Source 70 Trap 75
Seal 90 Mig 85 Low 12 1 20 11 68 231 187 025 58
Res Pres 80 Res Eff 50 Best 17 2 35 14 75 183 416 032 133
50 32 High 25 3 60 17 83 151 911 040 303
COS 16 Deterministic inputs probabilistic STOIIP and Rec Resource Mean 163
Four way dip closed anticlinal structure The SS-2 interval has a
gross thickness over the crest area of 830 m The prospective
reservoir has been interpreted as a stacked series of channellobe
sets Seals to deeper reservoirs may be eroded by overlying
reservoirs
Seismic Line Top Structure Map
2010 Migration Velocity Data ndashSS-2 Probability Above Spill
Enclosure 25 Summary Description Sheet
Summary - SS - 1Block A1
Working Interest () 60
Fluid Oil
Crest (m) 5970 (3750 bml)
Water depth (m) 2220
Notes
Play Risk Prospect Risk Area Stack F Net Porosity SO Bo STOIIP Rf Rec Res(Km2) (frac) (m) () () (rbstb) (MMstb) (frac) (MMstb)
Source 70 Trap 65
Seal 90 Mig 80 Low 17 1 20 8 50 249 158 015 34
Res Pres 80 Res Eff 50 Best 30 2 35 11 60 196 399 024 98
50 26 High 54 3 60 13 70 162 997 040 276
COS 13 Deterministic inputs probabilistic STOIIP and Rec Resource Mean 135
Four way dip closed anticlinal structureThe SS-1 interval has a
gross thickness over the crest area of 890 m The prospective
reservoir lies under an unconformity and is believed to be Jurassic
in age its seismic character suggests a channel amp channel-levee
complex Regional porosity trends indicate low porosities are likely
to be encountered if hydrostatic pressures are assumed
Seismic Line Top Structure Map
2010 Migration Velocity Data ndash SS-1 Probability Above Spill
Enclosure 31 Summary Description Sheet
SummaryBlock SL-03
APCL Interest () 90
Fluid Oil
Crest (m ss) 5400
Water depth (m) 3300
Notes
Play Risk Prospect Risk Area Areal NG Net Porosity SO Bo STOIIP Rf Rec Res(km2) (frac) (m) () () (rbstb) (MMstb) (frac) (MMstb)
Source 80 Trap 50
Seal 90 Mig 70 Low 11 070 29 15 73 205 218 030 79
Res Pres 90 Res Eff 80 Best 32 082 56 18 80 162 755 038 278
65 28 High 92 094 83 21 88 134 2473 045 938
COS 18 Mean 434
Altair is a Turonian turbidite channel prospects within the
SL-03 Block offshore Sierra Leone It is identified as a
stratigraphic trap with areal extents defined by amplitude
truncation and structural pinchout Recent discoveries in
nearby blocks confirm a working hydrocarbon system
(Venus-B1 Jupiter-1 and Mercury-1) The Sierra Leone
wells A-1 and A1-2 proved good reservoir and potential
source rocks Two distinct canyon systems feed erosive
channels at the break of slope An area net approach was
adopted using a pseudo-gradient volume SNA extraction to
constrain areal extent and define an areal NG to account
for lateral variability of sand distribution within the
reservoir
Arbitrary Dip Line Grad TWTGrad NRMS Extraction
Enclosure 41 Summary Description Sheet
SummaryBlock CI-513
APCL Interest () 90
Fluid Oil
Crest (m ss) 4200
Water depth (m) 2500
Notes
Play Risk Prospect Risk Area Areal NG Net Porosity SO Bo STOIIP Rf Rec Res(km2) (frac) (m) () () (rbstb) (MMstb) (frac) (MMstb)
Source 60 Trap 50
Seal 90 Mig 70 Low 11 070 20 17 73 181 179 030 65
Res Pres 90 Res Eff 80 Best 40 085 38 20 80 149 815 038 302
49 28 High 149 099 55 23 88 126 3474 045 1318
COS 14 Mean 569
Ayame is an Upper Cretaceous fan which mainly lies
ZLWKLQEORFNampRIIVKRUHampRWHparaYRLUHWLVLGHQWLILHGas a stratigraphic trap with areal extents defined by
amplitude truncation and structural pinchout The prospect
has very good amplitude support An area net approach
was adopted using pseudo-gradient volume SNA NRMS
extractions to constrain areal extent and define an areal
NG to account for lateral variability of sand distribution
within the reservoir for low and high case area polygons
These seismically defined polygons were then filled to
column heights of 200m and 800m respectively and used
to constrain the P90 and P10 area inputs of our
probabilistic simulation
Seismic Line
TWT Grad SNA Extraction
Ayame
Ayame West
dtdƐͿ
Ayame
Enclosure 42 Summary Description Sheet
SummaryBlock CI-513 amp Open
APCL Interest () 90 in CI-513
Fluid Oil
Crest (m ss) 4900
Water depth (m) 2700
Notes
Play Risk Prospect Risk Area Areal NG Net Porosity SO Bo STOIIP Rf Rec Res(km2) (frac) (m) () () (rbstb) (MMstb) (frac) (MMstb)
Source 60 Trap 50
Seal 90 Mig 70 Low 10 061 25 14 73 194 161 030 58
Res Pres 90 Res Eff 80 Best 30 080 47 18 80 159 585 038 216
49 28 High 93 099 69 21 88 134 2085 045 788
COS 14 Mean 352
A second prospect within the same reservoir interval was
identified and volumetrically assessed Ayame West is
separated from Ayame by a structural high isopach
thinning and amplitude dimming The prospect was
assessed in the same manner as Ayame with a but with
Low Case column height of 600m filling down to the point
at which amplitudes between the two fans brighten
allowing possible communication The upper end of the
Ayame West fan lies down-dip of Ayame and less than
1km away from the thinning low amplitude saddle between
the two prospects
Seismic Line
TWT Grad SNA Extraction
Ayame
West
Ayame West
dtdƐͿ
Ayame
Enclosure 43 Summary Description Sheet
SummaryBlock CI-513 CI-509
APCL Interest () 90 of CI-513
Fluid Oil
Crest (m ss) 4400
Water depth (m) 2500
Notes
Play Risk Prospect Risk Area Areal NG Net Porosity SO Bo STOIIP Rf Rec Res(km2) (frac) (m) () () (rbstb) (MMstb) (frac) (MMstb)
Source 60 Trap 40
Seal 90 Mig 70 Low 6 070 15 16 73 185 71 030 26
Res Pres 90 Res Eff 70 Best 23 084 28 19 80 152 320 038 118
49 20 High 92 098 42 22 88 129 1408 045 521
COS 10 Mean 237
This sheet refers to volumes associated with Blocks 513 and CI-509 Sassandra is an Upper Cretaceous fan
which straddles blocks CI-513 and CI-509 It is identified
as a stratigraphic trap with areal extents defined by
amplitude truncation and structural pinchout A single
target reservoir is identified within the Turonian The
prospect has good amplitude support An area times net
approach was adopted using a pseudo-gradient volume
NRMS extraction to constrain prospect size Angle stacks
were not available outside of Block CI-513 so an RMS
extraction on the full stack volume was used to determine
NW extent In our low case we restrict the area of the
accumulation to the brightest area of anomalous
amplitudes Our high case extends the prospect down-dip
Arbitrary Dip Line Grad TWT
Full Stack - RMS Extraction
Sassandra
dtdƐͿ
Enclosure 44 Summary Description Sheet
SummaryBlock CI-513
APCL Interest () 90
Fluid Oil
Crest (m ss) 3900
Water depth (m) 2500
Notes
Play Risk Prospect Risk Area Areal NG Net Porosity SO Bo STOIIP Rf Rec Res(km2) (frac) (m) () () (rbstb) (MMstb) (frac) (MMstb)
Source 60 Trap 40
Seal 90 Mig 70 Low 4 071 20 19 73 185 67 030 25
Res Pres 90 Res Eff 70 Best 13 085 38 22 80 152 281 038 104
49 20 High 46 099 55 25 88 129 1142 045 431
COS 10 Mean 190
Cavalla is an Upper Cretaceous Fan which lies between
the Ayame and Sassandra prospects of Block CI-513
RIIVKRUHampRWHparaYRLUHWLVLGHQWLILHGDVDVWUDWLJUDSKLFtrap with areal extents defined by amplitude truncation and
structural pinchout A single target reservoir is identified
within the TuronianCenomanian interval which lies
stratigraphically beneath the Ayame Prospect For the
amplitude analysis the top reservoir has been shifted up
30ms to bracket strong negative amplitudes on the
Gradient volume and the base reservoir has been shifted
up 50ms to remove Albian related amplitudes An area net
approach was adopted using pseudo-gradient volume SNA
NRMS extractions to constrain extent of the low and high
case area polygons These seismically defined polygons
were then filled to column heights of 200m and 800m
respectively
Arbitrary Dip Line Grad TWT Grad NRMS Extraction
Cavalla
dtdƐͿ
Enclosure 45 Summary Description Sheet
SummaryBlock CI-509
APCL Interest () 90
Fluid Oil
Crest (m ss) 3700
Water depth (m) 2500
Notes
Play Risk Prospect Risk Area Areal NG Net Porosity SO Bo STOIIP Rf Rec Res(km2) (frac) (m) () () (rbstb) (MMstb) (frac) (MMstb)
Source 60 Trap 60
Seal 90 Mig 70 Low 5 076 39 21 73 150 252 015 55
Res Pres 90 Res Eff 80 Best 18 088 75 24 80 134 997 028 258
49 34 High 61 100 111 27 88 121 3682 040 1039
COS 16 Mean 460
Leraba is an Upper Cretaceous fan It is identified as a
stratigraphic trap with extents defined by amplitude
truncation and structural pinchout The final processing
products and AvO volumes are yet to be delivered for CI-
KRZHYHUWKHmicroHRWUDFHUDZPLJUDWLRQVWDFNparaYROXPHLVof high quality and is deemed suitable for deriving a
volumetric range for Leraba An area net approach was
adopted using an RMS extraction to constrain extent and
define an areal NG to account for lateral variability of sand
distribution In our low case we restrict the area to the
brightest area of anomalous amplitudes Our high case
extends the prospect down-dip and SW to include a
secondary channel system
Arbitrary Dip Line TWT Full Stack RMS Extraction
Leraba
dtdƐͿ
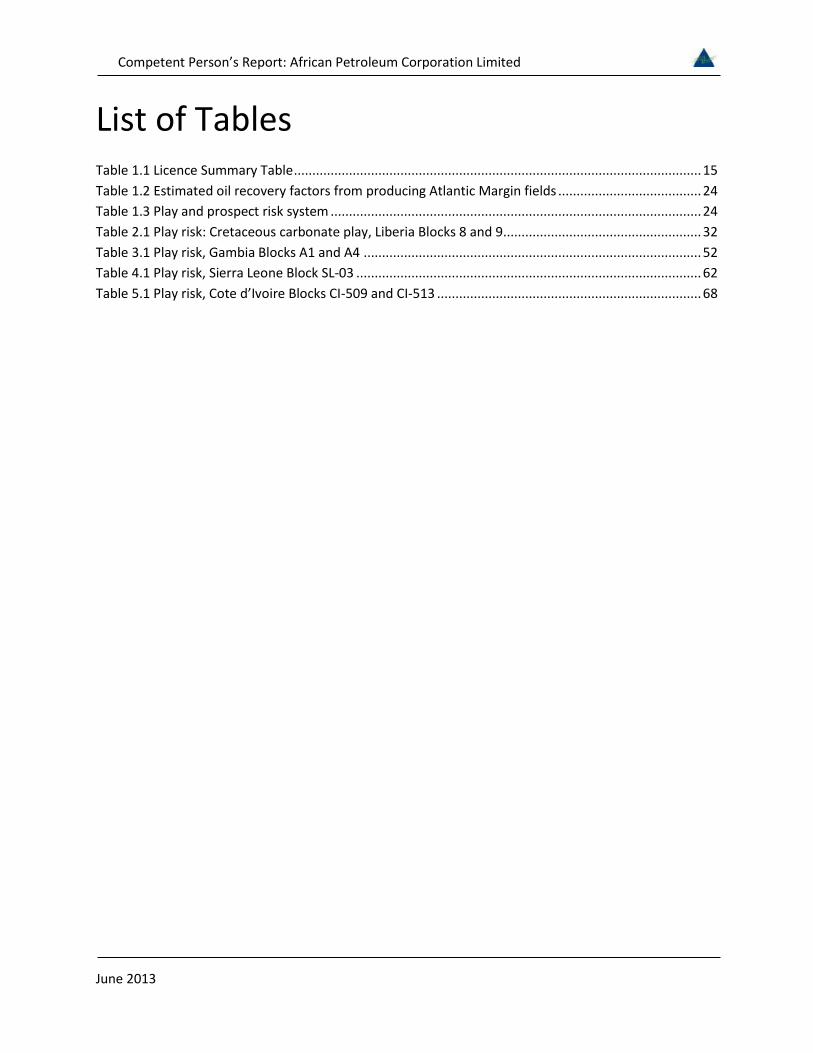
Competent Personrsquos Report African Petroleum Corporation Limited
June 2013
List of Tables Table 11 Licence Summary Table 15 Table 12 Estimated oil recovery factors from producing Atlantic Margin fields 24 Table 13 Play and prospect risk system 24 Table 21 Play risk Cretaceous carbonate play Liberia Blocks 8 and 9 32 Table 31 Play risk Gambia Blocks A1 and A4 52 Table 41 Play risk Sierra Leone Block SL-03 62 Table 51 Play risk Cote drsquoIvoire Blocks CI-509 and CI-513 68
Competent Personrsquos Report African Petroleum Corporation Limited
June 2013
List of Figures Figure 1-1 Location of APCL licences West Africa 14 Figure 1-2 Location of Liberia Blocks 8 and 9 16 Figure 1-3 Location of Gambia Blocks A1 and A4 17 Figure 1-4 Location of Senegal ROP and SOSP Licences 18 Figure 1-5 Location of Blocks SL-03 and SL-04A 20 Figure 1-6 Location of Blocks CI-509 and CI-513 21 Figure 2-1 Notable discoveries West Africa offshore 27 Figure 2-2 Well and seismic database Liberia Blocks 8 and 9 28 Figure 2-3 Petroleum systems and plays Liberia Blocks 8 and 9 30 Figure 2-4 Porositydepth trend published West Africa turbidite reservoirs 31 Figure 2-5 Leads and Prospects Liberia Blocks 8 and 9 33 Figure 2-6 Seismic line (depth) over the Barbet prospect 34 Figure 2-7 Barbet far offset amplitudes with Top Turonian depth contours (m TVDSS) 35 Figure 2-8 Regional seismic line along axis of the Sunbird canyon system 36 Figure 2-9 Sunbird Campanian far offset amplitudes with Cenomanian depth contours (m TVDSS) 37 Figure 2-10 Sunbird Turonian far offset amplitudes with Top Turonian depth contours (m TVDSS) 38 Figure 2-11 Sunbird Cenomanian far offset amplitudes with Cenomanian depth contours (m TVDSS) 39 Figure 2-12 Arbitrary line across Night Heron PSDM (Depth m) 40 Figure 2-14 SNA from Basin Floor Fan Isopach (m) - PSDM 41 Figure 2-15 Seismic line over the Lovebird prospect 42 Figure 2-16 Lovebird prospect Top Pink horizon depth (mss) high case 43 Figure 2-17 Seismic line and prospect geo-seismic sketch Wildbird prospect 45 Figure 2-18 Wildbird Top Reservoir depth map (m TVDSS) Spill point - green contour 46 Figure 3-1 Plays Gambia Blocks A1 and A4 47 Figure 3-2 Wells 2D and 3D seismic data (red outline) Gambia Blocks A1 and A4 48 Figure 3-3 Well to seismic tie ndash Well Jammah-1 to the Alhamdulilah prospect 50 Figure 3-4 Leads and prospects identified by APCL in Gambia Blocks A1 and A4 53 Figure 3-5 Seismic line over the Alhamdulilah prospect 54 Figure 3-6 Area of closure Alhamdulilah prospect layers SS1 to SS4 55 Figure 3-7Alhamdulilah prospect seismic facies interpretation Cretaceous intervals 56 Figure 3-8 Seismic line through Prospect M 57 Figure 3-9 Low and high case closure Prospect M top Aptian depth (m TVDSS) 58 Figure 4-1 Offshore licences and discoveries Liberia and Sierra Leone 59 Figure 4-2 Well and seismic database offshore Sierra Leone 60 Figure 4-3 Leads Sierra Leone Block SL-03 61 Figure 4-4 Dip seismic line (full offsets) Altair prospect 63 Figure 4-5 Seismic amplitude (gradient stack) and Top Turonian depth (m TVDSS) Altair prospect 64 Figure 5-1 CI-509 and CI-513 Prospects and Leads offshore Cote drsquoIvoire 65
Competent Personrsquos Report African Petroleum Corporation Limited
June 2013
Figure 5-2 Petroleum systems and plays offshore Cote drsquoIvoire 66 Figure 5-3 Well and seismic database offshore Sierra Leone 67 Figure 5-4 Strike Line Ayame and Ayame West prospects 69 Figure 5-5 Ayame Seismic amplitude (gradient stack) and Top Turonian depth (m TVDSS) 70 Figure 5-6 Dip seismic line Sassandra prospect 71 Figure 5-7 Sassandra prospect Seismic amplitude and Top Turonian depth (m TVDSS) 72 Figure 5-8 Dip seismic line Cavalla prospect 74 Figure 5-9 Seismic amplitude (gradient stack) and Top fan depth (m TVDSS) Cavalla prospect 75 Figure 5-10 Dip seismic line Leraba prospect 76 Figure 5-11 Seismic amplitudes Leraba prospect 77 Figure 6-1 Petroleum systems and plays offshore Senegal 78 Figure 6-2 leads offshore Senegal Blocks ROP and SOSP 79
Competent Personrsquos Report African Petroleum Corporation Limited
June 2013 14
1 Introduction
At the time of writing African Petroleum Corporation Limited (APCL) holds interests in and operates exploration licences offshore West Africa within the territorial waters of Senegal the Gambia Sierra Leone Liberia and Cote drsquoIvoire (Figure 1-1) The status of these licences is summarised in Table 11 below ERC Equipoise Ltd (ERCE) has reviewed the prospectivity of these licences using data as of 31st May 2013
Figure 1-1 Location of APCL licences West Africa
Currently prospective resources are identified by APCL within the Liberia Gambia Sierra Leone and Cote drsquoIvoire licences We have made independent estimates of prospective resources and geological chance of success for certain prospects within these countries which are identified by APCL as near-term drilling opportunities The evaluation of the offshore Senegal licences is on-going and no prospects have been identified as of the date of this report We summarise qualitatively the prospectivity of the licences held by APCL in this country
Competent Personrsquos Report African Petroleum Corporation Limited
June 2013 15
Country Block Licence
Operator APCL () Status
Licence
Area (km2)
Outstanding Commitment in this Phase
Start of Current Phase
End of Current Phase
Liberia 8 APCL 100 Expl June 2012
June 2014
2717 Two
Exploration wells
Liberia 9 APCL 100 Expl June 2012
June 2014
2634 None
Gambia A1 APCL 60 Expl Dec
2007 Dec
2013 1296
One Exploration
well 1
Gambia A4 APCL 60 Expl Dec
2007 Dec
2013 1376 (see A1)
Senegal Rufisque Offshore Profond
APCL 90 Expl Oct
2011 Oct
2015 10357
One exploration
well
Senegal
Senegal Offshore
Sud Profond
APCL 90 Expl Oct
2011 Oct
2014 7920 None
Sierra Leone
SL-03 APCL 100 Expl Feb
2011 Feb
2014 3860 None
Sierra Leone
SL-04A APCL 100 Expl Sept 2012
Sept 2015
1995 One
exploration well 2
Cote drsquoIvoire
CI-509 APCL 90 Expl March 2012
March 2015
1091 One
exploration well
Cote drsquoIvoire
CI-513 APCL 90 Expl Dec
2011 Dec
2014 1446
One exploration
well
1) Transferrable to Block A4 if necessary 2) Contingent on results of 3D and that technology is available to drill in such water depths
Table 11 Licence Summary Table
Competent Personrsquos Report African Petroleum Corporation Limited
June 2013 16
11Liberia PSC Overview
APCL holds a 100 contractor interest in a Production Sharing Contract (ldquoPSCrdquo) covering Blocks 8 amp 9 offshore Liberia (Figure 1-2) Both blocks are in their second exploration period which began on 12th June 2012 and lasts for two years Commitments during the second phase in Block 8 are two exploration wells (to a minimum depth of 2000 meters) as a well commitment from the first exploration phase has been carried into the second phase All commitments have been met for the second phase in Block 9 with the drilling of Well Bee Eater-1 The minimum spend for each block in the second exploration period is US$ 10 MM At the end of this second phase a further 25 of each licence must be relinquished
Figure 1-2 Location of Liberia Blocks 8 and 9
For each block there is one further optional exploration period of two years that can be entered into with an additional well (to a minimum of 2000 metres) being required in each block in each period At the end of the third period all areas not retained for appraisal and development are to be relinquished There are also provisions for an appraisal period and an exploitation period of 25 years (with an additional term of 10 years if necessary) for each development area
Competent Personrsquos Report African Petroleum Corporation Limited
June 2013 17
Following a 25 relinquishment at the end of the first exploration phase Block 8 comprises an area of 2717 km2 and Block 9 comprises 2634 km2 Water depths range from less than 100 m to over 3000 m Most of the block areas lie in water depths greater than 500 m
12Gambia PSC Review
APCL holds a 60 contractor interest in Production Sharing Contracts covering Blocks A1 and A4 offshore Gambia (Figure 1-3) with Buried Hill Gambia BV holding the remaining 40 The licences were signed on 8th September 2006 with an effective date of 31st December 2007 and following two extensions they are still currently in the first exploration period which runs through to 31 December 2013
The work commitment during the first period comprises 1000 km2 of 3D seismic data in Block A1 and 750 km2 of 3D seismic data in Block A4 and one well which may be drilled in either block The seismic commitment has already been met
There are two further optional (but automatic) exploration periods of three years each that can be entered into with a well being required in each period in each licence Furthermore in Block A1 relinquishment of 10 of the licence area is required at the end of the first exploration period and 20 at the end of the second period In Block A4 relinquishment of 10 of the licence area is required at the end of the first exploration period In both blocks at the end of the third period all areas not retained for appraisal and development are to be relinquished There are also provisions for an exploitation period with the total term of the licences being 30 years (including the exploration periods) for each development area
The area of the licence is 1296 km2 for Block A1 and 1376 km2 for Block A4 Water depths vary from 500 m to over 3000 m
Figure 1-3 Location of Gambia Blocks A1 and A4
Competent Personrsquos Report African Petroleum Corporation Limited
June 2013 18
13Senegal PSC Review
APCL holds a 90 contractor interest in Exploration and Production Sharing Contracts (EPSC) covering Blocks Rufisque Offshore Profond (ROP) and Senegal Offshore Sud Profonde (SOSP) offshore Senegal (Figure 1-4) via its wholly owned subsidiary African Petroleum Senegal Limited Petrosen the state oil company hold a 10 carried interest
The EPSC governing block SOSP has an effective date of 25th October 2011 The first 85 years of the EPSC are termed the exploration phase which is subdivided into an initial period of three years with two subsequent extension periods of three and two and a half years each Work commitment in the initial exploration period is to acquire and reprocess the existing seismic data within the licence area and also to acquire a further 2500 km2 of 3D seismic data all with a minimum investment of US$ 10 MM The two extension periods have a commitment of one exploration well to a minimum depth of 3500 mss in each period or a minimum investment of US$ 20 MM Entry to the first extension period requires a 30 relinquishment of the licence area and a further 20 of the initial licence area must be relinquished on entry to the third phase The area of the licence is currently 7920 km2 Water depth is between 1000 and 4000 m over the block
Figure 1-4 Location of Senegal ROP and SOSP Licences
Competent Personrsquos Report African Petroleum Corporation Limited
June 2013 19
The EPSC governing Block ROP is of similar structure to that governing Block SOSP It has an effective date of 25th October 2011 The first eight years of the EPSC are termed the exploration phase which is subdivided into an initial period of four years with two subsequent extension periods of two years each Work commitment in the initial exploration period is to acquire the existing seismic data within the licence area for a minimum of US$ 2 MM and drill one exploration well to a minimum depth of 3500 m TVDSS or a minimum investment of US$ 20 MM The two extension periods have a further commitment of one exploration well to a minimum depth of 3500 m TVDSS in each period or a minimum investment of US$ 20 MM Entry to the first extension period requires a 30 relinquishment of the licence area and a further 20 of the initial licence area must be relinquished on entry to the third period The area of the licence is currently 10357 km2 Water depth is between 1500 and 3000 m over the block
APCL has met the seismic commitment of the first exploration period
Petrosen has a back-in right if an exploitation period is authorised for up to 20 of the licence subject to contribution of its share of forward costs (excluding training) The duration of an exploitation period is 25 years from authorisation with option for two ten year extensions at the discretion of the state
14Sierra Leone PSC Review
APCL holds a 100 contractor interest in a PSC covering Block SL-03 offshore Sierra Leone (Figure 1-5) through its wholly owned subsidiary European Hydrocarbons Ltd The licence was awarded on 23rd April 2010 and ratified on 22nd February 2011 APCL also holds a 100 contractor interest in a PSC covering Block SL-04A through its wholly owned subsidiary African Petroleum Sierra Leone Ltd The PSC governing Block SL-04A was ratified on 21st September 2012
The SL-03 licence has a duration of thirty years the first seven of which are termed the exploration period which is further subdivided into an initial period of three years followed by two extension periods of two years each The licence is currently in the initial exploration period
Work commitments during the initial period for Block SL-03 are to purchase and interpret the existing 2D seismic data over the licence and acquire a minimum of 500 km2 of 3D seismic data APCL has purchased the 2D seismic data and has acquired 2535 km2 of multi-client 3D seismic data over Block SL-03 fulfilling the seismic commitment for the initial phase The first and second extension periods require the drilling of one exploration well to a minimum depth (below mud line) of 1300 m or a minimum equivalent investment of US$ 30 MM Entry to the first extension period requires a 50 relinquishment of the licence area and a further 25 of the initial licence area must be relinquished on entry to the second extension period The area of the licence is 3860 km2 and water depth varies from 100m to over 4000m with the south-western half of the block being at water depths greater than 3000m
Competent Personrsquos Report African Petroleum Corporation Limited
June 2013 20
Figure 1-5 Location of Blocks SL-03 and SL-04A
The PSC covering Block SL-04A was ratified on 21st September 2012 The licence term is for thirty years the first seven years of which are defined as the exploration period which is further subdivided into an initial period of three years and two subsequent periods of two years Each well drilled in the initial exploration period extends this period by three months Work commitments during the initial phase are to acquire at least 1500 km2 of 3D seismic data and drill one exploration well (to a minimum depth of 2500m) contingent on the results of the 3D and the availability of drilling technology for such deep water The minimum equivalent investment is US$ 10 MM In 2011 TGS acquired 1085 km2 of multi-client 3D seismic data over Block SL-04A Upon licencing these data APCL will have fulfilled the seismic commitment for the initial phase
The subsequent two exploration periods require the drilling of one exploration well in each period (to a minimum depth of 2500 m) or a minimum investment of US$ 50 MM Entry to the second period requires a 50 relinquishment of the licence area and a further 25 of the initial licence area must be relinquished on entry to the third phase The area of the licence is currently 1995 km2 Water depth is between 3000 and 4000 m over the block
Competent Personrsquos Report African Petroleum Corporation Limited
June 2013 21
The state retains the right to a 10 carried interest during any development phase in both licences with the option to acquire a further 5 by covering an equivalent proportion of any development costs
15Cote13 drsquoIvoire13 PSC13 Review
APCL holds a 90 per cent contractor interest in two PSCs governing Block CI-509 and Block CI-513 offshore Cote drsquoIvoire (Figure 1-6) via its wholly owned subsidiary African Petroleum Cote drsquoIvoire Limited The state oil company Petroci has a 10 carried interest
Figure 1-6 Location of Blocks CI-509 and CI-513
The PSC for Block CI-509 was awarded on 16th March 2012 The first eight years of the PSC are termed the exploration period which is further divided into three terms of three three and two years respectively The licence is currently in its first exploration term Work commitments during the first exploration term are to purchase the existing 2D seismic data acquire 1091 km2 (ie a block wide) 3D seismic survey and drill one exploration well at least 100 m into the Albian (Lower Cretaceous) section The minimum investment is US$ 60 MM The second and third terms have a further commitment to drill one exploration well to at least 100 m into the Albian (Lower Cretaceous) section with a minimum investment of US$ 50 MM Entry to the second term requires a 25 relinquishment of the licence area and a further 25 of the initial licence area must be relinquished on entry to the third term The area of the licence is currently 1091 km2 Water depth is between 1900 and 3250 m over the block
Competent Personrsquos Report African Petroleum Corporation Limited
June 2013 22
The PSC covering Block CI-513 has an effective date of 19th December 2011 It has a similar structure to that governing Block CI-509 The first seven years are termed the exploration period subdivided into three terms of three two and two years The licence is currently in its first exploration term Work commitments during the first exploration term are to purchase the existing 2D seismic data acquire 1446 km2 (ie a block wide) 3D seismic survey and drill one exploration well at least 100 m into the Albian (Lower Cretaceous) section The minimum investment is US$ 60 MM The second and third terms have a further commitment to drill one exploration well to at least 100 m into the Albian (Lower Cretaceous) section with a minimum investment of US$ 50 MM Entry to the second term requires a 25 relinquishment of the licence area and a further 25 of the initial licence area must be relinquished on entry to the third term The area under licence is currently 1446 km2 Water depth is between 900 and 3100 m over the block
The exploitation period of both licences is for 25 years subject to successful award in the event of a commercial discovery On development Petroci has the right to acquire an interest of up to 20 in each licence subject to payment of its portion of future costs
In October 2012 APCL completed acquisition of 4200 km2 of 3D seismic data covering blocks CI-508 CI-509 and CI-513 fulfilling the seismic work commitments of the first exploration phase of both PSCs APCL is planning a two well drilling programme for the licences during 2014
16Evaluation Methodology Prospective Resources
We have used probabilistic methods to evaluate selected prospects within Liberia Blocks 8 and 9 Gambia Blocks A1 and A4 Sierra Leone Block SL-03 and Cote drsquoIvoire Blocks CI-513 and CI-509 We classify the results of our simulation as Low Best and High estimates of prospective resources following the Petroleum Resources Management System or PRMS (Appendix 1) We have assigned geological chance of success to each of the prospects using the methodology described below Estimates are made for oil only although we recognise that due to the significant uncertainties in the available geological information that there is a possibility of gas charge in all licences We present a summary of input estimates output STOIIP and gross resources and geological chance of success as a resource summary sheet for each prospective interval investigated These can be found in the enclosures 11 to 45 in this document
Inputs to our probabilistic simulation are evaluated in a consistent manner For the structurally trapped prospective intervals in Liberia (the Lovebird and Wildbird prospects) and the Alhamdulilah prospect in Gambia we have made a low and high deterministic estimate of closing contour for each trap to reflect the uncertainty in both mapping and depth conversion For Liberia we use the gross-rock volume (GRV) derived in this manner to constrain the P90 and P10 of our GRV distribution in our probabilistic simulation For Gambia we have used the areal extents of the low and high cases as inputs to an area times net calculation
Competent Personrsquos Report African Petroleum Corporation Limited
June 2013 23
For the stratigraphically trapped prospects in Liberia (Barbet Night Heron and Sunbird) Cote drsquoIvoire (Sassandra Ayame Ayame West Cavalla and Leraba) and Sierra Leone (Altair) we have made low and high estimates of area of closure using both structural and amplitude support where possible We have then made low and high estimates of gross reservoir thickness derived from regional observations calibrated against seismic data where possible As such depositional systems also have laterally variable sand distributions often supported by seismic data we employ the concept of an areal net to gross ratio varying the percentage of sand areally within the overall stratigraphic trap based on the uncertainty in seismic amplitude strength Where appropriate a geological shape factor is used depending on trap shape and structural relief relative to reservoir thickness
Estimates of reservoir porosity and net to gross ratio are made with reference to regional data offset wells including recent drilling by APCL in Liberia and account for compaction and a degree of overpressure (Figure 2-4) We make low mid and high deterministic estimates and use these to constrain the P90 P50 and P10 inputs to a probabilistic simulation Inputs for hydrocarbon saturation are constrained in a similar manner with reference to regional porosity and permeability trends calibrated to APCLrsquos recent drilling results in Liberia
We have estimated oil formation volume factors for a range of gas oil ratios (GOR) (from an appropriate minimum to fully saturated) for each of the prospective intervals assuming 4oC at the mudline (seabed) and geothermal gradients between 25 and 35oC per 100 m consistent with regional observation and the available well data We assume that the minimum GOR will increase with depth below the mudline Our estimates are calibrated against the oil samples in Well Narina-1 when estimating resources for the Liberian prospects
Some degree of overpressure is accounted for as it has been in our estimates of porosity but by reference to offset discoveries we assume that it is unlikely to exceed 500 psi over the depth range investigated
Recovery factors for the clastic reservoirs are estimated with reference to published information from discoveries in similar reservoir types examples of which are tabulated below (Table 12) Based on this table we estimate low best and high recovery factors of 30 375 and 45 respectively Again these are used to constrain the P90 P50 and P10 of our input distribution during probabilistic simulation
Some prospects are deep relative to mud line and we expect reservoir quality to be reduced despite overpressure We reduce our recovery factor estimates accordingly where this is the case Some prospects are relatively shallow to mud line Where this is the case we model a more viscous oil (prospects materially less than 1500m below sea bed) and have reduced our low best and high recovery factor range to 15 275 and 40 respectively In all cases we assume that a development is able to effectively dispose of any associated gas
Recovery factors for the carbonate reservoirs of the Wildbird prospect in Liberia and Prospect M in the Gambia are estimated by reference to more regional analogues and are discussed in the relevant sections
Competent Personrsquos Report African Petroleum Corporation Limited
June 2013 24
Due to the early stage of exploration within APCLrsquos licences we have adopted a six component risk matrix in all areas barring Liberia to estimate geological chance of success (COS) separated into play and prospect specific risks (Table 13) We have adopted this form of presentation of COS to reflect the fact that deep water exploration in much of the West African Atlantic Margin is at a very early stage and also that a number of the identified prospects have risk dependence and thus can be grouped as a play
Table 12 Estimated oil recovery factors from producing Atlantic Margin fields
PLAY RISK PROSPECT RISK
SOURCE RESERVOIR SEAL TRAP CHARGE RESERVOIR (Presence and Maturity) (Presence) (Presence) (Definition and Efficacy) (Migration) (Efficacy) Incorporates trap definition and seal risk (including biodegradation risk where necessary)
Table 13 Play and prospect risk system
The play risk segment focuses solely on the elements required in a given play to make a hypothetical prospect successful source reflecting the presence and thermal maturity of available source rocks with sufficient generation and expulsion to charge prospects reservoir reflecting the presence regionally of geological intervals that could potentially contain reservoir rock and seal ndash the regional presence of a sealing formation with sufficient thickness and extent to trap hydrocarbons
Prospect risk is divided into three elements Commonly we present seal and trap risk combined as an overall illustration of the integrity of the container here labelled trap risk Charge risk reflects the risk to migration of hydrocarbons from the source rock into the prospect and reservoir risk reflects solely the efficacy (ie porosity and permeability) of any identified reservoir interval
Note that a successful well on a given prospect may reduce or remove the play risk should the well prove reservoir charge and seal in a given play This will have the effect of de-risking further prospects associated with that play
Country Field Start Date Np Max Water Depth Prod Ult
RecoveryRec
FactorRecovery
Prod STOIIP
(MMstb) (m) (MMstb) (MMstb) (MMstb)Eq Guinea Ceiba Nov-00 112 800 18 187 40 10 468Eq Guinea Zafiro Aug-96 652 850 62 1583 40 26 4008Angola Girassol Dec-01 332 1360 32 958 45 30 2129Angola Kuito Dec-99 133 410 36 650 46 18 1413Brasil Espadarte Aug-00 67 877 10 261 31 26 842Brasil Marlim Mar-91 1720 853 101 2878 33 28 8721Total 259 6517 17580Average - Arithmetic 39 23Average - Weighted by STOIIP Ult Rec 37 25
Low Best High30 375 45
Fields on Atlantic Margin with significant production
Hence RF Range
Competent Personrsquos Report African Petroleum Corporation Limited
June 2013 25
Recent drilling within Liberia Blocks 8 and 9 has de-risked the play As a result we adopt prospect specific risking alone as source reservoir trap and seal with the same definitions as described above (Table 13)
Competent Personrsquos Report African Petroleum Corporation Limited
June 2013 26
2 Liberia Prospectivity and Plays
21Introduction
All of the available deep-water acreage offshore Liberia-Sierra Leone basin is under licence (Figure 1-2) Regionally hydrocarbons have been discovered within sandstones at a number of stratigraphic levels from the pre-rift to early syn-rift Albian in Cote drsquoIvoire (Espoir Foxtrot fields and a number of other discoveries) to turbiditic sandstones that have Late Cretaceous (CenomanianTuronian MaastrichtianConiacian) to early Tertiary (Palaeocene to Eocene) ages Recent drilling offshore Ghana has yielded a number of discoveries within these Upper Cretaceous sandstones such as the Jubilee oil field and the Enyenra Tweneboa and Odum oil and gascondensate discoveries In the Liberia-Sierra Leone basin recent drilling has yielded six hydrocarbon discoveries (Bee Eater Narina Monterrado Mercury Venus and Jupiter) but as yet none has been declared commercial (Figure 2-1) Although reservoir quality in the Albian sandstones is variable reservoir quality in the Upper Cretaceous and Tertiary sandstones is often good Successful trap types encountered regionally are both structural and stratigraphic
Of significance to the evaluation of the petroleum systems of Blocks 8 and 9 APCL have drilled three wells within the deeper water parts of the blocks Wells Apalis-1 Narina-1 and Bee Eater-1 Well Apalis-1 found source rock intervals of Albian to Cenomanian age but failed to find the prognosed reservoir Well Narina-1 found light oil within deep-marine sandstones of Cretaceous age The sandstones were of variable reservoir quality as the well appears to have been drilled on the edge of a fan system which can be interpreted from seismic data The extent of the Turonian hydrocarbon bearing interval around Well Narina-1 is currently under investigation by APCL who are working with CGGV to reprocess the 3D multi-client seismic with the hope of identifying areas of favourable reservoir within closure
Well Bee Eater-1 completed in February 2013 also discovered hydrocarbons within similar sandstones of Cretaceous age However the oil bearing Turonian reservoir at Bee Eater is interpreted as being of very low permeability and hence non-commercial APCL interprets that Well Bee Eater-1 was drilled in a canyon system that may have been largely bypassed by sediment input
Both wells demonstrate the viability of Cretaceous petroleum systems within the licence area
Competent Personrsquos Report African Petroleum Corporation Limited
June 2013 27
Figure 2-1 Notable discoveries West Africa offshore
22Well and Seismic Database
Exploration offshore Liberia is at an early stage To date five wells have been drilled in the deeper water areas in 2011 and 2012 with historical exploration drilling (up to 1985) restricted to the more shelfal areas (Figure 2-2) Data from two of these shallow water wells Wells S3-1 and Cestos-1 were made available to us for this evaluation Well S3-1 encountered oil shows in sandstones of Late Cretaceous age
GhanaJubilee Field on
production development of TEN area discoveries
new Hess deepwater discoveries
Cote drsquoIvoireShallow water production
recent discoveries in deepwater Turonian
reservoirs
LiberiaOil discoveries in
Cretaceous deepwater reservoirs at Narina
Monserrado
Sierra LeoneVenus Mercury and Jupiter
oil and condensate discoveries in deepwater
reservoirs
Guinea-COil shows in
offshore wells
Guinea-BSinapa oil discovery
planned appraisal
AGCDome Flore area heavy oil
discoveries under development review
SenegalOnshore gas and condensate production Recent onshore
Turonian discovery
MauritaniaChinguetti Field
production other oil and gas discoveries under development review
Competent Personrsquos Report African Petroleum Corporation Limited
June 2013 28
Figure 2-2 Well and seismic database Liberia Blocks 8 and 9
APCL has drilled three exploration wells offshore Liberia in the deep water part of Block 9 Wells Narina-1 Bee Eater 1 and Apalis-1 (Figure 1-2 Figure 2-2) Well Apalis-1 was drilled in 2011 targeting a four-way dip-closed structure with possible AvO support The well found traces of hydrocarbons plus source rock intervals but the prognosed reservoir sands were absent at target depth and the well was plugged and abandoned
Well Narina-1 was drilled by APCL in 2012 and found 16 to 21 m of net pay (light oil) within sandstones of Turonian (Cretaceous) age Hydrocarbons were also discovered in the underlying Albian Oil samples were collected but no drill-stem testing was undertaken Analysis of the oil samples indicates an API
3D Seismic Area
Competent Personrsquos Report African Petroleum Corporation Limited
June 2013 29
gravity for the Turonian oil of about 38 degrees and about 45 degrees for the Albian hydrocarbons Mobilities from formation pressure measurements and permeability from side-wall core measurements show the reservoir to be of relatively low permeability at this location
Well Bee Eater-1 was drilled by APCL in January and February 2013 The well found oil-bearing sandstones of Cretaceous age but of very low permeability and hence the well is considered non-commercial Post-drill interpretation of the seismic data has helped APCL revise the depositional model for this Turonian fan system The Bee Eater-1 well is interpreted to have encountered a bypass zone in both the Turonian and Cenomanian with immature sandstones that are poorly sorted and tight Post-well mapping of key seismic events tied to Well Bee Eater-1 reveals the possibility of finding better quality sandstones in lsquobasin-floor fanrsquo units down-dip Potentially sealing shale units and source rock units were also found in the Bee-Eater-1 well
Well Apalis-1 and in particular Wells Bee Eater-1 and Narina-1 help de-risk seal and hydrocarbon charge for the Cretaceous play on-block
The primary seismic dataset for our evaluation was the recently acquired 5170 km2 of 3D seismic data over the deeper water area of Blocks 8 and 9 including certain products to review amplitude versus offset (AvO) effects These seismic data cover both recently drilled deep water wells In addition a grid of 2D seismic data was also made available with average line spacing of around 45 km These data provide a tie to Well S3-1 although the well lies some 200m from the nearest seismic line In general the data quality of the 3D volume is good and of suitable fidelity to enable us to undertake our review of identified prospectivity However local complexity in the shallow geology causes the signal to degrade considerably at the prospective levels in certain areas APCL are currently reprocessing these data in an attempt to improve signal quality APCL intend to utilise this dataset to update the CPR in the next 3-6 months It is hoped that these data will support maturation of additional prospects and further clarification of risk and volumes for prospects within this CPR
23Plays and Petroleum Geology Blocks 8 and 9
APCL has identified a number of plays within Blocks 8 and 9 at similar stratigraphic levels to those proven successful elsewhere along the West African margin (Figure 2-3) Recent drilling within Blocks 8 and 9 has demonstrated a working petroleum system within the mid to lower Cretaceous with drilling finding light oil within deep marine sandstones of Turonian age and also in sandstones of Albo-Aptian age
Competent Personrsquos Report African Petroleum Corporation Limited
June 2013 30
Figure 2-3 Petroleum systems and plays Liberia Blocks 8 and 9
Structural traps are identified at the pre-rift to early syn-rift (Albian) level as tilted fault blocks with hydrocarbons sourced from the Albian or Lower Cretaceous source rocks and seal provided by post-rift mud drape Structural and stratigraphic traps are also identified at several potential reservoir levels within the Late Cretaceous and Lower Tertiary again potentially sourced from the Turonian and or Albian source rocks Traps are sealed by coeval marine shales and muds As is encountered regionally there is reasonable seismic evidence for the presence of reservoir bearing intervals within the Upper Cretaceous and Early Tertiary section and this seismic evidence has been used in trap definition
The most significant play in the area is that of Cenomanian to Turonian age deep-marine channel-fan systems as structural and stratigraphic traps In addition an emerging lower Cretaceous microbial carbonate reservoir play has been identified sourced from coeval lacustrine source rocks and sealed by shales deposited during the subsequent drowning of the lacustrine systems by the onset of significant subsidence and marine inundation later in the Cretaceous We have evaluated prospects within both of these play systems Prospectivity in the shallower Cretaceous and Tertiary intervals is still being re-evaluated by APCL as of the date of this report and no leads have been matured to prospect status
Oil show Cestos-1
Competent Personrsquos Report African Petroleum Corporation Limited
June 2013 31
Figure 2-4 Porositydepth trend published West Africa turbidite reservoirs
24Play and Prospect Risk Liberia Blocks 8 and 9
Of the prospects reviewed all but the Wildbird prospect fall within the Cenomanian to Turonian channelfan play In our opinion recent drilling has de-risked source and reservoir presence for this play However reservoir quality in recent wells is variable In our risking of Cenomanian to Turonian prospectivity (Barbet Sunbird Lovebird and Night Heron prospects) we have removed the play element to our risking matrix and see a low risk to hydrocarbon charge for individual prospects Key risk is therefore to trap integrity and reservoir quality We use a four component risk matrix as outlined in Section 16 to define geological chance of success for these prospects
The Wildbird prospect has been recently identified by APCL as part of its review of further play fairways within the Liberian licences The play concept is of early Aptian bio-constructed carbonate build-ups within the restricted lacustrine environment that existed at this time Porosity and permeability within the bioclastic microbial limestones is potentially enhanced by hydrothermal activity resulting from the early rifting Later post-rift subsidence and drowning by marine conditions provides the top seal via the
0
500
1000
1500
2000
2500
3000
3500
4000
0 01 02 03 04m
Bel
ow S
eabe
dPorosity (fraction)
Porosity versus Depth Trend
Regional West AfricaTurbidite Data
Competent Personrsquos Report African Petroleum Corporation Limited
June 2013 32
deposition of Cretaceous marine muds It is envisaged that the play is charged or by Aptian source rocks deposited in the offset lagoonal facies with possible charge from later (but on-lapping) Cretaceous marine source rocks (as other plays on the blocks) Both potential source rocks provide lateral seal (Figure 2-16) Regionally lacustrine microbial carbonate reservoirs can be found in Congo and Angola where there is some production but also in the Campos and Santos basins in Brazil
The microbial carbonate play is emerging within Blocks 8 and 9 and has not been demonstrated to be effective by drilling We adopt the play and prospect risking as discussed in Section 16 to risk the Wildbird prospect as a result discounting biodegradation risk as the prospect is at significant depth Our estimate of play risk for the Cretaceous microbial carbonate play is summarized in below
PLAY Source Reservoir Presence Seal Play
Risk Cretaceous Carbonate 08 06 05 20
Table 21 Play risk Cretaceous carbonate play Liberia Blocks 8 and 9
Competent Personrsquos Report African Petroleum Corporation Limited
June 2013 33
25Liberia Blocks 8 and 9 Leads and Prospects
Following the drilling of Wells Narina-1 and Bee Eater-1 APCL is re-evaluating the prospectivity within Blocks 8 and 9 and has developed a number of potential traps (Figure 2-5) several of which (marked in orange Figure 2-5) have been matured to prospect status We have assessed the prospective resources for certain of these prospects that APCL has identified as viable near-term drilling opportunities Barbet Sunbird Lovebird Night Heron and Wildbird A number of the prospects have multiple reservoir targets Our evaluation of these prospects follows the methodology described in Section 16 The results of Wells Narina-1 and Bee Eater-1 would indicate that oil charge is probable and thus only oil cases have been evaluated However as we state in Section 16 a gas charge cannot be discounted due to the uncertainties in source rock evaluation and basin modelling Input parameters STOIIP prospective resources and geological chance of success for each of the evaluated prospects are summarised in Table 1 of this report and are also presented in the resource summary sheets as Enclosures 11 to 19 of this document
Figure 2-5 Leads and Prospects Liberia Blocks 8 and 9
Competent Personrsquos Report African Petroleum Corporation Limited
June 2013 34
ʹǤͷǤͳǤ Barbet Prospect
The Barbet prospect is identified as a stratigraphic trap around 14 km to the east of and up-dip from Well Narina-1 within Block 9 (Figure 2-6) A single target reservoir is mapped within the Turonian Seismic amplitude anomalies are also identified within the area of the trap that may provide support for reservoir development The Turonian is mapped at between 3000 and 3600 m TVDSS over the area of the prospect in a water depth of around 750 to 770 m
Figure 2-6 Seismic line - depth (m TVDSS) over the Barbet prospect
We have used an areanet pay methodology to estimate prospective resources for the Barbet prospect In our low case we restrict the area of the accumulation to the brightest area of anomalous amplitudes on the far offsets Our high case extends the prospect down-dip to include a larger area of anomalous amplitudes above an observed amplitude shut-off (Figure 2-7) These are used to constrain the P90 and P10 inputs of our probabilistic simulation These polygons approximate to an oil column height of 200 and 700 m respectively
Amplitudes are variable within the area of closure and we apply an areal net to gross ratio to better constrain sand distribution within the trap Gross reservoir thickness estimates are computed from the mapped seismic interval net to gross ratio from regional analogue and porosity from a regional porositydepth trend (Figure 2-4) Fluid parameters and recovery factors are estimated as described in Section 16
Narina-1 Barbet
Top Turonian
Top Cenomanian
Top Albian
Lwr Turonian (BFF)
Top Turonian
Narina-1
Apalis-1
Albian UC
0 km 2(mss)
W E
Competent Personrsquos Report African Petroleum Corporation Limited
June 2013 35
Figure 2-7 Barbet far offset amplitudes with Top Turonian depth contours (m TVDSS)
We have used the prospect risk matrix presented in Section 16 to determine the geological chance of success for the Barbet prospect Key risk to the Barbet prospect is to trapcontainment as the trap requires pinch-out of the reservoir in three directions to seal There is also a subsidiary risk to reservoir as the Turonian reservoir encountered in Well Narina-1 is of relatively poor quality which is countered by seismic evidence over the prospect to support reservoir development As a result we attribute a geological chance of success of 22 to the Barbet prospect
metres
P10
P90metres
APALIS-1
Competent Personrsquos Report African Petroleum Corporation Limited
June 2013 36
ʹǤͷǤʹǤ Sunbird Canyon Prospect
The Sunbird canyon prospect is also identified as a stratigraphic trap around 5 km to the south of Well Apalis-1 within Blocks 8 and 9 mapped as a large canyon system There are three potential reservoir targets within the prospect within the Campanian the Turonian (as encountered in Well Narina-1) and in the underlying Cenomanian Reservoir is prognosed at between 3000 m TVDSS and 3600 m TVDSS in a water depth of around 1300 m
Figure 2-8 Regional seismic line along axis of the Sunbird canyon system
We have used an areanet pay methodology to estimate prospective resources for the Sunbird canyon prospect At all three prospective layers the prospect divides into two discrete lsquocanyonsrsquo separated by an intra-basinal high (eg Figure 2-9) For the Campanian and Turonian prospective intervals in the low case we restrict the area of the accumulation to the brightest area of anomalous amplitudes on the far offsets in the northerly of the two canyons where amplitude response is better Our high case extends the prospect down-dip to include a larger area of anomalous amplitudes above an observed amplitude shut-off and also includes the southerly of the two canyons as this would now be in charge communication The low and high case polygons approximate to an oil column height of 200 m and 600 m respectively
Albian uc
LB-08LB-09
LB-08
LB-09
Albian UC
Sunbird
0 km 4
NESW
Competent Personrsquos Report African Petroleum Corporation Limited
June 2013 37
For the deeper Cenomanian the prospect is mapped as a single canyon to the south of the intra-basinal high The low and high case polygons approximate to an oil column height of 200 m and 700 m respectively Our low and high estimates of area are used to constrain the P90 and P10 of our probabilistic simulation
Figure 2-9 Sunbird Campanian far offset amplitudes with Cenomanian depth contours (m TVDSS)
Amplitudes are variable within the area of closure and we apply an areal net to gross ratio to better constrain sand distribution within the trap for all three prospective layers Gross reservoir thickness estimates are computed from the mapped seismic interval net to gross from regional analogue and porosity from the observed porositydepth trend (Figure 2-4) Fluid parameters and recovery factors are estimated as described in Section 16
metres
P90
P10
Block 9
Block 8
APALIS-1
Competent Personrsquos Report African Petroleum Corporation Limited
June 2013 38
Figure 2-10 Sunbird Turonian far offset amplitudes with Top Turonian depth contours (m TVDSS)
We have used the prospect risk matrix presented in Section 16 to determine the geological chance of success for the three prospective intervals of the Sunbird prospect Key risk to all three prospective layers is to trapcontainment as the trap requires pinch-out of the reservoir in three directions to seal There is also a subsidiary risk to reservoir at the two deeper levels as the Turonian reservoir encountered in Well Narina-1 is of relatively poor quality and Cenomanian reservoirs are yet to be proven on block However there is seismic evidence for reservoir development and hence we see this risk as favourable Reservoir risk is low for the Campanian as it is developed in the offset Well Narina-1 and there is seismic evidence for reservoir presence As a result we attribute a geological chance of
P90
P10
metres
Block 9
Block 8
APALIS-1
Competent Personrsquos Report African Petroleum Corporation Limited
June 2013 39
success of 27 19 and 18 to the Campanian Turonian and Cenomanian prospective intervals of the Sunbird canyon prospect
Figure 2-11 Sunbird Cenomanian far offset amplitudes with Cenomanian depth contours (m TVDSS)
ʹǤͷǤ͵Ǥ Night Heron
Night Heron is a Turonian basin floor fan system which lies 8 Km south west of Well Bee Eater-1 It is mainly within Block 9 but extends into Block 10 It is identified as a stratigraphic trap with areal extents defined by amplitude truncation and structural pinch-out Reservoir is prognosed at between 4100 m TVDSS and 4700 m TVDSS in a water depth of around 1750 m (Figure 2-12) APCL has selected a
P90
P10
metres
Block 9
Block 8
Competent Personrsquos Report African Petroleum Corporation Limited
June 2013 40
provisional well location which lies on the 3D survey location ndash In-line 1098 X-line 6103 They are currently seeking partners to drill the Night Heron well in early 2014
Figure 2-12 Arbitrary line across Night Heron PSDM - Depth (m TVDSS)
Cenomanian reservoir potential also exists beneath the Turonian basin floor fan and work by APCL is on-going to determine prospectivity
Well Bee Eater-1 found an organic-rich Turonian shale section overlying a hydrocarbon bearing thin-bedded low permeability sandstone Another shale dominated package underlies the sandstone Although the Turonian interval is considered non-commercial for Bee Eater the prospectivity down-dip is appealing APCL interprets that the well was drilled in a canyon system that may have been largely bypassed by sediment input The 3D seismic indicates a significant thickening of this Turonian interval towards the south west and there is some amplitude support for the occurrence of a lobate fan straddling Blocks 9 amp 10
An area times net approach was adopted using the full stack PSDM depth volume to provide an SNA extraction and constrain areal extent and estimate an areal NG to account for lateral variability within the reservoir (Figure 2-13) As night Heron falls partly off block ERCE correct for this using the ratio of on-block to off-block area in reporting of net unrisked and net risked results
S NEBee EaterNight Heron
5 Km
BFF Isopach (m)
Competent Personrsquos Report African Petroleum Corporation Limited
June 2013 41
Figure 2-13 SNA from Basin Floor Fan Isopach (m) - PSDM
We have used the prospect risk matrix presented in Section 16 to determine the geological chance of success for the Turonian interval of the Night Heron prospect Recent drilling results suggest that there is a low risk to hydrocarbon charge The observations at Bee Eater-1 also indicate that shale seals are also likely at a coeval interval Reservoir is a significant risk due to the poor Turonian reservoir development in Well Bee Eater-1 The Turonian reservoir encountered in Well Narina-1 is also of relatively poor quality However there is seismic evidence on the 3D survey for a possible improvement in reservoir development over the prospective area The definition of the trap is the key risk as the seismic evidence for closurereservoir pinch-out is ambiguous over the 2D data in Block 10 There appears to be evidence of the reservoir interval thinning in the critical north westerly direction but 3D data would be required to reduce trap risk any further As a result we attribute a geological chance of success of 144 to the Night Heron prospect
3
3
SNA from BFF Isopach
Block Boundary
Competent Personrsquos Report African Petroleum Corporation Limited
June 2013 42
ʹǤͷǤͶǤ Lovebird Prospect
The Lovebird prospect is mapped as a four-way dip closure to the south of Block 8 (Figure 2-14) Three prospective layers are mapped by correlation to up-dip wells and are prognosed to be of Cenomanian age Thus as with the Sunbird canyon prospect these reservoirs are not proven on block but seismic mapping and regional geological work suggests the sands may be derived from the east via a canyon system identified in block LB-07 The three prospective intervals are termed Upper Middle and Lower or Blue Pink and Green based on horizon colour Structural relief at the Pink horizon is between 50 and 200 m depending on the estimate and thus the prospect is relatively low relief in some realisations
Figure 2-14 Seismic line over the Lovebird prospect
Lovebird
Depth (mss)
4 km
NE
Competent Personrsquos Report African Petroleum Corporation Limited
June 2013 43
Figure 2-15 Lovebird prospect Top Pink horizon depth (m TVDSS) high case
The prospect is mapped to the edge of the available 3D (Figure 2-15) which coincides with the southern boundary of Block 8 but closure can be mapped south of the 3D area on the available 2D lines Reservoir depth is prognosed at between 5000 and 5900 m TVDSS in a water depth of 2850 m at the prospect crest Thus reservoir rock if present will be at comparable depths below mud line to the Barbet prospect
We use a gross-rock volumenet to gross methodology to estimate prospective resources for the Lovebird prospect APCLrsquos evaluation of the Lovebird prospect is on-going and of the three interpreted horizons the Pink horizon is the best defined We review pick depth conversion and thickness uncertainty for this interval to generate a range of gross-rock volumes for this interval with the
m ss
metres
Block 9
Block 8
Competent Personrsquos Report African Petroleum Corporation Limited
June 2013 44
prospect full to spill (Figure 2-15) Assuming the Pink horizon provides an accurate representation of the Blue and Green horizons we then estimate gross-rock volumes for these two intervals by isopach
Reservoir thickness and net to gross ratio estimates are derived from regional analogues with reservoir porosity derived from our regional porositydepth trend (Figure 2-4) Fluid properties and recovery factors are estimated as described in Section 16 Our volumetrics are restricted to the portion of the Lovebird prospect on Block 8 We would expect a further evaluation of the prospective resources of the Lovebird prospect to occur subsequent to the completion of the APCL evaluation and the prospective resources associated with the prospect in this report may therefore be subject to change
The key risks to the Lovebird prospect are to the development of reservoir at the prognosed Cenomanian intervals as they are not proved in wells elsewhere on the block and to source as the prospect requires a source rock deeper than that proven by drilling There is also risk to trapcontainment as the structure is not fully defined by the 3D seismic data volume and is of low relief in some realisations We assign a geological chance of success to the Lovebird prospect of 20 as a result
255Wildbird Prospect
The Wildbird prospect is mapped on 3D seismic data towards the south of Block 8 as a large four-way dip-closed high (Figure 2-17) at a depth of between 4000 to 4600 m TVDSS in a water depth of around 2000 m Structural relief is up to 600 m and area of closure up to 170 km2 The conceptual geological model is discussed above but is that the prognosed microbial carbonate reservoir of Albian age is developed between the mapped lsquoredrsquo and lsquolight bluersquo seismic events (Figure 2-16) with lateral seal developed to the north-east of the prospect within contemporaneous lagoonal facies which also provide the primary source rock This lateral seal is required to close the prospect Basin modelling undertaken by APCL suggests that the Albian lagoonal and later Cretaceous source rocks would be mature for oil generation
We have accepted this model as a geological concept and have used it to make estimates of prospective resources for the Wildbird prospect We then risk the model accordingly
Competent Personrsquos Report African Petroleum Corporation Limited
June 2013 45
Figure 2-16 Seismic line and prospect geo-seismic sketch Wildbird prospect
5
0 km 5
SWN
E
mss
Wildbird
Horizons
BlackberryLight BlueRoseRed
Competent Personrsquos Report African Petroleum Corporation Limited
June 2013 46
Figure 2-17 Wildbird Top Reservoir depth map (m TVDSS) Spill point - green contour
The Wildbird prospect is a large container but there is considerable uncertainty in reservoir thickness structural mapping and degree of charge from the offset kitchen areas We evaluate the prospect in a similar manner to the Lovebird prospect by perturbing the above variables In our low case we choose a shallow contact at 4250 m TVDSS to simulate under-filling or lateral breach via onlapping thief zones and also employ a reservoir thickness of 80 m from offset analogue Our high case assumes the prospect is filled to spill and that the lsquoredrsquo seismic event marks base reservoir Estimates of reservoir net to gross ratio and porosity are derived from the available analogues and are necessarily wide Fluid parameters and recovery factors are derived as described in Section 16
The Wildbird play is emerging and is of high risk We attribute a play risk of 24 as a result (Section 24) The key prospect risk to the Wildbird prospect is that of containment or trap as there is evidence for erosion at the crest of the feature and it is reliant on the development of lagoonal facies to the north-east and overlying marine shales to provide lateral seal and support the hydrocarbon column heights modelled here We attribute a prospect risk of 38 Wildbird which when combined with the play risk gives an overall chance of success for the Wildbird prospect of 9
mss
Competent Personrsquos Report African Petroleum Corporation Limited
June 2013 47
3 Gambia Prospectivity and Plays
͵ǤͳǤ Introduction
Although only one exploration well (Well Jammah-1) exists offshore Gambia exploration drilling has been undertaken to the north and south within Senegalese and Guinea Bissau waters (Figure 2-1 Figure 3-1) A number of oil and gas discoveries have been made onshore Senegal and the large Dome Flore and Dome Gea discoveries to the south of the blocks are each reported to contain a million barrels of biodegraded oil (c10-13o API) in place within sandstones of Oligocene (Tertiary) age Some lighter (30-34o API) oil has also been encountered in deeper intervals More regionally oil and gas discoveries have been made to the north offshore Mauritania and in Guinea Bissau (Sinapa) the recently drilled Venus and Mercury wells in Sierra Leone have also encountered hydrocarbons
Figure 3-1 Plays Gambia Blocks A1 and A4
The range of hydrocarbon types encountered is suggestive of multiple sourcing and the age of the reservoirs suggest late timing of oil generation consistent with a late Cretaceous source for the heavy oil although there are no published data to confirm this Regionally the gas source could be any of the older potential source rocks discussed below
Alhamdulilah
GAMBIA A1ampA4 PROSPECTIVITY POTENTIAL
Deep Water Fans channel levee complexes BFF lobes
Late Jurassic clastic progrades
Clastic progrades (unconformity trap)
Karst amp reef features in carbonate platform
Intra-carbonate clastic truncations
Based on line 1046-NWA
1
2
3
1
51
14
2
3
4
5
Competent Personrsquos Report African Petroleum Corporation Limited
June 2013 48
32Well and Seismic Database
Exploration offshore Gambia is also at an early stage and no wells have been drilled in the deeper water areas The nearest well to Blocks A1 and A4 (and the only well offshore Gambia) is Well Jammah-1 some 15 km to the east of Block A1 (Figure 3-2) This well contains oil shows within sandstones of Late Cretaceous age The well drilled to 3020 m MD reaching total depth in an interval of uncertain age perhaps Cenomanian to Albian
A regional grid of 2D seismic data was made available to us for our evaluation with an average line spacing of around 2-3 km on Block A1 and up to 8 km on Block A4 (Figure 3-2 Figure 3-3) In addition a 2003 vintage 3D seismic data volume was available for analysis covering 2008 km2 However APCL is using 2010 vintage 3D seismic data (2566km2) processed to pre-stack time-migration in their current evaluation and we have adopted these data for our review In general seismic data quality was found to be good
Figure 3-2 Wells 2D and 3D seismic data (red outline) Gambia Blocks A1 and A4
The 2D seismic data was sufficient to enable a well to seismic tie to be made to Well Jammah-1 (Figure 3-3) Despite its shelfal location we were able to extrapolate some stratigraphy into the deeper water
Competent Personrsquos Report African Petroleum Corporation Limited
June 2013 49
although the key Upper Cretaceous section is not sampled adequately by the well leading to uncertainty in the age of the deeper clastic section that forms the potential reservoir interval for the Alhamdulilah prospect
33Plays and Petroleum Geology Blocks A1 and A4
Some of the plays identified by APCL offshore Gambia are similar to those described for Liberia in Section 23 above with structural and stratigraphic traps identified at a number of Cretaceous intervals (Figure 3-1) and reservoirs prognosed as being of deep marine turbidites or other mass transport systems However plate tectonic reconstructions suggest that rifting occurred earlier along the Senegalese and Gambian margin beginning in the Lower Jurassic Thus there is the potential for deeper Jurassic age source and reservoir in the area
There is some seismic evidence for the presence of reservoir intervals as is common regionally although evidence is less compelling in the deeper intervals (Figure 3-5) Of the identified traps in this play fairway only one has currently been matured to prospect status by APCL the Alhamdulilah prospect
Regionally reservoirs within the Cretaceous are associated with a deep marine depositional environment and are generally expected to be of good to excellent quality with the possibility of some overpressure A similar depositional environment is prognosed for the deeper Jurassic age reservoirs with possible fan-delta like geometries identifiable on seismic landward (eastward) of the Alhamdululah prospect (Figure 3-7)
In addition to the Jurassic and Cretaceous clastic plays APCL has identified a number of closures along the margin of a carbonate platform of Jurassic to Aptian age partially penetrated by Well Jammah-1 (Figure 3-3 Figure 3-4) These closures are currently being evaluated by APCL and only one Prospect M has been evaluated to prospect status and we assess the prospective resources for Prospect M in this section
Competent Personrsquos Report African Petroleum Corporation Limited
June 2013 50
Figure 3-3 Well to seismic tie ndash Well Jammah-1 to the Alhamdulilah prospect
There is good evidence for the presence of source rocks in the Gambian margin The youngest source interval that could possibly generate oil is the Cenomanian-Turonian marine source rock proven in the Casamance Shelf wells and present in basins to the north Published data indicate kerogen is a mixed Type IIIII locally and Type II in wells to the south with HI of between 370-660 mggC in gt2 TOC rocks (TOCs in the DSDP-367 well 300 km to the west are in excess of 5 in black shales of Albian to Turonian age) This section is absent in Well Jammah-1 probably as a result of erosion
There is also the possibility of Necomian and Jurassic source rocks Necomian black shales are described in the DSDP-367 well Jurassic (Toarcian) source rocks are inferred to be present based on analogue evidence and plate tectonic reconstructions that place proven Jurassic source rocks in Morocco Portugal Nova Scotia and north-eastern Brazil in proximity to the Senegal-Gambia basin These are documented as having a HI of around 450 mggC and a TOC of up to 6
Regional thermal information shows a high degree of variability with gradients from 25 to 45 degCkm likely as a result of drilling on salt domes where geothermal gradients are elevated or in areas locally affected by volcanics Blocks A1 and A4 are at the northernmost margin of the salt basin so at worst only limited local effects are anticipated Using data from Well Jammah-1 we infer a geothermal gradient of 30deg Ckm at the location of the well This would put the Cenomanian-Turonian source locally into the oil window around the Alhamdulilah prospect However uncertainty in both depth conversion and geothermal modelling do not rule out the possibility that the Cenomanian-Turonian could be mature regionally for hydrocarbon generation Deeper Neocomian or Jurassic source rocks if present would be mature for oil generation under this model
ALHAMDULILAH
M
Senonian UC
W E4 km
Jammah-1
Alhamdulilah
Intra Aptian Carbonate
TWT (ms)
Competent Personrsquos Report African Petroleum Corporation Limited
June 2013 51
34Play Risk
In our evaluation of APCLrsquos Gambian blocks we note that a number of the prospective plays require further definition to mature the identified leads to prospect status As a result our evaluation is limited to the determination of independent estimates of prospective resource for the Alhamdulilah prospect and Prospect M We have used play and prospect risk for both prospects to allow for consistency in comparison between our evaluations where a play risk is appropriate
Based on the review above we see source risk as the key risk to the Lower Cretaceous and Jurassic clastic play Although a number of source rock intervals are present regionally only those within the Cretaceous are demonstrated to be present proximal to Blocks A1 and A4 Data are limited but modelling would suggest that those within the Cenomanian-Turonian could be immature for oil generation in all but a small area of the blocks As a result we assign a source risk of 07 Note that the uncertainty in both source rock presence and thermal data is such that there is a possibility of gas charge although like Liberia Sierra Leone and Cote drsquoIvoire it is impossible to quantify this chance at present
We see seal risk for this play to be relatively low as there is seismic evidence similar to that interpreted regionally for the presence of seal Seal risks for the multiple stacked sands prognosed for the Alhamdulilah prospect are handled as a prospect specific risk The inferred depositional environment for this interval would also suggest that sealing intervals would be developed We have therefore assigned a seal risk of 09 to this play
Seismic evidence for the presence of reservoir is also good but less convincing than that observed regionally and in our evaluation of Liberia Blocks 8 and 9 However we assign a reservoir presence risk of 08 It is possible that the younger Cretaceous reservoirs identified could be locally sourced via exhumation of the coeval carbonate platform to the east and thus be composed of detrital carbonate material This is reflected in the reservoir risk for the Alhamdulilah prospect itself
For the carbonate platform play the key risk is that of top seal Seismic reflectivity is highly variable above the top of the platform carbonates (Figure 3-3) as the event is a strong regional unconformity In places the overlying clastic section can be interpreted immediately above this unconformity Although the latter is factored into prospect specific risk to top seal the seismic evidence for the presence of a regional seal above the unconformity is not compelling The top seal is provided by a down-lapping carbonate prone Aptian-Albian section where the Senonian unconformity is not immediately above the reservoir section Analogues suggest there is a general lack of support for intra-formational seals in similar settings and therefore we assign a risk to the carbonate platform play seal of 05 as a result
The presence of a strong angular unconformity at the top of the carbonate platform structures is however likely to have enhanced reservoir quality within the carbonates themselves as a result of subareal exposure and karstification Thus we assign a risk of 09 to the reservoir presence element of the carbonate platform play and review the prospect specific reservoir efficacy risk on a prospect by prospect basis dependent on the seismic evidence for erosion
Competent Personrsquos Report African Petroleum Corporation Limited
June 2013 52
A number of the identified structures along the buried carbonate platform margin are relatively shallow to mudline and thus biodegradation of any oil charge is possible However as we have only estimated prospective resources for Prospect M we have not carried a play risk to biodegradation
Our final play risks for the Lower Cretaceous clastic and the buried carbonate platform plays are summarised in Table 31 below
PLAY Source Reservoir Presence Seal Play
Risk Cretaceous to Jurassic Clastic Play 07 08 09 50
Carbonate Platform Margin 07 09 05 28
Table 31 Play risk Gambia Blocks A1 and A4
Competent Personrsquos Report African Petroleum Corporation Limited
June 2013 53
35Gambia Leads and Prospects
In all 13 leads and prospects have been identified by APCL within Blocks A1 and A4 with areas of closure varying from around 4 km2 to 63 km2 (Figure 3-4) Of the identified prospective intervals a number are best classified as leads and require further technical work to mature them to prospect status (yellow Figure 3-4) Structural closure is identified within the Lower Cretaceous and a number of slope fans can be identified as seismic amplitude anomalies within the Upper Cretaceous section In addition a number of closures are mapped along the edge of the buried carbonate platform margin at Top Aptian level and APCL are currently evaluating the potential for a deeper Barremian age seal which might provide further prospectivity within the carbonate platform play
Figure 3-4 Leads and prospects identified by APCL in Gambia Blocks A1 and A4
In this section we briefly describe our evaluation of the Alhamdulilah prospect and Prospect M A summary of input parameters for the calculation of prospective resources results and risks for each of the prospective layers evaluated is given in the resource summary sheets in Enclosures 21 to 25 of this document
In 2010 APCL acquired a further 2566 km2 of 3D data over both blocks A re-evaluation of the identified leads and prospects is on-going using these data with the evaluation of the Alhamdulilah prospect and Prospect M completed
ALHAMDULILAH
M
Competent Personrsquos Report African Petroleum Corporation Limited
June 2013 54
351Alhamdulilah Prospect
The Alhamdulilah prospect is identified as a four-way dip-closed structural high within the centre of the deep water portion of Block A1 (Figure 3-3 Figure 3-5) We have evaluated four prospective intervals in total (Figure 3-5) Reservoir ages are currently prognosed by APCL to be of Lower Cretaceous (Turonian) to perhaps Lower Jurassic The prospect extends northwards of Block A1 into Senegalese waters and we have restricted our calculations to the proportion of the prospect that lies within Block A1 The bulk of the prospect does however lie within Gambian territory
Figure 3-5 Seismic line over the Alhamdulilah prospect
The prospective intervals within the Alhamdulilah structure lie between 4230 m TVDSS and 5970 m TVDSS or around 2010 to 3750 metres below sea bed This is relatively deep and despite the estimates of overpressure it is possible that porosity and thus reservoir quality to be relatively poor (Figure 2-4) Our estimates of recovery factor for the deeper prospective intervals reflect this
There is uncertainty in the degree of structural closure as although mapped reflectors are relatively bright and continuous the structure is of low relief We have account for this by undertaking various depth conversions of the mapped structure from the time domain 3D seismic data restricting our analysis to closure demonstrable on-block (Figure 3-6) At SS-1 level closure continues to the north off-block and also off the 3D seismic data We have reviewed the available 2D seismic data northwards to determine the spill point at this level
SS 4 (1)
SS 3 (1-2)
SS 2 (1-3)
SS 1 (1-3)
2 Km
Inline 1140 - TWT ALHAMDULILAH
TWT (s)
W E
Competent Personrsquos Report African Petroleum Corporation Limited
June 2013 55
Where seismic facies analysis suggests the potential for stacked pay intervals these have been modelled probabilistically Estimates of gross rock volume derived in this way are combined with the estimates of net reservoir thickness based on mapped seismic thicknesses and porosity and fluid information are derived as described in Section 16 to compute probabilistic estimates of resources for each reservoir interval
Figure 3-6 Area of closure Alhamdulilah prospect layers SS1 to SS4
Recovery factors used are as described in Section 16 of this report but modified to reflect the depth of burial of the deeper prospective intervals
We have reviewed the prospect specific risk for each of the prospective intervals independently Although the Alhamdulilah trap is a four-way dip-closed feature the time closure is subtle and the prospect is relatively deep There is also seabed canyoning which may cause uncertainty in the imaging and thus trap closure
Seismic evidence for seal is relatively good over the Alhamdulilah trap However there is evidence for downcuttingerosion between layers and above the prospect there is also evidence for downlapping events onto the topmost reflector
The key risk to the Alhamdulilah prospect is that of reservoir efficacy There are indications of fan-like geometries within the 3D seismic data (Figure 3-7) and some events can be mapped for the shallower reservoir layers However the Cretaceous reservoirs may alternatively comprise the eroded talus from the coeval carbonate platform to the east and reservoir quality rock may not be developed as a result Finally our estimate of overpressure may be incorrect and any sandstones present may have the reservoir quality sufficiently degraded via compaction to render them non-reservoir
SS-1 Low and High Case AreasSS-4 Low and High Case Areas SS-3 Low and High Case Areas SS-2 Low and High Case Areas
Competent Personrsquos Report African Petroleum Corporation Limited
June 2013 56
As a result the prospect specific risks to the prospective intervals of the Alhamdulilah prospect vary from 26 to 34 and from 13 to 17 when combined with the play risk
Figure 3-7Alhamdulilah prospect seismic facies interpretation Cretaceous intervals
AH-1 AH-1
Competent Personrsquos Report African Petroleum Corporation Limited
June 2013 57
352Prospect M
A number of structures have been identified by APCL at the Aptian level (ie top carbonate) along the buried carbonate platform margin that runs through Blocks A1 and A4 (Figure 3-1) Of these one structure Prospect M has been matured to prospect status and is of sufficient size to warrant independent estimates of resources (Figure 3-8)
Figure 3-8 Seismic line through Prospect M
We have evaluated the uncertainty in gross rock volume for Prospect M and combined this with reservoir net to gross ratio and porosity from analogue to generate estimates of STOIIP and prospective resources We have simulated uncertainty in seismic pick and also depth conversion to generate a range of spill points for the structure (Figure 3-9) These are used to make low and high case estimates of gross-rock volume
Due to the shallow nature of Prospect M we have assumed relatively high (but moveable) oil viscosities as discussed in Section 1 Recovery factor estimates are made with reference to this and also to analogue where uncertainty in both reservoir quality and also the degree of fracturing (and hence dual permeability) leads to a wide range in uncertainty in ultimate recovery Our low case recovery factor being affected primarily by early onset of water cut via fractures and an adverse mobility ratio and the high case making allowance for better oil mobility and improved matrix porosity and permeability leading to a more efficient sweep We therefore use a recovery factor range from 10 to 35 and use these as the P90 and P10 estimates on a log-normal distribution in our probabilistic simulation of prospective resources
Senonian UC
Intra Aptian Carbonate
TWT (ms)2 km
w EProspect M
Competent Personrsquos Report African Petroleum Corporation Limited
June 2013 58
Figure 3-9 Low and high case closure Prospect M top Aptian depth (m TVDSS)
There is pick and depth conversion uncertainty associated with Prospect M but we see a good chance of a closure being developed within the 3D seismic area and assign a prospect specific risk to trap of 09 as a result Downlapping events are observed onto the crest of the prospect (Figure 3-8) but the overlying seismic signature is relatively transparent thus we see a good chance of the prospect being sealed relative to the play risk However the prospect is relatively shallow at around 1000 m to 1100 m below the seabed and there is a risk to biodegradation of any oil charge Thus we associate a risk of 06 to biodegradation As it is established practice we place this risk into containment or trap risk which results in an overall trap risk of 09 06 or 54
There is evidence for the development of reservoir quality rock with a seismic character that has been associated with the development of karstification in the analogues used We also note that the prospect is very close to the platform edge and the erosional unconformity is quite pronounced again suggesting a period of subareal exposure Thus we see the prospect specific risk to reservoir efficacy as 08 Charge risk is also favourable with the prospect located at the edge of the buried platform margin proximal to the deeper potential kitchen areas We therefore associate a charge risk of 08 to the prospect
Thus we assign a prospect specific risk of 35 which when combined with the play risk for the carbonate platform margin gives an overall COS of 10
3
3
m ss
metres
Competent Personrsquos Report African Petroleum Corporation Limited
June 2013 59
4 Sierra Leone Prospectivity and Plays
As with offshore Liberia to the south-east all of the deep-water acreage offshore Sierra Leone is under licence (Figure 4-1) A discussion of regional hydrocarbon occurrences is presented in Section 21 APCLrsquos licences SL-03 and SL-04A-10 lie to the north-west of the countryrsquos territorial waters around 200 to 300 km north-west of the recent Venus Mercury and Jupiter discoveries made by Anadarko (Figure 4-1)
Figure 4-1 Offshore licences and discoveries Liberia and Sierra Leone
A regional grid of 2D seismic data is available to APCL for the evaluation of offshore Sierra Leone (Figure 4-2) In addition APCL has licenced c 2500 km2 of 3D seismic data covering the deeper water area of Block SL-03 and is negotiating the licencing of further 3D seismic data covering part of Block SL-04A-10
Competent Personrsquos Report African Petroleum Corporation Limited
June 2013 60
Well data offshore Sierra Leone are sparse Historical exploration was restricted to the shelf and resulted in the drilling of two exploration wells (Wells A-1 and A-1-2) which were plugged and abandoned as dry holes Data from both wells are available to APCL Recent drilling by Anadarko in the deeper waters of licence SL-07B-10 has yielded a number of discoveries (Wells Jupiter-1 Venus-1 and Mercury-1) but these well data are not available to APCL
Figure 4-2 Well and seismic database offshore Sierra Leone
The play fairways identified offshore Sierra Leone are very similar to those identified offshore Liberia (Figure 2-3) as structural traps within the Lower Cretaceous syn-rift section and primarily as stratigraphic traps within turbiditic sands of Cretaceous age (Campanian Cenomanian and Turonian) Sourcing from regional marine (Cenomanian) or lacustrine (Albo-Aptian) source rocks is hypothesized For the syn-rift structural play the presence of Albo-Aptian reservoirs is demonstrated by the shallow water Wells A-1 and A-1-2 which also had indications of the development of source rocks within the
Competent Personrsquos Report African Petroleum Corporation Limited
June 2013 61
Cretaceous syn-rift section Although the data are not available the recent Anadarko wells are publically documented as having found hydrocarbons within post-rift Cretaceous turbidites potentially de-risking this play
Blocks SL-03 and SL-04A-10 are towards the north-western edge of the seismically identified Cretaceous basin immediately adjacent to a large structural lineament the Sierra Leone Transform System Submarine canyon development is therefore prognosed to occur to the south and east of this lineament providing sediment input into the blocks during Cretaceous time As is encountered regionally there is reasonable seismic evidence for the presence of reservoir bearing intervals within the Upper Cretaceous section in the blocks
APCLrsquos evaluation of the recently licenced 3D seismic data is on-going and as yet only one prospect Altair has been matured to drillable prospect status However a number of other Cretaceous channelfan systems have been identified within Block SL- 03 (Figure 4-3)
Figure 4-3 Leads Sierra Leone Block SL-03
Competent Personrsquos Report African Petroleum Corporation Limited
June 2013 62
41Play Risk
Although there has been recent drilling along strike of APCLrsquos Sierra Leone licences these wells lie some 100 km to the east We have therefore attributed a play risk albeit favourable to Cretaceous channel-fan prospectivity within Blocks SL-03 and SL-04A-10 As with our review of Liberia there is strong seismic evidence for reservoir and seal rocks being present and offset drilling would indicate the same from the limited published information However there is as yet no proven source rock within APCLrsquos licences and we see this as the key risk to play The reported results of offset drilling and APCLrsquos own basin modelling would suggest that source risk would be favourable
Our final play risk for the Cretaceous channel-fan systems in APCLrsquos Sierra Leone licences is summarised in Table 31 below
PLAY Source Reservoir Presence Seal Play
Risk Cretaceous Play 08 09 09 65
Table 41 Play risk Sierra Leone Block SL-03
41Sierra Leone Leads and Prospects
APCL is currently evaluating the recently licenced 3D seismic data over Block SL-03 and has identified a number of Cretaceous channel-fan systems varying in areal extent from 20 km2 to 150 km2 Of the mapped channel fan systems one Altair has been matured to prospect status by APCL and we have made independent estimates of prospective resources and risks for this prospect
A summary of input parameters for the calculation of prospective resources results and risks for the Altair prospect is given in the resource summary sheet in Enclosure 31 of this document
411Altair
The Altair prospect is a turbidite channel prospect mapped at a seismic event described as Turonian by APCL (Figure 4-4) There is however uncertainty in this stratigraphy as it is established by jump correlation using regional seismic data due to the lack of deep water wells on block It is a stratigraphic trap with areal extents defined by amplitude truncation and structural pinch-out in a similar manner to prospectivity within APCLrsquos Liberia and Cote drsquoIvoire acreage A single target reservoir is identified within the trapped area The prospect has anomalous seismic amplitudes associated with it (Figure 4-5) which may indicate reservoir development The top structure is mapped between 6200 ndash 6800 ms TWT over the area of the prospect Our depth conversion indicates a crestal depth of approximately 5400 m TVDSS beneath a water depth of 3300 m giving 2100 m of sediment above top reservoir
Competent Personrsquos Report African Petroleum Corporation Limited
June 2013 63
Figure 4-4 Dip seismic line (full offsets) Altair prospect
The seismic image suggests that Altair is a turbidite channel constrained in the north east by a well-defined canyon Two distinct canyon systems feed erosive channels at the break of slope A south west trending fault which is almost perpendicular to the main canyon feeders alters bathymetric relief and diverts the Altair channel southwards
ERCE has made estimates of prospective resources for the Altair prospect using an identical methodology to our evaluation of Liberian prospectivity An area net approach was adopted using optimized seismic amplitudes to constrain areal extent and define an areal net to gross to account for lateral variability of sand distribution within the reservoir In our low case we restrict the area of the accumulation to the brightest area of anomalous amplitudes and a column height of 200 m Our high case extends the prospect down-dip to a column height of 800 m and laterally to incorporate weaker amplitude responses (Figure 4-5) These polygons were used to constrain the P90 and P10 area inputs of our probabilistic simulation
SW NE
Top Turonian
Top syn-rift
0 5kmTWT (s)
ALTAIR
3
3
metres
Competent Personrsquos Report African Petroleum Corporation Limited
June 2013 64
Figure 4-5 Seismic amplitude (gradient stack) and Top Turonian depth (m TVDSS) Altair prospect
Net pay is estimated from the mapped seismic interval and regional analogue with porosities and fluid properties estimated as described in Section 16
We have used the prospect risk matrix presented in Section 16 to determine the geological chance of success for the Altair prospect Key risk is to trap integrity due to the coalescing of a number of mapped fan systems up dip towards the pinch-out of Altair with subsidiary risk to charge as this is as yet unproven on block This gives a prospect specific risk of 28 which when combined with the play risk gives an overall chance of success of 18 for the Altair prospect
3
3
metres
Competent Personrsquos Report African Petroleum Corporation Limited
June 2013 65
5 Cote13 drsquoIvoire13 Prospectivity13 and Plays
51Introduction
Offshore Cote drsquoIvoire has been actively explored for hydrocarbons for a number of years and much of the offshore shelf is under licence Recently exploration has moved into deeper waters targeting the regional post-rift (Cretaceous) play and APCL has identified a number of prospects and leads within the western licence Blocks of CI-513 and CI-509 (Figure 5-1)
There are two main play types identifiable offshore Cote drsquoIvoire (Figure 5-2) as structural traps within the Lower Cretaceous (Aptian to Albian) syn-rift section and as stratigraphic traps within post rift turbiditic sands of Cenomanian to Turonian age Sourcing is prognosed from regional marine (Turonian) or lacustrine (Albo-Aptian) source rocks
Figure 5-1 CI-509 and CI-513 Prospects and Leads13 offshore13 Cote13 drsquoIvoire
Historically exploration has been restricted to the narrow shelf area and has yielded a number of commercial fields both oil and gas including Foxtrot Baobab and Espoir All of these fields lie within the Lower Cretaceous (Aptian) syn-rift play Recently exploration has moved into deeper waters targeting the regional post-rift (Cretaceous) play Well Paon-1X c 300 km to the east of Blocks CI-105 and CI-513
Competent Personrsquos Report African Petroleum Corporation Limited
June 2013 66
drilled by Tullow Oil plc and partners in licence CI-103 during 2012 is reported to have found hydrocarbons in turbiditic sandstones of Cretaceous age Well Kosrou-1X some 150 km east of Blocks CI-105 and CI-513 shows reservoir development within the post-rift Cretaceous section particularly within the Turonian to Cenomanian section
Evaluation of prospectivity within Blocks CI-509 and CI-513 is at an early stage and a working petroleum system is not proven on block However a number of Cretaceous channelfan systems have been identified using both 2D and 3D seismic data which have generated around seven potential traps at the date of this report five of which are considered prospects for this report (Figure 5-1)
Figure 5-2 Petroleum13 systems13 and13 plays13 offshore13 Cote13 drsquoIvoire
52Well and Seismic Database
APCL has obtained a regional database of 2D seismic data offshore Cote drsquoIvoire which provides well to seismic ties to Well San Pedro-1 (Figure 5-3) The primary data set used for our evaluation is that provided by the recently acquired 3D seismic data At the time of writing these data were processed to
Competent Personrsquos Report African Petroleum Corporation Limited
June 2013 67
pre-stack time-migration and we have used this volume plus available AvO processed volumes to evaluate the prospectivity of the CI-513 licence currently only the full-stack seismic product has been used to assess the prospectivity in Block CI-509
Figure 5-3 Well and seismic database offshore Sierra Leone
53Plays and Petroleum Geology Blocks CI-509 and CI-513
The primary play being explored within Blocks CI-509 and CI-513 is the Cretaceous post-rift turbidite play (Figure 5-2) There is reasonable seismic evidence for the presence of reservoir bearing intervals within the Upper Cretaceous section of the blocks However dating of the age of these post-rift turbidite channelfan systems is uncertain due to the paucity of well and seismic data with stratigraphy extrapolated into APCLrsquos licences via regional seismic correlation The presence of a regional Turonian source rock is hypothesized to charge any identified traps This is not proven on block but evidence from offset drilling in Block CI-105 demonstrates the presence of source rocks developed within the
Grand Lahou East 1
Kosrou 1x
San Pedro 1
South Grand Lahou 1
Competent Personrsquos Report African Petroleum Corporation Limited
June 2013 68
Cenomanian to Turonian and basin modelling studies indicate that the Turonian may be mature for oil generation local to the licences
A number of Cretaceous channelfan systems have been identified using both 2D and 3D seismic data (Figure 5-1) and we have independently evaluated the Prospective Resources and geological chance of success for five of these In addition the Lower Cretaceous syn-rift play may be viable within the licences particularly to the north Evaluation of this play by APCL is on-going and no prospective resources have been assessed for this play
54Play Risk
Exploration offshore Cote drsquoIvoire is at an early stage and there are limited well data available As a result ERCE has adopted a play and prospect risk system in our evaluation of the Cote drsquoIvoire prospective resources within the Cretaceous channel-fan play in an identical manner to our review of Liberia the Gambia and Sierra Leone
In a similar manner to Liberia the Gambia and Sierra Leone there is seismic evidence for the presence of seal and reservoir rock and thus the key risk is to source and we see source risk as the key risk to the Creteaceous clastic play Sourcing is prognosed from regional marine (Turonian) modelled as having limited hydrocarbon generating potential or lacustrine (Albo-Aptian) source rocks the maturity of which are interpreted to be in the very early oil window As a result we assign a play source risk of 06 Note that the uncertainty in both source rock presence and thermal maturity is such that there is a possibility of gas charge although it is impossible to quantify this chance at present
Our final play risk is summarised in Table 51 below
PLAY Source Reservoir Presence Seal Play
Risk Cretaceous Clastic Play 06 09 09 049
Table 51 Play13 risk13 Cote13 drsquoIvoire13 Blocks13 CI-509 and CI-513
Competent Personrsquos Report African Petroleum Corporation Limited
June 2013 69
ͷǤͷǤ Cote13 drsquoIvoire13 Blocks13 CI-509 and CI-503 Leads and Prospects
Prospectivity has been identified by APCL at a number of levels with the evaluation of the Cretaceous clastic turbidite channel-fan play being the most advanced ERCE has made independent assessments of prospective resources and geological chance of success for five prospects within this play Ayame Ayame West Sassandra Cavella and Leraba (Figure 5-1)
A summary of input parameters for the calculation of prospective resources results and risks for each of the prospective layers evaluated is given in the resource summary sheets in Enclosures 41 to 45 of this document
ͷǤͷǤͳǤ Ayame amp Ayame West
The Ayame and Ayame West prospects are identified as Upper Cretaceous fans which lie mainly within Block CI-513 (Figure 5-4) The prognosed trapping mechanism is stratigraphic with areal extents defined by amplitude truncation and structural pinch-out A single target reservoir is prognosed for both within stratigraphy identified as Turonian although stratigraphy is uncertain in both licences as it is established via long distance seismic ties The prospects have anomalous seismic amplitudes associated with them (Figure 5-5) which may indicate reservoir development The top structure is mapped between 5400 ndash 6300 ms TWT over the area of the prospect and our depth conversion places the crest of the trap at approximately 4200 m TVDSS beneath a water depth of 2500 m
Figure 5-4 Strike Line Ayame and Ayame West prospects
NE
0 km 4
TWT (s)
Top
Turonian
Base
Turonian
Top
Albian
AYAMEAYAME WESTSW
P90
P10
metres
P90
P10
AYAME
AYAMEWEST
Competent Personrsquos Report African Petroleum Corporation Limited
June 2013 70
Evaluation of the Ayame and Ayame West prospects is undertaken in an identical manner to our evaluations of the stratigraphically trapped channel-fan prospects in APCLrsquos Liberia and Sierra Leone licences An area net approach is adopted using anomalous seismic amplitudes to constrain areal extent and define an areal net to gross to account for lateral variability of sand distribution within the closure area In our low case we restrict the area of the accumulation to the brightest area of anomalous amplitudes and a 200 m column height Our high case extends the prospect down-dip to 800 m of column height to include a larger area of anomalous amplitudes (Figure 5-5) These polygons are used to constrain the P90 and P10 area inputs of our probabilistic simulation
Net pay estimates are estimated from mapped seismic interval thickness and from regional analogues with porosity fluid parameters and recovery factors estimated as described in Section 16
Figure 5-5 Ayame Seismic amplitude (gradient stack) and Top Turonian depth (m TVDSS)
We use the prospect risk matrix presented in Section 16 to determine the geological chance of success for the Ayame and Ayame West prospects Key risk is to trap and we attribute a trap risk of 50 to both
P90
P10
metres
P90
P10
AYAME
AYAMEWEST
Competent Personrsquos Report African Petroleum Corporation Limited
June 2013 71
prospects giving a prospect specific chance of success of 28 for both prospects When combined with the play risk this gives an overall chance of success of 14
A proportion of the closure areas for both the Ayame and Ayame West prospects fall outside Block CI-513 in our high case (6 km2 and 11 km2 respectively) This is corrected for in our summary tables of net risked and unrisked prospective resources at the beginning of this document by computing the area of the prospect off-block at P90 P50 and P10 and scaling accordingly
ͷǤͷǤʹǤ Sassandra
The Sassandra prospect is mapped as a deep-water fan system at Top Turonian level and lies within Blocks CI-513 and CI-509 approximately 20km west along strike from the Ayame prospect It is a stratigraphic trap with areal extents defined by amplitude truncation and structural pinch-out (Figure 5-6) A single target reservoir is prognosed within the Turonian and as with other prospects on block has similar uncertainty in the stratigraphic age of the prospective interval The prospect has anomalous amplitudes associated with it (Figure 5-7) which may indicate reservoir development The top structure is mapped between 5000 ndash 6000 ms TWT over the area of the prospect and our depth conversion predicts a crestal depth of approximately 4400 m TVDSS beneath a water depth of 2500 m
Figure 5-6 Dip seismic line Sassandra prospect
Top Turonian
Base Turonian
Top Albian
N S
TWT (s)
SASSANDRA
P90 P10
metres
CI-509
Competent Personrsquos Report African Petroleum Corporation Limited
June 2013 72
Evaluation of the Sassandra prospect is undertaken in an identical manner to our evaluation of the Ayame and Ayame West prospects An area net approach is adopted using anomalous seismic amplitudes to constrain areal extent and define an areal net to gross to account for lateral variability of sand distribution within the closure area In our low case we restrict the area of the accumulation to the brightest area of anomalous amplitudes and a 200 m column height Our high case extends the prospect down-dip to 800 m of column height to include a larger area of anomalous amplitudes (Figure 5-7) These polygons are used to constrain the P90 and P10 area inputs of our probabilistic simulation As far offset data are only available for CI-513 (at the time of writing) we have used amplitudes from the full-stack volume to map the extent of the prospect to the west off block (Figure 5-7)
Net pay estimates are estimated from mapped seismic interval thickness and from regional analogues with porosity fluid parameters and recovery factors estimated as described in Section 16
Figure 5-7 Sassandra prospect Seismic amplitude and Top Turonian depth (m TVDSS)
We use the prospect risk matrix presented in Section 16 to determine the geological chance of success for the Sassandra prospect Key risk is to trap and we attribute a trap risk of 40 This is a lower value
33
metres
CI-509
Competent Personrsquos Report African Petroleum Corporation Limited
June 2013 73
than our estimates for the Ayame and Ayame West prospects as the up-dip termination of the trap is less well defined and requires a larger area for pinch-out or bypass Seismic amplitude support for reservoir presence is less over the Sassandra prospect relative to Ayame Thus we estimate a prospect specific chance of success for the Sassandra prospect of 20 which when combined with the play risk gives an overall chance of success for the Sassandra prospect of 10
A proportion of the closure area for the Sassandra prospect falls outside Blocks CI-513 and CI-509 in our high case (33 km2) This is corrected for in our summary tables of net risked and unrisked prospective resources at the beginning of this document by computing the area of the prospect off-block at P90 P50 and P10 and scaling accordingly
553Cavalla
The Cavalla prospect is an Upper Cretaceous Fan which lies between the Ayame and Sassandra prospects within Block CI-513 It is identified as a stratigraphic trap with areal extents defined by amplitude truncation and structural pinch-out (Figure 5-8) A single target reservoir is prognosed within the TuronianCenomanian interval (with similar stratigraphic uncertainty to other prospects on block) which lies stratigraphically beneath the Ayame prospect The prospect has anomalous seismic amplitudes associated with it (Figure 5-9) which may indicate reservoir development The top structure is mapped between 4600 ndash 5900 ms TWT over the area of the prospect and we estimate a crestal depth of approximately 3900 m TVDSS beneath a water depth of 2500 m The prospect is more steeply dipping than other fan systems mapped on block
Evaluation of the Cavalla prospect is undertaken in an identical manner to our evaluation of the Ayame Ayame West and Sassandra prospects An area net approach is adopted using anomalous seismic amplitudes to constrain areal extent and define an areal net to gross to account for lateral variability of sand distribution within the closure area In our low case we restrict the area of the accumulation to the brightest area of anomalous amplitudes and a 200 m column height Our high case extends the prospect down-dip to 800 m of column height to include a larger area of anomalous amplitudes (Figure 5-9) These polygons are used to constrain the P90 and P10 area inputs of our probabilistic simulation
Net pay estimates are estimated from mapped seismic interval thickness and from regional analogues with porosity fluid parameters and recovery factors estimated as described in Section 16
We use the prospect risk matrix presented in Section 16 to determine the geological chance of success for the Cavella prospect Key risk is to trap and we attribute a trap risk of 40 As with the Sassandra prospect this is a lower value than our estimates for the Ayame and Ayame West prospects as the up-dip termination of the trap is less well defined and requires a larger area for pinch-out or bypass Seismic amplitude support for reservoir presence is less over the Cavella prospect relative to Ayame Thus we estimate a prospect specific chance of success for the Cavella prospect of 20 which when combined with the play risk gives an overall chance of success for the Cavella prospect of 10
Competent Personrsquos Report African Petroleum Corporation Limited
June 2013 74
The Cavalla prospect is contained entirely within APCLrsquos licences
Figure 5-8 Dip seismic line Cavalla prospect
Top Turonian
Top Albian
TWT (s)
CAVALLANW SEP90
P10
metres
Competent Personrsquos Report African Petroleum Corporation Limited
June 2013 75
Figure 5-9 Seismic amplitude (gradient stack) and Top fan depth (m TVDSS) Cavalla prospect
ͷǤͷǤͶǤ Leraba
As with the other evaluated prospectivity within Blocks CI-509 and CI-513 the Leraba prospect is an Upper Cretaceous fan which lies within Block CI-509 It is identified as a stratigraphic trap with areal extents defined by amplitude truncation and structural pinch-out (Figure 5-10) The prospect has anomalous seismic amplitudes associated with it (Figure 5-11) which may indicate reservoir development Unlike the other Cote DrsquoIvoire prospects evaluated in this report no offset seismic volumes were available for our review of Leraba at the time of writing The seismic amplitude response and character on the full-stack data is however consistent with that observed over other prospects in Block CI-513 where more seismic products were available
P90
P10
metres
Competent Personrsquos Report African Petroleum Corporation Limited
June 2013 76
The top structure is mapped between 4600 ndash 5200 ms TWT over the area of the prospect and we estimate a depth at the crest of approximately 3700 m TVDSS beneath a water depth of 2500 m
Figure 5-10 Dip seismic line Leraba prospect
Evaluation of the Leraba prospect is undertaken in an identical manner to our evaluation of the other Cretaceous fan systems evaluated in this section An area net approach is adopted using anomalous seismic amplitudes to constrain areal extent and define an areal net to gross to account for lateral variability of sand distribution within the closure area In our low case we restrict the area of the accumulation to the brightest area of anomalous amplitudes and a 200 m column height Our high case extends the prospect down-dip to 800 m of column height to include a larger area of anomalous amplitudes (Figure 5-11) These polygons are used to constrain the P90 and P10 area inputs of our probabilistic simulation
P90
P10
metresTWT (s)
LERABANW SE
Top Turonian
Albian
0 5km
Competent Personrsquos Report African Petroleum Corporation Limited
June 2013 77
Figure 5-11 Seismic amplitudes Leraba prospect overlay of Top Reservoir m TVDSS
Net pay estimates are derived from mapped seismic interval thickness and from regional analogues with porosity fluid parameters and recovery factors estimated as described in Section 16 The prospect is relatively shallow to mud line and we have modelled a more viscous oil as described in Section 16
We use the prospect risk matrix presented in Section 16 to determine the geological chance of success for the Leraba prospect Key risk is to trap and we attribute a trap risk of 60 as the up-dip extent of the prospect is fairly well defined on seismic data Although no off-set 3D seismic data were available the seismic evidence for reservoir presence is again comparable to that of Ayame West Thus we estimate a prospect specific chance of success for the Leraba prospect of 34 which when combined with the play risk gives an overall chance of success for the Leraba prospect of 16
The Leraba prospect is contained entirely within APCLrsquos licences
P90
P10
metres
Competent Personrsquos Report African Petroleum Corporation Limited
June 2013 78
6 Senegal Prospectivity and Plays
Prospectivity identified within APCLrsquos Sengalese licences is seen as being similar to that identified offshore Gambia (Figure 6-1) and a description of the regional petroleum systems and main play types expected is given in Section 3
Figure 6-1 Petroleum systems and plays offshore Senegal
In 2012 APCL acquired 3600 km2 of multi-client 3D seismic data over the Offshore Sud Profond licence In addition 1500 km2 of legacy 3D data over the Rufisque Offshore Profond licence is currently being reprocessed by APCL and legacy 2D seismic data (c 7000 line km) have also been acquired APCL expects to begin prospect evaluation once seismic processing is complete which is expected later in 2013 At present a number of conceptual Cretaceous post-rift leads are identified by APCL (Figure 6-2)
Competent Personrsquos Report African Petroleum Corporation Limited
June 2013 79
Figure 6-2 leads offshore Senegal Blocks ROP and SOSP
Competent Personrsquos Report African Petroleum Corporation Limited
June 2013 80
7 Appendix 1 SPE PRMS Guidelines
SPEWPCAAPGSPEE Petroleum Reserves and Resources Classification System and Definitions
The Petroleum Resources Management System
Preamble
Petroleum Resources are the estimated quantities of hydrocarbons naturally occurring on or within the Earthrsquos crust Resource assessments estimate total quantities in known and yet-to-be-discovered accumulations Resources evaluations are focused on those quantities that can potentially be recovered and marketed by commercial projects A petroleum Resources managements system provides a consistent approach to estimating petroleum quantities evaluating development projects and presenting results within a comprehensive classification framework
International efforts to standardize the definitions of petroleum Resources and how they are estimated began in the 1930s Early guidance focused on Proved Reserves Building on work initiated by the Society of Petroleum Evaluation Engineers (SPEE) SPE published definitions for all Reserves categories in 1987 In the same year the World Petroleum Council (WPC then known as the World Petroleum Congress) working independently published Reserves definitions that were strikingly similar In 1997 the two organizations jointly released a single set of definitions for Reserves that could be used worldwide In 2000 the American Association of Petroleum Geologists (AAPG) SPE and WPC jointly developed a classification system for all petroleum Resources This was followed by additional supporting documents supplemental application evaluation guidelines (2001) and a glossary of terms utilized in Resources definitions (2005) SPE also published standards for estimating and auditing Reserves information (revised 2007)
These definitions and the related classification system are now in common use internationally within the petroleum industry They provide a measure of comparability and reduce the subjective nature of Resources estimation However the technologies employed in petroleum exploration development production and processing continue to evolve and improve The SPE Oil and Gas Reserves Committee works closely with other organizations to maintain the definitions and issues periodic revisions to keep current with evolving technologies and changing commercial opportunities
The SPE-PRMS consolidates builds on and replaces guidance previously contained in the 1997 Petroleum Reserves Definitions the 2000 Petroleum Resources Classification and Definitions publications and the 2001 ldquoGuidelines for the Evaluation of Petroleum Reserves and Resourcesrdquo the latter document remains a valuable source of more detailed background information
These definitions and guidelines are designed to provide a common reference for the international petroleum industry including national reporting and regulatory disclosure agencies and to support petroleum project and portfolio management requirements They are intended to improve clarity in
Competent Personrsquos Report African Petroleum Corporation Limited
June 2013 81
global communications regarding petroleum Resources It is expected that the SPE-PRMS will be supplemented with industry education programs and application guides addressing their implementation in a wide spectrum of technical andor commercial settings
It is understood that these definitions and guidelines allow flexibility for users and agencies to tailor application for their particular needs however any modifications to the guidance contained herein should be clearly identified The definitions and guidelines contained in this document must not be construed as modifying the interpretation or application of any existing regulatory reporting requirements
The full text of the SPEWPCAAPGSPEE Petroleum Resources Management System document hereinafter referred to as the SPE-PRMS can be viewed at
wwwspeorgspecmabinaryfiles6859916Petroleum_Resources_Management_System_2007pdf
Overview and Summary of Definitions
The estimation of petroleum resource quantities involves the interpretation of volumes and values that have an inherent degree of uncertainty These quantities are associated with development projects at various stages of design and implementation Use of a consistent classification system enhances comparisons between projects groups of projects and total company portfolios according to forecast production profiles and recoveries Such a system must consider both technical and commercial factors that impact the projectrsquos economic feasibility its productive life and its related cash flows
Petroleum is defined as a naturally occurring mixture consisting of hydrocarbons in the gaseous liquid or solid phase Petroleum may also contain non-hydrocarbons common examples of which are carbon dioxide nitrogen hydrogen sulphide and sulphur In rare cases non-hydrocarbon content could be greater than 50
The term ldquoResourcesrdquo as used herein is intended to encompass all quantities of petroleum naturally occurring on or within the Earthrsquos crust discovered and undiscovered (recoverable and unrecoverable) plus those quantities already produced Further it includes all types of petroleum whether currently considered conventionalrdquo or ldquounconventionalrdquo
Figure 1-1 is a graphical representation of the SPEWPCAAPGSPEE Resources classification system The system defines the major recoverable Resources classes Production Reserves Contingent Resources and Prospective Resources as well as Unrecoverable petroleum
Competent Personrsquos Report African Petroleum Corporation Limited
June 2013 82
Figure 1-1 SPEAAPGWPCSPEE Resources Classification System
The ldquoRange of Uncertaintyrdquo reflects a range of estimated quantities potentially recoverable from an accumulation by a project while the vertical axis represents the ldquoChance of Developmentrdquo that is the chance that the project that will be developed and reach commercial producing status
The following definitions apply to the major subdivisions within the Resources classification
TOTAL PETROLEUM INITIALLY-IN-PLACE
Total Petroleum Initially in Place is that quantity of petroleum that is estimated to exist originally in naturally occurring accumulations
It includes that quantity of petroleum that is estimated as of a given date to be contained in known accumulations prior to production plus those estimated quantities in accumulations yet to be discovered (equivalent to ldquototal Resourcesrdquo)
Competent Personrsquos Report African Petroleum Corporation Limited
June 2013 83
DISCOVERED PETROLEUM INITIALLY-IN-PLACE
Discovered Petroleum Initially in Place is that quantity of petroleum that is estimated as of a given date to be contained in known accumulations prior to production
PRODUCTION
Production is the cumulative quantity of petroleum that has been recovered at a given date
Multiple development projects may be applied to each known accumulation and each project will recover an estimated portion of the initially-in-place quantities The projects shall be subdivided into Commercial and Sub-Commercial with the estimated recoverable quantities being classified as Reserves and Contingent Resources respectively as defined below
RESERVES
Reserves are those quantities of petroleum anticipated to be commercially recoverable by application of development projects to known accumulations from a given date forward under defined conditions
Reserves must satisfy four criteria they must be discovered recoverable commercial and remaining based on the development project(s) applied Reserves are further subdivided in accordance with the level of certainty associated with the estimates and may be sub-classified based on project maturity andor characterized by their development and production status To be included in the Reserves class a project must be sufficiently defined to establish its commercial viability There must be a reasonable expectation that all required internal and external approvals will be forthcoming and there is evidence of firm intention to proceed with development within a reasonable time frame A reasonable time frame for the initiation of development depends on the specific circumstances and varies according to the scope of the project While five years is recommended as a benchmark a longer time frame could be applied where for example development of economic projects are deferred at the option of the producer for among other things market-related reasons or to meet contractual or strategic objectives
In all cases the justification for classification as Reserves should be clearly documented To be included in the Reserves class there must be a high confidence in the commercial producibility of the reservoir as supported by actual production or formation tests In certain cases Reserves may be assigned on the basis of well logs andor core analysis that indicate that the subject reservoir is hydrocarbon-bearing and is analogous to reservoirs in the same area that are producing or have demonstrated the ability to produce on formation tests
Proved Reserves
Proved Reserves are those quantities of petroleum which by analysis of geoscience and engineering data can be estimated with reasonable certainty to be commercially recoverable from a given date forward from known reservoirs and under defined economic conditions operating methods and government regulations
Competent Personrsquos Report African Petroleum Corporation Limited
June 2013 84
If deterministic methods are used the term reasonable certainty is intended to express a high degree of confidence that the quantities will be recovered If probabilistic methods are used there should be at least a 90 probability that the quantities actually recovered will equal or exceed the estimate The area of the reservoir considered as Proved includes
the area delineated by drilling and defined by fluid contacts if any and adjacent undrilled portions of the reservoir that can reasonably be judged as continuous with it and commercially productive on the basis of available geoscience and engineering data
In the absence of data on fluid contacts Proved quantities in a reservoir are limited by the lowest known hydrocarbon (LKH) as seen in a well penetration unless otherwise indicated by definitive geoscience engineering or performance data Such definitive information may include pressure gradient analysis and seismic indicators Seismic data alone may not be sufficient to define fluid contacts for Proved Reserves (see ldquo2001 Supplemental Guidelinesrdquo Chapter 8) Reserves in undeveloped locations may be classified as Proved provided that the locations are in undrilled areas of the reservoir that can be judged with reasonable certainty to be commercially productive and interpretations of available geoscience and engineering data indicate with reasonable certainty that the objective formation is laterally continuous with drilled Proved locations
For Proved Reserves the recovery efficiency applied to these reservoirs should be defined based on a range of possibilities supported by analogs and sound engineering judgment considering the characteristics of the Proved area and the applied development program
Probable Reserves
Probable Reserves are those additional Reserves which analysis of geoscience and engineering data indicate are less likely to be recovered than Proved Reserves but more certain to be recovered than Possible Reserves
It is equally likely that actual remaining quantities recovered will be greater than or less than the sum of the estimated Proved plus Probable Reserves (2P) In this context when probabilistic methods are used there should be at least a 50 probability that the actual quantities recovered will equal or exceed the 2P estimate
Probable Reserves may be assigned to areas of a reservoir adjacent to Proved where data control or interpretations of available data are less certain The interpreted reservoir continuity may not meet the reasonable certainty criteria Probable estimates also include incremental recoveries associated with project recovery efficiencies beyond that assumed for Proved
Possible Reserves
Possible Reserves are those additional Reserves which analysis of geoscience and engineering data indicate are less likely to be recoverable than Probable Reserves
Competent Personrsquos Report African Petroleum Corporation Limited
June 2013 85
The total quantities ultimately recovered from the project have a low probability to exceed the sum of Proved plus Probable plus Possible (3P) which is equivalent to the high estimate scenario When probabilistic methods are used there should be at least a 10 probability that the actual quantities recovered will equal or exceed the 3P estimate
Possible Reserves may be assigned to areas of a reservoir adjacent to Probable where data control and interpretations of available data are progressively less certain Frequently this may be in areas where geoscience and engineering data are unable to clearly define the area and vertical reservoir limits of commercial production from the reservoir by a defined project
Possible estimates also include incremental quantities associated with project recovery efficiencies beyond that assumed for Probable
Probable and Possible Reserves
(See above for separate criteria for Probable Reserves and Possible Reserves)
The 2P and 3P estimates may be based on reasonable alternative technical and commercial interpretations within the reservoir andor subject project that are clearly documented including comparisons to results in successful similar projects
In conventional accumulations Probable andor Possible Reserves may be assigned where geoscience and engineering data identify directly adjacent portions of a reservoir within the same accumulation that may be separated from Proved areas by minor faulting or other geological discontinuities and have not been penetrated by a wellbore but are interpreted to be in communication with the known (Proved) reservoir Probable or Possible Reserves may be assigned to areas that are structurally higher than the Proved area Possible (and in some cases Probable) Reserves may be assigned to areas that are structurally lower than the adjacent Proved or 2P area
Caution should be exercised in assigning Reserves to adjacent reservoirs isolated by major potentially sealing faults until this reservoir is penetrated and evaluated as commercially productive Justification for assigning Reserves in such cases should be clearly documented Reserves should not be assigned to areas that are clearly separated from a known accumulation by non-productive reservoir (ie absence of reservoir structurally low reservoir or negative test results) such areas may contain Prospective Resources
In conventional accumulations where drilling has defined a highest known oil (HKO) elevation and there exists the potential for an associated gas cap Proved oil Reserves should only be assigned in the structurally higher portions of the reservoir if there is reasonable certainty that such portions are initially above bubble point pressure based on documented engineering analyses Reservoir portions that do not meet this certainty may be assigned as Probable and Possible oil andor gas based on reservoir fluid properties and pressure gradient interpretations
Competent Personrsquos Report African Petroleum Corporation Limited
June 2013 86
CONTINGENT RESOURCES
Contingent Resources are those quantities of petroleum estimated as of a given date to be potentially recoverable from known accumulations by application of development projects but which are not currently considered to be commercially recoverable due to one or more contingencies
Contingent Resources may include for example projects for which there are currently no viable markets or where commercial recovery is dependent on technology under development or where evaluation of the accumulation is insufficient to clearly assess commerciality Contingent Resources are further categorized in accordance with the level of certainty associated with the estimates and may be sub-classified based on project maturity andor characterized by their economic status
UNDISCOVERED PETROLEUM INITIALLY-IN-PLACE
Undiscovered Petroleum Initially in Place is that quantity of petroleum that is estimated as of a given date to be contained within accumulations yet to be discovered
PROSPECTIVE RESOURCES
Prospective Resources are those quantities of petroleum which are estimated as of a given date to be potentially recoverable from undiscovered accumulations
Potential accumulations are evaluated according to their chance of discovery and assuming a discovery the estimated quantities that would be recoverable under defined development projects It is recognized that the development programs will be of significantly less detail and depend more heavily on analog developments in the earlier phases of exploration
Prospect
A project associated with a potential accumulation that is sufficiently well defined to represent a viable drilling target
Project activities are focused on assessing the chance of discovery and assuming discovery the range of potential recoverable quantities under a commercial development program
Lead
A project associated with a potential accumulation that is currently poorly defined and requires more data acquisition andor evaluation in order to be classified as a prospect
Project activities are focused on acquiring additional data andor undertaking further evaluation designed to confirm whether or not the lead can be matured into a prospect Such evaluation includes the assessment of the chance of discovery and assuming discovery the range of potential recovery under feasible development scenarios
Play
Competent Personrsquos Report African Petroleum Corporation Limited
June 2013 87
A project associated with a prospective trend of potential prospects but which requires more data acquisition andor evaluation in order to define specific leads or prospects
Project activities are focused on acquiring additional data andor undertaking further evaluation designed to define specific leads or prospects for more detailed analysis of their chance of discovery and assuming discovery the range of potential recovery under hypothetical development scenarios
The range of uncertainty of the recoverable andor potentially recoverable volumes may be represented by either deterministic scenarios or by a probability distribution When the range of uncertainty is represented by a probability distribution a low best and high estimate shall be provided such that
bull There should be at least a 90 probability (P90) that the quantities actually recovered will equal or exceed the low estimate
bull There should be at least a 50 probability (P50) that the quantities actually recovered will equal or exceed the best estimate
bull There should be at least a 10 probability (P10) that the quantities actually recovered will equal or exceed the high estimate
When using the deterministic scenario method typically there should also be low best and high estimates where such estimates are based on qualitative assessments of relative uncertainty using consistent interpretation guidelines Under the deterministic incremental (risk-based) approach quantities at each level of uncertainty are estimated discretely and separately
These same approaches to describing uncertainty may be applied to Reserves Contingent Resources and Prospective Resources While there may be significant risk that sub-commercial and undiscovered accumulations will not achieve commercial production it useful to consider the range of potentially recoverable quantities independently of such a risk or consideration of the resource class to which the quantities will be assigned
Evaluators may assess recoverable quantities and categorize results by uncertainty using the deterministic incremental (risk-based) approach the deterministic scenario (cumulative) approach or probabilistic methods (see ldquo2001 Supplemental Guidelinesrdquo Chapter 25) In many cases a combination of approaches is used
Use of consistent terminology (Figure 11) promotes clarity in communication of evaluation results For Reserves the general cumulative terms lowbesthigh estimates are denoted as 1P2P3P respectively The associated incremental quantities are termed Proved Probable and Possible Reserves are a subset of and must be viewed within context of the complete Resources classification system While the categorization criteria are proposed specifically for Reserves in most cases they can be equally applied to Contingent and Prospective Resources conditional upon their satisfying the criteria for discovery andor development
Competent Personrsquos Report African Petroleum Corporation Limited
June 2013 88
For Contingent Resources the general cumulative terms lowbesthigh estimates are denoted as 1C2C3C respectively For Prospective Resources the general cumulative terms lowbesthigh estimates still apply No specific terms are defined for incremental quantities within Contingent and Prospective Resources
Without new technical information there should be no change in the distribution of technically recoverable volumes and their categorization boundaries when conditions are satisfied sufficiently to reclassify a project from Contingent Resources to Reserves All evaluations require application of a consistent set of forecast conditions including assumed future costs and prices for both classification of projects and categorization of estimated quantities recovered by each project
Competent Personrsquos Report African Petroleum Corporation Limited
June 2013 89
8 Appendix 2 Nomenclature
81 Units degC degrees Celsius
degF degrees Fahrenheit
bbl barrel
cp centipoises
ft feet
ftMDRKB feet below Kelly Bushing
ftTVDSS feet subsea
km kilometres
m metres
M or MM thousands and millions respectively
ms metres per second
md millidarcy
mTVDSS metres subsea
psia pounds per square inch absolute
psig pounds per square inch gauge
pu porosity unit
rb reservoir barrels
stb a stock tank barrel which is 42 US gallons measured at 147 pounds per square inch and 60 degrees Fahrenheit
82 Reserves and Resources Classifications
Low Low estimate of Prospective Resources as defined in SPE PRMS 2007
Best Best estimate of Prospective Resources as defined in SPE PRMS 2007
High High estimate of Prospective Resources as defined in SPE PRMS 2007
COS Geological Chance of Success associated with Prospective Resources
P10 10 per cent probability = Proved + Probable + Possible or 3P
P50 50 per cent probability = Proved + Probable or 2P
P90 90 per cent probability = Proved or 1P
83 Abbreviations AvO amplitude variation with offset
Bo oil shrinkage factor or formation volume factor in rbstb
Competent Personrsquos Report African Petroleum Corporation Limited
June 2013 90
CPI computer processed information log
FVF formation volume factor
FWL free water level
GRV gross rock volume
GWC gas water contact
KB kelly bushing
kh permeability thickness
MD measured depth
MSL mean sea level
NG net to gross ratio
OWC oil water contact
Phi porosity
PSC production sharing contract
PSDM post stack depth migration
PSTM post stack time migration
PVT pressure volume temperature experiment
RFT repeat formation tester
So oil saturation
Soi initial oil saturation
SS Subsea
STOIIP stock tank oil initially in place
Sw water saturation
Swc connate water saturation
TD total depth
TOC total organic carbon
TVD true vertical depth
TWT two way time
Vsh shale volume
Competent Personrsquos Report African Petroleum Corporation Limited
June 2013 91
Enclosures Resource Summary Sheets
Enclosure 11 Summary Description Sheet Barbet Prospect
SummaryBlock 9
APC Interest () 100
Fluid Oil
Crest (m ss) 3000
Water depth (m) 750
Notes
Area Shape F Areal NG Net Thick Porosity SO Bo STOIIP Rf Rec Res(km2) (frac) () (m) () () (rbstb) (MMstb) (frac) (MMstb)
Charge 90
Reservoir 70 Low 14 085 62 22 13 73 135 166 0300 60
Trap 50 Best 37 090 80 34 17 80 150 500 0375 186
Seal 70 High 98 095 98 53 20 88 165 1479 0450 558
COS 22 Deterministic inputs probabilistic STOIIP and Rec Resource Mean 270
Stratigraphic trap with amplitude support
Geological Risk Matrix
P10
P90metres
BARBET
dtdƐͿ
ϬŬŵϰ
Enclosure 12 Summary Description Sheet Sunbird Prospect Campanian Reservoir
SummaryBlock 8 amp 9
APC Interest () 100
Fluid Oil
Crest (m ss) 3000
Water depth (m) 1300
Notes
Area Shape F Areal NG Net Thick Porosity SO Bo STOIIP Rf Rec Res(km2) (frac) () (m) () () (rbstb) (MMstb) (frac) (MMstb)
Charge 80
Reservoir 80 Low 12 070 43 27 18 73 130 177 0300 63
Trap 60 Best 27 080 69 42 21 80 145 461 0375 172
Seal 70 High 61 090 95 66 24 88 165 1187 0450 448
COS 27 Deterministic inputs probabilistic STOIIP and Rec Resource Mean 229
Stratigraphic trap with amplitude support Split by intra-canyon
high
Geological Risk Matrix
P90
P10
metres
SUNBIRD
dtdƐͿ
ϬŬŵϰSUNBIRD
Enclosure 13 Summary Description Sheet Sunbird prospect Turonian Reservoir
SummaryBlock 8 amp 9
APC Interest () 100
Fluid Oil
Crest (m ss) 3300
Water depth (m) 1300
Notes
Area Shape F Areal NG Net Thick Porosity SO Bo STOIIP Rf Rec Res(km2) (frac) () (m) () () (rbstb) (MMstb) (frac) (MMstb)
Charge 90
Reservoir 60 Low 8 085 65 24 14 73 140 107 0300 39
Trap 50 Best 21 090 80 37 17 80 158 307 0375 115
Seal 70 High 53 095 94 58 20 88 175 863 0450 327
COS 19 Deterministic inputs probabilistic STOIIP and Rec Resource Mean 162
Stratigraphic trap with amplitude support Split by intra-canyon
high
Geological Risk Matrix
SW NE
Campanian Jacana Channel
Turonian BFF
P90
P10
metres
SUNBIRD
ϬŬŵϰ
Enclosure 14 Summary Description Sheet Sunbird Prospect Cenomanian Reservoir
SummaryBlock 8 amp 9
APC Interest () 100
Fluid Oil
Crest (m ss) 3500
Water depth (m) 1300
Notes
Area Shape F Areal NG Net Thick Porosity SO Bo STOIIP Rf Rec Res(km2) (frac) () (m) () () (rbstb) (MMstb) (frac) (MMstb)
Charge 100
Reservoir 50 Low 10 060 71 21 14 73 140 91 0300 33
Trap 60 Best 25 070 85 33 17 80 158 264 0375 99
Seal 60 High 65 080 99 51 20 88 175 779 0450 294
COS 18 Deterministic inputs probabilistic STOIIP and Rec Resource Mean 141
Stratigraphic trap with amplitude support Split by intra-canyon
high
Geological Risk Matrix
P90
P10
metres
SUNBIRD
dtdƐͿ
ϬŬŵϮ
Enclosure 15 Summary Description Sheet Lovebird Prospect Blue Horizon
SummaryBlock 8
APC Interest () 100
Fluid Oil
Crest (m ss) 5000
Water depth (m) 2850
Notes
GRV NG Porosity SO Bo STOIIP Rf Rec Res(MMm2) () () () (rbstb) (MMstb) (frac) (MMstb)
Charge 54
Reservoir 60 Low 354 30 14 60 150 68 030 25
Trap 70 Best 1310 54 19 70 180 293 038 109
Seal 90 High 4849 73 24 80 210 1218 045 456
COS 20 Mean 201
Four way dip closure to south of Block 8 Three potential
reservoirs identified Blue and Green horizon volumetrics derived
assuming ispoachous to Pink
Geological Risks
ŝŐŚĂƐĞWŝŶŬĞƉƚŚDĂƉ
Enclosure 16 Summary Description Sheet Lovebird Prospect Pink Horizon
SummaryBlock 8
APC Interest () 100
Fluid Oil
Crest (m ss) 5400
Water depth (m) 2850
Notes
GRV NG Porosity SO Bo STOIIP Rf Rec Res(MMm2) () () () (rbstb) (MMstb) (frac) (MMstb)
Charge 54
Reservoir 60 Low 354 30 12 60 155 59 030 22
Trap 70 Best 1310 54 17 70 188 262 038 96
Seal 90 High 4849 73 22 80 220 1066 045 400
COS 20 Mean 178
Four way dip closure to south of Block 8 Three potential
reservoirs identified Blue and Green horizon volumetrics derived
assuming ispoachous to Pink
Geological Risks
ŝŐŚĂƐĞWŝŶŬĞƉƚŚDĂƉ
Enclosure 17 Summary Description Sheet Lovebird Prospect Green Horizon
SummaryBlock 8
APC Interest () 100
Fluid Oil
Crest (m ss) 5800
Water depth (m) 2850
Notes
GRV NG Porosity SO Bo STOIIP Rf Rec Res(MMm2) () () () (rbstb) (MMstb) (frac) (MMstb)
Charge 54
Reservoir 60 Low 354 30 10 60 160 48 030 18
Trap 70 Best 1310 54 15 70 195 210 038 78
Seal 90 High 4849 73 20 80 230 896 045 337
COS 20 Mean 150
Four way dip closure to south of Block 8 Three potential
reservoirs identified Blue and Green horizon volumetrics derived
assuming ispoachous to Pink
Geological Risks
ŝŐŚĂƐĞWŝŶŬĞƉƚŚDĂƉ
Enclosure 18 Summary Description Sheet Wildbird Prospect
SummaryORFN $3ampQWHUHVW )OXLG 2LOampUHVWPVV DWHUGHSWKP P
Notes
Play Risk Prospect RiskGRV NG Porosity SO Bo STOIIP Rf Rec Res
6RXUFH 7UDS (MMm2) () () () (rbstb) (MMstb) (frac) (MMstb)6HDO ampKDUJH 5HVHUYRLU3UHV 5HVHUYRLU(II Low
Best High
COS 9 Deterministic inputs probabilistic STOIIP and Rec Resource Mean
)RXUZDGLSFORVHGKLJK
5
0 km 5
6 1(
PVV
Wildbird Horizons
ODFNEHUULJKWOXH3LQN5HG
mss
Enclosure 19 Summary Description Sheet Night Heron Prospect
SummaryORFN $3ampQWHUHVW RIORFN)OXLG 2LOampUHVWPVV DWHUGHSWKP
Notes
Prospect Risk Area Areal NG Net Porosity SO Bo STOIIP Rf Rec ResampKDUJH (km2) (frac) (m) () () (rbstb) (MMstb) (frac) (MMstb)5HVHUYRLU 7UDS Low 6HDO Best
High COS 144 Deterministic inputs probabilistic STOIIP and Rec Resource Mean 759
1LJKW+HURQLVD7XURQLDQEDVLQIORRUIDQVVWHPZKLFKPDLQOOLHVZLWKLQEORFNRIIVKRUHLEHULDWLVLGHQWLILHGDVDVWUDWLJUDSKLFWUDSZLWKDUHDOH[WHQWVGHILQHGEDPSOLWXGHWUXQFDWLRQDQGVWUXFWXUDOSLQFKRXW$QDUHDQHWDSSURDFKZDVDGRSWHGXVLQJWKHIXOOVWDFN360GHSWKLPDJHYROXPHWRSURYLGH61$H[WUDFWLRQDQGFRQVWUDLQDUHDOH[WHQWDQGHVWLPDWHDQDUHDO1WRDFFRXQWIRUODWHUDOYDULDELOLWZLWKLQWKHUHVHUYRLU1LJKW+HURQIDOOVSDUWORIIEORFN(5amp(FRUUHFWIRUWKLVXVLQJWKHUDWLRRIRQEORFNWRRIIEORFNDUHDLQUHSRUWLQJRIQHWXQULVNHGDQGQHWULVNHGUHVXOWV
6HLVPLFLQH36061$([WUDFWLRQ
Arbitrary line across Night Heron PSDM (Depth m)
S NE
2QWKHXSGLSSLQFKRXWLVGHILQHGELVRSDFKDQGDPSOLWXGHWUXQFDWLRQ
2QWKHXSGLSSLQFKRXWLVGHILQHGRQOELVRSDFK
Bee EaterNight Heron
5 Km
RMS Amplitudes from BFF Isopach
Depth (m)
Block Boundary
Enclosure 21 Summary Description Sheet
Summary - M - CretBlock A1
Working Interest () 60
Fluid Oil
Crest (m) 3130 (1070 bml)
Water depth (m) 2220
Notes
Play Risk Prospect Risk Area Stack F Net Porosity SO Bo STOIIP Rf Rec Res(Km2) (frac) (m) () () (rbstb) (MMstb) (frac) (MMstb)
Source 70 Trap 54
Seal 50 Mig 80 Low 8 1 15 10 55 125 82 010 13
Res Pres 80 Res Eff 80 Best 14 1 30 16 65 117 231 023 43
28 35 High 26 1 60 22 75 110 629 035 141
COS 10 Deterministic inputs probabilistic STOIIP and Rec Resource Mean 66
Structural high along edge of buried carbonate platform margin of
probable Lower Cretaceous and Jurassic age Seismic evidence
favourable for reservoir development Lower Bo model used to
reflect relatively shallow nature of prospect The prospect is close
to the shelf margin and so is well placed for charging The strong
rugose seismic events are interpreted as Karstified Limestones
Seismic Line Top Structure Map
WƌŽƐƉĞĐƚD
ĞƉƚŚŵ
Ϳ
Enclosure 22 Summary Description Sheet
Summary - SS - 4Block A1
Working Interest () 60
Fluid Oil
Crest (m) 4230 (2010 bml)
Water depth (m) 2220
Notes
Play Risk Prospect Risk Area Stack F Net Porosity SO Bo STOIIP Rf Rec Res(Km2) (frac) (m) () () (rbstb) (MMstb) (frac) (MMstb)
Source 70 Trap 80
Seal 90 Mig 85 Low 6 1 10 16 68 220 43 030 16
Res Pres 80 Res Eff 50 Best 11 1 19 20 75 167 113 038 42
50 34 High 21 1 35 24 83 135 295 045 112
COS 17 Deterministic inputs probabilistic STOIIP and Rec Resource Mean 56
Four way dip closed anticlinal structure The SS-4 interval has a
gross thickness over the crest area of 360 m Downlap of seismic
events across the crest of the SS-4 structure slightly downgrades
SS-4 seal The interval is believed to be Cenomanian in age and
the seismic character of generally planar events is interpreted as
representing thin bedded turbidites
Seismic Line Top Structure Map
2010 Migration Velocity Data ndash SS-4 Probability Above Spill
Enclosure 23 Summary Description Sheet
Summary - SS - 3Block A1
Working Interest () 60
Fluid Oil
Crest (m) 4590 (2370 bml)
Water depth (m) 2220
Notes
Play Risk Prospect Risk Area Stack F Net Porosity SO Bo STOIIP Rf Rec Res(Km2) (frac) (m) () () (rbstb) (MMstb) (frac) (MMstb)
Source 70 Trap 75
Seal 90 Mig 85 Low 12 1 20 15 68 227 197 025 63
Res Pres 80 Res Eff 50 Best 17 15 35 18 75 173 417 034 143
50 32 High 25 2 60 20 83 140 881 045 316
COS 16 Deterministic inputs probabilistic STOIIP and Rec Resource Mean 173
Four way dip closed anticlinal structure The SS-3 interval has a
gross thickness over the crest area of 550 m Seals to deeper
reservoirs may be eroded by overlying reservoirs From seismic
the prospective reservoir has been interpreted as being an Albian
deep water channel-lobe complex
Seismic Line Top Structure Map
2010 Migration Velocity Data ndashSS-3 Probability Above Spill
Enclosure 24 Summary Description Sheet
Summary - SS - 2Block A1
Working Interest () 60
Fluid Oil
Crest (m) 5140 (2920 bml)
Water depth (m) 2220
Notes
Play Risk Prospect Risk Area Stack F Net Porosity SO Bo STOIIP Rf Rec Res(Km2) (frac) (m) () () (rbstb) (MMstb) (frac) (MMstb)
Source 70 Trap 75
Seal 90 Mig 85 Low 12 1 20 11 68 231 187 025 58
Res Pres 80 Res Eff 50 Best 17 2 35 14 75 183 416 032 133
50 32 High 25 3 60 17 83 151 911 040 303
COS 16 Deterministic inputs probabilistic STOIIP and Rec Resource Mean 163
Four way dip closed anticlinal structure The SS-2 interval has a
gross thickness over the crest area of 830 m The prospective
reservoir has been interpreted as a stacked series of channellobe
sets Seals to deeper reservoirs may be eroded by overlying
reservoirs
Seismic Line Top Structure Map
2010 Migration Velocity Data ndashSS-2 Probability Above Spill
Enclosure 25 Summary Description Sheet
Summary - SS - 1Block A1
Working Interest () 60
Fluid Oil
Crest (m) 5970 (3750 bml)
Water depth (m) 2220
Notes
Play Risk Prospect Risk Area Stack F Net Porosity SO Bo STOIIP Rf Rec Res(Km2) (frac) (m) () () (rbstb) (MMstb) (frac) (MMstb)
Source 70 Trap 65
Seal 90 Mig 80 Low 17 1 20 8 50 249 158 015 34
Res Pres 80 Res Eff 50 Best 30 2 35 11 60 196 399 024 98
50 26 High 54 3 60 13 70 162 997 040 276
COS 13 Deterministic inputs probabilistic STOIIP and Rec Resource Mean 135
Four way dip closed anticlinal structureThe SS-1 interval has a
gross thickness over the crest area of 890 m The prospective
reservoir lies under an unconformity and is believed to be Jurassic
in age its seismic character suggests a channel amp channel-levee
complex Regional porosity trends indicate low porosities are likely
to be encountered if hydrostatic pressures are assumed
Seismic Line Top Structure Map
2010 Migration Velocity Data ndash SS-1 Probability Above Spill
Enclosure 31 Summary Description Sheet
SummaryBlock SL-03
APCL Interest () 90
Fluid Oil
Crest (m ss) 5400
Water depth (m) 3300
Notes
Play Risk Prospect Risk Area Areal NG Net Porosity SO Bo STOIIP Rf Rec Res(km2) (frac) (m) () () (rbstb) (MMstb) (frac) (MMstb)
Source 80 Trap 50
Seal 90 Mig 70 Low 11 070 29 15 73 205 218 030 79
Res Pres 90 Res Eff 80 Best 32 082 56 18 80 162 755 038 278
65 28 High 92 094 83 21 88 134 2473 045 938
COS 18 Mean 434
Altair is a Turonian turbidite channel prospects within the
SL-03 Block offshore Sierra Leone It is identified as a
stratigraphic trap with areal extents defined by amplitude
truncation and structural pinchout Recent discoveries in
nearby blocks confirm a working hydrocarbon system
(Venus-B1 Jupiter-1 and Mercury-1) The Sierra Leone
wells A-1 and A1-2 proved good reservoir and potential
source rocks Two distinct canyon systems feed erosive
channels at the break of slope An area net approach was
adopted using a pseudo-gradient volume SNA extraction to
constrain areal extent and define an areal NG to account
for lateral variability of sand distribution within the
reservoir
Arbitrary Dip Line Grad TWTGrad NRMS Extraction
Enclosure 41 Summary Description Sheet
SummaryBlock CI-513
APCL Interest () 90
Fluid Oil
Crest (m ss) 4200
Water depth (m) 2500
Notes
Play Risk Prospect Risk Area Areal NG Net Porosity SO Bo STOIIP Rf Rec Res(km2) (frac) (m) () () (rbstb) (MMstb) (frac) (MMstb)
Source 60 Trap 50
Seal 90 Mig 70 Low 11 070 20 17 73 181 179 030 65
Res Pres 90 Res Eff 80 Best 40 085 38 20 80 149 815 038 302
49 28 High 149 099 55 23 88 126 3474 045 1318
COS 14 Mean 569
Ayame is an Upper Cretaceous fan which mainly lies
ZLWKLQEORFNampRIIVKRUHampRWHparaYRLUHWLVLGHQWLILHGas a stratigraphic trap with areal extents defined by
amplitude truncation and structural pinchout The prospect
has very good amplitude support An area net approach
was adopted using pseudo-gradient volume SNA NRMS
extractions to constrain areal extent and define an areal
NG to account for lateral variability of sand distribution
within the reservoir for low and high case area polygons
These seismically defined polygons were then filled to
column heights of 200m and 800m respectively and used
to constrain the P90 and P10 area inputs of our
probabilistic simulation
Seismic Line
TWT Grad SNA Extraction
Ayame
Ayame West
dtdƐͿ
Ayame
Enclosure 42 Summary Description Sheet
SummaryBlock CI-513 amp Open
APCL Interest () 90 in CI-513
Fluid Oil
Crest (m ss) 4900
Water depth (m) 2700
Notes
Play Risk Prospect Risk Area Areal NG Net Porosity SO Bo STOIIP Rf Rec Res(km2) (frac) (m) () () (rbstb) (MMstb) (frac) (MMstb)
Source 60 Trap 50
Seal 90 Mig 70 Low 10 061 25 14 73 194 161 030 58
Res Pres 90 Res Eff 80 Best 30 080 47 18 80 159 585 038 216
49 28 High 93 099 69 21 88 134 2085 045 788
COS 14 Mean 352
A second prospect within the same reservoir interval was
identified and volumetrically assessed Ayame West is
separated from Ayame by a structural high isopach
thinning and amplitude dimming The prospect was
assessed in the same manner as Ayame with a but with
Low Case column height of 600m filling down to the point
at which amplitudes between the two fans brighten
allowing possible communication The upper end of the
Ayame West fan lies down-dip of Ayame and less than
1km away from the thinning low amplitude saddle between
the two prospects
Seismic Line
TWT Grad SNA Extraction
Ayame
West
Ayame West
dtdƐͿ
Ayame
Enclosure 43 Summary Description Sheet
SummaryBlock CI-513 CI-509
APCL Interest () 90 of CI-513
Fluid Oil
Crest (m ss) 4400
Water depth (m) 2500
Notes
Play Risk Prospect Risk Area Areal NG Net Porosity SO Bo STOIIP Rf Rec Res(km2) (frac) (m) () () (rbstb) (MMstb) (frac) (MMstb)
Source 60 Trap 40
Seal 90 Mig 70 Low 6 070 15 16 73 185 71 030 26
Res Pres 90 Res Eff 70 Best 23 084 28 19 80 152 320 038 118
49 20 High 92 098 42 22 88 129 1408 045 521
COS 10 Mean 237
This sheet refers to volumes associated with Blocks 513 and CI-509 Sassandra is an Upper Cretaceous fan
which straddles blocks CI-513 and CI-509 It is identified
as a stratigraphic trap with areal extents defined by
amplitude truncation and structural pinchout A single
target reservoir is identified within the Turonian The
prospect has good amplitude support An area times net
approach was adopted using a pseudo-gradient volume
NRMS extraction to constrain prospect size Angle stacks
were not available outside of Block CI-513 so an RMS
extraction on the full stack volume was used to determine
NW extent In our low case we restrict the area of the
accumulation to the brightest area of anomalous
amplitudes Our high case extends the prospect down-dip
Arbitrary Dip Line Grad TWT
Full Stack - RMS Extraction
Sassandra
dtdƐͿ
Enclosure 44 Summary Description Sheet
SummaryBlock CI-513
APCL Interest () 90
Fluid Oil
Crest (m ss) 3900
Water depth (m) 2500
Notes
Play Risk Prospect Risk Area Areal NG Net Porosity SO Bo STOIIP Rf Rec Res(km2) (frac) (m) () () (rbstb) (MMstb) (frac) (MMstb)
Source 60 Trap 40
Seal 90 Mig 70 Low 4 071 20 19 73 185 67 030 25
Res Pres 90 Res Eff 70 Best 13 085 38 22 80 152 281 038 104
49 20 High 46 099 55 25 88 129 1142 045 431
COS 10 Mean 190
Cavalla is an Upper Cretaceous Fan which lies between
the Ayame and Sassandra prospects of Block CI-513
RIIVKRUHampRWHparaYRLUHWLVLGHQWLILHGDVDVWUDWLJUDSKLFtrap with areal extents defined by amplitude truncation and
structural pinchout A single target reservoir is identified
within the TuronianCenomanian interval which lies
stratigraphically beneath the Ayame Prospect For the
amplitude analysis the top reservoir has been shifted up
30ms to bracket strong negative amplitudes on the
Gradient volume and the base reservoir has been shifted
up 50ms to remove Albian related amplitudes An area net
approach was adopted using pseudo-gradient volume SNA
NRMS extractions to constrain extent of the low and high
case area polygons These seismically defined polygons
were then filled to column heights of 200m and 800m
respectively
Arbitrary Dip Line Grad TWT Grad NRMS Extraction
Cavalla
dtdƐͿ
Enclosure 45 Summary Description Sheet
SummaryBlock CI-509
APCL Interest () 90
Fluid Oil
Crest (m ss) 3700
Water depth (m) 2500
Notes
Play Risk Prospect Risk Area Areal NG Net Porosity SO Bo STOIIP Rf Rec Res(km2) (frac) (m) () () (rbstb) (MMstb) (frac) (MMstb)
Source 60 Trap 60
Seal 90 Mig 70 Low 5 076 39 21 73 150 252 015 55
Res Pres 90 Res Eff 80 Best 18 088 75 24 80 134 997 028 258
49 34 High 61 100 111 27 88 121 3682 040 1039
COS 16 Mean 460
Leraba is an Upper Cretaceous fan It is identified as a
stratigraphic trap with extents defined by amplitude
truncation and structural pinchout The final processing
products and AvO volumes are yet to be delivered for CI-
KRZHYHUWKHmicroHRWUDFHUDZPLJUDWLRQVWDFNparaYROXPHLVof high quality and is deemed suitable for deriving a
volumetric range for Leraba An area net approach was
adopted using an RMS extraction to constrain extent and
define an areal NG to account for lateral variability of sand
distribution In our low case we restrict the area to the
brightest area of anomalous amplitudes Our high case
extends the prospect down-dip and SW to include a
secondary channel system
Arbitrary Dip Line TWT Full Stack RMS Extraction
Leraba
dtdƐͿ
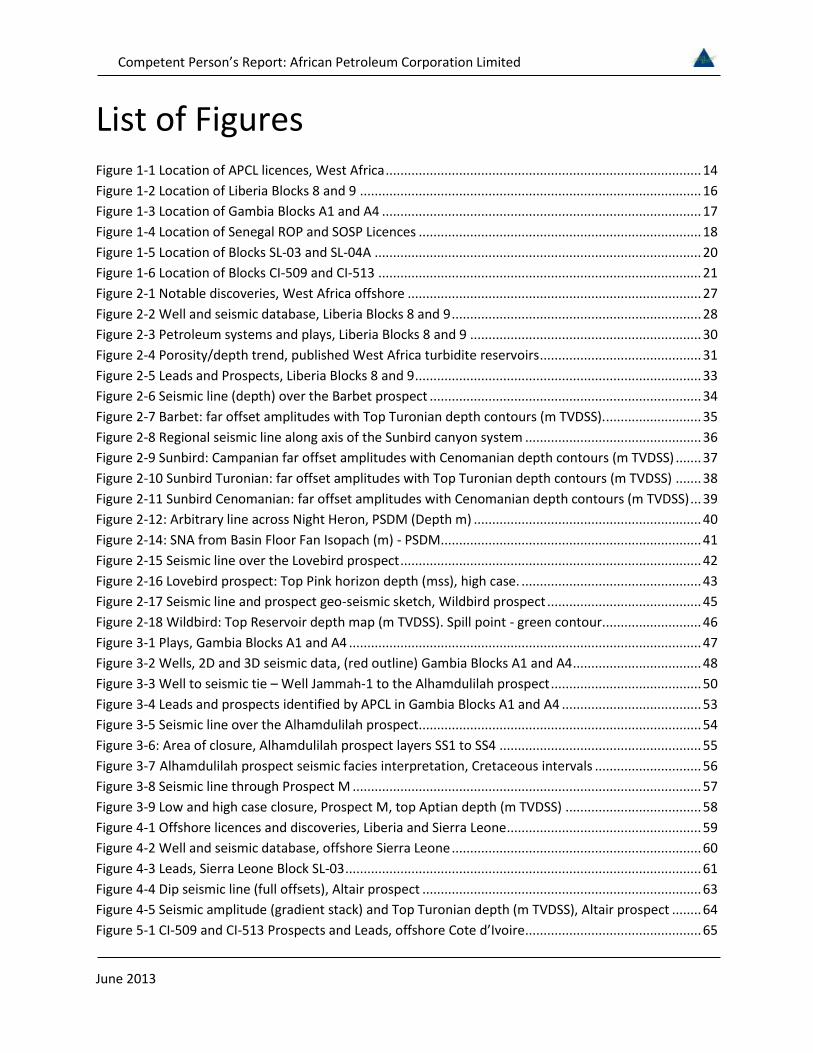
Competent Personrsquos Report African Petroleum Corporation Limited
June 2013
List of Figures Figure 1-1 Location of APCL licences West Africa 14 Figure 1-2 Location of Liberia Blocks 8 and 9 16 Figure 1-3 Location of Gambia Blocks A1 and A4 17 Figure 1-4 Location of Senegal ROP and SOSP Licences 18 Figure 1-5 Location of Blocks SL-03 and SL-04A 20 Figure 1-6 Location of Blocks CI-509 and CI-513 21 Figure 2-1 Notable discoveries West Africa offshore 27 Figure 2-2 Well and seismic database Liberia Blocks 8 and 9 28 Figure 2-3 Petroleum systems and plays Liberia Blocks 8 and 9 30 Figure 2-4 Porositydepth trend published West Africa turbidite reservoirs 31 Figure 2-5 Leads and Prospects Liberia Blocks 8 and 9 33 Figure 2-6 Seismic line (depth) over the Barbet prospect 34 Figure 2-7 Barbet far offset amplitudes with Top Turonian depth contours (m TVDSS) 35 Figure 2-8 Regional seismic line along axis of the Sunbird canyon system 36 Figure 2-9 Sunbird Campanian far offset amplitudes with Cenomanian depth contours (m TVDSS) 37 Figure 2-10 Sunbird Turonian far offset amplitudes with Top Turonian depth contours (m TVDSS) 38 Figure 2-11 Sunbird Cenomanian far offset amplitudes with Cenomanian depth contours (m TVDSS) 39 Figure 2-12 Arbitrary line across Night Heron PSDM (Depth m) 40 Figure 2-14 SNA from Basin Floor Fan Isopach (m) - PSDM 41 Figure 2-15 Seismic line over the Lovebird prospect 42 Figure 2-16 Lovebird prospect Top Pink horizon depth (mss) high case 43 Figure 2-17 Seismic line and prospect geo-seismic sketch Wildbird prospect 45 Figure 2-18 Wildbird Top Reservoir depth map (m TVDSS) Spill point - green contour 46 Figure 3-1 Plays Gambia Blocks A1 and A4 47 Figure 3-2 Wells 2D and 3D seismic data (red outline) Gambia Blocks A1 and A4 48 Figure 3-3 Well to seismic tie ndash Well Jammah-1 to the Alhamdulilah prospect 50 Figure 3-4 Leads and prospects identified by APCL in Gambia Blocks A1 and A4 53 Figure 3-5 Seismic line over the Alhamdulilah prospect 54 Figure 3-6 Area of closure Alhamdulilah prospect layers SS1 to SS4 55 Figure 3-7Alhamdulilah prospect seismic facies interpretation Cretaceous intervals 56 Figure 3-8 Seismic line through Prospect M 57 Figure 3-9 Low and high case closure Prospect M top Aptian depth (m TVDSS) 58 Figure 4-1 Offshore licences and discoveries Liberia and Sierra Leone 59 Figure 4-2 Well and seismic database offshore Sierra Leone 60 Figure 4-3 Leads Sierra Leone Block SL-03 61 Figure 4-4 Dip seismic line (full offsets) Altair prospect 63 Figure 4-5 Seismic amplitude (gradient stack) and Top Turonian depth (m TVDSS) Altair prospect 64 Figure 5-1 CI-509 and CI-513 Prospects and Leads offshore Cote drsquoIvoire 65
Competent Personrsquos Report African Petroleum Corporation Limited
June 2013
Figure 5-2 Petroleum systems and plays offshore Cote drsquoIvoire 66 Figure 5-3 Well and seismic database offshore Sierra Leone 67 Figure 5-4 Strike Line Ayame and Ayame West prospects 69 Figure 5-5 Ayame Seismic amplitude (gradient stack) and Top Turonian depth (m TVDSS) 70 Figure 5-6 Dip seismic line Sassandra prospect 71 Figure 5-7 Sassandra prospect Seismic amplitude and Top Turonian depth (m TVDSS) 72 Figure 5-8 Dip seismic line Cavalla prospect 74 Figure 5-9 Seismic amplitude (gradient stack) and Top fan depth (m TVDSS) Cavalla prospect 75 Figure 5-10 Dip seismic line Leraba prospect 76 Figure 5-11 Seismic amplitudes Leraba prospect 77 Figure 6-1 Petroleum systems and plays offshore Senegal 78 Figure 6-2 leads offshore Senegal Blocks ROP and SOSP 79
Competent Personrsquos Report African Petroleum Corporation Limited
June 2013 14
1 Introduction
At the time of writing African Petroleum Corporation Limited (APCL) holds interests in and operates exploration licences offshore West Africa within the territorial waters of Senegal the Gambia Sierra Leone Liberia and Cote drsquoIvoire (Figure 1-1) The status of these licences is summarised in Table 11 below ERC Equipoise Ltd (ERCE) has reviewed the prospectivity of these licences using data as of 31st May 2013
Figure 1-1 Location of APCL licences West Africa
Currently prospective resources are identified by APCL within the Liberia Gambia Sierra Leone and Cote drsquoIvoire licences We have made independent estimates of prospective resources and geological chance of success for certain prospects within these countries which are identified by APCL as near-term drilling opportunities The evaluation of the offshore Senegal licences is on-going and no prospects have been identified as of the date of this report We summarise qualitatively the prospectivity of the licences held by APCL in this country
Competent Personrsquos Report African Petroleum Corporation Limited
June 2013 15
Country Block Licence
Operator APCL () Status
Licence
Area (km2)
Outstanding Commitment in this Phase
Start of Current Phase
End of Current Phase
Liberia 8 APCL 100 Expl June 2012
June 2014
2717 Two
Exploration wells
Liberia 9 APCL 100 Expl June 2012
June 2014
2634 None
Gambia A1 APCL 60 Expl Dec
2007 Dec
2013 1296
One Exploration
well 1
Gambia A4 APCL 60 Expl Dec
2007 Dec
2013 1376 (see A1)
Senegal Rufisque Offshore Profond
APCL 90 Expl Oct
2011 Oct
2015 10357
One exploration
well
Senegal
Senegal Offshore
Sud Profond
APCL 90 Expl Oct
2011 Oct
2014 7920 None
Sierra Leone
SL-03 APCL 100 Expl Feb
2011 Feb
2014 3860 None
Sierra Leone
SL-04A APCL 100 Expl Sept 2012
Sept 2015
1995 One
exploration well 2
Cote drsquoIvoire
CI-509 APCL 90 Expl March 2012
March 2015
1091 One
exploration well
Cote drsquoIvoire
CI-513 APCL 90 Expl Dec
2011 Dec
2014 1446
One exploration
well
1) Transferrable to Block A4 if necessary 2) Contingent on results of 3D and that technology is available to drill in such water depths
Table 11 Licence Summary Table
Competent Personrsquos Report African Petroleum Corporation Limited
June 2013 16
11Liberia PSC Overview
APCL holds a 100 contractor interest in a Production Sharing Contract (ldquoPSCrdquo) covering Blocks 8 amp 9 offshore Liberia (Figure 1-2) Both blocks are in their second exploration period which began on 12th June 2012 and lasts for two years Commitments during the second phase in Block 8 are two exploration wells (to a minimum depth of 2000 meters) as a well commitment from the first exploration phase has been carried into the second phase All commitments have been met for the second phase in Block 9 with the drilling of Well Bee Eater-1 The minimum spend for each block in the second exploration period is US$ 10 MM At the end of this second phase a further 25 of each licence must be relinquished
Figure 1-2 Location of Liberia Blocks 8 and 9
For each block there is one further optional exploration period of two years that can be entered into with an additional well (to a minimum of 2000 metres) being required in each block in each period At the end of the third period all areas not retained for appraisal and development are to be relinquished There are also provisions for an appraisal period and an exploitation period of 25 years (with an additional term of 10 years if necessary) for each development area
Competent Personrsquos Report African Petroleum Corporation Limited
June 2013 17
Following a 25 relinquishment at the end of the first exploration phase Block 8 comprises an area of 2717 km2 and Block 9 comprises 2634 km2 Water depths range from less than 100 m to over 3000 m Most of the block areas lie in water depths greater than 500 m
12Gambia PSC Review
APCL holds a 60 contractor interest in Production Sharing Contracts covering Blocks A1 and A4 offshore Gambia (Figure 1-3) with Buried Hill Gambia BV holding the remaining 40 The licences were signed on 8th September 2006 with an effective date of 31st December 2007 and following two extensions they are still currently in the first exploration period which runs through to 31 December 2013
The work commitment during the first period comprises 1000 km2 of 3D seismic data in Block A1 and 750 km2 of 3D seismic data in Block A4 and one well which may be drilled in either block The seismic commitment has already been met
There are two further optional (but automatic) exploration periods of three years each that can be entered into with a well being required in each period in each licence Furthermore in Block A1 relinquishment of 10 of the licence area is required at the end of the first exploration period and 20 at the end of the second period In Block A4 relinquishment of 10 of the licence area is required at the end of the first exploration period In both blocks at the end of the third period all areas not retained for appraisal and development are to be relinquished There are also provisions for an exploitation period with the total term of the licences being 30 years (including the exploration periods) for each development area
The area of the licence is 1296 km2 for Block A1 and 1376 km2 for Block A4 Water depths vary from 500 m to over 3000 m
Figure 1-3 Location of Gambia Blocks A1 and A4
Competent Personrsquos Report African Petroleum Corporation Limited
June 2013 18
13Senegal PSC Review
APCL holds a 90 contractor interest in Exploration and Production Sharing Contracts (EPSC) covering Blocks Rufisque Offshore Profond (ROP) and Senegal Offshore Sud Profonde (SOSP) offshore Senegal (Figure 1-4) via its wholly owned subsidiary African Petroleum Senegal Limited Petrosen the state oil company hold a 10 carried interest
The EPSC governing block SOSP has an effective date of 25th October 2011 The first 85 years of the EPSC are termed the exploration phase which is subdivided into an initial period of three years with two subsequent extension periods of three and two and a half years each Work commitment in the initial exploration period is to acquire and reprocess the existing seismic data within the licence area and also to acquire a further 2500 km2 of 3D seismic data all with a minimum investment of US$ 10 MM The two extension periods have a commitment of one exploration well to a minimum depth of 3500 mss in each period or a minimum investment of US$ 20 MM Entry to the first extension period requires a 30 relinquishment of the licence area and a further 20 of the initial licence area must be relinquished on entry to the third phase The area of the licence is currently 7920 km2 Water depth is between 1000 and 4000 m over the block
Figure 1-4 Location of Senegal ROP and SOSP Licences
Competent Personrsquos Report African Petroleum Corporation Limited
June 2013 19
The EPSC governing Block ROP is of similar structure to that governing Block SOSP It has an effective date of 25th October 2011 The first eight years of the EPSC are termed the exploration phase which is subdivided into an initial period of four years with two subsequent extension periods of two years each Work commitment in the initial exploration period is to acquire the existing seismic data within the licence area for a minimum of US$ 2 MM and drill one exploration well to a minimum depth of 3500 m TVDSS or a minimum investment of US$ 20 MM The two extension periods have a further commitment of one exploration well to a minimum depth of 3500 m TVDSS in each period or a minimum investment of US$ 20 MM Entry to the first extension period requires a 30 relinquishment of the licence area and a further 20 of the initial licence area must be relinquished on entry to the third period The area of the licence is currently 10357 km2 Water depth is between 1500 and 3000 m over the block
APCL has met the seismic commitment of the first exploration period
Petrosen has a back-in right if an exploitation period is authorised for up to 20 of the licence subject to contribution of its share of forward costs (excluding training) The duration of an exploitation period is 25 years from authorisation with option for two ten year extensions at the discretion of the state
14Sierra Leone PSC Review
APCL holds a 100 contractor interest in a PSC covering Block SL-03 offshore Sierra Leone (Figure 1-5) through its wholly owned subsidiary European Hydrocarbons Ltd The licence was awarded on 23rd April 2010 and ratified on 22nd February 2011 APCL also holds a 100 contractor interest in a PSC covering Block SL-04A through its wholly owned subsidiary African Petroleum Sierra Leone Ltd The PSC governing Block SL-04A was ratified on 21st September 2012
The SL-03 licence has a duration of thirty years the first seven of which are termed the exploration period which is further subdivided into an initial period of three years followed by two extension periods of two years each The licence is currently in the initial exploration period
Work commitments during the initial period for Block SL-03 are to purchase and interpret the existing 2D seismic data over the licence and acquire a minimum of 500 km2 of 3D seismic data APCL has purchased the 2D seismic data and has acquired 2535 km2 of multi-client 3D seismic data over Block SL-03 fulfilling the seismic commitment for the initial phase The first and second extension periods require the drilling of one exploration well to a minimum depth (below mud line) of 1300 m or a minimum equivalent investment of US$ 30 MM Entry to the first extension period requires a 50 relinquishment of the licence area and a further 25 of the initial licence area must be relinquished on entry to the second extension period The area of the licence is 3860 km2 and water depth varies from 100m to over 4000m with the south-western half of the block being at water depths greater than 3000m
Competent Personrsquos Report African Petroleum Corporation Limited
June 2013 20
Figure 1-5 Location of Blocks SL-03 and SL-04A
The PSC covering Block SL-04A was ratified on 21st September 2012 The licence term is for thirty years the first seven years of which are defined as the exploration period which is further subdivided into an initial period of three years and two subsequent periods of two years Each well drilled in the initial exploration period extends this period by three months Work commitments during the initial phase are to acquire at least 1500 km2 of 3D seismic data and drill one exploration well (to a minimum depth of 2500m) contingent on the results of the 3D and the availability of drilling technology for such deep water The minimum equivalent investment is US$ 10 MM In 2011 TGS acquired 1085 km2 of multi-client 3D seismic data over Block SL-04A Upon licencing these data APCL will have fulfilled the seismic commitment for the initial phase
The subsequent two exploration periods require the drilling of one exploration well in each period (to a minimum depth of 2500 m) or a minimum investment of US$ 50 MM Entry to the second period requires a 50 relinquishment of the licence area and a further 25 of the initial licence area must be relinquished on entry to the third phase The area of the licence is currently 1995 km2 Water depth is between 3000 and 4000 m over the block
Competent Personrsquos Report African Petroleum Corporation Limited
June 2013 21
The state retains the right to a 10 carried interest during any development phase in both licences with the option to acquire a further 5 by covering an equivalent proportion of any development costs
15Cote13 drsquoIvoire13 PSC13 Review
APCL holds a 90 per cent contractor interest in two PSCs governing Block CI-509 and Block CI-513 offshore Cote drsquoIvoire (Figure 1-6) via its wholly owned subsidiary African Petroleum Cote drsquoIvoire Limited The state oil company Petroci has a 10 carried interest
Figure 1-6 Location of Blocks CI-509 and CI-513
The PSC for Block CI-509 was awarded on 16th March 2012 The first eight years of the PSC are termed the exploration period which is further divided into three terms of three three and two years respectively The licence is currently in its first exploration term Work commitments during the first exploration term are to purchase the existing 2D seismic data acquire 1091 km2 (ie a block wide) 3D seismic survey and drill one exploration well at least 100 m into the Albian (Lower Cretaceous) section The minimum investment is US$ 60 MM The second and third terms have a further commitment to drill one exploration well to at least 100 m into the Albian (Lower Cretaceous) section with a minimum investment of US$ 50 MM Entry to the second term requires a 25 relinquishment of the licence area and a further 25 of the initial licence area must be relinquished on entry to the third term The area of the licence is currently 1091 km2 Water depth is between 1900 and 3250 m over the block
Competent Personrsquos Report African Petroleum Corporation Limited
June 2013 22
The PSC covering Block CI-513 has an effective date of 19th December 2011 It has a similar structure to that governing Block CI-509 The first seven years are termed the exploration period subdivided into three terms of three two and two years The licence is currently in its first exploration term Work commitments during the first exploration term are to purchase the existing 2D seismic data acquire 1446 km2 (ie a block wide) 3D seismic survey and drill one exploration well at least 100 m into the Albian (Lower Cretaceous) section The minimum investment is US$ 60 MM The second and third terms have a further commitment to drill one exploration well to at least 100 m into the Albian (Lower Cretaceous) section with a minimum investment of US$ 50 MM Entry to the second term requires a 25 relinquishment of the licence area and a further 25 of the initial licence area must be relinquished on entry to the third term The area under licence is currently 1446 km2 Water depth is between 900 and 3100 m over the block
The exploitation period of both licences is for 25 years subject to successful award in the event of a commercial discovery On development Petroci has the right to acquire an interest of up to 20 in each licence subject to payment of its portion of future costs
In October 2012 APCL completed acquisition of 4200 km2 of 3D seismic data covering blocks CI-508 CI-509 and CI-513 fulfilling the seismic work commitments of the first exploration phase of both PSCs APCL is planning a two well drilling programme for the licences during 2014
16Evaluation Methodology Prospective Resources
We have used probabilistic methods to evaluate selected prospects within Liberia Blocks 8 and 9 Gambia Blocks A1 and A4 Sierra Leone Block SL-03 and Cote drsquoIvoire Blocks CI-513 and CI-509 We classify the results of our simulation as Low Best and High estimates of prospective resources following the Petroleum Resources Management System or PRMS (Appendix 1) We have assigned geological chance of success to each of the prospects using the methodology described below Estimates are made for oil only although we recognise that due to the significant uncertainties in the available geological information that there is a possibility of gas charge in all licences We present a summary of input estimates output STOIIP and gross resources and geological chance of success as a resource summary sheet for each prospective interval investigated These can be found in the enclosures 11 to 45 in this document
Inputs to our probabilistic simulation are evaluated in a consistent manner For the structurally trapped prospective intervals in Liberia (the Lovebird and Wildbird prospects) and the Alhamdulilah prospect in Gambia we have made a low and high deterministic estimate of closing contour for each trap to reflect the uncertainty in both mapping and depth conversion For Liberia we use the gross-rock volume (GRV) derived in this manner to constrain the P90 and P10 of our GRV distribution in our probabilistic simulation For Gambia we have used the areal extents of the low and high cases as inputs to an area times net calculation
Competent Personrsquos Report African Petroleum Corporation Limited
June 2013 23
For the stratigraphically trapped prospects in Liberia (Barbet Night Heron and Sunbird) Cote drsquoIvoire (Sassandra Ayame Ayame West Cavalla and Leraba) and Sierra Leone (Altair) we have made low and high estimates of area of closure using both structural and amplitude support where possible We have then made low and high estimates of gross reservoir thickness derived from regional observations calibrated against seismic data where possible As such depositional systems also have laterally variable sand distributions often supported by seismic data we employ the concept of an areal net to gross ratio varying the percentage of sand areally within the overall stratigraphic trap based on the uncertainty in seismic amplitude strength Where appropriate a geological shape factor is used depending on trap shape and structural relief relative to reservoir thickness
Estimates of reservoir porosity and net to gross ratio are made with reference to regional data offset wells including recent drilling by APCL in Liberia and account for compaction and a degree of overpressure (Figure 2-4) We make low mid and high deterministic estimates and use these to constrain the P90 P50 and P10 inputs to a probabilistic simulation Inputs for hydrocarbon saturation are constrained in a similar manner with reference to regional porosity and permeability trends calibrated to APCLrsquos recent drilling results in Liberia
We have estimated oil formation volume factors for a range of gas oil ratios (GOR) (from an appropriate minimum to fully saturated) for each of the prospective intervals assuming 4oC at the mudline (seabed) and geothermal gradients between 25 and 35oC per 100 m consistent with regional observation and the available well data We assume that the minimum GOR will increase with depth below the mudline Our estimates are calibrated against the oil samples in Well Narina-1 when estimating resources for the Liberian prospects
Some degree of overpressure is accounted for as it has been in our estimates of porosity but by reference to offset discoveries we assume that it is unlikely to exceed 500 psi over the depth range investigated
Recovery factors for the clastic reservoirs are estimated with reference to published information from discoveries in similar reservoir types examples of which are tabulated below (Table 12) Based on this table we estimate low best and high recovery factors of 30 375 and 45 respectively Again these are used to constrain the P90 P50 and P10 of our input distribution during probabilistic simulation
Some prospects are deep relative to mud line and we expect reservoir quality to be reduced despite overpressure We reduce our recovery factor estimates accordingly where this is the case Some prospects are relatively shallow to mud line Where this is the case we model a more viscous oil (prospects materially less than 1500m below sea bed) and have reduced our low best and high recovery factor range to 15 275 and 40 respectively In all cases we assume that a development is able to effectively dispose of any associated gas
Recovery factors for the carbonate reservoirs of the Wildbird prospect in Liberia and Prospect M in the Gambia are estimated by reference to more regional analogues and are discussed in the relevant sections
Competent Personrsquos Report African Petroleum Corporation Limited
June 2013 24
Due to the early stage of exploration within APCLrsquos licences we have adopted a six component risk matrix in all areas barring Liberia to estimate geological chance of success (COS) separated into play and prospect specific risks (Table 13) We have adopted this form of presentation of COS to reflect the fact that deep water exploration in much of the West African Atlantic Margin is at a very early stage and also that a number of the identified prospects have risk dependence and thus can be grouped as a play
Table 12 Estimated oil recovery factors from producing Atlantic Margin fields
PLAY RISK PROSPECT RISK
SOURCE RESERVOIR SEAL TRAP CHARGE RESERVOIR (Presence and Maturity) (Presence) (Presence) (Definition and Efficacy) (Migration) (Efficacy) Incorporates trap definition and seal risk (including biodegradation risk where necessary)
Table 13 Play and prospect risk system
The play risk segment focuses solely on the elements required in a given play to make a hypothetical prospect successful source reflecting the presence and thermal maturity of available source rocks with sufficient generation and expulsion to charge prospects reservoir reflecting the presence regionally of geological intervals that could potentially contain reservoir rock and seal ndash the regional presence of a sealing formation with sufficient thickness and extent to trap hydrocarbons
Prospect risk is divided into three elements Commonly we present seal and trap risk combined as an overall illustration of the integrity of the container here labelled trap risk Charge risk reflects the risk to migration of hydrocarbons from the source rock into the prospect and reservoir risk reflects solely the efficacy (ie porosity and permeability) of any identified reservoir interval
Note that a successful well on a given prospect may reduce or remove the play risk should the well prove reservoir charge and seal in a given play This will have the effect of de-risking further prospects associated with that play
Country Field Start Date Np Max Water Depth Prod Ult
RecoveryRec
FactorRecovery
Prod STOIIP
(MMstb) (m) (MMstb) (MMstb) (MMstb)Eq Guinea Ceiba Nov-00 112 800 18 187 40 10 468Eq Guinea Zafiro Aug-96 652 850 62 1583 40 26 4008Angola Girassol Dec-01 332 1360 32 958 45 30 2129Angola Kuito Dec-99 133 410 36 650 46 18 1413Brasil Espadarte Aug-00 67 877 10 261 31 26 842Brasil Marlim Mar-91 1720 853 101 2878 33 28 8721Total 259 6517 17580Average - Arithmetic 39 23Average - Weighted by STOIIP Ult Rec 37 25
Low Best High30 375 45
Fields on Atlantic Margin with significant production
Hence RF Range
Competent Personrsquos Report African Petroleum Corporation Limited
June 2013 25
Recent drilling within Liberia Blocks 8 and 9 has de-risked the play As a result we adopt prospect specific risking alone as source reservoir trap and seal with the same definitions as described above (Table 13)
Competent Personrsquos Report African Petroleum Corporation Limited
June 2013 26
2 Liberia Prospectivity and Plays
21Introduction
All of the available deep-water acreage offshore Liberia-Sierra Leone basin is under licence (Figure 1-2) Regionally hydrocarbons have been discovered within sandstones at a number of stratigraphic levels from the pre-rift to early syn-rift Albian in Cote drsquoIvoire (Espoir Foxtrot fields and a number of other discoveries) to turbiditic sandstones that have Late Cretaceous (CenomanianTuronian MaastrichtianConiacian) to early Tertiary (Palaeocene to Eocene) ages Recent drilling offshore Ghana has yielded a number of discoveries within these Upper Cretaceous sandstones such as the Jubilee oil field and the Enyenra Tweneboa and Odum oil and gascondensate discoveries In the Liberia-Sierra Leone basin recent drilling has yielded six hydrocarbon discoveries (Bee Eater Narina Monterrado Mercury Venus and Jupiter) but as yet none has been declared commercial (Figure 2-1) Although reservoir quality in the Albian sandstones is variable reservoir quality in the Upper Cretaceous and Tertiary sandstones is often good Successful trap types encountered regionally are both structural and stratigraphic
Of significance to the evaluation of the petroleum systems of Blocks 8 and 9 APCL have drilled three wells within the deeper water parts of the blocks Wells Apalis-1 Narina-1 and Bee Eater-1 Well Apalis-1 found source rock intervals of Albian to Cenomanian age but failed to find the prognosed reservoir Well Narina-1 found light oil within deep-marine sandstones of Cretaceous age The sandstones were of variable reservoir quality as the well appears to have been drilled on the edge of a fan system which can be interpreted from seismic data The extent of the Turonian hydrocarbon bearing interval around Well Narina-1 is currently under investigation by APCL who are working with CGGV to reprocess the 3D multi-client seismic with the hope of identifying areas of favourable reservoir within closure
Well Bee Eater-1 completed in February 2013 also discovered hydrocarbons within similar sandstones of Cretaceous age However the oil bearing Turonian reservoir at Bee Eater is interpreted as being of very low permeability and hence non-commercial APCL interprets that Well Bee Eater-1 was drilled in a canyon system that may have been largely bypassed by sediment input
Both wells demonstrate the viability of Cretaceous petroleum systems within the licence area
Competent Personrsquos Report African Petroleum Corporation Limited
June 2013 27
Figure 2-1 Notable discoveries West Africa offshore
22Well and Seismic Database
Exploration offshore Liberia is at an early stage To date five wells have been drilled in the deeper water areas in 2011 and 2012 with historical exploration drilling (up to 1985) restricted to the more shelfal areas (Figure 2-2) Data from two of these shallow water wells Wells S3-1 and Cestos-1 were made available to us for this evaluation Well S3-1 encountered oil shows in sandstones of Late Cretaceous age
GhanaJubilee Field on
production development of TEN area discoveries
new Hess deepwater discoveries
Cote drsquoIvoireShallow water production
recent discoveries in deepwater Turonian
reservoirs
LiberiaOil discoveries in
Cretaceous deepwater reservoirs at Narina
Monserrado
Sierra LeoneVenus Mercury and Jupiter
oil and condensate discoveries in deepwater
reservoirs
Guinea-COil shows in
offshore wells
Guinea-BSinapa oil discovery
planned appraisal
AGCDome Flore area heavy oil
discoveries under development review
SenegalOnshore gas and condensate production Recent onshore
Turonian discovery
MauritaniaChinguetti Field
production other oil and gas discoveries under development review
Competent Personrsquos Report African Petroleum Corporation Limited
June 2013 28
Figure 2-2 Well and seismic database Liberia Blocks 8 and 9
APCL has drilled three exploration wells offshore Liberia in the deep water part of Block 9 Wells Narina-1 Bee Eater 1 and Apalis-1 (Figure 1-2 Figure 2-2) Well Apalis-1 was drilled in 2011 targeting a four-way dip-closed structure with possible AvO support The well found traces of hydrocarbons plus source rock intervals but the prognosed reservoir sands were absent at target depth and the well was plugged and abandoned
Well Narina-1 was drilled by APCL in 2012 and found 16 to 21 m of net pay (light oil) within sandstones of Turonian (Cretaceous) age Hydrocarbons were also discovered in the underlying Albian Oil samples were collected but no drill-stem testing was undertaken Analysis of the oil samples indicates an API
3D Seismic Area
Competent Personrsquos Report African Petroleum Corporation Limited
June 2013 29
gravity for the Turonian oil of about 38 degrees and about 45 degrees for the Albian hydrocarbons Mobilities from formation pressure measurements and permeability from side-wall core measurements show the reservoir to be of relatively low permeability at this location
Well Bee Eater-1 was drilled by APCL in January and February 2013 The well found oil-bearing sandstones of Cretaceous age but of very low permeability and hence the well is considered non-commercial Post-drill interpretation of the seismic data has helped APCL revise the depositional model for this Turonian fan system The Bee Eater-1 well is interpreted to have encountered a bypass zone in both the Turonian and Cenomanian with immature sandstones that are poorly sorted and tight Post-well mapping of key seismic events tied to Well Bee Eater-1 reveals the possibility of finding better quality sandstones in lsquobasin-floor fanrsquo units down-dip Potentially sealing shale units and source rock units were also found in the Bee-Eater-1 well
Well Apalis-1 and in particular Wells Bee Eater-1 and Narina-1 help de-risk seal and hydrocarbon charge for the Cretaceous play on-block
The primary seismic dataset for our evaluation was the recently acquired 5170 km2 of 3D seismic data over the deeper water area of Blocks 8 and 9 including certain products to review amplitude versus offset (AvO) effects These seismic data cover both recently drilled deep water wells In addition a grid of 2D seismic data was also made available with average line spacing of around 45 km These data provide a tie to Well S3-1 although the well lies some 200m from the nearest seismic line In general the data quality of the 3D volume is good and of suitable fidelity to enable us to undertake our review of identified prospectivity However local complexity in the shallow geology causes the signal to degrade considerably at the prospective levels in certain areas APCL are currently reprocessing these data in an attempt to improve signal quality APCL intend to utilise this dataset to update the CPR in the next 3-6 months It is hoped that these data will support maturation of additional prospects and further clarification of risk and volumes for prospects within this CPR
23Plays and Petroleum Geology Blocks 8 and 9
APCL has identified a number of plays within Blocks 8 and 9 at similar stratigraphic levels to those proven successful elsewhere along the West African margin (Figure 2-3) Recent drilling within Blocks 8 and 9 has demonstrated a working petroleum system within the mid to lower Cretaceous with drilling finding light oil within deep marine sandstones of Turonian age and also in sandstones of Albo-Aptian age
Competent Personrsquos Report African Petroleum Corporation Limited
June 2013 30
Figure 2-3 Petroleum systems and plays Liberia Blocks 8 and 9
Structural traps are identified at the pre-rift to early syn-rift (Albian) level as tilted fault blocks with hydrocarbons sourced from the Albian or Lower Cretaceous source rocks and seal provided by post-rift mud drape Structural and stratigraphic traps are also identified at several potential reservoir levels within the Late Cretaceous and Lower Tertiary again potentially sourced from the Turonian and or Albian source rocks Traps are sealed by coeval marine shales and muds As is encountered regionally there is reasonable seismic evidence for the presence of reservoir bearing intervals within the Upper Cretaceous and Early Tertiary section and this seismic evidence has been used in trap definition
The most significant play in the area is that of Cenomanian to Turonian age deep-marine channel-fan systems as structural and stratigraphic traps In addition an emerging lower Cretaceous microbial carbonate reservoir play has been identified sourced from coeval lacustrine source rocks and sealed by shales deposited during the subsequent drowning of the lacustrine systems by the onset of significant subsidence and marine inundation later in the Cretaceous We have evaluated prospects within both of these play systems Prospectivity in the shallower Cretaceous and Tertiary intervals is still being re-evaluated by APCL as of the date of this report and no leads have been matured to prospect status
Oil show Cestos-1
Competent Personrsquos Report African Petroleum Corporation Limited
June 2013 31
Figure 2-4 Porositydepth trend published West Africa turbidite reservoirs
24Play and Prospect Risk Liberia Blocks 8 and 9
Of the prospects reviewed all but the Wildbird prospect fall within the Cenomanian to Turonian channelfan play In our opinion recent drilling has de-risked source and reservoir presence for this play However reservoir quality in recent wells is variable In our risking of Cenomanian to Turonian prospectivity (Barbet Sunbird Lovebird and Night Heron prospects) we have removed the play element to our risking matrix and see a low risk to hydrocarbon charge for individual prospects Key risk is therefore to trap integrity and reservoir quality We use a four component risk matrix as outlined in Section 16 to define geological chance of success for these prospects
The Wildbird prospect has been recently identified by APCL as part of its review of further play fairways within the Liberian licences The play concept is of early Aptian bio-constructed carbonate build-ups within the restricted lacustrine environment that existed at this time Porosity and permeability within the bioclastic microbial limestones is potentially enhanced by hydrothermal activity resulting from the early rifting Later post-rift subsidence and drowning by marine conditions provides the top seal via the
0
500
1000
1500
2000
2500
3000
3500
4000
0 01 02 03 04m
Bel
ow S
eabe
dPorosity (fraction)
Porosity versus Depth Trend
Regional West AfricaTurbidite Data
Competent Personrsquos Report African Petroleum Corporation Limited
June 2013 32
deposition of Cretaceous marine muds It is envisaged that the play is charged or by Aptian source rocks deposited in the offset lagoonal facies with possible charge from later (but on-lapping) Cretaceous marine source rocks (as other plays on the blocks) Both potential source rocks provide lateral seal (Figure 2-16) Regionally lacustrine microbial carbonate reservoirs can be found in Congo and Angola where there is some production but also in the Campos and Santos basins in Brazil
The microbial carbonate play is emerging within Blocks 8 and 9 and has not been demonstrated to be effective by drilling We adopt the play and prospect risking as discussed in Section 16 to risk the Wildbird prospect as a result discounting biodegradation risk as the prospect is at significant depth Our estimate of play risk for the Cretaceous microbial carbonate play is summarized in below
PLAY Source Reservoir Presence Seal Play
Risk Cretaceous Carbonate 08 06 05 20
Table 21 Play risk Cretaceous carbonate play Liberia Blocks 8 and 9
Competent Personrsquos Report African Petroleum Corporation Limited
June 2013 33
25Liberia Blocks 8 and 9 Leads and Prospects
Following the drilling of Wells Narina-1 and Bee Eater-1 APCL is re-evaluating the prospectivity within Blocks 8 and 9 and has developed a number of potential traps (Figure 2-5) several of which (marked in orange Figure 2-5) have been matured to prospect status We have assessed the prospective resources for certain of these prospects that APCL has identified as viable near-term drilling opportunities Barbet Sunbird Lovebird Night Heron and Wildbird A number of the prospects have multiple reservoir targets Our evaluation of these prospects follows the methodology described in Section 16 The results of Wells Narina-1 and Bee Eater-1 would indicate that oil charge is probable and thus only oil cases have been evaluated However as we state in Section 16 a gas charge cannot be discounted due to the uncertainties in source rock evaluation and basin modelling Input parameters STOIIP prospective resources and geological chance of success for each of the evaluated prospects are summarised in Table 1 of this report and are also presented in the resource summary sheets as Enclosures 11 to 19 of this document
Figure 2-5 Leads and Prospects Liberia Blocks 8 and 9
Competent Personrsquos Report African Petroleum Corporation Limited
June 2013 34
ʹǤͷǤͳǤ Barbet Prospect
The Barbet prospect is identified as a stratigraphic trap around 14 km to the east of and up-dip from Well Narina-1 within Block 9 (Figure 2-6) A single target reservoir is mapped within the Turonian Seismic amplitude anomalies are also identified within the area of the trap that may provide support for reservoir development The Turonian is mapped at between 3000 and 3600 m TVDSS over the area of the prospect in a water depth of around 750 to 770 m
Figure 2-6 Seismic line - depth (m TVDSS) over the Barbet prospect
We have used an areanet pay methodology to estimate prospective resources for the Barbet prospect In our low case we restrict the area of the accumulation to the brightest area of anomalous amplitudes on the far offsets Our high case extends the prospect down-dip to include a larger area of anomalous amplitudes above an observed amplitude shut-off (Figure 2-7) These are used to constrain the P90 and P10 inputs of our probabilistic simulation These polygons approximate to an oil column height of 200 and 700 m respectively
Amplitudes are variable within the area of closure and we apply an areal net to gross ratio to better constrain sand distribution within the trap Gross reservoir thickness estimates are computed from the mapped seismic interval net to gross ratio from regional analogue and porosity from a regional porositydepth trend (Figure 2-4) Fluid parameters and recovery factors are estimated as described in Section 16
Narina-1 Barbet
Top Turonian
Top Cenomanian
Top Albian
Lwr Turonian (BFF)
Top Turonian
Narina-1
Apalis-1
Albian UC
0 km 2(mss)
W E
Competent Personrsquos Report African Petroleum Corporation Limited
June 2013 35
Figure 2-7 Barbet far offset amplitudes with Top Turonian depth contours (m TVDSS)
We have used the prospect risk matrix presented in Section 16 to determine the geological chance of success for the Barbet prospect Key risk to the Barbet prospect is to trapcontainment as the trap requires pinch-out of the reservoir in three directions to seal There is also a subsidiary risk to reservoir as the Turonian reservoir encountered in Well Narina-1 is of relatively poor quality which is countered by seismic evidence over the prospect to support reservoir development As a result we attribute a geological chance of success of 22 to the Barbet prospect
metres
P10
P90metres
APALIS-1
Competent Personrsquos Report African Petroleum Corporation Limited
June 2013 36
ʹǤͷǤʹǤ Sunbird Canyon Prospect
The Sunbird canyon prospect is also identified as a stratigraphic trap around 5 km to the south of Well Apalis-1 within Blocks 8 and 9 mapped as a large canyon system There are three potential reservoir targets within the prospect within the Campanian the Turonian (as encountered in Well Narina-1) and in the underlying Cenomanian Reservoir is prognosed at between 3000 m TVDSS and 3600 m TVDSS in a water depth of around 1300 m
Figure 2-8 Regional seismic line along axis of the Sunbird canyon system
We have used an areanet pay methodology to estimate prospective resources for the Sunbird canyon prospect At all three prospective layers the prospect divides into two discrete lsquocanyonsrsquo separated by an intra-basinal high (eg Figure 2-9) For the Campanian and Turonian prospective intervals in the low case we restrict the area of the accumulation to the brightest area of anomalous amplitudes on the far offsets in the northerly of the two canyons where amplitude response is better Our high case extends the prospect down-dip to include a larger area of anomalous amplitudes above an observed amplitude shut-off and also includes the southerly of the two canyons as this would now be in charge communication The low and high case polygons approximate to an oil column height of 200 m and 600 m respectively
Albian uc
LB-08LB-09
LB-08
LB-09
Albian UC
Sunbird
0 km 4
NESW
Competent Personrsquos Report African Petroleum Corporation Limited
June 2013 37
For the deeper Cenomanian the prospect is mapped as a single canyon to the south of the intra-basinal high The low and high case polygons approximate to an oil column height of 200 m and 700 m respectively Our low and high estimates of area are used to constrain the P90 and P10 of our probabilistic simulation
Figure 2-9 Sunbird Campanian far offset amplitudes with Cenomanian depth contours (m TVDSS)
Amplitudes are variable within the area of closure and we apply an areal net to gross ratio to better constrain sand distribution within the trap for all three prospective layers Gross reservoir thickness estimates are computed from the mapped seismic interval net to gross from regional analogue and porosity from the observed porositydepth trend (Figure 2-4) Fluid parameters and recovery factors are estimated as described in Section 16
metres
P90
P10
Block 9
Block 8
APALIS-1
Competent Personrsquos Report African Petroleum Corporation Limited
June 2013 38
Figure 2-10 Sunbird Turonian far offset amplitudes with Top Turonian depth contours (m TVDSS)
We have used the prospect risk matrix presented in Section 16 to determine the geological chance of success for the three prospective intervals of the Sunbird prospect Key risk to all three prospective layers is to trapcontainment as the trap requires pinch-out of the reservoir in three directions to seal There is also a subsidiary risk to reservoir at the two deeper levels as the Turonian reservoir encountered in Well Narina-1 is of relatively poor quality and Cenomanian reservoirs are yet to be proven on block However there is seismic evidence for reservoir development and hence we see this risk as favourable Reservoir risk is low for the Campanian as it is developed in the offset Well Narina-1 and there is seismic evidence for reservoir presence As a result we attribute a geological chance of
P90
P10
metres
Block 9
Block 8
APALIS-1
Competent Personrsquos Report African Petroleum Corporation Limited
June 2013 39
success of 27 19 and 18 to the Campanian Turonian and Cenomanian prospective intervals of the Sunbird canyon prospect
Figure 2-11 Sunbird Cenomanian far offset amplitudes with Cenomanian depth contours (m TVDSS)
ʹǤͷǤ͵Ǥ Night Heron
Night Heron is a Turonian basin floor fan system which lies 8 Km south west of Well Bee Eater-1 It is mainly within Block 9 but extends into Block 10 It is identified as a stratigraphic trap with areal extents defined by amplitude truncation and structural pinch-out Reservoir is prognosed at between 4100 m TVDSS and 4700 m TVDSS in a water depth of around 1750 m (Figure 2-12) APCL has selected a
P90
P10
metres
Block 9
Block 8
Competent Personrsquos Report African Petroleum Corporation Limited
June 2013 40
provisional well location which lies on the 3D survey location ndash In-line 1098 X-line 6103 They are currently seeking partners to drill the Night Heron well in early 2014
Figure 2-12 Arbitrary line across Night Heron PSDM - Depth (m TVDSS)
Cenomanian reservoir potential also exists beneath the Turonian basin floor fan and work by APCL is on-going to determine prospectivity
Well Bee Eater-1 found an organic-rich Turonian shale section overlying a hydrocarbon bearing thin-bedded low permeability sandstone Another shale dominated package underlies the sandstone Although the Turonian interval is considered non-commercial for Bee Eater the prospectivity down-dip is appealing APCL interprets that the well was drilled in a canyon system that may have been largely bypassed by sediment input The 3D seismic indicates a significant thickening of this Turonian interval towards the south west and there is some amplitude support for the occurrence of a lobate fan straddling Blocks 9 amp 10
An area times net approach was adopted using the full stack PSDM depth volume to provide an SNA extraction and constrain areal extent and estimate an areal NG to account for lateral variability within the reservoir (Figure 2-13) As night Heron falls partly off block ERCE correct for this using the ratio of on-block to off-block area in reporting of net unrisked and net risked results
S NEBee EaterNight Heron
5 Km
BFF Isopach (m)
Competent Personrsquos Report African Petroleum Corporation Limited
June 2013 41
Figure 2-13 SNA from Basin Floor Fan Isopach (m) - PSDM
We have used the prospect risk matrix presented in Section 16 to determine the geological chance of success for the Turonian interval of the Night Heron prospect Recent drilling results suggest that there is a low risk to hydrocarbon charge The observations at Bee Eater-1 also indicate that shale seals are also likely at a coeval interval Reservoir is a significant risk due to the poor Turonian reservoir development in Well Bee Eater-1 The Turonian reservoir encountered in Well Narina-1 is also of relatively poor quality However there is seismic evidence on the 3D survey for a possible improvement in reservoir development over the prospective area The definition of the trap is the key risk as the seismic evidence for closurereservoir pinch-out is ambiguous over the 2D data in Block 10 There appears to be evidence of the reservoir interval thinning in the critical north westerly direction but 3D data would be required to reduce trap risk any further As a result we attribute a geological chance of success of 144 to the Night Heron prospect
3
3
SNA from BFF Isopach
Block Boundary
Competent Personrsquos Report African Petroleum Corporation Limited
June 2013 42
ʹǤͷǤͶǤ Lovebird Prospect
The Lovebird prospect is mapped as a four-way dip closure to the south of Block 8 (Figure 2-14) Three prospective layers are mapped by correlation to up-dip wells and are prognosed to be of Cenomanian age Thus as with the Sunbird canyon prospect these reservoirs are not proven on block but seismic mapping and regional geological work suggests the sands may be derived from the east via a canyon system identified in block LB-07 The three prospective intervals are termed Upper Middle and Lower or Blue Pink and Green based on horizon colour Structural relief at the Pink horizon is between 50 and 200 m depending on the estimate and thus the prospect is relatively low relief in some realisations
Figure 2-14 Seismic line over the Lovebird prospect
Lovebird
Depth (mss)
4 km
NE
Competent Personrsquos Report African Petroleum Corporation Limited
June 2013 43
Figure 2-15 Lovebird prospect Top Pink horizon depth (m TVDSS) high case
The prospect is mapped to the edge of the available 3D (Figure 2-15) which coincides with the southern boundary of Block 8 but closure can be mapped south of the 3D area on the available 2D lines Reservoir depth is prognosed at between 5000 and 5900 m TVDSS in a water depth of 2850 m at the prospect crest Thus reservoir rock if present will be at comparable depths below mud line to the Barbet prospect
We use a gross-rock volumenet to gross methodology to estimate prospective resources for the Lovebird prospect APCLrsquos evaluation of the Lovebird prospect is on-going and of the three interpreted horizons the Pink horizon is the best defined We review pick depth conversion and thickness uncertainty for this interval to generate a range of gross-rock volumes for this interval with the
m ss
metres
Block 9
Block 8
Competent Personrsquos Report African Petroleum Corporation Limited
June 2013 44
prospect full to spill (Figure 2-15) Assuming the Pink horizon provides an accurate representation of the Blue and Green horizons we then estimate gross-rock volumes for these two intervals by isopach
Reservoir thickness and net to gross ratio estimates are derived from regional analogues with reservoir porosity derived from our regional porositydepth trend (Figure 2-4) Fluid properties and recovery factors are estimated as described in Section 16 Our volumetrics are restricted to the portion of the Lovebird prospect on Block 8 We would expect a further evaluation of the prospective resources of the Lovebird prospect to occur subsequent to the completion of the APCL evaluation and the prospective resources associated with the prospect in this report may therefore be subject to change
The key risks to the Lovebird prospect are to the development of reservoir at the prognosed Cenomanian intervals as they are not proved in wells elsewhere on the block and to source as the prospect requires a source rock deeper than that proven by drilling There is also risk to trapcontainment as the structure is not fully defined by the 3D seismic data volume and is of low relief in some realisations We assign a geological chance of success to the Lovebird prospect of 20 as a result
255Wildbird Prospect
The Wildbird prospect is mapped on 3D seismic data towards the south of Block 8 as a large four-way dip-closed high (Figure 2-17) at a depth of between 4000 to 4600 m TVDSS in a water depth of around 2000 m Structural relief is up to 600 m and area of closure up to 170 km2 The conceptual geological model is discussed above but is that the prognosed microbial carbonate reservoir of Albian age is developed between the mapped lsquoredrsquo and lsquolight bluersquo seismic events (Figure 2-16) with lateral seal developed to the north-east of the prospect within contemporaneous lagoonal facies which also provide the primary source rock This lateral seal is required to close the prospect Basin modelling undertaken by APCL suggests that the Albian lagoonal and later Cretaceous source rocks would be mature for oil generation
We have accepted this model as a geological concept and have used it to make estimates of prospective resources for the Wildbird prospect We then risk the model accordingly
Competent Personrsquos Report African Petroleum Corporation Limited
June 2013 45
Figure 2-16 Seismic line and prospect geo-seismic sketch Wildbird prospect
5
0 km 5
SWN
E
mss
Wildbird
Horizons
BlackberryLight BlueRoseRed
Competent Personrsquos Report African Petroleum Corporation Limited
June 2013 46
Figure 2-17 Wildbird Top Reservoir depth map (m TVDSS) Spill point - green contour
The Wildbird prospect is a large container but there is considerable uncertainty in reservoir thickness structural mapping and degree of charge from the offset kitchen areas We evaluate the prospect in a similar manner to the Lovebird prospect by perturbing the above variables In our low case we choose a shallow contact at 4250 m TVDSS to simulate under-filling or lateral breach via onlapping thief zones and also employ a reservoir thickness of 80 m from offset analogue Our high case assumes the prospect is filled to spill and that the lsquoredrsquo seismic event marks base reservoir Estimates of reservoir net to gross ratio and porosity are derived from the available analogues and are necessarily wide Fluid parameters and recovery factors are derived as described in Section 16
The Wildbird play is emerging and is of high risk We attribute a play risk of 24 as a result (Section 24) The key prospect risk to the Wildbird prospect is that of containment or trap as there is evidence for erosion at the crest of the feature and it is reliant on the development of lagoonal facies to the north-east and overlying marine shales to provide lateral seal and support the hydrocarbon column heights modelled here We attribute a prospect risk of 38 Wildbird which when combined with the play risk gives an overall chance of success for the Wildbird prospect of 9
mss
Competent Personrsquos Report African Petroleum Corporation Limited
June 2013 47
3 Gambia Prospectivity and Plays
͵ǤͳǤ Introduction
Although only one exploration well (Well Jammah-1) exists offshore Gambia exploration drilling has been undertaken to the north and south within Senegalese and Guinea Bissau waters (Figure 2-1 Figure 3-1) A number of oil and gas discoveries have been made onshore Senegal and the large Dome Flore and Dome Gea discoveries to the south of the blocks are each reported to contain a million barrels of biodegraded oil (c10-13o API) in place within sandstones of Oligocene (Tertiary) age Some lighter (30-34o API) oil has also been encountered in deeper intervals More regionally oil and gas discoveries have been made to the north offshore Mauritania and in Guinea Bissau (Sinapa) the recently drilled Venus and Mercury wells in Sierra Leone have also encountered hydrocarbons
Figure 3-1 Plays Gambia Blocks A1 and A4
The range of hydrocarbon types encountered is suggestive of multiple sourcing and the age of the reservoirs suggest late timing of oil generation consistent with a late Cretaceous source for the heavy oil although there are no published data to confirm this Regionally the gas source could be any of the older potential source rocks discussed below
Alhamdulilah
GAMBIA A1ampA4 PROSPECTIVITY POTENTIAL
Deep Water Fans channel levee complexes BFF lobes
Late Jurassic clastic progrades
Clastic progrades (unconformity trap)
Karst amp reef features in carbonate platform
Intra-carbonate clastic truncations
Based on line 1046-NWA
1
2
3
1
51
14
2
3
4
5
Competent Personrsquos Report African Petroleum Corporation Limited
June 2013 48
32Well and Seismic Database
Exploration offshore Gambia is also at an early stage and no wells have been drilled in the deeper water areas The nearest well to Blocks A1 and A4 (and the only well offshore Gambia) is Well Jammah-1 some 15 km to the east of Block A1 (Figure 3-2) This well contains oil shows within sandstones of Late Cretaceous age The well drilled to 3020 m MD reaching total depth in an interval of uncertain age perhaps Cenomanian to Albian
A regional grid of 2D seismic data was made available to us for our evaluation with an average line spacing of around 2-3 km on Block A1 and up to 8 km on Block A4 (Figure 3-2 Figure 3-3) In addition a 2003 vintage 3D seismic data volume was available for analysis covering 2008 km2 However APCL is using 2010 vintage 3D seismic data (2566km2) processed to pre-stack time-migration in their current evaluation and we have adopted these data for our review In general seismic data quality was found to be good
Figure 3-2 Wells 2D and 3D seismic data (red outline) Gambia Blocks A1 and A4
The 2D seismic data was sufficient to enable a well to seismic tie to be made to Well Jammah-1 (Figure 3-3) Despite its shelfal location we were able to extrapolate some stratigraphy into the deeper water
Competent Personrsquos Report African Petroleum Corporation Limited
June 2013 49
although the key Upper Cretaceous section is not sampled adequately by the well leading to uncertainty in the age of the deeper clastic section that forms the potential reservoir interval for the Alhamdulilah prospect
33Plays and Petroleum Geology Blocks A1 and A4
Some of the plays identified by APCL offshore Gambia are similar to those described for Liberia in Section 23 above with structural and stratigraphic traps identified at a number of Cretaceous intervals (Figure 3-1) and reservoirs prognosed as being of deep marine turbidites or other mass transport systems However plate tectonic reconstructions suggest that rifting occurred earlier along the Senegalese and Gambian margin beginning in the Lower Jurassic Thus there is the potential for deeper Jurassic age source and reservoir in the area
There is some seismic evidence for the presence of reservoir intervals as is common regionally although evidence is less compelling in the deeper intervals (Figure 3-5) Of the identified traps in this play fairway only one has currently been matured to prospect status by APCL the Alhamdulilah prospect
Regionally reservoirs within the Cretaceous are associated with a deep marine depositional environment and are generally expected to be of good to excellent quality with the possibility of some overpressure A similar depositional environment is prognosed for the deeper Jurassic age reservoirs with possible fan-delta like geometries identifiable on seismic landward (eastward) of the Alhamdululah prospect (Figure 3-7)
In addition to the Jurassic and Cretaceous clastic plays APCL has identified a number of closures along the margin of a carbonate platform of Jurassic to Aptian age partially penetrated by Well Jammah-1 (Figure 3-3 Figure 3-4) These closures are currently being evaluated by APCL and only one Prospect M has been evaluated to prospect status and we assess the prospective resources for Prospect M in this section
Competent Personrsquos Report African Petroleum Corporation Limited
June 2013 50
Figure 3-3 Well to seismic tie ndash Well Jammah-1 to the Alhamdulilah prospect
There is good evidence for the presence of source rocks in the Gambian margin The youngest source interval that could possibly generate oil is the Cenomanian-Turonian marine source rock proven in the Casamance Shelf wells and present in basins to the north Published data indicate kerogen is a mixed Type IIIII locally and Type II in wells to the south with HI of between 370-660 mggC in gt2 TOC rocks (TOCs in the DSDP-367 well 300 km to the west are in excess of 5 in black shales of Albian to Turonian age) This section is absent in Well Jammah-1 probably as a result of erosion
There is also the possibility of Necomian and Jurassic source rocks Necomian black shales are described in the DSDP-367 well Jurassic (Toarcian) source rocks are inferred to be present based on analogue evidence and plate tectonic reconstructions that place proven Jurassic source rocks in Morocco Portugal Nova Scotia and north-eastern Brazil in proximity to the Senegal-Gambia basin These are documented as having a HI of around 450 mggC and a TOC of up to 6
Regional thermal information shows a high degree of variability with gradients from 25 to 45 degCkm likely as a result of drilling on salt domes where geothermal gradients are elevated or in areas locally affected by volcanics Blocks A1 and A4 are at the northernmost margin of the salt basin so at worst only limited local effects are anticipated Using data from Well Jammah-1 we infer a geothermal gradient of 30deg Ckm at the location of the well This would put the Cenomanian-Turonian source locally into the oil window around the Alhamdulilah prospect However uncertainty in both depth conversion and geothermal modelling do not rule out the possibility that the Cenomanian-Turonian could be mature regionally for hydrocarbon generation Deeper Neocomian or Jurassic source rocks if present would be mature for oil generation under this model
ALHAMDULILAH
M
Senonian UC
W E4 km
Jammah-1
Alhamdulilah
Intra Aptian Carbonate
TWT (ms)
Competent Personrsquos Report African Petroleum Corporation Limited
June 2013 51
34Play Risk
In our evaluation of APCLrsquos Gambian blocks we note that a number of the prospective plays require further definition to mature the identified leads to prospect status As a result our evaluation is limited to the determination of independent estimates of prospective resource for the Alhamdulilah prospect and Prospect M We have used play and prospect risk for both prospects to allow for consistency in comparison between our evaluations where a play risk is appropriate
Based on the review above we see source risk as the key risk to the Lower Cretaceous and Jurassic clastic play Although a number of source rock intervals are present regionally only those within the Cretaceous are demonstrated to be present proximal to Blocks A1 and A4 Data are limited but modelling would suggest that those within the Cenomanian-Turonian could be immature for oil generation in all but a small area of the blocks As a result we assign a source risk of 07 Note that the uncertainty in both source rock presence and thermal data is such that there is a possibility of gas charge although like Liberia Sierra Leone and Cote drsquoIvoire it is impossible to quantify this chance at present
We see seal risk for this play to be relatively low as there is seismic evidence similar to that interpreted regionally for the presence of seal Seal risks for the multiple stacked sands prognosed for the Alhamdulilah prospect are handled as a prospect specific risk The inferred depositional environment for this interval would also suggest that sealing intervals would be developed We have therefore assigned a seal risk of 09 to this play
Seismic evidence for the presence of reservoir is also good but less convincing than that observed regionally and in our evaluation of Liberia Blocks 8 and 9 However we assign a reservoir presence risk of 08 It is possible that the younger Cretaceous reservoirs identified could be locally sourced via exhumation of the coeval carbonate platform to the east and thus be composed of detrital carbonate material This is reflected in the reservoir risk for the Alhamdulilah prospect itself
For the carbonate platform play the key risk is that of top seal Seismic reflectivity is highly variable above the top of the platform carbonates (Figure 3-3) as the event is a strong regional unconformity In places the overlying clastic section can be interpreted immediately above this unconformity Although the latter is factored into prospect specific risk to top seal the seismic evidence for the presence of a regional seal above the unconformity is not compelling The top seal is provided by a down-lapping carbonate prone Aptian-Albian section where the Senonian unconformity is not immediately above the reservoir section Analogues suggest there is a general lack of support for intra-formational seals in similar settings and therefore we assign a risk to the carbonate platform play seal of 05 as a result
The presence of a strong angular unconformity at the top of the carbonate platform structures is however likely to have enhanced reservoir quality within the carbonates themselves as a result of subareal exposure and karstification Thus we assign a risk of 09 to the reservoir presence element of the carbonate platform play and review the prospect specific reservoir efficacy risk on a prospect by prospect basis dependent on the seismic evidence for erosion
Competent Personrsquos Report African Petroleum Corporation Limited
June 2013 52
A number of the identified structures along the buried carbonate platform margin are relatively shallow to mudline and thus biodegradation of any oil charge is possible However as we have only estimated prospective resources for Prospect M we have not carried a play risk to biodegradation
Our final play risks for the Lower Cretaceous clastic and the buried carbonate platform plays are summarised in Table 31 below
PLAY Source Reservoir Presence Seal Play
Risk Cretaceous to Jurassic Clastic Play 07 08 09 50
Carbonate Platform Margin 07 09 05 28
Table 31 Play risk Gambia Blocks A1 and A4
Competent Personrsquos Report African Petroleum Corporation Limited
June 2013 53
35Gambia Leads and Prospects
In all 13 leads and prospects have been identified by APCL within Blocks A1 and A4 with areas of closure varying from around 4 km2 to 63 km2 (Figure 3-4) Of the identified prospective intervals a number are best classified as leads and require further technical work to mature them to prospect status (yellow Figure 3-4) Structural closure is identified within the Lower Cretaceous and a number of slope fans can be identified as seismic amplitude anomalies within the Upper Cretaceous section In addition a number of closures are mapped along the edge of the buried carbonate platform margin at Top Aptian level and APCL are currently evaluating the potential for a deeper Barremian age seal which might provide further prospectivity within the carbonate platform play
Figure 3-4 Leads and prospects identified by APCL in Gambia Blocks A1 and A4
In this section we briefly describe our evaluation of the Alhamdulilah prospect and Prospect M A summary of input parameters for the calculation of prospective resources results and risks for each of the prospective layers evaluated is given in the resource summary sheets in Enclosures 21 to 25 of this document
In 2010 APCL acquired a further 2566 km2 of 3D data over both blocks A re-evaluation of the identified leads and prospects is on-going using these data with the evaluation of the Alhamdulilah prospect and Prospect M completed
ALHAMDULILAH
M
Competent Personrsquos Report African Petroleum Corporation Limited
June 2013 54
351Alhamdulilah Prospect
The Alhamdulilah prospect is identified as a four-way dip-closed structural high within the centre of the deep water portion of Block A1 (Figure 3-3 Figure 3-5) We have evaluated four prospective intervals in total (Figure 3-5) Reservoir ages are currently prognosed by APCL to be of Lower Cretaceous (Turonian) to perhaps Lower Jurassic The prospect extends northwards of Block A1 into Senegalese waters and we have restricted our calculations to the proportion of the prospect that lies within Block A1 The bulk of the prospect does however lie within Gambian territory
Figure 3-5 Seismic line over the Alhamdulilah prospect
The prospective intervals within the Alhamdulilah structure lie between 4230 m TVDSS and 5970 m TVDSS or around 2010 to 3750 metres below sea bed This is relatively deep and despite the estimates of overpressure it is possible that porosity and thus reservoir quality to be relatively poor (Figure 2-4) Our estimates of recovery factor for the deeper prospective intervals reflect this
There is uncertainty in the degree of structural closure as although mapped reflectors are relatively bright and continuous the structure is of low relief We have account for this by undertaking various depth conversions of the mapped structure from the time domain 3D seismic data restricting our analysis to closure demonstrable on-block (Figure 3-6) At SS-1 level closure continues to the north off-block and also off the 3D seismic data We have reviewed the available 2D seismic data northwards to determine the spill point at this level
SS 4 (1)
SS 3 (1-2)
SS 2 (1-3)
SS 1 (1-3)
2 Km
Inline 1140 - TWT ALHAMDULILAH
TWT (s)
W E
Competent Personrsquos Report African Petroleum Corporation Limited
June 2013 55
Where seismic facies analysis suggests the potential for stacked pay intervals these have been modelled probabilistically Estimates of gross rock volume derived in this way are combined with the estimates of net reservoir thickness based on mapped seismic thicknesses and porosity and fluid information are derived as described in Section 16 to compute probabilistic estimates of resources for each reservoir interval
Figure 3-6 Area of closure Alhamdulilah prospect layers SS1 to SS4
Recovery factors used are as described in Section 16 of this report but modified to reflect the depth of burial of the deeper prospective intervals
We have reviewed the prospect specific risk for each of the prospective intervals independently Although the Alhamdulilah trap is a four-way dip-closed feature the time closure is subtle and the prospect is relatively deep There is also seabed canyoning which may cause uncertainty in the imaging and thus trap closure
Seismic evidence for seal is relatively good over the Alhamdulilah trap However there is evidence for downcuttingerosion between layers and above the prospect there is also evidence for downlapping events onto the topmost reflector
The key risk to the Alhamdulilah prospect is that of reservoir efficacy There are indications of fan-like geometries within the 3D seismic data (Figure 3-7) and some events can be mapped for the shallower reservoir layers However the Cretaceous reservoirs may alternatively comprise the eroded talus from the coeval carbonate platform to the east and reservoir quality rock may not be developed as a result Finally our estimate of overpressure may be incorrect and any sandstones present may have the reservoir quality sufficiently degraded via compaction to render them non-reservoir
SS-1 Low and High Case AreasSS-4 Low and High Case Areas SS-3 Low and High Case Areas SS-2 Low and High Case Areas
Competent Personrsquos Report African Petroleum Corporation Limited
June 2013 56
As a result the prospect specific risks to the prospective intervals of the Alhamdulilah prospect vary from 26 to 34 and from 13 to 17 when combined with the play risk
Figure 3-7Alhamdulilah prospect seismic facies interpretation Cretaceous intervals
AH-1 AH-1
Competent Personrsquos Report African Petroleum Corporation Limited
June 2013 57
352Prospect M
A number of structures have been identified by APCL at the Aptian level (ie top carbonate) along the buried carbonate platform margin that runs through Blocks A1 and A4 (Figure 3-1) Of these one structure Prospect M has been matured to prospect status and is of sufficient size to warrant independent estimates of resources (Figure 3-8)
Figure 3-8 Seismic line through Prospect M
We have evaluated the uncertainty in gross rock volume for Prospect M and combined this with reservoir net to gross ratio and porosity from analogue to generate estimates of STOIIP and prospective resources We have simulated uncertainty in seismic pick and also depth conversion to generate a range of spill points for the structure (Figure 3-9) These are used to make low and high case estimates of gross-rock volume
Due to the shallow nature of Prospect M we have assumed relatively high (but moveable) oil viscosities as discussed in Section 1 Recovery factor estimates are made with reference to this and also to analogue where uncertainty in both reservoir quality and also the degree of fracturing (and hence dual permeability) leads to a wide range in uncertainty in ultimate recovery Our low case recovery factor being affected primarily by early onset of water cut via fractures and an adverse mobility ratio and the high case making allowance for better oil mobility and improved matrix porosity and permeability leading to a more efficient sweep We therefore use a recovery factor range from 10 to 35 and use these as the P90 and P10 estimates on a log-normal distribution in our probabilistic simulation of prospective resources
Senonian UC
Intra Aptian Carbonate
TWT (ms)2 km
w EProspect M
Competent Personrsquos Report African Petroleum Corporation Limited
June 2013 58
Figure 3-9 Low and high case closure Prospect M top Aptian depth (m TVDSS)
There is pick and depth conversion uncertainty associated with Prospect M but we see a good chance of a closure being developed within the 3D seismic area and assign a prospect specific risk to trap of 09 as a result Downlapping events are observed onto the crest of the prospect (Figure 3-8) but the overlying seismic signature is relatively transparent thus we see a good chance of the prospect being sealed relative to the play risk However the prospect is relatively shallow at around 1000 m to 1100 m below the seabed and there is a risk to biodegradation of any oil charge Thus we associate a risk of 06 to biodegradation As it is established practice we place this risk into containment or trap risk which results in an overall trap risk of 09 06 or 54
There is evidence for the development of reservoir quality rock with a seismic character that has been associated with the development of karstification in the analogues used We also note that the prospect is very close to the platform edge and the erosional unconformity is quite pronounced again suggesting a period of subareal exposure Thus we see the prospect specific risk to reservoir efficacy as 08 Charge risk is also favourable with the prospect located at the edge of the buried platform margin proximal to the deeper potential kitchen areas We therefore associate a charge risk of 08 to the prospect
Thus we assign a prospect specific risk of 35 which when combined with the play risk for the carbonate platform margin gives an overall COS of 10
3
3
m ss
metres
Competent Personrsquos Report African Petroleum Corporation Limited
June 2013 59
4 Sierra Leone Prospectivity and Plays
As with offshore Liberia to the south-east all of the deep-water acreage offshore Sierra Leone is under licence (Figure 4-1) A discussion of regional hydrocarbon occurrences is presented in Section 21 APCLrsquos licences SL-03 and SL-04A-10 lie to the north-west of the countryrsquos territorial waters around 200 to 300 km north-west of the recent Venus Mercury and Jupiter discoveries made by Anadarko (Figure 4-1)
Figure 4-1 Offshore licences and discoveries Liberia and Sierra Leone
A regional grid of 2D seismic data is available to APCL for the evaluation of offshore Sierra Leone (Figure 4-2) In addition APCL has licenced c 2500 km2 of 3D seismic data covering the deeper water area of Block SL-03 and is negotiating the licencing of further 3D seismic data covering part of Block SL-04A-10
Competent Personrsquos Report African Petroleum Corporation Limited
June 2013 60
Well data offshore Sierra Leone are sparse Historical exploration was restricted to the shelf and resulted in the drilling of two exploration wells (Wells A-1 and A-1-2) which were plugged and abandoned as dry holes Data from both wells are available to APCL Recent drilling by Anadarko in the deeper waters of licence SL-07B-10 has yielded a number of discoveries (Wells Jupiter-1 Venus-1 and Mercury-1) but these well data are not available to APCL
Figure 4-2 Well and seismic database offshore Sierra Leone
The play fairways identified offshore Sierra Leone are very similar to those identified offshore Liberia (Figure 2-3) as structural traps within the Lower Cretaceous syn-rift section and primarily as stratigraphic traps within turbiditic sands of Cretaceous age (Campanian Cenomanian and Turonian) Sourcing from regional marine (Cenomanian) or lacustrine (Albo-Aptian) source rocks is hypothesized For the syn-rift structural play the presence of Albo-Aptian reservoirs is demonstrated by the shallow water Wells A-1 and A-1-2 which also had indications of the development of source rocks within the
Competent Personrsquos Report African Petroleum Corporation Limited
June 2013 61
Cretaceous syn-rift section Although the data are not available the recent Anadarko wells are publically documented as having found hydrocarbons within post-rift Cretaceous turbidites potentially de-risking this play
Blocks SL-03 and SL-04A-10 are towards the north-western edge of the seismically identified Cretaceous basin immediately adjacent to a large structural lineament the Sierra Leone Transform System Submarine canyon development is therefore prognosed to occur to the south and east of this lineament providing sediment input into the blocks during Cretaceous time As is encountered regionally there is reasonable seismic evidence for the presence of reservoir bearing intervals within the Upper Cretaceous section in the blocks
APCLrsquos evaluation of the recently licenced 3D seismic data is on-going and as yet only one prospect Altair has been matured to drillable prospect status However a number of other Cretaceous channelfan systems have been identified within Block SL- 03 (Figure 4-3)
Figure 4-3 Leads Sierra Leone Block SL-03
Competent Personrsquos Report African Petroleum Corporation Limited
June 2013 62
41Play Risk
Although there has been recent drilling along strike of APCLrsquos Sierra Leone licences these wells lie some 100 km to the east We have therefore attributed a play risk albeit favourable to Cretaceous channel-fan prospectivity within Blocks SL-03 and SL-04A-10 As with our review of Liberia there is strong seismic evidence for reservoir and seal rocks being present and offset drilling would indicate the same from the limited published information However there is as yet no proven source rock within APCLrsquos licences and we see this as the key risk to play The reported results of offset drilling and APCLrsquos own basin modelling would suggest that source risk would be favourable
Our final play risk for the Cretaceous channel-fan systems in APCLrsquos Sierra Leone licences is summarised in Table 31 below
PLAY Source Reservoir Presence Seal Play
Risk Cretaceous Play 08 09 09 65
Table 41 Play risk Sierra Leone Block SL-03
41Sierra Leone Leads and Prospects
APCL is currently evaluating the recently licenced 3D seismic data over Block SL-03 and has identified a number of Cretaceous channel-fan systems varying in areal extent from 20 km2 to 150 km2 Of the mapped channel fan systems one Altair has been matured to prospect status by APCL and we have made independent estimates of prospective resources and risks for this prospect
A summary of input parameters for the calculation of prospective resources results and risks for the Altair prospect is given in the resource summary sheet in Enclosure 31 of this document
411Altair
The Altair prospect is a turbidite channel prospect mapped at a seismic event described as Turonian by APCL (Figure 4-4) There is however uncertainty in this stratigraphy as it is established by jump correlation using regional seismic data due to the lack of deep water wells on block It is a stratigraphic trap with areal extents defined by amplitude truncation and structural pinch-out in a similar manner to prospectivity within APCLrsquos Liberia and Cote drsquoIvoire acreage A single target reservoir is identified within the trapped area The prospect has anomalous seismic amplitudes associated with it (Figure 4-5) which may indicate reservoir development The top structure is mapped between 6200 ndash 6800 ms TWT over the area of the prospect Our depth conversion indicates a crestal depth of approximately 5400 m TVDSS beneath a water depth of 3300 m giving 2100 m of sediment above top reservoir
Competent Personrsquos Report African Petroleum Corporation Limited
June 2013 63
Figure 4-4 Dip seismic line (full offsets) Altair prospect
The seismic image suggests that Altair is a turbidite channel constrained in the north east by a well-defined canyon Two distinct canyon systems feed erosive channels at the break of slope A south west trending fault which is almost perpendicular to the main canyon feeders alters bathymetric relief and diverts the Altair channel southwards
ERCE has made estimates of prospective resources for the Altair prospect using an identical methodology to our evaluation of Liberian prospectivity An area net approach was adopted using optimized seismic amplitudes to constrain areal extent and define an areal net to gross to account for lateral variability of sand distribution within the reservoir In our low case we restrict the area of the accumulation to the brightest area of anomalous amplitudes and a column height of 200 m Our high case extends the prospect down-dip to a column height of 800 m and laterally to incorporate weaker amplitude responses (Figure 4-5) These polygons were used to constrain the P90 and P10 area inputs of our probabilistic simulation
SW NE
Top Turonian
Top syn-rift
0 5kmTWT (s)
ALTAIR
3
3
metres
Competent Personrsquos Report African Petroleum Corporation Limited
June 2013 64
Figure 4-5 Seismic amplitude (gradient stack) and Top Turonian depth (m TVDSS) Altair prospect
Net pay is estimated from the mapped seismic interval and regional analogue with porosities and fluid properties estimated as described in Section 16
We have used the prospect risk matrix presented in Section 16 to determine the geological chance of success for the Altair prospect Key risk is to trap integrity due to the coalescing of a number of mapped fan systems up dip towards the pinch-out of Altair with subsidiary risk to charge as this is as yet unproven on block This gives a prospect specific risk of 28 which when combined with the play risk gives an overall chance of success of 18 for the Altair prospect
3
3
metres
Competent Personrsquos Report African Petroleum Corporation Limited
June 2013 65
5 Cote13 drsquoIvoire13 Prospectivity13 and Plays
51Introduction
Offshore Cote drsquoIvoire has been actively explored for hydrocarbons for a number of years and much of the offshore shelf is under licence Recently exploration has moved into deeper waters targeting the regional post-rift (Cretaceous) play and APCL has identified a number of prospects and leads within the western licence Blocks of CI-513 and CI-509 (Figure 5-1)
There are two main play types identifiable offshore Cote drsquoIvoire (Figure 5-2) as structural traps within the Lower Cretaceous (Aptian to Albian) syn-rift section and as stratigraphic traps within post rift turbiditic sands of Cenomanian to Turonian age Sourcing is prognosed from regional marine (Turonian) or lacustrine (Albo-Aptian) source rocks
Figure 5-1 CI-509 and CI-513 Prospects and Leads13 offshore13 Cote13 drsquoIvoire
Historically exploration has been restricted to the narrow shelf area and has yielded a number of commercial fields both oil and gas including Foxtrot Baobab and Espoir All of these fields lie within the Lower Cretaceous (Aptian) syn-rift play Recently exploration has moved into deeper waters targeting the regional post-rift (Cretaceous) play Well Paon-1X c 300 km to the east of Blocks CI-105 and CI-513
Competent Personrsquos Report African Petroleum Corporation Limited
June 2013 66
drilled by Tullow Oil plc and partners in licence CI-103 during 2012 is reported to have found hydrocarbons in turbiditic sandstones of Cretaceous age Well Kosrou-1X some 150 km east of Blocks CI-105 and CI-513 shows reservoir development within the post-rift Cretaceous section particularly within the Turonian to Cenomanian section
Evaluation of prospectivity within Blocks CI-509 and CI-513 is at an early stage and a working petroleum system is not proven on block However a number of Cretaceous channelfan systems have been identified using both 2D and 3D seismic data which have generated around seven potential traps at the date of this report five of which are considered prospects for this report (Figure 5-1)
Figure 5-2 Petroleum13 systems13 and13 plays13 offshore13 Cote13 drsquoIvoire
52Well and Seismic Database
APCL has obtained a regional database of 2D seismic data offshore Cote drsquoIvoire which provides well to seismic ties to Well San Pedro-1 (Figure 5-3) The primary data set used for our evaluation is that provided by the recently acquired 3D seismic data At the time of writing these data were processed to
Competent Personrsquos Report African Petroleum Corporation Limited
June 2013 67
pre-stack time-migration and we have used this volume plus available AvO processed volumes to evaluate the prospectivity of the CI-513 licence currently only the full-stack seismic product has been used to assess the prospectivity in Block CI-509
Figure 5-3 Well and seismic database offshore Sierra Leone
53Plays and Petroleum Geology Blocks CI-509 and CI-513
The primary play being explored within Blocks CI-509 and CI-513 is the Cretaceous post-rift turbidite play (Figure 5-2) There is reasonable seismic evidence for the presence of reservoir bearing intervals within the Upper Cretaceous section of the blocks However dating of the age of these post-rift turbidite channelfan systems is uncertain due to the paucity of well and seismic data with stratigraphy extrapolated into APCLrsquos licences via regional seismic correlation The presence of a regional Turonian source rock is hypothesized to charge any identified traps This is not proven on block but evidence from offset drilling in Block CI-105 demonstrates the presence of source rocks developed within the
Grand Lahou East 1
Kosrou 1x
San Pedro 1
South Grand Lahou 1
Competent Personrsquos Report African Petroleum Corporation Limited
June 2013 68
Cenomanian to Turonian and basin modelling studies indicate that the Turonian may be mature for oil generation local to the licences
A number of Cretaceous channelfan systems have been identified using both 2D and 3D seismic data (Figure 5-1) and we have independently evaluated the Prospective Resources and geological chance of success for five of these In addition the Lower Cretaceous syn-rift play may be viable within the licences particularly to the north Evaluation of this play by APCL is on-going and no prospective resources have been assessed for this play
54Play Risk
Exploration offshore Cote drsquoIvoire is at an early stage and there are limited well data available As a result ERCE has adopted a play and prospect risk system in our evaluation of the Cote drsquoIvoire prospective resources within the Cretaceous channel-fan play in an identical manner to our review of Liberia the Gambia and Sierra Leone
In a similar manner to Liberia the Gambia and Sierra Leone there is seismic evidence for the presence of seal and reservoir rock and thus the key risk is to source and we see source risk as the key risk to the Creteaceous clastic play Sourcing is prognosed from regional marine (Turonian) modelled as having limited hydrocarbon generating potential or lacustrine (Albo-Aptian) source rocks the maturity of which are interpreted to be in the very early oil window As a result we assign a play source risk of 06 Note that the uncertainty in both source rock presence and thermal maturity is such that there is a possibility of gas charge although it is impossible to quantify this chance at present
Our final play risk is summarised in Table 51 below
PLAY Source Reservoir Presence Seal Play
Risk Cretaceous Clastic Play 06 09 09 049
Table 51 Play13 risk13 Cote13 drsquoIvoire13 Blocks13 CI-509 and CI-513
Competent Personrsquos Report African Petroleum Corporation Limited
June 2013 69
ͷǤͷǤ Cote13 drsquoIvoire13 Blocks13 CI-509 and CI-503 Leads and Prospects
Prospectivity has been identified by APCL at a number of levels with the evaluation of the Cretaceous clastic turbidite channel-fan play being the most advanced ERCE has made independent assessments of prospective resources and geological chance of success for five prospects within this play Ayame Ayame West Sassandra Cavella and Leraba (Figure 5-1)
A summary of input parameters for the calculation of prospective resources results and risks for each of the prospective layers evaluated is given in the resource summary sheets in Enclosures 41 to 45 of this document
ͷǤͷǤͳǤ Ayame amp Ayame West
The Ayame and Ayame West prospects are identified as Upper Cretaceous fans which lie mainly within Block CI-513 (Figure 5-4) The prognosed trapping mechanism is stratigraphic with areal extents defined by amplitude truncation and structural pinch-out A single target reservoir is prognosed for both within stratigraphy identified as Turonian although stratigraphy is uncertain in both licences as it is established via long distance seismic ties The prospects have anomalous seismic amplitudes associated with them (Figure 5-5) which may indicate reservoir development The top structure is mapped between 5400 ndash 6300 ms TWT over the area of the prospect and our depth conversion places the crest of the trap at approximately 4200 m TVDSS beneath a water depth of 2500 m
Figure 5-4 Strike Line Ayame and Ayame West prospects
NE
0 km 4
TWT (s)
Top
Turonian
Base
Turonian
Top
Albian
AYAMEAYAME WESTSW
P90
P10
metres
P90
P10
AYAME
AYAMEWEST
Competent Personrsquos Report African Petroleum Corporation Limited
June 2013 70
Evaluation of the Ayame and Ayame West prospects is undertaken in an identical manner to our evaluations of the stratigraphically trapped channel-fan prospects in APCLrsquos Liberia and Sierra Leone licences An area net approach is adopted using anomalous seismic amplitudes to constrain areal extent and define an areal net to gross to account for lateral variability of sand distribution within the closure area In our low case we restrict the area of the accumulation to the brightest area of anomalous amplitudes and a 200 m column height Our high case extends the prospect down-dip to 800 m of column height to include a larger area of anomalous amplitudes (Figure 5-5) These polygons are used to constrain the P90 and P10 area inputs of our probabilistic simulation
Net pay estimates are estimated from mapped seismic interval thickness and from regional analogues with porosity fluid parameters and recovery factors estimated as described in Section 16
Figure 5-5 Ayame Seismic amplitude (gradient stack) and Top Turonian depth (m TVDSS)
We use the prospect risk matrix presented in Section 16 to determine the geological chance of success for the Ayame and Ayame West prospects Key risk is to trap and we attribute a trap risk of 50 to both
P90
P10
metres
P90
P10
AYAME
AYAMEWEST
Competent Personrsquos Report African Petroleum Corporation Limited
June 2013 71
prospects giving a prospect specific chance of success of 28 for both prospects When combined with the play risk this gives an overall chance of success of 14
A proportion of the closure areas for both the Ayame and Ayame West prospects fall outside Block CI-513 in our high case (6 km2 and 11 km2 respectively) This is corrected for in our summary tables of net risked and unrisked prospective resources at the beginning of this document by computing the area of the prospect off-block at P90 P50 and P10 and scaling accordingly
ͷǤͷǤʹǤ Sassandra
The Sassandra prospect is mapped as a deep-water fan system at Top Turonian level and lies within Blocks CI-513 and CI-509 approximately 20km west along strike from the Ayame prospect It is a stratigraphic trap with areal extents defined by amplitude truncation and structural pinch-out (Figure 5-6) A single target reservoir is prognosed within the Turonian and as with other prospects on block has similar uncertainty in the stratigraphic age of the prospective interval The prospect has anomalous amplitudes associated with it (Figure 5-7) which may indicate reservoir development The top structure is mapped between 5000 ndash 6000 ms TWT over the area of the prospect and our depth conversion predicts a crestal depth of approximately 4400 m TVDSS beneath a water depth of 2500 m
Figure 5-6 Dip seismic line Sassandra prospect
Top Turonian
Base Turonian
Top Albian
N S
TWT (s)
SASSANDRA
P90 P10
metres
CI-509
Competent Personrsquos Report African Petroleum Corporation Limited
June 2013 72
Evaluation of the Sassandra prospect is undertaken in an identical manner to our evaluation of the Ayame and Ayame West prospects An area net approach is adopted using anomalous seismic amplitudes to constrain areal extent and define an areal net to gross to account for lateral variability of sand distribution within the closure area In our low case we restrict the area of the accumulation to the brightest area of anomalous amplitudes and a 200 m column height Our high case extends the prospect down-dip to 800 m of column height to include a larger area of anomalous amplitudes (Figure 5-7) These polygons are used to constrain the P90 and P10 area inputs of our probabilistic simulation As far offset data are only available for CI-513 (at the time of writing) we have used amplitudes from the full-stack volume to map the extent of the prospect to the west off block (Figure 5-7)
Net pay estimates are estimated from mapped seismic interval thickness and from regional analogues with porosity fluid parameters and recovery factors estimated as described in Section 16
Figure 5-7 Sassandra prospect Seismic amplitude and Top Turonian depth (m TVDSS)
We use the prospect risk matrix presented in Section 16 to determine the geological chance of success for the Sassandra prospect Key risk is to trap and we attribute a trap risk of 40 This is a lower value
33
metres
CI-509
Competent Personrsquos Report African Petroleum Corporation Limited
June 2013 73
than our estimates for the Ayame and Ayame West prospects as the up-dip termination of the trap is less well defined and requires a larger area for pinch-out or bypass Seismic amplitude support for reservoir presence is less over the Sassandra prospect relative to Ayame Thus we estimate a prospect specific chance of success for the Sassandra prospect of 20 which when combined with the play risk gives an overall chance of success for the Sassandra prospect of 10
A proportion of the closure area for the Sassandra prospect falls outside Blocks CI-513 and CI-509 in our high case (33 km2) This is corrected for in our summary tables of net risked and unrisked prospective resources at the beginning of this document by computing the area of the prospect off-block at P90 P50 and P10 and scaling accordingly
553Cavalla
The Cavalla prospect is an Upper Cretaceous Fan which lies between the Ayame and Sassandra prospects within Block CI-513 It is identified as a stratigraphic trap with areal extents defined by amplitude truncation and structural pinch-out (Figure 5-8) A single target reservoir is prognosed within the TuronianCenomanian interval (with similar stratigraphic uncertainty to other prospects on block) which lies stratigraphically beneath the Ayame prospect The prospect has anomalous seismic amplitudes associated with it (Figure 5-9) which may indicate reservoir development The top structure is mapped between 4600 ndash 5900 ms TWT over the area of the prospect and we estimate a crestal depth of approximately 3900 m TVDSS beneath a water depth of 2500 m The prospect is more steeply dipping than other fan systems mapped on block
Evaluation of the Cavalla prospect is undertaken in an identical manner to our evaluation of the Ayame Ayame West and Sassandra prospects An area net approach is adopted using anomalous seismic amplitudes to constrain areal extent and define an areal net to gross to account for lateral variability of sand distribution within the closure area In our low case we restrict the area of the accumulation to the brightest area of anomalous amplitudes and a 200 m column height Our high case extends the prospect down-dip to 800 m of column height to include a larger area of anomalous amplitudes (Figure 5-9) These polygons are used to constrain the P90 and P10 area inputs of our probabilistic simulation
Net pay estimates are estimated from mapped seismic interval thickness and from regional analogues with porosity fluid parameters and recovery factors estimated as described in Section 16
We use the prospect risk matrix presented in Section 16 to determine the geological chance of success for the Cavella prospect Key risk is to trap and we attribute a trap risk of 40 As with the Sassandra prospect this is a lower value than our estimates for the Ayame and Ayame West prospects as the up-dip termination of the trap is less well defined and requires a larger area for pinch-out or bypass Seismic amplitude support for reservoir presence is less over the Cavella prospect relative to Ayame Thus we estimate a prospect specific chance of success for the Cavella prospect of 20 which when combined with the play risk gives an overall chance of success for the Cavella prospect of 10
Competent Personrsquos Report African Petroleum Corporation Limited
June 2013 74
The Cavalla prospect is contained entirely within APCLrsquos licences
Figure 5-8 Dip seismic line Cavalla prospect
Top Turonian
Top Albian
TWT (s)
CAVALLANW SEP90
P10
metres
Competent Personrsquos Report African Petroleum Corporation Limited
June 2013 75
Figure 5-9 Seismic amplitude (gradient stack) and Top fan depth (m TVDSS) Cavalla prospect
ͷǤͷǤͶǤ Leraba
As with the other evaluated prospectivity within Blocks CI-509 and CI-513 the Leraba prospect is an Upper Cretaceous fan which lies within Block CI-509 It is identified as a stratigraphic trap with areal extents defined by amplitude truncation and structural pinch-out (Figure 5-10) The prospect has anomalous seismic amplitudes associated with it (Figure 5-11) which may indicate reservoir development Unlike the other Cote DrsquoIvoire prospects evaluated in this report no offset seismic volumes were available for our review of Leraba at the time of writing The seismic amplitude response and character on the full-stack data is however consistent with that observed over other prospects in Block CI-513 where more seismic products were available
P90
P10
metres
Competent Personrsquos Report African Petroleum Corporation Limited
June 2013 76
The top structure is mapped between 4600 ndash 5200 ms TWT over the area of the prospect and we estimate a depth at the crest of approximately 3700 m TVDSS beneath a water depth of 2500 m
Figure 5-10 Dip seismic line Leraba prospect
Evaluation of the Leraba prospect is undertaken in an identical manner to our evaluation of the other Cretaceous fan systems evaluated in this section An area net approach is adopted using anomalous seismic amplitudes to constrain areal extent and define an areal net to gross to account for lateral variability of sand distribution within the closure area In our low case we restrict the area of the accumulation to the brightest area of anomalous amplitudes and a 200 m column height Our high case extends the prospect down-dip to 800 m of column height to include a larger area of anomalous amplitudes (Figure 5-11) These polygons are used to constrain the P90 and P10 area inputs of our probabilistic simulation
P90
P10
metresTWT (s)
LERABANW SE
Top Turonian
Albian
0 5km
Competent Personrsquos Report African Petroleum Corporation Limited
June 2013 77
Figure 5-11 Seismic amplitudes Leraba prospect overlay of Top Reservoir m TVDSS
Net pay estimates are derived from mapped seismic interval thickness and from regional analogues with porosity fluid parameters and recovery factors estimated as described in Section 16 The prospect is relatively shallow to mud line and we have modelled a more viscous oil as described in Section 16
We use the prospect risk matrix presented in Section 16 to determine the geological chance of success for the Leraba prospect Key risk is to trap and we attribute a trap risk of 60 as the up-dip extent of the prospect is fairly well defined on seismic data Although no off-set 3D seismic data were available the seismic evidence for reservoir presence is again comparable to that of Ayame West Thus we estimate a prospect specific chance of success for the Leraba prospect of 34 which when combined with the play risk gives an overall chance of success for the Leraba prospect of 16
The Leraba prospect is contained entirely within APCLrsquos licences
P90
P10
metres
Competent Personrsquos Report African Petroleum Corporation Limited
June 2013 78
6 Senegal Prospectivity and Plays
Prospectivity identified within APCLrsquos Sengalese licences is seen as being similar to that identified offshore Gambia (Figure 6-1) and a description of the regional petroleum systems and main play types expected is given in Section 3
Figure 6-1 Petroleum systems and plays offshore Senegal
In 2012 APCL acquired 3600 km2 of multi-client 3D seismic data over the Offshore Sud Profond licence In addition 1500 km2 of legacy 3D data over the Rufisque Offshore Profond licence is currently being reprocessed by APCL and legacy 2D seismic data (c 7000 line km) have also been acquired APCL expects to begin prospect evaluation once seismic processing is complete which is expected later in 2013 At present a number of conceptual Cretaceous post-rift leads are identified by APCL (Figure 6-2)
Competent Personrsquos Report African Petroleum Corporation Limited
June 2013 79
Figure 6-2 leads offshore Senegal Blocks ROP and SOSP
Competent Personrsquos Report African Petroleum Corporation Limited
June 2013 80
7 Appendix 1 SPE PRMS Guidelines
SPEWPCAAPGSPEE Petroleum Reserves and Resources Classification System and Definitions
The Petroleum Resources Management System
Preamble
Petroleum Resources are the estimated quantities of hydrocarbons naturally occurring on or within the Earthrsquos crust Resource assessments estimate total quantities in known and yet-to-be-discovered accumulations Resources evaluations are focused on those quantities that can potentially be recovered and marketed by commercial projects A petroleum Resources managements system provides a consistent approach to estimating petroleum quantities evaluating development projects and presenting results within a comprehensive classification framework
International efforts to standardize the definitions of petroleum Resources and how they are estimated began in the 1930s Early guidance focused on Proved Reserves Building on work initiated by the Society of Petroleum Evaluation Engineers (SPEE) SPE published definitions for all Reserves categories in 1987 In the same year the World Petroleum Council (WPC then known as the World Petroleum Congress) working independently published Reserves definitions that were strikingly similar In 1997 the two organizations jointly released a single set of definitions for Reserves that could be used worldwide In 2000 the American Association of Petroleum Geologists (AAPG) SPE and WPC jointly developed a classification system for all petroleum Resources This was followed by additional supporting documents supplemental application evaluation guidelines (2001) and a glossary of terms utilized in Resources definitions (2005) SPE also published standards for estimating and auditing Reserves information (revised 2007)
These definitions and the related classification system are now in common use internationally within the petroleum industry They provide a measure of comparability and reduce the subjective nature of Resources estimation However the technologies employed in petroleum exploration development production and processing continue to evolve and improve The SPE Oil and Gas Reserves Committee works closely with other organizations to maintain the definitions and issues periodic revisions to keep current with evolving technologies and changing commercial opportunities
The SPE-PRMS consolidates builds on and replaces guidance previously contained in the 1997 Petroleum Reserves Definitions the 2000 Petroleum Resources Classification and Definitions publications and the 2001 ldquoGuidelines for the Evaluation of Petroleum Reserves and Resourcesrdquo the latter document remains a valuable source of more detailed background information
These definitions and guidelines are designed to provide a common reference for the international petroleum industry including national reporting and regulatory disclosure agencies and to support petroleum project and portfolio management requirements They are intended to improve clarity in
Competent Personrsquos Report African Petroleum Corporation Limited
June 2013 81
global communications regarding petroleum Resources It is expected that the SPE-PRMS will be supplemented with industry education programs and application guides addressing their implementation in a wide spectrum of technical andor commercial settings
It is understood that these definitions and guidelines allow flexibility for users and agencies to tailor application for their particular needs however any modifications to the guidance contained herein should be clearly identified The definitions and guidelines contained in this document must not be construed as modifying the interpretation or application of any existing regulatory reporting requirements
The full text of the SPEWPCAAPGSPEE Petroleum Resources Management System document hereinafter referred to as the SPE-PRMS can be viewed at
wwwspeorgspecmabinaryfiles6859916Petroleum_Resources_Management_System_2007pdf
Overview and Summary of Definitions
The estimation of petroleum resource quantities involves the interpretation of volumes and values that have an inherent degree of uncertainty These quantities are associated with development projects at various stages of design and implementation Use of a consistent classification system enhances comparisons between projects groups of projects and total company portfolios according to forecast production profiles and recoveries Such a system must consider both technical and commercial factors that impact the projectrsquos economic feasibility its productive life and its related cash flows
Petroleum is defined as a naturally occurring mixture consisting of hydrocarbons in the gaseous liquid or solid phase Petroleum may also contain non-hydrocarbons common examples of which are carbon dioxide nitrogen hydrogen sulphide and sulphur In rare cases non-hydrocarbon content could be greater than 50
The term ldquoResourcesrdquo as used herein is intended to encompass all quantities of petroleum naturally occurring on or within the Earthrsquos crust discovered and undiscovered (recoverable and unrecoverable) plus those quantities already produced Further it includes all types of petroleum whether currently considered conventionalrdquo or ldquounconventionalrdquo
Figure 1-1 is a graphical representation of the SPEWPCAAPGSPEE Resources classification system The system defines the major recoverable Resources classes Production Reserves Contingent Resources and Prospective Resources as well as Unrecoverable petroleum
Competent Personrsquos Report African Petroleum Corporation Limited
June 2013 82
Figure 1-1 SPEAAPGWPCSPEE Resources Classification System
The ldquoRange of Uncertaintyrdquo reflects a range of estimated quantities potentially recoverable from an accumulation by a project while the vertical axis represents the ldquoChance of Developmentrdquo that is the chance that the project that will be developed and reach commercial producing status
The following definitions apply to the major subdivisions within the Resources classification
TOTAL PETROLEUM INITIALLY-IN-PLACE
Total Petroleum Initially in Place is that quantity of petroleum that is estimated to exist originally in naturally occurring accumulations
It includes that quantity of petroleum that is estimated as of a given date to be contained in known accumulations prior to production plus those estimated quantities in accumulations yet to be discovered (equivalent to ldquototal Resourcesrdquo)
Competent Personrsquos Report African Petroleum Corporation Limited
June 2013 83
DISCOVERED PETROLEUM INITIALLY-IN-PLACE
Discovered Petroleum Initially in Place is that quantity of petroleum that is estimated as of a given date to be contained in known accumulations prior to production
PRODUCTION
Production is the cumulative quantity of petroleum that has been recovered at a given date
Multiple development projects may be applied to each known accumulation and each project will recover an estimated portion of the initially-in-place quantities The projects shall be subdivided into Commercial and Sub-Commercial with the estimated recoverable quantities being classified as Reserves and Contingent Resources respectively as defined below
RESERVES
Reserves are those quantities of petroleum anticipated to be commercially recoverable by application of development projects to known accumulations from a given date forward under defined conditions
Reserves must satisfy four criteria they must be discovered recoverable commercial and remaining based on the development project(s) applied Reserves are further subdivided in accordance with the level of certainty associated with the estimates and may be sub-classified based on project maturity andor characterized by their development and production status To be included in the Reserves class a project must be sufficiently defined to establish its commercial viability There must be a reasonable expectation that all required internal and external approvals will be forthcoming and there is evidence of firm intention to proceed with development within a reasonable time frame A reasonable time frame for the initiation of development depends on the specific circumstances and varies according to the scope of the project While five years is recommended as a benchmark a longer time frame could be applied where for example development of economic projects are deferred at the option of the producer for among other things market-related reasons or to meet contractual or strategic objectives
In all cases the justification for classification as Reserves should be clearly documented To be included in the Reserves class there must be a high confidence in the commercial producibility of the reservoir as supported by actual production or formation tests In certain cases Reserves may be assigned on the basis of well logs andor core analysis that indicate that the subject reservoir is hydrocarbon-bearing and is analogous to reservoirs in the same area that are producing or have demonstrated the ability to produce on formation tests
Proved Reserves
Proved Reserves are those quantities of petroleum which by analysis of geoscience and engineering data can be estimated with reasonable certainty to be commercially recoverable from a given date forward from known reservoirs and under defined economic conditions operating methods and government regulations
Competent Personrsquos Report African Petroleum Corporation Limited
June 2013 84
If deterministic methods are used the term reasonable certainty is intended to express a high degree of confidence that the quantities will be recovered If probabilistic methods are used there should be at least a 90 probability that the quantities actually recovered will equal or exceed the estimate The area of the reservoir considered as Proved includes
the area delineated by drilling and defined by fluid contacts if any and adjacent undrilled portions of the reservoir that can reasonably be judged as continuous with it and commercially productive on the basis of available geoscience and engineering data
In the absence of data on fluid contacts Proved quantities in a reservoir are limited by the lowest known hydrocarbon (LKH) as seen in a well penetration unless otherwise indicated by definitive geoscience engineering or performance data Such definitive information may include pressure gradient analysis and seismic indicators Seismic data alone may not be sufficient to define fluid contacts for Proved Reserves (see ldquo2001 Supplemental Guidelinesrdquo Chapter 8) Reserves in undeveloped locations may be classified as Proved provided that the locations are in undrilled areas of the reservoir that can be judged with reasonable certainty to be commercially productive and interpretations of available geoscience and engineering data indicate with reasonable certainty that the objective formation is laterally continuous with drilled Proved locations
For Proved Reserves the recovery efficiency applied to these reservoirs should be defined based on a range of possibilities supported by analogs and sound engineering judgment considering the characteristics of the Proved area and the applied development program
Probable Reserves
Probable Reserves are those additional Reserves which analysis of geoscience and engineering data indicate are less likely to be recovered than Proved Reserves but more certain to be recovered than Possible Reserves
It is equally likely that actual remaining quantities recovered will be greater than or less than the sum of the estimated Proved plus Probable Reserves (2P) In this context when probabilistic methods are used there should be at least a 50 probability that the actual quantities recovered will equal or exceed the 2P estimate
Probable Reserves may be assigned to areas of a reservoir adjacent to Proved where data control or interpretations of available data are less certain The interpreted reservoir continuity may not meet the reasonable certainty criteria Probable estimates also include incremental recoveries associated with project recovery efficiencies beyond that assumed for Proved
Possible Reserves
Possible Reserves are those additional Reserves which analysis of geoscience and engineering data indicate are less likely to be recoverable than Probable Reserves
Competent Personrsquos Report African Petroleum Corporation Limited
June 2013 85
The total quantities ultimately recovered from the project have a low probability to exceed the sum of Proved plus Probable plus Possible (3P) which is equivalent to the high estimate scenario When probabilistic methods are used there should be at least a 10 probability that the actual quantities recovered will equal or exceed the 3P estimate
Possible Reserves may be assigned to areas of a reservoir adjacent to Probable where data control and interpretations of available data are progressively less certain Frequently this may be in areas where geoscience and engineering data are unable to clearly define the area and vertical reservoir limits of commercial production from the reservoir by a defined project
Possible estimates also include incremental quantities associated with project recovery efficiencies beyond that assumed for Probable
Probable and Possible Reserves
(See above for separate criteria for Probable Reserves and Possible Reserves)
The 2P and 3P estimates may be based on reasonable alternative technical and commercial interpretations within the reservoir andor subject project that are clearly documented including comparisons to results in successful similar projects
In conventional accumulations Probable andor Possible Reserves may be assigned where geoscience and engineering data identify directly adjacent portions of a reservoir within the same accumulation that may be separated from Proved areas by minor faulting or other geological discontinuities and have not been penetrated by a wellbore but are interpreted to be in communication with the known (Proved) reservoir Probable or Possible Reserves may be assigned to areas that are structurally higher than the Proved area Possible (and in some cases Probable) Reserves may be assigned to areas that are structurally lower than the adjacent Proved or 2P area
Caution should be exercised in assigning Reserves to adjacent reservoirs isolated by major potentially sealing faults until this reservoir is penetrated and evaluated as commercially productive Justification for assigning Reserves in such cases should be clearly documented Reserves should not be assigned to areas that are clearly separated from a known accumulation by non-productive reservoir (ie absence of reservoir structurally low reservoir or negative test results) such areas may contain Prospective Resources
In conventional accumulations where drilling has defined a highest known oil (HKO) elevation and there exists the potential for an associated gas cap Proved oil Reserves should only be assigned in the structurally higher portions of the reservoir if there is reasonable certainty that such portions are initially above bubble point pressure based on documented engineering analyses Reservoir portions that do not meet this certainty may be assigned as Probable and Possible oil andor gas based on reservoir fluid properties and pressure gradient interpretations
Competent Personrsquos Report African Petroleum Corporation Limited
June 2013 86
CONTINGENT RESOURCES
Contingent Resources are those quantities of petroleum estimated as of a given date to be potentially recoverable from known accumulations by application of development projects but which are not currently considered to be commercially recoverable due to one or more contingencies
Contingent Resources may include for example projects for which there are currently no viable markets or where commercial recovery is dependent on technology under development or where evaluation of the accumulation is insufficient to clearly assess commerciality Contingent Resources are further categorized in accordance with the level of certainty associated with the estimates and may be sub-classified based on project maturity andor characterized by their economic status
UNDISCOVERED PETROLEUM INITIALLY-IN-PLACE
Undiscovered Petroleum Initially in Place is that quantity of petroleum that is estimated as of a given date to be contained within accumulations yet to be discovered
PROSPECTIVE RESOURCES
Prospective Resources are those quantities of petroleum which are estimated as of a given date to be potentially recoverable from undiscovered accumulations
Potential accumulations are evaluated according to their chance of discovery and assuming a discovery the estimated quantities that would be recoverable under defined development projects It is recognized that the development programs will be of significantly less detail and depend more heavily on analog developments in the earlier phases of exploration
Prospect
A project associated with a potential accumulation that is sufficiently well defined to represent a viable drilling target
Project activities are focused on assessing the chance of discovery and assuming discovery the range of potential recoverable quantities under a commercial development program
Lead
A project associated with a potential accumulation that is currently poorly defined and requires more data acquisition andor evaluation in order to be classified as a prospect
Project activities are focused on acquiring additional data andor undertaking further evaluation designed to confirm whether or not the lead can be matured into a prospect Such evaluation includes the assessment of the chance of discovery and assuming discovery the range of potential recovery under feasible development scenarios
Play
Competent Personrsquos Report African Petroleum Corporation Limited
June 2013 87
A project associated with a prospective trend of potential prospects but which requires more data acquisition andor evaluation in order to define specific leads or prospects
Project activities are focused on acquiring additional data andor undertaking further evaluation designed to define specific leads or prospects for more detailed analysis of their chance of discovery and assuming discovery the range of potential recovery under hypothetical development scenarios
The range of uncertainty of the recoverable andor potentially recoverable volumes may be represented by either deterministic scenarios or by a probability distribution When the range of uncertainty is represented by a probability distribution a low best and high estimate shall be provided such that
bull There should be at least a 90 probability (P90) that the quantities actually recovered will equal or exceed the low estimate
bull There should be at least a 50 probability (P50) that the quantities actually recovered will equal or exceed the best estimate
bull There should be at least a 10 probability (P10) that the quantities actually recovered will equal or exceed the high estimate
When using the deterministic scenario method typically there should also be low best and high estimates where such estimates are based on qualitative assessments of relative uncertainty using consistent interpretation guidelines Under the deterministic incremental (risk-based) approach quantities at each level of uncertainty are estimated discretely and separately
These same approaches to describing uncertainty may be applied to Reserves Contingent Resources and Prospective Resources While there may be significant risk that sub-commercial and undiscovered accumulations will not achieve commercial production it useful to consider the range of potentially recoverable quantities independently of such a risk or consideration of the resource class to which the quantities will be assigned
Evaluators may assess recoverable quantities and categorize results by uncertainty using the deterministic incremental (risk-based) approach the deterministic scenario (cumulative) approach or probabilistic methods (see ldquo2001 Supplemental Guidelinesrdquo Chapter 25) In many cases a combination of approaches is used
Use of consistent terminology (Figure 11) promotes clarity in communication of evaluation results For Reserves the general cumulative terms lowbesthigh estimates are denoted as 1P2P3P respectively The associated incremental quantities are termed Proved Probable and Possible Reserves are a subset of and must be viewed within context of the complete Resources classification system While the categorization criteria are proposed specifically for Reserves in most cases they can be equally applied to Contingent and Prospective Resources conditional upon their satisfying the criteria for discovery andor development
Competent Personrsquos Report African Petroleum Corporation Limited
June 2013 88
For Contingent Resources the general cumulative terms lowbesthigh estimates are denoted as 1C2C3C respectively For Prospective Resources the general cumulative terms lowbesthigh estimates still apply No specific terms are defined for incremental quantities within Contingent and Prospective Resources
Without new technical information there should be no change in the distribution of technically recoverable volumes and their categorization boundaries when conditions are satisfied sufficiently to reclassify a project from Contingent Resources to Reserves All evaluations require application of a consistent set of forecast conditions including assumed future costs and prices for both classification of projects and categorization of estimated quantities recovered by each project
Competent Personrsquos Report African Petroleum Corporation Limited
June 2013 89
8 Appendix 2 Nomenclature
81 Units degC degrees Celsius
degF degrees Fahrenheit
bbl barrel
cp centipoises
ft feet
ftMDRKB feet below Kelly Bushing
ftTVDSS feet subsea
km kilometres
m metres
M or MM thousands and millions respectively
ms metres per second
md millidarcy
mTVDSS metres subsea
psia pounds per square inch absolute
psig pounds per square inch gauge
pu porosity unit
rb reservoir barrels
stb a stock tank barrel which is 42 US gallons measured at 147 pounds per square inch and 60 degrees Fahrenheit
82 Reserves and Resources Classifications
Low Low estimate of Prospective Resources as defined in SPE PRMS 2007
Best Best estimate of Prospective Resources as defined in SPE PRMS 2007
High High estimate of Prospective Resources as defined in SPE PRMS 2007
COS Geological Chance of Success associated with Prospective Resources
P10 10 per cent probability = Proved + Probable + Possible or 3P
P50 50 per cent probability = Proved + Probable or 2P
P90 90 per cent probability = Proved or 1P
83 Abbreviations AvO amplitude variation with offset
Bo oil shrinkage factor or formation volume factor in rbstb
Competent Personrsquos Report African Petroleum Corporation Limited
June 2013 90
CPI computer processed information log
FVF formation volume factor
FWL free water level
GRV gross rock volume
GWC gas water contact
KB kelly bushing
kh permeability thickness
MD measured depth
MSL mean sea level
NG net to gross ratio
OWC oil water contact
Phi porosity
PSC production sharing contract
PSDM post stack depth migration
PSTM post stack time migration
PVT pressure volume temperature experiment
RFT repeat formation tester
So oil saturation
Soi initial oil saturation
SS Subsea
STOIIP stock tank oil initially in place
Sw water saturation
Swc connate water saturation
TD total depth
TOC total organic carbon
TVD true vertical depth
TWT two way time
Vsh shale volume
Competent Personrsquos Report African Petroleum Corporation Limited
June 2013 91
Enclosures Resource Summary Sheets
Enclosure 11 Summary Description Sheet Barbet Prospect
SummaryBlock 9
APC Interest () 100
Fluid Oil
Crest (m ss) 3000
Water depth (m) 750
Notes
Area Shape F Areal NG Net Thick Porosity SO Bo STOIIP Rf Rec Res(km2) (frac) () (m) () () (rbstb) (MMstb) (frac) (MMstb)
Charge 90
Reservoir 70 Low 14 085 62 22 13 73 135 166 0300 60
Trap 50 Best 37 090 80 34 17 80 150 500 0375 186
Seal 70 High 98 095 98 53 20 88 165 1479 0450 558
COS 22 Deterministic inputs probabilistic STOIIP and Rec Resource Mean 270
Stratigraphic trap with amplitude support
Geological Risk Matrix
P10
P90metres
BARBET
dtdƐͿ
ϬŬŵϰ
Enclosure 12 Summary Description Sheet Sunbird Prospect Campanian Reservoir
SummaryBlock 8 amp 9
APC Interest () 100
Fluid Oil
Crest (m ss) 3000
Water depth (m) 1300
Notes
Area Shape F Areal NG Net Thick Porosity SO Bo STOIIP Rf Rec Res(km2) (frac) () (m) () () (rbstb) (MMstb) (frac) (MMstb)
Charge 80
Reservoir 80 Low 12 070 43 27 18 73 130 177 0300 63
Trap 60 Best 27 080 69 42 21 80 145 461 0375 172
Seal 70 High 61 090 95 66 24 88 165 1187 0450 448
COS 27 Deterministic inputs probabilistic STOIIP and Rec Resource Mean 229
Stratigraphic trap with amplitude support Split by intra-canyon
high
Geological Risk Matrix
P90
P10
metres
SUNBIRD
dtdƐͿ
ϬŬŵϰSUNBIRD
Enclosure 13 Summary Description Sheet Sunbird prospect Turonian Reservoir
SummaryBlock 8 amp 9
APC Interest () 100
Fluid Oil
Crest (m ss) 3300
Water depth (m) 1300
Notes
Area Shape F Areal NG Net Thick Porosity SO Bo STOIIP Rf Rec Res(km2) (frac) () (m) () () (rbstb) (MMstb) (frac) (MMstb)
Charge 90
Reservoir 60 Low 8 085 65 24 14 73 140 107 0300 39
Trap 50 Best 21 090 80 37 17 80 158 307 0375 115
Seal 70 High 53 095 94 58 20 88 175 863 0450 327
COS 19 Deterministic inputs probabilistic STOIIP and Rec Resource Mean 162
Stratigraphic trap with amplitude support Split by intra-canyon
high
Geological Risk Matrix
SW NE
Campanian Jacana Channel
Turonian BFF
P90
P10
metres
SUNBIRD
ϬŬŵϰ
Enclosure 14 Summary Description Sheet Sunbird Prospect Cenomanian Reservoir
SummaryBlock 8 amp 9
APC Interest () 100
Fluid Oil
Crest (m ss) 3500
Water depth (m) 1300
Notes
Area Shape F Areal NG Net Thick Porosity SO Bo STOIIP Rf Rec Res(km2) (frac) () (m) () () (rbstb) (MMstb) (frac) (MMstb)
Charge 100
Reservoir 50 Low 10 060 71 21 14 73 140 91 0300 33
Trap 60 Best 25 070 85 33 17 80 158 264 0375 99
Seal 60 High 65 080 99 51 20 88 175 779 0450 294
COS 18 Deterministic inputs probabilistic STOIIP and Rec Resource Mean 141
Stratigraphic trap with amplitude support Split by intra-canyon
high
Geological Risk Matrix
P90
P10
metres
SUNBIRD
dtdƐͿ
ϬŬŵϮ
Enclosure 15 Summary Description Sheet Lovebird Prospect Blue Horizon
SummaryBlock 8
APC Interest () 100
Fluid Oil
Crest (m ss) 5000
Water depth (m) 2850
Notes
GRV NG Porosity SO Bo STOIIP Rf Rec Res(MMm2) () () () (rbstb) (MMstb) (frac) (MMstb)
Charge 54
Reservoir 60 Low 354 30 14 60 150 68 030 25
Trap 70 Best 1310 54 19 70 180 293 038 109
Seal 90 High 4849 73 24 80 210 1218 045 456
COS 20 Mean 201
Four way dip closure to south of Block 8 Three potential
reservoirs identified Blue and Green horizon volumetrics derived
assuming ispoachous to Pink
Geological Risks
ŝŐŚĂƐĞWŝŶŬĞƉƚŚDĂƉ
Enclosure 16 Summary Description Sheet Lovebird Prospect Pink Horizon
SummaryBlock 8
APC Interest () 100
Fluid Oil
Crest (m ss) 5400
Water depth (m) 2850
Notes
GRV NG Porosity SO Bo STOIIP Rf Rec Res(MMm2) () () () (rbstb) (MMstb) (frac) (MMstb)
Charge 54
Reservoir 60 Low 354 30 12 60 155 59 030 22
Trap 70 Best 1310 54 17 70 188 262 038 96
Seal 90 High 4849 73 22 80 220 1066 045 400
COS 20 Mean 178
Four way dip closure to south of Block 8 Three potential
reservoirs identified Blue and Green horizon volumetrics derived
assuming ispoachous to Pink
Geological Risks
ŝŐŚĂƐĞWŝŶŬĞƉƚŚDĂƉ
Enclosure 17 Summary Description Sheet Lovebird Prospect Green Horizon
SummaryBlock 8
APC Interest () 100
Fluid Oil
Crest (m ss) 5800
Water depth (m) 2850
Notes
GRV NG Porosity SO Bo STOIIP Rf Rec Res(MMm2) () () () (rbstb) (MMstb) (frac) (MMstb)
Charge 54
Reservoir 60 Low 354 30 10 60 160 48 030 18
Trap 70 Best 1310 54 15 70 195 210 038 78
Seal 90 High 4849 73 20 80 230 896 045 337
COS 20 Mean 150
Four way dip closure to south of Block 8 Three potential
reservoirs identified Blue and Green horizon volumetrics derived
assuming ispoachous to Pink
Geological Risks
ŝŐŚĂƐĞWŝŶŬĞƉƚŚDĂƉ
Enclosure 18 Summary Description Sheet Wildbird Prospect
SummaryORFN $3ampQWHUHVW )OXLG 2LOampUHVWPVV DWHUGHSWKP P
Notes
Play Risk Prospect RiskGRV NG Porosity SO Bo STOIIP Rf Rec Res
6RXUFH 7UDS (MMm2) () () () (rbstb) (MMstb) (frac) (MMstb)6HDO ampKDUJH 5HVHUYRLU3UHV 5HVHUYRLU(II Low
Best High
COS 9 Deterministic inputs probabilistic STOIIP and Rec Resource Mean
)RXUZDGLSFORVHGKLJK
5
0 km 5
6 1(
PVV
Wildbird Horizons
ODFNEHUULJKWOXH3LQN5HG
mss
Enclosure 19 Summary Description Sheet Night Heron Prospect
SummaryORFN $3ampQWHUHVW RIORFN)OXLG 2LOampUHVWPVV DWHUGHSWKP
Notes
Prospect Risk Area Areal NG Net Porosity SO Bo STOIIP Rf Rec ResampKDUJH (km2) (frac) (m) () () (rbstb) (MMstb) (frac) (MMstb)5HVHUYRLU 7UDS Low 6HDO Best
High COS 144 Deterministic inputs probabilistic STOIIP and Rec Resource Mean 759
1LJKW+HURQLVD7XURQLDQEDVLQIORRUIDQVVWHPZKLFKPDLQOOLHVZLWKLQEORFNRIIVKRUHLEHULDWLVLGHQWLILHGDVDVWUDWLJUDSKLFWUDSZLWKDUHDOH[WHQWVGHILQHGEDPSOLWXGHWUXQFDWLRQDQGVWUXFWXUDOSLQFKRXW$QDUHDQHWDSSURDFKZDVDGRSWHGXVLQJWKHIXOOVWDFN360GHSWKLPDJHYROXPHWRSURYLGH61$H[WUDFWLRQDQGFRQVWUDLQDUHDOH[WHQWDQGHVWLPDWHDQDUHDO1WRDFFRXQWIRUODWHUDOYDULDELOLWZLWKLQWKHUHVHUYRLU1LJKW+HURQIDOOVSDUWORIIEORFN(5amp(FRUUHFWIRUWKLVXVLQJWKHUDWLRRIRQEORFNWRRIIEORFNDUHDLQUHSRUWLQJRIQHWXQULVNHGDQGQHWULVNHGUHVXOWV
6HLVPLFLQH36061$([WUDFWLRQ
Arbitrary line across Night Heron PSDM (Depth m)
S NE
2QWKHXSGLSSLQFKRXWLVGHILQHGELVRSDFKDQGDPSOLWXGHWUXQFDWLRQ
2QWKHXSGLSSLQFKRXWLVGHILQHGRQOELVRSDFK
Bee EaterNight Heron
5 Km
RMS Amplitudes from BFF Isopach
Depth (m)
Block Boundary
Enclosure 21 Summary Description Sheet
Summary - M - CretBlock A1
Working Interest () 60
Fluid Oil
Crest (m) 3130 (1070 bml)
Water depth (m) 2220
Notes
Play Risk Prospect Risk Area Stack F Net Porosity SO Bo STOIIP Rf Rec Res(Km2) (frac) (m) () () (rbstb) (MMstb) (frac) (MMstb)
Source 70 Trap 54
Seal 50 Mig 80 Low 8 1 15 10 55 125 82 010 13
Res Pres 80 Res Eff 80 Best 14 1 30 16 65 117 231 023 43
28 35 High 26 1 60 22 75 110 629 035 141
COS 10 Deterministic inputs probabilistic STOIIP and Rec Resource Mean 66
Structural high along edge of buried carbonate platform margin of
probable Lower Cretaceous and Jurassic age Seismic evidence
favourable for reservoir development Lower Bo model used to
reflect relatively shallow nature of prospect The prospect is close
to the shelf margin and so is well placed for charging The strong
rugose seismic events are interpreted as Karstified Limestones
Seismic Line Top Structure Map
WƌŽƐƉĞĐƚD
ĞƉƚŚŵ
Ϳ
Enclosure 22 Summary Description Sheet
Summary - SS - 4Block A1
Working Interest () 60
Fluid Oil
Crest (m) 4230 (2010 bml)
Water depth (m) 2220
Notes
Play Risk Prospect Risk Area Stack F Net Porosity SO Bo STOIIP Rf Rec Res(Km2) (frac) (m) () () (rbstb) (MMstb) (frac) (MMstb)
Source 70 Trap 80
Seal 90 Mig 85 Low 6 1 10 16 68 220 43 030 16
Res Pres 80 Res Eff 50 Best 11 1 19 20 75 167 113 038 42
50 34 High 21 1 35 24 83 135 295 045 112
COS 17 Deterministic inputs probabilistic STOIIP and Rec Resource Mean 56
Four way dip closed anticlinal structure The SS-4 interval has a
gross thickness over the crest area of 360 m Downlap of seismic
events across the crest of the SS-4 structure slightly downgrades
SS-4 seal The interval is believed to be Cenomanian in age and
the seismic character of generally planar events is interpreted as
representing thin bedded turbidites
Seismic Line Top Structure Map
2010 Migration Velocity Data ndash SS-4 Probability Above Spill
Enclosure 23 Summary Description Sheet
Summary - SS - 3Block A1
Working Interest () 60
Fluid Oil
Crest (m) 4590 (2370 bml)
Water depth (m) 2220
Notes
Play Risk Prospect Risk Area Stack F Net Porosity SO Bo STOIIP Rf Rec Res(Km2) (frac) (m) () () (rbstb) (MMstb) (frac) (MMstb)
Source 70 Trap 75
Seal 90 Mig 85 Low 12 1 20 15 68 227 197 025 63
Res Pres 80 Res Eff 50 Best 17 15 35 18 75 173 417 034 143
50 32 High 25 2 60 20 83 140 881 045 316
COS 16 Deterministic inputs probabilistic STOIIP and Rec Resource Mean 173
Four way dip closed anticlinal structure The SS-3 interval has a
gross thickness over the crest area of 550 m Seals to deeper
reservoirs may be eroded by overlying reservoirs From seismic
the prospective reservoir has been interpreted as being an Albian
deep water channel-lobe complex
Seismic Line Top Structure Map
2010 Migration Velocity Data ndashSS-3 Probability Above Spill
Enclosure 24 Summary Description Sheet
Summary - SS - 2Block A1
Working Interest () 60
Fluid Oil
Crest (m) 5140 (2920 bml)
Water depth (m) 2220
Notes
Play Risk Prospect Risk Area Stack F Net Porosity SO Bo STOIIP Rf Rec Res(Km2) (frac) (m) () () (rbstb) (MMstb) (frac) (MMstb)
Source 70 Trap 75
Seal 90 Mig 85 Low 12 1 20 11 68 231 187 025 58
Res Pres 80 Res Eff 50 Best 17 2 35 14 75 183 416 032 133
50 32 High 25 3 60 17 83 151 911 040 303
COS 16 Deterministic inputs probabilistic STOIIP and Rec Resource Mean 163
Four way dip closed anticlinal structure The SS-2 interval has a
gross thickness over the crest area of 830 m The prospective
reservoir has been interpreted as a stacked series of channellobe
sets Seals to deeper reservoirs may be eroded by overlying
reservoirs
Seismic Line Top Structure Map
2010 Migration Velocity Data ndashSS-2 Probability Above Spill
Enclosure 25 Summary Description Sheet
Summary - SS - 1Block A1
Working Interest () 60
Fluid Oil
Crest (m) 5970 (3750 bml)
Water depth (m) 2220
Notes
Play Risk Prospect Risk Area Stack F Net Porosity SO Bo STOIIP Rf Rec Res(Km2) (frac) (m) () () (rbstb) (MMstb) (frac) (MMstb)
Source 70 Trap 65
Seal 90 Mig 80 Low 17 1 20 8 50 249 158 015 34
Res Pres 80 Res Eff 50 Best 30 2 35 11 60 196 399 024 98
50 26 High 54 3 60 13 70 162 997 040 276
COS 13 Deterministic inputs probabilistic STOIIP and Rec Resource Mean 135
Four way dip closed anticlinal structureThe SS-1 interval has a
gross thickness over the crest area of 890 m The prospective
reservoir lies under an unconformity and is believed to be Jurassic
in age its seismic character suggests a channel amp channel-levee
complex Regional porosity trends indicate low porosities are likely
to be encountered if hydrostatic pressures are assumed
Seismic Line Top Structure Map
2010 Migration Velocity Data ndash SS-1 Probability Above Spill
Enclosure 31 Summary Description Sheet
SummaryBlock SL-03
APCL Interest () 90
Fluid Oil
Crest (m ss) 5400
Water depth (m) 3300
Notes
Play Risk Prospect Risk Area Areal NG Net Porosity SO Bo STOIIP Rf Rec Res(km2) (frac) (m) () () (rbstb) (MMstb) (frac) (MMstb)
Source 80 Trap 50
Seal 90 Mig 70 Low 11 070 29 15 73 205 218 030 79
Res Pres 90 Res Eff 80 Best 32 082 56 18 80 162 755 038 278
65 28 High 92 094 83 21 88 134 2473 045 938
COS 18 Mean 434
Altair is a Turonian turbidite channel prospects within the
SL-03 Block offshore Sierra Leone It is identified as a
stratigraphic trap with areal extents defined by amplitude
truncation and structural pinchout Recent discoveries in
nearby blocks confirm a working hydrocarbon system
(Venus-B1 Jupiter-1 and Mercury-1) The Sierra Leone
wells A-1 and A1-2 proved good reservoir and potential
source rocks Two distinct canyon systems feed erosive
channels at the break of slope An area net approach was
adopted using a pseudo-gradient volume SNA extraction to
constrain areal extent and define an areal NG to account
for lateral variability of sand distribution within the
reservoir
Arbitrary Dip Line Grad TWTGrad NRMS Extraction
Enclosure 41 Summary Description Sheet
SummaryBlock CI-513
APCL Interest () 90
Fluid Oil
Crest (m ss) 4200
Water depth (m) 2500
Notes
Play Risk Prospect Risk Area Areal NG Net Porosity SO Bo STOIIP Rf Rec Res(km2) (frac) (m) () () (rbstb) (MMstb) (frac) (MMstb)
Source 60 Trap 50
Seal 90 Mig 70 Low 11 070 20 17 73 181 179 030 65
Res Pres 90 Res Eff 80 Best 40 085 38 20 80 149 815 038 302
49 28 High 149 099 55 23 88 126 3474 045 1318
COS 14 Mean 569
Ayame is an Upper Cretaceous fan which mainly lies
ZLWKLQEORFNampRIIVKRUHampRWHparaYRLUHWLVLGHQWLILHGas a stratigraphic trap with areal extents defined by
amplitude truncation and structural pinchout The prospect
has very good amplitude support An area net approach
was adopted using pseudo-gradient volume SNA NRMS
extractions to constrain areal extent and define an areal
NG to account for lateral variability of sand distribution
within the reservoir for low and high case area polygons
These seismically defined polygons were then filled to
column heights of 200m and 800m respectively and used
to constrain the P90 and P10 area inputs of our
probabilistic simulation
Seismic Line
TWT Grad SNA Extraction
Ayame
Ayame West
dtdƐͿ
Ayame
Enclosure 42 Summary Description Sheet
SummaryBlock CI-513 amp Open
APCL Interest () 90 in CI-513
Fluid Oil
Crest (m ss) 4900
Water depth (m) 2700
Notes
Play Risk Prospect Risk Area Areal NG Net Porosity SO Bo STOIIP Rf Rec Res(km2) (frac) (m) () () (rbstb) (MMstb) (frac) (MMstb)
Source 60 Trap 50
Seal 90 Mig 70 Low 10 061 25 14 73 194 161 030 58
Res Pres 90 Res Eff 80 Best 30 080 47 18 80 159 585 038 216
49 28 High 93 099 69 21 88 134 2085 045 788
COS 14 Mean 352
A second prospect within the same reservoir interval was
identified and volumetrically assessed Ayame West is
separated from Ayame by a structural high isopach
thinning and amplitude dimming The prospect was
assessed in the same manner as Ayame with a but with
Low Case column height of 600m filling down to the point
at which amplitudes between the two fans brighten
allowing possible communication The upper end of the
Ayame West fan lies down-dip of Ayame and less than
1km away from the thinning low amplitude saddle between
the two prospects
Seismic Line
TWT Grad SNA Extraction
Ayame
West
Ayame West
dtdƐͿ
Ayame
Enclosure 43 Summary Description Sheet
SummaryBlock CI-513 CI-509
APCL Interest () 90 of CI-513
Fluid Oil
Crest (m ss) 4400
Water depth (m) 2500
Notes
Play Risk Prospect Risk Area Areal NG Net Porosity SO Bo STOIIP Rf Rec Res(km2) (frac) (m) () () (rbstb) (MMstb) (frac) (MMstb)
Source 60 Trap 40
Seal 90 Mig 70 Low 6 070 15 16 73 185 71 030 26
Res Pres 90 Res Eff 70 Best 23 084 28 19 80 152 320 038 118
49 20 High 92 098 42 22 88 129 1408 045 521
COS 10 Mean 237
This sheet refers to volumes associated with Blocks 513 and CI-509 Sassandra is an Upper Cretaceous fan
which straddles blocks CI-513 and CI-509 It is identified
as a stratigraphic trap with areal extents defined by
amplitude truncation and structural pinchout A single
target reservoir is identified within the Turonian The
prospect has good amplitude support An area times net
approach was adopted using a pseudo-gradient volume
NRMS extraction to constrain prospect size Angle stacks
were not available outside of Block CI-513 so an RMS
extraction on the full stack volume was used to determine
NW extent In our low case we restrict the area of the
accumulation to the brightest area of anomalous
amplitudes Our high case extends the prospect down-dip
Arbitrary Dip Line Grad TWT
Full Stack - RMS Extraction
Sassandra
dtdƐͿ
Enclosure 44 Summary Description Sheet
SummaryBlock CI-513
APCL Interest () 90
Fluid Oil
Crest (m ss) 3900
Water depth (m) 2500
Notes
Play Risk Prospect Risk Area Areal NG Net Porosity SO Bo STOIIP Rf Rec Res(km2) (frac) (m) () () (rbstb) (MMstb) (frac) (MMstb)
Source 60 Trap 40
Seal 90 Mig 70 Low 4 071 20 19 73 185 67 030 25
Res Pres 90 Res Eff 70 Best 13 085 38 22 80 152 281 038 104
49 20 High 46 099 55 25 88 129 1142 045 431
COS 10 Mean 190
Cavalla is an Upper Cretaceous Fan which lies between
the Ayame and Sassandra prospects of Block CI-513
RIIVKRUHampRWHparaYRLUHWLVLGHQWLILHGDVDVWUDWLJUDSKLFtrap with areal extents defined by amplitude truncation and
structural pinchout A single target reservoir is identified
within the TuronianCenomanian interval which lies
stratigraphically beneath the Ayame Prospect For the
amplitude analysis the top reservoir has been shifted up
30ms to bracket strong negative amplitudes on the
Gradient volume and the base reservoir has been shifted
up 50ms to remove Albian related amplitudes An area net
approach was adopted using pseudo-gradient volume SNA
NRMS extractions to constrain extent of the low and high
case area polygons These seismically defined polygons
were then filled to column heights of 200m and 800m
respectively
Arbitrary Dip Line Grad TWT Grad NRMS Extraction
Cavalla
dtdƐͿ
Enclosure 45 Summary Description Sheet
SummaryBlock CI-509
APCL Interest () 90
Fluid Oil
Crest (m ss) 3700
Water depth (m) 2500
Notes
Play Risk Prospect Risk Area Areal NG Net Porosity SO Bo STOIIP Rf Rec Res(km2) (frac) (m) () () (rbstb) (MMstb) (frac) (MMstb)
Source 60 Trap 60
Seal 90 Mig 70 Low 5 076 39 21 73 150 252 015 55
Res Pres 90 Res Eff 80 Best 18 088 75 24 80 134 997 028 258
49 34 High 61 100 111 27 88 121 3682 040 1039
COS 16 Mean 460
Leraba is an Upper Cretaceous fan It is identified as a
stratigraphic trap with extents defined by amplitude
truncation and structural pinchout The final processing
products and AvO volumes are yet to be delivered for CI-
KRZHYHUWKHmicroHRWUDFHUDZPLJUDWLRQVWDFNparaYROXPHLVof high quality and is deemed suitable for deriving a
volumetric range for Leraba An area net approach was
adopted using an RMS extraction to constrain extent and
define an areal NG to account for lateral variability of sand
distribution In our low case we restrict the area to the
brightest area of anomalous amplitudes Our high case
extends the prospect down-dip and SW to include a
secondary channel system
Arbitrary Dip Line TWT Full Stack RMS Extraction
Leraba
dtdƐͿ
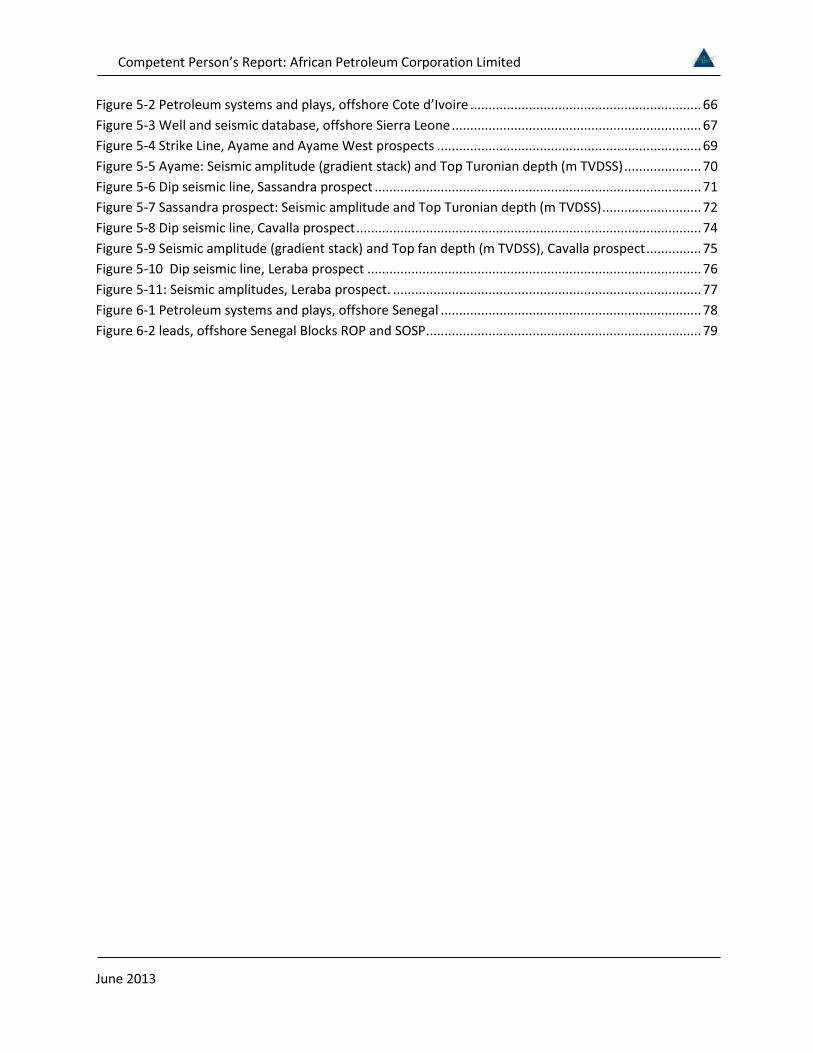
Competent Personrsquos Report African Petroleum Corporation Limited
June 2013
Figure 5-2 Petroleum systems and plays offshore Cote drsquoIvoire 66 Figure 5-3 Well and seismic database offshore Sierra Leone 67 Figure 5-4 Strike Line Ayame and Ayame West prospects 69 Figure 5-5 Ayame Seismic amplitude (gradient stack) and Top Turonian depth (m TVDSS) 70 Figure 5-6 Dip seismic line Sassandra prospect 71 Figure 5-7 Sassandra prospect Seismic amplitude and Top Turonian depth (m TVDSS) 72 Figure 5-8 Dip seismic line Cavalla prospect 74 Figure 5-9 Seismic amplitude (gradient stack) and Top fan depth (m TVDSS) Cavalla prospect 75 Figure 5-10 Dip seismic line Leraba prospect 76 Figure 5-11 Seismic amplitudes Leraba prospect 77 Figure 6-1 Petroleum systems and plays offshore Senegal 78 Figure 6-2 leads offshore Senegal Blocks ROP and SOSP 79
Competent Personrsquos Report African Petroleum Corporation Limited
June 2013 14
1 Introduction
At the time of writing African Petroleum Corporation Limited (APCL) holds interests in and operates exploration licences offshore West Africa within the territorial waters of Senegal the Gambia Sierra Leone Liberia and Cote drsquoIvoire (Figure 1-1) The status of these licences is summarised in Table 11 below ERC Equipoise Ltd (ERCE) has reviewed the prospectivity of these licences using data as of 31st May 2013
Figure 1-1 Location of APCL licences West Africa
Currently prospective resources are identified by APCL within the Liberia Gambia Sierra Leone and Cote drsquoIvoire licences We have made independent estimates of prospective resources and geological chance of success for certain prospects within these countries which are identified by APCL as near-term drilling opportunities The evaluation of the offshore Senegal licences is on-going and no prospects have been identified as of the date of this report We summarise qualitatively the prospectivity of the licences held by APCL in this country
Competent Personrsquos Report African Petroleum Corporation Limited
June 2013 15
Country Block Licence
Operator APCL () Status
Licence
Area (km2)
Outstanding Commitment in this Phase
Start of Current Phase
End of Current Phase
Liberia 8 APCL 100 Expl June 2012
June 2014
2717 Two
Exploration wells
Liberia 9 APCL 100 Expl June 2012
June 2014
2634 None
Gambia A1 APCL 60 Expl Dec
2007 Dec
2013 1296
One Exploration
well 1
Gambia A4 APCL 60 Expl Dec
2007 Dec
2013 1376 (see A1)
Senegal Rufisque Offshore Profond
APCL 90 Expl Oct
2011 Oct
2015 10357
One exploration
well
Senegal
Senegal Offshore
Sud Profond
APCL 90 Expl Oct
2011 Oct
2014 7920 None
Sierra Leone
SL-03 APCL 100 Expl Feb
2011 Feb
2014 3860 None
Sierra Leone
SL-04A APCL 100 Expl Sept 2012
Sept 2015
1995 One
exploration well 2
Cote drsquoIvoire
CI-509 APCL 90 Expl March 2012
March 2015
1091 One
exploration well
Cote drsquoIvoire
CI-513 APCL 90 Expl Dec
2011 Dec
2014 1446
One exploration
well
1) Transferrable to Block A4 if necessary 2) Contingent on results of 3D and that technology is available to drill in such water depths
Table 11 Licence Summary Table
Competent Personrsquos Report African Petroleum Corporation Limited
June 2013 16
11Liberia PSC Overview
APCL holds a 100 contractor interest in a Production Sharing Contract (ldquoPSCrdquo) covering Blocks 8 amp 9 offshore Liberia (Figure 1-2) Both blocks are in their second exploration period which began on 12th June 2012 and lasts for two years Commitments during the second phase in Block 8 are two exploration wells (to a minimum depth of 2000 meters) as a well commitment from the first exploration phase has been carried into the second phase All commitments have been met for the second phase in Block 9 with the drilling of Well Bee Eater-1 The minimum spend for each block in the second exploration period is US$ 10 MM At the end of this second phase a further 25 of each licence must be relinquished
Figure 1-2 Location of Liberia Blocks 8 and 9
For each block there is one further optional exploration period of two years that can be entered into with an additional well (to a minimum of 2000 metres) being required in each block in each period At the end of the third period all areas not retained for appraisal and development are to be relinquished There are also provisions for an appraisal period and an exploitation period of 25 years (with an additional term of 10 years if necessary) for each development area
Competent Personrsquos Report African Petroleum Corporation Limited
June 2013 17
Following a 25 relinquishment at the end of the first exploration phase Block 8 comprises an area of 2717 km2 and Block 9 comprises 2634 km2 Water depths range from less than 100 m to over 3000 m Most of the block areas lie in water depths greater than 500 m
12Gambia PSC Review
APCL holds a 60 contractor interest in Production Sharing Contracts covering Blocks A1 and A4 offshore Gambia (Figure 1-3) with Buried Hill Gambia BV holding the remaining 40 The licences were signed on 8th September 2006 with an effective date of 31st December 2007 and following two extensions they are still currently in the first exploration period which runs through to 31 December 2013
The work commitment during the first period comprises 1000 km2 of 3D seismic data in Block A1 and 750 km2 of 3D seismic data in Block A4 and one well which may be drilled in either block The seismic commitment has already been met
There are two further optional (but automatic) exploration periods of three years each that can be entered into with a well being required in each period in each licence Furthermore in Block A1 relinquishment of 10 of the licence area is required at the end of the first exploration period and 20 at the end of the second period In Block A4 relinquishment of 10 of the licence area is required at the end of the first exploration period In both blocks at the end of the third period all areas not retained for appraisal and development are to be relinquished There are also provisions for an exploitation period with the total term of the licences being 30 years (including the exploration periods) for each development area
The area of the licence is 1296 km2 for Block A1 and 1376 km2 for Block A4 Water depths vary from 500 m to over 3000 m
Figure 1-3 Location of Gambia Blocks A1 and A4
Competent Personrsquos Report African Petroleum Corporation Limited
June 2013 18
13Senegal PSC Review
APCL holds a 90 contractor interest in Exploration and Production Sharing Contracts (EPSC) covering Blocks Rufisque Offshore Profond (ROP) and Senegal Offshore Sud Profonde (SOSP) offshore Senegal (Figure 1-4) via its wholly owned subsidiary African Petroleum Senegal Limited Petrosen the state oil company hold a 10 carried interest
The EPSC governing block SOSP has an effective date of 25th October 2011 The first 85 years of the EPSC are termed the exploration phase which is subdivided into an initial period of three years with two subsequent extension periods of three and two and a half years each Work commitment in the initial exploration period is to acquire and reprocess the existing seismic data within the licence area and also to acquire a further 2500 km2 of 3D seismic data all with a minimum investment of US$ 10 MM The two extension periods have a commitment of one exploration well to a minimum depth of 3500 mss in each period or a minimum investment of US$ 20 MM Entry to the first extension period requires a 30 relinquishment of the licence area and a further 20 of the initial licence area must be relinquished on entry to the third phase The area of the licence is currently 7920 km2 Water depth is between 1000 and 4000 m over the block
Figure 1-4 Location of Senegal ROP and SOSP Licences
Competent Personrsquos Report African Petroleum Corporation Limited
June 2013 19
The EPSC governing Block ROP is of similar structure to that governing Block SOSP It has an effective date of 25th October 2011 The first eight years of the EPSC are termed the exploration phase which is subdivided into an initial period of four years with two subsequent extension periods of two years each Work commitment in the initial exploration period is to acquire the existing seismic data within the licence area for a minimum of US$ 2 MM and drill one exploration well to a minimum depth of 3500 m TVDSS or a minimum investment of US$ 20 MM The two extension periods have a further commitment of one exploration well to a minimum depth of 3500 m TVDSS in each period or a minimum investment of US$ 20 MM Entry to the first extension period requires a 30 relinquishment of the licence area and a further 20 of the initial licence area must be relinquished on entry to the third period The area of the licence is currently 10357 km2 Water depth is between 1500 and 3000 m over the block
APCL has met the seismic commitment of the first exploration period
Petrosen has a back-in right if an exploitation period is authorised for up to 20 of the licence subject to contribution of its share of forward costs (excluding training) The duration of an exploitation period is 25 years from authorisation with option for two ten year extensions at the discretion of the state
14Sierra Leone PSC Review
APCL holds a 100 contractor interest in a PSC covering Block SL-03 offshore Sierra Leone (Figure 1-5) through its wholly owned subsidiary European Hydrocarbons Ltd The licence was awarded on 23rd April 2010 and ratified on 22nd February 2011 APCL also holds a 100 contractor interest in a PSC covering Block SL-04A through its wholly owned subsidiary African Petroleum Sierra Leone Ltd The PSC governing Block SL-04A was ratified on 21st September 2012
The SL-03 licence has a duration of thirty years the first seven of which are termed the exploration period which is further subdivided into an initial period of three years followed by two extension periods of two years each The licence is currently in the initial exploration period
Work commitments during the initial period for Block SL-03 are to purchase and interpret the existing 2D seismic data over the licence and acquire a minimum of 500 km2 of 3D seismic data APCL has purchased the 2D seismic data and has acquired 2535 km2 of multi-client 3D seismic data over Block SL-03 fulfilling the seismic commitment for the initial phase The first and second extension periods require the drilling of one exploration well to a minimum depth (below mud line) of 1300 m or a minimum equivalent investment of US$ 30 MM Entry to the first extension period requires a 50 relinquishment of the licence area and a further 25 of the initial licence area must be relinquished on entry to the second extension period The area of the licence is 3860 km2 and water depth varies from 100m to over 4000m with the south-western half of the block being at water depths greater than 3000m
Competent Personrsquos Report African Petroleum Corporation Limited
June 2013 20
Figure 1-5 Location of Blocks SL-03 and SL-04A
The PSC covering Block SL-04A was ratified on 21st September 2012 The licence term is for thirty years the first seven years of which are defined as the exploration period which is further subdivided into an initial period of three years and two subsequent periods of two years Each well drilled in the initial exploration period extends this period by three months Work commitments during the initial phase are to acquire at least 1500 km2 of 3D seismic data and drill one exploration well (to a minimum depth of 2500m) contingent on the results of the 3D and the availability of drilling technology for such deep water The minimum equivalent investment is US$ 10 MM In 2011 TGS acquired 1085 km2 of multi-client 3D seismic data over Block SL-04A Upon licencing these data APCL will have fulfilled the seismic commitment for the initial phase
The subsequent two exploration periods require the drilling of one exploration well in each period (to a minimum depth of 2500 m) or a minimum investment of US$ 50 MM Entry to the second period requires a 50 relinquishment of the licence area and a further 25 of the initial licence area must be relinquished on entry to the third phase The area of the licence is currently 1995 km2 Water depth is between 3000 and 4000 m over the block
Competent Personrsquos Report African Petroleum Corporation Limited
June 2013 21
The state retains the right to a 10 carried interest during any development phase in both licences with the option to acquire a further 5 by covering an equivalent proportion of any development costs
15Cote13 drsquoIvoire13 PSC13 Review
APCL holds a 90 per cent contractor interest in two PSCs governing Block CI-509 and Block CI-513 offshore Cote drsquoIvoire (Figure 1-6) via its wholly owned subsidiary African Petroleum Cote drsquoIvoire Limited The state oil company Petroci has a 10 carried interest
Figure 1-6 Location of Blocks CI-509 and CI-513
The PSC for Block CI-509 was awarded on 16th March 2012 The first eight years of the PSC are termed the exploration period which is further divided into three terms of three three and two years respectively The licence is currently in its first exploration term Work commitments during the first exploration term are to purchase the existing 2D seismic data acquire 1091 km2 (ie a block wide) 3D seismic survey and drill one exploration well at least 100 m into the Albian (Lower Cretaceous) section The minimum investment is US$ 60 MM The second and third terms have a further commitment to drill one exploration well to at least 100 m into the Albian (Lower Cretaceous) section with a minimum investment of US$ 50 MM Entry to the second term requires a 25 relinquishment of the licence area and a further 25 of the initial licence area must be relinquished on entry to the third term The area of the licence is currently 1091 km2 Water depth is between 1900 and 3250 m over the block
Competent Personrsquos Report African Petroleum Corporation Limited
June 2013 22
The PSC covering Block CI-513 has an effective date of 19th December 2011 It has a similar structure to that governing Block CI-509 The first seven years are termed the exploration period subdivided into three terms of three two and two years The licence is currently in its first exploration term Work commitments during the first exploration term are to purchase the existing 2D seismic data acquire 1446 km2 (ie a block wide) 3D seismic survey and drill one exploration well at least 100 m into the Albian (Lower Cretaceous) section The minimum investment is US$ 60 MM The second and third terms have a further commitment to drill one exploration well to at least 100 m into the Albian (Lower Cretaceous) section with a minimum investment of US$ 50 MM Entry to the second term requires a 25 relinquishment of the licence area and a further 25 of the initial licence area must be relinquished on entry to the third term The area under licence is currently 1446 km2 Water depth is between 900 and 3100 m over the block
The exploitation period of both licences is for 25 years subject to successful award in the event of a commercial discovery On development Petroci has the right to acquire an interest of up to 20 in each licence subject to payment of its portion of future costs
In October 2012 APCL completed acquisition of 4200 km2 of 3D seismic data covering blocks CI-508 CI-509 and CI-513 fulfilling the seismic work commitments of the first exploration phase of both PSCs APCL is planning a two well drilling programme for the licences during 2014
16Evaluation Methodology Prospective Resources
We have used probabilistic methods to evaluate selected prospects within Liberia Blocks 8 and 9 Gambia Blocks A1 and A4 Sierra Leone Block SL-03 and Cote drsquoIvoire Blocks CI-513 and CI-509 We classify the results of our simulation as Low Best and High estimates of prospective resources following the Petroleum Resources Management System or PRMS (Appendix 1) We have assigned geological chance of success to each of the prospects using the methodology described below Estimates are made for oil only although we recognise that due to the significant uncertainties in the available geological information that there is a possibility of gas charge in all licences We present a summary of input estimates output STOIIP and gross resources and geological chance of success as a resource summary sheet for each prospective interval investigated These can be found in the enclosures 11 to 45 in this document
Inputs to our probabilistic simulation are evaluated in a consistent manner For the structurally trapped prospective intervals in Liberia (the Lovebird and Wildbird prospects) and the Alhamdulilah prospect in Gambia we have made a low and high deterministic estimate of closing contour for each trap to reflect the uncertainty in both mapping and depth conversion For Liberia we use the gross-rock volume (GRV) derived in this manner to constrain the P90 and P10 of our GRV distribution in our probabilistic simulation For Gambia we have used the areal extents of the low and high cases as inputs to an area times net calculation
Competent Personrsquos Report African Petroleum Corporation Limited
June 2013 23
For the stratigraphically trapped prospects in Liberia (Barbet Night Heron and Sunbird) Cote drsquoIvoire (Sassandra Ayame Ayame West Cavalla and Leraba) and Sierra Leone (Altair) we have made low and high estimates of area of closure using both structural and amplitude support where possible We have then made low and high estimates of gross reservoir thickness derived from regional observations calibrated against seismic data where possible As such depositional systems also have laterally variable sand distributions often supported by seismic data we employ the concept of an areal net to gross ratio varying the percentage of sand areally within the overall stratigraphic trap based on the uncertainty in seismic amplitude strength Where appropriate a geological shape factor is used depending on trap shape and structural relief relative to reservoir thickness
Estimates of reservoir porosity and net to gross ratio are made with reference to regional data offset wells including recent drilling by APCL in Liberia and account for compaction and a degree of overpressure (Figure 2-4) We make low mid and high deterministic estimates and use these to constrain the P90 P50 and P10 inputs to a probabilistic simulation Inputs for hydrocarbon saturation are constrained in a similar manner with reference to regional porosity and permeability trends calibrated to APCLrsquos recent drilling results in Liberia
We have estimated oil formation volume factors for a range of gas oil ratios (GOR) (from an appropriate minimum to fully saturated) for each of the prospective intervals assuming 4oC at the mudline (seabed) and geothermal gradients between 25 and 35oC per 100 m consistent with regional observation and the available well data We assume that the minimum GOR will increase with depth below the mudline Our estimates are calibrated against the oil samples in Well Narina-1 when estimating resources for the Liberian prospects
Some degree of overpressure is accounted for as it has been in our estimates of porosity but by reference to offset discoveries we assume that it is unlikely to exceed 500 psi over the depth range investigated
Recovery factors for the clastic reservoirs are estimated with reference to published information from discoveries in similar reservoir types examples of which are tabulated below (Table 12) Based on this table we estimate low best and high recovery factors of 30 375 and 45 respectively Again these are used to constrain the P90 P50 and P10 of our input distribution during probabilistic simulation
Some prospects are deep relative to mud line and we expect reservoir quality to be reduced despite overpressure We reduce our recovery factor estimates accordingly where this is the case Some prospects are relatively shallow to mud line Where this is the case we model a more viscous oil (prospects materially less than 1500m below sea bed) and have reduced our low best and high recovery factor range to 15 275 and 40 respectively In all cases we assume that a development is able to effectively dispose of any associated gas
Recovery factors for the carbonate reservoirs of the Wildbird prospect in Liberia and Prospect M in the Gambia are estimated by reference to more regional analogues and are discussed in the relevant sections
Competent Personrsquos Report African Petroleum Corporation Limited
June 2013 24
Due to the early stage of exploration within APCLrsquos licences we have adopted a six component risk matrix in all areas barring Liberia to estimate geological chance of success (COS) separated into play and prospect specific risks (Table 13) We have adopted this form of presentation of COS to reflect the fact that deep water exploration in much of the West African Atlantic Margin is at a very early stage and also that a number of the identified prospects have risk dependence and thus can be grouped as a play
Table 12 Estimated oil recovery factors from producing Atlantic Margin fields
PLAY RISK PROSPECT RISK
SOURCE RESERVOIR SEAL TRAP CHARGE RESERVOIR (Presence and Maturity) (Presence) (Presence) (Definition and Efficacy) (Migration) (Efficacy) Incorporates trap definition and seal risk (including biodegradation risk where necessary)
Table 13 Play and prospect risk system
The play risk segment focuses solely on the elements required in a given play to make a hypothetical prospect successful source reflecting the presence and thermal maturity of available source rocks with sufficient generation and expulsion to charge prospects reservoir reflecting the presence regionally of geological intervals that could potentially contain reservoir rock and seal ndash the regional presence of a sealing formation with sufficient thickness and extent to trap hydrocarbons
Prospect risk is divided into three elements Commonly we present seal and trap risk combined as an overall illustration of the integrity of the container here labelled trap risk Charge risk reflects the risk to migration of hydrocarbons from the source rock into the prospect and reservoir risk reflects solely the efficacy (ie porosity and permeability) of any identified reservoir interval
Note that a successful well on a given prospect may reduce or remove the play risk should the well prove reservoir charge and seal in a given play This will have the effect of de-risking further prospects associated with that play
Country Field Start Date Np Max Water Depth Prod Ult
RecoveryRec
FactorRecovery
Prod STOIIP
(MMstb) (m) (MMstb) (MMstb) (MMstb)Eq Guinea Ceiba Nov-00 112 800 18 187 40 10 468Eq Guinea Zafiro Aug-96 652 850 62 1583 40 26 4008Angola Girassol Dec-01 332 1360 32 958 45 30 2129Angola Kuito Dec-99 133 410 36 650 46 18 1413Brasil Espadarte Aug-00 67 877 10 261 31 26 842Brasil Marlim Mar-91 1720 853 101 2878 33 28 8721Total 259 6517 17580Average - Arithmetic 39 23Average - Weighted by STOIIP Ult Rec 37 25
Low Best High30 375 45
Fields on Atlantic Margin with significant production
Hence RF Range
Competent Personrsquos Report African Petroleum Corporation Limited
June 2013 25
Recent drilling within Liberia Blocks 8 and 9 has de-risked the play As a result we adopt prospect specific risking alone as source reservoir trap and seal with the same definitions as described above (Table 13)
Competent Personrsquos Report African Petroleum Corporation Limited
June 2013 26
2 Liberia Prospectivity and Plays
21Introduction
All of the available deep-water acreage offshore Liberia-Sierra Leone basin is under licence (Figure 1-2) Regionally hydrocarbons have been discovered within sandstones at a number of stratigraphic levels from the pre-rift to early syn-rift Albian in Cote drsquoIvoire (Espoir Foxtrot fields and a number of other discoveries) to turbiditic sandstones that have Late Cretaceous (CenomanianTuronian MaastrichtianConiacian) to early Tertiary (Palaeocene to Eocene) ages Recent drilling offshore Ghana has yielded a number of discoveries within these Upper Cretaceous sandstones such as the Jubilee oil field and the Enyenra Tweneboa and Odum oil and gascondensate discoveries In the Liberia-Sierra Leone basin recent drilling has yielded six hydrocarbon discoveries (Bee Eater Narina Monterrado Mercury Venus and Jupiter) but as yet none has been declared commercial (Figure 2-1) Although reservoir quality in the Albian sandstones is variable reservoir quality in the Upper Cretaceous and Tertiary sandstones is often good Successful trap types encountered regionally are both structural and stratigraphic
Of significance to the evaluation of the petroleum systems of Blocks 8 and 9 APCL have drilled three wells within the deeper water parts of the blocks Wells Apalis-1 Narina-1 and Bee Eater-1 Well Apalis-1 found source rock intervals of Albian to Cenomanian age but failed to find the prognosed reservoir Well Narina-1 found light oil within deep-marine sandstones of Cretaceous age The sandstones were of variable reservoir quality as the well appears to have been drilled on the edge of a fan system which can be interpreted from seismic data The extent of the Turonian hydrocarbon bearing interval around Well Narina-1 is currently under investigation by APCL who are working with CGGV to reprocess the 3D multi-client seismic with the hope of identifying areas of favourable reservoir within closure
Well Bee Eater-1 completed in February 2013 also discovered hydrocarbons within similar sandstones of Cretaceous age However the oil bearing Turonian reservoir at Bee Eater is interpreted as being of very low permeability and hence non-commercial APCL interprets that Well Bee Eater-1 was drilled in a canyon system that may have been largely bypassed by sediment input
Both wells demonstrate the viability of Cretaceous petroleum systems within the licence area
Competent Personrsquos Report African Petroleum Corporation Limited
June 2013 27
Figure 2-1 Notable discoveries West Africa offshore
22Well and Seismic Database
Exploration offshore Liberia is at an early stage To date five wells have been drilled in the deeper water areas in 2011 and 2012 with historical exploration drilling (up to 1985) restricted to the more shelfal areas (Figure 2-2) Data from two of these shallow water wells Wells S3-1 and Cestos-1 were made available to us for this evaluation Well S3-1 encountered oil shows in sandstones of Late Cretaceous age
GhanaJubilee Field on
production development of TEN area discoveries
new Hess deepwater discoveries
Cote drsquoIvoireShallow water production
recent discoveries in deepwater Turonian
reservoirs
LiberiaOil discoveries in
Cretaceous deepwater reservoirs at Narina
Monserrado
Sierra LeoneVenus Mercury and Jupiter
oil and condensate discoveries in deepwater
reservoirs
Guinea-COil shows in
offshore wells
Guinea-BSinapa oil discovery
planned appraisal
AGCDome Flore area heavy oil
discoveries under development review
SenegalOnshore gas and condensate production Recent onshore
Turonian discovery
MauritaniaChinguetti Field
production other oil and gas discoveries under development review
Competent Personrsquos Report African Petroleum Corporation Limited
June 2013 28
Figure 2-2 Well and seismic database Liberia Blocks 8 and 9
APCL has drilled three exploration wells offshore Liberia in the deep water part of Block 9 Wells Narina-1 Bee Eater 1 and Apalis-1 (Figure 1-2 Figure 2-2) Well Apalis-1 was drilled in 2011 targeting a four-way dip-closed structure with possible AvO support The well found traces of hydrocarbons plus source rock intervals but the prognosed reservoir sands were absent at target depth and the well was plugged and abandoned
Well Narina-1 was drilled by APCL in 2012 and found 16 to 21 m of net pay (light oil) within sandstones of Turonian (Cretaceous) age Hydrocarbons were also discovered in the underlying Albian Oil samples were collected but no drill-stem testing was undertaken Analysis of the oil samples indicates an API
3D Seismic Area
Competent Personrsquos Report African Petroleum Corporation Limited
June 2013 29
gravity for the Turonian oil of about 38 degrees and about 45 degrees for the Albian hydrocarbons Mobilities from formation pressure measurements and permeability from side-wall core measurements show the reservoir to be of relatively low permeability at this location
Well Bee Eater-1 was drilled by APCL in January and February 2013 The well found oil-bearing sandstones of Cretaceous age but of very low permeability and hence the well is considered non-commercial Post-drill interpretation of the seismic data has helped APCL revise the depositional model for this Turonian fan system The Bee Eater-1 well is interpreted to have encountered a bypass zone in both the Turonian and Cenomanian with immature sandstones that are poorly sorted and tight Post-well mapping of key seismic events tied to Well Bee Eater-1 reveals the possibility of finding better quality sandstones in lsquobasin-floor fanrsquo units down-dip Potentially sealing shale units and source rock units were also found in the Bee-Eater-1 well
Well Apalis-1 and in particular Wells Bee Eater-1 and Narina-1 help de-risk seal and hydrocarbon charge for the Cretaceous play on-block
The primary seismic dataset for our evaluation was the recently acquired 5170 km2 of 3D seismic data over the deeper water area of Blocks 8 and 9 including certain products to review amplitude versus offset (AvO) effects These seismic data cover both recently drilled deep water wells In addition a grid of 2D seismic data was also made available with average line spacing of around 45 km These data provide a tie to Well S3-1 although the well lies some 200m from the nearest seismic line In general the data quality of the 3D volume is good and of suitable fidelity to enable us to undertake our review of identified prospectivity However local complexity in the shallow geology causes the signal to degrade considerably at the prospective levels in certain areas APCL are currently reprocessing these data in an attempt to improve signal quality APCL intend to utilise this dataset to update the CPR in the next 3-6 months It is hoped that these data will support maturation of additional prospects and further clarification of risk and volumes for prospects within this CPR
23Plays and Petroleum Geology Blocks 8 and 9
APCL has identified a number of plays within Blocks 8 and 9 at similar stratigraphic levels to those proven successful elsewhere along the West African margin (Figure 2-3) Recent drilling within Blocks 8 and 9 has demonstrated a working petroleum system within the mid to lower Cretaceous with drilling finding light oil within deep marine sandstones of Turonian age and also in sandstones of Albo-Aptian age
Competent Personrsquos Report African Petroleum Corporation Limited
June 2013 30
Figure 2-3 Petroleum systems and plays Liberia Blocks 8 and 9
Structural traps are identified at the pre-rift to early syn-rift (Albian) level as tilted fault blocks with hydrocarbons sourced from the Albian or Lower Cretaceous source rocks and seal provided by post-rift mud drape Structural and stratigraphic traps are also identified at several potential reservoir levels within the Late Cretaceous and Lower Tertiary again potentially sourced from the Turonian and or Albian source rocks Traps are sealed by coeval marine shales and muds As is encountered regionally there is reasonable seismic evidence for the presence of reservoir bearing intervals within the Upper Cretaceous and Early Tertiary section and this seismic evidence has been used in trap definition
The most significant play in the area is that of Cenomanian to Turonian age deep-marine channel-fan systems as structural and stratigraphic traps In addition an emerging lower Cretaceous microbial carbonate reservoir play has been identified sourced from coeval lacustrine source rocks and sealed by shales deposited during the subsequent drowning of the lacustrine systems by the onset of significant subsidence and marine inundation later in the Cretaceous We have evaluated prospects within both of these play systems Prospectivity in the shallower Cretaceous and Tertiary intervals is still being re-evaluated by APCL as of the date of this report and no leads have been matured to prospect status
Oil show Cestos-1
Competent Personrsquos Report African Petroleum Corporation Limited
June 2013 31
Figure 2-4 Porositydepth trend published West Africa turbidite reservoirs
24Play and Prospect Risk Liberia Blocks 8 and 9
Of the prospects reviewed all but the Wildbird prospect fall within the Cenomanian to Turonian channelfan play In our opinion recent drilling has de-risked source and reservoir presence for this play However reservoir quality in recent wells is variable In our risking of Cenomanian to Turonian prospectivity (Barbet Sunbird Lovebird and Night Heron prospects) we have removed the play element to our risking matrix and see a low risk to hydrocarbon charge for individual prospects Key risk is therefore to trap integrity and reservoir quality We use a four component risk matrix as outlined in Section 16 to define geological chance of success for these prospects
The Wildbird prospect has been recently identified by APCL as part of its review of further play fairways within the Liberian licences The play concept is of early Aptian bio-constructed carbonate build-ups within the restricted lacustrine environment that existed at this time Porosity and permeability within the bioclastic microbial limestones is potentially enhanced by hydrothermal activity resulting from the early rifting Later post-rift subsidence and drowning by marine conditions provides the top seal via the
0
500
1000
1500
2000
2500
3000
3500
4000
0 01 02 03 04m
Bel
ow S
eabe
dPorosity (fraction)
Porosity versus Depth Trend
Regional West AfricaTurbidite Data
Competent Personrsquos Report African Petroleum Corporation Limited
June 2013 32
deposition of Cretaceous marine muds It is envisaged that the play is charged or by Aptian source rocks deposited in the offset lagoonal facies with possible charge from later (but on-lapping) Cretaceous marine source rocks (as other plays on the blocks) Both potential source rocks provide lateral seal (Figure 2-16) Regionally lacustrine microbial carbonate reservoirs can be found in Congo and Angola where there is some production but also in the Campos and Santos basins in Brazil
The microbial carbonate play is emerging within Blocks 8 and 9 and has not been demonstrated to be effective by drilling We adopt the play and prospect risking as discussed in Section 16 to risk the Wildbird prospect as a result discounting biodegradation risk as the prospect is at significant depth Our estimate of play risk for the Cretaceous microbial carbonate play is summarized in below
PLAY Source Reservoir Presence Seal Play
Risk Cretaceous Carbonate 08 06 05 20
Table 21 Play risk Cretaceous carbonate play Liberia Blocks 8 and 9
Competent Personrsquos Report African Petroleum Corporation Limited
June 2013 33
25Liberia Blocks 8 and 9 Leads and Prospects
Following the drilling of Wells Narina-1 and Bee Eater-1 APCL is re-evaluating the prospectivity within Blocks 8 and 9 and has developed a number of potential traps (Figure 2-5) several of which (marked in orange Figure 2-5) have been matured to prospect status We have assessed the prospective resources for certain of these prospects that APCL has identified as viable near-term drilling opportunities Barbet Sunbird Lovebird Night Heron and Wildbird A number of the prospects have multiple reservoir targets Our evaluation of these prospects follows the methodology described in Section 16 The results of Wells Narina-1 and Bee Eater-1 would indicate that oil charge is probable and thus only oil cases have been evaluated However as we state in Section 16 a gas charge cannot be discounted due to the uncertainties in source rock evaluation and basin modelling Input parameters STOIIP prospective resources and geological chance of success for each of the evaluated prospects are summarised in Table 1 of this report and are also presented in the resource summary sheets as Enclosures 11 to 19 of this document
Figure 2-5 Leads and Prospects Liberia Blocks 8 and 9
Competent Personrsquos Report African Petroleum Corporation Limited
June 2013 34
ʹǤͷǤͳǤ Barbet Prospect
The Barbet prospect is identified as a stratigraphic trap around 14 km to the east of and up-dip from Well Narina-1 within Block 9 (Figure 2-6) A single target reservoir is mapped within the Turonian Seismic amplitude anomalies are also identified within the area of the trap that may provide support for reservoir development The Turonian is mapped at between 3000 and 3600 m TVDSS over the area of the prospect in a water depth of around 750 to 770 m
Figure 2-6 Seismic line - depth (m TVDSS) over the Barbet prospect
We have used an areanet pay methodology to estimate prospective resources for the Barbet prospect In our low case we restrict the area of the accumulation to the brightest area of anomalous amplitudes on the far offsets Our high case extends the prospect down-dip to include a larger area of anomalous amplitudes above an observed amplitude shut-off (Figure 2-7) These are used to constrain the P90 and P10 inputs of our probabilistic simulation These polygons approximate to an oil column height of 200 and 700 m respectively
Amplitudes are variable within the area of closure and we apply an areal net to gross ratio to better constrain sand distribution within the trap Gross reservoir thickness estimates are computed from the mapped seismic interval net to gross ratio from regional analogue and porosity from a regional porositydepth trend (Figure 2-4) Fluid parameters and recovery factors are estimated as described in Section 16
Narina-1 Barbet
Top Turonian
Top Cenomanian
Top Albian
Lwr Turonian (BFF)
Top Turonian
Narina-1
Apalis-1
Albian UC
0 km 2(mss)
W E
Competent Personrsquos Report African Petroleum Corporation Limited
June 2013 35
Figure 2-7 Barbet far offset amplitudes with Top Turonian depth contours (m TVDSS)
We have used the prospect risk matrix presented in Section 16 to determine the geological chance of success for the Barbet prospect Key risk to the Barbet prospect is to trapcontainment as the trap requires pinch-out of the reservoir in three directions to seal There is also a subsidiary risk to reservoir as the Turonian reservoir encountered in Well Narina-1 is of relatively poor quality which is countered by seismic evidence over the prospect to support reservoir development As a result we attribute a geological chance of success of 22 to the Barbet prospect
metres
P10
P90metres
APALIS-1
Competent Personrsquos Report African Petroleum Corporation Limited
June 2013 36
ʹǤͷǤʹǤ Sunbird Canyon Prospect
The Sunbird canyon prospect is also identified as a stratigraphic trap around 5 km to the south of Well Apalis-1 within Blocks 8 and 9 mapped as a large canyon system There are three potential reservoir targets within the prospect within the Campanian the Turonian (as encountered in Well Narina-1) and in the underlying Cenomanian Reservoir is prognosed at between 3000 m TVDSS and 3600 m TVDSS in a water depth of around 1300 m
Figure 2-8 Regional seismic line along axis of the Sunbird canyon system
We have used an areanet pay methodology to estimate prospective resources for the Sunbird canyon prospect At all three prospective layers the prospect divides into two discrete lsquocanyonsrsquo separated by an intra-basinal high (eg Figure 2-9) For the Campanian and Turonian prospective intervals in the low case we restrict the area of the accumulation to the brightest area of anomalous amplitudes on the far offsets in the northerly of the two canyons where amplitude response is better Our high case extends the prospect down-dip to include a larger area of anomalous amplitudes above an observed amplitude shut-off and also includes the southerly of the two canyons as this would now be in charge communication The low and high case polygons approximate to an oil column height of 200 m and 600 m respectively
Albian uc
LB-08LB-09
LB-08
LB-09
Albian UC
Sunbird
0 km 4
NESW
Competent Personrsquos Report African Petroleum Corporation Limited
June 2013 37
For the deeper Cenomanian the prospect is mapped as a single canyon to the south of the intra-basinal high The low and high case polygons approximate to an oil column height of 200 m and 700 m respectively Our low and high estimates of area are used to constrain the P90 and P10 of our probabilistic simulation
Figure 2-9 Sunbird Campanian far offset amplitudes with Cenomanian depth contours (m TVDSS)
Amplitudes are variable within the area of closure and we apply an areal net to gross ratio to better constrain sand distribution within the trap for all three prospective layers Gross reservoir thickness estimates are computed from the mapped seismic interval net to gross from regional analogue and porosity from the observed porositydepth trend (Figure 2-4) Fluid parameters and recovery factors are estimated as described in Section 16
metres
P90
P10
Block 9
Block 8
APALIS-1
Competent Personrsquos Report African Petroleum Corporation Limited
June 2013 38
Figure 2-10 Sunbird Turonian far offset amplitudes with Top Turonian depth contours (m TVDSS)
We have used the prospect risk matrix presented in Section 16 to determine the geological chance of success for the three prospective intervals of the Sunbird prospect Key risk to all three prospective layers is to trapcontainment as the trap requires pinch-out of the reservoir in three directions to seal There is also a subsidiary risk to reservoir at the two deeper levels as the Turonian reservoir encountered in Well Narina-1 is of relatively poor quality and Cenomanian reservoirs are yet to be proven on block However there is seismic evidence for reservoir development and hence we see this risk as favourable Reservoir risk is low for the Campanian as it is developed in the offset Well Narina-1 and there is seismic evidence for reservoir presence As a result we attribute a geological chance of
P90
P10
metres
Block 9
Block 8
APALIS-1
Competent Personrsquos Report African Petroleum Corporation Limited
June 2013 39
success of 27 19 and 18 to the Campanian Turonian and Cenomanian prospective intervals of the Sunbird canyon prospect
Figure 2-11 Sunbird Cenomanian far offset amplitudes with Cenomanian depth contours (m TVDSS)
ʹǤͷǤ͵Ǥ Night Heron
Night Heron is a Turonian basin floor fan system which lies 8 Km south west of Well Bee Eater-1 It is mainly within Block 9 but extends into Block 10 It is identified as a stratigraphic trap with areal extents defined by amplitude truncation and structural pinch-out Reservoir is prognosed at between 4100 m TVDSS and 4700 m TVDSS in a water depth of around 1750 m (Figure 2-12) APCL has selected a
P90
P10
metres
Block 9
Block 8
Competent Personrsquos Report African Petroleum Corporation Limited
June 2013 40
provisional well location which lies on the 3D survey location ndash In-line 1098 X-line 6103 They are currently seeking partners to drill the Night Heron well in early 2014
Figure 2-12 Arbitrary line across Night Heron PSDM - Depth (m TVDSS)
Cenomanian reservoir potential also exists beneath the Turonian basin floor fan and work by APCL is on-going to determine prospectivity
Well Bee Eater-1 found an organic-rich Turonian shale section overlying a hydrocarbon bearing thin-bedded low permeability sandstone Another shale dominated package underlies the sandstone Although the Turonian interval is considered non-commercial for Bee Eater the prospectivity down-dip is appealing APCL interprets that the well was drilled in a canyon system that may have been largely bypassed by sediment input The 3D seismic indicates a significant thickening of this Turonian interval towards the south west and there is some amplitude support for the occurrence of a lobate fan straddling Blocks 9 amp 10
An area times net approach was adopted using the full stack PSDM depth volume to provide an SNA extraction and constrain areal extent and estimate an areal NG to account for lateral variability within the reservoir (Figure 2-13) As night Heron falls partly off block ERCE correct for this using the ratio of on-block to off-block area in reporting of net unrisked and net risked results
S NEBee EaterNight Heron
5 Km
BFF Isopach (m)
Competent Personrsquos Report African Petroleum Corporation Limited
June 2013 41
Figure 2-13 SNA from Basin Floor Fan Isopach (m) - PSDM
We have used the prospect risk matrix presented in Section 16 to determine the geological chance of success for the Turonian interval of the Night Heron prospect Recent drilling results suggest that there is a low risk to hydrocarbon charge The observations at Bee Eater-1 also indicate that shale seals are also likely at a coeval interval Reservoir is a significant risk due to the poor Turonian reservoir development in Well Bee Eater-1 The Turonian reservoir encountered in Well Narina-1 is also of relatively poor quality However there is seismic evidence on the 3D survey for a possible improvement in reservoir development over the prospective area The definition of the trap is the key risk as the seismic evidence for closurereservoir pinch-out is ambiguous over the 2D data in Block 10 There appears to be evidence of the reservoir interval thinning in the critical north westerly direction but 3D data would be required to reduce trap risk any further As a result we attribute a geological chance of success of 144 to the Night Heron prospect
3
3
SNA from BFF Isopach
Block Boundary
Competent Personrsquos Report African Petroleum Corporation Limited
June 2013 42
ʹǤͷǤͶǤ Lovebird Prospect
The Lovebird prospect is mapped as a four-way dip closure to the south of Block 8 (Figure 2-14) Three prospective layers are mapped by correlation to up-dip wells and are prognosed to be of Cenomanian age Thus as with the Sunbird canyon prospect these reservoirs are not proven on block but seismic mapping and regional geological work suggests the sands may be derived from the east via a canyon system identified in block LB-07 The three prospective intervals are termed Upper Middle and Lower or Blue Pink and Green based on horizon colour Structural relief at the Pink horizon is between 50 and 200 m depending on the estimate and thus the prospect is relatively low relief in some realisations
Figure 2-14 Seismic line over the Lovebird prospect
Lovebird
Depth (mss)
4 km
NE
Competent Personrsquos Report African Petroleum Corporation Limited
June 2013 43
Figure 2-15 Lovebird prospect Top Pink horizon depth (m TVDSS) high case
The prospect is mapped to the edge of the available 3D (Figure 2-15) which coincides with the southern boundary of Block 8 but closure can be mapped south of the 3D area on the available 2D lines Reservoir depth is prognosed at between 5000 and 5900 m TVDSS in a water depth of 2850 m at the prospect crest Thus reservoir rock if present will be at comparable depths below mud line to the Barbet prospect
We use a gross-rock volumenet to gross methodology to estimate prospective resources for the Lovebird prospect APCLrsquos evaluation of the Lovebird prospect is on-going and of the three interpreted horizons the Pink horizon is the best defined We review pick depth conversion and thickness uncertainty for this interval to generate a range of gross-rock volumes for this interval with the
m ss
metres
Block 9
Block 8
Competent Personrsquos Report African Petroleum Corporation Limited
June 2013 44
prospect full to spill (Figure 2-15) Assuming the Pink horizon provides an accurate representation of the Blue and Green horizons we then estimate gross-rock volumes for these two intervals by isopach
Reservoir thickness and net to gross ratio estimates are derived from regional analogues with reservoir porosity derived from our regional porositydepth trend (Figure 2-4) Fluid properties and recovery factors are estimated as described in Section 16 Our volumetrics are restricted to the portion of the Lovebird prospect on Block 8 We would expect a further evaluation of the prospective resources of the Lovebird prospect to occur subsequent to the completion of the APCL evaluation and the prospective resources associated with the prospect in this report may therefore be subject to change
The key risks to the Lovebird prospect are to the development of reservoir at the prognosed Cenomanian intervals as they are not proved in wells elsewhere on the block and to source as the prospect requires a source rock deeper than that proven by drilling There is also risk to trapcontainment as the structure is not fully defined by the 3D seismic data volume and is of low relief in some realisations We assign a geological chance of success to the Lovebird prospect of 20 as a result
255Wildbird Prospect
The Wildbird prospect is mapped on 3D seismic data towards the south of Block 8 as a large four-way dip-closed high (Figure 2-17) at a depth of between 4000 to 4600 m TVDSS in a water depth of around 2000 m Structural relief is up to 600 m and area of closure up to 170 km2 The conceptual geological model is discussed above but is that the prognosed microbial carbonate reservoir of Albian age is developed between the mapped lsquoredrsquo and lsquolight bluersquo seismic events (Figure 2-16) with lateral seal developed to the north-east of the prospect within contemporaneous lagoonal facies which also provide the primary source rock This lateral seal is required to close the prospect Basin modelling undertaken by APCL suggests that the Albian lagoonal and later Cretaceous source rocks would be mature for oil generation
We have accepted this model as a geological concept and have used it to make estimates of prospective resources for the Wildbird prospect We then risk the model accordingly
Competent Personrsquos Report African Petroleum Corporation Limited
June 2013 45
Figure 2-16 Seismic line and prospect geo-seismic sketch Wildbird prospect
5
0 km 5
SWN
E
mss
Wildbird
Horizons
BlackberryLight BlueRoseRed
Competent Personrsquos Report African Petroleum Corporation Limited
June 2013 46
Figure 2-17 Wildbird Top Reservoir depth map (m TVDSS) Spill point - green contour
The Wildbird prospect is a large container but there is considerable uncertainty in reservoir thickness structural mapping and degree of charge from the offset kitchen areas We evaluate the prospect in a similar manner to the Lovebird prospect by perturbing the above variables In our low case we choose a shallow contact at 4250 m TVDSS to simulate under-filling or lateral breach via onlapping thief zones and also employ a reservoir thickness of 80 m from offset analogue Our high case assumes the prospect is filled to spill and that the lsquoredrsquo seismic event marks base reservoir Estimates of reservoir net to gross ratio and porosity are derived from the available analogues and are necessarily wide Fluid parameters and recovery factors are derived as described in Section 16
The Wildbird play is emerging and is of high risk We attribute a play risk of 24 as a result (Section 24) The key prospect risk to the Wildbird prospect is that of containment or trap as there is evidence for erosion at the crest of the feature and it is reliant on the development of lagoonal facies to the north-east and overlying marine shales to provide lateral seal and support the hydrocarbon column heights modelled here We attribute a prospect risk of 38 Wildbird which when combined with the play risk gives an overall chance of success for the Wildbird prospect of 9
mss
Competent Personrsquos Report African Petroleum Corporation Limited
June 2013 47
3 Gambia Prospectivity and Plays
͵ǤͳǤ Introduction
Although only one exploration well (Well Jammah-1) exists offshore Gambia exploration drilling has been undertaken to the north and south within Senegalese and Guinea Bissau waters (Figure 2-1 Figure 3-1) A number of oil and gas discoveries have been made onshore Senegal and the large Dome Flore and Dome Gea discoveries to the south of the blocks are each reported to contain a million barrels of biodegraded oil (c10-13o API) in place within sandstones of Oligocene (Tertiary) age Some lighter (30-34o API) oil has also been encountered in deeper intervals More regionally oil and gas discoveries have been made to the north offshore Mauritania and in Guinea Bissau (Sinapa) the recently drilled Venus and Mercury wells in Sierra Leone have also encountered hydrocarbons
Figure 3-1 Plays Gambia Blocks A1 and A4
The range of hydrocarbon types encountered is suggestive of multiple sourcing and the age of the reservoirs suggest late timing of oil generation consistent with a late Cretaceous source for the heavy oil although there are no published data to confirm this Regionally the gas source could be any of the older potential source rocks discussed below
Alhamdulilah
GAMBIA A1ampA4 PROSPECTIVITY POTENTIAL
Deep Water Fans channel levee complexes BFF lobes
Late Jurassic clastic progrades
Clastic progrades (unconformity trap)
Karst amp reef features in carbonate platform
Intra-carbonate clastic truncations
Based on line 1046-NWA
1
2
3
1
51
14
2
3
4
5
Competent Personrsquos Report African Petroleum Corporation Limited
June 2013 48
32Well and Seismic Database
Exploration offshore Gambia is also at an early stage and no wells have been drilled in the deeper water areas The nearest well to Blocks A1 and A4 (and the only well offshore Gambia) is Well Jammah-1 some 15 km to the east of Block A1 (Figure 3-2) This well contains oil shows within sandstones of Late Cretaceous age The well drilled to 3020 m MD reaching total depth in an interval of uncertain age perhaps Cenomanian to Albian
A regional grid of 2D seismic data was made available to us for our evaluation with an average line spacing of around 2-3 km on Block A1 and up to 8 km on Block A4 (Figure 3-2 Figure 3-3) In addition a 2003 vintage 3D seismic data volume was available for analysis covering 2008 km2 However APCL is using 2010 vintage 3D seismic data (2566km2) processed to pre-stack time-migration in their current evaluation and we have adopted these data for our review In general seismic data quality was found to be good
Figure 3-2 Wells 2D and 3D seismic data (red outline) Gambia Blocks A1 and A4
The 2D seismic data was sufficient to enable a well to seismic tie to be made to Well Jammah-1 (Figure 3-3) Despite its shelfal location we were able to extrapolate some stratigraphy into the deeper water
Competent Personrsquos Report African Petroleum Corporation Limited
June 2013 49
although the key Upper Cretaceous section is not sampled adequately by the well leading to uncertainty in the age of the deeper clastic section that forms the potential reservoir interval for the Alhamdulilah prospect
33Plays and Petroleum Geology Blocks A1 and A4
Some of the plays identified by APCL offshore Gambia are similar to those described for Liberia in Section 23 above with structural and stratigraphic traps identified at a number of Cretaceous intervals (Figure 3-1) and reservoirs prognosed as being of deep marine turbidites or other mass transport systems However plate tectonic reconstructions suggest that rifting occurred earlier along the Senegalese and Gambian margin beginning in the Lower Jurassic Thus there is the potential for deeper Jurassic age source and reservoir in the area
There is some seismic evidence for the presence of reservoir intervals as is common regionally although evidence is less compelling in the deeper intervals (Figure 3-5) Of the identified traps in this play fairway only one has currently been matured to prospect status by APCL the Alhamdulilah prospect
Regionally reservoirs within the Cretaceous are associated with a deep marine depositional environment and are generally expected to be of good to excellent quality with the possibility of some overpressure A similar depositional environment is prognosed for the deeper Jurassic age reservoirs with possible fan-delta like geometries identifiable on seismic landward (eastward) of the Alhamdululah prospect (Figure 3-7)
In addition to the Jurassic and Cretaceous clastic plays APCL has identified a number of closures along the margin of a carbonate platform of Jurassic to Aptian age partially penetrated by Well Jammah-1 (Figure 3-3 Figure 3-4) These closures are currently being evaluated by APCL and only one Prospect M has been evaluated to prospect status and we assess the prospective resources for Prospect M in this section
Competent Personrsquos Report African Petroleum Corporation Limited
June 2013 50
Figure 3-3 Well to seismic tie ndash Well Jammah-1 to the Alhamdulilah prospect
There is good evidence for the presence of source rocks in the Gambian margin The youngest source interval that could possibly generate oil is the Cenomanian-Turonian marine source rock proven in the Casamance Shelf wells and present in basins to the north Published data indicate kerogen is a mixed Type IIIII locally and Type II in wells to the south with HI of between 370-660 mggC in gt2 TOC rocks (TOCs in the DSDP-367 well 300 km to the west are in excess of 5 in black shales of Albian to Turonian age) This section is absent in Well Jammah-1 probably as a result of erosion
There is also the possibility of Necomian and Jurassic source rocks Necomian black shales are described in the DSDP-367 well Jurassic (Toarcian) source rocks are inferred to be present based on analogue evidence and plate tectonic reconstructions that place proven Jurassic source rocks in Morocco Portugal Nova Scotia and north-eastern Brazil in proximity to the Senegal-Gambia basin These are documented as having a HI of around 450 mggC and a TOC of up to 6
Regional thermal information shows a high degree of variability with gradients from 25 to 45 degCkm likely as a result of drilling on salt domes where geothermal gradients are elevated or in areas locally affected by volcanics Blocks A1 and A4 are at the northernmost margin of the salt basin so at worst only limited local effects are anticipated Using data from Well Jammah-1 we infer a geothermal gradient of 30deg Ckm at the location of the well This would put the Cenomanian-Turonian source locally into the oil window around the Alhamdulilah prospect However uncertainty in both depth conversion and geothermal modelling do not rule out the possibility that the Cenomanian-Turonian could be mature regionally for hydrocarbon generation Deeper Neocomian or Jurassic source rocks if present would be mature for oil generation under this model
ALHAMDULILAH
M
Senonian UC
W E4 km
Jammah-1
Alhamdulilah
Intra Aptian Carbonate
TWT (ms)
Competent Personrsquos Report African Petroleum Corporation Limited
June 2013 51
34Play Risk
In our evaluation of APCLrsquos Gambian blocks we note that a number of the prospective plays require further definition to mature the identified leads to prospect status As a result our evaluation is limited to the determination of independent estimates of prospective resource for the Alhamdulilah prospect and Prospect M We have used play and prospect risk for both prospects to allow for consistency in comparison between our evaluations where a play risk is appropriate
Based on the review above we see source risk as the key risk to the Lower Cretaceous and Jurassic clastic play Although a number of source rock intervals are present regionally only those within the Cretaceous are demonstrated to be present proximal to Blocks A1 and A4 Data are limited but modelling would suggest that those within the Cenomanian-Turonian could be immature for oil generation in all but a small area of the blocks As a result we assign a source risk of 07 Note that the uncertainty in both source rock presence and thermal data is such that there is a possibility of gas charge although like Liberia Sierra Leone and Cote drsquoIvoire it is impossible to quantify this chance at present
We see seal risk for this play to be relatively low as there is seismic evidence similar to that interpreted regionally for the presence of seal Seal risks for the multiple stacked sands prognosed for the Alhamdulilah prospect are handled as a prospect specific risk The inferred depositional environment for this interval would also suggest that sealing intervals would be developed We have therefore assigned a seal risk of 09 to this play
Seismic evidence for the presence of reservoir is also good but less convincing than that observed regionally and in our evaluation of Liberia Blocks 8 and 9 However we assign a reservoir presence risk of 08 It is possible that the younger Cretaceous reservoirs identified could be locally sourced via exhumation of the coeval carbonate platform to the east and thus be composed of detrital carbonate material This is reflected in the reservoir risk for the Alhamdulilah prospect itself
For the carbonate platform play the key risk is that of top seal Seismic reflectivity is highly variable above the top of the platform carbonates (Figure 3-3) as the event is a strong regional unconformity In places the overlying clastic section can be interpreted immediately above this unconformity Although the latter is factored into prospect specific risk to top seal the seismic evidence for the presence of a regional seal above the unconformity is not compelling The top seal is provided by a down-lapping carbonate prone Aptian-Albian section where the Senonian unconformity is not immediately above the reservoir section Analogues suggest there is a general lack of support for intra-formational seals in similar settings and therefore we assign a risk to the carbonate platform play seal of 05 as a result
The presence of a strong angular unconformity at the top of the carbonate platform structures is however likely to have enhanced reservoir quality within the carbonates themselves as a result of subareal exposure and karstification Thus we assign a risk of 09 to the reservoir presence element of the carbonate platform play and review the prospect specific reservoir efficacy risk on a prospect by prospect basis dependent on the seismic evidence for erosion
Competent Personrsquos Report African Petroleum Corporation Limited
June 2013 52
A number of the identified structures along the buried carbonate platform margin are relatively shallow to mudline and thus biodegradation of any oil charge is possible However as we have only estimated prospective resources for Prospect M we have not carried a play risk to biodegradation
Our final play risks for the Lower Cretaceous clastic and the buried carbonate platform plays are summarised in Table 31 below
PLAY Source Reservoir Presence Seal Play
Risk Cretaceous to Jurassic Clastic Play 07 08 09 50
Carbonate Platform Margin 07 09 05 28
Table 31 Play risk Gambia Blocks A1 and A4
Competent Personrsquos Report African Petroleum Corporation Limited
June 2013 53
35Gambia Leads and Prospects
In all 13 leads and prospects have been identified by APCL within Blocks A1 and A4 with areas of closure varying from around 4 km2 to 63 km2 (Figure 3-4) Of the identified prospective intervals a number are best classified as leads and require further technical work to mature them to prospect status (yellow Figure 3-4) Structural closure is identified within the Lower Cretaceous and a number of slope fans can be identified as seismic amplitude anomalies within the Upper Cretaceous section In addition a number of closures are mapped along the edge of the buried carbonate platform margin at Top Aptian level and APCL are currently evaluating the potential for a deeper Barremian age seal which might provide further prospectivity within the carbonate platform play
Figure 3-4 Leads and prospects identified by APCL in Gambia Blocks A1 and A4
In this section we briefly describe our evaluation of the Alhamdulilah prospect and Prospect M A summary of input parameters for the calculation of prospective resources results and risks for each of the prospective layers evaluated is given in the resource summary sheets in Enclosures 21 to 25 of this document
In 2010 APCL acquired a further 2566 km2 of 3D data over both blocks A re-evaluation of the identified leads and prospects is on-going using these data with the evaluation of the Alhamdulilah prospect and Prospect M completed
ALHAMDULILAH
M
Competent Personrsquos Report African Petroleum Corporation Limited
June 2013 54
351Alhamdulilah Prospect
The Alhamdulilah prospect is identified as a four-way dip-closed structural high within the centre of the deep water portion of Block A1 (Figure 3-3 Figure 3-5) We have evaluated four prospective intervals in total (Figure 3-5) Reservoir ages are currently prognosed by APCL to be of Lower Cretaceous (Turonian) to perhaps Lower Jurassic The prospect extends northwards of Block A1 into Senegalese waters and we have restricted our calculations to the proportion of the prospect that lies within Block A1 The bulk of the prospect does however lie within Gambian territory
Figure 3-5 Seismic line over the Alhamdulilah prospect
The prospective intervals within the Alhamdulilah structure lie between 4230 m TVDSS and 5970 m TVDSS or around 2010 to 3750 metres below sea bed This is relatively deep and despite the estimates of overpressure it is possible that porosity and thus reservoir quality to be relatively poor (Figure 2-4) Our estimates of recovery factor for the deeper prospective intervals reflect this
There is uncertainty in the degree of structural closure as although mapped reflectors are relatively bright and continuous the structure is of low relief We have account for this by undertaking various depth conversions of the mapped structure from the time domain 3D seismic data restricting our analysis to closure demonstrable on-block (Figure 3-6) At SS-1 level closure continues to the north off-block and also off the 3D seismic data We have reviewed the available 2D seismic data northwards to determine the spill point at this level
SS 4 (1)
SS 3 (1-2)
SS 2 (1-3)
SS 1 (1-3)
2 Km
Inline 1140 - TWT ALHAMDULILAH
TWT (s)
W E
Competent Personrsquos Report African Petroleum Corporation Limited
June 2013 55
Where seismic facies analysis suggests the potential for stacked pay intervals these have been modelled probabilistically Estimates of gross rock volume derived in this way are combined with the estimates of net reservoir thickness based on mapped seismic thicknesses and porosity and fluid information are derived as described in Section 16 to compute probabilistic estimates of resources for each reservoir interval
Figure 3-6 Area of closure Alhamdulilah prospect layers SS1 to SS4
Recovery factors used are as described in Section 16 of this report but modified to reflect the depth of burial of the deeper prospective intervals
We have reviewed the prospect specific risk for each of the prospective intervals independently Although the Alhamdulilah trap is a four-way dip-closed feature the time closure is subtle and the prospect is relatively deep There is also seabed canyoning which may cause uncertainty in the imaging and thus trap closure
Seismic evidence for seal is relatively good over the Alhamdulilah trap However there is evidence for downcuttingerosion between layers and above the prospect there is also evidence for downlapping events onto the topmost reflector
The key risk to the Alhamdulilah prospect is that of reservoir efficacy There are indications of fan-like geometries within the 3D seismic data (Figure 3-7) and some events can be mapped for the shallower reservoir layers However the Cretaceous reservoirs may alternatively comprise the eroded talus from the coeval carbonate platform to the east and reservoir quality rock may not be developed as a result Finally our estimate of overpressure may be incorrect and any sandstones present may have the reservoir quality sufficiently degraded via compaction to render them non-reservoir
SS-1 Low and High Case AreasSS-4 Low and High Case Areas SS-3 Low and High Case Areas SS-2 Low and High Case Areas
Competent Personrsquos Report African Petroleum Corporation Limited
June 2013 56
As a result the prospect specific risks to the prospective intervals of the Alhamdulilah prospect vary from 26 to 34 and from 13 to 17 when combined with the play risk
Figure 3-7Alhamdulilah prospect seismic facies interpretation Cretaceous intervals
AH-1 AH-1
Competent Personrsquos Report African Petroleum Corporation Limited
June 2013 57
352Prospect M
A number of structures have been identified by APCL at the Aptian level (ie top carbonate) along the buried carbonate platform margin that runs through Blocks A1 and A4 (Figure 3-1) Of these one structure Prospect M has been matured to prospect status and is of sufficient size to warrant independent estimates of resources (Figure 3-8)
Figure 3-8 Seismic line through Prospect M
We have evaluated the uncertainty in gross rock volume for Prospect M and combined this with reservoir net to gross ratio and porosity from analogue to generate estimates of STOIIP and prospective resources We have simulated uncertainty in seismic pick and also depth conversion to generate a range of spill points for the structure (Figure 3-9) These are used to make low and high case estimates of gross-rock volume
Due to the shallow nature of Prospect M we have assumed relatively high (but moveable) oil viscosities as discussed in Section 1 Recovery factor estimates are made with reference to this and also to analogue where uncertainty in both reservoir quality and also the degree of fracturing (and hence dual permeability) leads to a wide range in uncertainty in ultimate recovery Our low case recovery factor being affected primarily by early onset of water cut via fractures and an adverse mobility ratio and the high case making allowance for better oil mobility and improved matrix porosity and permeability leading to a more efficient sweep We therefore use a recovery factor range from 10 to 35 and use these as the P90 and P10 estimates on a log-normal distribution in our probabilistic simulation of prospective resources
Senonian UC
Intra Aptian Carbonate
TWT (ms)2 km
w EProspect M
Competent Personrsquos Report African Petroleum Corporation Limited
June 2013 58
Figure 3-9 Low and high case closure Prospect M top Aptian depth (m TVDSS)
There is pick and depth conversion uncertainty associated with Prospect M but we see a good chance of a closure being developed within the 3D seismic area and assign a prospect specific risk to trap of 09 as a result Downlapping events are observed onto the crest of the prospect (Figure 3-8) but the overlying seismic signature is relatively transparent thus we see a good chance of the prospect being sealed relative to the play risk However the prospect is relatively shallow at around 1000 m to 1100 m below the seabed and there is a risk to biodegradation of any oil charge Thus we associate a risk of 06 to biodegradation As it is established practice we place this risk into containment or trap risk which results in an overall trap risk of 09 06 or 54
There is evidence for the development of reservoir quality rock with a seismic character that has been associated with the development of karstification in the analogues used We also note that the prospect is very close to the platform edge and the erosional unconformity is quite pronounced again suggesting a period of subareal exposure Thus we see the prospect specific risk to reservoir efficacy as 08 Charge risk is also favourable with the prospect located at the edge of the buried platform margin proximal to the deeper potential kitchen areas We therefore associate a charge risk of 08 to the prospect
Thus we assign a prospect specific risk of 35 which when combined with the play risk for the carbonate platform margin gives an overall COS of 10
3
3
m ss
metres
Competent Personrsquos Report African Petroleum Corporation Limited
June 2013 59
4 Sierra Leone Prospectivity and Plays
As with offshore Liberia to the south-east all of the deep-water acreage offshore Sierra Leone is under licence (Figure 4-1) A discussion of regional hydrocarbon occurrences is presented in Section 21 APCLrsquos licences SL-03 and SL-04A-10 lie to the north-west of the countryrsquos territorial waters around 200 to 300 km north-west of the recent Venus Mercury and Jupiter discoveries made by Anadarko (Figure 4-1)
Figure 4-1 Offshore licences and discoveries Liberia and Sierra Leone
A regional grid of 2D seismic data is available to APCL for the evaluation of offshore Sierra Leone (Figure 4-2) In addition APCL has licenced c 2500 km2 of 3D seismic data covering the deeper water area of Block SL-03 and is negotiating the licencing of further 3D seismic data covering part of Block SL-04A-10
Competent Personrsquos Report African Petroleum Corporation Limited
June 2013 60
Well data offshore Sierra Leone are sparse Historical exploration was restricted to the shelf and resulted in the drilling of two exploration wells (Wells A-1 and A-1-2) which were plugged and abandoned as dry holes Data from both wells are available to APCL Recent drilling by Anadarko in the deeper waters of licence SL-07B-10 has yielded a number of discoveries (Wells Jupiter-1 Venus-1 and Mercury-1) but these well data are not available to APCL
Figure 4-2 Well and seismic database offshore Sierra Leone
The play fairways identified offshore Sierra Leone are very similar to those identified offshore Liberia (Figure 2-3) as structural traps within the Lower Cretaceous syn-rift section and primarily as stratigraphic traps within turbiditic sands of Cretaceous age (Campanian Cenomanian and Turonian) Sourcing from regional marine (Cenomanian) or lacustrine (Albo-Aptian) source rocks is hypothesized For the syn-rift structural play the presence of Albo-Aptian reservoirs is demonstrated by the shallow water Wells A-1 and A-1-2 which also had indications of the development of source rocks within the
Competent Personrsquos Report African Petroleum Corporation Limited
June 2013 61
Cretaceous syn-rift section Although the data are not available the recent Anadarko wells are publically documented as having found hydrocarbons within post-rift Cretaceous turbidites potentially de-risking this play
Blocks SL-03 and SL-04A-10 are towards the north-western edge of the seismically identified Cretaceous basin immediately adjacent to a large structural lineament the Sierra Leone Transform System Submarine canyon development is therefore prognosed to occur to the south and east of this lineament providing sediment input into the blocks during Cretaceous time As is encountered regionally there is reasonable seismic evidence for the presence of reservoir bearing intervals within the Upper Cretaceous section in the blocks
APCLrsquos evaluation of the recently licenced 3D seismic data is on-going and as yet only one prospect Altair has been matured to drillable prospect status However a number of other Cretaceous channelfan systems have been identified within Block SL- 03 (Figure 4-3)
Figure 4-3 Leads Sierra Leone Block SL-03
Competent Personrsquos Report African Petroleum Corporation Limited
June 2013 62
41Play Risk
Although there has been recent drilling along strike of APCLrsquos Sierra Leone licences these wells lie some 100 km to the east We have therefore attributed a play risk albeit favourable to Cretaceous channel-fan prospectivity within Blocks SL-03 and SL-04A-10 As with our review of Liberia there is strong seismic evidence for reservoir and seal rocks being present and offset drilling would indicate the same from the limited published information However there is as yet no proven source rock within APCLrsquos licences and we see this as the key risk to play The reported results of offset drilling and APCLrsquos own basin modelling would suggest that source risk would be favourable
Our final play risk for the Cretaceous channel-fan systems in APCLrsquos Sierra Leone licences is summarised in Table 31 below
PLAY Source Reservoir Presence Seal Play
Risk Cretaceous Play 08 09 09 65
Table 41 Play risk Sierra Leone Block SL-03
41Sierra Leone Leads and Prospects
APCL is currently evaluating the recently licenced 3D seismic data over Block SL-03 and has identified a number of Cretaceous channel-fan systems varying in areal extent from 20 km2 to 150 km2 Of the mapped channel fan systems one Altair has been matured to prospect status by APCL and we have made independent estimates of prospective resources and risks for this prospect
A summary of input parameters for the calculation of prospective resources results and risks for the Altair prospect is given in the resource summary sheet in Enclosure 31 of this document
411Altair
The Altair prospect is a turbidite channel prospect mapped at a seismic event described as Turonian by APCL (Figure 4-4) There is however uncertainty in this stratigraphy as it is established by jump correlation using regional seismic data due to the lack of deep water wells on block It is a stratigraphic trap with areal extents defined by amplitude truncation and structural pinch-out in a similar manner to prospectivity within APCLrsquos Liberia and Cote drsquoIvoire acreage A single target reservoir is identified within the trapped area The prospect has anomalous seismic amplitudes associated with it (Figure 4-5) which may indicate reservoir development The top structure is mapped between 6200 ndash 6800 ms TWT over the area of the prospect Our depth conversion indicates a crestal depth of approximately 5400 m TVDSS beneath a water depth of 3300 m giving 2100 m of sediment above top reservoir
Competent Personrsquos Report African Petroleum Corporation Limited
June 2013 63
Figure 4-4 Dip seismic line (full offsets) Altair prospect
The seismic image suggests that Altair is a turbidite channel constrained in the north east by a well-defined canyon Two distinct canyon systems feed erosive channels at the break of slope A south west trending fault which is almost perpendicular to the main canyon feeders alters bathymetric relief and diverts the Altair channel southwards
ERCE has made estimates of prospective resources for the Altair prospect using an identical methodology to our evaluation of Liberian prospectivity An area net approach was adopted using optimized seismic amplitudes to constrain areal extent and define an areal net to gross to account for lateral variability of sand distribution within the reservoir In our low case we restrict the area of the accumulation to the brightest area of anomalous amplitudes and a column height of 200 m Our high case extends the prospect down-dip to a column height of 800 m and laterally to incorporate weaker amplitude responses (Figure 4-5) These polygons were used to constrain the P90 and P10 area inputs of our probabilistic simulation
SW NE
Top Turonian
Top syn-rift
0 5kmTWT (s)
ALTAIR
3
3
metres
Competent Personrsquos Report African Petroleum Corporation Limited
June 2013 64
Figure 4-5 Seismic amplitude (gradient stack) and Top Turonian depth (m TVDSS) Altair prospect
Net pay is estimated from the mapped seismic interval and regional analogue with porosities and fluid properties estimated as described in Section 16
We have used the prospect risk matrix presented in Section 16 to determine the geological chance of success for the Altair prospect Key risk is to trap integrity due to the coalescing of a number of mapped fan systems up dip towards the pinch-out of Altair with subsidiary risk to charge as this is as yet unproven on block This gives a prospect specific risk of 28 which when combined with the play risk gives an overall chance of success of 18 for the Altair prospect
3
3
metres
Competent Personrsquos Report African Petroleum Corporation Limited
June 2013 65
5 Cote13 drsquoIvoire13 Prospectivity13 and Plays
51Introduction
Offshore Cote drsquoIvoire has been actively explored for hydrocarbons for a number of years and much of the offshore shelf is under licence Recently exploration has moved into deeper waters targeting the regional post-rift (Cretaceous) play and APCL has identified a number of prospects and leads within the western licence Blocks of CI-513 and CI-509 (Figure 5-1)
There are two main play types identifiable offshore Cote drsquoIvoire (Figure 5-2) as structural traps within the Lower Cretaceous (Aptian to Albian) syn-rift section and as stratigraphic traps within post rift turbiditic sands of Cenomanian to Turonian age Sourcing is prognosed from regional marine (Turonian) or lacustrine (Albo-Aptian) source rocks
Figure 5-1 CI-509 and CI-513 Prospects and Leads13 offshore13 Cote13 drsquoIvoire
Historically exploration has been restricted to the narrow shelf area and has yielded a number of commercial fields both oil and gas including Foxtrot Baobab and Espoir All of these fields lie within the Lower Cretaceous (Aptian) syn-rift play Recently exploration has moved into deeper waters targeting the regional post-rift (Cretaceous) play Well Paon-1X c 300 km to the east of Blocks CI-105 and CI-513
Competent Personrsquos Report African Petroleum Corporation Limited
June 2013 66
drilled by Tullow Oil plc and partners in licence CI-103 during 2012 is reported to have found hydrocarbons in turbiditic sandstones of Cretaceous age Well Kosrou-1X some 150 km east of Blocks CI-105 and CI-513 shows reservoir development within the post-rift Cretaceous section particularly within the Turonian to Cenomanian section
Evaluation of prospectivity within Blocks CI-509 and CI-513 is at an early stage and a working petroleum system is not proven on block However a number of Cretaceous channelfan systems have been identified using both 2D and 3D seismic data which have generated around seven potential traps at the date of this report five of which are considered prospects for this report (Figure 5-1)
Figure 5-2 Petroleum13 systems13 and13 plays13 offshore13 Cote13 drsquoIvoire
52Well and Seismic Database
APCL has obtained a regional database of 2D seismic data offshore Cote drsquoIvoire which provides well to seismic ties to Well San Pedro-1 (Figure 5-3) The primary data set used for our evaluation is that provided by the recently acquired 3D seismic data At the time of writing these data were processed to
Competent Personrsquos Report African Petroleum Corporation Limited
June 2013 67
pre-stack time-migration and we have used this volume plus available AvO processed volumes to evaluate the prospectivity of the CI-513 licence currently only the full-stack seismic product has been used to assess the prospectivity in Block CI-509
Figure 5-3 Well and seismic database offshore Sierra Leone
53Plays and Petroleum Geology Blocks CI-509 and CI-513
The primary play being explored within Blocks CI-509 and CI-513 is the Cretaceous post-rift turbidite play (Figure 5-2) There is reasonable seismic evidence for the presence of reservoir bearing intervals within the Upper Cretaceous section of the blocks However dating of the age of these post-rift turbidite channelfan systems is uncertain due to the paucity of well and seismic data with stratigraphy extrapolated into APCLrsquos licences via regional seismic correlation The presence of a regional Turonian source rock is hypothesized to charge any identified traps This is not proven on block but evidence from offset drilling in Block CI-105 demonstrates the presence of source rocks developed within the
Grand Lahou East 1
Kosrou 1x
San Pedro 1
South Grand Lahou 1
Competent Personrsquos Report African Petroleum Corporation Limited
June 2013 68
Cenomanian to Turonian and basin modelling studies indicate that the Turonian may be mature for oil generation local to the licences
A number of Cretaceous channelfan systems have been identified using both 2D and 3D seismic data (Figure 5-1) and we have independently evaluated the Prospective Resources and geological chance of success for five of these In addition the Lower Cretaceous syn-rift play may be viable within the licences particularly to the north Evaluation of this play by APCL is on-going and no prospective resources have been assessed for this play
54Play Risk
Exploration offshore Cote drsquoIvoire is at an early stage and there are limited well data available As a result ERCE has adopted a play and prospect risk system in our evaluation of the Cote drsquoIvoire prospective resources within the Cretaceous channel-fan play in an identical manner to our review of Liberia the Gambia and Sierra Leone
In a similar manner to Liberia the Gambia and Sierra Leone there is seismic evidence for the presence of seal and reservoir rock and thus the key risk is to source and we see source risk as the key risk to the Creteaceous clastic play Sourcing is prognosed from regional marine (Turonian) modelled as having limited hydrocarbon generating potential or lacustrine (Albo-Aptian) source rocks the maturity of which are interpreted to be in the very early oil window As a result we assign a play source risk of 06 Note that the uncertainty in both source rock presence and thermal maturity is such that there is a possibility of gas charge although it is impossible to quantify this chance at present
Our final play risk is summarised in Table 51 below
PLAY Source Reservoir Presence Seal Play
Risk Cretaceous Clastic Play 06 09 09 049
Table 51 Play13 risk13 Cote13 drsquoIvoire13 Blocks13 CI-509 and CI-513
Competent Personrsquos Report African Petroleum Corporation Limited
June 2013 69
ͷǤͷǤ Cote13 drsquoIvoire13 Blocks13 CI-509 and CI-503 Leads and Prospects
Prospectivity has been identified by APCL at a number of levels with the evaluation of the Cretaceous clastic turbidite channel-fan play being the most advanced ERCE has made independent assessments of prospective resources and geological chance of success for five prospects within this play Ayame Ayame West Sassandra Cavella and Leraba (Figure 5-1)
A summary of input parameters for the calculation of prospective resources results and risks for each of the prospective layers evaluated is given in the resource summary sheets in Enclosures 41 to 45 of this document
ͷǤͷǤͳǤ Ayame amp Ayame West
The Ayame and Ayame West prospects are identified as Upper Cretaceous fans which lie mainly within Block CI-513 (Figure 5-4) The prognosed trapping mechanism is stratigraphic with areal extents defined by amplitude truncation and structural pinch-out A single target reservoir is prognosed for both within stratigraphy identified as Turonian although stratigraphy is uncertain in both licences as it is established via long distance seismic ties The prospects have anomalous seismic amplitudes associated with them (Figure 5-5) which may indicate reservoir development The top structure is mapped between 5400 ndash 6300 ms TWT over the area of the prospect and our depth conversion places the crest of the trap at approximately 4200 m TVDSS beneath a water depth of 2500 m
Figure 5-4 Strike Line Ayame and Ayame West prospects
NE
0 km 4
TWT (s)
Top
Turonian
Base
Turonian
Top
Albian
AYAMEAYAME WESTSW
P90
P10
metres
P90
P10
AYAME
AYAMEWEST
Competent Personrsquos Report African Petroleum Corporation Limited
June 2013 70
Evaluation of the Ayame and Ayame West prospects is undertaken in an identical manner to our evaluations of the stratigraphically trapped channel-fan prospects in APCLrsquos Liberia and Sierra Leone licences An area net approach is adopted using anomalous seismic amplitudes to constrain areal extent and define an areal net to gross to account for lateral variability of sand distribution within the closure area In our low case we restrict the area of the accumulation to the brightest area of anomalous amplitudes and a 200 m column height Our high case extends the prospect down-dip to 800 m of column height to include a larger area of anomalous amplitudes (Figure 5-5) These polygons are used to constrain the P90 and P10 area inputs of our probabilistic simulation
Net pay estimates are estimated from mapped seismic interval thickness and from regional analogues with porosity fluid parameters and recovery factors estimated as described in Section 16
Figure 5-5 Ayame Seismic amplitude (gradient stack) and Top Turonian depth (m TVDSS)
We use the prospect risk matrix presented in Section 16 to determine the geological chance of success for the Ayame and Ayame West prospects Key risk is to trap and we attribute a trap risk of 50 to both
P90
P10
metres
P90
P10
AYAME
AYAMEWEST
Competent Personrsquos Report African Petroleum Corporation Limited
June 2013 71
prospects giving a prospect specific chance of success of 28 for both prospects When combined with the play risk this gives an overall chance of success of 14
A proportion of the closure areas for both the Ayame and Ayame West prospects fall outside Block CI-513 in our high case (6 km2 and 11 km2 respectively) This is corrected for in our summary tables of net risked and unrisked prospective resources at the beginning of this document by computing the area of the prospect off-block at P90 P50 and P10 and scaling accordingly
ͷǤͷǤʹǤ Sassandra
The Sassandra prospect is mapped as a deep-water fan system at Top Turonian level and lies within Blocks CI-513 and CI-509 approximately 20km west along strike from the Ayame prospect It is a stratigraphic trap with areal extents defined by amplitude truncation and structural pinch-out (Figure 5-6) A single target reservoir is prognosed within the Turonian and as with other prospects on block has similar uncertainty in the stratigraphic age of the prospective interval The prospect has anomalous amplitudes associated with it (Figure 5-7) which may indicate reservoir development The top structure is mapped between 5000 ndash 6000 ms TWT over the area of the prospect and our depth conversion predicts a crestal depth of approximately 4400 m TVDSS beneath a water depth of 2500 m
Figure 5-6 Dip seismic line Sassandra prospect
Top Turonian
Base Turonian
Top Albian
N S
TWT (s)
SASSANDRA
P90 P10
metres
CI-509
Competent Personrsquos Report African Petroleum Corporation Limited
June 2013 72
Evaluation of the Sassandra prospect is undertaken in an identical manner to our evaluation of the Ayame and Ayame West prospects An area net approach is adopted using anomalous seismic amplitudes to constrain areal extent and define an areal net to gross to account for lateral variability of sand distribution within the closure area In our low case we restrict the area of the accumulation to the brightest area of anomalous amplitudes and a 200 m column height Our high case extends the prospect down-dip to 800 m of column height to include a larger area of anomalous amplitudes (Figure 5-7) These polygons are used to constrain the P90 and P10 area inputs of our probabilistic simulation As far offset data are only available for CI-513 (at the time of writing) we have used amplitudes from the full-stack volume to map the extent of the prospect to the west off block (Figure 5-7)
Net pay estimates are estimated from mapped seismic interval thickness and from regional analogues with porosity fluid parameters and recovery factors estimated as described in Section 16
Figure 5-7 Sassandra prospect Seismic amplitude and Top Turonian depth (m TVDSS)
We use the prospect risk matrix presented in Section 16 to determine the geological chance of success for the Sassandra prospect Key risk is to trap and we attribute a trap risk of 40 This is a lower value
33
metres
CI-509
Competent Personrsquos Report African Petroleum Corporation Limited
June 2013 73
than our estimates for the Ayame and Ayame West prospects as the up-dip termination of the trap is less well defined and requires a larger area for pinch-out or bypass Seismic amplitude support for reservoir presence is less over the Sassandra prospect relative to Ayame Thus we estimate a prospect specific chance of success for the Sassandra prospect of 20 which when combined with the play risk gives an overall chance of success for the Sassandra prospect of 10
A proportion of the closure area for the Sassandra prospect falls outside Blocks CI-513 and CI-509 in our high case (33 km2) This is corrected for in our summary tables of net risked and unrisked prospective resources at the beginning of this document by computing the area of the prospect off-block at P90 P50 and P10 and scaling accordingly
553Cavalla
The Cavalla prospect is an Upper Cretaceous Fan which lies between the Ayame and Sassandra prospects within Block CI-513 It is identified as a stratigraphic trap with areal extents defined by amplitude truncation and structural pinch-out (Figure 5-8) A single target reservoir is prognosed within the TuronianCenomanian interval (with similar stratigraphic uncertainty to other prospects on block) which lies stratigraphically beneath the Ayame prospect The prospect has anomalous seismic amplitudes associated with it (Figure 5-9) which may indicate reservoir development The top structure is mapped between 4600 ndash 5900 ms TWT over the area of the prospect and we estimate a crestal depth of approximately 3900 m TVDSS beneath a water depth of 2500 m The prospect is more steeply dipping than other fan systems mapped on block
Evaluation of the Cavalla prospect is undertaken in an identical manner to our evaluation of the Ayame Ayame West and Sassandra prospects An area net approach is adopted using anomalous seismic amplitudes to constrain areal extent and define an areal net to gross to account for lateral variability of sand distribution within the closure area In our low case we restrict the area of the accumulation to the brightest area of anomalous amplitudes and a 200 m column height Our high case extends the prospect down-dip to 800 m of column height to include a larger area of anomalous amplitudes (Figure 5-9) These polygons are used to constrain the P90 and P10 area inputs of our probabilistic simulation
Net pay estimates are estimated from mapped seismic interval thickness and from regional analogues with porosity fluid parameters and recovery factors estimated as described in Section 16
We use the prospect risk matrix presented in Section 16 to determine the geological chance of success for the Cavella prospect Key risk is to trap and we attribute a trap risk of 40 As with the Sassandra prospect this is a lower value than our estimates for the Ayame and Ayame West prospects as the up-dip termination of the trap is less well defined and requires a larger area for pinch-out or bypass Seismic amplitude support for reservoir presence is less over the Cavella prospect relative to Ayame Thus we estimate a prospect specific chance of success for the Cavella prospect of 20 which when combined with the play risk gives an overall chance of success for the Cavella prospect of 10
Competent Personrsquos Report African Petroleum Corporation Limited
June 2013 74
The Cavalla prospect is contained entirely within APCLrsquos licences
Figure 5-8 Dip seismic line Cavalla prospect
Top Turonian
Top Albian
TWT (s)
CAVALLANW SEP90
P10
metres
Competent Personrsquos Report African Petroleum Corporation Limited
June 2013 75
Figure 5-9 Seismic amplitude (gradient stack) and Top fan depth (m TVDSS) Cavalla prospect
ͷǤͷǤͶǤ Leraba
As with the other evaluated prospectivity within Blocks CI-509 and CI-513 the Leraba prospect is an Upper Cretaceous fan which lies within Block CI-509 It is identified as a stratigraphic trap with areal extents defined by amplitude truncation and structural pinch-out (Figure 5-10) The prospect has anomalous seismic amplitudes associated with it (Figure 5-11) which may indicate reservoir development Unlike the other Cote DrsquoIvoire prospects evaluated in this report no offset seismic volumes were available for our review of Leraba at the time of writing The seismic amplitude response and character on the full-stack data is however consistent with that observed over other prospects in Block CI-513 where more seismic products were available
P90
P10
metres
Competent Personrsquos Report African Petroleum Corporation Limited
June 2013 76
The top structure is mapped between 4600 ndash 5200 ms TWT over the area of the prospect and we estimate a depth at the crest of approximately 3700 m TVDSS beneath a water depth of 2500 m
Figure 5-10 Dip seismic line Leraba prospect
Evaluation of the Leraba prospect is undertaken in an identical manner to our evaluation of the other Cretaceous fan systems evaluated in this section An area net approach is adopted using anomalous seismic amplitudes to constrain areal extent and define an areal net to gross to account for lateral variability of sand distribution within the closure area In our low case we restrict the area of the accumulation to the brightest area of anomalous amplitudes and a 200 m column height Our high case extends the prospect down-dip to 800 m of column height to include a larger area of anomalous amplitudes (Figure 5-11) These polygons are used to constrain the P90 and P10 area inputs of our probabilistic simulation
P90
P10
metresTWT (s)
LERABANW SE
Top Turonian
Albian
0 5km
Competent Personrsquos Report African Petroleum Corporation Limited
June 2013 77
Figure 5-11 Seismic amplitudes Leraba prospect overlay of Top Reservoir m TVDSS
Net pay estimates are derived from mapped seismic interval thickness and from regional analogues with porosity fluid parameters and recovery factors estimated as described in Section 16 The prospect is relatively shallow to mud line and we have modelled a more viscous oil as described in Section 16
We use the prospect risk matrix presented in Section 16 to determine the geological chance of success for the Leraba prospect Key risk is to trap and we attribute a trap risk of 60 as the up-dip extent of the prospect is fairly well defined on seismic data Although no off-set 3D seismic data were available the seismic evidence for reservoir presence is again comparable to that of Ayame West Thus we estimate a prospect specific chance of success for the Leraba prospect of 34 which when combined with the play risk gives an overall chance of success for the Leraba prospect of 16
The Leraba prospect is contained entirely within APCLrsquos licences
P90
P10
metres
Competent Personrsquos Report African Petroleum Corporation Limited
June 2013 78
6 Senegal Prospectivity and Plays
Prospectivity identified within APCLrsquos Sengalese licences is seen as being similar to that identified offshore Gambia (Figure 6-1) and a description of the regional petroleum systems and main play types expected is given in Section 3
Figure 6-1 Petroleum systems and plays offshore Senegal
In 2012 APCL acquired 3600 km2 of multi-client 3D seismic data over the Offshore Sud Profond licence In addition 1500 km2 of legacy 3D data over the Rufisque Offshore Profond licence is currently being reprocessed by APCL and legacy 2D seismic data (c 7000 line km) have also been acquired APCL expects to begin prospect evaluation once seismic processing is complete which is expected later in 2013 At present a number of conceptual Cretaceous post-rift leads are identified by APCL (Figure 6-2)
Competent Personrsquos Report African Petroleum Corporation Limited
June 2013 79
Figure 6-2 leads offshore Senegal Blocks ROP and SOSP
Competent Personrsquos Report African Petroleum Corporation Limited
June 2013 80
7 Appendix 1 SPE PRMS Guidelines
SPEWPCAAPGSPEE Petroleum Reserves and Resources Classification System and Definitions
The Petroleum Resources Management System
Preamble
Petroleum Resources are the estimated quantities of hydrocarbons naturally occurring on or within the Earthrsquos crust Resource assessments estimate total quantities in known and yet-to-be-discovered accumulations Resources evaluations are focused on those quantities that can potentially be recovered and marketed by commercial projects A petroleum Resources managements system provides a consistent approach to estimating petroleum quantities evaluating development projects and presenting results within a comprehensive classification framework
International efforts to standardize the definitions of petroleum Resources and how they are estimated began in the 1930s Early guidance focused on Proved Reserves Building on work initiated by the Society of Petroleum Evaluation Engineers (SPEE) SPE published definitions for all Reserves categories in 1987 In the same year the World Petroleum Council (WPC then known as the World Petroleum Congress) working independently published Reserves definitions that were strikingly similar In 1997 the two organizations jointly released a single set of definitions for Reserves that could be used worldwide In 2000 the American Association of Petroleum Geologists (AAPG) SPE and WPC jointly developed a classification system for all petroleum Resources This was followed by additional supporting documents supplemental application evaluation guidelines (2001) and a glossary of terms utilized in Resources definitions (2005) SPE also published standards for estimating and auditing Reserves information (revised 2007)
These definitions and the related classification system are now in common use internationally within the petroleum industry They provide a measure of comparability and reduce the subjective nature of Resources estimation However the technologies employed in petroleum exploration development production and processing continue to evolve and improve The SPE Oil and Gas Reserves Committee works closely with other organizations to maintain the definitions and issues periodic revisions to keep current with evolving technologies and changing commercial opportunities
The SPE-PRMS consolidates builds on and replaces guidance previously contained in the 1997 Petroleum Reserves Definitions the 2000 Petroleum Resources Classification and Definitions publications and the 2001 ldquoGuidelines for the Evaluation of Petroleum Reserves and Resourcesrdquo the latter document remains a valuable source of more detailed background information
These definitions and guidelines are designed to provide a common reference for the international petroleum industry including national reporting and regulatory disclosure agencies and to support petroleum project and portfolio management requirements They are intended to improve clarity in
Competent Personrsquos Report African Petroleum Corporation Limited
June 2013 81
global communications regarding petroleum Resources It is expected that the SPE-PRMS will be supplemented with industry education programs and application guides addressing their implementation in a wide spectrum of technical andor commercial settings
It is understood that these definitions and guidelines allow flexibility for users and agencies to tailor application for their particular needs however any modifications to the guidance contained herein should be clearly identified The definitions and guidelines contained in this document must not be construed as modifying the interpretation or application of any existing regulatory reporting requirements
The full text of the SPEWPCAAPGSPEE Petroleum Resources Management System document hereinafter referred to as the SPE-PRMS can be viewed at
wwwspeorgspecmabinaryfiles6859916Petroleum_Resources_Management_System_2007pdf
Overview and Summary of Definitions
The estimation of petroleum resource quantities involves the interpretation of volumes and values that have an inherent degree of uncertainty These quantities are associated with development projects at various stages of design and implementation Use of a consistent classification system enhances comparisons between projects groups of projects and total company portfolios according to forecast production profiles and recoveries Such a system must consider both technical and commercial factors that impact the projectrsquos economic feasibility its productive life and its related cash flows
Petroleum is defined as a naturally occurring mixture consisting of hydrocarbons in the gaseous liquid or solid phase Petroleum may also contain non-hydrocarbons common examples of which are carbon dioxide nitrogen hydrogen sulphide and sulphur In rare cases non-hydrocarbon content could be greater than 50
The term ldquoResourcesrdquo as used herein is intended to encompass all quantities of petroleum naturally occurring on or within the Earthrsquos crust discovered and undiscovered (recoverable and unrecoverable) plus those quantities already produced Further it includes all types of petroleum whether currently considered conventionalrdquo or ldquounconventionalrdquo
Figure 1-1 is a graphical representation of the SPEWPCAAPGSPEE Resources classification system The system defines the major recoverable Resources classes Production Reserves Contingent Resources and Prospective Resources as well as Unrecoverable petroleum
Competent Personrsquos Report African Petroleum Corporation Limited
June 2013 82
Figure 1-1 SPEAAPGWPCSPEE Resources Classification System
The ldquoRange of Uncertaintyrdquo reflects a range of estimated quantities potentially recoverable from an accumulation by a project while the vertical axis represents the ldquoChance of Developmentrdquo that is the chance that the project that will be developed and reach commercial producing status
The following definitions apply to the major subdivisions within the Resources classification
TOTAL PETROLEUM INITIALLY-IN-PLACE
Total Petroleum Initially in Place is that quantity of petroleum that is estimated to exist originally in naturally occurring accumulations
It includes that quantity of petroleum that is estimated as of a given date to be contained in known accumulations prior to production plus those estimated quantities in accumulations yet to be discovered (equivalent to ldquototal Resourcesrdquo)
Competent Personrsquos Report African Petroleum Corporation Limited
June 2013 83
DISCOVERED PETROLEUM INITIALLY-IN-PLACE
Discovered Petroleum Initially in Place is that quantity of petroleum that is estimated as of a given date to be contained in known accumulations prior to production
PRODUCTION
Production is the cumulative quantity of petroleum that has been recovered at a given date
Multiple development projects may be applied to each known accumulation and each project will recover an estimated portion of the initially-in-place quantities The projects shall be subdivided into Commercial and Sub-Commercial with the estimated recoverable quantities being classified as Reserves and Contingent Resources respectively as defined below
RESERVES
Reserves are those quantities of petroleum anticipated to be commercially recoverable by application of development projects to known accumulations from a given date forward under defined conditions
Reserves must satisfy four criteria they must be discovered recoverable commercial and remaining based on the development project(s) applied Reserves are further subdivided in accordance with the level of certainty associated with the estimates and may be sub-classified based on project maturity andor characterized by their development and production status To be included in the Reserves class a project must be sufficiently defined to establish its commercial viability There must be a reasonable expectation that all required internal and external approvals will be forthcoming and there is evidence of firm intention to proceed with development within a reasonable time frame A reasonable time frame for the initiation of development depends on the specific circumstances and varies according to the scope of the project While five years is recommended as a benchmark a longer time frame could be applied where for example development of economic projects are deferred at the option of the producer for among other things market-related reasons or to meet contractual or strategic objectives
In all cases the justification for classification as Reserves should be clearly documented To be included in the Reserves class there must be a high confidence in the commercial producibility of the reservoir as supported by actual production or formation tests In certain cases Reserves may be assigned on the basis of well logs andor core analysis that indicate that the subject reservoir is hydrocarbon-bearing and is analogous to reservoirs in the same area that are producing or have demonstrated the ability to produce on formation tests
Proved Reserves
Proved Reserves are those quantities of petroleum which by analysis of geoscience and engineering data can be estimated with reasonable certainty to be commercially recoverable from a given date forward from known reservoirs and under defined economic conditions operating methods and government regulations
Competent Personrsquos Report African Petroleum Corporation Limited
June 2013 84
If deterministic methods are used the term reasonable certainty is intended to express a high degree of confidence that the quantities will be recovered If probabilistic methods are used there should be at least a 90 probability that the quantities actually recovered will equal or exceed the estimate The area of the reservoir considered as Proved includes
the area delineated by drilling and defined by fluid contacts if any and adjacent undrilled portions of the reservoir that can reasonably be judged as continuous with it and commercially productive on the basis of available geoscience and engineering data
In the absence of data on fluid contacts Proved quantities in a reservoir are limited by the lowest known hydrocarbon (LKH) as seen in a well penetration unless otherwise indicated by definitive geoscience engineering or performance data Such definitive information may include pressure gradient analysis and seismic indicators Seismic data alone may not be sufficient to define fluid contacts for Proved Reserves (see ldquo2001 Supplemental Guidelinesrdquo Chapter 8) Reserves in undeveloped locations may be classified as Proved provided that the locations are in undrilled areas of the reservoir that can be judged with reasonable certainty to be commercially productive and interpretations of available geoscience and engineering data indicate with reasonable certainty that the objective formation is laterally continuous with drilled Proved locations
For Proved Reserves the recovery efficiency applied to these reservoirs should be defined based on a range of possibilities supported by analogs and sound engineering judgment considering the characteristics of the Proved area and the applied development program
Probable Reserves
Probable Reserves are those additional Reserves which analysis of geoscience and engineering data indicate are less likely to be recovered than Proved Reserves but more certain to be recovered than Possible Reserves
It is equally likely that actual remaining quantities recovered will be greater than or less than the sum of the estimated Proved plus Probable Reserves (2P) In this context when probabilistic methods are used there should be at least a 50 probability that the actual quantities recovered will equal or exceed the 2P estimate
Probable Reserves may be assigned to areas of a reservoir adjacent to Proved where data control or interpretations of available data are less certain The interpreted reservoir continuity may not meet the reasonable certainty criteria Probable estimates also include incremental recoveries associated with project recovery efficiencies beyond that assumed for Proved
Possible Reserves
Possible Reserves are those additional Reserves which analysis of geoscience and engineering data indicate are less likely to be recoverable than Probable Reserves
Competent Personrsquos Report African Petroleum Corporation Limited
June 2013 85
The total quantities ultimately recovered from the project have a low probability to exceed the sum of Proved plus Probable plus Possible (3P) which is equivalent to the high estimate scenario When probabilistic methods are used there should be at least a 10 probability that the actual quantities recovered will equal or exceed the 3P estimate
Possible Reserves may be assigned to areas of a reservoir adjacent to Probable where data control and interpretations of available data are progressively less certain Frequently this may be in areas where geoscience and engineering data are unable to clearly define the area and vertical reservoir limits of commercial production from the reservoir by a defined project
Possible estimates also include incremental quantities associated with project recovery efficiencies beyond that assumed for Probable
Probable and Possible Reserves
(See above for separate criteria for Probable Reserves and Possible Reserves)
The 2P and 3P estimates may be based on reasonable alternative technical and commercial interpretations within the reservoir andor subject project that are clearly documented including comparisons to results in successful similar projects
In conventional accumulations Probable andor Possible Reserves may be assigned where geoscience and engineering data identify directly adjacent portions of a reservoir within the same accumulation that may be separated from Proved areas by minor faulting or other geological discontinuities and have not been penetrated by a wellbore but are interpreted to be in communication with the known (Proved) reservoir Probable or Possible Reserves may be assigned to areas that are structurally higher than the Proved area Possible (and in some cases Probable) Reserves may be assigned to areas that are structurally lower than the adjacent Proved or 2P area
Caution should be exercised in assigning Reserves to adjacent reservoirs isolated by major potentially sealing faults until this reservoir is penetrated and evaluated as commercially productive Justification for assigning Reserves in such cases should be clearly documented Reserves should not be assigned to areas that are clearly separated from a known accumulation by non-productive reservoir (ie absence of reservoir structurally low reservoir or negative test results) such areas may contain Prospective Resources
In conventional accumulations where drilling has defined a highest known oil (HKO) elevation and there exists the potential for an associated gas cap Proved oil Reserves should only be assigned in the structurally higher portions of the reservoir if there is reasonable certainty that such portions are initially above bubble point pressure based on documented engineering analyses Reservoir portions that do not meet this certainty may be assigned as Probable and Possible oil andor gas based on reservoir fluid properties and pressure gradient interpretations
Competent Personrsquos Report African Petroleum Corporation Limited
June 2013 86
CONTINGENT RESOURCES
Contingent Resources are those quantities of petroleum estimated as of a given date to be potentially recoverable from known accumulations by application of development projects but which are not currently considered to be commercially recoverable due to one or more contingencies
Contingent Resources may include for example projects for which there are currently no viable markets or where commercial recovery is dependent on technology under development or where evaluation of the accumulation is insufficient to clearly assess commerciality Contingent Resources are further categorized in accordance with the level of certainty associated with the estimates and may be sub-classified based on project maturity andor characterized by their economic status
UNDISCOVERED PETROLEUM INITIALLY-IN-PLACE
Undiscovered Petroleum Initially in Place is that quantity of petroleum that is estimated as of a given date to be contained within accumulations yet to be discovered
PROSPECTIVE RESOURCES
Prospective Resources are those quantities of petroleum which are estimated as of a given date to be potentially recoverable from undiscovered accumulations
Potential accumulations are evaluated according to their chance of discovery and assuming a discovery the estimated quantities that would be recoverable under defined development projects It is recognized that the development programs will be of significantly less detail and depend more heavily on analog developments in the earlier phases of exploration
Prospect
A project associated with a potential accumulation that is sufficiently well defined to represent a viable drilling target
Project activities are focused on assessing the chance of discovery and assuming discovery the range of potential recoverable quantities under a commercial development program
Lead
A project associated with a potential accumulation that is currently poorly defined and requires more data acquisition andor evaluation in order to be classified as a prospect
Project activities are focused on acquiring additional data andor undertaking further evaluation designed to confirm whether or not the lead can be matured into a prospect Such evaluation includes the assessment of the chance of discovery and assuming discovery the range of potential recovery under feasible development scenarios
Play
Competent Personrsquos Report African Petroleum Corporation Limited
June 2013 87
A project associated with a prospective trend of potential prospects but which requires more data acquisition andor evaluation in order to define specific leads or prospects
Project activities are focused on acquiring additional data andor undertaking further evaluation designed to define specific leads or prospects for more detailed analysis of their chance of discovery and assuming discovery the range of potential recovery under hypothetical development scenarios
The range of uncertainty of the recoverable andor potentially recoverable volumes may be represented by either deterministic scenarios or by a probability distribution When the range of uncertainty is represented by a probability distribution a low best and high estimate shall be provided such that
bull There should be at least a 90 probability (P90) that the quantities actually recovered will equal or exceed the low estimate
bull There should be at least a 50 probability (P50) that the quantities actually recovered will equal or exceed the best estimate
bull There should be at least a 10 probability (P10) that the quantities actually recovered will equal or exceed the high estimate
When using the deterministic scenario method typically there should also be low best and high estimates where such estimates are based on qualitative assessments of relative uncertainty using consistent interpretation guidelines Under the deterministic incremental (risk-based) approach quantities at each level of uncertainty are estimated discretely and separately
These same approaches to describing uncertainty may be applied to Reserves Contingent Resources and Prospective Resources While there may be significant risk that sub-commercial and undiscovered accumulations will not achieve commercial production it useful to consider the range of potentially recoverable quantities independently of such a risk or consideration of the resource class to which the quantities will be assigned
Evaluators may assess recoverable quantities and categorize results by uncertainty using the deterministic incremental (risk-based) approach the deterministic scenario (cumulative) approach or probabilistic methods (see ldquo2001 Supplemental Guidelinesrdquo Chapter 25) In many cases a combination of approaches is used
Use of consistent terminology (Figure 11) promotes clarity in communication of evaluation results For Reserves the general cumulative terms lowbesthigh estimates are denoted as 1P2P3P respectively The associated incremental quantities are termed Proved Probable and Possible Reserves are a subset of and must be viewed within context of the complete Resources classification system While the categorization criteria are proposed specifically for Reserves in most cases they can be equally applied to Contingent and Prospective Resources conditional upon their satisfying the criteria for discovery andor development
Competent Personrsquos Report African Petroleum Corporation Limited
June 2013 88
For Contingent Resources the general cumulative terms lowbesthigh estimates are denoted as 1C2C3C respectively For Prospective Resources the general cumulative terms lowbesthigh estimates still apply No specific terms are defined for incremental quantities within Contingent and Prospective Resources
Without new technical information there should be no change in the distribution of technically recoverable volumes and their categorization boundaries when conditions are satisfied sufficiently to reclassify a project from Contingent Resources to Reserves All evaluations require application of a consistent set of forecast conditions including assumed future costs and prices for both classification of projects and categorization of estimated quantities recovered by each project
Competent Personrsquos Report African Petroleum Corporation Limited
June 2013 89
8 Appendix 2 Nomenclature
81 Units degC degrees Celsius
degF degrees Fahrenheit
bbl barrel
cp centipoises
ft feet
ftMDRKB feet below Kelly Bushing
ftTVDSS feet subsea
km kilometres
m metres
M or MM thousands and millions respectively
ms metres per second
md millidarcy
mTVDSS metres subsea
psia pounds per square inch absolute
psig pounds per square inch gauge
pu porosity unit
rb reservoir barrels
stb a stock tank barrel which is 42 US gallons measured at 147 pounds per square inch and 60 degrees Fahrenheit
82 Reserves and Resources Classifications
Low Low estimate of Prospective Resources as defined in SPE PRMS 2007
Best Best estimate of Prospective Resources as defined in SPE PRMS 2007
High High estimate of Prospective Resources as defined in SPE PRMS 2007
COS Geological Chance of Success associated with Prospective Resources
P10 10 per cent probability = Proved + Probable + Possible or 3P
P50 50 per cent probability = Proved + Probable or 2P
P90 90 per cent probability = Proved or 1P
83 Abbreviations AvO amplitude variation with offset
Bo oil shrinkage factor or formation volume factor in rbstb
Competent Personrsquos Report African Petroleum Corporation Limited
June 2013 90
CPI computer processed information log
FVF formation volume factor
FWL free water level
GRV gross rock volume
GWC gas water contact
KB kelly bushing
kh permeability thickness
MD measured depth
MSL mean sea level
NG net to gross ratio
OWC oil water contact
Phi porosity
PSC production sharing contract
PSDM post stack depth migration
PSTM post stack time migration
PVT pressure volume temperature experiment
RFT repeat formation tester
So oil saturation
Soi initial oil saturation
SS Subsea
STOIIP stock tank oil initially in place
Sw water saturation
Swc connate water saturation
TD total depth
TOC total organic carbon
TVD true vertical depth
TWT two way time
Vsh shale volume
Competent Personrsquos Report African Petroleum Corporation Limited
June 2013 91
Enclosures Resource Summary Sheets
Enclosure 11 Summary Description Sheet Barbet Prospect
SummaryBlock 9
APC Interest () 100
Fluid Oil
Crest (m ss) 3000
Water depth (m) 750
Notes
Area Shape F Areal NG Net Thick Porosity SO Bo STOIIP Rf Rec Res(km2) (frac) () (m) () () (rbstb) (MMstb) (frac) (MMstb)
Charge 90
Reservoir 70 Low 14 085 62 22 13 73 135 166 0300 60
Trap 50 Best 37 090 80 34 17 80 150 500 0375 186
Seal 70 High 98 095 98 53 20 88 165 1479 0450 558
COS 22 Deterministic inputs probabilistic STOIIP and Rec Resource Mean 270
Stratigraphic trap with amplitude support
Geological Risk Matrix
P10
P90metres
BARBET
dtdƐͿ
ϬŬŵϰ
Enclosure 12 Summary Description Sheet Sunbird Prospect Campanian Reservoir
SummaryBlock 8 amp 9
APC Interest () 100
Fluid Oil
Crest (m ss) 3000
Water depth (m) 1300
Notes
Area Shape F Areal NG Net Thick Porosity SO Bo STOIIP Rf Rec Res(km2) (frac) () (m) () () (rbstb) (MMstb) (frac) (MMstb)
Charge 80
Reservoir 80 Low 12 070 43 27 18 73 130 177 0300 63
Trap 60 Best 27 080 69 42 21 80 145 461 0375 172
Seal 70 High 61 090 95 66 24 88 165 1187 0450 448
COS 27 Deterministic inputs probabilistic STOIIP and Rec Resource Mean 229
Stratigraphic trap with amplitude support Split by intra-canyon
high
Geological Risk Matrix
P90
P10
metres
SUNBIRD
dtdƐͿ
ϬŬŵϰSUNBIRD
Enclosure 13 Summary Description Sheet Sunbird prospect Turonian Reservoir
SummaryBlock 8 amp 9
APC Interest () 100
Fluid Oil
Crest (m ss) 3300
Water depth (m) 1300
Notes
Area Shape F Areal NG Net Thick Porosity SO Bo STOIIP Rf Rec Res(km2) (frac) () (m) () () (rbstb) (MMstb) (frac) (MMstb)
Charge 90
Reservoir 60 Low 8 085 65 24 14 73 140 107 0300 39
Trap 50 Best 21 090 80 37 17 80 158 307 0375 115
Seal 70 High 53 095 94 58 20 88 175 863 0450 327
COS 19 Deterministic inputs probabilistic STOIIP and Rec Resource Mean 162
Stratigraphic trap with amplitude support Split by intra-canyon
high
Geological Risk Matrix
SW NE
Campanian Jacana Channel
Turonian BFF
P90
P10
metres
SUNBIRD
ϬŬŵϰ
Enclosure 14 Summary Description Sheet Sunbird Prospect Cenomanian Reservoir
SummaryBlock 8 amp 9
APC Interest () 100
Fluid Oil
Crest (m ss) 3500
Water depth (m) 1300
Notes
Area Shape F Areal NG Net Thick Porosity SO Bo STOIIP Rf Rec Res(km2) (frac) () (m) () () (rbstb) (MMstb) (frac) (MMstb)
Charge 100
Reservoir 50 Low 10 060 71 21 14 73 140 91 0300 33
Trap 60 Best 25 070 85 33 17 80 158 264 0375 99
Seal 60 High 65 080 99 51 20 88 175 779 0450 294
COS 18 Deterministic inputs probabilistic STOIIP and Rec Resource Mean 141
Stratigraphic trap with amplitude support Split by intra-canyon
high
Geological Risk Matrix
P90
P10
metres
SUNBIRD
dtdƐͿ
ϬŬŵϮ
Enclosure 15 Summary Description Sheet Lovebird Prospect Blue Horizon
SummaryBlock 8
APC Interest () 100
Fluid Oil
Crest (m ss) 5000
Water depth (m) 2850
Notes
GRV NG Porosity SO Bo STOIIP Rf Rec Res(MMm2) () () () (rbstb) (MMstb) (frac) (MMstb)
Charge 54
Reservoir 60 Low 354 30 14 60 150 68 030 25
Trap 70 Best 1310 54 19 70 180 293 038 109
Seal 90 High 4849 73 24 80 210 1218 045 456
COS 20 Mean 201
Four way dip closure to south of Block 8 Three potential
reservoirs identified Blue and Green horizon volumetrics derived
assuming ispoachous to Pink
Geological Risks
ŝŐŚĂƐĞWŝŶŬĞƉƚŚDĂƉ
Enclosure 16 Summary Description Sheet Lovebird Prospect Pink Horizon
SummaryBlock 8
APC Interest () 100
Fluid Oil
Crest (m ss) 5400
Water depth (m) 2850
Notes
GRV NG Porosity SO Bo STOIIP Rf Rec Res(MMm2) () () () (rbstb) (MMstb) (frac) (MMstb)
Charge 54
Reservoir 60 Low 354 30 12 60 155 59 030 22
Trap 70 Best 1310 54 17 70 188 262 038 96
Seal 90 High 4849 73 22 80 220 1066 045 400
COS 20 Mean 178
Four way dip closure to south of Block 8 Three potential
reservoirs identified Blue and Green horizon volumetrics derived
assuming ispoachous to Pink
Geological Risks
ŝŐŚĂƐĞWŝŶŬĞƉƚŚDĂƉ
Enclosure 17 Summary Description Sheet Lovebird Prospect Green Horizon
SummaryBlock 8
APC Interest () 100
Fluid Oil
Crest (m ss) 5800
Water depth (m) 2850
Notes
GRV NG Porosity SO Bo STOIIP Rf Rec Res(MMm2) () () () (rbstb) (MMstb) (frac) (MMstb)
Charge 54
Reservoir 60 Low 354 30 10 60 160 48 030 18
Trap 70 Best 1310 54 15 70 195 210 038 78
Seal 90 High 4849 73 20 80 230 896 045 337
COS 20 Mean 150
Four way dip closure to south of Block 8 Three potential
reservoirs identified Blue and Green horizon volumetrics derived
assuming ispoachous to Pink
Geological Risks
ŝŐŚĂƐĞWŝŶŬĞƉƚŚDĂƉ
Enclosure 18 Summary Description Sheet Wildbird Prospect
SummaryORFN $3ampQWHUHVW )OXLG 2LOampUHVWPVV DWHUGHSWKP P
Notes
Play Risk Prospect RiskGRV NG Porosity SO Bo STOIIP Rf Rec Res
6RXUFH 7UDS (MMm2) () () () (rbstb) (MMstb) (frac) (MMstb)6HDO ampKDUJH 5HVHUYRLU3UHV 5HVHUYRLU(II Low
Best High
COS 9 Deterministic inputs probabilistic STOIIP and Rec Resource Mean
)RXUZDGLSFORVHGKLJK
5
0 km 5
6 1(
PVV
Wildbird Horizons
ODFNEHUULJKWOXH3LQN5HG
mss
Enclosure 19 Summary Description Sheet Night Heron Prospect
SummaryORFN $3ampQWHUHVW RIORFN)OXLG 2LOampUHVWPVV DWHUGHSWKP
Notes
Prospect Risk Area Areal NG Net Porosity SO Bo STOIIP Rf Rec ResampKDUJH (km2) (frac) (m) () () (rbstb) (MMstb) (frac) (MMstb)5HVHUYRLU 7UDS Low 6HDO Best
High COS 144 Deterministic inputs probabilistic STOIIP and Rec Resource Mean 759
1LJKW+HURQLVD7XURQLDQEDVLQIORRUIDQVVWHPZKLFKPDLQOOLHVZLWKLQEORFNRIIVKRUHLEHULDWLVLGHQWLILHGDVDVWUDWLJUDSKLFWUDSZLWKDUHDOH[WHQWVGHILQHGEDPSOLWXGHWUXQFDWLRQDQGVWUXFWXUDOSLQFKRXW$QDUHDQHWDSSURDFKZDVDGRSWHGXVLQJWKHIXOOVWDFN360GHSWKLPDJHYROXPHWRSURYLGH61$H[WUDFWLRQDQGFRQVWUDLQDUHDOH[WHQWDQGHVWLPDWHDQDUHDO1WRDFFRXQWIRUODWHUDOYDULDELOLWZLWKLQWKHUHVHUYRLU1LJKW+HURQIDOOVSDUWORIIEORFN(5amp(FRUUHFWIRUWKLVXVLQJWKHUDWLRRIRQEORFNWRRIIEORFNDUHDLQUHSRUWLQJRIQHWXQULVNHGDQGQHWULVNHGUHVXOWV
6HLVPLFLQH36061$([WUDFWLRQ
Arbitrary line across Night Heron PSDM (Depth m)
S NE
2QWKHXSGLSSLQFKRXWLVGHILQHGELVRSDFKDQGDPSOLWXGHWUXQFDWLRQ
2QWKHXSGLSSLQFKRXWLVGHILQHGRQOELVRSDFK
Bee EaterNight Heron
5 Km
RMS Amplitudes from BFF Isopach
Depth (m)
Block Boundary
Enclosure 21 Summary Description Sheet
Summary - M - CretBlock A1
Working Interest () 60
Fluid Oil
Crest (m) 3130 (1070 bml)
Water depth (m) 2220
Notes
Play Risk Prospect Risk Area Stack F Net Porosity SO Bo STOIIP Rf Rec Res(Km2) (frac) (m) () () (rbstb) (MMstb) (frac) (MMstb)
Source 70 Trap 54
Seal 50 Mig 80 Low 8 1 15 10 55 125 82 010 13
Res Pres 80 Res Eff 80 Best 14 1 30 16 65 117 231 023 43
28 35 High 26 1 60 22 75 110 629 035 141
COS 10 Deterministic inputs probabilistic STOIIP and Rec Resource Mean 66
Structural high along edge of buried carbonate platform margin of
probable Lower Cretaceous and Jurassic age Seismic evidence
favourable for reservoir development Lower Bo model used to
reflect relatively shallow nature of prospect The prospect is close
to the shelf margin and so is well placed for charging The strong
rugose seismic events are interpreted as Karstified Limestones
Seismic Line Top Structure Map
WƌŽƐƉĞĐƚD
ĞƉƚŚŵ
Ϳ
Enclosure 22 Summary Description Sheet
Summary - SS - 4Block A1
Working Interest () 60
Fluid Oil
Crest (m) 4230 (2010 bml)
Water depth (m) 2220
Notes
Play Risk Prospect Risk Area Stack F Net Porosity SO Bo STOIIP Rf Rec Res(Km2) (frac) (m) () () (rbstb) (MMstb) (frac) (MMstb)
Source 70 Trap 80
Seal 90 Mig 85 Low 6 1 10 16 68 220 43 030 16
Res Pres 80 Res Eff 50 Best 11 1 19 20 75 167 113 038 42
50 34 High 21 1 35 24 83 135 295 045 112
COS 17 Deterministic inputs probabilistic STOIIP and Rec Resource Mean 56
Four way dip closed anticlinal structure The SS-4 interval has a
gross thickness over the crest area of 360 m Downlap of seismic
events across the crest of the SS-4 structure slightly downgrades
SS-4 seal The interval is believed to be Cenomanian in age and
the seismic character of generally planar events is interpreted as
representing thin bedded turbidites
Seismic Line Top Structure Map
2010 Migration Velocity Data ndash SS-4 Probability Above Spill
Enclosure 23 Summary Description Sheet
Summary - SS - 3Block A1
Working Interest () 60
Fluid Oil
Crest (m) 4590 (2370 bml)
Water depth (m) 2220
Notes
Play Risk Prospect Risk Area Stack F Net Porosity SO Bo STOIIP Rf Rec Res(Km2) (frac) (m) () () (rbstb) (MMstb) (frac) (MMstb)
Source 70 Trap 75
Seal 90 Mig 85 Low 12 1 20 15 68 227 197 025 63
Res Pres 80 Res Eff 50 Best 17 15 35 18 75 173 417 034 143
50 32 High 25 2 60 20 83 140 881 045 316
COS 16 Deterministic inputs probabilistic STOIIP and Rec Resource Mean 173
Four way dip closed anticlinal structure The SS-3 interval has a
gross thickness over the crest area of 550 m Seals to deeper
reservoirs may be eroded by overlying reservoirs From seismic
the prospective reservoir has been interpreted as being an Albian
deep water channel-lobe complex
Seismic Line Top Structure Map
2010 Migration Velocity Data ndashSS-3 Probability Above Spill
Enclosure 24 Summary Description Sheet
Summary - SS - 2Block A1
Working Interest () 60
Fluid Oil
Crest (m) 5140 (2920 bml)
Water depth (m) 2220
Notes
Play Risk Prospect Risk Area Stack F Net Porosity SO Bo STOIIP Rf Rec Res(Km2) (frac) (m) () () (rbstb) (MMstb) (frac) (MMstb)
Source 70 Trap 75
Seal 90 Mig 85 Low 12 1 20 11 68 231 187 025 58
Res Pres 80 Res Eff 50 Best 17 2 35 14 75 183 416 032 133
50 32 High 25 3 60 17 83 151 911 040 303
COS 16 Deterministic inputs probabilistic STOIIP and Rec Resource Mean 163
Four way dip closed anticlinal structure The SS-2 interval has a
gross thickness over the crest area of 830 m The prospective
reservoir has been interpreted as a stacked series of channellobe
sets Seals to deeper reservoirs may be eroded by overlying
reservoirs
Seismic Line Top Structure Map
2010 Migration Velocity Data ndashSS-2 Probability Above Spill
Enclosure 25 Summary Description Sheet
Summary - SS - 1Block A1
Working Interest () 60
Fluid Oil
Crest (m) 5970 (3750 bml)
Water depth (m) 2220
Notes
Play Risk Prospect Risk Area Stack F Net Porosity SO Bo STOIIP Rf Rec Res(Km2) (frac) (m) () () (rbstb) (MMstb) (frac) (MMstb)
Source 70 Trap 65
Seal 90 Mig 80 Low 17 1 20 8 50 249 158 015 34
Res Pres 80 Res Eff 50 Best 30 2 35 11 60 196 399 024 98
50 26 High 54 3 60 13 70 162 997 040 276
COS 13 Deterministic inputs probabilistic STOIIP and Rec Resource Mean 135
Four way dip closed anticlinal structureThe SS-1 interval has a
gross thickness over the crest area of 890 m The prospective
reservoir lies under an unconformity and is believed to be Jurassic
in age its seismic character suggests a channel amp channel-levee
complex Regional porosity trends indicate low porosities are likely
to be encountered if hydrostatic pressures are assumed
Seismic Line Top Structure Map
2010 Migration Velocity Data ndash SS-1 Probability Above Spill
Enclosure 31 Summary Description Sheet
SummaryBlock SL-03
APCL Interest () 90
Fluid Oil
Crest (m ss) 5400
Water depth (m) 3300
Notes
Play Risk Prospect Risk Area Areal NG Net Porosity SO Bo STOIIP Rf Rec Res(km2) (frac) (m) () () (rbstb) (MMstb) (frac) (MMstb)
Source 80 Trap 50
Seal 90 Mig 70 Low 11 070 29 15 73 205 218 030 79
Res Pres 90 Res Eff 80 Best 32 082 56 18 80 162 755 038 278
65 28 High 92 094 83 21 88 134 2473 045 938
COS 18 Mean 434
Altair is a Turonian turbidite channel prospects within the
SL-03 Block offshore Sierra Leone It is identified as a
stratigraphic trap with areal extents defined by amplitude
truncation and structural pinchout Recent discoveries in
nearby blocks confirm a working hydrocarbon system
(Venus-B1 Jupiter-1 and Mercury-1) The Sierra Leone
wells A-1 and A1-2 proved good reservoir and potential
source rocks Two distinct canyon systems feed erosive
channels at the break of slope An area net approach was
adopted using a pseudo-gradient volume SNA extraction to
constrain areal extent and define an areal NG to account
for lateral variability of sand distribution within the
reservoir
Arbitrary Dip Line Grad TWTGrad NRMS Extraction
Enclosure 41 Summary Description Sheet
SummaryBlock CI-513
APCL Interest () 90
Fluid Oil
Crest (m ss) 4200
Water depth (m) 2500
Notes
Play Risk Prospect Risk Area Areal NG Net Porosity SO Bo STOIIP Rf Rec Res(km2) (frac) (m) () () (rbstb) (MMstb) (frac) (MMstb)
Source 60 Trap 50
Seal 90 Mig 70 Low 11 070 20 17 73 181 179 030 65
Res Pres 90 Res Eff 80 Best 40 085 38 20 80 149 815 038 302
49 28 High 149 099 55 23 88 126 3474 045 1318
COS 14 Mean 569
Ayame is an Upper Cretaceous fan which mainly lies
ZLWKLQEORFNampRIIVKRUHampRWHparaYRLUHWLVLGHQWLILHGas a stratigraphic trap with areal extents defined by
amplitude truncation and structural pinchout The prospect
has very good amplitude support An area net approach
was adopted using pseudo-gradient volume SNA NRMS
extractions to constrain areal extent and define an areal
NG to account for lateral variability of sand distribution
within the reservoir for low and high case area polygons
These seismically defined polygons were then filled to
column heights of 200m and 800m respectively and used
to constrain the P90 and P10 area inputs of our
probabilistic simulation
Seismic Line
TWT Grad SNA Extraction
Ayame
Ayame West
dtdƐͿ
Ayame
Enclosure 42 Summary Description Sheet
SummaryBlock CI-513 amp Open
APCL Interest () 90 in CI-513
Fluid Oil
Crest (m ss) 4900
Water depth (m) 2700
Notes
Play Risk Prospect Risk Area Areal NG Net Porosity SO Bo STOIIP Rf Rec Res(km2) (frac) (m) () () (rbstb) (MMstb) (frac) (MMstb)
Source 60 Trap 50
Seal 90 Mig 70 Low 10 061 25 14 73 194 161 030 58
Res Pres 90 Res Eff 80 Best 30 080 47 18 80 159 585 038 216
49 28 High 93 099 69 21 88 134 2085 045 788
COS 14 Mean 352
A second prospect within the same reservoir interval was
identified and volumetrically assessed Ayame West is
separated from Ayame by a structural high isopach
thinning and amplitude dimming The prospect was
assessed in the same manner as Ayame with a but with
Low Case column height of 600m filling down to the point
at which amplitudes between the two fans brighten
allowing possible communication The upper end of the
Ayame West fan lies down-dip of Ayame and less than
1km away from the thinning low amplitude saddle between
the two prospects
Seismic Line
TWT Grad SNA Extraction
Ayame
West
Ayame West
dtdƐͿ
Ayame
Enclosure 43 Summary Description Sheet
SummaryBlock CI-513 CI-509
APCL Interest () 90 of CI-513
Fluid Oil
Crest (m ss) 4400
Water depth (m) 2500
Notes
Play Risk Prospect Risk Area Areal NG Net Porosity SO Bo STOIIP Rf Rec Res(km2) (frac) (m) () () (rbstb) (MMstb) (frac) (MMstb)
Source 60 Trap 40
Seal 90 Mig 70 Low 6 070 15 16 73 185 71 030 26
Res Pres 90 Res Eff 70 Best 23 084 28 19 80 152 320 038 118
49 20 High 92 098 42 22 88 129 1408 045 521
COS 10 Mean 237
This sheet refers to volumes associated with Blocks 513 and CI-509 Sassandra is an Upper Cretaceous fan
which straddles blocks CI-513 and CI-509 It is identified
as a stratigraphic trap with areal extents defined by
amplitude truncation and structural pinchout A single
target reservoir is identified within the Turonian The
prospect has good amplitude support An area times net
approach was adopted using a pseudo-gradient volume
NRMS extraction to constrain prospect size Angle stacks
were not available outside of Block CI-513 so an RMS
extraction on the full stack volume was used to determine
NW extent In our low case we restrict the area of the
accumulation to the brightest area of anomalous
amplitudes Our high case extends the prospect down-dip
Arbitrary Dip Line Grad TWT
Full Stack - RMS Extraction
Sassandra
dtdƐͿ
Enclosure 44 Summary Description Sheet
SummaryBlock CI-513
APCL Interest () 90
Fluid Oil
Crest (m ss) 3900
Water depth (m) 2500
Notes
Play Risk Prospect Risk Area Areal NG Net Porosity SO Bo STOIIP Rf Rec Res(km2) (frac) (m) () () (rbstb) (MMstb) (frac) (MMstb)
Source 60 Trap 40
Seal 90 Mig 70 Low 4 071 20 19 73 185 67 030 25
Res Pres 90 Res Eff 70 Best 13 085 38 22 80 152 281 038 104
49 20 High 46 099 55 25 88 129 1142 045 431
COS 10 Mean 190
Cavalla is an Upper Cretaceous Fan which lies between
the Ayame and Sassandra prospects of Block CI-513
RIIVKRUHampRWHparaYRLUHWLVLGHQWLILHGDVDVWUDWLJUDSKLFtrap with areal extents defined by amplitude truncation and
structural pinchout A single target reservoir is identified
within the TuronianCenomanian interval which lies
stratigraphically beneath the Ayame Prospect For the
amplitude analysis the top reservoir has been shifted up
30ms to bracket strong negative amplitudes on the
Gradient volume and the base reservoir has been shifted
up 50ms to remove Albian related amplitudes An area net
approach was adopted using pseudo-gradient volume SNA
NRMS extractions to constrain extent of the low and high
case area polygons These seismically defined polygons
were then filled to column heights of 200m and 800m
respectively
Arbitrary Dip Line Grad TWT Grad NRMS Extraction
Cavalla
dtdƐͿ
Enclosure 45 Summary Description Sheet
SummaryBlock CI-509
APCL Interest () 90
Fluid Oil
Crest (m ss) 3700
Water depth (m) 2500
Notes
Play Risk Prospect Risk Area Areal NG Net Porosity SO Bo STOIIP Rf Rec Res(km2) (frac) (m) () () (rbstb) (MMstb) (frac) (MMstb)
Source 60 Trap 60
Seal 90 Mig 70 Low 5 076 39 21 73 150 252 015 55
Res Pres 90 Res Eff 80 Best 18 088 75 24 80 134 997 028 258
49 34 High 61 100 111 27 88 121 3682 040 1039
COS 16 Mean 460
Leraba is an Upper Cretaceous fan It is identified as a
stratigraphic trap with extents defined by amplitude
truncation and structural pinchout The final processing
products and AvO volumes are yet to be delivered for CI-
KRZHYHUWKHmicroHRWUDFHUDZPLJUDWLRQVWDFNparaYROXPHLVof high quality and is deemed suitable for deriving a
volumetric range for Leraba An area net approach was
adopted using an RMS extraction to constrain extent and
define an areal NG to account for lateral variability of sand
distribution In our low case we restrict the area to the
brightest area of anomalous amplitudes Our high case
extends the prospect down-dip and SW to include a
secondary channel system
Arbitrary Dip Line TWT Full Stack RMS Extraction
Leraba
dtdƐͿ