Embed Size (px)
Citation preview
179
Reaction Kinetics for the Synthesis of Methanol from CO and H2 on a Copper Catalyst Reaktionskinetik der Methanolsynthese aus CO und H, auf einem Kupferkatalysator
M. KUCZYNSKI, W. I. BROWN& H. J. FONTEIN and K. R. WESTERTERP
Chemical Reaction Engineering Laboratories, Department of Chemical Engineering, Twente University of Technology, P.O. Box 217, 7500 AE Enschede (The Netherlands)
(Received May 12, 1986; in final form December 15, 1986)
Abstract
The kinetics for the low-pressure synthesis of methanol from CO and H, were studied in a small integral reactor. The mole fraction of CO was varied from 0.1 to 0.54, the total pressure from 3 to 9 MPa and the temperature from 483 to 545 K.
Using the maximum likelihood approach, seventeen possible reaction rate correlations were evaluated statis- tically. Among these models three appear to fit the experimental data satisfactorily.
Kurzfassung
Kinetische Untersuchungen der Methanolsynthese aus CO and H, mit einem Niederdruckkatalysator wurden in einem kleinen, integralen Versuchsreaktor durchgefiihrt. Die Molfraktion des Kohlenmonoxids im Synthesegas, der Totaldruck und die Temperatur wurden entsprechend von 0.1 bis 0.54, von 3 bis 9 MPa und von 483 bis 545 K variiert.
Siebzehn verschiedene Reaktionsgeschwindigkeitsansatze wurden einer auf dem ‘Maximum Likelihood Prinzip’ griindenden statistischen Auswertung unterworfen. Drei Ansatze ergaben eine befriedigende Ueberein- stimmung mit den MeBdaten.
Synopse
Die katalytische Hydrierung des Kohlenmonoxids ist heute der wichtigste Produktionsweg zum Methanol [I]. Trotz der scheinbaren Simplizitiit der mit Gl. (I) vorgestellten Reaktion ergaben bisherige Studien [2-151 kein eindeutiges mechanistisches Bild dieser Reaktion (Tab. I). Durchfiihrung genauer Messungen und Verar - beitung der MeBdaten wet-aim durch die drastischen Reaktionsbedingungen, das stark exotherme Verhalten der Reaktion, sowie durch das Auftreten verschiedener Nebenreaktionen (GI. (2)-(6)) bedeutend erschwert. In der vorliegenden Arbeit beabsichtigten wir eine adti- quate kinetische Korrelation fur die Reaktion (I) auf dem BASF S3-85 Niederdruckkatalysator zu finden. Auch die Lebensdauer des Katalysators in Abwesenheit des Kohlendioxids im Synthesegas solite festgestellt werden.
Bronzeblock zum Temperaturausgleich ausgestattet (Abb. 2(a)). Das Katalysator-Festbett besteht aus (0.7- 1.2) x IO-‘m Katalysator-Splintern die mit zer- mahlenem Alumina-Trager vermistiht sind, so dap die Katalysatorbett-Ldnge 40 x lop3 m betriigt. Der To- taldruck wird mit einem Druckregler eingestellt. Die Stabilittit und Homogenitiit der Temperatur wird mit fiinf kalibrierten Thermoelementen kontrolliert. Die Temperaturregelung erfolgt automatisch mit Hilfe eines Hewlett-Packard 9826 PC. Kalibrierte CO/H, Mischungen werden dem Reaktor aus einer Batterie von Hockdruck-Zylindern zugefiihrt. Der Gasdurch- satz wird mit zwei Priizisionsventilen am Reaktoraus- gang geregelt und mittels einer Gasuhr gemessen. Die Analyse der Gasgemische am Eingang sowie am Aus- gang des Reaktors erfolgt gaschromatograjisch mit Hilfe eines WdrmeIeitftihigkeitsdetektors. Als Trager- gas wird Wasserstofl verwendet.
Das Mejsystem ist auf Abb. 1 gezeigt. Ein Festbett- Vor der Inbetriebnahme wird der Katalysator mit reaktvr von integralem Typ wurde wegen seines beson- N,lH,-Gemischen - bei steigendem Molenbruch von ders einfachen Aufbaus gewiihlt. Der IO x 10e6 m3 Wasserstoff unter 0.4 MPa und bei 443-523 K langsam Reaktor hat einen Durchmesser von 8 x 10e3 m und ist reduziert. Nach 3-tiigiger Formierung stabilisiert sich mit einem elektrischen Qfen sowie mit einem massiven
. . die Akttvttat des Katalysatormusters. Eine Messung
OZSS-2701/87/%3SO Chem. Eng. Process., 21 (1987) 179491 0 Elsevier Sequoia/Printed in The Netherlands
180
heginnt mit der Einstellung der gewiinschten Temper- atur, des Totaldruckes und der Gasbelastung. Nach der 2 his 6 Stunden dauernden Stabilisierung werden der Gasdurchsatz am Reaktorausgang, die Zusammenset- zung des Produktgases und das axiale Temperaturprofl im Festbett bestimmt und kiinnen die gewiinschten Werte zu einem neuen Mejpunkt eingestellt werden. . . Zur Kontrolle der Akttvttat des Katalysators wurden mehrmals Standardmessungen wiederholt.
Es wurde festgestellt, daB die Nebenreaktionen nach Gl. (5) undloder (6) bei niedrigen Gasdurchsiitzen nicht vernachliissigbar sind. Bei hohen Partialdriicken von Dimethyhither verliert der Katalysator seine Akttvttat innerhalb von einigen Tagen. Eine sehr schnelle (inner- halb von 2 Stunden) und vollstiindige Degradation wurde such bei sehr hohen Molenbriichen von CO von etwa 0.90 im Synthesegas festgestellt.
Insgesam t wurden 110 Messungen im Versuchsreak- tor durchgefiihrt (Tab. 4). Da die Reaktion stark exotherm verliiuft (AH,,, = - 91 kJ mol- ‘), konnte das Katalysator-Festbett nicht exakt isotherm gehalten werden: in der Reaktorachse wurden Temperaturunter- schiede bis zu 3 K gemessen. Zu weiteren Berechnungen wurde ein mittlerer Wert nach Gl. (7) verwendet.
Der Berechnung experimen teller CO - Umsetzungs- grade cc0 liegt Gl. (8) zugrunde. Die Stoflilanz beziiglich des Kohlenstojs wird mit Gl. (9) kontrolliert. Der Gasdurchsatz am Reaktorausgangfolgt aus GI. (IO) und die ‘Kontaktzeit’ t wird mit Gl. (1 I) berechnet. Auf Abb. 3 sind typische Me8daten gezeigt. Aus einer Feh- lerbetrachtung folgte die Schlu~folgerung, dafI die wesentlichen Fehler der Messungen auf die Temperatur - gradienten im Katalysatorbett zuriickgehen. Es ist aber such zwetfelhaft, ob man durch den Einsatz eines Dt~erentialreaktors mit innerem Kreislauf die TemperaturmePfehler vollstiindig beseitigen kann [lo, 12, 13, 15’. Die MeBfehler werden teilweise such dem promovierenden EinfluB des nach Gl. (2), (5) undl . . oder (6) geihildeten Wassers auf die Aktmttat des Katalysators [7] zugeschrieben.
Die 17 Langmuir-Hinshelwood und Eley-Rideal Reaktionsmodelle (Tab. 3) wurden einer statistischen Auswertung unterworfen. Dazu wurde das RKPES Pro- gram herangezogen, das von Klaus und Rippin [I 91 en t - worfen wurde. Der Berechnung des CO-Umsatzes liegt GI. (12) zugrunde, wobei die speztj?srhe Reaktions- geschwindigkeit R,, eine Funktion der Temperatur und der Fugazitiiten von den Reaktionskomponenten ist. Diese Fugazitiiten $ri werden mit Gl. (13) berechnet, wobei die Molfraktionen y, aus Gl. (14))(16)folgen. Die Fugazitiitskoefizienten f; ergeben sich aus den von Peng und Robinson [20] gegebenen Gl. (I 7)-(18). Die Gleichgewichtskonstante der Reaktion (I)folgt aus Gl. (19). Mit Hi@ des RKPES-Programms wurden die optimalen Werte der kinetischen Parametern in den 17 Ansatzen berechnet. Zur Auswahl der adiiquaten Ansiitze’wurden drei Faktoren beachtet:
(1) Summe der Abstandsquadrate; (2) T-Parameter (Quotient der Parameter- Werte
und ihrer Standardabweichungen); (3) Symmetrie der Verteilung der Abweichungen. Drei der gepriiften Anstitze (Nr. 1, 4 und 12 in Tab.
3) ergeben eine gute Uebereinstimmung mit den MeBdaten (Tab. 6). Auf Ahh. (4) wird die Verteilung der Abweichungen fur diese Ansiitze gezeigt. Abbildung 5 demonstriert dagegen eine nicht-symmetrische Verteilung eines verworfenen Ansatzes. Ansatz 1 wurde such von anderen Autoren [2, 13lgefunden. Wegen der niedrigen T- Werte kdnnen wir beziiglich der miigli- then Reaktionsmechanismen keine Schluafolgerungen ziehen.
Zur Berechnung der Reaktionsgeschwindigkeit Rco kann man entweder GI. (20) oder Gl. (21) gebrauchen. Die von uns gefundenen Reaktionsgeschwindigkeiten sind urn etwa einen Faktor 6nierdriger al.7 diejenige von Seyfert und Luft [12] fur denselben Katalysator fest- gestellten. Dieser Unterschied ist prim& durch die Ab- wesenheit des Kohlendioxids in unseren Synthesegasen bedingt. Auch ohne CO, behalt der BASF S3-85 . . . Methanolkontakt monatenlang seine Akttvttat und Selektivitiit. Das Auftreten von Nebenreaktionen und die Fehler der Temperaturmessungen verursachen die relativ grogen MeBfehler im Integralreaktor.
Introduction
The catalytic hydrogenation of carbon monoxide is nowadays the most important route to methanol pro- duction. In spite of its apparent simplicity, experimen- tal studies of the reaction
CO + 2H, = CH,OH (I)
hitherto did not result in an unequivocal mechanistic reaction model, possibly due to experimental and interpretational problems. Modern catalysts require temperatures of at least 473 K and consequently the use of high total pressures, for example, ‘from 4 to 20 MPa, in order to overcome the thermodynamic limitations. These conditions, together with the high exothermicity of reaction ( 1) ( AHIg8 = - 9 1 kJ mol ~ ‘, which results in an adiabatic temperature rise of around 1000 K for a stoichiometric reaction mixture) and the possible parallel and consecutive reactions, cause significant difficulties, both in the experiments and in the elaboration of the data obtained.
Reaction (1) can be accompanied by several side and consecutive reactions; examples are [ 11:
CO + 3H, = CH, + H,O AH,,, = -206 kJ mall’ (2)
2C0 + 2H, = CH, + CO,
AH,,, =
CO+H,O=CO,+H,
AH,,, = and
2CH,OH = (CH,),O + Hz0
AH,,, = or
2C0 + 4H, = (CH,),O + H,O
AH,,, =
-247 kJ mall’ (3)
-41 kJ mol-’ (4)
-23.5 kJ mol-’ (5)
-206 kJ mall’ (6)
181
Whether these reactions cause significant reactant losses depends on the catalyst and on the operating conditions used. Generally, the modern copper cata- lysts are highly selective.
We needed quantitative information on the kinet- ics of reaction (1) using the BASF S3-85 catalyst and CO,-free synthesis gas. Our main objectives were (1) to obtain a reliable kinetic correlation for the operat- ing conditions mentioned, and (2) to examine whether the copper catalyst functions well in the absence of CO,. For our kinetic measurements we chose the inte- gral, packed tubular reactor in view of its simplicity of construction, especially for experiments at high tem- peratures and pressures.
Literature survey
A first comprehensive discussion of the kinetics of the methanol synthesis reaction was published by Natta et al. in 1953 [2]. Since then the number of papers published concerning the methanol synthesis reaction has been increasing gradually. Although the reaction mechanism is not fully understood, neverthe- less much progress has been made in the last two decades in improving the properties of the catalysts. The catalysts based on ZnO were replaced by the highly active Cu/ZnO catalysts: this allowed a reduc- tion of the reaction pressures from 2&30 MPa to 5- 10 MPa and of the reaction temperature by about 50 K, down to SO&550 K.
In the studies published a large variety of catalysts, feed gas compositions and operating conditions was used; regretfully, it is not possible to draw general conclusions from them on the reaction mechanism. Furthermore, it is not known whether the reaction mechanisms for the ZnO/Cr,O, and for the Cu/ZnO catalysts are identical or not. Denny and Whan [3], Kung [ 41 and Klier and co-workers [ 5571 summarized and extensively discussed the findings on the mecha- nism of the methanol synthesis reaction. Generally, the main reaction (1) is considered to proceed in a series of steps involving adsorption of the reactants, chemical reactions of a Langmuir-Hinshelwood or an Eley-Rideal type, and product desorption.
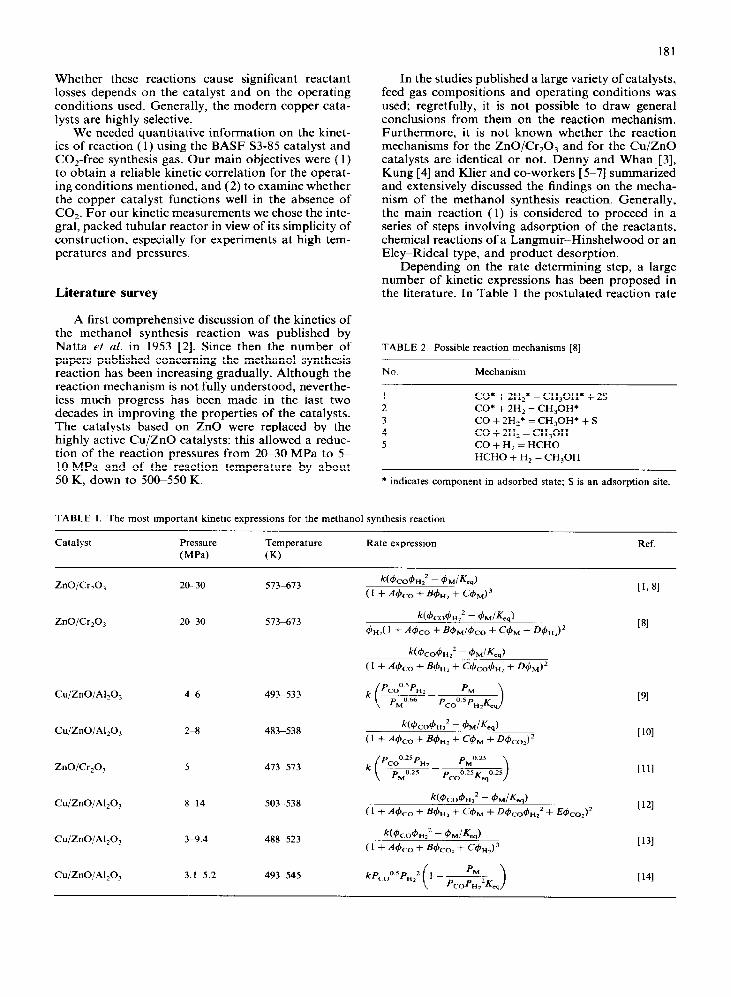
Depending on the rate determining step, a large number of kinetic expressions has been proposed in the literature. In Table 1 the postulated reaction rate
TABLE 2. Possible reaction mechanisms [S]
No. Mechanism
I CO* + 2Hz* = CH30H* + 25 2 CO* + 2H, = CH,OH* 3 CO + 2H2* = CH,OH* + S 4 CO + 2H, = CH,OH 5 CO + H, = HCHO
HCHO + H, = CH,OH
* indicates component in adsorbed state; S is an adsorption site.
TABLE 1. The most important kinetic expressions for the methanol synthesis reaction
Catalyst Pressure
(MPa)
Temperature
(K)
Rate expression Ref.
ZnO/Cr,O, 20-30 573473
Cu/ZnO/Al,O,
Cu/ZnO/Al,O,
ZnO/Cr,O,
46 493-533
483-538
473-573
113 81
181
[91
[lOI
[Ill
Cu/ZnO/Al,O, 8-14 503-538
CulZnO/Al,O, 3-9.4 488-523
Cu/ZnO/Al,O, 3.1-5.2 493-545
1121
[I31
[I41
182
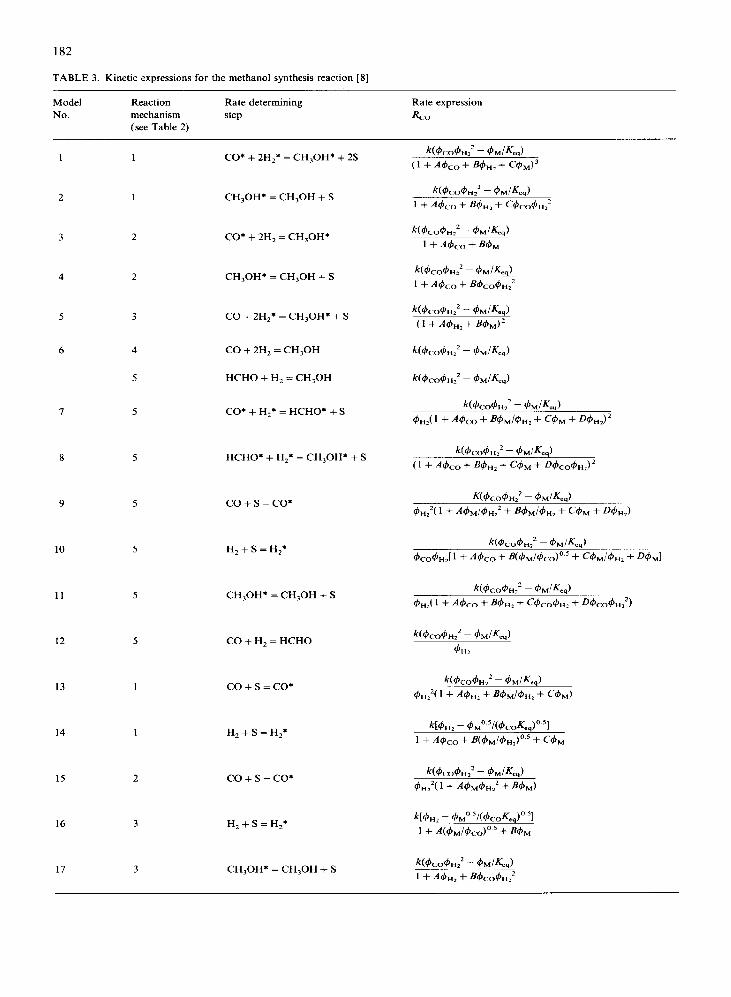
TABLE 3. Kinetic expressions for the methanol synthesis reaction [8]
Model Reaction Rate determining Rate expression
No
-
mechanism
(see Table 2) step
-
1 1 CO* + 2H,* = CH,OH* + 2S
2 CH,OH* = CH,OH + S
3 2 CO* + 2H, = CH30H*
4 2 CH,OH* = CH,OH + S
5 CO + 2Hz* = CH30H* + S
6 CO + 2H, = CH,OH
HCHO + H, = CH,OH
7 CO* + Hz* = HCHO* + S
8 5 HCHO* + H,* = CH30H* + S
9 5 co+s=co*
10 5 HZ+S=H2*
11 5 CH,OH* = CH,OH + S
12 5 CO + H, = HCHO
13 co+s=co*
14 1 H,+S=H,*
15 2 co+s=co*
16 3 HZ+S=Hz*
17 3 CH30H* = CH,OH + S
expressions are summarized. Many experimental studies were carried out under conditions where the main reaction (1) proceeds only in the forward or in the backward direction: the synthesis at very low methanol concentrations or the decomposition of methanol at atmospheric pressure. Kinetic expres- sions obtained in these studies are not listed in our Table 1 because in practical situations the effective methanol production rate is affected considerably by the reversed reaction, so that the kinetics of the de- composition reaction must also be taken into account. Furthermore, the studies of the decomposition reac- tion were carried out almost in the absence of CO and H,, whereas these components may significantly affect the chemisorption of methanol on the catalyst sur- face. Even more kinetic expressions have been pro- posed by Buzzi Ferraris and Donati [8]; assuming the Langmuir-Hinshelwood or Eley-Rideal type of mechanisms of Table 2 and taking various steps as rate determining, they derived the 17 kinetic expres- sions listed in Table 3. Recently most authors have proposed that reaction (1) is of Langmuir-Hinshel- wood or Eley-Rideal type [ 7, 12, 131. Seyfert and Luft [ 121 probably published the most extensive experi- mental study using the BASF S3-85 catalyst and a CO,-containing synthesis gas. Their measurements were carried out in a recycle jet-loop reactor. Owing to high temperatures and total pressures (Table 1) and low partial pressures of methanol, very high reac- tion rates were measured. After a statistical elabora- tion they proposed expression 8 of Table 3, which is based on the hypothesis of a bimolecular surface reac- tion involving an adsorbed intermediate. Villa et al. [ 131, in a Berty reactor, studied the methanol synthe- sis reaction over a Cu/ZnO/Al,O, catalyst and used
183
CO,-containing synthesis gas. They obtained a good fit of the experimental data using expression 1 from Table 3, which was originally proposed by Natta et al.
[ 21 and recently partially confirmed by Klier et al. [ 71.
Experimental part
The experimental set-up
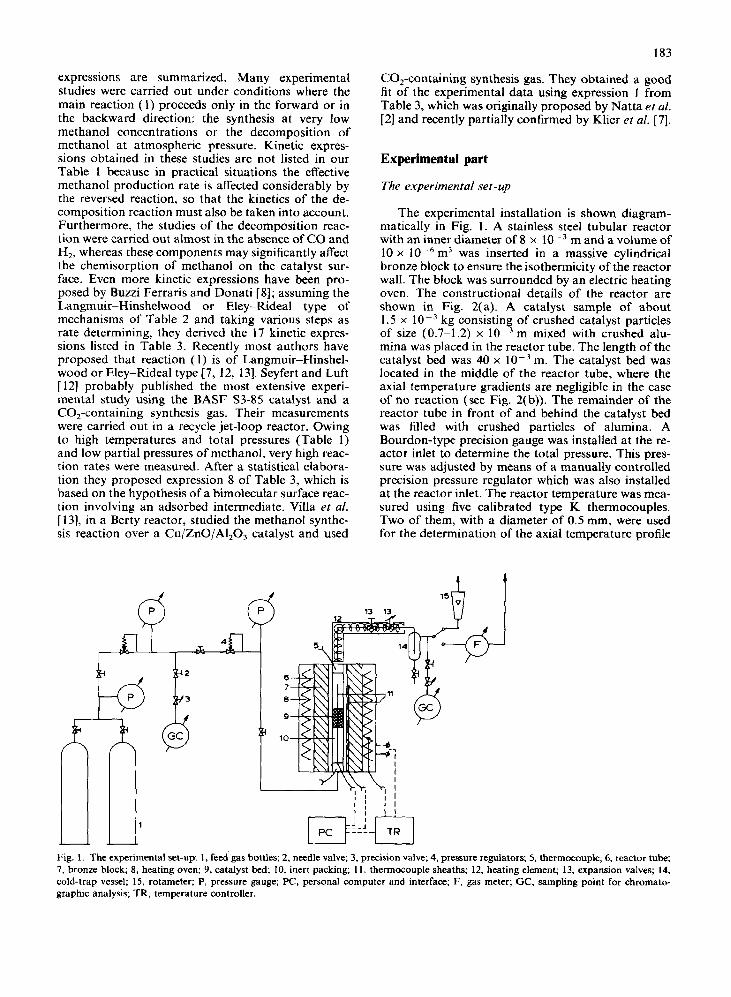
The experimental installation is shown diagram- matically in Fig. 1. A stainless steel tubular reactor with an inner diameter of 8 x lop3 m and a volume of 10 x 1O-6 m3 was inserted in a massive cylindrical bronze block to ensure the isothermicity of the reactor wall. The block was surrounded by an electric heating oven. The constructional details of the reactor are shown in Fig. 2(a). A catalyst sample of about 1.5 x lop3 kg consisting of crushed catalyst particles of size (0.7-l .2) x lop3 m mixed with crushed alu- mina was placed in the reactor tube. The length of the catalyst bed was 40 x 1O-3 m. The catalyst bed was located in the middle of the reactor tube, where the axial temperature gradients are negligible in the case of no reaction (see Fig. 2(b)). The remainder of the reactor tube in front of and behind the catalyst bed was filled with crushed particles of alumina. A Bourdon-type precision gauge was installed at the re- actor inlet to determine the total pressure. This pres- sure was adjusted by means of a manually controlled precision pressure regulator which was also installed at the reactor inlet. The reactor temperature was mea- sured using five calibrated type K thermocouples. Two of them, with a diameter of 0.5 mm, were used for the determination of the axial temperature profile
L
Fig. 1. The experimental set-up: I, feed gas bottles; 2, needle valve; 3, precision valve; 4, pressure regulators; 5, thermocouple; 6, reactor tube; 7, bronze block; 8, heating oven; 9, catalyst bed; 10, inert packing; II, thermocouple sheaths; 12, heating element; 13, expansion valves; 14, cold-trap vessel; 15, rotameter; P, pressure gauge; PC, personal computer and interface; F, gas meter; CC, sampling point for chromato- graphic analysis; TR, temperature controller.
184
205
- length
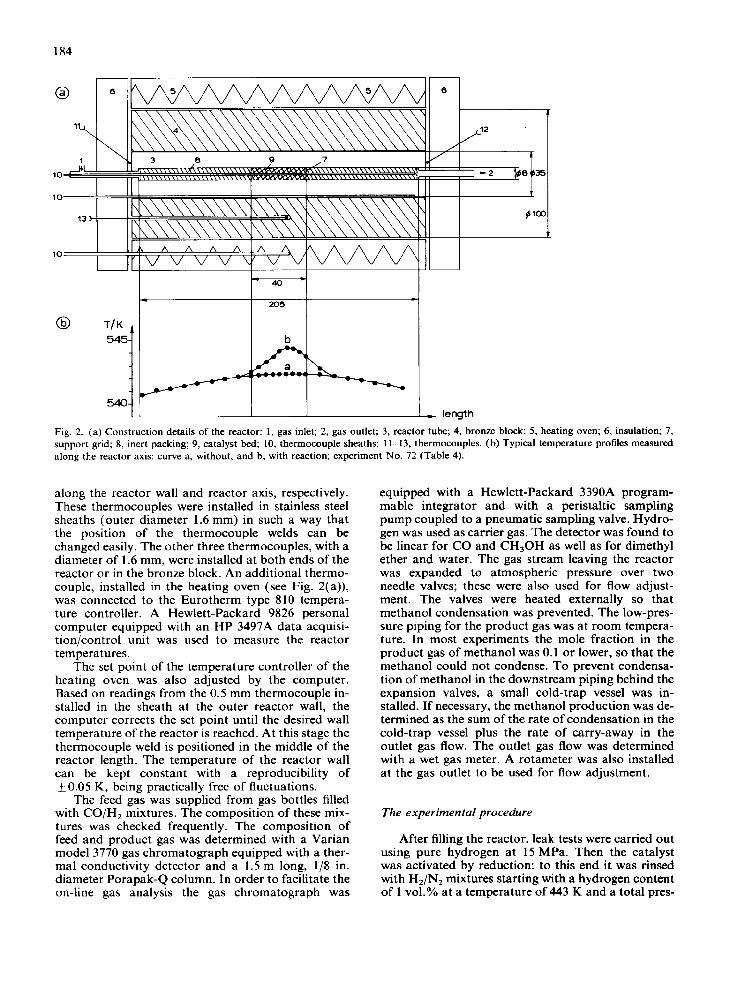
Fig. 2. (a) Construction details of the reactor: 1, gas inlet; 2, gas outlet; 3, reactor tube; 4, bronze block; 5, heating oven; 6, insulation; 7, support grid; 8, inert packing; 9, catalyst bed; 10, thermocouple sheaths; 1 I-13, thermocouples. (b) Typical temperature profiles measured along the reactor axis: curve a, without, and b, with reaction; experiment No. 72 (Table 4).
along the reactor wall and reactor axis, respectively. These thermocouples were installed in stainless steel sheaths (outer diameter 1.6 mm) in such a way that the position of the thermocouple welds can be changed easily. The other three thermocouples, with a diameter of 1.6 mm, were installed at both ends of the reactor or in the bronze block. An additional thermo- couple, installed in the heating oven (see Fig. 2(a)), was connected to the Eurotherm type 810 tempera- ture controller. A Hewlett-Packard 9824 personal computer equipped with an HP 3497A data acquisi- tion/control unit was used to measure the reactor temperatures.
The set point of the temperature controller of the heating oven was also adjusted by the computer. Based on readings from the 0.5 mm thermocouple in- stalled in the sheath at the outer reactor wall, the computer corrects the set point until the desired wall temperature of the reactor is reached. At this stage the thermocouple weld is positioned in the middle of the reactor length. The temperature of the reactor wall can be kept constant with a reproducibility of kO.05 K, being practically free of fluctuations.
The feed gas was supplied from gas bottles filled with CO/H, mixtures. The composition of these mix- tures was checked frequently. The composition of feed and product gas was determined with a Varian model 3770 gas chromatograph equipped with a ther- mal conductivity detector and a 1.5 m long, l/S in. diameter Porapak-Q column. In order to facilitate the on-line gas analysis the gas chromatograph was
equipped with a Hewlett-Packard 3390A program- mable integrator and with a peristaltic sampling pump coupled to a pneumatic sampling valve. Hydro- gen was used as carrier gas. The detector was found to be linear for CO and CH30H as well as for dimethyl ether and water. The gas stream leaving the reactor was expanded to atmospheric pressure over two needle valves; these were also used for flow adjust- ment. The valves were heated externally so that methanol condensation was prevented. The low-pres- sure piping for the product gas was at room tempera- ture. In most experiments the mole fraction in the product gas of methanol was 0.1 or lower, so that the methanol could not condense. To prevent condensa- tion of methanol in the downstream piping behind the expansion valves, a small cold-trap vessel was in- stalled. If necessary, the methanol production was de- termined as the sum of the rate of condensation in the cold-trap vessel plus the rate of carry-away in the outlet gas flow. The outlet gas flow was determined with a wet gas meter. A rotameter was also installed at the gas outlet to be used for flow adjustment.
The experimental procedure
After filling the reactor, leak tests were carried out using pure hydrogen at 15 MPa. Then the catalyst was activated by reduction: to this end it was rinsed with HJN, mixtures starting with a hydrogen content of 1 vol.% at a temperature of 443 K and a total pres-
185
sure of 0.4 MPa. After one hour both the temperature and the hydrogen content were gradually increased up to 523 K and 20 vol.% H, respectively over a period of 12 hours. The reactor effluent at the end of the reduction was free of water vapour. After reduction of the catalyst, it was treated with a continuous stream of 20/80 vol.% of CO/H2 at 523 K and 6 MPa to stabilize the catalyst activity. We found a period of 72 hours to be sufficient for stabilization of the cata- lyst; for a CO,-containing synthesis gas Seyfert and Luft [ 121 suggest a period of 96 hours. The leak tests and the activation procedures were repeated after every new filling of the reactor with fresh catalyst.
An experiment was started by first setting the de- sired pressure and temperature. Then the gas flow was adjusted with the needle valves and the rotameter at the reactor outlet. The feed gas flow cannot be deter- mined directly, therefore it was calculated after com- pletion of an experiment. Depending on the operating conditions chosen, the reactor reached a steady state after 2-6 hours. Then the product gas flow, the product gas composition and the axial temperature profile were determined. After this, the conditions for a subsequent experiment can be adjusted. In between the experiments, the catalyst was kept at 0.2 MPa and at around 500 K in a mixture of nitrogen and hydro- gen of 20/80 vol.%. The catalyst activity was checked frequently by executing a standard experiment.
Concerning the intraparticle mass transfer resis- tances, we refer to Seyfert and Luft [ 121, who for the same BASF S3-85 catalyst determined the reaction rates at varying particle diameters. They found that for crushed catalyst particles of diameter I mm the effectiveness factor equals unity. Since our measure- ments were carried out at much less severe conditions (on average our reaction rates were about 5-l 5 times lower), we assume the intraparticle transfer resis- tances to be absent.
Catalyst stability
We observed that reactions (5) and/or (6) become significant for experiments at low feed flows, where the conversions approach the actual equilibrium for reaction (1) and the mole fractions of water or dimethyl ether exceed 1 vol.%. At high dimethyl ether contents we observed a relatively quick and irre- versible loss of catalyst activity within several days of operation. The deactivated catalyst particles were violet in colour and had lost their mechanical strength. Also, scanning electron microscope photo- graphs showed changes in the texture of the catalyst surface. Several simple batch experiments, in which samples of fresh catalyst were kept in an atmosphere of dimethyl ether, confirmed our assumption that this compound causes a degradation of the catalyst. An- other unexpected degradation was observed during experiments with high CO partial pressures, using a synthesis gas containing 90 vol.% CO and 10 vol.% H,: the catalyst activity was completely lost in less than two hours.
We have no explanation for either of these types of degradation. Possibly they only occur if there is no CO2 present in the synthesis gas.
Results
A total of I 10 experiments were carried out at various temperatures, pressures, feed gas composi- tions and flow rates. The experimental conditions and the results are specified in Table 4; they are arranged in groups of data with equal feed gas composition. As already mentioned, owing to the exothermicity of the reaction, the temperature in the catalyst bed was not uniform; an example of a temperature profile mea- sured along the reactor axis is shown in Fig. 2(b). For the experiments of Table 4, the temperature differ- ences measured along the catalyst bed never exceeded 3 K, whereas in about 90% of the cases these differ- ences were lower than 2 K. The temperatures reported in Table 4 are mean values: the axial temperature was measured at 5 mm intervals along the 40 mm bed (see Fig. 2(b)), the mean value being calculated by
The temperature measured at the outside of the reac- tor wall was always practically constant over the whole bed length. In all experiments the concentra- tions of both dimethyl ether and water, being the products of the most important undesired reactions (5) and/or (6), were always considerably below 1 vol.%, so that their quantitative determination was very inaccurate. We decided in calculating conver- sions to abstain from correcting for the formation of side products so that the conversion [, was calculated from the measured mole fractions of CO at the inlet and the outlet of the reactor according to
Tco = YCO, in - YCO, out
YCO, in - 2YC0, out.YCO, in (8)
The carbon balance was checked with
i YM, out zz---
1 _c;co YCO, out (9)
For all experiments, the carbon balance holds to an accuracy of better than 5%. The molar feed flow of CO follows from
and the ‘contact time’ r from
meat kg cat s z=- Q co. in mol CO in (11)
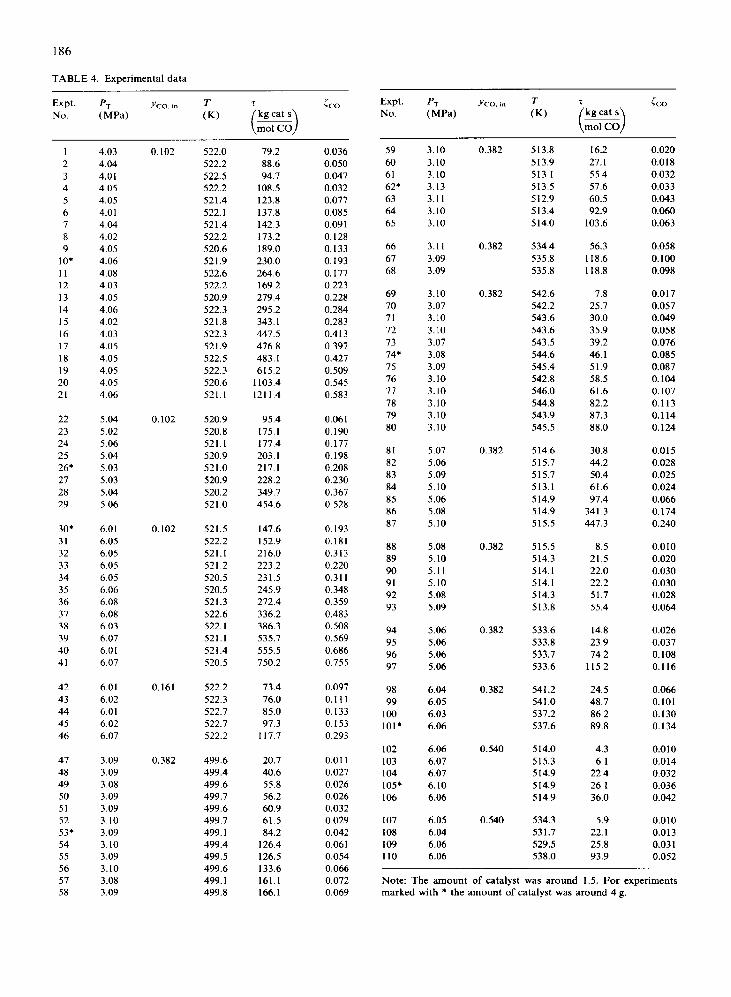
In Fig. 3, typical conversion versus ‘contact time’ data are presented.
To check for interparticle mass transfer resistances several experiments reported in Table 4 were carried out with feed gas flows and amounts of catalyst in- creased by a factor of 2.5, so that the ‘contact time’ T
186
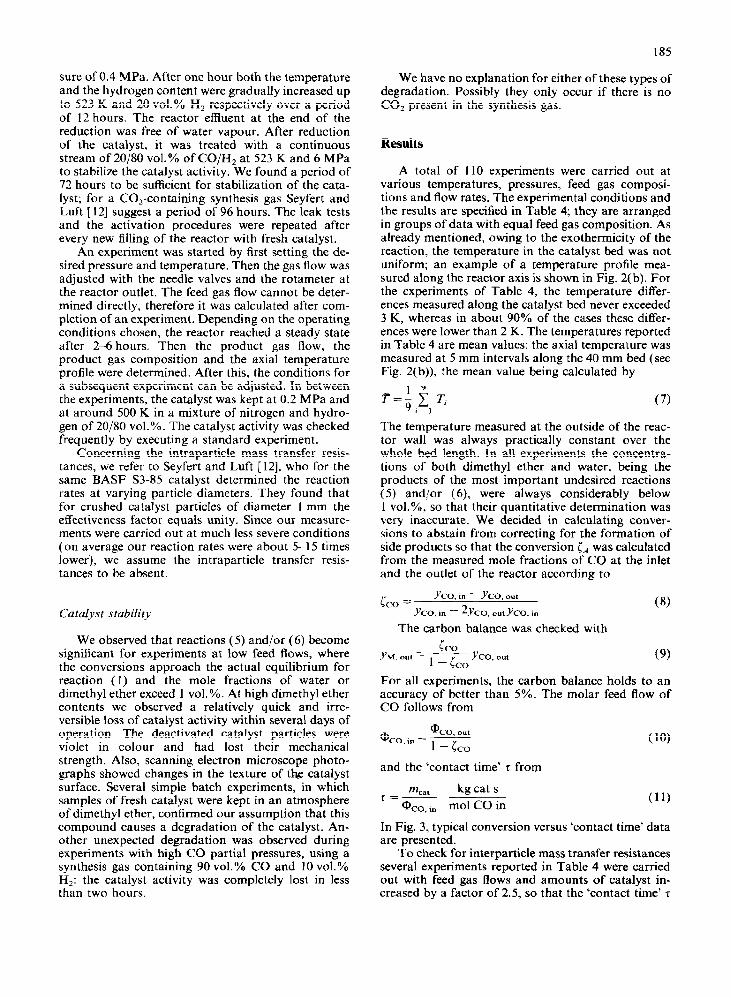
TABLE 4. Experimental data
Expt. PT I'c0.m T T i co NO. (MW (K)
1 4.03 0.102 522.0 79.2 0.036 2 4.04 522.2 88.6 0.050 3 4.01 522.5 94.7 0.047 4 4.05 522.2 108.5 0.032 5 4.05 521.4 123.8 0.077 6 4.01 522.1 137.8 0.085 7 4.04 521.4 142.3 0.091 8 4.02 522.2 173.2 0.128 9 4.05 520.6 189.0 0.133
10’ 4.06 521.9 230.0 0.193 11 4.08 522.6 264.6 0.177 12 4.03 522.2 169 2 0.223 13 4.05 520.9 279.4 0.228 14 4.06 522.3 295.2 0.284 15 4.02 521.8 343.1 0.283 16 4.03 522.3 447.5 0.413 17 4.05 521.9 476.8 0.397 18 4.05 522.5 483.1 0.427 19 4.05 522.3 615.2 0.509 20 4.05 520.6 1103.4 0.545 21 4.06 521.1 1211.4 0.583
22 5.04 0.102 520.9 95.4 0.061 23 5.02 520.8 175.1 0.190 24 5.06 521.1 177.4 0.177 25 5.04 520.9 203.1 0.198 26* 5.03 521.0 217.1 0.208 27 5.03 520.9 228.2 0.230 28 5.04 520.2 349.7 0.367 29 5.06 521.0 454.6 0.528
30’ 6.01 0.102 521.5 147.6 0.193 31 6.05 522.2 152.9 0.181 32 6.05 521.1 216.0 0.313 33 6.05 521.2 223.2 0.220 34 6.05 520.5 231.5 0.311 35 6.06 520.5 245.9 0.348 36 6.08 521.3 272.4 0.359 37 6.08 522.6 336.2 0.483 38 6.03 522.1 386.3 0.508 39 6.07 521.1 535.7 0.569 40 6.01 521.4 555.5 0.686 41 6.07 520.5 750.2 0.755
42 6.01 0.161 522.2 73.4 0.097 43 6.02 522.3 76.0 0.111 44 6.01 522.7 85.0 0.133 45 6.02 522.7 97.3 0.153 46 6.07 522.2 117.7 0.293
47 3.09 0.382 499.6 20.7 0.011 48 3.09 499.4 40.6 0.027 49 3.08 499.6 55.8 0.026 50 3.09 499.7 56.2 0.026 51 3.09 499.6 60.9 0.032 52 3.10 499.7 61.5 0.029 53* 3.09 499.1 84.2 0.042 54 3.10 499.4 126.4 0.061 55 3.09 499.5 126.5 0.054 56 3.10 499.6 133.6 0.066 57 3.08 499.1 161.1 0.072 58 3.09 499.8 166.1 0.069
Expt. No.
59 3.10 60 3.10 61 3.10 62* 3.13 63 3.11 64 3.10 65 3.10
66 3.11 67 3.09 68 3.09
69 3.10 70 3.07 71 3.10 72 3.10 73 3.07 74+ 3.08 75 3.09 76 3.10 77 3.10 78 3.10 79 3.10 80 3.10
81 5.07 82 5.06 83 5.09 84 5.10 85 5.06 86 5.08 87 5.10
88 5.08 89 5.10 90 5.11 91 5.10 92 5.08 93 5.09
94 5.06 95 5.06 96 5.06 97 5.06
98 6.04 99 6.05
100 6.03 101’ 6.06
102 6.06 103 6.07 104 6.07 105* 6.10 106 6.06
107 6.05 108 6.04 109 6.06 110 6.06
0.382
0.382
0.382
0.382
0.382
0.382
0.382
0.540
0.540
513.8 16.2 0.020 513.9 27.1 0.018 513.1 55.4 0.032 513.5 57.6 0.033 512.9 60.5 0.043 513.4 92.9 0.060 514.0 103.6 0.063
534.4 56.3 0.058 535.8 118.6 0.100 535.8 118.8 0.098
542.6 7.8 0.017 542.2 25.7 0.057 543.6 30.0 0.049 543.6 35.9 0.058 543.5 39.2 0.076 544.6 46.1 0.085 545.4 51.9 0.087 542.8 58.5 0.104 546.0 61.6 0.107 544.8 82.2 0.113 543.9 87.3 0.114 545.5 88.0 0.124
514.6 30.8 0.015 515.7 44.2 0.028 515.7 50.4 0.025 513.1 61.6 0.024 5 14.9 97.4 0.066 514.9 341.3 0.174 515.5 447.3 0.240
515.5 8.5 0.010 514.3 21.5 0.020 514.1 22.0 0.030 514.1 22.2 0.030 514.3 51.7 0.028 513.8 55.4 0.064
533.6 14.8 0.026 533.8 23.9 0.037 533.7 74.2 0.108 533.6 115.2 0.116
541.2 24.5 0.066 541 .o 48.7 0.101 537.2 86.2 0.130 537.6 89.8 0.134
514.0 4.3 0.010 515.3 6.1 0.014 514.9 22.4 0.032 514.9 26.1 0.036 514.9 36.0 0.042
534.3 5.9 0.010 531.7 22.1 0.013 529.5 25.8 0.03 1 538.0 93.9 0.052
Note: The amount of catalyst was around 1.5. For experiments marked with * the amount of catalyst was around 4 g.
187
Scot a
1
c
01 0 L 0
b 0 0
0 0
i 005
1 0 0
-
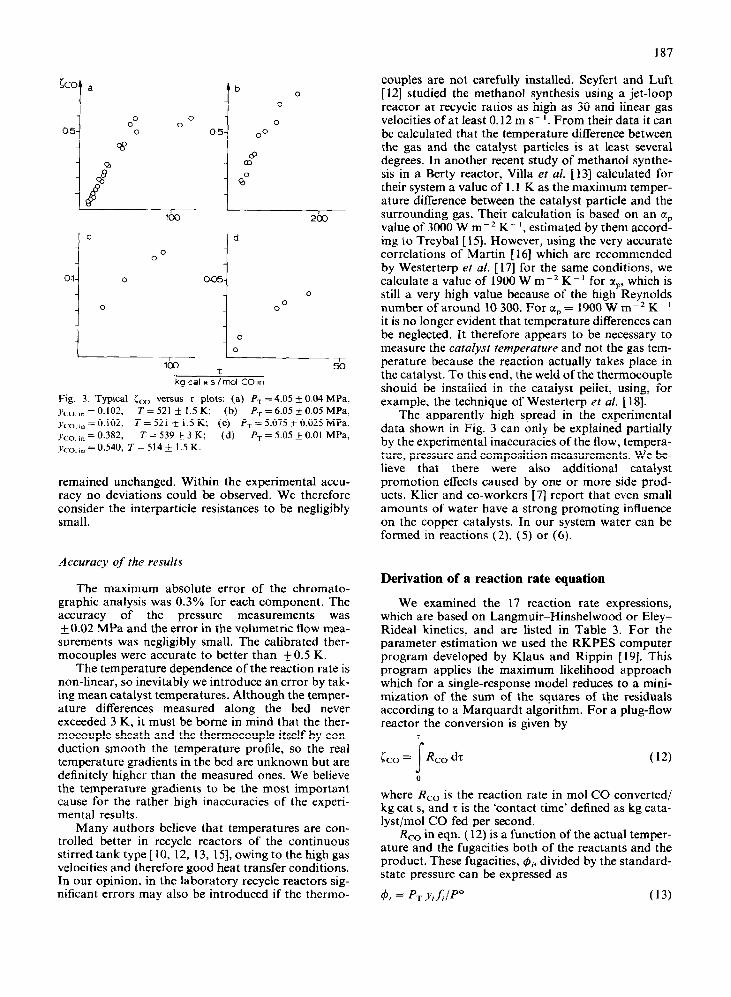
Fig. 3. Typical cc0 versus T plots: (a) P, = 4.05 + 0.04 MPa. Ym, I” = 0.102, T = 521 + 1.5 K; (b) PT = 6.05 k 0.05 MPa, rCo,,n = 0.102, T = 521 + 1.5 K; (c) P, = 5.075 k 0.025 MPa, Y,,, ,n = 0.382, T = 539 + 3 K; (d) Pr = 5.05 + 0.01 MPa,
,vco, I” = 0.540, T = 514 k 1.5 K.
remained unchanged. Within the experimental accu- racy no deviations could be observed. We therefore consider the interparticle resistances to be negligibly small.
Accuracy of the results
The maximum absolute error of the chromato- graphic analysis was 0.3% for each component. The accuracy of the pressure measurements was + 0.02 MPa and the error in the volumetric flow mea- surements was negligibly small. The calibrated ther- mocouples were accurate to better than _+O.S K.
The temperature dependence of the reaction rate is non-linear, so inevitably we introduce an error by tak- ing mean catalyst temperatures. Although the temper- ature differences measured along the bed never exceeded 3 K, it must be borne in mind that the ther- mocouple sheath and the thermocouple itself by con- duction smooth the temperature profile, so the real temperature gradients in the bed are unknown but are definitely higher than the measured ones. We believe the temperature gradients to be the most important cause for the rather high inaccuracies of the experi- mental results.
Many authors believe that temperatures are con- trolled better in recycle reactors of the continuous stirred tank type [ 10, 12, 13, 151, owing to the high gas velocities and therefore good heat transfer conditions. In our opinion, in the laboratory recycle reactors sig- nificant errors may also be introduced if the thermo-
couples are not carefully installed. Seyfert and Luft [ 121 studied the methanol synthesis using a jet-loop reactor at recycle ratios as high as 30 and linear gas velocities of at least 0.12 m s-‘. From their data it can be calculated that the temperature difference between the gas and the catalyst particles is at least several degrees. In another recent study of methanol synthe- sis in a Berty reactor, Villa et al. [13] calculated for their system a value of 1.1 K as the maximum temper- ature difference between the catalyst particle and the surrounding gas. Their calculation is based on an clp value of 3000 W m-* K-‘, estimated by them accord- ing to Treybal [ 151. However, using the very accurate correlations of Martin [16] which are recommended by Westerterp et al. [ 171 for the same conditions, we calculate a value of 1900 W me2 K-’ for up, which is still a very high value because of the high Reynolds numberofaroundl0300.Fora,=1900Wm-*K-’ it is no longer evident that temperature differences can be neglected. It therefore appears to be necessary to measure the catalyst temperature and not the gas tem- perature because the reaction actually takes place in the catalyst. To this end, the weld of the thermocouple should be installed in the catalyst pellet, using, for example, the technique of Westerterp et al. [ 181.
The apparently high spread in the experimental data shown in Fig. 3 can only be explained partially by the experimental inaccuracies of the flow, tempera- ture, pressure and composition measurements. We be- lieve that there were also additional catalyst promotion effects caused by one or more side prod- ucts. Klier and co-workers [7] report that even small amounts of water have a strong promoting influence on the copper catalysts. In our system water can be formed in reactions (2) (5) or (6).
Derivation of a reaction rate equation
We examined the 17 reaction rate expressions, which are based on Langmuir-Hinshelwood or Eley- Rideal kinetics, and are listed in Table 3. For the parameter estimation we used the RKPES computer program developed by Klaus and Rippin [19]. This program applies the maximum likelihood approach which for a single-response model reduces to a mini- mization of the sum of the squares of the residuals according to a Marquardt algorithm. For a plug-flow reactor the conversion is given by
Lo = [&I dr (12)
where R,, is the reaction rate in mol CO converted/ kg cat s, and 7 is the ‘contact time’ defined as kg cata- lyst/mol CO fed per second.
R,, in eqn. ( 12) is a function of the actual temper- ature and the fugacities both of the reactants and the product. These fugacities, di, divided by the standard- state pressure can be expressed as
(13)
188
where PT is the total pressure, P” the standard-state pressure equal to 0.1 MPa, yi the mole fraction, andf; the fugacity coefficient of component i under reaction conditions. At a given feed gas composition, yi can be expressed as a function of the conversion coo:
( l - iCO)YCO, in yco = 1 - 2L2oYco. in
YH> = 1 - YCO, in - 25C0 YCO, in
1 - 21COYC0, in
and
YCO, in <CO
YM = ’ - 2iCOYC0, in
(15)
(16)
For the calculation of the fugacity coefficients fi, the expressions derived from the Peng-Robinson equation of state [20] can be used:
A lnx=?(Z-l)-ln(Z--B)---
2B&
where
Xln(;~~:~;~;)~~_~) (17)
A = aP/(RT)2, B = hP/RT, Z = Pv/RT
a = 1 C yiaii, h = C yib, aii = ( 1 - 6,)(a,a,) ‘I* 1 I i
a,(T) = 0.45724 T[l +K,(l -T,,)]’ CI
N m4 mol-
h(T) = h(T,,) = 0.7878RT,,/P,, m3 mall’
and
Ki = 0.37464 + 1 .54226wi - 0.269920,~
Owing to the lack of original data the interaction parameters 6, are assumed to be equal to zero. Also, for the calculation of the molar volume u we apply the Peng- Robinson equation
RT p=----- a(T)
v - b v(v + b) + b(v - b) (18)
The thermodynamic constants we used to find the fugacity coefficients are specified in Table 5. The ap- plicability of the Peng-Robinson equation of state has been confirmed in other studies [21,22]. For the thermodynamic equilibrium constant Keq of reaction ( 1) the following correlation can be derived [23]:
In Keq = -28.9762 + 11815/T (19)
All these data have been put into each of the 17
TABLE 5. Thermodynamic data for CO, H, and CH,OH
Component co HZ CH,OH
PC (MW 3.45 I .28 8.078 T, (K) 134 33.3 512.6 UI 0.049 - 0.226 0.564
possible rate equations of Table 3 and, after integra- tion of eqn. (12), experimental r-&.0 data sets have been compared with those calculated using the best fit obtained with the RKPES program in which the sum of the squares of the residuals was subjected to a minimization.
In the discrimination between the possible reac- tion rate equations three criteria were considered:
(1) the value X of the sum of the squares of the residuals at the optimum;
(2) the T values, being the ratios of the calculated parameter values to their standard deviations; and
(3) the randomness of the distribution of the residuals.
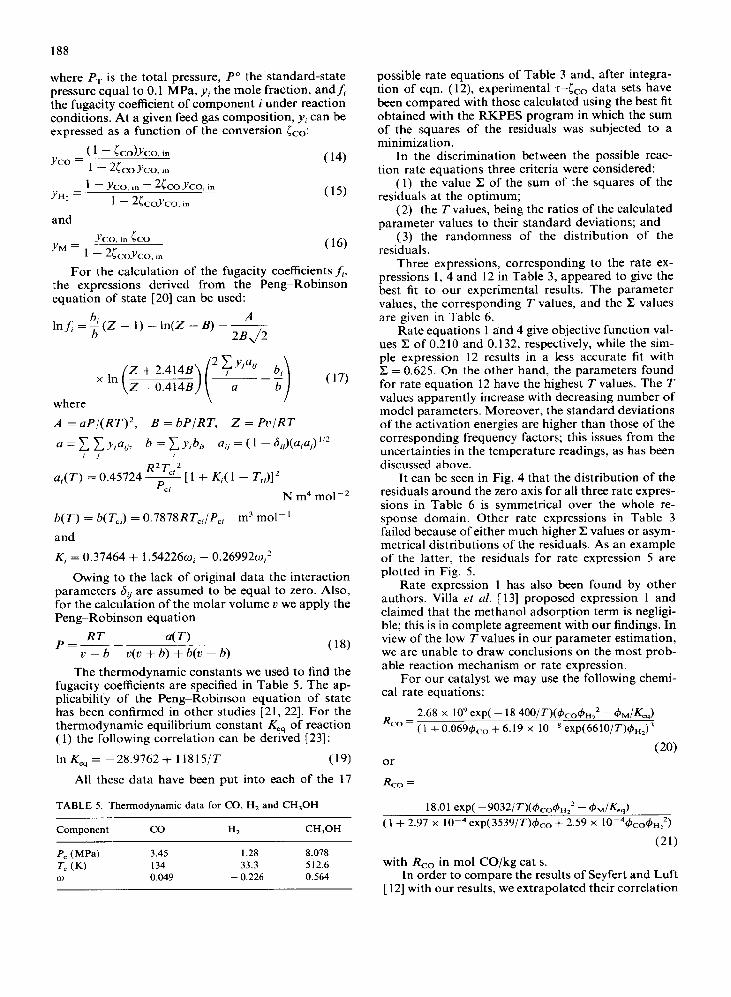
Three expressions, corresponding to the rate ex- pressions 1, 4 and 12 in Table 3, appeared to give the best fit to our experimental results. The parameter values, the corresponding T values, and the Z values are given in Table 6.
Rate equations 1 and 4 give objective function val- ues Z of 0.210 and 0.132, respectively, while the sim- ple expression 12 results in a less accurate fit with C = 0.625. On the other hand, the parameters found for rate equation 12 have the highest T values. The T values apparently increase with decreasing number of model parameters. Moreover, the standard deviations of the activation energies are higher than those of the corresponding frequency factors; this issues from the uncertainties in the temperature readings, as has been discussed above.
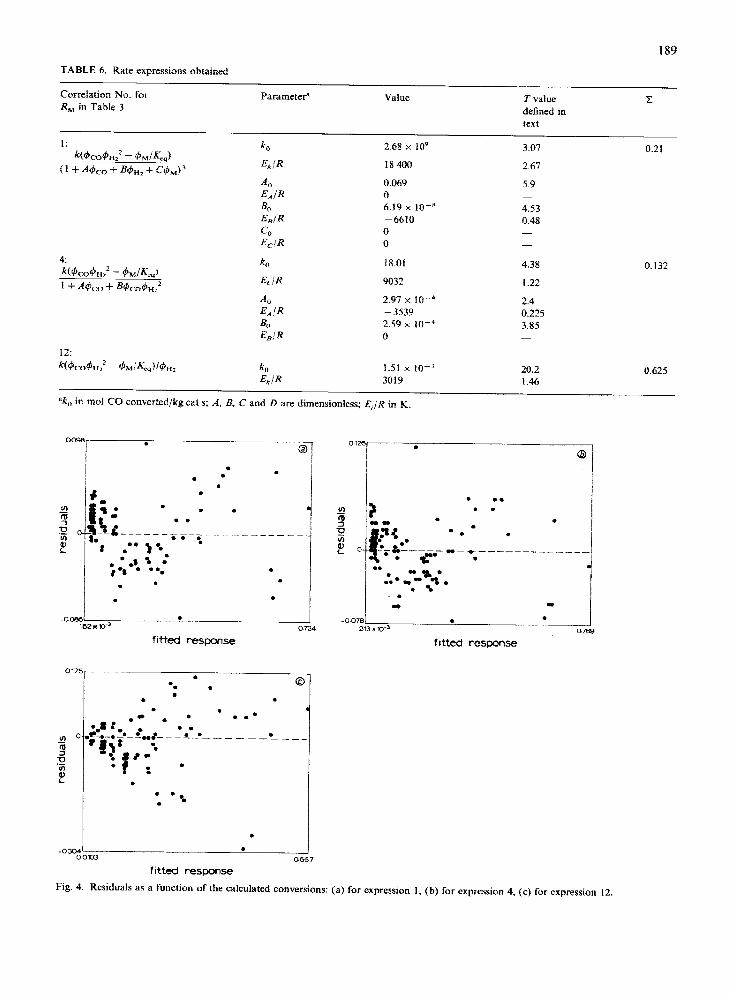
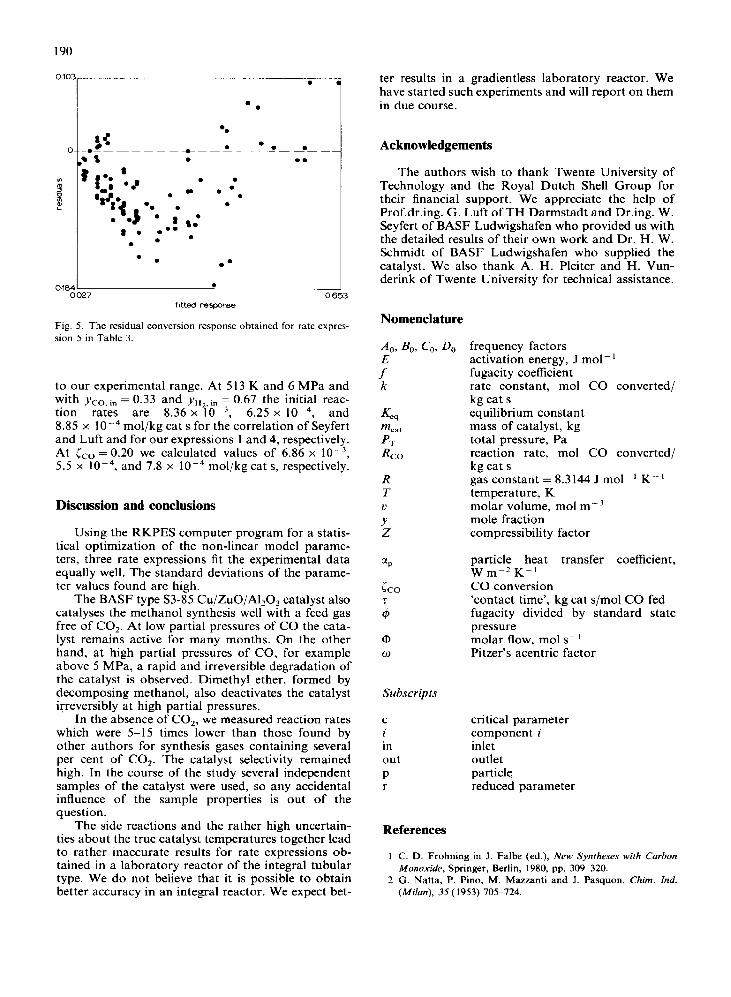
It can be seen in Fig. 4 that the distribution of the residuals around the zero axis for all three rate expres- sions in Table 6 is symmetrical over the whole re- sponse domain. Other rate expressions in Table 3 failed because of either much higher X values or asym- metrical distributions of the residuals. As an example of the latter, the residuals for rate expression 5 are plotted in Fig. 5.
Rate expression 1 has also been found by other authors. Villa et (11. [ 131 proposed expression 1 and claimed that the methanol adsorption term is negligi- ble; this is in complete agreement with our findings. In view of the low T values in our parameter estimation, we are unable to draw conclusions on the most prob- able reaction mechanism or rate expression.
For our catalyst we may use the following chemi- cal rate equations:
R 2.68 x IO9 exp( - 18 400/T)(&,&r,2 - &,/K_,)
co = (1 + 0.0691$,, + 6.19 x 10 V8 exp(6610/T)&J3
or
R co =
(20)
18.01 exp( -90W~)(4co&,2 - h..dfL,) (I + 2.97 x 10e4 exp(3539/T)&., + 2.59 x 10⁻⁴&o~H~)
(21) with Rco in mol CO/kg cat s.
In order to compare the results of Seyfert and Luft [ 121 with our results, we extrapolated their correlation
189
TABLE 6. Rate expressions obtained
Correlation No. for R, in TabIe 3
Parameter’ Value T vaiue defined in text
z
ko E/JR
2.68 X 10⁹
18 400
3.07
2.67
A0 0.069 5.9 E,!R 0 -
BC 6.19 X 10-B 4.53 E,IR -6610 0.48 Co 0 E,.IR 0
ko Et/R
18.01 4.38
1.22
0.21
0.132
A0 2.97 x 10W4 E,IR ~ 3539 @J 2.59 X IO-4 E,!R 0
12:
W,&z - &.lK&$,, k, I.51 X IO-’ -G/R 3019
“k,, in mol CO converted/kg cat s; A. 8, C and D are dimensionless; EJR in K.
2.4 0.225 3.85 -
20.2 0.625 1.46
.
.o~: ‘_. l * te2*XI? 0
fitted response
. . I
0867
fitted response
fitted response
Fig. 4. Residuals as a function of the calculated conversions: (a) for expression 1, (b) for expression 4, (c) for expression 12.
0027 0 653 fItted response
Fig. 5. The residual conversion response obtained for rate expres- sion 5 in Table 3.
to our experimental range. At 513 K and 6 MPa and with YCO, in tion
= 0.33 and yH2, in = 0.67 the initial reac- rates are 8.36 x 10 3, 6.25 x 10 4, and
8.85 x 1O-4 mol/kg cat s for the correlation of Seyfert and Luft and for our expressions 1 and 4, respectively. At Lo = 0.20 we calculated values of 6.86 x lo-), 5.5 x 10p4, and 7.8 x lop4 mol/kg cat s, respectively.
Discussion and conclusions
Using the RKPES computer program for a statis- tical optimization of the non-linear model parame- ters, three rate expressions fit the experimental data equally well. The standard deviations of the parame- ter values found are high.
The BASF type S3-85 Cu/ZuO/Al,O, catalyst also catalyses the methanol synthesis well with a feed gas free of CO,. At low partial pressures of CO the cata- lyst remains active for many months. On the other hand, at high partial pressures of CO, for example above 5 MPa, a rapid and irreversible degradation of the catalyst is observed. Dimethyl ether, formed by decomposing methanol, also deactivates the catalyst irreversibly at high partial pressures.
In the absence of CO,, we measured reaction rates which were 5-15 times lower than those found by other authors for synthesis gases containing several per cent of CO,. The catalyst selectivity remained high. In the course of the study several independent samples of the catalyst were used, so any accidental influence of the sample properties is out of the question.
The side reactions and the rather high uncertain- ties about the true catalyst temperatures together lead to rather inaccurate results for rate expressions ob- tained in a laboratory reactor of the integral tubular type. We do not believe that it is possible to obtain better accuracy in an integral reactor. We expect bet-
ter results in a gradientless laboratory reactor. We have started such experiments and will report on them in due course.
Acknowledgements
The authors wish to thank Twente University of Technology and the Royal Dutch Shell Group for their financial support. We appreciate the help of Prof.dr.ing. G. Luft of TH Darmstadt and Dr.ing. W. Seyfert of BASF Ludwigshafen who provided us with the detailed results of their own work and Dr. H. W. Schmidt of BASF Ludwigshafen who supplied the catalyst. We also thank A. H. Pleiter and H. Vun- derink of Twente University for technical assistance.
Nomenclature
A,, Bo, Co, Do E f k
KY meat PT R co
R T V Y Z
Subscripts
C
in out P r
frequency factors activation energy, J mol- ’ fugacity coefficient rate constant, mol CO converted/ kg cat s equilibrium constant mass of catalyst, kg total pressure, Pa reaction rate, mol CO converted/ kg cat s gas constant = 8.3144 J mol-’ K-’ temperature, K molar volume, mol rnp3 mole fraction compressibility factor
particle heat transfer coefficient, W rn-’ K-’ CO conversion ‘contact time’, kg cat s/mol CO fed fugacity divided by standard state pressure molar flow, mol S-I Pitzer’s acentric factor
critical parameter component i inlet outlet particle reduced parameter
References
1 C. D. Frohning in J. Falbe (ed.), New Syntheses with Curbon Monoxide, Springer, Berlin, 1980, pp. 309-320.
2 G. Natta, P. Pino, M. Mazzanti and J. Pasquon, Chim. Ind. (Milan), 35 (1953) 705-724.
191
3 P. J. Denny and D. A. Whan, Catalysis (London), 2 (1978) 4686.
4 H. H. Kung, Caral. Reu.-Sri. Eng., 22 (1980) 235-259. 5 R. G. Herman, K. Klier. G. W. Simmons, B. P. Finn, J. B.
Bulko and T. P. Kobylinski, J. Catal., 56 ( 1979) 407429. 6 S. Mehta, G. W. Simmons, K. Klier and R. G. Herman, J.
Caral., 57 (1979) 3399360. 7 K. Klier, V. Chatikavanij, R. G. Herman and G. W. Simmons,
J. Cutul., 74 (1982) 343-360. 8 G. Buzzi Ferraris and G. Donati, Zng. Chim. (Milan), 7 (1971)
53-64. 9 V. E. Leonov, M. M. Karabaev, e.N. Tsybina and G. S.
Petrishcheva. F&et. Cat&. (USSR), 14 (1973) 970-975. 10 0. Schermuly and G. Luft, Chem-Ing:Tech., 49 ( 1977) 907. 11 Y. V. Lender, L. S. Parfenova and K. N. Telnykn, Khim. Prom.,
49 (1974) 654655. 12 W. Seyfert and G. Luft, Chem.-Ing.-Tech., J7 (1985) 482; see
also W. Seyfert, Thesis, T.H. Darmstadt, 1984. 13 P. Villa, P. Forzatti, G. Buzzi Ferraris, G. Garone and J.
Pasquon, Ind. Eng. Chew.. Process. Des. Dew., 24 ( 1985) 12-19.
14 J. Skrzypck, M. Gnesik and R. Szopa, Chem. Eng. Sci., 40 (1985) 671473.
IS C. E. Brown and C. 0. Bennett, AIChE J., 16 (1970) 817-823. 16 H. Martin, Chem. Eng. Sci., 33 (1978) 913-919. 17 K. R. Westerterp, W. P. M. van Swaaij and A. A. C. M.
Bcenackers, Chemical Reactor Design and Operation, Wiley, Chichester, 1984, pp. 613622.
18 K. R. Westerterp, W. C. Kusters and R. J. Wijngaarden, Chem. Eng. Sci., 40 (1985) 1463-1467.
19 R. A. Klaus and D. W. T. Rippin, Comput. Chem. Eng., 3 (1979) 105-115; see also R. A. Klaus, Thesis, E.T.H. Zurich, 1981.
20 D. Yu Peng and D. 8. Robinson, Ind. Eng. Chem., Fundam., 15 (1976) 59-64.
21 M. Kuczynski, A. van Ooteghem and K. R. Westerterp, Colloid Polym. Sci., 264 (1986) 163-367.
22 M. Kuczynski, W. ‘t Hart and K. R. Westerterp, Chem. Eng. Process., 20 (1986) 53-58.
23 R. C. Reid, J. M. Prausnitz and T. K. Sherwood, The Properties ofGases and Liquids, McGraw-Hill, New York, 3rd edn., 1977.