Embed Size (px)
Citation preview
Transportation Research Record 844
from interviewed drivers exposed to other message conditions. Also, separate analyses of drivers seeing versus those not seeing CMS devices that contained speed advisory messages verified the observed total traffic effect of reduced speed response to the appropriate CMS message.
While improved traffic behavior was convincingly demonstrated to occur with CMS use, it was repeatedly shown that beneficial effects can be overridden by such factors as roadway geometry. For example, CMS observation by drivers was shown to be affected by traffic volume and sight distance to the device. Effects of grade and interchange proximity were seen to obfuscate speed and lane-change responses otherwise elicited by CMS devices.
CONCLUSIONS
Numerous substantiated results that CMSs tend to improve traffic flow on the approach to construction zone lane closures support their limited application. The associated smoother lane-change profiles can potentially reduce side-swipe and rear-end accidents on the construction zone approach, and the reduced speeds may increase safety for construction zone workers.
Yet, that beneficial effects of CMS were often seen to be overridden by specific highway geometric conditions points out the need for their judicious application (as is the case with traffic-control devices in general). Furthermore, any conclusion regarding the effect of CMS devices must emphasize that these devices are to be considered supplemental in nature to standard traffic-control schemes currently in use rather than a substitution for any specific device.
Suggested cost-efficient CMS applications are as follows:
1. Short-term closures characterized by decreased driver expectancy,
41
2. Minimum traffic volumes of 900 vehicles/h, and 3. Limited sight distances to the closure.
Four specific guidelines for CMS application resulted from this research:
1. Device format should permit information display at a glance line presentation format with a message phases),
maximum amount of (i.e. , use three
maximum of two
2. CMS devices should be located o. 7 5 mile in advance of closure,
3. CMS devices are to be considered supplemental in nature to currently applied standard traffic-control device schemes, and
4. CMS devices are not to be considered as an alternative to the arrowboardi arrowboard placement and brightness have a considerably greater impact on operational safety than does CMS use.
ACKNOWLEDGMENT
This research was performed under NCHRP Project 3-21(2) under contract to BioTechnology, Inc. This work was sponsored by the American Association of State Highway and Transportation Officials, in cooperation with the Federal Highway Administration, and was conducted in the National Cooperative Highway Research Program, which is administered by the Transportation Research Board of the National Research Council.
REFERENCE
1. Manual on Uniform Traffic Control Devices. FHWA, 1978.
Publication of this paper sponsored by Committee on User Information Systems.
Reading Time and Accuracy of Response to Simulated Urban Freeway Guide Signs
ROGERW. McNEES AND CARROLL J. MESSER
The results and methodology used in a laboratory study to determine motorists' time required to read urban freeway guide signs and the accuracy with which they read the signs are presented. The study was performed by using licensed drivers as subjects. The subjects, ranging in age from 18 to 79 years, were taken along a hypothetical urban freeway route where 2-, 3-, 4-, and 5-panel signs were used. A sign bridge typically has between one and four sign panels that have a green background and a white border around each panel. Each panel contains one or two route designations, one or more destination cities, and additional action messages. Each panel contained either 2, 4, 6, 8, or 10 units of information. The results of this study indicate that the optimum accuracy level was about 6 units of information/panel. When the information level was less than 16 units, 100 percent of the subjects could read the signs acceptably; when the level was between 16-30 units, 51 percent could read the sign acceptably; and when the level was between 31-50 units, only 33 percent could read the sign acceptably. It is apparent that route-selection accuracy decreases as the number of route choices increases. On a large sign (3 or more panels), the information content should not exceed 16 units of information/sign bridge. The time required to read a sign also increases with the number of route choices and total information on the sign.
Extensive research in the area of sign reading began in the late 1930s and continues even today. These efforts have mainly been concerned with the physical dimensions of the lettering, types of sign, illumination and reflectorization, recognition and effectiveness, message content, and placement in relation to the driver's cone of v1s1on and line of sight. These research efforts have led to the development of standards that apply to alphabets and numerals used on the signs. The Federal Highway Administration (FHWA) has a standard alphabet that dictates the letter series to be used in the design of exit-direction signs. The standard alphabet used on overhead exit-direction signs is the series E(M) alphabet. These letters are designed in such a way that they can be seen by a person with 20-20 vision at a distance equal to 60 ft/in of letter height.

--
42
This means that if the sign has 15-in letters, it can be read at 900 ft.
These factors have been related to both lateral and longitudinal sign-placement locations. The implication of research in this area for longitudinal sign placement is that an effective sign affords a longer sign-reading distance; thus maneuvering can be initiated earlier. Hence, the greater the distance at which the sign can be read, the shorter the distance it needs to be placed upstream of the decision point.
Forbes and Holmes (ll studied legibility with regard to letter height, width, and reflectorization in the laboratory situation. Tests of series B (narrow) and series D (wide) letters were made during daylight and at night. The daylight visibility distance for subjects with 20/40 visual acuity (average) was 33 ft/in of letter height for the Bseries letters and 50 ft/in for the D-ser ies letters. At night there was a 10-20 percent loss in legibility for both letter series. They also found that at night reflectorized letters against a dark background were as legible as floodlighted letters; however, there was a 30-40 percent loss of legibility distance when the signs were lighted by low beams.
Richards (_~) reviewed research concerned with visibility of signs during night driving. Night visibility of signs depends on their size, reflectivity, and illumination. Reflectorized signs depend on the amount and the angle of illumination for the sign to be most effective with regard to legibility.
Straub and Allen (}) in a laboratory study investigated the effects of vehicle illumination on sign placement. The laboratory studies consisted of several types of reflective signs that were illuminated by a vehicle headlamp. The sign position was changed to correspond to different placement locations on a highway. The level of illumination reflected for each type of sign was determined by using a light meter. For overhead signs, the study showed that heights 5-8 ft above the pavement were more easily read than those placed higher. For roadside signs it was found that signs should be no more than 6 ft from the road edge for optimum headlight luminance. The authors found that both beams result in the highest sign luminance between 200 and 300 ft from the sign.
Allen (!) performed a field study to compare day and night legibility of different types of static highway signs. The subjects were placed in a vehicle that traveled on a straight flat section of rural highway in which a test sign had been erected. The sign contained several four-letter words that the subjects were told to read. These same 48 subjects participated in both the day and night observations. The letters were standard series E with a widened stroke. Letter heights were 8, 12, 15, and 18 in. These signs were illuminated by a rheostat-controlled bank of tungsten lamps placed on the side of the roadway at levels of O .1, 1.0, 10.0, and 100.0 footlamberts. The findings were that average daytime legibility distance was about 88 ft/in of letter height. On average, opt-i~ mally illuminated signs (10 footlamberts) were approximat'ely l.5 percent less than daylight legibility,
Roberts (.2_) also studied the effects of roadside placement of signs on legibility distance. He found that if the signs were placed less than 30 ft from the edge of the road, the legibility of the sign was greater than 50 ft/in of letter height. Signs farther than 30 ft from the edge had a legibility of less than 50 ft/in of letter height.
Ivey and others (6) performed a field test of the effects of rain on ;isibility and the opetation of
Transportation Research Record 844
the motor vehicle. They used four different targets, selected to be representative of highway obstacles, to determine the visibility distances from inside an automobile during natural rainfall. The simulated rainfall represented 0.5, 1.0, 1.5, and 2.0 in of rain/h. This test indicated that object size and contrast with road surfaces were factors that have a significant effect on visibility during various levels of rainfall.
Messer and others (7) performed a controlled field study to determine the legibility distance for words on a matrix changeable message sign. Three four-letter words with 18-in letter heights were used in the study. All tests were performed during the day and the drivers were not task loaded. The results of the test indicated a mean legibility distance of 46.6 ft/in of letter height, or 830 ft, only slightly less than the 50 ft/in rule-of-thumb for static signs.
One of the critical elements in motorists' use of urban freeway guide signing is the time they require to read and react to navigational messages presented to them. Surprisingly, there is little literature specifically related to the subject. King (~) presented an analytical analysis of signing in 1970 in which the sign-reading literature was summarized. Two equations for determining the time required to read a sign were presented. King pointed out that Mitchell and Forbes recommended using Equation l when the sign contained more than three words. About l s was recommended as the time required to make a single glance. Forbes also stated that an ordinary person can read three or four familiar words during a single glance.
t = (N/3) + 1.0 (!)
Work by the British Transport and Road Research Laboratory presents an alternative (Equation 2), which calculates reading time to determine letter size requirements. This equation is as follows:
t = 0.31N + 1.94 (2)
In both equations, t is the reading time and N is the number of familiar words on the sign,
Abramson (~) expanded this definition of N to include numerals together with familiar shapes and symbols, such as route shields and lane-assignment arrows. No experimental evidence for this expanded definition was given. One may conclude that the time required to read a familiar word is assumed to be about 0.31 s/word.
As is evidenced by the previous equations, it is generally believed that unfamiliar motorists req'uire more total time to read the information on a sign as more words are added to the message. It is assumed in the models that the increase in time is a linear constant with the number of words, although this assumption is questionable. By using King's expanded definition of N, the reading time required of a 4-panel overhead guide sign might require a total of 14.3 s to read, assuming each panel had 10 words on it. Personal driving experiences would suggest that 14.3 sis an unreasonably long required readfng time.
Mourant and others (10) used a·n eye-marker camera t·o record a driver's visual search and scan patterns under three levels of route familiarity (mediated by instructions) and two driving conditions (open driving and steady-state car following). The drivers drove on an exp·ressway rou'te for which they had memorized a set of directions. They were instructed on trial 1 to read all road signs as a driver who is unfamiliar with the route must do; on trial 2 to read only those signs necessary; and on trial 3 try not to read any signs, as the driver who is very
Transportation Research Record 844
familiar with the route does. The results showed that for open driving the visual patterns shifted to the left and down and showed more compactness as a function of trials. In addition, the percentage of time spent viewing road signs and the saccadic travel distance to fixations on other traffic, road and lane markers, and bridges and road signs decreased as the driver became more familiar with the route. For car following, the increase in compactness of the visual patterns over trials was pronounced, but there was no change in the center of location of the visual pattern. Compared with open driving, the travel distances for car following were greater when looking ahead and at bridges, road signs, and other vehicles. However, drivers in the car-following condition spent less time reading road signs, which indicates that they used the lead car as an aid for route guidance. Possible visual aids for decreasing the driver's visual workload under today's driving conditions were discussed.
Bhise and Rockwell (11) conducted a study to develop a methodology to evaluate signs by determining the degree of match between the characteristics of the sign, the abilities of the driver, and other components of the highway such as traffic and road geometrics. An eye-marker camera was used to obtain data on driver eye movements while reading 400 Interstate highway signs. The authors employed both laboratory and field studies to obtain the required data. By use of the eye-marker camera, it was determined that the drivers eyes do not continually sample information but make successive discrete fixations. A driver acquires information only during a fixation that is between 100-600 ms in length. For the information to be available to the driver, it must be resolvable. A computer program (sign evaluation by analysis of driver eye movements (SEADEN) J was developed to determine the eye fix at ion that provides resolvable information about the sign to the driver by using eye-movement data, roadway geometry, velocity profile and path, sign characteristics, and visual acuity. SEADEN also computed various time-distance relations that concern the resolvability of the information on the sign.
The results indicated that the drivers first obtained this resolvable information from the awareness of the legibility of the maximum-sized letters. When the ratio between the distances at which the sign becomes legible and the distances of the driver's first fixation is 1.0, then the driver acquires information as soon as the sign becomes visible. This ratio decreases when the driver's visual load increases. When there is a sequence of signs, the driver spends more time in acquiring information on the first and last sign. As the driver becomes more familiar with the sign, he or she requires less time to obtain the information, and the driver timeshares between the sign and the road while obtaining the information. Bhise and Rockwell (11) also found that when drivers were searching for the mileage to a given destination, it required between 1.6 and 2.2 s when there was between 2-4 words on the sign and between 2.2 and 2.3 s when the information load increased from 4 to 10 words, When the driver was searching for a particular destination that was presented on the sign, he or she required between 1.7-2. 2 s for 2-4 words and 2. 2-2. 4 s for 4-10 words, and when the driver was searching for a destination not presented on the sign, the driver required between 1.65-2.6 s for 2-4 words and 2 . 6-2.9 s for 4-10 words/sign.
These studies indicate that various researchers have done some studies in the area of information loading; however, a great deal more needs to be accomplished. It is not only sufficient to know how a driver acquires the information and the time and
43
distance required. It still remains to be determined at what information level do drivers become so inundated with information that they cannot possibly acquire it and therefore start making errors in their control and navigation tasks of driving. This research focuses on that problem.
RESEARCH OBJECTIVES
The objectives of this study were (a) to determine the time required to find and read the correct test sign panel (that sign that gives the subjects information about their destination) embedded on a simulated urban freeway sign-bridge structure, and (b) to determine the accuracy of the selection process as related to sign design ( information presented) and reading time. The research objectives were addressed in a laboratory environment by using licensed drivers as test subjects. The responses of these subjects to 35-mm slides of signs projected on a screen were recorded and evaluated.
STUDY VARIABLES
The specific magnitudes and variables studied during this phase of the research effort were as follows:
1. The number of panels per overhead-sign structure (2, 3, 4, and 5 panels),
2. The number of units of information on each panel (2, 4, 6, B, and 10 units),
3. The display time available for subjects to read the signs (2.5, 4, and 6 s), and
4. The percentage of subjects giving the correct response.
A discussion of these variables follows.
Number of Panels
The number of panels selected for study includes almost all likely overhead sign designs. Most overhead guide signs in large cities have 3 or 4 sign panels/sign structure. A few signs have 5 panels on them. In the fringe area of cities and in smaller cities and towns, 2- and 3-panel signs are more common. A typical sign panel has a green background (route-guidance information) and a white margin around it and usually contains an exit number, route number, cardinal direction, two destinations, and an exit direction for a total of 6 uni ts of information. Sign panels that have up to 10 units of information have been observed at major interchanges.
Units of Information
The following list illustrates what is defined in this study as a unit of information:
1, Place name (Denver), 2. Street name (Lamar Street) , 3. Route number (I-95), 4. Cardinal direction (North), 5. Exit number (Exit 243A), 6. Command (Exit), 7. Distance (0.5 mile), 8. Lane-use arrows (~), 9. Junction (Jct), and
10. Exit Only.
Some dif:t:erences of opinion and need for discretion are to be expected in applying these measures. For example, all lane-use arrows to the same destination are counted as one unit of information. Some complex traffic facility names, particularly freeways like Central Expressway or Santa Barbara Free-
--
44
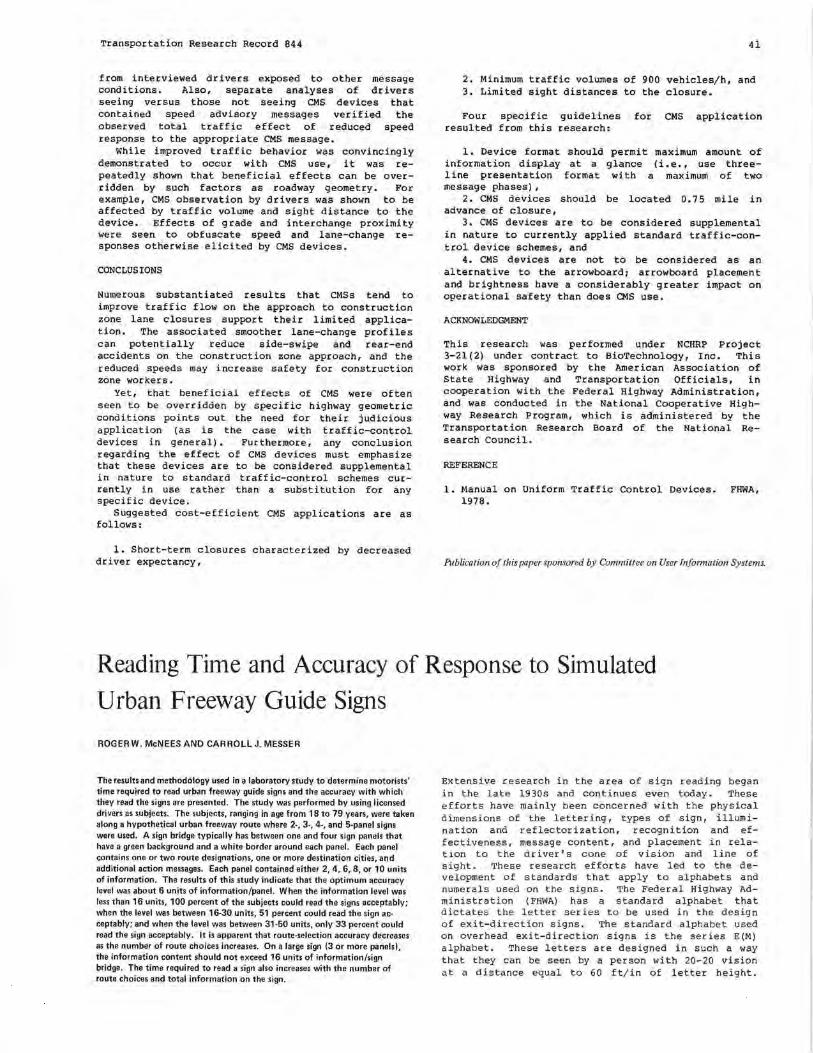
Figure 1. Three-panel, 4-unlts/panel test sign.
• •• 1 I 4
way, may be considered two units of information because of their size and possible confusion with a destination city,
The sign presented in Figure l illustrates a simulated sign used in this study that has 3 panels/sign structure with 4 units of information/ panel. One should keep in mind that information rates in reality are only those messages that are needed and evaluated by the driver and may not be accurately reflected by the total content of all the words, numerals, and symbols on a sign.
Display Time
The projection or display times of the slides of the signs in the laboratory simulated the total time a motorist may have available to read freeway guide signs in a typical urban freeway traffic environment. The reading time is only a portion of the total time that the sign is visible. It is also less than the total static legibility distance (or time) , which is less than the visibility distance (or time). The reason for this latter reduction is that motorists must time-share reading signs with other driving tasks, such as lane tracking and avoiding adjacent traffic. In addition, the last 150 ft or so immediately in advance of the sign is likely to be difficult to read due to the large vertical angle and relative motion of the sign with respect to the driver's visual scene.
The display times provided for reading the signs in the laboratory were selected to represent extreme, minimum, and desirable traffic (and design) condition.;. High-quality guide signs are readable for most people in the absence of obstructions, beginning about 900 ft away, or 11 s of lead time. Deducting 2 s for clearance of the sign and 50 percent of the rema1n1ng time as required for conducting other driving tasks leaves 4,5 s available for sign reading. From a conservative design viewpoint, it would be desirable to provide freeway motorists with perhaps 6 s of unobstructed reading time in an unloaded driving-task condition for each overhead freeway guide sign. The motorists would take a portion of that time (perhaps 4 s) to select the appropriate sign panel by locating and reading the route number, cardinal direction, and destination. Some additional confirmation time might be allowed. A minimum acceptable design criterion might assume that the overhead guide signs were readable for at least 4 s, which reflects higher traffic congestion, more critical alignments, and higher probabilities for vehicle blockage of the signs. As the previous calculations showed, the laboratory display times of 2. 5, 4, and 6 s seem to reasonably reflect extreme (unacceptable), minimum (acceptable), and desirable available reading times.
Accuracy
Accuracy of subject responses (selection of the proper sign panel that gives destination information) was measured in addition to reading times. The percentage of correct reponses based on the
Transportation Research Record 844
total laboratory subject population was determined for each test condition. It was expected that as the total information load increased and as the display time decreased for the same level of experience, accuracy levels would drop. An uninformed (or first-try) accuracy rate of 85 percent was arbitrarily selected as the minimum acceptable accuracy level.
RESEARCH METHODOLOGY
Two similar laboratory studies were conducted in an effort to accomplish the study objectives. In both studies, laboratory subjects were asked to follow a hypothetical route through an unfamiliar city based on (a) navigational directions provided by a schematic map of the area and (bl simulated guide signing presented by 35-mm slides at 22 locations along the route. A total of 87 subjects participated in the first laboratory study. The second study, conducted one year later, contained 70 subjects taken primarily from the same subject pool. The subjects ranged in age from 18 to 79 years, with a medium age of 34 years. Approximately 60 percent were male and 40 percent were female, We were not controlling for visual acuity and we wanted a representative sample of the driving public. We did not determine the visual acuity for all of the subjects. A discussion of the components of the research methodology follows.
Trip Scenac ios
Subjects approached the city of "Denver" from the southwest on I-50. They were then directed to follow the south loop around the city, and then were directed to take I-25 to Omaha. The subjects were advised of their trip before testing began. The loop route was selected to maximize the number of interchanges that could be conveniently studied.
A set of 22 test signs that have preselected design attributes was developed for testing as the subjects "drove" along the route. The 22 signs were composed of 4 types of panels by 5 levels of information-unit rates (20 test signs) plus duplicates of the 4xl0 and 5xl0 panels. An artist developed the test signs following the style (to some extent) of overhead freeway guide signs found in the urban centers of Texas. Photographs of the simulated signs were taken and converted into 35-mm 2x2-in slides. one example of the 22 test signs was presented in Figure L The colors of the various sign elements were as close to the correct color as could be obtained. The background for all the signs was sky blue.
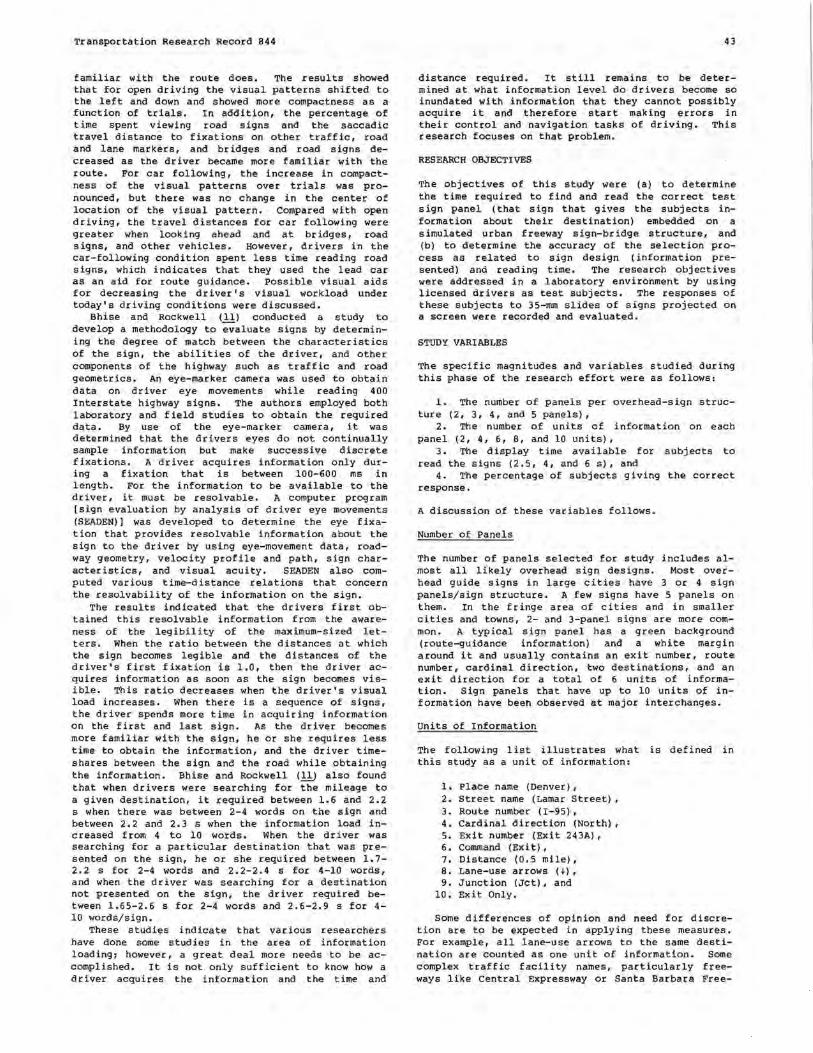
The laboratory scenarios called for the slides to be projected in a sequence consistent with the simulated trip. The slides were projected on a built-in wall screen in the laboratory by using rear-project ion techniques. Viewing conditions and legibility of the signs shown to the subjects were controlled to approximate the average legibility requirements of signs on freeways. The design, placement, and display of the test signs along the route were selected such that large differences between the amount of information on each sign were not placed on consecutive locations. One practice slide was provided at the start of the trip to acquaint the subjects with the laboratory testing procedure, Map slides, similar to Figure 2 but showing the present location of the trip, were alternated between the 22 test signs so that the subjects, it was hoped, would know the information needed to navigate along the route. These slides were presented for 2 sand then advanced to the next test slide.
The subjects were asked to select the sign panel
-!-

Transportation Research Record 844
Figure 2. Map of hypothetical city and route used in sign-reading study.
I l I I I I I I \ '- CITY LIMITS
I I I I I I I I I I __ /
MILTON
that provided information to the final destination from the set of panels on the sign bridge. It was assumed, and stated in the laboratory, that the sign panels would be placed immediately overhead of the corresponding freeway lane to drive in. The lane (or sign) number selected was given in the slides for each panel. At the bottom of each sign panel, a number representing the position of that panel on the bridge was printed on the slide.
Some subjects may have been confused in a few cases where the signing sequence (from the left) did not correspond to the lane assignments. For example, the first sign from the left may have been over lane 2 and the associated sign panel number would have been 2. To aid the subjects, the relative positions of sign panels over specific lanes were consistently maintained throughout the study.
Measurements
Estimates of subject reading times of the signs were obtained from electronically timed measurements of the time the slide became visible (human-operator input) until the time each subject activated his or her recorder unit. A student responder was used in the laboratory study for the subjects to indicate which sign panel contained the information that he or she needed to follow his or her route. There were five buttons located on this responder that corresponded to the five possible positions for the sign panels. Under each sign panel was a number, and this number was then entered into the responder system by each subject if that panel contained the required information. A recorder was at a master console at the back of the room recording the number entered by each subject. One of five numbered buttons could be selected, with the correct choice varying with each test sign. Subjects were asked to respond as soon as they were confident of their lane-assignment answer by pushing the corresponding numbered button on their data-recording unit. The accuracy of each response was also recorded for each subject. A maximum of five subjects could be tested at one time.
45
The subjects' average reaction time to a zerolevel information sign was developed such that this reaction time could be subtracted from the overall response times so that the reading time could be estimated. The zero-level information slides were slides that had a distinct red background with the message "Push Button No. l" on them. The subjects were shown one of the slides prior to testing, were informed of its purpose, and permitted to practice responding to it one time. The subjects were told that four of these slides would be randomly distributed through their trip and to respond to it accordingly. From these signs it was determined that an average subject population reaction time of 1.0 s existed. This time was subtracted from all measured response times to determine sign reading times.
Test Sequence
The 6- and 4-s display times were tested in the laboratory during March 1978. The sequence of projection times began with 6 sand the subjects drove the trip not knowing that, after a 10-min break, the trip would be redriven by using the same set of signs but displayed at 4 s. This procedure did result in some learning effect and improvement in response skill due to the previous experience. This was expected since the repeat test was conceptualized as a simulation scenario of semi-familiar urban freeway motorists who are experienced with the types and locations of decisions required.
The 2. 5-s rate was a test to see how the same subjects would perform under anticipated and expected high-stress levels. This study was conducted one year after the previous tests. Some 8 improvements to the original 22 signs were made to improve route following and were used during all three (2.5-, 4-, and 6-s) display-time tests. Some of these signs were creating biased results due to the location of the sign, the complexity of the sign, or the location of the sign panel on the bridge.
RESULTS
The results of the 6-, 4-, and 2.5-s display times are presented in the following sections. The results show that the faster the display time, the faster the subjects responded. The results also show that, in general, the greater the information load, the slower the reading time. It is also important to note that the faster the display rate of the greater information load on a sign, the lower the percentage of correct responses. Most anomalies in the results to follow can be explained by either the simplicity or complexity of determining the correct sign panel (and lane) of a particular sign as tested in the laboratory. The subjects were told to select the sign that presented the information to their destination and then respond. They were not required to respond in a set length of time; there~ fore, the traditional speed-accuracy trade-off did not take place. However, after the test slide was removed from the subjects, it took longer to respond; thus, the response would be less accurate.
Display Time of 6 Seconds
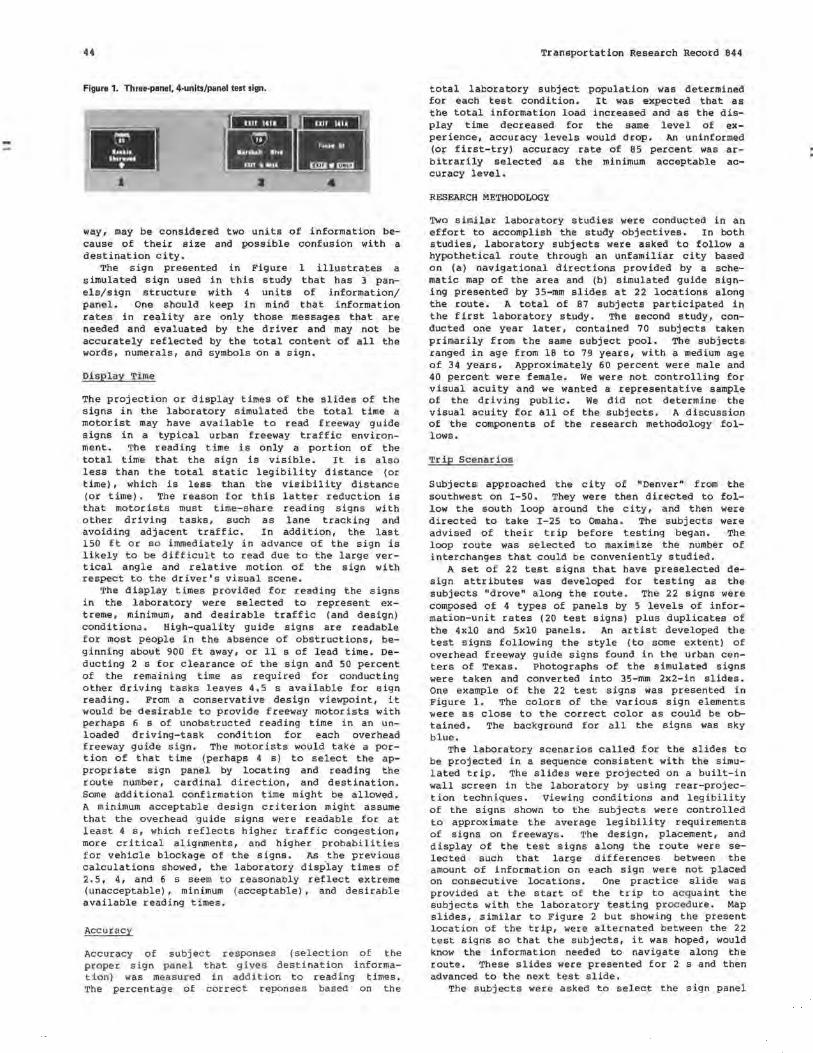
A summary of the results for the 6-s display time, as presented in Figures 3 and 4, shows that the median (50th percentile) reading time was 2.9 s and the 85th percentile was 4.6 s. The average percentage of correct responses is 75 percent for 84 usable subjects. Some of the subjects did not answer within a reasonable time compared with the other subjects. Therefore, not to bias the time data, we proceeded to the next situation. Those subjects'
46
responses we did not take into consideration when determining the reaction time or the accuracy of the responses.
There are some important trends to be noted that result from this study. As the amount of information units per sign panel (and total on the sign structure) increased, increased reading times and
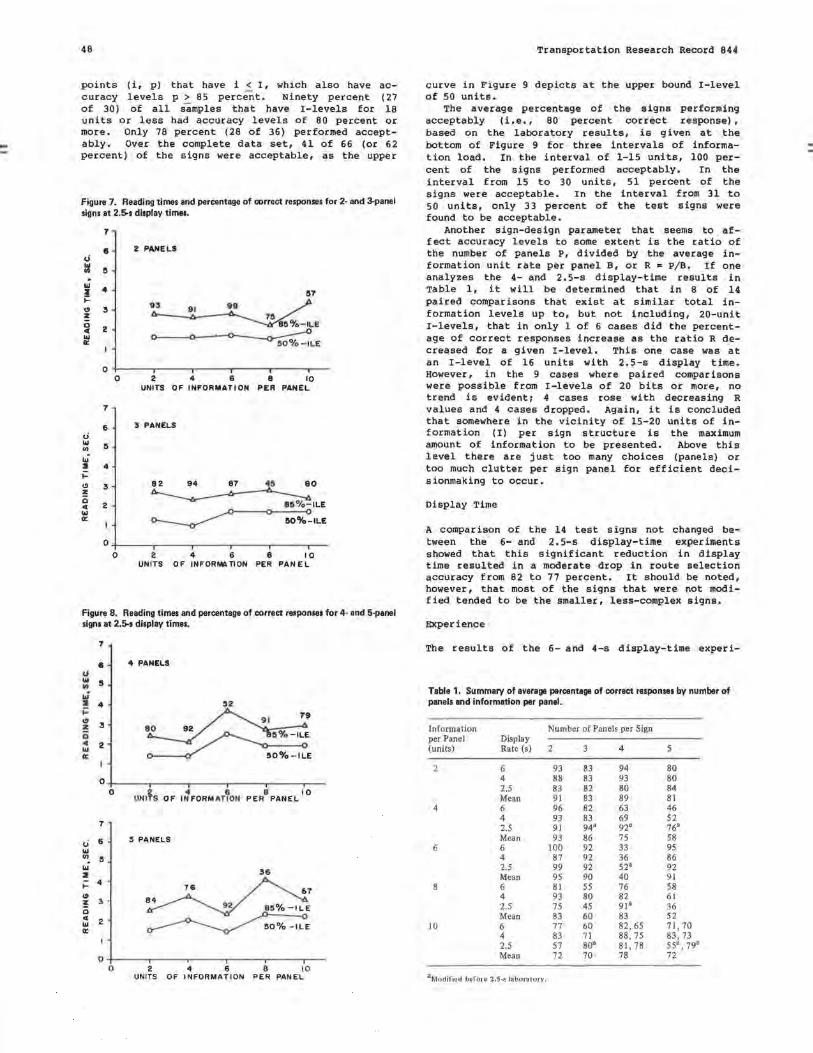
Figure 3. Reading times and percentage of correct responses for 2- and 3-panel signs at 6-s display times.
7
6 2 PANELS
r.i ... Cl) 5 .; ~7
:II 4 ;::: 9 U .. 3 z 0
~ ILE .. 2 ... a:
0 2 4 s B 10 UNITS OF INFORMATION PER PANEL
7
6 3 PANELS
J 82 60 ... Cl) 5
~ .; LE 2 4
;::: 8 .. 3
~LE
z 0 2 .. ... a:
0 2 4 6 B 10 UNITS OF INFORMATION PER PANEL
Figure 4. Reading times and percentage of correct responses for 4- and 5-panel signs at 6-s display times.
1 33
• u 76 74 ... 5 Cl)
.; 4 ! ... .. 3
z 0 2 C ... a:
0 2 4 6 B 10 UNITS OF IN FORMAT I ON PER PANiL
7 46 5 8
6 J "' 5 . Cl)
,J li 4 ;::: .. 3 ~ 0 .. 2 50%-ILE
"' "'
0 2 4 8 B 10 UNITS OF INFORMATION PER PANEL
Transportation Research Record 844
decreased accuracy levels generally were the result. These inverse trends are interrelated as the following comparisons show. The average values of the 50th percentile reading times and 85 percentile accuracy levels for all 2-panel signs are 2.2 sand 89 percent, respectively. On the other hand, the average values of the 50th percentile reading times and 85th percentile accuracy levels for all 5-panel signs are 3.3 s and 70 percent, respectively. Assuming that the 80th percentile correct response is selected as the minimum acceptable value, then four of the five 2-panel signs would be acceptable, whereas only one of the five 5-panel signs would be acceptable. The 6-unit 3- and 5-panel signs were selected v.ery accurately and with unusual speed as a result of the location during the trip scenario • The location of the test signs were randomly selected, which resulted in a certain amount of bias in the results. This was the cause of the very poor accuracy rate of the 6-unit 4-panel sign. These were 3 of the 8 changes made in the signs before the start of the second study, as described earlier .
Display Time of 4 Seconds
The 4-s display test was a repeat of the same 22 signs used in the 6-s study. As noted previously, a break of about 10 min separated the two simulated trips. The subjects were given no advance clues that the second study was going to be a repeat of the first run. Some learning effects and skills improvement were expected. The reason for the repeat laboratory test was that it might more readily simulate a semi-familiar motorist who has driven the facility in the recent past.
A summary of the 4-s display test is presented in Figures 5 and 6. The median (50th percentile) reading time was determined to be 2.0 s, the average 2.3 s, and the 85th percentile 3.5 s. A mean percentage of correct response of 78 percent was obtained for 84 usable subjects. This is a 3 percent increase above the initial run and illustrates subject improvement due to learning and experience.
The inverse relation between reading time and accuracy continued with the 4-s display experiment. For example, the average values of the reading times for all 2- and 5-panel signs were 1. 7 and 2. 3 s, respectively. That is, reading times increased with increasing information load. The respective accuracy levels, on the other hand, decreased from 89 to 71 percent. Again, by ~sing 80 percent as a minimum acceptable accuracy level, all 5 of the 2-panel signs performed acceptably. Only two of the five 5-panel signs had acceptable accuracy levels .
Display Time of 2. 5 Seconds
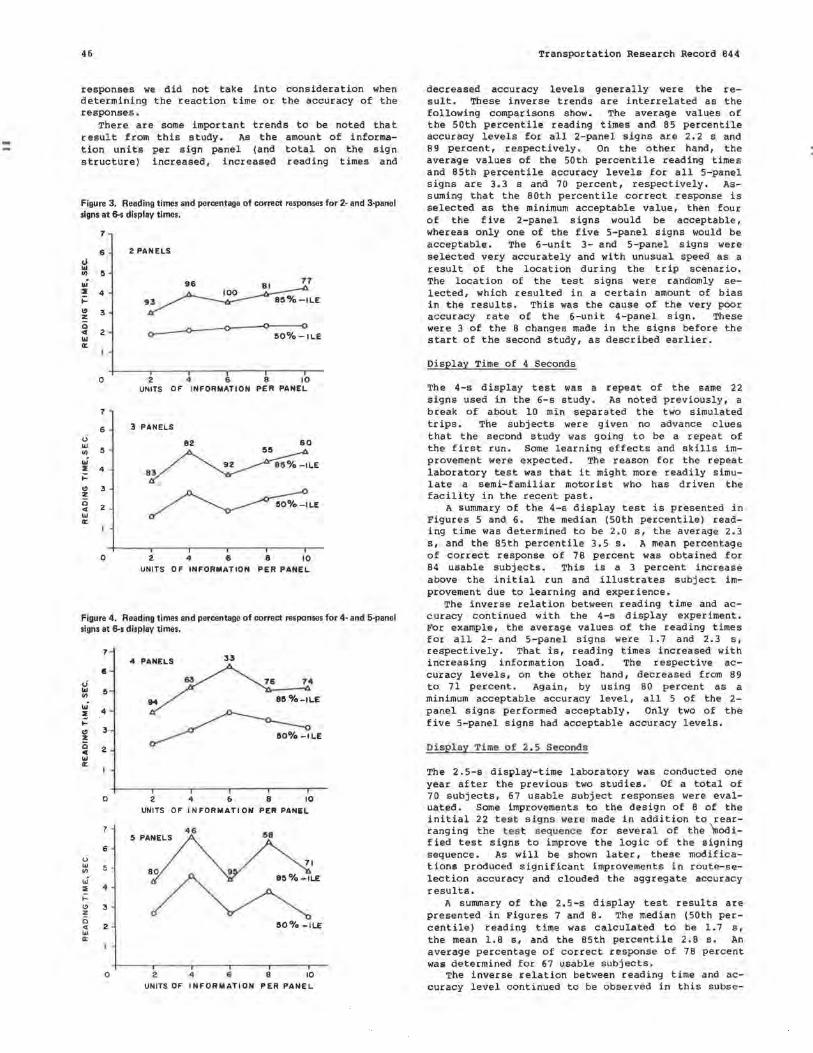
The 2. 5-s display-time laboratory was conducted one year after the previous two studies. Of a total of 70 subjects, 67 usable subject responses were evaluated. Some improvements to the design of 8 of the initial 22 t est s igns were made in addition to rearranging the tes t s equence for several of the 'modified test signs to improve the logic of the signing sequence. As will be shown later, these modif ications produced significant improvements in route-selection accuracy and clouded the aggregate accuracy results.
A summary of the 2.5-s display test results are presented in Figures 7 and 8. The median (50th percentile) reading time was calculated to be 1.7 s, the mean 1.8 s, and the 85th percentile 2.8 s. An average percentage of correct response of 78 percent was determined for 67 usable subjects.
The inverse relation between reading time and accuracy level continued to be observed in this subse-

Transportation Research Record 844
quent experiment. The average of the 50th percentile reading times was determined to be 1.7 s for all 2-panel signs and 1.9 s for all 5-panel signs. The average percentage of correct responses for all 2-panel signs had accuracy levels above 80 percent. However, only two of the five 5-panel signs performed acceptably.
Figure 5. Reading times and percentage of correct responses for 2- and 3-panel signs at 4-s display times.
7 2 PANELS
6
cJ
"' 5 Ill
,J 4 :r
;: <!I 3 l!!:
~ 3 85 o/o - lLE
C 2 <(
"' a:
0 2 4 6 8 10 UNITS OF INFORMATION PER PANEL
7 3 PANELS
6
cJ "' 5 II)
,J :r 4 ;: <!I 3 :!:
83 BO TI
~ ILE C <( 2 "' a: - -ILE
0 2 4 6 8 10 UNITS OF INFORMATION PER PANEL
Figure 6. Reading times and percentage of correct responses for 4- and 5-panel signs at 4-s display times.
7
4 PANELS 6
cJ w 5 II)
w" 4
~ :t: f- 9 ILE <!I J z
~ ILE
0 2 <( w a:
0 2 4 6 8 10 UNITS OF INFORMATION PER PANEL
7 5 PANELS
6 u w 5 61 II)
~ ,J :t: 4 8 8 ;: <!I 3 85%-ILE z
~ ILE
0 <( 2 w a:
0 2 4 6 8 10 UNITS OF INFORMATION PER PANEL
47
DISCUSSION OF RESULTS
A discussion of the results of the three displaytime experiments follows. Comparisons are made from among the accuracy and reading-time results. Useful research findings are drawn from these comparisons and analyses.
Accuracy
The ability of the laboratory subjects to select the correct sign panel was found to depend on several variables; namely, total units of information on the sign, display time, and experience. Sign modifications also were found to impact accuracy results.
Information
A summary of the average percentages of correct response results by the sign-information test var iables--number of sign panels per sign structure and information uni ts per test panel--is presented in Table 1. At the outset, the sign-modification impacts between the 6- and 2.5-s display rates should be noted from Table 1. Of the 14 test signs not modified, 11 showed reductions in accuracy levels, l was unchanged, and 3 experienced slight accuracy increases. The mean percentage of correct responses of the data set dropped 5 percentage points on average, from 82 to 77 percent. Of the 8 signs that were modified, all 8 showed increases in the percentage of correct responses. The accuracy levels of the 8 modified signs increased 13 percentage points from 64 to 77 percent. Although there was no objective originally to suboptimize the sign designs, these findings do show that suboptimal sign designs can be significantly improved.
If it is assumed that the 6-, 4-, and 2.5-s display-test results represent samples of existing sign designs, reading requirements, and representative driver experiences for design-evaluation purposes, then the results of the 66 tests (3 display rates by 22 test signs) may be pooled to analyze combined accuracy results. The following analyses are conducted under this assumption.
The pooled accuracy results of Table l suggest that 6 units of information/panel are about optimum, which recognizes that 2 uni ts are not a practical value. This conclusion is drawn from a consideration of the average accuracy levels of the 2-, 4-, 6-, 8-, and 10-unit signs in Table l (i.e., 86, 78, 79, 70, and 73 percent, respectively). It can also be determined from Table l that the average percentage of correct responses decreased with an increasing number of panels and with total information load I, where I is the product of number of panels P, and by the average number of units of information per panel B, or I = P x B. The average percentage of correct responses for 2-, 3-, 4-, and 5-panel signs in Table l is 87, 78, 73, and 71 percent, respectively. The average percentage of correct responses for I-levels of 8, 12, 16, 24, and 40 units of information is calculated from the average of two cells for each I-level to be 91, 91, 79, 51, and 65 percent, respectively.
An analysis of the 66 individual data points from the three display-time experiments further reveals the reduction in accuracy rates with increasing total information levels on a sign. From Table l it can be determined that all 21 test signs that have I-levels of 12 units or less had accuracy levels of 80 percent correct or better. Again, 80 percent correct response is assumed to be the minimum acceptable level per test for this laboratory. These results are reflected by the upper curve in Figure 9. This curve shows the percentage of all data
48
points (i, p) that have i < I, which also have accuracy levels p > 85 percent. Ninety percent (27 of 30) of all samples that have I-levels for 18 units or less had accuracy levels of 80 percent or more. Only 78 percent (28 of 36) performed acceptably. Over the complete data set, 41 of 66 (or 62 percent) of the signs were acceptable, as the upper
Figure 7. Reading times and percentage of correct responses for 2- and 3-panel signs at 2.5-s display times.
7
• 2 PANELS .; 1:1 !I .,j
4 :I !17 .:
~ Cl) 3 z n 8!1o/o - lLE 0
2 " ~LE ... Cl:
o-1-------~--~--~---~-0 2 4 6 8 10
UNITS OF INFORMATION PER PANEL
7
6 3 PANELS .; ... !I "' ..; :I 4 .: Cl) 3 z 0
2 C( ... Cl:
8 2 94 87 4!1 80
~ 8!1%- ILE
~ILE
0
0 2 4 6 8 10 UNITS OF INFORMATION PER PANEL
Figure 8. Reading times and percentage of correct responses for 4- and 5-panel signs at 2.5-s display times.
7
• 4 PANELS rJ Ill s "' ..; :I 4 !12 .:
~ Cl) 3 z
~ 0 C( 2 ... Cl: E
0 0
UN&$ OF 4 6 8 10
IN FORM ATION PER PANEL
7
<.i 6 !I PANELS ... "' !I ..;
36 :I j:: 4
<!I ~7 ! 3 8
E 0
~ E
C( ... 2 Cl:
0 0 2 4 6 8 10
UNITS OF INFORMATION PER PANEL
Transportation Research Record 844
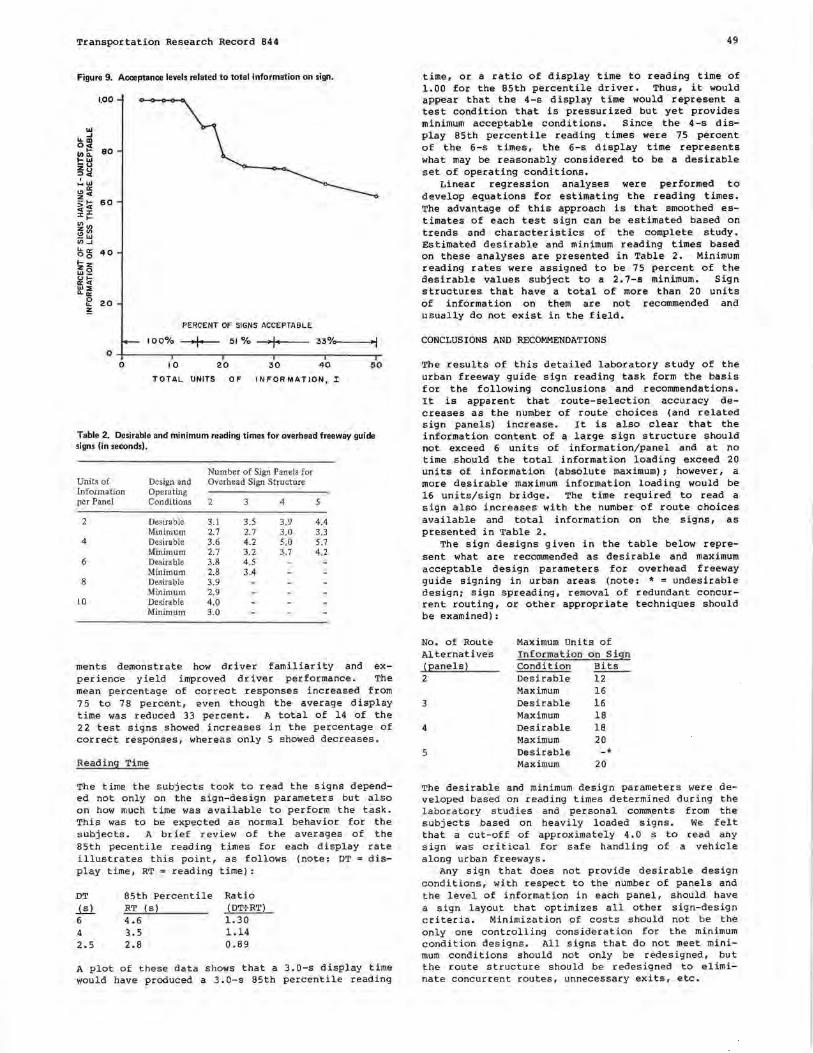
curve in Figure 9 depicts at the upper bound I-level of 50 units.
The average percentage of the signs performing acceptably (i.e., 80 percent correct response), based on the laboratory results, is given at the bottom of Figure 9 for three intervals of information load. In the interval of 1-15 units, 100 percent of the signs performed acceptably. In the interval from 15 to 30 units, 51 percent of the signs were acceptable. In the interval from 31 to 50 units, only 33 percent of the test signs were found to be acceptable.
Another sign-design parameter that seems to affect accuracy levels to some extent is the ratio of the number of panels P, divided by the average information unit rate per panel B, or R = P/B. If one analyzes the 4- and 2. 5-s display-time results in Table l, it will be determined that in 8 of 14 paired comparisons that exist at similar total information levels up to, but not including, 20-unit I-levels, that in only l of 6 cases did the percentage of correct responses increase as the ratio R decreased for a given I-level. This one case was 'at an I-level of 16 units with 2.5-s display time. However, in the 9 cases where paired comparisons were possible from I-levels of 20 bits or more, no trend is evidenti 4 cases rose with decreasing R values and 4 cases dropped. Again, it is concluded that somewhere in the vicinity of 15-20 units of information (I) per sign structure is the maximum amount of information to be presented. Above this level there are just too many choices (panels) or too much clutter per sign panel for efficient decisionmaking to occur.
Display Time
A comparison of the 14 test signs not changed between the 6- and 2.5-s display-time experiments showed that this significant reduction in display time resulted in a moderate drop in route selection accuracy from 82 to 77 percent. It should be noted, however, that most of the signs that were not modified tended to be the smaller, less-complex signs.
Experience
The results of the 6- and 4-s display-time experi-
Table 1. Summary of average percentage of correct responses by number of panels and information per panel.
Information Number of Panels per Sign per Panel Display (units) Rate (s) 2 3 4 5
2 6 93 83 94 80 4 88 83 93 80 2.5 83 82 80 84 Mean 91 83 89 81
4 6 96 82 63 46 4 93 83 69 52 2.5 91 94• 92• 76" Mean 93 86 75 58
6 6 100 92 33 95 4 87 92 36 86 2.5 99 92 52" 92 Mean 95 90 40 91
8 6 81 55 76 58 4 93 80 82 61 2.5 75 45 91 8 36 Mean 83 60 83 52
10 6 77 60 82,65 71, 70 4 83 71 88, 75 83, 73 2.5 57 so• 81, 78 55•, 79• Mean 72 70 78 72
3Modified before 2.5-s laboratory .
Transportation Research Record 844
Figure 9. Acceptance levels related to total information on sign.
1.00
PERCENT OF SIGNS ACCEPTABLE
IO o0/o -+I-- 51 °/o 33 %0-----;>>jl 0-+-----,----,-----.---------~
0 10 20 30 40 50
TOTAL UNITS OF INFORMATION, I
Table 2. Desirable and minimum reading times for overhead freeway guide signs (in seconds).
Number of Sign Panels for Units of Design and Overhead Sign Structure Information Operating per Panel Conditions 2 3 4 5
2 Desirable 3.1 3.5 3.9 4.4 Minimum 2.7 2.7 3.0 3.3
4 Desirable 3.6 4.2 5.0 5.7 Minimum 2.7 3.2 3.7 4.2
6 Desirable 3.8 4.5 Minimum 2.8 3.4
8 Desirable 3.9 Minimum 2.9
10 Desirable 4.0 Minimum 3.0
ments demonstrate how driver familiarity and experience yield improved driver performance. The mean percentage of correct responses increased from 75 to 78 percent, even though the average display time was reduced 33 percent. A total of 14 of the 22 test signs showed increases in the percentage of correct responses, whereas only 5 showed decreases.
Reading Time
The time the subjects took to read the signs depended not only on the sign-design parameters but also on how much time was available to perform the task. This was to be expected as normal behavior for the subjects. A brief review of the averages of the 85th pecentile reading times for each display rate illustrates this point, as follows (note: DT = display time, RT= reading time):
DT 85th Percentile Ratio
ill RT (s ) (DT+RT) 6 4.6 1. 30 4 3.5 1.14 2.5 2.8 0.89
A plot of these data shows that a 3.0-s display time would have produced a 3. 0-s 85th percentile reading
49
time, or a ratio of display time to reading time of 1.00 for the 85th percentile driver. Thus, it would appear that the 4-s display time would represent a test condition that is pressurized but yet provides minimum acceptable conditions. Since the 4-s display 85th percentile reading times were 75 percent of the 6-s times, the 6-s display time represents what may be reasonably considered to be a desirable set of operating conditions.
Linear regression analyses were performed to develop equations for estimating the reading times. The advantage of this approach is that smoothed estimates of each test sign can be estimated based on trends and characteristics of the complete study. Estimated desirable and minimum reading times based on these analyses are presented in Table 2. Minimum reading rates were assigned to be 75 percent of the desirable values subject to a 2. 7-s minimum. Sign structures that have a total of more than 20 units of information on them are not recommended and usually do not exist in the field.
CONCLUSIONS AND RECOMMENDATIONS
The results of this detailed laboratory study of the urban freeway guide sign reading task form the basis for the following conclusions and recommendations. It is apparent that route-selection accuracy decreases as the number of route choices (and related sign panels) increase. It is also clear that the information content of a large sign structure should not exceed 6 units of information/panel and at no time should the total information loading exceed 20 units of information (absolute maximum); however, a more desirable maximum information loading would be 16 units/sign bridge. The time required to read a sign also increases with the number of route choices available and total information on the signs, as presented in Table 2.
The sign designs given in the table below represent what are recommended as desirable and maximum acceptable design parameters for overhead freeway guide signing in urban areas (note: * = undesirable design; sign spreading, removal of redundant concurrent routing, or other appropriate techniques should be examined):
No. of Route Maximum Units of Alternatives Infor.mation o n Sign !eanels) Condition Bits 2 Desirable 12
Maximum 16 3 Desirable 16
Maximum 18 4 Desirable 18
Maximum 20 5 Desirable -· Maximum 20
The desirable and minimum design parameters were developed based on reading times determined during the laboratory studies and personal comments from the subjects based on heavily loaded signs. We felt that a cut-off of approximately 4. 0 s to read any sign was critical for safe handling of a vehicle along urban freeways.
Any sign that does not provide desirable design conditions, with respect to the number of panels and the level of information in each panel, should have a sign layout that optimizes all other sign-design criteria. Minimization of costs should not be the only one controlling consideration for the minimum condition designs. All signs that do not meet minimum conditions should not only be redesigned, but the route structure should be redesigned to eliminate concurrent routes, unnecessary exits, etc.

--
50
REFERENCES
l.
2.
3.
4.
5.
6.
T.W. Forbes and R.S. Holmes. Legibility Distances of Highway Destination Signs in Relation to Letter Height. Proc., HRB, Vol. 19, 1939, pp. 321-335. o.w. Richards. vision at Levels of Night Road Illumination. HRB, Bull. 56, 1952, pp. 36-65. A.L. Straub and T.M. Allen. Sign Brightness in Relation to Position, Distance, and Reflectorization. HRB, Bull. 146, 1956, pp. 13-44. T.M. Allen. Night Legibility Distance of Highway Signs. HRB; Bull. 191, 1958, pp. 33-40. A.W. Roberts. A Study of Lateral Sign Placement. Connecticut Highway Department, Hartford, 1968. D.L. Ivey, E.K. Lehtipuu, and J.W. Button. Rainfall and Visibility--The View From Behind the Wheel. Journal of Safety Research, Vol. 7, 1975, pp. 156-169.
7. C.J. Messer, W.R. Stockton, J.M. Mounce, D.A. Andersen, and J.M. Turner. A Study of Physical
Transportation Research Record 844
Design Requirements for Motorists Information Matrix Signs. Texas Transportation Institute, Texas A,M Univ., College Station, unpublished rept., Research Foundation Project 3112, 1976.
8. G.F. King. Some Effects of Lateral Sign Placement. HRB, Highway Research Record 325, 1970, pp. 15-27.
9. N. Abramson. Information Theory and Coding. McGraw-Hill, New York, 1963.
10. R.R. Mourant, T.H. Rockwell, and N.J. Rackoff. Driver's Eye Movements and Visual Workload. Systems Research Group, Department of Industrial Engineering, Ohio State Univ., Columbus, Jan. 1969.
11. v.D. Bhise and T.H. Rockwell. Toward the Development of a Methodology for Evaluating Highway Signs Based on Driver Information Acquisition. HRB, Highway Research Record 440, 1973, pp. 38-51.
Publication of this paper sponsored by Committee on User Information Systems.
Use of Computerized Roadway-Information System in Safety Analyses MARK A. FLAK AND JAMES C. BARBARESSO
The investigation of safety problems at a site requires that accident patterns be identified to aid in defining whether a safety problem exists and the level of the safety problem. Traditionally, safety engineers have identified accident patterns based on a combination of a visual inspection of collision diagrams and a site review of the study location. This approach, although enabling the engineer to identify accident patterns at a site, fails to define whether the magnitude of the patterns is sufficient to warrant the critical review of specific patterns and to recommend countermeasures to alleviate them. Rather, these decisions are made based on the engineering judgment of the safety engineer. A procedure that describes a mathematical approach used to identify safety problems and recommends countermeasures is described. By using a comprehensive roadway-information data base, this procedure is being used in Michigan by the Oakland County Road Commission in its highway risk management program. Similar roadway sites are selected based on geometric and operational parameters provided in the data base. These data, in combination with an accident data base for the defined roadway system, permit the analysis and comparison of accident characteristics of a study site to other similar sites. These analyses are also used in the identification of favorable countermeasures by comparing accident characteristics between similar sites with and without a particular countermeasure. These findings can also be used to develop accident-reduction factors for specific countermeasures.
Highway-safety professionals have long recognized the need for an organized approach for the correction of safety problems. This objective led the Federal Highway Administration (FHWA) to establish several programs to assist state and local agencies in improving safety on highways under their jurisdiction. These programs served to guide, assist, and encourage highway agencies to upgrade and maintain their highway system based on highway-safety objectives. The programs ranged from funds provided to identify and correct hazardous locations to the earmarking of funds for specific categorical programs and for the development of procedures to efficiently and effectively maintain a highway-safety improvement program (HSIP).
The HSIP was described in Federal Highway Program Manual (FHPM) 6-8-2-1. The FHPM described a systematic procedure for organizing a safety-improvement program. FHPM 6-8-2-1 was superceded in 1979 by FHPM 8-2-3. FHPM 8-2-3 recommends that processes for planning, implementing, and evaluating highwaysafety projects be instituted on a statewide basis. It is planned that each state develop and implement, on a continuing basis, a HSIP that has the overall objective of reducing the number and severity of accidents and decreasing the potential for accidents on all highways.
A major component of the HSIP is the planning component. The planning component consists of the collection and maintenance of traffic, highway, and accident data; the identification of hazardous locations; the application of engineering studies, and the development of safety projects and their implementation. Prior to the development of safety projects, individual site investigations are required. The investigation requires that the site and its roadway, traffic, and accident characteristics be reviewed and that safety problems be identified in order to select favorable countermeasures. A review of the cost-effectiveness, safety impacts, and other significant factors for each countermeasure results in the development of a safety project.
To aid in the development and maintenance of the HSIP and highway risk management program for Oakland county, Michigan, the Oakland County Road Commission developed a comprehensive roadway-information system. This system uses computerized roadway, roadside, and accident data bases and a statistical computer package to assist the Road Commission in its safety analyses. The system not only permits the maintenance of highway, traffic, and accident data but allows a variety of safety analyses to develop