Embed Size (px)
Citation preview

Read
y fo
r wha
t’s
■ For the 14th consecutive year, Duke Energy was named to the Dow Jones Sustainability Index for North America.
■ Duke Energy was named to Fortune magazine’s “World’s Most Admired Companies” list in 2020 for the third consecutive year.
■ Forbes magazine named Duke Energy one of “America’s Best Employers” in 2019.
■ Forbes magazine named Duke Energy one of “America’s Best Employers for Diversity” in 2020 and one of “America’s Best Employers for Women” in 2019.
■ Duke Energy received a perfect score for the third year in a row on the Human Rights Campaign’s 2020 Corporate Equality Index, and was named to the organization’s list of “Best Places to Work for LGBTQ Equality.”
■ Duke Energy received a “HIRE Vets Medallion Award” in 2019 from the U.S. Department of Labor for recruiting, employing and retaining veterans.
■ Labrador Advisory Services ranked Duke Energy No. 1 among U.S. utilities for investor transparency.
■ Duke Energy was ranked 125 on Newsweek magazine’s 2020 list of “America’s Most Responsible Companies,” out of 2,000 companies analyzed.
■ Duke Energy received the Edison Electric Institute’s “Emergency Recovery Award” for the company’s power restoration efforts after Winter Storm Diego hit the Carolinas in December 2018.
■ The Arbor Day Foundation recognized Duke Energy as a 2019 Tree Line USA utility in Florida, Indiana, Kentucky, Ohio and the Carolinas.
■ Duke Energy was recognized for ethics and compliance excellence by the Ethisphere Institute with its “Compliance Leader Verification” designation for 2019 and 2020.
■ For the 15th consecutive year, Duke Energy in 2019 was named to Site Selection magazine’s list of “Top Utilities in Economic Development.”
Table of Contents
A Message From Our CEO . . . . . . . . 3
About This Report . . . . . . . . . . . . . . 5
Duke Energy At A Glance . . . . . . . . . 6
Value Creation Model . . . . . . . . . . . . 8
Our Stakeholders and What Matters Most . . . . . . . . . . . . 10
Our Sustainability Plan and Goals . . . . . . . . . . . . . . . . . . . 12
Management Approach to Sustainability . . . . . . . . . . . . . . 14
Customers . . . . . . . . . . . . . . . . . . . 15
Growth . . . . . . . . . . . . . . . . . . . . . 24
Operations . . . . . . . . . . . . . . . . . . . 34
Employees . . . . . . . . . . . . . . . . . . . 47
2019 | 2020
RECOGNITIONS
Duke Energy published its 2019 Sustainability
Report in April 2020 during the COVID-19
(coronavirus) pandemic. Learn about the company’s
response to this crisis at dukeenergyupdates.com.
2 | 2019 DUKE ENERGY SUSTAINABILITY REPORT
INTR
ODUC
TION

A Message From Our CEO
This is an extraordinary time for our company and our country as we respond to the impact of COVID-19. This pandemic is unlike anything we’ve seen – and it’s required us to dramatically adjust how we operate. Like people everywhere, we’ve experienced a range of emotions – everything from fear and anxiety to hope and pride – as we navigate this together.
Having a mission, vision and values keeps us grounded in an uncertain time. Our purpose at Duke Energy has never been more important. We provide an essential service. We power the daily lives of our employees, customers and communities, no matter the circumstances. And sustainability is a critical part of that.
The importance of delivering value through sustainability continues to grow, reshaping how industries operate, invest and deliver value to their stakeholders.
I’m proud to say we have a strong track record on sustainability, including the actions we’ve taken to reduce the impact of our operations on the environment. For example, last year we decreased our carbon emissions an additional 8 percent from 2005 levels, bringing total reductions to 39 percent.
That’s progress – but we’ve taken our commitment even further.
In 2019, we refreshed our climate strategy and accelerated our goals – we now plan to reduce carbon emissions from electricity generation by at least 50 percent by 2030 and achieve net-zero emissions by 2050. In the pages that follow and our newly released Climate Report, you’ll find more details on how we plan to achieve these targets. We’re also strong advocates for investments in research and development and technologies that don’t exist at scale yet today.
LYNN J. GOOD
Chair, President and Chief Executive Officer
Ready for what’s
3 | 2019 DUKE ENERGY SUSTAINABILITY REPORT
2019 ResultsOther highlights of our sustainability success in 2019 include:
■ Shared our plans to pursue subsequent license renewal to operate our nuclear fleet for another 20 years. Nuclear power is a linchpin in achieving our climate goals – providing nearly 90 percent of our carbon-free generation.
■ Announced over 1,500 megawatts of new wind and solar projects in our Commercial Renewables business, and made significant progress on new solar projects in our regulated businesses in Florida and the Carolinas.
■ Brought our Asheville combined-cycle natural gas plant online in North Carolina and have since retired two coal-fired units at the site.
■ Improved reliability measures 15 percent year over year and prevented more than 610,000 extended power outages, saving customers approximately 62 million outage minutes with self-optimizing grid capabilities.
■ Issued an additional $1.3 billion in green bonds, bringing our total clean energy offerings to $2.3 billion since 2018.
■ Announced plans to support the deployment of nearly 7,500 electric vehicle chargers in our service territories including residential, fleet, public transit and highway fast charging.
■ Increased investment in battery storage, including approximately $600 million over the next five to 10 years to expand capabilities by nearly 400 megawatts.
■ Continued to build a diverse and talented workforce that’s positioned to meet the pace of change in our industry. This includes the establishment of our Optimist Hall facility with nearly 400 employees dedicated to developing new products and services and transforming how we operate our business.
■ Remained active in the communities we serve, creating jobs, fostering innovation and providing support. In 2019, we helped attract over 15,000 jobs and $7.1 billion across our service territories.
■ Donated more than $30 million in 2019 to help tackle pressing community issues, such as the opioid epidemic, access to affordable housing and skilling the workforce for the jobs of tomorrow.
Continuing Our LegacyIn a time when uncertainty is the only certainty, it reminds us to stay focused on the path forward.
We’re embracing change as we prepare our business to meet tomorrow’s energy needs. We’re becoming more efficient, more competitive and more agile – while maintaining our commitment to sustainability.
There’s no question sustainability is a defining characteristic of our future, and I look forward to continuing our legacy of meeting the needs of our stakeholders.
Lynn J. Good Chair, President and Chief Executive Officer
April 28, 2020
4 | 2019 DUKE ENERGY SUSTAINABILITY REPORT
INTR
ODUC
TION
THE IMPORTANCE OF DELIVERING VALUE THROUGH SUSTAINABILITY CONTINUES TO GROW, RESHAPING HOW
INDUSTRIES OPERATE, INVEST AND DELIVER VALUE TO THEIR STAKEHOLDERS.
About This ReportThe energy industry is changing. At Duke Energy, we want to give our customers, employees, and stakeholders a front seat to impact and witness this exciting transformation.
In 2019, we announced a commitment to be carbon neutral by 2050, a key development as we seek to build a cleaner energy future.
Tomorrow’s energy landscape will continue to address key issues of today: Ensuring reliable and affordable energy while addressing the important issue of climate change. We must also be mindful of a changing workforce, economic opportunity for the communities we serve, cybersecurity and the role of new technology, and we will need to collaborate with our stakeholders to develop solutions to these issues.
Successful companies are those that recognize and adapt to a changing landscape. In this report, you will notice the many areas where engagement with our external stakeholders has created positive outcomes.
That engagement will continue as Duke Energy moves toward a more clean, affordable and reliable energy system. Maintaining open, two-way communication channels will help us promote a better environment for sustainability to thrive.
As always, we aim to make sure our information is comprehensive, clear and paints an accurate picture of the company. We are proud of the progress we’ve made and are focused on opportunities for improvement.
In addition to this Sustainability Report, you can find a detailed Global Reporting Initiative Index on our website. Duke Energy is also participating in the Edison Electric Institute and American Gas Association sustainability reporting initiative.
The company has also issued a 2020 Climate Report to provide more details on how we are managing climate risks, including physical, policy and economic risks – as well as our plan to transition to a cleaner energy future. The report is organized to align with the Taskforce on Climate-related Financial Disclosures (TCFD) framework.
Lastly, we intend to use the Sustainability Accounting Standards Board (SASB) standards in 2020 to help inform our sustainability reporting.
Thank you for your interest in the 2019 Sustainability Report and Duke Energy.
Louis RenjelSenior Vice PresidentFederal Government and Corporate Affairs
5 | 2019 DUKE ENERGY SUSTAINABILITY REPORT
Louis Renjel
Senior Vice President Federal Government and Corporate Affairs
Duke Energy At A Glance
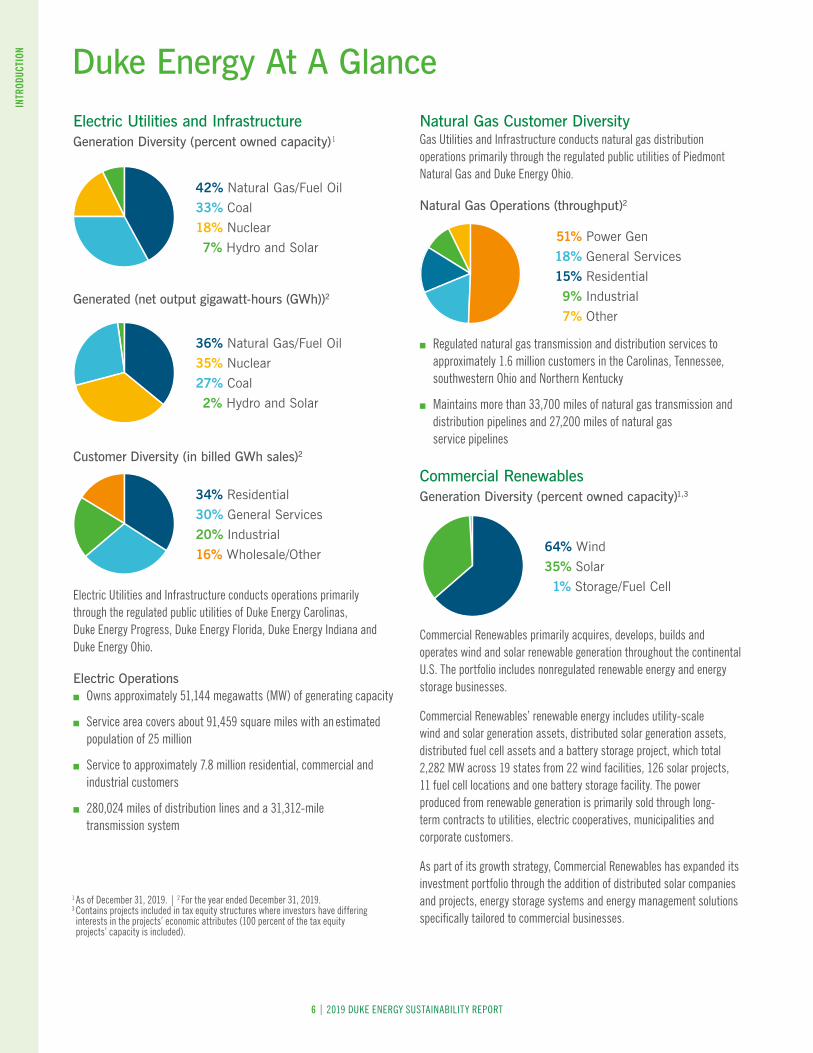
Electric Utilities and InfrastructureGeneration Diversity (percent owned capacity) 1
42% Natural Gas/Fuel Oil
33% Coal
18% Nuclear
7% Hydro and Solar
Generated (net output gigawatt-hours (GWh))2
36% Natural Gas/Fuel Oil
35% Nuclear
27% Coal
2% Hydro and Solar
Customer Diversity (in billed GWh sales)2
34% Residential
30% General Services
20% Industrial
16% Wholesale/Other
Electric Utilities and Infrastructure conducts operations primarily through the regulated public utilities of Duke Energy Carolinas, Duke Energy Progress, Duke Energy Florida, Duke Energy Indiana and Duke Energy Ohio .
Electric Operations ■ Owns approximately 51,144 megawatts (MW) of generating capacity
■ Service area covers about 91,459 square miles with an estimated population of 25 million
■ Service to approximately 7 .8 million residential, commercial and industrial customers
■ 280,024 miles of distribution lines and a 31,312-mile transmission system
Natural Gas Customer DiversityGas Utilities and Infrastructure conducts natural gas distribution operations primarily through the regulated public utilities of Piedmont Natural Gas and Duke Energy Ohio .
Natural Gas Operations (throughput)2
■ Regulated natural gas transmission and distribution services to approximately 1 .6 million customers in the Carolinas, Tennessee, southwestern Ohio and Northern Kentucky
■ Maintains more than 33,700 miles of natural gas transmission and distribution pipelines and 27,200 miles of natural gas service pipelines
Commercial RenewablesGeneration Diversity (percent owned capacity)1,3
Commercial Renewables primarily acquires, develops, builds and operates wind and solar renewable generation throughout the continental U .S . The portfolio includes nonregulated renewable energy and energy storage businesses .
Commercial Renewables’ renewable energy includes utility-scale wind and solar generation assets, distributed solar generation assets, distributed fuel cell assets and a battery storage project, which total 2,282 MW across 19 states from 22 wind facilities, 126 solar projects, 11 fuel cell locations and one battery storage facility . The power produced from renewable generation is primarily sold through long-term contracts to utilities, electric cooperatives, municipalities and corporate customers .
As part of its growth strategy, Commercial Renewables has expanded its investment portfolio through the addition of distributed solar companies and projects, energy storage systems and energy management solutions specifically tailored to commercial businesses.
1 As of December 31, 2019 . | 2 For the year ended December 31, 2019 .3 Contains projects included in tax equity structures where investors have differing interests in the projects’ economic attributes (100 percent of the tax equity projects’ capacity is included) .
51% Power Gen
18% General Services
15% Residential
9% Industrial
7% Other
64% Wind
35% Solar
1% Storage/Fuel Cell
6 | 2019 DUKE ENERGY SUSTAINABILITY REPORT
INTR
ODUC
TION
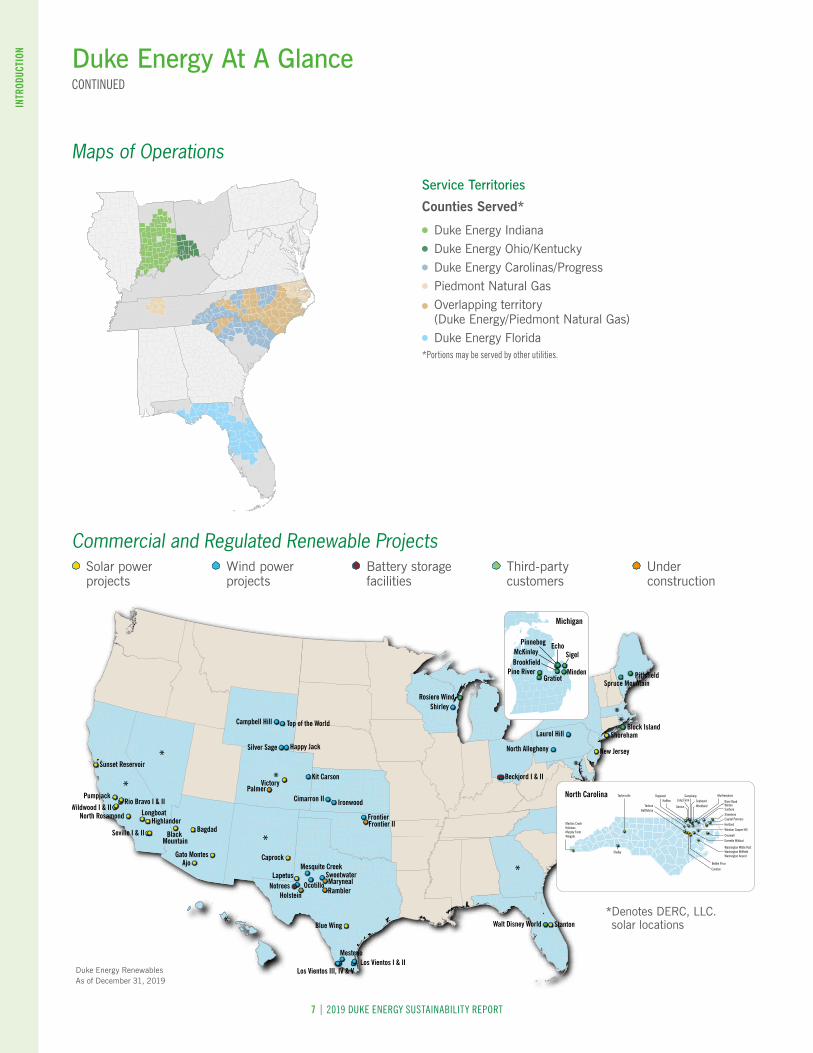
Service Territories
Counties Served*
Duke Energy Indiana Duke Energy Ohio/Kentucky Duke Energy Carolinas/Progress Piedmont Natural Gas Overlapping territory (Duke Energy/Piedmont Natural Gas)
Duke Energy Florida*Portions may be served by other utilities .
Maps of Operations
Duke Energy At A Glance CONTINUED
Commercial and Regulated Renewable Projects Solar power projects
Wind power projects
Battery storage facilities
Third-party customers
Under construction
Blue Wing
Ajo
BagdadBlack
Mountain
Gato Montes
Stanton
HighlanderLongboat
Caprock
Sunset Reservoir
Pumpjack
Wildwood I & II
Seville I & II
New Jersey
Rio Bravo I & II
Victory
Shoreham
North Rosamond
Sweetwater
Happy JackSilver Sage
Campbell Hill
Ocotillo
North Allegheny
Laurel Hill
Cimarron II Ironwood
Frontier
Kit Carson
Los Vientos I & IILos Vientos III, IV & V
Mesquite Creek
Shirley
Top of the World
Notrees
Beckjord I & II
Rosiere Wind
Block Island
Walt Disney World
Spruce MountainPittsfield
*
*
*
*
**
**
*
MarynealRambler
Mesteno
Holstein
Frontier II
Lapetus
Palmer
GratiotPine River
BrookfieldSigel
Echo
Minden
Michigan
PinnebogMcKinley
Martins CreekHolinessMurphy FarmWingate
Shelby
Taylorsville
Washington White PostWashington MillfieldWashington Airport
BattleboroTarboro
HalifaxDogwood
Conetoe
Murfreesboro
Windsor Cooper Hill
Sunbury
Capital PartnersShawboro
Everetts Wildcat
Bethel Price
Creswell
Gaston
Long FarmGarysburg
WoodlandRiver RoadWinton
Hertford
SeaboardNorth Carolina
* Denotes DERC, LLC. solar locations
Duke Energy Renewables As of December 31, 2019
7 | 2019 DUKE ENERGY SUSTAINABILITY REPORT
INTR
ODUC
TION
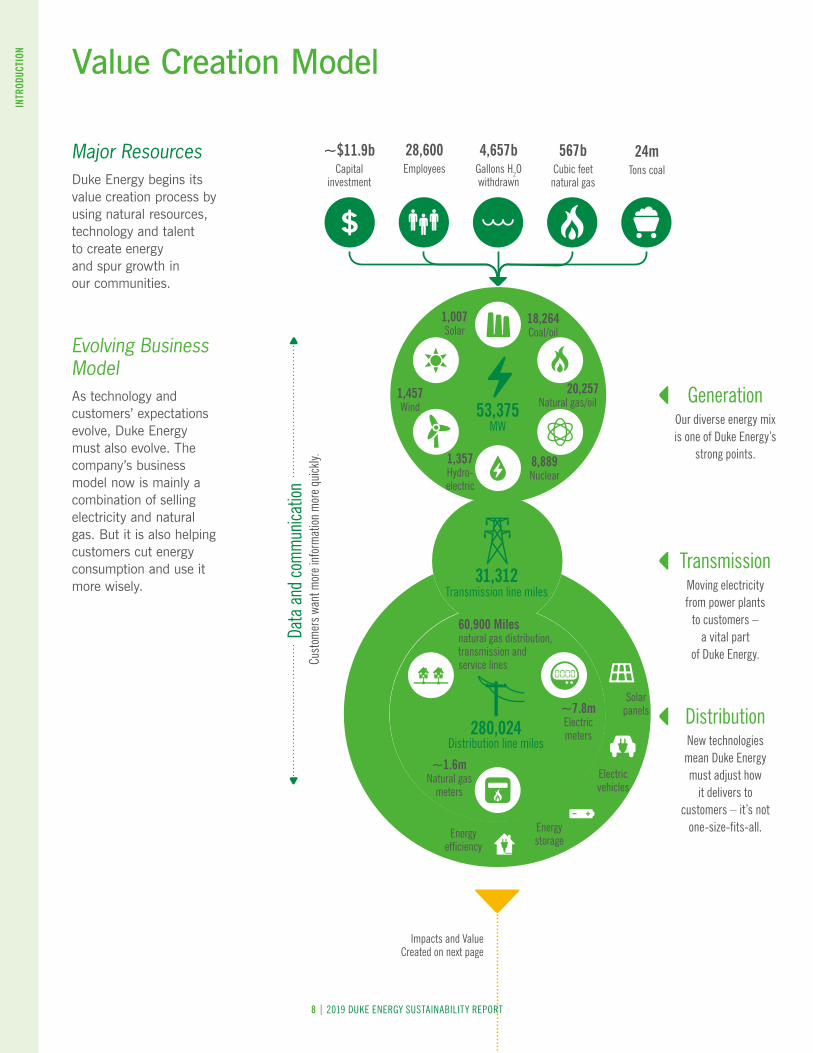
Value Creation Model
Major Resources Duke Energy begins its value creation process by using natural resources, technology and talent to create energy and spur growth in our communities.
Evolving Business Model As technology and customers’ expectations evolve, Duke Energy must also evolve. The company’s business model now is mainly a combination of selling electricity and natural gas. But it is also helping customers cut energy consumption and use it more wisely.
Changing customer expectations
31,312Transmission line miles
280,024Distribution line miles
~7.8mElectric meters
60,900 Miles natural gas distribution, transmission and service lines
~1.6mNatural gas
meters
53,375 MW
18,264Coal/oil
20,257Natural gas/oil
8,889Nuclear
1,357Hydro- electric
1,457Wind
1,007Solar
Energy efficiency
Solar panels
Electric vehicles
Energy storage
GenerationOur diverse energy mix is one of Duke Energy’s
strong points .
TransmissionMoving electricity from power plants
to customers – a vital part
of Duke Energy .
DistributionNew technologies mean Duke Energy must adjust how
it delivers to customers – it’s not
one-size-fits-all .
Cust
omer
s wan
t mor
e inf
orm
ation
mor
e qui
ckly .
Data
and
com
mun
icatio
n
24mTons coal
567bCubic feet natural gas
4,657bGallons H2O withdrawn
28,600Employees
~$11.9bCapital
investment
Impacts and Value Created on next page
8 | 2019 DUKE ENERGY SUSTAINABILITY REPORT
INTR
ODUC
TION
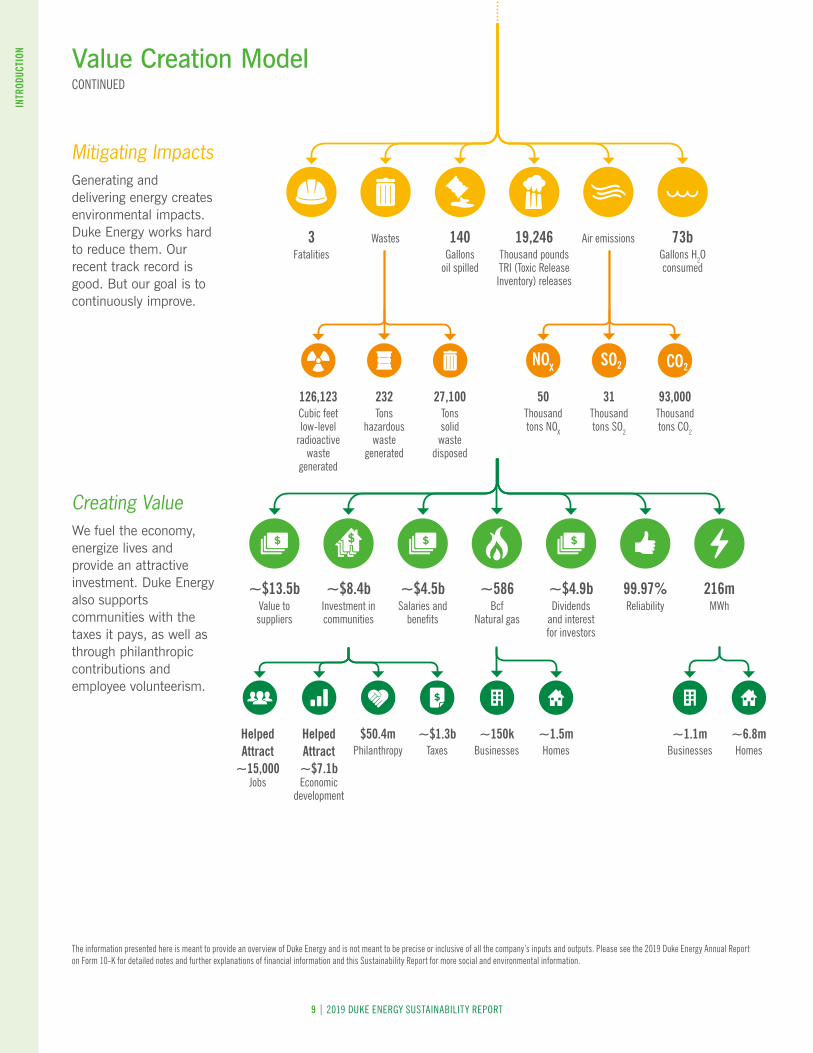
Value Creation ModelCONTINUED
The information presented here is meant to provide an overview of Duke Energy and is not meant to be precise or inclusive of all the company’s inputs and outputs . Please see the 2019 Duke Energy Annual Report on Form 10-K for detailed notes and further explanations of financial information and this Sustainability Report for more social and environmental information .
Mitigating ImpactsGenerating and delivering energy creates environmental impacts. Duke Energy works hard to reduce them. Our recent track record is good. But our goal is to continuously improve.
Creating Value We fuel the economy, energize lives and provide an attractive investment. Duke Energy also supports communities with the taxes it pays, as well as through philanthropic contributions and employee volunteerism.
Air emissions
93,000Thousand tons CO2
31Thousand tons SO2
73bGallons H2O consumed
19,246 Thousand poundsTRI (Toxic Release Inventory) releases
Wastes3Fatalities
27,100Tons solid waste
disposed
232Tons
hazardous waste
generated
50Thousand tons NOX
126,123Cubic feet low-level
radioactive waste
generated
140Gallons
oil spilled
99.97%Reliability
~6.8mHomes
~1.1mBusinesses
216mMWh
~$4.9bDividends
and interest for investors
~$8.4bInvestment in communities
~$13.5bValue to suppliers
~586Bcf
Natural gas
~$4.5bSalaries and
benefits
~1.5mHomes
~150kBusinesses
~$1.3b Taxes
$50.4m Philanthropy
Helped Attract ~$7.1b Economic
development
Helped Attract
~15,000Jobs
NOX
9 | 2019 DUKE ENERGY SUSTAINABILITY REPORT
INTR
ODUC
TION
Our Stakeholders and What Matters Most
The Value of Our StakeholdersDuke Energy is honored to provide the reliable energy that keeps our communities moving forward. Every day, our product has an impact on people’s lives.
With that privilege comes a deep sense of responsibility to deliver the right energy solutions. The only way to get those solutions right is if they are shaped by the views of a broad array of perspectives.
Thankfully, our stakeholder audience is diverse. They include customers, shareholders, regulators, environmental groups, social advocates, community agencies, elected officials, employees and many others. Each stakeholder brings a needed and essential perspective, which is vitally important as we develop future energy solutions to meet their needs.
Getting those perspectives early and often – and then collaborating to develop workable solutions – is essential. We seek that input in many formal and informal ways. They range from one-on-one meetings in our stakeholders’ offices to open houses to our Advisory or Listening Councils – to name a few.
With so much at stake, securing and transforming our collective energy future depends on hearing many voices. Our commitment to make a positive impact on our communities keeps us focused on hearing more and listening harder.
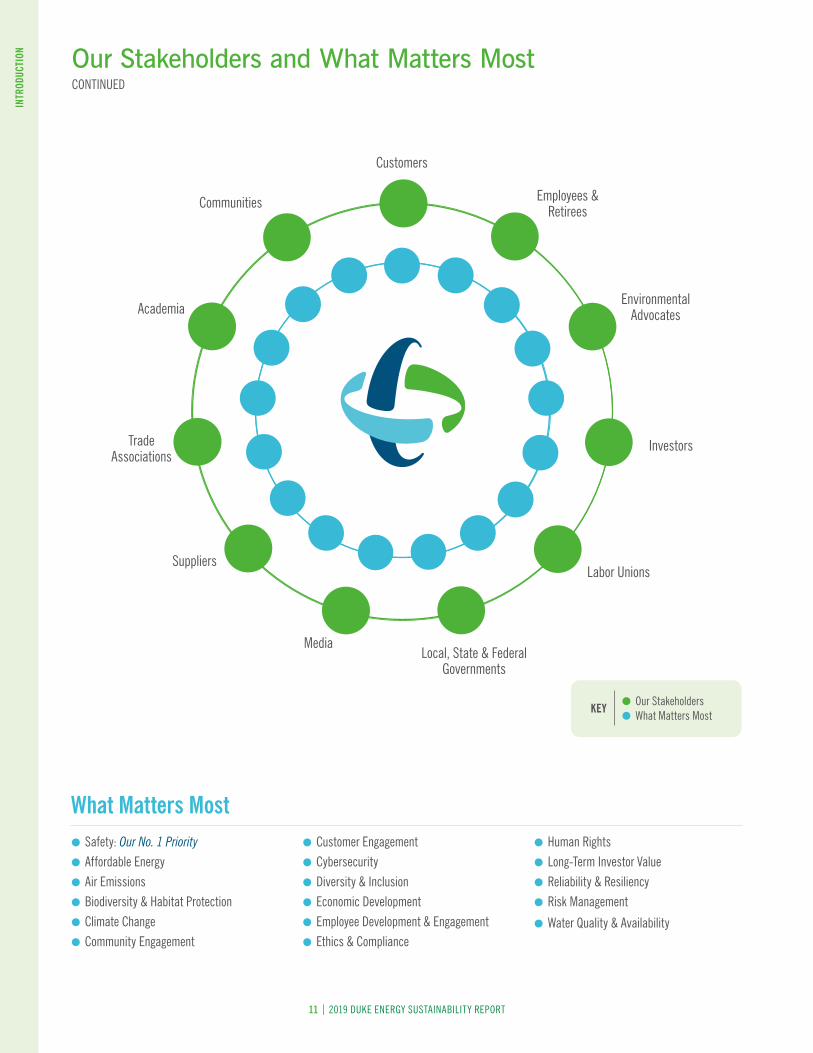
What Matters MostDuke Energy’s approach to sustainability focuses on the issues that are most important to our stakeholders and to us. We identify issues from a variety of sources such as stakeholder feedback, surveys, reporting frameworks, thought leader perspectives, social and traditional media coverage, and shareholder proposals in our sector.
We have mapped our priority issues to the United Nations Sustainable Development Goals (SDGs), which aim to “end poverty, protect the planet and ensure prosperity for all.” Since their development in 2015, the 17 SDGs have gained traction with stakeholders concerned about sustainability issues. While there was alignment between our priorities and several of the SDGs, goals such as “Seven: Affordable and Clean Energy,” and “Thirteen: Climate Action,” are especially applicable to our company.
The graphic depicts the relationship among Duke Energy, its stakeholders and the most important issues. The stakeholders and issues are both presented alphabetically to make it clear that they are all important while safety, as always, is our No. 1 priority.
10 | 2019 DUKE ENERGY SUSTAINABILITY REPORT
INTR
ODUC
TION
Our Stakeholders and What Matters Most CONTINUED
Safety: Our No. 1 Priority Affordable Energy Air Emissions Biodiversity & Habitat Protection Climate Change Community Engagement
Customer Engagement Cybersecurity Diversity & Inclusion Economic Development Employee Development & Engagement Ethics & Compliance
Human Rights Long-Term Investor Value Reliability & Resiliency Risk Management
Water Quality & Availability
Employees & Retirees
Environmental Advocates
Investors
Labor Unions
Local, State & Federal Governments
Media
Suppliers
Trade Associations
Communities
Customers
Academia
What Matters Most
KEY Our Stakeholders What Matters Most
11 | 2019 DUKE ENERGY SUSTAINABILITY REPORT
INTR
ODUC
TION
Our Sustainability Plan and Goals
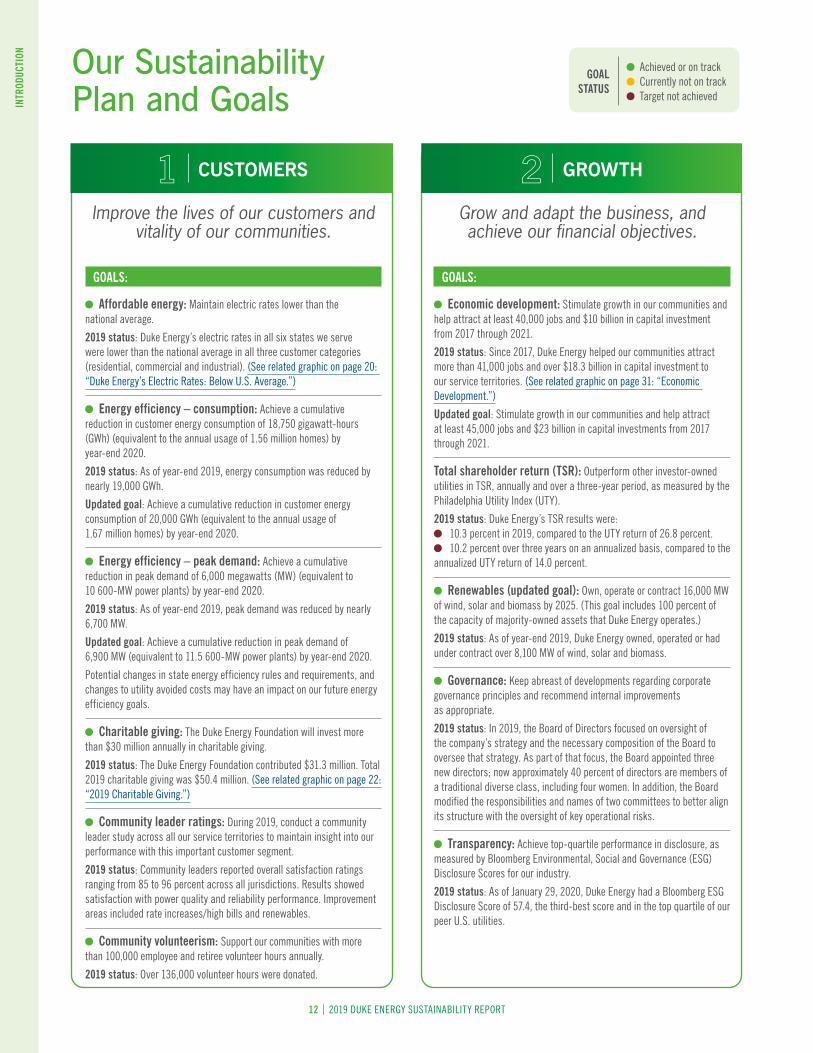
Grow and adapt the business, and achieve our financial objectives.
GOALS:
Economic development: Stimulate growth in our communities and help attract at least 40,000 jobs and $10 billion in capital investment from 2017 through 2021 .
2019 status: Since 2017, Duke Energy helped our communities attract more than 41,000 jobs and over $18 .3 billion in capital investment to our service territories . (See related graphic on page 31: “Economic Development .”)
Updated goal: Stimulate growth in our communities and help attract at least 45,000 jobs and $23 billion in capital investments from 2017 through 2021 .
Total shareholder return (TSR): Outperform other investor-owned utilities in TSR, annually and over a three-year period, as measured by the Philadelphia Utility Index (UTY) .
2019 status: Duke Energy’s TSR results were: 10 .3 percent in 2019, compared to the UTY return of 26 .8 percent . 10 .2 percent over three years on an annualized basis, compared to the
annualized UTY return of 14 .0 percent .
Renewables (updated goal): Own, operate or contract 16,000 MW of wind, solar and biomass by 2025 . (This goal includes 100 percent of the capacity of majority-owned assets that Duke Energy operates .)
2019 status: As of year-end 2019, Duke Energy owned, operated or had under contract over 8,100 MW of wind, solar and biomass .
Governance: Keep abreast of developments regarding corporate governance principles and recommend internal improvements as appropriate .
2019 status: In 2019, the Board of Directors focused on oversight of the company’s strategy and the necessary composition of the Board to oversee that strategy . As part of that focus, the Board appointed three new directors; now approximately 40 percent of directors are members of a traditional diverse class, including four women . In addition, the Board modified the responsibilities and names of two committees to better align its structure with the oversight of key operational risks .
Transparency: Achieve top-quartile performance in disclosure, as measured by Bloomberg Environmental, Social and Governance (ESG) Disclosure Scores for our industry .
2019 status: As of January 29, 2020, Duke Energy had a Bloomberg ESG Disclosure Score of 57 .4, the third-best score and in the top quartile of our peer U .S . utilities .
Improve the lives of our customers and vitality of our communities.
GOALS:
Affordable energy: Maintain electric rates lower than the national average .
2019 status: Duke Energy’s electric rates in all six states we serve were lower than the national average in all three customer categories (residential, commercial and industrial) . (See related graphic on page 20: “Duke Energy’s Electric Rates: Below U .S . Average .”)
Energy efficiency – consumption: Achieve a cumulative reduction in customer energy consumption of 18,750 gigawatt-hours (GWh) (equivalent to the annual usage of 1 .56 million homes) by year-end 2020 .
2019 status: As of year-end 2019, energy consumption was reduced by nearly 19,000 GWh .
Updated goal: Achieve a cumulative reduction in customer energy consumption of 20,000 GWh (equivalent to the annual usage of 1 .67 million homes) by year-end 2020 .
Energy efficiency – peak demand: Achieve a cumulative reduction in peak demand of 6,000 megawatts (MW) (equivalent to 10 600-MW power plants) by year-end 2020 .
2019 status: As of year-end 2019, peak demand was reduced by nearly 6,700 MW .
Updated goal: Achieve a cumulative reduction in peak demand of 6,900 MW (equivalent to 11 .5 600-MW power plants) by year-end 2020 .
Potential changes in state energy efficiency rules and requirements, and changes to utility avoided costs may have an impact on our future energy efficiency goals .
Charitable giving: The Duke Energy Foundation will invest more than $30 million annually in charitable giving .
2019 status: The Duke Energy Foundation contributed $31 .3 million . Total 2019 charitable giving was $50 .4 million . (See related graphic on page 22: “2019 Charitable Giving .”)
Community leader ratings: During 2019, conduct a community leader study across all our service territories to maintain insight into our performance with this important customer segment .
2019 status: Community leaders reported overall satisfaction ratings ranging from 85 to 96 percent across all jurisdictions . Results showed satisfaction with power quality and reliability performance . Improvement areas included rate increases/high bills and renewables .
Community volunteerism: Support our communities with more than 100,000 employee and retiree volunteer hours annually .
2019 status: Over 136,000 volunteer hours were donated .
GOAL STATUS
Achieved or on track Currently not on track Target not achieved
1 CUSTOMERS 2 GROWTH
12 | 2019 DUKE ENERGY SUSTAINABILITY REPORT
INTR
ODUC
TION
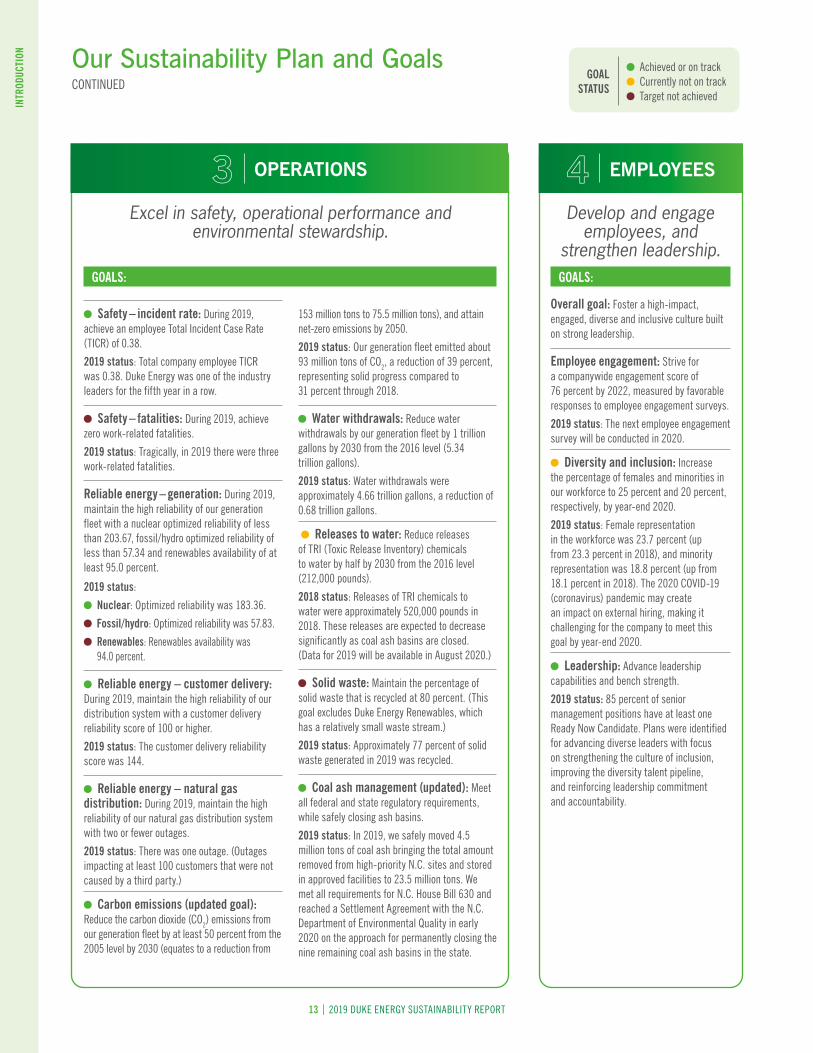
Excel in safety, operational performance and environmental stewardship.
GOALS:
Safety – incident rate: During 2019, achieve an employee Total Incident Case Rate (TICR) of 0 .38 .
2019 status: Total company employee TICR was 0 .38 . Duke Energy was one of the industry leaders for the fifth year in a row .
Safety – fatalities: During 2019, achieve zero work-related fatalities .
2019 status: Tragically, in 2019 there were three work-related fatalities .
Reliable energy – generation: During 2019, maintain the high reliability of our generation fleet with a nuclear optimized reliability of less than 203 .67, fossil/hydro optimized reliability of less than 57 .34 and renewables availability of at least 95 .0 percent .
2019 status:
Nuclear: Optimized reliability was 183 .36 .
Fossil/hydro: Optimized reliability was 57 .83 .
Renewables: Renewables availability was 94 .0 percent .
Reliable energy – customer delivery: During 2019, maintain the high reliability of our distribution system with a customer delivery reliability score of 100 or higher .
2019 status: The customer delivery reliability score was 144 .
Reliable energy – natural gas distribution: During 2019, maintain the high reliability of our natural gas distribution system with two or fewer outages .
2019 status: There was one outage . (Outages impacting at least 100 customers that were not caused by a third party .)
Carbon emissions (updated goal): Reduce the carbon dioxide (CO2) emissions from our generation fleet by at least 50 percent from the 2005 level by 2030 (equates to a reduction from
153 million tons to 75 .5 million tons), and attain net-zero emissions by 2050 .
2019 status: Our generation fleet emitted about 93 million tons of CO2, a reduction of 39 percent, representing solid progress compared to 31 percent through 2018 .
Water withdrawals: Reduce water withdrawals by our generation fleet by 1 trillion gallons by 2030 from the 2016 level (5 .34 trillion gallons) .
2019 status: Water withdrawals were approximately 4 .66 trillion gallons, a reduction of 0 .68 trillion gallons .
Releases to water: Reduce releases of TRI (Toxic Release Inventory) chemicals to water by half by 2030 from the 2016 level (212,000 pounds) .
2018 status: Releases of TRI chemicals to water were approximately 520,000 pounds in 2018 . These releases are expected to decrease significantly as coal ash basins are closed . (Data for 2019 will be available in August 2020 .)
Solid waste: Maintain the percentage of solid waste that is recycled at 80 percent . (This goal excludes Duke Energy Renewables, which has a relatively small waste stream .)
2019 status: Approximately 77 percent of solid waste generated in 2019 was recycled .
Coal ash management (updated): Meet all federal and state regulatory requirements, while safely closing ash basins .
2019 status: In 2019, we safely moved 4 .5 million tons of coal ash bringing the total amount removed from high-priority N .C . sites and stored in approved facilities to 23 .5 million tons . We met all requirements for N .C . House Bill 630 and reached a Settlement Agreement with the N .C . Department of Environmental Quality in early 2020 on the approach for permanently closing the nine remaining coal ash basins in the state .
Develop and engage employees, and
strengthen leadership.GOALS:
Overall goal: Foster a high-impact, engaged, diverse and inclusive culture built on strong leadership .
Employee engagement: Strive for a companywide engagement score of 76 percent by 2022, measured by favorable responses to employee engagement surveys .
2019 status: The next employee engagement survey will be conducted in 2020 .
Diversity and inclusion: Increase the percentage of females and minorities in our workforce to 25 percent and 20 percent, respectively, by year-end 2020 .
2019 status: Female representation in the workforce was 23 .7 percent (up from 23 .3 percent in 2018), and minority representation was 18 .8 percent (up from 18 .1 percent in 2018) . The 2020 COVID-19 (coronavirus) pandemic may create an impact on external hiring, making it challenging for the company to meet this goal by year-end 2020 .
Leadership: Advance leadership capabilities and bench strength .
2019 status: 85 percent of senior management positions have at least one Ready Now Candidate . Plans were identified for advancing diverse leaders with focus on strengthening the culture of inclusion, improving the diversity talent pipeline, and reinforcing leadership commitment and accountability .
Our Sustainability Plan and GoalsCONTINUED
4 EMPLOYEES3 OPERATIONS
GOAL STATUS
Achieved or on track Currently not on track Target not achieved
13 | 2019 DUKE ENERGY SUSTAINABILITY REPORT
INTR
ODUC
TION
Management Approach to Sustainability
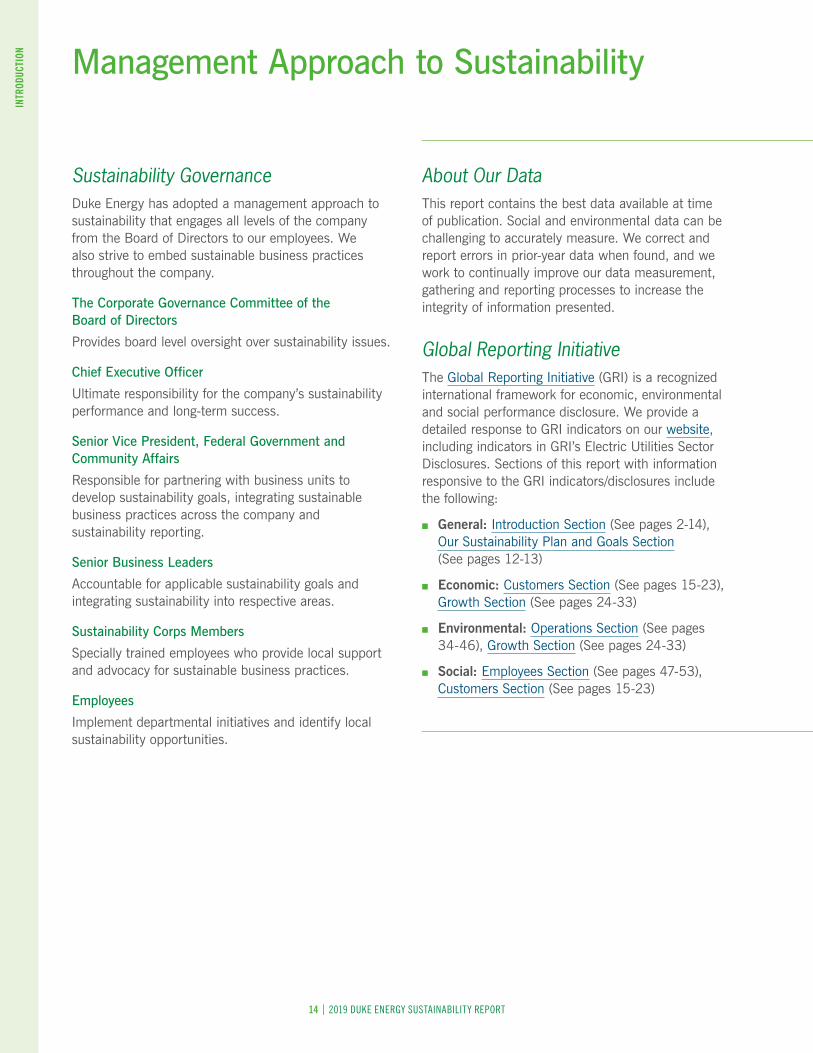
Sustainability GovernanceDuke Energy has adopted a management approach to sustainability that engages all levels of the company from the Board of Directors to our employees. We also strive to embed sustainable business practices throughout the company.
The Corporate Governance Committee of the Board of Directors
Provides board level oversight over sustainability issues.
Chief Executive Officer
Ultimate responsibility for the company’s sustainability performance and long-term success.
Senior Vice President, Federal Government and Community Affairs
Responsible for partnering with business units to develop sustainability goals, integrating sustainable business practices across the company and sustainability reporting.
Senior Business Leaders
Accountable for applicable sustainability goals and integrating sustainability into respective areas.
Sustainability Corps Members
Specially trained employees who provide local support and advocacy for sustainable business practices.
Employees
Implement departmental initiatives and identify local sustainability opportunities.
About Our Data This report contains the best data available at time of publication. Social and environmental data can be challenging to accurately measure. We correct and report errors in prior-year data when found, and we work to continually improve our data measurement, gathering and reporting processes to increase the integrity of information presented.
Global Reporting Initiative The Global Reporting Initiative (GRI) is a recognized international framework for economic, environmental and social performance disclosure. We provide a detailed response to GRI indicators on our website, including indicators in GRI’s Electric Utilities Sector Disclosures. Sections of this report with information responsive to the GRI indicators/disclosures include the following:
■ General: Introduction Section (See pages 2-14), Our Sustainability Plan and Goals Section (See pages 12-13)
■ Economic: Customers Section (See pages 15-23), Growth Section (See pages 24-33)
■ Environmental: Operations Section (See pages 34-46), Growth Section (See pages 24-33)
■ Social: Employees Section (See pages 47-53), Customers Section (See pages 15-23)
14 | 2019 DUKE ENERGY SUSTAINABILITY REPORT
INTR
ODUC
TION

15 | 2019 DUKE ENERGY SUSTAINABILITY REPORT
1
CUST
OMER
S
Improve the Lives of Our Customers and Vitality of Our Communities
CUSTOMERS
16 | 2019 DUKE ENERGY SUSTAINABILITY REPORT
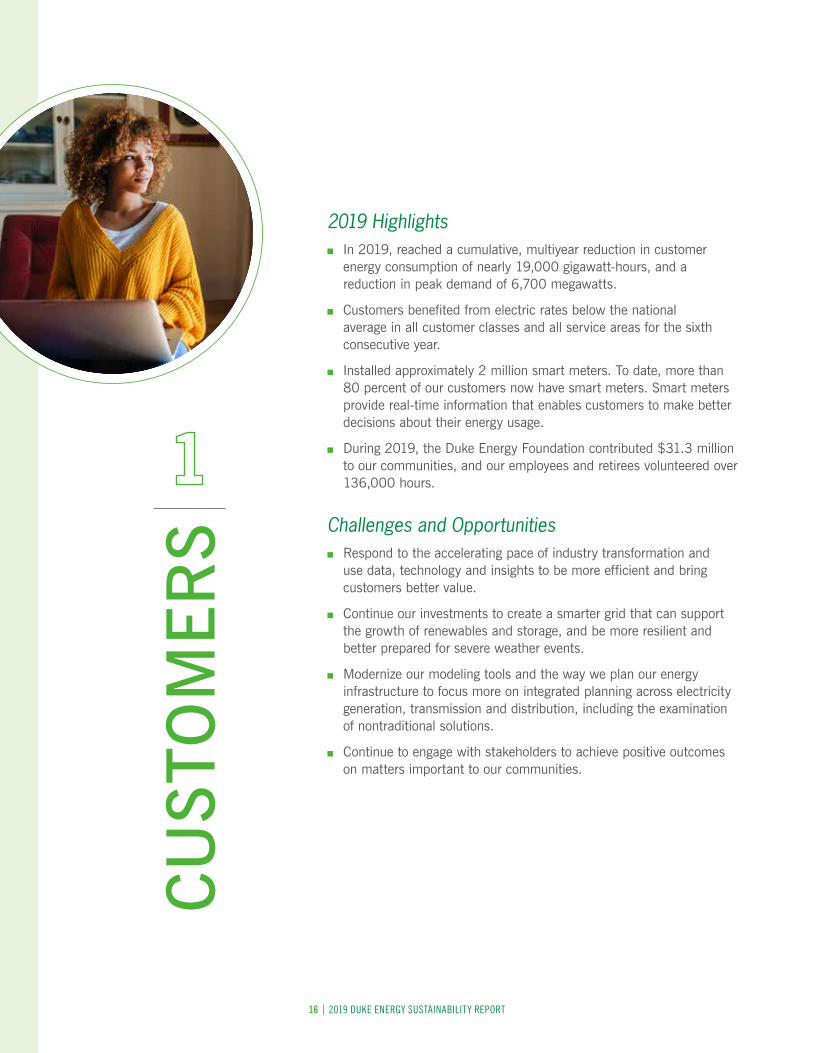
2019 Highlights ■ In 2019, reached a cumulative, multiyear reduction in customer
energy consumption of nearly 19,000 gigawatt-hours, and a reduction in peak demand of 6,700 megawatts.
■ Customers benefited from electric rates below the national average in all customer classes and all service areas for the sixth consecutive year.
■ Installed approximately 2 million smart meters. To date, more than 80 percent of our customers now have smart meters. Smart meters provide real-time information that enables customers to make better decisions about their energy usage.
■ During 2019, the Duke Energy Foundation contributed $31.3 million to our communities, and our employees and retirees volunteered over 136,000 hours.
Challenges and Opportunities ■ Respond to the accelerating pace of industry transformation and
use data, technology and insights to be more efficient and bring customers better value.
■ Continue our investments to create a smarter grid that can support the growth of renewables and storage, and be more resilient and better prepared for severe weather events.
■ Modernize our modeling tools and the way we plan our energy infrastructure to focus more on integrated planning across electricity generation, transmission and distribution, including the examination of nontraditional solutions.
■ Continue to engage with stakeholders to achieve positive outcomes on matters important to our communities.
CU
STO
MER
S
17 | 2019 DUKE ENERGY SUSTAINABILITY REPORT
1
CUST
OMER
S
Early Collaboration Yields Savings at Cincinnati School Duke Energy has been exceeding its energy efficiency goals as customers embrace doing more with less energy. The company has been recognized as the clear leader in energy efficiency in the Southeast by the Southern Alliance for Clean Energy.
Duke Energy’s goals to reduce customer energy consumption and peak demand were both exceeded in 2019. The company has set even more aggressive energy efficiency goals for 2020.
Duke Energy works closely with its customers to help them save energy and money.
A collaboration between Duke Energy and the Bethany School in Cincinnati helped the kindergarten through eighth grade school earn recognition as the Midwest’s first “net-zero” school building and the second-most energy-efficient school in the U.S.
To earn a net-zero designation, a building must be powered by enough renewable energy to offset its demand for energy produced by carbon-emitting sources. The Bethany School earned its designation by using two types of renewable energy systems: solar and geothermal. A solar energy system harnesses the sun’s power to produce electricity. Geothermal systems draw from the Earth’s natural temperature for heating and cooling.
Bethany School’s commitment to sustainability resulted in an ultra-efficient design that earned the school more than $75,000 in Duke Energy incentives and rebates.
Some of the energy-efficient design features include:
■ A building layout that keeps most classrooms out of the direct path of the sun.
■ Insulation that keeps warm air inside the building during winter or outside during summer.
■ Roofing materials chosen with high solar reflectance values, to minimize the “heat island effect” that buildings can create in the environment.
■ A geothermal exchange system of more than 100 piping wells buried to depths of 305 feet – and engineered to maximize the transfer of warmer or cooler air between buildings where needed.
In total, the design is expected to deliver energy savings of about 187,000 kilowatt hours per year. That’s about the same amount of energy used to dry more than 53,600 loads of laundry and good news for a school committed to sustainability and saving money.
Duke Energy’s goals to reduce customer energy consumption and peak
demand were both exceeded in 2019.

1
CUST
OMER
S
18 | 2019 DUKE ENERGY SUSTAINABILITY REPORT
Helping Customers Go Green with REC PurchasesWhen label stock maker UPM Raflatac wanted to go 100 percent renewable, it didn’t have the luxury of building a solar or wind farm at its plant in Henderson County, North Carolina.
But it did have another option: It could buy the ownership rights to the amount of energy its Mill River plant and its 170 employees would use in a year.
The path to 100 percent renewable involved buying Renewable Energy Certificates (RECs) through Duke Energy’s company REC Solutions. To renewable energy insiders, a REC (pronounced “wreck”) is a common term. To the rest of the world – not so much.
A REC is a market-based instrument that can be bought, sold and traded. One REC is issued when 1 megawatt-hour (MWh) of electricity is generated and delivered to the electricity grid from a renewable energy source. It can be from a rooftop solar array, large wind farm or several other energy sources.
Many companies cannot change the sources of electricity delivered by the local energy grid. But by purchasing RECs, those same companies can buy the ownership rights to renewable energy. By owning the REC, a company can legally claim the renewable energy as its own.
Currently, a REC can cost anywhere from 75 cents to $8 per MWh in Duke Energy’s regulated service territories – depending on geography and various state regulations. In some areas of the northeastern United States, a REC can cost as much as $400.
So as customers seek to meet their sustainability goals, buying RECs could be a growing part of that strategy. And Duke Energy might be the first energy company they call.
Connecting Customers to a Smarter Energy Future Duke Energy’s grid improvement initiative continues to expand across its service territories.
The company is leveraging smart technologies and making strategic investments to improve reliability for customers, strengthen the grid against physical and cyber threats, enable expansion of solar and innovative technologies, and give customers more options and control to manage their energy use and save money.
As part of this effort, Duke Energy is significantly expanding the use of smart, self-healing technology that automatically identifies power outages and quickly reroutes power to restore customers – often in less than a minute – helping to reduce the number of customers affected by outages by as much as 75 percent.
Duke Energy is strengthening the electric grid to keep customers’ lights on during severe weather.

Understanding what customers think, feel and need is essential to being nimble and responsive in the present, and in planning for a smarter energy future.
19 | 2019 DUKE ENERGY SUSTAINABILITY REPORT
Self-healing systems delivered significant benefits to customers in 2019, helping to avoid more than 610,000 extended customer outages and saving customers more than 1 million hours of outage time. And those benefits will continue to increase as this technology expands in 2020.
A smart-thinking grid also supports the two-way power flow needed to effectively integrate rooftop solar and other distributed technologies like battery storage, electric vehicles and microgrids.
Duke Energy has delivered improved options and control to customers in 2019 with more than 7 million smart meters now installed in the Carolinas, Florida and the Midwest – 80 percent of the company’s customers. Smart meters provide customers with more information about their energy use and usage alerts to help them save energy and money before their bill arrives. They also provide improved outage detection and can help to speed restoration following a major outage.
Additional work in 2019 included grid-strengthening upgrades, physical and cyber security improvements and targeted undergrounding of outage-prone lines, all of which will help deliver a better experience for customers.
With severe weather events increasing in frequency and severity across the company’s service area, improving the grid to make it stronger and more resilient will continue to be a top priority for Duke Energy to reliably serve customers now and in the future.
Transforming the Customer Experience Through Action At the center of all we do is the people we serve – our customers. Understanding what customers think, feel and need is essential to being nimble and responsive in the present, and in planning for a smarter energy future.
Duke Energy learns from customers through face-to-face conversations as well as more formal feedback. Surveys, focus groups, town halls and other market research are some of the information sources we rely on.
Customers can track electricity use, report power outages and pay bills using the Duke Energy app.
1
CUST
OMER
S
20 | 2019 DUKE ENERGY SUSTAINABILITY REPORT
1
CUST
OMER
S
Still, what we learn only transforms the customer experience when we respond with action. Our most recent customer service enhancements were developed to meet customer needs for real-time and proactive information:
■ The Duke Energy app offers easy access to paying an energy bill, tracking home energy use, reporting and checking an outage status, and more.
■ The interactive outage map provides the number of customers without power, when and where an outage was reported and estimated restoration times. Customers can also opt in to receive outage alerts by phone, text or email.
■ Track My Service notifications provide updates to customers seeking to start, stop or transfer their energy services, and are expanding to include planned outage and vegetation management (tree trimming) notifications.
These tools complement Duke Energy’s existing service offerings including My Home Energy Report, Online Savings Store, the Find It Duke contractor referral service and the Free Home Energy House Call.
Connecting with customers in the ways that matter most helped increase Duke Energy’s internal customer satisfaction rating by 25 percent in 2019. The company also saw improvement across most of our service territories as measured by J.D. Power’s Customer Service Index for residential service customers.
Looking ahead, customers can expect more action in response to their feedback. A newly designed energy bill, based on input from customers, is just one example. In the meantime, we’ll keep listening and learning in order to further deliver on customer wants and needs.
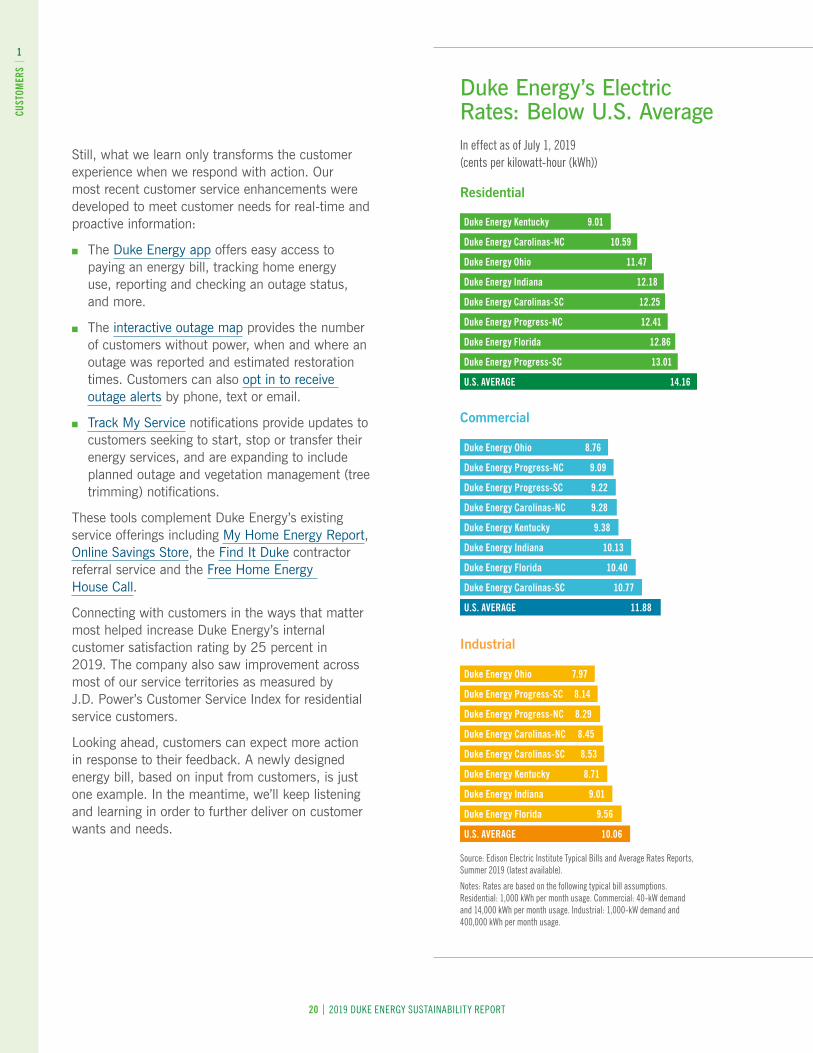
Source: Edison Electric Institute Typical Bills and Average Rates Reports, Summer 2019 (latest available) .
Notes: Rates are based on the following typical bill assumptions . Residential: 1,000 kWh per month usage . Commercial: 40-kW demand and 14,000 kWh per month usage . Industrial: 1,000-kW demand and 400,000 kWh per month usage .
Duke Energy’s Electric Rates: Below U.S. AverageIn effect as of July 1, 2019 (cents per kilowatt-hour (kWh))
Residential
Industrial
Commercial
U.S. AVERAGE 10.06
Duke Energy Florida 9.56
Duke Energy Indiana 9.01
Duke Energy Kentucky 8.71
Duke Energy Carolinas-SC 8.53
Duke Energy Carolinas-NC 8.45
Duke Energy Progress-NC 8.29
Duke Energy Progress-SC 8.14
Duke Energy Ohio 7.97
U.S. AVERAGE 14.16
Duke Energy Progress-SC 13.01
Duke Energy Florida 12.86
Duke Energy Progress-NC 12.41
Duke Energy Carolinas-SC 12.25
Duke Energy Indiana 12.18
Duke Energy Ohio 11.47
Duke Energy Carolinas-NC 10.59
Duke Energy Kentucky 9.01
U.S. AVERAGE 11.88
Duke Energy Carolinas-SC 10.77
Duke Energy Florida 10.40
Duke Energy Indiana 10.13
Duke Energy Kentucky 9.38
Duke Energy Carolinas-NC 9.28
Duke Energy Progress-SC 9.22
Duke Energy Progress-NC 9.09
Duke Energy Ohio 8.76
Since Share the Warmth’s inception
in 1985, Duke Energy has contributed more
than $35 million to the program through
Crisis Assistance Ministry and 85 other
service agencies.
21 | 2019 DUKE ENERGY SUSTAINABILITY REPORT
1
CUST
OMER
S
Customer Assistance Programs Help Those in Need Helping customers in need with heating and cooling assistance programs has been a hallmark of Duke Energy for a generation. The company’s heating assistance programs include Share the Warmth in the Carolinas, Helping Hand Indiana, HeatShare Ohio and WinterCare Kentucky. To help with energy costs during extreme summer heat, the company offers Cooling Assistance in the Carolinas and the Energy Neighbor Fund in both the Carolinas and Florida.
Since Share the Warmth’s inception in 1985, Duke Energy has contributed more than $35 million to the program through Crisis Assistance Ministry and 85 other service agencies. The program is supported by Duke Energy’s customers, shareholders and employees. The Duke Energy Foundation matches all contributions dollar for dollar up to $500,000.
The Piedmont Natural Gas Share the Warmth program has contributed more than $3.7 million in customer and corporate donations since 2003 to Crisis Assistance Ministry and other organizations to help struggling residents in North Carolina, South Carolina and Tennessee.
Piedmont’s optional program rounds a customer’s monthly bill up to the nearest dollar – totaling no more than $12 a year – and donates the difference to help those in need in the community, regardless of their energy source or provider.
These contributions are invaluable to those struggling to make ends meet, giving them the means to keep their heat on and families warm.
The company is always looking for new ways to help more customers in need. In December 2019, Duke Energy and the NFL’s Carolina Panthers teamed up to bolster contributions to Share the Warmth.
The partnership included game-day events, advertising and other outreach efforts including a text-to-give option allowing anyone who donates to receive an exclusive thank-you video featuring Carolina Panther players.
Plus, the Carolina Panthers Charities Fund contributed $1,000 per quarterback sack in December and guaranteed a minimum of $15,000 – the grand total was $15,000.
Investing In Our Communities Duke Energy has a long history of supporting its communities. In 2019, the Duke Energy Foundation contributed $31.1 million in its territories – from nonprofits to major issues that impact our areas.
In 2019, the company made $750,000 in grants to tackle a major problem facing the nation: opioid addiction.
In North Carolina, the company awarded $100,000 to the More Powerful NC campaign and $400,000 to the North Carolina Harm Reduction Coalition (NCHRC).
The More Powerful NC campaign was created by the North Carolina Departments of Justice and Health and Human Services, as well as other partners, to raise awareness about the opioid crisis. The campaign outlines real, actionable steps for the safe storage, use and disposal of pain medications, as well as resources for finding treatment and recovery support.
NCHRC is a comprehensive harm reduction program. The organization engages in grassroots advocacy, resource development, coalition building and direct services for people impacted by drug use. NCHRC also provides resources and support to the law enforcement, public health and provider communities.
In Indiana, Duke Energy announced $250,000 in grants to tackle unique aspects of the issue. Five people a day die in the state from drug overdoses – many opioid related.
Ivy Tech Community College will receive $175,000 to educate and prepare specialists in addiction and mental health to combat the crisis. Meanwhile, Hamilton Center, Inc., a regional behavioral health system in Indiana, will receive $75,000 for a pilot program to help those with an opioid use disorder who are unemployed or want to remain in the workforce while seeking treatment for their substance use disorder.
Separately, Duke Energy also is helping communities prepare for hurricanes in the wake of several major storms that have hit the Carolinas and Florida in recent years.
In Florida, a $500,000 grant to local organizations helped assemble and distribute storm preparedness kits to vulnerable customers, who may not have the means to access the materials in other ways.
In North Carolina, the company announced more than $1.1 million in funding to help local communities increase their response capabilities for future weather events with advance preparation and planning.
A Powerful Commitment to Human Rights Duke Energy works every day to power customers’ lives and help communities thrive. A strong commitment to safety, integrity and service drives our daily efforts and future vision. We amplify this in our Human Rights Policy.
The cornerstones of this policy can be found in the United Nations Universal Declaration of Human Rights and the United Nations Guiding Principles on Business and Human Rights. Internally, a Code of Business Ethics
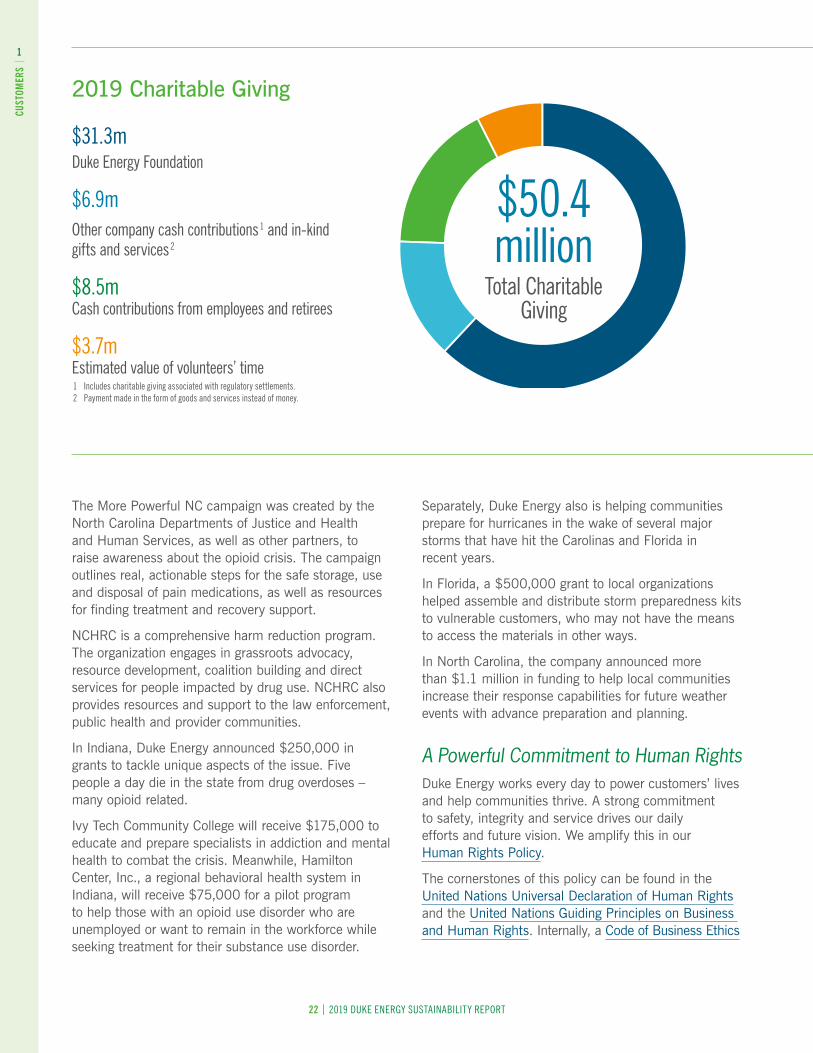
2019 Charitable Giving
$31 .3mDuke Energy Foundation
$6 .9m Other company cash contributions 1 and in-kind gifts and services 2
$8 .5m Cash contributions from employees and retirees
$3 .7mEstimated value of volunteers’ time 1 Includes charitable giving associated with regulatory settlements . 2 Payment made in the form of goods and services instead of money .
$50 .4million
Total Charitable Giving
1
CUST
OMER
S
22 | 2019 DUKE ENERGY SUSTAINABILITY REPORT
23 | 2019 DUKE ENERGY SUSTAINABILITY REPORT
and Supplier Code of Conduct provide the backbone to commitments outlined in the human rights policy, including:
■ Workforce: Working conditions at Duke Energy reflect the human dignity of our workforce. We uphold human and workplace rights in all operations, treating workers fairly and without discrimination.
■ Communities and Stakeholders: Respecting the rights of people where they live, work and play includes doing business in ways that protect the environment and mitigate adverse impacts from our operations.
■ Suppliers and Partners: Supplying goods and services to Duke Energy requires adhering to these same commitments and applying them locally and around the world.
Duke Energy employees, suppliers, customers and other stakeholders can report a human rights concern anonymously by phone or online through the company’s EthicsLine, or directly to company personnel. In 2019, no human rights concerns were raised through the company’s EthicsLine or internal channels.
Respect for human rights is an imperative to powering lives. Duke Energy is proud to embrace the ongoing process of educating, learning, evaluating and improving how we operate.
Supporting Suppliers Who Share Our Values In 2019, Duke Energy spent more than $13.5 billion purchasing goods and services used to provide electricity and natural gas to our customers.
The company strives to improve the lives of our customers and the vitality of our communities by consistently considering supplier diversity, local economic impact, and environmental stewardship as part of our sourcing practices.
Since 2015, Duke Energy has spent more than $1 billion annually with minority-, women-, veteran-, service-disabled veteran-owned and federal HUBZone-certified businesses. The spending has grown an average of 10 percent per year, with 2019’s spending coming in at $1.6 billion.
As for spending with local suppliers, Duke Energy’s figure has exceeded $4 billion since 2018.
Our local economic impact and community outreach were two of several factors that led to us earning the Hispanic Chamber of Metro Orlando’s Corporate Procurement Group of the Year Award. The award is presented to the corporation who has done the most, overall, in increasing its spending with Hispanic and other diverse suppliers, and managing initiatives to assist these suppliers.
Duke Energy’s Supplier Code of Conduct describes in detail our expectations of suppliers.
We also partner with industry peers and suppliers to advance sustainability best practices in the utility sector through our work with the Electric Utility Industry Sustainable Supply Chain Alliance.
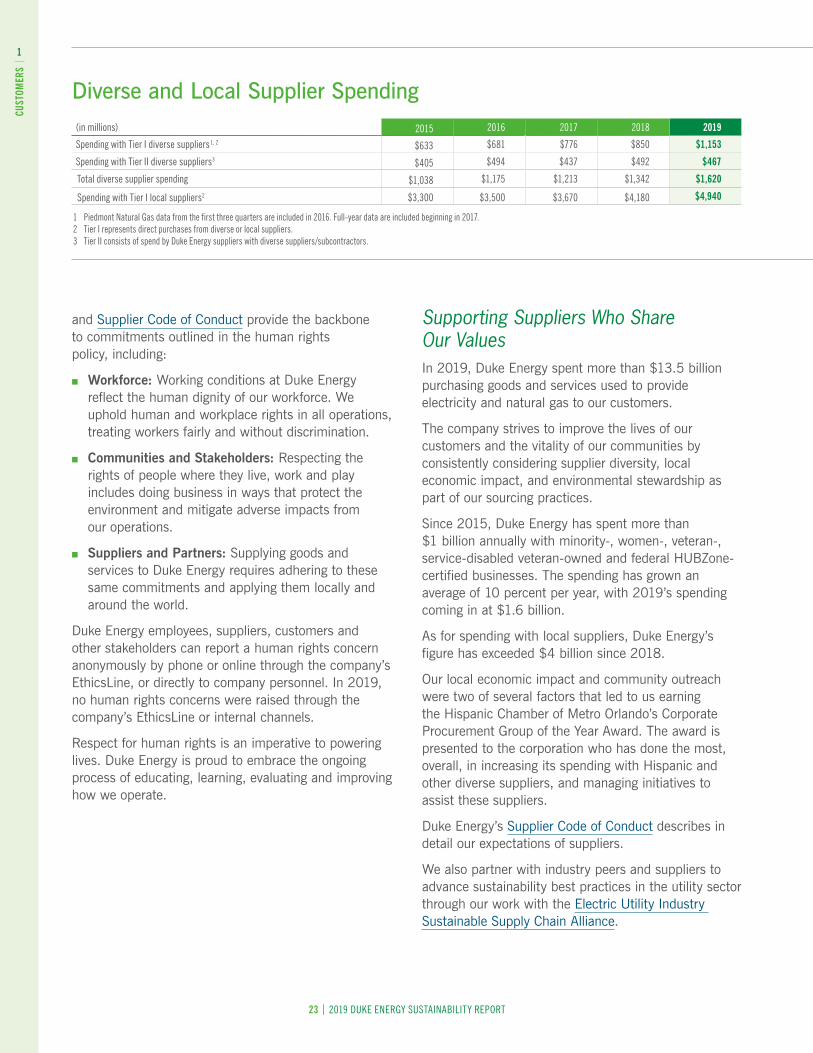
Diverse and Local Supplier Spending (in millions) 2015 2016 2017 2018 2019
Spending with Tier I diverse suppliers 1, 2 $633 $681 $776 $850 $1,153
Spending with Tier II diverse suppliers3 $405 $494 $437 $492 $467
Total diverse supplier spending $1,038 $1,175 $1,213 $1,342 $1,620
Spending with Tier I local suppliers2 $3,300 $3,500 $3,670 $4,180 $4,940
1 Piedmont Natural Gas data from the first three quarters are included in 2016 . Full-year data are included beginning in 2017 . 2 Tier I represents direct purchases from diverse or local suppliers . 3 Tier II consists of spend by Duke Energy suppliers with diverse suppliers/subcontractors .
1
CUST
OMER
S
24 | 2019 DUKE ENERGY SUSTAINABILITY REPORT
2
GROW
TH
Grow and Adapt the Business and Achieve Our Financial Objectives
GROWTH
25 | 2019 DUKE ENERGY SUSTAINABILITY REPORT
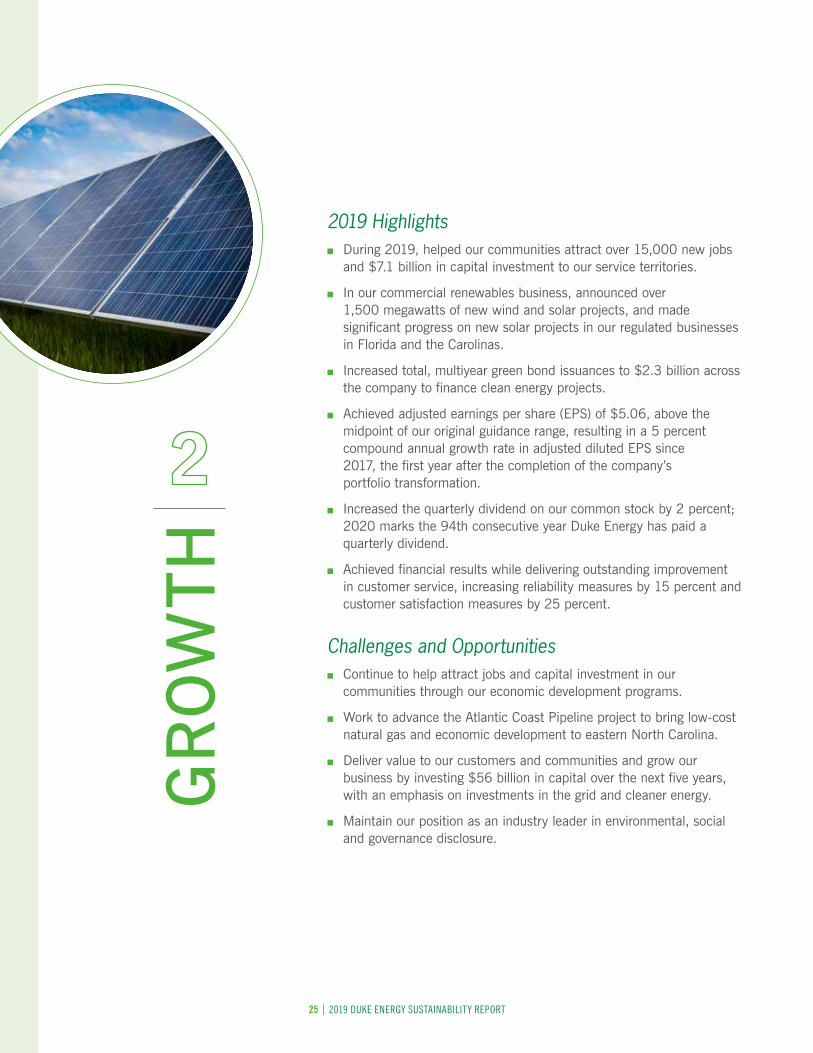
2019 Highlights ■ During 2019, helped our communities attract over 15,000 new jobs
and $7.1 billion in capital investment to our service territories.
■ In our commercial renewables business, announced over 1,500 megawatts of new wind and solar projects, and made significant progress on new solar projects in our regulated businesses in Florida and the Carolinas.
■ Increased total, multiyear green bond issuances to $2.3 billion across the company to finance clean energy projects.
■ Achieved adjusted earnings per share (EPS) of $5.06, above the midpoint of our original guidance range, resulting in a 5 percent compound annual growth rate in adjusted diluted EPS since 2017, the first year after the completion of the company’s portfolio transformation.
■ Increased the quarterly dividend on our common stock by 2 percent; 2020 marks the 94th consecutive year Duke Energy has paid a quarterly dividend.
■ Achieved financial results while delivering outstanding improvement in customer service, increasing reliability measures by 15 percent and customer satisfaction measures by 25 percent.
Challenges and Opportunities ■ Continue to help attract jobs and capital investment in our
communities through our economic development programs.
■ Work to advance the Atlantic Coast Pipeline project to bring low-cost natural gas and economic development to eastern North Carolina.
■ Deliver value to our customers and communities and grow our business by investing $56 billion in capital over the next five years, with an emphasis on investments in the grid and cleaner energy.
■ Maintain our position as an industry leader in environmental, social and governance disclosure.
GR
OW
TH
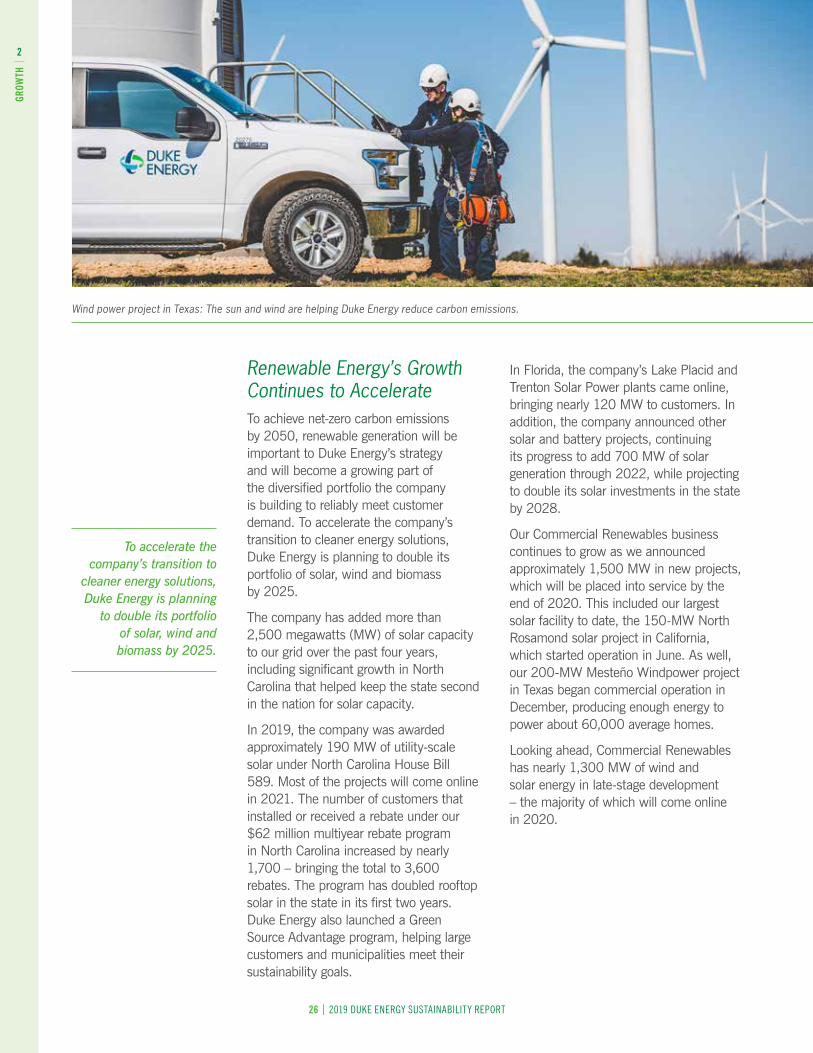
Wind power project in Texas: The sun and wind are helping Duke Energy reduce carbon emissions.
26 | 2019 DUKE ENERGY SUSTAINABILITY REPORT
Renewable Energy’s Growth Continues to Accelerate To achieve net-zero carbon emissions by 2050, renewable generation will be important to Duke Energy’s strategy and will become a growing part of the diversified portfolio the company is building to reliably meet customer demand. To accelerate the company’s transition to cleaner energy solutions, Duke Energy is planning to double its portfolio of solar, wind and biomass by 2025.
The company has added more than 2,500 megawatts (MW) of solar capacity to our grid over the past four years, including significant growth in North Carolina that helped keep the state second in the nation for solar capacity.
In 2019, the company was awarded approximately 190 MW of utility-scale solar under North Carolina House Bill 589. Most of the projects will come online in 2021. The number of customers that installed or received a rebate under our $62 million multiyear rebate program in North Carolina increased by nearly 1,700 – bringing the total to 3,600 rebates. The program has doubled rooftop solar in the state in its first two years. Duke Energy also launched a Green Source Advantage program, helping large customers and municipalities meet their sustainability goals.
In Florida, the company’s Lake Placid and Trenton Solar Power plants came online, bringing nearly 120 MW to customers. In addition, the company announced other solar and battery projects, continuing its progress to add 700 MW of solar generation through 2022, while projecting to double its solar investments in the state by 2028.
Our Commercial Renewables business continues to grow as we announced approximately 1,500 MW in new projects, which will be placed into service by the end of 2020. This included our largest solar facility to date, the 150-MW North Rosamond solar project in California, which started operation in June. As well, our 200-MW Mesteño Windpower project in Texas began commercial operation in December, producing enough energy to power about 60,000 average homes.
Looking ahead, Commercial Renewables has nearly 1,300 MW of wind and solar energy in late-stage development – the majority of which will come online in 2020.
To accelerate the company’s transition to
cleaner energy solutions, Duke Energy is planning
to double its portfolio of solar, wind and biomass by 2025.
2
GROW
TH
27 | 2019 DUKE ENERGY SUSTAINABILITY REPORT
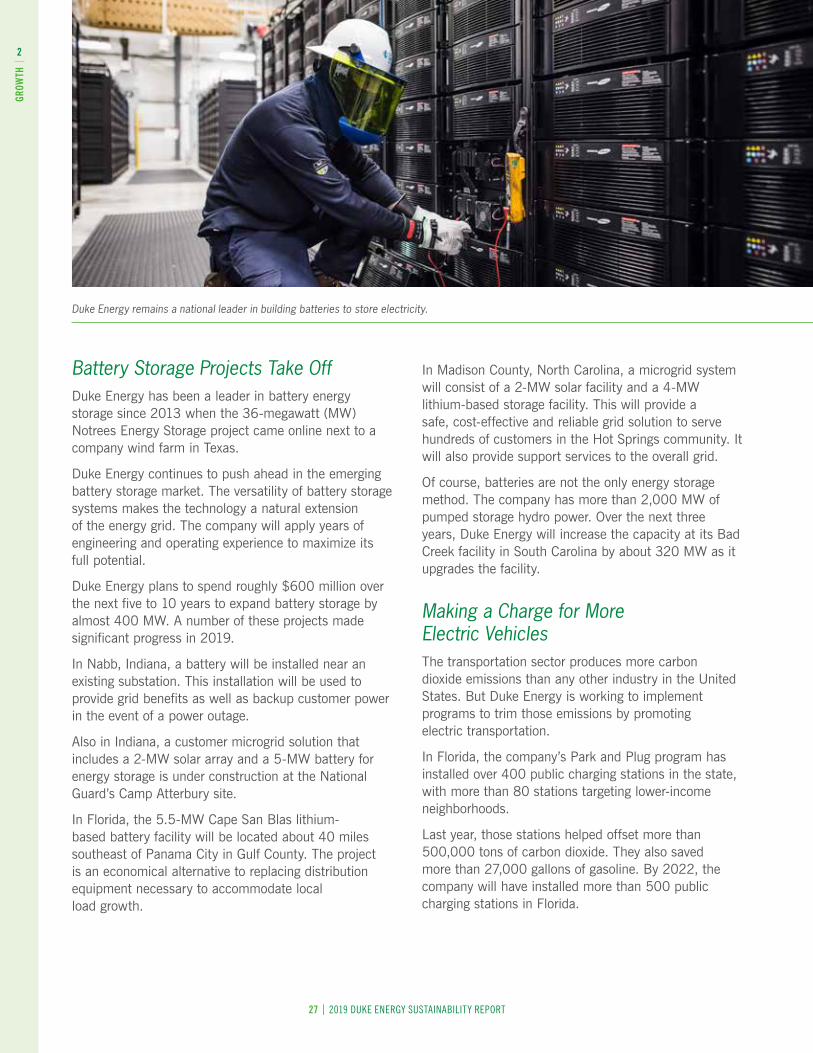
Battery Storage Projects Take Off Duke Energy has been a leader in battery energy storage since 2013 when the 36-megawatt (MW) Notrees Energy Storage project came online next to a company wind farm in Texas.
Duke Energy continues to push ahead in the emerging battery storage market. The versatility of battery storage systems makes the technology a natural extension of the energy grid. The company will apply years of engineering and operating experience to maximize its full potential.
Duke Energy plans to spend roughly $600 million over the next five to 10 years to expand battery storage by almost 400 MW. A number of these projects made significant progress in 2019.
In Nabb, Indiana, a battery will be installed near an existing substation. This installation will be used to provide grid benefits as well as backup customer power in the event of a power outage.
Also in Indiana, a customer microgrid solution that includes a 2-MW solar array and a 5-MW battery for energy storage is under construction at the National Guard’s Camp Atterbury site.
In Florida, the 5.5-MW Cape San Blas lithium-based battery facility will be located about 40 miles southeast of Panama City in Gulf County. The project is an economical alternative to replacing distribution equipment necessary to accommodate local load growth.
In Madison County, North Carolina, a microgrid system will consist of a 2-MW solar facility and a 4-MW lithium-based storage facility. This will provide a safe, cost-effective and reliable grid solution to serve hundreds of customers in the Hot Springs community. It will also provide support services to the overall grid.
Of course, batteries are not the only energy storage method. The company has more than 2,000 MW of pumped storage hydro power. Over the next three years, Duke Energy will increase the capacity at its Bad Creek facility in South Carolina by about 320 MW as it upgrades the facility.
Making a Charge for More Electric VehiclesThe transportation sector produces more carbon dioxide emissions than any other industry in the United States. But Duke Energy is working to implement programs to trim those emissions by promoting electric transportation.
In Florida, the company’s Park and Plug program has installed over 400 public charging stations in the state, with more than 80 stations targeting lower-income neighborhoods.
Last year, those stations helped offset more than 500,000 tons of carbon dioxide. They also saved more than 27,000 gallons of gasoline. By 2022, the company will have installed more than 500 public charging stations in Florida.
Duke Energy remains a national leader in building batteries to store electricity.
2
GROW
TH
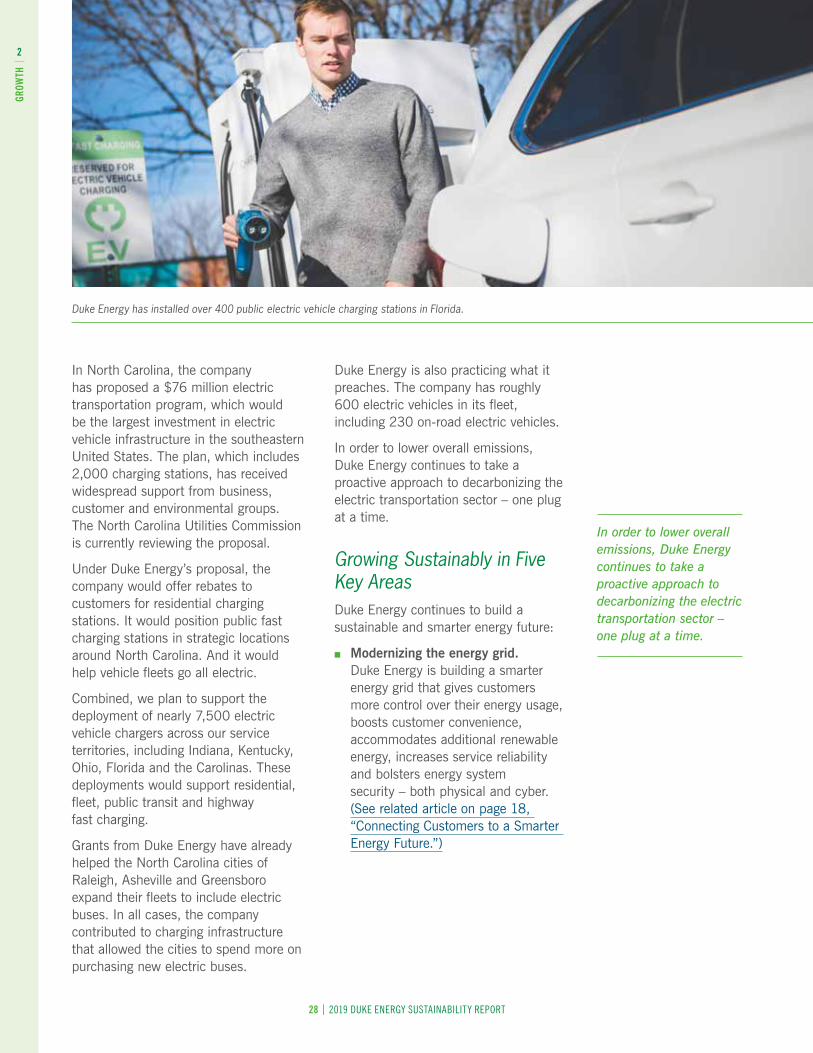
Duke Energy has installed over 400 public electric vehicle charging stations in Florida.
28 | 2019 DUKE ENERGY SUSTAINABILITY REPORT
In North Carolina, the company has proposed a $76 million electric transportation program, which would be the largest investment in electric vehicle infrastructure in the southeastern United States. The plan, which includes 2,000 charging stations, has received widespread support from business, customer and environmental groups. The North Carolina Utilities Commission is currently reviewing the proposal.
Under Duke Energy’s proposal, the company would offer rebates to customers for residential charging stations. It would position public fast charging stations in strategic locations around North Carolina. And it would help vehicle fleets go all electric.
Combined, we plan to support the deployment of nearly 7,500 electric vehicle chargers across our service territories, including Indiana, Kentucky, Ohio, Florida and the Carolinas. These deployments would support residential, fleet, public transit and highway fast charging.
Grants from Duke Energy have already helped the North Carolina cities of Raleigh, Asheville and Greensboro expand their fleets to include electric buses. In all cases, the company contributed to charging infrastructure that allowed the cities to spend more on purchasing new electric buses.
Duke Energy is also practicing what it preaches. The company has roughly 600 electric vehicles in its fleet, including 230 on-road electric vehicles.
In order to lower overall emissions, Duke Energy continues to take a proactive approach to decarbonizing the electric transportation sector – one plug at a time.
Growing Sustainably in Five Key Areas Duke Energy continues to build a sustainable and smarter energy future:
■ Modernizing the energy grid. Duke Energy is building a smarter energy grid that gives customers more control over their energy usage, boosts customer convenience, accommodates additional renewable energy, increases service reliability and bolsters energy system security – both physical and cyber. (See related article on page 18, “Connecting Customers to a Smarter Energy Future.”)
In order to lower overall emissions, Duke Energy continues to take a proactive approach to decarbonizing the electric transportation sector – one plug at a time.
2
GROW
TH
29 | 2019 DUKE ENERGY SUSTAINABILITY REPORT
2
GROW
TH
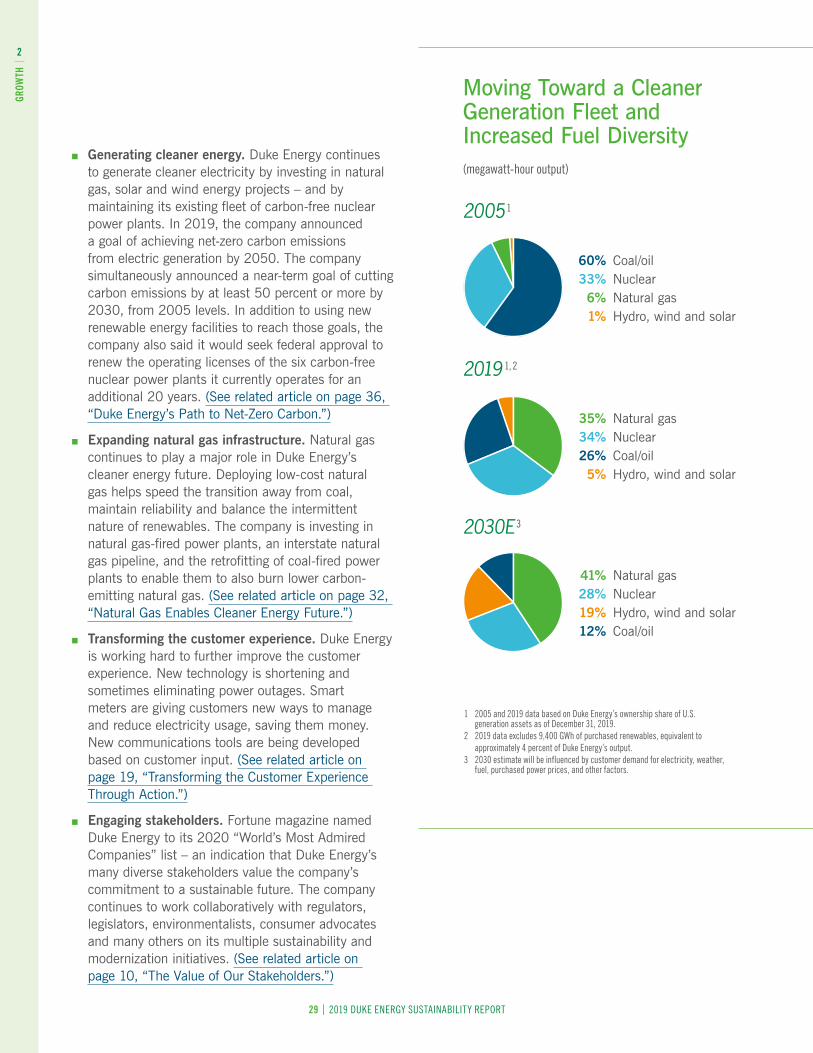
Moving Toward a Cleaner Generation Fleet and Increased Fuel Diversity (megawatt-hour output)
2005 1
60% Coal/oil33% Nuclear
6% Natural gas 1% Hydro, wind and solar
2019 1, 2
35% Natural gas 34% Nuclear
26% Coal/oil 5% Hydro, wind and solar
2030E 3
41% Natural gas 28% Nuclear
19% Hydro, wind and solar 12% Coal/oil
1 2005 and 2019 data based on Duke Energy’s ownership share of U .S . generation assets as of December 31, 2019 .
2 2019 data excludes 9,400 GWh of purchased renewables, equivalent to approximately 4 percent of Duke Energy’s output .
3 2030 estimate will be influenced by customer demand for electricity, weather, fuel, purchased power prices, and other factors .
■ Generating cleaner energy. Duke Energy continues to generate cleaner electricity by investing in natural gas, solar and wind energy projects – and by maintaining its existing fleet of carbon-free nuclear power plants. In 2019, the company announced a goal of achieving net-zero carbon emissions from electric generation by 2050. The company simultaneously announced a near-term goal of cutting carbon emissions by at least 50 percent or more by 2030, from 2005 levels. In addition to using new renewable energy facilities to reach those goals, the company also said it would seek federal approval to renew the operating licenses of the six carbon-free nuclear power plants it currently operates for an additional 20 years. (See related article on page 36, “Duke Energy’s Path to Net-Zero Carbon.”)
■ Expanding natural gas infrastructure. Natural gas continues to play a major role in Duke Energy’s cleaner energy future. Deploying low-cost natural gas helps speed the transition away from coal, maintain reliability and balance the intermittent nature of renewables. The company is investing in natural gas-fired power plants, an interstate natural gas pipeline, and the retrofitting of coal-fired power plants to enable them to also burn lower carbon-emitting natural gas. (See related article on page 32, “Natural Gas Enables Cleaner Energy Future.”)
■ Transforming the customer experience. Duke Energy is working hard to further improve the customer experience. New technology is shortening and sometimes eliminating power outages. Smart meters are giving customers new ways to manage and reduce electricity usage, saving them money. New communications tools are being developed based on customer input. (See related article on page 19, “Transforming the Customer Experience Through Action.”)
■ Engaging stakeholders. Fortune magazine named Duke Energy to its 2020 “World’s Most Admired Companies” list – an indication that Duke Energy’s many diverse stakeholders value the company’s commitment to a sustainable future. The company continues to work collaboratively with regulators, legislators, environmentalists, consumer advocates and many others on its multiple sustainability and modernization initiatives. (See related article on page 10, “The Value of Our Stakeholders.”)
30 | 2019 DUKE ENERGY SUSTAINABILITY REPORT
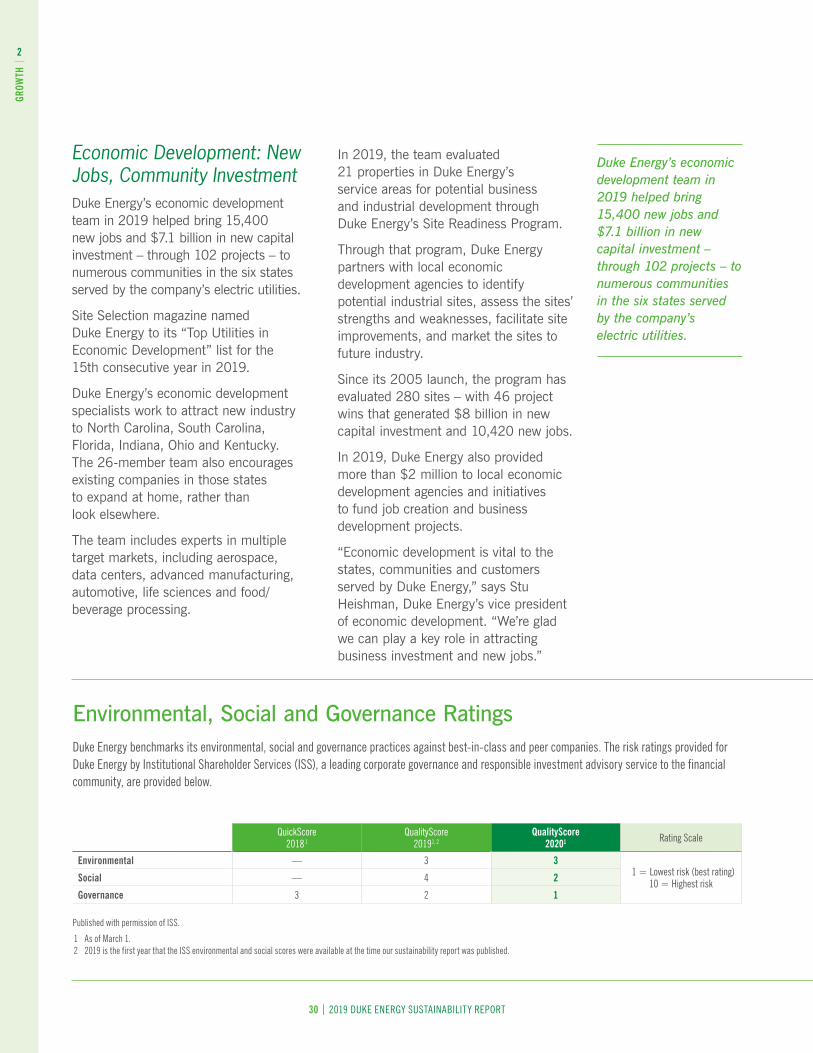
Environmental, Social and Governance Ratings Duke Energy benchmarks its environmental, social and governance practices against best-in-class and peer companies . The risk ratings provided for Duke Energy by Institutional Shareholder Services (ISS), a leading corporate governance and responsible investment advisory service to the financial community, are provided below .
QuickScore2018 1
QualityScore20191, 2
QualityScore20201 Rating Scale
Environmental — 3 3 1 = Lowest risk (best rating)
10 = Highest riskSocial — 4 2
Governance 3 2 1
Published with permission of ISS .
1 As of March 1 . 2 2019 is the first year that the ISS environmental and social scores were available at the time our sustainability report was published .
Economic Development: New Jobs, Community InvestmentDuke Energy’s economic development team in 2019 helped bring 15,400 new jobs and $7.1 billion in new capital investment – through 102 projects – to numerous communities in the six states served by the company’s electric utilities.
Site Selection magazine named Duke Energy to its “Top Utilities in Economic Development” list for the 15th consecutive year in 2019.
Duke Energy’s economic development specialists work to attract new industry to North Carolina, South Carolina, Florida, Indiana, Ohio and Kentucky. The 26-member team also encourages existing companies in those states to expand at home, rather than look elsewhere.
The team includes experts in multiple target markets, including aerospace, data centers, advanced manufacturing, automotive, life sciences and food/beverage processing.
In 2019, the team evaluated 21 properties in Duke Energy’s service areas for potential business and industrial development through Duke Energy’s Site Readiness Program.
Through that program, Duke Energy partners with local economic development agencies to identify potential industrial sites, assess the sites’ strengths and weaknesses, facilitate site improvements, and market the sites to future industry.
Since its 2005 launch, the program has evaluated 280 sites – with 46 project wins that generated $8 billion in new capital investment and 10,420 new jobs.
In 2019, Duke Energy also provided more than $2 million to local economic development agencies and initiatives to fund job creation and business development projects.
“Economic development is vital to the states, communities and customers served by Duke Energy,” says Stu Heishman, Duke Energy’s vice president of economic development. “We’re glad we can play a key role in attracting business investment and new jobs.”
2
GROW
TH
Duke Energy’s economic development team in 2019 helped bring 15,400 new jobs and $7.1 billion in new capital investment – through 102 projects – to numerous communities in the six states served by the company’s electric utilities.
31 | 2019 DUKE ENERGY SUSTAINABILITY REPORT
2
GROW
TH
Encouraging Civic Participation at All Levels Duke Energy serves 7.8 million electric and 1.6 million natural gas customers across seven different states, and employs nearly 30,000 people. With complex political and policy landscapes at the state and federal levels, it is important that there is a balanced view on issues to ensure the best interest of Duke Energy customers and employees are top of mind.
DukePAC, a voluntary, nonpartisan political action committee, leverages the collective financial contributions of eligible employees to support political organizations and candidates who share the concerns and best interests of Duke Energy employees and customers. In 2019, DukePAC’s total contributions were $633,930.
DukePAC also serves as a key resource in its ability to educate employees, encouraging their increased civic participation at all levels.
Through engagement with local communities, lawmakers, and stakeholders, Duke Energy is also able to advocate for state-specific policies at the state capitals in its service territory. The company also advocates for innovative and practical policies at the federal level that further the good progress made by the company, and the industry as a whole.
Duke Energy’s total reportable federal lobbying expenses in 2019 were $5,284,510. That amount includes the $963,720 federal lobbying portion of trade association dues (includes dues in excess of $50,000) to support policy research and advocacy. The company also contributed approximately $1,194,660 to Section 527 organizations created to support the nomination, election, appointment or defeat of a candidate. (For additional details, see Duke Energy’s Corporate Political Expenditure Reports.)
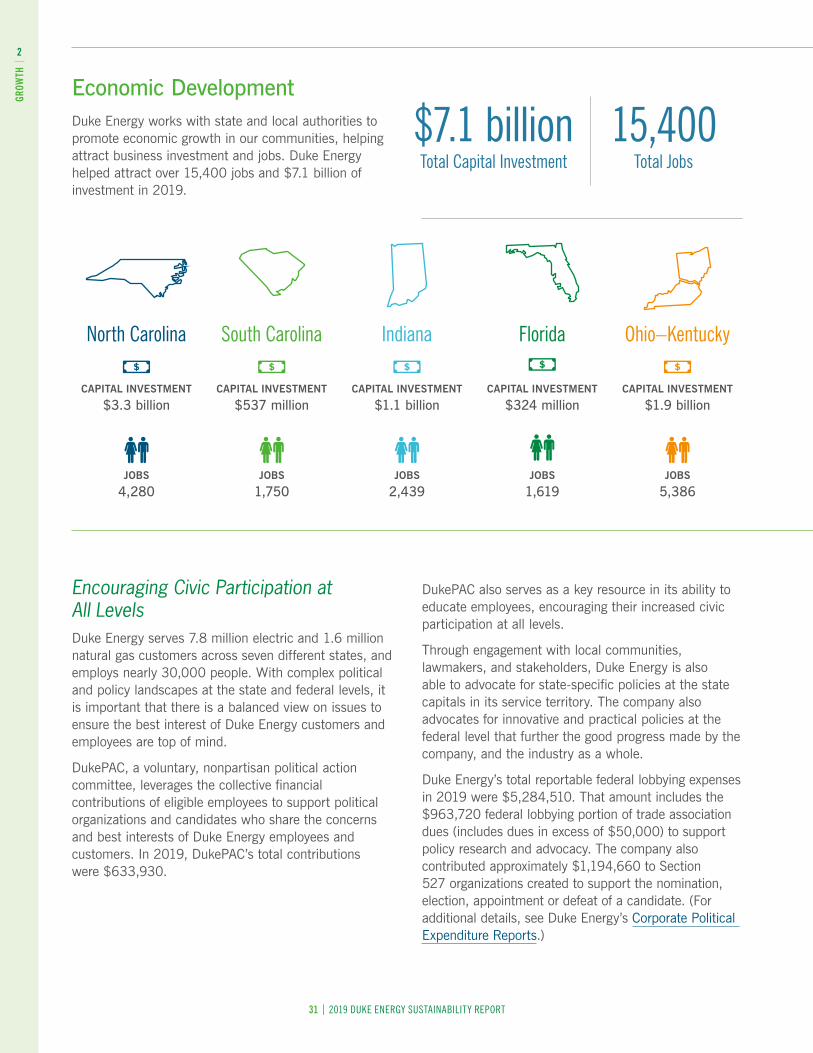
Economic DevelopmentDuke Energy works with state and local authorities to promote economic growth in our communities, helping attract business investment and jobs. Duke Energy helped attract over 15,400 jobs and $7.1 billion of investment in 2019.
$7 .1 billionTotal Capital Investment
15,400Total Jobs
North Carolina
CAPITAL INVESTMENT
$3.3 billion
JOBS
4,280
South Carolina
CAPITAL INVESTMENT
$537 million
JOBS
1,750
Indiana
CAPITAL INVESTMENT
$1.1 billion
JOBS
2,439
Florida
CAPITAL INVESTMENT
$324 million
JOBS
1,619
Ohio–Kentucky
CAPITAL INVESTMENT
$1.9 billion
JOBS 5,386
32 | 2019 DUKE ENERGY SUSTAINABILITY REPORT
2
GROW
TH
Duke Energy’s Political Expenditures Policy requires compliance with laws and regulations governing political contributions, government interaction and lobbying activities. It also requires a semiannual update on political expenditures to the Corporate Governance Committee of the Duke Energy Board of Directors. The company is legally prohibited from making direct contributions to candidates for U.S. federal offices and certain state offices.
Natural Gas Enables Cleaner Energy Future Natural gas continues to play a central role as Duke Energy moves toward a cleaner, lower-carbon energy future. This low-cost fuel source is helping the company retire coal plants faster and balance the intermittent nature of renewables.
In 2020, the company’s new natural gas-fired Asheville Combined Cycle Station in Buncombe County, North Carolina, became operational. The power plant replaced a 56-year-old, higher carbon-emitting, coal-fired plant.
The natural gas plant is 75 percent more efficient than the retired coal plant. In addition, the new plant’s carbon dioxide emissions are 60 percent lower (per megawatt hour), sulfur dioxide emissions are 99 percent lower, and nitrogen oxides emissions are 40 percent lower than the coal plant’s emissions. Mercury emissions have been eliminated.
Duke Energy also has retrofitted two units at its coal-fired Rogers Energy Complex near Cliffside, North Carolina, enabling the power plant to burn a combination of natural gas and coal – rather than coal only – to reduce carbon dioxide and other emissions.
A similar natural gas retrofitting project has been completed on one unit (and is underway on a second unit) at Duke Energy’s Belews Creek Steam Station, a coal-fired power plant in Stokes County, North Carolina. Natural gas retrofitting work also is underway at the company’s Marshall Steam Station, a coal-fired power plant in Catawba County, North Carolina.
In addition, Duke Energy in 2019 continued expansion work at its Lincoln Combustion Turbine Station, a natural gas-fired power plant near Denver, North Carolina. The company is adding a new unit that will
significantly increase the plant’s electricity output, particularly during periods of high customer demand. When fully operational in 2024, the new unit will be about 34 percent more efficient than the plant’s 16 existing units.
Meanwhile, legal and regulatory work on another natural gas project – the proposed Atlantic Coast Pipeline – continues. The approximately 600-mile underground natural gas pipeline, partly owned by Duke Energy, would start in West Virginia and traverse Virginia and eastern North Carolina before ending in Robeson County, North Carolina.
The pipeline’s natural gas would be used in Virginia and North Carolina to fuel power plants and industrial facilities, heat homes and businesses, support local economic development, and ensure that natural gas utilities have enough natural gas to meet growing customer demand.
Additional court and regulatory rulings related to the pipeline’s review and approval process are expected in 2020.
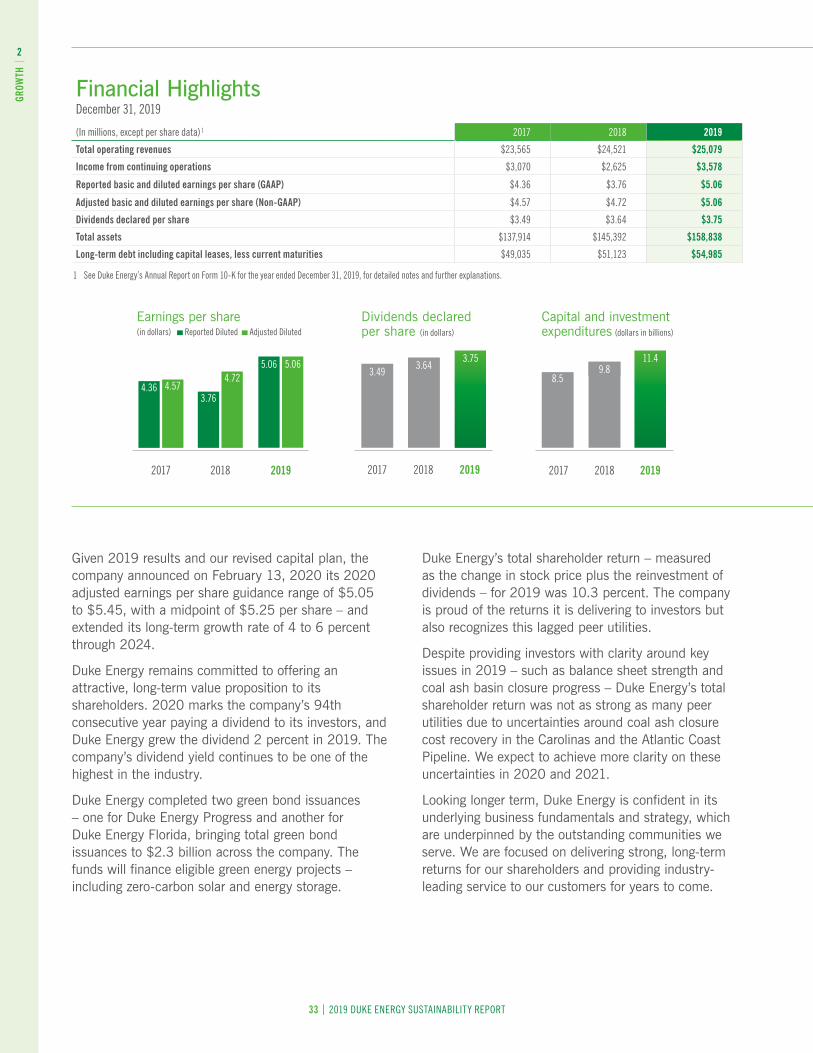
Strong Results for Shareholders and Value for Customers In 2019, Duke Energy achieved adjusted earnings per share of $5.06, delivering 7 percent growth for the year. It was a strong year for Duke Energy – the company met its commitments to customers, advanced its long-term strategy and exceeded growth expectations.
Our electric, gas and commercial renewables businesses all experienced growth in 2019, which was helped by base rate increases in the Carolinas and Florida, customer growth in our gas businesses and new renewables projects placed in service.
In 2019, the company issued $2 billion in preferred stock and priced $2.5 billion in equity. These proactive steps strengthened the balance sheet, paving the way for a substantial increase in our five-year capital plan, significantly increasing the earnings potential of the company to the benefit of our communities and shareholders.
33 | 2019 DUKE ENERGY SUSTAINABILITY REPORT
2
GROW
TH
Given 2019 results and our revised capital plan, the company announced on February 13, 2020 its 2020 adjusted earnings per share guidance range of $5.05 to $5.45, with a midpoint of $5.25 per share – and extended its long-term growth rate of 4 to 6 percent through 2024.
Duke Energy remains committed to offering an attractive, long-term value proposition to its shareholders. 2020 marks the company’s 94th consecutive year paying a dividend to its investors, and Duke Energy grew the dividend 2 percent in 2019. The company’s dividend yield continues to be one of the highest in the industry.
Duke Energy completed two green bond issuances – one for Duke Energy Progress and another for Duke Energy Florida, bringing total green bond issuances to $2.3 billion across the company. The funds will finance eligible green energy projects – including zero-carbon solar and energy storage.
Duke Energy’s total shareholder return – measured as the change in stock price plus the reinvestment of dividends – for 2019 was 10.3 percent. The company is proud of the returns it is delivering to investors but also recognizes this lagged peer utilities.
Despite providing investors with clarity around key issues in 2019 – such as balance sheet strength and coal ash basin closure progress – Duke Energy’s total shareholder return was not as strong as many peer utilities due to uncertainties around coal ash closure cost recovery in the Carolinas and the Atlantic Coast Pipeline. We expect to achieve more clarity on these uncertainties in 2020 and 2021.
Looking longer term, Duke Energy is confident in its underlying business fundamentals and strategy, which are underpinned by the outstanding communities we serve. We are focused on delivering strong, long-term returns for our shareholders and providing industry-leading service to our customers for years to come.
Financial Highlights December 31, 2019
(In millions, except per share data) 1 2017 2018 2019
Total operating revenues $23,565 $24,521 $25,079
Income from continuing operations $3,070 $2,625 $3,578
Reported basic and diluted earnings per share (GAAP) $4 .36 $3 .76 $5.06
Adjusted basic and diluted earnings per share (Non-GAAP) $4 .57 $4 .72 $5.06
Dividends declared per share $3 .49 $3 .64 $3.75
Total assets $137,914 $145,392 $158,838
Long-term debt including capital leases, less current maturities $49,035 $51,123 $54,985
1 See Duke Energy’s Annual Report on Form 10-K for the year ended December 31, 2019, for detailed notes and further explanations .
Capital and investment expenditures (dollars in billions)
20182017 2019
Dividends declared per share (in dollars)
2018 201920172019
4 .574 .72
5 .06
4 .363 .76
5 .06
20182017
3 .493 .75
3 .648 .5
11 .49 .8
Earnings per share (in dollars) Reported Diluted Adjusted Diluted
2
GROW
TH
34 | 2019 DUKE ENERGY SUSTAINABILITY REPORT
OPER
ATIO
NS
3
Excel in Safety, Operational Performance and Environmental Stewardship
OPERATIONS
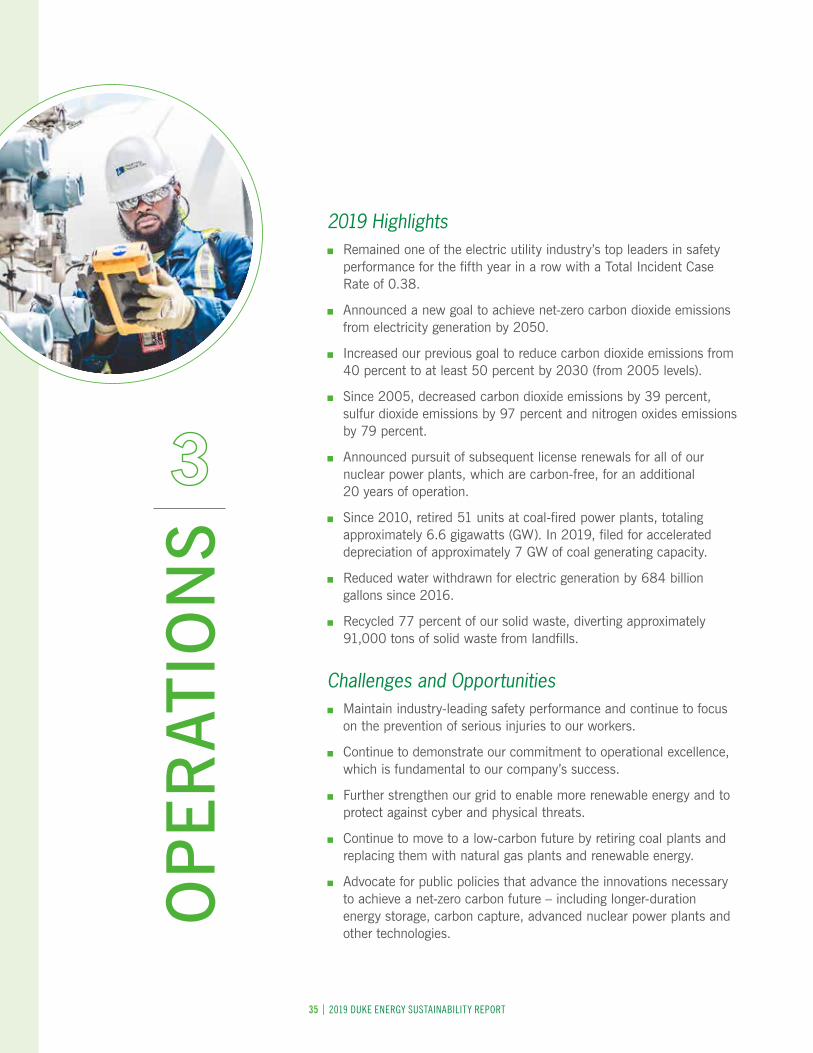
35 | 2019 DUKE ENERGY SUSTAINABILITY REPORT
OPER
ATIO
NS
3
2019 Highlights ■ Remained one of the electric utility industry’s top leaders in safety
performance for the fifth year in a row with a Total Incident Case Rate of 0.38.
■ Announced a new goal to achieve net-zero carbon dioxide emissions from electricity generation by 2050.
■ Increased our previous goal to reduce carbon dioxide emissions from 40 percent to at least 50 percent by 2030 (from 2005 levels).
■ Since 2005, decreased carbon dioxide emissions by 39 percent, sulfur dioxide emissions by 97 percent and nitrogen oxides emissions by 79 percent.
■ Announced pursuit of subsequent license renewals for all of our nuclear power plants, which are carbon-free, for an additional 20 years of operation.
■ Since 2010, retired 51 units at coal-fired power plants, totaling approximately 6.6 gigawatts (GW). In 2019, filed for accelerated depreciation of approximately 7 GW of coal generating capacity.
■ Reduced water withdrawn for electric generation by 684 billion gallons since 2016.
■ Recycled 77 percent of our solid waste, diverting approximately 91,000 tons of solid waste from landfills.
Challenges and Opportunities ■ Maintain industry-leading safety performance and continue to focus
on the prevention of serious injuries to our workers.
■ Continue to demonstrate our commitment to operational excellence, which is fundamental to our company’s success.
■ Further strengthen our grid to enable more renewable energy and to protect against cyber and physical threats.
■ Continue to move to a low-carbon future by retiring coal plants and replacing them with natural gas plants and renewable energy.
■ Advocate for public policies that advance the innovations necessary to achieve a net-zero carbon future – including longer-duration energy storage, carbon capture, advanced nuclear power plants and other technologies.
OP
ERAT
ION
S
36 | 2019 DUKE ENERGY SUSTAINABILITY REPORT
OPER
ATIO
NS
3
Duke Energy’s Path to Net-Zero Carbon Duke Energy is serious about doing its part to deliver the cleaner energy future that its customers want and deserve, while keeping energy affordable and reliable.
In September 2019, the company refreshed its climate strategy and announced the acceleration of its carbon-reduction goals from electric generation. Duke Energy’s new goals are to reduce carbon dioxide emissions at least 50 percent by 2030 from 2005 levels, and strive to be net-zero by 2050. The company is the largest power generator in the United States to have such a net-zero goal.
Duke Energy continues to achieve significant decreases in overall carbon emissions, driven largely by utilizing more natural gas and renewables generation and less coal. As of year-end 2019, the company has reduced carbon emissions by 39 percent from 2005 levels.
While there are many factors that influence emissions on an annual basis, Duke Energy is confident in its ability to meet its 2030 goal of at least a 50 percent carbon emissions reduction, and its 2050 goal of net-zero carbon emissions.
Achieving these ambitious goals requires a bold vision and a pragmatic strategy. This vision includes continuing to modernize the current fleet and grid with increased investments in renewables, storage, natural gas and energy efficiency. Importantly, the company plans to continue to operate its existing nuclear fleet and retire coal plants.
To reach our net-zero 2050 target, we must have additional non-emitting technologies. We are working with the private and public sectors to drive research, development and demonstration of new technologies – such as longer-duration (up to seasonal) storage, carbon capture, advanced nuclear and new, carbon-free solutions that don’t exist yet at scale.
The company has taken a holistic approach to managing the climate issue that includes three key areas of focus: adaptation, mitigation and innovation.
■ Adaptation – Duke Energy is preparing for the changing global climate, including water conservation and storm preparation.
■ Mitigation – Duke Energy is working to slow climate change with a variety of carbon-reduction and land conservation efforts.
■ Innovation – Duke Energy is helping drive the technology necessary for a carbon-free future, including grid modernization and new technologies.
The company has already made meaningful progress in each area and will continue to update plans to ensure that climate change is tackled from all angles.
You can read more on this approach in the company’s 2020 Climate Report.
OPER
ATIO
NS
3
Duke Energy continues to achieve significant decreases in overall carbon emissions, driven largely by utilizing more natural gas and renewables generation and less coal.

37 | 2019 DUKE ENERGY SUSTAINABILITY REPORT
OPER
ATIO
NS
3
Nuclear Essential to Meeting Carbon Goals Nuclear power remains Duke Energy’s largest greenhouse gas emissions-free generator. And the company plans to rely on it as it seeks to be carbon neutral by 2050.
In September 2019, the company announced it would seek to renew the operating licenses of the 11 reactors it operates at six nuclear stations in the Carolinas for an additional 20 years.
The first nuclear plants will approach the end of their current operating licenses in the early 2030s. Rigorous, ongoing preventive maintenance programs across the nuclear fleet and technology upgrades and investments over the years have contributed to their continuing strong operating performance. In 2019, Duke Energy’s nuclear fleet marked its 21st consecutive year with a fleet capacity factor – a measure of reliability – greater than 90 percent.
The company expects to submit the license renewal application for Oconee Nuclear Station in South Carolina in 2021, followed by its other nuclear stations.
In 2019, the Duke Energy nuclear fleet generated almost 74 billion kilowatt-hours of electricity and avoided the release of more than 52 million tons of carbon dioxide – equivalent to keeping more than 11 million passenger cars off the road.
U.S. nuclear facilities are licensed by the U.S. Nuclear Regulatory Commission and were originally licensed to operate for 40 years based on economic considerations, not technology limitations.
Regulations allow nuclear licensees to renew their licenses for up to 20 years at a time. All Duke Energy-operated nuclear units have received one renewed license for an additional 20 years. The process to renew licenses for a second 20 years requires a comprehensive analysis and evaluation to ensure the units can safely operate for the extended operation period.
Duke Energy’s nuclear power plant teams generate carbon-free electricity around the clock.
Nuclear power remains Duke Energy’s largest greenhouse gas emissions-free generator.
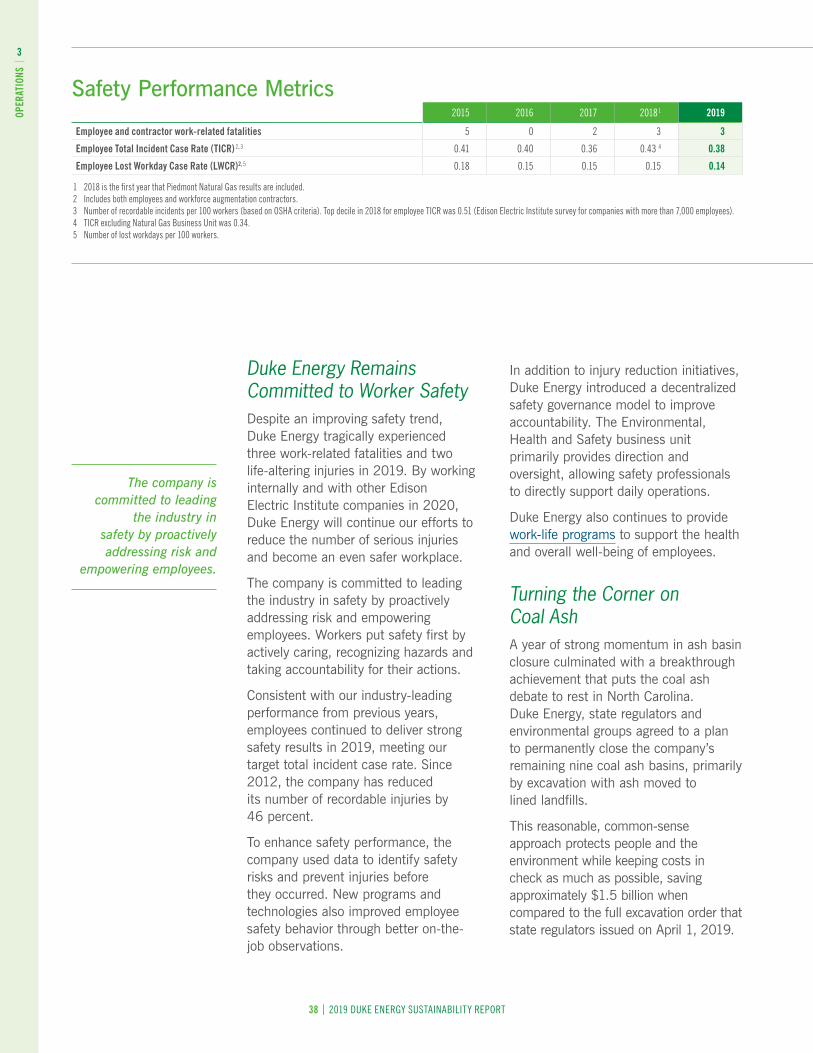
38 | 2019 DUKE ENERGY SUSTAINABILITY REPORT
OPER
ATIO
NS
3
Safety Performance Metrics2015 2016 2017 2018 1 2019
Employee and contractor work-related fatalities 5 0 2 3 3
Employee Total Incident Case Rate (TICR) 2, 3 0 .41 0 .40 0 .36 0 .43 4 0.38
Employee Lost Workday Case Rate (LWCR)2, 5 0 .18 0 .15 0 .15 0 .15 0.14
1 2018 is the first year that Piedmont Natural Gas results are included . 2 Includes both employees and workforce augmentation contractors . 3 Number of recordable incidents per 100 workers (based on OSHA criteria) . Top decile in 2018 for employee TICR was 0 .51 (Edison Electric Institute survey for companies with more than 7,000 employees) . 4 TICR excluding Natural Gas Business Unit was 0 .34 . 5 Number of lost workdays per 100 workers .
Duke Energy Remains Committed to Worker Safety Despite an improving safety trend, Duke Energy tragically experienced three work-related fatalities and two life-altering injuries in 2019. By working internally and with other Edison Electric Institute companies in 2020, Duke Energy will continue our efforts to reduce the number of serious injuries and become an even safer workplace.
The company is committed to leading the industry in safety by proactively addressing risk and empowering employees. Workers put safety first by actively caring, recognizing hazards and taking accountability for their actions.
Consistent with our industry-leading performance from previous years, employees continued to deliver strong safety results in 2019, meeting our target total incident case rate. Since 2012, the company has reduced its number of recordable injuries by 46 percent.
To enhance safety performance, the company used data to identify safety risks and prevent injuries before they occurred. New programs and technologies also improved employee safety behavior through better on-the-job observations.
In addition to injury reduction initiatives, Duke Energy introduced a decentralized safety governance model to improve accountability. The Environmental, Health and Safety business unit primarily provides direction and oversight, allowing safety professionals to directly support daily operations.
Duke Energy also continues to provide work-life programs to support the health and overall well-being of employees.
Turning the Corner on Coal Ash A year of strong momentum in ash basin closure culminated with a breakthrough achievement that puts the coal ash debate to rest in North Carolina. Duke Energy, state regulators and environmental groups agreed to a plan to permanently close the company’s remaining nine coal ash basins, primarily by excavation with ash moved to lined landfills.
This reasonable, common-sense approach protects people and the environment while keeping costs in check as much as possible, saving approximately $1.5 billion when compared to the full excavation order that state regulators issued on April 1, 2019.
The company is committed to leading
the industry in safety by proactively addressing risk and
empowering employees.
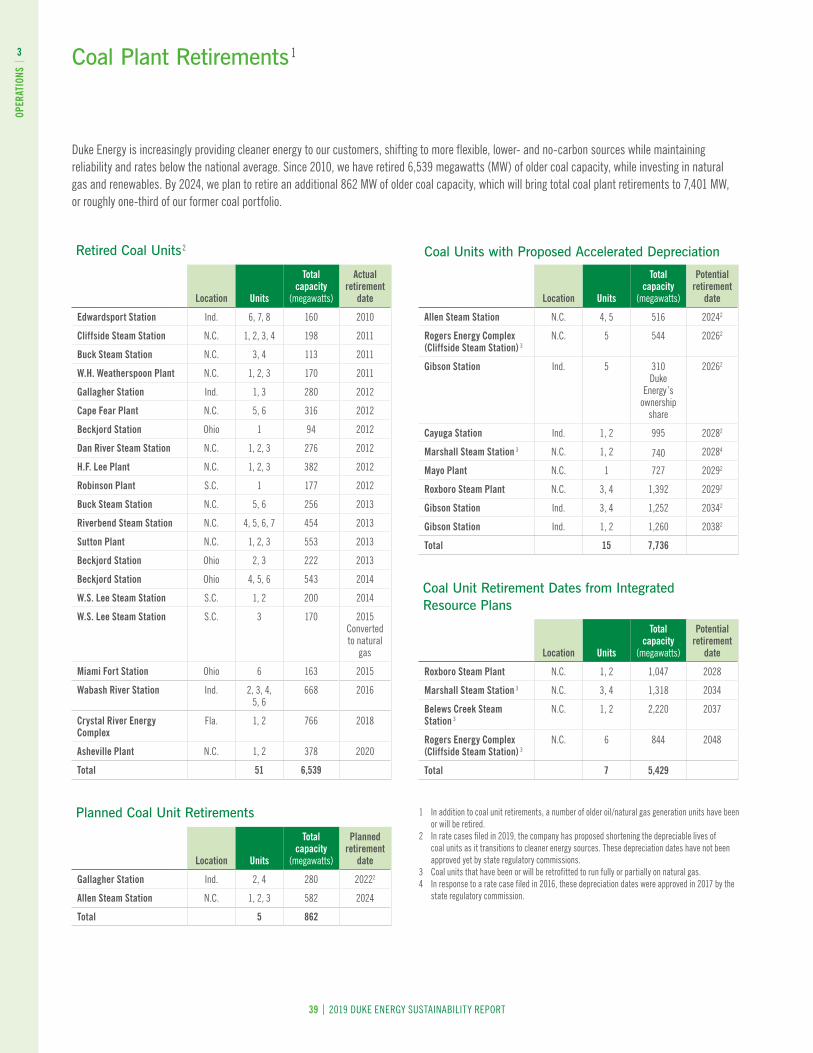
39 | 2019 DUKE ENERGY SUSTAINABILITY REPORT
OPER
ATIO
NS
3
Retired Coal Units 2
Location Units
Total capacity
(megawatts)
Actual retirement
date
Edwardsport Station Ind . 6, 7, 8 160 2010
Cliffside Steam Station N .C . 1, 2, 3, 4 198 2011
Buck Steam Station N .C . 3, 4 113 2011
W.H. Weatherspoon Plant N .C . 1, 2, 3 170 2011
Gallagher Station Ind . 1, 3 280 2012
Cape Fear Plant N .C . 5, 6 316 2012
Beckjord Station Ohio 1 94 2012
Dan River Steam Station N .C . 1, 2, 3 276 2012
H.F. Lee Plant N .C . 1, 2, 3 382 2012
Robinson Plant S .C . 1 177 2012
Buck Steam Station N .C . 5, 6 256 2013
Riverbend Steam Station N .C . 4, 5, 6, 7 454 2013
Sutton Plant N .C . 1, 2, 3 553 2013
Beckjord Station Ohio 2, 3 222 2013
Beckjord Station Ohio 4, 5, 6 543 2014
W.S. Lee Steam Station S .C . 1, 2 200 2014
W.S. Lee Steam Station S .C . 3 170 2015Converted to natural
gas
Miami Fort Station Ohio 6 163 2015
Wabash River Station Ind . 2, 3, 4, 5, 6
668 2016
Crystal River Energy Complex
Fla . 1, 2 766 2018
Asheville Plant N .C . 1, 2 378 2020
Total 51 6,539
Planned Coal Unit Retirements
Location Units
Total capacity
(megawatts)
Planned retirement
date
Gallagher Station Ind . 2, 4 280 20222
Allen Steam Station N .C . 1, 2, 3 582 2024
Total 5 862
Coal Units with Proposed Accelerated Depreciation
Location Units
Total capacity
(megawatts)
Potential retirement
date
Allen Steam Station N .C . 4, 5 516 20242
Rogers Energy Complex (Cliffside Steam Station) 3
N .C . 5 544 20262
Gibson Station Ind . 5 310 Duke
Energy’s ownership
share
20262
Cayuga Station Ind . 1, 2 995 20282
Marshall Steam Station 3 N .C . 1, 2 740 20284
Mayo Plant N .C . 1 727 20292
Roxboro Steam Plant N .C . 3, 4 1,392 20292
Gibson Station Ind . 3, 4 1,252 20342
Gibson Station Ind . 1, 2 1,260 20382
Total 15 7,736
Coal Unit Retirement Dates from Integrated Resource Plans
Location Units
Total capacity
(megawatts)
Potential retirement
date
Roxboro Steam Plant N .C . 1, 2 1,047 2028
Marshall Steam Station 3 N .C . 3, 4 1,318 2034
Belews Creek Steam Station 3
N .C . 1, 2 2,220 2037
Rogers Energy Complex (Cliffside Steam Station) 3
N .C . 6 844 2048
Total 7 5,429
1 In addition to coal unit retirements, a number of older oil/natural gas generation units have been or will be retired .
2 In rate cases filed in 2019, the company has proposed shortening the depreciable lives of coal units as it transitions to cleaner energy sources . These depreciation dates have not been approved yet by state regulatory commissions .
3 Coal units that have been or will be retrofitted to run fully or partially on natural gas .4 In response to a rate case filed in 2016, these depreciation dates were approved in 2017 by the
state regulatory commission .
Coal Plant Retirements 1
Duke Energy is increasingly providing cleaner energy to our customers, shifting to more flexible, lower- and no-carbon sources while maintaining reliability and rates below the national average . Since 2010, we have retired 6,539 megawatts (MW) of older coal capacity, while investing in natural gas and renewables . By 2024, we plan to retire an additional 862 MW of older coal capacity, which will bring total coal plant retirements to 7,401 MW, or roughly one-third of our former coal portfolio .
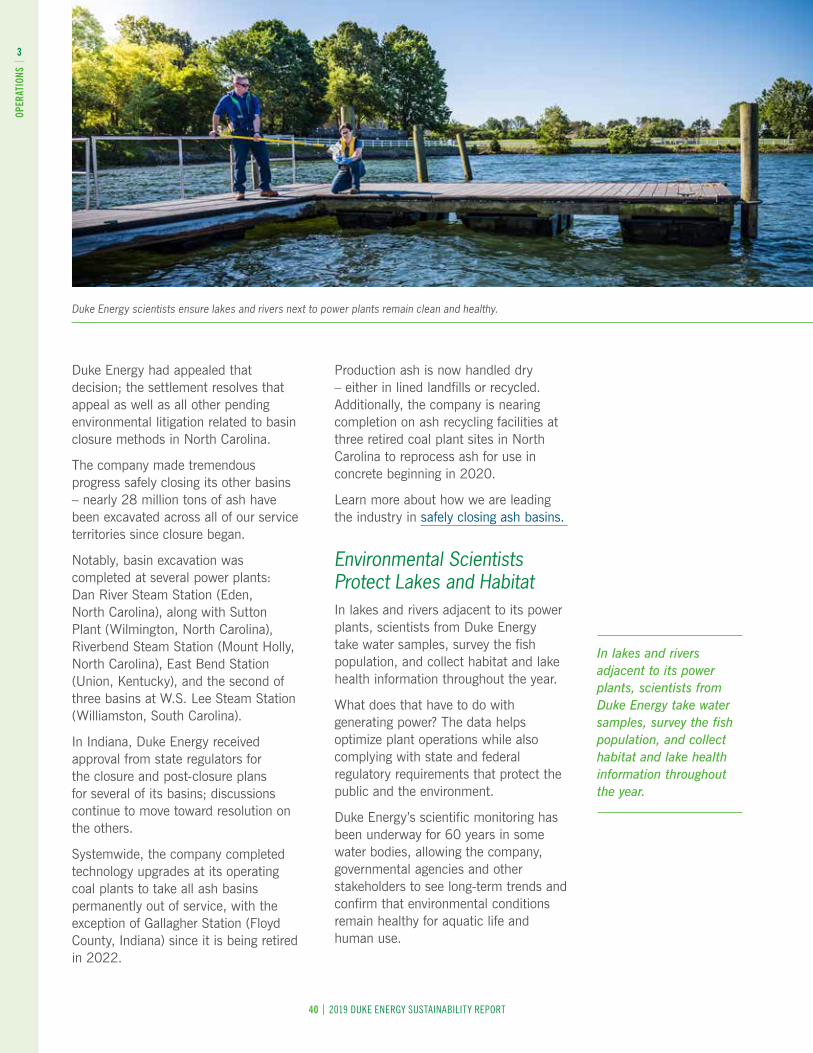
40 | 2019 DUKE ENERGY SUSTAINABILITY REPORT
Duke Energy had appealed that decision; the settlement resolves that appeal as well as all other pending environmental litigation related to basin closure methods in North Carolina.
The company made tremendous progress safely closing its other basins – nearly 28 million tons of ash have been excavated across all of our service territories since closure began.
Notably, basin excavation was completed at several power plants: Dan River Steam Station (Eden, North Carolina), along with Sutton Plant (Wilmington, North Carolina), Riverbend Steam Station (Mount Holly, North Carolina), East Bend Station (Union, Kentucky), and the second of three basins at W.S. Lee Steam Station (Williamston, South Carolina).
In Indiana, Duke Energy received approval from state regulators for the closure and post-closure plans for several of its basins; discussions continue to move toward resolution on the others.
Systemwide, the company completed technology upgrades at its operating coal plants to take all ash basins permanently out of service, with the exception of Gallagher Station (Floyd County, Indiana) since it is being retired in 2022.
Production ash is now handled dry – either in lined landfills or recycled. Additionally, the company is nearing completion on ash recycling facilities at three retired coal plant sites in North Carolina to reprocess ash for use in concrete beginning in 2020.
Learn more about how we are leading the industry in safely closing ash basins.
Environmental Scientists Protect Lakes and Habitat In lakes and rivers adjacent to its power plants, scientists from Duke Energy take water samples, survey the fish population, and collect habitat and lake health information throughout the year.
What does that have to do with generating power? The data helps optimize plant operations while also complying with state and federal regulatory requirements that protect the public and the environment.
Duke Energy’s scientific monitoring has been underway for 60 years in some water bodies, allowing the company, governmental agencies and other stakeholders to see long-term trends and confirm that environmental conditions remain healthy for aquatic life and human use.
In lakes and rivers adjacent to its power plants, scientists from Duke Energy take water samples, survey the fish population, and collect habitat and lake health information throughout the year.
OPER
ATIO
NS
3
Duke Energy scientists ensure lakes and rivers next to power plants remain clean and healthy.
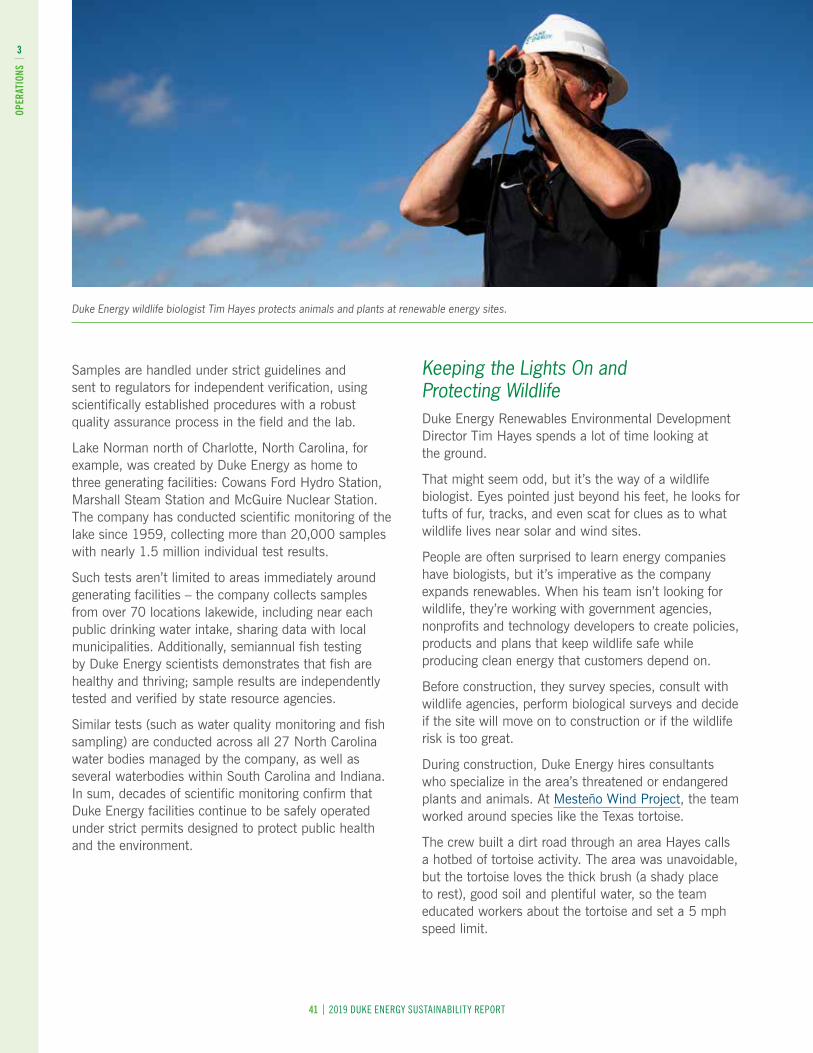
41 | 2019 DUKE ENERGY SUSTAINABILITY REPORT
Samples are handled under strict guidelines and sent to regulators for independent verification, using scientifically established procedures with a robust quality assurance process in the field and the lab.
Lake Norman north of Charlotte, North Carolina, for example, was created by Duke Energy as home to three generating facilities: Cowans Ford Hydro Station, Marshall Steam Station and McGuire Nuclear Station. The company has conducted scientific monitoring of the lake since 1959, collecting more than 20,000 samples with nearly 1.5 million individual test results.
Such tests aren’t limited to areas immediately around generating facilities – the company collects samples from over 70 locations lakewide, including near each public drinking water intake, sharing data with local municipalities. Additionally, semiannual fish testing by Duke Energy scientists demonstrates that fish are healthy and thriving; sample results are independently tested and verified by state resource agencies.
Similar tests (such as water quality monitoring and fish sampling) are conducted across all 27 North Carolina water bodies managed by the company, as well as several waterbodies within South Carolina and Indiana. In sum, decades of scientific monitoring confirm that Duke Energy facilities continue to be safely operated under strict permits designed to protect public health and the environment.
Keeping the Lights On and Protecting Wildlife Duke Energy Renewables Environmental Development Director Tim Hayes spends a lot of time looking at the ground.
That might seem odd, but it’s the way of a wildlife biologist. Eyes pointed just beyond his feet, he looks for tufts of fur, tracks, and even scat for clues as to what wildlife lives near solar and wind sites.
People are often surprised to learn energy companies have biologists, but it’s imperative as the company expands renewables. When his team isn’t looking for wildlife, they’re working with government agencies, nonprofits and technology developers to create policies, products and plans that keep wildlife safe while producing clean energy that customers depend on.
Before construction, they survey species, consult with wildlife agencies, perform biological surveys and decide if the site will move on to construction or if the wildlife risk is too great.
During construction, Duke Energy hires consultants who specialize in the area’s threatened or endangered plants and animals. At Mesteño Wind Project, the team worked around species like the Texas tortoise.
The crew built a dirt road through an area Hayes calls a hotbed of tortoise activity. The area was unavoidable, but the tortoise loves the thick brush (a shady place to rest), good soil and plentiful water, so the team educated workers about the tortoise and set a 5 mph speed limit.
OPER
ATIO
NS
3
Duke Energy wildlife biologist Tim Hayes protects animals and plants at renewable energy sites.
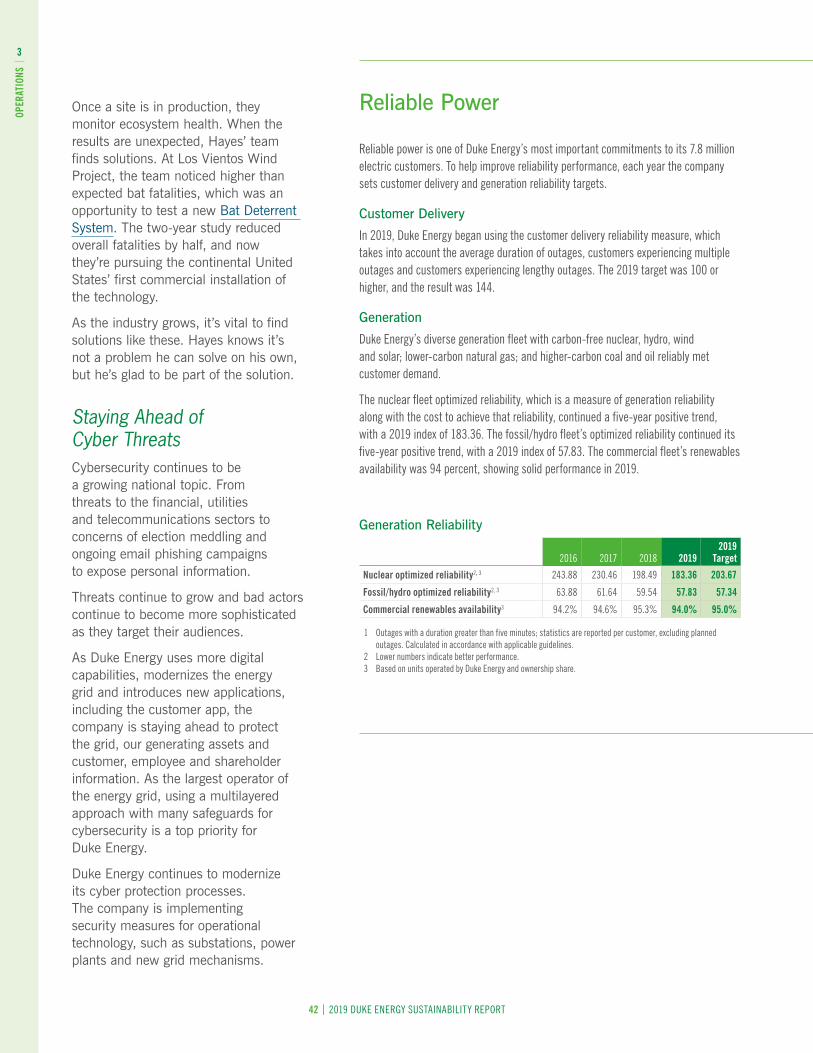
42 | 2019 DUKE ENERGY SUSTAINABILITY REPORT
OPER
ATIO
NS
3
Once a site is in production, they monitor ecosystem health. When the results are unexpected, Hayes’ team finds solutions. At Los Vientos Wind Project, the team noticed higher than expected bat fatalities, which was an opportunity to test a new Bat Deterrent System. The two-year study reduced overall fatalities by half, and now they’re pursuing the continental United States’ first commercial installation of the technology.
As the industry grows, it’s vital to find solutions like these. Hayes knows it’s not a problem he can solve on his own, but he’s glad to be part of the solution.
Staying Ahead of Cyber Threats Cybersecurity continues to be a growing national topic. From threats to the financial, utilities and telecommunications sectors to concerns of election meddling and ongoing email phishing campaigns to expose personal information.
Threats continue to grow and bad actors continue to become more sophisticated as they target their audiences.
As Duke Energy uses more digital capabilities, modernizes the energy grid and introduces new applications, including the customer app, the company is staying ahead to protect the grid, our generating assets and customer, employee and shareholder information. As the largest operator of the energy grid, using a multilayered approach with many safeguards for cybersecurity is a top priority for Duke Energy.
Duke Energy continues to modernize its cyber protection processes. The company is implementing security measures for operational technology, such as substations, power plants and new grid mechanisms.
Reliable power is one of Duke Energy’s most important commitments to its 7 .8 million electric customers . To help improve reliability performance, each year the company sets customer delivery and generation reliability targets .
Customer Delivery
In 2019, Duke Energy began using the customer delivery reliability measure, which takes into account the average duration of outages, customers experiencing multiple outages and customers experiencing lengthy outages . The 2019 target was 100 or higher, and the result was 144 .
Generation
Duke Energy’s diverse generation fleet with carbon-free nuclear, hydro, wind and solar; lower-carbon natural gas; and higher-carbon coal and oil reliably met customer demand .
The nuclear fleet optimized reliability, which is a measure of generation reliability along with the cost to achieve that reliability, continued a five-year positive trend, with a 2019 index of 183 .36 . The fossil/hydro fleet’s optimized reliability continued its five-year positive trend, with a 2019 index of 57 .83 . The commercial fleet’s renewables availability was 94 percent, showing solid performance in 2019 .
Generation Reliability
2016 2017 2018 20192019
Target
Nuclear optimized reliability2, 3 243 .88 230 .46 198 .49 183.36 203.67
Fossil/hydro optimized reliability2, 3 63 .88 61 .64 59 .54 57.83 57.34
Commercial renewables availability3 94 .2% 94 .6% 95 .3% 94.0% 95.0%
Reliable Power
1 Outages with a duration greater than five minutes; statistics are reported per customer, excluding planned outages . Calculated in accordance with applicable guidelines .
2 Lower numbers indicate better performance .3 Based on units operated by Duke Energy and ownership share .
43 | 2019 DUKE ENERGY SUSTAINABILITY REPORT
Duke Energy also has a dedicated team focused on educating employees and increasing awareness of threats – from routine test phishing emails and annual trainings to seminars and video resources.
The company maintains an incident response team of highly-skilled cybersecurity professionals who identify, mitigate and engage organizations across the company, as well as local, state and federal agencies to respond to issues. And, to ensure we are adequately prepared to respond, the company conducts drills to test emergency response plans and ensure employees understand their role in case an event occurs.
In an effort to protect its systems and engage stakeholders, Duke Energy routinely shares information, lessons learned and best practices with industry partners, peer utilities and government agencies, including the Department of Homeland Security and the Federal Bureau of Investigation.
The Power of Partnership in Red Tide Recovery Residents and tourists along Florida’s world-famous Gulf Coast often enjoy catching the popular red drum, or redfish. Yet in the wake of a historic red tide bloom, anglers of all ages released tens of thousands of the fish instead.
Red tide occurs naturally during most late summers from a bloom of dinoflagellate (algae) that usually dies off in weeks. When a 2017 bloom lingered into 2019, heartbreaking losses of manatees, sea turtles, fish and other marine life resulted.
The massive redfish release effort resulted from a partnership between Duke Energy and the Coastal Conservation Association Florida (CCA). Employees at Duke Energy’s Mariculture Center in Crystal River, Florida spawned and raised 34,000 juvenile “fingerlings” and 300 adult redfish. Members of CCA Florida arranged the release events after Duke Energy received permits from Florida’s Fish and Wildlife Commission.
By late 2019, release events were completed within a 500-mile span between the Pan Handle’s Gulf County to Collier County on the southwest coast.
Fingerlings were released in locations lined with mangroves and other hiding places to increase their survival chances against predators. Adults, which can live for up to 40 years, were tagged and hand-released. If caught, anglers can help researchers by calling the phone number on the tag.
Will 34,300 redfish make a difference? One female redfish can spawn up to 2 million eggs per batch, making millions of new redfish a possibility. That’s encouraging news for Florida’s delicate coastal ecosystem – including those counting on its longevity to thrive.
In an effort to protect its systems and
engage stakeholders, Duke Energy routinely
shares information, lessons learned and best practices with
industry partners, peer utilities and government agencies, including the
Department of Homeland Security and the Federal Bureau of Investigation.
OPER
ATIO
NS
3
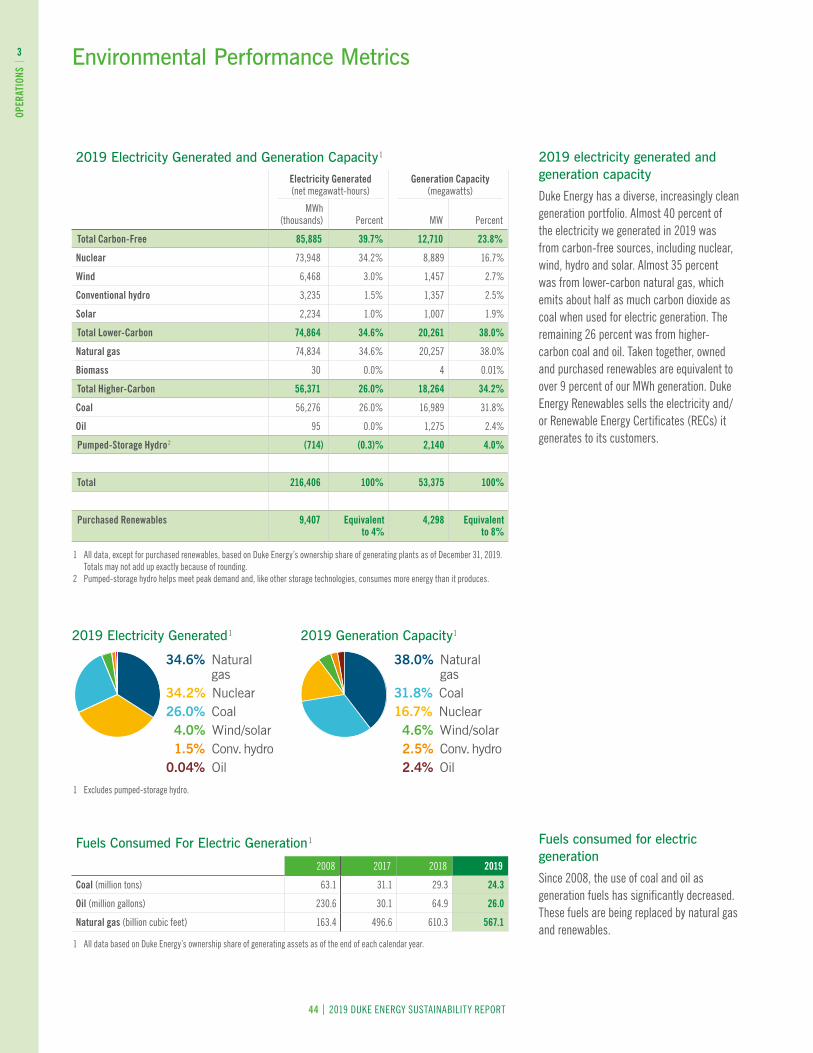
Environmental Performance Metrics
2019 Electricity Generated and Generation Capacity 1
Electricity Generated (net megawatt-hours)
Generation Capacity (megawatts)
MWh (thousands) Percent MW Percent
Total Carbon-Free 85,885 39.7% 12,710 23.8%
Nuclear 73,948 34 .2% 8,889 16 .7%
Wind 6,468 3 .0% 1,457 2 .7%
Conventional hydro 3,235 1 .5% 1,357 2 .5%
Solar 2,234 1 .0% 1,007 1 .9%
Total Lower-Carbon 74,864 34.6% 20,261 38.0%
Natural gas 74,834 34 .6% 20,257 38 .0%
Biomass 30 0 .0% 4 0 .01%
Total Higher-Carbon 56,371 26.0% 18,264 34.2%
Coal 56,276 26 .0% 16,989 31 .8%
Oil 95 0 .0% 1,275 2 .4%
Pumped-Storage Hydro 2 (714) (0.3)% 2,140 4.0%
Total 216,406 100% 53,375 100%
Purchased Renewables 9,407 Equivalent to 4%
4,298 Equivalent to 8%
1 All data, except for purchased renewables, based on Duke Energy’s ownership share of generating plants as of December 31, 2019 . Totals may not add up exactly because of rounding .
2 Pumped-storage hydro helps meet peak demand and, like other storage technologies, consumes more energy than it produces .
2019 electricity generated and generation capacity
Duke Energy has a diverse, increasingly clean generation portfolio . Almost 40 percent of the electricity we generated in 2019 was from carbon-free sources, including nuclear, wind, hydro and solar . Almost 35 percent was from lower-carbon natural gas, which emits about half as much carbon dioxide as coal when used for electric generation . The remaining 26 percent was from higher-carbon coal and oil . Taken together, owned and purchased renewables are equivalent to over 9 percent of our MWh generation . Duke Energy Renewables sells the electricity and/or Renewable Energy Certificates (RECs) it generates to its customers .
Fuels Consumed For Electric Generation 1
2008 2017 2018 2019
Coal (million tons) 63 .1 31 .1 29 .3 24.3
Oil (million gallons) 230 .6 30 .1 64 .9 26.0
Natural gas (billion cubic feet) 163 .4 496 .6 610 .3 567.1
1 All data based on Duke Energy’s ownership share of generating assets as of the end of each calendar year .
Fuels consumed for electric generation
Since 2008, the use of coal and oil as generation fuels has significantly decreased . These fuels are being replaced by natural gas and renewables .
2019 Electricity Generated 1 2019 Generation Capacity1
34.6% Natural gas
34.2% Nuclear 26.0% Coal 4.0% Wind/solar 1.5% Conv.hydro 0.04% Oil
38.0% Natural gas
31.8% Coal 16.7% Nuclear 4.6% Wind/solar 2.5% Conv.hydro 2.4% Oil
1 Excludes pumped-storage hydro .
44 | 2019 DUKE ENERGY SUSTAINABILITY REPORT
OPER
ATIO
NS
3
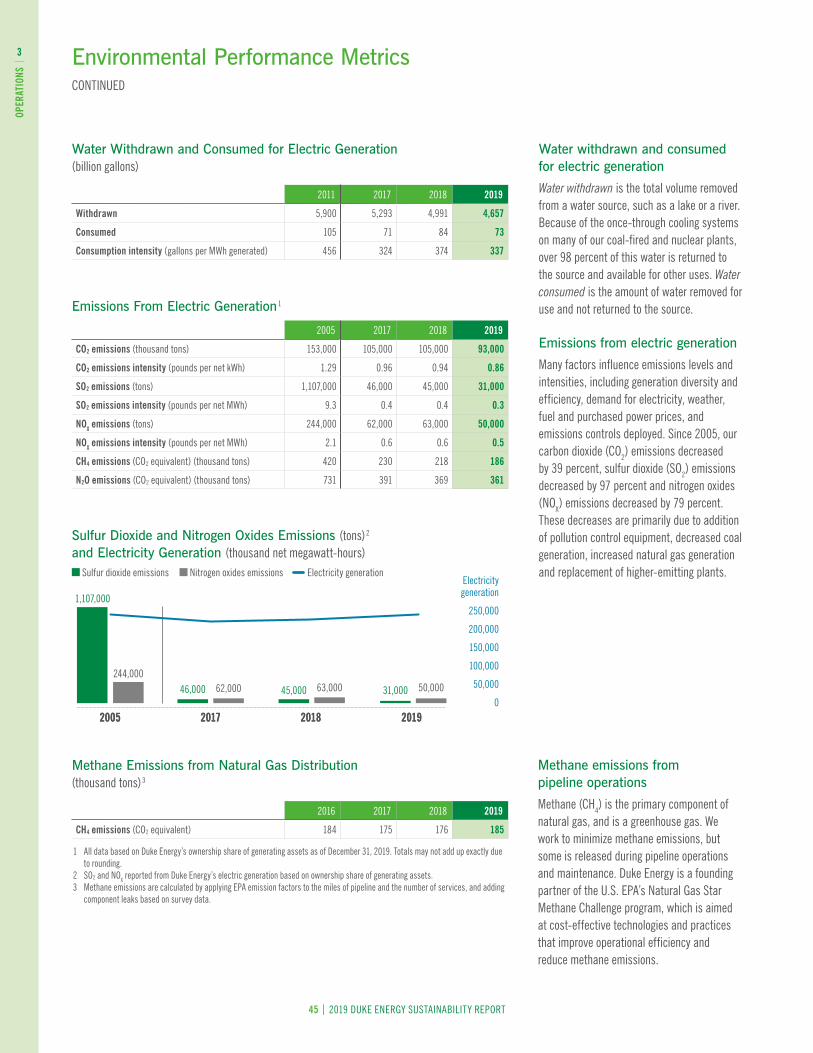
Water Withdrawn and Consumed for Electric Generation(billion gallons)
2011 2017 2018 2019
Withdrawn 5,900 5,293 4,991 4,657
Consumed 105 71 84 73
Consumption intensity (gallons per MWh generated) 456 324 374 337
Emissions From Electric Generation 1
2005 2017 2018 2019
CO2 emissions (thousand tons) 153,000 105,000 105,000 93,000
CO2 emissions intensity (pounds per net kWh) 1 .29 0 .96 0 .94 0.86
SO2 emissions (tons) 1,107,000 46,000 45,000 31,000
SO2 emissions intensity (pounds per net MWh) 9 .3 0 .4 0 .4 0.3
NOX emissions (tons) 244,000 62,000 63,000 50,000
NOX emissions intensity (pounds per net MWh) 2 .1 0 .6 0 .6 0.5
CH4 emissions (CO2 equivalent) (thousand tons) 420 230 218 186
N2O emissions (CO2 equivalent) (thousand tons) 731 391 369 361
Sulfur Dioxide and Nitrogen Oxides Emissions (tons) 2 and Electricity Generation (thousand net megawatt-hours)
Methane Emissions from Natural Gas Distribution (thousand tons) 3
2016 2017 2018 2019
CH4 emissions (CO2 equivalent) 184 175 176 185
1 All data based on Duke Energy’s ownership share of generating assets as of December 31, 2019 . Totals may not add up exactly due to rounding .
2 SO2 and NOX reported from Duke Energy’s electric generation based on ownership share of generating assets . 3 Methane emissions are calculated by applying EPA emission factors to the miles of pipeline and the number of services, and adding
component leaks based on survey data .
Environmental Performance Metrics CONTINUED
Water withdrawn and consumed for electric generation
Water withdrawn is the total volume removed from a water source, such as a lake or a river . Because of the once-through cooling systems on many of our coal-fired and nuclear plants, over 98 percent of this water is returned to the source and available for other uses . Water consumed is the amount of water removed for use and not returned to the source .
Emissions from electric generation
Many factors influence emissions levels and intensities, including generation diversity and efficiency, demand for electricity, weather, fuel and purchased power prices, and emissions controls deployed . Since 2005, our carbon dioxide (CO2) emissions decreased by 39 percent, sulfur dioxide (SO2) emissions decreased by 97 percent and nitrogen oxides (NOX) emissions decreased by 79 percent . These decreases are primarily due to addition of pollution control equipment, decreased coal generation, increased natural gas generation and replacement of higher-emitting plants .
Methane emissions from pipeline operations
Methane (CH4) is the primary component of natural gas, and is a greenhouse gas . We work to minimize methane emissions, but some is released during pipeline operations and maintenance . Duke Energy is a founding partner of the U .S . EPA’s Natural Gas Star Methane Challenge program, which is aimed at cost-effective technologies and practices that improve operational efficiency and reduce methane emissions .
2017 20182005 2019
Sulfur dioxide emissions Nitrogen oxides emissions Electricity generation
2017 2018
63,000 50,00045,000 31,000
2005
1,107,000
244,000
2019
Electricity generation
250,000
200,000
150,000
100,000
50,000
062,00046,000
45 | 2019 DUKE ENERGY SUSTAINABILITY REPORT
OPER
ATIO
NS
3
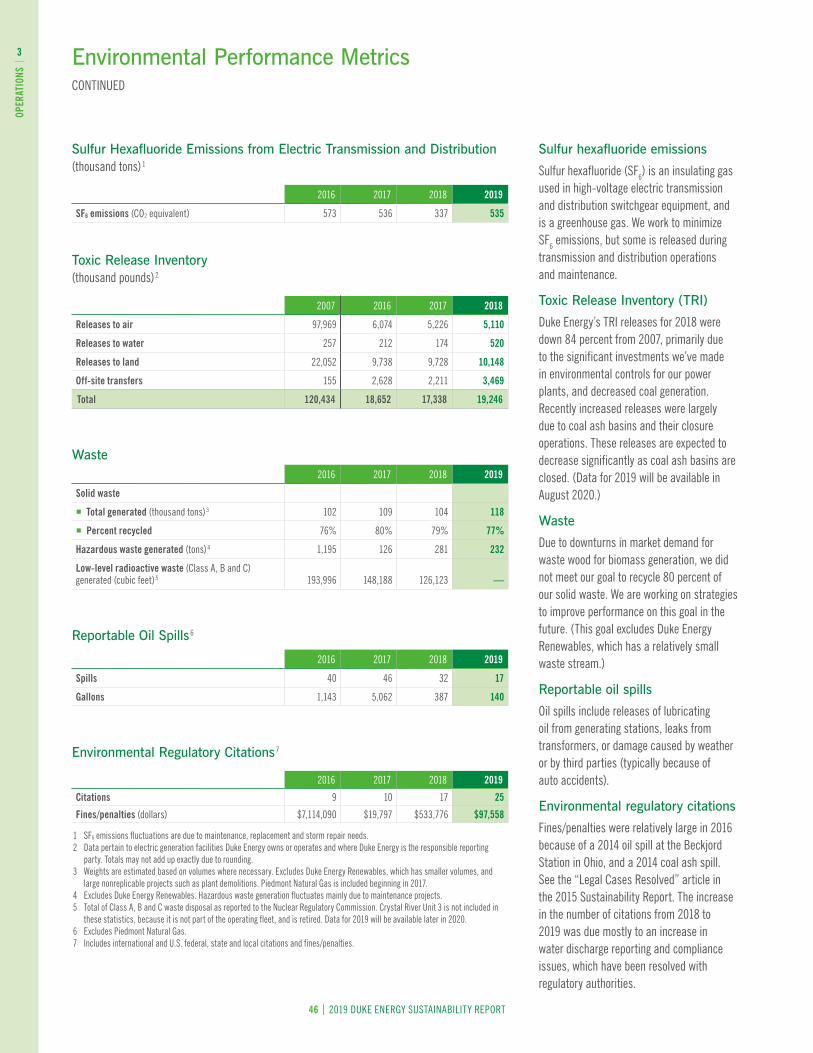
Sulfur Hexafluoride Emissions from Electric Transmission and Distribution (thousand tons) 1
2016 2017 2018 2019
SF6 emissions (CO2 equivalent) 573 536 337 535
Toxic Release Inventory (thousand pounds) 2
2007 2016 2017 2018
Releases to air 97,969 6,074 5,226 5,110
Releases to water 257 212 174 520
Releases to land 22,052 9,738 9,728 10,148
Off-site transfers 155 2,628 2,211 3,469
Total 120,434 18,652 17,338 19,246
Waste2016 2017 2018 2019
Solid waste
� Total generated (thousand tons) 3 102 109 104 118
� Percent recycled 76% 80% 79% 77%
Hazardous waste generated (tons) 4 1,195 126 281 232
Low-level radioactive waste (Class A, B and C) generated (cubic feet) 5 193,996 148,188 126,123 —
Reportable Oil Spills 6
2016 2017 2018 2019
Spills 40 46 32 17
Gallons 1,143 5,062 387 140
Environmental Regulatory Citations 7
2016 2017 2018 2019
Citations 9 10 17 25
Fines/penalties (dollars) $7,114,090 $19,797 $533,776 $97,558
1 SF6 emissions fluctuations are due to maintenance, replacement and storm repair needs . 2 Data pertain to electric generation facilities Duke Energy owns or operates and where Duke Energy is the responsible reporting
party . Totals may not add up exactly due to rounding . 3 Weights are estimated based on volumes where necessary . Excludes Duke Energy Renewables, which has smaller volumes, and
large nonreplicable projects such as plant demolitions . Piedmont Natural Gas is included beginning in 2017 . 4 Excludes Duke Energy Renewables . Hazardous waste generation fluctuates mainly due to maintenance projects . 5 Total of Class A, B and C waste disposal as reported to the Nuclear Regulatory Commission . Crystal River Unit 3 is not included in
these statistics, because it is not part of the operating fleet, and is retired . Data for 2019 will be available later in 2020 . 6 Excludes Piedmont Natural Gas . 7 Includes international and U .S . federal, state and local citations and fines/penalties .
Environmental Performance Metrics CONTINUED
Sulfur hexafluoride emissions
Sulfur hexafluoride (SF6) is an insulating gas used in high-voltage electric transmission and distribution switchgear equipment, and is a greenhouse gas . We work to minimize SF6 emissions, but some is released during transmission and distribution operations and maintenance .
Toxic Release Inventory (TRI)
Duke Energy’s TRI releases for 2018 were down 84 percent from 2007, primarily due to the significant investments we’ve made in environmental controls for our power plants, and decreased coal generation . Recently increased releases were largely due to coal ash basins and their closure operations . These releases are expected to decrease significantly as coal ash basins are closed . (Data for 2019 will be available in August 2020 .)
Waste
Due to downturns in market demand for waste wood for biomass generation, we did not meet our goal to recycle 80 percent of our solid waste . We are working on strategies to improve performance on this goal in the future . (This goal excludes Duke Energy Renewables, which has a relatively small waste stream .)
Reportable oil spills
Oil spills include releases of lubricating oil from generating stations, leaks from transformers, or damage caused by weather or by third parties (typically because of auto accidents) .
Environmental regulatory citations
Fines/penalties were relatively large in 2016 because of a 2014 oil spill at the Beckjord Station in Ohio, and a 2014 coal ash spill . See the “Legal Cases Resolved” article in the 2015 Sustainability Report . The increase in the number of citations from 2018 to 2019 was due mostly to an increase in water discharge reporting and compliance issues, which have been resolved with regulatory authorities .
46 | 2019 DUKE ENERGY SUSTAINABILITY REPORT
OPER
ATIO
NS
3

Develop and Engage Employees and Strengthen Leadership
EMPLOYEES
47 | 2019 DUKE ENERGY SUSTAINABILITY REPORT
48 | 2019 DUKE ENERGY SUSTAINABILITY REPORT
EMPL
OYEE
S
4
2019 Highlights ■ Increased female representation in the workforce to 23.7 percent (up
from 23.3 percent in 2018), and increased minority representation to 18.8 percent (up from 18.1 percent in 2018).
■ Earned a perfect score for the third year in a row on the Human Rights Campaign’s Corporate Equality Index, and earned distinction as a “Best Place to Work for LGBTQ Equality.”
■ Named one of “America’s Best Employers for Diversity” in 2020 and one of “America’s Best Employers for Women” in 2019 by Forbes magazine.
■ Received a “HIRE Vets Medallion Award” in 2019 from the U.S. Department of Labor for recruiting, employing and retaining veterans.
■ Ranked 125 on Newsweek magazine’s 2020 list of “America’s Most Responsible Companies,” out of 2,000 companies analyzed.
Challenges and Opportunities ■ Foster a high-performance and inclusive culture built on strong
leadership, diversity and engaged employees.
■ Continue to invest in education and workforce development to ensure a robust pipeline of highly skilled workers.
■ Ensure transfer of knowledge from our retiring baby boomer workers to new employees.
EMP
LOYE
ES
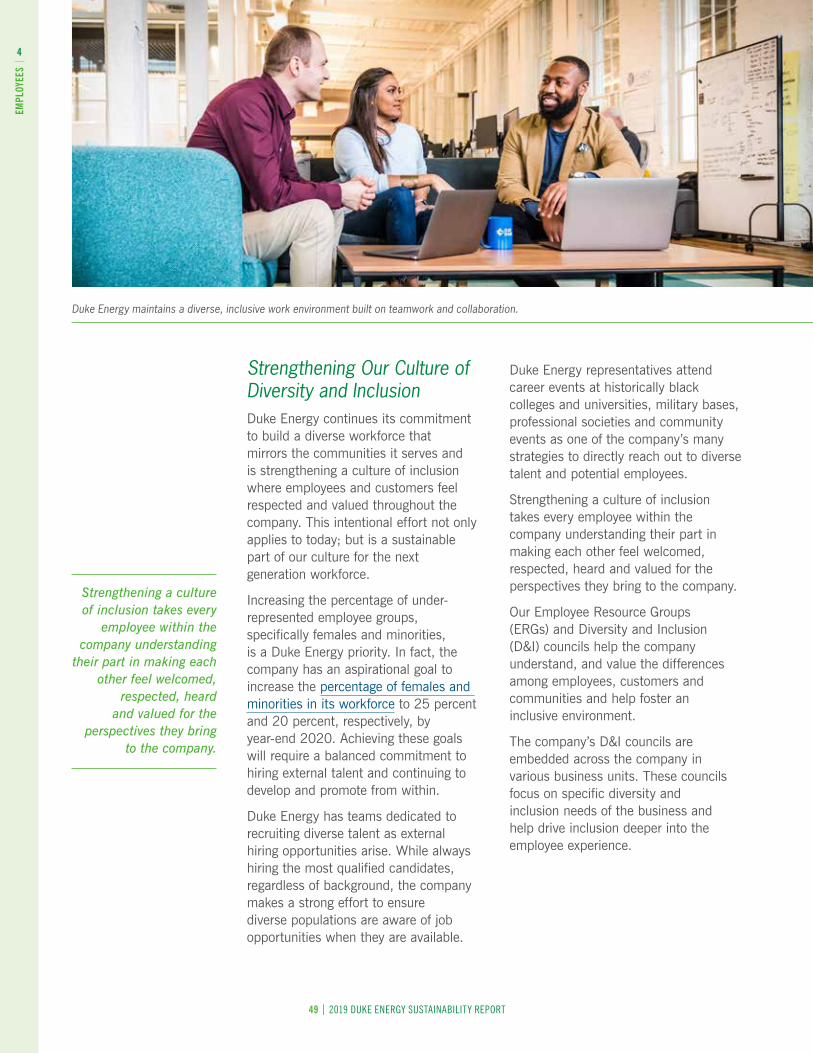
49 | 2019 DUKE ENERGY SUSTAINABILITY REPORT
EMPL
OYEE
S
4
Strengthening Our Culture of Diversity and Inclusion Duke Energy continues its commitment to build a diverse workforce that mirrors the communities it serves and is strengthening a culture of inclusion where employees and customers feel respected and valued throughout the company. This intentional effort not only applies to today; but is a sustainable part of our culture for the next generation workforce.
Increasing the percentage of under-represented employee groups, specifically females and minorities, is a Duke Energy priority. In fact, the company has an aspirational goal to increase the percentage of females and minorities in its workforce to 25 percent and 20 percent, respectively, by year-end 2020. Achieving these goals will require a balanced commitment to hiring external talent and continuing to develop and promote from within.
Duke Energy has teams dedicated to recruiting diverse talent as external hiring opportunities arise. While always hiring the most qualified candidates, regardless of background, the company makes a strong effort to ensure diverse populations are aware of job opportunities when they are available.
Duke Energy representatives attend career events at historically black colleges and universities, military bases, professional societies and community events as one of the company’s many strategies to directly reach out to diverse talent and potential employees.
Strengthening a culture of inclusion takes every employee within the company understanding their part in making each other feel welcomed, respected, heard and valued for the perspectives they bring to the company.
Our Employee Resource Groups (ERGs) and Diversity and Inclusion (D&I) councils help the company understand, and value the differences among employees, customers and communities and help foster an inclusive environment.
The company’s D&I councils are embedded across the company in various business units. These councils focus on specific diversity and inclusion needs of the business and help drive inclusion deeper into the employee experience.
Duke Energy maintains a diverse, inclusive work environment built on teamwork and collaboration.
Strengthening a culture of inclusion takes every
employee within the company understanding
their part in making each other feel welcomed,
respected, heard and valued for the
perspectives they bring to the company.
50 | 2019 DUKE ENERGY SUSTAINABILITY REPORT
Duke Energy has eight ERGs and numerous departmental D&I councils. They provide cultural awareness, learning and development opportunities, scholarships, represent the company at community events, recruiting assistance, professional development and business support:
■ Advocates for African Americans (A3) – attract, develop, engage and retain African American employees
■ Business Women’s Network (BWN) – professional development, personal enrichment for working women; with a focus on challenges women face in the workplace
■ disABILITY Outreach and Inclusion – empowerment and inclusion for individuals with disabilities; focusing on disability awareness through education, networking, community outreach
■ Latinos Energizing Diversity (LED) – attract and engage Latino employees by creating an engaging environment where the Latino culture is embraced by all employees
■ New to Duke (N2D) – integrate new employees to strengthen engagement and increase employee retention
■ Together We Stand (TWS) – enable our veterans to celebrate their shared service, effectively employing the skills of veterans, and make our communications stronger by supporting internal/external veterans’ initiatives
■ We Are One for LGBT Equality (WeR1) – increase awareness and understanding of issues impacting LGBT employees and allies and maintain and encourage a work environment that is inclusive and supportive of all employees
■ Asian Inclusion Network (AIN) – this is a newly created ERG for attracting and engaging Asian employees
Membership for ERGs is open to all Duke Energy full- or part-time employees regardless of race, ethnicity or cultural background. Approximately 6,000 Duke Energy employees participate in one or more ERGs, and numerous employees also participate in their departmental D&I councils.
Developing Tomorrow’s Workforce Today Sustainability is about being ready for the future. Duke Energy’s commitment to delivering a smarter energy future includes a commitment to developing the workforce that will be necessary for that future. Providing employees with the essential knowledge, development and skills they need to be safe and successful in a changing industry is part of our culture.
That commitment also extends to developing tomorrow’s workforce. National concerns about declining student interest in science, technology, engineering and math studies – disciplines collectively known as STEM – have our attention. Individuals with these skills are the foundation of our work today and tomorrow. That’s why part of Duke Energy’s strategy for developing a sustainable workforce includes reaching into local education systems to bring energy career awareness to educators, students and parents.
Duke Energy has established relationships with local community colleges that offer programs in the STEM studies essential to the future. Students are prepared for possible future employment in the energy industry as lineworkers, solar technicians and other careers.
Our education efforts don’t stop there, however. In fact, they start much earlier. Duke Energy employees have strong local connections and take pride in sharing their knowledge and histories. Using a speaker toolkit developed expressly for this purpose, employees share information about Duke Energy and the many career opportunities that exist within the changing energy industry.
Maintaining a skilled workforce includes a focus on today without losing sight of tomorrow. That’s why planting the seeds of interest in an energy career must begin early and remain a key strategy for today and tomorrow.
Learn more about how Duke Energy’s learning and development programs prepare leaders and employees to meet future challenges.
EMPL
OYEE
S
4

Duke Energy’s highly skilled lineworkers use drones and computers to keep power flowing.
51 | 2019 DUKE ENERGY SUSTAINABILITY REPORT
EMPL
OYEE
S
4
Lineworker Skills Always Being Fine-Tuned No one is more hands-on with the electric utility industry than lineworkers. To ensure a pipeline of future employees, Duke Energy has been funding strategic initiatives to help enhance and diversify the energy industry’s workforce of tomorrow.
The company has worked closely with community colleges and other educational organizations to attract a future workforce that will have the skills necessary to build and maintain a changing energy infrastructure.
But once workers get to Duke Energy, the fine-tuning of skills is not over. And being the best of the best doesn’t stop.
Every October in Bonner Springs, Kansas, the best lineworkers compete against the best in their trade at the International Lineman’s Rodeo.
The Lineman’s Rodeo events test job-related skills like working safely while climbing fast, making repairs and rescuing an injured teammate while being judged on speed, agility, technique and safety procedures.
In 2019, more than 1,000 lineworkers from the United States, Canada and Australia competed and our Duke Energy linemen roped in six awards, with North Carolina’s Mike Haynes, David Phillips and Neal Walker taking home first place in the world for the journeyman senior division, ages 50 and up.
While most people associate maintaining the grid with the manual work of setting poles and stringing lines, lineworkers are also using drones and computers in their trucks and relay technicians are making the self-healing grid possible. It takes highly skilled talent to tackle the ever-changing needs of the industry.
But their work from the front lines is critical to powering our communities now and will continue to be in the future.
To ensure a pipeline of future employees,
Duke Energy has been funding strategic initiatives to help
enhance and diversify the energy industry’s
workforce of tomorrow.
52 | 2019 DUKE ENERGY SUSTAINABILITY REPORT
EMPL
OYEE
S
4
Charging Ahead with Ethics and ComplianceDuke Energy is one the first U.S. electric and natural gas investor-owned utilities to receive Compliance Leader Verification. Duke Energy’s verification is for 2019 and 2020.
Awarded by the Ethisphere Institute, Compliance Leader Verification is awarded to companies with leading ethics and compliance programs.
Ethisphere is an independent research center that provides thought leadership and promotes best practices in corporate ethics and compliance. It’s Duke Energy’s practice to seek an outside assessment of our ethics and compliance program about every five years.
Ethisphere’s Compliance Leader Verification process includes a comprehensive review of a company’s ethics and compliance program structure and oversight. It examines employee training and communications, risk measurement and mitigation, monitoring practices designed to expose misconduct, consistency in the application of disciplinary measures, and employee perceptions of the company’s ethics culture.
Duke Energy’s Code of Business Ethics describes ethics and compliance standards for Duke Energy employees. New employees are required to complete ethics and compliance training in the first 30 calendar days on the job. All employees also are annually required to: complete ethics refresher training; acknowledge their responsibility to comply with company ethics policies; and confirm their obligation to report violations of laws, rules or company policies.
The strength of Duke Energy’s ethics and compliance program is crucial to the company’s success and integrity, which depend on the continuing ability to earn the trust and confidence of our customers, employees, regulators, elected officials, shareholders, and other stakeholders. That success is dependent on every employee’s dedication and focus to ensure we consistently deliver results the right way, every day and in every job.
Learn more about Duke Energy’s ethics and employee engagement programs.
The strength of Duke Energy’s ethics and
compliance program is crucial to the company’s
success and integrity, which depend on the
continuing ability to earn the trust and confidence
of our customers, employees, regulators,
elected officials, shareholders, and
other stakeholders.
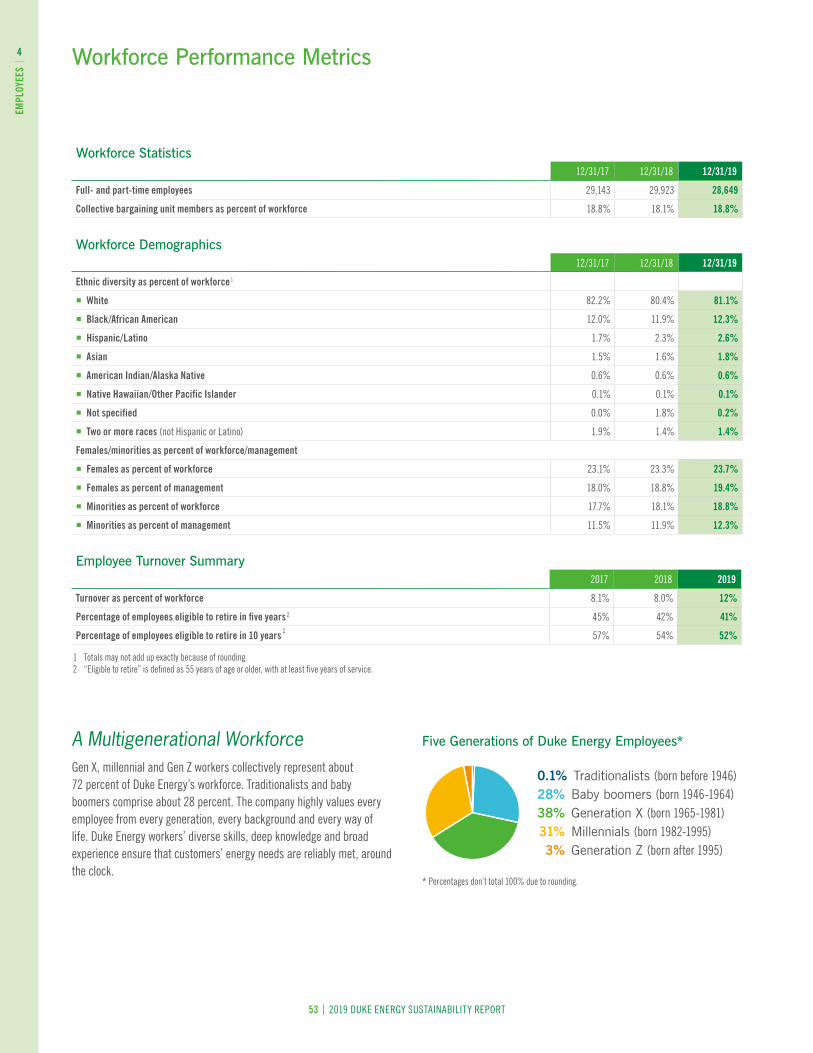
Workforce Performance Metrics
Workforce Statistics 12/31/17 12/31/18 12/31/19
Full- and part-time employees 29,143 29,923 28,649
Collective bargaining unit members as percent of workforce 18 .8% 18 .1% 18.8%
Workforce Demographics 12/31/17 12/31/18 12/31/19
Ethnic diversity as percent of workforce 1
� White 82 .2% 80 .4% 81.1%
� Black/African American 12 .0% 11 .9% 12.3%
� Hispanic/Latino 1 .7% 2 .3% 2.6%
� Asian 1 .5% 1 .6% 1.8%
� American Indian/Alaska Native 0 .6% 0 .6% 0.6%
� Native Hawaiian/Other Pacific Islander 0 .1% 0 .1% 0.1%
� Not specified 0 .0% 1 .8% 0.2%
� Two or more races (not Hispanic or Latino) 1 .9% 1 .4% 1.4%
Females/minorities as percent of workforce/management
� Females as percent of workforce 23 .1% 23 .3% 23.7%
� Females as percent of management 18 .0% 18 .8% 19.4%
� Minorities as percent of workforce 17 .7% 18 .1% 18.8%
� Minorities as percent of management 11 .5% 11 .9% 12.3%
Employee Turnover Summary 2017 2018 2019
Turnover as percent of workforce 8 .1% 8 .0% 12%
Percentage of employees eligible to retire in five years 2 45% 42% 41%
Percentage of employees eligible to retire in 10 years 2 57% 54% 52%
1 Totals may not add up exactly because of rounding . 2 “Eligible to retire” is defined as 55 years of age or older, with at least five years of service .
A Multigenerational WorkforceGen X, millennial and Gen Z workers collectively represent about 72 percent of Duke Energy’s workforce . Traditionalists and baby boomers comprise about 28 percent . The company highly values every employee from every generation, every background and every way of life . Duke Energy workers’ diverse skills, deep knowledge and broad experience ensure that customers’ energy needs are reliably met, around the clock .
Five Generations of Duke Energy Employees*
0.1% Traditionalists (born before 1946) 28% Baby boomers (born 1946-1964) 38% Generation X (born 1965-1981) 31% Millennials (born 1982-1995)
3% Generation Z (born after 1995)
* Percentages don’t total 100% due to rounding .
53 | 2019 DUKE ENERGY SUSTAINABILITY REPORT
EMPL
OYEE
S
4
Forward-Looking Information
Cautionary statement regarding forward-looking information
This document includes forward-looking statements within the meaning of Section 27A of the Securities Act of 1933 and Section 21E of the Securities Exchange Act of 1934 . Forward-looking statements are based on management’s beliefs and assumptions and can often be identified by terms and phrases that include “anticipate,” “believe,” “intend,” “estimate,” “expect,” “continue,” “should,” “could,” “may,” “plan,” “project,” “predict,” “will,” “potential,” “forecast,” “target,” “guidance,” “outlook” or other similar terminology . Various factors may cause actual results to be materially different than the suggested outcomes within forward-looking statements; accordingly, there is no assurance that such results will be realized . These factors include, but are not limited to:
� State, federal and foreign legislative and regulatory initiatives, including costs of compliance with existing and future environmental requirements, including those related to climate change, as well as rulings that affect cost and investment recovery or have an impact on rate structures or market prices;
� The extent and timing of costs and liabilities to comply with federal and state laws, regulations and legal requirements related to coal ash remediation, including amounts for required closure of certain ash impoundments, are uncertain and difficult to estimate;
� The ability to recover eligible costs, including amounts associated with coal ash impoundment retirement obligations and costs related to significant weather events, and to earn an adequate return on investment through rate case proceedings and the regulatory process;
� The costs of decommissioning nuclear facilities could prove to be more extensive than amounts estimated and all costs may not be fully recoverable through the regulatory process;
� Costs and effects of legal and administrative proceedings, settlements, investigations and claims;
� Industrial, commercial and residential growth or decline in service territories or customer bases resulting from sustained downturns of the economy and the economic health of our service territories or variations in customer usage patterns, including energy efficiency efforts and use of alternative energy sources, such as self-generation and distributed generation technologies;
� Federal and state regulations, laws and other efforts designed to promote and expand the use of energy efficiency measures and distributed generation technologies, such as private solar and battery storage, in Duke Energy service territories could result in customers leaving the electric distribution system, excess generation resources as well as stranded costs;
� Advancements in technology;
� Additional competition in electric and natural gas markets and continued industry consolidation;
� The influence of weather and other natural phenomena on operations, including the economic, operational and other effects of severe storms, hurricanes, droughts, earthquakes and tornadoes, including extreme weather associated with climate change;
� The impact of the COVID-19 pandemic;
� The ability to successfully operate electric generating facilities and deliver electricity to customers including direct or indirect effects to the company resulting from an incident that affects the United States electric grid or generating resources;
� The ability to obtain the necessary permits and approvals and to complete necessary or desirable pipeline expansion or infrastructure projects in our natural gas business;
� Operational interruptions to our natural gas distribution and transmission activities;
� The availability of adequate interstate pipeline transportation capacity and natural gas supply;
� The impact on facilities and business from a terrorist attack, cybersecurity threats, data security breaches, operational accidents, information technology failures or other catastrophic events, such as fires, explosions, pandemic health events or other similar occurrences;
� The inherent risks associated with the operation of nuclear facilities, including environmental, health, safety, regulatory and financial risks, including the financial stability of third-party service providers;
� The timing and extent of changes in commodity prices and interest rates and the ability to recover such costs through the regulatory process, where appropriate, and their impact on liquidity positions and the value of underlying assets;
� The results of financing efforts, including the ability to obtain financing on favorable terms, which can be affected by various factors, including credit ratings, interest rate fluctuations, compliance with debt covenants and conditions and general market and economic conditions;
� Credit ratings of Duke Energy and its registered subsidiaries may be different from what is expected;
� Declines in the market prices of equity and fixed-income securities and resultant cash funding requirements for defined benefit pension plans, other post-retirement benefit plans and nuclear decommissioning trust funds;
� Construction and development risks associated with the completion of Duke Energy’s capital investment projects, including risks related to financing, obtaining and complying with terms of permits, meeting construction budgets and schedules and satisfying operating and environmental performance standards, as well as the ability to recover costs from customers in a timely manner, or at all;
� Changes in rules for regional transmission organizations, including changes in rate designs and new and evolving capacity markets, and risks related to obligations created by the default of other participants;
� The ability to control operation and maintenance costs;
� The level of creditworthiness of counterparties to transactions;
� The ability to obtain adequate insurance at acceptable costs;
� Employee workforce factors, including the potential inability to attract and retain key personnel;
� The ability of subsidiaries to pay dividends or distributions to Duke Energy Corporation holding company (the Parent);
� The performance of projects undertaken by our nonregulated businesses and the success of efforts to invest in and develop new opportunities;
� The effect of accounting pronouncements issued periodically by accounting standard-setting bodies;
� The impact of United States tax legislation to our financial condition, results of operations or cash flows and our credit ratings;
� The impacts from potential impairments of goodwill or equity method investment carrying values; and
� The ability to implement our business strategy, including enhancing existing technology systems .
Additional risks and uncertainties are identified and discussed in Duke Energy’s reports filed with the SEC and available at the SEC’s website at sec .gov . In light of these risks, uncertainties and assumptions, the events described in the forward-looking statements might not occur or might occur to a different extent or at a different time than described . Forward-looking statements speak only as of the date they are made and Duke Energy expressly disclaim an obligation to publicly update or revise any forward-looking statements, whether as a result of new information, future events or otherwise .
54 | 2019 DUKE ENERGY SUSTAINABILITY REPORT
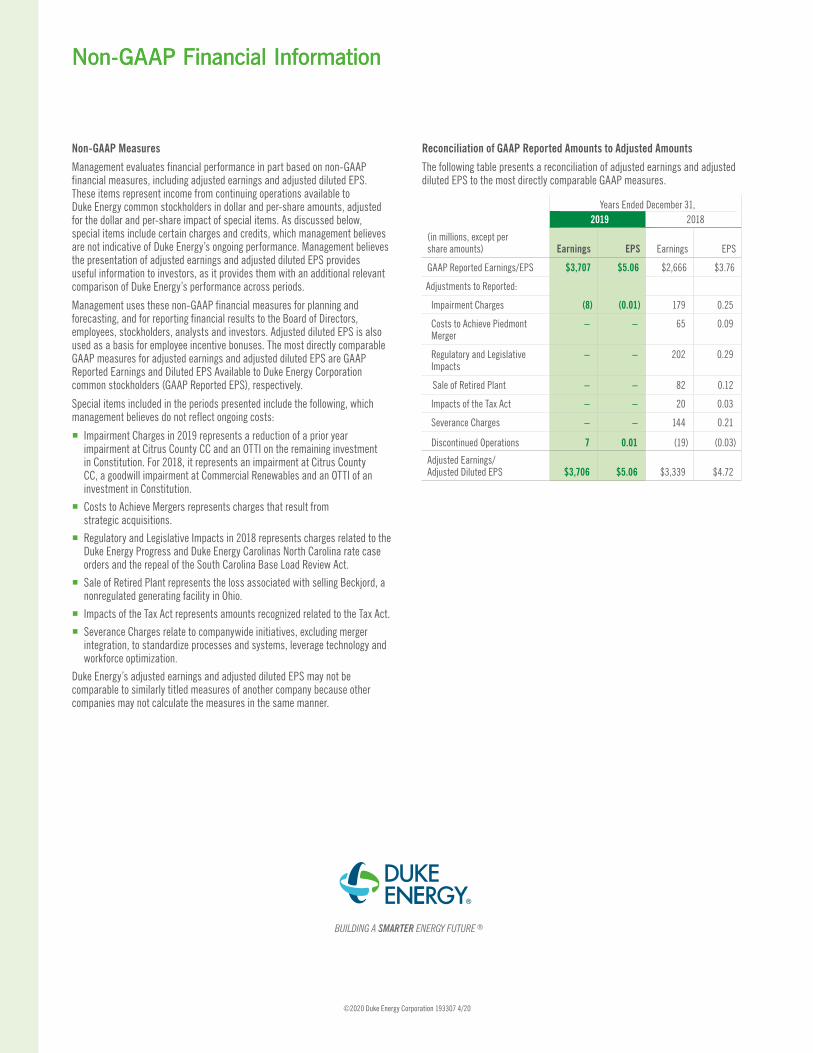
Non-GAAP Financial InformationNon-GAAP Financial Information
Non-GAAP Measures
Management evaluates financial performance in part based on non-GAAP financial measures, including adjusted earnings and adjusted diluted EPS . These items represent income from continuing operations available to Duke Energy common stockholders in dollar and per-share amounts, adjusted for the dollar and per-share impact of special items . As discussed below, special items include certain charges and credits, which management believes are not indicative of Duke Energy’s ongoing performance . Management believes the presentation of adjusted earnings and adjusted diluted EPS provides useful information to investors, as it provides them with an additional relevant comparison of Duke Energy’s performance across periods .
Management uses these non-GAAP financial measures for planning and forecasting, and for reporting financial results to the Board of Directors, employees, stockholders, analysts and investors . Adjusted diluted EPS is also used as a basis for employee incentive bonuses . The most directly comparable GAAP measures for adjusted earnings and adjusted diluted EPS are GAAP Reported Earnings and Diluted EPS Available to Duke Energy Corporation common stockholders (GAAP Reported EPS), respectively .
Special items included in the periods presented include the following, which management believes do not reflect ongoing costs:
� Impairment Charges in 2019 represents a reduction of a prior year impairment at Citrus County CC and an OTTI on the remaining investment in Constitution . For 2018, it represents an impairment at Citrus County CC, a goodwill impairment at Commercial Renewables and an OTTI of an investment in Constitution .
� Costs to Achieve Mergers represents charges that result from strategic acquisitions .
� Regulatory and Legislative Impacts in 2018 represents charges related to the Duke Energy Progress and Duke Energy Carolinas North Carolina rate case orders and the repeal of the South Carolina Base Load Review Act .
� Sale of Retired Plant represents the loss associated with selling Beckjord, a nonregulated generating facility in Ohio .
� Impacts of the Tax Act represents amounts recognized related to the Tax Act .
� Severance Charges relate to companywide initiatives, excluding merger integration, to standardize processes and systems, leverage technology and workforce optimization .
Duke Energy’s adjusted earnings and adjusted diluted EPS may not be comparable to similarly titled measures of another company because other companies may not calculate the measures in the same manner .
Reconciliation of GAAP Reported Amounts to Adjusted Amounts
The following table presents a reconciliation of adjusted earnings and adjusted diluted EPS to the most directly comparable GAAP measures .
Years Ended December 31,2019 2018
(in millions, except per share amounts) Earnings EPS Earnings EPS
GAAP Reported Earnings/EPS $3,707 $5.06 $2,666 $3 .76
Adjustments to Reported:
Impairment Charges (8) (0.01) 179 0 .25
Costs to Achieve Piedmont Merger
– – 65 0 .09
Regulatory and Legislative Impacts
– – 202 0 .29
Sale of Retired Plant – – 82 0 .12
Impacts of the Tax Act – – 20 0 .03
Severance Charges – – 144 0 .21
Discontinued Operations 7 0.01 (19) (0 .03)
Adjusted Earnings/Adjusted Diluted EPS $3,706 $5.06 $3,339 $4 .72
©2020 Duke Energy Corporation 193307 4/20